ARTISAN PARTNERS ASSET MANAGEMENT INC.
10-Ks and 10-Qs
|
|
|
|
|
|
|
|
|
|
|
|
|
|
|
|
|
|
|
|
|
|
|
|
|
|
|
|
|
|
|
|
|
|
|
|
|
|
UNITED STATES
SECURITIES AND EXCHANGE COMMISSION
Washington, D.C. 20549
Form 10-K
|
(Mark One)
|
|
|
þ
|
ANNUAL REPORT PURSUANT TO SECTION 13 OR 15(d) OF THE SECURITIES EXCHANGE ACT OF 1934
|
|
FOR THE FISCAL YEAR ENDED DECEMBER 31, 2015
|
|
|
OR
|
|
|
o
|
TRANSITION REPORT PURSUANT TO SECTION 13 OR 15(d) OF THE SECURITIES EXCHANGE ACT OF 1934
|
|
FOR THE TRANSITION PERIOD FROM TO
|
|
Commission file number: 001-35826
Artisan Partners Asset Management Inc.
(Exact name of registrant as specified in its charter)
|
Delaware
|
45-0969585
|
|
(State or other jurisdiction of
incorporation or organization)
|
(I.R.S. Employer
Identification No.)
|
|
875 E. Wisconsin Avenue, Suite 800
Milwaukee, WI
|
53202
|
|
(Address of principal executive offices)
|
(Zip Code)
|
(414) 390-6100
(Registrant’s telephone number, including area code)
Securities registered pursuant to Section 12(b) of the Act:
|
Class A Common Stock, $0.01 par value
|
The New York Stock Exchange
|
|
|
(Title of each class)
|
(Name of each exchange on which registered)
|
|
Securities registered pursuant to section 12(g) of the Act: None
Indicate by check mark if the registrant is a well-known seasoned issuer, as defined in Rule 405 of the Securities Act. Yes
þ
No
o
Indicate by check mark if the registrant is not required to file reports pursuant to Section 13 or 15(d) of the Act. Yes
o
No
þ
Indicate by check mark whether the registrant: (1) has filed all reports required to be filed by Section 13 or 15(d) of the Securities Exchange Act of 1934 during the preceding 12 months (or for such shorter period that the registrant was required to file such reports), and (2) has been subject to such filing requirements for the past 90 days. Yes
þ
No
o
Indicate by check mark whether the registrant has submitted electronically and posted on its corporate Web site, if any, every Interactive Data File required to be submitted and posted pursuant to Rule 405 of Regulation S-T (§ 232.405 of this chapter) during the preceding 12 months (or for such shorter period that the registrant was required to submit and post such files). Yes
þ
No
o
Indicate by check mark if disclosure of delinquent filers pursuant to Item 405 of Regulation S-K (§ 229.405 of this chapter) is not contained herein, and will not be contained, to the best of registrant’s knowledge, in definitive proxy or information statements incorporated by reference in Part III of this Form 10-K or any amendment to this Form 10-K.
o
Indicate by check mark whether the registrant is a large accelerated filer, an accelerated filer, a non-accelerated filer, or a smaller reporting company. See the definitions of “large accelerated filer,” “accelerated filer” and “smaller reporting company” in Rule 12b-2 of the Exchange Act. (Check one):
|
Large accelerated filer
þ
|
Accelerated filer
o
|
||
|
Non-accelerated filer
o
|
(Do not check if a smaller reporting company)
|
Smaller reporting company
o
|
|
Indicate by check mark whether the registrant is a shell company (as defined in Rule 12b-2 of the Exchange Act). Yes
o
No
þ
The aggregate market value of common equity held by non-affiliates of the registrant at June 30, 2015, which was the last business day of the registrant’s most recently completed second fiscal quarter, was approximately $1,817,954,619 based on the closing price of $46.46 for one share of Class A common stock, as reported on the New York Stock Exchange on that date. For purposes of this calculation only, it is assumed that the affiliates of the registrant include only directors and executive officers of the registrant.
The number of outstanding shares of the registrant’s Class A common stock, par value $0.01 per share, Class B common stock, par value $0.01 per share, and Class C common stock, par value $0.01 per share, as of February 23, 2016 were 40,501,778, 18,327,222 and 15,649,101, respectively.
TABLE OF CONTENTS
|
Page
|
||
|
PART I
|
||
|
Item 1.
|
||
|
Item 1A.
|
||
|
Item 1B.
|
||
|
Item 2.
|
||
|
Item 3.
|
||
|
Item 4.
|
||
|
PART II
|
||
|
Item 5.
|
||
|
Item 6.
|
||
|
Item 7.
|
||
|
Item 7A.
|
||
|
Item 8.
|
||
|
Item 9.
|
||
|
Item 9A.
|
||
|
Item 9B.
|
||
|
PART III
|
||
|
Item 10.
|
||
|
Item 11.
|
||
|
Item 12.
|
||
|
Item 13.
|
||
|
Item 14.
|
||
|
PART IV
|
||
|
Item 15.
|
||
Except where the context requires otherwise, in this report:
|
•
|
“Artisan Funds” refers to Artisan Partners Funds, Inc., a family of Securities and Exchange Commission registered mutual funds.
|
|
•
|
“Artisan Global Funds” refers to Artisan Partners Global Funds PLC, a family of Ireland-domiciled funds organized pursuant to the European Union’s Undertaking for Collective Investment in Transferable Securities (“UCITS”).
|
|
•
|
“client” and “clients” refer to investors who access our investment management services by investing in mutual funds, including the funds of Artisan Funds or Artisan Global Funds, or by engaging us to manage a separate account in one or
|
i
more of our investment strategies (such accounts include collective investment trusts and other pooled investment vehicles for which we are investment adviser, each of which we manage on a separate account basis).
|
•
|
“Company”, “Artisan”, “we”, “us” or “our” refer to Artisan Partners Asset Management Inc. (“APAM”) and, unless the context otherwise requires, its direct and indirect subsidiaries, including Artisan Partners Holdings LP (“Artisan Partners Holdings” or “Holdings”), and, for periods prior to our IPO, “Artisan,” the “company,” “we,” “us” and “our” refer to Artisan Partners Holdings and, unless the context otherwise requires, its direct and indirect subsidiaries. On March 12, 2013, APAM closed its IPO and related IPO Reorganization. Prior to that date, APAM was a subsidiary of Artisan Partners Holdings. The IPO Reorganization and IPO are described in the notes to our consolidated financial statements included in Part II of this Form 10-K.
|
|
•
|
“IPO” means the initial public offering of 12,712,279 shares of Class A common stock of Artisan Partners Asset Management Inc. completed on March 12, 2013.
|
|
•
|
“IPO Reorganization” means the series of transactions Artisan Partners Asset Management Inc. and Artisan Partners Holdings completed on March 12, 2013, immediately prior to the IPO, in order to reorganize their capital structures in preparation for the IPO.
|
|
•
|
“2013 Follow-On Offering” means the registered offering of 5,520,000 shares of Class A common stock of Artisan Partners Asset Management Inc. completed on November 6, 2013.
|
|
•
|
“2014 Follow-On Offering” means the registered offering of 9,284,337 shares of Class A common stock of Artisan Partners Asset Management Inc. completed on March 12, 2014.
|
|
•
|
“2015 Follow-On Offering” means the registered offering of 3,831,550 shares of Class A common stock of Artisan Partners Asset Management Inc. completed on March 9, 2015.
|
Forward-Looking Statements
This report contains, and from time to time our management may make, forward-looking statements within the meaning of the safe harbor provisions of the U.S. Private Securities Litigation Reform Act of 1995. In some cases, you can identify these statements by forward-looking words such as “may”, “might”, “will”, “should”, “expects”, “intends”, “plans”, “anticipates”, “believes”, “estimates”, “predicts”, “potential” or “continue”, the negative of these terms and other comparable terminology. These forward-looking statements, which are subject to risks, uncertainties and assumptions, may include projections of our future financial performance, future expenses, anticipated growth strategies, descriptions of new business initiatives and anticipated trends in our industry, our business or our financial results. These statements are only predictions based on our current expectations and projections about future events. Among the important factors that could cause actual results, level of activity, performance or achievements to differ materially from those indicated by such forward-looking statements are: fluctuations in quarterly and annual results, adverse economic or market conditions, incurrence of net losses, adverse effects of management focusing on implementation of a growth strategy, failure to develop and maintain the Artisan Partners brand and other factors disclosed under “Risk Factors” in Item 1A of this Form 10-K. We undertake no obligation to publicly update or review any forward-looking statement, whether as a result of new information, future developments or otherwise, except as required by law.
Forward-looking statements include, but are not limited to, statements about:
|
•
|
our anticipated future results of operations;
|
|
•
|
our potential operating performance and efficiency;
|
|
•
|
our expectations with respect to future levels of assets under management, including the capacity of our strategies and client cash inflows and outflows;
|
|
•
|
our expectations with respect to industry trends and how those trends may impact our business;
|
|
•
|
our financing plans, cash needs and liquidity position;
|
|
•
|
our intention to pay dividends and our expectations about the amount of those dividends;
|
|
•
|
our expected levels of compensation of our employees;
|
|
•
|
our expectations with respect to future expenses and the level of future expenses;
|
|
•
|
our expected tax rate, and our expectations with respect to deferred tax assets; and
|
|
•
|
our estimates of future amounts payable pursuant to our tax receivable agreements.
|
Performance and Assets Under Management Information Used in this Report
We manage investments primarily through mutual funds and separate accounts. We serve as investment adviser to Artisan Funds and as investment manager of Artisan Global Funds. We refer to funds and other accounts that are managed by us with a broadly common investment objective and substantially in accordance with a single model account as being part of the same “strategy”.
ii
We measure the results both of our individual funds and of our “composites”, which represent the aggregate performance of all discretionary client accounts, including mutual funds, invested in the same strategy, except those accounts with respect to which we believe client-imposed investment restrictions (such as socially-based restrictions) may have a material impact on portfolio construction and those accounts managed in a currency other than U.S. dollars (the results of these accounts are maintained in separate composites, which are not presented in this report).
The performance of accounts with investment restrictions differs from the performance of accounts included in our principal composite for the applicable strategy because one or more securities may be omitted from the portfolio in order to comply with the restrictions and the weightings in the portfolio of other securities are correspondingly altered. The performance of non-U.S. dollar accounts differs from the performance of the principal composite for the applicable strategy because of the fluctuations in currency exchange rates between the currencies in which portfolio securities are traded and the currency in which the account is managed or U.S. dollars, respectively. Our assets under management in accounts with investment restrictions and non-U.S. dollar accounts represented approximately 2% and 7%, respectively, of our assets under management as of December 31, 2015. Results for any investment strategy described herein, and for different investment vehicles within a strategy, are affected by numerous factors, including: different material market or economic conditions; different investment management fee rates, brokerage commissions and other expenses; and the reinvestment of dividends or other earnings.
The returns for any strategy may be positive or negative, and past performance does not guarantee future results. In this report, we refer to the date on which we began tracking the performance of an investment strategy as that strategy’s “inception date”.
In this report, we present the average annual returns of our composites on a “gross” basis, which represent average annual returns before payment of fees payable to us by any portfolio in the composite and are net of commissions and transaction costs. We also present the average annual returns of certain market indices or “benchmarks” for the comparable period. Indices that are used for these performance comparisons are broad-based market indices that we believe are appropriate comparisons of our investment performance over a full market cycle. The indices are unmanaged and have differing volatility, credit and other characteristics. You should not assume that there is any material overlap between the securities included in the portfolios of our investment strategies during these periods and those that comprise any MSCI, Russell or BofA Merrill Lynch index referred to in this report. At times, this can cause material differences in relative performance. It is not possible to invest directly in any of the indices. The returns of these indices, as presented in this report, have not been reduced by fees and expenses associated with investing in securities, but do include the reinvestment of dividends.
The MSCI EAFE
®
Index, the MSCI EAFE
®
Growth Index, the MSCI EAFE
®
Small Cap Index, the MSCI EAFE
®
Value Index, the MSCI ACWI
®
Index and the MSCI Emerging Markets Index
SM
are trademarks of MSCI Inc. MSCI Inc. is the owner of all copyrights relating to these indices and is the source of the performance statistics of these indices that are referred to in this report.
The Russell 2000
®
Index, the Russell 2000
®
Value Index, the Russell Midcap
®
Index, the Russell Midcap
®
Value Index, the Russell 1000
®
Index, the Russell 1000
®
Value Index, the Russell Midcap
®
Growth Index and the Russell 2000
®
Growth Index are trademarks of Russell Investment Group. Russell Investment Group is the owner of all copyrights relating to these indices and is the source of the performance statistics that are referred to in this report.
The BofA Merrill Lynch US High Yield Master II Index is licensed from BofA Merrill Lynch, which is the source of the performance statistics of this index.
In this report, we present Morningstar, Inc., or Morningstar, ratings for series of Artisan Funds. The Morningstar ratings refer to the ratings by Morningstar of the share class of the respective series of Artisan Funds with the earliest inception date and are based on a 5-star scale. Morningstar data contained herein (1) is proprietary to Morningstar and/or its content providers, (2) may not be copied or distributed and (3) is not warranted to be accurate, complete or timely. Neither Morningstar nor its content providers are responsible for any damages or losses arising from any use of this information. For each fund with at least a three-year history, Morningstar calculates a Morningstar Rating™, which is based on a Morningstar Risk-Adjusted Return measure that accounts for variation in a fund’s monthly performance, including the effects of sales charges, loads, and redemption fees, placing more emphasis on downward variations and rewarding consistent performance. The top 10% of funds in each category receive 5 stars, the next 22.5% receive 4 stars, the next 35% receive 3 stars, the next 22.5% receive 2 stars and the bottom 10% receive 1 star. The Overall Morningstar Rating
TM
is derived from a weighted average of the performance figures associated with the rated fund’s three-, five- and 10-year Morningstar Rating metrics.
Throughout this report, we present historical information about our assets under management, including information about changes in our assets under management due to gross client cash inflows and outflows, market appreciation and depreciation and transfers between investment vehicles (i.e., Artisan Funds and separate accounts). Gross client cash inflows and outflows represent client fundings, terminations and client initiated contributions and withdrawals (which could be in cash or in securities).
iii
Market appreciation (depreciation) represents realized gains and losses, the change in unrealized gains and losses, net income and certain miscellaneous items, immaterial in the aggregate, which may include payment of Artisan’s management fees or payment of custody expenses to the extent a client causes these fees to be paid from the account we manage. The effect of translating into U.S. dollars the value of portfolio securities denominated in currencies other than the U.S. dollar is included in market appreciation (depreciation).We also present information about our average assets under management for certain periods.
We use our information management systems to track our assets under management, the components of market appreciation and depreciation, and client inflows and outflows, and we believe the information set forth in this report regarding our assets under management, market appreciation and depreciation, and client inflows and outflows is accurate in all material respects. We also present information regarding the amount of our assets under management and client inflows and outflows sourced through particular investment vehicles and distribution channels. The allocation of assets under management and client flows sourced through particular distribution channels involves estimates because precise information on the sourcing of assets invested in Artisan Funds or Artisan Global Funds through intermediaries is not available on a complete or timely basis and involves the exercise of judgment because the same assets, in some cases, might fairly be said to have been sourced from more than one distribution channel. We have presented the information on our assets under management and client inflows and outflows sourced by distribution channel in the way in which we prepare and use that information in the management of our business. Data on our assets under management sourced by distribution channel and client inflows and outflows are not subject to our internal controls over financial reporting.
None of the information in this report constitutes either an offer or a solicitation to buy or sell any fund securities, nor is any such information a recommendation for any fund security or investment service.
iv
Overview
Founded in 1994, we are an investment management firm that provides a broad range of U.S., non-U.S. and global investment strategies, each of which is managed by one of our seven distinct and autonomous investment teams. Since our founding, we have pursued a business model that is designed to maximize our ability to produce attractive investment results for our clients, and we believe this model has contributed to our success in doing so. We focus on attracting, retaining and developing talented investment professionals by creating an environment in which each investment team is provided ample resources and support, transparent and direct financial incentives, and a high degree of investment autonomy. Each of our investment teams is led by one or more experienced portfolio managers with a track record of strong investment performance and is devoted to identifying long-term investment opportunities. We believe this autonomous structure promotes independent analysis and accountability among our investment professionals, which we believe promotes superior investment results.
The following table sets forth our revenues and our ending and average assets under management for the periods noted:
|
For the Years Ended December 31,
|
|||||||||||
|
2015
|
2014
|
2013
|
|||||||||
|
(in millions)
|
|||||||||||
|
Total revenues
|
$
|
806
|
|
$
|
829
|
|
$
|
686
|
|
||
|
Ending assets under management
|
$
|
99,848
|
|
$
|
107,915
|
|
$
|
105,477
|
|
||
|
Average assets under management
|
$
|
106,484
|
|
$
|
107,865
|
|
$
|
89,545
|
|
||
Each of our investment strategies is designed to have a clearly articulated, consistent and replicable investment process that is well-understood by clients and managed to achieve long-term performance. Throughout our history, we have expanded our investment management capabilities in a disciplined manner that we believe is consistent with our overall philosophy of offering high value-added investment strategies in growing asset classes. We have expanded the range of strategies that we offer by launching new strategies managed by our existing investment teams as those teams have developed investment capacity, such as our Global Small-Cap Growth strategy, which we launched in June 2013, as well as by launching new strategies managed by new investment teams recruited to join Artisan. During 2014, we established the Artisan Credit Team, which manages the Artisan High Income strategy, our first fixed income strategy. During 2015, we established the Artisan Developing World Team, which manages the Artisan Developing World strategy.
We launch a new strategy only when we believe it has the potential to achieve superior investment performance in an area that we believe will have sustained client demand at attractive fee rates over the long term. We strive to maintain the integrity of the investment process followed in each of our strategies by rigorous adherence to the investment parameters we have communicated to our clients. We also carefully monitor our investment capacity in each investment strategy. We believe that management of our investment capacity protects our ability to manage assets successfully, which protects the interests of our clients and, in the long term, protects our ability to retain client assets and maintain our profit margins. In order to better achieve our long-term goals, we are willing to close a strategy to new investors or otherwise take action to slow or restrict its growth, even though our short-term results may be impacted.
In addition to our investment teams, we have a management team that is focused on our business objectives of achieving profitable growth, expanding our investment capabilities, diversifying the source of our assets under management and delivering superior client service. Our management team supports our investment management capabilities and manages a centralized infrastructure, which allows our investment professionals to focus primarily on making investment decisions and generating returns for our clients.
We offer our investment management capabilities primarily to institutions and through intermediaries that operate with institutional-like decision-making processes and have longer-term investment horizons, by means of separate accounts and mutual funds. As of
December 31, 2015
, separate accounts represented
$46.3 billion
, or
46%
, of our assets under management.
We serve as the investment adviser to Artisan Partners Funds, Inc., an SEC-registered family of mutual funds that offers shares in multiple classes designed to meet the needs of a range of institutional and other investors, and as investment manager of Artisan Partners Global Funds PLC, a family of Ireland-based UCITS funds that began operations in 2011 and offers shares to non-U.S. investors. Artisan Funds and Artisan Global Funds comprised
$53.5 billion
, or
54%
, of our assets under management as of
December 31, 2015
.
1
We access traditional institutional clients primarily through relationships with investment consultants. We access other institutional-like investors primarily through consultants, alliances with major defined contribution/401(k) platforms and relationships with financial advisors and broker-dealers. We derive essentially all of our revenues from investment management fees, which primarily are based on a specified percentage of clients’ average assets under management. These fees are derived from investment advisory and sub-advisory agreements that are terminable by clients upon short notice or no notice.
As of
December 31, 2015
, we had approximately 370 employees. Our employees, including our investment professionals and senior management, to whom we have granted equity collectively owned approximately 29% of the equity ownership interests in our company, based on Class B common stock and unvested restricted shares held by employees as of
December 31, 2015
.
Investment Teams
We provide clients with multiple long-only, equity investment strategies spanning market capitalization segments and investing styles in both U.S. and non-U.S. markets. We also offer one fixed income strategy, the Artisan High Income strategy. Each strategy is managed by one of the investment teams described below. Each team operates autonomously to identify investment opportunities in order to generate strong, long-term investment performance.
The table below sets forth the total assets under management for each of our investment teams and strategies as of
December 31, 2015
, the inception date for each investment composite, the value-added by each strategy since inception date, and the Overall Morningstar Rating™ for the series of Artisan Funds managed in that strategy.
|
Investment Team and Strategy
|
AUM as of December 31, 2015
|
Composite Inception Date
|
Value-Added Since Inception Date
(1)
as of December 31, 2015
|
Fund Rating
(2)
as of December 31, 2015
|
|
|
|
(in millions)
|
||||
|
Global Equity Team
|
|
|
|
|
|
|
Non-U.S. Growth Strategy
|
$30,187
|
January 1, 1996
|
618
|
««««
|
|
|
Non-U.S. Small-Cap Growth Strategy
|
1,323
|
January 1, 2002
|
448
|
«««
|
|
|
Global Equity Strategy
|
786
|
April 1, 2010
|
554
|
«««««
|
|
|
Global Small-Cap Growth Strategy
|
138
|
July 1, 2013
|
(88)
|
Not yet rated
|
|
|
|
|||||
|
U.S. Value Team
|
|
|
|
|
|
|
U.S. Mid-Cap Value Strategy
|
7,959
|
April 1, 1999
|
404
|
«««
|
|
|
U.S. Small-Cap Value Strategy
|
854
|
June 1, 1997
|
315
|
««
|
|
|
Value Equity Strategy
|
1,556
|
July 1, 2005
|
(119)
|
««
|
|
|
|
|||||
|
Growth Team
|
|
|
|||
|
U.S. Mid-Cap Growth Strategy
|
15,103
|
April 1, 1997
|
560
|
««««
|
|
|
U.S. Small-Cap Growth Strategy
|
2,270
|
April 1, 1995
|
115
|
««««
|
|
|
Global Opportunities Strategy
|
7,556
|
February 1, 2007
|
641
|
«««««
|
|
|
|
|||||
|
Global Value Team
|
|
|
|||
|
Non-U.S. Value Strategy
|
16,257
|
July 1, 2002
|
673
|
«««««
|
|
|
Global Value Strategy
|
13,925
|
July 1, 2007
|
550
|
«««««
|
|
|
|
|||||
|
Emerging Markets Team
|
|
|
|||
|
Emerging Markets Strategy
|
571
|
July 1, 2006
|
(23)
|
««
|
|
|
|
|||||
|
Credit Team
|
|||||
|
High Income Strategy
|
989
|
April 1, 2014
|
553
|
Not yet rated
|
|
|
Developing World Team
|
|||||
2
|
Developing World Strategy
|
374
|
July 1, 2015
|
560
|
Not yet rated
|
|
|
Total AUM as of December 31, 2015
|
$99,848
|
|
|
||
|
(1) Value-added since inception date is the amount in basis points by which the average annual gross composite return of each of our strategies has outperformed the broad-based market index most commonly used by our clients to compare the performance of the relevant strategy since its inception date. Periods of one year or less are not annualized. The broad-based market indices used to compute the value added since inception date for each of our strategies are as follows: Non-U.S. Growth strategy-MSCI EAFE® Index; Non-U.S. Small-Cap Growth strategy-MSCI EAFE® Small Cap Index; Global Equity strategy-MSCI ACWI® Index; Global Small-Cap Growth strategy-MSCI ACWI® Small Cap Index; U.S. Small-Cap Value strategy-Russell 2000® Index; U.S. Mid-Cap Value strategy-Russell Midcap® Index; Value Equity strategy-Russell 1000® Index; U.S. Mid-Cap Growth strategy-Russell Midcap® Index; Global Opportunities strategy-MSCI ACWI® Index; U.S. Small-Cap Growth strategy-Russell 2000® Index; Non-U.S. Value strategy-MSCI EAFE® Index; Global Value strategy-MSCI ACWI® Index; Emerging Markets strategy-MSCI Emerging Markets IndexSM; Developing World Strategy-MSCI Emerging Markets Index; High Income strategy—Bank of America Merrill Lynch U.S. High Yield Master II Index. Unlike the BofA Merrill Lynch High Yield Master ll Index, the Artisan High Income strategy may hold loans and other security types. At times, this does cause material differences in relative performance.
|
|||||
|
(2) The Morningstar Rating™ compares the risk-adjusted performance of the Artisan Funds series to other funds in a category assigned by Morningstar based on its analysis of the funds’ portfolio holdings. The top 10% of funds receive 5 stars, the next 22.5% receive 4 stars, the next 35% receive 3 stars, the next 22.5% receive 2 stars and the bottom 10% receive 1 star. The Overall Morningstar Rating™ is derived from a weighted average of the performance figures associated with the rated fund’s three-, five- and 10-year Morningstar Rating metrics. The Artisan Funds, the ratings of which are reflected in the table above, and the categories in which they are rated are: Artisan International Fund-Foreign Large Blend Funds Category; Artisan International Small Cap Fund-Foreign Small/Mid Growth Funds Category; Artisan Global Equity Fund-World Stock; Artisan Small Cap Value Fund-Small Value Funds Category; Artisan Mid Cap Value Fund-Mid Cap Value Funds Category; Artisan Value Equity Fund-Large Value Funds Category; Artisan Mid Cap Fund-Mid Cap Growth Funds Category; Artisan Global Opportunities Fund-World Stock; Artisan Small Cap Fund-Small Growth Funds Category; Artisan International Value Fund-Foreign Small/Mid Funds Category; Artisan Global Value Fund-World Stock; Artisan Emerging Markets Fund-Diversified Emerging Markets Funds Category. Morningstar ratings are initially given on a fund’s three-year track record and change monthly.
|
|||||
Global Equity Team
Our Global Equity team, which was formed in 1996 and is based in San Francisco and New York, manages four investment strategies: Non-U.S. Growth, Non-U.S. Small-Cap Growth, Global Equity and Global Small-Cap Growth. Mark L. Yockey is the founder of our Global Equity team and has been portfolio manager of each of the team’s strategies since their inception. Charles-Henri Hamker and Andrew J. Euretig are associate portfolio managers of the Non-U.S. Growth strategy and portfolio co-managers (with Mr. Yockey) of the Global Equity strategy. Mr. Hamker also serves as portfolio manager of the Non-U.S. Small-Cap Growth and Global Small-Cap Growth strategies with Mr. Yockey. The Non-U.S. Small-Cap Growth strategy is closed to most new investors and client relationships. We closed the Non-U.S. Growth strategy to most new retail and intermediary investors on February 1, 2016, and we plan to close the strategy to most new institutional investors and employee benefit plans on October 1, 2016.
The Global Equity team employs a fundamental stock selection process focused on identifying companies within its preferred themes with sustainable growth characteristics at valuations that do not fully reflect their long-term potential. The team’s objective is to invest in companies that are industry leaders and have meaningful exposure to and will benefit from long-term secular growth trends. To identify long-term, sustainable growth characteristics of potential investments, the team seeks high-quality companies that typically have a sustainable competitive advantage, a superior business model and a high-quality management team. Finally, the team uses multiple valuation metrics to establish a target price range and assesses the relationship between its estimate of a company’s sustainable growth prospects and the company’s current valuation.
3
|
|
As of December 31, 2015
|
|||||||||||||
|
Investment Strategy (Inception Date)
|
1 Year
|
|
3 Years
|
|
5 Years
|
|
10 Years
|
|
Inception
|
|||||
|
Non-U.S. Growth (January 1, 1996)
|
|
|
|
|
|
|
|
|
|
|||||
|
Average Annual Gross Returns
|
(2.83
|
)%
|
7.70
|
%
|
8.13
|
%
|
6.37
|
%
|
10.60
|
%
|
||||
|
MSCI EAFE
®
Index
|
(0.81
|
)%
|
5.01
|
%
|
3.60
|
%
|
3.03
|
%
|
4.42
|
%
|
||||
|
|
||||||||||||||
|
Non-U.S. Small-Cap Growth (January 1, 2002)
|
|
|
|
|
|
|
|
|
|
|||||
|
Average Annual Gross Returns
|
12.63
|
%
|
9.94
|
%
|
9.24
|
%
|
9.39
|
%
|
14.54
|
%
|
||||
|
MSCI EAFE
®
Small Cap Index
|
9.59
|
%
|
10.44
|
%
|
6.32
|
%
|
4.55
|
%
|
10.06
|
%
|
||||
|
|
||||||||||||||
|
Global Equity (April 1, 2010)
|
|
|
|
|
|
|
|
|
||||||
|
Average Annual Gross Returns
|
2.18
|
%
|
11.91
|
%
|
11.65
|
|
—
|
|
12.44
|
%
|
||||
|
MSCI ACWI
®
Index
|
(2.36
|
)%
|
7.69
|
%
|
6.08
|
|
—
|
|
6.90
|
%
|
||||
|
Global Small-Cap Growth (July, 1, 2013)
|
||||||||||||||
|
Average Annual Gross Returns
|
7.72
|
%
|
—
|
|
—
|
|
—
|
|
6.37
|
%
|
||||
|
MSCI ACWI
®
Small Cap Index
|
(1.04
|
)%
|
—
|
|
—
|
|
—
|
|
7.25
|
%
|
||||
U.S. Value Team
Our U.S. Value team, which was formed in 1997 and is based in Atlanta, Georgia, manages three investment strategies: U.S. Small-Cap Value, U.S. Mid-Cap Value and Value Equity. Scott C. Satterwhite, James C. Kieffer, George O. Sertl, Jr. and Daniel L. Kane are the portfolio co-managers for each of these strategies. Mr. Satterwhite plans to retire in September 2016. The U.S. Small-Cap Value and the U.S. Mid-Cap Value strategies are closed to most new investors and client relationships. In late February 2016 we announced that we plan to cease managing assets in the U.S. Small-Cap Value strategy. In connection with that decision, the board of directors of Artisan Funds approved a plan to reorganize Artisan Small Cap Value Fund into Artisan Mid Cap Value Fund. The reorganization is expected to close in the second quarter of 2016. We plan to work with separate account clients on the transition or liquidation options available for their accounts.
The U.S. Value team’s strategies employ a fundamental investment process used to construct diversified portfolios of companies that the team believes are undervalued, are in solid financial condition and have attractive business economics. The team believes companies with these characteristics are less likely to experience eroding values over the long term compared to companies without such characteristics.
The team values a business using what it believes are reasonable expectations for the long-term earnings power and capitalization rates of that business. This results in a range of values for the company that the team believes would be reasonable. The team generally will purchase a security if the stock price falls below or toward the lower end of that range.
The team prefers companies with an acceptable level of debt and positive cash flow. At a minimum, the team seeks to avoid companies that have so much debt that management may be unable to make decisions that would be in the best interest of the companies’ shareholders. The team also favors cash-producing businesses that it believes are capable of earning acceptable returns on capital over the company’s business cycle.
4
|
|
As of December 31, 2015
|
|||||||||||||
|
Investment Strategy (Inception Date)
|
1 Year
|
|
3 Years
|
|
5 Years
|
|
10 Years
|
|
Inception
|
|||||
|
U.S. Small-Cap Value (June 1, 1997)
|
|
|
|
|
|
|
|
|
|
|||||
|
Average Annual Gross Returns
|
(11.24
|
)%
|
2.31
|
%
|
2.47
|
%
|
5.34
|
%
|
10.60
|
%
|
||||
|
Russell 2000
®
Index
|
(4.41
|
)%
|
11.65
|
%
|
9.18
|
%
|
6.80
|
%
|
7.45
|
%
|
||||
|
|
||||||||||||||
|
U.S. Mid-Cap Value (April 1, 1999)
|
|
|
|
|
|
|
|
|
|
|||||
|
Average Annual Gross Returns
|
(8.77
|
)%
|
8.80
|
%
|
9.34
|
%
|
8.32
|
%
|
12.92
|
%
|
||||
|
Russell Midcap
®
Index
|
(2.44
|
)%
|
14.18
|
%
|
11.43
|
%
|
7.99
|
%
|
8.88
|
%
|
||||
|
|
||||||||||||||
|
Value Equity (July 1, 2005)
|
|
|
|
|
|
|
|
|
|
|||||
|
Average Annual Gross Returns
|
(8.30
|
)%
|
7.20
|
%
|
8.52
|
%
|
5.96
|
%
|
6.45
|
%
|
||||
|
Russell 1000
®
Index
|
0.92
|
%
|
15.01
|
%
|
12.44
|
%
|
7.40
|
%
|
7.64
|
%
|
||||
Growth Team
Our Growth team, which was formed in 1997 and is based in Milwaukee, Wisconsin, manages three investment strategies: U.S. Mid-Cap Growth, Global Opportunities and U.S. Small-Cap Growth. James D. Hamel, Matthew H. Kamm, Craigh A. Cepukenas, and Jason L. White are the portfolio co-managers of all three strategies. Mr. Kamm is the lead portfolio manager of the U.S. Mid-Cap Growth strategy; Mr. Hamel is the lead portfolio manager of the Global Opportunities strategy; and Mr. Cepukenas is the lead portfolio manager of the U.S. Small-Cap Growth strategy. The U.S. Mid-Cap Growth and U.S. Small-Cap Growth strategies are currently closed to most new investors and client relationships.
The Growth team’s investment process focuses on two distinct areas-security selection and capital allocation. The team’s investment process begins by identifying companies that have franchise characteristics (e.g. low cost production capability, possession of a proprietary asset, dominant market share or a defensible brand name), are benefiting from an accelerating profit cycle and are trading at a discount to the team’s estimate of private market value. The team looks for companies that are well positioned for long-term growth, which is driven by demand for their products and services at an early enough stage in their profit cycle to benefit from the increased cash flows produced by the emerging profit cycle.
Based on the investment team’s fundamental analysis of a company’s profit cycle, the investment team classifies each portfolio holding in one of three stages. Garden
SM
investments generally are smaller positions in the early part of their profit cycle that may warrant a larger allocation once their profit cycle accelerates. Crop
SM
investments are positions that are being increased to or maintained at a full weight because they are moving through the strongest part of their profit cycle. Harvest
SM
investments are positions that are being reduced as they near the investment team’s estimate of full valuation or their profit cycle begins to decelerate. The team overlays the security selection and capital allocation elements of its investment process with a desire to invest opportunistically across the entire global economy. The team seeks broad knowledge of the global economy in order to position it to find growth wherever it occurs.
|
|
As of December 31, 2015
|
|||||||||||||
|
Investment Strategy (Inception Date)
|
1 Year
|
|
3 Years
|
|
5 Years
|
|
10 Years
|
|
Inception
|
|||||
|
U.S. Mid-Cap Growth (April 1, 1997)
|
|
|
|
|
|
|
|
|
|
|||||
|
Average Annual Gross Returns
|
3.44
|
%
|
15.44
|
%
|
13.03
|
%
|
11.11
|
%
|
15.55
|
%
|
||||
|
Russell Midcap
®
Index
|
(2.44
|
)%
|
14.18
|
%
|
11.43
|
%
|
7.99
|
%
|
9.96
|
%
|
||||
|
|
||||||||||||||
|
Global Opportunities (February 1, 2007)
|
|
|
|
|
|
|
|
|
|
|||||
|
Average Annual Gross Returns
|
9.12
|
%
|
12.61
|
%
|
12.11
|
%
|
—
|
|
9.42
|
%
|
||||
|
MSCI ACWI
®
Index
|
(2.36
|
)%
|
7.69
|
%
|
6.08
|
%
|
—
|
|
3.01
|
%
|
||||
|
|
||||||||||||||
|
U.S. Small-Cap Growth (April 1, 1995)
|
|
|
|
|
|
|
|
|
|
|||||
|
Average Annual Gross Returns
|
1.61
|
%
|
13.85
|
%
|
13.76
|
%
|
8.18
|
%
|
9.94
|
%
|
||||
|
Russell 2000
®
Index
|
(4.41
|
)%
|
11.65
|
%
|
9.18
|
%
|
6.80
|
%
|
8.79
|
%
|
||||
5
Global Value Team
Our Global Value team, which was formed in 2002 and is based in San Francisco, California, manages two investment strategies: Non-U.S. Value and Global Value. N. David Samra and Daniel J. O’Keefe are the portfolio co-managers of both strategies. Mr. Samra is the lead portfolio manager of the Non-U.S. Value strategy, and Mr. O’Keefe is the lead portfolio manager of the Global Value strategy. The Non-U.S. Value strategy is closed to most new investors and client relationships. We re-opened the Global Value strategy across pooled vehicles on October 1, 2015. The strategy remains closed to most new separate account clients.
The Global Value team’s strategies employ a fundamental investment process used to construct diversified portfolios of companies. The team seeks to invest in what it considers to be high quality, undervalued companies with strong balance sheets and shareholder-oriented management teams.
Determining the intrinsic value of a business is the heart of the team’s research process. The team believes that intrinsic value represents the amount that a buyer would pay to own a company’s future cash flows. The team seeks to invest at a significant discount to its estimate of the intrinsic value of a business. The team also seeks to invest in companies with histories of generating strong free cash flow, improving returns on capital and strong competitive positions in their industries. The team believes that investing in companies with strong balance sheets helps to reduce the potential for capital risk and provides company management the ability to build value when attractive opportunities are available. The team’s research process also attempts to identify management teams with a history of building value for shareholders.
The team ranks companies that make it through this analytical process according to the degree of the discount of the current market price of the stock to the team’s estimate of the company’s intrinsic value. The team manages its strategies by generally taking larger positions in companies where the discount is greatest and smaller positions in companies with narrower discounts (subject to adjustments for investment-related concerns, including, diversification, risk management and liquidity).
|
|
As of December 31, 2015
|
|||||||||||||
|
Investment Strategy (Inception Date)
|
1 Year
|
|
3 Years
|
|
5 Years
|
|
10 Years
|
|
Inception
|
|||||
|
Non-U.S. Value (July 1, 2002)
|
|
|
|
|
|
|
|
|
|
|||||
|
Average Annual Gross Returns
|
(0.64
|
)%
|
9.96
|
%
|
9.09
|
%
|
9.25
|
%
|
12.67
|
%
|
||||
|
MSCI EAFE
®
Index
|
(0.81
|
)%
|
5.01
|
%
|
3.60
|
%
|
3.03
|
%
|
5.93
|
%
|
||||
|
|
||||||||||||||
|
Global Value (July 1, 2007)
|
|
|
|
|
|
|
|
|
|
|||||
|
Average Annual Gross Returns
|
(1.83
|
)%
|
11.70
|
%
|
11.66
|
%
|
—
|
|
7.64
|
%
|
||||
|
MSCI ACWI
®
Index
|
(2.36
|
)%
|
7.69
|
%
|
6.08
|
%
|
—
|
|
2.14
|
%
|
||||
Emerging Markets Team
Our Emerging Markets team, which was formed in 2006 and is based in New York, New York, manages a single investment strategy. Maria Negrete-Gruson is the portfolio manager for the Emerging Markets strategy. In late February 2016, a client of our Emerging Markets strategy communicated its intent to terminate its account with us during the second quarter of 2016. The client’s account represents approximately one-half of the assets under management in the Emerging Markets strategy as of the date of this filing.
The Emerging Markets team employs a fundamental research process to construct a diversified portfolio of emerging market companies. The team seeks to invest in companies that it believes are uniquely positioned to benefit from the growth potential in emerging markets and possess a sustainable global competitive advantage. The team believes that over the long-term a stock’s price is directly related to the company’s ability to deliver sustainable earnings, which the team determines based upon financial and strategic analyses. The team also believes that a disciplined risk framework allows greater focus on fundamental stock selection. The team incorporates its assessment of company-specific and macroeconomic risks into its valuation analysis to develop a risk adjusted target price. The risk-rating assessment includes a review of the currency, inflation, monetary and fiscal policy and political risks to which a company is exposed. Finally, the team believes that investment opportunities develop when businesses with sustainable earnings are undervalued relative to peers and historical industry, country and regional valuations. The team values a business and develops a price target for a company based on its assessment of the business’s sustainable earnings and risk assessment.
6
|
|
As of December 31, 2015
|
||||||||||||
|
Investment Strategy (Inception Date)
|
1 Year
|
|
3 Years
|
|
5 Years
|
|
10 Years
|
|
Inception
|
||||
|
Emerging Markets (July 1, 2006)
|
|
|
|
|
|
|
|
|
|
||||
|
Average Annual Gross Returns
|
(10.95
|
)%
|
(5.56
|
)%
|
(6.26
|
)%
|
—
|
2.82
|
%
|
||||
|
MSCI Emerging Markets Index
SM
|
(14.92
|
)%
|
(6.76
|
)%
|
(4.80
|
)%
|
—
|
3.05
|
%
|
||||
Credit Team
Our Credit team, which was formed in 2014 and is based in Mission Woods, Kansas, manages a single investment strategy. Bryan L. Krug is the portfolio manager for the High Income strategy. The Credit team seeks to invest in issuers with high quality business models that have compelling risk-adjusted return characteristics. The team invests primarily in non-investment grade corporate bonds and secured and unsecured loans of U.S. and non-U.S. issuers. The team’s research process has four primary pillars: business quality; financial strength and flexibility; downside analysis; and value identification.
The team analyzes the general health of the industry in which an issuer operates, the issuer’s competitive position, the dynamics of industry participants, and the decision-making history of the issuer’s management. To understand an issuer’s financial health, the team believes it is critical to analyze the history and trend of free cash flow. The team also considers an issuer’s capital structure, refinancing options, financial covenants, amortization schedules and overall financial transparency. The team seeks to manage the risk of loss with what it believes to be conservative financial projections that account for industry position, competitive dynamics and positioning within the capital structure. To determine the value of an investment opportunity the team uses multiple valuation metrics. The team looks for credit improvement potential, relative value within an issuer’s capital structure, catalysts for business improvement and potential value stemming from market or industry dislocations.
The Credit team generally determines the amount of assets invested in each issuer based on conviction, valuation and availability of supply. Based on the team’s analysis it divides the portfolio into three parts. Core investments are generally positions with stable to improving credit profiles and lower loan to value ratios. Spread investments are those where the team has an out-of-consensus view about a company’s credit improvement potential. Opportunistic investments are driven by market dislocations that have created a unique investment opportunity.
|
|
As of December 31, 2015
|
||||||||||
|
Investment Strategy (Inception Date)
|
1 Year
|
|
3 Years
|
|
5 Years
|
|
10 Years
|
|
Inception
|
||
|
High Income (April 1, 2014)
|
|
|
|
|
|
|
|
|
|
||
|
Average Annual Gross Returns
|
2.02
|
%
|
—
|
—
|
—
|
2.59
|
%
|
||||
|
BofA Merrill Lynch High Yield Master II Index
|
(4.64
|
)%
|
—
|
—
|
—
|
(2.94
|
)%
|
||||
Developing World Team
Our Developing World team, which was formed in 2015 and is based in San Francisco, California, manages a single investment strategy. Lewis S. Kaufman is the portfolio manager for the Developing World strategy.
The Developing World team employs a fundamental investment process to construct a diversified portfolio of securities that offers exposure to developing world economies. In pursuit of this goal, the team generally invests substantially in companies domiciled in or economically tied to countries the team considers to have characteristics typical of the developing world. The team generally seeks to emphasize business value compounders, which it defines as financially sound, free cash flow generative companies with sound business models that are exposed to the growth potential of the developing world. The team may seek to mitigate currency volatility by emphasizing investments in countries and currencies that are less dependent on foreign capital. The Developing World team believes a portfolio of companies with these characteristics will be well positioned to deliver attractive risk-adjusted returns over the long term.
The Developing World strategy began operations in June of 2015. Its gross return since composite inception (July 1, 2015) is
(11.75)%
compared to
(17.35)%
for the MSCI Emerging Markets Index over the same period.
Distribution, Investment Products and Client Relationships
The goal of our marketing, distribution and client service efforts is to establish and maintain a client base that is diversified by investment strategy, investment vehicle (for example, across mutual funds and separate accounts), distribution channel (for example, institutional, intermediary and retail) and geographic region.
7
We focus our distribution and marketing efforts on institutions and on intermediaries that operate with institutional-like, centralized decision-making processes and longer-term investment horizons.
We have designed our distribution strategies and structured our distribution teams to use knowledgeable, seasoned marketing and client service professionals in a way intended to limit the time our investment professionals are required to spend in marketing and client service activities. We believe that minimizing other demands allows our portfolio managers and other investment professionals to focus their energies and attention on the investment decision-making process, which we believe enhances the opportunity to achieve superior investment returns.
Our distribution efforts are centrally managed by Dean J. Patenaude, Executive Vice President and Head of Global Distribution, who oversees and coordinates the efforts of our marketing and client service professionals. We are expanding our distribution efforts into non-U.S. markets, with our primary non-U.S. efforts focused currently on the United Kingdom, other European countries, Australia, Canada and certain Asian countries where we believe there is growing demand for global and non-U.S. investment strategies. In our non-U.S. distribution efforts, we use regional specialists who draw on the knowledge and expertise of our strategy-focused professionals. As of
December 31, 2015
, 14% of our total assets under management were sourced from clients located outside the United States.
Institutional Channel
Our institutional distribution channel includes traditional institutional clients, such as U.S.-registered mutual funds, non-U.S. funds and collective investment trusts we sub-advise; state and local governments; employee benefit plans including Taft-Hartley plans; foundations; and endowments. We offer our investment products to these types of institutional clients directly and by marketing our services to the investment consultants that advise them. As of
December 31, 2015
, approximately 39% of our assets under management were sourced through investment consultants, and no single consulting firm represented clients (including investors in Artisan Funds) having more than 7% of our assets under management.
Our institutional distribution channel also includes defined contribution/401(k) plans. An investor in the defined contribution/401(k) marketplace may access our services via Artisan Funds shares and separate accounts (including collective investment trusts). Although the vehicles utilized in the defined contribution marketplace continue to evolve, most of our defined contribution/401(k) assets under management are invested in Artisan Funds, shares of which are offered as an investment option on a number of 401(k) platforms. We include defined contribution/401(k) plan assets in our institutional distribution channel because we access these assets through investment consultants who advise defined contribution/401(k) plans and other institutional decision makers. As of
December 31, 2015
, our largest 401(k) plan provider relationship accounted for approximately 4% of our assets under management.
As of
December 31, 2015
,
65%
of our assets under management were sourced through our institutional channel.
Intermediary Channel
We maintain relationships with a number of major brokerage firms and larger private banks. More broker-dealers have moved to an open architecture model under which they strive to offer “best-in-breed” investment strategies to their clients, as do the larger private banks and trust companies with which we have relationships. In those organizations, the process for identifying which funds to offer has been centralized to a relatively limited number of key decision-makers that exhibit institutional decision-making behavior, which we believe allows us to gain broad exposure to broker-dealer and private bank clients in a manner consistent with our distribution strategy. We also maintain relationships with a number of financial advisory firms that offer our investment products to their clients. These advisors range from relatively small firms to large organizations. We access high net worth individuals and other non-institutional or small institutional investors through these relationships.
As of
December 31, 2015
, approximately
30%
of our assets under management were sourced through our intermediary channel, and our largest intermediary relationship represented approximately 3% of our assets under management.
Retail Channel
We primarily access retail investors indirectly through mutual fund supermarkets through which investors have the ability to purchase and redeem shares without another intermediary. The providers of mutual fund supermarkets typically have recommended lists that are effective in promoting purchases of shares of mutual funds included in the list. Investors can also invest directly in the series of Artisan Funds. Our subsidiary, Artisan Partners Distributors LLC, a registered broker-dealer, distributes shares of Artisan Funds. Publicity and reviews and rankings from Morningstar, Lipper and others are important in building the Artisan Partners brand, which is important in attracting retail investors. As a result, we publicize the ratings and rankings received by the series of Artisan Funds and work to ensure that potential retail investors have appropriate information to evaluate a potential investment in Artisan Funds. We do not generally use direct marketing campaigns as we believe that their cost outweighs their potential benefits.
As of
December 31, 2015
, approximately
5%
of our assets under management were sourced from investors we categorize as retail investors.
8
Access Through a Range of Investment Vehicles
Our clients access our investment strategies through a range of investment vehicles, including separate accounts and mutual funds. As of
December 31, 2015
, approximately 46% of our assets under management were in separate accounts, and Artisan Funds and Artisan Global Funds accounted for approximately 54% of our total assets under management.
Separate Accounts
We manage separate account assets within most of our investment strategies. As of
December 31, 2015
, we managed 217 separate accounts spanning 147 client relationships. Our separate account clients include pension and profit sharing plans, corporations, trusts, endowments, foundations, charitable organizations, government entities, insurance companies, investment advisers, and private funds, as well as mutual funds, non-U.S. funds and collective investment trusts we sub-advise. We generally require a minimum account size of $20 million to $100 million, depending on the strategy, to manage a separate account. The separate accounts we manage include all or part of the portfolios of several U.S.-registered mutual funds and non-U.S.-based funds pursuant to sub-advisory agreements with their primary advisers. The institutions with which we enter into sub-advisory relationships include financial services companies supplementing their own product offerings with externally managed products. For these clients, the portfolio or sub-portfolio we manage is managed in accordance with one of our identified investment strategies. We also offer access to our Non-U.S. Growth, Value Equity, Global Equity, Global Opportunities and Developing World strategies through Artisan-branded collective investment trusts. The fees we charge our separate accounts vary by client, investment strategy and the size of the account and are accrued monthly, but generally are paid quarterly in arrears.
Artisan Funds and Artisan Global Funds
U.S. investors that do not meet our minimum account size for a separate account, or who otherwise prefer to invest through a mutual fund, can invest in our strategies through Artisan Funds. We serve as the investment adviser to each series of Artisan Funds, SEC-registered mutual funds that offer no-load, open-end share classes designed to meet the needs of a range of institutional and other investors. Each series of Artisan Funds corresponds to one of the investment strategies we offer to clients. In contrast to some mutual funds, investors in Artisan Funds pay no 12b-1 fees, which are fees charged to investors in addition to management fees to pay for marketing, advertising and distribution services associated with the mutual funds. Expenses for marketing, advertising and distribution services related to Artisan Funds, including payments to broker-dealers and other intermediaries, are paid out of the investment management fees we earn. We earn investment management fees, which are based on the average daily net assets of each Artisan Fund and are paid monthly, for serving as investment adviser to these funds.
We also serve as investment manager of Artisan Global Funds, a family of Ireland-based UCITS funds. Artisan Global Funds began operations in the first quarter of 2011 and offers shares to non-U.S. investors. Currently we offer a sub-fund of Artisan Global Funds corresponding to each of the Global Opportunities, Global Value, Global Equity, Value Equity and Emerging Markets strategies. As with Artisan Funds, investors in Artisan Global Funds do not pay fees for marketing, advertising and distribution services. Expenses for marketing, advertising and distribution services related to Artisan Global Funds, including payments to broker-dealers and other intermediaries, are paid out of the investment management fees we earn, which are based on the average daily net assets of each sub-fund and are generally paid quarterly.
Regulatory Environment and Compliance
Our business is subject to extensive regulation in the United States at the federal level and, to a lesser extent, the state level, as well as by self-regulatory organizations and outside the United States. Under these laws and regulations, agencies that regulate investment advisers have broad administrative powers, including the power to limit, restrict or prohibit an investment adviser from carrying on its business in the event that it fails to comply with such laws and regulations. Possible sanctions that may be imposed include the suspension of individual employees, limitations on engaging in certain lines of business for specified periods of time, revocation of investment adviser and other registrations, censures and fines.
SEC Regulation
Artisan Partners Limited Partnership and Artisan Partners UK LLP are registered with the SEC as investment advisers under the Advisers Act, and Artisan Funds and several of the investment companies we sub-advise are registered under the 1940 Act. The Advisers Act and the 1940 Act, together with the SEC’s regulations and interpretations thereunder, impose substantive and material restrictions and requirements on the operations of advisers and mutual funds. The Securities Act and the Exchange Act, along with the regulations and interpretations thereunder, impose additional restrictions and requirements on mutual funds. The SEC is authorized to institute proceedings and impose sanctions for violations of those Acts, ranging from fines and censures to termination of an adviser’s registration.
As an investment adviser, we have a fiduciary duty to our clients. The SEC has interpreted that duty to impose standards, requirements and limitations on, among other things: trading for proprietary, personal and client accounts; allocations of investment opportunities among clients; use of soft dollars; execution of transactions; and recommendations to clients. We manage accounts for our clients on a discretionary basis, with authority to buy and sell securities for each portfolio, select broker-dealers to execute trades and negotiate brokerage commission rates. In connection with certain of these transactions, we receive soft dollar credits from broker-dealers that have the effect of reducing certain of our expenses.
9
All of our soft dollar arrangements are intended to be within the safe harbor provided by Section 28(e) of the Exchange Act. If our ability to use soft dollars were reduced or eliminated as a result of the implementation of statutory amendments or new regulations including regulations imposed by non-U.S. regulators, our operating expenses would increase.
As a registered adviser, we are subject to many additional requirements that cover, among other things, disclosure of information about our business to clients; maintenance of written policies and procedures; maintenance of extensive books and records; restrictions on the types of fees we may charge; custody of client assets; client privacy; advertising; and solicitation of clients. The SEC has authority to inspect any investment adviser and typically inspects a registered adviser periodically to determine whether the adviser is conducting its activities (i) in accordance with applicable laws, (ii) in a manner that is consistent with disclosures made to clients and (iii) with adequate systems and procedures to ensure compliance.
For the year ended
December 31, 2015
, 68% of our revenues were derived from our advisory services to investment companies registered under the 1940 Act, including
65%
from our advisory services to Artisan Funds. The 1940 Act imposes significant requirements and limitations on a registered fund, including with respect to its capital structure, investments and transactions. While we exercise broad discretion over the day-to-day management of the business and affairs of Artisan Funds and the investment portfolios of Artisan Funds and the funds we sub-advise, our own operations are subject to oversight and management by each fund’s board of directors. Under the 1940 Act, a majority of the directors must not be “interested persons” with respect to us (sometimes referred to as the “independent director” requirement). The responsibilities of the board include, among other things, approving our investment management agreement with the fund; approving other service providers; determining the method of valuing assets; and monitoring transactions involving affiliates.
Our investment management agreements with these funds may be terminated by the funds on not more than 60 days’ notice, and are subject to annual renewal by each fund’s board after the initial term of one to two years. The 1940 Act also imposes on the investment adviser to a mutual fund a fiduciary duty with respect to the receipt of the adviser’s investment management fees. That fiduciary duty may be enforced by the SEC, by administrative action or by litigation by investors in the fund pursuant to a private right of action. The number of cases brought by investors pursuant to this private right of action has increased in recent years.
As required by the Advisers Act, our investment management agreements may not be assigned without the client’s consent. Under the 1940 Act, investment management agreements with registered funds (such as the mutual funds we manage) terminate automatically upon assignment. The term “assignment” is broadly defined and includes direct assignments as well as assignments that may be deemed to occur upon the transfer, directly or indirectly, of a controlling interest in us.
Artisan Partners Distributors LLC, our SEC-registered broker-dealer subsidiary, is subject to the SEC’s Uniform Net Capital Rule, which requires that at least a minimum part of a registered broker-dealer’s assets be kept in relatively liquid form. At
December 31, 2015
, Artisan Partners Distributors LLC had net capital of $153,664, which was $128,664 in excess of its required net capital of $25,000.
ERISA-Related Regulation
Artisan Partners Limited Partnership is a fiduciary under ERISA with respect to assets that we manage for benefit plan clients subject to ERISA. ERISA, regulations promulgated thereunder and applicable provisions of the Internal Revenue Code impose certain duties on persons who are fiduciaries under ERISA, prohibit certain transactions involving ERISA plan clients and provide monetary penalties for violations of these prohibitions.
Non-U.S. Regulation
In addition to the extensive regulation we are subject to in the United States, one of our subsidiaries, Artisan Partners UK LLP, is authorized and regulated by the U.K. Financial Conduct Authority, which is responsible for the conduct of business and supervision of financial firms in the United Kingdom. The Central Bank of Ireland imposes requirements on UCITS funds subject to regulation by it, including Artisan Global Funds, as do the regulators in certain other markets in which shares of Artisan Global Funds are offered for sale, and with which we are required to comply. We are also subject to regulation internationally by the Australian Securities and Investments Commission, where we operate pursuant to orders of exemption, and by various Canadian regulatory authorities in the Canadian provinces where we operate pursuant to exemptions from registration. Our business is also subject to the rules and regulations of the countries in which we conduct investment management activities, including the countries in which our investment strategies make investments. We may become subject to additional regulatory demands in the future to the extent we expand our business in existing and new jurisdictions. See “Risk Factors—Risks Related to our Industry—We are subject to extensive regulation” and “Risk Factors—Risks Related to our Industry—The regulatory environment in which we operate is subject to continual change, and regulatory developments designed to increase oversight may adversely affect our business.”
Competition
In order to grow our business, we must be able to compete effectively for assets under management. Historically, we have competed to attract assets to our management principally on the basis of:
10
|
•
|
the performance of our investment strategies;
|
|
•
|
continuity of our investment professionals;
|
|
•
|
the quality of the service we provide to our clients; and
|
|
•
|
our brand recognition and reputation within the institutional investing community.
|
Our ability to continue to compete effectively will also depend upon our ability to retain our current investment professionals and employees and to attract highly qualified new investment professionals and employees. We compete in all aspects of our business with a large number of investment management firms, commercial banks, broker-dealers, insurance companies and other financial institutions. For additional information concerning the competitive risks that we face, see “Risks Factors—Risks Related to Our Industry—The investment management industry is intensely competitive.”
Operations, Systems and Technology
With respect to our equity strategies, we perform middle- and back-office functions internally, generally using third-party software and technology for functions such as trade confirmation, trade settlement, custodian reconciliations, corporate action processing, performance calculation and client reporting, customized as necessary to support our investment processes and operations. With respect to our High Income strategy, which is currently our only fixed income strategy, we outsource most of the middle- and back-office functions to service providers that we supervise. Artisan Funds and Artisan Global Funds outsource the functions of custodian, transfer agent and portfolio accounting agent to third parties whose services to Artisan Funds or Artisan Global Funds we supervise. We also have back-up and disaster recovery systems in place.
Employees
As of
December 31, 2015
, we employed approximately 370 full-time and part-time employees. None of our employees is subject to collective bargaining agreements. We consider our relationship with our employees to be good and have not experienced interruptions of operations due to labor disagreements.
Our Structure and Reorganization
Holding Company Structure
We are a holding company and our assets principally consist of our ownership of partnership units of Artisan Partners Holdings, deferred tax assets and cash. As the sole general partner of Artisan Partners Holdings, we operate and control all of its business and affairs, subject to certain voting rights of its limited partners. We conduct all of our business activities through operating subsidiaries of Artisan Partners Holdings. Net profits and net losses are allocated based on the ownership of partnership units of Artisan Partners Holdings. As of
December 31, 2015
, we owned approximately
54%
of Artisan Partners Holdings, and the other
46%
was owned by the limited partners of Artisan Partners Holdings.
The historical consolidated financial statements presented and discussed elsewhere in this document are the combined and consolidated results of Artisan Partners Asset Management and Artisan Partners Holdings. Because Artisan Partners Asset Management and Artisan Partners Holdings were under common control at the time of our IPO reorganization in March 2013, Artisan Partners Asset Management’s acquisition of control of Artisan Partners Holdings was accounted for as a transaction among entities under common control. Artisan Partners Asset Management has been allocated a part of Artisan Partners Holdings’ net income since March 12, 2013, when it became Artisan Partners Holdings’ general partner as part of the IPO reorganization discussed below.
IPO Reorganization
In March 2013, we completed our IPO. In connection with the IPO, we and Artisan Partners Holdings completed a series of reorganization transactions, which we refer to as the IPO Reorganization, in order to reorganize our capital structures in preparation for the IPO. The IPO Reorganization was designed to create a capital structure that preserves our ability to conduct our business through Artisan Partners Holdings, while permitting us to raise additional capital and provide access to liquidity through a public company. Multiple classes of securities at the public company level were necessary to achieve those objectives and maintain a corporate governance structure consistent with that of Artisan Partners Holdings prior to the IPO Reorganization. The IPO Reorganization included, among other changes, the following:
|
•
|
Our appointment as the sole general partner of Artisan Partners Holdings.
|
|
•
|
The modification of our capital structure into three classes of common stock and a series of convertible preferred stock. We issued shares of our Class B common stock, Class C common stock and convertible preferred stock to pre-IPO partners of Artisan Partners Holdings. Each share of Class B common stock corresponds to a Class B common unit of Artisan Partners Holdings. Each share of Class C common stock corresponds to either a Class A, Class D or Class E common unit of Artisan Partners Holdings. Subject to certain restrictions, each common unit of Artisan Partners Holdings (together with the corresponding share of Class B or Class C common stock) is exchangeable for a share of our Class A common stock.
|
11
|
•
|
A corporation (“H&F Corp”) merged with and into Artisan Partners Asset Management, which we refer to in this document as the H&F Corp Merger. As consideration for the merger, the shareholder of H&F Corp received shares of our convertible preferred stock, contingent value rights, or CVRs, issued by Artisan Partners Asset Management and the right to receive an amount of cash. In November 2013, the CVRs issued by Artisan Partners Asset Management were terminated with no amounts paid or payable thereunder. In June 2014, the shareholder of H&F Corp converted all of its then-remaining shares of convertible preferred stock into shares of Class A common stock and sold those shares. We no longer have any outstanding shares of convertible preferred stock, and Artisan Partners Holdings no longer has any outstanding preferred units.
|
|
•
|
The voting and certain other rights of each class of limited partnership units of Artisan Partners Holdings were modified. In addition, Artisan Partners Holdings issued CVRs to the holders of the preferred units. In November 2013, the CVRs issued by Artisan Partners Holdings were terminated with no amounts paid or payable thereunder.
|
|
•
|
We entered into two tax receivable agreements (“TRAs”), one with the pre-H&F Corp Merger shareholder of H&F Corp (“Pre-H&F Merger Shareholder”) and the other with each limited partner of Artisan Partners Holdings. Pursuant to the first TRA, we will pay to the Pre-H&F Merger Shareholder a portion of certain tax benefits we realize as a result of the H&F Corp Merger. Pursuant to the second TRA, we will pay to certain limited partners of Artisan Partners Holdings a portion of certain tax benefits we realize as a result of the purchase or exchange of their limited partnership units of Artisan Partners Holdings.
|
The diagram below depicts our organizational structure as of
December 31, 2015
:
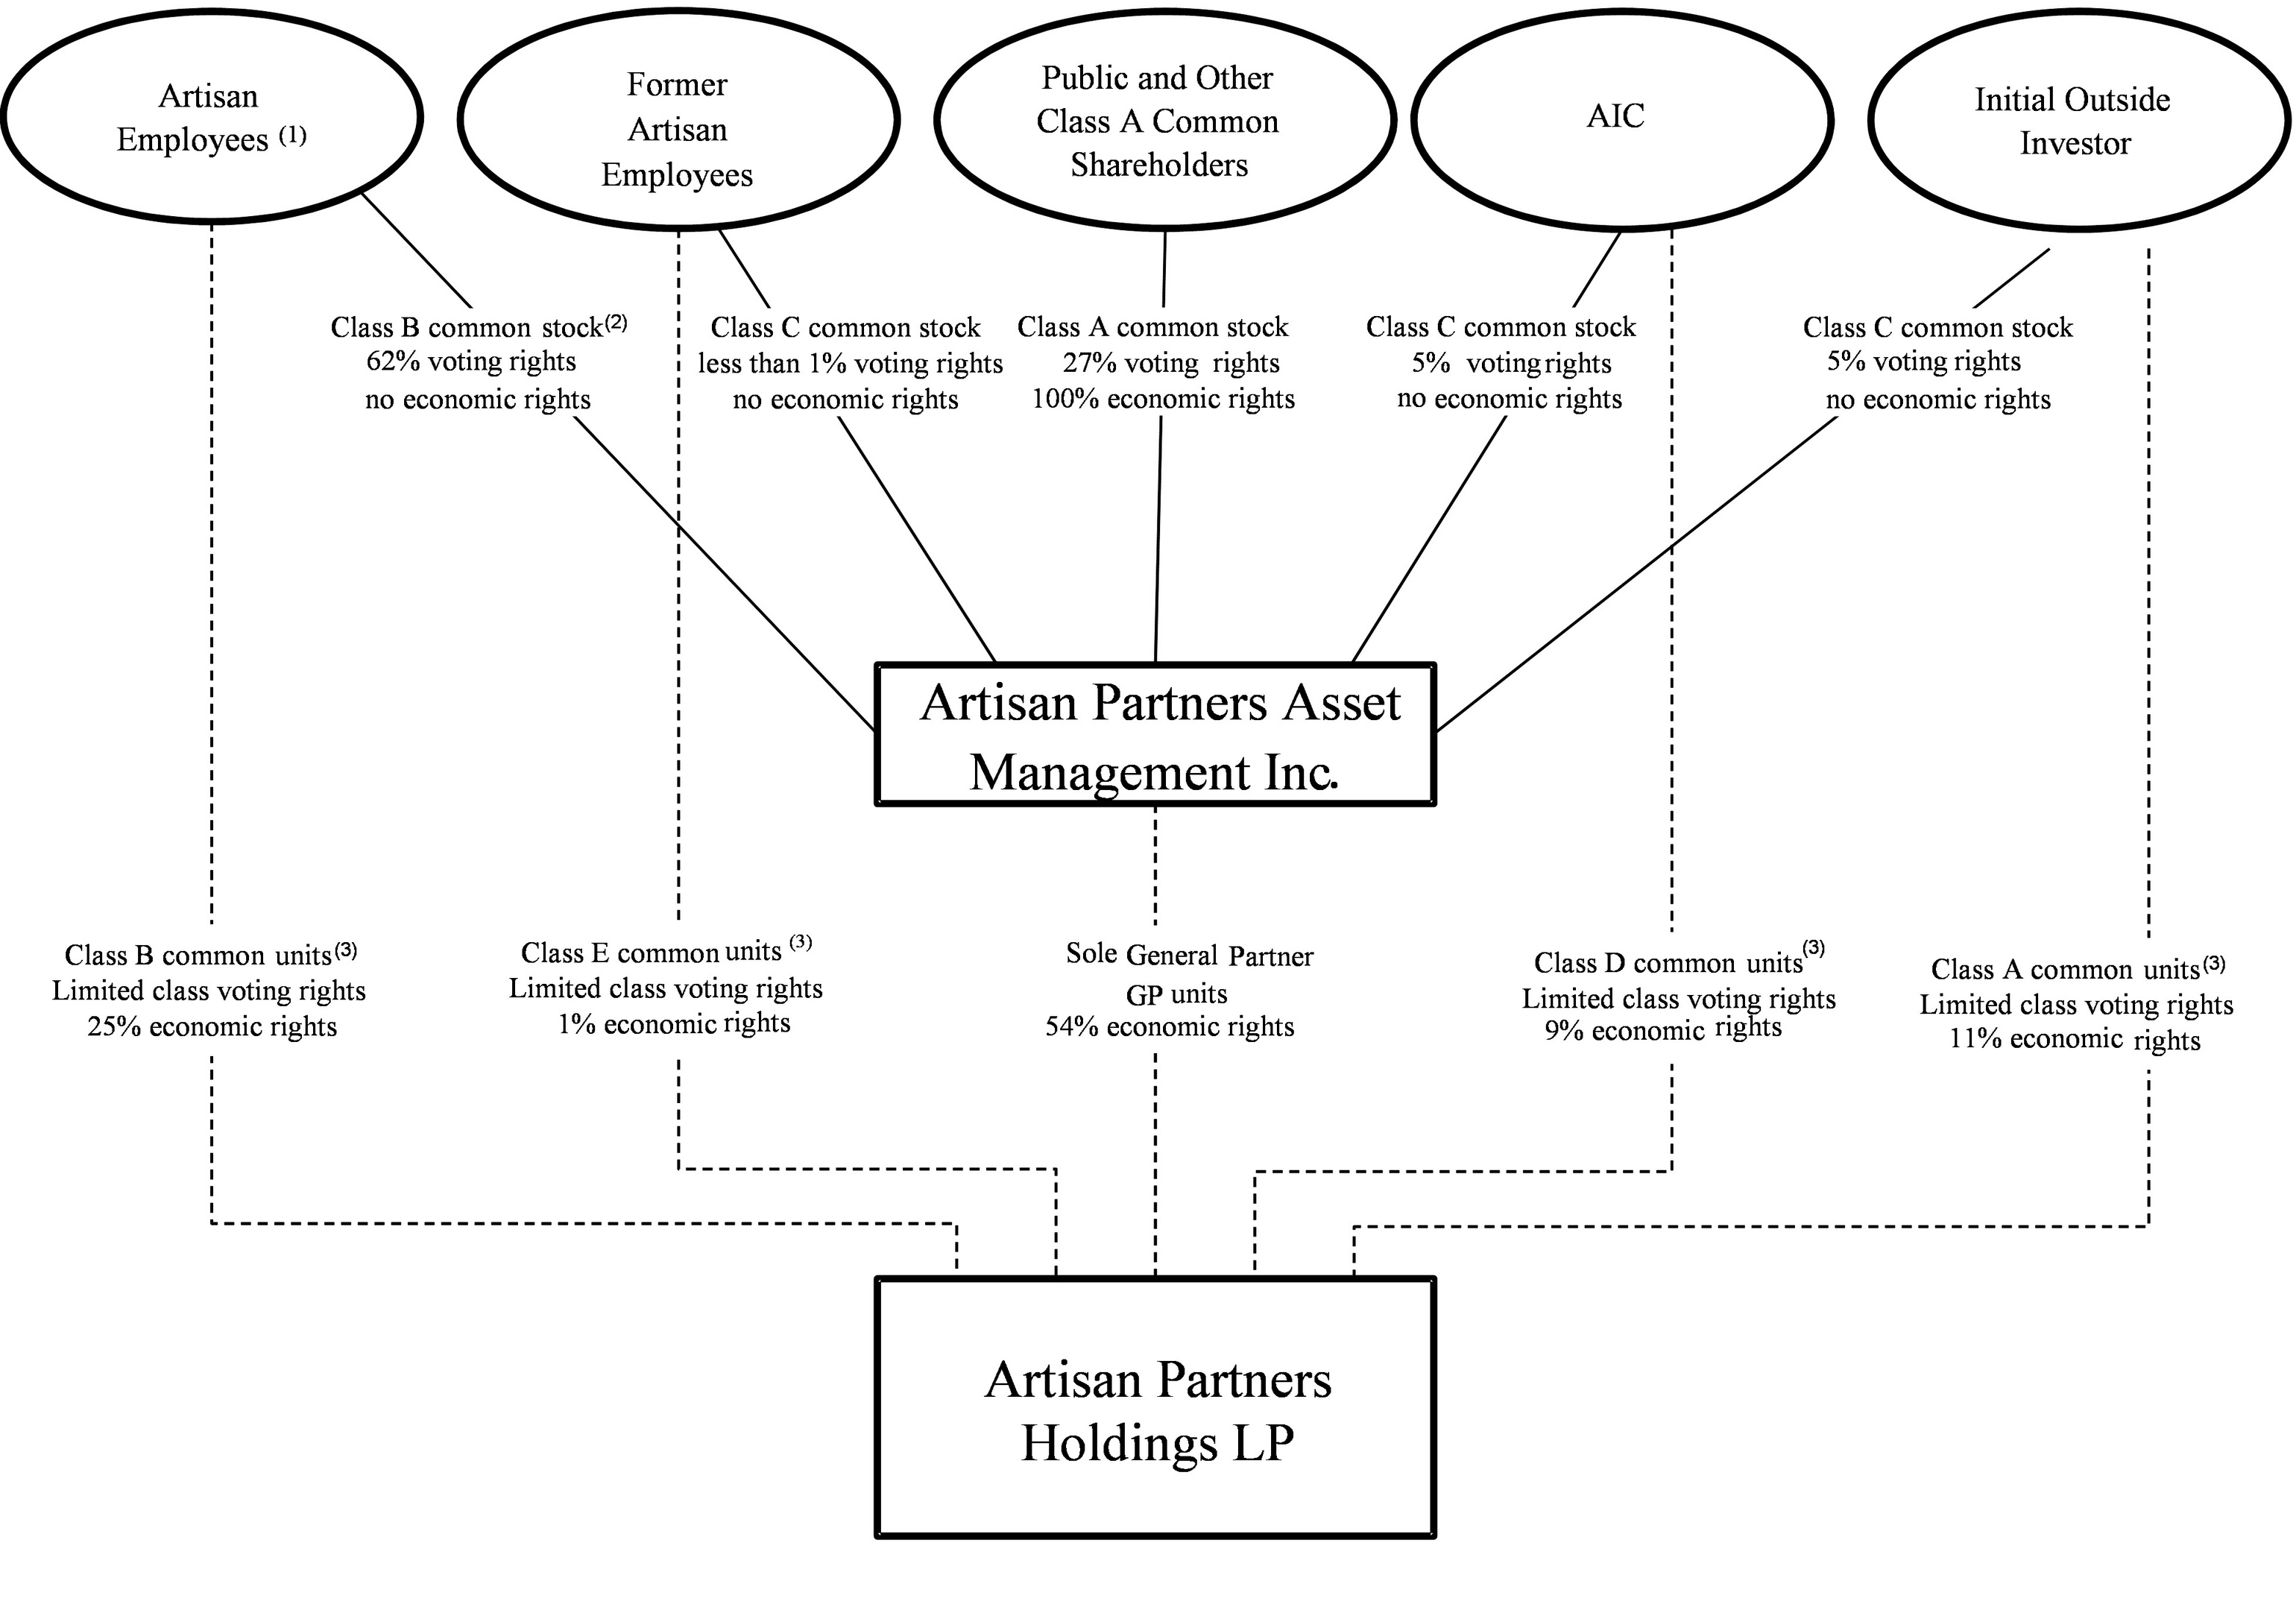
12
|
(1)
|
Our employees to whom we have granted equity have entered into a stockholders agreement with respect to all shares of our common stock they have acquired from us and any shares they may acquire from us in the future, pursuant to which they granted an irrevocable voting proxy to a stockholders committee currently consisting of Eric R. Colson (Chairman and Chief Executive Officer), Charles J. Daley (Chief Financial Officer) and Gregory K. Ramirez (Executive Vice President). The stockholders committee, by vote of a majority of the members, will determine the vote of all of the shares subject to the stockholders agreement. In addition to owning all of the shares of our Class B common stock, our employees owned unvested restricted shares of our Class A common stock representing approximately 7% of our outstanding Class A common stock as of December 31, 2015.
|
|
(2)
|
Each share of Class B common stock initially entitles its holder to five votes per share. The stockholders committee holds an irrevocable proxy to vote the shares of our common stock held by the Class B common stockholders.
|
|
(3)
|
Each class of common units generally entitles its holders to the same economic and voting rights in Artisan Partners Holdings as each other class of common units, except that the Class E common units have no voting rights except as required by law.
|
Available Information
Our principal executive offices are located at 875 E. Wisconsin Avenue, Suite 800, Milwaukee, Wisconsin 53202. Our telephone number at this address is (414) 390-6100 and our website address is www.artisanpartners.com. We make available free of charge through our website all of the materials we file or furnish with the SEC as soon as reasonably practicable after we electronically file or furnish such materials with the SEC. Information contained on our website is not part of, nor is it incorporated by reference into, this Form 10-K. The company was incorporated in Wisconsin on March 21, 2011 and converted to a Delaware corporation on October 29, 2012.
The public may read and copy any of the materials we file with the SEC at the SEC’s Public Reference Room at 100 F Street, NE, Washington, DC 20549. Information on the operation of the Public Reference Room may be obtained by calling the SEC at 1-800-SEC-0330. The SEC also maintains an Internet site that contains reports, proxies and information statements, and other information regarding issuers that file electronically with the SEC at www.sec.gov.
13
An investment in our Class A common stock involves substantial risks and uncertainties. You should carefully consider each of the risks below, together with all of the other information contained in this document, before deciding to invest in shares of our Class A common stock. If any of the following risks develops into an actual event, our business, financial condition or results of operations could be negatively affected, the market price of your shares could decline and you could lose all or part of your investment.
Risks Related to our Business
The loss of key investment professionals or members of our senior management team could have a material adverse effect on our business. In addition, a substantial portion of our total assets under management is in six of our strategies, several of which are closed to most new investors and client relationships.
We depend on the skills and expertise of our portfolio managers and other investment professionals and our success depends on our ability to retain the key members of our investment teams, who possess substantial experience in investing and have been primarily responsible for the historically strong investment performance we have achieved. Mark L. Yockey is the sole portfolio manager for our largest strategy, the Non-U.S. Growth strategy, which represented
$30.2 billion
, or
30%
, of our assets under management as of
December 31, 2015
. Charles-Henri Hamker and Andrew J. Euretig are associate portfolio managers of the Non-U.S. Growth strategy. Our Non-U.S. Value strategy, which represented
$16.3 billion
, or
16%
, of our assets under management as of
December 31, 2015
, is managed by co-managers N. David Samra (lead manager) and Daniel J. O’Keefe. Mr. O’Keefe (lead manager) and Mr. Samra also co-manage our Global Value strategy, which represented
$13.9 billion
, or
14%
, of our assets under management as of
December 31, 2015
. James D. Hamel, Matthew A. Kamm, Craigh A. Cepukenas and Jason White are portfolio co-managers of our U.S. Mid-Cap Growth (of which Mr. Kamm is lead manager) and Global Opportunities (of which Mr. Hamel is lead manager) strategies, which represented
$15.1 billion
, or
15%
, and
$7.6 billion
, or
8%
, respectively, of our assets under management as of
December 31, 2015
.The U.S. Mid-Cap Value strategy, of which James C. Kieffer, Scott C. Satterwhite, George O. Sertl and Daniel L. Kane are co-managers, represented
$8.0 billion
, or
8%
, of our assets under management as of
December 31, 2015
. In September 2013, Mr. Satterwhite provided his three-year advance retirement notice.
Because of the long tenure and stability of our portfolio managers, our clients generally attribute the investment performance we have achieved to these individuals. The departure of a portfolio manager, even for strategies with multiple portfolio managers, could cause clients to withdraw funds from the strategy which would reduce our assets under management, investment management fees and our net income, and these reductions could be material if our assets under management in that strategy and the related revenues were material.
The departure of a portfolio manager also could cause consultants and intermediaries to stop recommending a strategy, and clients to refrain from allocating additional funds to the strategy or delay such additional funds until a sufficient new track record has been established. We also depend on the contributions of our senior management team led by Eric R. Colson, and our senior marketing and client service personnel have direct contact with our institutional clients and consultants and other key individuals within each of our distribution channels.
The loss of any of these key professionals could limit our ability to successfully execute our business strategy and may prevent us from sustaining the historically strong investment performance we have achieved or adversely affect our ability to retain existing and attract new client assets and related revenues.
Any of our investment or management professionals may resign at any time, join our competitors or form a competing company. Although many of our portfolio managers and each of our named executive officers are subject to post-employment non-compete obligations, these non-competition provisions may not be enforceable or may not be enforceable to their full extent. In addition, we may agree to waive non-competition provisions or other restrictive covenants applicable to former investment or management professionals in light of the circumstances surrounding their relationship with us. We do not carry “key man” insurance that would provide us with proceeds in the event of the death or disability of any of the key members of our investment or management teams.
Competition for qualified investment, management and marketing and client service professionals is intense and we may fail to successfully attract and retain qualified personnel in the future. Our ability to attract and retain these personnel will depend heavily on the amount and structure of compensation and opportunities for equity ownership we offer. Any cost-reduction initiative or adjustments or reductions to compensation or changes to our equity ownership culture could negatively impact our ability to retain key personnel. Generally, an employee-partner that exchanged and sold the maximum number of Class B common units that he or she was entitled to sell during each one-year period beginning in March 2014 would hold, at December 31, 2018, approximately 44% of his or her beginning Class B common units. In addition, changes to our management structure, corporate culture and corporate governance arrangements could negatively impact our ability to retain key personnel.
14
If we are unable to maintain our investment culture or compensation levels for investment professionals, we may be unable to attract, develop and retain talented investment professionals, which could negatively impact the performance of our investment strategies, our financial results and our ability to grow.
Attracting, developing and retaining talented investment professionals is an essential component of our business strategy. To do so, it is critical that we continue to foster an environment and provide compensation that is attractive for our existing investment professionals and for prospective investment professionals. If we are unsuccessful in maintaining such an environment (for instance, because of changes in management structure, corporate culture, corporate governance arrangements, or applicable laws and regulations) or compensation levels for any reason, our existing investment professionals may leave our firm or fail to produce their best work on a consistent, long-term basis and/or we may be unsuccessful in attracting talented new investment professionals, any of which could negatively impact the performance of our investment strategies, our financial results and our ability to grow.
If our investment strategies perform poorly, clients could withdraw their funds and we could suffer a decline in our assets under management and/or become subject to litigation, which would reduce our earnings.
The performance of our investment strategies is critical in retaining existing client assets as well as attracting new client assets. If our investment strategies perform poorly for any reason, our earnings could decline because:
|
•
|
Our existing clients may withdraw funds from our investment strategies or terminate their relationships with us.
|
|
•
|
The Morningstar and Lipper ratings and rankings of mutual funds we manage may decline, which may adversely affect the ability of those funds to attract new or retain existing assets.
|
|
•
|
Third-party financial intermediaries, advisors or consultants may rate our investment products poorly, which may lead our existing clients to withdraw funds from our investment strategies or reduce asset inflows from these third parties or their clients.
|
Our investment strategies can perform poorly for a number of reasons, including general market conditions; investor sentiment about market and economic conditions; investment styles and philosophies; investment decisions; the performance of the companies in which our investment strategies invest and the currencies in which those investment are made; the liquidity of securities or instruments in which our investment strategies invest; and our inability to identify sufficient appropriate investment opportunities for existing and new client assets on a timely basis. In addition, while we seek to deliver long-term value to our clients, volatility may lead to under-performance in the near term, which could adversely affect our results of operations.
In contrast, when our strategies experience strong results relative to the market, clients’ allocations to our strategies typically increase relative to their other investments and we sometimes experience withdrawals as our clients rebalance their investments to fit their asset allocation preferences despite our strong results.
While clients do not have legal recourse against us solely on the basis of poor investment results, if our investment strategies perform poorly, we are more likely to become subject to litigation brought by dissatisfied clients. In addition, to the extent clients are successful in claiming that their losses resulted from fraud, negligence, willful misconduct, breach of contract or other similar misconduct, these clients may have remedies against us, the mutual funds and other funds we advise and/or our investment professionals under various U.S. and non-U.S. laws.
The historical returns of our existing investment strategies may not be indicative of their future results or of the investment strategies we may develop in the future.
The historical returns of our strategies and the ratings and rankings we or the mutual funds that we advise have received in the past should not be considered indicative of the future results of these strategies or of any other strategies that we may develop in the future. The investment performance we achieve for our clients varies over time and the variance can be wide. The ratings and rankings we or the mutual funds we advise have received are typically revised monthly. Our strategies’ returns have benefited during some periods from investment opportunities and positive economic and market conditions. In other periods, general economic and market conditions have negatively affected investment opportunities and our strategies’ returns. These negative conditions may occur again, and in the future we may not be able to identify and invest in profitable investment opportunities within our current or future strategies.
Difficult market conditions can adversely affect our business in many ways, including by reducing the value of our assets under management and causing clients to withdraw funds, each of which could materially reduce our revenues and adversely affect our financial condition.
The fees we earn under our investment management agreements are typically based on the market value of our assets under management, and to a much lesser extent based directly on investment performance. Investors in the mutual funds we advise can redeem their investments in those funds at any time without prior notice and our clients may reduce the aggregate amount of assets under management with us with minimal or no notice for any reason, including financial market conditions and the absolute or relative investment performance we achieve for our clients. In addition, the prices of the securities held in the portfolios we manage may decline due to any number of factors beyond our control, including, among others, a declining market, general economic downturn, political uncertainty or acts of terrorism. In connection with the severe market dislocations of 2008
15
and 2009, for example, the value of our assets under management declined substantially due primarily to the sizeable decline in stock prices worldwide. In the period from June 30, 2008 through March 31, 2009, our assets under management decreased by approximately 43%, primarily as a result of general market conditions. The growth of our assets under management since 2009 benefited from the prolonged bull market in equity securities around the world. That prolonged bull market may increase the likelihood of a severe or prolonged downturn in world-wide equity prices which would directly reduce the value of our assets under management and could also accelerate client redemptions or withdrawals.
If any of these factors cause a decline in our assets under management, it would result in lower investment management fees. If our revenues decline without a commensurate reduction in our expenses, our net income will be reduced.
The significant growth we have experienced over the past decade has been and may continue to be difficult to sustain.
Our assets under management increased from $44.8 billion as of December 31, 2005 to
$99.8 billion
as of
December 31, 2015
. The absolute measure of our assets under management represents a significant rate of growth that has been and may continue to be difficult to sustain. For instance, between June 30, 2014, and December 31, 2015, our assets under management declined from $112.0 billion to
$99.8 billion
. The continued long-term growth of our business will depend on, among other things, retaining key investment professionals, attracting and recruiting new investment professionals, maintaining existing investment strategies and selectively developing new, value-added investment strategies. Our business growth will also depend on our success in achieving superior investment performance from our investment strategies, as well as our ability to maintain and extend our distribution capabilities, to deal with changing market conditions, to maintain adequate financial and business controls and to comply with new legal and regulatory requirements arising in response to both the increased sophistication of the investment management industry and the significant market and economic events of the last decade.
We may not be able to manage our growing business effectively or be able to sustain the level of long-term growth we have achieved historically.
Our efforts to establish and develop new teams and strategies may be unsuccessful and will likely negatively impact our results of operations and could negatively impact our reputation and culture.
We seek to add new investment teams that invest in a way that is consistent with our philosophy of offering high value-added investment strategies and would allow us to grow strategically. We also look to offer new strategies managed by our existing teams. We expect the costs associated with establishing a new team and or strategy initially to exceed the revenues generated, which will likely negatively impact our results of operations. New strategies, whether managed by a new team or by an existing team may invest in instruments (such as certain types of derivatives) or present operational (including legal and regulatory) issues and risks with which we have little or no experience. Our lack of experience could strain our resources and increase the likelihood of an error or failure. The establishment of new teams and/or strategies (in particular, alternative investment teams or strategies) may also cause us to depart from our traditional compensation and economic model, which could reduce our profitability and harm our firm’s culture.
In addition, the historical returns of our existing investment strategies may not be indicative of the investment performance of any new strategy, and the poor performance of any new strategy could negatively impact our reputation and the reputation of our other investment strategies.
We may support the development of new strategies by making one or more seed investments using capital that would otherwise be available for our general corporate purposes. Making such a seed investment would expose us to capital losses.
Failure to properly address conflicts of interest could harm our reputation or cause clients to withdraw funds, each of which could adversely affect our business and results of operations.
The SEC and other regulators have increased their scrutiny of potential conflicts of interest, and we have implemented procedures and controls that we believe are reasonably designed to address these issues. However, appropriately dealing with conflicts of interest is complex and if we fail, or appear to fail, to deal appropriately with conflicts of interest, we could face reputational damage, litigation or regulatory proceedings or penalties, any of which may adversely affect our results of operations.
In addition, as we expand the scope of our business and our client base, we must continue to monitor and address any conflicts between the interests of our stockholders and those of our clients. Our clients may withdraw funds if they perceive conflicts of interest between the investment decisions we make for strategies in which they have invested and our obligations to our stockholders. For example, we may limit the growth of assets in or close strategies or otherwise take action to slow the flow of assets when we believe it is in the best interest of our clients even though our aggregate assets under management and investment management fees may be negatively impacted in the short term. Similarly, we may establish or add new investment teams or strategies or expand operations into other geographic areas or jurisdictions if we believe such actions are in the best interest of our clients, even though our profitability may be adversely affected in the short term. Although we believe such actions enable us to retain client assets and maintain our fee schedules and profit margins, which benefits both our clients and stockholders, if clients perceive a change in our investment or operations decisions in favor of a strategy to maximize short term results, they may withdraw funds, which could adversely affect our investment management fees.
16
Several of our investment strategies invest principally in the securities of non-U.S. companies, which involve foreign currency exchange, tax, political, social and economic uncertainties and risks.
As of
December 31, 2015
, approximately 47% of our assets under management across our investment strategies were invested in strategies that primarily invest in securities of non-U.S. companies. In addition, some of our other strategies also invest on a more limited basis in securities of non-U.S. companies. Approximately 43% of our assets under management were invested in securities denominated in currencies other than the U.S. dollar. Fluctuations in foreign currency exchange rates could negatively affect the returns of our clients who are invested in these strategies. In addition, an increase in the value of the U.S. dollar relative to non-U.S. currencies is likely to result in a decrease in the U.S. dollar value of our assets under management, which, in turn, would likely result in lower revenue and profits. See “Qualitative and Quantitative Disclosures Regarding Market Risk-Exchange Rate Risk” in Item 7A of this report for more information about exchange rate risk.
Investments in non-U.S. issuers may also be affected by tax positions taken in countries or regions in which we are invested as well as political, social and economic uncertainty. Declining tax revenues may cause governments to assert their ability to tax the local gains and/or income of foreign investors (including our clients), which could adversely affect clients’ interests in investing outside their home markets. Many financial markets are not as developed, or as efficient, as the U.S. financial markets, and, as a result, those markets may have limited liquidity and higher price volatility, and may lack established regulations. Liquidity may also be adversely affected by political or economic events, government policies, and social or civil unrest within a particular country, and our ability to dispose of an investment may also be adversely affected if we increase the size of our investments in smaller non-U.S. issuers. Non-U.S. legal and regulatory environments, including financial accounting standards and practices, may also be different, and there may be less publicly available information about such companies. These risks could adversely affect the performance of our strategies that are invested in securities of non-U.S. issuers and may be particularly acute in the emerging or less developed markets in which we invest. In addition to our Emerging Markets and Developing World strategies, a number of our other investment strategies are permitted to invest, and do invest, in emerging or less developed markets.
We may not be able to maintain our current fee structure as a result of poor investment performance, competitive pressures, as a result of changes in our business mix or for other reasons, which could have a material adverse effect on our profit margins and results of operations.
We may not be able to maintain our current fee structure for any number of reasons, including as a result of poor investment performance, competitive pressures, changes in global markets and asset classes, or as a result of changes in our business mix. Although our investment management fees vary by client and investment strategy, we historically have been successful in maintaining an attractive overall rate of fee and profit margin due to the strength of our investment performance and our focus on high value-added investment strategies. In recent years, however, there has been a general trend toward lower fees in the investment management industry, and some of our investment strategies that tend to invest in larger-capitalization companies and were designed to have larger capacity and to appeal to larger clients, have lower fee schedules. In order to maintain our fee structure in a competitive environment, we must retain the ability to decline additional assets to manage from potential clients who demand lower fees even though our revenues may be adversely affected in the short term. In addition, we must be able to continue to provide clients with investment returns and service that our clients believe justify our fees.
If our investment strategies perform poorly, we may be forced to lower our fees in order to retain current, and attract additional, assets to manage. We may not succeed in providing the investment returns and service that will allow us to maintain our current fee structure. We may also make fee concessions in order to attract early investors in a strategy or increase marketing momentum in a strategy. Downward pressure on fees may also result from the growth and evolution of the universe of potential investments in a market or asset class. For example, prevailing fee rates for managing portfolios of emerging markets securities have declined as those markets and the universe of potential investments in emerging markets companies have grown. In the first quarter of 2013, we reduced the rates of our standard fee schedule for managing assets in our Emerging Markets strategy. Changes in how clients choose to access asset management services may also exert downward pressure on fees. Some investment consultants, for example, have implemented programs in which the consultant provides a range of services, including selection, in a fiduciary capacity, of asset managers to serve as sub-adviser at lower fee rates than the manager’s otherwise applicable rates, with the expectation of a larger amount of assets under management through that consultant. The expansion of those and similar programs could, over time, make it more difficult for us to maintain our fee rates. Over time, a larger part of our assets under management could be invested in our larger capacity, lower fee strategies, which could adversely affect our profitability. In addition, plan sponsors of 401(k) and other defined contribution assets that we manage may choose to invest plan assets in vehicles with lower cost structures than mutual funds (such as a collective investment trust, if one is available) or may choose to access our services through a separate account. We provide a lesser array of services to collective investment trusts and separate accounts than we provide to Artisan Funds and we receive fees at lower rates.
The investment management agreements pursuant to which we advise mutual funds are terminable on short notice and, after an initial term, are subject to an annual process of review and renewal by the funds’ boards. As part of that annual review process, the fund board considers, among other things, the level of compensation that the fund has been paying us for our services, and that process may result in the renegotiation of our fee structure or increase the cost of our performance of our obligations. Any fee reductions on existing or future new business could have an adverse effect on our profit margins and results of operations.
17
We derive substantially all of our revenues from contracts and relationships that may be terminated upon short or no notice.
We derive substantially all of our revenues from investment advisory and sub-advisory agreements, all of which are terminable by clients upon short notice or no notice. Our investment management agreements with mutual funds, as required by law, are generally terminable by the funds’ boards or a vote of a majority of the funds’ outstanding voting securities on not more than 60 days’ written notice. After an initial term, each fund’s investment management agreement must be approved and renewed annually by that fund’s board, including by its independent members. In addition, all of our separate account clients and some of the mutual funds that we sub-advise have the ability to re-allocate all or any portion of the assets that we manage away from us at any time with little or no notice. These investment management agreements and client relationships may be terminated or not renewed for any number of reasons. The decrease in revenues that could result from the termination of a material client relationship or group of client relationships could have a material adverse effect on our business.
Investors in the pooled vehicles that we advise can redeem their investments in those funds at any time without prior notice, which could adversely affect our earnings.
Investors in the mutual funds and some other pooled investment vehicles that we advise or sub-advise may redeem their investments in those funds at any time without prior notice and investors in other types of pooled vehicles we sub-advise may typically redeem their investments on fairly limited or no prior notice, thereby reducing our assets under management. These investors may redeem for any number of reasons, including general financial market conditions, the absolute or relative investment performance we have achieved, or their own financial condition and requirements. In a declining stock market, the pace of redemptions could accelerate. Poor investment performance relative to other funds tends to result in decreased purchases and increased redemptions of fund shares. For the year ended
December 31, 2015
, we generated approximately 80% of our revenues from advising mutual funds and other pooled vehicles (including Artisan Funds, Artisan Global Funds, and other entities for which we are adviser or sub-adviser), and the redemption of investments in those funds would adversely affect our revenues and could have a material adverse effect on our earnings.
We depend on third parties to market our investment strategies.
Our ability to attract additional assets to manage is highly dependent on our access to third-party intermediaries. We gain access to investors in Artisan Funds primarily through consultants, 401(k) platforms, mutual fund platforms, broker-dealers and financial advisors through which shares of the funds are sold. We have relationships with some third-party intermediaries through which we access clients in multiple distribution channels. Our two largest intermediary relationships across multiple distribution channels represented approximately 11% and 9% of our total assets under management as of
December 31, 2015
.
We compensate most of the intermediaries through which we gain access to investors in Artisan Funds by paying fees, most of which are a percentage of assets invested in Artisan Funds through that intermediary and with respect to which that intermediary provides shareholder and administrative services. The allocation of such fees between us and Artisan Funds is determined by the board of Artisan Funds, based on information and a recommendation from us, with the goal of allocating to us all costs attributable to marketing and distribution of shares of Artisan Funds. In the third quarter of 2014, the portion of those fees allocated to us was increased, which increased our expenses.
In the future, our expenses in connection with those intermediary relationships could further increase if the portion of those fees determined to be in connection with marketing and distribution, or otherwise allocated to us, increased. Clients of these intermediaries may not continue to be accessible to us on terms we consider commercially reasonable, or at all. The absence of such access could have a material adverse effect on our results of operations.
We access institutional clients primarily through consultants. Our institutional business is highly dependent upon referrals from consultants. Many of these consultants review and evaluate our products and our firm from time to time. As of
December 31, 2015
, the investment consultant advising the largest portion of our assets under management represented approximately 7% of our total assets under management. Poor reviews or evaluations of either a particular strategy or us as an investment management firm may result in client withdrawals or may impair our ability to attract new assets through these intermediaries.
Substantially all of our existing assets under management are managed in long-only, equity investment strategies, which exposes us to greater risk than certain of our competitors who may manage significant amounts of assets in non-long only or non-equity strategies.
Fourteen of our 15 existing investment strategies invest primarily in long positions in publicly-traded equity securities. Our High Income strategy, which accounted for only
$1.0 billion
of our
$99.8 billion
in total assets under management as of
December 31, 2015
, invests in fixed income securities. Under market conditions in which there is a general decline in the value of equity securities, the assets under management in each of our 14 equity strategies is likely to decline. Unlike some of our competitors, we do not currently offer strategies that invest in privately-held companies or take short positions in equity securities, which could offset some of the poor performance of our long-only, equity strategies under such market conditions. Even if our investment performance remains strong during such market conditions relative to other long-only, equity strategies, investors may choose to withdraw assets from our management or allocate a larger portion of their assets to non-long-only or non-equity strategies. In addition, the prices of equity securities may fluctuate more widely than the prices of other types of securities, making the level of our assets under management and related revenues more volatile.
18
Our failure to comply with investment guidelines set by our clients, including the boards of funds, and limitations imposed by applicable law, could result in damage awards against us and a loss of our assets under management, either of which could adversely affect our results of operations or financial condition.
When clients retain us to manage assets on their behalf, they generally specify certain guidelines regarding investment allocation and strategy that we are required to follow in managing their portfolios. The boards of funds we manage generally establish similar guidelines regarding the investment of assets in those funds. In general, we have experienced an increase in client-imposed guidelines. We are also required to invest the U.S. mutual funds’ assets in accordance with limitations under the 1940 Act and applicable provisions of the Internal Revenue Code of 1986, as amended, or the Internal Revenue Code. Other clients, such as plans subject to the Employee Retirement Income Security Act of 1974, as amended, or ERISA, or non-U.S. clients, require us to invest their assets in accordance with applicable law. Our failure to comply with any of these guidelines and other limitations could result in losses to clients or investors in a fund which, depending on the circumstances, could result in our obligation to reimburse clients or fund investors for such losses. If we believed that the circumstances did not justify a reimbursement, or clients and investors believed the reimbursement we offered was insufficient, they could seek to recover damages from us or could withdraw assets from our management or terminate their investment management agreement with us. Any of these events could harm our reputation and adversely affect our business.
Operational risks may disrupt our business, result in losses or limit our growth.
We are heavily dependent on the capacity and reliability of the communications, information and technology systems supporting our operations, whether developed, owned and operated by us or by third parties. We also rely on manual workflows and a variety of manual user controls. Operational risks such as trading or other operational errors or interruption of our financial, accounting, trading, compliance and other data processing systems, whether caused by human error, fire, other natural disaster or pandemic, power or telecommunications failure, cyber-attack or viruses, act of terrorism or war or otherwise, could result in a disruption of our business, liability to clients, regulatory intervention or reputational damage, and thus materially adversely affect our business. The potential for some types of operational risks, including, for example, trading errors, may be increased in periods of increased volatility, which can magnify the cost of an error. Although we have not suffered material operational errors, including material trading errors, in the past, we may experience such errors in the future, which could be material and the losses related to which we would be required to absorb. Insurance and other safeguards might not be available or might only partially reimburse us for our losses.
Although we have back-up systems in place, our back-up procedures and capabilities in the event of a failure or interruption may not be adequate, and the fact that we operate our business out of multiple physical locations may make such failures and interruptions difficult to address on a timely and adequate basis. As our client base, number and complexity of investment strategies, client relationships and/or physical locations increase, and as our employees become increasingly mobile, developing and maintaining our operational systems and infrastructure may become increasingly challenging.
Any changes, upgrades or expansions to our operations and/or technology or implementation of new technology systems to replace manual workflows or to accommodate increased volumes or complexity of transactions or otherwise may require significant expenditures and may increase the probability that we will experience operational errors or suffer system degradations and failures. If we are unsuccessful in executing upgrades, expansions or implementations, we may instead have to hire additional employees, which could increase operational risk due to human error.
We depend substantially on our Milwaukee, Wisconsin office, where a majority of our employees, administration and technology resources are located, for the continued operation of our business. Any significant disruption to that office could have a material adverse effect on us. We also depend on a number of key vendors for various fund administration, accounting, custody and transfer agent roles and other operational needs. The failure of any key vendor to fulfill its obligations could result in financial losses for us and/or our clients.
Our operational systems and networks are subject to evolving cybersecurity or other technological risks, which could result in the disclosure of confidential client information, loss of our proprietary information, business interruptions, damage to our reputation, additional costs to us, regulatory penalties and other adverse impacts.
We are heavily reliant upon internal and third party technology systems and networks to view, process, transmit and store information, including sensitive client and proprietary information, and to conduct many of our business activities and transactions with our clients, vendors/service providers (collectively, “vendors”) and other third parties. Maintaining the integrity of these systems and networks is critical to the success of our business operations and to the protection of our proprietary information and our clients’ information. We rely on our (and our vendors’) information and cybersecurity infrastructure, policies, procedures and capabilities to protect those systems and the data that reside on or are transmitted through them.
To date, we have not experienced any material breaches of or interference with our systems and networks; however, we routinely encounter and address such threats. Our experiences with and preparation for cybersecurity and technology threats have included phishing scams, introductions of malware, attempts at electronic break-ins, and unauthorized payment requests. Any such breaches or interference that may occur in the future could have a material adverse impact on our business, financial condition or results of operations.
19
We are subject to international, federal and state regulations, and in some cases contractual obligations, that require us to establish and maintain policies and procedures designed to protect sensitive client, employee, contractor and vendor information. The increasing reliance on technology systems and networks and the occurrence and potential adverse impact of attacks on such systems and networks, both generally and in the financial services industry, have enhanced government and regulatory scrutiny of the measures taken by companies to protect against cybersecurity threats. As these threats, and government and regulatory oversight of associated risks, continue to evolve, we may be required to expend additional resources to enhance or expand upon the security measures we currently maintain.
Despite the measures we have taken and may in the future take to address and mitigate cybersecurity and technology risks, we cannot guarantee that our systems and networks will not be subject to breaches or interference. In particular, although we take precautions to password protect and encrypt our mobile electronic devices, if such devices are stolen or misplaced, they may become vulnerable to hacking or other unauthorized use, creating a possible security risk. Any such event may result in operational disruptions as well as unauthorized access to or the disclosure, corruption or loss of our proprietary information or our clients’ or employees’ information, which in turn may result in legal claims, regulatory scrutiny and liability, reputational damage, the incurrence of costs to eliminate or mitigate further exposure, or the loss of clients or other damage to our business. In addition, the trend toward broad consumer and general public notification of such incidents could exacerbate the harm to our business, financial condition or results of operations. Even if we successfully protect our technology infrastructure and the confidentiality of sensitive data, we may incur significant expenses in connection with our responses to any such attacks and the adoption and maintenance of additional appropriate security measures. We cannot be certain that advances in criminal capabilities, discovery of new vulnerabilities, attempts to exploit vulnerabilities in our or our vendors’ systems, data thefts, physical system or network break-ins or inappropriate access, or other developments will not compromise or breach the technology or other security measures protecting the networks and systems used in connection with our business.
The High Income strategy, which we launched in 2014, presents certain investment, operational and other risks that are different in kind and/or degree from those presented by our other investment strategies, and we have less experience with those risks.
In order to establish our first fixed income strategy, the High Income strategy, which we launched in 2014, we developed, and contracted with third parties for, the operational infrastructure and systems necessary to operate a fixed income strategy, including infrastructure and systems for trading and valuing fixed income securities and other credit instruments. Prior to the launch of the strategy, we had not previously operated a fixed income strategy, and the new strategy primarily invests in securities and other instruments (such as high yield corporate bonds, secured and unsecured loans, revolving credit facilities and loan participations) with which we had no or limited operational experience. The below-investment-grade instruments in which the High Income strategy invests and the debtors to which the strategy is exposed present different risks and/or degrees of risk (including liquidity and legal risks) than our other strategies, which invest primarily in publicly-traded equity securities. In particular, the instruments in which the strategy invests may be less liquid than higher-rated bonds and are not as liquid as most of the publicly-traded equity securities in which our other strategies primarily invest. This potential lack of liquidity may make it more difficult for Artisan High Income Fund to accurately value these securities for purposes of determining the fund’s net asset value per share and, under certain circumstances, may make it more difficult for the fund to manage redemption requests. In order to identify, monitor and mitigate our exposure to these new or increased risks, we have implemented or modified a number of policies, procedures and systems and hired new individuals with relevant experience. However, neither the measures we have taken, nor the Credit team’s investment decision-making and execution, can eliminate the risks associated with investing in the instruments described above. Any real or perceived problems with respect to our High Income strategy (or any of our individual strategies) could negatively impact our reputation and business more generally.
In addition, the High Income strategy and other future strategies may invest in additional instruments (such as credit default swaps and other types of derivative instruments) or present other operational (including legal and regulatory) issues and risks with which we have little or no experience.
Employee misconduct, or perceived misconduct, could expose us to significant legal liability and/or reputational harm.
We are vulnerable to reputational harm because we operate in an industry in which integrity and the confidence of our clients are of critical importance. Our employees could engage in misconduct (such as fraud or unauthorized trading), or perceived misconduct, that adversely affects our business. For example, if an employee were to engage in illegal or suspicious activities, we could be subject to regulatory sanctions and suffer serious harm to our reputation (as a consequence of the negative perception resulting from such activities), financial position, client relationships and ability to attract new clients. Our business often requires that we deal with confidential information. If our employees were to improperly use or disclose this information, even if inadvertently we could suffer serious harm to our reputation, financial position and current and future business relationships. It is not always possible to deter employee misconduct, and the precautions we take to detect and prevent this activity may not always be effective. Misconduct or perceived misconduct by our employees, or even unsubstantiated allegations of such conduct, could result in significant legal liability and/or an adverse effect on our reputation and our business.
20
If our techniques for managing risk are ineffective, we may be exposed to material unanticipated losses.
In order to manage the significant risks inherent in our business, we must maintain effective policies, procedures and systems that enable us to identify, monitor and mitigate our exposure to operational, legal and reputational risks. Our risk management methods may prove to be ineffective due to their design or implementation, or as a result of the lack of adequate, accurate or timely information or otherwise. If our risk management efforts are ineffective, we could suffer losses that could have a material adverse effect on our financial condition or operating results. Additionally, we could be subject to litigation, particularly from our clients or investors, and sanctions or fines from regulators.
Our techniques for managing operational, legal and reputational risks in client portfolios may not fully mitigate the risk exposure in all economic or market environments, including exposure to risks that we might fail to identify or anticipate. Because our clients invest in our strategies in order to gain exposure to the portfolio securities of the respective strategies, we have not adopted corporate-level risk management policies to manage market, interest rate, or exchange rate risks that would affect the value of our overall assets under management.
Our indebtedness may expose us to material risks.
In August 2012, we entered into a $100 million five-year revolving credit agreement and issued $200 million in unsecured notes consisting of $60 million Series A notes maturing in 2017, $50 million Series B notes maturing in 2019, and $90 million Series C notes maturing in 2022. As of December 31, 2015, no amounts were outstanding on the revolving credit facility. Nevertheless, we continue to have substantial indebtedness outstanding in the amount of $200 million in unsecured notes, which exposes us to risks associated with the use of leverage. Our substantial indebtedness may make it more difficult for us to withstand or respond to adverse or changing business, regulatory and economic conditions or to take advantage of new business opportunities or make necessary capital expenditures. In addition, our notes and revolving credit agreement contain financial and operating covenants that may limit our ability to conduct our business. To the extent we service our debt from our cash flow, such cash will not be available for our operations or other purposes. Because our debt service obligations are fixed, the portion of our cash flow used to service those obligations could be substantial if our revenues have declined, whether because of market declines or for other reasons. The Series A, Series B and Series C notes bear interest at a rate equal to 4.98%, 5.32% and 5.82% per annum, respectively, and each rate is subject to a 100 basis point increase in the event Artisan Partners Holdings receives a below-investment grade rating. Each series requires a balloon payment at maturity. Any substantial decrease in net operating cash flows or any substantial increase in expenses could make it difficult for us to meet our debt service requirements or force us to modify our operations. Our ability to repay the principal amount of our notes or any outstanding loans under our revolving credit agreement, to refinance our debt or to obtain additional financing through debt or the sale of additional equity securities will depend on our performance, as well as financial, business and other general economic factors affecting the credit and equity markets generally or our business in particular, many of which are beyond our control. Any such alternatives may not be available to us on satisfactory terms or at all.
Our note purchase agreement and revolving credit agreement contain, and our future indebtedness may contain, various covenants that may limit our business activities.
Our note purchase agreement and revolving credit agreement contain financial and operating covenants that limit our business activities, including restrictions on our ability to incur additional indebtedness and pay dividends to our stockholders. For example, the agreements include financial covenants requiring Artisan Partners Holdings not to exceed specified ratios of indebtedness to consolidated earnings before interest, taxes, depreciation and amortization (as defined in the agreements), or EBITDA, and interest expense to consolidated EBITDA. The agreements also restrict Artisan Partners Holdings from making distributions to its partners (including us), other than tax distributions or distributions to fund our ordinary expenses, if a default (as defined in the respective agreements) has occurred and is continuing or would result from such a distribution. The failure to comply with any of these restrictions could result in an event of default, giving our lenders the ability to accelerate repayment of our obligations. As of
December 31, 2015
, we believe we are in compliance with all of the covenants and other requirements set forth in the agreements.
We provide a broad range of services to Artisan Funds, Artisan Global Funds and sub-advised mutual funds which may expose us to liability.
We provide a broad range of administrative services to Artisan Funds, including providing personnel to Artisan Funds to serve as a director and as officers of Artisan Funds and to serve on the valuation committee of Artisan Funds, the preparation or supervision of the preparation of Artisan Funds’ regulatory filings, maintenance of board calendars and preparation or supervision of the preparation of board meeting materials, management of compliance and regulatory matters, provision of shareholder services and communications, accounting services including the supervision of the activities of Artisan Funds’ accounting services provider in the calculation of the funds’ net asset values, supervision of the preparation of Artisan Funds’ financial statements and coordination of the audits of those financial statements, tax services including calculation of dividend and distribution amounts and supervision of tax return preparation, and supervision of the work of Artisan Funds’ other service providers. Although less extensive than the range of services we provide to Artisan Funds, we also provide a range of similar services, in addition to investment management services, to Artisan Global Funds, including personnel to serve as directors.
21
In addition, we from time to time provide information to the funds for which we act as sub-adviser (or to a person or entity providing administrative services to such a fund) which is used by those funds in their efforts to comply with various regulatory requirements. If we make a mistake in the provision of those services, Artisan Funds, Artisan Global Funds or the sub-advised fund could incur costs for which we might be liable. In addition, if it were determined that Artisan Funds, Artisan Global Funds or the sub-advised fund failed to comply with applicable regulatory requirements as a result of action or failure to act by our employees, we could be responsible for losses suffered or penalties imposed. In addition, we could have penalties imposed on us, be required to pay fines or be subject to private litigation, any of which could decrease our future income or negatively affect our current business or our future growth prospects.
The expansion of our business outside of the United States raises tax and regulatory risks, may adversely affect our profit margins and places additional demands on our resources and employees.
We have expanded and continue to expand our distribution efforts into non-U.S. markets, including the United Kingdom, other European countries, Canada, Australia and certain Asian countries, among others. Our client relationships outside the United States have grown from approximately 30 as of December 31, 2012 to approximately 90 as of
December 31, 2015
. Clients outside the United States may be adversely affected by political, social and economic uncertainty in their respective home countries and regions, which could result in a decrease in the net client cash flows that come from such clients. These clients also may be less accepting of the U.S. practice of payment for certain research products and services through soft dollars or such practices may not be permissible in some jurisdictions, which could have the effect of increasing our expenses.
This expansion has required and will continue to require us to incur a number of up-front expenses, including those associated with obtaining and maintaining regulatory approvals and office space, as well as additional ongoing expenses, including those associated with leases, the employment of additional support staff and regulatory compliance. In addition, we organized and serve as investment manager of, Artisan Global Funds, a family of Ireland-based UCITS funds, that began operations during the first quarter of 2011. Our U.S.-based employees routinely travel outside the United States as a part of our investment research process or to market our services and may spend extended periods of time in one or more non-U.S. jurisdictions. Their activities outside the United States on our behalf may raise both tax and regulatory issues. If and to the extent we are incorrect in our analysis of the applicability or impact of non-U.S. tax or regulatory requirements, we could incur costs, penalties or be the subject of an enforcement or other action. Operating our business in non-U.S. markets is generally more expensive than in the United States. Among other expenses, the effective tax rates applicable to our income allocated to some non-U.S. markets, which we are likely to earn through an entity that will pay corporate income tax, may be higher than the effective rates applicable to our income allocated to the United States, even though the effective tax rates are lower in many non-U.S. markets, because our U.S. operations are conducted through partnerships. In addition, costs related to our distribution and marketing efforts in non-U.S. markets generally have been more expensive than comparable costs in the United States. To the extent that our revenues do not increase to the same degree our expenses increase in connection with our continuing expansion outside the United States, our profitability could be adversely affected. Expanding our business into non-U.S. markets may also place significant demands on our existing infrastructure and employees.
Failure to maintain effective internal control over financial reporting could have a material adverse effect on our business and stock price.
As a public company, we are subject to a variety of reporting requirements under the Sarbanes-Oxley Act of 2002. Sarbanes-Oxley requires, among other things, that we maintain effective internal control over financial reporting. In accordance with Section 404 of Sarbanes-Oxley, our management is required to conduct an annual assessment of the effectiveness of our internal control over financial reporting and include a report on these internal controls in the annual reports we file with the SEC on Form 10-K. If we are not able to continue to comply with the requirements of Section 404 in a capable manner, we may be subject to adverse regulatory consequences and there could be a negative reaction in the financial markets due to a loss of investor confidence in us and the reliability of our financial statements. This could have a material adverse effect on us.
A change of control could result in termination of our investment advisory agreements with SEC-registered mutual funds and could trigger consent requirements in our other investment advisory agreements.
Under the U.S. Investment Company Act of 1940, as amended, or the 1940 Act, each of the investment advisory agreements between SEC-registered mutual funds and our subsidiary, Artisan Partners Limited Partnership, will terminate automatically in the event of its assignment, as defined in the 1940 Act.
Upon the occurrence of such an assignment, our subsidiary could continue to act as adviser to any such fund only if that fund’s board and shareholders approved a new investment advisory agreement, except in the case of certain of the funds that we sub-advise for which only board approval would be necessary. In addition, as required by the U.S. Investment Advisers Act of 1940, as amended, or the Advisers Act, each of the investment advisory agreements for the separate accounts we manage provides that it may not be assigned, as defined in the Advisers Act, without the consent of the client. An assignment occurs under the 1940 Act and the Advisers Act if, among other things, Artisan Partners Limited Partnership undergoes a change of control as recognized under the 1940 Act and the Advisers Act. If such an assignment were to occur, we cannot be certain that we will be able to obtain the necessary approvals from the boards and shareholders of the mutual funds we advise or the necessary consents from our separate account clients.
22
Risks Related to our Industry
We are subject to extensive regulation.
We are subject to extensive regulation in the United States, primarily at the federal level, including regulation by the SEC under the 1940 Act and the Advisers Act, by the U.S. Department of Labor under ERISA, and by the Financial Industry Regulatory Authority, Inc. The U.S. mutual funds we manage are registered with and regulated by the SEC as investment companies under the 1940 Act. We are also subject to regulation in the United Kingdom by the Financial Conduct Authority. The U.K. Financial Conduct Authority imposes a comprehensive system of regulation that is primarily principles-based (compared to the primarily rules-based U.S. regulatory system). The Advisers Act imposes numerous obligations on investment advisers including record keeping, advertising and operating requirements, disclosure obligations and prohibitions on fraudulent activities. The 1940 Act imposes similar obligations, as well as additional detailed operational requirements, on registered investment companies, which must be adhered to by their investment advisers. We have also expanded and continue to expand our distribution effort into non-U.S. markets, including the United Kingdom, other European countries, Canada, Australia and certain Asian countries, among others. The Central Bank of Ireland imposes requirements on UCITS funds subject to regulation by it, as do the regulators in certain other markets in which shares of Artisan Global Funds are offered for sale, and with which we are required to comply with respect to Artisan Global Funds. In the future, we may further expand our business outside of the United States in such a way or to such an extent that we may be required to register with additional foreign regulatory agencies or otherwise comply with additional non-U.S. laws and regulations that do not currently apply to us and with respect to which we do not have compliance experience. Our lack of experience in complying with any such non-U.S. laws and regulations may increase our risk of becoming party to litigation and subject to regulatory actions.
Accordingly, we face the risk of significant intervention by regulatory authorities, including extended investigation and surveillance activity, adoption of costly or restrictive new regulations and judicial or administrative proceedings that may result in substantial penalties. Among other things, we could be fined or be prohibited from engaging in some of our business activities. The requirements imposed by our regulators are designed to ensure the integrity of the financial markets and to protect customers and other third parties who deal with us, and are not designed to protect our stockholders. Consequently, these regulations often serve to limit our activities, including through net capital, customer protection and market conduct requirements. See “Regulatory Environment and Compliance”.
In addition to the extensive regulation to which we are subject in the United States, the United Kingdom and Ireland, we are also subject to regulation by the Australian Securities and Investments Commission, where we operate pursuant to an order of exemption, and by Canadian regulatory authorities in the Canadian provinces where we operate pursuant to exemptions from registration. Our business is also subject to the rules and regulations of the countries in which we conduct investment management activities. Failure to comply with applicable laws and regulations in the foreign countries where we invest and/or where our clients or prospective clients reside could result in fines, suspensions of personnel or other sanctions. See “Regulatory Environment and Compliance”.
The regulatory environment in which we operate is subject to continual change, and regulatory developments designed to increase oversight may adversely affect our business.
The legislative and regulatory environment in which we operate has undergone significant changes in the recent past. We believe that significant regulatory changes in our industry are likely to continue on a scale that exceeds the historical pace of regulatory change, which is likely to subject industry participants to additional, more costly and generally more punitive regulation. The requirements imposed by our regulators (including both U.S. and non-U.S. regulators) are designed to ensure the integrity of the financial markets and to protect customers and other third parties who deal with us, and are not designed to protect our stockholders. Consequently, these regulations often serve to limit our activities and/or increase our costs, including through customer protection and market conduct requirements. New laws or regulations, or changes in the enforcement of existing laws or regulations, applicable to us and our clients may adversely affect our business. Our ability to function in this environment will depend on our ability to constantly monitor and promptly react to legislative and regulatory changes. There have been a number of highly publicized regulatory inquiries that have focused on the investment management industry. These inquiries already have resulted in increased scrutiny of the industry and new rules and regulations for mutual funds and investment managers. This regulatory scrutiny may limit our ability to engage in certain activities that might be beneficial to our stockholders. See “Regulatory Environment and Compliance”.
We may be adversely affected as a result of new or revised legislation or regulations imposed by the SEC, other U.S. or non-U.S. governmental regulatory authorities or self-regulatory organizations that supervise the financial markets. We also may be adversely affected by changes in the interpretation or enforcement of existing laws and rules by these governmental authorities and self-regulatory organizations, as well as by courts. It is impossible to determine the extent of the impact of any new U.S. or non-U.S. laws, regulations or initiatives that may be proposed, or whether any of the proposals will become law. Compliance with any new laws or regulations could be more difficult and expensive and affect the manner in which we conduct business.
23
The investment management industry is intensely competitive.
The investment management industry is intensely competitive, with competition based on a variety of factors, including investment performance, investment management fee rates, continuity of investment professionals and client relationships, the quality of services provided to clients, corporate positioning and business reputation, continuity of selling arrangements with intermediaries and differentiated products. A number of factors, including the following, serve to increase our competitive risks:
|
•
|
Unlike some of our competitors, we do not currently offer passive investment strategies or alternative investment strategies, nor do we offer “solutions” products like target-date funds.
|
|
•
|
A number of our competitors have greater financial, technical, marketing and other resources, more comprehensive name recognition and more personnel than we do.
|
|
•
|
Potential competitors have a relatively low cost of entering the investment management industry.
|
|
•
|
Some investors may prefer to invest with an investment manager that is not publicly traded based on the perception that a publicly-traded asset manager may focus on the manager’s own growth to the detriment of investment performance for clients.
|
|
•
|
Other industry participants, hedge funds and alternative asset managers may seek to recruit our investment professionals.
|
|
•
|
Some competitors charge lower fees for their investment management services than we do.
|
For example, to the extent that there is a trend in favor of low-fee passive products such as index and certain exchange-traded funds, that trend will favor those of our competitors who provide passive investment strategies. Additionally, intermediaries through which we distribute our mutual funds may also sell their own proprietary funds and investment products, which could limit the distribution of our investment strategies. If we are unable to compete effectively, our earnings would be reduced and our business could be materially adversely affected.
The investment management industry faces substantial litigation risks which could materially adversely affect our business, financial condition or results of operations or cause significant reputational harm to us.
We depend to a large extent on our network of relationships and on our reputation in order to attract and retain client assets. If a client is not satisfied with our services, its dissatisfaction may be more damaging to our business than client dissatisfaction would be to other types of businesses. We make investment decisions on behalf of our clients that could result in substantial losses to them. If our clients suffer significant losses, or are otherwise dissatisfied with our services, we could be subject to the risk of legal liabilities or actions alleging negligent misconduct, breach of fiduciary duty, breach of contract, unjust enrichment and/or fraud. These risks are often difficult to assess or quantify and their existence and magnitude often remain unknown for substantial periods of time, even after an action has been commenced.
We may incur significant legal expenses in defending against litigation whether or not we engaged in conduct as a result of which we might be subject to legal liability. Substantial legal liability or significant regulatory action against us could materially adversely affect our business, financial condition or results of operations or cause significant reputational harm to us.
Risks Related to Our Structure
Control by our stockholders committee of approximately 65% of the combined voting power of our capital stock and the rights of holders of limited partnership units of Artisan Partners Holdings may give rise to conflicts of interest.
Our employees to whom we have granted equity (including our employee-partners) hold approximately 65% of the combined voting power of our capital stock and have entered into a stockholders agreement pursuant to which they granted an irrevocable voting proxy with respect to all shares of our common stock they have acquired from us and any shares they may acquire from us in the future to a stockholders committee. Any additional shares of our common stock that we issue to our employee-partners or other employees, including shares of common stock issued under our Omnibus Incentive Compensation Plan, will be subject to the stockholders agreement so long as the agreement has not been terminated. Shares held by an employee cease to be subject to the stockholders agreement upon termination of employment.
The stockholders committee has the ability to determine the outcome of any matter requiring the approval of a simple majority of our outstanding voting stock and prevent the approval of any matter requiring the approval of 66 2/3% of our outstanding voting stock. For so long as the shares subject to the stockholders agreement represent at least a majority of the combined voting power of our capital stock, the stockholders committee is able to elect all of the members of our board of directors (subject to the obligation of the stockholders committee under the terms of the stockholders agreement to vote in support of certain nominees) and will thereby control our management and affairs, including determinations with respect to acquisitions, dispositions, borrowings, issuances of securities, and the declaration and payment of dividends. In addition, subject to the class approval rights of each class of our outstanding capital stock and each class of Artisan Partners Holdings limited partnership units, the stockholders committee is able to determine the outcome of all matters requiring approval by a majority of stockholders, and is able to cause or prevent a change of control of our company or a change in the composition of our board of directors, and could preclude any unsolicited acquisition of our company. The stockholders committee has the ability to prevent the consummation of mergers, takeovers or other transactions that may be in the best interests of our Class A stockholders.
24
In particular, this concentration of voting power could deprive Class A stockholders of an opportunity to receive a premium for their shares of Class A common stock as part of a sale of our company, and could affect the market price of our Class A common stock. Because each share of our Class B common stock initially entitles its holder to five votes, the stockholders committee possesses the power and control described above even though the shares subject to the stockholders agreement represent less than a majority of the number of outstanding shares of our capital stock. If and when the holders of our Class B common stock collectively hold less than 20% of the aggregate number of outstanding shares of our capital stock, shares of Class B common stock will entitle the holder to only one vote per share.
The stockholders committee currently consists of Eric R. Colson (Chairman and Chief Executive Officer), Charles J. Daley, Jr. (Chief Financial Officer) and Gregory K. Ramirez (Executive Vice President). All shares subject to the stockholders agreement are voted in accordance with the majority decision of those three members
Our employee-partners (through their ownership of Class B common units), AIC (through its ownership of Class D common units) and the holders of Class A common units have the right, each voting as a single and separate class, to approve or disapprove certain transactions and matters, including material corporate transactions, such as a merger, consolidation, dissolution or sale of greater than 25% of the fair market value of Artisan Partners Holdings’ assets. These voting and class approval rights may enable our employee-partners, AIC or the holders of Class A common units to prevent the consummation of transactions that may be in the best interests of holders of our Class A common stock.
In addition, because our pre-IPO owners (including members of our board of directors) hold all or a portion of their ownership interests in our business through Artisan Partners Holdings, rather than through Artisan Partners Asset Management, these pre-IPO owners may have conflicting interests with holders of our Class A common stock. For example, our pre-IPO owners may have different tax positions from us which could influence their decisions regarding whether and when we should dispose of assets, whether and when we should incur new or refinance existing indebtedness, especially in light of the existence of the tax receivable agreements, and whether and when Artisan Partners Asset Management should terminate the tax receivable agreements and accelerate its obligations thereunder. In addition, the structuring of future transactions may take into consideration these pre-IPO owners’ tax or other considerations even where no similar benefit would accrue to us.
Our ability to pay regular dividends to our stockholders is subject to the discretion of our board of directors and may be limited by our structure and applicable provisions of Delaware law.
We intend to pay dividends to holders of our Class A common stock as described in “Dividend Policy”. Our board of directors may, in its sole discretion, change the amount or frequency of dividends or discontinue the payment of dividends entirely. In addition, as a holding company, we are dependent upon the ability of our subsidiaries to generate earnings and cash flows and distribute them to us so that we may pay dividends to our stockholders. We expect to cause Artisan Partners Holdings, which is a Delaware limited partnership, to make distributions to its partners, including us, in an amount sufficient for us to pay dividends. However, its ability to make such distributions will be subject to its and its subsidiaries’ operating results, cash requirements and financial condition, the applicable provisions of Delaware law that may limit the amount of funds available for distribution to its partners, its compliance with covenants and financial ratios related to existing or future indebtedness, including under our notes and our revolving credit agreement, its other agreements with third parties, as well as its obligation to make tax distributions under its partnership agreement (which distributions would reduce the cash available for distributions by Artisan Partners Holdings to us). In addition, each of the companies in our corporate chain must manage its assets, liabilities and working capital in order to meet all of its cash obligations, including the payment of dividends or distributions. As a consequence of these various limitations and restrictions, we may not be able to make, or may have to reduce or eliminate, the payment of dividends on our Class A common stock. Any change in the level of our dividends or the suspension of the payment thereof could adversely affect the market price of our Class A common stock.
Our ability to pay taxes and expenses, including payments under the tax receivable agreements, may be limited by our holding company structure.
As a holding company, our assets principally consist of our ownership of partnership units of Artisan Partners Holdings, deferred tax assets and cash and we have no independent means of generating revenue. Artisan Partners Holdings is a partnership for U.S. federal income tax purposes and, as such, is not subject to U.S. federal income tax. Instead, Artisan Partners Holdings’ taxable income is allocated to holders of its partnership units, including us. Accordingly, we incur income taxes on our proportionate share of Artisan Partners Holdings’ taxable income and also may incur expenses related to our operations. Under the terms of its amended and restated limited partnership agreement, Artisan Partners Holdings is obligated to make tax distributions to holders of its partnership units, including us. In addition to tax expenses, we are also required to make payments under the tax receivable agreements, which we expect will be significant, and we may incur other expenses related to the tax receivable agreements and our operations. We intend to cause Artisan Partners Holdings to make distributions in an amount sufficient to allow us to pay our taxes, make any payments due under the tax receivable agreements, and pay any additional operating expenses. However, its ability to make such distributions will be subject to various limitations and restrictions as set forth in the preceding risk factor. If, as a consequence of these various limitations and restrictions, we do not have sufficient funds to pay tax or other liabilities or to fund our operations, we may have to borrow funds and thus our liquidity and financial condition could be materially adversely affected. To the extent that we are unable to make payments when due under the tax receivable agreements for any reason, such payments will be deferred and will accrue interest at a rate equal to one-year LIBOR plus 300 basis points until paid.
25
We will be required to pay the tax receivable agreement beneficiaries for certain tax benefits we claim, and we expect that the payments we will be required to make will be substantial.
We are party to two tax receivable agreements. The first tax receivable agreement generally provides for the payment by us to the Pre-H&F Merger Shareholder of 85% of the amount of cash savings, if any, in U.S. federal, state and local income tax that we actually realize (or are deemed to realize in certain circumstances) as a result of (i) tax attributes of the preferred units acquired by us in the merger of a wholly-owned subsidiary of the private equity fund into us in March 2013, (ii) net operating losses available to us as a result of the merger, and (iii) tax benefits related to imputed interest.
The second tax receivable agreement generally provides for the payment by us to current or former limited partners of Artisan Partners Holdings of 85% of the amount of the cash savings, if any, in U.S. federal, state and local income tax that we actually realize (or are deemed to realize in certain circumstances) as a result of (i) certain tax attributes of their partnership units sold to us or exchanged (for shares of Class A common stock, convertible preferred stock or other consideration) and that are created as a result of such sales or exchanges and payments under the TRAs and (ii) tax benefits related to imputed interest.
The payment obligation under the tax receivable agreements is an obligation of APAM, not Artisan Partners Holdings, and we expect that the payments we will be required to make under the tax receivable agreements will be substantial. Assuming no material changes in the relevant tax law and that we earn sufficient taxable income to realize all tax benefits that are subject to the tax receivable agreements, as of December 31, 2015, we expect that the reduction in tax payments for us associated with (i) the H&F Corp merger described above, (ii) our purchase of limited partnership units from, and exchanges of limited partnership units by, certain of our investors in 2013, 2014 and 2015, and (iii) future purchases or exchanges of limited partnership units as described above would aggregate to approximately $1.4 billion over generally a minimum of 15 years, assuming the future purchases or exchanges described in clause (iii) occurred when the market value of our Class A Common stock was $36.06, the closing price of our Class A common stock on December 31, 2015. Under such scenario we would be required to pay the other parties to the tax receivable agreements 85% of such amount, or approximately $1.2 billion, over generally a minimum of 15 years. The actual amounts may materially differ from these hypothetical amounts, as potential future reductions in tax payments for us and tax receivable agreement payments by us will be calculated using the market value of our Class A common stock at the time of purchase or exchange and the prevailing tax rates applicable to us over the life of the tax receivable agreements and will be dependent on us generating sufficient future taxable income to realize the benefit. As of
December 31, 2015
, we recorded a
$589.1 million
liability, representing amounts payable under the tax receivable agreements equal to 85% of the tax benefit we expected to realize from the H&F Corp merger described above and our purchase of limited partnership units from, and the exchanges of partnership units by, certain of our investors in 2013, 2014 and 2015, assuming no material changes in the related tax law and that we earn sufficient taxable income to realize all tax benefits subject to the tax receivable agreements. The liability will increase upon future purchases or exchanges of limited partnership units with the increase representing amounts payable under the tax receivable agreements equal to 85% of the estimated future tax benefits, if any, resulting from such purchases or exchanges. Payments under the tax receivable agreements are not conditioned on the counterparties’ continued ownership of us.
The actual increase in tax basis, as well as the amount and timing of any payments under these agreements, will vary depending upon a number of factors, including the timing of purchases or exchanges of limited partnership units, the price of our Class A common stock at the time of the purchase or exchange, the extent to which such transactions are taxable, the amount and timing of the taxable income we generate in the future and the tax rate then applicable as well as the portion of our payments under the tax receivable agreements constituting imputed interest or depreciable or amortizable basis. Payments under the tax receivable agreements are expected to give rise to certain additional tax benefits attributable to either further increases in basis or in the form of deductions for imputed interest, depending on the tax receivable agreement and the circumstances. Any such benefits are covered by the tax receivable agreements and will increase the amounts due thereunder. In addition, the tax receivable agreements provide for interest, at a rate equal to one-year LIBOR plus 100 basis points, accrued from the due date (without extensions) of the corresponding APAM tax return to the payment due date specified by the tax receivable agreements. In addition, to the extent that we are unable to make payments when due under the tax receivable agreements for any reason, such payments will be deferred and will accrue interest at a rate equal to one-year LIBOR plus 300 basis points until paid.
Payments under the tax receivable agreements will be based on the tax reporting positions that we determine. Although we are not aware of any issue that would cause the IRS or other taxing authority to challenge a tax basis increase or other tax attributes subject to the tax receivable agreements, we will not be reimbursed for any payments previously made under the tax receivable agreements if such basis increases or other benefits are subsequently disallowed (however, any such additional payments may be netted against future payments (if any) that are made under the tax receivable agreements). As a result, in certain circumstances, payments could be made under the tax receivable agreements in excess of the benefits that we actually realize in respect of the attributes to which the tax receivable agreements relate.
In certain cases, payments under the tax receivable agreements may be accelerated and/or significantly exceed the actual benefits we realize in respect of the tax attributes subject to the tax receivable agreements.
The tax receivable agreements provide that (i) upon certain mergers, asset sales, other forms of business combinations or other changes of control, (ii) in the event that we materially breach any of our material obligations under the agreements, whether as a result of failure to make any payment within six months of when due (provided we have sufficient funds to make such payment), failure to honor any other material obligation required thereunder or by operation of law as a result of the rejection of the
26
agreements in a bankruptcy or otherwise, or (iii) if, at any time, we elect an early termination of the agreements, our (or our successor’s) obligations under the agreements (with respect to all units, whether or not units have been exchanged or acquired before or after such transaction) would be based on certain assumptions. In the case of a material breach or if we elect early termination, those assumptions include that we would have sufficient taxable income to fully utilize the deductions arising from the increased tax deductions and tax basis and other benefits related to entering into the tax receivable agreements. In the case of a change of control, the assumptions include that in each taxable year ending on or after the closing date of the change of control, our taxable income (prior to the application of the tax deductions and tax basis and other benefits related to entering into the tax receivable agreements) will equal the greater of (i) the actual taxable income (prior to the application of the tax deductions and tax basis and other benefits related to entering into the tax receivable agreements) for the taxable year and (ii) the highest taxable income (calculated without taking into account extraordinary items of income or deduction and prior to the application of the tax deductions and tax basis and other benefits related to entering into the tax receivable agreements) in any of the four fiscal quarters ended prior to the closing date of the change of control, annualized and increased by 10% for each taxable year beginning with the second taxable year following the closing date of the change of control. In the event we elect to terminate the agreements early or we materially breach a material obligation, our obligations under the agreements will accelerate. As a result, (i) we could be required to make payments under the tax receivable agreements that are greater than or less than the specified percentage of the actual benefits we realize in respect of the tax attributes subject to the agreements and (ii) if we materially breach a material obligation under the agreements or if we elect to terminate the agreements early, we would be required to make an immediate payment equal to the present value of the anticipated future tax benefits, which payment may be made significantly in advance of the actual realization of such future benefits. In these situations, our obligations under the tax receivable agreements could have a substantial negative impact on our liquidity and could have the effect of delaying, deferring or preventing certain mergers, asset sales, other forms of business combinations or other changes of control. There can be no assurance that we will be able to finance our obligations under the tax receivable agreements. If we were to elect to terminate the tax receivable agreements as of December 31, 2015, based on an assumed discount rate equal to one-year LIBOR plus 100 basis points, we estimate that we would be required to pay approximately $1.0 billion in the aggregate under the tax receivable agreements.
If we were deemed an investment company under the 1940 Act as a result of our ownership of Artisan Partners Holdings, applicable restrictions could make it impractical for us to continue our business as contemplated and could have a material adverse effect on our business.
Under Sections 3(a)(1)(A) and (C) of the 1940 Act, a company generally will be deemed to be an “investment company” for purposes of the 1940 Act if (i) it is, or holds itself out as being, engaged primarily, or proposes to engage primarily, in the business of investing, reinvesting or trading in securities or (ii) it engages, or proposes to engage, in the business of investing, reinvesting, owning, holding or trading in securities and, absent an applicable exemption, it owns or proposes to acquire investment securities having a value exceeding 40% of the value of its total assets (exclusive of U.S. government securities and cash items) on an unconsolidated basis. We do not believe that we are an “investment company”, as such term is defined in either of those sections of the 1940 Act.
As the sole general partner of Artisan Partners Holdings, we control and operate Artisan Partners Holdings. On that basis, we believe that our interest in Artisan Partners Holdings is not an “investment security” as that term is used in the 1940 Act. However, if we were to cease participation in the management of Artisan Partners Holdings, our interest in Artisan Partners Holdings could be deemed an “investment security” for purposes of the 1940 Act.
We and Artisan Partners Holdings intend to continue to conduct our operations so that we will not be deemed an investment company. However, if we were to be deemed an investment company, restrictions imposed by the 1940 Act, including limitations on our capital structure and our ability to transact with affiliates, could make it impractical for us to continue our business as contemplated and could have a material adverse effect on our business.
Risks Related to Our Class A Common Stock
The market price and trading volume of our Class A common stock may be volatile, which could result in rapid and substantial losses for our stockholders.
The market price of our Class A common stock may be highly volatile and could be subject to wide fluctuations. In addition, the trading volume of our Class A common stock may fluctuate and cause significant price variations to occur. If the market price of our Class A common stock declines significantly, investors may be unable to sell shares of Class A common stock at or above their purchase price, if at all. The market price of our Class A common stock may fluctuate or decline significantly in the future. Some of the factors that could negatively affect the price of our Class A common stock, or result in fluctuations in the price or trading volume of our Class A common stock, include:
|
•
|
Variations in our quarterly operating results.
|
|
•
|
Failure to meet analysts’ earnings or other expectations.
|
|
•
|
Publication of research reports about us or the investment management industry.
|
|
•
|
Departures of any of our portfolio managers or members of our management team or additions or departures of other key personnel.
|
|
•
|
Adverse market reaction to any indebtedness we may incur or securities we may issue in the future.
|
27
|
•
|
Actions by stockholders.
|
|
•
|
Changes in market valuations of similar companies.
|
|
•
|
Actual or anticipated poor performance in one or more of the investment strategies we offer.
|
|
•
|
Changes or proposed changes in laws or regulations, or differing interpretations thereof, affecting our business, or enforcement of these laws and regulations, or announcements relating to these matters.
|
|
•
|
Adverse publicity about the investment management industry generally, or particular scandals, specifically.
|
|
•
|
Litigation and governmental investigations.
|
|
•
|
The relatively low trading volume and public float of our Class A common stock.
|
|
•
|
Sales of a large number of shares of our Class A common stock or the perception that such sales could occur.
|
|
•
|
General market and economic conditions.
|
Future sales of our Class A common stock in the public market could lower our stock price, and any future grant or sale of equity or convertible securities may dilute existing stockholders’ ownership in us.
The market price of our Class A common stock could decline as a result of future sales of a large number of shares of our Class A common stock, or the perception that such sales could occur.
These sales, or the possibility that these sales may occur, also may make it more difficult for us to raise additional capital by selling equity securities in the future, at a time and price that we deem appropriate.
We are party to a resale and registration rights agreement pursuant to which the shares of our Class A common stock issued upon exchange of limited partnership units are eligible for resale. Such shares of Class A common stock may be transferred only in accordance with the terms and conditions of the resale and registration rights agreement. The common units of Artisan Partners Holdings discussed below are exchangeable for shares of our Class A common stock on a one-for-one basis.
There is no limit on the number of shares of our Class A common stock that our Class A limited partners or AIC are permitted to sell. As of
December 31, 2015
, our Class A limited partners owned approximately 7.9 million Class A common units and AIC owned approximately 7.0 million Class D common units.
For an employee-partner, in each one-year period, the first of which began in March 2014, the partner is generally permitted to sell up to (i) a number of vested shares of our Class A common stock representing 15% of the aggregate number of common units and shares of Class A common stock received upon exchange of common units (in each case, whether vested or unvested) he or she held as of the first day of that period or, (ii) if greater, vested shares of our Class A common stock having a market value as of the time of sale of $250,000, as well as, in either case, the number of shares such holder could have sold in any previous period or periods but did not sell in such period or periods. As of
December 31, 2015
, our employee-partners owned
18.3 million
Class B common units. Approximately 3.3 million of those units will be eligible for exchange and sale in the first quarter of 2016. We may waive or modify these restrictions.
In addition, we have filed a registration statement registering 15,000,000 shares of our Class A common stock for issuance pursuant to our 2013 Omnibus Incentive Compensation Plan and 2013 Non-Employee Director Plan. We have awarded
4,765,725
restricted stock units or restricted shares of Class A common stock to our employees and employees of our subsidiaries.
3,278,084
of these awards vest pro rata over the five years from the date of issuance and may be sold upon vesting.
1,487,641
of these awards are career shares or restricted stock units, which generally will only vest upon the grantee’s qualifying retirement. We may increase the number of shares registered for this purpose from time to time. Once these shares have been issued and have vested, they will be able to be sold in the public market.
We may also purchase limited partnerships units of Holdings at any time and may issue and sell additional shares of our Class A common stock to fund such purchases. We cannot predict the size of future issuances of our Class A common stock or the effect, if any, that future issuances and sales of shares of our Class A common stock may have on the market price of our Class A common stock. Sales or distributions of substantial amounts of our Class A common stock (including shares issued in connection with an acquisition), or the perception that such sales could occur, may cause the market price of our Class A common stock to decline.
The disparity in the voting rights among the classes of our capital stock may have a potential adverse effect on the price of our Class A common stock.
Each share of our Class A common stock and Class C common stock entitles its holder to one vote on all matters to be voted on by stockholders generally, while each share of our Class B common stock entitles its holder to five votes on all matters to be voted on by stockholders generally for so long as the holders of our Class B common stock collectively hold at least 20% of the number of outstanding shares of our capital stock. The difference in voting rights could adversely affect the value of our Class A common stock by, for example, delaying or deferring a change of control or if investors view, or any potential future purchaser of our company views, the superior voting rights of the Class B common stock to have value.
28
Anti-takeover provisions in our restated certificate of incorporation and amended and restated bylaws and in the Delaware General Corporation Law could discourage a change of control that our stockholders may favor, which could negatively affect the market price of our Class A common stock.
Provisions in our restated certificate of incorporation, amended and restated bylaws and in the Delaware General Corporation Law, or the DGCL, may make it more difficult and expensive for a third party to acquire control of us even if a change of control would be beneficial to the interests of our stockholders. Those provisions include:
|
•
|
The disparity in the voting rights among the classes of our capital stock.
|
|
•
|
The right of the various classes of our capital stock to vote, as separate classes, on certain amendments to our restated certificate of incorporation and certain fundamental transactions.
|
|
•
|
The ability of our board of directors to determine to issue shares of preferred stock and to determine the price and other terms of those shares, which could be used to thwart a takeover attempt.
|
|
•
|
Advance notice procedures that stockholders must comply with in order to nominate candidates to our board of directors or to propose matters to be acted upon at a stockholders’ meeting, which may discourage or deter a potential acquiror from conducting a solicitation of proxies to elect the acquiror’s own slate of directors or otherwise attempting to obtain control of us.
|
|
•
|
A limitation that, generally, stockholder action may only be taken at an annual or special meeting or by unanimous written consent.
|
|
•
|
A requirement that a special meeting of stockholders may be called only by our board of directors or our Chairman and Chief Executive Officer, which may delay the ability of our stockholders to force consideration of a proposal or to take action, including the removal of directors.
|
|
•
|
The ability of our board of directors to adopt, amend and repeal our amended and restated bylaws by majority vote, while such action by stockholders would require a super majority vote, which makes it more difficult for stockholders to change certain provisions described above.
|
The market price of our Class A common stock could be adversely affected to the extent that the provisions of our restated certificate of incorporation and amended and restated bylaws discourage potential takeover attempts that our stockholders may favor.
Our restated certificate of incorporation designates the Court of Chancery of the State of Delaware as the sole and exclusive forum for certain types of actions and proceedings that may be initiated by our stockholders, which could limit our stockholders’ ability to obtain a favorable judicial forum for disputes with us or our directors, officers, employees or agents.
Our restated certificate of incorporation provides that, unless we consent in writing to an alternative forum, the Court of Chancery of the State of Delaware will be the sole and exclusive forum for (i) any derivative action or proceeding brought on our behalf, (ii) any action asserting a claim of breach of a fiduciary duty owed by any of our directors, officers, employees or agents to us or our stockholders, (iii) any action asserting a claim arising pursuant to any provision of the Delaware General Corporation Law, our restated certificate of incorporation or our amended and restated bylaws or (iv) any action asserting a claim that is governed by the internal affairs doctrine, in each case subject to the Court of Chancery having personal jurisdiction over the indispensable parties named as defendants therein and the claim not being one which is vested in the exclusive jurisdiction of a court or forum other than the Court of Chancery or for which the Court of Chancery does not have subject matter jurisdiction. Any person purchasing or otherwise acquiring any interest in any shares of our capital stock shall be deemed to have notice of and to have consented to this provision of our restated certificate of incorporation. This choice of forum provision may limit our stockholders’ ability to bring a claim in a judicial forum that it finds favorable for disputes with us or our directors, officers, employees or agents, which may discourage such lawsuits against us and our directors, officers, employees and agents. Alternatively, if a court were to find this provision of our restated certificate of incorporation inapplicable to, or unenforceable in respect of, one or more of the specified types of actions or proceedings, we may incur additional costs associated with resolving such matters in other jurisdictions, which could adversely affect our business and financial condition.
Our indemnification obligations may pose substantial risks to our financial condition.
Pursuant to our restated certificate of incorporation, we will indemnify our directors and officers to the fullest extent permitted by Delaware law against all liability and expense incurred by them in their capacities as directors or officers of us. We also are obligated to pay their expenses in connection with the defense of claims. Our bylaws provide for similar indemnification of, and advancement of expenses to, our directors, officers, employees and agents and members of our stockholders committee. We have also entered into indemnification agreements with each of our directors and executive officers and each member of our stockholders committee, pursuant to which we will indemnify them to the fullest extent permitted by Delaware law in connection with their service in such capacities. Artisan Partners Holdings will indemnify and advance expenses to AIC, as its former general partner, the former members of its pre-IPO Advisory Committee, the members of our stockholders committee, our directors and officers and its officers and employees against any liability and expenses incurred by them and arising as a result of the capacities in which they serve or served Artisan Partners Holdings.
29
We have obtained liability insurance insuring our directors, officers and members of our stockholders committee against liability for acts or omissions in their capacities as directors, officers or committee members subject to certain exclusions. These indemnification obligations may pose substantial risks to our financial condition, as we may not be able to maintain our insurance or, even if we are able to maintain our insurance, claims in excess of our insurance coverage could be material. In addition, these indemnification obligations and other provisions of our restated certificate of incorporation, and the amended and restated partnership agreement of Artisan Partners Holdings, may have the effect of reducing the likelihood of derivative litigation against indemnified persons, and may discourage or deter stockholders or management from bringing a lawsuit against such persons, even though such an action, if successful, might otherwise have benefited us and our stockholders.
Our restated certificate of incorporation provides that certain of our investors do not have an obligation to offer us business opportunities.
Our restated certificate of incorporation provides that, to the fullest extent permitted by applicable law, certain of our investors and their respective affiliates (including affiliates who serve on our board of directors) have no obligation to offer us an opportunity to participate in the business opportunities presented to them, even if the opportunity is one that we might reasonably have pursued (and therefore they may be free to compete with us in the same business or similar business). Furthermore, we renounce and waive and agree not to assert any claim for breach of any fiduciary or other duty relating to any such opportunity against those investors and their affiliates by reason of any such activities unless, in the case of any person who is our director or officer, such opportunity is expressly offered to such director or officer in writing solely in his or her capacity as an officer or director of us. This may create actual and potential conflicts of interest between us and certain of our investors and their affiliates (including certain of our directors).
If securities or industry analysts do not publish research or publish inaccurate or unfavorable research about our business or our industry, our stock price and trading volume could decline.
The trading market for our Class A common stock depends in part on the research and reports that securities or industry analysts publish about us or our business, or about the investment management industry generally. If one or more of the analysts who cover us downgrades our stock or publishes unfavorable research about our business or about the investment management industry, our stock price would likely decline. If one or more of these analysts ceases coverage of us or fails to publish reports on us regularly, demand for our stock could decrease, which could cause our stock price and trading volume to decline.
None
We operate our business from offices in Milwaukee, Wisconsin; San Francisco, California; Atlanta, Georgia; New York, New York; Wilmington, Delaware; Mission Woods, Kansas; Sydney; London; Singapore and Toronto. Most of our business operations are based in Milwaukee. Our Chief Executive Officer and Chief Financial Officer, along with other employees, are based in San Francisco. We lease office space in each location and believe our existing and contracted-for facilities are adequate to meet our requirements.
In the normal course of business, we may be subject to various legal and administrative proceedings. Currently, there are no legal or administrative proceedings that management believes may have a material effect on our consolidated financial position, cash flows or results of operations.
Not applicable
30
Shares of our Class A common stock have been listed and traded on the NYSE under the symbol “APAM” since March 7, 2013. The following table sets forth, for the periods indicated, the high and low intra-day sale prices in dollars on the NYSE for our Class A common stock and the dividends per share of Class A common stock we declared during the periods indicated.
|
|
High
|
Low
|
Dividends
Declared
|
|||||||||
|
For the quarter ended March 31, 2014
|
$
|
71.86
|
|
$
|
57.50
|
|
$
|
2.18
|
|
|||
|
For the quarter ended June 30, 2014
|
$
|
65.65
|
|
$
|
51.72
|
|
$
|
0.55
|
|
|||
|
For the quarter ended September 30, 2014
|
$
|
57.62
|
|
$
|
50.66
|
|
$
|
0.55
|
|
|||
|
For the quarter ended December 31, 2014
|
$
|
53.12
|
|
$
|
44.86
|
|
$
|
0.55
|
|
|||
|
For the quarter ended March 31, 2015
|
$
|
50.93
|
|
$
|
44.34
|
|
$
|
1.55
|
|
|||
|
For the quarter ended June 30, 2015
|
$
|
48.15
|
|
$
|
43.05
|
|
$
|
0.60
|
|
|||
|
For the quarter ended September 30, 2015
|
$
|
48.39
|
|
$
|
34.57
|
|
$
|
0.60
|
|
|||
|
For the quarter ended December 31, 2015
|
$
|
40.62
|
|
$
|
33.24
|
|
$
|
0.60
|
|
|||
There is no trading market for shares of our Class B common stock or Class C common stock.
On
December 31, 2015
, the last reported sale price for our Class A common stock on the NYSE was $36.06 per share. As of February 23, 2016, there were approximately 114 stockholders of record of our Class A common stock, 44 stockholders of record of our Class B common stock, and 30 stockholders of record of our Class C common stock. These figures do not reflect the beneficial ownership or shares held in nominee name, nor do they include holders of any restricted stock units.
31
Performance Graph
The following graph compares the year-end cumulative total stockholder return on our Class A common stock from the date the shares began trading on the NYSE on March 7, 2013 to December 31, 2015, with the year-end cumulative total return of the S&P 500
®
and the Dow Jones U.S. Asset Managers Index. The graph assumes the investment of $100 in our common stock and in the market indices on March 7, 2013 and the reinvestment of all dividends.
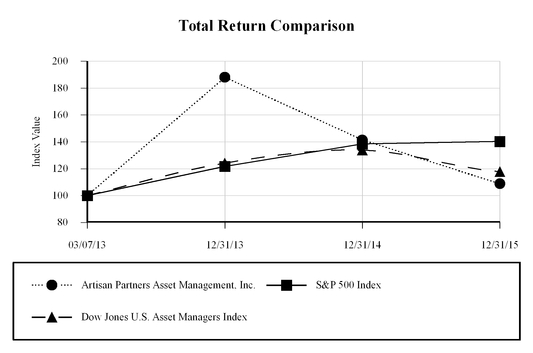
|
3/7/2013
|
12/31/2013
|
12/31/2014
|
12/31/2015
|
|
|
Artisan Partners Asset Management, Inc.
|
$100.00
|
$188.06
|
$141.46
|
$108.85
|
|
S&P 500 Index
|
$100.00
|
$121.75
|
$138.42
|
$140.33
|
|
Dow Jones U.S. Asset Managers Index
|
$100.00
|
$124.20
|
$133.86
|
$117.85
|
The information contained in the performance graph and table shall not be deemed to be “soliciting material” or “filed” or incorporated by reference in future filings with the SEC, except to the extent that the company specifically incorporates the information by reference into a document filed under the Securities Act or the Exchange Act.
Dividend Policy
Subject to board approval each quarter, we expect to pay a quarterly dividend during 2016. After the end of the year, our board expects to consider paying a special dividend that will take into consideration our annual adjusted earnings, business conditions and the amount of cash we want to retain at that time. During the first quarter of 2016, our board of directors declared a quarterly dividend of $0.60 per share of Class A common stock and a special annual dividend of $0.40 per share. Although we expect to pay dividends according to our dividend policy, we may not pay dividends according to our policy or at all. We intend to fund dividends from our portion of distributions made by Artisan Partners Holdings from its available cash generated from operations. The holders of our Class B common stock and Class C common stock are not entitled to any cash dividends in their capacity as stockholders, but, in their capacity as holders of limited partnership units of Artisan Partners Holdings, they generally participate on a pro rata basis in distributions by Artisan Partners Holdings.
The declaration and payment of all future dividends, if any, will be at the sole discretion of our board of directors. In determining the amount of any future dividends, our board of directors will take into account: (i) our financial results, (ii) our available cash, as well as anticipated cash requirements (including debt servicing), (iii) our capital requirements and the capital requirements of our subsidiaries (including Artisan Partners Holdings), (iv) contractual, legal, tax and regulatory restrictions on, and implications of, the payment of dividends by us to our stockholders or by our subsidiaries (including Artisan Partners Holdings) to us, including the obligation of Artisan Partners Holdings to make tax distributions to the holders of partnership units (including us), (v) general economic and business conditions and (vi) any other factors that our board of directors may deem relevant.
32
As a holding company, our assets principally consist of our ownership of partnership units of Artisan Partners Holdings, deferred tax assets and cash. Accordingly, we depend on distributions from Artisan Partners Holdings to fund any dividends we may pay. We intend to cause Artisan Partners Holdings to distribute cash to its partners, including us, in an amount sufficient to cover dividends, if any, declared by us. If we do cause Artisan Partners Holdings to make such distributions, holders of Artisan Partners Holdings limited partnership units will be entitled to receive equivalent distributions on a pro rata basis.
Our dividend policy has certain risks and limitations, particularly with respect to liquidity. Although we expect to pay dividends according to our dividend policy, we may not pay dividends according to our policy, or at all, if, among other things, Artisan Partners Holdings is unable to make distributions to us as a result of its operating results, cash requirements and financial condition, the applicable laws of the State of Delaware (which may limit the amount of funds available for distribution), its compliance with covenants and financial ratios related to indebtedness (including the notes and the revolving credit agreement) and its other agreements with third parties. Our note purchase and revolving credit agreements contain covenants limiting Artisan Partners Holdings’ ability to make distributions if a default has occurred and is continuing or would result from such a distribution. See “Management’s Discussion and Analysis of Financial Condition and Results of Operations—Liquidity and Capital Resources”.
Under the Delaware General Corporation Law, we may only pay dividends from legally available surplus or, if there is no such surplus, out of our net profits for the fiscal year in which the dividend is declared and/or the preceding fiscal year. Surplus is defined as the excess of the fair value of our total assets over the sum of the fair value of our total liabilities plus the par value of our outstanding capital stock. Capital stock is defined as the aggregate of the par value of all issued capital stock. To the extent we do not have sufficient cash to pay dividends, we may decide not to pay dividends.
Artisan Partners Holdings’ Distributions
Artisan Partners Holdings has made the following distributions to holders of its partnership units, including APAM, during the periods indicated:
|
For the Years Ended December 31,
|
|||
|
2015
|
2014
|
||
|
Distributions
|
(in millions)
|
||
|
For the quarter ended March 31
|
$79.4
|
$131.6
|
|
|
For the quarter ended June 30
|
$109.2
|
$116.5
|
|
|
For the quarter ended September 30
|
$81.1
|
$81.6
|
|
|
For the quarter ending December 31
|
$99.2
|
$97.5
|
|
Unregistered Sales of Equity Securities
As described in
Note 10, “Stockholders’ Equity”
, to the Consolidated Financial Statements included in Item 8 of this report, upon termination of employment with Artisan, an employee-partner’s unvested Class B common units are forfeited. Generally, the employee-partner’s vested Class B common units are exchanged for Class E common units. The employee-partner’s shares of Class B common stock are canceled and APAM issues the former employee-partner a number of shares of Class C common stock equal to the former employee-partner’s number of Class E common units. Class E common units are exchangeable for Class A common stock subject to the same restrictions and limitations on exchange applicable to the other common units of Holdings. There were no such issuances during the three months ended December 31, 2015.
33
Securities Authorized for Issuance Under Equity Compensation Plans
The following table sets forth the total shares of our Class A common stock authorized and issued (or to be issued) under our equity compensation plans as of December 31, 2015:
|
As of December 31, 2015
|
|||||||
|
Authorized
|
Issued (or to be issued)
|
Number of Securities remaining available for future issuance under equity compensation plans
|
Equity Type
|
||||
|
2013 Omnibus Incentive Compensation Plan
|
14,000,000
|
3,663,065
|
10,336,935
|
Restricted Share Awards
Restricted Stock Units
|
|||
|
2013 Non-Employee Director Plan
|
1,000,000
|
47,718
|
952,282
|
Restricted Stock Units
|
|||
These plans were approved by our sole stockholder prior to our IPO in March 2013. For restricted stock units issued to employees, the shares of Class A common stock underlying the restricted stock units will generally be issued and delivered promptly following the vesting of the awards. For restricted stock units issued to non-employee directors, the shares of Class A common stock underlying the restricted stock units will generally be issued and delivered on or promptly following the termination of the non-employee director’s service on the Board.
The following tables set forth selected historical consolidated financial data of Artisan Partners Asset Management as of the dates and for the periods indicated. The selected consolidated statements of operations data for the years ended
December 31, 2015
,
2014
and
2013
and the selected consolidated statements of financial condition data as of
December 31, 2015
and
2014
have been derived from our audited consolidated financial statements included elsewhere in this document. The selected consolidated statements of operations data for the years ended December 31, 2012 and 2011 and the consolidated statement of financial condition as of December 31, 2013, 2012 and 2011 have been derived from consolidated financial statements not included elsewhere in this document. The historical consolidated financial statements are the combined results of Artisan Partners Asset Management and Artisan Partners Holdings. Because Artisan Partners Asset Management and Artisan Partners Holdings were under common control at the time of the IPO Reorganization, Artisan Partners Asset Management’s acquisition of control of Artisan Partners Holdings was accounted for as a transaction among entities under common control. Artisan Partners Asset Management has been allocated a part of Artisan Partners Holdings’ net income since March 12, 2013, when it became Artisan Partners Holdings’ general partner.
You should read the following selected historical consolidated financial data together with “Management’s Discussion and Analysis of Financial Condition and Results of Operations” and the Consolidated Financial Statements and Notes.
34
|
|
For the Years Ended December 31,
|
||||||||||||||||||
|
|
2015
|
2014
|
|
2013
|
|
2012
|
|
2011
|
|||||||||||
|
(in millions, except per-share data)
|
|||||||||||||||||||
|
|
|
|
|
|
|
|
|
|
|
||||||||||
|
Revenues
|
|
|
|
|
|
|
|
|
|
||||||||||
|
Management fees
|
|
|
|
|
|
|
|
|
|
|
|
|
|
|
|||||
|
Mutual funds
|
$
|
543.3
|
|
$
|
575.4
|
|
$
|
464.3
|
|
$
|
336.2
|
|
$
|
305.2
|
|
||||
|
Separate accounts
|
260.4
|
|
|
252.3
|
|
219.0
|
|
|
167.8
|
|
|
145.8
|
|
||||||
|
Performance fees
|
1.8
|
|
|
1.0
|
|
2.5
|
|
|
1.6
|
|
|
4.1
|
|
||||||
|
Total revenues
|
$
|
805.5
|
|
|
$
|
828.7
|
|
|
$
|
685.8
|
|
|
$
|
505.6
|
|
|
$
|
455.1
|
|
|
Operating Expenses
|
|
|
|
|
|
|
|
||||||||||||
|
Salaries, incentive compensation and benefits
|
372.2
|
|
|
350.3
|
|
309.2
|
|
|
227.3
|
|
|
198.6
|
|
||||||
|
Pre-offering related compensation-share-based awards
|
42.1
|
|
|
64.7
|
|
404.2
|
|
|
101.7
|
|
|
(21.1
|
)
|
||||||
|
Pre-offering related compensation-other
|
—
|
|
|
—
|
|
143.0
|
|
|
54.1
|
|
|
55.7
|
|
||||||
|
Total compensation and benefits
|
414.3
|
|
|
415.0
|
|
|
856.4
|
|
|
383.1
|
|
|
233.2
|
|
|||||
|
Distribution and marketing
|
43.6
|
|
|
49.1
|
|
38.4
|
|
|
29.0
|
|
|
26.2
|
|
||||||
|
Occupancy
|
12.5
|
|
|
11.3
|
|
10.5
|
|
|
9.3
|
|
|
9.0
|
|
||||||
|
Communication and technology
|
25.5
|
|
|
21.0
|
|
14.4
|
|
|
13.2
|
|
|
10.6
|
|
||||||
|
General and administrative
|
27.2
|
|
|
25.4
|
|
27.3
|
|
|
23.9
|
|
|
21.8
|
|
||||||
|
Total operating expenses
|
523.1
|
|
|
521.8
|
|
|
947.0
|
|
|
458.5
|
|
|
300.8
|
|
|||||
|
Operating income (loss)
|
282.4
|
|
|
306.9
|
|
|
(261.2
|
)
|
|
47.1
|
|
|
154.3
|
|
|||||
|
Non-operating income (loss)
|
|
|
|
|
|
|
|
||||||||||||
|
Interest expense
|
(11.7
|
)
|
|
(11.6
|
)
|
(11.9
|
)
|
|
(11.4
|
)
|
|
(18.4
|
)
|
||||||
|
Net gain (loss) of Launch Equity
|
—
|
|
(4.0
|
)
|
10.7
|
|
8.8
|
|
(3.1
|
)
|
|||||||||
|
Loss on debt extinguishment
|
—
|
|
—
|
|
—
|
|
(0.8
|
)
|
—
|
|
|||||||||
|
Net gain on the valuation of contingent value rights
|
—
|
|
|
—
|
|
49.6
|
|
|
—
|
|
|
—
|
|
||||||
|
Net investment income
|
0.4
|
|
|
0.7
|
|
5.1
|
|
|
0.7
|
|
|
0.3
|
|
||||||
|
Net loss on the tax receivable agreements
|
(12.2
|
)
|
|
(4.2
|
)
|
—
|
|
—
|
|
—
|
|
||||||||
|
Other non-operating income (loss)
|
—
|
|
|
(0.3
|
)
|
—
|
|
|
(0.8
|
)
|
|
(1.9
|
)
|
||||||
|
Total non-operating income (loss)
|
(23.5
|
)
|
|
(19.4
|
)
|
|
53.5
|
|
|
(3.5
|
)
|
|
(23.1
|
)
|
|||||
|
Income (loss) before income taxes
|
258.9
|
|
|
287.5
|
|
|
(207.7
|
)
|
|
43.6
|
|
|
131.2
|
|
|||||
|
Provision for income taxes
|
46.8
|
|
|
48.8
|
|
26.4
|
|
|
1.0
|
|
|
1.2
|
|
||||||
|
Net income (loss) before noncontrolling interests
|
212.1
|
|
|
238.7
|
|
|
(234.1
|
)
|
|
42.6
|
|
|
130.0
|
|
|||||
|
Less: Net income (loss) attributable to noncontrolling interests-Artisan Partners Holdings LP
|
130.3
|
|
|
173.1
|
|
(269.6
|
)
|
|
33.8
|
|
|
133.1
|
|
||||||
|
Less: Net income (loss) attributable to noncontrolling interests-Launch Equity
|
—
|
|
|
(4.0
|
)
|
10.7
|
|
|
8.8
|
|
|
(3.1
|
)
|
||||||
|
Net income (loss) attributable to Artisan Partners Asset Management Inc.
|
$
|
81.8
|
|
$
|
69.6
|
|
|
$
|
24.8
|
|
—
|
|
—
|
|
|||||
|
Per Share Data:
|
|
|
|
|
|
|
|
|
|
||||||||||
|
Earnings (loss) per basic and diluted common share
|
$
|
1.86
|
|
$
|
(0.37
|
)
|
$
|
(2.04
|
)
|
—
|
|
—
|
|
||||||
|
Weighted average basic and diluted common shares outstanding
|
35.4
|
|
|
27.5
|
|
|
13.8
|
|
|
—
|
|
|
—
|
|
|||||
|
Dividends declared
|
$
|
3.35
|
|
$
|
3.83
|
|
|
$
|
0.86
|
|
|
—
|
|
|
—
|
|
|||
35
|
|
As of December 31,
|
||||||||||||||||||
|
2015
|
2014
|
|
2013
|
|
2012
|
|
2011
|
||||||||||||
|
|
(in millions)
|
||||||||||||||||||
|
Cash and cash equivalents
|
$
|
166.2
|
|
$
|
182.3
|
|
$
|
211.8
|
|
$
|
141.2
|
|
$
|
127.0
|
|
||||
|
Total assets
|
946.5
|
|
|
849.5
|
|
|
581.4
|
|
|
287.6
|
|
|
224.9
|
|
|||||
|
Borrowings
(1)
|
200.0
|
|
|
200.0
|
|
|
200.0
|
|
|
290.0
|
|
|
324.8
|
|
|||||
|
Total liabilities
|
829.9
|
|
|
742.0
|
|
|
449.1
|
|
|
603.1
|
|
|
508.8
|
|
|||||
|
Temporary equity-redeemable preferred units
(2)
|
—
|
|
|
—
|
|
|
—
|
|
|
357.2
|
|
|
357.2
|
|
|||||
|
Total equity (deficit)
|
$
|
116.6
|
|
$
|
107.5
|
|
$
|
132.3
|
|
$
|
(672.7
|
)
|
$
|
(641.1
|
)
|
||||
|
(1)
In August 2012, we issued $200 million in unsecured notes and entered into a $100 million five-year revolving credit agreement. We used the proceeds of the notes and $90 million drawn from the revolving credit facility to prepay all of the then-outstanding principal amount of our $400 million term loan. We used a portion of the net proceeds of our IPO to repay all of the $90 million drawn from the revolving credit facility. See “Management’s Discussion and Analysis of Financial Condition and Results of Operations—Liquidity and Capital Resources”.
|
|||||||||||||||||||
|
(2)
Under the terms of Artisan Partners Holdings’ limited partnership agreement in effect prior to the IPO Reorganization, the holders of the preferred units had a right to put such units to the partnership on July 3, 2016 under certain circumstances.
|
|||||||||||||||||||
The following table sets forth certain of our selected operating data as of the dates and for the periods indicated:
|
|
As of and for the Years Ended December 31,
|
||||||||||||||||||
|
|
2015
|
|
2014
|
|
2013
|
|
2012
|
|
2011
|
||||||||||
|
Selected Unaudited Operating Data:
|
(in millions)
|
||||||||||||||||||
|
Assets under management
(1)
|
$
|
99,848
|
|
$
|
107,915
|
|
$
|
105,477
|
|
$
|
74,334
|
|
$
|
57,104
|
|
||||
|
Net client cash flows
(2)
|
(5,848
|
)
|
|
788
|
|
|
7,178
|
|
|
5,813
|
|
|
1,960
|
|
|||||
|
Market appreciation (depreciation)
(3)
|
$
|
(2,219
|
)
|
$
|
1,650
|
|
$
|
23,965
|
|
$
|
11,417
|
|
$
|
(2,315
|
)
|
||||
|
(1)
Reflects the dollar value of assets we managed for our clients in our strategies as of the last day of the period.
|
|||||||||||||||||||
|
(2)
Reflects the dollar value of assets our clients placed with us for management, and withdrew from our management, during the period, excluding appreciation (depreciation) due to market performance and fluctuations in exchange rates.
|
|||||||||||||||||||
|
(3)
Represents the appreciation (depreciation) of the value of our assets under management during the period due to market performance and fluctuations in exchange rates, as well as income, such as dividends, earned on assets under management.
|
|||||||||||||||||||
The following table shows net income, operating income, operating margin and the corresponding adjusted measures for Artisan Partners Asset Management for the periods indicated.
|
|
For the Years Ended December 31,
|
||||||||||||||||||
|
|
2015
|
|
2014
|
|
2013
|
|
2012
|
|
2011
|
||||||||||
|
(dollars in millions)
|
|||||||||||||||||||
|
Net income attributable to Artisan Partners Asset Management Inc. (GAAP)
|
$
|
81.8
|
|
$
|
69.6
|
|
$
|
24.8
|
|
$
|
—
|
|
$
|
—
|
|
||||
|
Adjusted net income (Non-GAAP)
|
$
|
197.3
|
|
$
|
228.9
|
|
$
|
180.3
|
|
$
|
122.4
|
|
$
|
108.4
|
|
||||
|
Operating income (loss) (GAAP)
|
$
|
282.4
|
|
$
|
306.9
|
|
$
|
(261.2
|
)
|
$
|
47.1
|
|
$
|
154.3
|
|
||||
|
Adjusted operating income (Non-GAAP)
|
$
|
324.5
|
|
$
|
371.7
|
|
$
|
288.9
|
|
$
|
202.9
|
|
$
|
188.9
|
|
||||
|
Operating margin (GAAP)
|
35.1
|
%
|
37.0
|
%
|
(38.1
|
)%
|
9.3
|
%
|
33.9
|
%
|
|||||||||
|
Adjusted operating margin (Non-GAAP)
|
40.3
|
%
|
44.9
|
%
|
42.1
|
%
|
40.1
|
%
|
41.5
|
%
|
|||||||||
For a further discussion of our adjusted non-GAAP measures and a reconciliation from GAAP financial measures to non-GAAP measures, including adjusted net income per adjusted share and adjusted EBITDA, see “Management’s Discussion and Analysis of Financial Condition and Results of Operations—Supplemental Non-GAAP Financial Information”.
36
Overview
We are an investment management firm focused on providing high-value added, active investment strategies to sophisticated clients globally. Our operations are conducted through Artisan Partners Holdings and its subsidiaries. We derive essentially all of our revenues from investment management fees. Nearly all our fees are based on a specified percentage of clients’ average assets under our management. We operate our business in a single segment.
We have seven autonomous investment teams that manage a broad range of U.S., non-U.S. and global investment strategies. Strategies are offered through multiple investment vehicles to accommodate a broad range of client mandates.
2015 financial and business highlights included:
|
•
|
The maintenance of an environment and culture in which our investment professionals continued to deliver strong investment performance. At year-end, the 5-year average annual returns of 8 of our 12 investment strategies with 5-year track records exceeded the returns of the applicable benchmark. Six of those strategies beat their benchmark on average by over 450 basis points per year during the 5-year period. Our Global Opportunities and Global Equity strategies, both of which are open to new clients and investors and have realizable capacity, beat their benchmarks by over 600 and 550 basis points, respectively, over the 5-year period.
|
|
•
|
The hiring and on-boarding of our seventh investment team, the Developing World team, and the successful launch of the team’s first strategy, the Artisan Developing World strategy. The Developing World strategy is consistent with our high value added philosophy and reflects our goal of launching new strategies with high degrees of freedom that are not easily replicated with passive products.
|
|
•
|
The successful first full-year for the Artisan High Income strategy, the firm’s first credit strategy. At year-end, the strategy had assets under management of
$988.9 million
.
|
|
•
|
The further expansion of our global distribution efforts, including opening new offices in Australia and Canada. At year-end, $14.2 billion of our total assets under management were from clients domiciled outside the U.S.
|
|
•
|
Executing our variable expense financial model in order to deliver a strong adjusted operating margin of
40.3%
. Our 2015 revenues of $805.5 million and adjusted operating income of $324.5 million are the second highest annual revenues and income in the firm’s history, behind only 2014. We also continued to distribute over 100% of our adjusted earnings to our investors.
|
|
•
|
The successful completion of our March 2015 follow-on offering and the continued evolution of our capital structure.
|
|
•
|
Maintaining and enhancing relationships and communication with clients, employees, investors and potential new investment talent.
|
Organizational Structure
Organizational Structure
On March 12, 2013, Artisan Partners Asset Management Inc. (“APAM”) and the intermediary holding company through which APAM conducts its operations, Artisan Partners Holdings LP (“Holdings”), completed a series of transactions (the “IPO Reorganization”) to reorganize their capital structures in connection with the initial public offering (“IPO”) of APAM’s Class A common stock. The IPO Reorganization and IPO were completed on March 12, 2013. The IPO Reorganization was designed to create a capital structure that preserves our ability to conduct our business through Holdings, while permitting us to raise additional capital and provide access to liquidity through a public company. Refer to
Note 2, “Reorganization and IPO”
to the Consolidated Financial Statements included in Item 8 of this report for further discussion of the IPO and its impact on the consolidated financial statements.
The historical results of operations discussed below are the combined results of APAM and Holdings. Because APAM and Holdings were under common control at the time of the IPO Reorganization, APAM’s acquisition of control of Holdings was accounted for as a transaction among entities under common control. APAM has been allocated a part of Holdings’ net income since March 12, 2013, when it became Holdings’ general partner. Our employees and other limited partners of Holdings held approximately
46%
of the equity interests in Holdings as of
December 31, 2015
. As a result, our post-IPO results reflect that significant noncontrolling interest.
2015 Offering and Unit Exchanges
On March 9, 2015, we completed an offering of 3,831,550 shares of Class A common stock and utilized all of the proceeds to purchase an aggregate of 3,831,550 common units of Holdings from certain of the limited partners of Holdings. In connection with the offering, APAM received 3,831,550 GP units of Holdings.
37
During the year ended December 31, 2015, certain limited partners of Holdings exchanged
826,809
common units (along with a corresponding number of shares of Class B or Class C common stock of APAM) for
826,809
shares of Class A common stock. In connection with the exchanges, APAM received
826,809
GP units of Holdings. The offering and unit exchanges increased APAM’s equity ownership interest in Holdings from 47% at December 31, 2014 to
54%
at December 31, 2015.
Tax Impact of IPO Reorganization and Offerings
In connection with the IPO, we entered into two tax receivable agreements (“TRAs”). The first TRA generally provides for the payment by us to the pre-H&F Merger shareholder of H&F Corp of 85% of the applicable cash savings, if any, of U.S. federal, state and local income taxes that we actually realize (or are deemed to realize in certain circumstances) as a result of (i) the tax attributes of the preferred units acquired by us in the merger of a wholly owned subsidiary of the private equity fund into us in March 2013, (ii) net operating losses available as a result of the merger, and (iii) tax benefits related to imputed interest. The second TRA generally provides for the payment by us to current or former limited partners of Holdings of 85% of the amount of cash savings, if any, of U.S. federal, state and local income taxes that we actually realize (or are deemed to realize in certain circumstances) as a result of (i) certain tax attributes of their partnership units sold to us or exchanged (for shares of Class A common stock, convertible preferred stock or other consideration) and that are created as a result of such sales or exchanges and payments under the TRAs and (ii) tax benefits related to imputed interest. Under both agreements, APAM generally will retain the benefit of the remaining 15% of the applicable tax savings.
Transactions during the year resulted in the following impact to deferred tax assets and amounts payable under the TRAs:
|
Amounts payable under tax receivable agreements
|
Deferred Tax Asset - Amortizable basis
|
|||||
|
(in millions)
|
||||||
|
December 31, 2014
|
$
|
489.2
|
|
$
|
552.0
|
|
|
2015 Follow-On Offering and Exchanges
|
107.7
|
|
126.7
|
|
||
|
Amortization
|
—
|
|
(33.1
|
)
|
||
|
Payments under TRA
|
(20.0
|
)
|
||||
|
Change in estimate
|
12.2
|
|
14.7
|
|
||
|
December 31, 2015
|
$
|
589.1
|
|
$
|
660.3
|
|
38
Financial Overview
Economic Environment
Global equity market conditions can materially affect our financial performance. During 2015, our AUM decreased 7%, 2% of which was due to market depreciation. The following table presents the total returns of relevant market indices for the years ended
December 31, 2015
,
2014
and
2013
:
|
For the Years Ended December 31,
|
||||||||
|
2015
|
2014
|
2013
|
||||||
|
S&P 500 total returns
|
1.4
|
%
|
13.7
|
%
|
32.4
|
%
|
||
|
MSCI All World total returns
|
(2.4
|
)%
|
4.2
|
%
|
22.8
|
%
|
||
|
MSCI EAFE total returns
|
(0.8
|
)%
|
(4.9
|
)%
|
22.8
|
%
|
||
|
Russell Midcap
®
Index total returns
|
(2.4
|
)%
|
13.2
|
%
|
34.8
|
%
|
||
Key Performance Indicators
When we review our performance we consider, among other things, the following:
|
For the Years Ended December 31,
|
|||||||||||
|
2015
|
2014
|
2013
|
|||||||||
|
(unaudited; in millions)
|
|||||||||||
|
Assets under management at period end
|
$
|
99,848
|
|
$
|
107,915
|
|
$
|
105,477
|
|
||
|
Average assets under management
(1)
|
$
|
106,484
|
|
$
|
107,865
|
|
$
|
89,545
|
|
||
|
Net client cash flows
|
$
|
(5,848
|
)
|
$
|
788
|
|
$
|
7,178
|
|
||
|
Total revenues
|
$
|
806
|
|
$
|
829
|
|
$
|
686
|
|
||
|
Weighted average fee
(2)
|
76 bps
|
|
77 bps
|
|
77 bps
|
|
|||||
|
Adjusted operating margin
(3)
|
40.3
|
%
|
44.9
|
%
|
42.1
|
%
|
|||||
|
(1)
We compute average assets under management by averaging day-end assets under management for the applicable period.
|
|||||||||||
|
(2)
We compute our weighted average fee by dividing annualized investment management fees by average assets under management for the applicable period.
|
|||||||||||
|
(3)
Adjusted measures are non-GAAP measures and are explained and reconciled to the comparable GAAP measures in “-Supplemental Non-GAAP Financial Information” below.
|
|||||||||||
Because we earn investment management fees based primarily on the value of the assets we manage across a reporting period, we believe that average assets under management for a period is a better metric for understanding changes in our revenues than period end assets under management.
The weighted average fee represents annualized investment management fees as a percentage of average assets under management for the applicable period. We have historically been disciplined about maintaining our rates of fees. Over time, industry-wide fee pressure could cause us to reduce our fees.
The 2015 decrease in the weighted average fee rate is a result of the shift in the mix of our AUM between our investment strategies and vehicles, primarily the reduction in the proportion of our total assets managed through Artisan Partners Funds.
Assets Under Management and Investment Performance
Changes to our operating results from one period to another are primarily caused by changes in the amount of our assets under management. Changes in the relative composition of our assets under management among our investment strategies and vehicles and the effective fee rates on our products also impact our operating results.
The amount and composition of our assets under management are, and will continue to be, influenced by a variety of factors including, among others:
|
•
|
investment performance, including fluctuations in both the financial markets and foreign currency exchange rates and the quality of our investment decisions;
|
|
•
|
flows of client assets into and out of our various strategies and investment vehicles;
|
|
•
|
our decision to close strategies or limit the growth of assets in a strategy or a vehicle when we believe it is in the best interest of our clients; as well as our decision to re-open strategies, in part or entirely;
|
|
•
|
our ability to attract and retain qualified investment, management, and marketing and client service professionals;
|
|
•
|
industry trends towards products or strategies that we do not offer;
|
39
|
•
|
competitive conditions in the investment management and broader financial services sectors; and
|
|
•
|
investor sentiment and confidence.
|
The table below sets forth changes in our total AUM:
|
For the Years Ended December 31,
|
Period-to-Period
|
|||||||||||||
|
2015
|
2014
|
$
|
%
|
|||||||||||
|
(unaudited; in millions)
|
||||||||||||||
|
Beginning assets under management
|
$
|
107,915
|
|
$
|
105,477
|
|
$
|
2,438
|
|
2.3
|
%
|
|||
|
Gross client cash inflows
|
18,577
|
|
22,953
|
|
(4,376
|
)
|
(19.1
|
)%
|
||||||
|
Gross client cash outflows
|
(24,425
|
)
|
(22,165
|
)
|
(2,260
|
)
|
(10.2
|
)%
|
||||||
|
Net client cash flows
|
(5,848
|
)
|
788
|
|
(6,636
|
)
|
(842.1
|
)%
|
||||||
|
Market appreciation (depreciation)
(1)
|
(2,219
|
)
|
1,650
|
|
(3,869
|
)
|
(234.5
|
)%
|
||||||
|
Ending assets under management
|
$
|
99,848
|
|
$
|
107,915
|
|
$
|
(8,067
|
)
|
(7.5
|
)%
|
|||
|
Average assets under management
|
$
|
106,484
|
|
$
|
107,865
|
|
$
|
(1,381
|
)
|
(1.3
|
)%
|
|||
|
For the Years Ended December 31,
|
Period-to-Period
|
|||||||||||||
|
2014
|
2013
|
$
|
%
|
|||||||||||
|
(unaudited; in millions)
|
||||||||||||||
|
Beginning assets under management
|
$
|
105,477
|
|
$
|
74,334
|
|
$
|
31,143
|
|
41.9
|
%
|
|||
|
Gross client cash inflows
|
22,953
|
|
22,290
|
|
663
|
|
3.0
|
%
|
||||||
|
Gross client cash outflows
|
(22,165
|
)
|
(15,112
|
)
|
(7,053
|
)
|
(46.7
|
)%
|
||||||
|
Net client cash flows
|
788
|
|
7,178
|
|
(6,390
|
)
|
(89.0
|
)%
|
||||||
|
Market appreciation (depreciation)
(1)
|
1,650
|
|
23,965
|
|
(22,315
|
)
|
(93.1
|
)%
|
||||||
|
Ending assets under management
|
$
|
107,915
|
|
$
|
105,477
|
|
$
|
2,438
|
|
2.3
|
%
|
|||
|
Average assets under management
|
$
|
107,865
|
|
$
|
89,545
|
|
$
|
18,320
|
|
20.5
|
%
|
|||
|
(1)
Includes the impact of translating the value of assets under management denominated in non-USD currencies into U.S. dollars. The impact was immaterial for the periods presented.
|
||||||||||||||
Net client cash flows for the
years ended December 31, 2015
and 2014
included net outflows of approximately $616 million and $635 million, respectively, from Artisan Partners Funds annual income and capital gains distributions, net of reinvestments.
We believe that growth in AUM in an investment strategy requires the availability of attractive investment opportunities relative to the amount of AUM in the strategy at a time when the strategy has a competitive performance track record and there is stable or growing client demand for the strategy or asset class. When we believe that each of these factors is present with respect to an investment strategy, we say we have “realizable capacity” in that strategy. We discuss realizable capacity in general, rather than discussing the capacity of our strategies in precise dollar amounts, because capacity is affected by a number of factors, evolves over time, and is subject to change.
We are confident that we have sufficient realizable capacity to continue to thoughtfully grow. In particular, we believe that we currently have realizable capacity in our Global Opportunities and Global Equity strategies, where we believe we are well-positioned to take advantage of client and investor demand.
During 2015, the Global Opportunities strategy had net inflows of
$2.0 billion
and the Global Equity strategy had net inflows of
$101 million
. While our past inflow experience does not guarantee future activity, if these strategies continue to perform well relative to their benchmarks and global strategies remain in demand, we expect that they will continue to gather assets.
Additionally, our High Income strategy, which we launched in March 2014, has performed well relative to its benchmark since its inception and generated net inflows of
$429 million
during 2015, despite having a short-term track record. We also saw strong interest in our Developing World strategy during the year, which launched at the end of June 2015 and has generated net inflows of $380 million since that time.
During 2015, our Non-U.S. Growth strategy, managed by our Global Equity team, had
$2.0 billion
of net inflows. On February 2, 2016 the Non-U.S. Growth strategy closed to most new retail and intermediary investors. On October 1, 2016, we will further close the Non-U.S. Growth strategy to most new institutional investors and employee benefit plans. We expect that the closing on October 1, 2016 will have some impact on the strategy’s net flows prior to that date, though we cannot estimate the impact with any certainty because of the many factors involved.
40
Across the firm, we experienced total net
outflows
of
$5.8 billion
during 2015. The strategies managed by our U.S. Value team experienced total net outflows of
$6.5 billion
during the year. If the U.S. Value team’s strategies continue to underperform their benchmarks and client trends continue, we expect the team’s strategies will continue to experience net outflows. In addition, in late February 2016 we announced that we plan to cease managing assets in the U.S. Small-Cap Value strategy. In connection with that decision, the board of directors of Artisan Funds approved a plan to reorganize Artisan Small Cap Value Fund into Artisan Mid Cap Value Fund. The reorganization is expected to close in the second quarter of 2016. We plan to work with separate account clients on the transition or liquidation options available for their accounts.
Our Global Value strategy experienced
$1.1 billion
of net outflows during 2015. We re-opened the Global Value strategy across pooled vehicles on October 1, 2015. The strategy remains closed to most new separate account clients. We cannot estimate the impact of the re-opening on net flows with any certainty because of the many factors involved.
In late February 2016, a client of our Emerging Markets strategy communicated its intent to terminate its account with us during the second quarter of 2016. The client’s account represents approximately one-half of the assets under management in the Emerging Markets strategy as of the date of this filing.
We monitor the availability of attractive investment opportunities relative to the amount of assets we manage in each of our investment strategies. When appropriate, we will close a strategy to new investors or otherwise take action to slow or restrict its growth, even though our aggregate AUM may be negatively impacted in the short term. We may also re-open a strategy, widely or selectively, to fill available capacity or manage the diversification of our client base in that strategy. We believe that management of our investment capacity protects our ability to manage assets successfully, which protects the interests of our clients and, in the long term, protects our ability to retain client assets and maintain our profit margins.
As of the date of this filing, our Non-U.S. Small-Cap Growth, Non-U.S. Value, U.S. Mid-Cap Growth, U.S. Small-Cap Value, U.S. Mid-Cap Value and U.S. Small-Cap Growth strategies are closed to most new investors and client relationships. As discussed above, our Non-U.S. Growth strategy is closed to most new retail and intermediary investors and, on October 1, 2016, we will further close the strategy to most new institutional investors and employee benefit plans.
When we close a strategy, we typically continue to allow additional investments in the strategy by existing clients and certain related entities, which means that during a given period we could have net client cash inflows even in a closed strategy. However, when a strategy is closed or its growth is restricted we expect there to be periods of net client cash outflows.
We measure the results of our “composites”, which represent the aggregate performance of all discretionary client accounts, including mutual funds, invested in the same strategy except those accounts with respect to which we believe client-imposed investment restrictions may have a material impact on portfolio construction and those accounts managed in a currency other than U.S. dollars.
The table below sets forth the total AUM for each of our investment teams and strategies as of
December 31, 2015
, the inception date for each investment composite, and the average annual total returns for each composite and its respective broad-based benchmark (and style benchmark, if applicable) over a multi-horizon time period as of
December 31, 2015
. Returns for periods of less than one year are not annualized.
41
|
Inception
|
Strategy AUM
|
Average Annual Total Returns (Gross)
|
Average Annual Value-Added
1
Since Inception (bps)
|
|||||||||
|
Investment Team and Strategy
|
Date
|
(in $MM)
|
1 YR
|
3 YR
|
5 YR
|
10 YR
|
Inception
|
|||||
|
Global Equity Team
|
||||||||||||
|
Non-U.S. Growth Strategy
|
1/1/1996
|
30,187
|
|
(2.83)%
|
7.70%
|
8.13%
|
6.37%
|
10.60%
|
618
|
|||
|
MSCI EAFE Index
|
(0.81)%
|
5.01%
|
3.60%
|
3.03%
|
4.42%
|
|||||||
|
Non-U.S. Small-Cap Growth Strategy
|
1/1/2002
|
1,323
|
|
12.63%
|
9.94%
|
9.24%
|
9.39%
|
14.54%
|
448
|
|||
|
MSCI EAFE Small Cap Index
|
9.59%
|
10.44%
|
6.32%
|
4.55%
|
10.06%
|
|||||||
|
Global Equity Strategy
|
4/1/2010
|
786
|
|
2.18%
|
11.91%
|
11.65%
|
N/A
|
12.44%
|
554
|
|||
|
MSCI All Country World Index
|
(2.36)%
|
7.69%
|
6.08%
|
N/A
|
6.90%
|
|||||||
|
Global Small-Cap Equity Strategy
|
7/1/2013
|
138
|
|
7.72%
|
N/A
|
N/A
|
N/A
|
6.37%
|
(88)
|
|||
|
MSCI All Country World Small Cap Index
|
(1.04)%
|
N/A
|
N/A
|
N/A
|
7.25%
|
|||||||
|
U.S. Value Team
|
||||||||||||
|
U.S. Mid-Cap Value Strategy
|
4/1/1999
|
7,959
|
|
(8.77)%
|
8.80%
|
9.34%
|
8.32%
|
12.92%
|
404
|
|||
|
Russell
®
Midcap Index
|
(2.44)%
|
14.18%
|
11.43%
|
7.99%
|
8.88%
|
|||||||
|
Russell
®
Midcap Value Index
|
(4.78)%
|
13.40%
|
11.24%
|
7.60%
|
9.46%
|
|||||||
|
U.S. Small-Cap Value Strategy
|
6/1/1997
|
854
|
|
(11.24)%
|
2.32%
|
2.47%
|
5.34%
|
10.60%
|
315
|
|||
|
Russell
®
2000 Index
|
(4.41)%
|
11.65%
|
9.18%
|
6.80%
|
7.45%
|
|||||||
|
Russell
®
2000 Value Index
|
(7.47)%
|
9.06%
|
7.67%
|
5.57%
|
8.34%
|
|||||||
|
Value Equity Strategy
|
7/1/2005
|
1,556
|
|
(8.30)%
|
7.20%
|
8.52%
|
5.96%
|
6.45%
|
(119)
|
|||
|
Russell
®
1000 Index
|
0.92%
|
15.01%
|
12.44%
|
7.40%
|
7.64%
|
|||||||
|
Russell
®
1000 Value Index
|
(3.83)%
|
13.08%
|
11.27%
|
6.15%
|
6.36%
|
|||||||
|
Growth Team
|
||||||||||||
|
U.S. Mid-Cap Growth Strategy
|
4/1/1997
|
15,103
|
|
3.44%
|
15.44%
|
13.03%
|
11.11%
|
15.55%
|
560
|
|||
|
Russell
®
Midcap Index
|
(2.44)%
|
14.18%
|
11.43%
|
7.99%
|
9.96%
|
|||||||
|
Russell
®
Midcap Growth Index
|
(0.20)%
|
14.88%
|
11.53%
|
8.16%
|
8.59%
|
|||||||
|
U.S. Small-Cap Growth Strategy
|
4/1/1995
|
2,270
|
|
1.61%
|
13.85%
|
13.76%
|
8.18%
|
9.94%
|
115
|
|||
|
Russell
®
2000 Index
|
(4.41)%
|
11.65%
|
9.18%
|
6.80%
|
8.79%
|
|||||||
|
Russell
®
2000 Growth Index
|
(1.38)%
|
14.28%
|
10.67%
|
7.95%
|
7.18%
|
|||||||
|
Global Opportunities Strategy
|
2/1/2007
|
7,556
|
|
9.12%
|
12.61%
|
12.11%
|
N/A
|
9.42%
|
641
|
|||
|
MSCI All Country World Index
|
(2.36)%
|
7.69%
|
6.08%
|
N/A
|
3.01%
|
|||||||
|
Global Value Team
|
||||||||||||
|
Non-U.S. Value Strategy
|
7/1/2002
|
16,257
|
|
(0.64)%
|
9.96%
|
9.09%
|
9.25%
|
12.67%
|
673
|
|||
|
MSCI EAFE Index
|
(0.81)%
|
5.01%
|
3.60%
|
3.03%
|
5.93%
|
|||||||
|
Global Value Strategy
|
7/1/2007
|
13,925
|
|
(1.83)%
|
11.70%
|
11.66%
|
N/A
|
7.64%
|
550
|
|||
|
MSCI All Country World Index
|
(2.36)%
|
7.69%
|
6.08%
|
N/A
|
2.14%
|
|||||||
|
Emerging Markets Team
|
||||||||||||
|
Emerging Markets Strategy
|
7/1/2006
|
571
|
|
(10.95)%
|
(5.56)%
|
(6.26)%
|
N/A
|
2.82%
|
(23)
|
|||
|
MSCI Emerging Markets Index
|
(14.92)%
|
(6.76)%
|
(4.80)%
|
N/A
|
3.05%
|
|||||||
|
Credit Team
|
||||||||||||
|
High Income Strategy
2
|
4/1/2014
|
989
|
|
2.02%
|
N/A
|
N/A
|
N/A
|
2.59%
|
553
|
|||
|
BofA Merrill Lynch High Yield Master II Index
|
(4.64)%
|
N/A
|
N/A
|
N/A
|
(2.94)%
|
|||||||
|
Developing World Team
|
||||||||||||
|
Developing World Strategy
|
7/1/2015
|
374
|
|
N/A
|
N/A
|
N/A
|
N/A
|
(11.75)%
|
560
|
|||
|
MSCI Emerging Markets Index
|
N/A
|
N/A
|
N/A
|
N/A
|
(17.35)%
|
|||||||
|
Total Assets Under Management
|
99,848
|
|
||||||||||
|
(1)
Value-added is the amount in basis points by which the average annual gross composite return of each of our strategies has outperformed the broad-based market index most commonly used by our clients to compare the performance of the relevant strategy. Value-added for periods less than one year is not annualized.
|
||||||||||||
|
(2)
The Artisan High Income strategy may hold loans and other security types, including securities with lower credit ratings, that may not be included in the BofA Merrill Lynch High Yield Master II Index. At times, this does cause material differences in relative performance.
|
||||||||||||
42
The tables below set forth changes in our AUM by investment team:
|
By Investment Team
|
||||||||||||||||||||||||
|
Year Ended
|
Global Equity
|
U.S. Value
|
Growth
|
Global Value
|
Emerging Markets
|
Credit
|
Developing World
|
Total
|
||||||||||||||||
|
December 31, 2015
|
(unaudited; in millions)
|
|||||||||||||||||||||||
|
Beginning assets under management
|
$
|
31,452
|
|
$
|
18,112
|
|
$
|
24,499
|
|
$
|
32,481
|
|
$
|
806
|
|
$
|
565
|
|
$
|
—
|
|
$
|
107,915
|
|
|
Gross client cash inflows
|
7,697
|
|
2,117
|
|
4,809
|
|
2,760
|
|
42
|
|
764
|
|
388
|
|
18,577
|
|
||||||||
|
Gross client cash outflows
|
(5,630
|
)
|
(8,574
|
)
|
(5,294
|
)
|
(4,379
|
)
|
(205
|
)
|
(335
|
)
|
(8
|
)
|
(24,425
|
)
|
||||||||
|
Net client cash flows
|
2,067
|
|
(6,457
|
)
|
(485
|
)
|
(1,619
|
)
|
(163
|
)
|
429
|
|
380
|
|
(5,848
|
)
|
||||||||
|
Market appreciation (depreciation)
|
(1,085
|
)
|
(1,286
|
)
|
915
|
|
(680
|
)
|
(72
|
)
|
(5
|
)
|
(6
|
)
|
(2,219
|
)
|
||||||||
|
Net transfers
(1)
|
—
|
|
—
|
|
—
|
|
—
|
|
—
|
|
—
|
|
—
|
|
—
|
|
||||||||
|
Ending assets under management
|
$
|
32,434
|
|
$
|
10,369
|
|
$
|
24,929
|
|
$
|
30,182
|
|
$
|
571
|
|
$
|
989
|
|
$
|
374
|
|
$
|
99,848
|
|
|
Average assets under management
(2)
|
$
|
33,262
|
|
$
|
14,511
|
|
$
|
25,204
|
|
$
|
32,015
|
|
$
|
641
|
|
$
|
775
|
|
$
|
153
|
|
$
|
106,484
|
|
|
December 31, 2014
|
||||||||||||||||||||||||
|
Beginning assets under management
|
$
|
27,317
|
|
$
|
23,024
|
|
$
|
22,433
|
|
$
|
30,957
|
|
$
|
1,746
|
|
$
|
—
|
|
$
|
—
|
|
$
|
105,477
|
|
|
Gross client cash inflows
|
9,185
|
|
3,003
|
|
5,912
|
|
4,177
|
|
21
|
|
655
|
|
—
|
|
22,953
|
|
||||||||
|
Gross client cash outflows
|
(4,908
|
)
|
(8,013
|
)
|
(4,883
|
)
|
(3,351
|
)
|
(917
|
)
|
(93
|
)
|
—
|
|
(22,165
|
)
|
||||||||
|
Net client cash flows
|
4,277
|
|
(5,010
|
)
|
1,029
|
|
826
|
|
(896
|
)
|
562
|
|
—
|
|
788
|
|
||||||||
|
Market appreciation (depreciation)
|
(142
|
)
|
98
|
|
990
|
|
745
|
|
(44
|
)
|
3
|
|
—
|
|
1,650
|
|
||||||||
|
Net transfers
(1)
|
—
|
|
—
|
|
47
|
|
(47
|
)
|
—
|
|
—
|
|
—
|
|
—
|
|
||||||||
|
Ending assets under management
|
$
|
31,452
|
|
$
|
18,112
|
|
$
|
24,499
|
|
$
|
32,481
|
|
$
|
806
|
|
$
|
565
|
|
$
|
—
|
|
107,915
|
|
|
|
Average assets under management
(3)
|
$
|
29,817
|
|
$
|
20,881
|
|
$
|
23,201
|
|
$
|
32,467
|
|
$
|
1,199
|
|
$
|
381
|
|
$
|
—
|
|
$
|
107,865
|
|
|
December 31, 2013
|
||||||||||||||||||||||||
|
Beginning assets under management
|
$
|
20,092
|
|
$
|
16,722
|
|
$
|
14,692
|
|
$
|
19,886
|
|
$
|
2,942
|
|
$
|
—
|
|
$
|
—
|
|
$
|
74,334
|
|
|
Gross client cash inflows
|
5,572
|
|
4,815
|
|
5,090
|
|
6,387
|
|
426
|
|
—
|
|
—
|
|
22,290
|
|
||||||||
|
Gross client cash outflows
|
(3,912
|
)
|
(4,098
|
)
|
(3,140
|
)
|
(2,391
|
)
|
(1,571
|
)
|
—
|
|
—
|
|
(15,112
|
)
|
||||||||
|
Net client cash flows
|
1,660
|
|
717
|
|
1,950
|
|
3,996
|
|
(1,145
|
)
|
—
|
|
—
|
|
7,178
|
|
||||||||
|
Market appreciation (depreciation)
|
5,565
|
|
5,585
|
|
5,861
|
|
7,005
|
|
(51
|
)
|
—
|
|
—
|
|
23,965
|
|
||||||||
|
Net transfers
(1)
|
—
|
|
—
|
|
(70
|
)
|
70
|
|
—
|
|
—
|
|
—
|
|
—
|
|
||||||||
|
Ending assets under management
|
$
|
27,317
|
|
$
|
23,024
|
|
$
|
22,433
|
|
$
|
30,957
|
|
$
|
1,746
|
|
$
|
—
|
|
$
|
—
|
|
$
|
105,477
|
|
|
Average assets under management
|
$
|
23,402
|
|
$
|
20,142
|
|
$
|
18,687
|
|
$
|
25,554
|
|
$
|
1,760
|
|
$
|
—
|
|
$
|
—
|
|
89,545
|
|
|
|
(1)
Net transfers represent certain amounts that we have identified as having been transferred out of one investment strategy, investment vehicle, or account and into another strategy, vehicle, or account.
|
||||||||||||||||||||||||
|
(2)
For the Developing World team, average assets under management is for the period between June 29, 2015, when the team’s investment strategy began operations, and December 31, 2015.
|
||||||||||||||||||||||||
|
(3)
For the Credit team, average assets under management is for the period between March 19, 2014, when the team’s investment strategy began operations, and December 31, 2014.
|
||||||||||||||||||||||||
43
The goal of our marketing, distribution and client services efforts is to establish and maintain a client base that is diversified by investment strategy, investment vehicle and distribution channel. As distribution channels have evolved to have more institutional-like decision making processes and longer-term investment horizons, we have expanded our distribution efforts into those areas. The table below sets forth our AUM by distribution channel:
|
As of December 31, 2015
|
As of December 31, 2014
|
As of December 31, 2013
|
||||||||||||||||||
|
$ in millions
|
% of total
|
$ in millions
|
% of total
|
$ in millions
|
% of total
|
|||||||||||||||
|
(unaudited)
|
||||||||||||||||||||
|
Institutional
|
$
|
64,352
|
|
64.5
|
%
|
$
|
68,153
|
|
63.2
|
%
|
$
|
66,987
|
|
63.5
|
%
|
|||||
|
Intermediary
|
30,161
|
|
30.2
|
%
|
33,894
|
|
31.4
|
%
|
32,530
|
|
30.8
|
%
|
||||||||
|
Retail
|
5,335
|
|
5.3
|
%
|
5,868
|
|
5.4
|
%
|
5,960
|
|
5.7
|
%
|
||||||||
|
Ending Assets Under Management
(1)
|
$
|
99,848
|
|
100.0
|
%
|
$
|
107,915
|
|
100.0
|
%
|
$
|
105,477
|
|
100.0
|
%
|
|||||
|
(1)
The allocation of AUM by distribution channel involves the use of estimates and the exercise of judgment.
|
||||||||||||||||||||
The following tables set forth the changes in our AUM for Artisan Funds, Artisan Global Funds and separate accounts:
|
Year Ended
|
Artisan Funds & Artisan Global Funds
|
Separate Accounts
|
Total
|
||||||||
|
December 31, 2015
|
(unaudited; in millions)
|
||||||||||
|
Beginning assets under management
|
$
|
60,257
|
|
$
|
47,658
|
|
$
|
107,915
|
|
||
|
Gross client cash inflows
|
13,942
|
|
4,635
|
|
18,577
|
|
|||||
|
Gross client cash outflows
|
(18,864
|
)
|
(5,561
|
)
|
(24,425
|
)
|
|||||
|
Net client cash flows
|
(4,922
|
)
|
(926
|
)
|
(5,848
|
)
|
|||||
|
Market appreciation (depreciation)
|
(1,494
|
)
|
(725
|
)
|
(2,219
|
)
|
|||||
|
Net transfers
(1)
|
(315
|
)
|
315
|
|
—
|
|
|||||
|
Ending assets under management
|
$
|
53,526
|
|
$
|
46,322
|
|
$
|
99,848
|
|
||
|
Average assets under management
|
$
|
58,671
|
|
$
|
47,813
|
|
$
|
106,484
|
|
||
|
December 31, 2014
|
|||||||||||
|
Beginning assets under management
|
$
|
59,881
|
|
$
|
45,596
|
|
$
|
105,477
|
|
||
|
Gross client cash inflows
|
15,800
|
|
7,153
|
|
22,953
|
|
|||||
|
Gross client cash outflows
|
(15,365
|
)
|
(6,800
|
)
|
(22,165
|
)
|
|||||
|
Net client cash flows
|
435
|
|
353
|
|
788
|
|
|||||
|
Market appreciation (depreciation)
|
573
|
|
1,077
|
|
1,650
|
|
|||||
|
Net transfers
(1)
|
(632
|
)
|
632
|
|
—
|
|
|||||
|
Ending assets under management
|
$
|
60,257
|
|
$
|
47,658
|
|
$
|
107,915
|
|
||
|
Average assets under management
|
$
|
61,819
|
|
$
|
46,046
|
|
$
|
107,865
|
|
||
|
December 31, 2013
|
|||||||||||
|
Beginning assets under management
|
$
|
39,603
|
|
$
|
34,731
|
|
$
|
74,334
|
|
||
|
Gross client cash inflows
|
16,943
|
|
5,347
|
|
22,290
|
|
|||||
|
Gross client cash outflows
|
(9,814
|
)
|
(5,298
|
)
|
(15,112
|
)
|
|||||
|
Net client cash flows
|
7,129
|
|
49
|
|
7,178
|
|
|||||
|
Market appreciation (depreciation)
|
13,210
|
|
10,755
|
|
23,965
|
|
|||||
|
Net transfers
(1)
|
(61
|
)
|
61
|
|
—
|
|
|||||
|
Ending assets under management
|
$
|
59,881
|
|
$
|
45,596
|
|
$
|
105,477
|
|
||
|
Average assets under management
|
$
|
49,756
|
|
$
|
39,789
|
|
$
|
89,545
|
|
||
|
(1)
Net transfers represent certain amounts that we have identified as having been transferred out of one investment strategy, investment vehicle, or account and into another strategy, vehicle, or account.
|
|||||||||||
44
Artisan Funds and Artisan Global Funds
As of
December 31, 2015
, Artisan Funds comprised
$51.7 billion
, or
52%
, of our assets under management. For the year ended
December 31, 2015
, fees from Artisan Funds represented
$528.1 million
, or
65%
, of our revenues. Our tiered fee rates for the series of Artisan Funds range from 0.63% to 1.25% of fund assets, depending on the strategy, the amount invested and other factors.
As of
December 31, 2015
, Artisan Global Funds comprised
$1.8 billion
, or
2%
, of our assets under management. In UCITS funds, it is permissible and in some circumstances customary for a portion of the management fee to be rebated to investors with accounts of a certain type or asset size to encourage investment at an early stage or for other reasons or for a portion of the management fee to be paid to intermediaries for distribution services. We have entered into such rebate and distribution arrangements, and will continue to do so, in circumstances we consider appropriate. Our fee rates for Artisan Global Funds range from 0.75% to 1.80% of assets under management. For the year ended
December 31, 2015
, fees from Artisan Global Funds represented
$15.2 million
, or
2%
, of our revenues.
The weighted average rate of fee paid by our Artisan Fund and Artisan Global Funds clients in the aggregate was
0.93
% for the years ended
December 31, 2015
,
2014
and
2013
.
Separate Accounts
Separate accounts comprised
$46.3 billion
, or
46%
, of our assets under management as of
December 31, 2015
. For the year ended
December 31, 2015
, fees from separate accounts represented
$262.2 million
, or
33%
, of our revenues.
For separate account clients, we generally impose standard fee schedules that vary by investment strategy and, through the application of standard breakpoints, reflect the size of the account and client relationship, with tiered rates of fee currently ranging from 0.40% of assets under management to 1.05% of assets under management. There are a number of exceptions to our standard fee schedules, including exceptions based on the nature of our relationship with the client and the value of the assets under our management in that relationship. In general, our effective rate of fee for a particular client relationship declines as the assets we manage for that client increase, which we believe is typical for the asset management industry.
The weighted average rate of fee paid by our separate account clients in the aggregate was
0.55
% for the years ended
December 31, 2015
and
2014
and
0.56
% for the year ended December 31,
2013
. Because, as is typical in the asset management industry, our rates of fee decline as the assets under our management in a relationship increase, and because of differences in our fees by investment strategy, a change in the composition of our assets under management, in particular a shift to strategies, clients or relationships with lower effective rates of fees, could have a material impact on our overall weighted average rate of fee. See “—Qualitative and Quantitative Disclosures Regarding Market Risk—Market Risk” for a sensitivity analysis that demonstrates the impact that certain changes in the composition of our assets under management could have on our revenues.
Revenues
Essentially all of our revenues consist of investment management fees earned from managing clients’ assets. Our investment management fees fluctuate based on a number of factors, including the total value of our AUM, the composition of AUM among our investment vehicles (including pooled vehicles available to U.S. investors, pooled vehicles available to non-U.S. investors and separate accounts) and our investment strategies (which have different fee rates), changes in the investment management fee rates on our products, the extent to which we enter into fee arrangements that differ from our standard fee schedules, which can be affected by custom and the competitive landscape in the relevant market, and, for the few accounts on which we earn performance-based fees, the investment performance of those accounts relative to their designated benchmarks.
The different fee structures associated with Artisan Funds, Artisan Global Funds and separate accounts and the different fee schedules of our investment strategies make the composition of our assets under management an important determinant of the investment management fees we earn. Historically, we have received higher effective rates of investment management fees from Artisan Funds and Artisan Global Funds than from our separate accounts, reflecting, among other things, the different array of services we provide to Artisan Funds and Artisan Global Funds. Investment management fees for non-U.S. funds may also be higher because they include fees to offset higher distribution costs. Our investment management fees also differ by investment strategy, with higher-capacity strategies having lower standard fee schedules than strategies with more limited capacity.
A small number of our separate account clients pay us fees according to the performance of their accounts relative to certain agreed-upon benchmarks, which typically results in a lower base fee, but allows us to earn higher fees if the performance we achieve for that client is superior to the performance of an agreed-upon benchmark.
45
The following table sets forth revenues we earned under our investment management agreements with Artisan Funds and Artisan Global Funds and on the separate accounts that we managed as well as average assets under management for the years ended
December 31, 2015
,
2014
and
2013
:
|
For the Years Ended December 31,
|
|||||||||||
|
2015
|
2014
|
2013
|
|||||||||
|
(in millions)
|
|||||||||||
|
Revenues
|
|||||||||||
|
Management fees
|
|||||||||||
|
Artisan Funds & Artisan Global Funds
|
$
|
543.3
|
|
$
|
575.4
|
|
$
|
464.3
|
|
||
|
Separate accounts
|
260.4
|
|
252.3
|
|
219.0
|
|
|||||
|
Performance fees
|
1.8
|
|
1.0
|
|
2.5
|
|
|||||
|
Total revenues
|
$
|
805.5
|
|
$
|
828.7
|
|
$
|
685.8
|
|
||
|
Average assets under management for period
|
$
|
106,484
|
|
$
|
107,865
|
|
$
|
89,545
|
|
||
For the years ended
December 31, 2015
,
2014
and
2013
, approximately 90%, 91% and 91%, respectively, of our investment management fees were earned from clients located in the United States.
Operating Expenses
Our operating expenses consist primarily of compensation and benefits, distribution and marketing, occupancy, communication and technology, and general and administrative.
Our expenses may fluctuate due to a number of factors, including the following:
|
•
|
variations in the level of total compensation expense due to, among other things, incentive compensation, equity awards, changes in our employee count and product mix and competitive factors; and
|
|
•
|
expenses, such as distribution fees, rent, professional service fees and data-related costs, incurred, as necessary, to operate our business.
|
Our largest operating expenses are compensation and benefits and distribution and marketing expenses. A significant portion of our operating expenses are variable and fluctuate in direct relation to our assets under management and revenues. Even if we experience declining revenues, we expect to continue to make the expenditures necessary for us to manage our business. As a result, our profits may decline.
Compensation and Benefits
Compensation and benefits includes (i) salaries, incentive compensation and benefits costs, (ii) compensation expense related to post-IPO equity awards granted to employees and (iii) pre-offering related compensation, which consists of distributions of profits to Class B partners, redemptions of Class B common units, changes in the value of Class B liability awards and amortization expense on Class B awards.
Incentive compensation is one of the most significant parts of the total compensation of our senior employees. The aggregate amount of cash incentive compensation paid to members of our portfolio management teams and senior members of our marketing and client service teams is based on formulas that are tied directly to revenues, which for each of our portfolio management teams represents approximately 25% of the revenues generated by assets under management in the team’s strategy or strategies. Incentive compensation paid to other employees is discretionary and subjectively determined based on individual performance and our overall results during the applicable year.
Certain compensation and benefits are seasonal expenses, such as employer funded retirement and health care contributions and payroll taxes. Historically these costs have added approximately $3 million to $4 million to our costs in the first quarter of each calendar year.
We grant equity awards to our employees pursuant to the Artisan Partners Asset Management Inc. 2013 Omnibus Incentive Compensation Plan. The awards generally vest on a pro rata basis over 5 years. Certain awards will vest upon a combination of both (1) pro-rata annual time vesting over 5 years and (2) qualifying retirement (as defined in the award agreements).
Compensation expense related to the equity awards is recognized based on the estimated grant date fair value, for only those awards expected to vest, on a straight-line basis over the requisite service period of the award. The initial requisite service period is generally five years for all awards that have been granted to date.
Our board of directors approved the grant of
642,950
and
1,102,660
restricted share based awards to certain of our employees in 2015 and January 2016, respectively. A portion of the awards granted in each year are standard restricted shares and will vest pro-rata over the five years following the date of grant. The remaining awards are career awards and will vest only upon a qualifying retirement (as defined in the award agreements).
46
Total compensation expense, which will be recognized on a straight-line basis over the requisite service period, is expected to be approximately $30.5 million and approximately
$33.6 million
, for the 2015 and 2016 awards, respectively. Including these awards, we expect the 2016 quarterly expense related to post-IPO equity compensation to be approximately $11 million.
Since the IPO, our board of directors has approved the grant of 4,765,725 restricted share based awards. The unrecognized compensation expense for these awards as of
December 31, 2015
was $154 million. We expect to continue to make equity grants each year. The amount of equity granted will vary from year to year and will be influenced by our results. From time to time, we may make individual equity grants to people we hire.
A significant portion of our historical compensation and benefits expense related to Holdings’ Class B limited partnership interests. Prior to the IPO Reorganization, Class B limited partnership interests were granted to certain employees. The Class B limited partnership interests provided both an interest in future profits of Holdings as well as an interest in the overall value of Holdings. Class B limited partnership interests generally vested ratably over a five-year period from the date of grant. Holders of Class B limited partnership interests were entitled to fully participate in profits from and after the date of grant. The distribution of profits associated with these limited partnership interests was recorded as compensation expense.
Prior to the IPO Reorganization, all vested Class B limited partnership interests were subject to mandatory redemption on termination of employment for any reason, with payment in cash in annual installments over the five years following termination of employment. Unvested Class B limited partnership interests were forfeited on termination of employment. Under the Class B grant agreements, the redemption value of Class B limited partnership interests varied depending on the circumstances of the partner’s termination but was based on the fair market value of the firm determined by the general partner.
Due to the redemption feature, the grants of Class B limited partnership interests were considered liability awards, with changes in fair value recorded as compensation expense. Fair value was calculated using a combination of an income approach and a market approach. The use of these valuation approaches to derive the fair value of the liability at a point in time resulted in volatility to the financial statements as our current and projected financial results, and the results and earnings multiples of comparable entities, change over time.
As part of the IPO Reorganization, Class B grant agreements were amended to eliminate the cash redemption feature. As a result, liability award accounting no longer applied and the costs associated with distributions to our Class B partners and changes in the value of Class B liability awards were no longer recognized as a compensation expense. Compensation expense for these awards following the IPO Reorganization represents the amortization of the fair value of unvested awards on the date of the IPO Reorganization over the remaining vesting period. All remaining unvested Class B awards will be fully vested on July 1, 2017.
Also as a result of the IPO Reorganization in 2013, we recognized a $287.3 million non-recurring compensation expense based on the difference between the carrying value of the liability associated with the vested Class B common units immediately prior to the IPO Reorganization and the value based on the offering price per share of Class A common stock ($30.00 per share)
.
We also recognized $56.8 million of compensation expense relating to a cash incentive compensation payment we made to certain of our portfolio managers in connection with the IPO and $20.5 million
of compensation expense associated with the reallocation of profits after the IPO which otherwise would have been allocable and distributable to Holdings’ pre-IPO non-employee partners but were instead allocated to certain of Artisan Partners Holdings’ employee-partners.
Distribution and Marketing
Distribution and marketing expenses primarily represent payments we make to broker-dealers, financial advisors, defined contribution plan providers, mutual fund supermarkets and other intermediaries for selling, servicing and administering accounts invested in shares of Artisan Funds. Artisan Funds authorizes intermediaries to accept purchase, exchange, and redemption orders for shares of Artisan Funds on behalf of Artisan Funds. Many intermediaries charge a fee for those services. Artisan Funds pays a portion of such fees, which are intended to compensate the intermediary for its provision of services of the type that would be provided by Artisan Funds’ transfer agent or other service providers if the shares were registered directly on the books of Artisan Funds’ transfer agent. Like the investment management fees we earn as adviser to Artisan Funds, distribution fees typically vary with the value of the assets invested in shares of Artisan Funds. The allocation of such fees between us and Artisan Funds is determined by the board of Artisan Funds, based on information and a recommendation from us, with the goal of allocating to us all costs attributable to the marketing and distribution of shares of Artisan Funds. A significant portion of Artisan Funds’ shares are held by investors through intermediaries to which we pay distribution and marketing expenses, which is consistent with an industry-wide shift from direct retail sales of mutual fund shares to sales through intermediaries that provide advice, administrative convenience or both.
Total distribution fees will likely increase as we increase our assets under management sourced through intermediaries that charge these fees. In contrast to some mutual funds, investors in Artisan Funds pay no 12b-1 fees, which are fees charged to investors to pay for marketing, advertising and distribution services.
Occupancy
Occupancy expenses include operating leases for facilities, furniture and office equipment, miscellaneous facility related costs and depreciation expense associated with furniture purchases and leasehold improvements.
47
Communication and technology
Communication and technology expenses include information and print subscriptions, telephone costs, information systems consulting fees, equipment and software maintenance expenses, operating leases for information technology equipment and depreciation and amortization expenses associated with computer hardware and software. Information and print subscriptions represent the costs we pay to obtain investment research and other data we need to operate our business, and such expenses generally increase or decrease in relative proportion to the number of our employees and the overall size and scale of our business operations. We expect to continue our measured investments in technology to support our investment teams, distribution efforts, and scalable operations, bringing our expected annual communications and technology expense to between approximately $25 million to $30 million.
On behalf of our mutual fund and separate account clients, we make decisions to buy and sell securities for each portfolio, select broker-dealers to execute trades and negotiate brokerage commission rates. In connection with these transactions, we may receive research products and services from broker-dealers in exchange for the business we conduct with such firms. Some of those research products and services could be acquired for cash and our receipt of those products and services through the use of client commissions, or soft dollars, reduces cash expenses we would otherwise incur. Our operating expenses will increase to the extent these soft dollars are reduced or eliminated. We believe that all research products and services we acquire through soft dollars are within the safe harbor provided by Section 28(e) of the Exchange Act.
General and Administrative
General and administrative expenses include professional fees, travel and entertainment, state and local taxes, directors’ and officers’ liability insurance, director fees, and other miscellaneous expenses we incur in operating our business.
Non-Operating Income (Loss)
Interest Expense
Interest expense primarily relates to the interest we pay on our debt. In August 2012, we issued $200 million in fixed interest rate senior unsecured notes and entered into a
$100 million
five
-year revolving credit agreement. The proceeds were used to repay the entire outstanding principal of an existing term loan. The revolving credit facility has been undrawn since our March 2013 IPO. For a description of the terms of the notes and our revolving credit facility, see “—Liquidity and Capital Resources”. Interest expense also includes interest on TRA payments, which is incurred between the due date (without extension) for our federal income tax return and the date on which we make TRA payments.
Net Gain on the Valuation of Contingent Value Rights
As part of the IPO Reorganization, we issued CVRs, which were classified as liabilities and accounted for under U.S. GAAP as derivatives. Net gain on the valuation of contingent value rights includes all changes in the fair value of this liability. The CVRs were terminated in November 2013.
Other Non-Operating Income (Loss)
Other items included in total non-operating income (loss) are income from our excess cash balances, dividends earned on available-for-sale securities, debt related costs, and gains or losses we recognize upon the sale of the securities we hold.
Non-operating income (loss) also includes gains or losses related to the changes in our estimate of the payment obligation under the tax receivable agreements. The effect of changes in our estimate of amounts payable under the tax receivable agreements, including the effect of changes in enacted tax rates and in applicable tax laws, is included in net income.
Net gains (losses) of Launch Equity
Net gain (loss) of Launch Equity includes net interest income, dividend expense and realized and unrealized gains and losses which are driven by the underlying investments held by Launch Equity. Nearly all of these net gains or losses are attributable to investors other than Artisan and are offset by net income (loss) attributable to noncontrolling interests - Launch Equity.
Net Income (Loss) Attributable to Noncontrolling Interests
Net Gain (Loss) of Launch Equity and Net Income (Loss) Attributable to Noncontrolling Interests-Launch Equity
Until December 2014, Artisan provided investment management services to Artisan Partners Launch Equity LP, or Launch Equity. Launch Equity was a private investment partnership, the investors in which were certain employees and former employees of Artisan. Artisan made day-to-day investment decisions concerning the assets of the private investment partnership. This partnership was consolidated under variable interest entity consolidation guidance.
In December 2014, Launch Equity liquidated all of its investments. All final liquidating distributions were made as of December 31, 2014, including Artisan’s pro rata distribution of $1 thousand. Because nearly all of the partnership interest was held by investors other than Artisan, the Launch Equity dissolution did not have a significant impact on our financial condition or results of operations.
48
Net Income (Loss) Attributable to Noncontrolling Interests-Holdings
Net income (loss) attributable to noncontrolling interests-Holdings represents the portion of earnings or loss attributable to the ownership interest in Artisan Partners Holdings held by the limited partners of Artisan Partners Holdings. All income of Artisan Partners Holdings for the period prior to March 12, 2013, is entirely attributable to noncontrolling interests.
Provision for Income Taxes
Our business was historically organized as a partnership and was not subject to U.S. federal and certain state income taxes. As a result of the IPO Reorganization, we became subject to tax as a C-corporation. We are subject to U.S. federal, state and local income taxes on our allocable portion of the income of Artisan Partners Holdings. Our effective income tax rate is dependent on many factors, including a rate benefit attributable to the fact that a portion of Artisan Partner Holdings’ earnings are not subject to corporate level taxes. This favorable impact is partially offset by the impact of certain permanent items, primarily attributable to certain pre-IPO share-based compensation expenses that are not deductible for tax purposes. Income tax expense is also recognized for certain foreign subsidiaries that pay corporate income tax.
49
Results of Operations
Year Ended December 31, 2015
, Compared to
Year Ended December 31, 2014
|
For the Years Ended December 31,
|
Period-to-Period
|
|||||||||||||
|
2015
|
2014
|
$
|
%
|
|||||||||||
|
Statements of operations data:
|
(in millions, except share and per-share data)
|
|||||||||||||
|
Revenues
|
$
|
805.5
|
|
$
|
828.7
|
|
$
|
(23.2
|
)
|
(3
|
)%
|
|||
|
Operating Expenses
|
||||||||||||||
|
Total compensation and benefits
|
414.3
|
|
415.0
|
|
(0.7
|
)
|
—
|
%
|
||||||
|
Other operating expenses
|
108.8
|
|
106.8
|
|
2.0
|
|
2
|
%
|
||||||
|
Total operating expenses
|
523.1
|
|
521.8
|
|
1.3
|
|
—
|
%
|
||||||
|
Total operating income
|
282.4
|
|
306.9
|
|
(24.5
|
)
|
(8
|
)%
|
||||||
|
Non-operating income (loss)
|
||||||||||||||
|
Interest expense
|
(11.7
|
)
|
(11.6
|
)
|
(0.1
|
)
|
(1
|
)%
|
||||||
|
Other non-operating income (loss)
|
(11.8
|
)
|
(7.8
|
)
|
(4.0
|
)
|
(51
|
)%
|
||||||
|
Total non-operating income (loss)
|
(23.5
|
)
|
(19.4
|
)
|
(4.1
|
)
|
(21
|
)%
|
||||||
|
Income (loss) before income taxes
|
258.9
|
|
287.5
|
|
(28.6
|
)
|
(10
|
)%
|
||||||
|
Provision for income taxes
|
46.8
|
|
48.8
|
|
(2.0
|
)
|
(4
|
)%
|
||||||
|
Net income (loss) before noncontrolling interests
|
212.1
|
|
238.7
|
|
(26.6
|
)
|
(11
|
)%
|
||||||
|
Less: Noncontrolling interests - Artisan Partners Holdings
|
130.3
|
|
173.1
|
|
(42.8
|
)
|
(25
|
)%
|
||||||
|
Less: Noncontrolling interests - Launch Equity
|
—
|
|
(4.0
|
)
|
4.0
|
|
100
|
%
|
||||||
|
Net income attributable to Artisan Partners Asset Management Inc.
|
$
|
81.8
|
|
$
|
69.6
|
|
$
|
12.2
|
|
18
|
%
|
|||
|
Per Share Data
|
||||||||||||||
|
Net income (loss) available to Class A common stock per basic and diluted share
|
$
|
1.86
|
|
$
|
(0.37
|
)
|
||||||||
|
Weighted average basic and diluted shares of Class A common stock outstanding
|
35,448,550
|
|
27,514,394
|
|
||||||||||
Revenues
The decrease in revenues of
$23.2 million
, or
3%
, for the
year ended December 31, 2015
, compared to the
year ended December 31, 2014
, was driven primarily by a
$1.4 billion
, or
1%
, decrease in our average AUM and a decrease in our weighted average investment management fee rate.
Our weighted average investment management fee was
76
basis points for the year ended December 31,
2015
compared to
77
basis points for the
year ended December 31, 2014
. The decrease resulted from a decline in the proportion of our total AUM managed through Artisan Funds. Separate accounts, in the aggregate, paid a weighted average fee of
55
basis points for the years ended December 31,
2015
and
2014
. Artisan Funds and Artisan Global Funds, to which we provide services in addition to the services we provide to separate account clients, paid in the aggregate a weighted average fee of
93
basis points for the
years ended December 31, 2015
and
2014
.
Operating Expenses
The increase in total operating expenses of
$1.3 million
for the
year ended December 31, 2015
, compared to the
year ended December 31, 2014
, was primarily due to a
$13.4 million
increase in restricted share based compensation expense and costs associated with the formation of our Developing World team. We incurred approximately $12 million of expenses during the year related to the Developing World team, of which $6.5 million related to establishing the team. The increased expenses were partially offset by a
$22.6 million
decrease in pre-offering related equity compensation expense.
50
Compensation and Benefits
|
For the Years Ended December 31,
|
Period-to-Period
|
|||||||||||||
|
2015
|
2014
|
$
|
%
|
|||||||||||
|
(in millions)
|
||||||||||||||
|
Salaries, incentive compensation and benefits
(1)
|
$
|
335.7
|
|
$
|
327.2
|
|
$
|
8.5
|
|
3
|
%
|
|||
|
Restricted share based award compensation expense
|
36.5
|
|
23.1
|
|
13.4
|
|
58
|
%
|
||||||
|
Total salaries, incentive compensation and benefits
|
372.2
|
|
350.3
|
|
21.9
|
|
6
|
%
|
||||||
|
Amortization expense of pre-offering Class B awards
|
42.1
|
|
64.7
|
|
(22.6
|
)
|
(35
|
)%
|
||||||
|
Pre-offering related compensation - share-based awards
|
42.1
|
|
64.7
|
|
(22.6
|
)
|
(35
|
)%
|
||||||
|
Total compensation and benefits
|
$
|
414.3
|
|
$
|
415.0
|
|
$
|
(0.7
|
)
|
0
|
%
|
|||
|
(1)
Excluding restricted share based award compensation expense
|
||||||||||||||
The increase in salaries, incentive compensation, and benefits was driven primarily by $6.0 million of start-up costs related to the Developing World team in the first quarter of 2015 and a $9.1 million increase due to an increase in the number of employees, including those on the Developing World team. These increases were partially offset by a decline in the cash incentive compensation directly linked to our revenues which decreased by
$6.6 million
.
The
$13.4 million
increase in restricted share based compensation expense resulted primarily from grants of awards in January 2015 and July 2014. We expect restricted share based award compensation expense to continue to increase as we make additional equity awards each year. The ultimate size of the expense will depend primarily on the number of awards granted and our stock price at the time awards are made.
Amortization expense on pre-offering Class B awards decreased
$22.6 million
, as certain awards became fully vested during 2015 and 2014. Class B awards will be fully vested on July 1, 2017.
Total salaries, incentive compensation and benefits was
46%
and
42%
of our revenues for the
years ended December 31, 2015
and
2014
, respectively.
Other operating expenses
Other operating expenses increased
$2.0 million
, or
2%
, for the
year ended December 31, 2015
compared to the
year ended December 31, 2014
, primarily due to a
$4.5 million
increase in communication and technology expenses as a result of investments in firm technology initiatives, mainly in the areas of information security and distribution and marketing. Occupancy and general and administrative expenses also increased by $3.0 million primarily due to an increase in the number of employees, including those on the Developing World team.
The increases in other operating expenses described above were partially offset by a $4.4 million reduction in distribution expenses. Third-party distribution expenses decreased as a result of a decrease in our AUM sourced from third-party intermediaries and the launch of the Advisor Share class for certain series of Artisan Funds. The amount we and Artisan Funds pay to intermediaries for distribution and administrative services with respect to Advisor Shares is less than the amount paid with respect to Investor Shares. The transfer of assets from Investor Shares to Advisor Shares reduced our intermediary fees by $2.7 million during 2015. Based on the assets that have transferred to date at current market values and current distribution fee rates, we expect to realize annualized savings of approximately $4.0 million to $4.5 million from the transfers to Advisor Shares.
Non-Operating Income (Loss)
Non-operating income (loss) for the years ended
December 31, 2015
and
2014
includes
$12.2 million
and $4.2 million, respectively, of expense resulting from changes in the estimate of the payment obligation under the tax receivable agreements. The effect of changes in that estimate after the date of an exchange or sale that triggers a potential future payment under the agreements is included in net income. Similarly, the effect on the estimate of changes in enacted tax rates and in applicable tax laws are included in net income.
Non-operating income (loss) for the
year ended December 31, 2014
also includes a
$4.0 million
net loss of Launch Equity, which represents net realized and unrealized losses of the underlying assets of Launch Equity. Nearly all losses were allocable to, and were offset by, net income (loss) attributable to noncontrolling interests - Launch Equity. In December 2014, we dissolved Launch Equity LP.
51
Provision for Income Taxes
The provision for income taxes primarily represents APAM’s U.S. federal, state, and local income taxes on its allocable portion of Holdings’ income, as well as foreign income taxes payable by Holdings’ subsidiaries. APAM’s effective income tax rate for the
year ended December 31, 2015
was
18.1%
compared to
17.0%
for the
year ended December 31, 2014
. Several factors contribute to the effective tax rate, including a rate benefit attributable to the fact that approximately
50%
and
60%
of Holdings’ earnings were not subject to corporate-level taxes for the
years ended December 31, 2015
and 2014, respectively. Income before income taxes includes amounts that are attributable to noncontrolling interests and not taxable to APAM and its subsidiaries, which reduces the effective tax rate. This favorable impact is partially offset by the impact of certain permanent items, primarily attributable to pre-IPO share-based compensation expenses that are not deductible for tax purposes. These factors are expected to continue to impact the effective tax rate for future years, although as APAM’s equity ownership in Holdings increases, the effective tax rate will likewise increase as more income will be subject to corporate-level taxes. Included in the tax provision for the years ended
December 31, 2015
and
2014
, are discrete tax benefits of $8.3 million and $4.1 million, respectively, related to changes in estimates associated with our deferred tax assets.
Earnings Per Share
Weighted average basic and diluted shares of Class A common stock outstanding increased during the
year ended December 31, 2015
, as a result of the stock offerings, unit exchanges and equity grants, as described above under “-Organizational Structure.” Basic and diluted earnings per share were negatively impacted in 2014 by our purchase of our preferred securities because the purchase price was greater than the equity carrying value. See
Note 14, “Earnings (Loss) Per Share”
in the Notes to the Consolidated Financial Statements in Item 8 of this report for further discussion of earnings per share.
52
Year Ended December 31, 2014 Compared to the Year Ended December 31, 2013
|
For the Years Ended December 31,
|
For the Period-to-Period
|
|||||||||||||
|
2014
|
2013
|
$
|
%
|
|||||||||||
|
Statements of operations data:
|
(in millions, except share and per-share data)
|
|||||||||||||
|
Revenues
|
$
|
828.7
|
|
$
|
685.8
|
|
$
|
142.9
|
|
21
|
%
|
|||
|
Operating Expenses
|
||||||||||||||
|
Total compensation and benefits
|
415.0
|
|
856.4
|
|
$
|
(441.4
|
)
|
(52
|
)%
|
|||||
|
Other operating expenses
|
106.8
|
|
90.6
|
|
$
|
16.2
|
|
18
|
%
|
|||||
|
Total operating expenses
|
521.8
|
|
947.0
|
|
$
|
(425.2
|
)
|
(45
|
)%
|
|||||
|
Total operating income
|
306.9
|
|
(261.2
|
)
|
568.1
|
|
217
|
%
|
||||||
|
Non-operating income (loss)
|
||||||||||||||
|
Interest expense
|
(11.6
|
)
|
(11.9
|
)
|
0.3
|
|
3
|
%
|
||||||
|
Other non-operating income (loss)
|
(7.8
|
)
|
65.4
|
|
(73.2
|
)
|
(112
|
)%
|
||||||
|
Total non-operating income (loss)
|
(19.4
|
)
|
53.5
|
|
(72.9
|
)
|
(136
|
)%
|
||||||
|
Income (loss) before income taxes
|
287.5
|
|
(207.7
|
)
|
495.2
|
|
238
|
%
|
||||||
|
Provision for income taxes
|
48.8
|
|
26.4
|
|
22.4
|
|
85
|
%
|
||||||
|
Net income (loss) before noncontrolling interests
|
238.7
|
|
(234.1
|
)
|
472.8
|
|
202
|
%
|
||||||
|
Less: Noncontrolling interests - Artisan Partners Holdings
|
173.1
|
|
(269.6
|
)
|
442.7
|
|
164
|
%
|
||||||
|
Less: Noncontrolling interests - Launch Equity
|
(4.0
|
)
|
10.7
|
|
(14.7
|
)
|
(137
|
)%
|
||||||
|
Net income attributable to Artisan Partners Asset Management Inc.
|
$
|
69.6
|
|
$
|
24.8
|
|
$
|
44.8
|
|
181
|
%
|
|||
|
Per Share Data
|
||||||||||||||
|
Net income (loss) available to Class A common stock per basic and diluted share
|
$
|
(0.37
|
)
|
$
|
(2.04
|
)
|
||||||||
|
Weighted average basic and diluted shares of Class A common stock outstanding
|
27,514,394
|
|
13,780,378
|
|
||||||||||
Revenues
The increase in revenues of $142.9 million, or 21%, for the year ended December 31, 2014, compared to the year ended December 31, 2013, was driven primarily by an $18.3 billion, or 21%, increase in our average AUM.
Our weighted average investment management fee was 77 basis points for the years ended December 31, 2014 and 2013. Separate accounts, in the aggregate, paid a weighted average fee of 55 basis points for the year ended December 31, 2014, compared to 56 basis points for the year ended December 31, 2013. Artisan Funds and Artisan Global Funds, to which we provide services in addition to the services we provide to separate account clients, paid in the aggregate a weighted average fee of 93 basis points for the years ended December 31, 2014 and 2013.
Operating Expenses
The decrease in total operating expenses for the year ended December 31, 2014, compared to the year ended December 31, 2013, was primarily attributable to a decrease in pre-offering related compensation expense, partially offset by increases in salaries, incentive compensation and benefits, communication and technology, and distribution and marketing expenses.
53
Compensation and Benefits
|
For the Years Ended December 31,
|
Period-to-Period
|
|||||||||||||
|
2014
|
2013
|
$
|
%
|
|||||||||||
|
(in millions)
|
||||||||||||||
|
Salaries, incentive compensation and benefits
(1)
|
$
|
327.2
|
|
$
|
301.6
|
|
$
|
25.6
|
|
8
|
%
|
|||
|
Restricted share compensation expense
|
23.1
|
|
7.6
|
|
15.5
|
|
204
|
%
|
||||||
|
Total salaries, incentive compensation and benefits
|
350.3
|
|
309.2
|
|
41.1
|
|
13
|
%
|
||||||
|
Change in value of Class B liability awards
|
—
|
|
41.9
|
|
(41.9
|
)
|
(100
|
)%
|
||||||
|
Class B award modification expense
|
—
|
|
287.3
|
|
(287.3
|
)
|
(100
|
)%
|
||||||
|
Amortization expense of pre-offering Class B awards
|
64.7
|
|
75.0
|
|
(10.3
|
)
|
(14
|
)%
|
||||||
|
Pre-offering related compensation - share-based awards
|
64.7
|
|
404.2
|
|
(339.5
|
)
|
(84
|
)%
|
||||||
|
Pre-offering related cash incentive compensation
|
—
|
|
56.8
|
|
(56.8
|
)
|
(100
|
)%
|
||||||
|
Pre-offering related bonus make-whole compensation
|
—
|
|
20.5
|
|
(20.5
|
)
|
(100
|
)%
|
||||||
|
Pre-offering distributions on Class B liability awards
|
—
|
|
65.7
|
|
(65.7
|
)
|
(100
|
)%
|
||||||
|
Pre-offering related compensation - other
|
—
|
|
143.0
|
|
(143.0
|
)
|
(100
|
)%
|
||||||
|
Total compensation and benefits
|
$
|
415.0
|
|
$
|
856.4
|
|
$
|
(441.4
|
)
|
(52
|
)%
|
|||
|
(1)
Excluding restricted share compensation expense
|
||||||||||||||
The increase in salaries, incentive compensation, and benefits was driven primarily by cash incentive compensation expense for our investment and marketing professionals. The portion of cash incentive compensation directly linked to our revenues increased by $36.3 million as a result of higher investment management fee revenue during the year ended December 31, 2014, as compared to the year ended December 31, 2013. Partially offsetting the increase was a $6.5 million decrease in severance expense and an $11.7 million decrease in incentive compensation expense related to a special incentive compensation plan for certain portfolio managers that ended on December 31, 2013.
Compensation expense related to restricted shares was $23.1 million and $7.6 million for the years ended December 31, 2014 and 2013, respectively. The increase resulted from our July 2014 grant of shares and a full year of expense on the 2013 awards.
The remaining increase in salaries, incentive compensation and benefits expense was driven mainly by an increase in the number of employees between 2013 and 2014. Total salaries, incentive compensation and benefits as a percentage of revenues was 42% and 45% for the years ended December 31, 2014 and 2013, respectively.
Pre-offering related share-based compensation expense decreased $339.5 million for the year ended December 31, 2014, compared to the year ended December 31, 2013. Prior to the IPO Reorganization, our Class B awards were classified as liabilities. As part of the IPO Reorganization, we amended the Class B grant agreements to eliminate the cash redemption feature of the awards. From January 1, 2013, through the date of the IPO Reorganization, we incurred a $41.9 million compensation charge to record the liability awards at fair value.
Immediately after the amendment of the grant agreements, we incurred a $287.3 million compensation charge as a result of the award modification. Compensation expense for these awards after the IPO Reorganization represents the amortization of the fair value of unvested Class B awards at the date of the IPO Reorganization over the remaining vesting term. Amortization expense on pre-offering Class B awards decreased $10.3 million, as certain awards became fully vested during 2014.
Pre-offering related other compensation decreased $143.0 million for the year ended December 31, 2014, compared to the year ended December 31, 2013. During the year ended December 31, 2013 we recognized $56.8 million in compensation expense related to a cash incentive paid to certain of our portfolio managers in connection with the IPO, $65.7 million in compensation expense related to distributions of the retained earnings of Holdings made to our pre-IPO employee-partners, and $20.5 million in compensation expense representing post-IPO profits otherwise allocable to Artisan Partners Holdings’ pre-IPO non-employee partners which was instead allocated and distributed to certain of our employee-partners.
Other operating expenses
Other operating expenses increased $16.2 million, or 18%, primarily due to a $10.7 million increase in distribution and marketing expense resulting mainly from higher average AUM and revenues sourced through intermediaries, and a $6.6 million increase in communication and technology expenses resulting mainly from an increase in information technology initiatives. Approximately $2.5 million of the distribution expense increase related to a change in the allocation of the intermediary fees between Artisan and the Artisan Funds.
54
Non-Operating Income (Loss)
The decrease in non-operating income of $72.9 million
was due to a number of factors. We recognized a $49.6 million gain on the valuation of contingent value rights during the year ended December 31, 2013. The gain on the CVR was the result of an increase in our stock price from the $30.00 per share IPO price utilized in determining the initial fair value of the CVR liability to the closing price of $61.25 per share on November 6, 2013, when the CVRs were terminated. As a derivative liability, all changes in the fair value of this liability were recorded to current earnings.
Non-operating income (loss) for the year ended December 31, 2014 includes $4.2 million of expense related to a change in estimate of the payment obligation under the tax receivable agreements. Non-operating income (loss) for the year ended December 31, 2013 included net investment income of $5.1 million, compared to $0.6 million in 2014.
Launch Equity had a net loss of $4.0 million for the year ended December 31, 2014, compared to a net gain of $10.7 million for the year ended December 31, 2013. Net gains (losses) of Launch Equity represent net realized and unrealized gains of the underlying assets of Launch Equity. Nearly all gains are allocable to, and offset by, net income (loss) attributable to noncontrolling interests - Launch Equity. In December 2014, we dissolved Launch Equity LP.
Provision for Income Taxes
APAM’s effective income tax rate for the year ended December 31, 2014 was 17.0% compared to 11.6% for the period from March 12, 2013 through December 31, 2013. Several factors contribute to the effective tax rate, including a rate benefit attributable to the fact that approximately 60% and 78% of Holdings’ earnings were not subject to corporate-level taxes for the years ended December 31, 2014 and 2013, respectively. Income before income taxes includes amounts that are attributable to noncontrolling interest and not taxable to APAM and its subsidiaries, which reduces the effective tax rate. This favorable impact was partially offset by the impact of certain permanent items, primarily attributable to pre-IPO share-based compensation expenses that are not deductible for tax purposes. Included in the tax provision for the year ended December 31, 2014, was a discrete tax benefit of $4.1 million related to the change in estimate of the payment obligation under the tax receivable agreements. This discrete tax benefit included the impact of the change in our estimated deferred tax rate from 36.1% to 36.5% during the year ended December 31, 2014.
Earnings Per Share
Weighted average basic and diluted shares of Class A common stock outstanding increased during the year ended December 31, 2014, as a result of the stock offerings and unit exchanges that occurred during 2014. Basic and diluted earnings per share were negatively impacted in both 2013 and 2014 by our purchase of our preferred securities because the purchase price was greater than the equity carrying value. See Note 14, “Earnings (Loss) Per Share” in the Notes to the Consolidated Financial Statements in Item 8 of this report for further discussion of earnings per share.
55
Supplemental Non-GAAP Financial Information
Our management uses non-GAAP measures (referred to as “adjusted” measures) of net income and operating income to evaluate the profitability and efficiency of the underlying operations of our business and as a factor when considering net income available for distributions and dividends. These adjusted measures remove the impact of (1) pre-offering related compensation, (2) offering related proxy expense, (3) the net gain (loss) on the valuation of contingent value rights, and (4) net gain (loss) on the tax receivable agreements. These adjustments also remove the non-operational complexities of our structure by adding back non-controlling interests and assuming all income of Artisan Partners Holdings is allocated to APAM. Management believes these non-GAAP measures provide more meaningful information to analyze our profitability and efficiency between periods and over time. We have included these non-GAAP measures to provide investors with the same financial metrics used by management to manage the company.
Non-GAAP measures should be considered in addition to, and not as a substitute for, financial measures prepared in accordance with GAAP. Our non-GAAP measures may differ from similar measures used by other companies, even if similar terms are used to identify such measures. Our non-GAAP measures are as follows:
|
•
|
Adjusted net income represents net income excluding the impact of (1) pre-offering related compensation, (2) offering related proxy expense, (3) net gain (loss) on the valuation of contingent value rights, and (4) net gain (loss) on the tax receivable agreements. Adjusted net income also reflects income taxes assuming the vesting of all unvested Class A share based awards and as if all outstanding limited partnership units of Artisan Partners Holdings and all shares of APAM’s convertible preferred stock had been exchanged for or converted into Class A common stock of the APAM on a one-for-one basis. Assuming full vesting, exchange and conversion, all income of Artisan Partners Holdings is treated as if it were allocated to APAM, and the adjusted provision for income taxes represents an estimate of income tax expense at an effective rate reflecting assumed federal, state, and local income taxes. The estimated adjusted effective tax rate was 37.0%, 36.5%, and 36.1% for the years ended December 31, 2015, 2014 and 2013, respectively.
|
|
•
|
Adjusted net income per adjusted share is calculated by dividing adjusted net income by adjusted shares. The number of adjusted shares is derived by assuming the vesting of all unvested Class A share based awards, the exchange of all outstanding limited partnership units of Artisan Partners Holdings and the conversion of all outstanding shares of APAM’s convertible preferred stock for or into Class A common stock of APAM on a one-for-one basis.
|
|
•
|
Adjusted operating income represents the operating income (loss) of APAM excluding offering related proxy expense and pre-offering related compensation.
|
|
•
|
Adjusted operating margin is calculated by dividing adjusted operating income (loss) by total revenues.
|
|
•
|
Adjusted EBITDA represents income (loss) before income taxes, interest expense and depreciation and amortization, adjusted to exclude the impact of net income (loss) attributable to non-controlling interests, offering related proxy expense, pre-offering related compensation, net gain (loss) on the tax receivable agreements, and the net gain (loss) on the valuation of contingent value rights.
|
For the years ended December 31, 2015 and 2014, pre-offering related compensation includes only the amortization of unvested Class B common units of Artisan Partners Holdings that were granted before and were unvested at our IPO, which closed on March 12, 2013. For the year ended December 31, 2013, pre-offering related compensation includes (1) expense resulting from cash incentive compensation payments triggered by our IPO and expenses associated with the reallocation of post-IPO profits from certain pre-IPO partners to employee-partners, (2) one-time expense resulting from the modification of the Class B common unit awards at the time of our IPO, based on the difference between the carrying value of the liability associated with the vested Class B common units immediately prior to our IPO and the value based on the offering price per share of Class A common stock in our IPO, (3) the amortization of unvested Class B common units of Artisan Partners Holdings that were granted prior to and were unvested at our IPO (4) distributions to the Class B partners of Artisan Partners Holdings, (5) redemptions of Class B liability awards and (6) changes in the value of Class B liability awards.
Net loss on tax receivable agreements represents the expense associated with the change in valuation of amounts payable under the tax receivable agreements entered into in connection with APAM’s initial public offering and related reorganization.
Offering related proxy expense represents costs incurred as a result of the change of control (for purposes of the Investment Company Act and Investment Advisers Act) which occurred on March 12, 2014. We incurred costs through the first quarter of 2014 to solicit the necessary approvals and consents from the boards and shareholders of the mutual funds that we advise or sub-advise and from our separate accounts clients, which were necessary because of the change of control.
56
The following table sets forth, for the periods indicated, a reconciliation from GAAP financial measures to non-GAAP measures:
|
For the Years Ended December 31,
|
|||||||||||
|
2015
|
2014
|
2013
|
|||||||||
|
(unaudited; in millions, except per share data)
|
|||||||||||
|
Reconciliation of non-GAAP financial measures:
|
|||||||||||
|
Net income attributable to Artisan Partners Asset Management Inc. (GAAP)
|
$
|
81.8
|
|
$
|
69.6
|
|
$
|
24.8
|
|
||
|
Add back: Net income (loss) attributable to noncontrolling interests - Artisan Partners Holdings
|
130.3
|
|
173.1
|
|
(269.6
|
)
|
|||||
|
Add back: Provision for income taxes
|
46.8
|
|
48.8
|
|
26.4
|
|
|||||
|
Add back: Pre-offering related compensation - share-based awards
|
42.1
|
|
64.7
|
|
404.2
|
|
|||||
|
Add back: Pre-offering related compensation - other
|
—
|
|
—
|
|
143.0
|
|
|||||
|
Add back: Offering related proxy expense
|
—
|
|
0.1
|
|
2.9
|
|
|||||
|
Add back: Net loss on the tax receivable agreements
|
12.2
|
|
4.2
|
|
—
|
|
|||||
|
Less: Net gain on the valuation of contingent value rights
|
—
|
|
—
|
|
49.6
|
|
|||||
|
Less: Adjusted provision for income taxes
|
115.9
|
|
131.6
|
|
101.8
|
|
|||||
|
Adjusted net income (Non-GAAP)
|
$
|
197.3
|
|
$
|
228.9
|
|
$
|
180.3
|
|
||
|
Average shares outstanding
|
|||||||||||
|
Class A common shares
|
35.4
|
|
27.5
|
|
13.8
|
|
|||||
|
Assumed vesting, conversion or exchange of:
|
|||||||||||
|
Unvested Class A restricted share based awards
|
3.1
|
|
2.1
|
|
0.9
|
|
|||||
|
Convertible preferred shares outstanding
|
—
|
|
0.4
|
|
2.3
|
|
|||||
|
Artisan Partners Holdings units outstanding (noncontrolling interest)
|
35.0
|
|
42.2
|
|
53.9
|
|
|||||
|
Adjusted shares
|
73.5
|
|
72.2
|
|
70.9
|
|
|||||
|
Adjusted net income per adjusted share (Non-GAAP)
|
$
|
2.69
|
|
$
|
3.17
|
|
$
|
2.54
|
|
||
|
Operating income (loss) (GAAP)
|
$
|
282.4
|
|
$
|
306.9
|
|
$
|
(261.2
|
)
|
||
|
Add back: Pre-offering related compensation - share-based awards
|
42.1
|
|
64.7
|
|
404.2
|
|
|||||
|
Add back: Pre-offering related compensation - other
|
—
|
|
—
|
|
143.0
|
|
|||||
|
Add back: Offering related proxy expense
|
—
|
|
0.1
|
|
2.9
|
|
|||||
|
Adjusted operating income (Non-GAAP)
|
$
|
324.5
|
|
$
|
371.7
|
|
$
|
288.9
|
|
||
|
Adjusted operating margin (Non-GAAP)
|
40.3
|
%
|
44.9
|
%
|
42.1
|
%
|
|||||
|
Net income attributable to Artisan Partners Asset Management Inc. (GAAP)
|
$
|
81.8
|
|
$
|
69.6
|
|
$
|
24.8
|
|
||
|
Add back: Net income (loss) attributable to noncontrolling interests - Artisan Partners Holdings
|
130.3
|
|
173.1
|
|
(269.6
|
)
|
|||||
|
Add back: Pre-offering related compensation - share-based awards
|
42.1
|
|
64.7
|
|
404.2
|
|
|||||
|
Add back: Pre-offering related compensation - other
|
—
|
|
—
|
|
143.0
|
|
|||||
|
Add back: Offering related proxy expense
|
—
|
|
0.1
|
|
2.9
|
|
|||||
|
Add back: Net loss on the tax receivable agreements
|
12.2
|
|
4.2
|
|
—
|
|
|||||
|
Less: Net gain on the valuation of contingent value rights
|
—
|
|
—
|
|
49.6
|
|
|||||
|
Add back: Interest expense
|
11.7
|
|
11.6
|
|
11.9
|
|
|||||
|
Add back: Provision for income taxes
|
46.8
|
|
48.8
|
|
26.4
|
|
|||||
|
Add back: Depreciation and amortization
|
4.5
|
|
3.2
|
|
3.2
|
|
|||||
|
Adjusted EBITDA (Non-GAAP)
|
$
|
329.4
|
|
$
|
375.3
|
|
$
|
297.2
|
|
||
57
Liquidity and Capital Resources
Our working capital needs, including accrued incentive compensation payments, have been and are expected to be met primarily through cash generated by our operations. The following table shows our liquidity position as of
December 31, 2015
and
December 31, 2014
.
|
December 31, 2015
|
December 31, 2014
|
||||||
|
(in millions)
|
|||||||
|
Cash and cash equivalents
|
$
|
166.2
|
|
$
|
182.3
|
|
|
|
Accounts receivable
|
$
|
60.1
|
|
$
|
69.4
|
|
|
|
Undrawn commitment on revolving credit facility
|
$
|
100.0
|
|
$
|
100.0
|
|
|
We manage our cash balances in order to fund our day-to-day operations. Accounts receivable primarily represent investment management fees that have been earned, but not yet received from our clients. We perform a review of our receivables on a monthly basis to assess collectability. As of December 31, 2015, none of our receivables were considered uncollectable. We also maintain a
$100 million
revolving credit facility, which was unused as of and for the year ended
December 31, 2015
.
In August 2012, we issued
$200 million
in unsecured notes and entered into the
$100 million
five-year revolving credit facility. We used the proceeds of the notes and
$90 million
drawn from the revolving credit facility to prepay the entire then-outstanding principal amount of our $400 million term loan. The notes are comprised of three series, each with a balloon payment at maturity. In connection with the IPO, we paid all of the
$90 million
outstanding principal amount of loans under the revolving credit facility. See Note 6, “Borrowings” in the Notes to the Consolidated Financial Statements in Item 8 of this report for a discussion of the interest rates charged on our borrowings.
These borrowings contain certain customary covenants including limitations on Artisan Partners Holdings’ ability to: (i) incur additional indebtedness or liens, (ii) engage in mergers or other fundamental changes, (iii) sell or otherwise dispose of assets including equity interests, and (iv) make dividend payments or other distributions to Artisan Partners Holdings’ partners (other than, among others, tax distributions paid to partners for the purpose of funding tax liabilities attributable to their interests) when a default occurred and is continuing or would result from such a distribution. In addition, a change of control (as defined in the agreements) is an event of default under the revolving credit agreement and requires that Artisan Partners Holdings offer to prepay all of the notes under the note purchase agreement.
In addition, covenants in the note purchase and revolving credit agreements require Artisan Partners Holdings to maintain the following financial ratios:
|
•
|
leverage ratio (calculated as the ratio of consolidated total indebtedness on any date to consolidated EBITDA for the period of four consecutive fiscal quarters ended on or prior to such date) cannot exceed 3.00 to 1.00 (Artisan Partners Holdings’ leverage ratio for the year ended
December 31, 2015
was 0.5 to 1.00); and
|
|
•
|
interest coverage ratio (calculated as the ratio of consolidated EBITDA for any period of four consecutive fiscal quarters to consolidated interest expense for such period) cannot be less than 4.00 to 1.00 for such period (Artisan Partners Holdings’ interest coverage ratio for the year ended
December 31, 2015
was 33.54 to 1.00).
|
Our failure to comply with any of the covenants or restrictions described above could result in an event of default under the agreements, giving our lenders the ability to accelerate repayment of our obligations.
Distributions and Dividends
Artisan Partners Holdings’ distributions, including distributions to APAM, for the years ended
December 31, 2015
and 2014 were as follows:
|
For the Years Ended December 31,
|
|||
|
2015
|
2014
|
||
|
(in millions)
|
|||
|
Holdings Partnership Distributions to Limited Partners
|
$182.2
|
$266.8
|
|
|
Holdings Partnership Distributions to APAM
|
$186.7
|
$160.4
|
|
|
Total Holdings Partnership Distributions
|
$368.9
|
$427.2
|
|
58
On January 26, 2016, we, acting as the general partner of Artisan Partners Holdings, declared a distribution of
$41.8 million
payable by Artisan Partners Holdings on February 23, 2016 to holders of its partnership units, including APAM, of record on February 12, 2016.
APAM declared and paid the following dividends per share during the years ended
December 31, 2015
and
2014
:
|
Type of Dividend
|
Class of Stock
|
For the Years Ended December 31,
|
||||
|
2015
|
2014
|
|||||
|
Quarterly
|
Common Class A
|
$2.40
|
$2.20
|
|||
|
Special Annual
|
Common Class A
|
$0.95
|
$1.63
|
|||
|
Quarterly
|
Convertible Preferred
(1)
|
$—
|
$3.81
|
|||
|
(1)
No convertible preferred securities have been outstanding since June 2014.
|
||||||
Subject to board approval each quarter, we expect to pay a quarterly dividend during 2016.
On January 26, 2016, our board declared a quarterly dividend of $0.60 per share of Class A common stock and a special annual dividend of $0.40 per share of Class A common stock, both payable on February 29, 2016 to shareholders of record as of February 12, 2016.
After the end of the year, our board expects to consider paying a special dividend that will take into consideration our annual adjusted earnings, business conditions and the amount of cash we want to retain at that time. Although we expect to pay dividends according to our dividend policy, we may not pay dividends according to our policy or at all.
Tax Receivable Agreements (“TRAs”)
In addition to funding our normal operations, we will be required to fund amounts payable by APAM under the TRAs that we entered into in connection with the IPO.
In connection with the IPO, we entered into two TRAs, which resulted in the recognition of a
$589.1 million
liability as of
December 31, 2015
. The
$589.1 million
liability represents 85% of the tax benefits we expect to realize as a result of the merger of H&F Corp into us as part of the IPO Reorganization, our purchase of partnership units from certain of our investors and the exchange by certain of our investors of their common and preferred units of Holdings for our Class A common stock or convertible preferred stock after the IPO. The estimated liability assumes no material changes in the relevant tax law and that we earn sufficient taxable income to realize all tax benefits subject to the TRAs.
The liability will increase upon future purchases of Holdings units or exchanges of Holdings units for our Class A common stock, with the increase representing
85%
of the estimated future tax benefits, if any, resulting from such purchases or exchanges. We intend to fund the payment of amounts due under the TRAs out of the reduced tax payments that APAM realizes in respect of the attributes to which the TRAs relate.
The actual payments, and associated tax benefits, will vary depending upon a number of factors, including the timing of purchases or exchanges by the holders of Holdings units, the price of our Class A common stock at the time of such purchases or exchanges, the extent to which such purchases or exchanges are taxable, the amount and timing of the taxable income we generate in the future and the tax rate then applicable, as well as the portion of our payments under the TRAs constituting imputed interest or depreciable or amortizable basis. In certain cases, payments under the TRAs may be accelerated and/or significantly exceed the actual benefits we realize in respect of the tax attributes subject to the TRAs. In such cases, we intend to fund those payments with cash on hand, although we may have to borrow funds depending on the amount and timing of the payments. During the year ended
December 31, 2015
, payments of
$20.2 million
, including interest, were made in accordance with the TRA agreements. We expect to make payments of approximately $28 million in 2016 related to the TRAs.
59
Cash Flows
|
For the Years Ended December 31,
|
|||||||||||
|
2015
|
2014
|
2013
|
|||||||||
|
(in millions)
|
|||||||||||
|
Cash as of January 1
|
$
|
182.3
|
|
$
|
211.8
|
|
$
|
141.2
|
|
||
|
Net cash provided by operating activities
|
321.2
|
|
398.1
|
|
112.1
|
|
|||||
|
Net cash provided by (used in) investing activities
|
(11.3
|
)
|
(7.8
|
)
|
8.7
|
|
|||||
|
Net cash used in financing activities
|
(326.0
|
)
|
(419.8
|
)
|
(50.2
|
)
|
|||||
|
Cash Balance as of December 31,
|
$
|
166.2
|
|
$
|
182.3
|
|
$
|
211.8
|
|
||
Year Ended
December 31, 2015
Compared to Year Ended
December 31, 2014
Operating activities provided net cash of
$321.2 million
and
$398.1 million
for the
years ended December 31, 2015
and
2014
, respectively. The decrease partially resulted from a decline in our operating income, excluding share-based and pre-offering related compensation expenses, which decreased
$33.8 million
for the
year ended December 31, 2015
compared to the year ended December 31, 2014,
Transactions associated with Launch Equity provided net operating cash of $46.5 million during the year ended December 31, 2014. The net cash provided by operating activities in 2014 was the result of the sale of Launch Equity’s investments as part of its dissolution. Nearly all of Launch Equity’s cash flows were attributable to non-controlling interests.
Investing activities consist primarily of acquiring and selling property and equipment, leasehold improvements and the purchase and sale of available-for-sale securities. Investing activities used net cash of
$11.3 million
and
$7.8 million
for the years ended December 31, 2015 and
2014
, respectively. The increase in net cash used in investing activities was due to a
$5.6 million
increase in the net purchases of investment securities during the
year ended December 31, 2015
, compared to the year ended December 31,
2014
. Cash used in acquisitions of property and equipment and leasehold improvements decreased by
$2.3 million
for the
year ended December 31, 2015
, compared to the year ended December 31,
2014
.
Financing activities consist primarily of partnership distributions to non-controlling interests, dividend payments to holders of our Class A common stock, proceeds from the issuance of Class A common stock in follow-on offerings, payments to purchase Holdings partnership units, and payments of amounts owed under the tax receivable agreements. Financing activities used net cash of
$326.0 million
and
$419.8 million
for the
years ended December 31, 2015
and
2014
, respectively. This decrease in net cash used by financing activities was primarily the result of an
$84.7 million
decrease in distributions to limited partners, partially offset by a
$24.1 million
increase in dividends paid and a
$15.4 million
increase in payments of amounts owed under the tax receivable during the
year ended December 31, 2015
, compared to the year ended December 31,
2014
.
Launch Equity’s limited partners contributed
$3.0 million
of additional capital to Launch Equity during the year ended December 31, 2014. In December 2014, Launch Equity was liquidated, and $49.5 million of capital was distributed, almost entirely to non-controlling interests.
Year Ended December 31, 2014 Compared to Year Ended December 31, 2013
Operating activities provided net cash of $398.1 million and $112.1 million for the years ended December 31, 2014 and 2013, respectively. The increase in net cash provided by operating activities was primarily driven by IPO Reorganization payments made in 2013 and higher operating income in 2014. In the first quarter of 2013, we paid $56.8 million of IPO-related cash incentive compensation payments and $65.7 million in Class B distributions. For the year ended December 31, 2014, compared to the year ended December 31, 2013, our operating income, excluding share-based and pre-offering related compensation expenses, increased $101.2 million. Timing differences in working capital accounts also increased our operating cash flows by $27.5 million in 2014, compared to 2013.
Transactions associated with Launch Equity provided net operating cash of $46.5 million and used net operating cash of $3.2 million during the years ended December 31, 2014, and 2013, respectively. The net cash provided by operating activities in 2014 was the result of the sale of Launch Equity’s investments as part of its dissolution. Nearly all of Launch Equity’s cash flows are attributable to non-controlling interests.
Investing activities consist primarily of acquiring and selling property and equipment, leasehold improvements and the purchase and sale of available-for-sale securities. Investing activities used net cash of $7.8 million and provided net cash of $8.7 million for the years ended December, 2014 and 2013, respectively.
60
The increase in net cash used in investing activities was primarily due to the acquisition of property and equipment and leasehold improvements of $9.6 million during the year ended December 31, 2014, compared to $3.2 million of such acquisitions during the year ended December 31, 2013. In addition, there was a $10.4 million decrease in the proceeds from the sale of investment securities, net of investment security purchases.
Financing activities consist primarily of partnership distributions to non-controlling interests, dividend payments to holders of our Class A common stock, payments of principal on our revolving credit arrangement, proceeds from the issuance of Class A common stock in the IPO and follow-on offerings, and payments to purchase APAM convertible preferred stock and Holdings partnership units in connection with these offerings. Financing activities used net cash of $419.8 million and $50.2 million for the years ended December 31, 2014 and 2013, respectively. This increase in net cash used by financing activities was primarily the result of net proceeds of $353.4 million provided by the IPO in March 2013. The cash provided by the IPO in 2013 was offset by $224.8 million in distributions to our non-employee partners, a $90.0 million payment of principal outstanding under our revolving credit arrangement, payments of $76.3 million for the purchase of Class A common units in connection with the IPO and $14.6 million of dividends paid to APAM shareholders.
For the year ended December 31, 2014, net cash used in financing activities was primarily driven by $266.8 million of Holdings’ distributions to non-controlling interests, $99.8 million of dividends paid to APAM shareholders, and $4.6 million of payments made in accordance with the TRA agreements. All of the proceeds provided by the 2014 Follow-On Offering were used to purchase shares of our convertible preferred stock and partnership units.
Launch Equity’s limited partners contributed $3.0 million and $3.2 million of additional capital to Launch Equity during the years ended December 31, 2014 and 2013, respectively. In December 2014, Launch Equity was liquidated, and $49.5 million of capital was distributed, almost entirely to non-controlling interests.
Certain Contractual Obligations
The following table sets forth our contractual obligations under certain contracts as of
December 31, 2015
.
|
Payments Due by Period
|
|||||||||||||||||||
|
Total
|
Less than
1 year |
1-3 Years
|
3-5 Years
|
More than 5
Years |
|||||||||||||||
|
(in millions)
|
|||||||||||||||||||
|
Principal payments on borrowings
|
$
|
200.0
|
|
$
|
—
|
|
$
|
60.0
|
|
$
|
50.0
|
|
$
|
90.0
|
|
||||
|
TRAs
(1)
|
589.1
|
|
—
|
|
—
|
|
—
|
|
—
|
|
|||||||||
|
Interest payable
|
53.5
|
|
11.1
|
|
18.8
|
|
13.1
|
|
10.5
|
|
|||||||||
|
Lease obligations
|
75.4
|
|
10.1
|
|
19.7
|
|
15.8
|
|
29.8
|
|
|||||||||
|
Partnership redemption payable
|
5.6
|
|
5.1
|
|
0.5
|
|
—
|
|
—
|
|
|||||||||
|
Total Contractual Obligations
|
$
|
923.6
|
|
$
|
26.3
|
|
$
|
99.0
|
|
$
|
78.9
|
|
$
|
130.3
|
|
||||
|
(1) The estimated payments under the TRAs as of December 31, 2015 are described above under “Liquidity and Capital Resources”. However, amounts payable under the TRAs will increase upon purchases or exchanges of Holdings units for our Class A common stock or sales of Holdings units to us, with the increase representing 85% of the estimated future tax benefits, if any, resulting from the exchanges or sales. The actual amount and timing of payments associated with our existing payable under our tax receivable agreements or future exchanges or sales, and associated tax benefits, will vary depending upon a number of factors as described under “
-
Liquidity and Capital Resources.” As a result, the timing of payments by period is currently unknown. We expect to pay approximately $28 million in 2016 related to the TRAs.
|
|||||||||||||||||||
Off-Balance Sheet Arrangements
We
did not
have any off-balance sheet arrangements as of
December 31, 2015
.
Critical Accounting Policies and Estimates
The accompanying consolidated financial statements were prepared in accordance with GAAP, and related rules and regulations of the SEC. The preparation of financial statements in conformity with GAAP requires management to make estimates or assumptions that affect the reported amounts of assets and liabilities at the date of the financial statements and the reported amounts of revenues and expenses during the periods presented. Actual results could differ from these estimates or assumptions and may have a material effect on the consolidated financial statements.
Accounting policies are an integral part of our financial statements. A thorough understanding of these accounting policies is essential when reviewing our reported results of operations and our financial condition. Management believes that the critical accounting policies and estimates discussed below involve additional management judgment due to the sensitivity of the methods and assumptions used.
61
Consolidation
We assess each legal entity in which we hold a variable interest to determine whether consolidation is appropriate at the onset of the relationship and upon certain reconsideration events. We first evaluate each entity that we manage to determine whether it is an investment company, as the FASB deferred the application of the revised consolidation model for certain investment entities that have the attributes of an investment company subject to ASC 946 (the “investment company guide”). We then determine whether we have a controlling financial interest in the entity by evaluating whether the entity is a voting interest entity, or VOE, or a variable interest entity, or VIE, under GAAP. Assessing whether an entity is a VIE or VOE and if it requires consolidation involves judgment and analysis. Factors considered in this assessment include the legal organization of the entity, our equity ownership and contractual involvement with the entity and any related party or de facto agent implications of our involvement with the entity.
Voting Interest Entities
-A VOE is an entity in which (i) the total equity investment at risk is sufficient to enable the entity to finance its activities independently and (ii) the equity holders at risk have the obligation to absorb losses, the right to receive residual returns and the right to direct the activities of the entity that most significantly impact the entity’s economic performance, whereby the equity investment has all the characteristics of a controlling financial interest. As a result, voting rights are a key driver of determining which party, if any, should consolidate the entity. We serve as the investment adviser for Artisan Funds and Artisan Global Funds, each of which is a VOE, as described below.
Artisan Funds, a family of U.S. mutual funds, and Artisan Global Funds, a family of Ireland-based UCITS, are corporate entities the business and affairs of which are managed by their respective boards of directors. The shareholders of the funds retain all voting rights, including the right to elect and reelect members of their respective boards of directors. While we hold, in limited cases, direct investments in a fund (which are made on the same terms as are available to other investors and do not represent a majority voting interest in any fund), we do not have a controlling financial interest or a majority voting interest and, as such, we do not consolidate these entities.
Variable Interest Entities
-A VIE is an entity that lacks one or more of the characteristics of a VOE. In accordance with GAAP, an enterprise must consolidate all VIEs of which it is the primary beneficiary. We determine if a legal entity meets the definition of a VIE by considering whether the fund’s equity investment at risk is sufficient to finance its activities without additional subordinated financial support and whether the fund’s at-risk equity holders absorb any losses, have the right to receive residual returns and have the right to direct the activities of the entity most responsible for the entity’s economic performance.
For VIEs that are investment companies subject to the deferral of the revised consolidation model, the primary beneficiary of the VIE is the party that absorbs a majority of the expected losses of the VIE, receives a majority of the expected residual returns of the VIE, or both. This evaluation is updated on a periodic basis.
We have determined that Artisan Partners Launch Equity LP, or Launch Equity, which began operations on July 25, 2011 and was dissolved in December 2014, was a VIE. Our equity investment in the fund represented our variable interest in the fund. Additionally, we had the right to receive management and incentive fees for the services we provided as investment adviser to Launch Equity, which were considered variable interests. The limited partners of Launch Equity were certain of our employees and former employees, and thus were related parties to us. We determined that Launch Equity was a VIE pursuant to ASC 810-10-15-14(c), because (i) the voting rights of the limited partners were not proportional to their obligations to absorb expected losses and rights to receive expected residual returns and (ii) substantially all of Launch Equity’s activities either involved or were conducted on behalf of the limited partners (the investors that have disproportionately few voting rights) and their related parties (including us). We concluded we were the primary beneficiary of Launch Equity for this purpose as we were the member of the related party group that was most closely associated with it. Although we had only a minimal equity investment in Launch Equity, as the general partner, we controlled Launch Equity’s management and affairs. In addition, the fund was designed to attract third party investors to provide an economic benefit to us in the form of quarterly management fees and an annual incentive fee based upon the net capital appreciation of the fund. Also, in the ordinary course of business, we chose to waive certain fees or assume operating expenses of the fund. As a result, we concluded we were the primary beneficiary of Launch Equity. The results of Launch Equity prior to its dissolution are included in our consolidated financial results.
Seed Investments
- We make initial seed investments in sponsored investment portfolios at the portfolio’s formation. If the seed investment results in a controlling financial interest, we will consolidate the investment, and the underlying individual securities will be accounted for as trading securities. If the seed investment results in significant influence, but not control, the investment will be accounted for as an equity method investment. Significant influence is generally considered to exist with equity ownership levels between 20% and 50%, although other factors are considered. Seed investments in which we do not have a controlling financial interest or significant influence are classified as available-for-sale investments. These investments are measured at fair value in the Consolidated Statement of Financial Condition. Unrealized holding gains and losses for available-for-sale securities are excluded from earnings and reported in other comprehensive income until realized. Realized gains are recognized in non-operating income (loss). We currently do not have a controlling financial interest or significant influence in any of our seed investments.
62
Revenue Recognition
Investment management fees are generally computed as a percentage of daily average assets under management and recognized as earned. Fees for providing investment management services are computed and billed in accordance with the provisions of the applicable investment management agreements, generally on a monthly or quarterly basis. The investment management agreements for a small number of accounts provide for performance-based fees. Performance-based fees, if earned, are recognized on the contractually determined measurement date. Interest and dividend income is recognized when earned. Performance fees generally are not subject to clawback as a result of performance declines subsequent to the most recent measurement date. Investment management fees are presented net of cash rebates and fees waived pursuant to contractual expense limitations of the funds or voluntary waivers.
The investment management fees that we receive are calculated based on the values of the securities held in the accounts that we manage for our clients. For our U.S.-registered mutual fund clients and UCITS, including Artisan Funds and Artisan Global Funds, our fees are based on the values of the funds’ assets as determined for purposes of calculating their net asset values.
Securities held by U.S.-registered mutual funds, including Artisan Funds, are generally valued at closing market prices, or if closing market prices are not readily available or are not considered reliable, at a fair value determined under procedures established by the fund’s board (fair value pricing). A U.S.-registered mutual fund typically considers a closing market price not to be readily available, and therefore uses fair value pricing, if, among other things, the value of the security might have been materially affected by events occurring after the close of the market in which the security was principally traded but before the time for determination of the fund’s net asset value. A subsequent event might be a company-specific development, a development affecting an entire market or region, or a development that might be expected to have global implications. A significant change in securities prices in U.S. markets may be deemed to be such a subsequent event with respect to non-U.S. securities.
Values of securities determined using fair value pricing are likely to be different than they would be if only closing market prices were used. As a result, over short periods of time, the revenues we generate from U.S.-registered mutual funds, including Artisan Funds, may be different than they would be if only closing prices were used in valuing portfolio securities. Over longer time periods, the differences in our fees resulting from fair value pricing are not material.
For our separate account clients other than U.S.-registered mutual funds, our fees may be based, at the client’s option, on the values of the securities in the portfolios we manage as determined by the client (or its custodian or other service provider) or by us in accordance with valuation procedures we have adopted. The valuation procedures we have adopted generally use closing market prices in the markets in which the securities trade, without adjustment for subsequent events except in unusual circumstances. We believe that our fees based on valuations determined under our procedures are not materially different from the fees we receive that are based on valuations determined by clients, their custodians or other service providers.
With the exception of the assets in our High Income strategy (which represented approximately 1.0% of our AUM at December 31, 2015), the portfolios of Artisan Funds and Artisan Global Funds, as well as the portfolios we manage for our separate account clients, are invested principally in publicly-traded equity securities for which public market values are readily available, with a portion of each portfolio held in cash or cash-like instruments.
Income Taxes
We operate in numerous states and countries and must allocate our income, expenses, and earnings under the various laws and regulations of each of these taxing jurisdictions. Accordingly, our provision for income taxes represents our total estimate of the liability that we have incurred in doing business each year in all of our locations. Annually, we file tax returns that represent our filing positions with each jurisdiction and settle our tax return liabilities. Each jurisdiction has the right to audit those tax returns and may take different positions with respect to income and expense allocations and taxable earnings determinations. Because the determination of our annual income tax provision is subject to judgments and estimates, actual results may vary from those recorded in our financial statements. We recognize additions to and reductions in income tax expense during a reporting period that pertains to prior period provisions as our estimated liabilities are revised and our actual tax returns and tax audits are completed.
Our management is required to exercise judgment in developing our provision for income taxes, including the determination of deferred tax assets and liabilities and any valuation allowance that might be required against deferred tax assets.
As of December 31, 2015
, we have not recorded a valuation allowance on any deferred tax assets. In the event that sufficient taxable income of the same character does not result in future years, among other things, a valuation allowance for certain of our deferred tax assets may be required.
63
Payments pursuant to the Tax Receivable Agreements (“TRAs”)
The TRAs, which we entered into as part of the IPO Reorganization, generally provide for the payment by us to certain counterparties of 85% of the amount of cash savings, if any, in U.S. federal, state and local income taxes that we actually realize (or are deemed to realize in certain circumstances) in periods after the IPO as a result of the merger of H&F Corp into us as part of the IPO Reorganization, our purchase of partnership units from certain of our investors and exchanges of partnership units and future purchases or exchange of partnership units. We have recorded a liability of
$589.1 million
at
December 31, 2015
related to those expected payment obligations. The actual amount and timing of any payments may vary from this estimate due to a number of factors, including a material change in the relevant tax law or our failure to earn sufficient taxable income to realize all estimated tax benefits. The expected payment obligation assumes no additional uncertain tax positions that would impact the TRAs.
New or Revised Accounting Standards
See Note 3, “Summary of Significant Accounting Policies — Recent accounting pronouncements” to the Consolidated Financial Statements included in Item 8 of Part II of this Form 10-K.
Market Risk
Our exposure to market risk is directly related to the role of our operating company as an investment adviser for the pooled vehicles and separate accounts it manages. Essentially all of our revenues are derived from investment management agreements with these vehicles and accounts. Under these agreements, the investment management fees we receive are generally based on the value of our assets under management and our fee rates. Accordingly, if our assets under management decline as a result of market depreciation, our revenues and net income will also decline. In addition, such a decline could cause our clients to withdraw their funds in favor of investments believed to offer higher returns or lower risk, which would cause our revenues to decline further.
The value of our assets under management was
$99.8 billion
as of
December 31, 2015
. A
10%
increase or decrease in the value of our assets under management, if proportionately distributed over all our investment strategies, products and client relationships, would cause an annualized increase or decrease in our revenues of approximately
$75.9 million
at our current weighted average fee rate of
76
basis points. Because of our declining rates of fee for larger relationships and differences in our rates of fee across investment strategies, a change in the composition of our assets under management, in particular an increase in the proportion of our total assets under management attributable to strategies, clients or relationships with lower effective rates of fees, could have a material negative impact on our overall weighted average rate of fee. The same
10%
increase or decrease in the value of our total assets under management, if attributed entirely to a proportionate increase or decrease in the assets of each of the Artisan Funds, to which we provide a range of services in addition to those provided to separate accounts, would cause an annualized increase or decrease in our revenues of approximately
$92.9 million
at the Artisan Funds weighted average fee of
93
basis points. If the same
10%
increase or decrease in the value of our total assets under management was attributable entirely to a proportionate increase or decrease in the assets of each separate account we manage, it would cause an annualized increase or decrease in our revenues of approximately
$54.9 million
at the current weighted average fee rate across all of our separate accounts of
55
basis points.
As is customary in the asset management industry, clients invest in particular strategies to gain exposure to certain asset classes, which exposes their investment to the benefits and risks of those asset classes. Because we believe that our clients invest in each of our strategies in order to gain exposure to the portfolio securities of the respective strategies and may implement their own risk management program or procedures, we have not adopted a corporate-level risk management policy regarding client assets, nor have we attempted to hedge at the corporate level or within individual strategies the market risks that would affect the value of our overall assets under management and related revenues. Some of these risks (
e.g.
, sector risks and currency risks) are inherent in certain strategies, and clients may invest in particular strategies to gain exposure to particular risks. While negative returns in our investment strategies and net client cash outflows do not directly reduce the assets on our balance sheet (because the assets we manage are owned by our clients, not us), any reduction in the value of our assets under management would result in a reduction in our revenues.
We also are subject to market risk from a decline in the prices of marketable securities that we own. The total value of marketable securities we owned was
$10.3 million
as of
December 31, 2015
. We invested in certain of Artisan Funds and Artisan Global Funds in amounts sufficient to cover certain organizational expenses and to ensure that the funds had sufficient assets at the commencement of their operations to build a viable investment portfolio. Assuming a 10% increase or decrease in the values of our total marketable securities, the fair value would increase or decrease by
$1.0 million
at
December 31, 2015
. Management regularly monitors the value of these investments; however, given their nature and relative size, we have not adopted a specific risk management policy to manage the associated market risk. Due to the nature of our business, we believe that we do not face any material risk from inflation.
64
Exchange Rate Risk
A substantial portion of the accounts that we advise, or sub-advise, hold investments that are denominated in currencies other than the U.S. dollar. Movements in the rate of exchange between the U.S. dollar and the underlying foreign currency affect the values of assets held in accounts we manage, thereby affecting the amount of revenues we earn. The value of the assets we manage was
$99.8 billion
as of
December 31, 2015
.
As of December 31, 2015
, approximately 47% of our assets under management across our investment strategies were invested in strategies that primarily invest in securities of non-U.S. companies and approximately
43%
of our assets under management were invested in securities denominated in currencies other than the U.S. dollar. To the extent our assets under management are denominated in currencies other than the U.S. dollar, the value of those assets under management will decrease with an increase in the value of the U.S. dollar, or increase with a decrease in the value of the U.S. dollar. Each investment team monitors its own exposure to exchange rate risk and makes decisions on how to manage that risk in the portfolios managed by that team. Because we believe that many of our clients invest in those strategies in order to gain exposure to non-U.S. currencies, or may implement their own hedging programs, we do not often hedge an investment portfolio’s exposure to a non-U.S. currency.
We have not adopted a corporate-level risk management policy to manage this exchange rate risk. Assuming that
43%
of our assets under management is invested in securities denominated in currencies other than the U.S. dollar and excluding the impact of any hedging arrangements, a
10%
increase or decrease in the value of the U.S. dollar would decrease or increase the fair value of our assets under management by
$4.3 billion
, which would cause an annualized increase or decrease in revenues of approximately
$32.3 million
at our current weighted average fee rate of
76
basis points.
We operate in several foreign countries of which the United Kingdom is the most prominent. We incur operating expenses and have foreign currency-denominated assets and liabilities associated with these operations, although our revenues are predominately realized in USD. We do not believe that foreign currency fluctuations materially affect our results of operations.
Interest Rate Risk
At certain times, we invest our available cash balances in money market mutual funds that invest primarily in U.S. Treasury or agency-backed money market instruments. These funds attempt to maintain a stable net asset value but interest rate changes or other market risks may affect the fair value of those funds’ investments and, if significant, could result in a loss of investment principal. Interest rate changes affect the income we earn from our excess cash balances.
As of December 31, 2015
, we invested
$49.0 million
of our available cash in money market funds that invested solely in U.S. Treasuries. Given the current low yield on these funds, interest rate changes would not have a material impact on the income we earn from these investments. The remaining portion of our cash was held in demand deposit accounts.
Interest rate changes may affect the amount of our interest payments in connection with our revolving credit agreement, and thereby affect future earnings and cash flows.
As of December 31, 2015
, there were no borrowings outstanding under the revolving credit agreement.
Our High Income strategy, which had $989 million of AUM as of December 31, 2015, invests in fixed income securities. The values of debt instruments held by the strategy may fall in response to increases in interest rates, which would reduce our revenues.
65
|
|
|
|
Index to Financial Statements:
|
Page
|
66
Report of Independent Registered Public Accounting Firm
To the Stockholders of Artisan Partners Asset Management Inc.
In our opinion, the accompanying consolidated statements of financial condition and the related consolidated statements of operations, of comprehensive income (loss), of changes in stockholders’ equity and of cash flows present fairly, in all material respects, the financial position of Artisan Partners Asset Management Inc.
and its subsidiaries at December 31, 2015 and 2014, and the results of their operations and their cash flows for each of the three years in the period ended
December 31, 2015 in conformity with accounting principles generally accepted in the United States of America. Also in our opinion, the Company maintained, in all material respects, effective internal control over financial reporting as of
December 31, 2015, based on criteria established in
Internal Control - Integrated Framework
(2013)
issued by the Committee of Sponsoring Organizations of the Treadway Commission (COSO). The Company’s management is responsible for these financial statements, for maintaining effective internal control over financial reporting and for its assessment of the effectiveness of internal control over financial reporting, included in the Report of Management on Internal Control over Financial Reporting appearing under Item 9A “Controls and Procedures”. Our responsibility is to express opinions on these financial statements and on the Company’s internal control over financial reporting based on our audits (which were integrated audits in 2015 and 2014). We conducted our audits in accordance with the standards of the Public Company Accounting Oversight Board (United States). Those standards require that we plan and perform the audits to obtain reasonable assurance about whether the financial statements are free of material misstatement and whether effective internal control over financial reporting was maintained in all material respects. Our audits of the financial statements included examining, on a test basis, evidence supporting the amounts and disclosures in the financial statements, assessing the accounting principles used and significant estimates made by management, and evaluating the overall financial statement presentation. Our audit of internal control over financial reporting included obtaining an understanding of internal control over financial reporting, assessing the risk that a material weakness exists, and testing and evaluating the design and operating effectiveness of internal control based on the assessed risk. Our audits also included performing such other procedures as we considered necessary in the circumstances. We believe that our audits provide a reasonable basis for our opinions.
A company’s internal control over financial reporting is a process designed to provide reasonable assurance regarding the reliability of financial reporting and the preparation of financial statements for external purposes in accordance with generally accepted accounting principles. A company’s internal control over financial reporting includes those policies and procedures that (i) pertain to the maintenance of records that, in reasonable detail, accurately and fairly reflect the transactions and dispositions of the assets of the company; (ii) provide reasonable assurance that transactions are recorded as necessary to permit preparation of financial statements in accordance with generally accepted accounting principles, and that receipts and expenditures of the company are being made only in accordance with authorizations of management and directors of the company; and (iii) provide reasonable assurance regarding prevention or timely detection of unauthorized acquisition, use, or disposition of the company’s assets that could have a material effect on the financial statements.
Because of its inherent limitations, internal control over financial reporting may not prevent or detect misstatements. Also, projections of any evaluation of effectiveness to future periods are subject to the risk that controls may become inadequate because of changes in conditions, or that the degree of compliance with the policies or procedures may deteriorate.
/s/ PRICEWATERHOUSECOOPERS LLP
Milwaukee, Wisconsin
February 25, 2016
67
|
ARTISAN PARTNERS ASSET MANAGEMENT INC.
Consolidated Statements of Financial Condition
(U.S. dollars in thousands, except per share amounts)
|
|||||||
|
At December 31,
|
|||||||
|
2015
|
2014
|
||||||
|
ASSETS
|
|||||||
|
Cash and cash equivalents
|
$
|
166,193
|
|
$
|
182,284
|
|
|
|
Accounts receivable
|
60,058
|
|
69,361
|
|
|||
|
Investment securities
|
10,290
|
|
6,712
|
|
|||
|
Prepaid expenses
|
7,474
|
|
5,892
|
|
|||
|
Property and equipment, net
|
17,995
|
|
16,594
|
|
|||
|
Restricted cash
|
889
|
|
925
|
|
|||
|
Deferred tax assets
|
678,537
|
|
562,396
|
|
|||
|
Other
|
5,096
|
|
5,288
|
|
|||
|
Total assets
|
$
|
946,532
|
|
$
|
849,452
|
|
|
|
LIABILITIES AND STOCKHOLDERS’ EQUITY
|
|||||||
|
Accounts payable, accrued expenses, and other
|
$
|
18,052
|
|
$
|
21,934
|
|
|
|
Accrued incentive compensation
|
13,748
|
|
12,973
|
|
|||
|
Deferred lease obligations
|
3,478
|
|
3,608
|
|
|||
|
Borrowings
|
200,000
|
|
200,000
|
|
|||
|
Class B redemptions payable
|
5,602
|
|
14,284
|
|
|||
|
Amounts payable under tax receivable agreements
|
589,101
|
|
489,154
|
|
|||
|
Total liabilities
|
$
|
829,981
|
|
$
|
741,953
|
|
|
|
Commitments and contingencies
|
|
|
|
|
|||
|
Common stock
|
|||||||
|
Class A common stock ($0.01 par value per share, 500,000,000 shares authorized, 39,432,605 and 34,238,131 shares outstanding at December 31, 2015 and December 31, 2014, respectively)
|
394
|
|
342
|
|
|||
|
Class B common stock ($0.01 par value per share, 200,000,000 shares authorized, 18,327,222 and 21,463,033 shares outstanding at December 31, 2015 and December 31, 2014, respectively)
|
183
|
|
215
|
|
|||
|
Class C common stock ($0.01 par value per share, 400,000,000 shares authorized, 15,649,101 and 17,226,379 shares outstanding at December 31, 2015 and December 31, 2014, respectively)
|
157
|
|
172
|
|
|||
|
Additional paid-in capital
|
116,448
|
|
93,524
|
|
|||
|
Retained earnings
|
13,238
|
|
16,417
|
|
|||
|
Accumulated other comprehensive income (loss)
|
(375
|
)
|
206
|
|
|||
|
Total stockholders’ equity
|
130,045
|
|
110,876
|
|
|||
|
Noncontrolling interest - Artisan Partners Holdings
|
(13,494
|
)
|
(3,377
|
)
|
|||
|
Total equity
|
$
|
116,551
|
|
$
|
107,499
|
|
|
|
Total liabilities and equity
|
$
|
946,532
|
|
$
|
849,452
|
|
|
The accompanying notes are an integral part of the consolidated financial statements.
68
|
ARTISAN PARTNERS ASSET MANAGEMENT INC.
Consolidated Statements of Operations
(U.S. dollars in thousands, except per share amounts)
|
|||||||||||
|
For the Years Ended December 31,
|
|||||||||||
|
2015
|
2014
|
2013
|
|||||||||
|
Revenues
|
|||||||||||
|
Management fees
|
$
|
803,701
|
|
$
|
827,651
|
|
$
|
683,322
|
|
||
|
Performance fees
|
1,768
|
|
1,050
|
|
2,519
|
|
|||||
|
Total revenues
|
$
|
805,469
|
|
$
|
828,701
|
|
$
|
685,841
|
|
||
|
Operating Expenses
|
|||||||||||
|
Compensation and benefits
|
|||||||||||
|
Salaries, incentive compensation and benefits
|
372,167
|
|
350,302
|
|
309,163
|
|
|||||
|
Pre-offering related compensation - share-based awards
|
42,071
|
|
64,664
|
|
404,160
|
|
|||||
|
Pre-offering related compensation - other
|
—
|
|
—
|
|
143,035
|
|
|||||
|
Total compensation and benefits
|
414,238
|
|
414,966
|
|
856,358
|
|
|||||
|
Distribution and marketing
|
43,626
|
|
49,132
|
|
38,398
|
|
|||||
|
Occupancy
|
12,504
|
|
11,255
|
|
10,476
|
|
|||||
|
Communication and technology
|
25,487
|
|
21,002
|
|
14,426
|
|
|||||
|
General and administrative
|
27,229
|
|
25,443
|
|
27,387
|
|
|||||
|
Total operating expenses
|
523,084
|
|
521,798
|
|
947,045
|
|
|||||
|
Total operating income (loss)
|
282,385
|
|
306,903
|
|
(261,204
|
)
|
|||||
|
Non-operating income (loss)
|
|||||||||||
|
Interest expense
|
(11,706
|
)
|
(11,572
|
)
|
(11,869
|
)
|
|||||
|
Net gains (losses) of Launch Equity
|
—
|
|
(3,964
|
)
|
10,623
|
|
|||||
|
Net gain on the valuation of contingent value rights
|
—
|
|
—
|
|
49,570
|
|
|||||
|
Net investment income
|
424
|
|
681
|
|
5,138
|
|
|||||
|
Net loss on the tax receivable agreements
|
(12,247
|
)
|
(4,187
|
)
|
—
|
|
|||||
|
Other non-operating income (loss)
|
21
|
|
(282
|
)
|
—
|
|
|||||
|
Total non-operating income (loss)
|
(23,508
|
)
|
(19,324
|
)
|
53,462
|
|
|||||
|
Income (loss) before income taxes
|
258,877
|
|
287,579
|
|
(207,742
|
)
|
|||||
|
Provision for income taxes
|
46,771
|
|
48,829
|
|
26,390
|
|
|||||
|
Net income (loss) before noncontrolling interests
|
212,106
|
|
238,750
|
|
(234,132
|
)
|
|||||
|
Less: Net income (loss) attributable to noncontrolling interests - Artisan Partners Holdings
|
130,305
|
|
173,085
|
|
(269,562
|
)
|
|||||
|
Less: Net income (loss) attributable to noncontrolling interests - Launch Equity
|
—
|
|
(3,964
|
)
|
10,623
|
|
|||||
|
Net income attributable to Artisan Partners Asset Management Inc.
|
$
|
81,801
|
|
$
|
69,629
|
|
$
|
24,807
|
|
||
|
January 1, 2015 to December 31, 2015
|
January 1, 2014 to December 31, 2014
|
March 12, 2013 to December 31, 2013
|
|||||||||
|
Basic and diluted earnings (loss) per share
|
$
|
1.86
|
|
$
|
(0.37
|
)
|
$
|
(2.04
|
)
|
||
|
Basic and diluted weighted average number of common shares outstanding
|
35,448,550
|
|
27,514,394
|
|
13,780,378
|
|
|||||
|
Dividends declared per Class A common share
|
$
|
3.35
|
|
$
|
3.83
|
|
$
|
0.86
|
|
||
The accompanying notes are an integral part of the consolidated financial statements.
69
|
ARTISAN PARTNERS ASSET MANAGEMENT INC.
Consolidated Statements of Comprehensive Income (Loss)
(U.S. dollars in thousands)
|
|||||||||||
|
For the Years Ended December 31,
|
|||||||||||
|
2015
|
2014
|
2013
|
|||||||||
|
Net income (loss) before noncontrolling interests
|
$
|
212,106
|
|
$
|
238,750
|
|
$
|
(234,132
|
)
|
||
|
Other comprehensive income (loss), net of tax
|
|||||||||||
|
Unrealized gain (loss) on investment securities:
|
|||||||||||
|
Unrealized holding gain (loss) on investment securities, net of tax of ($146), ($16) and $171, respectively
|
(301
|
)
|
(241
|
)
|
3,655
|
|
|||||
|
Less: reclassification adjustment for net gains included in net income
|
424
|
|
295
|
|
4,119
|
|
|||||
|
Net unrealized gain (loss) on investment securities
|
(725
|
)
|
(536
|
)
|
(464
|
)
|
|||||
|
Foreign currency translation gain (loss)
|
(586
|
)
|
(510
|
)
|
197
|
|
|||||
|
Total other comprehensive income (loss)
|
(1,311
|
)
|
(1,046
|
)
|
(267
|
)
|
|||||
|
Comprehensive income (loss)
|
210,795
|
|
237,704
|
|
(234,399
|
)
|
|||||
|
Comprehensive income (loss) attributable to noncontrolling interests - Artisan Partners Holdings
|
129,574
|
|
172,211
|
|
(270,207
|
)
|
|||||
|
Comprehensive income (loss) attributable to noncontrolling interests - Launch Equity
|
—
|
|
(3,964
|
)
|
10,623
|
|
|||||
|
Comprehensive income attributable to Artisan Partners Asset Management Inc.
|
$
|
81,221
|
|
$
|
69,457
|
|
$
|
25,185
|
|
||
The accompanying notes are an integral part of the consolidated financial statements.
70
|
ARTISAN PARTNERS ASSET MANAGEMENT INC.
Consolidated Statements of Changes in Stockholders' Equity
(U.S. dollars in thousands)
|
|||||||||||||||||||||||||||||||||
|
Class A Common Stock
|
Class B Common Stock
|
Class C Common Stock
|
Convertible Preferred Stock
|
Additional Paid-in Capital
|
Retained Earnings
|
Accumulated Other Comprehensive Income
|
Noncontrolling interest - Artisan Partners Holdings
|
Noncontrolling interest - Launch Equity
|
Total Equity (Deficit)
|
Redeemable Preferred Units
|
|||||||||||||||||||||||
|
Balance at January 1, 2013
|
$
|
—
|
|
$
|
—
|
|
$
|
—
|
|
$
|
—
|
|
$
|
—
|
|
$
|
—
|
|
$
|
—
|
|
$
|
(709,414
|
)
|
$
|
36,699
|
|
$
|
(672,715
|
)
|
$
|
357,194
|
|
|
Net income (loss)
|
—
|
|
—
|
|
—
|
|
—
|
|
—
|
|
—
|
|
—
|
|
(434,342
|
)
|
—
|
|
(434,342
|
)
|
—
|
|
|||||||||||
|
Other comprehensive income
|
—
|
|
—
|
|
—
|
|
—
|
|
—
|
|
—
|
|
—
|
|
1,065
|
|
—
|
|
1,065
|
|
—
|
|
|||||||||||
|
Partnership distributions
|
—
|
|
—
|
|
—
|
|
—
|
|
—
|
|
—
|
|
—
|
|
(100,514
|
)
|
—
|
|
(100,514
|
)
|
—
|
|
|||||||||||
|
Modifications of equity award and other pre-offering related compensation
|
—
|
|
—
|
|
—
|
|
—
|
|
—
|
|
—
|
|
—
|
|
572,471
|
|
—
|
|
572,471
|
|
—
|
|
|||||||||||
|
Modification of redeemable preferred units
|
—
|
|
—
|
|
—
|
|
—
|
|
—
|
|
—
|
|
—
|
|
357,194
|
|
—
|
|
357,194
|
|
(357,194
|
)
|
|||||||||||
|
Initial establishment of contingent value right liability
|
—
|
|
—
|
|
—
|
|
—
|
|
—
|
|
—
|
|
—
|
|
(55,440
|
)
|
—
|
|
(55,440
|
)
|
—
|
|
|||||||||||
|
Capital redemption
|
—
|
|
—
|
|
—
|
|
—
|
|
—
|
|
—
|
|
—
|
|
(16
|
)
|
—
|
|
(16
|
)
|
—
|
|
|||||||||||
|
Balance at March 12, 2013
|
$
|
—
|
|
$
|
—
|
|
$
|
—
|
|
$
|
—
|
|
$
|
—
|
|
$
|
—
|
|
$
|
—
|
|
$
|
(368,996
|
)
|
$
|
36,699
|
|
$
|
(332,297
|
)
|
$
|
—
|
|
|
IPO proceeds
|
—
|
|
—
|
|
—
|
|
—
|
|
—
|
|
—
|
|
—
|
|
353,414
|
|
—
|
|
353,414
|
|
—
|
|
|||||||||||
|
Attribution of noncontrolling interest at IPO
|
127
|
|
263
|
|
284
|
|
74,748
|
|
(58,365
|
)
|
—
|
|
662
|
|
(17,719
|
)
|
—
|
|
—
|
|
—
|
|
|||||||||||
|
Redemption of partnership units
|
—
|
|
—
|
|
—
|
|
—
|
|
—
|
|
—
|
|
—
|
|
(76,319
|
)
|
—
|
|
(76,319
|
)
|
—
|
|
|||||||||||
|
Deferred tax assets, net of amounts payable under tax receivable agreements
|
—
|
|
—
|
|
—
|
|
—
|
|
36,799
|
|
—
|
|
—
|
|
—
|
|
—
|
|
36,799
|
|
—
|
|
|||||||||||
|
Net income (loss)
|
—
|
|
—
|
|
—
|
|
—
|
|
—
|
|
24,807
|
|
—
|
|
164,780
|
|
10,623
|
|
200,210
|
|
—
|
|
|||||||||||
|
Other comprehensive income - foreign currency translation
|
—
|
|
—
|
|
—
|
|
—
|
|
—
|
|
—
|
|
134
|
|
390
|
|
—
|
|
524
|
|
—
|
|
|||||||||||
|
Other comprehensive income - available for sale investments, net of tax
|
—
|
|
—
|
|
—
|
|
—
|
|
—
|
|
—
|
|
(250
|
)
|
(1,293
|
)
|
—
|
|
(1,543
|
)
|
—
|
|
|||||||||||
|
Cumulative impact of changes in ownership of Artisan Partners Holdings LP, net of tax
|
—
|
|
—
|
|
—
|
|
—
|
|
(50,312
|
)
|
—
|
|
(168
|
)
|
50,167
|
|
—
|
|
(313
|
)
|
—
|
|
|||||||||||
|
Capital contribution
|
—
|
|
—
|
|
—
|
|
—
|
|
—
|
|
—
|
|
—
|
|
—
|
|
3,150
|
|
3,150
|
|
—
|
|
|||||||||||
|
Amortization of equity-based compensation
|
—
|
|
—
|
|
—
|
|
—
|
|
20,365
|
|
—
|
|
—
|
|
62,581
|
|
—
|
|
82,946
|
|
—
|
|
|||||||||||
|
Forfeitures
|
—
|
|
(10
|
)
|
9
|
|
—
|
|
1
|
|
—
|
|
—
|
|
—
|
|
—
|
|
—
|
|
—
|
|
|||||||||||
|
Issuance of restricted stock awards
|
16
|
|
—
|
|
—
|
|
—
|
|
(16
|
)
|
—
|
|
—
|
|
—
|
|
—
|
|
—
|
|
—
|
|
|||||||||||
|
Issuance of class A common stock, net of issuance costs
|
55
|
|
—
|
|
—
|
|
—
|
|
295,447
|
|
—
|
|
—
|
|
—
|
|
—
|
|
295,502
|
|
—
|
|
|||||||||||
|
Purchase of convertible preferred stock and subsidiary equity
|
—
|
|
—
|
|
(41
|
)
|
(39,839
|
)
|
(237,531
|
)
|
(8,785
|
)
|
—
|
|
(4,689
|
)
|
—
|
|
(290,885
|
)
|
—
|
|
|||||||||||
|
Distributions
|
—
|
|
—
|
|
—
|
|
—
|
|
—
|
|
—
|
|
—
|
|
(124,256
|
)
|
—
|
|
(124,256
|
)
|
—
|
|
|||||||||||
|
Dividends
|
—
|
|
—
|
|
—
|
|
—
|
|
—
|
|
(14,621
|
)
|
—
|
|
—
|
|
—
|
|
(14,621
|
)
|
—
|
|
|||||||||||
|
Balance at December 31, 2013
|
$
|
198
|
|
$
|
253
|
|
$
|
252
|
|
$
|
34,909
|
|
$
|
6,388
|
|
$
|
1,401
|
|
$
|
378
|
|
$
|
38,060
|
|
$
|
50,472
|
|
$
|
132,311
|
|
$
|
—
|
|
71
|
ARTISAN PARTNERS ASSET MANAGEMENT INC.
Consolidated Statements of Changes in Stockholders' Equity, continued
(U.S. dollars in thousands)
|
||||||||||||||||||||||||||||||
|
Class A Common Stock
|
Class B Common Stock
|
Class C Common Stock
|
Convertible Preferred Stock
|
Additional Paid-in Capital
|
Retained Earnings
|
Accumulated Other Comprehensive Income
|
Noncontrolling interest - Artisan Partners Holdings
|
Noncontrolling interest - Launch Equity
|
Total Equity (Deficit)
|
|||||||||||||||||||||
|
Balance at January 1, 2014
|
$
|
198
|
|
$
|
253
|
|
$
|
252
|
|
$
|
34,909
|
|
$
|
6,388
|
|
$
|
1,401
|
|
$
|
378
|
|
$
|
38,060
|
|
$
|
50,472
|
|
$
|
132,311
|
|
|
Net income (loss)
|
—
|
|
—
|
|
—
|
|
—
|
|
—
|
|
69,629
|
|
—
|
|
173,085
|
|
(3,964
|
)
|
238,750
|
|
||||||||||
|
Other comprehensive income - foreign currency translation
|
—
|
|
—
|
|
—
|
|
—
|
|
—
|
|
—
|
|
(255
|
)
|
(255
|
)
|
—
|
|
(510
|
)
|
||||||||||
|
Other comprehensive income - available for sale investments, net of tax
|
—
|
|
—
|
|
—
|
|
—
|
|
—
|
|
—
|
|
(175
|
)
|
(243
|
)
|
—
|
|
(418
|
)
|
||||||||||
|
Cumulative impact of changes in ownership of Artisan Partners Holdings LP, net of tax
|
—
|
|
—
|
|
—
|
|
—
|
|
(10,481
|
)
|
—
|
|
258
|
|
10,105
|
|
—
|
|
(118
|
)
|
||||||||||
|
Capital contribution
|
—
|
|
—
|
|
—
|
|
—
|
|
—
|
|
—
|
|
—
|
|
—
|
|
2,980
|
|
2,980
|
|
||||||||||
|
Capital redemption
|
—
|
|
—
|
|
—
|
|
—
|
|
—
|
|
—
|
|
—
|
|
—
|
|
(49,488
|
)
|
(49,488
|
)
|
||||||||||
|
Amortization of equity-based compensation
|
—
|
|
—
|
|
—
|
|
—
|
|
36,175
|
|
—
|
|
—
|
|
52,081
|
|
—
|
|
88,256
|
|
||||||||||
|
Deferred tax assets, net of amounts payable under tax receivable agreements
|
—
|
|
—
|
|
—
|
|
—
|
|
64,520
|
|
—
|
|
—
|
|
—
|
|
—
|
|
64,520
|
|
||||||||||
|
Issuance of Class A common stock, net of issuance costs
|
111
|
|
—
|
|
—
|
|
—
|
|
552,178
|
|
—
|
|
—
|
|
—
|
|
—
|
|
552,289
|
|
||||||||||
|
Issuance of restricted stock awards
|
14
|
|
—
|
|
—
|
|
—
|
|
(14
|
)
|
—
|
|
—
|
|
—
|
|
—
|
|
—
|
|
||||||||||
|
Employee net share settlement
|
—
|
|
—
|
|
—
|
|
—
|
|
(136
|
)
|
—
|
|
—
|
|
(166
|
)
|
—
|
|
(302
|
)
|
||||||||||
|
Purchase of equity and subsidiary equity
|
—
|
|
(38
|
)
|
(47
|
)
|
(21,652
|
)
|
(533,204
|
)
|
—
|
|
—
|
|
812
|
|
—
|
|
(554,129
|
)
|
||||||||||
|
Conversion of preferred stock and exchange of subsidiary equity
|
19
|
|
—
|
|
(33
|
)
|
(13,257
|
)
|
23,289
|
|
—
|
|
—
|
|
(10,018
|
)
|
—
|
|
—
|
|
||||||||||
|
Distributions
|
—
|
|
—
|
|
—
|
|
—
|
|
—
|
|
—
|
|
—
|
|
(266,838
|
)
|
—
|
|
(266,838
|
)
|
||||||||||
|
Dividends
|
—
|
|
—
|
|
—
|
|
—
|
|
(45,191
|
)
|
(54,613
|
)
|
—
|
|
—
|
|
—
|
|
(99,804
|
)
|
||||||||||
|
Balance at January 1, 2015
|
$
|
342
|
|
$
|
215
|
|
$
|
172
|
|
$
|
—
|
|
$
|
93,524
|
|
$
|
16,417
|
|
$
|
206
|
|
$
|
(3,377
|
)
|
$
|
—
|
|
$
|
107,499
|
|
|
Net income
|
—
|
|
—
|
|
—
|
|
—
|
|
—
|
|
81,801
|
|
—
|
|
130,305
|
|
—
|
|
212,106
|
|
||||||||||
|
Other comprehensive income - foreign currency translation
|
—
|
|
—
|
|
—
|
|
—
|
|
—
|
|
—
|
|
(303
|
)
|
(283
|
)
|
—
|
|
(586
|
)
|
||||||||||
|
Other comprehensive income - available for sale investments, net of tax
|
—
|
|
—
|
|
—
|
|
—
|
|
—
|
|
—
|
|
(307
|
)
|
(383
|
)
|
—
|
|
(690
|
)
|
||||||||||
|
Cumulative impact of changes in ownership of Artisan Partners Holdings LP, net of tax
|
—
|
|
—
|
|
—
|
|
—
|
|
(5,463
|
)
|
—
|
|
29
|
|
5,399
|
|
—
|
|
(35
|
)
|
||||||||||
|
Amortization of equity-based compensation
|
—
|
|
—
|
|
—
|
|
—
|
|
42,144
|
|
—
|
|
—
|
|
37,376
|
|
—
|
|
79,520
|
|
||||||||||
|
Deferred tax assets, net of amounts payable under tax receivable agreements
|
—
|
|
—
|
|
—
|
|
—
|
|
26,075
|
|
—
|
|
—
|
|
—
|
|
—
|
|
26,075
|
|
||||||||||
|
Issuance of Class A common stock, net of issuance costs
|
38
|
|
—
|
|
—
|
|
—
|
|
175,974
|
|
—
|
|
—
|
|
—
|
|
—
|
|
176,012
|
|
||||||||||
|
Forfeitures
|
—
|
|
(4
|
)
|
3
|
|
—
|
|
1
|
|
—
|
|
—
|
|
—
|
|
—
|
|
—
|
|
||||||||||
|
Issuance of restricted stock awards
|
6
|
|
—
|
|
—
|
|
—
|
|
(6
|
)
|
—
|
|
—
|
|
—
|
|
—
|
|
—
|
|
||||||||||
|
Employee net share settlement
|
—
|
|
—
|
|
—
|
|
—
|
|
(358
|
)
|
—
|
|
—
|
|
(311
|
)
|
—
|
|
(669
|
)
|
||||||||||
|
Exchange of subsidiary equity
|
8
|
|
(4
|
)
|
(4
|
)
|
—
|
|
—
|
|
—
|
|
—
|
|
—
|
|
—
|
|
—
|
|
||||||||||
|
Purchase of equity and subsidiary equity
|
—
|
|
(24
|
)
|
(14
|
)
|
—
|
|
(176,520
|
)
|
—
|
|
—
|
|
—
|
|
—
|
|
(176,558
|
)
|
||||||||||
|
Distributions
|
—
|
|
—
|
|
—
|
|
—
|
|
—
|
|
—
|
|
—
|
|
(182,175
|
)
|
—
|
|
(182,175
|
)
|
||||||||||
|
Dividends
|
—
|
|
—
|
|
—
|
|
—
|
|
(38,923
|
)
|
(84,980
|
)
|
—
|
|
(45
|
)
|
—
|
|
(123,948
|
)
|
||||||||||
|
Balance at December 31, 2015
|
$
|
394
|
|
$
|
183
|
|
$
|
157
|
|
$
|
—
|
|
$
|
116,448
|
|
$
|
13,238
|
|
$
|
(375
|
)
|
$
|
(13,494
|
)
|
$
|
—
|
|
$
|
116,551
|
|
The accompanying notes are an integral part of the consolidated financial statements.
72
|
ARTISAN PARTNERS ASSET MANAGEMENT INC.
(U.S. dollars in thousands)
|
|||||||||||
|
For the Years Ended December 31,
|
|||||||||||
|
2015
|
2014
|
2013
|
|||||||||
|
Cash flows from operating activities
|
|||||||||||
|
Net income (loss) before noncontrolling interests
|
$
|
212,106
|
|
$
|
238,750
|
|
$
|
(234,132
|
)
|
||
|
Adjustments to reconcile net income to net cash provided by operating activities:
|
|
|
|
||||||||
|
Depreciation and amortization
|
4,519
|
|
3,250
|
|
3,225
|
|
|||||
|
Deferred income taxes
|
16,521
|
|
17,569
|
|
9,384
|
|
|||||
|
Reinvested dividends
|
—
|
|
(364
|
)
|
(1,019
|
)
|
|||||
|
Net gain on the valuation of contingent value rights
|
—
|
|
—
|
|
(49,570
|
)
|
|||||
|
Capital gains on the sale of investments, net
|
(424
|
)
|
(295
|
)
|
(4,119
|
)
|
|||||
|
Net loss on the tax receivable agreements
|
12,247
|
|
4,187
|
|
—
|
|
|||||
|
(Gains) losses of Launch Equity, net
|
—
|
|
3,964
|
|
(10,623
|
)
|
|||||
|
Proceeds from sale of investments by Launch Equity
|
—
|
|
147,862
|
|
146,967
|
|
|||||
|
Purchase of investments by Launch Equity
|
—
|
|
(120,272
|
)
|
(140,664
|
)
|
|||||
|
Loss on disposal of property and equipment
|
40
|
|
362
|
|
16
|
|
|||||
|
Amortization of debt issuance costs
|
448
|
|
448
|
|
448
|
|
|||||
|
Share-based compensation
|
79,520
|
|
88,256
|
|
655,417
|
|
|||||
|
Excess tax benefit on share-based awards
|
(1,300
|
)
|
(1,114
|
)
|
—
|
|
|||||
|
Change in assets and liabilities resulting in an increase (decrease) in cash:
|
|||||||||||
|
Net change in operating assets and liabilities of Launch Equity
|
—
|
|
18,919
|
|
(9,453
|
)
|
|||||
|
Accounts receivable
|
9,303
|
|
(5,599
|
)
|
(17,739
|
)
|
|||||
|
Prepaid expenses and other assets
|
(2,614
|
)
|
(1,607
|
)
|
(1,966
|
)
|
|||||
|
Accounts payable and accrued expenses
|
(316
|
)
|
12,638
|
|
(2,405
|
)
|
|||||
|
Class B liability awards
|
(8,682
|
)
|
(8,742
|
)
|
(231,480
|
)
|
|||||
|
Deferred lease obligations
|
(129
|
)
|
(136
|
)
|
(121
|
)
|
|||||
|
Net cash provided by operating activities
|
321,239
|
|
398,076
|
|
112,166
|
|
|||||
|
Cash flows from investing activities
|
|||||||||||
|
Acquisition of property and equipment
|
(3,794
|
)
|
(4,797
|
)
|
(2,359
|
)
|
|||||
|
Leasehold improvements
|
(3,541
|
)
|
(4,822
|
)
|
(832
|
)
|
|||||
|
Proceeds from sale of property and equipment
|
—
|
|
4
|
|
—
|
|
|||||
|
Proceeds from sale of investment securities
|
2,724
|
|
11,610
|
|
16,932
|
|
|||||
|
Purchase of investment securities
|
(6,750
|
)
|
(10,031
|
)
|
(5,000
|
)
|
|||||
|
Change in restricted cash
|
36
|
|
260
|
|
—
|
|
|||||
|
Net cash provided by (used in) investing activities
|
(11,325
|
)
|
(7,776
|
)
|
8,741
|
|
|||||
73
|
ARTISAN PARTNERS ASSET MANAGEMENT INC.
Consolidated Statements of Cash Flows, continued
(U.S. dollars in thousands)
|
|||||||||||
|
For the Years Ended December 31,
|
|||||||||||
|
2015
|
2014
|
2013
|
|||||||||
|
Cash flows from financing activities
|
|||||||||||
|
Partnership distributions
|
(182,175
|
)
|
(266,838
|
)
|
(224,786
|
)
|
|||||
|
Dividends paid
|
(123,948
|
)
|
(99,804
|
)
|
(14,621
|
)
|
|||||
|
Change in other liabilities
|
(46
|
)
|
(66
|
)
|
(63
|
)
|
|||||
|
Repayment under revolving credit facility
|
—
|
|
—
|
|
(90,000
|
)
|
|||||
|
Payment of amounts owed under the tax receivable agreements
|
(20,040
|
)
|
(4,645
|
)
|
—
|
|
|||||
|
Net proceeds from issuance of common stock
|
176,558
|
|
554,129
|
|
653,335
|
|
|||||
|
Payment of costs directly associated with the issuance of Class A common stock
|
(427
|
)
|
(2,806
|
)
|
(4,168
|
)
|
|||||
|
Purchase of preferred stock and subsidiary equity
|
(176,558
|
)
|
(554,129
|
)
|
(296,755
|
)
|
|||||
|
Purchase of Class A common units
|
—
|
|
—
|
|
(76,319
|
)
|
|||||
|
Taxes paid related to employee net share settlement
|
(669
|
)
|
(302
|
)
|
—
|
|
|||||
|
Capital invested into Launch Equity
|
—
|
|
2,980
|
|
3,150
|
|
|||||
|
Capital distributed by Launch Equity
|
—
|
|
(49,488
|
)
|
—
|
|
|||||
|
Excess tax benefit on share-based awards
|
1,300
|
|
1,114
|
|
—
|
|
|||||
|
Net cash used in financing activities
|
(326,005
|
)
|
(419,855
|
)
|
(50,227
|
)
|
|||||
|
Net increase (decrease) in cash and cash equivalents
|
(16,091
|
)
|
(29,555
|
)
|
70,680
|
|
|||||
|
Cash and cash equivalents
|
|||||||||||
|
Beginning of period
|
182,284
|
|
211,839
|
|
141,159
|
|
|||||
|
End of period
|
$
|
166,193
|
|
$
|
182,284
|
|
$
|
211,839
|
|
||
|
Supplementary information
|
|||||||||||
|
Noncash activity:
|
|||||||||||
|
Issuance of preferred stock
|
$
|
—
|
|
$
|
—
|
|
$
|
74,748
|
|
||
|
Establishment of deferred tax assets - IPO
|
—
|
|
—
|
|
73,574
|
|
|||||
|
Establishment of amounts payable under tax receivable agreements - IPO
|
—
|
|
—
|
|
55,358
|
|
|||||
|
Establishment of deferred tax assets - Post-IPO
|
132,516
|
|
392,058
|
|
123,888
|
|
|||||
|
Establishment of amounts payable under tax receivable agreements - Post-IPO
|
107,740
|
|
328,667
|
|
105,305
|
|
|||||
|
Establishment of contingent value rights
|
—
|
|
—
|
|
55,440
|
|
|||||
|
Cash paid for:
|
|||||||||||
|
Interest on borrowings
|
$
|
11,019
|
|
$
|
11,108
|
|
$
|
11,423
|
|
||
|
Income tax
|
29,316
|
|
30,685
|
|
16,449
|
|
|||||
The accompanying notes are an integral part of the consolidated financial statements.
74
ARTISAN PARTNERS ASSET MANAGEMENT INC.
Notes to Consolidated Financial Statements
(U.S. currencies in thousands, except per share or per unit amounts and as otherwise indicated)
Nature of Business
Artisan Partners Asset Management, Inc. (“APAM” or “Artisan”) is an investment management firm focused on providing high-value added, active investment strategies to sophisticated clients globally. Artisan has
seven
autonomous investment teams that manage a broad range of U.S., non-U.S. and global investment strategies. During the second quarter of 2015, Artisan launched its newest investment strategy, the Artisan Partners Developing World strategy, which is managed by the firm’s Developing World team.
Strategies are offered through multiple investment vehicles to accommodate a broad range of client mandates. Artisan offers its investment management services primarily to institutions and through intermediaries that operate with institutional-like decision-making processes and have long-term investment horizons.
Organization
On March 12, 2013, APAM completed its initial public offering (the “IPO”). APAM was formed for the purpose of becoming the general partner of Artisan Partners Holdings LP (“Artisan Partners Holdings” or “Holdings”) in connection with the IPO. Holdings is a holding company for the investment management business conducted under the name “Artisan Partners”. The partnership interests in Holdings consist of GP units, Class A, B, D and E common units. The reorganization (“IPO Reorganization”) established the necessary corporate structure to complete the IPO while at the same time preserving the ability of the firm to conduct operations through Holdings and its subsidiaries. See
Note 2, “Reorganization and IPO”
for more information on the reorganization and IPO.
As the sole general partner, APAM controls the business and affairs of Holdings. As a result, APAM consolidates Holdings’ financial statements and records a noncontrolling interest for the equity interests in Holdings held by the limited partners of Holdings. At
December 31, 2015
, APAM held approximately
54%
of the equity ownership interest in Holdings. APAM has been allocated a part of Holdings’ net income since March 12, 2013, when it became Holdings’ general partner.
Holdings, together with its wholly owned subsidiary, Artisan Investments GP LLC (“AIGP”), controls a
100%
interest in Artisan Partners Limited Partnership (“APLP”), a multi-product investment management firm that is the principal operating subsidiary of Artisan Partners Holdings. APLP is registered as an investment adviser with the U.S. Securities and Exchange Commission under the Investment Advisers Act of 1940. APLP provides investment advisory services to separate accounts and pooled investment vehicles, including Artisan Partners Funds, Inc. (“Artisan Funds” or the “Funds”) and Artisan Partners Global Funds PLC (“Artisan Global Funds”). Artisan Funds are a series of open-end, diversified mutual funds registered under the Investment Company Act of 1940, as amended. Artisan Global Funds is a family of Ireland-domiciled UCITS.
Artisan Partners Distributors LLC (“APDLLC”) is a wholly-owned subsidiary of Holdings. APDLLC is a limited purpose broker/dealer registered with the Financial Industry Regulatory Authority that serves as distributor of the shares of Artisan Funds and Artisan Global Funds and does not execute trades on behalf of clients. APDLLC is subject to the net capital requirements pursuant to Rule 15c3-1 of the Securities Exchange Act of 1934. At
December 31, 2015
, APDLLC had a ratio of aggregate indebtedness to net capital of
27%
and net capital was
$154
thousand, which was
$129
thousand in excess of its required net capital of
$25
thousand.
The consolidated financial statements include the accounts of APAM and all of its majority owned and controlled subsidiaries. APAM and its subsidiaries are hereafter referred to collectively as “Artisan” or the “Company”.
Note 2. Reorganization and IPO
Reorganization
In connection with the IPO, APAM and Holdings entered into a series of transactions in order to reorganize their capital structures and complete the IPO. The reorganization transactions included, among others, the following:
|
•
|
Appointment of APAM as the sole general partner of Holdings.
|
|
•
|
Modification of APAM’s capital structure into three classes of common stock and a series of convertible preferred stock. Shares of Class B common stock, Class C common stock and convertible preferred stock were issued to pre-IPO partners of Holdings. A description of these shares is included in
|
|
•
|
Merger (the “H&F Corp Merger”) into APAM of a corporation (“H&F Corp”) that at the time of the merger was a holder of preferred units and contingent value rights (“Partnership CVRs”) issued by Holdings and Class C common stock of APAM. As consideration for the merger, the shareholder of H&F Corp received shares of APAM’s convertible preferred stock, contingent value rights (“APAM CVRs”) issued by APAM, and the right to receive an amount of cash equal to H&F Corp’s share of the post-IPO distribution of Holdings pre-IPO retained profits.
|
75
|
•
|
Entry by APAM into two tax receivable agreements (“TRAs”), one with the pre-merger shareholder of H&F Corp (“Pre-H&F Merger Shareholder”) and the other with each limited partner of Holdings. Pursuant to the first TRA, APAM will pay to the counterparty a portion of certain tax benefits realized by APAM as a result of the H&F Corp Merger. Pursuant to the second TRA, APAM will pay to the counterparties a portion of certain tax benefits realized by APAM as a result of the purchase or exchange of Holdings limited partner units. The TRAs are further described in Note 3, “Summary of Significant Accounting Policies — Tax Receivable Agreements”
.
|
Because APAM and Holdings were under common control at the time of the reorganization, APAM’s acquisition of control of Holdings was accounted for as a transaction among entities under common control. The consolidated financial statements of APAM reflect the following:
|
•
|
Statements of Financial Condition - The assets, liabilities and equity of Holdings and of APAM have been carried forward at their historical carrying values. The historical partners’ deficit of Holdings is reflected as a noncontrolling interest.
|
|
•
|
Statements of Operations, Comprehensive Income and Cash Flows - The historical consolidated statements of Holdings have been consolidated with the statements of operations, comprehensive income and cash flows of APAM.
|
Modification of Artisan Partners Holdings’ Units
As part of the IPO Reorganization, the limited partner units of Holdings were modified. In addition to modification of the voting and other rights with respect to each class of units, the following modifications were made to the Class B common units and the preferred units:
|
•
|
The Class B common units of Holdings, which are held by employee-partners, were modified to eliminate a cash redemption feature. Prior to the reorganization, the terms of the Class B unit award agreements required Holdings to redeem the units from a holder whose employment by Artisan had been terminated. As a result of the redemption feature, Artisan was required to account for the Class B units as liability awards. At the time of the IPO, the amount of the liability was increased to
$552.0 million
to reflect the value implied by the IPO valuation. Thereafter, as a result of the elimination of the redemption feature, Artisan reclassified the entire liability to equity. The vesting of Class B awards that were unvested at the time of the reorganization is reflected as “Pre-offering related compensation — share-based awards” over the remaining vesting period (see
Note 11, “Compensation and Benefits”
).
|
|
•
|
The preferred units of Holdings were modified to eliminate the associated put right. In exchange for the elimination of the put right, Holdings issued Partnership CVRs to the holders of the preferred units. The CVRs were classified as liabilities and the preferred units were reclassified to permanent equity after the modification. As discussed above, in conjunction with the H&F Corp Merger, APAM received modified preferred units and partnership CVRs and issued to the shareholder of H&F Corp convertible preferred stock and APAM CVRs. For each outstanding APAM CVR, APAM held one Partnership CVR. The convertible preferred stock and APAM CVRs issued were recorded at the carryover basis of the preferred units and Partnership CVRs originally held by H&F Corp. On November 6, 2013, all of the CVRs were terminated without any payment by APAM or Holdings.
|
IPO and Use of Proceeds
The net proceeds from the IPO were
$353.4 million
. In connection with the IPO, Artisan used cash on hand to make cash incentive payments aggregating
$56.8 million
to certain of its portfolio managers. Artisan used a portion of the IPO net proceeds, combined with remaining cash on hand, for the following:
|
•
|
to pay distributions of retained profits in the aggregate amount of
$105.3 million
to the pre-IPO partners of Holdings;
|
|
•
|
to repay
$90.0 million
outstanding under Holdings’ revolving credit agreement (see Note 6, “Borrowings”); and
|
|
•
|
to purchase for
$76.3 million
an aggregate of
2,720,823
Class A common units from certain Class A limited partners of Holdings.
|
Artisan used the remaining proceeds for general corporate purposes.
76
Follow-On Offerings
Subsequent to the IPO, APAM has completed registered primary offerings of shares of Class A common stock (the “Follow-On Offerings”). The entire net proceeds of the primary offerings were used to purchase units of Artisan Partners Holdings, APAM’s direct subsidiary, and shares of APAM convertible preferred stock. The details of the offerings are as follows:
|
Offering Date
|
Proceeds
|
Class A Common Stock Issued
|
Class B Common Stock Canceled
|
Class C Common Stock Canceled
|
Convertible Preferred Stock Canceled
|
Increase in Deferred Tax Assets
|
Increase in Amounts Payable Under TRA
|
||||||||||
|
(dollars in millions)
|
|||||||||||||||||
|
November 6, 2013
|
$
|
296.8
|
|
5,520,000
|
|
—
|
|
(4,152,665
|
)
|
(1,367,335
|
)
|
$
|
123.9
|
|
$
|
105.3
|
|
|
March 12, 2014
|
$
|
554.1
|
|
9,284,337
|
|
(3,705,453
|
)
|
(4,835,767
|
)
|
(743,117
|
)
|
$
|
287.4
|
|
$
|
244.3
|
|
|
March 9, 2015
|
$
|
176.6
|
|
3,831,550
|
|
(2,415,253
|
)
|
(1,416,297
|
)
|
—
|
|
$
|
105.1
|
|
$
|
89.4
|
|
|
Total
|
$
|
1,027.5
|
|
18,635,887
|
|
(6,120,706
|
)
|
(10,404,729
|
)
|
(2,110,452
|
)
|
$
|
516.4
|
|
$
|
439.0
|
|
The offerings resulted in an increase in APAM’s equity ownership of Holdings, as well as an increase in deferred tax assets and amounts payable under tax receivable agreements. See
Note 8, “Noncontrolling Interest - Holdings”
for the financial statement impact of changes in ownership and see
Note 12, “Income Taxes and Related Payments”
for the income tax impact of the offerings. In conjunction with the 2013 Follow-On Offering, the CVRs were terminated and the associated
$5.9 million
liability was eliminated.
The purchase of convertible preferred stock and preferred units resulted in a deemed dividend for purposes of calculating earnings per share. See
Note 14, “Earnings (Loss) Per Share”
.
Holdings Unit Exchanges
On June 16, 2014, affiliates of Hellman & Friedman LLC (the “H&F Funds”) elected to convert
455,011
shares of convertible preferred stock into, and exchange
1,381,887
preferred units of Holdings for, a total of
1,836,898
shares of APAM’s Class A common stock (the “H&F Conversion”). The H&F Funds subsequently sold all
1,836,898
shares of Class A common stock. After the H&F Conversion, there were no longer any outstanding APAM convertible preferred shares or Holdings preferred units.
During the
years ended December 31, 2015
and
2014
, certain limited partners of Artisan Partners Holdings exchanged common units (along with a corresponding number of shares of Class B or C common stock of APAM) for shares of Class A common stock (the “Holdings Common Unit Exchanges”). The following common and preferred units were exchanged for APAM Class A common stock during the
years ended December 31, 2015
and
2014
:
|
Date of Exchange
|
Total Units Exchanged
|
Class A Common Units
|
Class B Common Units
|
Preferred Units
|
Class E Common Units
|
|||||
|
June 2, 2014
|
171,125
|
|
171,125
|
|
—
|
|
—
|
|
||
|
June 16, 2014
|
1,381,887
|
|
—
|
|
—
|
|
1,381,887
|
|
—
|
|
|
August 25, 2014
|
1,578,228
|
|
1,567,968
|
|
10,260
|
|
—
|
|
—
|
|
|
December 1, 2014
|
116,571
|
|
116,571
|
|
—
|
|
—
|
|
—
|
|
|
Total Units Exchanged 2014
|
3,247,811
|
|
1,855,664
|
|
10,260
|
|
1,381,887
|
|
—
|
|
|
March 9, 2015
|
527,012
|
|
169,474
|
|
332,538
|
|
—
|
|
25,000
|
|
|
May 21, 2015
|
132,961
|
|
127,729
|
|
5,232
|
|
—
|
|
—
|
|
|
August 20, 2015
|
145,265
|
|
127,730
|
|
17,535
|
|
—
|
|
—
|
|
|
November 18, 2015
|
21,571
|
|
21,571
|
|
—
|
|
—
|
|
—
|
|
|
Total Units Exchanged 2015
|
826,809
|
|
446,504
|
|
355,305
|
|
—
|
|
25,000
|
|
The corresponding shares of APAM Class B and Class C common stock were immediately canceled upon exchange. The Holdings Common Unit Exchanges and H&F Conversion increased APAM’s equity ownership interest in Holdings, and resulted in a combined increase to deferred tax assets of approximately
$21.6 million
and
$99.3 million
, for the years ended December 31, 2015 and 2014, respectively, and increases in amounts payable under the tax receivable agreements of approximately
$18.4 million
and
$84.4 million
, for the years ended December 31, 2015 and 2014, respectively.
77
Basis of presentation
The accompanying consolidated financial statements were prepared in accordance with U.S. generally accepted accounting principles (“U.S. GAAP”) and related rules and regulations of the SEC. The preparation of financial statements in conformity with U.S. GAAP requires management to make estimates or assumptions that affect the reported amounts and disclosures in the financial statements. Actual results could differ from these estimates or assumptions.
Principles of consolidation
Artisan’s policy is to consolidate all subsidiaries or other entities in which it has a controlling financial interest and variable interest entities (“VIEs”) of which Artisan is deemed to be the primary beneficiary. The primary beneficiary is deemed to be the entity that has the power to govern the financial and operating policies of the subsidiary so as to obtain benefits from its activities. The consolidated financial statements include the accounts of APAM, all subsidiaries or other entities in which APAM has a direct or indirect controlling financial interest and VIEs of which Artisan is deemed to be the primary beneficiary. All material intercompany balances have been eliminated in consolidation.
Artisan’s wholly-owned subsidiary, Artisan Partners Alternative Investments GP LLC, was the general partner of Artisan Partners Launch Equity LP (“Launch Equity”), a private investment partnership that was considered a VIE. Launch Equity was considered an investment company and therefore accounted for under Accounting Standard Codification Topic (“ASC”) 946, “Financial Services – Investment Companies”. Artisan had retained the specialized industry accounting principles of this investment company in its consolidated financial statements. Launch Equity was liquidated and dissolved in December 2014. See
Note 9, “Variable and Voting Interest Entities”
for additional details.
The Company makes initial seed investments in sponsored investment portfolios at the portfolio’s formation. If the seed investment results in a controlling financial interest, APAM consolidates the fund, and the underlying individual securities are accounted for as trading securities.
Seed investments in which the Company does not have a controlling financial interest are classified as available-for-sale investments, as described below under “-Investment Securities”. As of December 31, 2015, APAM does not have a controlling financial interest in any of the funds in which it has made a seed investment.
Tax Receivable Agreements (“TRAs”)
In connection with the IPO, APAM entered into
two
tax receivable agreements. The first TRA, generally provides for the payment by APAM to the Pre-H&F Merger Shareholder of
85%
of the applicable cash savings, if any, in U.S. federal, state and local income taxes that APAM actually realizes (or is deemed to realize in certain circumstances) as a result of (i) the tax attributes of the preferred units APAM acquired in the merger of a wholly-owned subsidiary of the private equity fund into APAM in March 2013, (ii) net operating losses available as a result of the merger and (iii) tax benefits related to imputed interest.
The second TRA generally provides for the payment by APAM to current or former limited partners of Holdings of
85%
of the applicable cash savings, if any, in U.S. federal, state and local income taxes that APAM actually realizes (or is deemed to realize in certain circumstances) as a result of (i) certain tax attributes of their units sold to APAM or exchanged (for shares of Class A common stock, convertible preferred stock or other consideration) and that are created as a result of such sales or exchanges and payments under the TRAs and (ii) tax benefits related to imputed interest. Under both agreements, APAM generally will retain the benefit of the remaining
15%
of the applicable tax savings.
For purposes of the TRAs, cash savings in tax are calculated by comparing APAM’s actual income tax liability to the amount it would have been required to pay had it not been able to utilize any of the tax benefits subject to the TRAs, unless certain assumptions apply. The TRAs will continue in effect until all such tax benefits have been utilized or expired, unless APAM exercises its right to terminate the agreements or payments under the agreements are accelerated in the event that APAM materially breaches any of its material obligations under the agreements. The actual increase in tax basis, as well as the amount and timing of any payments under these agreements, will vary depending upon a number of factors, including the timing of sales or exchanges by the holders of limited partnership units, the price of the Class A common stock at the time of such sales or exchanges, whether such sales or exchanges are taxable, the amount and timing of the taxable income APAM generates in the future and the tax rate then applicable and the portion of APAM’s payments under the TRAs constituting imputed interest.
Payments under the TRAs, if any, will be made pro rata among all TRA counterparties entitled to payments on an annual basis to the extent APAM has sufficient taxable income to utilize the increased depreciation and amortization charges. Artisan expects to make payments under the TRAs, to the extent they are required, within
125
days after APAM’s federal income tax return is filed for each fiscal year. Interest on such payments will begin to accrue at a rate equal to one-year LIBOR plus
100
basis points from the due date (without extension) of such tax return.
78
Operating segments
Artisan operates in
one
segment, the investment management industry. Artisan provides investment management services to separate accounts and mutual funds and other pooled investment vehicles. Management assesses the financial performance of these vehicles on a combined basis.
Cash and cash equivalents
Artisan defines cash and cash equivalents as money market funds and other highly liquid investments with original maturities of 90 days or less. Cash and cash equivalents are stated at cost, which approximates fair value due to the short-term nature and liquidity of these financial instruments. For disclosure purposes, cash equivalents are categorized as Level 1 in the fair value hierarchy. Cash and cash equivalents are subject to credit risk and were primarily maintained in demand deposit accounts with financial institutions or treasury money market funds.
Foreign currency translation
Assets and liabilities of foreign operations whose functional currency is not the U.S. dollar are translated at prevailing year-end exchange rates. Revenue and expenses of such foreign operations are translated at average exchange rates during the year. The net effect of the translation adjustment for foreign operations is included in other comprehensive income (loss) in the Consolidated Statements of Comprehensive Income (Loss). The cumulative effect of translation adjustments is included in accumulated other comprehensive income (loss) and noncontrolling interest - Artisan Partners Holdings in the Consolidated Statements of Financial Condition, based on current ownership levels.
Accounts receivable
Accounts receivable are carried at invoiced amounts and consist primarily of investment management fees that have been earned, but not yet received from clients. Due to the short-term nature of the receivables, the carrying values of these assets approximate fair value. The accounts receivable balance does not include any allowance for doubtful accounts as Artisan believes all accounts receivable balances are fully collectible. There has not been any bad debt expense recorded for the
years ended December 31, 2015
,
2014
and
2013
.
Investment securities
Investment securities consist of investments in mutual funds for which Artisan is the investment adviser and are classified as available-for-sale. Investments provide exposure to various risks, including price risk (the risk of a potential future decline in value of the investment) and foreign currency risk. Investments in registered mutual funds are carried at fair value at their respective net asset values as of the valuation date.
Unrealized gains (losses) on available-for-sale securities are recorded as a component of other comprehensive income (loss). Dividend income from these investments is recognized when earned and is included in net investment income in the Consolidated Statements of Operations. Realized gains (losses) are computed on a specific identification basis and are recorded in net investment income in the Consolidated Statements of Operations.
Investment securities are evaluated for other-than-temporary impairment on a quarterly basis when the cost of an investment exceeds its fair value.
Property and equipment
Property and equipment are carried at cost, less accumulated depreciation. Depreciation is generally recognized on a straight-line basis over the estimated useful lives of the respective assets, which range from three to seven years. Depreciation for leasehold improvements is recognized over the applicable life of the asset class, typically the lesser of the economic useful life of the improvement or the remaining term of the lease. Property and equipment is tested for impairment when there is an indication that the carrying amount of an asset may not be recoverable. When an asset is determined to not be recoverable, the impairment loss is measured based on the excess, if any, of the carrying value of the asset over its fair value.
Restricted cash
Restricted cash represents cash that is restricted as collateral on a standby letter of credit related to a lease obligation.
Revenue recognition
Investment management fees are generally computed as a percentage of average daily assets under management and recognized as earned. Fees for providing investment advisory services are computed and billed in accordance with the provisions of the applicable investment management agreements, generally on a monthly or quarterly basis. The investment management agreements for a small number of accounts provide for performance-based fees. Performance-based fees, if earned, are recognized on the contractually determined measurement date.
79
Performance-based fees generally are not subject to claw back as a result of performance declines subsequent to the most recent measurement date. Investment management fees are presented net of cash rebates and fees waived pursuant to contractual expense limitations of the funds or voluntary waivers.
Unit-based compensation
Prior to the IPO Reorganization, Class B limited partnership interests were granted to certain employees. The Class B limited partnership interests provided both an interest in future profits of Holdings as well as an interest in the overall value of Holdings. Class B limited partnership interests generally vested ratably over a
five
-year period from the date of grant. Holders of Class B limited partnership interests were entitled to fully participate in profits from and after the date of grant. The distribution of profits associated with these limited partnership interests was recorded as compensation expense.
Compensation cost was recognized as expense over the requisite service period for vesting, typically five years. Grants of Class B interests were considered liability awards, with changes in fair value recorded as compensation expense. Fair value was calculated using a combination of an income approach and a market approach. During 2013, the Class B common units were modified, which eliminated the cash redemption feature and liability classification. See
Note 11, “Compensation and Benefits”
for details on the modification of these awards.
Share-based compensation
Share-based compensation expense is recognized based on grant-date fair value on a straight-line basis over the requisite service period of the awards, adjusted for estimated forfeitures. Forfeiture assumptions are evaluated on a quarterly basis and updated as necessary. The awards generally vest ratably over a
five
-year vesting period, beginning on the date of grant. Certain awards vest upon a combination of both (1) pro-rata annual time vesting over
five
years and (2) qualifying retirement (as defined in the award agreements).
Distribution fees
Artisan Funds has authorized certain financial services companies, broker-dealers, banks or other intermediaries, and in some cases, other organizations designated by an authorized intermediary to accept purchase, exchange, and redemption orders for shares of Artisan Funds on the funds’ behalf. Many intermediaries charge a fee for accounting and shareholder services provided to fund shareholders on the funds’ behalf. Those services typically include recordkeeping, transaction processing for shareholders’ accounts, and other services. The fee is either based on the number of accounts to which the intermediary provides such services or a percentage of the average daily value of fund shares held in such accounts. The funds pay a portion of such fees directly to the intermediaries, which are intended to compensate the intermediary for its provision of services of the type that would be provided by the funds’ transfer agent or other service providers if the shares were registered directly on the books of the funds’ transfer agent. Artisan pays the balance of those fees which includes compensation to the intermediary for its distribution and marketing of Artisan Funds shares.
Artisan Global Funds also have distribution arrangements pursuant to which Artisan is required to pay a portion of its investment management fee for distribution and marketing of Artisan Global Funds shares.
Distribution fees paid by Artisan are presented as an operating expense as Artisan is the principal in its role as the primary obligor related to distribution and marketing services. Distribution fees paid to intermediaries were as follows:
|
For the Years Ended December 31,
|
|||||||||||
|
2015
|
2014
|
2013
|
|||||||||
|
Total intermediary fees incurred related to Artisan Funds
|
$
|
120,402
|
|
$
|
133,745
|
|
$
|
112,360
|
|
||
|
Less: fees incurred by Artisan Funds
|
80,390
|
|
89,372
|
|
78,036
|
|
|||||
|
Fees incurred by Artisan
|
40,012
|
|
44,373
|
|
34,324
|
|
|||||
|
Global Funds distribution and other marketing expenses
|
3,614
|
|
4,759
|
|
4,074
|
|
|||||
|
Total distribution and marketing
|
$
|
43,626
|
|
$
|
49,132
|
|
$
|
38,398
|
|
||
Accrued fees to intermediaries were
$4.6 million
and
$6.6 million
as of
December 31, 2015
and
2014
, respectively, and are included in accounts payable, accrued expenses and other liabilities in the Consolidated Statements of Financial Condition.
Leases
Rent under non-cancelable operating leases with scheduled rent increases or decreases is accounted for on a straight-line basis over the lease term, beginning on the date of initial possession or the effective date of the lease agreement. Allowances and other lease incentives provided by Artisan’s landlords are amortized on a straight-line basis as a reduction of rent expense. The difference between straight-line rent expense and rent paid and the unamortized deferred lease costs and build-out allowances are recorded as deferred lease obligations in the Consolidated Statements of Financial Condition.
80
Loss contingencies
Artisan considers the assessment of loss contingencies as a significant accounting policy because of the significant uncertainty relating to the outcome of any potential legal actions and other claims and the difficulty of predicting the likelihood and range of the potential liability involved, coupled with the material impact on Artisan’s results of operations that could result from legal actions or other claims and assessments. Artisan recognizes estimated costs to defend as incurred. Potential loss contingencies are reviewed at least quarterly and are adjusted to reflect the impact and status of settlements, rulings, advice of counsel and other information pertinent to a particular matter. Significant differences could exist between the actual cost required to investigate, litigate and/or settle a claim or the ultimate outcome of a suit and management’s estimate. These differences could have a material impact on Artisan’s results of operations, financial position, or cash flows. Recoveries of losses are recognized in the Consolidated Statements of Operations when receipt is deemed probable.
No
loss contingencies were recorded at
December 31, 2015
,
2014
, and
2013
. Currently, there are no legal or administrative proceedings that management believes may have a material effect on Artisan’s consolidated financial position, cash flows or results of operations.
Income taxes
Artisan accounts for income taxes under the liability method, which requires the recognition of deferred tax assets and liabilities for the future tax consequences attributable to temporary differences between the financial statement carrying amounts and tax bases of assets and liabilities. Deferred tax assets and liabilities are measured using enacted tax rates expected to apply to taxable income in the years in which those temporary differences are expected to be realized or settled. Artisan recognizes a valuation allowance if it is more likely than not that some portion or all of the deferred tax assets will not be realized.
Artisan accounts for uncertain income tax positions by recognizing the impact of a tax position in its consolidated financial statements when Artisan believes it is more likely than not that the tax position would not be sustained upon examination by the appropriate tax authorities based on the technical merits of the position.
Comprehensive income (loss)
Total comprehensive income (loss) includes net income and other comprehensive income. Other comprehensive income (loss) consists of the change in unrealized gains (losses) on available-for-sale investments and foreign currency translation, net of related tax effects. The tax effects of components of other comprehensive income (loss) is calculated on the portion of comprehensive income (loss) attributable to APAM.
Partnership distributions
Artisan makes distributions to its partners (or former partners) for purposes of paying income taxes as required under the terms of Artisan Partners Holdings’ partnership agreement. Tax distributions are calculated utilizing the highest combined individual federal, state and local income tax rate among the various locations in which the partners (or former partners), as a result of owning their interests in the partnership, are subject to tax, assuming maximum applicability of the phase-out of itemized deductions contained in the Internal Revenue Code. Artisan also makes additional distributions under the terms of the partnership agreement. Distributions are recorded in the financial statements on the declaration date. Partnership distributions, excluding distributions to APAM, totaled
$182.2 million
,
$266.8 million
and
$290.5 million
for the
years ended December 31, 2015
,
2014
, and
2013
, respectively, and are reported either as pre-offering related compensation-other within the Consolidated Statements of Operations or partnership distributions within the Consolidated Statements of Changes in Stockholders’ Equity, depending on the timing of distributions.
Earnings per Share
Basic and diluted earnings per share is computed under the two-class method by dividing income available to Class A common stockholders by the weighted average number of Class A common shares outstanding during the period. Unvested restricted share based awards are excluded from the number of Class A common shares outstanding for the basic earnings per share calculation because the shares have not yet been earned by employees. Income available to Class A common stockholders is computed by reducing net income attributable to APAM by dividends declared or paid to convertible preferred stockholders during the period and earnings (distributed and undistributed) allocated to participating securities, according to their respective rights to participate in those earnings. Class B and Class C common shares do not share in profits of APAM and therefore are not reflected in the calculations.
Diluted earnings per share is computed by increasing the denominator by the amount of additional Class A common shares that would have been outstanding if all potential Class A common shares had been issued. The numerator is also increased for the net income allocated to the potential Class A common shares.
Potential dilutive Class A common shares consist of (1) the Class A common shares issuable upon exchange of Holdings limited partnership units for APAM Class A common stock, (2) the Class A common shares issuable upon conversion of APAM convertible preferred stock and (3) unvested restricted share-based awards.
81
Recent accounting pronouncements
In May 2014, the Financial Accounting Standards Board (“FASB”) issued ASU 2014-09,
Revenue from Contracts with Customers
, which supersedes existing accounting standards for revenue recognition and creates a single framework. In August 2015, the effective date of the ASU was deferred. The new guidance will now be effective on January 1, 2018 with early adoption permitted as of the original effective date of January 1, 2017. The Company is currently evaluating its transition method and the potential impact on its consolidated financial statements.
In February 2015, the FASB issued ASU 2015-02,
Amendments to the Consolidation Analysis
. The ASU modifies existing consolidation guidance for determining whether certain legal entities should be consolidated. The ASU eliminates the deferral under ASU 2010-10,
Consolidation
-
Amendments for Certain Investment Funds,
and, as a result, the Company must apply the new guidance to all entities, including investment companies. The presumption that a general partner controls a limited partnership has been eliminated. In addition, fees paid to decision makers that meet certain conditions no longer cause the decision makers to consolidate VIEs, in certain instances. The new guidance was effective on January 1, 2016, and requires either a retrospective or a modified retrospective approach to adoption. Based on current ownership levels, the Company does not expect the adoption of the new standard to change existing consolidation conclusions.
In April 2015, the FASB issued ASU 2015-03,
Simplifying the Presentation of Debt Issuance Costs
, which requires debt issuance costs to be presented in the balance sheet as a direct deduction from the note liability, rather than presented as an asset. The new guidance was effective on January 1, 2016, and requires a retrospective approach to adoption. At December 31, 2015, the Company had approximately
$0.7 million
of debt issuance costs in prepaid expenses and other assets on its Condensed Consolidated Statements of Financial Condition that meet the criteria of this amendment.
In April 2015, the FASB issued ASU 2015-05,
Customer’s Accounting for Fees Paid in a Cloud Computing Arrangement
, which provides guidance on determining whether a cloud computing arrangement contains a software license that should be accounted for as internal-use software. The new guidance was effective on January 1, 2016. The Company does not expect the adoption of this ASU to have an impact on its consolidated financial statements.
In January 2016, the FASB issued ASU 2016-01,
Recognition and Measurement of Financial Assets and Financial Liabilities,
which requires all equity investments to be measured at fair value with changes in the fair value recognized through net income. ASU 2016-01 will be effective on January 1, 2018 and will result in a cumulative-effect adjustment to the balance sheet upon adoption. After adoption, the Company’s unrealized holding gain (loss) on available for sale investment securities will be recognized through net income, which will be a change from the current treatment of recognition in other comprehensive income.
The disclosures below include details of Artisan’s investments.
|
Cost
|
Unrealized
Gains |
Unrealized
Losses |
Fair Value
|
||||||||||||
|
December 31, 2015
|
|||||||||||||||
|
Mutual funds
|
$
|
10,069
|
|
$
|
832
|
|
$
|
(611
|
)
|
$
|
10,290
|
|
|||
|
December 31, 2014
|
|||||||||||||||
|
Mutual funds
|
$
|
5,618
|
|
$
|
1,096
|
|
$
|
(2
|
)
|
$
|
6,712
|
|
|||
Artisan’s investments in mutual funds consist of investments in shares of Artisan Partners Funds, Inc. and Artisan Partners Global Funds plc and are considered to be available-for-sale securities. As a result, unrealized gains (losses) are recorded to other comprehensive income (loss).
As of
December 31, 2015
and 2014, the total fair value of investments in an unrealized loss position was
$4.4 million
and
$38 thousand
, respectively. The unrealized losses on available-for-sale securities are considered temporary, based on the severity and duration of the unrealized losses. No impairment losses were recorded on these available-for-sale securities.
During the year ended
December 31, 2015
, Artisan made seed investments of
$6.8 million
, including a
$5.0 million
investment in Artisan Developing World Fund. Also during the year ended
December 31, 2015
, Artisan sold
$2.7 million
of its investments, resulting in realized gains of
$0.4 million
. During the years ended
December 31, 2014
and
2013
, Artisan sold seed investments resulting in realized gains of
$0.3 million
and
$4.1 million
, respectively.
82
The table below presents information about Artisan’s assets and liabilities that are measured at fair value and the valuation techniques Artisan utilized to determine such fair value. In accordance with ASC 820, fair value is defined as the price that Artisan would receive upon selling an investment in an orderly transaction to an independent buyer in the principal or most advantageous market for the investment. The following three-tier fair value hierarchy prioritizes the inputs used in measuring fair value:
|
•
|
Level 1 – Observable inputs such as quoted (unadjusted) market prices in active markets for identical securities.
|
|
•
|
Level 2 – Other significant observable inputs (including but not limited to quoted prices for similar instruments, interest rates, prepayment speeds, credit risk, etc.).
|
|
•
|
Level 3—Significant unobservable inputs (including Artisan’s own assumptions in determining fair value).
|
The following provides the hierarchy of inputs used to derive fair value of Artisan’s assets and liabilities that are financial instruments as of
December 31, 2015
and
2014
:
|
Assets and Liabilities at Fair Value
|
|||||||||||||||
|
Total
|
Level 1
|
Level 2
|
Level 3
|
||||||||||||
|
December 31, 2015
|
|||||||||||||||
|
Assets
|
|||||||||||||||
|
Cash equivalents
|
$
|
49,005
|
|
$
|
49,005
|
|
$
|
—
|
|
$
|
—
|
|
|||
|
Mutual funds
|
10,290
|
|
10,290
|
|
—
|
|
—
|
|
|||||||
|
December 31, 2014
|
|||||||||||||||
|
Assets
|
|||||||||||||||
|
Cash equivalents
|
$
|
44,004
|
|
$
|
44,004
|
|
$
|
—
|
|
$
|
—
|
|
|||
|
Mutual funds
|
6,712
|
|
6,712
|
|
—
|
|
—
|
|
|||||||
Fair values determined based on Level 1 inputs utilize quoted market prices for identical assets. Level 1 assets generally consist of money market funds, marketable open-end mutual funds and Undertakings for Collective Investment in Transferable Securities (“UCITS”). There were no Level 2 or Level 3 assets or liabilities recorded at fair value as of
December 31, 2015
and 2014.
Artisan’s policy is to recognize transfers in and transfers out of the valuation levels as of the beginning of the reporting period. There were no transfers between Level 1, Level 2 or Level 3 securities during the years ended
December 31, 2015
and
2014
.
Artisan’s borrowings consist of the following as of
December 31, 2015
and
2014
:
|
Maturity
|
Outstanding Balance
|
Interest Rate Per Annum
|
||||||
|
Revolving credit agreement
|
August 2017
|
—
|
|
NA
|
|
|||
|
Senior notes
|
||||||||
|
Series A
|
August 2017
|
60,000
|
|
4.98
|
%
|
|||
|
Series B
|
August 2019
|
50,000
|
|
5.32
|
%
|
|||
|
Series C
|
August 2022
|
90,000
|
|
5.82
|
%
|
|||
|
Total borrowings
|
$
|
200,000
|
|
|||||
The fair value of borrowings was approximately
$197.0 million
as of December 31, 2015
. Fair value was determined based on future cash flows, discounted to present value using current market interest rates. The inputs are categorized as Level 2 in the fair value hierarchy, as defined in
Note 5, “Fair Value Measurements”
.
83
Senior notes
- On August 16, 2012, Holdings issued
$200 million
in senior unsecured notes and entered into a
$100 million
five
-year revolving credit agreement. The proceeds were used to repay the entire outstanding principal of an existing term loan. The fixed interest rate on each series of unsecured notes is subject to a one percentage point increase in the event Holdings receives a below-investment grade rating and any such increase will continue to apply until an investment grade rating is received. The unsecured notes and the revolving credit agreement contain certain restrictive financial covenants including a limitation on the leverage ratio of Holdings and a minimum interest coverage ratio.
Revolving credit agreement
- Any loans outstanding under the revolving credit agreement bear interest at a rate equal to, at the Company’s election, (i) LIBOR adjusted by a statutory reserve percentage plus an applicable margin ranging from
1.50%
to
3.00%
, depending on Holdings’ leverage ratio (as defined in the revolving credit agreement) or (ii) an alternate base rate equal to the highest of (a) prime rate plus
0.50%
, (b) the federal funds effective rate plus
0.50%
, and (c) the daily
one
-month LIBOR adjusted by a statutory reserve percentage plus
1.00%
, plus, in each case, an applicable margin ranging from
0.50%
to
2.00%
, depending on Holdings’ leverage ratio. Unused commitments under the revolving credit agreement bear interest at a rate that ranges from
0.175%
to
0.625%
, depending on Holdings’ leverage ratio.
In connection with the closing of the IPO, Artisan paid all of the then-outstanding principal amount of loans under the revolving credit agreement.
As of December 31, 2015
, there were no borrowings outstanding under the revolving credit agreement and the interest rate on the unused commitment was
0.175%
.
Interest expense incurred on the unsecured notes and revolving credit agreement was
$11.1 million
for the years ended
December 31, 2015
and
2014
, and
$11.4 million
for the year ended December 31, 2013.
As of December 31, 2015
, the aggregate maturities of debt obligations, based on their contractual terms, are as follows:
|
2016
|
$
|
—
|
|
|
2017
|
60,000
|
|
|
|
2018
|
—
|
|
|
|
2019
|
50,000
|
|
|
|
2020
|
—
|
|
|
|
Thereafter
|
90,000
|
|
|
|
$
|
200,000
|
|
|
Contingent Value Rights (“CVRs”)
As part of the IPO Reorganization, Holdings issued Partnership CVRs and APAM issued APAM CVRs to the holders of Holdings’ preferred units and APAM’s convertible preferred stock, respectively. APAM held one Partnership CVR for each APAM CVR outstanding. On November 6, 2013, the CVRs were terminated with no amounts paid or payable by Artisan.
The CVRs were considered derivative instruments under ASC 815,
Derivatives and Hedging
, and accordingly were recorded as a liability at fair value on the balance sheet until they were terminated on November 6, 2013. Changes in the fair value of these derivative instruments have been recorded in earnings as a net gain (loss) on the valuation of contingent value rights in the period of change.
As of November 6, 2013, the fair value of the CVRs was
$5.9 million
. For the year ended December 31, 2013, gains of
$49.6 million
were recorded in other non-operating gains (losses) to reflect a decrease in the estimated fair value of the CVRs. On November 6, 2013, the CVRs were terminated and the liability was eliminated.
Holdings is the predecessor of APAM for accounting purposes, and its consolidated financial statements are Artisan’s historical financial statements for periods prior to March 12, 2013, the date on which APAM became the general partner of Holdings.
As of December 31, 2015
, APAM held approximately
54%
of the equity ownership interests in Holdings.
Net income (loss) attributable to noncontrolling interests - Artisan Partners Holdings in the Consolidated Statements of Operations represents the portion of earnings or loss attributable to the equity ownership interests in Holdings held by the limited partners of Holdings. All income for the periods prior to March 12, 2013, is entirely attributable to noncontrolling interests.
84
Subsequent to the IPO, APAM’s equity ownership interest in Holdings has increased as a result of the following transactions:
|
Holdings GP Units
|
Limited Partnership Units
|
Total
|
APAM Ownership %
|
|||||
|
As of March 12, 2013
|
15,277,742
|
|
54,713,763
|
|
69,991,505
|
|
22
|
%
|
|
Issuance of APAM Restricted Shares
|
1,575,157
|
|
—
|
|
1,575,157
|
|
2
|
%
|
|
2013 Follow-On Offering
|
4,152,665
|
|
(4,152,665
|
)
|
—
|
|
6
|
%
|
|
Employee Terminations
(1)
|
—
|
|
(82,655
|
)
|
(82,655
|
)
|
—
|
%
|
|
For the Year Ended December 31, 2013
|
21,005,564
|
|
50,478,443
|
|
71,484,007
|
|
29
|
%
|
|
Issuance of APAM Restricted Shares
|
1,438,808
|
|
—
|
|
1,438,808
|
|
2
|
%
|
|
2014 Follow-On Offering
|
8,541,220
|
|
(8,541,220
|
)
|
—
|
|
12
|
%
|
|
H&F Conversion
|
1,381,887
|
|
(1,381,887
|
)
|
—
|
|
2
|
%
|
|
Holdings Common Unit Exchanges
|
1,865,924
|
|
(1,865,924
|
)
|
—
|
|
3
|
%
|
|
Delivery of Shares Underlying RSUs
(1)
|
4,728
|
|
—
|
|
4,728
|
|
—
|
%
|
|
For the Year Ended December 31, 2014
|
34,238,131
|
|
38,689,412
|
|
72,927,543
|
|
47
|
%
|
|
Issuance of APAM Restricted Shares
|
548,674
|
|
—
|
|
548,674
|
|
1
|
%
|
|
2015 Follow-On Offering
|
3,831,550
|
|
(3,831,550
|
)
|
—
|
|
5
|
%
|
|
Holdings Common Unit Exchanges
|
826,809
|
|
(826,809
|
)
|
—
|
|
1
|
%
|
|
Employee Terminations
(1)
|
(12,559
|
)
|
(54,730
|
)
|
(67,289
|
)
|
—
|
%
|
|
For the Year Ended December 31, 2015
|
39,432,605
|
|
33,976,323
|
|
73,408,928
|
|
54
|
%
|
|
(1)
The impact of the transaction on APAM’s ownership percentage was less than 1%.
|
||||||||
Since APAM continues to have a controlling interest in Holdings, changes in ownership of Holdings are accounted for as equity transactions. Additional paid-in capital and noncontrolling interest - Artisan Partners Holdings in the Consolidated Statements of Financial Condition are adjusted to reallocate Holdings’ historical equity to reflect the change in APAM’s ownership of Holdings.
The reallocation of equity had the following impact on the Consolidated Statements of Financial Condition:
|
Statement of Financial Condition
|
For the Years Ended December 31,
|
||||||
|
2015
|
2014
|
||||||
|
Additional paid-in capital
|
$
|
(5,463
|
)
|
$
|
(10,481
|
)
|
|
|
Noncontrolling interest - Artisan Partners Holdings
|
5,399
|
|
10,105
|
|
|||
|
Accumulated other comprehensive income
|
29
|
|
258
|
|
|||
|
Deferred tax assets
|
35
|
|
118
|
|
|||
|
Net balance sheet impact
|
—
|
|
—
|
|
|||
In addition to the reallocation of historical equity, the change in ownership resulted in an increase to deferred tax assets and additional paid in capital of
$5.8 million
for the year ended
December 31, 2015
and
$5.4 million
for the year ended
December 31, 2014
.
Artisan Funds and Artisan Global Funds
Artisan serves as the investment adviser for Artisan Partners Funds, Inc. (“Artisan Funds”), a family of mutual funds registered with the SEC under the Investment Company Act of 1940, and Artisan Partners Global Funds plc (“Artisan Global Funds”), a family of Ireland-based UCITS. Artisan Funds and Artisan Global Funds are corporate entities the business and affairs of which are managed by their respective boards of directors. The shareholders of the funds retain all voting rights, including the right to elect and reelect members of their respective boards of directors. As a result, each of these entities is a voting interest entity (“VOE”). While Artisan holds, in limited cases, direct investments in a fund (which are made on the same terms as are available to other investors and do not represent a majority voting interest in any entity), Artisan does not have a controlling financial interest or a majority voting interest and, as such, does not consolidate these entities.
85
Artisan Partners Launch Equity LP
Prior to December 2014, Artisan had an agreement to serve as the investment adviser to Artisan Partners Launch Equity Fund LP (“Launch Equity”), which was a private investment partnership in which the investors were certain employees or former employees (or entities beneficially owned by such persons) of Artisan Partners Holdings. Artisan Partners Alternative Investments GP LLC (“Artisan Alternatives”), a wholly-owned subsidiary of Holdings, was the general partner of Launch Equity.
In December 2014, Launch Equity was liquidated and the net assets were distributed as a return of capital to all limited partners of the fund, including Artisan Partners Alternative Investments GP LLC, which received proceeds of $1 thousand. The fair value of the consideration distributed was equal to the carrying amount of Launch Equity’s net assets on the date of liquidation. As a result, no gain or loss was recorded in connection with the transaction.
Prior to the dissolution, Launch Equity was determined to be a variable interest entity (“VIE”) which required consolidation within Artisan’s consolidated financial statements.
Prior to the dissolution, Artisan had the right to receive management fees as compensation for services provided as the investment adviser. Artisan also maintained, through Artisan Partners Alternative Investments GP LLC, a direct equity investment in the fund and had the right to receive an allocation of profits based upon Launch Equity’s net capital appreciation during a fiscal year. Each of these represented a variable interest in the fund.
The limited partners of Launch Equity were certain Artisan employees and former employees and were considered related parties. Artisan determined that Launch Equity was a VIE as (a) the voting rights of the limited partners were not proportional to their obligations to absorb expected losses and rights to receive expected residual returns and (b) substantially all of Launch Equity’s activities either involved or were conducted on behalf of the limited partners (the investors that had disproportionately few voting rights) and their related parties (including Artisan).
As an investment company, Launch Equity qualified for deferral of the current consolidation guidance for VIEs. The guidance applicable to investment companies required an analysis of which party, through holding interests directly or indirectly in the entity or contractually through other variable interests, such as management fees and incentive allocations, would absorb a majority of the expected variability of the entity. In determining whether Artisan was the primary beneficiary of Launch Equity, both qualitative and quantitative factors such as voting rights of the equity holders, economic participation of all parties, including how fees were earned, related party ownership and the level of involvement Artisan had in the design of the VIE, were considered. It was concluded that Artisan was the primary beneficiary as the related party group absorbed a majority of the variability associated with Launch Equity and Artisan was the member within the related party group that was most closely associated with the VIE. Although Artisan had only a minimal equity investment in Launch Equity, as the general partner, it controlled Launch Equity’s management and affairs. As a result, it was concluded that Artisan was the primary beneficiary of Launch Equity and its results are included in Artisan’s consolidated financial statements.
Artisan’s maximum exposure to investment loss from its involvement with Launch Equity was limited to its equity investment of
$1 thousand
while the potential benefit was limited to the management fee and incentive allocation receivable as investment adviser and general partner. Therefore, the gains or losses of Launch Equity did not have a significant impact on Artisan’s results of operations, liquidity or capital resources. Artisan had no right to the benefits from, nor did it bear the risks associated with, Launch Equity’s investments, beyond Artisan’s minimal direct investment in Launch Equity.
86
The following tables reflect the impact of consolidating Launch Equity’s results into the Consolidated Statement of Operations for the years ended December 31,
2014
and
2013
:
|
Condensed Consolidating Statement of Operations
|
|||||||||||||||
|
For the Year Ended
|
|||||||||||||||
|
December 31, 2014
|
|||||||||||||||
|
Before
Consolidation |
Launch Equity
|
Eliminations
|
As Reported
|
||||||||||||
|
Total revenues
|
$
|
829,155
|
|
$
|
—
|
|
$
|
(454
|
)
|
$
|
828,701
|
|
|||
|
Total operating expenses
|
522,252
|
|
—
|
|
(454
|
)
|
521,798
|
|
|||||||
|
Operating income (loss)
|
306,903
|
|
—
|
|
—
|
|
306,903
|
|
|||||||
|
Non-operating income (loss)
|
(15,360
|
)
|
—
|
|
—
|
|
(15,360
|
)
|
|||||||
|
Net gains (loss) of Launch Equity
|
—
|
|
(3,964
|
)
|
—
|
|
(3,964
|
)
|
|||||||
|
Total non-operating income (loss)
|
(15,360
|
)
|
(3,964
|
)
|
—
|
|
(19,324
|
)
|
|||||||
|
Income (loss) before income taxes
|
291,543
|
|
(3,964
|
)
|
—
|
|
287,579
|
|
|||||||
|
Provision for income taxes
|
48,829
|
|
—
|
|
—
|
|
48,829
|
|
|||||||
|
Net income (loss)
|
242,714
|
|
|
(3,964
|
)
|
—
|
|
238,750
|
|
||||||
|
Less: Net income attributable to noncontrolling interests - Artisan Partners Holdings
|
173,085
|
|
—
|
|
—
|
|
173,085
|
|
|||||||
|
Less: Net income (loss) attributable to noncontrolling interests - Launch Equity
|
—
|
|
(3,964
|
)
|
—
|
|
(3,964
|
)
|
|||||||
|
Net income attributable to Artisan Partners Asset Management Inc.
|
$
|
69,629
|
|
$
|
—
|
|
$
|
—
|
|
$
|
69,629
|
|
|||
|
Condensed Consolidating Statement of Operations
|
|||||||||||||||
|
For the Year Ended
|
|||||||||||||||
|
December 31, 2013
|
|||||||||||||||
|
Before
Consolidation |
Launch Equity
|
Eliminations
|
As Reported
|
||||||||||||
|
Total revenues
|
$
|
688,333
|
|
$
|
—
|
|
$
|
(2,492
|
)
|
$
|
685,841
|
|
|||
|
Total operating expenses
|
949,537
|
|
—
|
|
(2,492
|
)
|
947,045
|
|
|||||||
|
Operating income (loss)
|
(261,204
|
)
|
—
|
|
—
|
|
(261,204
|
)
|
|||||||
|
Non-operating income (loss)
|
42,839
|
|
—
|
|
—
|
|
42,839
|
|
|||||||
|
Net gains of Launch Equity
|
—
|
|
10,623
|
|
—
|
|
10,623
|
|
|||||||
|
Total non-operating income (loss)
|
42,839
|
|
10,623
|
|
—
|
|
53,462
|
|
|||||||
|
Income (loss) before income taxes
|
(218,365
|
)
|
10,623
|
|
—
|
|
(207,742
|
)
|
|||||||
|
Provision for income taxes
|
26,390
|
|
—
|
|
—
|
|
26,390
|
|
|||||||
|
Net income (loss)
|
(244,755
|
)
|
10,623
|
|
—
|
|
(234,132
|
)
|
|||||||
|
Less: Net income (loss) attributable to noncontrolling interests - Artisan Partners Holdings
|
(269,562
|
)
|
|
|
—
|
|
(269,562
|
)
|
|||||||
|
Less: Net income attributable to noncontrolling interests - Launch Equity
|
—
|
|
10,623
|
|
—
|
|
10,623
|
|
|||||||
|
Net income attributable to Artisan Partners Asset Management Inc.
|
$
|
24,807
|
|
$
|
—
|
|
$
|
—
|
|
$
|
24,807
|
|
|||
87
APAM - Stockholders’ Equity
As of December 31, 2015
and 2014, APAM had the following authorized and outstanding equity:
|
Outstanding
|
||||||||||||
|
Authorized
|
December 31, 2015
|
December 31, 2014
|
Voting Rights
(1)
|
Economic Rights
|
||||||||
|
Common shares
|
||||||||||||
|
Class A, par value $0.01 per share
|
500,000,000
|
|
39,432,605
|
|
34,238,131
|
|
1 vote per share
|
Proportionate
|
||||
|
Class B, par value $0.01 per share
|
200,000,000
|
|
18,327,222
|
|
21,463,033
|
|
5 votes per share
|
None
|
||||
|
Class C, par value $0.01 per share
|
400,000,000
|
|
15,649,101
|
|
17,226,379
|
|
1 vote per share
|
None
|
||||
|
(1) The Company’s employees to whom Artisan has granted equity have entered into a stockholders agreement with respect to all shares of APAM common stock they have acquired from the Company and any shares they may acquire from the Company in the future, pursuant to which they granted an irrevocable voting proxy to a Stockholders Committee. As of December 31, 2015, Artisan’s employees held 2,781,984 restricted shares of Class A common stock subject to the agreement and all 18,327,222 outstanding shares of Class B common stock.
|
||||||||||||
APAM is dependent on cash generated by Holdings to fund any dividends. Generally, Holdings will make distributions to all of its partners, including APAM, based on the proportionate ownership each holds in Holdings. APAM will fund dividends to its stockholders from its proportionate share of those distributions after provision for its taxes and other obligations. APAM declared and paid the following dividends per share during the years ended
December 31, 2015
,
2014
and
2013
.
|
Type of Dividend
|
Class of Stock
|
For the Years Ended December 31,
|
|||||
|
2015
|
2014
|
2013
|
|||||
|
Quarterly
|
Common Class A
|
$2.40
|
$2.20
|
$0.86
|
|||
|
Special Annual
|
Common Class A
|
$0.95
|
$1.63
|
$—
|
|||
|
Quarterly
|
Convertible Preferred
|
$—
|
$3.81
|
$—
|
|||
88
APAM issued (canceled) the following shares during the years ended
December 31, 2015
and
2014
:
|
Total Stock Outstanding
|
Class A Common Stock
|
Class B Common Stock
|
Class C Common Stock
|
Convertible Preferred Stock
|
||||||
|
Balance at January 1, 2014
|
71,484,007
|
|
19,807,436
|
|
25,271,889
|
|
25,206,554
|
|
1,198,128
|
|
|
2014 Follow-On Offering
|
—
|
|
9,284,337
|
|
(3,705,453
|
)
|
(4,835,767
|
)
|
(743,117
|
)
|
|
H&F Conversion
|
—
|
|
1,836,898
|
|
—
|
|
(1,381,887
|
)
|
(455,011
|
)
|
|
Holdings Common Unit Exchanges
|
—
|
|
1,865,924
|
|
(10,260
|
)
|
(1,855,664
|
)
|
—
|
|
|
Restricted Share Award Grants
|
1,444,688
|
|
1,444,688
|
|
—
|
|
—
|
|
—
|
|
|
Restricted Share Award Net Share Settlement
|
(5,880
|
)
|
(5,880
|
)
|
—
|
|
—
|
|
—
|
|
|
Delivery of Shares Underlying RSUs
(1)
|
4,728
|
|
4,728
|
|
—
|
|
—
|
|
—
|
|
|
Employee Terminations
|
—
|
|
—
|
|
(93,143
|
)
|
93,143
|
|
—
|
|
|
Balance at December 31, 2014
|
72,927,543
|
|
34,238,131
|
|
21,463,033
|
|
17,226,379
|
|
—
|
|
|
2015 Follow-On Offering
|
—
|
|
3,831,550
|
|
(2,415,253
|
)
|
(1,416,297
|
)
|
—
|
|
|
Holdings Common Unit Exchanges
|
—
|
|
826,809
|
|
(355,305
|
)
|
(471,504
|
)
|
—
|
|
|
Restricted Share Award Grants
|
562,950
|
|
562,950
|
|
—
|
|
—
|
|
—
|
|
|
Restricted Share Award Net Share Settlement
|
(14,276
|
)
|
(14,276
|
)
|
—
|
|
—
|
|
—
|
|
|
Employee Terminations
|
(67,289
|
)
|
(12,559
|
)
|
(365,253
|
)
|
310,523
|
|
—
|
|
|
Balance at December 31, 2015
|
73,408,928
|
|
39,432,605
|
|
18,327,222
|
|
15,649,101
|
|
—
|
|
|
(1)
There were 122,990 and 20,612 restricted stock units outstanding at December 31, 2015 and 2014, respectively. Restricted stock units are not reflected in the table because they are not considered outstanding or issued stock.
|
||||||||||
Each Class A, Class B, Class D and Class E common unit of Holdings (together with the corresponding share of Class B or Class C common stock) is exchangeable for one share of Class A common stock. The corresponding shares of Class B and Class C common stock are immediately canceled upon any such exchange. The preferred units of Holdings (together with the corresponding shares of Class C common stock) were also exchangeable for Class A common stock generally on a one-for-one basis. APAM’s convertible preferred stock was convertible into Class A common stock generally on a one-for-one basis.
Upon termination of employment with Artisan, an employee-partner’s unvested Class B common units are forfeited. Generally, the employee-partner’s vested Class B common units are exchanged for Class E common units. The employee-partner’s shares of Class B common stock are canceled and APAM issues the former employee-partner a number of shares of Class C common stock equal to the former employee-partner’s number of Class E common units. Class E common units are exchangeable for Class A common stock subject to the same restrictions and limitations on exchange applicable to the other common units of Holdings.
Artisan Partners Holdings - Partners’ Equity
Holdings makes distributions of its net income to the holders of its partnership units for income taxes as required under the terms of the partnership agreement and also makes additional distributions under the terms of the partnership agreement. The distributions are recorded in the financial statements on the declaration date, or on the payment date in lieu of a declaration date. Holdings’ partnership distributions for the years ended
December 31, 2015
,
2014
and
2013
were as follows:
|
For the Years Ended December 31,
|
|||||
|
2015
|
2014
|
2013
|
|||
|
Holdings Partnership Distributions to Limited Partners
|
$182,175
|
$266,838
|
$290,511
|
||
|
Holdings Partnership Distributions to APAM
|
$186,711
|
$160,353
|
$41,450
|
||
|
Total Holdings Partnership Distributions
|
$368,886
|
$427,191
|
$331,961
|
||
The portion of these distributions made to all partners are recorded as a reduction to consolidated stockholders’ equity, with the exception of the portion of distributions made to APAM, which is eliminated upon consolidation. The portion of these distributions made prior to the IPO to the holders of Class B common units (which were classified as liability awards prior to the IPO) are reflected as compensation and benefits expense within the Consolidated Statements of Operations, and totaled $65.7 million for the year ended December 31, 2013.
89
Total compensation and benefits consists of the following:
|
For the Years Ended December 31,
|
|||||||||||
|
2015
|
2014
|
2013
|
|||||||||
|
Salaries, incentive compensation and benefits
(1)
|
$
|
335,700
|
|
$
|
327,154
|
|
$
|
301,621
|
|
||
|
Restricted share based award compensation expense
|
36,467
|
|
23,148
|
|
7,542
|
|
|||||
|
Total salaries, incentive compensation and benefits
|
372,167
|
|
350,302
|
|
309,163
|
|
|||||
|
Pre-offering related compensation - share-based awards
|
42,071
|
|
64,664
|
|
404,160
|
|
|||||
|
Pre-offering related compensation - other
|
—
|
|
—
|
|
143,035
|
|
|||||
|
Total compensation and benefits
|
$
|
414,238
|
|
$
|
414,966
|
|
$
|
856,358
|
|
||
|
(1)
Excluding restricted share based award compensation expense
|
|||||||||||
Incentive compensation
Cash incentive compensation paid to members of Artisan’s portfolio management teams and members of its distribution teams is generally based on formulas that are tied directly to revenues. These payments are made in the quarter following the quarter in which the incentive was earned with the exception of fourth quarter payments which are paid in the fourth quarter of the year. Cash incentive compensation paid to most other employees is discretionary and subjectively determined based on individual performance and Artisan’s overall results during the applicable year and has historically been paid in the fourth quarter of the year. The cash incentive compensation earned by named executive officers for the year ended December 31, 2015, was paid in 2016.
Restricted share based awards
Artisan has registered
14,000,000
shares of Class A common stock for issuance under the 2013 Omnibus Incentive Compensation Plan (the “Plan”). Pursuant to the Plan, APAM has granted a combination of restricted stock awards and restricted stock units (collectively referred to as “restricted share based awards”) of Class A common stock to employees. The restricted share based awards generally vest on a pro rata basis over
five
years. Certain share based awards will vest upon a combination of both (1) pro-rata annual time vesting and (2) qualifying retirement (as defined in the award agreements). Unvested awards are subject to forfeiture upon termination of employment. Grantees receiving the awards are entitled to dividends on unvested and vested shares and units. As of
December 31, 2015
,
10,336,935
shares of Class A common stock were reserved and available for issuance under the Plan.
Compensation expense related to the restricted share based awards is recognized based on the estimated grant date fair value, for only those awards expected to vest, on a straight-line basis over the requisite service period of the award. The initial requisite service period is generally five years for all share based awards. The Company estimated the number of awards expected to vest based, in part, on historical forfeiture rates and also based on management’s expectations of employee turnover. Forfeitures are estimated at the time of grant and revised in subsequent periods, if necessary, based on actual forfeiture activity.
90
The following table summarizes the restricted share based award activity for the years ended
December 31, 2015
,
2014
and
2013
:
|
Weighted-Average Grant Date Fair Value
|
Number of Awards
|
|||||
|
Unvested at January 1, 2013
|
$
|
—
|
|
—
|
|
|
|
Granted
|
$
|
52.36
|
|
1,575,157
|
|
|
|
Forfeited
|
—
|
|
—
|
|
||
|
Vested
|
—
|
|
—
|
|
||
|
Unvested at January 1, 2014
|
$
|
52.36
|
|
1,575,157
|
|
|
|
Granted
|
$
|
52.85
|
|
1,444,688
|
|
|
|
Forfeited
|
—
|
|
—
|
|
||
|
Vested
|
$
|
52.61
|
|
(319,211
|
)
|
|
|
Unvested at January 1, 2015
|
$
|
52.59
|
|
2,700,634
|
|
|
|
Granted
|
$
|
48.17
|
|
642,950
|
|
|
|
Forfeited
|
$
|
52.71
|
|
(12,559
|
)
|
|
|
Vested
|
$
|
52.69
|
|
(469,041
|
)
|
|
|
Unvested at December 31, 2015
|
$
|
51.58
|
|
2,861,984
|
|
|
Compensation expense recognized related to the restricted share based awards was
$36.5 million
,
$23.1 million
and
$7.6 million
for the years ended
December 31, 2015
,
2014
, and
2013
, respectively. The aggregate vesting date fair value of awards that vested during the years ended December 31, 2015 and 2014 was approximately
$22.0 million
and
$16.4 million
, respectively. The unrecognized compensation expense for the unvested restricted share based awards as of
December 31, 2015
was
$120.8 million
with a weighted average recognition period of
3.5
years remaining. The initial requisite service period and remaining weighted average recognition period for career shares and standard restricted shares are substantially equivalent.
During the years ended December 31, 2015 and 2014, the Company withheld a total of
14,276
and
5,880
restricted shares, respectively, as a result of net share settlements to satisfy employee tax withholding obligations. The Company paid
$0.7 million
and
$0.3 million
in employee tax withholding obligations related to employee share transactions during the years ended
December 31, 2015
and
2014
, respectively. These net share settlements had the effect of shares repurchased and retired by the Company, as they reduced the number of shares outstanding.
Pre-offering related compensation consists of the following:
|
For the Years Ended December 31,
|
|||||||||||
|
2015
|
2014
|
2013
|
|||||||||
|
Change in value of Class B liability awards
|
$
|
—
|
|
$
|
—
|
|
$
|
41,942
|
|
||
|
Class B award modification expense
|
—
|
|
—
|
|
287,292
|
|
|||||
|
Amortization expense on pre-offering Class B awards
|
42,071
|
|
64,664
|
|
74,926
|
|
|||||
|
Pre-offering related compensation - share-based awards
|
42,071
|
|
64,664
|
|
404,160
|
|
|||||
|
Pre-offering related cash incentive compensation
|
—
|
|
—
|
|
56,788
|
|
|||||
|
Pre-offering related bonus make-whole compensation
|
—
|
|
—
|
|
20,520
|
|
|||||
|
Distributions on Class B liability awards
|
—
|
|
—
|
|
65,727
|
|
|||||
|
Pre-offering related compensation - other
|
—
|
|
—
|
|
143,035
|
|
|||||
|
Total pre-offering related compensation
|
$
|
42,071
|
|
$
|
64,664
|
|
$
|
547,195
|
|
||
91
Pre-offering related compensation - share-based awards
Historical Class B share-based awards
Holdings historically granted Class B share-based awards to certain employees. These awards vested over a period of
five
years. Prior to the IPO, all vested Class B awards were subject to mandatory redemption on termination of employment for any reason and were reflected as liabilities measured at fair value; unvested Class B awards were forfeited on termination of employment. The vested Class B liability awards of a terminated employee were historically redeemed in cash in annual installments, generally over the
five
years following termination of employment. The change in value of Class B liability awards and distributions to Class B limited partners were treated as compensation expense.
Historical redemption of Class B awards
Holdings historically redeemed the Class B awards of partners whose employment was terminated. The redemption value of the awards was determined in accordance with the terms of the grant agreement pursuant to which the award was granted. The remaining redemption payment liability for Class B awards of partners whose services to Holdings terminated prior to the IPO was
$5.6 million
and
$14.3 million
as of
December 31, 2015
and
2014
, respectively. Redemption payments of
$8.7 million
were made for the years ended
December 31, 2015
and
2014
, respectively, and
$8.8 million
for the year ended December 31, 2013.
Modification of Class B share-based awards
As a part of the IPO Reorganization, the Class B grant agreements were amended to eliminate the cash redemption feature. The amendment was considered a modification under ASC 718 and the Class B awards have been classified as equity awards since such modification. As a result of the modification, Artisan recognized a non-recurring expense of
$287.3 million
based on the elimination of the redemption feature associated with the Class B awards recorded as the difference between the fair value and carrying value of the liability associated with the vested Class B common units immediately prior to the IPO. For any unvested Class B awards, Artisan will recognize recurring non-cash compensation expense on a straight line basis over the remaining vesting period.
The following table summarizes the activity related to unvested Class B awards for the years ended
December 31, 2015
,
2014
and 2013:
|
Weighted-Average Grant Date Fair Value
|
Number of Class B Awards
|
|||||
|
Unvested Class B awards at January 1, 2013
|
$
|
30.00
|
|
9,911,720
|
|
|
|
Granted
|
—
|
|
—
|
|
||
|
Forfeited
|
30.00
|
|
(82,655
|
)
|
||
|
Vested
|
30.00
|
|
(2,579,223
|
)
|
||
|
Unvested Class B awards at January 1, 2014
|
$
|
30.00
|
|
7,249,842
|
|
|
|
Granted
|
—
|
|
—
|
|
||
|
Forfeited
|
—
|
|
—
|
|
||
|
Vested
|
30.00
|
|
(3,204,826
|
)
|
||
|
Unvested Class B awards at January 1, 2015
|
$
|
30.00
|
|
4,045,016
|
|
|
|
Granted
|
—
|
|
—
|
|
||
|
Forfeited
|
30.00
|
|
(54,730
|
)
|
||
|
Vested
|
30.00
|
|
(1,641,952
|
)
|
||
|
Unvested at December 31, 2015
|
$
|
30.00
|
|
2,348,334
|
|
|
The unrecognized compensation expense for the unvested Class B awards as of
December 31, 2015
was
$43.5 million
with a weighted average recognition period of
1.5 years
remaining.
Pre-offering related compensation - other
During the year ended December 31, 2013, Artisan also incurred pre-offering related compensation charges of
$56.8 million
to pay cash incentive compensation to certain portfolio managers and
$20.5 million
representing profits after the IPO otherwise allocable and distributable, in the aggregate, to Holdings’ pre-IPO non-employee partners that instead was allocated and distributed to certain employee-partners. For the period between January 1, 2013 and the IPO, profits distributions totaling
$65.7 million
were made to Class B partners.
92
APAM is subject to U.S. federal, state and local income taxation on APAM’s allocable portion of Holdings’ income. Components of the provision for income taxes consist of the following:
|
For the Years Ended December 31,
|
|||||||||||
|
2015
|
2014
|
2013
|
|||||||||
|
Current:
|
|||||||||||
|
Federal
|
$
|
26,090
|
|
$
|
27,094
|
|
$
|
13,816
|
|
||
|
State and local
|
3,560
|
|
3,982
|
|
2,719
|
|
|||||
|
Foreign
|
600
|
|
184
|
|
471
|
|
|||||
|
Total
|
30,250
|
|
31,260
|
|
17,006
|
|
|||||
|
Deferred:
|
|||||||||||
|
Federal
|
22,916
|
|
21,402
|
|
9,089
|
|
|||||
|
State and local
|
(6,395
|
)
|
(3,833
|
)
|
295
|
|
|||||
|
Total
|
16,521
|
|
17,569
|
|
9,384
|
|
|||||
|
Income tax expense
|
$
|
46,771
|
|
$
|
48,829
|
|
$
|
26,390
|
|
||
The provision for income taxes differs from the amount of income tax computed by applying the applicable U.S. statutory federal income tax rate to income before provision for income taxes as follows:
|
Years Ended December 31,
|
||||||||
|
2015
|
2014
|
2013
|
||||||
|
U.S. federal statutory rate
|
35.0
|
%
|
35.0
|
%
|
35.0
|
%
|
||
|
Non-deductible share-based compensation
|
2.9
|
|
3.1
|
|
2.6
|
|
||
|
Rate benefit from the flow through entity
|
(17.7
|
)
|
(20.8
|
)
|
(27.4
|
)
|
||
|
Change in deferred state tax rate
|
(3.0
|
)
|
(1.7
|
)
|
—
|
|
||
|
Other
|
0.9
|
|
1.4
|
|
1.4
|
|
||
|
Effective tax rate
|
18.1
|
%
|
17.0
|
%
|
11.6
|
%
|
||
The effective tax rate includes a rate benefit attributable to the fact that approximately
50%
,
60%
and
78%
of Artisan Partners Holdings’ taxable earnings were attributable to other partners and not taxable to APAM for the years ended
December 31, 2015
,
2014
and
2013
, respectively. This favorable impact is partially offset by the impact of certain permanent items, primarily attributable to pre-IPO share-based compensation expenses that are not deductible for tax purposes.
The H&F Corp Merger described in
Note 2, “Reorganization and IPO”
resulted in an increase in amortizable basis and the transfer of other tax attributes which APAM expects will reduce future U.S. federal, state and local income taxes and result in payments under the TRA between APAM and the Pre-H&F Merger Shareholder. The purchase by APAM of investor’s limited partnership units and the exchange of their limited partnership units subsequent to the IPO also resulted in an increase in amortizable basis which APAM expects will reduce future U.S. federal, state and local income taxes and result in payments under the TRA between APAM and the limited partners of Holdings. The TRAs require APAM to pay to the applicable counterparty an amount equal to 85% of the cash tax savings (if any) resulting from such increased tax benefits from the transactions giving rise to the tax benefit. Amounts payable under tax receivable agreements are estimates which may be impacted by factors, including but not limited to, expected tax rates, projected taxable income, and projected ownership levels. Changes in the estimates of amounts payable under tax receivable agreements are recorded as non-operating income (loss) in the Consolidated Statements of Operations. See
Note 3, “Summary of Significant Accounting Policies”
for further information.
93
Transactions during the years ended
December 31, 2015
and
2014
resulted in the following impact to deferred tax assets and amounts payable under the TRAs:
|
Amounts payable under tax receivable agreements
|
Deferred Tax Asset - Amortizable basis
|
|||||
|
December 31, 2013
|
$
|
160,663
|
|
$
|
183,858
|
|
|
2014 Follow-On Offering, H&F Conversion and Exchanges
|
328,949
|
|
386,667
|
|
||
|
Amortization
|
—
|
|
(23,472
|
)
|
||
|
Payments under TRA
(1)
|
(4,645
|
)
|
—
|
|
||
|
Change in estimate
|
4,187
|
|
4,899
|
|
||
|
December 31, 2014
|
489,154
|
|
551,952
|
|
||
|
2015 Follow-On Offering and Exchanges
|
107,740
|
|
126,753
|
|
||
|
Amortization
|
—
|
|
(33,128
|
)
|
||
|
Payments under TRA
(1)
|
(20,040
|
)
|
—
|
|
||
|
Change in estimate
|
12,247
|
|
14,677
|
|
||
|
December 31, 2015
|
$
|
589,101
|
|
$
|
660,254
|
|
|
(1)
Interest of $179 thousand and $36 thousand was paid in addition to these TRA payments for the years ended December 31, 2015 and 2014, respectively.
|
||||||
Net deferred tax assets comprise the following:
|
As of December 31, 2015
|
As of December 31, 2014
|
||||||
|
Deferred tax assets:
|
|||||||
|
Amortizable basis
(1)
|
$
|
660,254
|
|
$
|
551,952
|
|
|
|
Other
(2)
|
18,283
|
|
10,444
|
|
|||
|
Total deferred tax assets
|
678,537
|
|
562,396
|
|
|||
|
Less: valuation allowance
(3)
|
—
|
|
—
|
|
|||
|
Net deferred tax assets
|
$
|
678,537
|
|
$
|
562,396
|
|
|
|
(1)
Represents the unamortized step-up of tax basis and other tax attributes from the H&F Corp Merger described above, the purchase of common and preferred units by APAM, and the exchange of common and preferred units for Class A common shares of APAM.
|
|||||||
|
(2)
Represents the net deferred tax assets associated with the merger described above and other miscellaneous deferred tax assets.
|
|||||||
|
(3)
Artisan assessed whether the deferred tax assets would be realizable and determined based on its history of taxable income that the benefits would more likely than not be realized. Accordingly, no valuation allowance is required.
|
|||||||
Accounting standards establish a minimum threshold for recognizing, and a system for measuring, the benefits of income tax return positions in financial statements. There were no uncertain tax positions recorded as of
December 31, 2015
or
December 31, 2014
.
In the normal course of business, Artisan is subject to examination by federal and certain state, local and foreign tax regulators. As of
December 31, 2015
, U.S. federal income tax returns for the years 2012 through 2014 are open and therefore subject to examination. State and local tax returns are generally subject to audit from 2011 to 2014. Foreign tax returns are generally subject to audit from 2011 to 2014. APAM is currently under examination by the Internal Revenue Service for the tax year 2014.
94
Accumulated Other Comprehensive Income (Loss), net of tax, in the accompanying Consolidated Statements of Financial Condition represents the portion of accumulated other comprehensive income attributable to APAM, and consists of the following:
|
As of December 31, 2015
|
As of December 31, 2014
|
||||||
|
Unrealized gain on investments
|
$
|
77
|
|
$
|
326
|
|
|
|
Foreign currency translation
|
(452
|
)
|
(120
|
)
|
|||
|
Accumulated Other Comprehensive Income (Loss)
|
$
|
(375
|
)
|
$
|
206
|
|
|
Comprehensive income (loss) attributable to noncontrolling interests - Artisan Partners Holdings in the Consolidated Statements of Comprehensive Income (Loss) represents the portion of comprehensive income (loss) attributable to the equity ownership interests in Holdings held by the limited partners of Holdings.
The computation of basic and diluted earnings per share under the two-class method for the periods ended
December 31, 2015
,
2014
and
2013
were as follows:
|
Basic and Diluted Earnings Per Share
|
For the Year Ended December 31, 2015
|
For the Year Ended December 31, 2014
|
For the period from March 12, 2013 through December 31, 2013
|
|||||||
|
Numerator:
|
||||||||||
|
Net income attributable to APAM
|
$
|
81,801
|
|
$
|
69,629
|
|
$
|
24,807
|
|
|
|
Less: Convertible preferred stock deemed dividends
|
—
|
|
22,694
|
|
32,215
|
|
||||
|
Less: Subsidiary preferred equity deemed dividends
|
—
|
|
27,619
|
|
19,457
|
|
||||
|
Less: Allocation to participating securities
|
16,033
|
|
29,616
|
|
1,300
|
|
||||
|
Net income (loss) available to common stockholders
|
$
|
65,768
|
|
$
|
(10,300
|
)
|
$
|
(28,165
|
)
|
|
|
Denominator:
|
||||||||||
|
Weighted average shares outstanding
|
35,448,550
|
|
27,514,394
|
|
13,780,378
|
|
||||
|
Earnings (loss) per share
|
$
|
1.86
|
|
$
|
(0.37
|
)
|
$
|
(2.04
|
)
|
|
As described in
Note 2. Reorganization and IPO
, the consideration Artisan paid to purchase shares of its convertible preferred stock in connection with the 2014 Follow-On Offering and 2013 Follow-On Offering exceeded the carrying amount of the shares of convertible preferred stock on Artisan’s consolidated balance sheet; the excess was subtracted from net income as a deemed dividend to arrive at income available to common stockholders in the earnings per share calculation. The purchase of subsidiary preferred equity in March 2014 resulted in a similar deemed dividend, which also reduced net income available to common stockholders. Allocation to participating securities generally represents dividends paid to holders of unvested restricted share based awards and convertible preferred stock and also reduces net income available to common stockholders.
The following table summarizes the weighted-average shares outstanding that are excluded from the calculation of diluted earnings per share because their effect would have been anti-dilutive.
|
Anti-Dilutive Weighted Average Shares Outstanding
|
For the Years Ended December 31,
|
|||||||
|
2015
|
2014
|
2013
|
||||||
|
Holdings limited partnership units
|
34,960,945
|
|
42,194,109
|
|
53,867,514
|
|
||
|
Convertible preferred stock
|
—
|
|
355,228
|
|
2,305,018
|
|
||
|
Unvested restricted share based awards
|
3,052,630
|
|
2,131,068
|
|
894,732
|
|
||
|
Total
|
38,013,575
|
|
44,680,405
|
|
57,067,264
|
|
||
95
The Holdings limited partnership units are anti-dilutive primarily due to the impact of public company expenses and unrecognized share-based compensation expense. Unvested restricted share based awards are anti-dilutive, primarily because the unvested awards are considered participating securities. Convertible preferred stock was anti-dilutive in 2014 and 2013 because all potential common shares are considered anti-dilutive in periods with a net loss available to common stockholders.
Artisan has a 401(k) plan and similar foreign arrangements for its employees, under which it provides a matching contribution on employees’ pre-tax contributions. Expenses related to Artisan’s benefits plans for the
years ended December 31, 2015
,
2014
, and
2013
were
$5.5 million
,
$4.9 million
and
$4.4 million
, respectively, and are included in compensation and benefits in the Consolidated Statements of Operations.
Artisan provides an opportunity for eligible employees to participate in Artisan’s financial growth and success through equity linked incentive awards. Prior to 2015, designated employees received an annual award of units pursuant to the Equity Incentive Plan that vest on the third anniversary of the award date. The appreciation of the units, if any, is based upon a stated formula and paid in cash to participants after vesting. In 2015, Artisan began granting employees phantom equity awards, pursuant to the Artisan Partners Holdings LP Phantom Equity Plan. The phantom equity awards provide participants the right to receive cash payments upon vesting based on the trading price of APAM’s Class A common stock. Awards made under the Phantom Equity Plan are liability awards and are subject to vesting on a pro rata basis over five years. Under both plans, award recipients must be employed by Artisan on the vesting date in order to receive payment.
Expenses related to these plans for the
years ended December 31, 2015
,
2014
, and
2013
were
$0.2 million
,
$1.2 million
and
$1.5 million
, respectively, and are included in compensation and benefits in the Consolidated Statements of Operations. The liability at
December 31, 2015
and
2014
for these plans was
$1.1 million
and
$2.0 million
, respectively.
In the normal course of business, APAM enters into agreements that include indemnities in favor of third parties. Holdings has also agreed to indemnify APAM as its general partner, Artisan Investment Corporation (“AIC”) as its former general partner, the directors and officers of APAM, the directors and officers of AIC as its former general partner, the members of its former Advisory Committee, and its partners, directors, officers, employees and agents. Holdings’ subsidiaries may also have similar agreements to indemnify their respective general partner(s), directors, officers, directors and officers of their general partner(s), partners, members, employees, and agents. The Company’s maximum exposure under these arrangements is unknown, as this would involve future claims that may be made against us that have not yet occurred. APAM maintains insurance policies that may provide coverage against certain claims under these indemnities.
The composition of property and equipment at
December 31, 2015
and
2014
are as follows:
|
As of December 31,
|
|||||||
|
2015
|
2014
|
||||||
|
Computers and equipment
|
$
|
7,551
|
|
$
|
5,910
|
|
|
|
Computer software
|
4,966
|
|
4,021
|
|
|||
|
Furniture and fixtures
|
6,892
|
|
6,654
|
|
|||
|
Leasehold improvements
|
19,673
|
|
17,049
|
|
|||
|
Total Cost
|
39,082
|
|
33,634
|
|
|||
|
Less: Accumulated depreciation
|
(21,087
|
)
|
(17,040
|
)
|
|||
|
Property and equipment, net of accumulated depreciation
|
$
|
17,995
|
|
$
|
16,594
|
|
|
Depreciation expense totaled
$4.5 million
for the year ended
December 31, 2015
, and
$3.2 million
for the years ended December 31,
2014
and 2013.
Artisan has lease commitments for office space, furniture, and equipment, which are accounted for as operating leases. Certain lease agreements provide for scheduled rent increases over the lease term. Artisan records rent expense for operating leases with scheduled rent increases on a straight-line basis over the term of the respective agreement. In addition, Artisan has received certain lease incentives, which are amortized on a straight-line basis over the term of the lease agreement. Rental expense for the years ended
December 31, 2015
,
2014
and
2013
was
$9.7 million
,
$9.4 million
and
$8.4 million
, respectively.
96
At
December 31, 2015
, the aggregate future minimum payments for leases for each of the following five years and thereafter are as follows:
|
2016
|
$
|
10,083
|
|
|
2017
|
9,757
|
|
|
|
2018
|
9,929
|
|
|
|
2019
|
8,329
|
|
|
|
2020
|
7,430
|
|
|
|
Thereafter
|
29,781
|
|
|
|
Total
|
$
|
75,309
|
|
The current named executive officers of APAM and certain members of APAM’s board (or their affiliates) are limited partners of Holdings. As a result, certain transactions (such as TRA payments) between Artisan and the limited partners of Holdings are considered to be related party transactions with respect to these persons.
Holdings also makes estimated state tax payments on behalf of certain limited partners, including related parties. These payments are then netted from subsequent distributions to the limited partners. At December 31, 2015 and 2014, accounts receivables included
$0.6 million
and
$5.8 million
, respectively, of partnership tax reimbursements due from Holdings’ limited partners, including related parties.
Affiliate transactions—Artisan Funds
Artisan has an agreement to serve as the investment adviser to Artisan Funds, with which certain of Artisan employees are affiliated. Under the terms of the agreement, which generally is reviewed and continued by the board of directors of Artisan Funds annually, a fee is paid to Artisan based on an annual percentage of the average daily net assets of each Artisan Fund ranging from
0.63%
to
1.25%
. Artisan generally collects revenues related to these services on the last business day of each month and records them in management fees in the Consolidated Statement of Operations. Artisan has contractually agreed to waive its management fees or reimburse for expenses incurred to the extent necessary to limit annualized ordinary operating expenses incurred by certain of the Artisan Funds to not more than a fixed percentage (ranging from
1.25%
to
1.50%
) of a Fund’s average daily net assets. In addition, Artisan may voluntarily waive fees or reimburse any of the Artisan Funds for other expenses. The officers and a director of Artisan Funds who are affiliated with Artisan receive no compensation from the funds.
Fees for managing the Funds and amounts waived or reimbursed by Artisan for fees and expenses (including management fees) are as follows:
|
For the Years Ended December 31,
|
|||||||||||
|
2015
|
2014
|
2013
|
|||||||||
|
Investment management fees:
|
|||||||||||
|
Artisan Funds
|
$
|
528,098
|
|
$
|
561,202
|
|
$
|
455,047
|
|
||
|
Fee waiver / expense reimbursement:
|
|||||||||||
|
Artisan Funds
|
$
|
444
|
|
$
|
63
|
|
$
|
291
|
|
||
Affiliate transactions—Artisan Global Funds
Artisan has an agreement to serve as the investment adviser to Artisan Global Funds, with which certain of Artisan employees are affiliated. Under the terms of these agreements, a fee is paid based on an annual percentage of the average daily net assets of each fund ranging from
0.75%
to
1.80%
. Artisan reimburses each sub-fund of Artisan Global Funds to the extent that sub-fund’s expenses, not including Artisan’s fee, exceed certain levels, which range from
0.10%
to
0.20%
. In addition, Artisan may voluntarily waive fees or reimburse any of the Artisan Global Funds for other expenses. The directors of Artisan Global Funds who are affiliated with Artisan receive no compensation from the funds. At
December 31, 2015
and
December 31, 2014
, accounts receivable included
$1.3 million
due from Artisan Global Funds.
97
Fees for managing Artisan Global Funds and amounts reimbursed to Artisan Global Funds by Artisan are as follows:
|
For the Years Ended December 31,
|
|||||||||||
|
2015
|
2014
|
2013
|
|||||||||
|
Investment management fees:
|
|||||||||||
|
Artisan Global Funds
|
$
|
15,218
|
|
$
|
14,172
|
|
$
|
9,291
|
|
||
|
Fee waiver / expense reimbursement:
|
|||||||||||
|
Artisan Global Funds
|
$
|
441
|
|
$
|
493
|
|
$
|
752
|
|
||
Affiliate transactions—Launch Equity
Prior to the dissolution described in Note 9, Artisan had an agreement to serve as the investment adviser to Launch Equity. Under the terms of Artisan’s agreement with Launch Equity, Artisan earned a quarterly fee based on the value of the closing capital account of each limited partner for the quarter, at the rate of
1.00%
(annualized). At Artisan’s discretion, the fee was waived and certain expenses reimbursed to the extent they exceeded a certain level. Artisan waived
100%
of the quarterly fee and reimbursed Launch Equity for all operating expenses, and Artisan also waived other expenses as well. Artisan was also entitled to receive an allocation of profits equal to
20%
of Launch Equity’s net capital appreciation as determined at the conclusion of its fiscal year. That amount, which Artisan also waived, was calculated at the end of the Launch Equity’s fiscal year. Artisan waived its incentive allocation for the years ended December 31,
2014
and
2013
. No incentive fees were paid in 2014. Expense reimbursements
$163 thousand
and
$172 thousand
for the years ended December 31,
2014
and
2013
, respectively.
Services provided to the following Artisan Funds generated over ten percent of total revenues for the periods presented. Fees for managing the Funds and the percentage of total revenues are as follows:
|
For the Years Ended December 31,
|
|||||||||||
|
Artisan Fund
|
2015
|
2014
|
2013
|
||||||||
|
U.S. Mid-Cap Growth
|
$
|
88,175
|
|
$
|
90,683
|
|
$
|
76,327
|
|
||
|
Percent of total revenues
|
11.0
|
%
|
10.9
|
%
|
11.1
|
%
|
|||||
|
U.S. Mid-Cap Value
|
$
|
75,445
|
|
$
|
106,463
|
|
$
|
93,774
|
|
||
|
Percent of total revenues
|
9.4
|
%
|
12.9
|
%
|
13.7
|
%
|
|||||
|
Non-U.S. Growth
|
$
|
176,695
|
|
$
|
156,537
|
|
$
|
116,173
|
|
||
|
Percent of total revenues
|
21.9
|
%
|
18.9
|
%
|
16.9
|
%
|
|||||
|
Non-U.S. Value
|
$
|
105,600
|
|
$
|
108,837
|
|
$
|
88,342
|
|
||
|
Percent of total revenues
|
13.1
|
%
|
13.1
|
%
|
12.9
|
%
|
|||||
Artisan generates a portion of its revenues from clients domiciled in various countries outside the United States. For the years ended
December 31, 2015
,
2014
and
2013
, approximately
10%
,
9%
and
9%
of Artisan’s investment management fees, respectively, were earned from clients located outside of the United States.
In the normal course of business, Artisan may be subject to various legal and administrative proceedings. Currently, there are no legal or administrative proceedings that management believes may have a material effect on Artisan’s consolidated financial position, cash flows or results of operations.
98
The following table presents unaudited quarterly results of operations for
2015
and
2014
. These quarterly results reflect all normal recurring adjustments that are, in the opinion of management, necessary for a fair statement of the results. Revenues and net income can vary significantly from quarter to quarter due to the nature of Artisan’s business activities.
|
|
For the Quarters Ended
|
|||||||||||
|
|
March 31, 2015
|
June 30, 2015
|
Sept. 30, 2015
|
Dec. 31, 2015
|
||||||||
|
Total revenues
|
$
|
203,575
|
|
$
|
211,573
|
|
$
|
198,313
|
|
$
|
192,008
|
|
|
Operating income
|
$
|
67,829
|
|
$
|
78,313
|
|
$
|
70,555
|
|
$
|
65,688
|
|
|
Net income attributable to noncontrolling interests-Artisan Partners Holdings
|
$
|
33,932
|
|
$
|
35,522
|
|
$
|
31,674
|
|
$
|
29,177
|
|
|
Net income attributable to Artisan Partners Asset Management Inc.
|
$
|
19,514
|
|
$
|
23,736
|
|
$
|
18,474
|
|
$
|
20,077
|
|
|
Earnings per Share:
|
||||||||||||
|
Basic and diluted
|
$
|
0.43
|
|
$
|
0.50
|
|
$
|
0.44
|
|
$
|
0.47
|
|
|
|
For the Quarters Ended
|
|||||||||||
|
|
March 31, 2014
|
June 30, 2014
|
Sept. 30, 2014
|
Dec. 31, 2014
|
||||||||
|
Total revenues
|
$
|
201,792
|
|
$
|
208,487
|
|
$
|
212,406
|
|
$
|
206,016
|
|
|
Operating income
|
$
|
67,152
|
|
$
|
80,825
|
|
$
|
81,016
|
|
$
|
77,910
|
|
|
Net income attributable to noncontrolling interests-Artisan Partners Holdings
|
$
|
44,149
|
|
$
|
45,547
|
|
$
|
43,243
|
|
$
|
40,146
|
|
|
Net income attributable to Artisan Partners Asset Management Inc.
|
$
|
8,636
|
|
$
|
19,260
|
|
$
|
20,439
|
|
$
|
21,294
|
|
|
Earnings (loss) per Share:
|
||||||||||||
|
Basic and diluted
|
$
|
(2.29
|
)
|
$
|
0.42
|
|
$
|
0.57
|
|
$
|
0.58
|
|
Restricted Share Based Awards
On January 26, 2016, the board of directors of APAM approved the grant of
1,102,660
restricted share based awards to certain employees pursuant to the Company’s 2013 Omnibus Incentive Compensation Plan. Approximately half of these awards will vest pro rata in the first fiscal quarter of each of the next
five
years. The remaining awards will generally vest upon a combination of both (1) pro-rata annual time vesting and (2) qualifying retirement (as defined in the award agreements). Compensation expense associated with these awards is expected to be approximately
$33.6 million
, which will be recognized on a straight-line basis over the requisite service period.
Distributions and dividends
On January 26, 2016, the board of directors of APAM declared a distribution by Artisan Partners Holdings of
$41.8 million
to holders of Artisan Partners Holdings partnership units, including APAM. On the same date, the board declared a quarterly dividend of
$0.60
per share of Class A common stock and a special annual dividend of
$0.40
per share of Class A common stock. Both common stock dividends, a total of
$1.00
per share, are payable on February 29, 2016 to shareholders of record as of February 12, 2016.
99
Item 9.
Changes in and Disagreements With Accountants on Accounting and Financial Disclosure
None.
Disclosure Controls and Procedures
We maintain disclosure controls and procedures, as defined in Rule 13a-15(e) and 15d-15(e) of the Exchange Act, that are designed to ensure that information required to be disclosed in our reports filed or submitted under the Securities Exchange Act of 1934 is recorded, processed, summarized and reported within the time periods specified in the SEC’s rules and forms, and that such information is accumulated and communicated to our management, including our principal executive and principal financial officers, as appropriate, to allow for timely decisions regarding required disclosure.
Our management, including our Chief Executive Officer and Chief Financial Officer, evaluated the effectiveness of our disclosure controls and procedures (as such term is defined in Rule 13a-15(e) and 15d-15(e) under the Exchange Act) at
December 31, 2015
. Based on that evaluation, our Chief Executive Officer and Chief Financial Officer have concluded that our disclosure controls and procedures are effective.
Report of Management on Internal Control over Financial Reporting
Company management is responsible for establishing and maintaining adequate internal control over financial reporting as defined in Rule 13a-15(f) and 15d-15(f) under the Exchange Act. Our internal control over financial reporting is a process designed to provide reasonable assurance regarding the reliability of financial reporting and the preparation of financial statements for external purposes in accordance with generally accepted accounting principles.
Because of its inherent limitations, internal control over financial reporting may not prevent or detect misstatements. Also, projections of any evaluation of effectiveness to future periods are subject to the risk that controls may become inadequate because of changes in conditions, or that the degree of compliance with the policies or procedures may deteriorate.
Company management, including our Chief Executive Officer and Chief Financial Officer, evaluated the effectiveness of our internal control over financial reporting as of
December 31, 2015
, based on the 2013 version of the Internal Control - Integrated Framework set forth by the Committee of Sponsoring Organizations of the Treadway Commission in
Internal Control - Integrated Framework
. Based on that assessment, Company management concluded that the Company’s internal control over financial reporting was effective as of
December 31, 2015
.
The effectiveness of the Company’s internal control over financial reporting as of
December 31, 2015
, has been audited by PricewaterhouseCoopers LLP, an independent registered public accounting firm, as stated in their report appearing in Item 8, which expresses an unqualified opinion on the effectiveness of internal control over financial reporting as of
December 31, 2015
.
Changes in Internal Control over Financial Reporting
There have been no changes in internal control over financial reporting (as such term is defined in Rule 13a-15(f) and 15d-15(f) under the Exchange Act) during the quarter ended
December 31, 2015
, that have materially affected or are reasonably likely to materially affect our internal control over financial reporting.
None.
100
The following table sets forth the name, age and positions of each of our directors and executives officers at February 23, 2016:
|
Name
|
Age
|
Position
|
||
|
Matthew R. Barger
|
58
|
Independent Director
|
||
|
Seth W. Brennan
|
45
|
Independent Director
|
||
|
Tench Coxe
|
58
|
Independent Director
|
||
|
Stephanie G. DiMarco
|
58
|
Independent Director
|
||
|
Jeffrey A. Joerres
|
56
|
Independent Director
|
||
|
Andrew A. Ziegler
|
58
|
Lead Director
|
||
|
Eric R. Colson
|
46
|
President, Chief Executive Officer and Chairman of the Board
|
||
|
Charles J. Daley, Jr.
|
53
|
Executive Vice President, Chief Financial Officer and Treasurer
|
||
|
James S. Hamman, Jr.
|
46
|
Executive Vice President
|
||
|
Sarah A. Johnson
|
44
|
Executive Vice President, Chief Legal Officer and Secretary
|
||
|
Dean J. Patenaude
|
53
|
Executive Vice President
|
||
|
Gregory K. Ramirez
|
45
|
Executive Vice President
|
||
Mr. Barger has served on our Board since February of 2013. Mr. Barger is the chairman of the Board’s Nominating and Corporate Governance Committee and also serves on the Board’s Audit Committee. He is currently the managing member of MRB Capital, LLC, and he has been a senior advisor at Hellman & Friedman LLC (“H&F”) since 2007. Prior to 2007, he served in a number of roles at H&F, including managing general partner and chairman of the investment committee. Mr. Barger was a member of the advisory committee of Artisan Partners Holdings from January 1995 to the completion of our initial public offering in March 2013. Prior to joining H&F, Mr. Barger was an associate in the corporate finance department of Lehman Brothers Kuhn Loeb. Mr. Barger graduated from Yale University in 1979 and received an M.B.A. from the Stanford Graduate School of Business in 1983. He has been a director of Hall Capital Partners LLC since August 2007. Mr. Barger’s expertise in the investment management industry and his broad experience in public and private directorships, finance, corporate strategy and business development provide valuable insight to our Board.
Mr. Brennan joined our Board in October of 2014 and currently serves on the Compensation Committee and Nominating and Corporate Governance Committee. Mr. Brennan is currently managing partner and co-founder of Lincoln Peak Capital. Prior to founding Lincoln Peak Capital in 2008, Mr. Brennan was an executive vice president and founding management team member of Affiliated Managers Group, Inc. Before joining Affiliated Managers Group, Mr. Brennan worked in the global insurance investment banking group at Morgan Stanley & Co. and in the financial institutions group at Wasserstein, Perella & Co. Mr. Brennan received a B.A. from Hamilton College. Mr. Brennan’s operating and leadership experience in the investment management industry qualifies him to serve on our Board. He brings to the Board extensive experience in finance and business development.
Mr. Coxe has served on our Board since February of 2013 and currently serves on the Compensation Committee and Nominating and Corporate Governance Committee. He has been a managing director of Sutter Hill Ventures since 1989 and joined that firm in 1987 following his tenure with Digital Communications Associates in Atlanta. Prior to that, Mr. Coxe worked with Lehman Brothers in New York City, where he was a corporate finance analyst specializing in mergers and acquisitions as well as debt and equity financing. Mr. Coxe was a member of Artisan Partners Holdings’ advisory committee from January 1995 to the completion of our initial public offering in March 2013. Mr. Coxe holds a B.A. in economics from Dartmouth College and an M.B.A. from Harvard Business School. He currently serves on the boards of directors of Mattersight Corporation and Nvidia Corporation. Mr. Coxe’s wide-ranging leadership experience and his experiences with both public and private directorships enable him to provide additional insight to our Board and its committees.
Ms. DiMarco has served on our Board since February 2013 and currently chairs the Audit Committee. Ms. DiMarco founded Advent Software, Inc. in June 1983 and served Advent in various capacities, most recently as the chair of its board of directors (September 2013 to July 2015), chief executive officer (May 2003 to June 2012) and chief financial officer (July 2008 to September 2009).
101
She currently serves on the advisory board of the College of Engineering at the University of California Berkeley and the board of directors of Summer Search, a non-profit organization. She is also a member of the Presidio Institute Advisory Committee. She is a former member of the board of trustees of the University of California Berkeley Foundation, a former advisory board member of the Haas School of Business at the University of California Berkeley and a former trustee of the San Francisco Foundation where she chaired the investment committee. Ms. DiMarco holds a B.S. in business administration from the University of California at Berkeley. Ms. DiMarco’s extensive experience in technological developments for the asset management industry and her management experience as a founder, officer and director of Advent provide perspective on the management and operations of a public company. In addition, her extensive financial and accounting experience strengthens our Board through her understanding of accounting principles, financial reporting rules and regulations, and internal controls.
Mr. Joerres has served on our Board since February of 2013. He currently chairs the Compensation Committee and serves as a member of the Audit Committee. Mr. Joerres was executive chairman and chairman of the board of directors of ManpowerGroup until his retirement in December 2015. From April 1999 until May 2014, he served as chief executive officer of ManpowerGroup. Prior to becoming chief executive officer, he served as vice president of marketing, senior vice president of European operations and senior vice president of global account management. Prior to joining ManpowerGroup, Mr. Joerres held the position of vice president of sales and marketing for ARI Network Services. Mr. Joerres currently serves on the boards of Johnson Controls, Inc. and Western Union and is a member of the Committee for Economic Development. He is also past chairman and director of the Federal Reserve Bank of Chicago and a former trustee of the U.S. Council for International Business. Mr. Joerres served on the board of Artisan Partners Funds, Inc. from 2001 to 2011. Mr. Joerres holds a bachelor’s degree from Marquette University’s College of Business Administration. Mr. Joerres’s operating and leadership experience as an officer and director of ManpowerGroup and his innovative approach to optimizing human capital provide the Board with insight into the management and operations of a public company.
Mr. Ziegler has served on our Board since March 2011 and is currently its Lead Director. Mr. Ziegler served as Chairman of the Board from March 2011 to August 2015 and was our Executive Chairman from March 2011 to March 2014. Mr. Ziegler also served on the board of directors of Artisan Partners Funds, Inc. from January 1995 to November 2013. Mr. Ziegler was a managing director and the chief executive officer of Artisan Partners Holdings from its founding in 1994 through January 2010. Immediately prior to founding Artisan Partners, Mr. Ziegler was president and chief operating officer of Strong Capital Management, Inc. and president of the Strong Capital Management, Inc. group of mutual funds. Mr. Ziegler holds a B.S. from the University of Wisconsin-Madison and a J.D. from the University of Wisconsin Law School. Mr. Ziegler’s operating and leadership experience as our past executive chairman and his extensive knowledge of our business and the investment management industry provide the Board with insight into the company and valuable continuity of leadership.
Mr. Colson has been President, Chief Executive Officer and a director of Artisan Partners Asset Management since March 2011 and has served as Chairman of the Board since August 1, 2015. He has also been a director of Artisan Partners Funds, Inc. since November 2013. Mr. Colson has served as chief executive officer of Artisan Partners since January 2010. Before serving as Artisan Partners’ chief executive officer, Mr. Colson served as chief operating officer for investment operations from March 2007 through January 2010. Mr. Colson has been a managing director of Artisan Partners since he joined the company in January 2005. Before joining Artisan Partners, Mr. Colson was an executive vice president of Callan Associates, Inc. Mr. Colson holds a B.A. in economics from the University of California-Irvine.
Mr. Daley has been Executive Vice President, Chief Financial Officer and Treasurer of Artisan Partners Asset Management since March 2011. He has served as chief financial officer of Artisan Partners since August 2010. He has been a managing director of Artisan Partners since July 2010. Prior to that, Mr. Daley was chief financial officer, executive vice president and treasurer of Legg Mason, Inc. Mr. Daley holds a B.S. in Accounting from the University of Maryland, is an inactive certified public accountant, and holds a Series 27 license.
Mr. Hamman was appointed Executive Vice President of Artisan Partners Asset Management in February 2016. He has served as a managing director of Artisan Partners with responsibility for overseeing human capital and various corporate development initiatives since April 2014. Prior to his current role, Mr. Hamman was responsible for providing legal advice with respect to various aspects of Artisan’s advisory business. He has also served as a director of Artisan Partners Global Funds since June 2010. Mr. Hamman joined Artisan Partners in March 2010. He holds a B.B.A from the University of Notre Dame and a J.D. from Northwestern University School of Law.
Ms. Johnson has been Executive Vice President, Chief Legal Officer and Secretary of Artisan Partners Asset Management and General Counsel of Artisan Partners since October 2013. From April 2013 to October 2013 she served as Assistant Secretary of Artisan Partners Asset Management. She has been general counsel of Artisan Partners Funds, Inc. since February 2011. Ms. Johnson was named a managing director of Artisan Partners in March 2010. Prior to joining the firm in July 2002, Ms. Johnson practiced law with the law firm of Bell, Boyd & Lloyd LLC, Chicago, Illinois. Ms. Johnson holds a B.A. from Northwestern University and a J.D. from Northwestern University School of Law.
102
Mr. Patenaude has been Executive Vice President of Artisan Partners Asset Management since July 2012 and a managing director of Artisan Partners and Head of Global Distribution since joining Artisan Partners in March 2009. Before joining Artisan Partners, Mr. Patenaude was senior vice president and head of global distribution for Affiliated Managers Group, Inc. Mr. Patenaude holds a B.S. in Business Administration from Georgetown University and an M.B.A. from the Kellogg School of Management at Northwestern University.
Mr. Ramirez was appointed Executive Vice President of Artisan Partners Asset Management in February 2016. From October 2013 to February 2016 he served as Senior Vice President and from April 2013 to October 2013 as Assistant Treasurer. He currently serves as chief financial officer for Artisan Partners Funds, Inc. and Head of Securities Operations and Vehicle Administration for Artisan Partners. He has also served as a director of Artisan Partners Global Funds since June 2010. His prior roles with Artisan Partners include controller, chief accounting officer and director of client accounting and administration. Mr. Ramirez was named a managing director of Artisan Partners in April 2003. Prior to joining the firm in July 1997, Mr. Ramirez was an audit manager with Price Waterhouse, focusing on investment company audits and reviewing transfer agency controls. Mr. Ramirez holds a B.B.A. in Accounting from the University of Iowa and an M.B.A. from Marquette University. He is a Certified Public Accountant and holds a Series 27 license.
Under the terms of our Stockholders Agreement, our Stockholders Committee, which has the authority to vote approximately 65% of the combined voting power of our capital stock, is required to vote the shares subject to the agreement for the election of each of Mr. Barger, Mr. Colson and Mr. Ziegler. Under the agreement, Artisan is required to use its best efforts to elect Mr. Barger, Mr. Colson and Mr. Ziegler, which efforts must include soliciting proxies for, and recommending that the company’s stockholders vote in favor of, the election of each. For more information on the Stockholders Agreement and Stockholders Committee see Item 13 of this report. There are no family relationships among any of our directors or executive officers.
Section 16(a) Beneficial Ownership Reporting Compliance
Section 16(a) of the Exchange Act and regulations of the SEC require our directors, executive officers and, with certain exceptions, persons who own more than 10% of a registered class of our equity securities, as well as certain affiliates of such persons, to file with the SEC reports of ownership of, and transactions in, our equity securities. These reporting persons are further required to provide us with copies of these reports.
Based solely on our review of such reports and written representations by the reporting persons, we believe that during the fiscal year ended
December 31, 2015
, our directors, officers and owners of more than 10% of a registered class of our equity securities complied with all applicable filing requirements, except for one late Form 4 for Ms. DiMarco relating to two purchases inadvertently made during fiscal 2015 pursuant to a broker-administered dividend reinvestment program.
Code of Ethics
Our Board has adopted a Code of Business Conduct applicable to all directors, officers and employees of the company to provide a framework for the highest standards of professional conduct and foster a culture of honesty and accountability. The Code of Business Conduct satisfies applicable SEC requirements and NYSE listing standards. The Code of Business Conduct is available under the Corporate Governance link on our website at
www.apam.com
. We will provide a printed copy of the Code of Business Conduct to stockholders upon request.
We intend to post on our website, www.apam.com, all disclosures that are required by law or NYSE listing standards concerning any amendments to, or waivers from, any provision of our Codes of Ethics.
Director Independence
The Board is composed of a majority of directors who satisfy the criteria for independence under the NYSE listing standards and do not have any material relationship with the Company. Our Board has determined that each of Matthew R. Barger, Seth W. Brennan, Tench Coxe, Stephanie G. DiMarco and Jeffrey A. Joerres is independent in accordance with NYSE listing standards and our Governance Guidelines, and does not have any relationship that would interfere with exercising independent judgment in carrying out his or her responsibilities as a director.
The Board and its Committees
The Board conducts its business through meetings of the Board and through meetings of its committees. The Board has three standing committees: an Audit Committee, a Compensation Committee and a Nominating and Corporate Governance Committee. The current members and chairpersons of the committees are:
103
|
Director
|
Audit Committee
|
Compensation Committee
|
Nominating and Corporate Governance Committee
|
|
Matthew R. Barger
|
X
|
Chair
|
|
|
Seth W. Brennan
|
X
|
X
|
|
|
Tench Coxe
|
X
|
X
|
|
|
Stephanie G. DiMarco
|
Chair
|
||
|
Jeffrey A. Joerres
|
X
|
Chair
|
|
The Audit Committee is comprised solely of directors who meet the independence requirements under NYSE listing standards and the Securities Exchange Act, and who are “financially literate” under NYSE rules. The Board has determined that each member of the Audit Committee has “accounting or related financial management expertise” and qualifies as an “audit committee financial expert”. The Audit Committee was established in accordance with Section 3(a)(58)(A) of the Exchange Act.
Compensation Discussion and Analysis
Summary
The core elements of our named executive officers’ compensation are base salary, a performance based discretionary cash bonus, and equity awards.
The following table shows the elements of compensation paid to our named executive officers with respect to
2015
,
2014
and 2013. The amounts in this table vary from the data and reporting conventions required in the Summary Compensation Table below.
|
Name & Principal Position
|
Year
|
Salary
|
Cash Bonus
|
Restricted Share Grant
|
Total Direct Compensation
|
Incentive Pay as a % of Total Direct Compensation
|
||||||||||||||
|
Eric R. Colson, Chief Executive Officer
|
2015
|
$
|
250,000
|
|
$
|
5,500,000
|
|
$
|
915,300
|
|
$
|
6,665,300
|
|
96%
|
||||||
|
2014
|
250,000
|
|
5,500,000
|
|
873,510
|
|
6,623,510
|
|
96%
|
|||||||||||
|
2013
|
250,000
|
|
7,000,000
|
|
1,178,100
|
|
8,428,100
|
|
97%
|
|||||||||||
|
Charles J. Daley, Jr., Chief Financial Officer
|
2015
|
250,000
|
|
2,000,000
|
|
305,100
|
|
2,555,100
|
|
90%
|
||||||||||
|
2014
|
250,000
|
|
2,000,000
|
|
423,520
|
|
2,673,520
|
|
91%
|
|||||||||||
|
2013
|
250,000
|
|
2,500,000
|
|
549,780
|
|
3,299,780
|
|
92%
|
|||||||||||
|
Dean J. Patenaude, Global Distribution
|
2015
|
250,000
|
|
2,200,000
|
|
305,100
|
|
2,755,100
|
|
91%
|
||||||||||
|
2014
|
250,000
|
|
2,200,000
|
|
370,580
|
|
2,820,580
|
|
91%
|
|||||||||||
|
2013
|
250,000
|
|
2,100,000
|
|
497,420
|
|
2,847,420
|
|
91%
|
|||||||||||
|
Sarah A. Johnson, Chief Legal Officer
|
2015
|
250,000
|
|
1,200,000
|
|
305,100
|
|
1,755,100
|
|
86%
|
||||||||||
|
2014
|
250,000
|
|
1,025,000
|
|
423,520
|
|
1,698,520
|
|
85%
|
|||||||||||
|
2013
|
250,000
|
|
950,000
|
|
261,800
|
|
1,461,800
|
|
83%
|
|||||||||||
|
Gregory K. Ramirez, Executive Vice President
|
2015
|
250,000
|
|
1,150,000
|
|
305,100
|
|
1,705,100
|
|
85%
|
||||||||||
|
2014
|
250,000
|
|
1,075,000
|
|
370,580
|
|
1,695,580
|
|
85%
|
|||||||||||
|
2013
|
250,000
|
|
1,000,000
|
|
261,800
|
|
1,511,800
|
|
83%
|
|||||||||||
104
The
2015
compensation reflects, among other things:
|
•
|
The maintenance of an environment and culture in which our investment professionals continued to deliver strong investment performance. At year-end, the 5-year average annual returns of 8 of our 12 investment strategies with 5-year track records exceeded the returns of the applicable benchmark. Six of those strategies beat their benchmark on average by over 450 basis points per year during the 5-year period. Our Global Opportunities and Global Equity strategies, both of which are open to new clients and investors and have realizable capacity, beat their benchmarks by over 600 and 550 basis points, respectively, over the 5-year period.
|
|
•
|
The hiring and on-boarding of our seventh investment team, the Developing World team, and the successful launch of the team’s first strategy, the Artisan Developing World strategy. The Developing World strategy is consistent with our high value added philosophy and reflects our goal of launching new strategies with high degrees of freedom that are not easily replicated with passive products.
|
|
•
|
The successful first full-year for the Artisan High Income strategy, the firm’s first credit strategy. At year-end, the strategy had assets under management of
$988.9 million
.
|
|
•
|
The further expansion of our global distribution efforts, including opening new offices in Australia and Canada. At year-end, $14.2 billion of our total assets under management were from clients domiciled outside the U.S.
|
|
•
|
Executing our variable expense financial model in order to deliver a strong adjusted operating margin of
40.3%
. Our 2015 revenues of $805.5 million and adjusted operating income of $324.5 million are the second highest annual revenues and income in the firm’s history, behind only 2014. We also continued to distribute over 100% of our adjusted earnings to our investors.
|
|
•
|
The successful completion of our March 2015 follow-on offering and the continued evolution of our capital structure.
|
|
•
|
Maintaining and enhancing relationships and communication with clients, employees, investors and potential new investment talent.
|
In 2014 we introduced a new component to our equity compensation program: career shares. Our standard restricted shares vest pro-rata over the five years following the date of grant. For career shares to vest, both of the following conditions must be met:
|
•
|
Pro rata time-vesting, under which 20% of the shares satisfy this condition in each of the five years following the year of grant.
|
|
•
|
Qualifying retirement, which requires that the recipient (i) has been employed by us for at least 10 years at retirement; (ii) had provided, in the case of named executive officers and portfolio managers, three years’ prior written notice of retirement (which can be reduced to not less than one year at our discretion); and (iii) remains at the Company through the retirement notice period.
|
One-half of the restricted shares awarded to each of our named executive officers since 2014 have been career shares. With certain exceptions, those career shares will only vest if and when the named executive officer retires from the Company in accordance with the qualifying retirement conditions. We believe that career shares will further align the interests of our named executive officers, portfolio managers, and other senior employees with our stockholders and clients and will incentivize recipients to remain at our firm until they are ready to leave in a thoughtful and structured way.
In addition to career shares, our named executive officer compensation program includes the following features that we believe reflect sound corporate pay governance:
|
•
|
We do not have employment or other agreements that provide termination benefits outside the context of a change in control.
|
|
•
|
Our post-IPO equity grants include double-trigger change in control provisions.
|
|
•
|
We do not provide “golden parachute” tax gross ups.
|
|
•
|
None of our named executive officers have bonus guarantees.
|
|
•
|
We do not offer retirement or pension plans other than the same 401(k) plan that is available to all employees.
|
|
•
|
We do not maintain any benefit plans or perquisites that cover only one or more of our named executive officers.
|
|
•
|
Our insider trading policy prohibits hedging or pledging of Company stock by our employees.
|
|
•
|
Our Compensation Committee receives input from an independent compensation consultant.
|
Objectives of the Compensation Program
We believe that to create long-term value for our stockholders our management team needs to focus on the following business objectives:
|
•
|
Achieving profitable and sustainable financial results.
|
|
•
|
Delivering superior investment performance and client service.
|
|
•
|
Attracting and retaining top investment talent whose interests are aligned with our clients and stockholders.
|
|
•
|
Expanding our investment capabilities through thoughtful growth.
|
|
•
|
Continuing to diversify our sources of assets.
|
105
Our cash and equity compensation programs are designed to:
|
•
|
Support our business strategy.
|
|
•
|
Attract, motivate and retain highly talented, results-oriented individuals.
|
|
•
|
Reward the achievement of superior and sustained long-term performance.
|
|
•
|
Be flexible and responsive to evolving market conditions.
|
|
•
|
Align the interests of our named executive officers with our stockholders.
|
|
•
|
Provide competitive pay opportunities.
|
Determination of Compensation
Role of Compensation Committee, Board and Chief Executive Officer
. Our Compensation Committee, which is comprised solely of independent directors, has ultimate responsibility for all compensation decisions relating to our named executive officers. Other members of the Board regularly attend and participate in meetings of the Compensation Committee, and the members of the Compensation Committee and Board regularly meet in executive session without management present. The decisions of the Compensation Committee are reported to the entire Board.
Our Chief Executive Officer evaluates the performance of, and makes recommendations to our Compensation Committee regarding compensation matters involving, the other named executive officers. The Compensation Committee retains the ultimate authority to approve, reject or modify those recommendations. The Compensation Committee independently evaluates our Chief Executive Officer’s performance and determines our Chief Executive Officer’s compensation.
Use of Compensation Consultant
. Our Compensation Committee has retained the services of McLagan, a compensation consultant, to provide advice regarding our named executive officer compensation program and compensation trends in the asset management industry. McLagan must receive pre-approval from the chairperson of our Compensation Committee prior to accepting any non-survey-related work from management. Other than compensation surveys and multi-client studies where McLagan provided information, but not advice, McLagan did not provide any services to management in
2015
. Our Compensation Committee has assessed the independence of McLagan pursuant to SEC rules and concluded that no conflict of interest exists that prevents McLagan from independently advising the Compensation Committee.
Peer Group Compensation Review
. We consider the individual and aggregate pay levels and financial performance of other asset management companies as inputs to our compensation decision-making process. For example, in approving the elements and amounts of compensation paid to our named executive officers with respect to 2015, our Compensation Committee considered compensation information with respect to other companies in the asset management industry.
Tax and Accounting Considerations.
When it reviews compensation matters, our Compensation Committee considers the anticipated tax and accounting treatment of various payments and benefits to the Company and, when relevant, to its named executive officers, although these considerations are not dispositive. Section 162(m) of the Internal Revenue Code generally disallows a tax deduction to a publicly-traded corporation that pays compensation in excess of $1 million to any of its named executive officers (other than the chief financial officer) in any taxable year, unless the compensation plan and awards meet certain requirements. Section 162(m) did not apply to our compensation prior to our IPO in March 2013. Under the transition rules, in general, compensation paid under a plan that existed while we were private is exempt from the $1 million deduction limit until the earliest to occur of: (i) the expiration of the plan; (ii) the material modification of the plan; (iii) the issuance of all available shares and other compensation that has been allocated under the plan; and (iv) the first meeting of stockholders at which directors are to be elected that occurs after the close of the third calendar year following the calendar year in which our IPO occurred (i.e., the first meeting of stockholders after December 31, 2016). To the extent Section 162(m) is now applicable to us, we are relying on this exemption. Notwithstanding the foregoing, we reserve the right to pay amounts that are not deductible under Section 162(m) during any period when Section 162(m) is applicable to us.
Elements of our Named Executive Officers’ Compensation and Benefits
The elements of our named executive officer compensation program include:
|
•
|
Base salary.
|
|
•
|
Annual performance based discretionary cash bonus.
|
|
•
|
Equity compensation.
|
|
•
|
Retirement benefits.
|
|
•
|
Other benefits.
|
106
Base Salary
Base salaries are intended to provide our named executive officers with a degree of financial certainty and stability that does not depend on performance and that does not differentiate among the responsibilities, contributions or performance of our named executive officers. Instead, we consider it a baseline compensation level that delivers some current cash income to our named executive officers. As is typical in the asset management industry, our named executive officers’ base salaries represent a relatively small portion of their overall total direct compensation. We believe that the potential for substantial incentive compensation is seen by our named executive officers as the more important component. Further, we believe in a model of managed fixed costs and the potential for substantial upside to productive employees and view this compensation structure as promoting our business objectives. Each of our named executive officers received an annual base salary of $250,000 in
2015
. The $250,000 annual base salary for named executive officers has remained unchanged over the last decade. We will continue to annually review the base salaries of our named executive officers.
Annual Performance Based Discretionary Cash Bonus
Cash incentive compensation is the most significant part of our named executive officers’ total direct compensation. Annual cash incentive compensation is determined after the end of each year and is based on the Compensation Committee’s assessment of individual and company-wide performance measured over long-term periods. We do not use predetermined incentive formulas to evaluate performance or determine pay. In its decision-making process for 2015, the Compensation Committee considered the execution of certain key strategic priorities, as well as business and financial metrics.
At its April
2015
meeting, our Compensation Committee discussed target bonus amounts for each named executive officer and a set of key strategic priorities and business and financial metrics against which to evaluate performance and determine bonuses. At its July and October
2015
meetings, the Compensation Committee reviewed the strategic priorities and metrics and discussed the target bonus amounts. In early January 2016 the Compensation Committee met to discuss the execution of strategic priorities and again discussed the target bonus amounts. In late January 2016 the Compensation Committee determined annual cash bonuses for
2015
based on its assessment of the named executive officers’ execution of strategic priorities and our 2015 business and financial results. In shaping its decisions with respect to all of the named executive officers, the Compensation Committee considered the following key
2015
achievements:
|
•
|
The maintenance of an environment and culture in which our investment professionals continued to deliver strong investment performance. At year-end, the 5-year average annual returns of 8 of our 12 investment strategies with 5-year track records exceeded the returns of the applicable benchmark. Six of those strategies beat their benchmark on average by over 450 basis points per year during the 5-year period. Our Global Opportunities and Global Equity strategies, both of which are open to new clients and investors and have realizable capacity, beat their benchmarks by over 600 and 550 basis points, respectively, over the 5-year period.
|
|
•
|
The hiring and on-boarding of our seventh investment team, the Developing World team, and the successful launch of the team’s first strategy, the Artisan Developing World strategy. The Developing World strategy is consistent with our high value added philosophy and reflects our goal of launching new strategies with high degrees of freedom that are not easily replicated with passive products.
|
|
•
|
The successful first full-year for the Artisan High Income strategy, the firm’s first credit strategy. At year-end, the strategy had assets under management of
$988.9 million
.
|
|
•
|
The further expansion of our global distribution efforts, including opening new offices in Australia and Canada. At year-end, $14.2 billion of our total assets under management were from clients domiciled outside the U.S.
|
|
•
|
Executing our variable expense financial model in order to deliver a strong adjusted operating margin of
40.3%
. Our 2015 revenues of $805.5 million and adjusted operating income of $324.5 million are the second highest annual revenues and income in the firm’s history, behind only 2014. We also continued to distribute over 100% of our adjusted earnings to our investors.
|
|
•
|
The successful completion of our March 2015 follow-on offering and the continued evolution of our capital structure.
|
|
•
|
Maintaining and enhancing relationships and communication with clients, employees, investors and potential new investment talent.
|
Based on these achievements , the Compensation Committee determined to pay
2015
cash incentive awards as follows:
$5,500,000
for Mr. Colson;
$2,000,000
for Mr. Daley;
$1,200,000
for Ms. Johnson;
$2,200,000
for Mr. Patenaude; and
$1,150,000
for Mr. Ramirez.
Equity Compensation
We strongly believe that equity participation causes employees to think and act like owners. Each of our named executive officers has significant holdings in the Company’s equity, through a mix of standard restricted shares, career shares and Class B common units of Artisan Partners Holdings. We place significant restrictions on the number of Class B common units that our named executive officers may sell in any given year. These restrictions result in our named executive officers maintaining a significant level of equity ownership.
107
In 2014 we introduced a new component to our equity compensation program: career shares. Our standard restricted shares vest pro-rata over the five years following the date of grant, subject to continued employment. For career shares to vest, both of the following conditions must be met:
|
•
|
Pro rata time-vesting, under which 20% of the shares satisfy this condition in each of the five years following the year of grant.
|
|
•
|
Qualifying retirement, which requires that the recipient (i) has been employed by us for at least 10 years at retirement; (ii) had provided, in the case of named executive officers and portfolio managers, three years’ prior written notice of retirement (which can be reduced to not less than one year at our discretion); and (iii) remains at the company through the retirement notice period.
|
Career shares and standard restricted shares will also vest upon a termination of employment due to death or disability. In addition, after a change of control, if the company terminates a recipient without cause or he or she resigns for good reason, in either case, within two years after a change in control, the shares will fully vest.
We believe that career shares will further align the interests of our named executive officers, portfolio managers, and other senior employees with our stockholders and clients and will incentivize recipients to remain at our firm until they are ready to leave in a thoughtful and structured way. Both standard restricted shares and career shares are awarded pursuant to the Artisan Partners Asset Management Inc. 2013 Omnibus Incentive Compensation Plan.
In January 2016, our Compensation Committee recommended, and our Board subsequently approved, equity grants to certain of our employees, including to our named executive officers. The aggregate award constituted a total of
1.1 million
shares, of which a total of
70,000
shares (or
6%
of the total grant) were awarded to our named executive officers as follows:
15,000
standard restricted shares and
15,000
career shares for Mr. Colson;
5,000
standard restricted shares and
5,000
career shares for Mr. Daley;
5,000
standard restricted shares and
5,000
career shares for Ms. Johnson;
5,000
standard restricted shares and
5,000
career shares for Mr. Patenaude; and
5,000
standard restricted shares and
5,000
career shares for Mr. Ramirez. The size of the award to each named executive officer was determined by the Compensation Committee in consultation with our Chief Executive Officer. By accepting the awards, each of our named executive officers agreed to certain restrictive covenants, including agreements not to compete with Artisan or solicit Artisan clients and employees, for one year after he or she ceases to be employed by Artisan.
We intend to continue to grant annual equity-based awards to our current named executive officers under the Omnibus Plan, which provides for a wide variety of equity awards. The size and structure of the equity awards granted with respect to
2015
may not be indicative of future awards. Future equity awards may be granted in a mix of restricted shares (both standard and career) and options and subject to both time- and performance-based vesting. We expect that future awards of restricted shares to our named executive officers will continue to consist of one-half career shares and one-half standard restricted shares.
Retirement Benefits
We believe that providing a cost-effective retirement benefit for the Company’s employees is an important recruitment and retention tool. Accordingly, the Company maintains, and each of the named executive officers participates in, a contributory defined contribution retirement plan for all U.S.-based employees, and matches 100% of each employee’s contributions (other than catch-up contributions by employees age 50 and older) up to the
2015
limit of $18,000. We also maintain retirement plans or make retirement plan contributions (or equivalent cash payments) for our employees based outside the U.S. The opportunity to participate in a retiree health plan, at the sole expense of the retiree, is available to employee-partners and career share recipients who have at least 10 years of service with us at the time of retirement.
Other Benefits
Our named executive officers participate in the employee health and welfare benefit programs we maintain, including medical, group life and long-term disability insurance, and health care savings accounts, on the same basis as all U.S. employees, subject to satisfying any eligibility requirements and applicable law. We also generally provide employer-paid parking or transit assistance and, for our benefit and convenience, on-site food and beverages; our named executive officers enjoy those benefits on the same terms as all of our employees.
108
Equity Award Modification
Our transition from a private partnership to a publicly-traded company in 2013 resulted in our recognizing several non-recurring expenses, including a non-recurring compensation expense of
$287.3 million
related to the modification of the Class B equity awards that we had made to our employee-partners, including each of our named executive officers. Prior to the IPO, the Class B awards were redeemable by us for cash upon termination of employment. The redemption value included a premium in the case of termination by reason of death, disability or retirement. As part of the 2013 IPO reorganization, the Class B awards were amended to eliminate the cash redemption feature. Now, upon termination of employment, an employee-partner retains his or her partnership equity. The equity may be exchanged for shares of our Class A common stock and sold over a time frame that depends on the circumstances of the employee-partner’s termination.
Applicable rules require that we include the incremental fair value resulting from the modification in the “Stock Awards” and “Total Compensation” columns below, although we do not believe the amounts related to the modification represented compensation paid to our named executive officers. The modification applied consistently to all of our employees who were partners of our firm at the time of our IPO, and it applied to equity awards that were made over a number of years prior to 2013. For instance, for Mr. Colson, the awards that were modified were made in 2006, 2008, 2009, 2010, 2011 and 2012.
The award modification described above, which we refer to as the “Modification”, is not expected to recur. There were no award modifications made with respect to 2014 or
2015
.
Risk Management and Named Executive Officer Compensation
We have identified two primary risks relating to compensation: the risk that compensation will not be sufficient in amount or appropriately structured to attract and to retain talent, and the risk that compensation may provide unintended incentives. To combat the risk that our compensation might not be sufficient or be inappropriately structured, we strive to use a compensation structure, and set compensation levels, for all employees in a way that we believe promotes retention. We make equity awards subject to multi-year vesting schedules to provide a long-term component to our compensation program, and in 2014 we introduced career shares to our equity compensation program. We believe that both the structure and levels of compensation have aided us in attracting and retaining key personnel. To address the risk that our compensation programs might provide unintended incentives, we have deliberately kept our compensation programs simple and without formulaic incentives. We have not seen any employee behaviors motivated by our compensation policies and practices that create increased risks for our stockholders.
Based on the foregoing, we do not believe that our compensation policies and practices motivate imprudent risk taking. Consequently, we are satisfied that any potential risks arising from our employee compensation policies and practices are not reasonably likely to have a material adverse effect on the Company. Our Compensation Committee will continue to monitor the effects of its compensation decisions to determine whether risks are being appropriately managed.
Compensation Committee Interlocks and Insider Participation
The Compensation Committee consists of Seth W. Brennan, Tench Coxe and Jeffrey A. Joerres, each of whom is an independent director under the rules of the NYSE and our Governance Guidelines. None of the members of the Compensation Committee has been an officer or employee of the Company. None of our named executive officers serves on the board of directors or compensation committee of a company that has an executive officer that serves on our Board.
In connection with our initial public offering, we entered into agreements with all limited partners of Artisan Partners Holdings, including with entities associated with Tench Coxe. Information about the agreements, and transactions thereunder, are more fully discussed in Item 13 of this report.
Compensation Committee Report
The Compensation Committee has reviewed and discussed the above Compensation Discussion and Analysis with management, and based upon such review and discussion, has recommended to the Board that the Compensation Discussion and Analysis be included in Artisan Partners Asset Management’s annual report on Form 10-K and proxy statement.
Compensation Committee:
Jeffrey A. Joerres, Chairperson
Seth W. Brennan
Tench Coxe
The information contained in this report shall not be deemed to be “soliciting material” or “filed” or incorporated by reference in future filings with the SEC, or subject to the liabilities of Section 18 of the Exchange Act, except to the extent that the Company specifically incorporates it by reference into a document filed under the Securities Act of 1933, as amended, or the Exchange Act.
109
Summary Compensation Table
(1)
The following table provides information regarding the compensation earned during the years ended
December 31, 2013
,
2014
and
2015
by each of our named executive officers. Columns for “Option Awards”, “Non-Equity Incentive Plan Compensation” and “Change in Pension Value and Nonqualified Deferred Compensation Earnings” do not appear in the following table as they do not pertain to the Company.
The awards of standard restricted shares and career shares made to our named executive officers with respect to 2015 were made in February 2016. Because we made the awards in 2016, applicable rules require that the value of those awards be attributed to 2016 for purposes of the Summary Compensation Table below. Accordingly, the table reflects $0 of 2015 stock awards for each named executive officer. Because we believe the value of the equity awards we made in 2016 should be considered a part of each named executive officer’s 2015 compensation, we have included the values in the table at the beginning of this Item 11, as well in the first footnote below.
|
Name & Principal Position
|
Year
|
Salary
|
Bonus
(2)
|
Stock Awards
(3)
|
All Other Compensation
(4)
|
Total
|
||||||||||||||||
|
Eric R. Colson
|
2015
|
$
|
250,000
|
|
$
|
5,500,000
|
|
$
|
0
|
|
$
|
168,041
|
|
$
|
5,918,041
|
|
||||||
|
Chief Executive Officer
|
2014
|
250,000
|
5,500,000
|
|
873,510
|
|
58,845
|
|
6,682,355
|
|||||||||||||
|
2013
|
250,000
|
7,000,000
|
|
15,041,777
|
|
143,309
|
|
22,435,086
|
||||||||||||||
|
Charles J. Daley, Jr.
|
2015
|
250,000
|
2,000,000
|
|
0
|
|
106,383
|
|
2,356,383
|
|||||||||||||
|
Chief Financial Officer
|
2014
|
250,000
|
2,000,000
|
|
423,520
|
|
56,610
|
|
2,730,130
|
|||||||||||||
|
2013
|
250,000
|
2,500,000
|
|
3,359,437
|
|
74,190
|
|
6,183,627
|
||||||||||||||
|
Dean J. Patenaude
|
2015
|
250,000
|
2,200,000
|
|
0
|
|
98,426
|
|
2,548,426
|
|||||||||||||
|
Global Distribution
|
2014
|
250,000
|
2,200,000
|
|
370,580
|
|
61,086
|
|
2,881,666
|
|||||||||||||
|
2013
|
250,000
|
2,100,000
|
|
3,221,159
|
|
70,832
|
|
5,641,991
|
||||||||||||||
|
Sarah A. Johnson
|
2015
|
250,000
|
1,200,000
|
|
0
|
|
79,152
|
|
1,529,152
|
|||||||||||||
|
Chief Legal Officer
|
2014
|
250,000
|
1,025,000
|
|
423,520
|
|
60,392
|
|
1,758,912
|
|||||||||||||
|
2013
|
250,000
|
950,000
|
|
1,678,751
|
|
53,393
|
|
2,932,144
|
||||||||||||||
|
Gregory K. Ramirez
|
2015
|
250,000
|
1,150,000
|
|
0
|
|
87,073
|
|
1,487,073
|
|||||||||||||
|
Senior Vice President
|
2014
|
250,000
|
1,075,000
|
|
370,580
|
|
60,375
|
|
1,755,955
|
|||||||||||||
|
2013
|
250,000
|
1,000,000
|
|
1,671,154
|
|
54,162
|
|
2,975,316
|
||||||||||||||
|
(1)
Applicable rules require that we include the incremental fair value resulting from the modification to our Class B common units (as described above in “-Compensation Discussion and Analysis-Equity Award Modification”) in the
“
Stock Awards
”
column for 2013. In evaluating our compensation program, we believe that these amounts should be excluded, because we do not believe the amounts represent compensation paid to our named executive officers. The table below shows total compensation excluding these amounts for 2013. In addition, as discussed above, the table below includes the value of the restricted shares that we granted to each named executive officer in February 2016 with respect to 2015. One-half of the restricted shares awarded to each of our named executive officers in February 2016 were career shares.
|
||||||||||||||||||||||
|
Name & Principal Position
|
Year
|
Salary
|
Bonus
|
Stock Awards
|
All Other Compensation
|
Total
|
||||||||||||||||
|
Eric R. Colson
|
2015
|
$
|
250,000
|
|
$
|
5,500,000
|
|
$
|
915,300
|
|
$
|
168,041
|
|
$
|
6,833,341
|
|
||||||
|
2014
|
250,000
|
5,500,000
|
|
873,510
|
|
58,845
|
|
6,682,355
|
||||||||||||||
|
2013
|
250,000
|
7,000,000
|
|
1,178,100
|
|
143,309
|
|
8,571,409
|
||||||||||||||
|
Charles J. Daley, Jr.
|
2015
|
250,000
|
2,000,000
|
|
305,100
|
|
106,383
|
|
2,661,483
|
|||||||||||||
|
2014
|
250,000
|
2,000,000
|
|
423,520
|
|
56,610
|
|
2,730,130
|
||||||||||||||
|
2013
|
250,000
|
2,500,000
|
|
549,780
|
|
74,190
|
|
3,373,970
|
||||||||||||||
|
Dean J. Patenaude
|
2015
|
250,000
|
2,200,000
|
|
305,100
|
|
98,426
|
|
2,853,526
|
|||||||||||||
|
2014
|
250,000
|
2,200,000
|
|
370,580
|
|
61,086
|
|
2,881,666
|
||||||||||||||
|
2013
|
250,000
|
2,100,000
|
|
497,420
|
|
70,832
|
|
2,918,252
|
||||||||||||||
|
Sarah A. Johnson
|
2015
|
250,000
|
1,200,000
|
|
305,100
|
|
79,152
|
|
1,834,252
|
|||||||||||||
|
2014
|
250,000
|
1,025,000
|
|
423,520
|
|
60,392
|
|
1,758,912
|
||||||||||||||
|
2013
|
250,000
|
950,000
|
|
261,800
|
|
53,393
|
|
1,515,193
|
||||||||||||||
|
Gregory K. Ramirez
|
2015
|
250,000
|
1,150,000
|
|
305,100
|
|
87,073
|
|
1,792,173
|
|||||||||||||
|
2014
|
250,000
|
1,075,000
|
|
370,580
|
|
60,375
|
|
1,755,955
|
||||||||||||||
|
2013
|
250,000
|
1,000,000
|
|
261,800
|
|
54,162
|
|
1,565,962
|
||||||||||||||
110
|
(2)
Amounts in this column represent the annual discretionary cash bonus compensation earned by our named executive officers in 2015, 2014 and 2013, as applicable. The amounts were paid in February 2016, February 2015 and December 2013, respectively.
|
||||||||||||
|
(3)
There were no equity awards made to our named executive officers during fiscal year 2015. However, as discussed above, we believe that the awards we made in February 2016 should be considered a part of each named executive officer’s 2015 compensation. Accordingly, the grant date fair value of those awards is reflected in the
“
Stock Awards
”
and
“
Total
”
columns in the table in footnote 1. The 2016 and 2014 awards of restricted shares were made in a 50-50 ratio of career shares and standard restricted shares. The 2013 award was made in standard restricted shares only. The amounts in this column for 2013 also include the impact of the Modification described above in
“
Compensation Discussion and Analysis-Equity Award Modification
”
. These amounts were calculated as the incremental fair value of the Modification in accordance with FASB ASC Topic 718 and were as follows: $13,863,677 for Mr. Colson; $2,809,657 for Mr. Daley; $2,723,739 for Mr. Patenaude; $1,416,951 for Ms. Johnson; and $1,409,354 for Mr. Ramirez. The table in footnote 1 shows the
“
Stock Awards
”
and
“
Total
”
column without the Modification.
|
||||||||||||
|
(4)
Amounts in this column represent the aggregate dollar amount of all other compensation received by our named executive officers. All other compensation includes (a) company matching contributions to our named executive officers’ contributory defined contribution plan accounts equal to 100% of their pre-tax contributions (excluding catch-up contributions for named executive officers age 50 and older), up to the limitations imposed under applicable tax rules, which contributions totaled $18,000 for each named executive officer in 2015; (b) reimbursement for 2015 self-employment payroll tax expense as follows: $104,352 for Mr. Colson; $47,090 for Mr. Daley; $52,368 for Mr. Patenaude; $33,893 for Ms. Johnson; and $34,650 for Mr. Ramirez and (c) costs incurred by the Company for spousal travel to Artisan events. In 2015, spousal airfare costs for Mr. Colson and Mr. Daley were $21,238 and $15,864, respectively.
|
||||||||||||
Grants of Plan-Based Awards During 2015
We did not grant any plan-based awards to our named executive officers during the 2015 fiscal year. Plan-based awards made to our named executive officers in February 2016 with respect to 2015 are discussed above and in the footnotes to the Summary Compensation Table.
Outstanding Equity Awards at
December 31, 2015
The following table provides information about the outstanding equity-based awards held by each of our named executive officers as of
December 31, 2015
.
|
Name
|
Number of Shares and Units of Stock That Have Not Vested(#)
(1)
|
Market Value of Shares and Units of Stock That Have Not Vested($)
(2)
|
|||||
|
Eric R. Colson
|
71,484
|
|
$
|
2,577,713
|
|
||
|
Charles J. Daley, Jr.
|
41,794
|
|
1,507,092
|
|
|||
|
Dean J. Patenaude
|
41,796
|
|
1,507,164
|
|
|||
|
Sarah A. Johnson
|
14,644
|
|
528,063
|
|
|||
|
Gregory K. Ramirez
|
15,232
|
|
549,266
|
|
|||
|
(1)
Represents the number of unvested restricted shares (both career shares and standard restricted shares) of Class A common stock and unvested Class B common units as of December 31, 2015:
|
|||||||
111
|
Name
|
Standard Restricted Shares
(A)
|
Career Shares
(B)
|
Class B Common Units
(C)
|
||||||
|
Eric R. Colson
|
20,100
|
|
8,250
|
|
43,134
|
|
|||
|
Charles J. Daley, Jr.
|
9,500
|
|
4,000
|
|
28,294
|
|
|||
|
Dean J. Patenaude
|
8,500
|
|
3,500
|
|
29,796
|
|
|||
|
Sarah A. Johnson
|
6,200
|
|
4,000
|
|
4,444
|
|
|||
|
Gregory K. Ramirez
|
5,800
|
|
3,500
|
|
5,932
|
|
|||
|
(A) Standard restricted shares vest in five equal installments over the five years following the date of grant, provided that the holder remains employed through the vesting dates. Standard restricted shares will also vest upon a termination on account of the holder’s death or disability or upon a qualifying termination in connection with a change in control. The following number of standard restricted shares were granted to each of our named executive officers in 2014 and 2013 as follows: 8,250 and 22,500 shares in 2014 and 2013, respectively, for Mr. Colson; 4,000 and 10,500 shares in 2014 and 2013, respectively, for Mr. Daley; 3,500 and 9,500 shares in 2014 and 2013, respectively, for Mr. Patenaude; 4,000 and 5,000 shares in 2014 and 2013, respectively, for Ms. Johnson; and 3,500 and 5,000 shares in 2014 and 2013, respectively, for Mr. Ramirez.
|
|||||||||
|
(B) Career shares vest as described above in “
-
Compensation Discussion and Analysis - Equity-Based Compensation.” The career shares shown in the table were all granted in 2014.
|
|||||||||
|
(C) The unvested Class B common units vest in installments over a five-year period from the grant dates, provided that the holder remains employed through the vesting dates. The units will also vest upon a termination on account of the holder’s death or disability and upon the occurrence of a change in control, subject to continued employment through such occurrence. Generally, Class B common units are exchangeable for shares of our Class A common stock on a one-for-one basis. However, generally, a holder of Class B common units that remains employed by us may only exchange and sell up to 15% of the total number of Class B common units (both vested and unvested) held by the employee at the beginning of any one-year period, plus any amounts that the holder could have sold in prior years but did not.
|
|||||||||
|
(2)
Restricted shares of Class A common stock were valued based on the closing price of our Class A common stock on the NYSE on December 31, 2015, which was $36.06. Unvested Class B common units were also valued based on the closing price of our Class A common stock on the NYSE on December 31, 2015, as the Class B common units are generally exchangeable for shares of Class A common stock on a one-for-one basis.
|
|||||||||
Equity Awards Vested During the
Year Ended December 31, 2015
The following table provides information about the value realized by each of our named executive officers during the
year ended December 31, 2015
, upon the vesting of equity awards.
|
Name
|
Number of Shares or Units Acquired Upon Vesting(#)
(1)
|
Value Realized on Vesting($)
(2)
|
|||||
|
Eric R. Colson
|
85,890
|
|
$
|
4,278,541
|
|
||
|
Charles J. Daley, Jr.
|
40,387
|
|
1,874,744
|
|
|||
|
Dean J. Patenaude
|
17,498
|
|
812,987
|
|
|||
|
Sarah A. Johnson
|
4,022
|
|
187,530
|
|
|||
|
Gregory K. Ramirez
|
4,667
|
|
217,390
|
|
|||
|
(1)
Represents the number of shares of Class A common stock and Class B common units that vested during the year ended December 31, 2015:
|
|||||||
|
Name
|
Vested Shares of Class A Common Stock
|
Vested Class B Common Units
|
|||||
|
Eric R. Colson
|
6,150
|
|
79,740
|
|
|||
|
Charles J. Daley, Jr.
|
2,900
|
|
37,487
|
|
|||
|
Dean J. Patenaude
|
2,600
|
|
14,898
|
|
|||
|
Sarah A. Johnson
|
1,800
|
|
2,222
|
|
|||
|
Gregory K. Ramirez
|
1,700
|
|
2,967
|
|
|||
|
Generally, Class B common units are exchangeable for shares of our Class A common stock on a one-for-one basis. However, generally, a holder of Class B common units that remains employed by us may only exchange and sell up to 15% of the total number of Class B common units (both vested and unvested) held by the employee at the beginning of any one-year period, plus any amounts that the holder could have sold in prior years but did not.
|
|||||||
|
(2)
The value of the restricted shares of Class A common stock and Class B common units that vested during 2015 is based on the stock price of our Class A common stock on each respective vesting date.
|
|||||||
112
Pension Benefits
We do not sponsor or maintain any defined benefit pension or retirement benefits for the benefit of our employees.
Nonqualified Defined Contribution and Other Nonqualified Deferred Compensation Plans
We do not sponsor or maintain any nonqualified defined contribution or other nonqualified deferred compensation plans for the benefit of our employees.
Employment Agreements
We do not have employment agreements with any of our named executive officers. Upon commencement of employment, each named executive officer received an offer letter outlining the initial terms of employment, including base salary and cash incentive compensation. None of these terms affected compensation paid to our named executive officers in
2015
and will not affect compensation paid in future years.
Each of the named executive officers has agreed, pursuant to his or her Class A restricted stock award agreements, to certain restrictive covenants, including agreements not to compete with Artisan, or solicit Artisan clients and employees, for one year after he or she ceases to be employed by Artisan. The enforceability of the restrictive covenants may be limited depending on the particular facts and circumstances.
Potential Payments Upon Termination or Change in Control
Our named executive officers are all employed on an “at will” basis, which enables us to terminate their employment at any time. Our named executive officers do not have agreements that provide severance benefits. We do not offer or have in place any formal retirement, severance or similar compensation programs providing for additional benefits or payments in connection with a termination of employment, change in job responsibility or change in control (other than our contributory defined contribution plan). Under certain circumstances, a named executive officer may be offered severance benefits to be negotiated at the time of termination.
Equity awards granted to our named executive officers are evidenced by an award agreement that sets forth the terms and conditions of the award and the effect of any termination event or a change in control on unvested awards. The effect of a termination event or change in control on outstanding equity awards varies by the type of award. The following table provides the value of equity acceleration that would have been realized for each of the named executive officers if he or she had been terminated on
December 31, 2015
under the circumstances indicated (including following a change in control).
As discussed above, each of our named executive officers has been granted career shares that are designed to vest upon a qualifying retirement. A qualifying retirement requires 10 years of service with the Company as of the date of retirement and three years’ advance notice of retirement, which we may waive to no less than one year. Career shares also include a pro rata time-vesting requirement, under which 20% of the shares become eligible for qualifying retirement vesting in each of the five years following the year of grant. While none of our named executive officers has provided us with notice of intent to retire, the amounts shown in the “Retirement” column reflect the value of career shares that have satisfied the time-vesting and 10 years of service requirements as of December 31, 2015, had the named executive officer satisfied the advance notice requirement as of that date. In addition, the amount of shares received upon exchange of Class B common units that may be sold in any one-year period may also increase upon a named executive officer’s retirement, so long as the officer provided us with sufficient notice of retirement and has at least 10 years of service at retirement.
113
|
Death or Disability
|
Qualifying Termination in Connection with Change in Control
|
Accelerating Vesting Upon Change in Control
|
Retirement
|
|||||||||||||
|
Eric R. Colson
|
||||||||||||||||
|
Unvested Class B Common Units
(1)
|
$
|
1,555,412
|
|
—
|
|
$
|
1,555,412
|
|
—
|
|
||||||
|
Standard Restricted Shares
(2)
|
724,806
|
|
$
|
724,806
|
|
—
|
|
—
|
|
|||||||
|
Career Shares
(3)
|
297,495
|
|
297,495
|
|
—
|
|
$
|
59,499
|
|
|||||||
|
Charles J. Daley, Jr.
|
||||||||||||||||
|
Unvested Class B Common Units
(1)
|
1,020,282
|
|
—
|
|
1,020,282
|
|
—
|
|
||||||||
|
Standard Restricted Shares
(2)
|
342,570
|
|
342,570
|
|
—
|
|
—
|
|
||||||||
|
Career Shares
(3)
|
144,240
|
|
144,240
|
|
—
|
|
—
|
|
||||||||
|
Dean J. Patenaude
|
||||||||||||||||
|
Unvested Class B Common Units
(1)
|
1,074,444
|
|
—
|
|
1,074,444
|
|
—
|
|
||||||||
|
Standard Restricted Shares
(2)
|
306,510
|
|
306,510
|
|
—
|
|
—
|
|
||||||||
|
Career Shares
(3)
|
126,210
|
|
126,210
|
|
—
|
|
—
|
|
||||||||
|
Sarah A. Johnson
|
||||||||||||||||
|
Unvested Class B Common Units
(1)
|
160,251
|
|
—
|
|
160,251
|
|
—
|
|
||||||||
|
Standard Restricted Shares
(2)
|
223,572
|
|
223,572
|
|
—
|
|
—
|
|
||||||||
|
Career Shares
(3)
|
144,240
|
|
144,240
|
|
—
|
|
28,848
|
|
||||||||
|
Gregory K. Ramirez
|
||||||||||||||||
|
Unvested Class B Common Units
(1)
|
213,908
|
|
—
|
|
213,908
|
|
—
|
|
||||||||
|
Standard Restricted Shares
(2)
|
209,148
|
|
209,148
|
|
—
|
|
—
|
|
||||||||
|
Career Shares
(3)
|
126,210
|
|
126,210
|
|
—
|
|
25,242
|
|
||||||||
|
(1)
Represents the value of the accelerated vesting of Class B common units, which was based on the closing price of our Class A common stock on the NYSE on December 31, 2015, which was $36.06 per share, as the Class B common units are generally exchangeable for shares of Class A common stock on a one-for-one basis. Any unvested Class B common units will become fully vested upon the holder’s death or disability or upon the occurrence of a change in control (subject to continued employment through such occurrence).
|
||||||||||||||||
|
(2)
Represents the value of the accelerated vesting of restricted shares of Class A common stock based on the closing price of our Class A common stock on the NYSE on December 31, 2015, which was $36.06 per share. Any standard restricted shares will become fully vested upon the holder’s death or disability or upon a qualifying termination in connection with a change in control (subject to continued employment through such occurrence).
|
||||||||||||||||
|
(3)
Represents the value of the accelerated vesting and retirement vesting of career shares based on the closing price of our Class A common stock on the NYSE as of December 31, 2015, which was $36.06 per share. Any career shares will become fully vested upon the holder’s death or disability or upon a qualifying termination in connection with a change in control (subject to continued employment through such occurrence). Career shares also vest upon qualifying retirement, as discussed above.
|
||||||||||||||||
114
DIRECTOR COMPENSATION
The company’s director compensation program is designed to attract and retain highly qualified non-employee directors. For fiscal year
2015
, the director compensation program entitled non-employee directors to a cash component, designed to compensate directors for their service on the Board, and an equity component, designed to align the interests of the directors with those of the company’s stockholders.
For
2015
, the standard equity component of the company’s director compensation program consisted of $100,000 of restricted stock units for each of the non-employee directors awarded under the Artisan Partners Asset Management Inc. 2013 Non-Employee Director Compensation Plan. The shares of Class A common stock underlying the restricted stock units will be delivered on the earlier to occur of (i) a change in control of APAM and (ii) the termination of the director’s service as a director.
During
2015
, each non-employee director was entitled to receive cash payments of $50,000, paid in four quarterly installments. The lead director and chairperson of our Audit Committee were entitled to receive an additional cash retainer of $50,000 pro-rated for the period of time during which he or she served in such capacity, and the chairpersons of each of the Compensation Committee and Nominating and Corporate Governance Committee were entitled to receive an additional cash retainer of $40,000. Each of our non-employee directors elected to receive the value of this cash compensation in the form of additional restricted stock units.
As a result, an additional number of restricted stock units were granted to each non-employee director in January of 2015, the value of which equaled the amount of cash compensation to which each director was entitled. One-quarter of the units awarded in lieu of cash compensation vested in each quarter of 2015.
In addition, all directors are reimbursed for reasonable out-of-pocket expenses incurred by them in connection with attending Board, committee and stockholder meetings, including those for travel, meals and lodging. These reimbursements are not reflected in the table below.
Mr. Colson does not receive any additional compensation for serving on the Board.
The following table provides information concerning the compensation of each non-employee director who served in fiscal year
2015
.
|
Name
|
Stock Awards
|
|||
|
Matthew R. Barger
(1)
|
$
|
190,000
|
|
|
|
Seth W. Brennan
(2)
|
150,000
|
|
||
|
Tench Coxe
(3)
|
150,000
|
|
||
|
Stephanie G. DiMarco
(4)
|
200,000
|
|
||
|
Jeffrey A. Joerres
(5)
|
190,000
|
|
||
|
Andrew A. Ziegler
(6)
|
200,000
|
|
||
|
(1)
On December 31, 2015, Mr. Barger had 8,665 restricted stock units outstanding.
|
||||
|
(2)
On December 31, 2015, Mr. Brennan had 3,108 restricted stock units outstanding.
|
||||
|
(3)
On December 31, 2015, Mr. Coxe had 7,836 restricted stock units outstanding.
|
||||
|
(4)
On December 31, 2015, Ms. DiMarco had 8,872 restricted stock units outstanding.
|
||||
|
(5)
On December 31, 2015, Mr. Joerres had 8,665 restricted stock units outstanding.
|
||||
|
(6)
On December 31, 2015, Mr. Ziegler had 5,884 restricted stock units outstanding. Mr. Ziegler served as chairman of the Board from January 1, 2015 through July 31, 2015, and as lead director from August 1, 2015 through December 31, 2015. There was no change to Mr. Ziegler’s annual retainer in connection with his change in role.
|
||||
115
The following table sets forth information regarding the beneficial ownership of our common stock as of February 16, 2016, for:
|
•
|
each person known by us to beneficially own more than 5% of any class of our outstanding shares, as of February 16, 2016;
|
|
•
|
each of our named executive officers;
|
|
•
|
each of our directors; and
|
|
•
|
all of our named executive officers and directors as a group.
|
Each share of our Class A common stock and Class C common stock is entitled to one vote per share. Each share of Class B common stock initially entitles its holder to five votes per share. The number of votes per share of Class B common stock will decrease from five to one when holders of Class B common stock collectively hold less than 20% of the aggregate number of outstanding shares of common stock. As of February 16, 2015, the holders of Class B common stock collectively held approximately 29% of the aggregate number of outstanding shares of common stock.
Each share of our Class C common stock corresponds to a Class A common unit, Class D common unit or Class E common unit of Artisan Partners Holdings, and each share of Class B common stock corresponds to a Class B common unit of Artisan Partners Holdings. Subject to certain restrictions, common units are exchangeable for shares of our Class A common stock on a one-for-one basis, and upon any such exchange, the corresponding shares of Class C or Class B common stock, as applicable, are canceled.
Because we have disclosed the ownership of shares of our Class B common stock and Class C common stock (which correspond to partnership units that are exchangeable for Class A common stock), the shares of Class A common stock underlying partnership units are not separately reflected in the table below.
Applicable percentage ownership is based on 40,680,179 shares of Class A common stock (including 178,401 restricted stock units that are currently outstanding), 18,327,222 shares of Class B common stock and 15,649,101 shares of Class C common stock outstanding at February 16, 2016. The aggregate percentage of combined voting power represents voting power with respect to all shares of our common stock voting together as a single class and is based on 147,786,989 total votes attributed to 74,478,101 total shares of outstanding common stock.
Beneficial ownership is determined in accordance with the rules of the SEC. These rules generally attribute beneficial ownership of securities to persons who possess sole or shared voting power or investment power with respect to such securities. Except as otherwise indicated, all persons listed below have sole voting and investment power with respect to the shares beneficially owned by them, subject to applicable community property laws.
Information about securities authorized for issuance under equity compensation plans is included in Item 5 of this report.
116
Except as otherwise indicated, the address for each stockholder listed below is c/o Artisan Partners Asset Management Inc., 875 E. Wisconsin Avenue, Suite 800, Milwaukee, Wisconsin 53202.
|
Class A
(1)
|
Class B
|
Class C
|
Aggregate
% of
Combined
Voting
Power
|
|||||||||||
|
No. of
Shares
|
% of
Class
|
No. of
Shares
|
% of
Class
|
No. of
Shares
|
% of
Class
|
|||||||||
|
Directors and Named Executive Officers:
|
||||||||||||||
|
Stockholders Committee
(2)
|
4,101,439
|
|
10.1
|
|
18,327,222
|
|
100%
|
|
—
|
|
—
|
|
64.8%
|
|
|
Eric R. Colson
(3)
|
69,000
|
|
*
|
|
667,768
|
|
3.6%
|
|
—
|
|
—
|
|
—
|
|
|
Charles J. Daley, Jr.
(3)(4)
|
23,900
|
|
*
|
|
135,333
|
|
*
|
|
—
|
|
—
|
|
*
|
|
|
Sarah A. Johnson
(3)
|
27,000
|
|
*
|
|
94,464
|
|
*
|
|
—
|
|
—
|
|
*
|
|
|
Dean J. Patenaude
(3)(5)
|
26,520
|
|
*
|
|
131,195
|
|
*
|
|
—
|
|
—
|
|
*
|
|
|
Gregory K. Ramirez
(3)
|
23,400
|
|
*
|
|
79,864
|
|
*
|
|
—
|
|
—
|
|
*
|
|
|
Andrew A. Ziegler
(6)(7)
|
12,286
|
|
*
|
|
—
|
|
—
|
|
6,955,973
|
|
44.4%
|
|
4.7%
|
|
|
Matthew R. Barger
(7)
|
14,785
|
|
*
|
|
—
|
|
—
|
|
1,242,002
|
|
7.9%
|
|
*
|
|
|
Seth W. Brennan
(7)(8)
|
20,439
|
|
*
|
|
—
|
|
—
|
|
—
|
|
—
|
|
*
|
|
|
Tench Coxe
(7)(9)
|
35,078
|
|
*
|
|
—
|
|
—
|
|
—
|
|
—
|
|
*
|
|
|
Stephanie G. DiMarco
(7)
|
86,392
|
|
*
|
|
—
|
|
—
|
|
—
|
|
—
|
|
*
|
|
|
Jeffrey A. Joerres
(7)
|
18,285
|
|
*
|
|
—
|
|
—
|
|
—
|
|
—
|
|
*
|
|
|
Directors and executive officers as a group (11 persons)
|
4,272,113
|
|
10.5%
|
|
18,327,222
|
|
100%
|
|
8,197,975
|
|
52.4%
|
|
70.4%
|
|
|
5+% Stockholders:
|
||||||||||||||
|
Artisan Investment Corporation
(6)
|
—
|
|
—
|
|
—
|
|
—
|
|
6,955,973
|
|
44.4%
|
|
4.7
|
%
|
|
MLY Holdings Corp.
(3)(10)
|
—
|
|
—
|
|
3,786,208
|
|
20.7%
|
|
—
|
|
—
|
|
—
|
|
|
LaunchEquity Acquisition Partners, LLC
(3)(11)
|
—
|
|
—
|
|
2,069,928
|
|
11.3%
|
|
—
|
|
—
|
|
—
|
|
|
N. David Samra
(3)
|
661,136
|
|
1.6%
|
|
1,601,003
|
|
8.7%
|
|
—
|
|
—
|
|
—
|
|
|
James C. Kieffer
(3)
|
—
|
|
—
|
|
1,477,611
|
|
8.1%
|
|
—
|
|
—
|
|
—
|
|
|
Scott C. Satterwhite
(3)
|
—
|
|
—
|
|
1,475,151
|
|
8.0%
|
|
—
|
|
—
|
|
—
|
|
|
George Sertl
(3)
|
—
|
|
—
|
|
1,474,058
|
|
8.0%
|
|
—
|
|
—
|
|
—
|
|
|
Daniel J. O’Keefe
(3)
|
729,605
|
|
1.8%
|
|
1,329,655
|
|
7.3%
|
|
—
|
|
—
|
|
—
|
|
|
James D. Hamel
(3)
|
256,542
|
|
*
|
|
966,066
|
|
5.3%
|
|
—
|
|
—
|
|
—
|
|
|
Patricia Christina Hellman Survivor’s Trust
|
—
|
|
—
|
|
—
|
|
—
|
|
1,330,738
|
|
8.5%
|
|
*
|
|
|
Arthur Rock 2000 Trust
|
—
|
|
—
|
|
—
|
|
—
|
|
1,153,280
|
|
7.4%
|
|
*
|
|
|
Thomas F. Steyer
|
—
|
|
—
|
|
—
|
|
—
|
|
1,082,314
|
|
6.9%
|
|
*
|
|
|
Pisces Fund
|
—
|
|
—
|
|
—
|
|
—
|
|
807,305
|
|
5.2
|
%
|
*
|
|
|
Kayne Anderson Rudnick Investment Management LLC
(12)
|
4,060,042
|
|
10.0%
|
|
—
|
|
—
|
|
—
|
|
—
|
|
2.7%
|
|
|
The Vanguard Group
(13)
|
2,523,308
|
|
6.2%
|
|
—
|
|
—
|
|
—
|
|
—
|
|
*
|
|
|
FMR LLC
(14)
|
2,871,184
|
|
7.1%
|
|
—
|
|
—
|
|
—
|
|
—
|
|
*
|
|
|
Eaton Vance Management
(15)
|
2,512,925
|
|
6.2%
|
|
—
|
|
—
|
|
—
|
|
—
|
|
1.7%
|
|
*Less than 1%.
|
(1)
|
Subject to certain exceptions, the persons who hold shares of our Class B common stock and Class C common stock (which correspond to partnership units that generally are exchangeable for Class A common stock) are currently deemed to have beneficial ownership over a number of shares of our Class A common stock equal to the number of shares of our Class B common stock and Class C common stock reflected in the table above, respectively. Because we have disclosed the ownership of shares of our Class B common stock and Class C common stock, the shares of Class A common stock underlying partnership units are not separately reflected in the table above.
|
|
(2)
|
Each of our employees to whom we have granted equity (including Mr. Colson, Mr. Daley, Mr. Ramirez, Ms. Johnson and Mr. Patenaude) has entered into a Stockholders Agreement pursuant to which they granted an irrevocable voting proxy with respect to all of the shares of our common stock they have acquired from us and any shares they may acquire from us in the future to a Stockholders Committee currently consisting of Mr. Colson, Mr. Daley and Mr. Ramirez. All shares subject to the Stockholders Agreement are voted in accordance with the majority decision of those three members. Shares originally subject to the Stockholders Agreement cease to be subject to it when sold by the employee or upon the termination of the employee’s employment with us.
|
117
The number of shares of Class A and Class B common stock in this row includes all shares of Class A common stock and Class B common stock that we have granted to current employees and that have not yet been sold by those employees. As members of the Stockholders Committee, Mr. Colson, Mr. Daley and Mr. Ramirez share voting power over all of these shares. Other than as shown in the row applicable to each of them individually, none of Mr. Colson, Mr. Daley or Mr. Ramirez has investment power with respect to any of the shares subject to the Stockholders Agreement, and each disclaims beneficial ownership of such shares.
|
(3)
|
Pursuant to the Stockholders Agreement, Mr. Colson, Mr. Daley, Mr. Ramirez, Ms. Johnson, Mr. Patenaude, MLY Holdings Corp., LaunchEquity Acquisition Partners, LLC, Mr. Samra, Mr. Kieffer, Mr. Satterwhite, Mr. Sertl, Mr. O’Keefe and Mr. Hamel each granted an irrevocable voting proxy with respect to all of the shares of our common stock he or she has acquired from us and any shares he or she may acquire from us in the future to the Stockholders Committee as described in footnote 2 above. Each retains investment power with respect to the shares of our common stock he or she holds, which are the shares reflected in the row applicable to each person. 400 of Mr. Daley’s shares, 1,400 of Mr. Ramirez’s shares, 4,000 of Ms. Johnson’s shares and 20 of Mr. Patenaude’s shares, respectively, are not subject to the Stockholders Agreement.
|
|
(4)
|
Includes 200 shares of Class A common stock held by Mr. Daley’s daughter.
|
|
(5)
|
Includes 20 shares of Class A common stock held by Mr. Patenaude’s son.
|
|
(6)
|
The Class C shares reflected in the row applicable to Mr. Ziegler individually are owned by Artisan Investment Corporation. Mr. Ziegler and Carlene M. Ziegler, who are married to each other, control Artisan Investment Corporation.
|
|
(7)
|
Includes the shares of Class A common stock underlying restricted stock units granted to our non-employee directors. The underlying shares will be delivered on the earlier to occur of (i) a change in control of Artisan and (ii) assuming the restricted stock units have vested, the termination of such person’s service as a director. Mr. Coxe holds restricted stock units awarded to him for the benefit of the managing directors of the general partner of Sutter Hill Ventures.
|
|
(8)
|
Includes 6,250 shares of Class A common stock held by a trust for the benefit of Mr. Brennan’s children.
|
|
(9)
|
Includes 22,411 shares of Class A common stock held by a trust of which Mr. Coxe is a co-trustee and beneficiary. Mr. Coxe shares voting and investment power over all of such shares of Class A common stock.
|
|
(10)
|
MLY Holdings Corp. is a Delaware corporation through which Mark L. Yockey holds his shares of Class B common stock. Mr. Yockey is the sole director of MLY Holdings Corp.
|
|
(11)
|
LaunchEquity Acquisition Partners, LLC, is a manager-managed designated series limited liability company organized under the laws of the State of Delaware. Andrew C. Stephens is the sole manager of the designated series of LaunchEquity Acquisition Partners through which Mr. Stephens holds his shares of Class B common stock.
|
(12) This information has been derived from the Schedule 13G filed with the SEC on February 10, 2016 by Kayne Anderson Rudnick Investment Management LLC which states that Kayne Anderson Rudnick Investment Management had voting control and dispositive power over 4,060,042 shares of Class A common stock as of December 31, 2015. The address of Kayne Anderson Rudnick Investment Management is 1800 Avenue of the Stars, Los Angeles, California, 90067.
(13) This information has been derived from the Schedule 13G filed with the SEC on February 10, 2016 by The Vanguard Group, Inc. which states that Vanguard Group had voting control over 28,915 shares and dispositive power over 2,523,308 shares of Class A common stock as of December 31, 2015. The address of the Vanguard Group is 100 Vanguard Blvd, Malvern, Pennsylvania, 19355.
(14) This information has been derived from the Schedule 13G filed with the SEC on February 12, 2016 by FMR LLC, which states that FMR LLC had voting control over 1,238,504 shares and dispositive power over 2,871,184 shares of Class A common stock as of December 31, 2015. The address of FMR LLC is 245 Summer Street, Boston, Massachusetts, 02210.
(15) This information has been derived from the Schedule 13G filed with the SEC on February 12, 2016 by Eaton Vance Management, which states that Eaton Vance Management had voting control and dispositive power over 2,512,925 shares of Class A common stock as of December 31, 2015. The address of Eaton Vance Management is 2 International Place, Boston, Massachusetts, 02110.
118
Transactions in Connection with our IPO
In March 2013, in connection with the initial public offering (“IPO”) of Artisan Partners Asset Management, we entered into the agreements described below with the limited partners of Artisan Partners Holdings, including the following persons and entities:
|
•
|
Each of our currently-serving named executive officers, all of whom own Class B common units of Artisan Partners Holdings.
|
|
•
|
Artisan Investment Corporation (“AIC”), an entity controlled by Andrew A. Ziegler, our Lead Director, and Carlene M. Ziegler. AIC owns all of the Class D common units of Artisan Partners Holdings.
|
|
•
|
Private equity funds (the “H&F holders”) controlled by Hellman & Friedman LLC (“H&F”). Mr. Barger, one of our directors, is a senior advisor of H&F. The H&F holders no longer own any units of Artisan Partners Holdings or, to our knowledge, any shares of our common stock.
|
|
•
|
Mr. Barger, who owns Class A common units of Artisan Partners Holdings.
|
|
•
|
Sutter Hill Ventures, of which one of our directors, Mr. Coxe, is a managing director of the general partner, and two trusts of which Mr. Coxe is a co-trustee.
|
|
•
|
Several other persons or entities who own Class A common units of Artisan Partners Holdings and greater than 5% of our outstanding Class C common stock.
|
|
•
|
Several of our employees, or entities controlled by an employee, who own greater than 5% of our outstanding Class B common stock. These employees, like all employees who own partnership units, own Class B common units of Artisan Partners Holdings.
|
The rights of each of the persons and entities listed above under the agreements discussed below are the same as the rights of each other holder of the same class of partnership units. So, for instance, the rights of each of our currently-serving named executive officers, as a holder of Class B common units, under the exchange, registration rights, partnership and tax receivable agreements described below are the same as the rights of each other holder of Class B common units. The descriptions of the transactions and agreements below, including the rights and ownership interests of the persons and entities listed above, are as of January 31, 2016, unless otherwise indicated.
Exchange Agreement
Under this agreement, subject to certain restrictions (including those intended to ensure that Artisan Partners Holdings is not treated as a “publicly traded partnership” for U.S. federal income tax purposes), holders of partnership units have the right to exchange common units (together with an equal number of shares of our Class B common stock or Class C common stock, as applicable) for shares of our Class A common stock on a one-for-one basis. A partnership unit cannot be exchanged for a share of our Class A common stock without a share of our Class B common stock or Class C common stock, as applicable, being delivered together at the time of exchange for cancellation.
Holders of partnership units are permitted to exchange units in a number of circumstances that are generally based on, but in several respects are not identical to, the “safe harbors” contained in the U.S. Treasury Regulations dealing with publicly traded partnerships. In accordance with the terms of the exchange agreement, partnership units are exchangeable: (i) in connection with the first underwritten offering in any calendar year pursuant to the registration rights agreement; (ii) on a specified date each fiscal quarter; (iii) in connection with the holder’s death, disability or mental incompetence; (iv) as part of one or more exchanges by the holder and any related persons during any 30-calendar day period representing in the aggregate more than 2% of all outstanding partnership units (generally disregarding interests held by us); (v) if the exchange is of all of the partnership units held by AIC in a single transaction; (vi) in connection with a tender offer, share exchange offer, issuer bid, take-over bid, recapitalization or similar transaction with respect to our Class A common stock that is effected with the consent of our Board or in connection with certain mergers, consolidations or other business combinations; or (vii) if we permit the exchanges after determining that Artisan Partners Holdings would not be treated as a “publicly traded partnership” under Section 7704 of the Internal Revenue Code as a result. Our Board may waive restrictions on exchange in the exchange agreement.
As the holders of limited partnership units exchange their units for Class A common stock, we receive a number of general partnership units, or GP units, of Artisan Partners Holdings equal to the number of shares of our Class A common stock that they receive, and an equal number of partnership units are canceled.
During the fiscal year ended December 31, 2015, holders of Class A, Class B and Class E common units exchanged an aggregate of
826,809
units for Class A common stock, and an equal number of shares of our Class B or Class C common stock, as applicable, were canceled.
119
Resale and Registration Rights Agreement
Under the Resale and Registration Rights Agreement, we have provided the holders of partnership units with certain registration rights. We have also established certain restrictions on the timing and manner of resales of Class A common stock received upon exchange of partnership units. In general, our Board may waive or modify the restrictions on resale described below.
We were required to file, and use our reasonable best efforts to cause the SEC to declare effective, two registration statements: (i) an exchange shelf registration statement registering all shares of our Class A common stock and convertible preferred stock to be issued upon exchange of partnership units, and (ii) a shelf registration statement registering secondary sales of Class A common stock issuable upon exchange of units or conversion of convertible preferred stock by AIC and the H&F holders, as applicable.
AIC sold 1,227,525 common units in connection with the 2015 Follow-On Offering. As of December 31, 2015, AIC owned 6,955,973 Class D common units exchangeable for an equal number of shares of our Class A common stock. There is no limit on the number of shares of our Class A common stock AIC may sell. AIC has the right to use the resale shelf registration statement to sell shares of Class A common stock, including the right to an unrestricted number of brokered transactions and, subject to certain limitations and qualifications, marketed and unmarketed underwritten shelf takedowns.
Our employee-partners, who hold Class B common units, sold an aggregate of 2,415,253 common units in connection with the 2015 Follow-On Offering. As of December 31, 2015, the employee-partners owned an aggregate of 18,327,222 Class B common units. In each 12-month period, the first of which began in March 2014, each employee-partner is permitted to sell up to (i) a number of vested shares of our Class A common stock representing 15% of the aggregate number of common units and shares of Class A common stock received upon exchange of common units (in each case, whether vested or unvested) he or she held as of the first day of that period or, (ii) if greater, vested shares of our Class A common stock having a market value as of the time of sale of $250,000, as well as, in either case, the number of shares such holder could have sold in any previous period or periods but did not sell in such period or periods. Approximately 3.3 million Class B common units will be eligible for exchange and sale in the first quarter of 2016. Units sold by employee-partners in connection with underwritten offerings (including the 2015 Follow-On Offering) or otherwise redeemed by us are included when calculating the maximum number of shares each employee-partner is permitted to sell in any one-year period. Our Board may waive or modify the resale limitations described in this paragraph. Because employee-partners and other employees are eligible to sell amounts of vested shares as described in this 10-K, employees’ equity ownership, in the aggregate, could significantly decline over the next five years.
Upon termination of employment with Artisan, an employee-partner’s unvested Class B common units are forfeited. Generally, the employee-partner’s vested Class B common units are exchanged for Class E common units; the employee-partner’s shares of Class B common stock are canceled; and we issue the former employee-partner a number of shares of Class C common stock equal to the former employee-partner’s number of Class E common units. Class E common units are exchangeable for Class A common stock subject to the same restrictions and limitations on exchange applicable to the other common units of Holdings.
If the employee-partner’s employment was terminated as a result of retirement, death or disability, the employee-partner or his or her estate may (i) as of and after the time of termination of employment, sell (A) a number of shares of our Class A common stock up to one-half of the employee-partner’s aggregate number of vested common units and shares of Class A common stock received upon exchange of common units held as of the date of termination of employment or, (B) if greater, vested shares of our Class A common stock having a market value as of the time of sale of up to $250,000, and (ii) as of and after the first anniversary of the termination, the person’s remaining shares of our Class A common stock received upon exchange of common units. Retirement, for these purposes, requires that the employee-partner have provided ten years of service or more at the date of retirement and offered one year’s written notice (or three years’ written notice in the case of employee-partners who are lead portfolio managers or executive officers) of the intention to retire, subject to our right to accept a shorter period of notice.
If an employee-partner resigns or is terminated involuntarily, the employee-partner may in each 12-month period following the third, fourth, fifth and sixth anniversary of the termination, sell a number of shares of our Class A common stock up to one-fourth of the employee-partner’s aggregate number of vested common units and shares of Class A common stock received upon exchange of common units held as of the date of termination of his or her employment (as well as the number of shares such employee-partner could have sold in any previous period or periods but did not sell in such period or periods).
Our former employee-partners sold an aggregate of 188,772 partnership units in connection with the 2015 Follow-On Offering. As of December 31, 2015, former employee-partners owned an aggregate of 822,701 Class E common units, 509,914 of which may currently be sold.
120
We have paid and will continue to pay all expenses incident to our performance of any registration or marketing of securities pursuant to the registration rights agreement, including reasonable fees and out-of-pocket costs and expenses of selling stockholders. We have also agreed to indemnify any selling stockholder, solely in their capacity as selling stockholders, against any losses or damages resulting from any untrue statement, or omission, of material fact in any registration statement, prospectus or free writing prospectus pursuant to which they may sell shares of our Class A common stock, except to the extent the liability arose from their misstatement or omission of a material fact, in which case they have similarly agreed to indemnify us.
As of December 31, 2015, the holders of Class A common units owned an aggregate of 7,870,427 Class A common units exchangeable for an equal number of shares of our Class A common stock. There is no limit on the number of shares of our Class A common stock the holders of Class A common units may sell.
Amended and Restated Limited Partnership Agreement of Artisan Partners Holdings
As a holding company, we conduct all of our business activities through our direct subsidiary, Artisan Partners Holdings, an intermediate holding company, which wholly owns Artisan Partners Limited Partnership, our principal operating subsidiary. The rights and obligations of Artisan Partners Holdings’ partners are currently set forth in the fifth amended and restated limited partnership agreement of Artisan Partners Holdings.
We are the general partner of Artisan Partners Holdings and control its business and affairs and are responsible for the management of its business, subject to the voting rights of the limited partners as described below. No limited partners of Artisan Partners Holdings, in their capacity as such, have any authority or right to control the management of Artisan Partners Holdings or to bind it in connection with any matter.
Artisan Partners Holdings has outstanding GP units and common units. Net profits and net losses and distributions of profits of Artisan Partners Holdings are allocated and made to partners pro rata in accordance with the number of partnership units they hold (whether or not vested). Artisan Partners Holdings is obligated to distribute to us and its other partners cash payments for the purposes of funding tax obligations of ours and theirs as partners of Artisan Partners Holdings. In order to make a share of our Class A common stock represent the same percentage economic interest, disregarding corporate-level taxes and payments with respect to the tax receivable agreements, in Artisan Partners Holdings as a common unit of Artisan Partners Holdings, we always hold a number of GP units equal to the number of shares of Class A common stock issued and outstanding.
As the general partner of Artisan Partners Holdings, we hold all GP units and control the business of Artisan Partners Holdings. Our approval, acting in our capacity as the general partner, along with the approval of holders of a majority of each class of limited partnership units (except the Class E common units), voting as a separate class, will be required to engage in a material corporate transaction; with certain exceptions, redeem or reclassify partnership units or interests in any subsidiary, issue additional partnership units or interests in any subsidiary, or create additional classes of partnership units or interests in any subsidiary; or make any in-kind distributions. If any of the foregoing affects only certain classes of partnership units, only the approval of us and the affected classes would be required. The approval rights of each class of partnership units will terminate when the holders of the respective class of units directly or indirectly cease to own units constituting at least 5% of the outstanding units of Artisan Partners Holdings.
The amended and restated limited partnership agreement may be amended with the consent of the general partner and the holders of a majority of the Class A common units, Class B common units and Class D common units, each voting as a separate class, provided that the general partner may, without the consent of any limited partner, make amendments that do not materially and adversely affect any limited partners. To the extent any amendment materially and adversely affects only certain classes of limited partners, only the holders of a majority of the units of the affected classes have the right to approve such amendment.
Artisan Partners Holdings will indemnify AIC, as its former general partner, us, as its current general partner, the former members of its pre-IPO Advisory Committee, the members of our Stockholders Committee and our directors and officers against any losses, damages, costs or expenses (including reasonable attorney’s fees, judgments, fines and amounts paid in settlement) actually incurred in connection with any threatened, pending or completed action, suit or proceeding, whether civil, criminal or administrative (including any action by or on behalf of Artisan Partners Holdings) arising as a result of the capacities in which they serve or served Artisan Partners Holdings to the maximum extent that any of them could be indemnified if Artisan Partners Holdings were a Delaware corporation and they were directors of such corporation. In addition, Artisan Partners Holdings will pay the costs or expenses (including reasonable attorneys’ fees) incurred by the indemnified parties in advance of a final disposition of such matters so long as the indemnified party undertakes to repay the expenses if the party is adjudicated not to be entitled to indemnification.
121
Artisan Partners Holdings will also indemnify its officers and employees and officers and employees of its subsidiaries against any losses, damages, costs or expenses (including reasonable attorney’s fees, judgments, fines and amounts paid in settlement) actually incurred in connection with any threatened, pending or completed action, suit or proceeding, whether civil, criminal or administrative arising as a result of their being an employee of Artisan Partners Holdings (or their serving as an officer or fiduciary of any of Artisan Partners Holdings’ subsidiaries or benefit plans or any entity of which Artisan is sponsor or adviser), provided that no employee will be indemnified or reimbursed for any claim, obligation or liability adjudicated to have arisen out of or been based upon such employee’s intentional misconduct, gross negligence, fraud or knowing violation of law.
Stockholders Agreement
Our employees (including all of our employee-partners) to whom we have granted equity have entered into a Stockholders Agreement pursuant to which they granted an irrevocable voting proxy with respect to all shares of our common stock they have acquired from us (which shares represent approximately 65% of the combined voting power of our capital stock) and any shares they may acquire from us in the future to a Stockholders Committee currently consisting of Eric R. Colson (Chairman and Chief Executive Officer), Charles J. Daley, Jr. (Chief Financial Officer) and Gregory K. Ramirez (Executive Vice President). Any shares of our common stock that we issue to our employees in the future will be subject to the Stockholders Agreement so long as the agreement has not been terminated. Shares subject to the Stockholders Agreement will be voted in accordance with the majority decision of the three members of the Stockholders Committee.
The members of the Stockholders Committee must be Artisan employees and holders of shares subject to the agreement. If a member of the Stockholders Committee ceases to act as a member of the committee, our Chief Executive Officer (if he or she is a holder of shares subject to the Stockholders Agreement and is not already a member of the committee) will become a member of the committee. Otherwise, the two remaining members of the Stockholders Committee will jointly select a third member of the committee. Each member of the Stockholders Committee is entitled to indemnification from Artisan in his or her capacity as a member of the Stockholders Committee.
The Stockholders Agreement provides that members of the Stockholders Committee will vote the shares subject to the agreement in support of the following:
|
•
|
Matthew R. Barger, or, unless Mr. Barger is removed from the Board for cause, a successor selected by Mr. Barger who holds Class A common units, so long as the holders of the Class A common units beneficially own at least 5% of our outstanding capital stock. As of December 31, 2015, the holders of the Class A common units beneficially owned approximately 11% of our outstanding capital stock.
|
|
•
|
A director nominee, initially Mr. Ziegler, designated by AIC, so long as AIC beneficially owns at least 5% of our outstanding capital stock. As of December 31, 2015, AIC beneficially owned approximately 9% of our outstanding capital stock.
|
|
•
|
A director nominee, initially Mr. Colson, designated by the Stockholders Committee who is an employee-partner.
|
Under the terms of the Stockholders Agreement, we are required to use our best efforts to elect the nominees described above, which efforts must include soliciting proxies for, and recommending that our stockholders vote in favor of, the election of each. Other than as provided above, under the terms of the Stockholders Agreement, the Stockholders Committee may in its discretion vote, or abstain from voting, all or any of the shares subject to the agreement on any matter on which holders of shares of our common stock are entitled to vote. The Stockholders Committee is specifically authorized to vote for its members as directors under the terms of the Stockholders Agreement.
At any time after the earlier of (i) the elimination of the Class B common stock’s supervoting rights and (ii) March 12, 2018, parties to the Stockholders Agreement holding at least two-thirds of the shares subject to the agreement may terminate it provided that the Stockholders Committee is no longer obligated to vote in favor of a director nominee who is a Class A common unit holder. For so long as the parties whose shares are subject to the agreement hold at least a majority of the combined voting power of our capital stock, the Stockholders Committee will be able to elect all of the members of our Board (subject to the obligation of the committee to vote in support of the nominees described above) and will thereby control our management and affairs. Because each share of Class B common stock initially entitles its holder to five votes, the Stockholders Committee will control our management and affairs even though the employees whose shares are subject to the agreement hold less than a majority of the number of outstanding shares of our common stock.
122
Tax Receivable Agreements
We are a party to two tax receivable agreements. The first tax receivable agreement is between us and the Pre-H&F Merger Shareholder that was the sole shareholder of our convertible preferred stock. As part of our IPO reorganization, a corporation (“H&F Corp”) controlled by Hellman & Friedman LLC merged with and into us pursuant to an Agreement and Plan of Merger. As consideration for the merger, the shareholder of H&F Corp received shares of our convertible preferred stock (all of which were converted to shares of Class A common stock in June 2014), contingent value rights (which were subsequently terminated in November 2013), and the right to receive an amount of cash. The tax receivable agreement between us and the Pre-H&F Merger Shareholder generally provides for the payment by us of 85% of the amount of cash savings, if any, in U.S. federal, state and local income taxes that we actually realize (or are deemed to realize in certain circumstances) as a result of (i) the tax attributes of the preferred units acquired by us in the merger, (ii) net operating losses available to us as a result of the merger, and (iii) tax benefits related to imputed interest deemed to be paid by us as a result of this tax receivable agreement.
The second tax receivable agreement, with each holder of limited partnership units, generally provides for the payment by us to each of them of 85% of the amount of the cash savings, if any, in U.S. federal, state and local income taxes that we actually realize (or are deemed to realize in certain circumstances) as a result of (i) certain tax attributes of their partnership units sold to us or exchanged (for shares of Class A common stock, convertible preferred stock or other consideration) and that are created as a result of such sales or exchanges and payments under the TRAs, and (ii) tax benefits related to imputed interest deemed to be paid by us as a result of this tax receivable agreement.
For purposes of these tax receivable agreements, cash savings in tax are calculated by comparing our actual income tax liability to the amount we would have been required to pay had we not been able to utilize any of the tax benefits subject to the tax receivable agreements. The tax receivable agreements will continue until all tax benefits have been utilized or expired, unless we exercise our right to terminate the agreements or we materially breach any of our material obligations under the agreements, in which cases our obligations under the agreements will accelerate. The actual increase in tax basis, as well as the amount and timing of any payments under these agreements, will vary depending upon a number of factors, including the timing of purchases or exchanges of partnership units, the price of our Class A common stock or the value of our convertible preferred stock, as the case may be, at the time of such purchases or exchanges, the extent to which such transactions are taxable, the amount and timing of the taxable income we generate in the future and the tax rate then applicable and the portion of our payments under the tax receivable agreements constituting imputed interest or depreciable or amortizable basis. In addition, in the case of a change of control, our obligations will be based on different assumptions that may affect the amount of the payments required under the agreements.
As of December 31, 2015, we recorded a
$589.1 million
liability, representing amounts payable under the tax receivable agreements equal to 85% of the tax benefit we expect to realize from the following (which exclude prior TRA payments and adjustments to the TRA liability due to changes in estimates):
|
•
|
The merger described above and our purchase of Class A common units in connection with our IPO (approximately $55 million).
|
|
•
|
Our purchase of preferred units from the H&F holders in November 2013 (approximately
$105 million
).
|
|
•
|
Our purchase of common and preferred units in connection with an offering of Class A common stock in March 2014 (approximately
$244 million
).
|
|
•
|
The H&F holders’ conversion in June 2014 of their remaining shares of convertible preferred stock into, and exchange of all of their remaining preferred units of Artisan Partners Holdings for, shares of Class A common stock (approximately $48 million).
|
|
•
|
Our purchase of common units in connection with the 2015 Follow-On Offering (approximately
$89 million
).
|
|
•
|
The quarterly exchanges made by certain limited partners pursuant to the Exchange Agreement (approximately $55 million).
|
Those amounts assume no material changes in the related tax law and that we earn sufficient taxable income to realize all tax benefits subject to the tax receivable agreements. Additional purchases or exchanges of units of Artisan Partners Holdings will cause the liability to increase.
During 2015, we made payments under the tax receivable agreements totaling approximately
$20 million
in the aggregate. Of that amount, $13.5 million was paid to certain of our directors or entities affiliated with certain directors and $3.9 million was paid to our employee-partners, including to certain of our currently-serving named executive officers and several employee-partners, or entities controlled by employee-partners, who own greater than 5% of our outstanding Class B common stock.
123
Assuming no material changes in the relevant tax law and that we earn sufficient taxable income to realize all tax benefits that are subject to the tax receivable agreements, we expect that the reduction in tax payments for us associated with (i) the H&F Corp merger described above; (ii) the purchase or exchange of partnership units from March 2013 through December 31, 2015; and (iii) future purchases or exchanges of partnership units would aggregate to approximately $1.4 billion over generally a minimum of 15 years, assuming the future purchases or exchanges described in clause (iii) occurred at a price of $36.06 per share of our Class A common stock, the closing price of our Class A common stock on December 31, 2015.
Under such scenario we would be required to pay the other parties to the tax receivable agreements 85% of such amount, or approximately $1.2 billion, over generally a minimum of 15 years. The actual amounts may materially differ from these hypothetical amounts, as potential future reductions in tax payments for us and tax receivable agreement payments by us will be calculated using the market value of our Class A common stock at the time of purchase or exchange and the prevailing tax rates applicable to us over the life of the tax receivable agreements and will be dependent on us generating sufficient future taxable income to realize the benefit.
The 2015 Follow-On Offering
In February 2015, we entered into partnership unit purchase agreements with limited partners who elected to sell partnership units to us. Pursuant to those agreements, we used the net proceeds of our issuance of 3,831,550 shares of our Class A common stock in March 2015 to purchase 3,831,550 common units from certain of the limited partners of Artisan Partners Holdings, including AIC; Mr. Colson, Mr. Daley and Mr. Patenaude; and many of our employee-partners, including several employee-partners, or entities controlled by employee-partners, who own greater than 5% of our outstanding Class B common stock. We purchased the units at a price equal to $46.08 per unit.
Indemnification Agreements
We have entered into an indemnification agreement with each of our executive officers, directors and the members of our Stockholders Committee that provides, in general, that we will indemnify them to the fullest extent permitted by Delaware law in connection with their service in such capacities. Due to the nature of the indemnification agreements, they are not the type of agreements that are typically entered into with or available to unaffiliated third parties.
Review, Approval or Ratification of Transactions with Related Persons
We have adopted a written policy regarding the approval, with certain exceptions, of any transaction or series of transactions in which we or any of our subsidiaries is a participant, the amount involved exceeds $120,000, and a “related party” (a director, director nominee, executive officer, or a person known to us to be the beneficial owner of more than 5% of our voting securities, or any immediate family member of any of the foregoing) has a direct or indirect material interest (a “related-party transaction”). Under the policy, a related party must promptly disclose to our Chief Legal Officer any potential related-party transaction and all material facts about the transaction. The Chief Legal Officer will then assess whether the transaction constitutes a related-party transaction. If the Chief Legal Officer determines a transaction qualifies as such, he or she will communicate that information to the Audit Committee of our Board, to the chairman of the Audit Committee, if the Chief Legal Officer determines it is impracticable or undesirable to wait until the next committee meeting, or to the entire Board. Based on its consideration of all of the relevant facts and circumstances, the reviewer will decide whether or not to approve such transaction and will generally approve only those transactions that are not inconsistent with our best interests. If we become aware of a related-party transaction that was not approved under this policy before it was entered into, the transaction will be referred to the Audit Committee or the entire Board, which will evaluate all options available, including ratification, amendment or termination of such transaction. Under the policy, any director who has an interest in a related-party transaction will recuse himself or herself from any formal action with respect to the transaction as deemed appropriate by the Audit Committee or Board.
124
INFORMATION ABOUT OUR INDEPENDENT REGISTERED PUBLIC ACCOUNTING FIRM FEES AND SERVICES
Audit and Non-Audit Fees
Aggregate fees for professional services rendered for us by PricewaterhouseCoopers LLP as of and for the fiscal years ended December 31, 2015 and 2014 are set forth below. The aggregate fees included in the “Audit Fees” category are fees billed
for
the fiscal year for the audits of our annual financial statements, audits of statutory and regulatory filings, and quarterly reviews. The aggregate fees included in the Audit-Related, Tax and Other Fees categories are fees for services performed
in
the fiscal years.
|
Fiscal Year 2015
|
Fiscal Year 2014
|
||||||
|
Audit Fees
|
$
|
881,000
|
|
$
|
884,300
|
|
|
|
Audit‑Related Fees
|
152,100
|
|
698,500
|
|
|||
|
Tax Fees
|
414,700
|
|
836,900
|
|
|||
|
All Other Fees
|
16,200
|
|
23,700
|
|
|||
|
Total
|
$
|
1,464,000
|
|
$
|
2,443,400
|
|
|
Audit Fees for the fiscal years ended December 31, 2015 and 2014 were for professional services rendered for the audits of our annual financial statements, reviews of quarterly financial statements and services that are customarily provided in connection with statutory or regulatory filings.
Audit-Related Fees for the fiscal years ended December 31, 2015 and 2014 were for reviews of registration statements filed with the SEC, consultations related to the accounting or disclosure treatment of transactions and attest services related to our compliance with the Global Investment Performance Standards (GIPS).
Tax Fees for the fiscal years ended December 31, 2015 and 2014 were for domestic and foreign tax return compliance, including review of partner capital accounts, and consultations related to technical interpretations, applicable laws and regulations and tax accounting. During 2015, $111,000 of the tax fees related to tax return compliance and preparation.
Other Fees for the fiscal years ended December 31, 2015 and 2014 were for consultations related to regulatory matters and license fees for professional publications.
Policy on Audit Committee Pre-Approval of Audit and Permissible Non-Audit Services of Independent Registered Public Accounting Firm
The Audit Committee is required to pre-approve, or adopt appropriate procedures to pre-approve, all audit and non-audit services to be provided by the independent auditors. The Committee will typically pre-approve specific types of audit, audit-related and tax services on an annual basis. The Committee pre-approves all other services on an individual basis throughout the year as the need arises. The Committee has delegated to its chairperson the authority to pre-approve independent auditor engagements between meetings of the Committee. Any such pre-approvals will be reported to and ratified by the entire Committee at its next regular meeting.
All audit, audit-related and tax services in fiscal 2015 were pre-approved by the Audit Committee. In all cases, the Audit Committee concluded that the provision of such services by PricewaterhouseCoopers LLP was compatible with the maintenance of PricewaterhouseCoopers LLP’s independence.
125
(1) Financial Statements: The information required by this Item is contained in Item 8 of Part II of this report.
(2) Financial Statement Schedules: None
(3) Exhibits:
|
Exhibit No.
|
Description
|
|
|
2.1
|
Agreement and Plan of Merger between Artisan Partners Asset Management Inc. and H&F Brewer Blocker Corp.
|
|
|
3.1
|
Restated Certificate of Incorporation of Artisan Partners Asset Management Inc.
|
|
|
3.2
|
Amended and Restated Bylaws of Artisan Partners Asset Management Inc.
|
|
|
10.1
|
Fifth Amended and Restated Limited Partnership Agreement of Artisan Partners Holdings LP
|
|
|
10.2
|
Amended and Restated Resale and Registration Rights Agreement
|
|
|
10.3
|
Exchange Agreement
|
|
|
10.4
|
Tax Receivable Agreement (Merger)
|
|
|
10.5
|
Tax Receivable Agreement (Exchanges)
|
|
|
10.6
|
Stockholders Agreement
|
|
|
10.7
|
Public Company Contingent Value Rights Agreement
|
|
|
10.8
|
Partnership Contingent Value Rights Agreement
|
|
|
10.9
|
Artisan Partners Asset Management Inc. 2013 Omnibus Incentive Compensation Plan
|
|
|
10.10
|
Artisan Partners Asset Management Inc. 2013 Non-Employee Director Plan
|
|
|
10.11
|
Artisan Partners Asset Management Inc. Bonus Plan
|
|
|
10.12
|
Form of Artisan Partners Holdings LP Restated Class B Common Units Grant Agreement
|
|
|
10.13
|
Employment Agreement of Andrew A. Ziegler
|
|
|
10.14
|
Form of Indemnification Agreement
|
|
|
10.15
|
Form of Indemnification Priority Agreement
|
|
|
10.16
|
Five-Year Revolving Credit Agreement, dated as of August 16, 2012, among Artisan Partners Holdings LP, the lenders named therein and Citibank, N.A., as Administrative Agent(1)
|
|
|
10.17
|
Note Purchase Agreement, dated as of August 16, 2012, among Artisan Partners Holdings LP and the purchasers listed therein(1)
|
|
|
10.18
|
Form of Artisan Partners Asset Management Inc. 2013 Non-Employee Director Plan - Restricted Share Unit Award Agreement
|
|
|
10.19
|
Form of Artisan Partners Asset Management Inc. 2013 Omnibus Incentive Compensation Plan - Restricted Stock Award Agreement
|
|
|
10.20
|
Form of Artisan Partners Asset Management Inc. 2013 Omnibus Incentive Compensation Plan - Restricted Share Award Agreement
|
|
|
10.21
|
Form of Artisan Partners Asset Management Inc. 2013 Omnibus Incentive Compensation Plan - Career Restricted Share Award Agreement
|
|
|
10.22
|
Form of Unit Purchase Agreement
|
|
|
10.23
|
Second Amended and Restated Investment Advisory Agreement between Artisan Partners Limited Partnership and Artisan Partners Funds, Inc.
|
|
|
21.1
|
Subsidiaries of the Registrant
|
|
|
23.1
|
Consent of Independent Registered Public Accounting Firm
|
|
|
31.1
|
Certification of the Company’s Chief Executive Officer pursuant to Exchange Act Rules 13a-14(a)/15d-14(a), as adopted pursuant to Section 302 of the Sarbanes-Oxley Act of 2002
|
|
|
31.2
|
Certification of the Company’s Chief Financial Officer pursuant to Exchange Act Rules 13a-14(a)/15d-14(a), as adopted pursuant to Section 302 of the Sarbanes-Oxley Act of 2002
|
|
126
|
32.1
|
Certification of the Company’s Chief Executive Officer pursuant to 18 U.S.C. Section 1350, as adopted pursuant to Section 906 of the Sarbanes-Oxley Act of 2002
|
|
|
32.2
|
Certification of the Company’s Chief Financial Officer pursuant to 18 U.S.C. Section 1350, as adopted pursuant to Section 906 of the Sarbanes-Oxley Act of 2002
|
|
|
101
|
The following Extensible Business Reporting Language (XBRL) documents are collectively included herewith as Exhibit 101: (i) the Consolidated Statements of Financial Condition as of December 31, 2015 and 2014; (ii) the Consolidated Statements of Operations for the years ended December 31, 2015, 2014 and 2013; (iii) the Consolidated Statements of Comprehensive Income (Loss) for the years ended December 31, 2015, 2014 and 2013; (iv) the Consolidated Statements of Changes in Stockholders’ Equity for the years ended December 31, 2015, 2014 and 2013; (v) the Consolidated Statements of Cash Flows for the years ended December 31, 2015, 2014 and 2013 and (vi) the Notes to Consolidated Financial Statements as of and for the years ended December 31, 2015, 2014 and 2013
|
|
|
(1)
|
incorporated by reference to Amendment No. 1 to the Registration Statement on Form S-1 filed by Artisan Partners Asset Management Inc. on December 18, 2012
|
|
127
SIGNATURES
Pursuant to the requirements of Section 13 or 15(d) of the Securities Exchange Act of 1934, the registrant has duly caused this report to be signed on its behalf by the undersigned, thereunto duly authorized.
Artisan Partners Asset Management Inc.
Dated: February 25, 2016
By:
|
/s/ Eric R. Colson
|
|
Eric R. Colson
President, Chief Executive Officer and Chairman of the Board
(principal executive officer)
|
|
/s/ Charles J. Daley Jr.
|
|
Charles J. Daley, Jr.
Executive Vice President, Chief Financial Officer and Treasurer
(principal financial and accounting officer)
|
Pursuant to the requirements of the Securities Exchange Act of 1934, this report has been signed below by the following persons on behalf of the registrant in the capacities indicated on the 25th day of February, 2016.
|
Signature
|
Title
|
|
|
/s/ Matthew R. Barger
|
Director
|
|
|
Matthew R. Barger
|
|
|
|
/s/ Seth W. Brennan
|
Director
|
|
|
Seth W. Brennan
|
||
|
/s/ Tench Coxe
|
Director
|
|
|
Tench Coxe
|
||
|
/s/ Stephanie G. DiMarco
|
Director
|
|
|
Stephanie G. DiMarco
|
||
|
/s/ Jeffrey A. Joerres
|
Director
|
|
|
Jeffrey A. Joerres
|
||
|
/s/ Andrew A. Ziegler
|
Director
|
|
|
Andrew A. Ziegler
|
||
128
TABLE OF CONTENTS
Part IItem 1. BusinessItem 1A. Risk FactorsItem 1B. Unresolved Staff CommentsItem 2. PropertiesItem 3. Legal ProceedingsItem 4. Mine Safety DisclosuresPart IIItem 5. Market For Registrant S Common Equity, Related Stockholder Matters and Issuer Purchases Of Equity SecuritiesNote 10, Stockholders EquityItem 6. Selected Financial DataItem 7. Management S Discussion and Analysis Of Financial Condition and Results Of OperationsItem 7. Management S Discussion and Analysis Of Financial Condition andNote 2, Reorganization and IpoNote 14, Earnings (loss) Per ShareItem 7A. Qualitative and Quantitative Disclosures Regarding Market RiskItem 8. Financial Information and Supplementary DataNote 1. Nature Of Business and OrganizationNote 2. Reorganization and IpoNote 11, Compensation and BenefitsNote 8, Noncontrolling Interest - HoldingsNote 12, Income Taxes and Related PaymentsNote 3. Summary Of Significant Accounting PoliciesNote 9, Variable and Voting Interest EntitiesNote 4. Investment SecuritiesNote 5. Fair Value MeasurementsNote 6. BorrowingsNote 5, Fair Value MeasurementsNote 7. Derivative InstrumentsNote 8. Noncontrolling Interest - HoldingsNote 9. Variable and Voting Interest EntitiesNote 10. Stockholders EquityNote 11. Compensation and BenefitsNote 12. Income Taxes and Related PaymentsNote 3, Summary Of Significant Accounting PoliciesNote 13. Accumulated Other Comprehensive Income (loss)Note 14. Earnings (loss) Per ShareNote 15. Benefit PlansNote 16. IndemnificationsNote 17. Property and EquipmentNote 18. Lease CommitmentsNote 19. Related Party TransactionsNote 20. Concentration Of Credit Risk and Significant RelationshipsNote 21. Litigation MattersNote 22. Selected Quarterly Financial Data (unaudited)Note 23. Subsequent EventsItem 9. Changes in and Disagreements with Accountants on Accounting and Financial DisclosureItem 9A. Controls and ProceduresItem 9B. Other InformationPart IIIItem 10. Directors, Executive Officers and Corporate GovernanceItem 11. Executive CompensationItem 12. Security Ownership Of Certain Beneficial Owners and Management and Related Stockholder MattersItem 13. Certain Relationships and Related Transactions, and Director IndependenceItem 14. Principal Accountant Fees and ServicesPart IVItem 15. Exhibits, Financial Statement Schedules