AMERICAN PUBLIC EDUCATION INC
10-Ks and 10-Qs
|
|
|
|
|
|
|
|
|
|
|
|
|
|
|
|
|
|
|
|
|
|
|
|
|
|
|
|
|
|
|
|
|
|
|
|
|
|
|
|
|
|
|
|
|
|
|
|
|
|
|
|
|
|
|
|
UNITED STATES SECURITIES AND EXCHANGE COMMISSION
Washington, D.C. 20549
Form 10-K
(Mark One)
[X] Annual Report Pursuant to Section 13 or 15(d) of the Securities Exchange Act of 1934
For the fiscal year ended
December 31, 2019
or
[ ] Transition report pursuant to Section 13 or 15(d) of the Securities Exchange Act of 1934
For the transition period from ______ to ______
Commission File Number: 001-33810
American Public Education, Inc.
(Exact name of registrant as specified in its charter)
|
Delaware
|
01-0724376
|
|
(State or other jurisdiction of
incorporation or organization)
|
(I.R.S. Employer
Identification No.)
|
|
111 West Congress Street
Charles Town, West Virginia
|
25414
|
|
(Address of principal executive offices)
|
(Zip Code)
|
Registrant’s telephone number, including area code:
(304) 724-3700
Securities registered pursuant to Section 12(b) of the Act:
|
Title of each class
|
Trading Symbol(s)
|
Name of each exchange on which registered
|
|
Common Stock, $.01 par value
|
APEI
|
Nasdaq Global Select Market
|
Securities registered pursuant to Section 12(g) of the Act: None
Indicate by check mark if the registrant is a well-known seasoned issuer, as defined in Rule 405 of the Securities Act.
Yes
o
No
þ
Indicate by check mark if the registrant is not required to file reports pursuant to Section 13 or Section 15(d) of the Act.
Yes
o
No
þ
Indicate by check mark whether the registrant (1) has filed all reports required to be filed by Section 13 or 15(d) of the Securities Exchange Act of 1934 during the preceding 12 months (or for such shorter period that the registrant was required to file such reports), and (2) has been subject to such filing requirements for the past 90 days. Yes
þ
No
o
Indicate by check mark whether the registrant has submitted electronically every Interactive Data File required to be submitted pursuant to Rule 405 of Regulation S-T (§232.405 of this chapter) during the preceding 12 months (or for such shorter period that the registrant was required to submit such files).
Yes
þ
No
o
Indicate by check mark whether the registrant is a large accelerated filer, an accelerated filer, a non-accelerated filer, a smaller reporting company, or an emerging growth company. See the definitions of “large accelerated filer,” “accelerated filer,” “smaller reporting company,” and “emerging growth company” in Rule 12b-2 of the Exchange Act.
|
Large accelerated filer
o
|
Accelerated filer
þ
|
Non-accelerated filer
o
|
|
Smaller reporting company
o
|
Emerging growth company
o
|
|
If an emerging growth company indicate by check mark if the registrant has elected not to use the extended transition period for complying with any new or revised financial accounting standards provided pursuant to Section 13(a) of the Exchange Act.
o
Indicate by check mark whether the registrant is a shell company (as defined in Rule 12b-2 of the Exchange Act).
Yes
o
No
þ
The aggregate market value of the registrant’s common stock held by non-affiliates as of
June 28, 2019
, the last business day of the registrant’s most recently completed second fiscal quarter, computed by reference to the price at which the common stock was last sold on the Nasdaq Global Select Market on that date, was approximately
$305
million.
The total number of shares of common stock outstanding as of
March 6, 2020
, was
14,926,651
.
DOCUMENTS INCORPORATED BY REFERENCE
Certain portions of the registrant’s Definitive Proxy Statement for its
2020
Annual Meeting of Stockholders (which is expected to be filed with the Commission within 120 days after the end of the registrant’s
2019
fiscal year) are incorporated by reference into Part III of this Report.
AMERICAN PUBLIC EDUCATION, INC.
FORM 10-K
INDEX
|
|
|
Page
|
|
|
||
|
|
||
|
|
||
SPECIAL NOTE REGARDING FORWARD-LOOKING STATEMENTS
This Annual Report, including the sections entitled “Risk Factors,” “Management’s Discussion and Analysis of Financial Condition and Results of Operations,” and “Business,” contains forward-looking statements. We may, in some cases, use words such as “project,” “believe,” “anticipate,” “plan,” “expect,” “estimate,” “intend,” “should,” “would,” “could,” “potentially,” “will,” or “may,” or other words or expressions that convey future events, conditions, circumstances or outcomes to identify these forward-looking statements. Forward-looking statements in this Annual Report include statements about:
|
•
|
changes to the size of our student enrollment, net course registrations, and the composition of our student body, including the pace of such changes;
|
|
•
|
our ability to maintain, develop, and grow our technology infrastructure to support our student body;
|
|
•
|
our conversion of prospective students to enrolled students and our retention of active students;
|
|
•
|
our ability to update and expand the content of existing programs and develop new programs to meet emerging student needs and marketplace demands, and our ability to do so in a cost-effective manner or on a timely basis;
|
|
•
|
our plans for, marketing of, and initiatives at, our institutions;
|
|
•
|
our ability to leverage our investments in support of our initiatives, students, and institutions;
|
|
•
|
our maintenance and expansion of our relationships and partnerships with the United States Armed Forces, corporations, and other organizations, and the development of new relationships and partnerships;
|
|
•
|
actions by the Department of Defense or branches of the United States Armed Forces;
|
|
•
|
federal appropriations and other budgetary matters, including government shutdowns, that affect the ability of our students to finance their education through programs administered by the Department of Education, the Department of Defense, and the Department of Veterans Affairs;
|
|
•
|
our ability to comply with the extensive regulatory framework applicable to our industry, including Title IV of the Higher Education Act of 1965, as amended, and the regulations thereunder, as well as state law and regulations and accrediting agency requirements;
|
|
•
|
our ability to undertake initiatives to improve the learning experience and attract students who are likely to persist;
|
|
•
|
changes in enrollment in postsecondary degree-granting institutions and workforce needs;
|
|
•
|
the competitive environment in which we operate;
|
|
•
|
our cash needs and expectations regarding cash flow from operations;
|
|
•
|
our ability to manage and influence our bad debt expense;
|
|
•
|
our ability to manage, grow, and diversify our business and execute our business initiatives and strategy; and
|
|
•
|
our financial performance generally.
|
Forward-looking statements are not guarantees of future performance. Actual future results, performance, achievements, or the timing of certain events may differ significantly from those expressed or implied by the forward-looking statements. A number of important factors could cause actual results to differ materially from the results anticipated by these forward-looking statements. Risks and uncertainties involved in the forward-looking statements include, among others:
|
•
|
our dependence on the effectiveness of our ability to attract students who persist in our institutions’ programs;
|
|
•
|
our inability to effectively market our programs;
|
|
•
|
adverse effects of changes our institutions make to improve the student experience and enhance their ability to identify and enroll students who are likely to succeed;
|
|
•
|
our inability to maintain strong relationships with the military and maintain enrollments from military students;
|
|
•
|
our failure to comply with regulatory and accrediting agency requirements or to maintain institutional accreditation;
|
|
•
|
our loss of eligibility to participate in Title IV programs or ability to process Title IV financial aid;
|
|
•
|
our need to successfully adjust to future market demands by updating existing programs and developing new programs; and
|
|
•
|
our dependence on and need to continue to invest in our technology infrastructure.
|
You should consider the forward-looking statements contained in this Annual Report in light of these factors and the factors described elsewhere in this Annual Report, including in Item 1A “Risk Factors” and Item 7 “Management’s Discussion and Analysis of Financial Condition and Results of Operations.” You should read these factors and the other cautionary statements made in this Annual Report as being applicable to all related forward-looking statements wherever they appear in this Annual Report. If one or more of these factors materialize, or if any underlying assumptions prove incorrect, our actual results, performance, or achievements may vary materially from any future results, performance, or achievements expressed or implied by these forward-looking statements.
We caution readers not to place undue reliance on any forward-looking statements made by us, which speak only as of the date of this Annual Report. We undertake no obligation to publicly update any forward-looking statements after the date of this Annual Report, whether as a result of new information, future events, or otherwise, except as required by law.
PART I
ITEM 1.
BUSINESS
American Public Education, Inc., or APEI, provides online and on-campus postsecondary education to approximately
82,600
students through two wholly owned institutions. In this Annual Report, “we,” “our,” “us,” “the Company” and similar terms refer to APEI and its educational institutions of higher learning collectively unless the context indicates otherwise.
This Item 1 of our Annual Report contains a “Company Overview” section that provides information about our reporting segments, the postsecondary educational market and opportunities, competition, our competitive strengths, our strategic approach, seasonality, and available information about us. This Item 1 also contains a section entitled “Our Institutions” that provides institution specific information regarding each of our two subsidiary institutions, our information technology, and our executive officers, and a section entitled “Regulatory Environment” that provides information on some of the educational and other regulations that impact us.
COMPANY OVERVIEW
APEI seeks to maximize a student’s return on their educational investment. Our institutions of higher learning offer programs designed to help students advance in their current occupation, or prepare for their next career, and develop the competencies that enable them to make meaningful contributions to their profession and society. Our institutions are:
|
•
|
American Public University System, Inc., or APUS, which provides online postsecondary education to approximately
81,000
adult learners. APUS is an accredited university system with a history of serving the academic needs of the military, military-affiliated, public service and service-minded communities through two brands: American Military University, or AMU; and American Public University, or APU.
|
APUS offers
121
degree programs and
111
certificate programs in diverse fields of study, with a particular focus on those relevant to today’s job market and emerging fields. Fields of study include traditional academics, such as business administration, health science, technology, criminal justice, education, and liberal arts, as well as public service-focused fields of study such as national security, military studies, intelligence, and homeland security. APUS has institutional accreditation from the Higher Learning Commission, or HLC, and several of its academic programs have specialized accreditations granted by industry governing organizations.
APUS is committed to providing quality, relevant, accessible, affordable, and student-focused higher education to a diverse student population in order to prepare students for service and leadership in a diverse, global society. In addition, the institution seeks to provide professional and workforce development solutions through partnerships with corporations and industry associations. Although APUS’s reach and appeal is broad, the institution continues to have an emphasis on serving the military, veteran, and public service communities. As of
December 31, 2019
, approximately
57%
of APUS’s students self-reported that they served in the military on active duty at the time of initial enrollment and approximately 14% of APUS’s students self-reported being a military veteran.
|
•
|
National Education Seminars, Inc., which we refer to as Hondros College of Nursing, or HCN, which provides nursing education to approximately
1,600
students at five campuses in Ohio in the suburban areas of Cincinnati, Cleveland, Columbus, Dayton, and Toledo. In the second quarter of 2020, HCN will begin offering classes at an additional campus in Indianapolis, Indiana. HCN serves the needs of local nursing and healthcare communities and addresses the persistent supply-demand gap of nurses that is evident nation-wide. HCN offers a Diploma in Practical Nursing, or PN, and an Associate Degree in Nursing, or ADN. In October 2019, HCN began offering a new Direct Entry ADN option that offers an accelerated graduation pathway for students who transfer at least 32 college credits to HCN and meet certain academic and entrance exam requirements. Portions of the PN and ADN Programs are online.
|
HCN is institutionally accredited by the Accrediting Bureau for Health Education Schools, or ABHES, and HCN’s locations and programs are approved by the Ohio State Board of Career Colleges and Schools, or the Ohio State Board. HCN’s PN and ADN Programs are approved by the Ohio Board of Nursing, or OBN, and the PN Program is accredited by the National League for Nursing Commission for Nursing Education Accreditation, or NLN CNEA.
HCN has also obtained or is in the process of obtaining all necessary approvals to offer postsecondary nursing education programs in connection with a new campus in Indianapolis, Indiana. The campus has been authorized by the Indiana Board for Proprietary Education/Indiana Commission for Higher Education to offer instruction in Indiana. The Indiana State Board of Nursing has voted to grant initial accreditation and authorize the admission of
1
the first cohort of students in the PN Program at the Indianapolis campus, where classes will begin in the second quarter of 2020. HCN has also notified NLN CNEA of the opening of the Indianapolis campus. While NLN CNEA approval is not required to begin classes, NLN CNEA may accept the notification or take other actions, such as requesting follow-up information or imposing conditions. We expect a response from NLN CNEA prior to the beginning of classes.
Reporting Segments
Our operations are organized into two reporting segments:
|
•
|
American Public Education Segment, or APEI Segment.
This segment reflects the operational activities of APUS, other corporate activities, and minority investments.
|
|
•
|
Hondros College of Nursing Segment, or HCN Segment.
This segment reflects the operational activities of HCN.
|
Our consolidated revenue for the year ended
December 31, 2019
decreased
3.8%
to
$286.3 million
from
$297.7 million
for the year ended
December 31, 2018
. Net income for the year ended
December 31, 2019
decreased
60.9%
to
$10.0 million
from
$25.6 million
for the year ended
December 31, 2018
. Financial information regarding each of our reporting segments, including information regarding segment revenue, net income, and total assets for each of the last three fiscal years, can be found in our Consolidated Financial Statements in Item 8 of Part II of this Annual Report. Additional financial information is reported in this Annual Report in “Selected Financial Data,” “Management’s Discussion and Analysis of Financial Condition and Results of Operations,” and “Financial Statements and Supplementary Data.”
In November 2018, HLC approved APUS’s application for a change in structure related to APUS’s proposal to enter into a shared services model with APEI. We subsequently entered into an intercompany agreement to implement the shared services model. As required by HLC policy, HLC conducted a focused site visit in May 2019. The site visit team found that evidence of compliance with APUS’s commitments made in its application and with HLC’s Eligibility Requirements Criteria for Accreditation was sufficiently demonstrated and no further follow up was recommended. In August 2019, HLC notified APUS that the Institutional Actions Council of the HLC, which conducts reviews and takes action on accreditation recommendations, concurred with the site visit team’s findings.
Postsecondary Education Market Characteristics
The postsecondary education market in the United States is large (with over 4,000 institutions), diverse in its business models, and fragmented such that no one institution has a significant market share. Most postsecondary institutions, including for-profit postsecondary institutions, regardless of where they are located, how they are organized, and who they serve, face significant challenges, including:
|
•
|
Enrollment Declines: In the United States, student enrollment declined in the fall of 2019 by 1.3% at postsecondary institutions participating in Title IV programs and 2.1% among four-year for-profit institutions, as compared to the same period the previous year.
|
|
•
|
Affordability: There is a continued focus on the cost of a college education and a resulting impact on access as well as on the high level of college student indebtedness.
|
|
•
|
Quality: Postsecondary institutions face questions from lawmakers, the media, potential students and others about the quality of academic programs.
|
|
•
|
Competition: Competition exists from lower cost alternatives and from non-traditional competitors, such as those offering competency-based education, or CBE, programs, coding bootcamps, credentialing programs, micro-credentials, corporate training and other alternative educational paths.
|
|
•
|
Relevance: Challenges exist regarding the ability to translate the value of a postsecondary education into economic mobility. Postsecondary institutions must prepare students with relevant skills to work in new and rapidly changing industries and respond to technological change and need to support employers in efforts to optimize and advance their workforce.
|
|
•
|
Accessibility: Postsecondary institutions must address the needs of students who are balancing education with other demands on their time
|
Despite these challenges, postsecondary institutions, and the credentials they grant, have an important role to play in enabling social and economic mobility. According to the U.S. Bureau of Labor Statistics, occupations that require a postsecondary credential are projected to grow at a faster rate through 2026 than those that do not require a postsecondary education, and most of the fastest-growing occupations will need postsecondary education.
2
Institutions who predominantly serve adult learners must address the particular needs of that population. According to the Lumina Foundation, approximately 38% of students enrolled in U.S. degree granting institutions are over the age of 25, and approximately 58% of these students are working adults. Today’s adult learners, including military service members, are often working with extended or irregular work schedules, have family obligations, travel or relocate frequently, and have limited financial resources. In December 2019, the Lumina Foundation, Strada Education Network, and Gallup released findings from an education consumer survey of approximately 42,000 adults aged 25-64 with some college credit, but no degree, and who are not currently enrolled in a postsecondary institution. Key findings included the following:
|
•
|
the most common reason cited for not continuing coursework was difficulty balancing school and work;
|
|
•
|
the factors that would have the most impact on getting this population to re-enroll are affordability, schedule flexibility, and a guaranteed employment outcome connected to further education;
|
|
•
|
only 19 percent of these adults reported that they were no longer interested in completing or did not need to complete their education; and
|
|
•
|
cost and time pressures continued to be barriers that keep people from re-enrolling.
|
Opportunities for APU
U.S. employers are increasingly reporting significant gaps between required job skills and the current capabilities of their workforce. In a 2019 survey on behalf of CareerBuilder, the Harris Poll found that 50% of human resource managers surveyed had jobs they could not fill because they could not find qualified talent. Working adults also recognize the need to be lifelong learners. Udemy’s 2018 Skills Gap Report found that 84% of workers surveyed said that they believe there is a skills gap in the U.S. and 72% thought skills needed for their jobs would change. The makeup of the labor market is also contributing to the need for more skilled workers. High-skill occupations, defined as those where at least 80% of online job postings for that position request a bachelor’s degree or higher, have 25% more openings than available workers, according to Burning Glass Technologies’ report Different Skills, Different Gaps: Measuring & Closing the Skills Gap, March 2018. This report also noted a need for improved alignment between educators and employers, and a rapidly changing labor market. We believe a growing number of employers and professional associations will seek partnerships with academic institutions to advance the skills and productivity of their workforce through higher education and training programs.
Opportunities for AMU
With nearly 2.2 million active duty military and reservists, we believe the U.S. military community will continue to be an important market segment for online education. Because of their particularly irregular schedules, frequent deployments and access to tuition assistance funding, we believe service members will continue to seek respected universities that provide military-focused support services coupled with an online curriculum and flexible scheduling. We believe service members are particularly interested in postsecondary credentials that offer both career advancement and preparation for employment outside of the military. As part of their longstanding tradition, military leaders often encourage service members to use their earned education benefits, and to enhance their qualifications, for purposes of the military’s compensation, promotion, assignment, and performance systems.
The Department of Defense, or DoD, uniform tuition assistance program offers active duty, National Guard and reserve component service members a variety of education and financial aid options. Additionally, veterans (and certain service members) are entitled to educational benefits from the Department of Veterans Affairs, or VA. For more information, refer to “Our Institutions - Sources of Student Financing” and “Regulatory Environment - Student Financing Sources and Related Regulations/Requirements.”
The U.S. military is demonstrating increased levels of support for credentials other than degrees. Credentialing Opportunities On-Line, or COOL, is a program from each of the military branches that links experience with certification. While benefits vary by service, service members may be eligible for assistance in paying for certifications, including by vouchers, reimbursement, or grants. Students must meet certain eligibility requirements in order to receive credentialing assistance, including in some cases service time, experience and DoD tuition assistance eligibility requirements. The Army is now offering an expanded credentialing program called the Army Credentialing Assistance Program, or CA. CA is a program designed to support soldiers who wish to pursue civilian credentials, licenses, and certifications that lead directly to a specific job, particularly in areas outside of a soldier’s Military Occupational Specialty (MOS). Through CA, soldiers can receive reimbursement for fees associated with qualifying programs listed on Army COOL. The US Army began a limited user test for CA at Fort Hood, Texas, in September 2018, expanded the test in 2019, and began an Army-wide implementation in January 2020. APUS became an approved training provider for CA programs in October 2019. We believe other service branches may
3
follow the Army’s example or pursue other approaches to enhancing support for credentialing. Students in the Army may use both DoD tuition assistance and credentialing assistance for CA, subject to a combined cap on benefit amounts.
We believe that military veterans represent another important market segment for online education. The U.S. Census Bureau estimated that there were 1.6 million veterans aged 18 to 35 and another 4.2 million veterans aged 35 to 54 in 2018. Furthermore, of the 9.0 million veterans aged 18 to 64, approximately 77% are part of the labor force, but only approximately 29% have a bachelor’s degree or higher. We believe that our military heritage, affordability, and online offerings are attractive to veterans in the pursuit of career advancement and employment outside of the military. Veterans and their dependents
pursuing a program of education on a more than half-time basis at an on-campus location are eligible for a monthly housing allowance equal to the basic allowance for housing available to service members who are at a military pay grade E-5, or $1,789 per month. Veterans pursuing a program of education solely through distance education on a more than half-time basis are eligible to receive half of that monthly housing allowance, or $895 per month.
Elected and private-industry leaders are heavily promoting new policies and campaigns to facilitate the hiring of veterans, supporting a transition from military service to the workforce and stimulating demand for online education. As these policies lower barriers to non-military jobs and facilitate veteran-owned businesses winning federal contracts, online universities offer valuable educational opportunities for veterans regardless of where they live, work, or learn.
Opportunities for Hondros
On a national level, the expanding need for healthcare coupled with a nursing shortage is driving demand for nursing education. Job opportunities for licensed practical nurses and registered nurses are expected to grow faster than the average growth for all occupations, or approximately 11%, between 2018 and 2028, according to the U.S. Bureau of Labor Statistics’
Occupational Outlook Handbook
, 2019-20 Edition. The demand for nurses in Ohio is similar to national demand: job opportunities for licensed practical nurses and registered nurses in Ohio are expected to grow 9.5% and 14.2% through 2026, respectively, according to the Ohio Department of Job and Family Services’ 2026 Ohio Job Outlook report. However, despite the anticipated growth in job opportunities, over 75,000 qualified applications were not accepted by entry-level baccalaureate and graduate nursing programs in 2018, according to a 2019 report from the American Association of Colleges of Nursing.
These statistics suggest there may be unmet demand from qualified students for nursing educational programs.
Competition
Within the postsecondary education market, APUS competes primarily with not-for-profit, public and private two-year and four-year colleges as well as other for-profit schools, particularly those that offer online learning programs. We believe APUS’s primary competitors include Arizona State University, Capella University, DeVry University, Grand Canyon University, Purdue Global, Southern New Hampshire University, Strayer University, University of Maryland Global Campus (formerly University of Maryland University College), University of Phoenix, and flagship and mid-size state universities offering degree programs online.
We believe that the competitive factors in the U.S. postsecondary education market include:
|
•
|
quality of the academic program, including alignment to high growth sectors of the job market;
|
|
•
|
affordability;
|
|
•
|
breadth of degree offerings;
|
|
•
|
flexibility in delivery models;
|
|
•
|
frequency of course or program starts;
|
|
•
|
experience of faculty members engaged in the practice of their fields;
|
|
•
|
level of support for student success;
|
|
•
|
reputation among prospective students, employers, and other stakeholders;
|
|
•
|
effectiveness of marketing efforts in attracting college-ready students; and
|
|
•
|
track record of strong compliance.
|
HCN’s programs are offered as campus-based programs to residents in the geographic areas surrounding its campuses. In these geographic areas, HCN competes with other schools offering similar programs, including for-profit and not-for-profit public and private colleges. Because of its relatively local focus, HCN’s competitive environment is impacted by various factors that are specific not only to Ohio and Indiana but also to the particular areas of Ohio and Indiana where HCN’s campuses are located, including local supply and demand dynamics for nurses and nursing schools. HCN’s results are therefore more susceptible to the actions of single competitors than the results of an institution that draws from a broader geographical area.
4
For example, a particularly effective or ineffective marketing approach by another school, or the opening or closing of another school, could have unanticipated detriments or benefits to HCN’s competitive position.
Due to the seventh straight annual enrollment decline in the United States our institutions could face increased competition as fewer students pursue degree-based postsecondary education. Furthermore, we anticipate increased competition from postsecondary institutions as they continue to increase the number of online degree programs and develop more non-traditional programs for working adult students.
Increased competition for college-ready students has led to an increase in the cost of advertising in certain marketing channels. Continued increases in the cost of advertising may adversely impact our ability to attract our fair share of college-ready students and/or increase our student acquisition costs. Moreover, institutions who charge higher tuition than APUS are generally in a position to make larger investments in marketing, specifically in student acquisition.
In recent years, other providers have started providing non-traditional, credit-bearing, and non-credit-bearing education programs without charge or at a low cost, including:
|
•
|
institutions offering CBE programs, which permit students to control their own pace and progress in a program by demonstrating that they have achieved certain skills or knowledge rather than by earning credit hours;
|
|
•
|
non-traditional competitors, such as entities providing coding bootcamps and micro-credentials; and
|
|
•
|
non-traditional competitors that are partnering with universities to offer new alternative educational paths.
|
Increased availability of federal student financial aid for CBE programs could create additional competition and drive additional students toward non-traditional education programs.
Most public institutions are aided by substantial government subsidies. Public and private not-for-profit institutions benefit from government and foundation grants, tax-exempt status, tax-deductible contributions, and other financial resources not widely available to for-profit institutions. Many public competitors also benefit from longstanding name recognition and are able to directly recruit students in a more cost-effective manner, especially in their local markets.
For more information on competition within the postsecondary education market, refer to “Risk Factors - Risks Related to Attracting and Retaining Students.”
APUS has focused on serving the military community since its founding as AMU, and the military market continues to be the primary market for APUS. Within the military market, there are more than 2,400 institutions that serve military students and receive funds through the DoD tuition assistance program. The primary competitors for military students are other institutions offering online instruction, and colleges and universities offering on-campus instruction located near military installations. Over the last several years, a number of APUS’s competitors have expanded their outreach and marketing efforts directed at active duty and reserve service members, as well as veterans.
We believe that APUS will continue to see increased competition in the military community from both not-for-profit and for-profit schools. As traditional not-for-profit public and private schools advance their online capabilities, they will present increasing levels of competition for APUS. At the same time, we believe for-profit schools will continue to market to students eligible for DoD tuition assistance programs and VA education benefits, rather than ED’s Title IV programs, in an attempt to comply with an ED regulatory requirement known as the 90/10 Rule (a rule that imposes sanctions on participating institutions that derive more than 90% of their total revenue on a cash accounting basis from Title IV programs as calculated under ED’s regulations). This regulatory requirement is described more fully below in “Regulatory Environment - Student Financing Sources and Related Regulations/Requirements - Department of Education - Regulation of Title IV Financial Aid Programs - The ‘90/10 Rule’.”
Within the non-military market, including service professionals, law enforcement personnel or other first responders, and other working adults with extended and irregular work schedules, APUS faces broad competition with not-for-profit public and private two-year and four-year colleges as well as other for-profit schools, particularly those that offer online learning programs. Many of these competitors, whether for-profit, not-for-profit, or public, are also able to leverage their greater scale and size to more efficiently compete.
5
Competitive Strengths
While many institutions are struggling to determine how to meet the needs of today’s students, both APUS and HCN have focused on consistently delivering high returns on student educational investment, serving busy military and non-military students who are often balancing work and other obligations with school and living expenses with the cost of education.
The sources of our institutions’ competitive strengths include:
|
•
|
Affordable Tuition.
Affordable tuition has been a priority of APUS since its founding, when APUS set undergraduate tuition to align with tuition assistance programs available to members of the military. Today, tuition at APUS remains among the lowest in the four-year for-profit sector. APUS’s low tuition rates mean that its students are not required to take on as much debt as they might at another institution. To support APUS’s active duty military students using TA, effective with courses beginning January 2020, APUS increased the tuition grant for those master’s students and their spouses and dependents. As a result, undergraduate and master’s students who are eligible for TA benefits and their spouses and dependents will pay a net tuition of $250 per credit hour. The combined tuition and fees at APUS are generally less expensive for undergraduate and graduate students than the average in-state cost at a public university. APUS’s low tuition and fees, in combination with APUS’s tuition grants, and its book grant that is provided to all undergraduate students, and beginning in January 2020, active-duty military students and their spouses and dependents at the master’s level, result in significant savings for students. APUS has provided approximately $140 million in book grant savings to undergraduate students since 2001, and will provide approximately $0.4 million to $0.6 million in book grant savings to graduate students in 2020. Tuition and fees at HCN are also designed to be affordable and competitive with those of similar institutions offering the same level of flexibility, accessibility, and student experience. We believe that, given broad concerns about rising tuition and student loan debt in higher education, there are opportunities to create awareness and attract college-ready students with the primary message of affordability and value.
|
|
•
|
Relevant Offerings Aligned with Student and Employer Demands.
Both APUS and HCN offer programs aligned to areas of high growth in the job market as supported by data provided by the Bureau of Labor Statistics and non-governmental organizations. The depth and breadth of APUS’s program offerings are designed to effectively address the diverse needs of students who enter into education programs with vastly different educational and career backgrounds and goals. Our institutions are committed to continually assessing and enhancing our academic programs and our student services to offer a high-quality education and facilitate successful outcomes for our students and graduates. APUS:
|
|
•
|
offers healthcare, technology, business, cybersecurity, nursing, and health information management programs;
|
|
•
|
offers a liberal arts curriculum that supports the development of the soft skills in demand by employers; and
|
|
•
|
utilizes Industry Advisory Councils to evaluate its current curriculum and inform the career relevance of programs and degrees, which facilitates efforts to connect APUS’s curriculum to the industries and the students it serves and to deliver a high-quality academic product.
|
Similarly, HCN focuses on educational relevance and excellence by hiring experienced nurses and other industry professionals as faculty members while enhancing student services to assist students with courses, labs, and clinical offerings. HCN’s faculty includes individuals with research experience and specialized nursing credentials. HCN has invested in an innovative concept-based curriculum and simulation labs to enhance the student learning experience and improve student success.
|
•
|
Military Market Leader:
APUS traces its roots to AMU, which was founded in 1991 as a distance-learning, graduate-level institution for military officers seeking an advanced degree in military studies. Since its founding, APUS has broadened its focus to include other military communities, veterans, and public service and service-minded communities, with a focus on a broad purpose of “educating those who serve.” Today, APUS is a market leader among active duty military professionals and is listed as the top provider of postsecondary education to active duty service members using DoD tuition assistance. As of December 31, 2019, approximately
57%
of APUS’s students self-reported that they served in the military on active duty at the time of initial enrollment.
|
|
•
|
Flexible Delivery / Frequent Entry Points / Focused on Adult Learners.
APUS offers online delivery with monthly starts, giving students the opportunity to begin their studies at a time that works for them. Our academic support offerings, from advising and mentoring to library services and career planning, are individualized to students’ needs, designed to support them at each step of their education journey in a format that works best for them. Because students are located worldwide, APUS focuses on providing asynchronous, interactive education to students that fits their busy
|
6
lives. HCN offers programs that accommodate working adults by offering blended online and in-person courses for the PN and ADN Programs, as well as daytime and evening/weekend options at convenient campus locations.
Strategic Approach
In an effort to grow revenue and improve our financial performance, we are focused on accomplishing the following goals and have commissioned a growth study to help prioritize investments and actions:
|
•
|
Increase Enrollment at APUS.
Growing student enrollment at APUS while maintaining a high quality academic experience is a priority. We aim to increase enrollment of new and returning college-ready students and further improving student retention and completion. This includes improving enrollments from operational improvements in enrollment management, student-onboarding, student service, and marketing, including a planned marketing campaign focusing on affordability and return on investment learners. Our efforts may also include seeking additional and expanding existing academic partnerships, with a focus on healthcare and community colleges, expanding our offerings, and launching new initiatives, including in the business-to-business space.
|
|
•
|
Maintain APUS’s Leading Position in the Military Market and Expand Our Presence in the Veteran Market.
The combination of our online model, market-focused curriculum, and outreach to military and veterans has enabled APUS to maintain a leadership position against more established institutions, many of which are traditional schools offering on-campus instruction that have served the military market for longer periods. In an effort to continue to strengthen our position, we are taking strides to, among other things, work with military schoolhouses to better align APUS programs with military schoolhouse curriculum in order to maximize transfer credit. In addition, our commitment to providing exceptional service and support to the military, military-affiliated, and veteran communities will increasingly require that we offer job-ready credentials and other non-degree offerings as a complement to degree programs, as evidenced by the US Army’s expansion of its credentialing assistance program.
|
|
•
|
Increase APUS’s Share of the Non-Military Market.
APUS’s programs are particularly responsive to learners in public service communities, including public safety, intelligence, and security professions. Today’s adult learners, regardless of their specific career requirements, are looking for a highly tailored educational experience that prepares them for success. We believe APUS’s academic offerings are attractive options for students seeking high quality, affordable, and flexible programs.
|
|
•
|
Utilize Innovative Education Technology.
At APUS, we provide a personalized online learning environment that leverages existing and proprietary technologies, as well as emerging technologies, for the purpose of enhancing student services, classroom instruction, learning outcomes, and the overall student experience. We utilize various technologies to encourage student persistence and engagement with an emphasis on the mobile experience. Our intention is to deliver a next-generation student experience from point of inquiry to graduation and beyond, leveraging enhanced levels of personalization in order to address student expectations informed by market-leading customer experiences online, while operating with agility and efficiency. In 2019, we initiated an information technology transformation program focusing on specific information technology projects, including replacements of our learning management and customer relationship management systems, with the goal of improving service delivery to internal and external customers.
|
|
•
|
Add New Campus Locations and Programs at HCN.
Given the persistent gap between demand for nurses, and the supply of qualified graduates of nursing schools, we will continue to pursue both organic and inorganic growth opportunities for HCN. In the second quarter of 2020, HCN will begin offering classes at a new campus in Indianapolis, Indiana. HCN will continue exploring opportunities to add campus locations, aligned with accreditor requirements, to meet the needs of students and marketplace demands, as well as new nursing and healthcare education programs, such as the Direct Entry ADN option. To complement these efforts, we may also seek opportunities to expand through acquisition of nursing schools or other organizations focused on healthcare education.
|
|
•
|
Increase Enrollment at HCN’s ADN Program.
Enrollments in HCN’s ADN Program for 2019 were significantly lower than planned. We plan to continue to review and refine our academic and admissions standards, including changes implemented during the year that we believe have impacted student enrollment, to work to improve negative perceptions from current and prospective student cohorts, and to implement new initiatives to improve the current and prospective student experiences such as by extending the hours of the customer service team and launching a direct-entry ADN program.
|
7
|
•
|
Expand Strategic Partnerships
. Our institutions partner with corporations, government agencies, professional associations, and non-profit organizations to support their professional and workforce development initiatives. APUS provides more than 200 partner organizations with a range of services to maximize strategic workforce development goals, including tailored learning programs, dedicated client services, admissions support, custom program webpages, direct payment options for eligible institutions, and tuition grants. HCN partners with more than 40 healthcare facilities and community partners, through corporate and local agreements, to provide clinical experiences for HCN students, meet partners’ workforce needs, and work collaboratively to chart the future of nursing education in a community advisory capacity.
|
|
•
|
Further Increase Alignment to Job Market Needs.
Our institutions will continue exploring opportunities to enhance degree offerings to meet emerging needs and marketplace demands, with a focus on fields of study exhibiting higher than average job growth and new degree programs that are relevant to the workplace. Our institutions will also continue to consider alternatives and non-traditional offerings, including corporate training and credentialing programs aligned to the job market and requiring less time and expense to complete, possibly including through acquisitions of training or corporate learning companies serving high growth industries such as healthcare, technology and STEM fields.
|
To support growth in our existing businesses and to diversify our business model, we will continue to assess and pursue strategic investments and acquisitions. Our investment and acquisition strategy includes a focus on investing in nursing and healthcare education as well as investing in companies that bridge postsecondary education to employment, to improve economic mobility for adult learners, in particular those in the military, national security and public service communities, through a combination of educational offerings and workforce-related solutions. For additional information regarding our investments and acquisitions, please refer to the “Financial Statements and Supplementary Data - Notes to Consolidated Financial Statements” in this Annual Report.
Seasonality and Quarterly Fluctuations
Our quarterly results fluctuate and, therefore, the results in any quarter may not represent the results we may achieve in any subsequent quarter or full year. Our revenue and operating results normally fluctuate as a result of seasonal or other variations in our enrollments. Our student population also varies as a result of new enrollments, graduations, student attrition, the success of our marketing programs, and other reasons that we cannot always anticipate. We expect quarterly fluctuations in operating results to continue as a result of these factors.
Available Information About Us
APEI was incorporated in Delaware in 2002 as the successor to a Virginia corporation incorporated in 1991. Our website is www.apei.com. The information on our website is not incorporated by reference in this Annual Report on Form 10-K. We make available, free of charge through our website, our Annual Reports on Form 10-K, Quarterly Reports on Form 10-Q, Current Reports on Form 8-K, and amendments to those reports filed or furnished pursuant to Section 13(a) or 15(d) of the Exchange Act, as soon as reasonably practicable after they are electronically filed with, or furnished to, the SEC.
OUR INSTITUTIONS
We provide postsecondary education through two educational institutions of higher learning, APUS and HCN. Our institutions are licensed or otherwise authorized by state authorities, or are in the process of obtaining such licenses or authorizations, to offer postsecondary education programs to the extent the institutions believe such licenses or authorizations are required, and are certified by the U.S. Department of Education, or ED, to participate in student financial aid programs authorized under Title IV of the Higher Education Act of 1965, as amended, or Title IV.
8
American Public University System
APUS is based in Charles Town, West Virginia and has institutional accreditation from HLC, a regional accrediting agency. As mentioned above, APUS traces its roots to AMU, which was founded in 1991 as a distance-learning, graduate-level institution for military officers seeking an advanced degree in military studies. APUS has gradually broadened its focus to include other military communities, veterans, and public service and public service-minded communities with a focus on educating those who serve. In 2002, APUS was organized into a university system with two components: AMU and APU. AMU is focused on educating students from the military, national security, military-affiliated and service communities. APU is focused on educating career-focused working adults with an emphasis on educating professionals working in service-related communities. APUS is an online institution of higher learning, which we believe is well-suited to its students, especially its military, public service and working adult students, many of who serve in positions requiring extended and irregular work schedules, are on call for rapid response missions, participate in extended deployments and exercises, travel or relocate frequently, must balance family and work demands or are single parents with limited financial resources. Many APUS students have significant prior education and career experiences; 87% are working adults and the average age of APUS students is 32. APUS is designed to serve those students with tailored offerings to support them in successfully reaching their individual goals.
Although APUS’s focus has broadened, it continues to have an emphasis on its relationship with the military community. Approximately
57%
of APUS’s students as of
December 31, 2019
self-reported that they served in the military on active duty at the time of initial enrollment. The remainder of APUS’s students are military-affiliated professionals (such as veterans, reservists or National Guard members), public service professionals (such as law enforcement personnel or other first responders), and other civilians (such as military spouses and working adult students).
Curriculum and Scheduling
APUS offers
232
degree and certificate programs, including one dual degree and four CBE programs. Over 1,600 distinct courses are available in either eight- or sixteen-week formats. Most academic terms begin on the first Monday of each month. APUS’s programs are as follows:
|
Programs
|
Number
|
|
|
Doctoral Degrees
|
2
|
|
|
Master’s Degrees
|
43
|
|
|
Bachelor’s Degrees
|
51
|
|
|
Associate Degrees
|
25
|
|
|
Total Degree Programs:
|
121
|
|
|
|
|
|
|
Certificates
|
Number
|
|
|
Graduate
|
54
|
|
|
Undergraduate
|
57
|
|
|
Total Certificates:
|
111
|
|
|
TOTAL PROGRAMS AND CERTIFICATES
|
232
|
|
In addition to degree programs, APUS offers
111
certificate programs. APUS’s certificate programs generally require a minimum of 18 credit hours and focus on a particular component of a broader degree program. Students may earn either discrete certificates or certificates in combination with work toward a degree program. APUS currently offers limited enrollment in our four Momentum CBE programs, which focus on the achievement of knowledge and skills, providing a more flexible degree path to non-traditional students seeking an alternative to prevailing schedule and tuition constraints. In addition, APUS offers several “Learning Tracks” that are comprised of three academic courses in a related area of interest. Like a microcredential, a Learning Track allows students to pursue a course of study without having to commit to a degree or certificate program. For a full list of our degree and certificate programs, please see http://catalog.apus.edu. The information on our website is expressly not incorporated by reference in this Annual Report.
For the fiscal year ended December 31, 2019, 23% of APUS students were enrolled in security and global studies programs, 24% in business, and 22% in arts and humanities, with the remainder of students in science, technology, education and math, health sciences, and education programs. During that period, 59% of students were enrolled in a bachelor’s degree program, 17% in an associate degree program, 15% in a master’s degree program, and 9% in certificate or other programs.
9
Student Recruitment and Marketing
APUS’s relationship-based marketing strategy focuses on building long-term, mutually beneficial relationships with organizations and individuals in the military, military-affiliated, and service communities. We rely on outreach teams, which serve these communities and foster long-standing relationships, as the core of this strategy. We believe APUS’s reputation as a trusted educator positions APUS as a respected institution among certain federal and private sector employers. These relationships, as well as APUS’s student and alumni networks, also cultivate personal referrals. We believe that this relationship-based marketing approach enables APUS to achieve lower student acquisition costs than otherwise would be achieved if it focused more heavily on traditional media advertising.
APUS supplements relationship-based marketing with multichannel, data-driven marketing campaigns to create greater brand awareness, particularly for academically prepared potential students outside the military, military-affiliated, and service communities. In these campaigns, APUS utilizes, among other marketing channels, digital marketing channels such as organic and paid search, APUS owned and external content and social marketing communities, linear and digital TV advertising, radio advertising, and print advertising. Increased competition in paid marketing channels has resulted in higher advertising costs in certain marketing channels and could lead to increased student acquisition costs. To better manage costs and focus marketing efforts on prospective student audiences most likely to matriculate and succeed, APUS put in place tools to provide new insights connecting individual student performance data with third-party audience insights and the marketing touch points that attracted them. APUS is using these insights and other highly personalized approaches to improve future decisions with respect to marketing mix allocation, audience targeting, new initiatives, relevant messaging, and creative decisions, as well as to more effectively and deeply leverage platform tools that support scalable advertising development, delivery, and testing.
APUS also provides more than 200 partner organizations with a range of services to maximize strategic workforce development goals, including dedicated client services, admissions support, custom program webpages, direct payment options for eligible institutions, and tuition grants.
APUS is beginning to attract greater numbers of adult learners who are younger and from more diverse backgrounds. Digital data signals tell us that our programs, designed to help to advance purpose-driven career goals, resonate strongly with this audience’s desire to make a difference in the world. Our commitment to affordability, particularly compared to that of other four-year public and private institutions, also strongly resonates given this audience’s deep concern for saving money and their reluctance to take on debt. Learners are looking for a practical solution; one that provides a return for their educational investment and fits their lifestyle and values. APUS is recognized among education providers in this respect. In fact, according to a 2019 Georgetown University Center on Education and the Workforce study titled,
“A First Try at ROI: Ranking 4,500 colleges”
, based on 40-year net present value, we were ranked in the top 2 percent for return-on-investment.
APUS continues to work to enhance the student learning experience to attract students who are more likely to persist and succeed in its programs, and will continue to work to identify and implement changes and initiatives in an effort to more effectively attract and enroll more college-ready students on average. These initiatives may include updates to admissions standards, which may have an adverse effect on APUS’s enrollment and our financial condition. For additional information on the risk factors associated with these initiatives and the APUS admissions process please refer to “Risk Factors - Risks Related to Our Business.”
Student Body and Enrollment
The student body of APUS consists of approximately
81,000
enrolled students, most of whom hold full-time employment. Student enrollment is defined as the number of unique active students, including those who take an approved leave of absence for up to two years, who have reached the eighth day of their first course or who have completed at least one course within the last 12 months for which a grade was received.
APUS is focused on executing initiatives that will more effectively support its students and help improve those students’ educational outcomes, including through faculty engagement initiatives and co-curricular initiatives to increase the level of engagement and collaboration in the classroom and strengthen the bond between APUS and its students. Improved engagement is an important element in APUS’s goal of retaining qualified students.
10
Accreditation
APUS has institutional accreditation from HLC, a regional institutional accrediting agency recognized by ED. The status and meaning of this accreditation is described more fully below in “Regulatory Environment - Accreditation.” The next comprehensive evaluation for reaffirmation of accreditation is scheduled for the 2020-2021 academic year.
In addition to accreditation by HLC, certain programs offered by APUS have received specialized accreditations or professional recognition. For example, the Accreditation Council for Business Schools and Programs (ACBSP), accredits 21 different academic programs, including the following:
•
Associate of Science, Bachelor of Science and Master of Science in Accounting;
•
Associate of Arts, Bachelor and Master of Business Administration;
•
Associate of Arts and Bachelor of Arts in Hospitality Management;
•
Associate of Arts, Bachelor of Arts, and Master of Arts in Management;
•
Associate of Arts in Real Estate Studies;
•
Associate of Arts and Bachelor of Arts in Retail Management;
•
Bachelor of Arts and Master of Arts in Reverse Logistics Management;
•
Bachelor of Arts and Master of Arts in Entrepreneurship;
•
Bachelor of Arts in Marketing; and
•
Bachelor of Arts and Master of Arts in Transportation and Logistics Management.
In addition to the general ACBSP accreditation, our Bachelor of Science and Master of Science in Accounting hold specialized accounting accreditation from ACBSP.
The Commission on Collegiate Nursing Education, or CCNE, accredits the Bachelor and Masters of Science in Nursing programs. In addition, APUS has obtained professional recognition for its program concentrations in Human Resources from the Society for Human Resource Management, for certain courses in the Sports and Health Sciences program from the American Sport Education Program for Bronze Level Certification and the National Academy of Sports Medicine Performance Enhancement Specialist, for the Information Systems Security program from the National Security Agency - Information Assurance Courseware Evaluation, and for certain courses in the Human Development and Family Studies program from the National Council on Family Relations for the Certified Family Life Educator.
Our Master of Public Health program holds accreditation from the Council on Education for Public Health, or CEPH.
In addition, the International Fire Service Accreditation Congress, or IFSAC, has accredited five APUS programs, including:
•
Associate of Science in Fire Science;
•
Bachelor of Science in Fire Science Management;
•
Bachelor and Master of Arts in Emergency and Disaster Management; and
•
Dual Master of Arts in Emergency and Disaster Management and Homeland Security.
Student Admissions
APUS welcomes prospective students to apply for admission at any time through an online application process. The current qualification for most undergraduate programs is a high school diploma or General Education Development certificate. Applicants for graduate programs must hold a bachelor’s degree from an accredited U.S. institution or an equivalent foreign institution. Certain programs may have additional admissions standards and restrictions.
Cost of Attendance and Financial Aid
We believe that APUS’s commitment to maximizing a student’s return on their educational investment is one of its competitive strengths. We are focused on offering our students affordable programs, and many APUS students also transfer a significant number of previously earned academic credit hours, which reduces the length of time required to earn their degrees, and therefore reduces the cost of the degree.
In October 2019, APUS announced the following tuition changes for undergraduate and master’s course registrations made on or after January 1, 2020:
•
The tuition for undergraduate level courses increased $15 per credit hour to $285 per credit hour.
•
The tuition for master’s level courses increased $20 per credit hour to $370 per credit hour.
11
•
The technology fee increased from $50 to $65 per class.
The January 2020 tuition increase is APUS’s first increase since July 2015 and is intended to help support increased investments in academic learning and student operations. Prior to the 2015 increase, APUS had not raised undergraduate tuition for 15 years or graduate tuition for four years. In general, a bachelor’s degree may be earned for $34,485 in tuition costs at current tuition rates, and APUS master’s degrees may be earned for $13,320 in tuition at current tuition rates. The combined tuition, fees, and books at APUS are designed to be less expensive for undergraduate and graduate students than the average in-state cost at a public university.
Undergraduate students and, effective January 1, 2020, all active duty military students and their spouses and dependents, enrolled in courses for academic credit receive their textbooks and certain course materials at no additional cost to them through an institutional book-grant program. This book grant represents an approximate savings over the course of a student’s undergraduate degree program of $5,000 as compared to public four-year colleges and universities according to comparative information from The College Board’s
Trends in College Pricing 2019
report. APUS also utilizes open access and online library materials where appropriate and works with various publishers to reduce the cost of textbooks and course materials for both students receiving the book grant and for graduate students who pay for textbooks and course materials.
To support APUS's active duty military students using TA, APUS increased the tuition grant for those undergraduate students and their spouses and dependents from $20 to $35 per credit hour to keep the cost at $250 per credit hour, and increased the tuition grant for those master’s students and their spouses and dependents from $25 to $120 per credit hour to reduce the cost from $325 per credit hour to $250 per credit hour for active duty military students. As a result, undergraduate and master’s students who are eligible for TA benefits and their spouses and dependents will pay a net tuition of $250 per credit hour. APUS also extended its book grant, previously available only to all undergraduate students, to active-duty military students and their spouses and dependents at the master’s level. The net effect of these price and grant adjustments is that for active duty military students using TA, an undergraduate or graduate degree at APUS may be attained for no out-of-pocket cost.
APUS estimates that the tuition grant will apply to approximately 60% of its total net course registrations made on or after January 1, 2020.
APUS’s tuition grant for veterans expired at the end of 2019. However, veterans who qualify for 100% of their Post-9/11 GI Bill benefits are expected to continue to have no out-of-pocket expenses. Those veterans who do not qualify for 100% may experience a small increase in out-of-pocket costs, but because APUS is a “Yellow Ribbon” university, many are expected to have access to additional funding resources.
APUS has two applied doctoral programs, Strategic Intelligence and Global Security, that began instruction in January 2018. The programs meet a need for higher-level education and research combined with professional practice in these fields. The doctoral degrees tuition and residency costs are currently $5,600 per term and include a book grant for course materials. APUS doctoral degrees may be earned for approximately $50,000 in tuition at current tuition rates.
APUS does not charge an admission fee or fees for services such as registration, course drops, or similar events that trigger fees at many other institutions. Because APUS is an exclusively online institution, there are no required resident fees, such as for parking, food service, student union, and recreation. APUS charges students a technology fee, but provides a grant to cover the technology fee for students using DoD tuition assistance programs. When applicable, APUS students are charged certain additional fees, such as graduation, late registration, transcript request, and comprehensive examination fees.
DoD tuition assistance programs cover $250 per credit hour for military students, and these students may also be able to use VA education benefits or aid from ED’s Title IV programs to cover any remaining cost, as described more fully below in “Sources of Student Financing”
and
“Regulatory Environment - Student Financing Sources and Related Regulations/Requirements.” APUS has set its tuition grant so that the DoD tuition assistance program covers the full tuition cost of undergraduate and graduate courses for members of the military up to the annual maximum benefit.
12
Sources of Student Financing
APUS’s students finance their education through a combination of individual resources, DoD tuition assistance programs, ED’s Title IV programs, VA education benefits, private loans, state and federal grants, and corporate reimbursement programs. Most students rely on some form of financial aid in addition to their individual resources. Students utilizing DoD’s tuition assistance programs accounted for 39%, those utilizing ED’s Title IV programs 25%, and those using VA education benefits 23% of APUS’s net course registrations in 2019. We believe that the ability of our students to participate in these programs is essential to APUS’s success. Participation in the DoD tuition assistance programs, ED’s Title IV programs and VA education benefits add to APUS’s regulatory burden, as described more fully below in “Regulatory Environment - Student Financing Sources and Related Regulations/Requirements.”
Federal legislative activity, including government shutdowns and other budgetary actions, as well as actions by ED and DoD, may adversely impact the ability of our students to obtain loans, grants, and other forms of tuition financing. Such actions could include eliminating various education and loan programs, reducing the funds or benefits (or both) available under those programs, or enacting new restrictions on participation in those programs. Any such changes, or any other reductions in or restrictions on funding for such programs, could have a material adverse effect on APUS’s enrollments and our financial condition. The potential risks associated with these and similar events are described more fully below in “Risk Factors - Risks Related to Our Business.”
Faculty and Staff
APUS’s faculty consists of approximately
1,780
full and part-time faculty members with relevant teaching and practitioner experience. The institution also employs professional staff of approximately
860
non-faculty APUS and APEI employees to administer APUS’s academic, technology, service, and business operations. Most of APUS’s non-faculty employees are based at either its headquarters in Charles Town, West Virginia, or at its administrative offices in Manassas, Virginia. None of APUS’s employees are parties to any collective bargaining arrangement. We believe that APUS has a good relationship with its employees.
APUS has approximately
340
full-time faculty members with the remainder designated as part-time. APUS establishes full-time and part-time positions based on program and course enrollment. Many of APUS’s full-time faculty began their careers with APUS as part-time faculty. We expect that APUS’s faculty headcount and the composition of full-time and part-time faculty will vary with fluctuations in enrollment.
We believe that APUS’s well-regarded faculty, which includes many former and current practitioners in their fields, attracts new students to APUS. A significant majority of APUS’s graduate faculty members hold terminal degrees or doctorates in their relevant fields, and virtually all undergraduate faculty members hold graduate degrees. Exceptions have been granted for a limited number of APUS’s faculty members who do not meet degree standards and who provide evidence of significant experience and achievement in the field of study that they teach, in accordance with APUS’s faculty quality guidelines. Many APUS faculty members have relevant experience at other universities and within military, corporate, and government institutions.
We believe that the quality of APUS’s faculty is critical to the student experience and student outcomes and is therefore vital to APUS’s success. APUS regularly reviews the performance of its faculty by, among other things, monitoring the online contact that faculty have with students, reviewing student feedback, and evaluating the learning outcomes achieved by students. If APUS determines that a faculty member is not performing at an acceptable level, it works with the faculty member to improve performance by assigning the faculty member a mentor, providing additional training and/or coaching the faculty member for success. If the faculty member’s performance does not improve, APUS will no longer employ that faculty member to teach. APUS does not offer tenure to faculty members.
We believe that the composition of APUS’s student body and curriculum are particularly attractive to potential faculty members because of the opportunity to teach relevant material to students who can implement higher education learning at their workplaces. APUS recruits faculty members through referrals by current faculty members, advertisements in higher education and trade association journals and its internet presence. Upon selection for a position, APUS requires each new faculty member to complete an orientation and training program that leads to their certification to teach at APUS and assignment to courses. All faculty members participate in annual faculty-development opportunities and requirements.
13
Intellectual Property
APUS owns and exercises rights associated with patents, copyrights, trademarks, service marks, domain names, agreements, and registrations to protect its intellectual property. APUS owns all course syllabi and course and instructional materials developed by APUS faculty and employees and, as such, these course materials may be used by APUS in current and future courses as needed to facilitate instruction, and may be modified by APUS to meet evolving course or curriculum requirements. In general, APUS does not assert ownership claims to scholarly works of its faculty, such as articles and books, which were not developed as APUS course materials. Such intellectual property of APUS’s individual faculty members remains the property of each such faculty member and is reserved specifically for use only by the faculty member who owns it, unless the faculty member grants permission for use by others. APUS relies on agreements under which it obtains rights to use course content developed by faculty members and other third-party content providers. APUS owns the copyright for a work by a faculty member if APUS compensated the faculty member for the particular product or if APUS funded the research in whole or in part.
APUS has secured rights to trademarks for various names and terms used in its business, including “American Public University System,” “American Military University,” “American Public University” and logos incorporating the foregoing terms and acronyms of those terms, as well as “Ready When You Are,” “Educating Those Who Serve,” “RESPECTED. AFFORDABLE. ONLINE.,” “COMMITTED TO YOUR FUTURE,” “MASTERS OF DISASTER,” “MOMENTUM,” “MyMomentum” and the term “Partnership At a Distance.” These trademarks and brand names are central to a number of APUS’s marketing efforts and we believe they are important to how prospective students identify APUS. APUS also owns rights to more than 200 internet domain names pertaining to APEI, APUS, AMU, APU and other unique descriptors.
Hondros College of Nursing
HCN’s programs are designed to prepare individuals for productive careers in the field of nursing. HCN’s students principally receive on-campus instruction at one of HCN’s Ohio campuses. In 2019, HCN had five campuses, which are located in the suburban areas of Cincinnati, Cleveland, Columbus, Dayton, and Toledo, and an administrative office located in suburban Columbus. HCN has also obtained or is in the process of obtaining all necessary approvals to offer postsecondary nursing education programs in connection with a new campus in Indianapolis, Indiana beginning in the second quarter of 2020, initially in the PN Program. Growth beyond an initial cohort of up to 30 students for the first year is subject to HCN’s ability to petition to increase the number of admissions after a site visit that will occur upon graduation of the first cohort. HCN is institutionally accredited by ABHES.
Curriculum and Scheduling
HCN offers on-campus instruction leading to a Diploma in PN and an ADN. Graduates of the PN Program are eligible to seek licensure as a Licensed Practical Nurse, or LPN, after passing the NCLEX-PN exam. Graduates of the ADN Program are eligible to seek licensure as a Registered Nurse, or RN, after passing the NCLEX-RN exam.
HCN voluntarily discontinued new enrollments in its online Registered Nurse to Bachelor of Science in Nursing, or RN-to-BSN, program after the start of the July 2018 term. A teach-out of the remaining students in the program was completed in December 2019 and HCN notified CCNE and the Ohio State Board in February 2020 that it had completed the teach-out and would enroll no new students in the RN-to-BSN program. In April 2019, HCN began offering courses in a Medical Laboratory Technician program, or MLT Program, at its Cincinnati and Columbus campuses. Due to low enrollment, HCN ceased enrolling new students and offered MLT Program students the opportunity to transfer to HCN’s other programs.
Academic terms for the PN and ADN Programs begin four times each year, with courses starting in January, April, July, and October. Approximately 65% of enrollments for the fiscal year ended December 31, 2019 were in the PN Program, while 35% were in the ADN Program.
Student Body and Enrollment
HCN provides nursing education to approximately
1,600
students at five campuses in Ohio. The average HCN student is 30 years old and 92% of HCN students are female.
Accreditation
14
HCN is institutionally accredited by ABHES, a national accrediting agency that is recognized by ED. ABHES informed HCN in February 2020 that based on review of the visit report from its recently completed unannounced visit to HCN’s Columbus campus, the response to the report, and ABHES program approval information, it had acted to affirm the institution’s accreditation, which continues through February 28, 2021. The next comprehensive evaluation for renewal of accreditation, which will include HCN’s submission of evidence related to its compliance with ABHES standards and a series of site visits, is scheduled for April 2020. For additional information related to HCN’s accreditation, including a discussion of recent correspondence from ABHES related to retention and placement rates at HCN, refer to “Regulatory Environment - Accreditation.”
HCN’s PN Program received its initial programmatic accreditation through NLN CNEA, with quality improvement conditions, from October 18, 2018 through October 31, 2024. On January 29, 2019, HCN submitted a required progress report to NLN CNEA addressing certain quality indicators. NLN CNEA may accept the report or take certain follow-up actions, such as request additional information or conduct a site visit.
Student Recruitment and Marketing
HCN’s marketing strategy is focused on building long-term relationships with businesses, organizations, and individuals in the healthcare community, primarily in Ohio and Indiana. We believe this strategy will continue to generate a significant number of referrals. In addition, HCN utilizes traditional media as well as digital marketing channels, including organic and paid search marketing.
Student Admissions
HCN welcomes prospective students to apply for admission at any time by submitting an application along with an application fee. To be accepted into any HCN program, an applicant must be a U.S. citizen or permanent resident, be at least 18 years old at the time of starting the program, and hold a high school diploma or General Education Development certificate. HCN’s programs also have program-specific admissions requirements.
Applicants for the PN Program and the ADN Program are required to complete an interview with an admissions representative, and complete and pass a criminal background check. PN Program applicants are also generally required to take and pass the Health Education Systems Admissions Assessment. In October 2019, HCN began offering a new Direct Entry ADN option that offers an accelerated graduation pathway for students who transfer at least 32 college credits to HCN and meet certain academic and entrance exam requirements. Portions of the PN and ADN Programs are online.
Beginning with the term that started in January 2019, HCN implemented enhanced ADN Program admissions requirements, requiring external ADN applicants to have an active unencumbered PN license and to have graduated from an approved PN program. All ADN applicants must take math and reading entrance exams. Applicants that do not meet the minimum placement scores may be required to take additional reading and math prerequisites or denied admission. ADN Program applicants who apply to start in the quarter immediately following their graduation from HCN’s PN Program may be admitted prior to possessing an active unencumbered PN license, but must obtain an active unencumbered PN license prior to the start of their second term. Beginning with the April 2019 term, HCN further changed its admissions standards to remove certain entrance exam requirements.
HCN has also made multiple changes to the assessment process since its original implementation and may further modify it in the future in order to better identify college-ready students. These initiatives require significant time, energy, and resources, and if our efforts are not successful, they may adversely impact our results of operations, cash flows, and financial condition. While we believe changes in admissions and academic achievement requirements are beneficial for our students and will result in a better and more positive educational experience and improved testing pass rates in the long term, we believe some of the changes have contributed to a decline in enrollment and have had a negative impact on our results of operations. While we work on identifying an appropriate balance of admissions requirements, academic achievement requirements and attracting appropriate students, there may continue to be a negative impact on enrollments at HCN. Even if these initiatives lead to the identification and enrollment of students who are likely to succeed and improve the student experience, they could result in adverse impacts on HCN enrollments.
Cost of Attendance and Financial Aid
HCN’s tuition costs vary among its programs. HCN’s PN Program may be completed for approximately $19,750 in tuition and fees and the ADN Program may be completed for approximately $28,500 in tuition and fees. Fees include the cost of
15
examination review materials, lab fees, test review fees, and fees for applications with OBN, among others. Some of these costs are payable to HCN and others are payable to third parties.
HCN’s students also incur costs for textbooks, supplies, uniforms and its technology package. These costs vary among HCN’s programs and are paid for by HCN’s students as the textbooks or supplies are needed. HCN estimates that over the life of its programs a student’s costs related to textbooks and supplies will be approximately $2,200 for the PN Program and $3,800 for the ADN Program.
Sources of Student Financing
HCN’s students finance their education through a combination of individual resources, VA education benefits, ED’s Title IV programs, private loans, state and federal grants, corporate reimbursement programs, and HCN’s extended payment plan options. Most HCN students rely on some form of financial aid in addition to their individual resources. The substantial majority of HCN’s revenue is derived from students utilizing ED’s Title IV programs, which results in increased regulatory scrutiny, as discussed more fully below in “Regulatory Environment - Student Financing Sources and Related Regulations/Requirements - Department of Education - Regulation of Title IV Financial Aid Programs - The ‘90/10 Rule.’” As a result, HCN’s management may find it necessary to decrease HCN’s enrollment of students utilizing the Title IV programs or pursue other approaches, any of which could have a negative impact on its operating results and financial condition.
HCN offers extended payment plan options to its students, including an additional extended payment program newly available for the term beginning in January 2020. The extended payment plan options are designed to assist students with educational costs consisting of tuition, textbooks, and fees, and are only available after all other student financial assistance has been applied to those costs. Payment plans require monthly payments while the student is enrolled in a program and extend for a period up to six months after the last day of attendance or graduation. To the extent interest is applied, it is generally fixed and does not accrue until the student departs the program or graduates. The extended payment plans do not impose any origination fees. Participants are advised about the terms of the extended payment plans and counseled to use all federal funding options.
In November 2019, HCN entered into a memorandum of understanding, or MOU, to participate in the DoD tuition assistance program and is therefore subject to such program’s requirements and restrictions. The MOU and these requirements and restrictions are more fully discussed in the “Regulatory Environment - Student Financing Sources and Related Regulations/Requirements” and “Risk Factors” sections of this Annual Report.
In addition, beginning January 1, 2020, HCN began offering an institutional grant to students demonstrating financial need to cover the difference between the total cost of tuition and fees less the amount of all eligible financial aid resources. The grant is designed to limit a student’s monthly payment to $200 through an award of up to $200 per month or $600 per term after consideration of financial aid, employer tuition reimbursement, and other financial resources.
Faculty and Staff
HCN
’s faculty consists of approximately
130
faculty members with relevant teaching and nursing or healthcare practitioner experience. HCN also employs approximately
110
professional staff members who administer HCN’s academic, technology, service, and business operations. HCN’s faculty and staff largely work at one of its five campuses. None of HCN’s employees are party to any collective bargaining arrangement. We believe that HCN has a good relationship with its employees.
HCN has approximately
100
full-time faculty members with the remainder designated as part-time. All faculty whose instruction is focused within the PN Program must have earned the minimum of a bachelor’s degree in nursing. All faculty whose instruction is focused within the ADN Program must have earned the minimum of a master’s degree. All HCN faculty whose instruction is nursing theory-based must have an active license to practice as a Registered Nurse. In addition to the formal education of HCN’s faculty members, many have also obtained specialized certifications in the field of nursing.
We believe that selecting well-educated and qualified faculty members is a key component to HCN’s success. In addition to having the necessary educational requirements, HCN seeks faculty members who have demonstrated experience in the field of nursing. Almost all faculty who teach HCN’s nursing courses have nursing experience in a clinical setting, which we believe helps teach HCN’s students the skills needed to be effective and safe caregivers.
16
HCN trains and develops new faculty through a formal, structured on-boarding, training, and mentoring program. All new HCN faculty members receive a 90-day on-boarding experience, which includes a formal orientation to the organization, policies and procedures, teaching strategies, performance expectations, and role responsibilities.
Intellectual Property
In connection with our acquisition of HCN, we received the right to the corporate name National Education Seminars, Inc. and a royalty-free, irrevocable, exclusive, transferable, sublicensable license to use the name “Hondros College of Nursing” and, instead of “Nursing,” any other qualifier directly related to nursing, medicine, or healthcare in connection with the business and operations of HCN.
HCN exercises rights associated with copyrights, trademarks, service marks, domain names, agreements, and registrations to protect its intellectual property.
Information Technology
Information technology systems are an essential part of our student experience and our business operations. As part of our implementation of the shared services model discussed in “Reporting Segments” above, we began providing information technology services to APUS and HCN through APEI. Previously, APUS had managed its own information technology infrastructure and services and provided information technology services to HCN through an intercompany arrangement. We believe we will need to continue, and potentially increase, our investment of capital, time, and resources in technology operations and enhancements to support our systems and mission.
We continue to make investments in information technology. We recently embarked on a multi-year technology transformation program in an effort to enable APUS to better accommodate new flexible learning modalities, improve the operational effectiveness of our enterprise, and enhance the learning experience for students and faculty.
|
•
|
The first cohort of students began studies on APUS’ new learning management system in March 2020
|
|
•
|
In January 2020, APUS signed a contract to consolidate its customer relationship management systems onto a single platform.
|
|
•
|
We are actively evaluating migration of key applications, systems and data to the cloud rather than in our own co-located data centers.
|
Our legacy systems include a customized student information and services system that we refer to as Partnership At a Distance™, or PAD, and proprietary information systems and processes to support PAD, into which we have invested significant capital and resources. PAD is APUS’s platform for interacting with our students. PAD is an information system designed to enable APUS to provide each student with individualized support at appropriate times from pre-enrollment through and beyond graduation, including student advising, administrative support, and community networking. PAD is used by APUS to manage admissions, online orientation, course registrations, tuition payments, grade reporting, progress toward degrees, and various other functions. We continually evaluate PAD for possible changes and upgrades.
APUS and HCN use Sakai Collaboration and Learning Environment, or Sakai CLE, an open-source learning management system, for their online classroom to support teaching, learning, research, and collaboration. We intend to replace Sakai as our learning management system in 2020. PAD and Sakai CLE are our two core enterprise systems. We also have several other systems that are used in the online campus, and to support the student experience, financial aid processing, financial management, human resources processes, marketing, and decision support.
The backbone of our information technology infrastructure consists of two co-location data centers: one in Virginia, and one in Texas. Our technology environment is managed internally. Student access to our systems is provided through redundant data carriers in both data centers.
Our continued investment in our institutions’ information technology may place a strain on resources that could adversely affect our systems, controls, and operating efficiency, and those of our institutions, and as a result of unsuccessful development efforts, or a result of replacing outdated technology, software or other technology related assets, we may have assets that become impaired. In addition, as a result of our reliance on information technology, system disruptions and security breaches could adversely affect our reputation and our operations. For additional information regarding risks related to our information technology, refer to “Risk Factors - Risks Related to Our Technology Infrastructure.”
17
For more information on these investments and their effects on our results of operations, refer to “Management’s Discussion and Analysis of Financial Condition and Results of Operations - Overview.”
Information About our Executive Officers
Set forth below is certain information concerning our executive officers serving as of the date of this Annual Report.
|
Name
|
|
Age
|
|
Position
|
|
Angela Selden
|
54
|
President and Chief Executive Officer
|
||
|
Dr. Wallace E. Boston
|
|
65
|
|
President of APUS
|
|
Richard W. Sunderland, Jr., CPA
|
59
|
Executive Vice President, Chief Financial Officer
|
||
|
Patrik U. Dyberg
|
55
|
Executive Vice President, Chief Technology Officer
|
||
|
Thomas A. Beckett
|
52
|
Senior Vice President, General Counsel and Secretary
|
||
|
Amy Bevilacqua
|
53
|
Senior Vice President, Chief Innovation Officer
|
||
|
Robert E. Gay
|
59
|
Senior Vice President, Chief Operations Officer, APUS
|
||
|
Elizabeth LaGuardia Cooper
|
47
|
Senior Vice President, Chief Marketing Officer
|
||
|
Dr. Vernon C. Smith
|
55
|
Senior Vice President, Provost, APUS
|
||
Angela Selden
joined us in September 2019 as President and Chief Executive Officer and a member of our Board of Directors. Prior to joining us, Ms. Selden served as Chief Executive Officer of DIGARC, LLC, an education technology provider to higher education institutions, since October 2016. From July 2015 until April 2016, Ms. Selden was Interim Chief Executive Officer of Skybridge Americas, a global contact center and provider of fulfillment solutions, and served as a member of its board of directors from July 2015 through December 2018. Prior to Skybridge Americas, Ms. Selden served as Chief Executive Officer of Workforce Insight, LLC, a global provider of strategic workforce management, from April 2014 to April 2015, after Workforce Insight’s acquisition by Baird Capital Partners, where Ms. Selden served as Executive in Residence from 2013 to 2014 and participated in the acquisition of Workforce Insight. Prior to her role at Baird, Ms. Selden served as Chief Executive Officer and Executive Co-Chairman of Arise Virtual Solutions, Inc., a virtual workforce solutions outsourcer. Earlier in her career, Ms. Selden spent 18 years at Accenture, including serving as the Managing Partner, leading Accenture’s North American West Consumer and Industrial Products group to significant growth.
Dr. Wallace E. Boston
joined us in September 2002 as Executive Vice President and Chief Financial Officer of APUS. From June 2004 through September 2019, Dr. Boston served as APEI President and Chief Executive Officer, and since October 2017, Dr. Boston has served as President of APUS. Dr. Boston will continue to serve as President of APUS through June 30, 2020 when he plans to retire. Dr. Boston previously served as President and Chief Executive Officer of APUS from June 2004 to July 2016. Dr. Boston has served on our Board and as a Trustee of APUS since June 2004. From 2001 to 2002, Dr. Boston served as Chief Financial Officer of Sun Healthcare Group. From 1998 to2001, Dr. Boston served as Chief Operating Officer and, later, President of NeighborCare, Inc. From 1993 to 1998, Dr. Boston served as Vice President of Finance and later, Senior Vice President of Acquisitions and Development of Manor Healthcare Corporation (now HCR ManorCare). From 1985 to 1992, Dr. Boston served as Chief Financial Officer of Meridian Healthcare.
Richard W. Sunderland, Jr., CPA
joined us in February 2011 as a consultant and became Senior Vice President of Finance of APUS in December 2012. Effective January 1, 2014, Mr. Sunderland was appointed Executive Vice President and Chief Financial Officer of APEI. Prior to joining APUS, Mr. Sunderland served as the Chief Financial Officer of NovaSom, Inc. from 2008 to 2010. In addition, Mr. Sunderland served as Chief Financial Officer of Active Day, Inc. between 2005 and 2008, and in various roles, including as Controller, Senior Vice President and Chief Financial Officer, of NeighborCare, Inc. from 1993 to 2004.
Patrik U. Dyberg
joined us in May 2018 as Executive Vice President and Chief Technology Officer, having previously served as interim Chief Information Officer in a consulting capacity from mid-December 2017. Mr. Dyberg was previously a Principal with The WGroup, an information technology management consulting firm, from August 2017 to April 2018 and Managing Director for custom software development company Luxoft Holding, Inc. from December 2015 to February 2017. Mr. Dyberg also served as Executive Vice President and Chief Technology Officer of publishing company John Wiley & Sons, Inc. from February 2012 to August 2015, Senior Vice President of Global Solutions Development at LexisNexis Group Inc. from 2009 through 2011, and Chief Information Officer in the Business Information Group of The McGraw-Hill Companies from 2005 through 2009.
18
Thomas A. Beckett
joined us in April 2011 as Director, Legal Affairs for APUS, in January 2012 became Vice President, Legal Affairs, and since January 2016, has served as Senior Vice President and General Counsel for APEI and APUS, and Secretary since June 2016 for APEI. Prior to joining APUS, Mr. Beckett was the General Counsel and Chief Operating Officer of HealthSport, Inc. and its wholly-owned subsidiary, InnoZen, Inc. (now CURE Pharmaceutical) from 2007 to 2010. In addition, from 2004 to 2010, Mr. Beckett held various leadership positions at HealthSport and InnoZen. Prior to this, Mr. Beckett was an associate at King & Spalding LLP and Holland & Knight LLP. Mr. Beckett began his career as a banking officer with First Union National Bank. Mr. Beckett is on the board of directors of Shenandoah Telecommunications Company, a wireless telephone and cable services company.
Amy Bevilacqua
joined us in May 2016 as Senior Vice President and Chief Innovation Officer. Ms. Bevilacqua previously founded and served as Managing Director of Bevilacqua Advisors LLC, an education equity investment advisory firm, from 2010 to 2014 and from October 2015 to April 2016. Additionally, Ms. Bevilacqua served as President of National Education Initiative from 2014 to September 2015. Ms. Bevilacqua has also served as an Adjunct Instructor at University of Pennsylvania and as a member of multiple education focused councils and alumni boards. Earlier in her career, Ms. Bevilacqua served as a Senior Director for Public Broadcasting Service, Chief Marketing Officer for an early learning company and led the global rollout of a SaaS solution for McCann Worldgroup, the world’s largest network of advertising agencies. Ms. Bevilacqua also served as General Manager for Films Media Group, a portfolio company for the private equity firm KKR, shepherding its sale to a strategic buyer, and was a Principal Consultant for PricewaterhouseCoopers’ entertainment and media consulting practice.
Robert E. Gay
joined APUS in December 2016 as Senior Vice President and Chief Operations Officer of APUS. Prior to joining APUS, Mr. Gay was a Senior Vice President at Maguire Associates, a research-based consulting firm serving educational institutions, from 2011 to November 2016. Mr. Gay previously served as Vice President of Enrollment at The New School from 2008 to 2012, Executive Vice President of Operations and Enrollment Management at Cardean Learning Group from 2005 to 2007, and as the first Vice President of Enrollment Management at the University of Maryland University College from 2003 to 2005. Prior to entering higher education, Mr. Gay spent 17 years in the communications industry, serving in various senior management positions with MCI Communications Corp., LCC International, Inc. and Solectron Global Services.
Elizabeth LaGuardia Cooper
joined us in November 2003 as Vice President, Marketing of APUS, and became Senior Vice President and Chief Marketing Officer of APUS in December 2017. Since January 2019, Ms. Cooper has served as Senior Vice President and Chief Marketing Officer of APEI. Prior to joining APUS, Ms. Cooper was a Product Manager for NICE Systems, Inc., an enterprise software solutions company, from 2001 to 2003. Prior to this, Ms. Cooper held various leadership positions at KeyBridge Corporation, LifeMinders, Inc. and Locus Direct Marketing Group from 1999 to 2001. Ms. Cooper also served as an Associate Promotion Manager from 1995 to 1999 at the United States Chamber of Commerce.
Dr. Vernon C. Smith
joined APUS in November 2016 as Senior Vice President and Provost. Prior to joining APUS, Dr. Smith was Vice Provost of distributed learning and Associate Professor of Practice at the Gladys L. Benerd School of Education for the University of the Pacific from June 2014 to October 2016.Dr. Smith served as founding Chief Academic Officer and Provost at MyCollege Foundation, where he oversaw the successful launch of Portmont College at Mount St. Mary's, Los Angeles (now MSMU Online), from 2012 to 2014 and previously served as Vice President of Academic Affairs at Rio Salado College from 2009 through 2012. Dr. Smith previously also held various positions at Northern Arizona University and Rio Salado College.
REGULATORY ENVIRONMENT
In the United States, postsecondary education institutions are regulated by (i) accrediting agencies, (ii) state regulatory bodies, and (iii) the federal government through the U.S. Department of Education, or ED. APUS and HCN are approved to participate in military tuition assistance programs administered by the U.S. Department of Defense, or DoD, and veterans’ education benefits programs administered by the U.S. Department of Veterans Affairs, or VA, and our institutions are therefore also subject to oversight by those agencies. Regulations, standards, and policies of these agencies address the vast majority of our operations, including our educational programs, facilities, instructional and administrative staff, administrative procedures, marketing, recruiting, and financial operations and condition.
The postsecondary education regulatory environment is complex and continues to evolve. Changes in or new interpretations of law, regulations, standards, and policies could have material consequences for our institutions’ accreditation, authorization to operate in various states, permissible activities, receipt of funds under student financial assistance programs, and costs of doing business. The postsecondary education regulatory environment has changed and may change in the future as a result of U.S. federal elections. For example, ED, under new leadership, acted in 2017 to delay the implementation of certain
19
regulations promulgated during the prior administration. In the meantime, ED also has initiated new rulemaking processes to alter and in some cases rescind existing regulations and could act to change other existing ED policies and practices. The relevant committees in Congress have held hearings and considered various policy and legislative proposals related to reauthorization of the Higher Education Act of 1964, as amended, or the HEA. We cannot predict the extent to which the Executive Branch and Congress will act to reauthorize the HEA or change or eliminate ED regulations, policies, and practices, nor can we predict the form that new legislation, regulations, policies, or practices may take.
Accreditation
Accreditation is a voluntary, non-governmental process through which an institution or a program submits to review based on the standards of the accrediting agency and the stated aims and purposes of the institution or program. Accrediting agencies establish criteria for accreditation, conduct peer-review evaluations, and publicly recognize those institutions or programs that meet the stated criteria. Accredited institutions and programs are subject to periodic review to ensure institutional and program integrity, to encourage continued high performance and improvement, and to confirm that accreditation criteria continue to be satisfied. An institution or program that does not meet the criteria may have its accreditation limited, revoked, or not renewed.
Accreditation by an accrediting agency recognized by ED is necessary to participate in the student financial aid programs authorized under Title IV of the HEA, or Title IV programs, and the DoD tuition assistance programs. To be recognized by ED, accrediting agencies must adopt specific standards and procedures. The National Advisory Committee on Institutional Quality and Integrity, or NACIQI, is charged with advising ED on whether to recognize accrediting agencies. In 2016, NACIQI voted to recommend that ED renew ABHES’s recognition for five years and in February 2018, NACIQI voted to recommend that ED renew HLC’s recognition for five years. If one of our institutions’ institutional accreditors was to lose its recognition as an accrediting agency and the institution was unable to obtain recognition from another recognized accrediting agency, the institution could lose its eligibility to participate in Title IV programs and DoD tuition assistance programs.
In October 2018, ED announced that it would establish a negotiated rulemaking committee broadly focused on accreditation and innovation, or the Accreditation and Innovation Committee, to prepare proposed regulations related to, among other things, ED’s recognition of accrediting agencies and related institutional eligibility issues. On November 1, 2019, ED published final regulations, portions of which relating to accreditation generally will be effective on July 1, 2020. The final regulations revise ED’s process for recognition and review of accrediting agencies and the criteria used by ED to recognize accrediting agencies. The regulations also revise ED’s requirements for oversight of accredited institutions and programs by generally providing accrediting agencies with greater autonomy and flexibility.
Additional information about each of our institutions’ accreditation is provided above in each reporting segment’s “Our Institutions - Accreditation” section and as follows:
|
•
|
APUS is institutionally accredited by The Higher Learning Commission, or HLC, a regional accrediting agency recognized by ED. HLC accredits degree-granting institutions in a 19-state region, including West Virginia. HLC most recently reaffirmed the accreditation status of APUS in July 2011. The next comprehensive evaluation for reaffirmation of accreditation is scheduled for the 2020-2021 academic year.
|
In August 2016, HLC adopted a policy that permits HLC to designate publicly an institution as “in financial distress” or “under governmental investigation” where such situations could impact the institution’s operations and HLC believes the public should have this information in making a decision to attend or continue to attend the institution. A designated institution must undergo special monitoring, and HLC may deny or defer an application from such an institution to make substantive changes in its business. A designation typically will extend for not more than two years and may be removed when HLC determines the institution has resolved the issues that led to the designation. In February 2018, HLC imposed a “governmental investigation” designation on APUS in connection with a Civil Investigative Demand, or CID, issued to APUS in July 2017 by the Attorney General of Massachusetts, which is discussed more fully below in this section in “Consumer Protection.” In August 2018, APUS notified HLC that the Commonwealth of Massachusetts and APUS voluntarily entered into an Assurance of Discontinuance, or AOD, to resolve the CID, and HLC notified APUS that in light of the AOD, HLC had removed the designation.
In November 2018, HLC approved APUS’s application for a change in structure related to APUS’s proposal to enter into a shared services model with APEI, and we entered into an intercompany agreement to implement the shared services model. As required by HLC policy and ED regulation, HLC conducted a focused site visit in May 2019. The site visit team found that evidence of compliance with the commitments APUS made in its application and with HLC’s Eligibility Requirements and Criteria for Accreditation was sufficiently demonstrated and no further follow up was
20
recommended. In August 2019, HLC notified APUS that HLC’s Institutional Actions Council, which conducts reviews and takes action on accreditation recommendations, concurred with the site visit team’s findings.
In connection with a routine mid-cycle review of APUS, HLC required APUS to submit an interim report on leadership of APEI and APUS. APUS timely submitted the report in April 2019. HLC accepted the first interim report and requested that APUS submit a second interim report, which APUS timely submitted in November 2019.
|
•
|
Hondros College of Nursing, or HCN, is institutionally accredited by the Accrediting Bureau of Health Education Schools, or ABHES, a national accrediting agency recognized by ED. In June 2018, ABHES granted HCN initial institutional accreditation through February 28, 2021. At that time, HCN was accredited by the Accrediting Council of Independent Colleges and Schools, or ACICS. In September 2018, ED approved HCN’s application to designate ABHES, rather than ACICS, as its institutional accrediting agency for purposes of participation in the Title IV programs. On October 1, 2018, HCN voluntarily withdrew from ACICS accreditation. The next comprehensive evaluation for renewal of ABHES accreditation, which will include HCN’s submission of evidence related to its compliance with ABHES standards and a series of site visits, is scheduled for April 2020.
|
ABHES annually reviews student achievement indicators, including retention rate, placement rate, and licensing and credentialing examination pass rate. Under ABHES policy, ABHES may withdraw accreditation at any time if it determines that an institution fails to demonstrate at least a 70% retention rate for each program, a 70% placement rate for each program, and a 70% pass rate on mandatory licensing and credentialing examinations, or fails to meet the state-mandated results for credentialing or licensure. Alternatively, ABHES may in its discretion provide an opportunity for a program to come into compliance within a period of time specified by ABHES, and ABHES may extend the period for achieving compliance if a program demonstrates improvement over time or other good cause. For the reporting year ended June 30, 2018, several HCN programs did not satisfy ABHES’s threshold requirements for retention rates or placement rates. As a result, in February 2019, ABHES directed HCN to provide evidence to ABHES that the relevant programs had achieved a retention rate of at least 70% for the period from July 1, 2018 through March 31, 2019 and a placement rate of at least 70% for the reporting year ended June 30, 2018, along with additional documentation and analysis related to those rates and pertinent action plans. HCN timely submitted the required progress report. For the reporting year ended June 30, 2019, each of HCN’s programs at each of HCN’s campuses satisfied ABHES’s placement rate requirements but failed to satisfy ABHES’s threshold requirements for retention rates.
In August 2019, ABHES notified HCN that ABHES had placed HCN’s Cleveland, Columbus, Dayton, and Toledo locations on outcomes reporting status, which requires submission of additional documentation regarding student outcomes and action plans for improving these outcomes. Based on the data submitted in response to ABHES’ request, ABHES determined that the PN Program at each of the Columbus, Dayton, and Toledo campuses did not satisfy ABHES’s retention rate requirement and that it was unable to verify that the ADN Program at each of the Cleveland and Toledo campuses had met ABHES’s placement rate requirement. ABHES directed HCN to submit certain documentation concerning the updated retention or placement rate, as applicable, for the reporting year ended June 30, 2019, and information about HCN’s action plan to achieve compliance if the updated rate was below 70%. HCN timely submitted the required documentation and action plans. ABHES notified HCN that the relevant programs at the Cleveland, Dayton, and Toledo campuses must come into compliance by May 1, 2020 and that the PN Program at the Columbus campus must come into compliance by May 1, 2021. In October 2019, HCN notified ABHES that the PN Programs at each of the Dayton, Toledo, and Columbus campuses failed to satisfy ABHES’s threshold requirements for retention rates for the reporting year ended June 30, 2019.
In February 2020, ABHES notified HCN that it had taken additional actions with respect to certain HCN programs at certain locations related to those programs’ performance in relation to ABHES student achievement indicators. Specifically, ABHES: (i) placed the PN programs at the Dayton and Toledo campuses on program specific warning status because the programs have failed to meet the 70% retention rate threshold since HCN’s 2017-2018 annual report and informed HCN that those programs must meet the retention rate threshold by May 1, 2020; (ii) removed the ADN programs at the Cleveland and Toledo campuses from outcomes reporting status after placement rates for those programs at those locations met the 70% compliance threshold; (iii) continued outcomes reporting status for the PN program at the Columbus campus because it has not met the retention rate compliance threshold and reconfirmed that it has until May 1, 2021 to do so; and (iv) directed HCN to provide evidence to ABHES that the ADN programs at each of the Columbus, Cleveland, Cincinnati, Dayton, and Toledo campuses and the PN programs at the Cleveland and Cincinnati campuses met the retention rate compliance threshold for the period from July 1, 2019 through March 31, 2020 and informed HCN that those programs must meet the compliance threshold by May 1, 2021. There can be no assurance that HCN will be able to demonstrate compliance by the relevant deadlines in all cases.
21
If HCN is unable to bring the programs into compliance during the timeframe established by ABHES, unless such timeframe is extended for good cause, ABHES may take other action, up to and including withdrawing accreditation for those programs. In addition, adverse actions taken by ABHES may trigger reporting requirements and ED action under ED’s Borrower Defense Regulations, see “Regulatory Environment - Student Financing Sources and Related Regulations/Requirements - Department of Education - Regulation of Title IV Financial Aid Programs - Borrower Defenses.”
Institutional accreditation is an important attribute of our institutions. Colleges and universities depend in part on accreditation in evaluating transfers of credit and applications to graduate schools. Students and sponsors of tuition reimbursement programs look to accreditation for quality assurance, and employers rely on institutions’ accreditation status when evaluating a candidate’s credentials. In addition, the loss of institutional accreditation would result in the loss of eligibility to participate in Title IV programs and DoD tuition assistance programs.
In addition to institutional accreditation, our institutions have obtained specialized accreditation or professional recognition for certain programs, as described more fully above in each reporting segment’s section under “Our Institutions” entitled “Accreditation.” If one of our institutions fails to satisfy the standards of these specialized accrediting agencies or professional organizations, the relevant programs could lose the specialized accreditation or professional recognition, which could result in materially reduced student enrollments in those programs, prevent the institution from offering the programs in certain states where programmatic accreditation is required, or prevent our students from seeking and obtaining licensure or employment.
State Licensure/Authorization
Our institutions are subject to regulation by the states in which they operate. The level of oversight varies from state to state, and such regulations change frequently. State laws typically establish standards for instruction, faculty qualifications, administrative procedures, marketing, recruiting, financial operations, and other operational matters. Some states prescribe regulations related to an institution’s financial condition, and some states require the posting of surety bonds. State laws and regulations may affect our institutions’ ability to offer educational programs, open locations, and award degrees. If one of our institutions fails to comply with a state’s requirements, it may lose its state licensure or authorization, which would result in the institution’s inability to enroll students in that state, and could result in the institution’s inability to receive Title IV program funds and DoD tuition assistance funds, at least for students in that state.
Some states assert authority to regulate an institution if its educational programs are offered to residents of those states, regardless of whether the institution maintains a physical presence in the state. The increased popularity of online education has led and may further lead to new laws and regulations and new interpretations of existing laws and regulations. New laws, regulations, or interpretations could increase our cost of doing business and affect our ability to recruit students in particular states, which could negatively affect enrollments and revenue and have a material adverse effect on our business. Changes in our business activities could lead states that do not currently require our institutions to be authorized to require such authorization. The extent of this increase in regulatory obligations, and the associated costs and significance, are not known at this time. Furthermore, in some states it may take a significant amount of time to meet the applicable regulatory requirements with respect to a new program initiative, or we may not be able to do so at all.
The State Authorization Reciprocity Agreement, or SARA, is a voluntary agreement among member states, districts, and territories that establishes national standards for interstate offering of postsecondary distance education and is intended to make it easier for students to take online courses offered by institutions based in another jurisdiction. SARA requires member jurisdictions to approve institutions in their jurisdiction to participate in SARA, based upon institutional accreditation and financial stability, and to resolve student complaints. Applications must be renewed annually. SARA does not cover, or limits its coverage related to, certain activities. As a result, an institution may still be required to obtain state authorization from, for example, agencies, or boards responsible for professional licensure. We cannot predict the extent to which states will retain membership in SARA, the manner in which SARA’s rules may be modified, interpreted and enforced, our institutions’ ability to comply with SARA’s requirements and retain eligibility, or the impact that failure to meet the SARA requirements may have on our business.
Many states also have specific requirements that an individual must satisfy in order to be licensed as a professional in a specified field. Students’ success in obtaining licensure typically depends on several factors, including: individual merits of the graduate; whether the institution and the program were approved by the state in which the graduate seeks licensure or by a professional association; whether the program meets all state requirements for professional licensure; and the accreditation of the institution and the specific program.
22
Federal Requirements for State Licensure/Authorization
“Home” State Authorization
ED regulations specify how an institution may demonstrate, as required by ED, that it is authorized to offer postsecondary educational programs by the state(s) where it is located, which we refer to as its “home” state, and that the home state otherwise satisfies ED requirements. If ED determines that an institution does not have the required state approval, the institution will be ineligible to participate in Title IV programs. If one of our institutions were to lose its ability to participate in Title IV programs in connection with “home” state authorization requirements, it would also lose its ability to participate in DoD tuition assistance programs. The loss of ability of one of our institutions to participate in either Title IV programs or DoD tuition assistance programs could have a material adverse effect on our business and financial condition.
State Authorization of Online Education
In December 2016, ED published final regulations addressing, among other issues, state authorization of programs offered through distance education, which were scheduled to go into effect on July 1, 2018. On June 29, 2018, ED announced that it would delay the effective date of the distance education portion of the state authorization final regulations, or the Distance Education Rule, until July 1, 2020. In April 2019, a U.S. District Court judge found that the delayed implementation was improper, and as a result of the court’s related order, the Distance Education Rule took effect in May 2019. The Distance Education Rule requires an institution offering distance education programs to be authorized by each state in which the institution enrolls students, if such authorization is required by the state, in order to award Title IV aid to such students. An institution may obtain such authorization directly from the state or through a state authorization reciprocity agreement that satisfies ED’s definition of such an agreement. In addition, the Distance Education Rule requires an institution to document the state process for resolving complaints from students enrolled in programs offered through distance education and to provide certain public and individualized disclosures to enrolled and prospective students regarding its programs that are provided or can be completed solely through distance education or correspondence courses, excluding internships and practicums.
In October 2018, ED announced the Accreditation and Innovation Committee would prepare proposed regulations related to, among other things, institutional and programmatic eligibility issues, including state authorization and courses offered through distance education. In June 2019, ED published certain portions of the agreed-upon regulatory language, including those provisions related to state authorization, in a notice of proposed rulemaking. On November 1, 2019, ED published final regulations concerning state authorization, which generally will be effective on July 1, 2020, except that institutions may in their discretion implement early regulations relating to state authorization and institutional information disclosures. APUS implemented early those regulations effective November 1, 2019. The final regulations related to state authorization effectively replace the Distance Education Rule. The final regulations also clarify the required methodology for determining the state in which a student is located for purposes of satisfying state authorization requirements for distance education courses and require an institution to disclose certain information related to whether programs leading to professional licensure meet applicable state requirements, regardless of program modality.
State Authorization/Licensure of Our Institutions
APUS is authorized to enroll students from each of the 50 states and the District of Columbia. APUS is headquartered in Charles Town, West Virginia, with administrative offices in Virginia. APUS is authorized to offer its programs by the West Virginia Higher Education Policy Commission, or WVHEPC. Under current law, if APUS were to lose its accreditation by HLC, WVHEPC may suspend, withdraw, or revoke APUS’s authorization. Failure to comply with WVHEPC requirements could result in APUS losing its authorization from WVHEPC, its accreditation by HLC, its eligibility to participate in Title IV programs and DoD tuition assistance programs, or its ability to offer certain programs, any of which could force APUS to cease operations. Under Virginia law, because it has administrative offices in Virginia, APUS is required to be authorized by the State Council of Higher Education for Virginia, or SCHEV. Accordingly, APUS has obtained SCHEV’s authorization to operate as an out-of-state institution. APUS has participated in SARA since its application was approved in December 2014. APUS also has obtained authorization to operate in California, which is the only state that is a non-SARA jurisdiction.
HCN is headquartered in Westerville, Ohio, and has five campuses in Ohio. Classes are expected to begin at an additional campus in Indianapolis, Indiana in the second quarter of 2020, initially only in HCN’s PN program. HCN is authorized to offer instruction in Ohio by the Ohio State Board. HCN’s PN and ADN programs are approved by OBN. HCN is authorized by the Indiana Board for Proprietary Education/Indiana Commission for Higher Education to offer instruction in Indiana, and on November 21, 2019 the Indiana State Board of Nursing voted to grant initial accreditation and authorize the admission of HCN’s first cohort of up to 30 students at its Indianapolis campus. HCN has participated in SARA since its application was approved in April 2016.
23
To apply for licensure to practice nursing in Ohio, an applicant must have successfully completed a nursing education program approved by the OBN. The OBN requires that nursing education programs such as HCN’s PN and ADN Programs have a pass rate on the relevant National Council Licensure Examination, or NCLEX, that is at least 95% of the national average for first-time candidates in a calendar year. If a program does not attain this pass rate, the program may face various consequences, including placement of a program on provisional status or withdrawal of approval pursuant to an adjudication proceeding. In March 2017, the OBN placed HCN’s ADN Program on provisional approval because the ADN Program had not met the pass rate standard for four consecutive years. In March 2019, the OBN found that HCN’s ADN Program did not meet the OBN pass rate standard in 2018 for a sixth consecutive year, and we do not expect to meet the pass rate standard in 2019. The OBN will consider restoring a program to Full Approval status if the program meets the pass rate standard for at least two consecutive years. If a program on provisional approval fails to meet OBN requirements at the end of the time period established for provisional approval, the OBN may propose to continue provisional approval for a set time period or may propose to withdraw approval. HCN has been implementing changes, including curriculum, admissions, and academic achievement and course retake policy changes, that are designed to improve NCLEX scores over time, but there is no assurance that these changes will be successful or will not have negative effects on HCN’s enrollment. For example, enrollments in HCN’s ADN Program in 2019 were significantly lower than HCN planned, which we believe is likely partly associated with the implementation of new academic achievement and admissions requirements that had the effect of reducing enrollments from qualified students. If HCN is unable to improve NCLEX scores over time, this situation could have an adverse impact on our ability to enroll students and eventually our ability to continue HCN’s ADN Program, any of which would have an adverse effect on our results of operations, cash flow, and financial condition. The Indiana State Board of Nursing also requires that nursing education programs have a pass rate on the relevant NCLEX exam that satisfies certain requirements. A program that is under initial accreditation may not be granted full accreditation if the program’s pass rate is lower than one standard deviation below the average national pass rate. In addition, if the program’s pass rate is lower than one standard deviation below the average national pass rate for three consecutive years, the program may be required to subject to additional oversight or a change in accreditation status.
Failure to comply with state authorization or licensure requirements could restrict our institutions’ ability to recruit or enroll students or result in other sanctions, including fines and penalties. We review state requirements to determine whether our institutions’ activities in those states may constitute a physical presence or otherwise may require authorization or licensure. New laws, regulations, interpretations, or changed circumstances related to our institutions’ educational programs could increase our cost of doing business and affect our ability to recruit students and offer programs in particular states, which could, in turn, adversely affect our institutions’ enrollments and revenue and have a material effect on our business.
Student Financing Sources and Related Regulations/Requirements
Our students finance their education through a combination of Title IV programs, DoD tuition assistance programs, education benefits administered by the VA, private loans, corporate reimbursement programs, individual resources and, in the case of HCN, extended payment plan options. Participation in federal student aid programs, including those administered by DoD and VA, and the extended payment plan options at HCN, adds to the regulation of our operations. In particular, the HEA and related ED regulations subject us to significant scrutiny in the form of numerous standards we must satisfy in order to participate in and administer Title IV programs.
Department of Education
The federal government provides support for postsecondary education through the Title IV programs in the form of grants and loans to eligible students who can use those funds to enroll in an eligible educational program at any institution that has been certified by ED. An institution will be certified to participate in the Title IV programs only if, among other things, it enters into a written program participation agreement, or PPA, with ED, which conditions participation in Title IV programs upon compliance with ED regulations and any additional conditions specified in the PPA.
Types of Title IV Financial Aid Programs
.
Title IV program aid is primarily awarded to students on the basis of financial need, generally defined as the difference between the cost of attending an institution and the amount a student can reasonably contribute. Our students receive grants and loans to fund their education under several Title IV programs, of which the two largest are Direct Loans and Pell Grants. Direct Loan Program loans, including Federal Stafford Loans, Federal Parent PLUS Loans, Federal Grad PLUS Loans, and Federal Consolidation Loans, are made directly by the federal government to students or their parents. Pell Grants are awarded to undergraduate students who demonstrate financial need. In accordance with applicable appropriations legislation, the maximum Pell Grant was $6,195 for the 2019-2020 award year and will be $6,345 for the 2020-2021 award year. A student’s lifetime eligibility to receive a Pell Grant is 12 semesters (or its equivalent). Students may not be able to use all of this eligibility at our
24
institutions based on their prior receipt of Pell Grants at other institutions. Institutions may award Pell Grant funds for up to 150% of a student’s standard scheduled Pell Grant in one award year. This provision, which commonly is referred to as “year-round Pell,” is intended to allow students to graduate more quickly and with less debt. Some of our students may also be eligible for other Title IV grant programs, such as the Federal Supplemental Education Opportunity Grant or Teacher Education Assistance for College and Higher Education, or TEACH, Grant. The Title IV programs are subject to Congressional action in terms of appropriations and other legislation that may affect funding levels, student eligibility, and other requirements. For example, the Pell Grant program could be subject to cuts or changes in the future, and cuts in ED’s administrative budget could lead to delays in student eligibility determinations and delays in origination and processing of federal student loans.
Regulation of Title IV Financial Aid Programs
To be eligible and certified to participate in Title IV programs, an institution must be accredited by an accrediting body recognized by ED, must be authorized to operate by the appropriate regulatory authority in each state where the institution maintains a physical presence, and must comply with specific standards and procedures set forth in the HEA and the regulations issued thereunder by ED.
ED periodically revises its regulations and changes its interpretations of existing laws and regulations. Accrediting agencies and state education agencies also have responsibilities for overseeing institutional compliance with certain Title IV program requirements. For these reasons, we cannot predict with certainty how Title IV program requirements will be applied in all circumstances. Key provisions relating to institutional participation in Title IV and the processing of Title IV aid that could adversely affect us include the following:
Eligibility and Certification Procedures.
An institution must apply periodically to ED for continued certification to participate in Title IV programs. Recertification generally is required every six years, but may be required earlier, including when an institution undergoes a change of control. An institution may come under review when it expands its activities in certain ways, such as opening an additional location, adding a new program, or, in certain cases, when it modifies academic credentials that it offers.
ED may place an institution on provisional certification status if ED finds that the institution does not fully satisfy all Title IV requirements and in certain other circumstances, such as when an institution undergoes a change in ownership resulting in a change of control. During a period of provisional certification, the institution must comply with any additional conditions imposed by ED. In addition, ED may more closely review a provisionally-certified institution if it applies for approval to open a new location, add an educational program, acquire another school, or make any other significant change. If ED determines that a provisionally-certified institution is unable to meet its responsibilities, it may seek to revoke the institution’s certification to participate in Title IV programs with fewer due process protections than if it were fully-certified.
APUS is certified to participate in Title IV programs through September 30, 2020 and will be required to apply timely for recertification in order to continue to participate in the Title IV programs after that date. As discussed more fully in “Compliance with Regulatory Standards and the Effect of Regulatory Violations - Compliance Reviews,” in September 2016 ED began a program review of APUS’s administration of the Title IV programs during the 2014-2015 and 2015-2016 award years, and that program review remains open and ongoing. If the program review and any associated liabilities remain unresolved at the time ED acts on APUS’s recertification application and ED decides to recertify APUS, we believe such recertification is likely to be on a provisional basis because of the unresolved program review and associated liabilities. HCN was provisionally certified to participate in the Title IV programs from November 2013 until September 2018. Since September 28, 2018, HCN has been certified to participate in Title IV programs, without the restrictions of provisional certification. HCN will be required to apply timely for recertification in order to continue to participate in the Title IV programs after September 30, 2021.
State Authorization.
To participate in Title IV programs, a school must receive and maintain authorization by the appropriate state education agencies. As described more fully above in “State Licensure/Authorization,” ED has specified the types of state approvals that are acceptable to demonstrate that an institution is authorized to offer postsecondary educational programs, and ED has promulgated rules that address authorization by states in which students enrolled in distance education programs reside or are located.
Administrative Capability.
ED regulations specify extensive criteria by which an institution must establish that it has the requisite “administrative capability” to participate in Title IV programs, including that the institution must:
|
•
|
comply with all applicable Title IV program regulations;
|
|
•
|
have capable and sufficient personnel to administer Title IV programs;
|
25
|
•
|
have acceptable methods of defining and measuring the satisfactory academic progress of its students;
|
|
•
|
not have cohort default rates above specified levels;
|
|
•
|
have various procedures in place for safeguarding federal funds;
|
|
•
|
not be, and not have any principal or affiliate who is, debarred or suspended from federal contracting or engaging in activity that is cause for debarment or suspension;
|
|
•
|
provide financial aid counseling to its students;
|
|
•
|
refer to ED’s Office of Inspector General any credible information indicating that any applicant, student, employee or agent of the institution has been engaged in any fraud or other illegal conduct involving Title IV programs;
|
|
•
|
submit in a timely manner all required reports and financial statements;
|
|
•
|
develop and apply an adequate system to identify and resolve discrepant information with respect to a student’s application for Title IV aid; and
|
|
•
|
not otherwise appear to lack administrative capability.
|
If an institution fails to satisfy any of these criteria, ED may require the repayment of Title IV program funds, transfer the institution from the “advance” system of payment to cash monitoring status or to the “reimbursement” system of payment, place the institution on provisional certification status, or commence a proceeding to impose a fine or to limit, suspend, or terminate the institution’s participation in Title IV programs.
Financial Responsibility.
The HEA and ED regulations establish extensive standards of financial responsibility that institutions must satisfy in order to participate in Title IV programs. These standards generally require that an institution provide the services described in its official publications and statements, properly administer Title IV programs in which it participates, and meet all of its financial obligations, including making required refunds and any repayments to ED.
ED evaluates institutions on an annual basis for compliance with specified financial responsibility standards, including a complex formula based on line items from the institution’s audited financial statements. The formula focuses on three financial ratios: (1) equity ratio (which measures the institution’s capital resources, financial viability, and ability to borrow); (2) primary reserve ratio (which measures the institution’s viability and liquidity); and (3) net income ratio (which measures the institution’s profitability or ability to operate within its means). Generally, an institution’s financial ratios must yield a composite score of at least 1.5 for the institution to be deemed financially responsible. Under certain circumstances, an institution may be able to establish financial responsibility on an alternative basis by complying with various conditions.
ED may also apply the financial responsibility standards to other entities under common ownership with an eligible institution. At the request of ED, for purposes of evaluating the financial responsibility of our institutions, including the composite score calculation, we supply consolidated financial statements to ED.
In final regulations published November 1, 2016, which we refer to as the 2016 Borrower Defense Regulations, ED modified its financial responsibility standards to provide that an institution (other than a public institution) may not be able to meet its financial or administrative obligations, and is therefore not financially responsible, if it is subject to one or more triggering events that occur on or after July 1, 2017. On September 23, 2019, ED published new final regulations, which we refer to as the 2020 Borrower Defense Regulations, which among other things amend ED’s financial responsibility provisions in several respects. Like the 2016 Borrower Defense Regulations, the 2020 Borrower Defense Regulations identify certain conditions or other triggering events that have or may have an adverse material effect on the institution’s financial condition, in response to which ED would or could require that the institution submit some form of financial protection, such as a letter of credit, to ED. Under the 2020 Borrower Defense Regulations, ED will consider an institution unable to meet its financial or administrative obligations under ED’s financial responsibility regulations if the institution is subject to one of certain mandatory triggering events that ED believes have or are likely to have a material adverse effect on the financial condition of the institution, some of which are the same as under the 2016 Borrower Defense Regulations. ED may consider an institution not to be financially responsible if ED determines that one of certain discretionary triggering events is likely to have a material adverse effect on the financial condition of the institution. The set of discretionary triggering events under the 2020 Borrower Defense Regulations includes some of the same events that are triggering events under the 2016 Borrower Defense Regulations. If the institution is subject to two or more of these discretionary triggering events, ED will consider the institution to be subject to a mandatory triggering event and therefore unable to meet its financial or administrative obligations. For each triggering event, to demonstrate that the institution remains financially responsible, the institution may submit evidence that the triggering event has been resolved, that the institution has insurance that will cover part or all of the debt or liabilities, or that the triggering event has not or will not have a material adverse effect on the institution. If ED determines that one of our institutions is not financially responsible because of one or more triggering events, the institution would be required to provide an irrevocable letter of credit equal to at least 10% of the amount of federal student financial aid funds received by the institution for the past year.
26
The 2020 Borrower Defense Regulations also implement updates to ED’s calculations of an institution’s composite score to reflect certain changes in Financial Accounting Standards Board accounting standards and to update the definitions and terms used to describe the calculation of the composite score, including leases and long-term debt. With limited exceptions related to optional early implementation of modifications to ED’s composite score methodology, the 2016 Borrower Defense Regulations will remain in effect until the 2020 Borrower Defense Regulations take effect on July 1, 2020.
Failure of one of our institutions to meet the “financial responsibility” requirements, because it does not satisfy the minimum composite score or is unable to establish financial responsibility on an alternative basis, or because it fails to meet other financial responsibility requirements, could cause the institution to lose access to Title IV program funding, or result in other penalties or conditions on continued participation. ED’s determination that our consolidated financial statements do not satisfy the “financial responsibility” requirements could cause both APUS and HCN to lose access to Title IV program funding, or result in other penalties or conditions on continued participation.
The “90/10 Rule.”
Under the so-called “90/10 Rule”, a for-profit institution is prohibited from deriving more than 90% of its revenue (as computed by ED) on a cash accounting basis (except for certain institutional loans) from Title IV programs for any fiscal year. If an institution violates the 90/10 Rule for any fiscal year, the institution is placed on provisional status for two fiscal years. An institution that violates the rule for two consecutive fiscal years becomes ineligible to participate in Title IV programs for at least two fiscal years and is required to demonstrate compliance with Title IV eligibility and certification requirements for at least two additional fiscal years prior to resuming Title IV program participation.
Using the applicable 90/10 formula, the following table contains the percentage of cash-basis revenue earned from Title IV program funds:
|
2017
|
2018
|
2019
|
|
|
APUS
|
41%
|
41%
|
38%
|
|
HCN
|
83%
|
82%
|
80%
|
In recent years, Congress has considered various proposals that would modify the 90/10 Rule. One current proposal would decrease the limit on Title IV funds from 90% to 85% and another current proposal would maintain the 90% limit but count DoD tuition assistance and VA education benefits toward that limit. In contrast, a previous proposal would have eliminated the 90/10 Rule. At this time we cannot predict whether Congress will pass legislation to modify the 90/10 Rule. Such proposals, or other similar legislation, should they become law, could have a material adverse impact on the operations of our institutions.
Incentive Payment Rule.
An institution participating in Title IV programs may not provide any commission, bonus or other incentive payment to any person or entity engaged in any student recruitment, admissions, or financial aid awarding activity based directly or indirectly on success in securing enrollments or federal student financial aid. In June 2015, ED announced that it will calculate institutional liability for noncompliance with the incentive payment rule by calculating the cost to ED of the Title IV funds improperly received by the institution, including the cost to ED of all of the Title IV funds received by the institution over a particular period of time if those funds were obtained through implementation of a policy or practice in which students were recruited in violation of the incentive payment rule. ED may also fine an institution, or take administrative action to limit, suspend, revoke, deny, or terminate an institution’s eligibility to participate in the Title IV programs, if the institution violates the prohibition.
We believe that our employee compensation and third-party contractual arrangements comply with the incentive payment rule currently in effect. However, because there are ambiguities as to how the rule is interpreted and enforced by ED, we can make no assurances that ED would not find deficiencies in our past, current, or future employee compensation plans and relevant third-party contractual arrangements. In addition, in recent years, other postsecondary educational institutions have been named as defendants to whistleblower lawsuits, known as “qui tam” cases, brought pursuant to the Federal False Claims Act, alleging that an institution’s compensation practices did not comply with the incentive payment rule. Any such litigation could be costly and could divert management’s time and attention away from the business, regardless of whether a claim has merit.
Gainful Employment.
Under the HEA, for-profit schools are eligible to participate in Title IV programs in connection with educational programs that lead to “gainful employment in a recognized occupation,” except for certain programs leading to a bachelor’s degree in liberal arts. Historically, this concept has not been defined in detail.
27
On October 31, 2014, ED published final regulations relating to gainful employment, which we refer to as the GE Regulations. The GE Regulations went into effect on July 1, 2015, with the exception of certain disclosure requirements, which generally went into effect January 1, 2017. The GE Regulations, among other things, establish debt-related measures for determining whether certain postsecondary education programs prepare students for gainful employment in a recognized occupation, require institutions to make certain disclosures in connection with gainful employment programs, and require institutions to make certain certifications to ED concerning gainful employment programs.
On July 1, 2019, ED published a final rule rescinding the GE Regulations. The rescission is scheduled to take effect July 1, 2020, but in guidance issued on June 28, 2019, ED explained that the Secretary of ED would exercise her authority to designate the rescission for early implementation by institutions that elect to implement early the rescission. Institutions that implement the rescission early will not be required to report data related to gainful employment programs to ED, comply with gainful employment disclosure requirements, or comply with related certification requirements, among other requirements. APUS and HCN have elected to implement early the rescission of the 2014 GE Regulations. APUS intends to continue to voluntarily make certain disclosures related to gainful employment programs.
Student Loan Defaults.
Under the HEA, an educational institution may lose its eligibility to participate in Title IV programs if defaults on the repayment of federal loans by its students exceed 40% in any one year or 30% for each of three consecutive years.
An institution’s cohort default rate is calculated as the percentage of borrowers who entered repayment in the relevant fiscal year who default before the end of the second fiscal year following the fiscal year in which the borrowers entered repayment. If an institution’s cohort default rate is equal to or greater than 30%, it must establish a default prevention task force.
In September 2018, ED released official three-year cohort default rates for federal fiscal year 2016. The final official ED cohort default rates for APUS and HCN for the federal fiscal years 2014, 2015, and 2016 are as follows:
|
2014
|
2015
|
2016
|
|
|
APUS
|
23.6%
|
23.8%
|
18.5%
|
|
HCN
|
11.4%
|
11.4%
|
11.3%
|
If one or both of our institutions has a default rate in excess of allowable levels, it could result in that institution’s or those institutions’ loss of eligibility to participate in Title IV programs or incurring additional costs related to default prevention, which could have a material adverse effect on our business.
Privacy of Student Personal Information and Records.
The Family Educational Rights and Privacy Act of 1974, or FERPA, and ED’s regulations implementing FERPA require educational institutions to protect the privacy of students’ educational records by, among other things, limiting disclosure of a student’s personally identifiable information without prior written consent. If an institution fails to comply with FERPA, ED may require corrective actions by the institution or may terminate an institution’s eligibility to participate in Title IV programs. In addition, educational institutions engaged in financial activities such as the granting of student loans are obligated to safeguard student information pursuant to the Gramm-Leach-Bliley Act, or GLBA, and applicable GLBA regulations, which among other things, require a comprehensive, written information security program to protect personally identifiable financial information of students, parents, or other individuals in a customer relationship with the institution. Failure to comply with the applicable GLBA requirements may result in Federal Trade Commission, or FTC, enforcement, which could include the imposition of conditions, penalties, monitoring, and oversight. Institutions are also subject to the general deceptive and unfair practices jurisdiction of section 5 of the FTC Act with respect to their collection, use, protection, and disclosure of student information. The FTC has brought numerous enforcement actions under section 5 of the FTC Act against companies that among other things: (1) may have collected, used, shared, or retained personal information inconsistent with the representations, commitments, and promises they make in their privacy policies and other public statements; (2) may have had privacy policies that did not adequately inform consumers about actual practices; and (3) may have failed to reasonably protect the security, privacy and confidentiality of personal information. Institutions must also comply with the FTC Red Flags Rule, a requirement designed to identify and mitigate identity theft for certain student accounts. States also have so called “mini-FTC Acts under which they may bring enforcement actions similar to those of the FTC as well as other applicable privacy and security laws. A new law in California, the California Consumer Privacy Act, or the CCPA, which took effect in January 2020, imposes new disclosure obligations and contains a broad array of consumer rights relating to their personal information, including among others, the right to obtain copies of their personal information collected in the past 12 months, the ability to opt out from the sale of personal information, and the right to demand the deletion of personal information. The CCPA also creates new consumer notice obligations. The CCPA has the potential for significant civil penalties for failing to comply as well as a private right of action and statutory damages for data breaches that are the result of unreasonable security, which may increase data breach litigation, including class action litigation. Although the
28
CCPA is now in effect, the California Attorney General is in the process of developing regulations, the final form of which may significantly impact the CCPA compliance measures we have or will undertake. Our collection of personal information relating to students or other individuals who are in the European Union, or EU, may implicate the EU’s General Data Protection Regulation, or GDPR, which took effect in May 2018. The GDPR contains numerous requirements relating to the collection, possession, use, and disclosure of personal information, but enforcement priorities and interpretation of certain provisions remain unclear. The GDPR requirements are generally stricter and more comprehensive than those of the U.S. Non-compliance with the GDPR could result in a fine for certain activities of up to 20 million Euros or 4% of an organization’s global annual revenue, whichever is higher, per violation.
Accessibility for Students with Disabilities
. Section 504 of the Rehabilitation Act of 1973, or Section 504, prohibits discrimination against a person with a disability by any organization that receives federal financial assistance, which includes us. In 2010, ED’s Office for Civil Rights, which enforces Section 504, together with the Department of Justice, asserted that requiring the use of technology in a classroom environment when such technology is inaccessible to individuals with disabilities violates Section 504, unless those individuals are provided accommodations or modifications that permit them to receive all the educational benefits provided by the technology in an equally effective and integrated manner. In recent years, ED’s Office for Civil Rights has taken enforcement action against several institutions of higher education, including primarily online institutions, after determining that their websites and online learning management platforms were not accessible to persons with a disability. If one of our institutions is found to have violated Section 504, it may be required to modify existing content and functionality of its online classroom or other uses of technology, including through adoption of specific technical standards. An institution that does not come into compliance with Section 504 could lose access to federal funding, including the ability to participate in the Title IV programs and DoD tuition assistance programs.
College Affordability and Transparency Lists.
ED publishes on its website lists of the top 5% of institutions, in each of nine categories, with (i) the highest tuition and fees for the most recent academic year, (ii) the highest “net price” for the most recent academic year, (iii) the largest percentage increase in tuition and fees for the most recent three academic years, and (iv) the largest percentage increase in net price for the most recent three academic years. An institution placed on a list for high percentage increases in either tuition and fees or in net price must submit a report to ED explaining the increases and the steps that it intends to take to reduce costs. ED reports annually to Congress on these institutions and publishes its reports on its website. ED also posts lists of the top 10% of institutions in each of the nine categories with lowest tuition and fees or the lowest net price for the most recent academic year. APUS was listed as the private for-profit, four-year or more undergraduate institution with the 14th lowest tuition for 2017-2018, the most recent year for which data is available, and 17th lowest net price for 2016-2017, in each case the most recent years for which data is available. We cannot determine the extent to which such lists have impacted or may impact our enrollments, reputation, or operating results.
College Scorecard.
In September 2015, ED publicly released its “College Scorecard” website, which among other characteristics, allows users to search for schools based upon programs offered, location, size, tax status, mission, and religious affiliation. Certain College Scorecard measures are based on data collected only about students who receive Title IV program aid. While a significant portion of APUS students receive Title IV program aid, they are a minority of APUS’s students. On August 14, 2018, ED announced a plan to update the College Scorecard or a similar web-based tool to provide program-level outcomes for all higher education programs at all institutions that participate in the Title IV Programs. In May 2019, ED updated the College Scorecard to include additional information, including more comprehensive graduation rates for full-time, part-time, first-time, and transfer students, and in November 2019 ED supplemented the College Scorecard to include program-level outcomes data such as median earnings and median loan debt. We cannot determine the extent to which the data collected and published by ED has impacted or may impact our enrollments, reputation, or operating results.
Third-Party Servicers.
ED regulations permit an institution to enter into a contract with a third-party servicer for the administration of any aspect of the Title IV programs. Our institutions utilize third-party servicers for some services and in the future may consider using third-party servicers for other functions that are currently managed directly by our institutions. Third-party servicers must, among other obligations, comply with Title IV requirements and be jointly and severally liable with the institution to ED for any violation by the servicer of any Title IV provision. An institution must report to ED new contracts with or any significant modifications to contracts with third-party servicers and other matters related to third-party servicers. If any third-party servicer engaged by one of our institutions does not comply with applicable statute and regulations, our institution may be liable for its actions, and our institution could lose its eligibility to participate in Title IV programs.
Title IV Return of Funds.
When a student withdraws, an institution must return unearned Title IV program funds to ED in a timely manner. An institution must first determine the amount of funds that a student “earned” before withdrawal. If the student withdraws during the first 60% of any period of enrollment or payment period, the amount of Title IV program funds that the student earned is equal to a pro rata portion of the funds for which the student would otherwise be eligible. If the student withdraws after the 60% threshold, then the student has earned 100% of the Title IV program funds. The institution
29
must return to the appropriate Title IV programs, in a specified order, the lesser of (i) the unearned Title IV program funds or (ii) the institutional charges incurred by the student for the period multiplied by the percentage of unearned Title IV program funds. An institution must return the funds no later than 45 days after the date of the institution’s determination that a student withdrew.
If 5% or more of such returns were not timely made, the institution may be required to submit a letter of credit in favor of ED equal to 25% of the amount of unearned Title IV funds the institution was required to return for its most recently completed fiscal year. For example, APUS’s Title IV compliance audit for the year ended December 31, 2016 identified a finding related to return of Title IV funds calculations that were not properly computed. In a Final Audit Determination letter in January 2018, ED conveyed its finding that funds had not been returned timely. ED also noted that a similar finding had been made in an open program review with respect to which APUS has not yet received a program review report. In connection with the finding, ED required that APUS post an irrevocable letter of credit for approximately $700,000. APUS posted the letter of credit March 2018 and it expired December 31, 2019. If ED determines that one of our institutions has repeatedly failed to comply with ED regulations, it may take adverse action against the institution on the basis of the repeated finding or may find that the institution has failed to demonstrate administrative capability, as described above.
Misrepresentation.
Under the HEA and its implementing regulations, ED may fine, suspend or terminate the participation in Title IV programs by an institution that engages in substantial misrepresentation regarding the nature of its educational program, its financial charges, or the employability of its graduates.
In December 2015, ED fined HCN $27,500 based on a finding that HCN had substantially misrepresented its programmatic accreditation status prior to our ownership of HCN. HCN noted its disagreement with ED’s findings but paid the fine in order to promptly resolve the matter.
The Clery Act
. Our institutions are required to comply with the Jeanne Clery Disclosure of Campus Security Policy and Campus Crime Statistics Act, or the Clery Act. The Clery Act requires an institution, among other things, to report to ED and disclose in an annual security report, for the three most recent calendar years, statistics concerning the number of certain crimes that occurred on or within the institution’s so-called “Clery geography” and to publish certain policies and procedures related to campus safety. A failure to comply with the Clery Act could result in our institutions being fined or having their eligibility to participate in Title IV programs limited, suspended, or terminated, could lead to litigation, or could harm our institutions’ reputation, each of which could, in turn, adversely affect our institutions’ enrollments and revenue and have a material effect on our business.
Borrower Defenses.
Under the HEA, ED is authorized to specify in regulations which acts or omissions of an institution of higher education a borrower may assert as a defense to repayment of a Direct Loan. ED’s previous regulations permitted a borrower to assert a borrower defense to repayment of a Direct Loan if the institution’s acts or omissions give rise to a cause of action against the institution under state law. On November 1, 2016, ED published the 2016 Borrower Defense Regulations, which concern which acts or omissions of an institution of higher education a student borrower or group of borrowers may assert as a defense to repayment of a loan made under the Direct Loan Program and certain other matters. For Direct Loans first disbursed on or after July 1, 2017, the 2016 Borrower Defense Regulations create a new federal standard for borrower defenses to repayment of Direct Loans, new limitation periods for such claims, and new processes for resolution of such claims. The 2016 Borrower Defense Regulations also prohibit institutions from requiring students to engage in the institutions’ internal complaint processes before contacting other agencies, prohibit the use of pre-dispute arbitration agreements by institutions, prohibit class action lawsuit waivers, and require institutions to notify ED of arbitration filings and awards, for claims that may form the basis for a borrower defense to repayment of a Direct Loan. ED announced delays until July 1, 2019 of the implementation of certain portions of the 2016 Borrower Defense Regulations, including those portions of the regulations that would have established a new federal standard and a process for determining whether a Direct Loan borrower has a defense to repayment on a Direct Loan based on an act or omission of an institution. However, in October 2018, a judge denied a request to delay implementation of portions of the Borrower Defense Regulations and, as a result, the 2016 Borrower Defense Regulations went into effect as of October 16, 2018. The 2016 Borrower Defense Regulations will remain in effect until the 2020 Borrower Defense Regulations, described below, take effect on July 1, 2020 and will thereafter continue to apply to all loans made under the Direct Loan Program on or after July 1, 2017 and before July 1, 2020.
On September 23, 2019, ED published the 2020 Borrower Defense Regulations, which, among other things, modify the borrower defenses to repayment for loans made under the Direct Loan Program on or after July 1, 2020, the limitation periods for related claims, and the processes for resolution of such claims as compared to defenses and claims under the 2016 Borrower Defense Regulations. The 2020 Borrower Defense Regulations generally remove the prohibitions contained in the 2016 Borrower Defense Regulations, but require institutions whose students must enter into pre-dispute arbitration agreements or class action waivers as a condition of enrollment to disclose publicly those requirements in an easily accessible format, and
30
prohibit such institutions from requiring a student to participate in arbitration or any internal dispute resolution process prior to filing a borrower defense to repayment application with ED. ED will have discretion to determine the appropriate amount of relief, if any. The 2020 Borrower Defense Regulations eliminate the process available under the 2016 Borrower Defense Regulations for a group of borrowers.
Under the Borrower Defense Regulations, ED may also initiate a separate proceeding to collect from an institution the amount of relief resulting from a borrower defense brought by an individual borrower. If ED determines that borrowers of Direct Loans who attended our institutions have a defense to repayment of their Direct Loans, our repayment liability to ED could have a material adverse effect on our financial condition, results of operations, and cash flows.
The 2020 Borrower Defense Regulations also make other regulatory changes, including modifying ED’s requirements with respect to the circumstances under which a borrower is eligible for a loan discharge if an institution or location closes.
Department of Defense
Service members of the United States Armed Forces are eligible to receive tuition assistance from their branch of service through the Uniform Tuition Assistance Program of the DoD, or DoD tuition assistance programs. Service members may use this tuition assistance to pursue postsecondary degrees at institutions that are accredited by accrediting agencies recognized by ED. APUS participates in DoD tuition assistance programs, and for students in APUS undergraduate, and beginning January 2020, for students in APUS master’s programs, we have established tuition rates per credit hour that under current DoD policies can be 100% covered by DoD tuition assistance funds provided that the student does not exceed the annual limits per student. As of November 2019, HCN also participates in DoD tuition assistance programs.
In March 2013, DoD restricted the ability of service members who have not previously taken a postsecondary education course and who are in certain duty locations outside the continental United States, or overseas locations, to receive DoD tuition assistance for courses offered by institutions of higher education that are not parties to contracts with the DoD to provide DoD voluntary education programs at those locations. Because we do not have contracts with the DoD to provide instruction at overseas locations, service members who begin their first postsecondary education program after arrival in an applicable overseas location may not use DoD tuition assistance programs to pay for their education in our programs until after they have already successfully completed a course with an institution that has entered into a contract to provide voluntary education programs at that overseas location. Service members who were already enrolled in one of our programs before arriving at an overseas location may continue to receive DoD tuition assistance for the in-progress program, but they will be encouraged to enroll in courses provided by institutions that provide programs at the applicable overseas duty location.
DoD has issued briefings that prohibit base commanders from authorizing education institutions to hold regular or recurring office hours on installations solely to provide counseling and prohibit former military members from accessing installations to represent an educational institution using their government ID card privileges. This has adversely affected our efforts to support existing students and serve new students. If we are not able to improve our access to military installations and our existing students on those installations, or find alternative methods to serve those students, our military enrollments may decline.
Each institution participating in DoD tuition assistance programs is required to sign a Memorandum of Understanding, or MOU outlining certain commitments and agreements between the institution and DoD prior to being permitted to participate in the DoD tuition assistance programs. In May 2014, DoD promulgated new regulations and a revised MOU, or the DoD MOU, which APUS signed in August 2014 and which HCN signed in November 2019. Pursuant to the DoD MOU, among other requirements, institutions must: explain certain tools to service members, such as ED’s “College Navigator” website and the Consumer Financial Protection Bureau’s “Paying for College” website; comply with requirements related to readmission policies for service members; abide by limitations on the use of funds derived from tuition assistance; provide certain academic and student support services; disclose information about transfer of credit; in certain circumstances, return tuition assistance funds to DoD (such as when a student ceases to attend or an institution cancels a course); offer to service members loan counseling before private student loans are offered or recommended; and comply with ED’s Title IV “program integrity” rules, including rules related to incentive payments and misrepresentation. The DoD MOU also provides that an institution may only participate in DoD tuition assistance programs if it is accredited by an accrediting agency recognized by ED, approved for VA funding, and a participant in Title IV programs. Additional information regarding the potential risks associated with the DoD MOU is provided in the “Risk Factors” section of this Annual Report.
In January 2014, several federal government agencies announced an online student complaint system for service members, veterans, and their families to report negative experiences at education institutions and training programs administering the Post-9/11 GI Bill, DoD tuition assistance programs, and other military-related education benefit programs. An
31
institution having recurring substantive complaints, or demonstrating an unwillingness to resolve complaints, may face a range of penalties, including revocation of its MOU and removal from participation in the DoD tuition assistance programs.
In addition to DoD tuition assistance, branches of the U.S. military offer credentialing assistance, which links soldiers to and in many cases provides funds for approved training courses or exams related to occupational licenses or certifications, and associated books, supplies and materials. Credentialing Opportunities On-Line, or COOL, is a program from each of the military branches that links experience with certification. While benefits vary by service, service members may be eligible for assistance in paying for certifications, including by vouchers, reimbursement, or grants. Students must meet certain eligibility requirements in order to receive credentialing assistance, including in some cases service time, experience and DoD tuition assistance eligibility requirements. The Army is now offering an expanded credentialing program called the Army Credentialing Assistance Program, or CA. CA is a program designed to support soldiers who wish to pursue civilian credentials, licenses, and certifications that lead directly to a specific job, particularly in areas outside of a soldier’s Military Occupational Specialty (MOS). Through CA, soldiers can receive reimbursement for fees associated with qualifying programs listed on Army COOL. The US Army began a limited user test for CA at Fort Hood, Texas, in September 2018, expanded the test in 2019, and began an Army-wide implementation in January 2020. APUS became an approved training provider for CA programs in October 2019. We believe other service branches may follow the Army’s example or pursue other approaches to enhancing support for credentialing
.
Students in the Army may use both DoD tuition assistance and credentialing assistance for CA, subject to a combined cap on benefit amounts.
Department of Veterans Affairs
The VA administers education benefits provided by federal law, including the Montgomery GI Bill, or GI Bill, and the Post-9/11 Veterans Educational Assistance Act of 2008, or Post-9/11 GI Bill. APUS is approved to provide education to veterans and members of the selective reserve and their dependents by the state approving agencies in West Virginia and Virginia. Programs at each of HCN’s campuses in Ohio are approved for VA benefits by the state approving agency in Ohio.
Under current law, for the academic year from August 1, 2019 - July 31, 2020, an eligible veteran who attends a non-public U.S. institution may receive veterans’ education benefits to pay for tuition and fees based on the net cost to the veteran up to $24,476.79. Veterans pursuing a program of education on a more than half-time basis at an on-campus location are eligible for a monthly housing allowance equal to the basic allowance for housing available to service members who are at a military pay grade E-5 and have dependents. Veterans pursuing a program of education solely through distance education on a more than half-time basis are eligible to receive a monthly housing allowance equal to 50% of the basic allowance for housing available to service members who are at a military pay grade E-5 and have dependents, or $894.50 per month.
To the extent that DoD tuition assistance programs do not cover the full cost of tuition for service members, eligible service members may also use their benefits under the GI Bill or the Post-9/11 GI Bill through the “Top-Up” program. The “Top-Up” program allows U.S. Military active duty service members to use their GI Bill or Post-9/11 GI Bill benefits to pay the difference between the total cost of a college course and the amount of DoD tuition assistance that is paid by the military for the course, but is limited to 36 months of payments.
Additional Sources of Student Payments
In addition to the Title IV, DoD, and VA programs described above, eligible students may participate in other financial aid programs or receive support from other governmental and private sources. Some of our students finance their own education or receive full or partial employer tuition reimbursement. Our institutions enter into agreements with various employers through which our institutions agree to a variety of terms, including terms related to the provision of tuition grants to eligible employees. Our institutions may offer interest free payment plans of less than 12 months to students to assist them with the financing of educational expenses. In certain circumstances, our students may access alternative loan programs from a number of private lenders, which are intended to cover the difference between what the student receives from all financial aid sources and the student’s total cost of attendance. As part of an institution’s Title IV PPA, the institution must adopt a code of conduct pertaining to student loans, including alternative loans.
Beginning July 1, 2018, HCN began offering its students extended payment plan options, and beginning with enrollments for the term beginning in January 2020, HCN added an additional extended payment program. The extended payment plan options are designed to assist students with educational costs consisting of tuition, textbooks, and fees, and are only available after all other student financial assistance has been applied. Payment plans require monthly payments while the student is enrolled in a program and extend for up to six months after the last day of attendance or graduation. To the extent interest is applied, it is generally fixed and does not accrue until the student departs the program or graduates. The extended payment plans do not impose any origination fees. Borrowers are advised about the terms of the extended payment plans and
32
counseled to use all federal funding options. The extended payment plans are subject to various federal and state laws and regulations, such as the Truth in Lending Act as implemented in Regulation Z, the Equal Credit Opportunity Act as implemented in Regulation B and the Unfair, Deceptive or Abusive Acts or Practices provisions of Title X of the Dodd-Frank Act.
Consumer Protection
Consumer Financial Protection Bureau
The Consumer Financial Protection Bureau, or CFPB, has pursued enforcement actions against certain for-profit institutions of higher education and has released several reports that directly address issues related to institutions of higher education. In October 2019, the CFPB Student Loan Ombudsman released a report analyzing more than 6,700 complaints from private student loan borrowers and more than 13,900 federal student loan servicing complaints the CFPB received between September 1, 2017 and August 31, 2019. We do not know what enforcement actions the CFPB may pursue, or what steps Congress or federal agencies may take, in response to these reports and whether such actions, if any, will have an adverse effect on our business or results of operations.
Other Issues Related to Consumer Protection and Complaints
Many states have become more active in regulating for-profit education from a consumer protection perspective, specifically related to enforcement of consumer protection laws and implementation of new regulations by state attorneys general. For example, the Attorney General of Massachusetts issued APUS a CID in July 2017 relating to an investigation of alleged unfair or deceptive acts or practices by AMU in connection with the recruitment and retention of students and the financing of education. The CID required the production of documents and information relating to recruitment, enrollment, job placement and other matters. On August 6, 2018, APUS entered into an AOD to resolve the inquiry. Pursuant to the terms of the AOD, and without any finding or admission of wrongdoing on APUS’s part, APUS paid $270,000 to the Attorney General and agreed to otherwise comply with applicable Massachusetts regulations. Other state attorneys general may also initiate inquiries into us or our subsidiaries. Actions by state attorneys general and other governmental agencies, whether or not involving us or our institutions, could damage our reputation and the reputation of our institutions and limit the ability to recruit and enroll students, which could reduce student demand for our institutions’ programs and adversely impact our revenue and cash flow from operations.
Our institutions are recipients of complaints filed with state regulatory authorities, the Better Business Bureau, and posted in online forums. Our institutions attempt to resolve such complaints in a cooperative manner. However, even if such complaints are resolved or are otherwise unfounded they may still harm the reputation of our institutions. For example, in August 2017, HCN received notice from the Ohio State Board that the Ohio State Board was responding to student complaints and initiating formal disciplinary action against HCN’s Cincinnati campus because the campus discontinued offering one version of the PN Program curriculum and implemented a new PN Program curriculum allegedly without the Ohio State Board’s permission. It was alleged that at least three students enrolled in the discontinued curriculum were unable to complete without transferring into the new program and incurring substantial costs and time to complete the program. As permitted, on August 10, 2017, HCN requested a hearing before the Ohio State Board with respect to the notification. Simultaneously, HCN submitted a proposed resolution to the Ohio State Board, which included for each of the three students a partial refund for classes in which they enrolled but earned no credit. The Ohio State Board accepted HCN’s proposal. One student accepted the partial refund, and the two others failed to return executed agreements to the Ohio State Board by their due dates. As a result, HCN is no longer obligated to make partial refunds to those two students, and on January 8, 2018, the Ohio State Board informed those two students that it had closed their cases.
Compliance with Regulatory Standards and the Effect of Regulatory Violations
Compliance Reviews
Our institutions are subject to compliance reviews and audits by various external agencies, including ED, its Office of Inspector General, state licensing agencies, agencies that guarantee FFEL Program loans, DoD, VA, and accrediting agencies. The HEA and ED regulations also require institutions to submit annually a compliance audit conducted by an independent certified public accountant in accordance with Government Auditing Standards and applicable ED Office of Inspector General audit standards. In addition, to enable ED to make a determination of financial responsibility, institutions must annually submit audited financial statements prepared in accordance with ED regulations.
33
In September 2016, ED began a program review of APUS’s administration of the Title IV programs during the 2014-2015 and 2015-2016 award years. As part of the program review, ED conducted a site visit from September 12 to September 15, 2016. In general, after ED conducts its site visit and reviews data supplied by the institution, if ED identifies any instances of noncompliance, ED sends the institution a preliminary program review report to which the institution has an opportunity to respond. ED then issues a final program review determination letter identifying any findings, including any liabilities. The institution may appeal any monetary liabilities specified in the final letter. APUS has not received a preliminary program review report or expedited final program determination letter, and the program review remains open and ongoing. We anticipate that certain findings addressed in the 2016 Title IV compliance audit Final Audit Determination letter dated January 29, 2018 will be resolved through the program review process, including a finding that return of Title IV funds calculations were incorrectly computed for some students and a finding that APUS had incorrectly reported the students’ enrollment status to the National Student Loan Data System for some students. At this time, we cannot predict the outcome of the program review, when it will be completed, or whether ED will place any liability or other limitations on APUS as a result of the review. APUS is certified to participate in Title IV programs through September 30, 2020 and will be required to apply timely for recertification in order to continue to participate in the Title IV programs after that date. If the program review and any associated liabilities remain unresolved at the time ED acts on APUS’s recertification application and ED decides to recertify APUS, we believe such recertification is likely to be on a provisional basis because of the unresolved program review and associated liabilities.
In order to participate in the DoD tuition assistance programs, institutions must agree to participate in DoD’s Voluntary Education Institutional Compliance Program, or ICP. An institution that through the ICP is found noncompliant with DoD requirements and demonstrates an unwillingness to resolve a finding may be subject to a range of penalties from a written warning to termination of the institution’s participation in the DoD tuition assistance programs. Upon request, in May 2017, APUS submitted a self-assessment in connection with the ICP. On February 9, 2018, DoD issued a report that made two findings about APUS. First, DoD found that attire worn by an individual providing testimonials on the institution’s public-facing website could be construed as similar to a distinctive part of military uniform. Second, DoD found that APUS failed to provide sufficient information relating to the financial aid process, including a timeline for applying for financial aid. APUS timely submitted the required corrective action plan and evidence of corrective actions taken related to both findings. On June 15, 2018, DoD notified APUS that DoD had reviewed the corrective action plan and determined the proposed actions appear to sufficiently address DoD’s findings. On December 19, 2018, DoD notified APUS that all corrective actions had been reviewed and accepted by DoD and no further action is required. In February 2020, DoD informed APUS that it is one of 250 institutions selected for ICP review in 2020.
Potential Effect of Regulatory Violations
If our institutions fail to comply with the regulatory standards governing Title IV programs, ED could impose one or more sanctions, including transferring our institutions to the reimbursement or cash monitoring system of payment, seeking to require repayment of certain Title IV program funds, requiring the posting of an irrevocable letter of credit in favor of ED as a condition for continued Title IV certification, taking emergency action against our institutions, referring the matter for criminal prosecution, or initiating proceedings to impose a fine or to limit, condition, suspend, or terminate participation in Title IV programs. If APUS’s approval to participate in Title IV programs is terminated, APUS will also lose its ability to participate in DoD tuition assistance programs pursuant to the DoD MOU. If such sanctions or proceedings were imposed against our institutions and resulted in a substantial curtailment, or termination, of participation in Title IV programs, this would materially and adversely affect our enrollments, revenue, results of operations, and financial condition.
If one of our institutions were to lose its eligibility to participate in Title IV programs, or if the amount of available Title IV program funds were reduced, we could seek to arrange or provide alternative sources of revenue or financial aid for students. Although we believe that one or more private organizations would be willing to provide financial assistance to students attending our institutions, there is no assurance that this would be the case, and the interest rate and other terms of such financial aid might not be as favorable as those for Title IV program funds. We may be required to guarantee all or part of such alternative assistance or might incur other additional costs in connection with securing alternative sources of financial aid. Accordingly, the loss of our eligibility to participate in Title IV programs, or a reduction in the amount of available federal student financial aid, would be expected to have a material adverse effect on our financial condition and results of operations even if we could arrange or provide alternative sources of revenue or student financial aid.
In addition to the actions that may be brought against us as a result of our institutions’ participation in Title IV programs, we also may be subject, from time to time, to complaints and lawsuits relating to regulatory compliance brought not only by our regulatory agencies, but also by other government agencies and third parties, such as present or former students or employees and other members of the public.
34
Regulatory Actions and Restrictions on Operations
Many actions that we may wish to take in connection with our operations are subject to regulation from a variety of agencies. For example, ED’s regulations, state regulatory requirements, and accrediting agency standards may, in certain instances, limit our ability to acquire or sell institutions, and to establish additional locations and programs. Many states require approval before institutions can add new programs, campuses, or teaching locations. WVHEPC, SCHEV, HLC, ABHES, the Ohio State Board, and the Indiana Board for Proprietary Education/Indiana Commission for Higher Education generally require institutions to notify them, and sometimes require institutions to obtain their approval, in advance of opening a new location or implementing new programs.
Change in Ownership Resulting in a Change of Control
ED’s regulations, state regulatory requirements, and accreditation standards may limit our ability to acquire, merge, or sell institutions, and may impose restrictions on activities following a transaction. For example, ED must approve any change in ownership resulting in a change of control. These restrictions may impede our ability to grow by acquisition, or to dispose of assets. Moreover, as a publicly-traded company, the potential adverse regulatory effects of a change of control could influence future decisions by us and our stockholders regarding the sale, purchase, transfer, issuance, or redemption of our stock. In addition, the regulatory burdens and risks associated with a change of control could discourage bids for our shares of common stock and could have an adverse effect on the market price of our shares.
U.S. Department of Education
An institution that undergoes a change in ownership resulting in a change of control loses its eligibility to participate in Title IV programs and must apply to ED in order to reestablish such eligibility. ED’s regulations provide that a change of control of a publicly-traded company occurs in one of two ways: (i) there is an event that would obligate the corporation to file a Current Report on Form 8-K with the Securities and Exchange Commission disclosing a change of control; or (ii) the corporation has a stockholder that owns at least 25% of the total outstanding voting stock of the corporation and is the largest stockholder of the corporation, and that stockholder ceases to own at least 25% of such stock, or ceases to be the largest stockholder. As a result, a significant purchase or disposition of our voting stock, including an acquisition resulting in a stockholder owning at least 25% of our outstanding stock, could be determined by ED to be a change in ownership and control.
Upon a change in ownership and control, an institution is ineligible to receive Title IV program funds during the period prior to recertification. The HEA provides that ED may temporarily provisionally certify an institution seeking approval of a change in ownership and control based on preliminary review of a materially complete application received within 10 business days after the transaction. ED may continue such temporary provisional certification on a month-to-month basis until it has rendered a final decision on the institution’s application. If ED determines to approve the application, it issues a provisional certification, which extends for a period expiring not later than the end of the third complete award year following the date of provisional certification.
When a change in ownership and control occurs, ED applies certain financial tests to determine the financial responsibility of the institution in conjunction with its review. The institution generally is required to submit a same-day audited balance sheet reflecting the financial condition of the institution immediately following the change in ownership, and the same-day balance sheet must satisfy certain requirements. In addition, when a change in ownership and control occurs and there is a new owner, the institution must submit to ED audited financial statements of the institution’s new owner’s two most recently completed fiscal years. ED may determine whether the financial statements meet financial responsibility standards with respect to the composite score formula. If the institution does not satisfy these requirements, ED may condition its approval of the change of ownership on the institution’s agreement to letters of credit, provisional certification, and additional monitoring requirements. The composite score formula and related ED conditions are described more fully above in “Student Financing Sources and Related Regulations/Requirements - Department of Education - Regulation of Title IV Financial Aid Programs - Financial Responsibility.” If the new owner does not have the required audited financial statements, ED may impose certain restrictions on the institution, including with respect to adding locations and programs.
State Regulatory Agencies
Many states require institutions of higher education to report or obtain approval of certain changes in ownership or other aspects of institutional status. The types of and triggers for such reporting or approval vary, but many states include the sale of a controlling interest of common stock in the definition of a change of control requiring approval. A change of control may require us to obtain approval of the change in ownership and control in order to maintain our state approval.
35
Accreditors
Many accrediting agencies require institutions of higher education to report or obtain approval for certain changes in ownership or other aspects of institutional status, but the types of and triggers for such reporting or approval vary.
HLC, the accrediting agency for APUS, requires HLC accredited institutions to inform HLC in advance of any substantive change. Examples of substantive changes requiring advance notice to HLC include changes in the legal status, ownership, or form of control of the institution, such as the sale of a for-profit institution. HLC must approve a substantive change in advance in order to include the change in the institution’s accreditation status. HLC also requires an on-site evaluation within six months to confirm the appropriateness of the approval.
HLC oversight extends to defined changes that occur in an institution’s parent or controlling entity, and not necessarily in the institution itself. Actions by, or relating to, an accredited institution, including a significant acquisition of another institution, significant changes in board composition or organizational documents, and accumulations by one stockholder of greater than 25% of the capital stock could trigger additional reviews of the institution and possible change from accredited status to candidate status, which enhances the risks associated with these types of actions. In particular, a change from accredited status to candidate status could adversely impact an institution’s ability to participate in Title IV programs, which in turn would impact the institution’s ability to participate in DoD tuition assistance programs.
ABHES, the accrediting agency for HCN, requires its accredited institutions to notify ABHES of any substantive change. Examples of substantive changes requiring notice to and approval by ABHES include changes in the legal status, form of control, or ownership of the institution. An institution must notify ABHES of a change of ownership within at least 45 days before the close of the transaction, and ABHES must act to reinstate the institution’s accreditation status after the change of ownership. ABHES also requires an on-site evaluation within six months to confirm the appropriateness of the approval.
Should we attempt to enter into transactions with institutions accredited by other accreditors, we would be required to follow the requirements of such accreditors. Our management may not have experience with the accreditors of the target institution, which would increase the risks related to such a transaction and management of the institution subsequent to the transaction.
Other Agencies
In certain circumstances, state approving agencies responsible for oversight of veterans’ education benefits may require an institution to obtain approval for a change in ownership and control. The state approving agency in Ohio approved the November 1, 2013 change of ownership of HCN. However, there is no guarantee that relevant state approving agencies will approve future transactions.
Restrictions on Adding Locations and Educational Programs
ED may, as a condition of certification to participate in Title IV programs, require prior approval of new locations, programs, or otherwise restrict the number of programs an institution may add. ED’s regulations also require institutions to report and, in certain cases (such as when an institution is provisionally-certified), to seek approval for a new additional campus location at which at least 50% of an eligible program will be offered if the institution wants to disburse Title IV program funds to students enrolled at that location. Institutions are responsible for knowing whether they need approval, and institutions that add locations and disburse Title IV program funds without having obtained any necessary approval may be subject to administrative repayments and other sanctions.
The HEA requires for-profit institutions to be in full operation for two years before qualifying to participate in Title IV programs. However, ED regulations in many circumstances permit an institution that is already qualified to participate in Title IV programs to establish additional campus locations that are exempt from the two-year rule. The new campus location must satisfy all other applicable requirements for institutional eligibility, including approval by the relevant state authorizing agency and the institution’s accrediting agency.
A fully-certified degree-granting institution generally is not obligated to obtain ED’s approval of an additional program leading to a degree at the same level previously approved by ED, or of a new program that both prepares students for gainful employment in the same or related recognized occupation as an educational program that has previously been designated as an eligible program at that institution and meets certain minimum-length requirements. However, ED could require prior approval of such programs or otherwise restrict the number of programs an institution may add. In the event that an institution is required
36
to obtain ED’s approval for the addition of a new program, fails to do so, and erroneously determines that the new educational program is eligible for Title IV program funds, the institution could be liable for repayment of those Title IV program funds.
Other Recent Legislative and Regulatory Activity
Many of our students rely on federally funded programs, including Title IV programs, DoD tuition assistance and education benefits administered by the VA that may be affected by changes in the federal budget. Due to the substantial amount of federal funds disbursed to schools through Title IV programs, the large number of students and institutions participating in these programs, and significant political interest in the cost of education, Congress continues to show interest in regulation and oversight of institutions of higher education, especially those that are for-profit.
Department of Defense
The Budget Control Act of 2011 put into place a series of automatic federal budget cuts, known as sequestration, that impacted certain federal student aid programs beginning in fiscal year 2013. As a result of uncertainty about the availability of funding, several military branches initially suspended and later announced changes to their tuition assistance programs. For example, the Army now requires service members to complete one year of service after graduation from Advanced Individual Training in order to be eligible for tuition assistance, and the Army and the Coast Guard have both reduced the total per service member annual benefits.
Congressional inaction on budgetary matters has led to lapses in funding, resulting government shutdowns, and subsequent policy changes that have affected federal student aid programs at DoD. For example, funding for the federal government, including the DoD, lapsed on each of January 20, 2018 and February 9, 2018, resulting in partial shutdowns that lasted for a few days and several hours, respectively. Funding for some portions of the federal government, not including the DoD, lapsed on December 22, 2018, resulting in a partial government shutdown that lasted for 35 days. The Coast Guard suspended its tuition assistance program during this partial government shutdown and the Marine Corps began to require Marines to have 24 months on active duty prior to being eligible to apply for tuition assistance. A future government shutdown, particularly one that includes DoD or suspension or resulting modification of DoD tuition assistance programs, could have a material adverse effect on our operations and financial condition.
In May 2019, the Navy announced that as a result of increased demand stemming from improvements in service delivery and higher limits on annual benefits available per sailor, tuition assistance benefits available to sailors for the fiscal year ended September 30, 2019 were exhausted by the end of May 2019, and effective May 28, 2019 the Navy ceased approving tuition assistance program funds for eligible sailors until the start of the new government fiscal year on October 1, 2019. In addition, effective October 1, 2019, Navy service members must have a minimum of two years of service before becoming eligible to use tuition assistance or the Navy College Program for Afloat College Education, funding is capped at twelve semester hours per fiscal year, and career funding is capped at 120 semester hours. On June 6, 2018, the Secretary of the Army issued Army Directive 2018-09, changing the Army tuition assistance eligibility policy by eliminating the one-year waiting period to pursue an undergraduate certificate or degree and the ten-year waiting period to pursue a graduate degree through use of tuition assistance. Under the new policy, effective beginning August 5, 2018, Army soldiers are eligible for two tiers of tuition assistance depending on their current level of civilian education.
On July 12, 2018, DoD announced a change to the Post-9/11 GI Bill regarding the ability of service members to transfer their educational benefits to eligible family members. Beginning July 12, 2019, the eligibility to transfer the educational benefits is limited to service members with at least six but fewer than 16 years of total service.
On March 2, 2020, the Navy announced a new “Education Strategy for Seapower 2020” that is intended to be a new comprehensive education strategy. While the details and impact of this particular strategy are still uncertain, we expect each military branch and the DoD to continually evaluate their approach to education funding, and the resulting changes could have an impact on the funds available to service members to pursue their education at our institutions.
Higher Education Act
The HEA must be periodically reauthorized by Congress and each Title IV program must be funded through appropriations acts on an annual basis. The most recent comprehensive reauthorization occurred in 2008 when Congress reauthorized most HEA programs through the 2014 federal fiscal year. In 2018, the House of Representatives considered proposals from Republicans and Democrats, referred to as the Promoting Real Opportunity, Success, and Prosperity through Education Reform Act, or PROSPER Act, and the Aim Higher Act, respectively, but neither proposal became law.
37
Congress currently is in the process of considering comprehensive legislation to reauthorize the HEA, including proposals from Republicans and Democrats, referred to as the Student Aid Improvement Act and the College Affordability Act, respectively.
We cannot predict whether, in what form, or when, the two houses of Congress will reauthorize the HEA or whether, or when, the President will sign reauthorization legislation. Amendments to the HEA could occur as part of reauthorization, which could require us to modify our business practices and increase administrative costs, thereby negatively impacting our results of operations.
As discussions concerning reauthorization of the HEA continue, on December 19, 2019, the Fostering Undergraduate Talent by Unlocking Resources for Education Act, or FUTURE Act, was signed into law. Among other things, the FUTURE Act amends the Internal Revenue Code to allow the Internal Revenue Service to share taxpayer data directly with ED, which is intended to streamline the process of applying for Title IV program aid, reduce the need for institutions to verify students’ eligibility for Title IV program funds, and simplify the process for borrowers to enroll in income-driven repayment plans with respect to their federal loans.
Other Regulatory Activity
Regulatory Reform Executive Order
Executive Order 13777, “Enforcing the Regulatory Reform Agenda,” signed by the President on February 24, 2017, directs federal agencies including ED to establish a Regulatory Reform Task Force to evaluate existing regulations and make recommendations to the agency head regarding the regulations. The first Progress Report from the ED Regulatory Reform Task Force identified a list of over 150 ED regulations and 1,772 issues of policy-related guidance that would be reviewed by the Task Force. In October 2018, the ED Regulatory Reform Task Force announced that ED’s Office for Postsecondary Education had identified a total of 1,230 guidance documents that were out-of-date and that it intended to withdraw. Those documents constituted nearly 80% of the Office of Postsecondary Education’s total of 1,562 guidance documents.
Federal Rulemakings
On July 1, 2019, ED published a final rule rescinding the GE Regulations. The rescission is scheduled to take effect July 1, 2020. For additional information, see “Gainful Employment,” above.
On September 23, 2019, ED published the 2020 Borrower Defense Regulations, which among other things, established a new federal standard for evaluating, and a new process for adjudicating, borrower defenses to repayment of loans made under the Direct Loan Program on or after July 1, 2020. The 2016 Borrower Defense Regulations, which became effective October 16, 2018, will remain in effect until July 1, 2020 and will thereafter continue to apply to all loans made under the Direct Loan Program on or after July 1, 2017 and before July 1, 2020. For additional information about the 2016 Borrower Defense Regulations and 2020 Borrower Defense Regulations, see “Financial Responsibility” and “Borrower Defenses,” above.
In October 2018, ED announced that it would establish the Accreditation and Innovation Committee to prepare proposed regulations related to, among other things, ED’s recognition of accrediting agencies and institutional and programmatic eligibility issues, including state authorization and courses offered through distance education, respectively. In April 2019, The Accreditation and Innovation Committee reached consensus on proposed regulatory language. On June 12, 2019, ED published certain portions of the agreed-upon regulatory language, including those provisions related to accreditation and state authorization, in a notice of proposed rulemaking. On November 1, 2019, ED published final regulations concerning accreditation and state authorization, which generally will be effective on July 1, 2020, except that institutions may in their discretion implement early regulations relating to state authorization and institutional information disclosures. APUS implemented early those regulations effective November 1, 2019. For additional information on these final regulations, see “Accreditation” and “State Authorization of Online Education,” above. On December 11, 2019, in a notice of proposed rulemaking, ED published additional portions of the agreed-upon regulatory language, including provisions related to the participation of faith-based entities in the Title IV programs and certain rules related to the TEACH Grant program. ED has indicated that it will issue an additional notice of proposed rulemaking to address other provisions in the agreed-upon regulatory language developed as part of the negotiated rulemaking, including provisions related to courses delivered by distance education. We are unable to predict the result of any other current or future rulemakings.
On November 29, 2018, ED published in the Federal Register a notice of proposed rulemaking regarding related to implementation of Title IX of the Education Amendments of 1972, which prohibits discrimination on the basis of sex in education programs that receive funding from the federal government. The proposed regulations would define what constitutes
38
sexual harassment for purposes of Title IX in the administrative enforcement context, would describe what actions trigger an institution’s obligation to respond to incidents of alleged sexual harassment, and would specify how an institution must respond to allegations of sexual harassment. We cannot predict what final regulations will be adopted as a result of this rulemaking process.
State Regulation
As discussed above in “Consumer Protection - Other Issues Related to Consumer Protection and Complaints,” many states have become more active in regulating for-profit education from a consumer protection perspective, specifically in regards to enforcement of consumer protection laws and implementation of new regulations by state attorneys general. Since our institutions operate in many jurisdictions, our institutions may be subject to regulations promulgated by a variety of regulators.
39
ITEM 1A.
RISK FACTORS
Investing in our common stock involves a high degree of risk. Before making an investment in our common stock, you should carefully consider the following risks, as well as the other information contained in this Annual Report, including our “Financial Statements and Supplementary Data” and “Management’s Discussion and Analysis of Financial Condition and Results of Operations.” Any of the risk factors described below could significantly and adversely affect our business, financial condition, operating results, cash flows, and prospects. The risks and uncertainties described below are not the only ones we face. Additional risks and uncertainties not presently known to us or that we currently believe are not material may also adversely affect our business, financial condition, operating results, cash flows, and prospects. As a result of the risks and uncertainties described below as well as such additional risks and uncertainties, the trading price of our common stock could decline, and you may lose all or part of your investment.
Risks Related to Attracting and Retaining Students
Our success and financial performance depends on the effectiveness of our ability to attract students who persist in our institutions’ programs.
Building awareness and reputation among potential students of our institutions and the programs they offer is critical to our institutions’ ability to attract new students. In order to maintain and increase our revenue and profits, our institutions must continue to attract new, qualified students in a cost-effective manner, and these students must remain active in our institutions’ programs. In addition, because our institutions experience declines in their student population as a result of graduation, transfers to other academic institutions, withdrawals, military deployments and other reasons, in order to grow we need to first attract sufficient students to replace those who have left. Some of the factors that could prevent us from successfully advertising and marketing our institutions’ programs and from successfully enrolling and retaining qualified students in those programs include:
|
•
|
changes and revisions to policies of the DoD and the various military services;
|
|
•
|
challenges in maintaining strong relationships with military and military-affiliated communities;
|
|
•
|
the emergence of more, and more successful, competitors, and alternative education models;
|
|
•
|
factors related to our institutions’ marketing, including the costs of internet advertising and multi-faceted interactive marketing campaigns;
|
|
•
|
challenges in designing marketing campaigns that successfully attract college-ready students;
|
|
•
|
the reduced availability of, or higher interest rates and other costs associated with, Title IV loan funds or other sources of financial aid;
|
|
•
|
performance problems with our institutions’ online systems;
|
|
•
|
our institutions’ failure to maintain accreditation, state authorization, eligibility for Title IV programs or other sources of financial aid, or other approvals;
|
|
•
|
increased regulation of online education, including in states in which we do not have a physical presence;
|
|
•
|
investigations or litigation by government agencies, other regulators, or private parties that may limit our ability to operate or damage our reputation;
|
|
•
|
challenges in maintaining a positive reputation among students, employers, and other stakeholders;
|
|
•
|
student dissatisfaction with our institutions’ services and programs;
|
|
•
|
failure to develop, deliver and maintain a message or image for APUS that resonates well with non-military students;
|
|
•
|
adverse publicity regarding us, our institutions, our competitors, or online or for-profit education generally;
|
|
•
|
a decline in the acceptance of online education generally; and
|
|
•
|
a decrease in the perceived or actual economic benefits that students derive from our institutions’ programs or programs provided by for-profit schools generally.
|
If we are unable to continue to develop awareness and reputation of our institutions and the programs we offer, and to recruit and enroll students that persist in our programs over time, our enrollments will suffer and there could be a material adverse effect on our financial condition and results of operations.
40
If we are unable to effectively market our programs, our operating results would be negatively affected.
Our marketing strategy for APUS traditionally focused on building long-term, mutually beneficial relationships with organizations and individuals in the military, military-affiliated, and public service communities. However, with limitations on access to military students, as discussed further below under the Risk Factor that begins “If APUS does not have strong relationships with, and access to, various military installations . . .” and with a continued focus on efforts to attract students outside of the military, we must continue to focus on marketing channels that attract college-ready students unaffiliated with the military who perform well at APUS. However, we have experienced challenges attracting college-ready students unaffiliated with the military who perform well at APUS, and there is no assurance that we will be able to do so on a cost-effective basis.
Furthermore, because APUS’s tuition is generally lower than that of most of its competitors, it has fewer dollars to spend per student on marketing and advertising than they do. Nevertheless, APUS has tried to, and may in the future try to, implement new marketing tactics and channels, including those with which it has no experience and which have no guarantee of success. For example, our Board of Directors has approved an increase in marketing expenditures for fiscal 2020, including to support a new advertising campaign focusing on affordability and return on investment for learners. If we are unable to develop and optimize marketing and advertising programs that are effective in developing awareness of our institutions and the programs we offer and their value propositions, and are unable to enroll and retain qualified students in military and non-military markets, our enrollments would suffer, and there could be a material adverse effect on our financial condition and results of operations.
The success of HCN depends, in part, on our ability to maintain and increase student enrollments in HCN’s programs. Enrollments in HCN’s ADN Program in 2019 were significantly lower than HCN planned, resulting in a significant decline in revenue in our HCN Segment. We believe the decline in enrollments is likely partly associated with the implementation of new academic achievement and admissions requirements, as well as negative perceptions by certain current and prospective student cohorts, among other potential factors. While we work on identifying the appropriate balance of academic achievement requirements, admissions requirements, and attracting appropriate students, as well as identifying and remediating the factors impacting enrollments, there may continue to be a negative impact on enrollments at HCN. We cannot predict whether our initiatives and efforts will be successful over the long term and cannot guarantee that we will be able to reverse the enrollment and revenue decline in our HCN Segment or return to our prior level of enrollments. Although we cannot predict what adjustments may be necessary or costs may be incurred as a result of the decline in enrollment at HCN, any such adjustments and costs may have an adverse impact on our results of operations or financial condition. In addition, with the opening of HCN’s fifth campus in Toledo in January 2017 and the planned opening of HCN’s sixth campus in Indianapolis, Indiana in the second quarter of 2020, we have been marketing in geographic areas in which HCN did not previously have a campus. If in the future we are unable to effectively market HCN’s programs, we may not be able to successfully maintain and increase HCN enrollments, which would negatively affect our operating results.
Changes our institutions may make to their operations to improve the student experience and enhance their ability to identify and enroll students who are likely to succeed may adversely affect our institutions’ enrollment, profitability, financial condition, results of operations, and cash flows.
In order to improve the learning experience of our students and to attract students who are likely to persist in our institutions’ programs, we have identified, and continue to work to identify, potential changes and initiatives that we believe will more effectively attract and enroll college-ready students, support those students, and help improve those students’ educational outcomes, including through systems, faculty-related initiatives and co-curricular initiatives to increase the level of engagement and collaboration in the classroom and to strengthen the bond between APUS and its students. APUS has made multiple changes to its admissions assessment process and may further modify it in the future in order to better identify college-ready students. For example, APUS implemented a process in 2017 requiring enhanced certification of prospective non-military students’ prior transcripts to confirm their authenticity and evaluate them for transfer credit.
Additional initiatives may include the following:
|
•
|
further changing admissions standards and requirements;
|
|
•
|
updates to the admissions process and procedures;
|
|
•
|
implementing more stringent satisfactory academic progress standards;
|
|
•
|
changing tuition costs and payment options;
|
|
•
|
experimenting with additional CBE programs and other alternative delivery methods; and
|
|
•
|
altering our institutions’ marketing efforts to target the appropriate prospective students.
|
HCN has also been implementing changes, including changes to its curriculum, admissions, and academic achievement and course retake policies, that are designed to improve NCLEX scores and retention rates over time.
41
These initiatives may adversely impact our institutions’ business, financial condition, results of operations, and cash flows, particularly in the near term. These initiatives require significant time, energy, and resources. We may not succeed in achieving our objectives due to organizational, operational, regulatory, resource, or other constraints. If our efforts are not successful, we may experience reduced enrollment, increased expense, or other impacts on our business that materially and adversely impact our results of operations, cash flows, and financial condition. Even if these initiatives successfully lead to the identification and enrollment of students who are likely to succeed and to improvements in student experience, they could result in adverse impacts on enrollments. Due to the many factors that can impact enrollments, we may not appropriately identify the cause of any adverse impacts, and therefore may not be able to appropriately modify our initiatives.
If APUS does not have strong relationships with, and access to, various military installations and installation education centers, our ability to maintain enrollments from military students and our future growth may be impaired.
As of
December 31, 2019
, approximately
57%
of APUS’s students self-reported that they served in the military on active duty at the time of initial enrollment, and a significant portion of APUS students rely on DoD tuition assistance programs to pay for their education. We are highly dependent on our relationship with the military and its members, and our ability to attract and retain military service members as students. Because APUS relies on referrals and personal relationships for recruiting, impediments to access can have an adverse effect on maintaining and generating registrations from military students.
DoD has issued briefings that prohibit base commanders from authorizing educational institutions to hold regular or recurring office hours solely to provide counseling and prohibit former military members from accessing installations to represent an educational institution using their government ID card privileges. This has adversely affected our efforts to support existing students and recruit new students. If we are not able to improve our access to military installations and our existing students on those installations, or find alternative methods to serve those students, our military enrollments could continue to decline. Furthermore, the DoD MOU, which specifies terms and conditions of participation in DoD tuition assistance programs and is discussed in more depth in “Regulatory Environment - Department of Defense” in Part I, Item 1 of this Annual Report, and the related increased focus by DoD on relationships with and oversight of educational providers, or additional DoD restrictions, could lead to further adverse changes in the nature of our relationships with military installations and their education centers and our access to military service members.
An inability to maintain strong relationships with installation education centers and with military service members would have an adverse effect on APUS’s ability to attract and retain qualified students, resulting in an adverse effect on our financial condition.
Enrollments and course registrations by active duty service members may be adversely affected by a variety of factors not directly related to education programs, including changes in military activity and budgets.
Events not directly related to education programs that could occur in the future could lead to a reduction in registrations from students on active duty. For example, large-scale personnel reductions or other significant drawdowns of U.S. active duty military forces would likely have a negative effect on enrollment and course registrations. Increased operations and overseas deployments across all branches of the military and the related increased demands on many active duty service members, combined with limited internet access associated with some deployments, could also negatively impact the ability of certain active duty military students to pursue higher education.
Military budget cuts or constraints could also negatively affect us by leading to force reductions or cuts to services and tools that we or APUS’s students rely upon for recruitment, enrollment, access, and tuition assistance. Even temporary changes to military activity and budgets may adversely affect operations. For example, funding for the federal government, including the DoD, lapsed in January 2018 and February 2018, resulting in partial shutdowns that lasted for a few days and several hours, respectively. Funding for some portions of the federal government, not including DoD, lapsed on December 22, 2018, resulting in a partial government shutdown that lasted for 35 days. In addition, as a result of increased demand stemming from improvements in service delivery and raised limits on annual benefits available per sailor, tuition assistance benefits available to sailors for the fiscal year ending September 30, 2019 were exhausted by the end of May 2019, and effective May 28, 2019 the Navy ceased approving tuition assistance program funds for eligible sailors until the start of the new government fiscal year on October 1, 2019. The temporary exhaustion of Navy tuition assistance program funds had a significant negative impact on our results of operations for the third quarter of 2019, and negatively impacted October 2019 revenue by approximately $0.4 million. Any future government shutdown or suspension of DoD tuition assistance programs could have a material adverse effect on APUS’s enrollments.
42
We will remain subject to the risk of events that occur within and with respect to the military, even where they do not directly relate to the use of DoD tuition assistance programs. Because of our dependence on active duty military students, changes that occur within and with respect to the military could have a material adverse effect on our operations.
DoD tuition assistance programs offered to service members of the U.S. Armed Forces constituted approximately
39%
of APUS’s adjusted net course registrations for
2019
, and our revenue and number of students would decrease if APUS is no longer able to receive funds under these tuition assistance programs or if tuition assistance is reduced, eliminated, or suspended.
Service members of the U.S. Armed Forces are eligible to receive tuition assistance from their branch of service through the DoD tuition assistance programs. Service members may use DoD tuition assistance programs to pursue postsecondary education at institutions that are accredited by an accrediting agency recognized by ED and that satisfy other requirements, including execution of, and compliance with, an MOU that specifies terms and conditions of participation in DoD tuition assistance programs. Students participating in DoD tuition assistance programs constituted approximately
39%
of APUS’s adjusted net course registrations for
2019
.
We do not know the scale or nature of future actions that may be taken with respect to DoD tuition assistance programs, which could include eliminating those programs, reducing the funds, benefits, or level of reimbursement available thereunder, changing the eligibility criteria for beneficiaries, enacting new restrictions on institutional participation or imposing other eligibility criteria on institutions, all of which could impact enrollments from service members. Other administrative changes to DoD programs could also have negative effects on our enrollments. For example, as discussed in “Regulatory Environment - Department of Defense,” in March 2013, DoD restricted the ability of service members who have not previously taken a postsecondary education course and are in certain overseas duty locations to receive DoD tuition assistance for courses offered by institutions of higher education, such as APUS, that are not parties to contracts with DoD to provide DoD voluntary education programs at those locations. As a result, our ability to retain existing students or enroll new students who are service members at those locations was curtailed.
Changes to eligibility requirements under the DoD tuition assistance programs have already occurred, and we expect there could be additional changes to the programs in the future. For example, as discussed in “Regulatory Environment - Department of Defense,” several of the military services announced changes to their tuition assistance programs that took effect in federal fiscal years 2014 and 2018. In addition, effective October 1, 2019, all Navy service members must have a minimum of two years of service before becoming eligible to use tuition assistance or the Navy College Program for Afloat College Education, funding is capped at twelve semester hours per fiscal year, and career funding is capped at 120 semester hours. These policies could have a negative impact on our enrollments. Additional changes to DoD tuition assistance programs could occur due to Congressional action or DoD policy and funding changes. Annual tuition assistance funding is limited and could be exhausted in any given year due to budget constraints or changes in demand or policy. For example, as a result of increased demand stemming from improvements in service delivery and raised limits on annual benefits available per sailor, tuition assistance benefits available to sailors for the fiscal year ending September 30, 2019 were exhausted by the end of May 2019, and effective May 28, 2019 the Navy ceased approving tuition assistance program funds for eligible sailors until the start of the new government fiscal year on October 1, 2019. The temporary exhaustion of Navy tuition assistance program funds had a significant negative impact on our results of operations for the third quarter of 2019, and negatively impacted October 2019 revenue by approximately $0.4 million. We are unable to predict whether and to what extent the Navy will continue to impose limitations on tuition assistance program approvals as a result of limited funding. Furthermore, in March 2020, the Navy announced a new “Education Strategy for Seapower 2020” that is intended to be a new comprehensive education strategy. While the details and impact of this particular strategy are still uncertain, we expect each military branch and the DoD to continually evaluate their approaches to education, and any resulting changes could have an impact on the funds available to service members to pursue their education at our institutions. Changes in funding allocations could have a material adverse effect on APUS’s enrollments.
If we are no longer able to receive funds from DoD tuition assistance programs, or if those programs are modified, reduced, eliminated, or temporarily suspended, our enrollments and revenue could be significantly reduced, which would result in a material adverse effect on our results of operations and financial condition.
We have limited experience participating in the DoD’s credentialing assistance programs, and changes to credentialing assistance programs or funding could have an adverse impact on our business strategy and results of operations.
As discussed in “Regulatory Environment - Student Financing Sources and Related Regulations/Requirements - Department of Defense” in Part I, Item 1 of this Annual Report, branches of the U.S. military offer credentialing assistance, which links soldiers to and in many cases provides funds for approved training courses or exams related to occupational
43
certifications, and associated books, supplies and materials. While benefits vary by service, service members may be eligible for assistance in paying for certifications, including by vouchers, reimbursement, or grants. Our ability to comply with regulatory requirements related to credentialing assistance and to enroll students in programs eligible for credentialing assistance remains uncertain. We have limited experience in offering programs eligible for credentialing assistance and have few current offerings in credentialing assistance, and as a result may not be as recognized for credentialing assistance as other providers that have developed or may develop a stronger brand. Failure to comply with applicable regulatory requirements or to enroll students in credentialing assistance programs could have an adverse effect on our results of operations, our financial condition, and our plans to increase the use of credentialing assistance at APUS.
The Army is now offering an expanded credentialing program called the Army Credentialing Assistance Program, or CA. Students in the Army may use both DoD tuition assistance and credentialing assistance for CA, subject to a combined cap on benefit amounts. As a result, soldiers that take advantage of one of these forms of assistance may not be able to use the other form to the extent that they otherwise might, which could adversely impact enrollments and our results of operations. Over time, it is possible that increased use of credentialing assistance could result in fewer funds being used or available for tuition assistance. In addition, to be eligible for credentialing assistance, students must meet certain eligibility requirements, including in some cases service time, experience and DoD tuition assistance eligibility requirements, and the training program must also be eligible.
While we believe other service branches may follow the Army’s example in expanding their credentialing programs or pursue other approaches to enhancing support for credentialing, there can be no assurance that they will do so or that we will benefit from any such expansion or enhancement
.
In addition, the DoD and military branches could eliminate credentialing assistance programs, reducing the funds, benefits, or level of reimbursement available for credentialing, change the eligibility criteria for beneficiaries, enact new restrictions on institutional participation or impose other eligibility criteria on institutions, all of which could impact enrollments from service members. Changes to DoD tuition assistance programs and funds could also have an impact on credentialing assistance programs and funds, and vice versa.
If our institutions are unable to successfully adjust to future market demands by updating and expanding the content of existing programs and developing new programs, specializations, and modes of teaching on a timely basis and in a cost-effective manner, our performance may be impaired.
We believe that our institutions need to continuously update and expand the content of their existing programs and develop new programs, specializations, and modes of teaching in order to continue to retain and attract qualified students. However, the updates and expansions of our institutions’ existing programs and the development of new programs and specializations may not be accepted by their accreditors, state regulators, ED, existing or prospective students, or employers. If we cannot respond to changes in market requirements, our business may be adversely affected. Even if our institutions are able to develop acceptable new programs, they may not be able to introduce these new programs as quickly as students require or as quickly as competitors introduce competing programs. To offer a new academic program, our institutions may be required to obtain appropriate federal, state, and accrediting agency approvals, which may be conditioned or delayed in a manner that could significantly affect our growth plans. If we are unable to respond adequately to changes in market requirements due to financial constraints, regulatory limitations, or other factors, our institutions’ ability to attract and retain students could be impaired and our financial results could suffer.
Establishing new academic programs, specializations, and modes of teaching or modifying or eliminating existing programs requires our institutions to make investments in management, academic resources including faculty, and capital expenditures, incur marketing expenses, and reallocate other resources. Our institutions may have limited experience providing courses in new fields of study or new modes of teaching (such as CBE, micro-credentials, or other non-degree credentials) and may need to modify systems and strategies or enter into arrangements with other institutions and organizations to provide new programs effectively and profitably. If our institutions are unable to establish new academic programs, increase the number of students enrolling in new academic programs, offer programs in a cost-effective manner, or otherwise manage effectively the operations of those programs, our results of operations and financial condition could be adversely affected.
If we are unable to successfully pursue HCN’s program initiatives and expansions, including opening new HCN campuses, our future growth may be impaired.
We experienced decreases in enrollment at HCN in 2019, which resulted in a significant decline in revenue in our HCN Segment. The success of HCN will depend on our ability to maintain and increase student enrollments in HCN’s programs and grow HCN’s on-campus offerings. As part of our strategy, we intend to open new campuses for HCN, such as the new campus in suburban Toledo, Ohio that began operations in early 2017, and the new campus in Indianapolis, Indiana that we expect to begin operations in the second quarter of 2020. Such actions require us to obtain appropriate federal, state, and accrediting agency
44
approvals and to comply with any requirements from those agencies related to a new location. For example, under ABHES rules, HCN was not permitted to seek ABHES approval for a new location until twelve months after HCN received its initial ABHES accreditation in June 2018. Adding new locations may also require significant financial investments, human resource capabilities, and new clinical placement relationships. In addition, regulatory authorities may place limitations or restrictions on new programs or campuses, including by only provisionally accrediting programs or limiting the number of initial enrollees. For example, in November 2019, the Indiana State Board of Nursing voted to grant initial accreditation for a PN Program at HCN’s Indianapolis campus, but growth beyond an initial cohort of up to 30 students for the first year is subject to HCN’s ability to petition to increase the number of admissions after a site visit that will occur upon graduation of the first cohort. The Indiana State Board of Nursing will not grant the Indianapolis campus full accreditation status until the first cohort graduates, and may not grant full accreditation at that time if the program has a pass rate lower than one standard deviation below the average national pass rate.
If we are unable to, or suffer any delay in our ability to, obtain appropriate approvals, attract additional students to new campus locations, offer programs at new campuses in a cost-effective manner, identify appropriate clinical placements, or otherwise manage effectively the operations of newly established campuses, our results of operations and financial condition could be adversely affected. In addition, the inability to expand efficiently or successfully existing programs, pursue new program initiatives, and add new campuses would harm our ability to grow the business and could have an adverse impact on our financial condition.
Strong competition in the postsecondary education market could decrease our institutions’ market share and increase our cost of acquiring students.
Within the postsecondary education market, our institutions compete primarily with not-for-profit public and private two-year and four-year colleges, as well as other for-profit schools, particularly those that offer online learning programs. Public institutions receive substantial government subsidies, and public and private not-for-profit institutions have access to government and foundation grants, tax-deductible contributions, and other financial resources generally not available to for-profit schools. These institutions may have instructional and support resources, or course delivery tools, that are superior to those of our institutions and other for-profit schools. Many of these competitors, whether for-profit, not-for-profit, or public, are also able to leverage their greater scale and size to more efficiently compete. Many of our competitors also have substantially greater name recognition and financial and other resources than we have, which may enable them to compete more effectively for potential students, or to provide instructional and support resources that are superior to those of our institutions and other for-profit schools. In addition, the DoD and military services may establish their own undergraduate education programs and begin offering distance learning for graduate degrees through their own institutions. Within the postsecondary education market generally, we have experienced increased competition, including the entrance of additional providers of online and non-traditional programs, a shift of for-profit institutions to not-for-profit status, and declines or slower growth in the total postsecondary student population. According to the National Student Clearinghouse, enrollment in Title IV postsecondary degree-granting institutions in the fall of 2019 decreased 1.3%, compared to the fall of 2018, with a decrease of 2.1% taking place among four-year for-profit schools. Longer term projections suggest that previous growth in enrollment in postsecondary degree-granting institutions is slowing. According to a May 2019 report from ED, such enrollment was projected to grow 3% over the 11-year period ending in fall of 2028, compared to 27% growth over the 17-year period that ended in 2017. The combination of reduced growth or declines in the postsecondary student population and the entrance of additional providers in the online postsecondary education market will further intensify competition, and any decline in the number of enrollments could have an adverse effect on our results of operations. In addition, increased competition for college-ready students has led to an increase in the cost of advertising in certain marketing channels. Continued increases in the cost of advertising may adversely impact our ability to attract college-ready students and/or increase our student acquisition costs.
We expect to continue to face greater competition from non-traditional offerings, provided by both educational institutions and non-traditional providers.
In recent years, competing institutions and others have started providing non-traditional education programs without charge or at low costs, including CBE programs, coding bootcamps, and micro-credentialing. We believe that our institutions will continue to face new competition from non-traditional programs, including lower cost programs. While we are working to develop our own alternatives in some of these areas, including through the launch of Momentum, a collection of CBE programs at APUS, in the first quarter of 2017, other institutions have programs that are more fully developed, and our offerings may not receive market acceptance. Since May 2018, APUS has limited enrollments in Momentum until system infrastructure is upgraded. Our institutions may not be able to compete successfully against current or future competitors and may face competitive pressures that could adversely affect their business or results of operations. Increased availability of federal student financial aid for CBE programs could create additional competition and drive additional students toward non-traditional
45
education programs. These competitive factors could cause our institutions’ enrollments, revenue, and profitability to decrease significantly.
Strong competition in the military market could decrease our institutions’ market share and increase our cost of acquiring students.
We anticipate that APUS will continue to see strong competition within the military market, which continues to be a primary market for APUS. There are a number of for-profit schools and not-for-profit institutions that focus on the military market because of the size of the market and the availability of funding, and some for-profit schools seek to attract students eligible for DoD tuition assistance programs, VA education benefits, or both, at least in part as a strategy of those institutions to satisfy the 90/10 Rule, which is described in “Regulatory Environment - Student Financing Sources and Related Regulations/Requirements - Department of Education - Regulation of Title IV Financial Aid Programs - The ‘90/10 Rule.’” Some of these institutions may develop relationships with the military and education service officers that are stronger than APUS’s, which could have an adverse effect on APUS’s ability to attract and retain qualified students, and ultimately, on our financial condition.
Risks Related to the Regulation of Our Industry
If we or our institutions fail to comply with the extensive regulatory requirements for the operation of postsecondary education institutions, we and our institutions could face penalties and significant restrictions on operations, including loss of access to DoD tuition assistance programs and federal student loans and grants.
We and our institutions are subject to extensive regulation by (i) accrediting agencies, (ii) state regulatory bodies, and (iii) the federal government through ED. APUS and HCN also are subject to DoD and VA oversight because APUS and HCN participate in DoD tuition assistance programs and veterans’ education benefits programs administered by the VA. Regulations, standards, and policies of these organizations address the vast majority of our institutions’ operations, including their educational programs, facilities, instructional and administrative staff, administrative procedures, marketing, recruiting, financial operations, and financial condition. These regulatory requirements can also affect our ability to acquire new institutions, open new locations, add new or expand existing educational programs, change our corporate structure or ownership, and make other substantive changes. These requirements can also increase our cost of operations.
Findings of noncompliance with these laws, regulations, standards, and policies could result in any of the relevant regulatory agencies taking action including: imposing monetary fines, penalties, or injunctions; limiting operations, including restricting our institutions’ ability to offer new programs of study or to open new locations, or imposing limits on our growth; limiting or terminating our ability to grant degrees; restricting or revoking our institutions’ accreditation, licensure, or other approval to operate; limiting, suspending, or terminating our institutions’ eligibility to participate in Title IV programs, DoD tuition assistance programs, or VA education benefit programs; requiring us to repay funds, post a letter of credit, or become subject to payment methods for Title IV programs that are not the advance payment system; subjecting us to civil or criminal penalties; or other actions that could have a material adverse effect on our business.
The regulations, standards, and policies of ED, state regulatory bodies, and our institutions’ accrediting agencies change frequently and are subject to interpretive ambiguities. Recent and pending changes in, or new interpretations of, applicable laws, regulations, standards, or policies, or our noncompliance with any applicable laws, regulations, standards, or policies, could have a material adverse effect on our accreditation, authorization to operate in various states, permissible activities, receipt of funds under DoD tuition assistance programs, ability to participate in Title IV programs, ability to participate in VA education benefit programs, or costs of doing business. We cannot predict with certainty how these regulatory requirements will be applied or whether we will be able to comply, or will be deemed by others to have complied, with all of the requirements.
In addition, in some circumstances of noncompliance or alleged noncompliance, we may be subject to lawsuits under the Federal False Claims Act, similar state false claim statutes, or various “whistleblower” statutes. These lawsuits in some cases can be prosecuted by a private plaintiff in respect of some action taken by us, even if ED or another regulatory body does not agree with the plaintiff’s theory of liability, or the government can intervene and become a party to the lawsuit. These lawsuits have the potential to generate significant financial liability linked to our receipt of government funds, including Title IV funding and DoD tuition assistance funds.
If our institutions fail to maintain their institutional accreditation, they would lose the ability to participate in DoD tuition assistance programs and Title IV programs.
Accreditation by an accrediting agency that is recognized by ED is required for participation in DoD tuition assistance programs and Title IV programs. APUS and HCN participate in DoD tuition assistance programs and Title IV programs. As
46
described more fully in each operating segment’s section in “Our Institutions - Accreditation” and “Regulatory Environment - Accreditation,” APUS is accredited by HLC and HCN is accredited by ABHES, which are institutional accrediting agencies recognized by ED.
Our institutions’ accrediting agencies may impose restrictions on their accreditation or may terminate their accreditation. To remain accredited, our institutions must continuously meet certain criteria and standards relating to, among other things, performance, governance, institutional integrity, educational quality, faculty, administrative capability, resources, and financial stability. Our institutions also must comply with accrediting agency policies and requirements, such as the requirements to apply and wait for approval before making certain changes. For example, in connection with the implementation of a shared services model with APEI, APUS was required to submit a change in structure application to HLC. In November 2018, HLC approved the change in structure application and extended APUS’s accreditation following adoption of the shared services model, and we entered into intercompany agreements to implement the model.
Failure to meet accreditation criteria or standards or to comply with accreditation policies and requirements could result in the loss of accreditation at the discretion of the accrediting agency. The complete loss of institutional accreditation at one of our institutions would, among other things, render the institution and its students ineligible to participate in DoD tuition assistance programs and Title IV programs, and have a material adverse effect on our enrollments, revenue, and results of operations.
HCN recently changed accrediting bodies and must satisfy accreditation standards, including specific student achievement indicators, with which it has not historically had to comply.
HCN is accredited by ABHES. Some of the ABHES accreditation standards differ from those HCN historically needed to meet under the requirements of ACICS, HCN’s former accreditor, which accredited HCN until October 1, 2018. We have limited experience complying with ABHES requirements. ABHES imposes certain limitations on newly accredited institutions, including a prohibition on applying for a new non-main or satellite campus during the first twelve months after receiving initial accreditation.
In addition, ABHES annually reviews student achievement indicators, including retention rate, placement rate, and licensing and credentialing examination pass rate. Under ABHES policy, ABHES may withdraw accreditation at any time if it determines that an institution fails to demonstrate at least a 70% retention rate for each program, a 70% placement rate for each program, and a 70% pass rate on mandatory licensing and credentialing examinations, or fails to meet state-mandated results for credentialing or licensure. Alternatively, ABHES may in its discretion provide an opportunity for a program to come into compliance within a period of time specified by ABHES, and ABHES may extend the period for achieving compliance if a program demonstrates improvement over time or other good cause. For the reporting year ended June 30, 2018, several HCN programs did not satisfy ABHES’s threshold requirements for retention rates or placement rates. As a result, in February 2019, ABHES directed HCN to provide evidence to ABHES that the relevant programs had achieved a retention rate of at least 70% for the period from July 1, 2018 through March 31, 2019 and a placement rate of at least 70% for the reporting year ended June 30, 2018, along with additional documentation and analysis related to those rates and pertinent action plans. HCN timely submitted the required progress report. For the reporting year ending June 30, 2019, each of HCN’s programs at each of HCN’s campuses satisfied ABHES’s placement rate requirements but failed to satisfy ABHES’s threshold requirements for retention rates.
In August 2019, ABHES notified HCN that ABHES had placed HCN’s Cleveland, Columbus, Dayton, and Toledo locations on outcomes reporting status, which requires submission of additional documentation regarding student outcomes and action plans for improving these outcomes, with respect to the reporting year ended June 30, 2018. ABHES determined that the PN Program at each of the Columbus, Dayton, and Toledo campuses did not satisfy ABHES’s retention rate requirement and that it was unable to verify that the ADN Program at each of the Cleveland and Toledo campuses had met ABHES’s placement rate requirement. In August 2019, ABHES notified HCN that the relevant programs at the Cleveland, Dayton, and Toledo campuses must come into compliance by May 1, 2020 and that the PN Program at the Columbus campus must come into compliance by May 1, 2021. In October 2019, HCN notified ABHES that the PN Programs at each of the Dayton, Toledo, and Columbus campuses failed to satisfy ABHES’s threshold requirements for retention rates for the reporting year ended June 30, 2019. In February 2020, ABHES notified HCN that it had taken additional actions with respect to certain HCN programs at certain locations related to those programs’ performance in relation to ABHES student achievement indicators. Specifically, ABHES: (i) placed the PN programs at the Dayton and Toledo campuses on program specific warning status because the programs have failed to meet the 70% retention rate threshold since HCN’s 2017-2018 annual report and informed HCN that those programs must meet the retention rate threshold by May 1, 2020; (ii) removed the ADN programs at the Cleveland and Toledo campuses from outcomes reporting status after placement rates for those programs at those locations met the 70% compliance threshold; (iii) continued outcomes reporting status for the PN program at the Columbus campus because it has not met the retention rate
47
compliance threshold and reconfirmed that it has until May 1, 2021 to do so; and (iv) directed HCN to provide evidence to ABHES that the ADN programs at each of the Columbus, Cleveland, Cincinnati, Dayton, and Toledo campuses and the PN programs at the Cleveland and Cincinnati campuses met the retention rate compliance threshold for the period from July 1, 2019 through March 31, 2020 and informed HCN that those programs must meet the compliance threshold by May 1, 2021. There can be no assurance that HCN will be able to demonstrate compliance by the relevant deadlines in all cases. If HCN is unable to bring the programs into compliance during the timeframe established by ABHES, unless such timeframe is extended for good cause, ABHES may take other action, up to and including withdrawing accreditation for those programs. In addition, adverse actions taken by ABHES may trigger reporting requirements and ED action under ED’s Borrower Defense Regulations, see “Regulatory Environment - Student Financing Sources and Related Regulations/Requirements - Department of Education - Regulation of Title IV Financial Aid Programs - Borrower Defenses.”
If any HCN campus or program fails to satisfy ABHES achievement measures, enrollment in such HCN campus or program could decline, or we could be forced to cease enrollments at that campus or in that program, which could have a material adverse impact on HCN’s student enrollment and our and HCN’s revenue, cash flows, and results of operations. The actions HCN takes to comply with ABHES requirements may not be successful in resolving existing issues and, if those actions are targeted at specific campuses or programs, may fail to prevent additional issues arising with respect to those or other campuses or programs. Similarly, even if HCN is successful in the long term in complying with these standards, the actions HCN takes to comply could result in increased costs or decreased enrollments.
Participation in the DoD tuition assistance programs requires compliance with numerous regulations with respect to which the failure to comply could lead to a loss of an ability to participate in these programs or other adverse events.
In order to participate in the DoD tuition assistance programs, institutions must, among other things, comply with an MOU that specifies terms and conditions of participation in DoD tuition assistance programs. By signing the MOU, APUS and HCN have agreed to participate in DoD’s Voluntary Education Institutional Compliance Program, or ICP. An institution that is found noncompliant with DoD requirements through the ICP and demonstrates an unwillingness to resolve a finding may be subject to a range of penalties from a written warning to termination of the institution’s participation in the DoD tuition assistance programs. For example, as more fully described in “Regulatory Environment - Compliance with Regulatory Standards and the Effect of Regulatory Violations - Compliance Reviews,” in February 2018, DoD issued a report that made two findings about APUS. First, DoD found that attire worn by an individual providing testimonials on APUS’s public-facing website could be construed as similar to a distinctive part of a military uniform. Second, DoD found that APUS had failed to provide sufficient information relating to the financial aid process, including a timeline for applying for financial aid. APUS submitted a corrective action plan and evidence of corrective actions, and in December 2018, DoD notified APUS that all corrective actions had been reviewed and accepted by DoD. If we are no longer able to receive funds from DoD tuition assistance programs, or if those programs are reduced, eliminated, or temporarily suspended, our enrollments and revenue could be significantly reduced, which would result in a material adverse effect on our results of operations and financial condition.
Our institutions’ student enrollments could decline if they fail to maintain accreditation.
Institutional accreditation is an important attribute of our institutions. Colleges and universities depend, in part, on accreditation in evaluating transfers of credit and applications to graduate schools. Many institutions will only accept transfer credit from regionally accredited institutions. Students and sponsors of tuition reimbursement programs look to accreditation for quality assurance, and employers rely on institutions’ accredited status when evaluating a candidate’s credentials. Failure to maintain our institutional accreditation would have a material adverse effect on our enrollments, revenue, and results of operations. In addition, certain of our programs are accredited by specialized accrediting agencies, or recognized by professional organizations. If our institutions fail to satisfy the standards of these specialized accrediting agencies and professional organizations, the relevant programs could lose the specialized accreditation or professional recognition, which could result in materially reduced student enrollments in those programs and have a material adverse effect on us. In addition, in certain cases, professional licensure will not be granted if an applicant for licensure earned the relevant educational credential from an institution or educational program that lacks regional or specialized accreditation. Failure to obtain or maintain specialized accreditation or professional recognition for certain programs could result in materially reduced student enrollments in affected programs and have a material adverse effect on us.
If the accrediting agency of one of our institutions was to lose its ability to serve as an accrediting agency for Title IV program purposes and the institution was unable to obtain recognition from another recognized accrediting agency, that institution would lose its ability to participate in Title IV programs and DoD tuition assistance programs.
APUS is accredited by HLC. In February 2018, NACIQI, the panel charged with advising ED on whether to recognize accrediting agencies for Title IV purposes, voted to recommend that ED renew HLC’s recognition for five years. If HLC were to
48
lose its recognition as an accrediting agency and APUS was unable to obtain recognition from another recognized accrediting agency, APUS would lose its eligibility to participate in Title IV programs and DoD tuition assistance programs. The inability of APUS to participate in Title IV programs would have a material adverse effect on enrollments, revenue, financial condition, and results of operations.
HCN is accredited by ABHES. In 2016, NACIQI voted to recommend that ED renew ABHES’s recognition for five years. If ABHES were to lose its recognition as an accrediting agency and HCN was unable to obtain recognition from another recognized accrediting agency, HCN would lose its eligibility to participate in Title IV programs and DoD tuition assistance programs. The ineligibility of HCN to participate in Title IV programs would have a material adverse effect on HCN’s enrollments, revenue, financial condition, and results of operations.
The failure of our institutions or their accrediting agencies to comply with Department of Education regulations setting forth new standards and procedures related to institutional eligibility to participate in Title IV and ED’s recognition of accrediting agencies could affect our institutions’ eligibility to participate in Title IV programs.
In October 2018, ED announced that it would establish the Accreditation and Innovation Committee to prepare proposed regulations related to, among other things, ED’s recognition of accrediting agencies and institutional and program eligibility issues, including state authorization and programs offered through distance education. In April 2019, the Accreditation and Innovation Committee reached consensus on the package of proposed regulatory language. In June 2019, ED published certain portions of the agreed-upon regulatory language, including those provisions related to accreditation and state authorization, in a notice of proposed rulemaking. On November 1, 2019, ED published final regulations concerning accreditation and state authorization, portions of which relating to accreditation generally will be effective on July 1, 2020. The final regulations revise ED’s process for recognition and review of accrediting agencies and the criteria used by ED to recognize accrediting agencies. The regulations also revise ED’s requirements for accrediting agency oversight of accredited institutions and programs by generally providing accrediting agencies with greater autonomy and flexibility. On December 11, 2019, in a notice of proposed rulemaking, ED published additional portions of the agreed-upon regulatory language, including provisions related to the participation of faith-based entities in the Title IV programs and certain rules related to the TEACH Grant program. ED has indicated that it will issue an additional notice of proposed rulemaking to address other provisions in the agreed-upon regulatory language developed as part of the negotiated rulemaking. We are unable to predict the result of any other current or future rulemakings, or the impact of such rulemakings on our business. However, the failure of our institutions or their accrediting agencies to comply with any final regulations could affect our institutions’ eligibility to participate in Title IV programs and therefore have a material adverse effect on our business, financial condition, and results of operations.
National or regional accreditation agencies may prescribe more rigorous accreditation standards or special forms of monitoring or action plans for our institutions, which could have a material adverse effect on our student enrollment, revenue, and cash flows.
The accreditation standards of the regional or national accreditation agencies that accredit our institutions can and do vary, and the accreditation agencies may prescribe more rigorous standards than are currently in place. Complying with more rigorous accreditation standards could require significant changes to the way we operate our business and increase our administrative and other costs. No assurances can be given that our institutions would be able to comply with more rigorous accreditation standards in a timely manner or at all. If one of our institutions does not meet its accreditation requirements, its accreditation could be limited, modified, suspended, or terminated. Failure to maintain accreditation would make such institution ineligible to participate in DoD tuition assistance programs and Title IV programs, which could have a material adverse effect on the institution’s student enrollment and revenue.
Accrediting bodies may adopt new or revised criteria, standards, and policies that are intended to monitor, regulate, or limit the growth of for-profit institutions like ours. For example, as discussed more fully in “Regulatory Environment - Accreditation,” HLC has adopted a policy to allow HLC to designate publicly an institution as “in financial distress” or “under governmental investigation” where such situations have the potential to impact the institution’s operations and HLC believes the public should have information in making a decision to attend or continue to attend the institution. As discussed in “Regulatory Environment - Accreditation,” HLC imposed a “governmental investigation” designation on APUS in February 2018 in connection with a CID issued to APUS by the Attorney General of Massachusetts in July 2017. HLC removed the governmental investigation designation in August 2018 in light of action taken to resolve the CID.
If our institutions fail to maintain state authorization in the states where they are physically located, the institutions would lose their ability to grant degrees and other credentials in that state and to participate in Title IV programs and DoD tuition assistance programs.
49
As discussed in “Regulatory Environment - State Licensure/Authorization,” to participate in Title IV programs and DoD tuition assistance programs, an institution must be legally authorized by the relevant education agency of the state in which it is physically located. Loss of state authorization by one of our institutions in the state in which it is physically located would cause that institution to be ineligible to participate in Title IV programs and DoD tuition assistance programs and to be unable to operate in the state and grant credentials. In addition, if one of our institutions were to lose its state authorization, it would lose its institutional accreditation, and if HCN were to lose approval from OBN for the Diploma in Practical Nursing or the Associate Degree in Nursing, or from the Indiana Board of Nursing for the Diploma in Practical Nursing, students in the program lacking approval would not be eligible to apply for licensure by examination to practice nursing in Ohio or Indiana, respectively.
ED regulations provide that an institution is considered legally authorized by a state if the state has a process to review and appropriately act on complaints concerning the institution, including enforcing applicable state laws, and the institution complies with any applicable state approval or licensure requirements. If a state in which one of our institutions is located fails in the future to satisfy the provisions of that regulation, our institutions’ ability to operate in that state and to participate in Title IV programs could be limited or terminated.
Our institutions’ failure to comply with the requirements of the State Authorization Reciprocity Agreement, or SARA, or regulations of ED or various states related to state authorization could result in actions that would have a material adverse effect on our enrollments, revenue, and results of operations.
Various states impose regulatory requirements on educational institutions operating within their boundaries, including registration requirements applicable to online educational institutions that have no physical location or other presence in the state but offer educational services to students who reside in the state or advertise to or recruit prospective students in the state. SARA is a voluntary agreement among member states, districts, and territories that establishes national standards for interstate offering of postsecondary distance education. For U.S. jurisdictions that are not members of SARA (namely, at this time, California), our institutions must satisfy the requirements of those individual jurisdictions with regard to online education in order to enroll students in those jurisdictions. Those requirements may change from time to time and, in some instances, are ambiguous or are left to the interpretative discretion of state regulators.
Changes in requirements to participate in SARA or changes to state laws and regulations and the interpretation of those laws and regulations by the applicable regulators may limit our ability to offer educational programs and award degrees. If one of our institutions were to fail to comply with SARA requirements or state licensing or authorization requirements to provide distance education in a non-SARA jurisdiction, the institution could lose its ability to participate in SARA or may be subject to the loss of state licensure or authorization to provide distance education in that non-SARA jurisdiction, respectively. If one of our institutions were to fail to comply with state requirements to obtain licensure or authorization, it could be subject to injunctive actions or penalties.
On December 19, 2016, ED published the Distance Education Rule, which is more fully described in “Regulatory Environment ‑ State Licensure/Authorization”, addressing, among other issues, state authorization of programs offered through distance education. After a delay and subsequent court order, the Distance Education Rule took effect on May 26, 2019. The Distance Education Rule requires an institution offering distance education programs to be authorized on a state-by-state basis, if such authorization is required by the state, in order to award Title IV aid to such students. If one of our institutions fails to obtain or maintain required state authorization to provide postsecondary distance education in a specific state, the institution could lose its ability to award Title IV aid to students in that state and to provide distance education in that state. The Distance Education Rule also requires an institution to provide public and individualized disclosures to enrolled and prospective students regarding its programs that are provided or can be completed solely through distance education or correspondence courses, excluding internships and practicums.
In October 2018, ED announced its intent to establish a negotiated rulemaking committee to prepare proposed regulations related to, among other things, disclosure and other requirements of state authorization. On November 1, 2019, ED published final regulations concerning accreditation and state authorization, which generally will be effective on July 1, 2020, except that institutions may in their discretion implement early regulations relating to state authorization and institutional information disclosures. The final regulations related to state authorization effectively replace the Distance Education Rule. APUS implemented early these regulations effective November 1, 2019. The final regulations clarify the required methodology for determining the state in which a student is located for purposes of satisfying state authorization requirements for distance education courses, and require an institution to disclose certain information related to whether programs leading to professional licensure meet applicable state requirements, regardless of program modality. Failure to make the disclosures required by the Distance Education Rule or its replacement regulations could put us at risk of administrative enforcement action or related litigation, including claims from students related to misrepresentation and other matters. In addition, we cannot predict whether, or to what extent, such disclosure requirements will have an effect on our enrollment processes and results.
50
The inability of our institutions’ graduates to obtain professional licensure, employment or other outcomes in their chosen fields of study could reduce our enrollments and revenue, limit our ability to offer educational programs, and potentially lead to litigation that could be costly to us.
HCN graduates and certain APUS graduates seek professional licensure, employment or other outcomes in their chosen fields following graduation. Their success in obtaining these outcomes depends on numerous factors, including: the individual merits of the graduate; whether the institution and the program were approved by the state in which the graduate seeks licensure, or by a professional association; whether the program meets all state requirements for professional licensure; and whether the institution or program has any required accreditation. For example, certain states have refused to license or certify students from particular APUS initial teacher licensure programs on grounds that the program did not meet one or more of the state’s specific licensure requirements or was not approved by the state for purposes of professional licensure. APUS has determined not to enroll new students in any of its initial teacher licensure programs.
To apply for licensure to practice nursing in Ohio, an applicant must have successfully completed a nursing education program that is approved by the OBN. The OBN requires that nursing education programs such as HCN’s PN and ADN Programs have a pass rate on the relevant NCLEX that is at least 95% of the national average for first-time candidates in a calendar year. As discussed more fully in “Regulatory Environment - State Authorization/Licensure of Our Institutions,” failure to satisfy that requirement can result in the OBN taking certain adverse actions, including placement of a program on provisional status or withdrawal of approval pursuant to an adjudication proceeding. In March 2017, the OBN placed HCN’s ADN Program on provisional approval because the ADN Program has not met the OBN pass rate standard for four consecutive years. In March 2019, the OBN found that HCN’s ADN Program did not meet the OBN pass rate standard in 2018 for a sixth consecutive year. HCN has been implementing changes, including curriculum, admissions, and academic achievement and course retake policy changes that are designed to improve NCLEX scores over time, but there is no assurance that these changes will be successful or will not have negative effects on HCN’s enrollment. For example, enrollments in HCN’s ADN Program in 2019 were significantly lower than HCN planned, which we believe is likely partly associated with the implementation of new academic achievement and admissions standards that had the effect of reducing enrollments from qualified students. If HCN is unable to improve NCLEX scores over time, this situation could have an adverse impact on our ability to enroll students and eventually our ability to continue HCN’s ADN Program, any of which would have an adverse effect on our results of operations, cash flows, and financial condition. The Indiana State Board of Nursing also requires that nursing education programs have a pass rate on the relevant NCLEX exam that satisfies certain requirements. The Indiana State Board of Nursing may not grant full accreditation to an initially accredited program that has a pass rate is lower than one standard deviation below the average national pass rate, and if the program’s pass rate is lower than one standard deviation below the average national pass rate for three consecutive years, a program may be subject to additional oversight or a change in accreditation status.
State requirements for licensure are subject to change, as are professional certification standards, and we may not become aware of changes that may impact our students in certain instances. In the event that one or more states refuse to recognize our institutions’ students for professional licensure based on factors relating to our institutions or programs, the potential growth of our institutions’ programs would be negatively impacted, which could have a material adverse effect on our business, financial condition, results of operations, and cash flows. In addition, requirements for employment vary from employer to employer and from field to field. To the extent our graduates fail to satisfy requirements for employment by particular employers or in a particular profession based on characteristics of our programs, the ability to maintain enrollments, as well as the potential for growth of our institutions’ programs would be negatively impacted, which could have a material adverse effect on our business, financial condition, results of operations, and cash flows. In addition, if our institutions’ graduates fail to obtain professional licensure, employment or other outcomes in their chosen fields of study, we and our institutions could be exposed to litigation, including class-action litigation, claiming that we are at fault for such failure, which would force us to incur legal and other expenses that could have a material adverse effect on our business, financial condition, results of operations, and cash flows.
Our institutions must periodically seek recertification to participate in Title IV programs, and may, in certain circumstances, be subject to review by the Department of Education prior to seeking recertification, and our future success may be adversely affected if our institutions are unable to successfully maintain certification or obtain recertification.
An institution generally must seek recertification from ED at least every six years and possibly more frequently depending on various factors, such as whether it is provisionally certified. ED may also review an institution’s continued eligibility and certification to participate in Title IV programs, or scope of eligibility and certification, in the event the institution undergoes a change in ownership resulting in a change of control, or expands its activities in certain ways. In certain circumstances, ED must provisionally certify an institution, such as when it is an initial participant in Title IV programs or has undergone a change in ownership and control.
51
A provisionally-certified institution must apply for and receive ED approval of substantial changes and must comply with any additional conditions included in its program participation agreement. If ED determines that a provisionally-certified institution is unable to meet its responsibilities, it may seek to revoke the institution’s certification to participate in Title IV programs with fewer due process protections for the institution than if it were fully-certified.
APUS is certified to participate in Title IV programs through September 30, 2020 and will be required to apply timely for recertification in order to continue to participate in the Title IV programs after that date. As discussed more fully in “Regulatory Environment - Compliance with Regulatory Standards and the Effect of Regulatory Violations - Compliance Reviews,” in September 2016, ED began a program review of APUS’s administration of the Title IV programs during the 2014-2015 and 2015-2016 award years, and that program review remains open and ongoing. If the program review and any associated liabilities remain unresolved at the time ED acts on APUS’s recertification application and ED decides to recertify APUS, we believe such recertification is likely to be on a provisional basis because of the unresolved program review and associated liabilities. HCN is certified to participate in Title IV programs through September 30, 2021 and will be required to apply timely for recertification in order to continue to participate in the Title IV programs after that date.
If ED were to withdraw or not renew our institutions’ certification to participate in Title IV programs, our students would no longer be able to receive Title IV program funds or DoD tuition assistance program funds, which would have a material adverse effect on our enrollments, revenue, results of operations, and financial condition.
If our institutions are unable to successfully maintain certification or obtain recertification to participate in Title IV programs they will not be able to participate in DoD tuition assistance programs.
If our institutions are unable to successfully maintain certification or obtain recertification to participate in ED’s Title IV programs, they will not be able to participate in DoD tuition assistance programs because the DoD MOU requires an institution to be certified to participate in Title IV programs in order to participate in DoD tuition assistance programs. Loss of participation in the DoD tuition assistance programs would have a material adverse effect on our enrollments, revenue, results of operations, and financial condition.
A failure to demonstrate “administrative capability” may result in the loss of eligibility to participate in Title IV programs.
ED’s regulations specify extensive criteria an institution must satisfy to establish that it has the requisite “administrative capability” to participate in Title IV programs and the sanctions ED may impose if an institution fails to satisfy any of those criteria. To meet the administrative capability standards, an institution must, among other things, comply with all applicable Title IV requirements, including with respect to the administration of Title IV programs and the processing of Title IV program funds. If an institution fails to satisfy any of the administrative capability requirements, ED may require the repayment of Title IV program funds, transfer the institution from the “advance” system of payment of Title IV program funds to heightened cash monitoring status, or to the “reimbursement” method of payment, place the institution on provisional certification status, or commence a proceeding to impose a fine or to limit, suspend, or terminate the participation of the institution in Title IV programs.
If one of our institutions is found not to have satisfied ED’s “administrative capability” requirements, it could be limited in its access to, or lose, Title IV program funding or certain Title IV-related conditions or fines could be imposed, which would adversely affect our enrollment, revenue, results of operations, and financial condition.
A failure to demonstrate “financial responsibility” may result in the loss of eligibility by one of our institutions to participate in Title IV programs or require the posting of an irrevocable letter of credit in order to maintain eligibility to participate in Title IV programs.
To participate in Title IV programs, an eligible institution must satisfy specific measures of financial responsibility prescribed by ED, or post a letter of credit in favor of ED, and possibly accept other conditions, such as provisional certification, additional reporting requirements, or regulatory oversight of its participation in Title IV programs. ED may also apply such measures of financial responsibility to a parent company of an eligible institution and, if such measures are not satisfied by the parent company, require the institution to post a letter of credit in favor of ED, and possibly accept other conditions on its participation in Title IV programs. For our institutions, ED applies its measures of financial responsibility at the level of the parent company, APEI. An obligation to post a letter of credit, or to accept other conditions, such as a change in our system of Title IV payment from ED for purposes of disbursement, could increase our costs of regulatory compliance, or affect our cash flow.
52
In the 2016 Borrower Defense Regulations, ED modified its financial responsibility standards to provide that an institution (other than a public institution) may not be able to meet its financial or administrative obligations, and is therefore not financially responsible, if it is subject to one or more triggering events occurring on or after July 1, 2017. On September 23, 2019, ED published the 2020 Borrower Defense Regulations, which, among other things, amend ED’s financial responsibility provisions in several respects. Like the 2016 Borrower Defense Regulations, the 2020 Borrower Defense Regulations identify certain conditions or other triggering events that have or may have an adverse material effect on the institution’s financial condition, in response to which ED would or could require that the institution submit some form of financial protection to ED. For more on the financial responsibility provisions of the Borrower Defense Regulations, see “Regulatory Environment - Student Financing Sources and Related Regulations/Requirements - Department of Education - Regulation of Title IV Financial Aid Programs - Borrower Defenses.”
If, under the Borrower Defense Regulations, ED determines that one of our institutions is not financially responsible because of one or more triggering events, the institution would be required to provide an irrevocable letter of credit equal to at least 10% of the amount of federal student financial aid funds received by the institution for the past year. If one of our institutions is found not to have satisfied ED’s financial responsibility requirements, it could be limited in its access to, or lose, Title IV program funds, which would limit our potential for growth and adversely affect our enrollment, revenue, and results of operations. If we, as the parent company of an eligible institution, are found not to have satisfied ED’s financial responsibility measures, all of our institutions could be limited in their access to, or lose, Title IV program funds, which would limit our potential for growth and adversely affect our enrollment, revenue, results of operations, and financial position.
ED rules now in effect and subsequent rules that take effect July 1, 2020, each setting forth new standards and procedures related to borrower defense-to-repayment claims, and requirements related to dispute resolution, may create significant liability that could have a material adverse effect on our business.
Under the HEA, ED is authorized to specify in regulations which acts or omissions of an institution of higher education a borrower may assert as a defense to repayment of a Direct Loan. Regulations in effect prior to the 2016 Defense Regulations permitted a borrower to assert a borrower defense to repayment of a Direct Loan if the institution’s acts or omissions give rise to a cause of action against the institution under state law. The 2016 Borrower Defense Regulations, which in part govern which acts or omissions of an institution of higher education a student borrower may assert as a defense to repayment of a loan made under the Direct Loan Program, or a Direct Loan, and certain other matters, create a new federal standard for borrower defenses, new limitation periods for borrower defense claims, and new processes for resolution of such claims. Certain portions of the 2016 Borrower Defense Regulations became effective October 16, 2018 after ED’s delay of the effective date of those regulations and a court decision in legal challenges to the delay. On September 23, 2019, ED published the 2020 Borrower Defense Regulations, which among other things establish a new federal standard for evaluating, and a new process for adjudicating, borrower defenses to repayment of loans made under the Direct Loan Program on or after July 1, 2020. The 2016 Borrower Defense Regulations thereafter will continue to apply to all loans made under the Direct Loan Program on or after July 1, 2017 and before July 1, 2020. For more information on the Borrower Defense Regulations, see “Regulatory Environment - Student Financing Sources and Related Regulations/Requirements - Department of Education - Regulation of Title IV Financial Aid Programs - Borrower Defenses.”
Under the Borrower Defense Regulations, ED may initiate a separate proceeding to collect from an institution the amount of relief resulting from a borrower defense brought by an individual borrower, and as part of group-process hearings under the 2016 Borrower Defense Regulations, ED will collect from the institution any liability for amounts discharged or reimbursed to borrowers under the group process. The 2020 Borrower Defense Regulations eliminate the process available under the 2016 Borrower Defense Regulations for a group of borrowers. If ED determines that borrowers of Direct Loans who attended our institutions have a defense to repayment of their Direct Loans, we could be subject to repayment liability to ED that could have a material adverse effect on our financial condition, results of operations, and cash flows.
The 2016 Borrower Defense Regulations also prohibit institutions from requiring students to engage in the institutions’ internal complaint processes before contacting other agencies, prohibit the use of pre-dispute arbitration agreements by institutions, prohibit class action lawsuit waivers, and require institutions to notify ED of arbitration filings and awards, for claims that may form the basis for a borrower defense to repayment of a Direct Loan. As a result of the 2016 Borrower Defense Regulations’ dispute resolution provisions, we could incur claims and expenses that we have not previously incurred, and which could have a material adverse effect on our business, financial condition, and results of operations. The 2020 Borrower Defense Regulations generally remove the prohibitions contained in the 2016 Borrower Defense Regulations but require institutions whose students must enter into pre-dispute arbitration agreements or class action waivers as a condition of enrollment to disclose publicly those requirements in an easily accessible format, and prohibit such an institution to require a student to participate in arbitration or any internal dispute resolution process prior to filing a borrower defense to repayment application with ED.
53
If one or more of our institutions does not comply with the 90/10 Rule, it or they will lose eligibility to participate in federal student financial aid programs.
The HEA requires all for-profit education institutions to comply with what is commonly referred to as the 90/10 Rule, which imposes sanctions on institutions that derive more than 90% of their total revenue on a cash accounting basis from Title IV programs, as calculated under ED’s regulations. In recent years, Congress has considered various proposals that would modify the 90/10 Rule. At this time we cannot predict whether Congress will pass legislation to modify the 90/10 Rule. Such proposals, or other similar legislation, should they become law, could have a material adverse impact on the operations of our institutions.
The 90/10 Rule percentage for our institutions could increase in the future, depending on the impact of future changes in our enrollment mix, and regulatory and other factors outside our control, including, for APUS, any reduction in tuition assistance provided by DoD for service members and education benefits provided by the VA for veterans, or changes in the treatment of such funding for purposes of the 90/10 Rule calculation. Currently, DoD tuition assistance and VA education benefits are not treated as Title IV revenue under the 90/10 Rule and, therefore, such funding is included in the “10%” portion of the rule calculation. A reduction in the availability of this type of funding, or a change (through legislation, regulatory action, or an executive order) that requires that those funds be treated in the same manner as Title IV funding under the 90/10 Rule, would increase our institutions’ 90/10 Rule percentage. For the past three years, HCN has derived more than 80% of its total revenue on a cash accounting basis from Title IV programs as calculated under ED’s regulations. If HCN is unable to attract students who do not depend on Title IV program aid, such as students who finance their own education or receive full or partial tuition reimbursement from their employers, or through VA benefits, HCN’s 90/10 Rule percentage may increase.
If any of our institutions violates the 90/10 Rule and loses eligibility to participate in Title IV programs, it would also lose the ability to participate in the DoD tuition assistance programs because DoD requires institutions to participate in the Title IV programs in order to participate in the tuition assistance programs, and ineligibility of either or both of our institutions to participate in Title IV programs and DoD tuition assistance would have a material adverse effect on our enrollments, revenue, results of operations, and cash flows.
A failure by our institutions to comply with the Department of Education’s incentive payment rule could result in sanctions.
If one of our institutions pays a bonus, commission, or other incentive payment in violation of the HEA’s prohibition on such payments, commonly referred to as the incentive payment rule, the institution could be subject to sanctions, which could have a material adverse effect on our business. If ED determines that one of our institutions violated the incentive payment rule, it may require the institution to modify its payment arrangements to ED’s satisfaction. ED may also fine the institution or initiate action to limit, suspend, or terminate the institution’s participation in Title IV programs. ED may also seek to recover Title IV funds disbursed in connection with the prohibited incentive payments. In June 2015, ED announced that it will calculate institutional liability for noncompliance with the incentive payment rule by calculating the cost to ED of the Title IV funds improperly received by the institution, including the cost to ED of all of the Title IV funds received by the institution over a particular period of time if those funds were obtained through implementation of a policy or practice in which students were recruited in violation of the incentive payment rule. As described in “Regulatory Environment - Student Financing Sources and Related Regulations/Requirements - Department of Education - Regulation of Title IV Financial Aid Programs - Incentive Payment Rule,” changes in the interpretation of the regulation may create uncertainty about what constitutes impermissible incentive payments. Ambiguities as to how the incentive payment rule is interpreted also may influence our approach, or limit our alternatives, with respect to employment policies and practices and consequently may negatively affect our ability to recruit and retain employees, and, as a result, our business could be materially and adversely affected.
The DoD MOU requires that institutions participating in the DoD tuition assistance programs have policies in place compliant with regulations issued by ED related to restrictions on payment of incentive compensation. In addition, the Improving Transparency of Education Opportunities for Veterans Acts bans incentive compensation based on success in securing enrollments or financial aid with regard to VA benefits.
In addition, third parties may file “qui tam” or “whistleblower” suits on behalf of the federal government under the Federal False Claims Act alleging violation of the incentive payment provision. Such suits may prompt ED investigations, and the federal government may determine to intervene in the lawsuits. Particularly in light of ED’s June 2015 announcement discussed above and the uncertainty surrounding interpretation of the incentive payment rule, the existence of, the costs of responding to, and the outcome of, qui tam or whistleblower suits or ED investigations could have a material adverse effect on our reputation causing our enrollments to decline, could cause us to incur costs that are material to our business, and could impact the ability of our institutions to participate in Title IV programs, among other things. As a result, our business could be materially and adversely affected.
54
Our institutions may lose eligibility to participate in Title IV programs if their student loan default rates are too high, and our future growth could be impaired as a result.
To remain eligible to participate in Title IV programs, an educational institution’s federal student loan cohort default rates must remain below certain specified levels. Each cohort is the group of students who first enter into student loan repayment during a federal fiscal year. If an institution’s cohort default rate equals or exceeds 30% for any given year, it must establish a default prevention task force and develop a default prevention plan with measurable objectives for improving the cohort default rate. Educational institutions will lose eligibility to participate in Title IV programs if their cohort default rate exceeds 40% for any given year or is equal to or greater than 30% for three consecutive years.
If one of our institutions is required to develop a formal default prevention plan, it may increase our administrative costs which would adversely impact our results of operations. In the past there has been increased attention by members of Congress and others on default prevention activities of for-profit education institutions. If such attention leads to Congressional or regulatory action restricting the types of default prevention assistance that educational institutions are permitted to provide, the default rates of our former students may be negatively impacted. Such attention could also lead to Congressional proposals to increase the measuring period, which could negatively impact our default rates. In the past, members of Congress have also introduced proposed legislation that would assess institutions a share of the costs associated with default of student loans by students who were enrolled in the institutions’ education programs and would tie an institution’s obligation to make such “risk-sharing” payments to the institution’s eligibility to participate in the Title IV programs. If one of our institutions loses its eligibility to participate in Title IV programs because of high student loan default rates, students would no longer be eligible to use Title IV program funds at that institution, which would significantly reduce that institution’s enrollments and revenue and have a material adverse effect on our results of operations.
We rely on third parties to administer our institutions’ participation in Title IV programs and their failure to perform services as agreed or to comply with applicable regulations could cause us to lose our eligibility to participate in Title IV programs.
ED’s regulations permit an institution to enter into a written contract with a third-party servicer for the administration of any aspect of the institution’s participation in Title IV programs. The third-party servicer must, among other obligations, comply with Title IV requirements and be jointly and severally liable with the institution to ED for any violation by the servicer of any Title IV provision. Our institutions utilize third-party servicers for some services and in the future may consider using third-party servicers for other functions that are currently managed directly by our institutions. If any third-party servicer that we have engaged does not comply with applicable statutes and regulations including the HEA, our institutions may be liable for its actions, and our institutions could lose eligibility to participate in Title IV programs. The failure of one of our third-party servicers to perform the services as agreed may adversely impact our ability to operate, our eligibility to participate in Title IV programs, and our financial condition. Further, in the event that our institutions transition to or from a third-party servicer for any of its services, there would be costs and risks related to the transition, which could have a material adverse effect on our financial condition.
Our institutions will be subject to sanctions that could be material to our results and damage our reputation if the Department of Education determines that our institutions failed to correctly calculate and timely return Title IV program funds for students who withdraw before completing their educational program.
An institution participating in Title IV programs must correctly calculate the amount of unearned Title IV program funds that have been disbursed to students who withdraw from their educational programs before completion, and must return those unearned funds to the Title IV programs in a timely manner, generally within 45 days after the date the school determines that the student has withdrawn. Under ED regulations, late returns of Title IV program funds for 5% or more of students sampled in connection with the institution’s annual Title IV compliance audit constitute material noncompliance for which an institution generally must submit an irrevocable letter of credit.
HCN’s Title IV compliance audit for the year ended December 31, 2012, identified a deficiency related to timely return of Title IV program funds. In a Final Audit Determination Letter in February 2014, ED determined that HCN was not required to repay the liability to ED and directed HCN to adopt procedures to prevent reoccurrence. However, HCN was required to post an irrevocable letter of credit in the amount of approximately $130,000, which was released by ED in February 2018.
APUS’s Title IV compliance audit for the year ended December 31, 2016 identified a finding related to return of Title IV funds calculations that were not properly computed. In a Final Audit Determination letter dated January 29, 2018, ED conveyed its finding that funds had not been returned timely. ED also noted that a similar finding had been made in an open program review with respect to which APUS has not yet received a program review report. In connection with the finding, ED
55
required APUS to post a letter of credit in the amount of approximately $700,000. APUS posted the letter of credit on March 28, 2018 and it expired December 31, 2019.
Our institutions’ failure to comply with ED’s substantial misrepresentation rules could result in material sanctions.
ED may take action against an institution in the event of substantial misrepresentation by the institution concerning the nature of its educational programs, its financial charges, or the employability of its graduates. An institution engages in substantial misrepresentation when the institution itself, one of its representatives, or an organization or person with which the institution has an agreement to provide educational programs, marketing, advertising, or admissions services, makes a substantial misrepresentation directly or indirectly to a student, prospective student or any member of the public, or to an accrediting agency, a state agency, or to ED.
If ED determines that an institution has engaged in substantial misrepresentation, ED may: (i) if the institution is provisionally certified, revoke an institution’s program participation agreement or impose limitations on its participation in Title IV programs; (ii) deny participation applications made on behalf of the institution; or (iii) initiate a proceeding against the institution to fine the institution or to limit, suspend or terminate the institution’s participation in Title IV programs. If administrative actions or litigation claiming substantial misrepresentation were brought against our institutions, we could incur legal costs related to their investigation and defense, which could materially and adversely impact our financial condition.
Failure to comply with the Jeanne Clery Disclosure of Campus Security Policy and Campus Crime Statistics Act as implemented by ED could result in sanctions.
Our institutions must comply with certain campus safety and security reporting requirements as well as other requirements in the Clery Act. The Clery Act requires an institution to report to ED and disclose in its annual security report, for the three most recent calendar years, statistics concerning the number of certain crimes that occurred within the institution’s so-called “Clery geography.” APUS historically has not had to comply with the Clery Act because it is a wholly online institution. As a result of opening a Veteran’s Center in Charles Town, WV, APUS determined that it is no longer subject to that exclusion and issued its first annual security report in 2016. HCN publishes an annual security report as required by the Clery Act. Our institutions’ failure to comply with the Clery Act requirements or regulations promulgated by ED could result in our institutions being fined or having their eligibility to participate in Title IV programs limited, suspended, or terminated, could lead to litigation, or could harm our institutions’ reputation, each of which could, in turn, adversely affect our institutions’ enrollments and revenue and have a material effect on our business.
Enforcement of laws related to the accessibility of technology continues to evolve, which could result in increased information technology development costs and compliance risks.
APUS’s educational programs are made available to students through personal computers, mobile devices and other technological devices. For each of these programs, the curriculum makes use of a combination of graphics, pictures, videos, animations, sounds, and interactive content. Federal agencies including ED and the Department of Justice have considered or are considering how electronic and information technology should be made accessible to persons with disabilities, such as in the terms of specific technical standards. For example, Section 504 of the Rehabilitation Act of 1973, or Section 504, prohibits discrimination against a person with a disability by any organization that receives federal financial assistance. ED’s Office for Civil Rights, which enforces Section 504, together with the Department of Justice assert that requiring the use of technology in a classroom environment when such technology is inaccessible to individuals with disabilities violates Section 504, unless those individuals are provided accommodations or modifications that permit them to receive all the educational benefits provided by the technology in an equally effective and integrated manner. In recent years, ED’s Office for Civil Rights has taken enforcement action against several institutions of higher education, including primarily online institutions, after determining that their websites and online learning management platforms were not accessible to persons with a disability. If one of our institutions is found to have violated Section 504, it may be required to modify existing content and functionality of its online classroom or other uses of technology, including through adoption of specific technical standards. As a result of such enforcement action or as a result of new laws and regulations that require greater accessibility or accessibility in accordance with specific technical standards, our institutions may have to modify their online classrooms and other uses of technology to satisfy applicable requirements, which could require substantial financial investment. As with all nondiscrimination laws that apply to recipients of federal financial assistance, an institution may lose access to federal financial assistance if it does not comply with Section 504 requirements. In addition, private parties may file or threaten to file lawsuits alleging failure to comply with laws that prohibit discrimination on the basis of disability, and defending against such actions may require our institutions to incur costs to modify their online classrooms and other uses of technology and costs of litigation.
56
Government and regulatory agencies and third parties may conduct compliance reviews, bring claims, or initiate enforcement actions or litigation against us, any of which could disrupt our institutions’ operations and adversely affect their performance.
Because our institutions operate in a highly-regulated industry, we are subject to audits, compliance reviews, inquiries, complaints, investigations, claims of noncompliance, enforcement proceedings, and lawsuits by government agencies, regulatory agencies, students, employees, and third parties, including claims brought by third parties on behalf of the federal government. For example, ED regularly conducts program reviews of educational institutions that are participating in Title IV programs and the ED OIG regularly conducts audits and investigations of such institutions. Institutions that participate in the Title IV programs also must have an independent auditor conduct an annual audit of the institution’s compliance with the laws and regulations that are applicable to the Title IV programs in which the school participates and must submit the results of the audit to ED. In addition, the Federal Trade Commission has investigated and in some cases brought lawsuits against for-profit institutions alleging that the institutions engaged in deceptive trade practices, and the Consumer Financial Protection Bureau has sued for-profit institutions for engaging in allegedly illegal predatory lending practices.
If the results of compliance reviews or other proceedings are unfavorable to us, or if we are unable to defend successfully against lawsuits or claims, our institutions may be required to pay monetary damages or be subject to fines, limitations, loss of Title IV funding, injunctions, or other penalties, including the requirement to make refunds. Even if our institutions adequately address issues raised by an agency review or successfully defend a lawsuit or claim, we may have to divert significant financial and management resources from our ongoing business operations to address issues raised by those reviews or to defend against those lawsuits or claims. Claims and lawsuits brought against us or one of our institutions may result in reputational damage, even if such claims and lawsuits are without merit. Any one of these sanctions could materially adversely affect our business, financial condition, results of operations, and cash flows and result in the imposition of significant restrictions on us and our institutions, which may materially adversely affect our ability to operate.
ED is currently conducting a program review of APUS’s administration of the Title IV programs, and we cannot predict the outcome of the review.
In September 2016, ED began a program review of APUS’s administration of the Title IV programs during the 2014-2015 and 2015-2016 award years. As part of the program review, ED conducted a site visit in September 2016. The program review remains open and ongoing. We anticipate that certain findings addressed in the 2016 Title IV compliance audit Final Audit Determination letter dated January 29, 2018 will be resolved through the program review process, including a finding that return of Title IV funds calculations were incorrectly computed for some students and a finding that APUS had incorrectly reported the students’ enrollment status to the National Student Loan Data System for some students. In addition, APUS is certified to participate in Title IV programs through September 30, 2020 and will be required to apply timely for recertification in order to continue to participate in the Title IV programs after that date. If the program review and any associated liabilities remain unresolved at the time ED acts on APUS’s recertification application and ED decides to recertify APUS, we believe such recertification is likely to be on a provisional basis because of the unresolved program review and associated liabilities. At this time, we cannot predict the outcome of the program review, when it will be completed, or whether it will impose any liability or other limitations on APUS as a result of the review.
Investigations by state Attorneys General, Congress, and governmental agencies may result in increased regulatory burdens and costs.
We and other for-profit postsecondary education providers have been subject to increased regulatory scrutiny and litigation in recent years. State attorneys general have increasingly focused on allegations of improper recruiting, compensation, and deceptive marketing practices, among other issues. States may also have consumer disclosure laws, including laws specifically applicable to for-profit institutions, and a state attorney general may take the position that any such laws apply to institutions that offer wholly online education to students in the state. A number of state attorneys general have launched investigations into for-profit postsecondary education institutions. In August 2017, we received from the Attorney General of Massachusetts a CID relating to an investigation of alleged unfair or deceptive acts or practices by American Military University in connection with the recruitment and retention of students and the financing of education. The CID required the production of documents and information relating to recruitment, enrollment, job placement and other matters. On August 6, 2018, APUS entered into an AOD to resolve the inquiry. Pursuant to the terms of the AOD, and without any finding or admission of wrongdoing on APUS’s part, APUS paid $270,000 to the Attorney General and agreed to otherwise comply with applicable Massachusetts regulations. Other state attorneys general may also initiate inquiries into us or our subsidiaries. Actions by state attorneys general and other governmental agencies, whether or not involving us or our institutions, could damage our reputation and the reputation of our institutions and limit the ability to recruit and enroll students, which could reduce student demand for our institutions’ programs and adversely impact our revenue and cash flow from operations.
57
Our regulatory environment and our reputation may be negatively influenced by the actions of other for-profit institutions.
Our institutions are two of a much larger number of for-profit institutions serving the postsecondary education market. Regulatory investigations and civil litigation have been brought against several for-profit educational institutions. These investigations and lawsuits have alleged, among other things, deceptive trade practices, and noncompliance with ED regulations. These allegations have attracted adverse media and social media coverage, have been the subject of federal and state legislative hearings, and have in some cases resulted in legislation or rulemaking. In some cases, institutions have ceased operations, including while under multiple government investigations. Broader allegations against the overall for-profit school sector have negatively affected public perceptions of for-profit educational institutions, including our institutions, and this trend could continue or broaden. In addition, reports on student lending practices of various lending institutions and schools, including for-profit schools, and investigations by a number of state attorneys general, Congress, and governmental agencies have led to adverse media and social media coverage of postsecondary and for-profit education. Adverse media or social media coverage regarding others in our industry, or regarding us or our institutions directly, could damage our reputation, could result in lower enrollments at our institutions, lower revenue and increased expenses, and could have a negative impact on our stock price. Such allegations could also result in increased scrutiny and regulation by ED, Congress, accrediting bodies, state legislatures, state attorneys general, or other governmental authorities with respect to all for-profit institutions, including us and our institutions. For these reasons or others, not-for-profit or public educational institutions may take actions to differentiate themselves from the for-profit educational institutions, including by choosing not to enter into collaborations with for-profit institutions, including us, or by excluding for-profit institutions from membership in industry groups. Similarly, some corporations may choose not to collaborate with for-profit providers such as us for programs for their employees or for other training purposes. For example, when Walmart announced that it will not be renewing its partnership agreement with APUS, it announced a new program that only involved not-for-profit institutions.
If we undergo a change in ownership or control, the Department of Education will place our institutions on provisional certification, and the terms of that provisional certification could limit our institutions’ potential for growth and adversely affect our institutions’ enrollment, our revenue, and results of operations.
ED’s regulations provide that a change of control of a publicly-traded corporation occurs if: (i) there is an event that would obligate the corporation to file a Current Report on Form 8-K with the SEC disclosing a change of control; or (ii) the corporation has a stockholder that owns at least 25% of the total outstanding voting stock of the corporation and is the largest stockholder of the corporation, and that stockholder ceases to own at least 25% of such stock or ceases to be the largest stockholder. A significant purchase or disposition of our voting stock could be determined by ED to be a change in ownership and control under this standard. Under the HEA, an institution whose parent undergoes a change in ownership resulting in a change of control loses its eligibility to participate in Title IV programs and must apply to ED in order to reestablish such eligibility.
Future transactions could constitute a change in ownership or control under ED’s regulations and could cause ED to place our institutions on provisional certification as required by the HEA. The conditions of provisional certification or heightened scrutiny by ED could impact, among other things, our institutions’ ability to add educational programs, or additional locations, our ability to acquire other institutions, or our ability to make other significant changes. In addition, if ED were to determine that our institutions were unable to meet their responsibilities while they were provisionally-certified, ED could seek to revoke our institutions’ certification to participate in Title IV programs with fewer due process protections than if they were fully-certified. Limitations on our institutions’ operations could, and the loss of our institutions’ certification to participate in Title IV programs would adversely affect our institutions’ enrollments, and our revenue and results of operations.
If regulators do not approve or delay their approval of transactions involving a change of control of our Company or of institutions that we own or acquire, our and our institutions’ ability to operate could be impaired.
If we or one of our institutions experiences a change of ownership or control under the standards of applicable state regulatory bodies, accrediting agencies, ED, or other regulators, we or the institution governed by such agencies must notify or seek the approval of each relevant regulatory agency. Transactions or events that constitute a change of control include significant acquisitions or dispositions of an institution’s common stock, significant changes in the composition of an institution’s Board of Directors, internal restructurings, acquisitions of institutions from other owners, or certain other transactions. Some of these transactions or events may be beyond our control. Our or our institutions’ failure to obtain, or a delay in receiving, approval of any change of control from the relevant regulatory agencies following a transaction involving a change of ownership or control could result in a suspension of operating authority, loss of accreditation, or suspension or loss of ability to participate in Title IV programs, which could have a material adverse effect on our institutions and our financial condition. Our failure to obtain, or a delay in receiving, approval of any change of control from other states in which we are currently licensed or authorized could require our institutions to suspend activities in that state or otherwise impair our
58
institutions’ operations. The potential adverse effects of a change of control could influence, among other things, future decisions by us and our stockholders regarding the sale, purchase, transfer, issuance, or redemption of our stock. In addition, the regulatory burdens and risks associated with a change of control also could have an adverse effect on the market price of our common stock.
Certain contingents of Congress continue to examine the for-profit postsecondary education sector, which could result in targeted legislation, heightened oversight, or additional Department of Education rulemaking that may limit or condition Title IV program participation of for-profit schools in a manner that may materially and adversely affect our business.
While in recent years the focus of Congress on for-profit educational institutions has declined, certain contingents of Congress continue to examine institutions like ours. This focus has resulted in the introduction of various pieces of legislation, the holding of several hearings by various Congressional committees, and Congressional investigations and inquiries. We have previously incurred significant legal and other costs to respond to Congressional inquiries, and could incur significant legal and other costs to respond to any future inquiries. We cannot predict the extent to which, or whether, these hearings and investigations will result in legislation, further rulemaking affecting our participation in Title IV programs, or litigation alleging statutory violations, regulatory infractions, or common law causes of action.
Congress currently is in the process of considering comprehensive legislation to reauthorize the HEA. We cannot predict whether, in what form, or when, the two houses of Congress will reauthorize the HEA or whether, or when, the President will sign reauthorization legislation. Amendments to the HEA could occur as part of reauthorization, which could require us to modify our business practices and increase administrative costs, thereby negatively impacting our results of operations.
The adoption of any law or regulation that reduces funding for federal student financial aid programs or the ability of our institutions or students to participate in these programs could have a material adverse effect on our student population and revenue. Legislative action also may increase our administrative costs and require our institutions to modify their practices in order to comply with applicable requirements. Additionally, members of Congress have also from time to time encouraged ED to adopt additional regulations for participation in Title IV programs that could increase our cost of operations or expose us to additional risks.
Congressional examination of DoD oversight of tuition assistance used for distance education and for-profit institutions could result in legislative or regulatory changes that may materially and adversely affect our business.
In recent years, Congress has considered various proposals that would modify the 90/10 Rule. One current proposal would decrease the limit on Title IV funds from 90% to 85% and another current proposal would maintain the 90% limit but count DoD tuition assistance and VA education benefits toward that limit. Such a proposal or other similar legislation, should it become law, could have a material adverse impact on the operations of our institutions. In contrast, another proposal would have eliminated the 90/10 Rule. At this time we cannot predict the likelihood that Congress or the President will modify the 90/10 Rule or take some other action to limit the use of DoD tuition assistance and VA education benefits at for-profit institutions. To the extent that any laws or regulations are adopted that limit or condition the participation of for-profit schools or distance education programs in DoD tuition assistance programs or in Title IV programs, or that limit or condition the amount of DoD tuition assistance for which for-profit schools or distance education programs are eligible to receive, our financial condition could be materially and adversely affected.
Congress has in the past changed, and may in the future change, eligibility standards and funding levels for federal student financial aid programs, DoD tuition assistance, and other programs. Other governmental or regulatory bodies may also change similar laws or regulations relating to such programs, which could adversely affect our student population, revenue, and financial condition.
Political and budgetary concerns can significantly affect Title IV programs, military tuition assistance programs, and other laws and regulations governing federal and state aid programs.
Title IV programs are made available pursuant to the provisions of the HEA, and the HEA comes up for reauthorization by Congress approximately every five to six years. In the recent past, Congress has passed short-term non-substantive extensions of the HEA pending comprehensive reauthorization legislation. Further, when Congress does not act on comprehensive reauthorization through a single piece of legislation, it may act through multiple pieces of legislation. Congress completed the most recent reauthorization through multiple pieces of legislation and may reauthorize the HEA in a piecemeal manner in the future. Congress currently is in the process of considering legislation to reauthorize the HEA. Additionally, Congress determines the funding level for each Title IV program on an annual basis.
59
Future Congressional action, including in reauthorizations or appropriations acts, may result in numerous legislative changes, including those that could adversely affect the ability of our institutions to participate in Title IV programs, DoD tuition assistance programs, and the availability of such funding sources for our students. Members of Congress frequently propose legislation to alter or amend the terms under which our institutions participate in the federal student financial aid programs. Any action by Congress that significantly reduces funding for Title IV programs or the ability of our institutions or students to participate in these programs could materially harm our institutions’ business. A reduction in government funding levels could lead to lower enrollments at our institutions and require our institutions to arrange for alternative sources of financial aid for their students. Lower student enrollments at our institutions or their students’ inability to arrange alternative sources of funding could adversely affect our financial condition. Congressional action may also require our institutions to modify their practices in ways that could result in increased administrative and regulatory expenses.
We are not in a position to predict whether any legislation will be passed by Congress or signed into law in the future. The reallocation of funding among Title IV programs, material changes in the requirements for participation in such programs, or the substitution of materially different Title IV programs could reduce the ability of certain students to finance their education at our institutions and adversely affect our revenue and results of operations.
Recent and future regulatory developments may adversely impact our institutions’ enrollment, financial condition, results of operations, expenses, and cash flows.
ED has in the past published and in the future may publish additional rules that affect our institutions. For example, on October 15, 2018, ED published in the Federal Register a notice of its intent to establish the Accreditation and Innovation Committee, including three subcommittees, to prepare proposed regulations on several topics related to the Title IV programs. In April 2019, the Accreditation and Innovation Committee reached consensus on the package of proposed regulatory language. Subsequently, ED has issued proposed and, in some cases, final rules related to the topics addressed by that committee. For more information about the rulemaking processes currently underway, see “Regulatory Environment - Regulatory Activity - Federal Rulemakings.”
In addition to publishing rules, ED has in the past and may in the future take other actions that affect our institutions. For example, in September 2015, ED publicly released its “College Scorecard” website, as discussed in more detail in “Regulatory Environment - Student Financing Sources and Related Regulations/Requirements - Regulation of Title IV Financial Aid Programs - College Scorecard.” Among other characteristics, the College Scorecard allows users to search for schools based upon programs offered, location, size, tax status, mission, and religious affiliation. In May 2019, ED updated the College Scorecard to include additional information, including program-level outcomes data such as earnings and loan debt, and in November 2019 ED supplemented the College Scorecard to include program-level outcomes data such as median earnings and median loan debt. We cannot determine the extent to which data collected and published by ED has impacted or may impact our institution’s enrollments, reputation, or operating results, including if students exclude our institutions from consideration because of the College Scorecard’s presentation of our graduation rate, the focus on tax status and our status as a for-profit business, or because of other factors.
We cannot predict the nature of any future rulemakings, actions, or interpretations that may be implemented or adopted by ED. However, these and future regulatory developments may adversely impact our institutions’ enrollments, financial condition, results of operations, expenses, and cash flows.
Failure to comply with the various federal and state laws and regulations governing HCN’s recently launched program to extend credit to its students could subject us to fines, penalties, obligations to discharge loans and other injunctive requirements, which could have a material adverse effect on our financial condition, results of operations, and cash flows and result in the imposition of significant restrictions on us and our ability to operate.
In July 2018, HCN began offering extended payment plan options, and beginning with enrollments for the term beginning in January 2020, HCN added an additional extended payment program. The extended payment plan options are designed to assist students with educational costs consisting of tuition, textbooks, and fees. Payment plans require monthly payments while the student is enrolled in a program and extend for a period up to six months after the last day of attendance or graduation. The extended payment plans are subject to various federal and state laws and regulations, such as the Truth in Lending Act as implemented in Regulation Z, the Equal Credit Opportunity Act as implemented in Regulation B, and the Unfair, Deceptive or Abusive Acts or Practices provisions of Title X of the Dodd-Frank Act. For more on these extended payment plan options and their regulation, see “Our Institutions - Hondros College of Nursing - Sources of Student Financing” and “Regulatory Environment - Student Financing Sources and Related Regulations / Requirements - Additional Sources of Student Payments” in Part I, Item 1 of this Annual Report. We have limited experience in extending credit to our students and therefore in complying with these laws and regulations. If we do not comply with laws and regulations applicable to this financing
60
program, we could be subject to fines, penalties, obligations to discharge loans and other injunctive requirements, which could have a material adverse effect on our financial condition, results of operations, and cash flows and result in the imposition of significant restrictions on us and our ability to operate. Additionally, an adverse allegation, finding or outcome in any of these matters could also materially and adversely affect our ability to maintain, obtain or renew licenses, approvals or accreditation and maintain eligibility to participate in Title IV programs or serve as a basis for ED to discharge certain Title IV student loans and seek recovery for some or all of its resulting losses from us, either of which could have a material adverse effect on our business, financial condition, results of operations, and cash flows, and result in the imposition of significant restrictions on us and our ability to operate.
Risks Related to Our Business
DoD’s MOU includes terms and conditions that impose extensive regulatory requirements on our institutions with respect to participation in DoD tuition assistance programs.
Each institution participating in DoD tuition assistance programs is required to sign an MOU outlining certain commitments and agreements between the institution and DoD prior to accepting funds from DoD tuition assistance programs. In 2014, DoD promulgated new regulations and institutions were required to sign a new MOU, which we refer to as the DoD MOU, in order to continue to participate in DoD tuition assistance programs. For more information about the requirements imposed by the DoD MOU, see “Regulatory Environment - Department of Defense.” We cannot predict precisely what type of immediate sanctions, if any, will be implemented before an institution loses the ability to participate in DoD tuition assistance programs for failure to comply with the DoD MOU. We believe that DoD may also impose sanctions other than denying an institution the ability to participate in tuition assistance programs, including restricting student enrollment in tuition assistance programs, suspending an institution from enrolling new students, limiting access to military installations, subjecting the institution to heightened compliance oversight, or otherwise limiting an institution’s ability to participate in tuition assistance programs. If we fail to comply with the requirements of the DoD MOU or any successor MOU, we will not be able to participate in DoD tuition assistance programs, which could have a significant adverse effect on our results of operations and financial condition.
Our business could be harmed if our institutions experience a disruption in their ability to process Title IV financial aid.
We collected a substantial portion of our fiscal year 2019 consolidated revenue from receipt of Title IV financial aid program funds. Any processing disruptions by ED, by our institutions, or by third-party service providers may impact the ability of our institutions’ students to obtain Title IV financial aid on a timely basis. If our institutions experience a disruption in their ability to process Title IV financial aid, either because of administrative challenges on their part or the part of their vendors, or the inability of ED to process Title IV funds on a timely basis, it could have a material adverse effect on our institutions’ business and on our financial condition, results of operations, and cash flows. If our institutions experience a disruption in their ability to process Title IV financial aid because of administrative challenges on their part or the part of their vendors, ED could require that our institutions become subject to payment methods for Title IV programs that are not the advance payment system, which could have a material adverse effect on our institutions’ cash flows.
We have recently implemented a shared services model for services between APEI and APUS, and APEI and HCN, and challenges encountered due to the implementation of this model may cause strategic or operational challenges and adversely impact us.
Beginning in 2016, we began to invest capital and human resources in the transition and planned implementation of the shared services model pursuant to which APEI will provide services to APUS and HCN that were previously handled directly within APUS and HCN, as well as in changes to our systems and training of employees, among other things. We also separated the roles of President of APUS and CEO of APEI, although subsequently our CEO, Dr. Wallace E. Boston, resumed both positions until a new CEO of APEI was appointed effective September 23, 2019. In December 2016, APUS submitted a change of structure application to HLC in connection with the proposed implementation of the shared services model.
In November 2018, HLC notified APUS that the HLC Board of Trustees approved the change in structure application and extended APUS’s accreditation following adoption of the shared services model, which we subsequently implemented. As required by HLC policy and ED regulation, HLC conducted a focused site visit in May 2019. The site visit team found that evidence of compliance with the commitments APUS made in its application and with HLC’s Eligibility Requirements and Criteria for Accreditation was sufficiently demonstrated and no further follow up was recommended. In August 2019, HLC notified APUS that HLC’s Institutional Actions Council, which conducts reviews and takes action on accreditation recommendations, concurred with the site visit team’s findings.
61
As with any operational change, the implementation of the shared services model, and the evaluation and implementation of any leadership changes, could lead to strategic and operational challenges, distractions of management from other key initiatives, inefficiencies, or increased costs, any of which could adversely affect our business, financial condition, results of operations, and cash flows.
Efforts to diversify our business outside of the traditional areas served by our institutions may provide strategic and operational challenges that we are not prepared or able to address.
We intend to continue to explore opportunities to invest in the education industry, which could include purchasing or investing in other education-related companies or companies developing new technologies. As we seek opportunities to expand our business and serve markets beyond those traditionally served by our institutions, we may encounter strategic and operational challenges different from those within our existing institutions. Our institutions may have limited experience operating in new businesses and markets or new modes of teaching (such as CBE, micro-credentials, or other non-degree credentials) and may need to modify systems and strategies or enter into arrangements with other institutions and organizations. In addition, our systems and infrastructure may not be able to respond quickly enough to support new business opportunities, or we may not otherwise be able to address the strategic or operational differences of these new opportunities. If we are unable to successfully capitalize on new opportunities, the value of our common stock may decline over time, including because of the challenges of growing our core business under our current model.
As part of our business strategy, we have entered into, and may enter into or seek to enter into, business combinations and acquisitions that may be difficult to integrate, disrupt our business, dilute stockholder value, or divert management attention.
We may seek to enter into business combinations or acquisitions in the future. Acquisitions are typically accompanied by a number of risks, including:
|
•
|
difficulties consolidating operations and integrating information technology and other systems, as well as the inability to maintain uniform standards, controls, policies and procedures;
|
|
•
|
distraction of management’s attention from normal business operations during the acquisition and integration processes;
|
|
•
|
inability to obtain, or delay in obtaining, approval of the acquisition from the necessary regulatory agencies, or the imposition of operating restrictions or a letter of credit requirement on us or on the acquired institution;
|
|
•
|
challenges relating to conforming non-compliant financial reporting procedures to those required of a subsidiary of a U.S. reporting company, including procedures required by the Sarbanes-Oxley Act;
|
|
•
|
expenses associated with the integration efforts; and
|
|
•
|
unidentified issues not discovered in the due diligence process, including legal contingencies.
|
Any inability to integrate completed acquisitions in an efficient and timely manner could have an adverse impact on our results of operations. Further, many acquisitions result in the acquirer recording goodwill. If any acquisitions for which we record goodwill are not successful or experience challenges, that goodwill may become impaired and have an adverse impact on our results of operations. For example, we recorded pretax, non-cash charges of
$7.3
million during the fiscal year ended December 31, 2019 to reduce the carrying value of our goodwill as a result of determinations that the fair value of HCN was less than its carrying value because of circumstances including HCN’s underperformance against 2019 internal targets and overall 2019 financial performance. We also previously recorded a charge in 2016 to reduce the carrying value of our goodwill as a result of a determination that the fair value of HCN was less than its carrying value.
Our acquisition of an educational institution would also likely be considered a change in ownership and control of the acquired institution under applicable regulatory standards, as in the HCN acquisition. For such an acquisition, we may need approval from ED, applicable state agencies and accrediting agencies, and possibly other regulatory bodies, a number of which can only be requested after completion of the acquisition. Our inability to obtain such approvals with respect to a completed acquisition could have a material adverse effect on our business, financial condition, results of operations, and cash flows. If we are not successful in completing acquisitions, we may incur substantial expenses and devote significant management time and resources without a productive result. In addition, future acquisitions could result in dilutive issuances of securities or could require use of substantial portions of our available cash, as in the HCN acquisition, or issuances of debt, which could adversely affect our financial condition.
We have limited experience in making investments in other entities, and any such investments may not result in strategic benefits for our business or could expose us to other risks.
62
To assist us in achieving elements of our business strategy or to further develop our business capabilities, from time to time we will consider and may pursue strategic investments and acquisitions. These transactions could include, among other things, investments in, partnerships or joint ventures with, or the acquisition of, other schools, service providers or education technology related companies, among other types of entities. Investing in another entity requires expertise in evaluating another entity’s business and identifying strategic benefits of a potential investment in such entity, among other expertise. These types of investments involve significant challenges and risks, including that the investment does not advance our business strategy, that we do not realize a satisfactory return on our investment, that we acquire unknown liabilities, or that management’s attention is diverted from our core business. These events could harm our operating results or financial condition. Any investments in other entities may also subject us to the operating and financial risks of such entities, and we rely on the internal controls and financial reporting controls of such entities.
We have made minority investments in entities in which we do not have sole control, which present risks in addition to those that apply to other investments or acquisitions. These investments include our investment in a holding company that acquired and now operates New Horizons Worldwide, Inc., or New Horizons, our investment in preferred stock of Fidelis Education, Inc., or Fidelis Education, our investment in preferred stock of Second Avenue Software, Inc., or Second Avenue, and our investment in preferred stock of RallyPoint, an online social network for members of the military. Although we have the right to representation on the Board of Directors of the holding company of New Horizons, the Board of Directors of Fidelis Education, and the Board of Directors of Second Avenue, and have observer rights for the Board of Directors of RallyPoint, we do not have the ability to control the policies, management or affairs of these entities, and generally we would not have that ability in any minority investment in an entity. The interests of persons who control the entities in which we have invested and may invest may differ from our interests, and they may cause such entities to take actions that are not in our best interest, and we may become involved in disputes with such persons. Our inability to control entities in which we make minority investments could negatively affect our ability to realize the strategic benefits of those investments.
We have made these minority investments to realize strategic benefits for our business, rather than to generate income or capital gains from these investments, and we may make future minority investments for similar purposes. We cannot ensure that we will realize any strategic benefits from these investments in the near-term or at all. To the extent that the strategic benefits of any investment are not timely realized, or the investment otherwise underperforms, we may wish to dispose of the investment. Because our interests in entities in which we have made minority investments, such as New Horizons, Fidelis Education, Second Avenue, and RallyPoint are highly illiquid and not traded in any public market, we may not be able to timely dispose of these interests, or may have to sell at less than our carrying value. Further, should the value of these investments become impaired, we may be required to reduce the carrying value of these investments. For example, we recorded a non-cash, pretax impairment charge of $0.5 million for the fiscal year ended December 31, 2018, to reduce the carrying value of certain minority investments to their fair value.
Our inability to dispose of our interest in such an entity, or a reduction in the carrying value of such an entity on our books, would negatively affect our operating results.
We may not be able to successfully manage and limit our exposure to bad debt.
We experienced an increase in bad debt in our HCN segment for the year ended December 31, 2019 and have experienced increases in other recent interim periods in both our HCN and APUS segments. We believe these increases in bad debt in our HCN segment have been primarily driven by HCN’s implementation of extended payment plan options in 2018. For more information on the extended payment plan options, see “Our Institutions - Hondros College of Nursing - Sources of Student Financing” and “Regulatory Environment - Student Financing Sources and Related Regulations / Requirements - Additional Sources of Student Payments” in Part I, Item 1 of this Annual Report.
We also experienced increases in our bad debt expense over several years prior to 2015, particularly at APUS. We believe those increases were primarily driven by an increase in the number of students using Title IV program funds, operational policies, processing challenges, and challenges collecting funds primarily related to students who did not complete courses. In September 2015, APUS changed the method by which it disburses Title IV program funds in an effort to lower bad debt expense and to reduce the attractiveness of our programs to students who are seeking to abuse the Title IV programs. While we have experienced decreases in bad debt expense at APUS during each of the last several years, there is no assurance that these changes caused the reductions.
There is no assurance that we will be able to limit our exposure to bad debt or that steps we take to limit bad debt will be effective. Continued bad debt increases in our HCN segment or bad debt expense increases at APUS could have a material adverse effect on our financial condition, cash flows, and results of operations.
63
We rely on third-party vendors whose service may be of lower quality than ours, whose responsiveness may be less timely than ours, and whose compliance practices may increase our operational and compliance risk.
We rely on third-party vendors to provide certain services to our institutions and their students primarily related to information technology services and financial aid processing, and expect to rely more heavily on such vendors, particularly through cloud computing services, for certain information technology services in the future. While we monitor and assess the service of these vendors, it is possible that the quality of their service and the timeliness of their responses may be less than the service and responsiveness that we or our institutions would provide. These third-party vendors may lack adequate business continuity planning. Using third-party vendors increases compliance risk that the vendors may not adequately protect personal information regarding our institutions’ students and their families, or that they may not comply with applicable federal or state regulations applicable to our institutions’ business. Further, transitioning from existing vendors or from in-house processes to new providers or from third-party providers to in-house processes involves inherent risks, including the risk of significant disruptions of integral processes. In the event third-party vendors fail to provide services, lack adequate continuity planning, or fail to provide necessary implementation or transition services, our financial condition and results of operations could be adversely affected.
If our institutions fail to maintain adequate systems and processes to detect and prevent fraudulent activity in student enrollment and financial aid, our institutions may lose the ability to participate in Title IV programs or Department of Defense tuition assistance programs, or have participation in these programs conditioned or limited.
Our institutions, in particular APUS, have been the target of fraudulent and abusive activity related to Title IV program funds, as well as other fraudulent or abusive activities. We believe the risk of outside parties attempting to perpetrate fraud in connection with the award and disbursement of Title IV program funds at APUS, including as a result of identity theft, is heightened due to its being an exclusively online education provider and its relatively low tuition. Our institutions must maintain systems and processes to identify and prevent fraudulent applications for enrollment and financial aid. We cannot be certain that our institutions’ systems and processes will continue to be adequate in the face of increasingly sophisticated fraud schemes, or that we will be able to expand such systems and processes at a pace consistent with the changing nature of these fraud schemes.
ED requires institutions that participate in Title IV programs to refer to the ED OIG credible information about fraud or other illegal conduct involving Title IV programs, and in the past our institutions have referred to the OIG information with respect to potential fraud by applicants and students. If the systems and processes that our institutions have established to detect and prevent fraud are inadequate, ED may find that our institutions do not satisfy ED’s “administrative capability” requirements. If our institutions fail to satisfy the administrative capability requirements, ED may require the repayment of Title IV program funds, transfer our institutions from the “advance” system of payment of Title IV program funds to heightened cash monitoring status, or to the “reimbursement” system of payment, place our institutions on provisional certification status, or commence a proceeding to impose a fine or to limit, suspend, or terminate our institutions’ participation in Title IV programs, which would adversely affect our institutions’ enrollment, revenue, and results of operations. In addition, our institutions’ ability to participate in Title IV programs and DoD tuition assistance programs is conditioned on maintaining accreditation by an accrediting agency that is recognized by ED. Any significant failure to adequately detect fraudulent activity related to student enrollment and financial aid could cause our institutions to fail to meet their accreditors’ standards. Furthermore, accrediting agencies that evaluate institutions offering online programs, like APUS’s programs, must require such institutions to have processes through which the institution establishes that a student who registers for such a program is the same student who participates in and receives credit for the program. Failure to meet the requirements of our institutions’ accrediting agencies could result in the loss of accreditation of one or more of our institutions, which could result in their loss of eligibility to participate in Title IV programs, DoD tuition assistance programs, or both.
We may have unanticipated tax liabilities that could adversely impact our results of operations and financial condition.
We and our institutions are subject to multiple types of taxes in the U.S. and may be subject to taxation in the future in various foreign jurisdictions. The determination of our provision for income taxes and other tax accruals involves various estimates and judgments, and therefore the ultimate tax determination is subject to uncertainty. In addition, changes in tax laws, regulations, or rules, or application of state sales taxes, may adversely affect our future reported financial results, may impact the way in which we conduct our business, or may increase the risk of audit by the Internal Revenue Service or other tax authorities.
Although we believe our tax accruals are reasonable, the final determination of tax returns under review or returns that may be reviewed in the future and any related litigation could result in tax liabilities that materially differ from our historical income tax provisions and accruals. In addition, an increasing number of states are adopting new laws or changing their interpretation of existing laws regarding the apportionment factors used for state corporate income tax purposes in a manner that could result in a larger proportion of our income being taxed by the states in which we are required to file state tax returns. These legislative and administrative changes could have a material adverse effect on our business and financial condition.
64
We rely on dividends, distributions and other payments, advances and transfers of funds from our operating subsidiaries to meet our obligations and to fund acquisitions and certain investments.
We rely on dividends, distributions and other payments, advances and transfers of funds from our operating subsidiaries to meet our obligations and to fund acquisitions and certain investments and generate all of our operating income through our subsidiaries. As a result, we rely on dividends and other payments or distributions from our operating subsidiaries to meet our obligations and to fund acquisitions and investments. The ability of our operating subsidiaries to pay dividends or to make distributions or other payments to us depends on their respective operating results and may be restricted by, among other things, the laws of their respective jurisdictions of organization, regulatory requirements such as obligations to maintain certain restricted cash or post letters of credit, accreditation requirements, agreements entered into by those operating subsidiaries, and the covenants of any future obligations that we or our subsidiaries may incur.
If we are unable to attract and retain management, faculty, administrators, and skilled personnel, our business and growth prospects could be severely harmed, and changes in management could cause disruption and uncertainty.
Our success depends largely upon the continued services of our executive officers and other key management and technical personnel. The loss of one or more of our key personnel could harm our business. While we have employment agreements with our Chief Executive Officer, the President of APUS, our Chief Financial Officer, and our Chief Technology Officer, we do not have employment agreements with other executives or personnel, and the employment agreements that we do have do not prevent our executives from voluntarily ceasing to work for us.
We must attract and retain diverse and highly qualified management, faculty, administrators, and skilled personnel to our institutions. Competition for hiring these individuals is intense, especially with regard to faculty in specialized areas, and executives with relevant industry expertise. We have had a number of other executive officers retire or otherwise depart our Company over the last several years and we continually evaluate our leadership structure. For instance, effective October 15, 2017, Dr. Karan Powell retired from her role as President of APUS. Dr. Boston, who was at the time our Chief Executive Officer, was appointed to serve as Interim President of APUS, and since August 2018 has served as President of APUS on a permanent basis. In September 2019, Angela Selden was hired as our Chief Executive Officer, and Dr. Boston remained in the role of President of APUS pending his expected retirement in June 2020. In addition, in May 2018, we hired a new Chief Technology Officer, and in May 2019, we appointed a new interim Chief Executive Officer of HCN, replacing the former Chief Executive Officer of HCN. In addition to these hires and changes, we are also seeking a successor to Dr. Boston as President of APUS, and may otherwise continue to work to strengthen our management team. As with any leadership changes, our past or future changes could lead to strategic and operational challenges and uncertainties, distractions of management from other key initiatives, inefficiencies, or increased costs, any of which could adversely affect our business, financial condition, results of operations, and cash flows.
If we fail to attract new management, faculty, administrators, or skilled personnel or fail to retain, develop, and motivate our existing management, faculty, administrators, and skilled personnel, our institutions and our ability to serve our students and expand our programs, open new locations, make investments or acquisitions, and update or enhance our technology could be severely harmed, and changes in management could disrupt our business and cause uncertainty.
Our success depends on the contributions of our approximately
2,900
employees.
Our performance largely depends on the talents, experience, and efforts of our employees, and we believe that we can be distinguished by our ability to foster a culture and practice of innovation, quality, communication, cooperation, honesty, and respect. In addition, our strategic initiatives require our management, faculty, staff, and skilled personnel to adapt and learn new skills and capabilities. Our failure to maintain a positive culture or to continue fostering the growth and development of our personnel, including through the use of staff performance evaluation systems and processes, could have a material adverse effect on our business and results of operations.
We rely on key personnel to lead with integrity. To the extent our leaders behave in a manner that is not consistent with our values, we could experience significant impact to our brand and reputation, as well as to our culture.
We also must manage leadership development and succession planning throughout our business. To the extent that we lose experienced personnel, it is critical that we develop other employees, hire new qualified personnel, and successfully manage the transfer of critical knowledge. While we have processes in place for management transition and the transfer of knowledge, the loss of key personnel, coupled with an inability to adequately train other personnel, hire new personnel, or transfer knowledge, could significantly impact our business and results of operations.
65
Our limited ability to obtain exclusive proprietary rights and protect our intellectual property, as well as disputes we may encounter from time to time with third parties regarding our use of their intellectual property, could harm our operations and prospects.
In the ordinary course of business, our institutions develop intellectual property of many kinds that is or will be the subject of patents, copyrights, trademarks, service marks, domain names, agreements, and other registrations. Our institutions rely on agreements under which we obtain rights to use course content developed by faculty members and other third-party content experts.
We cannot ensure that any measures we and our institutions take to protect our intellectual property or obtain rights to the intellectual property of others will be adequate, or that we have secured, or will be able to secure, appropriate protections for all of our institutions’ proprietary rights in the United States or foreign jurisdictions, or that third parties will not infringe upon or violate the proprietary rights of our institutions. Despite our efforts to protect these rights, third parties may attempt to develop competing programs or copy aspects of our institutions’ curriculum, online resource material, quality management, and other proprietary content. Any such attempt, if successful, could adversely affect our institutions’ business. Protecting these types of intellectual property rights can be difficult, particularly as it relates to the development by our institutions’ competitors of competing courses and programs.
Our institutions may encounter disputes from time to time over rights and obligations concerning intellectual property, and may not prevail in these disputes. Third parties may raise a claim against our institutions alleging an infringement or violation of their intellectual property. Some third-party intellectual property rights may be extremely broad, and it may not be possible for our institutions to conduct operations in such a way as to avoid disputes regarding those intellectual property rights. Any such dispute could subject our institutions to costly litigation and impose a significant strain on our financial resources and management personnel regardless of whether that dispute has merit. Our insurance may not cover potential claims of this type adequately or at all, and our institutions may be required to alter the content of their courses or pay monetary damages, which may be significant.
We may incur liability for the unauthorized duplication or distribution of course materials posted online for course discussions.
In some instances, our institutions’ faculty members or students may post various articles or other third-party content online in course discussion boards or in other venues. The laws governing the fair use of these third-party materials are imprecise and adjudicated on a case-by-case basis, which makes it challenging to adopt and implement appropriately balanced institutional policies governing these practices. We and our institutions may incur liability for the unauthorized duplication or distribution of this material posted online. Third parties may raise claims against us and our institutions for the unauthorized duplication of this material. Any such claims could subject us and our institutions to costly litigation and impose a significant strain on financial resources and management personnel regardless of whether the claims have merit. Our institutions’ faculty members or students could also post classified material on course discussion boards, which could expose us to civil and criminal liability and harm our institutions’ reputations and relationships with members of the military and government. Our insurance may not cover potential claims of this type adequately or at all, and we may be required to pay monetary damages and our institutions may be required to alter the content of their courses.
Legal proceedings, particularly class action lawsuits, may require human and financial resources, distract our management, and negatively affect our reputation and operating results.
From time to time, we and our institutions have been and may be involved in various legal proceedings. In recent years, we have observed an increase in litigation brought against for-profit schools, including class actions brought by students and prospective students based on alleged misrepresentations about a school’s programs, an increase in “qui tam” lawsuits, and investigations by state attorneys general into for-profit postsecondary education institutions, which are described above under the heading “Risks Related to the Regulation of Our Industry.” For example, in November 2013, a putative class action was brought against HCN relating to a time period prior to our ownership. The lawsuit asserted claims for fraud and fraudulent inducement, negligent misrepresentation, breach of implied-in-fact contract, promissory estoppel, unjust enrichment, and violation of the Ohio Consumer Sales Practices Act. While HCN admitted to no wrongdoing in the eventual settlement agreement and the case was dismissed with prejudice after the payment of a
de minimis
settlement, on December 4, 2015, ED sent HCN a letter informing HCN that ED had determined to fine HCN $27,500 based on ED’s finding that HCN had substantially misrepresented its programmatic accreditation status during a time period prior to our ownership of HCN. HCN informed ED in a letter that it disagreed with ED’s findings but would pay the fine in order to resolve promptly the matter and to enable ED to finalize its review of the application for a change in ownership. In the future, not all claims may be as easily resolved. The significant human and financial resources required to investigate and respond to claims brought in any future
66
litigation may distract management’s attention from operating our business or lead to larger payments or liabilities, including adverse regulatory action, and, as a result, negatively affect our operating results.
We may need additional capital in the future, but there is no assurance that funds will be available on acceptable terms.
We may need additional capital in the future for various reasons, including to finance business acquisitions and investments in technology or to achieve growth or fund other business initiatives, but there is no assurance that capital will be available in sufficient amounts or on terms acceptable to us and may be dilutive to existing stockholders. Additionally, any securities issued to raise capital may have rights, preferences, or privileges senior to those of existing stockholders. If adequate capital is not available or is not available on acceptable terms, our and our institutions’ ability to expand, develop or enhance services or products, or respond to competitive pressures, will be limited.
Our access to capital markets and sourcing for additional funding to expand or operate our business is subject to market conditions. Credit concerns regarding the for-profit postsecondary education industry as a whole also may impede our access to capital markets. If we are unable to obtain needed capital on terms acceptable to us, we may have to limit strategic initiatives or take other actions that materially adversely affect our business, financial condition, results of operations, and cash flows.
Economic and market conditions, including changes in interest rates, could affect our enrollments, success with placement and persistence and cohort default rates in the U.S. or abroad.
Our business has been and may in the future be adversely affected by a general economic slowdown or recession in the U.S. or abroad. Our institutions derive a significant portion of their revenue from Title IV programs, which include student loans with interest rates subsidized by the federal government. Additionally, some students finance their education through private loans that are not government subsidized. Historically low interest rates have created a favorable borrowing environment for students. However, our students may have to pay higher interest rates on their Title IV program loans and private loans as a result of recent interest rate increases. Increases in applicable interest rates could result in a corresponding increase in educational costs to our existing and prospective students, which could result in a reduction in our enrollment. Higher interest rates could also contribute to higher default rates with respect to our students’ repayment of their education loans. Higher default rates may in turn adversely impact our eligibility to participate in some Title IV programs, which could adversely impact our operations and financial condition.
Adverse economic developments that affect the United States could also result in a reduction in the number of jobs available to our graduates and lower salaries being offered in connection with available employment, which, in turn, could result in declines in our success with placements and persistence. In addition, adverse economic developments could adversely affect the ability or willingness of our former students to repay student loans, which could increase our institutions’ student loan cohort default rates and require increased time, attention, and resources to manage these defaults. Our institutions’ students are able to borrow Title IV loans in excess of their tuition and fees. The excess is received by such students as a credit balance refund. However, if a student withdraws, our institutions must return any unearned Title IV funds, which may include a portion of the credit balance refund, and must seek to collect from the student any resulting amounts owed to the institution. A protracted economic slowdown could negatively impact such students’ ability to satisfy debts to the institution, including debts that result from returns of unearned Title IV amounts. As a result, the amount of Title IV funds we would have to return without repayment from our institutions’ students could increase, and our financial results could suffer.
Risks Related to Our Technology Infrastructure
We need to continue to invest, and may need to increase our level of investment in, our institutions’ information technology, which may place a strain on resources that could adversely affect our systems, controls, and operating efficiency, and those of our institutions.
We need to invest capital, time, and resources to update our institutions’ information technology, including our student-facing systems, in response to competitive pressures in the marketplace, including data analytics, artificial intelligence, interactive and immersive user and learning experience technologies such as those that leverage virtual and augmented reality, multi-channel customer engagement, and robotic process automation, to update or replace older systems, and to enhance functionality. We incurred approximately $2.1 million during 2019 to evaluate and invest in replacements or upgrades to our information technology systems, including our learning management system, and to inform the scope and duration of our larger overall information technology transformation program. We also anticipate spending between approximately $6.0 million and $8.0 million in 2020, focusing on specific information technology projects, including replacements of our learning management and customer relationship management systems. While we estimate 80% of this anticipated spending to be one-time spending with respect to the projects and systems to which the expenditures relate, we expect to make similar expenditures in future years,
67
but we have not estimated any future amounts at this time. We would likely also have to make investments to integrate the technology systems of any business we may acquire in the future. Our efforts to improve our information technology systems may not be successful, may cost more than expected, may increase our level of spending, not all of which can be capitalized, or may otherwise adversely affect our financial condition. We may also be unable to address all of the initiatives that we would like to pursue, or find that the number of projects we are working on impacts our ability to adequately address critical areas. As a result of unsuccessful development efforts, or as a result of replacing outdated technology, software or other technology related assets, we may have assets that become impaired. For example, for the year ended December 31, 2016, we recorded a pretax, non-cash charge of $5.1 million in long-lived assets, primarily consisting of a loss that resulted from the abandonment of development of a new student course registration system.
If we are unable to increase the capacity of our institutions’ technology resources or update their resources appropriately, their ability to handle future growth, to attract or retain students, and our financial condition and results of operations could be adversely affected. Similarly, even if we are able to increase the capacity of our institutions’ resources and update their resources appropriately, our financial condition and results of operations could be adversely affected by an increased level of spending.
System disruptions to our online computer networks, technology infrastructure, or online classroom infrastructure, or to the networks, infrastructure and systems of third parties, could negatively impact our ability to generate revenue and could damage our reputation, limiting our ability to attract and retain students.
The performance and reliability of our and our institutions’ networks and technology infrastructure, including those of third parties systems we use, is critical to our institutions’ reputation and ability to attract and retain students. Any system error or failure, or a sudden and significant increase in bandwidth usage, could interrupt our or our institutions’ ability to operate and could result in the unavailability of APUS’ online classrooms, preventing students from accessing their courses and adversely affecting our results of operations. In addition, our institutions’ technology infrastructure, and the technology infrastructure of our third-party vendors, could be vulnerable to interruption or malfunction due to events beyond our control, including natural disasters, cyber-attacks, terrorist activities, and telecommunications failures.
Our systems at APUS, particularly those proprietary information systems and processes that we refer to as Partnership at a Distance
TM
, or PAD, have been predominantly developed in-house, with limited support from outside vendors. To the extent that we have utilized third-party vendors to provide certain software products for our systems, we have generally needed to integrate those products into, and ensure that they function with, PAD. We continuously work on upgrades to PAD, and our employees devote substantial time to its development and to the successful integration of third-party products into PAD. To the extent that we face system disruptions or malfunctions with PAD or lose employees with experience on our systems, we may not have the capacity to address such disruptions or malfunctions or to continue to administer PAD with our internal resources, and we may not be able to identify outside contractors with expertise relevant to our custom system.
We also use third party services such as cloud computing and software as a service for certain aspects of our operations and are reliant on the capabilities of vendors for such functions. We expect to increasingly rely on cloud computing and software as a service providers for our information technology operations in the future. Cloud computing and third party service providers may take actions beyond our control that could adversely affect our access to the provider’s service, including discontinuing or limiting our access to its platform or modifying or interpreting its terms of service or other policies in a manner that impacts our ability to run our business and operations. In addition, any transition of cloud computing and third party services that we use to another vendor could be difficult to implement and cause us to incur significant time and expense. Any significant downtime or other interruption or disruption of these services could adversely impact our operations and our business.
Any significant interruption in the operation of our institutions’ data centers or server rooms or those of our third party service providers could cause a loss of data. Even with redundancy, a significant interruption in the operation of these facilities or the loss of institutional and operational data due to a natural disaster, fire, power interruption, act of terrorism, or other unanticipated catastrophic event may not be preventable. Any significant interruption in the operation of these facilities, including an interruption caused by the failure to successfully expand or upgrade systems, or to manage transitions and implementations, could reduce the ability to manage network and technological infrastructure, which could adversely affect our institutions’ operations and reputations. Additionally, our institutions do not necessarily control the operation of the facilities hosting our technology infrastructure and may be required to rely on other parties to provide physical security, facilities management, and communications infrastructure services. If any third party vendors encounter financial difficulty such as bankruptcy or other events beyond our control that causes them to fail to adequately secure and maintain their facilities or provide necessary connectivity or capacity, our institutions and their students may experience interruptions in service or the loss or theft of important data, which could adversely affect our financial condition.
68
Data security breaches and cyber-attacks could compromise sensitive information and cause system disruptions and significant damage to our business and reputation.
In the ordinary course of our business, we maintain on our network systems, and on the networks of our third-party providers, certain information that is confidential, proprietary, personal (such as student information), or otherwise sensitive in nature, including financial information and confidential business information. Our computer networks, and the networks of our third-party vendors, may be vulnerable to unauthorized access or disruptions by computer hackers, phishing, ransom-ware, computer viruses, denial of service attacks, malicious social engineering and other security attacks or security problems. A user who circumvents security measures could misappropriate confidential or proprietary information or personal information about our students or employees, or could cause interruptions or malfunctions in operations.
Our systems and the systems maintained by our third-party providers, have been in the past, and may be in the future, subject to attempts to gain unauthorized access, breach or other system disruptions. In some cases, it is difficult to anticipate or to detect immediately such incidents and the damage caused thereby.
If we or third parties with access to our systems, or to our proprietary information or personal information about our students or employees, experience security breaches in the future, we may be required to expend significant resources to protect against the threat of these security breaches or to alleviate problems caused by such breaches, which could include litigation brought by affected individuals or other parties, the impositions of penalties, disruption to our operations, and damage to our reputation.
Our planned increased use and reliance on cloud computing could expose us to additional risks. While our contractual arrangements with cloud computing vendors provide for the protection of information, we cannot control these vendors or their systems and cannot guarantee that a data security or privacy breach of their systems will not occur in the future.
We use external vendors to perform security assessments on a periodic basis to review and assess our information security. We utilize this information to audit ourselves to ensure that we are adequately monitoring the security of our technology infrastructure. However, we cannot ensure that these security assessments and audits will protect our computer networks against the threat of security breaches. Similarly, although we require our third-party vendors to maintain a level of security that is acceptable to us and work closely with our third-party vendors to address potential and actual security concerns and attacks, we cannot ensure that we and our systems and proprietary information or personal information about our students or employees will be protected against the threat of security attacks on our third-party vendors that affect our systems or such information. System disruptions and security breaches to our online computer networks, technology infrastructure, or online classroom infrastructure, or to the networks, infrastructures and systems of third parties could have an adverse effect on our financial condition.
The personal information that we collect may be vulnerable to breach, theft or loss that could adversely affect our reputation and operations.
Possession and use of personal information in our institutions’ operations subjects us to risks and costs that could harm our business. Our institutions or, in some cases, certain third-party vendors hired by our institutions, collect, use, and retain large amounts of personal information regarding our students and their families, including social security numbers, tax return information and personal and family financial data. Our institutions also collect and maintain personal information of employees in the ordinary course of our business. Some of this personal information is held and managed by certain third-party vendors, including our third-party servicers and information technology vendors. Although our institutions use security and business controls to limit access and use of personal information, a third party may be able to circumvent those security and business controls, which could result in a breach of student or employee privacy. In addition, errors in the storage, use, or transmission of personal information or intentional or unintentional misuse could result in a breach of student or employee privacy. Possession and use of personal information in our institutions’ operations also subjects us to legislative and regulatory burdens that could restrict the use of personal information and require notification of data breaches. We cannot guarantee that a breach, loss, or theft of personal information will not occur. A violation of any laws or regulations relating to the collection or use of personal information could result in the imposition of fines or lawsuits against us or our institutions. As a result, we may be required to expend significant resources to protect against the threat of these security breaches or to alleviate problems caused by such breaches. Given the evolving nature of security threats and evolving safeguards, we cannot be sure that our chosen safeguards will protect against security threats to our systems, data, and business. Even security measures that are appropriate, reasonable, or in accordance with applicable legal requirements may not be able to protect the information we maintain. A breach, theft, or loss of personal information regarding our institutions’ students and their families or our institutions’ employees or other data that is held by our institutions or third-party vendors could have a material adverse effect on our institutions’ reputations and results of operations and result in legal actions by regulators, state attorneys general, and private litigants, any of which actions could divert management’s attention and have a material adverse effect on our business, financial condition, results of operations, and cash flows.
69
We face an ever-increasing number of threats to our computer systems, including unauthorized activity and access, malicious penetration, system viruses, ransomware, phishing and other malicious code and organized cyber-attacks, which could breach our security and disrupt our systems. These risks increase when we make changes to our information technology systems or implement new ones. Our size makes us a prominent target for hacking and other cyber-attacks within the education industry. From time to time we experience security events and incidents, and these reflect an increasing level of malicious sophistication, organization, and innovation. We have devoted and will continue to devote significant resources to the security of our computer systems, but they may still be vulnerable to these threats and may subsequently be deemed to have been inadequate by regulators or courts given the lack of prescriptive measures in data security and cybersecurity laws. A user who circumvents security measures could misappropriate proprietary information or cause interruptions or malfunctions in operations, perhaps over an extended period of time prior to detection. As a result, we may be required to expend significant additional resources to protect against the threat of or alleviate problems caused by these system disruptions and security breaches. Any of these events could have a material adverse effect on our business and financial condition. Although we maintain insurance in respect of these types of events, there is no assurance that available insurance proceeds would be adequate to compensate us for damages sustained due to these events.
Failure to comply with privacy laws or regulations could have an adverse effect on our business.
Various federal, state, and international laws and regulations govern the collection, use, retention, sharing, and security of student and consumer data. These laws could be applied in a manner that results in costs, the imposition of fines and operational conditions on our business. For example, if an institution fails to comply with FERPA, ED may require corrective actions by the institution or may terminate an institution’s eligibility to participate in Title IV programs. Failure to comply with the applicable GLBA requirements may result in FTC enforcement, which could include the imposition of conditions, penalties, monitoring, and oversight. In addition, this area of the law is evolving, and interpretations of applicable laws and regulations differ. In addition, in the U.S., Congress and many state legislatures are considering legislation relating to privacy and security of personal information as are other countries. These evolving laws and interpretations are difficult to predict and could impact our business. Legislative activity in the privacy area may result in new laws that are relevant to us and the operations of our institutions, for example, restricting use or sharing of consumer data, including for marketing or advertising, and may lead to increases in the cost of compliance. For example, the CCPA became effective January 1, 2020 and contains new disclosure obligations for businesses that collect personal information about California residents, affords those individuals new rights relating to their personal information that may affect our ability to use personal information and provides a private right to action for certain data breaches. In addition, our institutions may be subject to the GDPR, which contains a number of requirements that may apply when they collect or otherwise handle personal information about individuals in the EU. These laws’ applicability to us could result in substantial compliance costs or liabilities. The GDPR came into effect in May 2018, but enforcement priorities and interpretation of certain provisions remain unclear. Non-compliance with the GDPR could result in a fine for certain activities of up to 20 million Euros or 4% of an organization’s global annual revenue, whichever is higher, per violation. Claims of failure to comply with our institutions’ privacy policies or applicable laws or regulations could form the basis of governmental or private-party actions against us. Such claims and actions may cause damage to our institutions’ reputation and could have an adverse effect on our financial condition. The enactment of laws similar to the GDPR or CCPA, or any future changes in such laws or additional restrictions, could result in significant costs and require us to change some of our business practices.
Government regulations relating to the internet could increase our cost of doing business and affect our ability to grow.
Government regulations relating to the internet could increase our cost of doing business and affect our ability to grow. The increasing reliance on and use of the internet and other online services has led and may continue to lead to the adoption of new laws and regulatory practices in the United States or foreign countries and to new interpretations of existing laws and regulations. These new laws and interpretations may relate to issues such as online privacy, cybersecurity, internet neutrality, copyrights, trademarks and service marks, sales taxes, fair business practices, and the requirement that online education institutions qualify to do business as foreign corporations or be licensed in one or more jurisdictions where they have no physical location. New laws, regulations or interpretations related to doing business over the internet could increase our costs of compliance or doing business and materially affect our institutions’ ability to offer online courses, which would have a material effect on our business and financial condition.
70
Risks Related to Owning our Common Stock
The price of our common stock may be volatile, and as a result returns on an investment in our common stock may be volatile.
Our stock has had relatively limited public float, and trading in our common stock has also been limited and, at times, volatile. An active trading market for our common stock may not be sustained, and the trading price of our common stock may fluctuate substantially.
The price of our common stock may fluctuate as a result of some or all of the following:
|
•
|
price and volume fluctuations in the overall stock market from time to time;
|
|
•
|
significant volatility in the market price and trading volume of comparable companies;
|
|
•
|
actual or anticipated changes in our earnings, our institutions’ net course registrations or enrollments, or fluctuations in our operating results or in the expectations of securities analysts;
|
|
•
|
the actual, anticipated or perceived impact of changes in the political environment, government policies, laws and regulations, or similar changes made by accrediting bodies;
|
|
•
|
the depth and liquidity of the market for our common stock;
|
|
•
|
general economic conditions and trends;
|
|
•
|
catastrophic events;
|
|
•
|
purchases or sales of large blocks of our stock;
|
|
•
|
recruitment or departure of key personnel; or
|
|
•
|
actions of others in our industry.
|
In the past, following periods of volatility in the market price of a company’s securities, securities class action litigation has often been brought against that company. Because of the potential volatility of our stock price, we may become the target of securities litigation in the future. Securities litigation could result in substantial costs and monetary damages and could divert management’s attention and resources from our business.
Seasonal and other fluctuations in our results of operations could adversely affect the trading price of our common stock.
Our quarterly results fluctuate and, therefore, the results in any quarter may not represent the results we may achieve in any subsequent quarter or full year. Our revenue and operating results normally fluctuate as a result of seasonal or other variations in our institutions’ enrollments and associated expenses. The student population at our institutions varies as a result of new enrollments, graduations, student attrition, increased military operations and deployments, the success of our marketing programs, and other reasons that we cannot always anticipate. We expect quarterly fluctuations in operating results to continue as a result of seasonal enrollment patterns at our institutions and related fluctuations in expenses. These fluctuations may result in volatility in our results of operations, have an adverse effect on the market price of our common stock, or both.
If securities or industry analysts do not continue to publish research or reports about our business, or if they issue an adverse or misleading opinion regarding our stock, our stock price or trading volume could decline.
The trading market for our common stock is influenced by the research and reports that industry or securities analysts publish about us or our business. We previously were covered by more analysts, but we currently only have limited research coverage by analysts, which makes it more difficult to attract interest from investors. Furthermore, if any of the analysts who cover us issue an adverse or misleading opinion regarding us, our business, or our stock performance, or if our performance does not meet the expectations of analysts, our stock price would likely decline. If one or more of the analysts covering us cease coverage of us or fail to publish reports on us regularly, we could lose visibility in the financial markets, which in turn could cause our stock price or trading volume to decline.
Provisions in our organizational documents and in the Delaware General Corporation Law may prevent takeover attempts that could be beneficial to our stockholders.
Provisions in our charter and bylaws and in the Delaware General Corporation Law may make it difficult and expensive for a third party to pursue a takeover attempt we oppose even if a change of control of our Company would be beneficial to the interests of our stockholders. These provisions include:
71
|
•
|
the ability of our Board of Directors to issue up to 10,000,000 shares of preferred stock in one or more series and to fix the powers, preferences, and rights of each series without stockholder approval, which may discourage unsolicited acquisition proposals or make it more difficult for a third party to gain control of our Company;
|
|
•
|
a requirement that stockholders provide advance notice of their intention to nominate a director or to propose any other business at an annual meeting of stockholders;
|
|
•
|
a prohibition against stockholder action by means of written consent unless otherwise approved by our Board of Directors in advance; and
|
|
•
|
Section 203 of the Delaware General Corporation Law, which generally prohibits us from engaging in mergers and other business combinations with stockholders that beneficially own 15% or more of our voting stock, or with their affiliates, unless our directors or stockholders approve the business combination in the prescribed manner.
|
72
ITEM 1B.
UNRESOLVED STAFF COMMENTS
None.
ITEM 2.
PROPERTIES
American Public Education, Inc., or APEI, and American Public University System, Inc., or APUS, together operate administrative facilities in Charles Town, West Virginia, Manassas, Virginia, and Baltimore, Maryland, which are within an approximate one-hour drive of one another and are located within the Baltimore-Washington metropolitan area. The corporate headquarters and administrative offices are located in Charles Town and consist of 11 owned facilities totaling approximately 233,000 square feet. Also in Charles Town, APUS owns two and a half acres of land earmarked for future development. APUS’s student services, graduation, and marketing operations are located in 25,000 square feet of leased space in Manassas under a lease that expires in 2023. APEI’s administrative offices also include approximately 3,000 square feet of leased space in Baltimore, Maryland under a lease that expires in 2022.
In 2019, Hondros College of Nursing, or HCN, had five Ohio campuses which are located in the suburban areas of Cincinnati (West Chester), Cleveland (Independence), Columbus (Westerville), Dayton (Fairborn) and Toledo (Maumee), and an administrative office located in suburban Columbus. In May 2019, HCN entered into a lease agreement for a new campus location in Indianapolis, Indiana opening in the second quarter of 2020. These campuses and administrative office include a total of ten leased facilities with approximately 142,300 square feet combined. The facilities are primarily used for instructional activities. HCN’s corporate offices are located at an administrative facility near the Westerville campus with additional offices at the Westerville campus. Lease terms and extension options vary by facility, with expiration dates ranging from 2023 to 2029.
We believe our existing facilities are in good operating condition and are adequate and suitable for the conduct of our business.
ITEM 3.
LEGAL PROCEEDINGS
From time to time, we have been and may be involved in various legal proceedings. We currently have no material legal proceedings pending.
ITEM 4.
MINE SAFETY DISCLOSURES
Not applicable.
PART II
ITEM 5.
MARKET FOR REGISTRANT’S COMMON EQUITY, RELATED STOCKHOLDER MATTERS AND ISSUER PURCHASES OF EQUITY SECURITIES
Market Information
Our common stock trades on the NASDAQ Global Select Market under the symbol “APEI.”
Holders
As of
March 6, 2020
, there were approximately
463
holders of record of our common stock.
Dividends
We have not historically paid dividends on our common stock and do not anticipate declaring or paying any cash dividends on our common stock in the foreseeable future. The payment of any dividends in the future will be at the discretion of our Board of Directors and will depend upon our financial condition, results of operations, earnings, capital requirements, contractual restrictions, outstanding indebtedness, and other factors deemed relevant by our Board.
Performance Graph
The graph below matches the cumulative five-year total return of holders of American Public Education, Inc.'s common stock with the cumulative total returns of the S&P 500 index, the NASDAQ Composite index and a customized peer group of five companies that includes: Adtalem Global Education Inc, Grand Canyon Education Inc, Perdoceo Education Corp
73
(formerly known as Career Education Corporation), Strategic Education Inc and Zovio, Inc. (formally known as Bridgepoint Education, Inc.). National American University Holdings, Inc., which was included in the performance graph in our annual report for the year ended December 31, 2018, has been removed from the performance graph in this Annual Report as a result of its delisting from Nasdaq. The graph assumes that the value of the investment in our common stock, in each index, and in the peer group (including reinvestment of dividends) was $100 on
December 31, 2014
and tracks the value of those investments, respectively, through
December 31, 2019
.
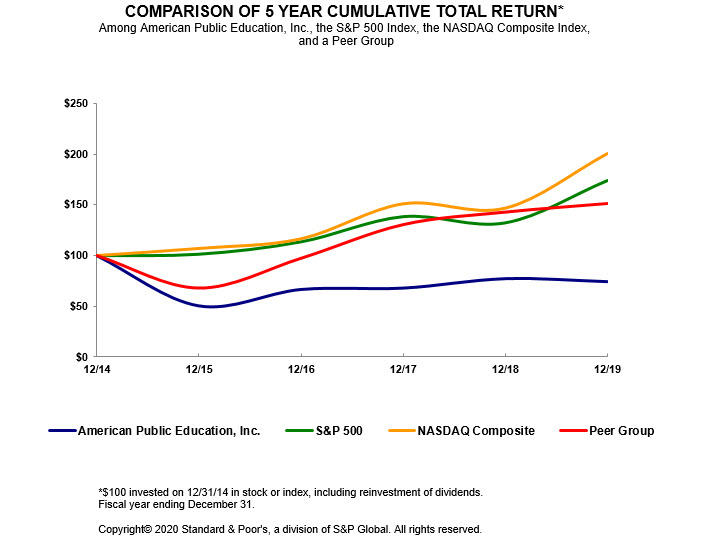
|
December 31, 2014
|
December 31, 2015
|
December 31, 2016
|
December 31, 2017
|
December 31, 2018
|
December 31, 2019
|
|||||||
|
APEI
|
100.00
|
|
50.47
|
|
66.59
|
|
67.94
|
|
77.19
|
|
74.29
|
|
|
S&P 500
|
100.00
|
|
101.38
|
|
113.51
|
|
138.29
|
|
132.23
|
|
173.86
|
|
|
NASDAQ Composite
|
100.00
|
|
106.96
|
|
116.45
|
|
150.96
|
|
146.67
|
|
200.49
|
|
|
Peer Group
|
100.00
|
|
67.92
|
|
97.22
|
|
130.41
|
|
142.72
|
|
151.19
|
|
The stock price performance included in the graph and table above is not necessarily indicative of future stock price performance.
Recent Sales of Unregistered Securities
None.
Purchases of Equity Securities by the Issuer and Affiliated Purchasers
On May 2, 2019, our Board of Directors authorized the repurchase of up to $35.0 million of our common stock, and on December 5, 2019, our Board approved an additional authorization to repurchase up to $25.0 million of shares. Subject to market conditions, applicable legal requirements, and other factors, the repurchases may be made from time to time in the open
74
market or in privately negotiated transactions. The authorization does not obligate us to acquire any shares, and purchases may be commenced or suspended at any time based on market conditions and other factors as we deem appropriate.
As of
December 31, 2019
, approximately
$22.0 million
remained in the current purchase authorization.
The following table presents our share repurchases during the quarter ended
December 31, 2019
. For additional information regarding our share repurchases please refer to “Financial Statements and Supplementary Data - Notes to Consolidated Financial Statements - Note 10. Stockholders’ Equity - Repurchase.”
|
Period
|
Total Number of Shares Purchased
|
Average Price Paid per Share
|
Total Number of Shares Purchased as Part of Publicly Announced Plans or Programs
|
Maximum Number of Shares that May Yet Be Purchased Under the Plans or Programs
(1)
|
Approximate Dollar Value of Shares that May Yet Be Purchased Under the Plans or Programs
(2) (3)
|
||||||||||||
|
October 1, 2019 - October 31, 2019
|
229,849
|
|
0.02
|
|
229,849
|
|
352
|
|
2,562,453
|
|
|||||||
|
November 1, 2019 - November 30, 2019
|
110,374
|
|
0.02
|
|
110,374
|
|
352
|
|
673
|
|
|||||||
|
December 1, 2019 - December 31, 2019
|
110,000
|
|
0.03
|
|
110,000
|
|
352
|
|
22,004,700
|
|
|||||||
|
Total
|
450,223
|
|
$
|
23.75
|
|
450,223
|
|
352
|
|
$
|
22,004,700
|
|
|||||
|
(1)
|
On December 9, 2011, our Board of Directors approved a stock repurchase program for our common stock, under which we could annually purchase up to the cumulative number of shares issued or deemed issued in that year under our equity incentive and stock purchase plans. Repurchases may be made from time to time in the open market at prevailing market prices or in privately negotiated transactions based on business and market conditions. The stock repurchase program does not obligate us to repurchase any shares, may be suspended or discontinued at any time, and is funded using our available cash.
|
|
(2)
|
On May 2, 2019, our Board of Directors authorized the repurchase of up to $35.0 million of our common stock, and on December 5, 2019, our Board approved an additional authorization of up to $25.0 million of shares. We may purchase shares at management’s discretion in the open market, in privately negotiated transactions, in transactions structured through investment banking institutions, or a combination of the foregoing. We may also, from time to time, enter into Rule 10b5-1 plans to facilitate repurchases of shares under this authorization. The amount and timing of repurchases are subject to a variety of factors, including liquidity, cash flow, stock price and general business and market conditions. We have no obligation to repurchase shares and may modify, suspend or discontinue the repurchase program at any time. The authorization under this program is in addition to our repurchase program under which we may annually purchase up to the cumulative number of shares issued or deemed issued in that year under our equity incentive and stock purchase plan.
|
|
(3)
|
During the three month period ended
December 31, 2019
, no shares of common stock were deemed to have been repurchased for common stock forfeited by employees to satisfy minimum tax-withholding requirements in connection with the vesting of restricted stock grants.
|
75
ITEM 6.
SELECTED FINANCIAL DATA
The following table sets forth our selected consolidated financial and operating data as of the dates and for the periods indicated. You should read this data together with “Item 7. Management’s Discussion and Analysis of Financial Condition and Results of Operations” and our Consolidated Financial Statements and related notes, included elsewhere in this Annual Report. The selected consolidated statement of operations data for each of the years in the three-year period ended
December 31, 2019
, and the selected Consolidated Balance Sheet data as of
December 31, 2018
and
2019
have been derived from our audited Consolidated Financial Statements, which are included elsewhere in this Annual Report. The selected consolidated statements of operations data for the years ended
December 31, 2015
and
2016
, and selected Consolidated Balance Sheet data as of
December 31, 2015
,
2016
, and
2017
, have been derived from our audited Consolidated Financial Statements not included in this Annual Report. Historical results are not necessarily indicative of the results of operations that should be expected in future periods.
|
|
Year Ended December 31,
|
|||||||||||||||||||
|
|
2015
|
2016
|
2017
|
2018
|
2019
|
|||||||||||||||
|
|
(In thousands, except per share and registration data)
|
|||||||||||||||||||
|
Statement of Operations Data:
|
|
|
|
|
|
|||||||||||||||
|
Revenue
(1)
|
$
|
327,910
|
|
$
|
313,139
|
|
$
|
299,248
|
|
$
|
297,687
|
|
$
|
286,270
|
|
|||||
|
Costs and expenses:
|
|
|
|
|
|
|
|
|
||||||||||||
|
Instructional costs and services
|
118,848
|
|
117,013
|
|
116,161
|
|
115,280
|
|
111,916
|
|
||||||||||
|
Selling and promotional
|
62,397
|
|
59,095
|
|
58,335
|
|
57,042
|
|
60,028
|
|
||||||||||
|
General and administrative
|
73,047
|
|
68,666
|
|
69,024
|
|
74,456
|
|
78,082
|
|
||||||||||
|
Loss on disposals of long-lived assets
|
817
|
|
5,970
|
|
2,093
|
|
882
|
|
556
|
|
||||||||||
|
Impairment of goodwill
|
—
|
|
4,735
|
|
—
|
|
—
|
|
7,336
|
|
||||||||||
|
Depreciation and amortization
|
20,520
|
|
19,384
|
|
18,776
|
|
17,501
|
|
15,596
|
|
||||||||||
|
Total costs and expenses
|
275,629
|
|
274,863
|
|
264,389
|
|
265,161
|
|
273,514
|
|
||||||||||
|
Income from operations before interest income and income taxes
|
52,281
|
|
38,276
|
|
34,859
|
|
32,526
|
|
12,756
|
|
||||||||||
|
Interest income, net
|
115
|
|
116
|
|
185
|
|
2,915
|
|
3,908
|
|
||||||||||
|
Income from operations before income taxes
|
52,396
|
|
38,392
|
|
35,044
|
|
35,441
|
|
16,664
|
|
||||||||||
|
Income tax expense
|
20,072
|
|
14,940
|
|
11,493
|
|
9,287
|
|
5,187
|
|
||||||||||
|
Equity investment income (loss)
|
90
|
|
703
|
|
(2,430
|
)
|
(515
|
)
|
(1,464
|
)
|
||||||||||
|
Net income
|
$
|
32,414
|
|
$
|
24,155
|
|
$
|
21,121
|
|
$
|
25,639
|
|
$
|
10,013
|
|
|||||
|
Net income per common share:
|
|
|
||||||||||||||||||
|
Basic
|
$
|
1.94
|
|
$
|
1.50
|
|
$
|
1.30
|
|
$
|
1.56
|
|
$
|
0.62
|
|
|||||
|
Diluted
|
$
|
1.93
|
|
$
|
1.49
|
|
$
|
1.29
|
|
$
|
1.54
|
|
$
|
0.62
|
|
|||||
|
Weighted average number of common shares outstanding:
|
|
|
|
|
|
|
||||||||||||||
|
Basic
|
16,676
|
|
16,068
|
|
16,236
|
|
16,404
|
|
16,094
|
|
||||||||||
|
Diluted
|
16,798
|
|
16,214
|
|
16,380
|
|
16,634
|
|
16,255
|
|
||||||||||
|
Other Data:
|
|
|
|
|
|
|
|
|
|
|
||||||||||
|
Net cash provided by operating activities
|
$
|
57,012
|
|
$
|
56,014
|
|
$
|
47,938
|
|
$
|
44,179
|
|
$
|
38,370
|
|
|||||
|
Capital expenditures
|
$
|
27,267
|
|
$
|
16,399
|
|
$
|
14,788
|
|
$
|
9,430
|
|
$
|
7,255
|
|
|||||
|
Stock-based compensation
|
$
|
5,912
|
|
$
|
5,211
|
|
$
|
6,246
|
|
$
|
7,180
|
|
$
|
5,960
|
|
|||||
|
APUS net course registrations
(2)
|
375,100
|
|
345,400
|
|
325,000
|
|
320,300
|
|
316,700
|
|
||||||||||
|
HCN student enrollment
(3)
|
1,968
|
|
1,709
|
|
2,107
|
|
2,107
|
|
1,595
|
|
||||||||||
76
|
|
As of December 31,
|
|||||||||||||||||||
|
|
2015
|
2016
|
2017
|
2018
|
2019
|
|||||||||||||||
|
|
(In thousands)
|
|||||||||||||||||||
|
Consolidated Balance Sheet Data:
|
|
|
|
|
|
|||||||||||||||
|
Cash, cash equivalents, and restricted cash
|
$
|
105,734
|
|
$
|
146,351
|
|
$
|
179,205
|
|
$
|
212,131
|
|
$
|
202,740
|
|
|||||
|
Working capital
(4)
|
$
|
73,598
|
|
$
|
116,452
|
|
$
|
147,782
|
|
$
|
188,242
|
|
$
|
177,631
|
|
|||||
|
Total assets
|
$
|
292,713
|
|
$
|
315,620
|
|
$
|
339,038
|
|
$
|
370,958
|
|
$
|
354,897
|
|
|||||
|
Stockholders’ equity
|
$
|
237,153
|
|
$
|
264,670
|
|
$
|
289,406
|
|
$
|
321,266
|
|
$
|
296,733
|
|
|||||
|
|
Year Ended December 31,
|
|||||||||||||||||||
|
|
2015
|
2016
|
2017
|
2018
|
2019
|
|||||||||||||||
|
|
(In thousands)
|
|||||||||||||||||||
|
Net income
|
$
|
32,414
|
|
$
|
24,155
|
|
$
|
21,121
|
|
$
|
25,639
|
|
$
|
10,013
|
|
|||||
|
Interest income, net
|
(115
|
)
|
(116
|
)
|
(185
|
)
|
(2,915
|
)
|
(3,908
|
)
|
||||||||||
|
Income tax expense
|
20,072
|
|
14,940
|
|
11,493
|
|
9,287
|
|
5,187
|
|
||||||||||
|
Equity investment (income)/loss
|
(90
|
)
|
(703
|
)
|
2,430
|
|
515
|
|
1,464
|
|
||||||||||
|
Depreciation and amortization
|
20,520
|
|
19,384
|
|
18,776
|
|
17,501
|
|
15,596
|
|
||||||||||
|
EBITDA from operations
(5)
|
$
|
72,801
|
|
$
|
57,660
|
|
$
|
53,635
|
|
$
|
50,027
|
|
$
|
28,352
|
|
|||||
|
(1)
|
Effective January 1, 2018, the Company adopted ASC 606,
Revenue from Contracts with Customers
. The Company elected to adopt the accounting change using a modified retrospective approach. The impact of adoption on the Company’s Consolidated Statement of Income for the years ended
December 31, 2018
and 2019 was not material. For additional details refer to “Note 3. Revenue” below in our Consolidated Financial Statements.
|
|
(2)
|
APUS net course registrations
represent the aggregate number of courses for which students remain enrolled after the date by which they may drop a course without financial penalty.
|
|
(3)
|
HCN student enrollment represents the total number of students enrolled in a course after the date by which students may drop a course without financial penalty for the ending quarter in the annual period.
|
|
(4)
|
Working capital is calculated by subtracting total current liabilities from total current assets.
|
|
(5)
|
Earnings before interest, taxes, and depreciation and amortization, or EBITDA, consists of net income, less interest (income) net, plus income tax expense, less equity investment (income)/loss, plus depreciation expense. The company uses EBITDA as a supplementary measurement of operating performance. EBITDA is not a recognized measurement under U.S. generally accepted accounting principles and may not be comparable to other companies. EBITDA has additional limitations as it is not intended to measure free cash flow or certain cash payments including taxes.
|
We believe EBITDA may be useful to investors evaluating our operating performance because it is widely used to measure a company’s operating performance without regard to certain non-cash expenses, including depreciation expense and expenses that are not reflective of our core operating results over time. We believe EBITDA, when combined with other measures of financial performance, may present a view of corporate performance exclusive of a company’s capital structure and provides management useful information to measure our performance.
ITEM 7.
MANAGEMENT’S DISCUSSION AND ANALYSIS OF FINANCIAL CONDITION AND RESULTS OF OPERATIONS
You should read the following discussion together with the consolidated financial statements and the related notes included elsewhere in this Annual Report. This discussion contains forward-looking statements that are based on management’s current expectations, estimates, and projections about our business and operations, and involves risks and uncertainties. Our actual results may differ materially from those currently anticipated and expressed in such forward-looking statements as a result of a number of factors, including those we discuss under “Risk Factors,” “Special Note Regarding Forward-Looking Statements,” and elsewhere in this Annual Report.
77
OVERVIEW
American Public Education, Inc., or APEI, is a provider of online and on-campus postsecondary education to approximately
82,600
students. We provide online postsecondary education primarily directed at the needs of the military, military-affiliated, public service and service-minded communities through the American Public University System, or APUS, that includes two brands: American Military University, or AMU, and American Public University, or APU. APUS is institutionally accredited by the Higher Learning Commission, or HLC, a regional accrediting agency recognized by ED. We provide on-campus nursing to students in Ohio, and, beginning in the second quarter of 2020, Indiana, through National Education Seminars, Inc., which we refer to as Hondros College of Nursing, or HCN. HCN is institutionally accredited by the Accrediting Bureau of Health Education Schools, or ABHES. Additional information regarding our subsidiary institutions and their regulation is included in the “Business - Company Overview” and “Business - Regulatory Environment” sections of this Annual Report.
Our revenue is largely driven by the number of students enrolled at our institutions, the number of and types of courses that they take, student payor source, and the mix of programs that students are attending. Our consolidated revenue in
2019
was
$286.3 million
, representing an
$11.4 million
, or
3.8%
, decrease from
$297.7 million
in
2018
. Our consolidated revenue in
2018
was
$297.7
million, representing a
$1.5 million
, or
0.5%
, decrease from
$299.2
million in
2017
. The
2019
revenue decrease was primarily due to a decrease in net course registrations at APUS and a decline in student enrollment at HCN during that period. The
2018
revenue decrease was due to a decrease in net course registrations at APUS partially offset by an increase in student enrollment at HCN.
Our operations are organized into two reporting segments:
|
•
|
American Public Education Segment, or APEI Segment.
This segment reflects the operational activities of APUS, other corporate activities, and minority investments.
|
|
•
|
Hondros College of Nursing Segment, or HCN Segment.
This segment reflects the operational activities of HCN.
|
Financial information regarding each of our reportable segments is reported in this Annual Report in the sections “Financial Statements and Supplementary Data,” “Management’s Discussion and Analysis of Financial Condition and Results of Operations - Operating Results by Reportable Segment Year Ended
December 31, 2019
Compared to Year Ended
December 31, 2018
,” and “Management’s Discussion and Analysis of Financial Condition and Results of Operations - Year Ended
December 31, 2018
Compared to Year Ended
December 31, 2017
.”
Student Body.
As of
December 31, 2019
, approximately
57%
of APUS’s students self-reported that they served in the military on active duty at the time of initial enrollment, and as a result APUS is particularly reliant on the Department of Defense, or DoD’s, tuition assistance programs and DoD’s budget. At APUS, active duty military students generally take fewer courses per year on average than non-military students. A significant portion of APUS’s enrollments are also attributable to students using funds from ED’s Title IV financial aid programs, or Title IV programs, and Veteran’s Affairs education benefits. HCN students generally attend classes at physical campuses and use Title IV program funds.
In recent years at APUS, and at HCN during 2019, we experienced declines in student enrollments. At the same time, we experienced increases in our operating costs as we provide new, and more costly, services to our students. We attribute these enrollment declines and operating cost increases, in part, to increased competition, changes in our marketing approach, investments in technology modernization, changes in our admissions processes at APUS, and changes in admissions and academic achievement requirements at HCN, among other factors. We believe that in order to continue to attract and retain qualified students our institutions need to continuously update and expand the content of their existing programs and develop new programs, specializations and modes of teaching, faculty engagement initiatives, and co-curricular initiatives that may require obtaining appropriate federal, state, and accrediting approvals, incur marketing expenses, make investments in management and capital expenditures, and reallocate other resources. Initiatives to attract and retain qualified students and control the growth of expenditures require significant time, energy, and resources, and if our efforts are not successful, our results of operations, cash flows, and financial condition may be adversely impacted. For more information about the risks related to these challenges please see “Risk Factors - Risks Related to Attracting and Retaining Students.”
Increased Costs and Expenses; Our Initiatives.
Our costs and expenses have increased over time due in part to increased marketing expenditures, the addition of the HCN Toledo campus in January 2017, the addition of a new HCN campus located in Indianapolis, Indiana expected to open in the second quarter of 2020, as well as the changing needs of our students including costs for technology required to support students at APUS. In addition, we incurred expenses in
2019
to evaluate and invest in replacements and upgrades to our information technology systems, including one-time expenses to upgrade our learning management system, and to inform the scope and duration of our larger overall information technology transformation
78
program in our APEI Segment. Lastly, we recorded pretax, non-cash impairment charges related to a goodwill impairment in our HCN Segment and employee compensation costs for post-employment benefits that will be payable to the APUS President upon retirement. For more information about HCN’s goodwill impairment please see “Note 6 Goodwill and Intangible Assets” in our Consolidated Financial Statements.
Our revenue may continue to decline and our costs and expenses may increase as our institutions adjust to changes in their student composition, undertake initiatives to improve the learning experience, and attract students who are more likely to persist in their programs. Additional initiatives that we implement that may increase costs and expenses or adversely affect our revenues may include the following:
|
•
|
further changes to admissions standards and requirements;
|
|
•
|
updates to the admissions process and procedures;
|
|
•
|
implementing more stringent satisfactory academic progress standards;
|
|
•
|
changing tuition costs and payment options;
|
|
•
|
changing fund disbursement methods;
|
|
•
|
implementing alternative learning delivery methods;
|
|
•
|
altering our institutions’ marketing programs to target the appropriate prospective students; and
|
|
•
|
investments in technology related to our overall information technology transformation program.
|
Our Board of Directors approved an increase in marketing expenditures for 2020 primarily in support of a planned new advertising campaign focusing on affordability and return on investment for learners. As a result of these increased expenses, we expect selling and promotional expenses as a percentage of revenue to increase in 2020 as compared to 2019.
Information technology systems are an essential part of the APUS student experience and our business operations. As part of our implementation of the shared services model discussed in “Reporting Segments” above, we began providing information technology services to APUS and HCN through APEI. Previously, APUS had managed its own information technology infrastructure and services and provided information technology services to HCN through an intercompany arrangement. We believe we will need to continue, and potentially increase, our investment of capital, time and resources, in technology operations and enhancements to support our systems and mission, and evaluate when it is appropriate to make significant changes, modifications or upgrades. We believe we will need to continue to make investments in information technology in response to competitive pressures in the marketplace, including increased demands for interactive solutions and access from multiple platforms, and to update older systems and to enhance functionality. We also expect operating and capital expenditures to increase in future periods as we accelerate the investment in
and refreshment of our information technology systems.
Changes and upgrades to our information technology systems may result in us incurring significant costs, including in the short term, and carry risk to our operations and financial results. We anticipate spending between $6.0 million and $8.0 million in 2020, focusing on specific information technology projects, including replacements of our Learning Management and Customer Relationship Management systems. These types of changes are not without risk to our operations and financial results. Our investments in information technology systems will result in an increased level of spending. For example, in
2019
we incurred approximately $2.1 million to evaluate and invest in replacements and upgrades to our information technology systems, including one-time expenses to upgrade our learning management system and to inform the scope and duration of our larger overall information technology transformation program. Not all of our information technology spending can be capitalized, and our investments may cost more than expected or fail to be successful.
Furthermore, as a result of unsuccessful development efforts, or a result of replacing outdated technology, software or other technology related assets, we may have assets that become impaired. For example, for the year ended December 31, 2016, APUS disposed of approximately $5.1 million in long-lived assets, primarily consisting of a loss that resulted from the abandonment of development of a new student course registration system because it was no longer probable that development would be completed and the software placed in service.
Implementation of Shared Services Model.
Beginning in 2016, we began to invest capital and human resources in the transition and planned implementation of the shared services model pursuant to which APEI provides services to APUS and HCN that were previously handled directly within APUS and HCN, as well as in changes to our systems and training of employees, among other things. In November 2018, HLC approved APUS’s application for a change in structure related to APUS’s proposal to enter into a shared services model with APEI and we entered into an intercompany agreement to implement the shared services model. As required by HLC policy, HLC conducted a focused site visit in May 2019. The site visit team found that evidence of compliance with APUS’s commitments made in its application and with HLC’s Eligibility Requirements and Criteria for Accreditation was sufficiently demonstrated and no further follow up was recommended. In
79
August 2019, HLC notified APUS that the Institutional Actions Council of the HLC, which conducts reviews and takes action on accreditation recommendations, concurred with the site visit team’s findings. As with any operational change, the implementation of the shared services model could lead to strategic and operational challenges, distractions of management from other key initiatives, inefficiencies or increased costs, any of which could adversely affect our business, financial condition, results of operations, and cash flows.
HCN Accreditation.
HCN is institutionally accredited by ABHES, a national accrediting agency recognized by ED. For the reporting year ended June 30, 2018, several HCN programs did not satisfy ABHES’s threshold requirements for retention rates or placement rates and, for the reporting year ended June 30, 2019, each of HCN’s programs at each of HCN’s campuses satisfied ABHES’s placement rate requirements but failed to satisfy ABHES’s threshold requirements for retention rates. As described more fully in “Regulatory Environment - Accreditation,” ABHES has notified HCN that it has taken actions with respect to certain HCN programs at certain campuses related to those programs’ performance in relation to ABHES student achievement indicators and has directed HCN in a number of those cases to demonstrate by a certain date that those programs meet the applicable threshold requirements. There can be no assurance that HCN will be able to demonstrate compliance by the relevant deadlines in all cases.
If HCN is unable to bring the programs into compliance during the timeframe established by ABHES, unless such timeframe is extended for good cause, ABHES may take other action, up to and including withdrawing accreditation for those programs. In addition, adverse actions taken by ABHES may trigger reporting requirements and ED action under ED’s Borrower Defense Regulations, see “Regulatory Environment - Student Financing Sources and Related Regulations/Requirements - Department of Education - Regulation of Title IV Financial Aid Programs - Borrower Defenses.”
ABHES also informed HCN in February 2020 that based on review of the visit report from its recently completed unannounced visit to the Columbus campus, the response to the report, and ABHES program approval information, it had acted to affirm the institution’s accreditation, which continues through February 28, 2021. The next comprehensive evaluation for renewal of ABHES accreditation, which will include HCN’s submission of evidence related to its compliance with ABHES standards and a series of site visits, is scheduled for April 2020. Renewal of accreditation is not guaranteed, and any failure to be renewed would have a material adverse impact on HCN’s ability to enroll students.
Staffing Realignment and Management Transition
. APUS implemented new general education requirements during the first quarter of 2018. These new requirements changed the courses that are required of all students. APUS incurred approximately $400,000 in costs related to the implementation of the new general education requirements in the first quarter of 2018 related to faculty realignment. We cannot predict what additional effects, if any, these new requirements will have on the total number of registrations, student persistence, or our financial condition or results of operations.
We regularly evaluate and review our costs and expenses. As part of that effort, in the first quarter of 2018, APUS initiated a voluntary reduction in force program for employees with more than eight years of service. The program resulted in a reduction of 48 employees, representing approximately 5% of APUS’s non-faculty workforce at that time. Our APEI Segment recorded expenses for termination benefits related to the workforce reduction in the first quarter of 2018 in accordance with the Financial Accounting Standards Board, or FASB, Accounting Standards Codification, or ASC, 420,
Exit or Disposal Cost Obligations
. We incurred an aggregate of approximately $1.7 million of pretax expenses associated with employee severance benefits. The reduction in force resulted in pretax labor and benefits costs savings of approximately $2.1 million in 2018 and approximately $2.7 million in 2019. These cost savings do not include expenses associated with employee severance benefits. There is no certainty that the voluntary program, or any other expense reduction initiative, will have the intended benefits of reducing costs and expenses over the long-term, or whether there will be adverse impacts because of the loss of valuable employees.
In August 2019, after an extensive search, Angela Selden was appointed Chief Executive Officer of APEI, effective September 23, 2019. APEI’s former Chief Executive Officer, Dr. Wallace E. Boston, will continue to serve as President of APUS until his expected retirement in June 2020. In
2019
we recorded approximately $2.8 million in employee compensation costs for post-employment benefits that will be payable to Dr. Boston upon retirement. To the extent we have further leadership or operational changes, we could incur similar or greater costs.
Admissions Process and Academic Achievement Requirements.
In April 2017, APUS continued to strengthen its verification process by implementing new procedures for prospective non-military students, an effort that originated in April 2015 with the implementation of a requirement for prospective students to complete a free, noncredit admissions assessment. APUS has made multiple changes to the assessment process since its original implementation and may further modify it in the future in order to better identify college-ready students. For example, in July 2017, APUS implemented a process requiring enhanced certification of prospective non-military students’ prior transcripts. These initiatives require significant time, energy and resources, and if our efforts are not successful, they may adversely impact our results of operations, cash flows, and
80
financial condition. Even if these initiatives successfully lead to the identification and enrollment of students who are likely to succeed and improve the student experience, they could result in adverse impacts on APUS enrollments.
Beginning with the term that started in January 2019, HCN implemented enhanced ADN Program admissions requirements, requiring external ADN applicants to have an active unencumbered PN license and to have graduated from an approved PN program. All ADN applicants must take math and reading entrance exams. Applicants that do not meet the minimum placement scores may be required to take additional reading and math prerequisites or denied admission. ADN Program applicants who apply to start in the quarter immediately following their graduation from HCN’s PN Program may be admitted prior to possessing an active unencumbered PN license, but must obtain an active unencumbered PN license prior to the start of their second term. Beginning with the April 2019 term, HCN further changed its admissions standards to remove certain entrance exam requirements.
HCN has made multiple changes to the assessment process since its original implementation and may further modify it in the future in order to better identify college-ready students. These initiatives require significant time, energy, and resources, and if our efforts are not successful, they may adversely impact our results of operations, cash flows, and financial condition. While we believe changes in admissions and academic achievement requirements are beneficial for our students and will result in a better and more positive educational experience and improved testing pass rates in the long term, we believe some of the changes have contributed to a decline in enrollment and have had a negative impact on our results of operations. While we work on identifying an appropriate balance of admissions requirements, academic achievement requirements and attracting appropriate students, there may continue to be a negative impact on enrollments at HCN. Even if these initiatives lead to the identification and enrollment of students who are likely to succeed and improve the student experience, they could result in adverse impacts on HCN enrollments.
HCN Enrollments.
Enrollments in HCN’s ADN Program for all 2019 terms were significantly lower than HCN planned, which we believe is likely partly associated with the implementation of the new admissions requirements discussed above, among other potential factors. For example, our enrollments appear to have been impacted by negative perceptions by certain current and prospective student cohorts, which is the type of factor that can occur more easily at a land-based institution than an online institution. While we continue to work on implementing and enhancing our academic and achievement and admission requirements, identifying and remediating the factors impacting our enrollments at HCN, and implementing new initiatives such as extending the hours of HCN’s customer service team, there can be no assurance we will be successful in these efforts over the long term and we cannot guarantee that we will be able to reverse the revenue decline in our HCN Segment or return to prior level of enrollments.
Tuition and Fees.
Affordable tuition has been a priority of APUS since its founding, when APUS set tuition to align with tuition assistance programs available to members of the military. Following a July 2015 tuition increase, to support APUS’s active duty military and certain military-affiliated students, APUS implemented a tuition grant that kept the cost of tuition for these students at its previous level. As a result, undergraduate course tuition continued to be $250 per credit hour, and graduate course tuition continued to be $325 per credit hour for U.S. Military active duty service members, National Guard members, reservists, military spouses and dependents, and veterans.
In October 2019, APUS announced the following changes for undergraduate and master’s course registrations made on or after January 1, 2020:
•
The tuition for undergraduate level courses would increase by $15 per credit hour to $285 per credit hour.
•
The tuition for master’s level courses would increase by $20 per credit hour to $370 per credit hour.
•
The technology fee would increase from $50 to $65 per course.
This January 2020 tuition increase is APUS’s first increase since the July 2015 tuition increase described above.
In support of APUS's active duty military students using TA, APUS has increased the tuition grant for those undergraduate students and their spouses and dependents from $20 to $35 per credit hour to keep the cost at $250 per credit hour, and increased the tuition grant for those master’s students and their spouses and dependents from $25 to $120 per credit hour to reduce the cost from $325 per credit hour to $250 per credit hour for graduate active duty military students. As a result, undergraduate and master’s students who are eligible for TA benefits and their spouses and dependents will pay a net tuition of $250 per credit hour. APUS also extended its book grant, previously available only to undergraduate students, to active-duty military students and their spouses and dependents at the master’s level. The net effect of these price and grant adjustments is that for active duty military students using TA, an undergraduate or graduate degree at APUS may be attained for no out-of-pocket cost.
81
APUS also announced that the existing tuition grant for veterans will expire at the end of 2019. However, veterans who qualify for 100% of their Post-9/11 GI Bill benefits are expected to continue to have no out-of-pocket expenses. Those veterans who do not qualify for 100% may experience a small increase in out-of-pocket costs, but because APUS is a “Yellow Ribbon” university, many are expected to have access to additional funding resources.
APUS estimates that the tuition grant applied to approximately 77%, and 78% of its total net course registrations in
2018
and
2019
, respectively, and will apply to approximately 60% of its total net course registrations made on or after January 1, 2020.
Today, tuition at APUS remains among the lowest in the sector. APUS’s low tuition rates mean that its students are not required to take on as much debt as they might at another institution. The combined tuition and fees at APUS are generally less expensive for undergraduate and graduate students than the average in-state cost at a public university. APUS’s low tuition and fees, in combination with APUS’s undergraduate book grant that is provided to all undergraduate students, and beginning January 2020, to active duty graduate students and their spouses and dependents, results in significant savings for students. APUS has provided approximately $140 million in book grant savings to undergraduate students since 2001, and will provide approximately $0.4 million to $0.6 million in book grant savings to graduate students in 2020.
APUS has two applied doctoral programs, Strategic Intelligence and Global Security, that began instruction in January 2018. The programs meet a need for higher-level education and research combined with professional practice in these fields. The doctoral degrees tuition and residency costs are currently $5,600 per term and include a book grant for course materials. In connection with our doctoral programs, we incurred approximately $0.7 million and $0.3 million in capital expenditures in
2018
and
2019
, respectively.
HCN’s tuition and fees are also designed to be affordable and competitive with those of similar institutions offering the same level of flexibility, accessibility, and student experience. Tuition and certain fees at HCN were increased approximately 3% effective with the January 2019 term.
Beginning January 1, 2020, HCN began offering an institutional grant to students demonstrating financial need to cover the difference between the total cost of tuition and fees and the amount of all eligible financial aid resources. The grant is designed to limit a student’s monthly payment to $200 through an award of up to $200 per month, or $600 per term after consideration of financial aid, employer tuition reimbursement, and other financial resources. HCN expects to award approximately $250,000 of institutional grants during 2020.
In November 2019, HCN entered into a memorandum of understanding, or MOU, to participate in the DoD tuition assistance program and is therefore subject to such program’s requirements and restrictions. The MOU and these requirements and restrictions are more fully discussed in the “Regulatory Environment - Student Financing Sources and Related Regulations / Requirements” and “Risk Factors” sections of this Annual Report.
We cannot predict whether APUS’s and HCN’s tuition and fee increase or APUS’s new programs will be successful, or how they will impact our results of operations, cash flows, or financial condition.
Bad Debt Expense.
We experienced an increase in bad debt expense in our HCN segment in
2019
and have experienced increases in other recent interim periods in both our HCN and APUS segments. We believe the increase in bad debt expense in our HCN segment was primarily due to HCN’s implementation of extended payment plan options in
2018
.
We also experienced increases in our bad debt expense over several years prior to
2015
, particularly at APUS. We believe those increases were primarily driven by an increase in the number of students using Title IV program funds, operational policies, processing challenges, and challenges collecting funds primarily related to students who did not complete courses. In September 2015, APUS changed the method by which it disburses Title IV program funds in an effort to lower bad debt expense and to reduce the attractiveness of our programs to students who are seeking to abuse the Title IV programs. While we have experienced decreases in bad debt expense at APUS during each of the last several years, there is no assurance that these changes caused the reductions.
Impact of Government Budgetary Pressures.
Congressional inaction on budgetary matters has led to lapses in funding, resulting government shutdowns, and subsequent policy changes that have affected tuition assistance programs at DoD. For example, funding for the federal government, including the DoD, lapsed on each of January 20, 2018 and February 9, 2018, resulting in partial shutdowns that lasted for a few days and several hours, respectively. Funding for some portions of the federal government, not including the DoD, lapsed on December 22, 2018, resulting in a partial government shutdown that lasted for 35 days. The Coast Guard suspended its tuition assistance program during this partial government shutdown and the
82
Marine Corps began to require Marines to have 24 months on active duty prior to being eligible to apply for tuition assistance. A future government shutdown, particularly one that includes DoD or suspension or resulting modification of DoD tuition assistance programs, could have a material adverse effect on our operations and financial condition.
In May 2019, the Navy announced that as a result of increased demand stemming from improvements in service delivery and higher limits on annual benefits available per sailor, TA benefits available to sailors for the fiscal year ending September 30, 2019 were expected to be exhausted by the end of May 2019, and effective May 28, 2019 the Navy ceased approving TA program funds for eligible sailors until the start of the new government fiscal year on October 1, 2019. In addition, effective October 1, 2019, Navy service members must have a minimum of two years of service before becoming eligible to use TA or the Navy College Program for Afloat College Education, funding will be capped at twelve semester hours per fiscal year, and career funding will be capped at 120 semester hours. Navy-related registrations were 10.3%, and 7.2% of total registrations for the three months ended September 30, 2018 and 2019, respectively. The temporary exhaustion of Navy tuition assistance program funds had a significant negative impact on our results of operations for the third quarter of 2019, and negatively impacted October 2019 revenue by approximately $0.4 million. We are unable to predict whether and to what extent the Navy will continue to impose limitations on TA program approvals as a result of limited funding. Furthermore, in March 2020, the Navy announced a new “Education Strategy for Seapower 2020” that is intended to be a new comprehensive education strategy. While the details and impact of this particular strategy are still uncertain, we expect each military branch and the DoD to continually evaluate their approaches to education, and any resulting changes could have an impact on the funds available to service members to pursue their education at our institutions. Changes in funding allocations could have a material adverse effect on APUS’s enrollments.
ED
Program Review and 2016 APUS Compliance Audit.
APUS’s Title IV compliance audit for the year ended December 31, 2016 identified a finding related to return of Title IV funds calculations that were not properly computed. In a Final Audit Determination letter in January 2018, ED conveyed its finding that funds had not been returned timely. ED also noted that a similar finding had been made in an open program review with respect to which APUS has not yet received a program review report. In connection with the finding, ED required that APUS post an irrevocable letter of credit for approximately $700,000. APUS posted the letter of credit March 2018 and it expired December 31, 2019.
Walmart Partnership.
On May 30, 2018, Walmart announced that in connection with entering into a new arrangement for education benefits to its affiliates it would not be renewing its partnership agreement with APUS to offer academic courses and degree programs to Walmart associates effective June 2019 and that it would begin transitioning to its new arrangement. In
2018
and
2019
approximately 1.1%, and 0.8%, respectively, of our consolidated revenue was associated with students that enrolled with APUS in connection with its partnership with Walmar
t.
Regulated Industry.
Our institutions operate in a highly regulated industry. For more information on the regulations to which our institutions are subject, please refer to the “Business - Company Overview” and “Business - Regulatory Environment” section of this Annual Report. Such regulations may impact our financial results in a way that we cannot predict, and may have an adverse impact on our financial condition.
Our Key Financial Results Metrics
Revenue
When reviewing our revenue we evaluate the following components: net course registrations and enrollment, tuition rate, net tuition and other fees.
Net course registrations and enrollment.
For financial reporting and analysis purposes, APUS measures its student population in terms of aggregate course enrollments, or net course registrations. Course enrollments, or net course registrations, which include one-credit lab courses combined with their related three-credit courses, represent the aggregate number of courses in which students remain enrolled after the date by which they may drop the course without financial penalty. HCN measures its student population in terms of student enrollments. Student enrollment represents the number of students enrolled in one or more courses after the date by which they may drop the course without financial penalty.
Because we recognize revenue over the length of a course, net course registrations and student enrollments in a financial reporting period do not correlate directly with revenue for that period because revenue recognized from courses is not necessarily recognized in the financial reporting period in which the course registrations or enrollments occur. For example, revenue in a quarter reflects a portion of the revenue from courses that began in a prior quarter and continued into the quarter, all revenue from courses that began and ended in the quarter, and a portion of the revenue from courses that began but did not end in the quarter.
83
The average number of courses per term at APUS varies by payor type. For example, ED’s Title IV programs require participating students to take more courses per term than students participating in DoD tuition assistance programs. As a result, should the number of APUS’s students who utilize ED’s Title IV programs decrease (or the number of students using DoD tuition assistance programs increase), we anticipate that it may cause the average number of courses per student per term to decrease.
You should not rely on the results of any prior periods as an indication of future net course registrations at APUS, student enrollments at HCN, or consolidated revenue. The composition of our students, changing market demands and competition, make forecasting very difficult, and we are unable to determine if we will return to growth or what level of growth we will achieve, if any. Similarly, you should not rely on our operating margins in any prior periods as an indication of our future operating margins.
Tuition rate.
Providing affordable certificate and degree programs is an important element of our competitive strategy. We estimate that APUS’s tuition is lower than the average in-state rates at public universities. In October 2019, APUS announced increases in tuition and technology fee for undergraduate and master’s course registrations made on or after January 1, 2020, as discussed in “Overview” above. The January 2020 tuition increase is APUS’s first increase since July 2015 and is intended to help support increased investments in academic learning and student operations. Prior to the 2015 increase, APUS had not raised undergraduate tuition for 15 years or graduate tuition in four years. HCN’s tuition and fees are also designed to be affordable and competitive when compared to the costs of similar institutions offering the same level of flexibility, accessibility, and student experience.
Net tuition.
Tuition revenue varies from period to period based on the aggregate number of students attending courses and the number of courses they are attending during the period, the student payor source, the mix of programs that students are attending during the period, as well as the number of students starting courses each month during the period and the timing of the start of a course each month or term. Tuition revenue is adjusted to reflect amounts for students who withdraw from a course in the month or term the withdrawal occurs. We also provide tuition grants and scholarships to certain students to assist them financially with their educational goals. The cost of these grants and scholarships is reported as a reduction of tuition revenue in the period incurred for purposes of establishing net tuition revenue.
Other fees.
In addition to tuition, APUS charges a per course technology fee. Prior to January 2020, the technology fee per course was $50, and for registrations made on or after January 2020 the technology fee per course was increased to $65. APUS may further alter this fee in the future. APUS students are also charged certain additional fees, such as graduation, late registration, transcript request, and comprehensive examination fees, when applicable. APUS provides a grant to cover the technology fee for students using DoD tuition assistance programs and other programs, as applicable. In
2018
, and
2019
, technology fee revenue net of technology fee grants was approximately $
7.2
million, or
2.4%
of revenue, and $
7.0
million, or
2.4%
of consolidated revenue, respectively. Until early 2019, APUS received purchase commissions for graduate student book purchases and ancillary supply purchases that students make directly from our preferred book vendor. HCN students are charged fees for various items such as application, testing, books and supplies, lab, technology and graduation.
Costs and Expenses
We categorize our costs and expenses in the following categories: instructional costs and services expenses; selling and promotional expenses; general and administrative expenses; loss on disposals of long-lived assets; impairment of goodwill; and depreciation and amortization.
Instructional costs and services expenses.
Instructional costs and services expenses are directly attributable to the educational services our institutions provide to their students. Instructional costs and services expenses include salaries and benefits for full-time faculty, administrators, and academic advisors, and costs associated with part-time faculty. Instructional costs and services expenses also include costs associated with curriculum development, academic records and graduation, as well as other services provided by our institutions, such as evaluating transcripts. Instructional costs and services expenses are generally affected by the cost of academic resources, the efficiency of delivering academic products and services to our students, salaries and benefits for our faculty and other academic and administration personnel, and the level of expenditures for initiatives for new and existing academic programs.
At APUS, instructional costs and services expenses includes expenses related to course materials, learning resources, the library, the book grant program, and instructional pay for part-time faculty that is primarily dependent on the number of students taught. At HCN, instructional costs and services expenses also includes operating expenses directly associated with HCN’s campus operations, including rent.
Selling and promotional expenses.
Selling and promotional expenses includes salaries and benefits of personnel engaged in student enrollment, advertising costs, and marketing material production costs. Our selling and promotional
84
expenses are generally affected by the cost of advertising media, the efficiency of our selling efforts, salaries and benefits for our selling and admissions personnel, and the level of expenditures for advertising initiatives for new and existing academic programs. We believe the availability of Title IV program funds to students has increased our marketability in non-military markets, but the nature of these markets, including the impact of competition, and the rising cost of internet search and other advertising media has caused our student acquisition costs to increase. This trend may continue and our student acquisition costs may increase.
General and administrative expenses.
General and administrative expenses includes salaries and benefits of employees engaged in corporate management, finance, financial aid processing, information technology, human resources, facilities, compliance and other corporate functions, the cost of renting and maintaining APUS’s administrative facilities, technology expenses, and costs for professional services. General and administrative expenses also includes bad debt expense. General and administrative expenses are generally affected by the costs of salaries and benefits for our general and administrative personnel, the efficiency of delivering back-office support including technology services, and the level of expenditures for supporting company initiatives.
Loss on disposals of long-lived assets
. Loss on disposals of long-lived assets is the difference between the long-lived assets’ residual value and their book value at the time of the assets’ disposition or abandonment.
Impairment of goodwill
. Impairment of goodwill recognizes the difference between the carrying value of goodwill and the fair value of goodwill.
Depreciation and amortization.
We incur depreciation and amortization expenses for costs related to the capitalization of property, equipment, software, and program development on a straight-line basis over the estimated useful lives of the assets. In addition, we incur amortization expense for the amortization of identified intangible assets with a definite life resulting from our acquisition of HCN.
Interest Income, Net
Interest income, net consists primarily of interest income earned on cash and cash equivalents, net of any interest expense.
Equity Investment Income/Loss
Equity investment income/loss consists of our proportional share of after-tax income or losses attributable to our equity investment as well as the loss from any other-than-temporary impairment charges, which represents the difference between the carrying value of and fair value of the investment.
Critical Accounting Policies and Use of Estimates
The discussion of our financial condition and results of operations is based upon our Consolidated Financial Statements, which have been prepared in accordance with accounting principles generally accepted in the United States, or GAAP. During the preparation of these financial statements, we are required to make estimates and assumptions that affect the reported amounts of assets, liabilities, revenue, costs and expenses, and related disclosures. On an ongoing basis, we evaluate our estimates and assumptions, including those related to revenue recognition and goodwill and indefinite-lived intangible assets. We base our estimates on historical experience and on various other assumptions that we believe are reasonable under the circumstances. The results of our analysis form the basis for making assumptions about the carrying values of assets and liabilities that are not readily apparent from other sources. Actual results may differ from these estimates under different assumptions or conditions, and the impact of such differences may be material to our Consolidated Financial Statements.
The following discussion of accounting policies is intended to supplement the accounting policies presented in “Note 2. Significant Accounting Policies” included in our Consolidated Financial Statements.
Revenue Recognition.
Our revenue is primarily derived from the sale of instructional services and various fees. Instructional services revenue includes tuition, technology, and laboratory fees. We generally recognize revenue ratably as instructional services are provided over the period or term, which is, for APUS, either an eight- or sixteen-week period, and for HCN, a quarterly term. Revenue is recognized when evidence of a contract exists, delivery has occurred or as instructional services are delivered, the price is determinable, and collectability is reasonably assured. Revenue from fees is recognized as information or services are delivered to customers, assuming all other revenue recognition criteria are met. For additional information regarding our revenue recognition refer to “Note 3. Revenue” included in our Consolidated Financial Statements.
Goodwill and indefinite-lived intangible assets.
Goodwill represents the excess of the purchase price of an acquired business over the amount assigned to the assets acquired and liabilities assumed. Goodwill is not amortized. In connection with
85
the November 1, 2013 acquisition of HCN, we recorded
$38.6 million
of goodwill, representing the excess of the purchase price over the amount assigned to the new assets acquired and the fair value assigned to identified intangible assets. We also recorded
$3.7 million
of indefinite-lived intangible assets as part of the HCN acquisition.
We annually assess goodwill and indefinite-lived intangible assets for impairment on October 31
st
, or more frequently if events and circumstances indicate that goodwill might be impaired. If the carrying value exceeds fair value, the asset is considered impaired and is reduced to fair value. In assessing goodwill impairment, we may choose to initially evaluate qualitative factors to determine if it is more likely than not that the fair value is less than its carrying amount. If the qualitative assessment is not conclusive, then the impairment analysis for goodwill is performed using a quantitative approach.
The process of evaluating goodwill and indefinite-lived intangibles for impairment is subjective and requires significant judgment at many points during the analysis. When performing an optional qualitative analysis, we consider many factors including: general economic conditions, industry and market conditions, certain cost factors, financial performance and key business drivers, long-term operating plans, and potential changes to significant assumptions used in the most recent fair value analysis. We utilize the services of an independent third-party valuation firm to complete the quantitative analysis and estimate fair value. In completing their analysis, the valuation firm weights the results of four different valuation methods: (1) discounted cash flow; (2) guideline company; (3) guideline transaction for comparable transactions; and (4) guideline transaction for private equity transactions. Under the discounted cash flow method, cash flows are discounted by an estimated risk weighted average cost of capital, which is intended to reflect the overall level of inherent risk of HCN. Under the guideline company method, valuation metrics from other education companies are used to determine the value. Under the comparable transaction method, pricing terms from other transactions in the higher education market are used to determine the value. Under the private equity method, pricing terms from private equity transactions are used to determine the value. Values derived under the four valuation methods are then weighted to estimate HCN’s enterprise value. The analysis includes significant estimates and assumptions from management, including revenue growth rates, operating margins and future economic and market conditions, among others. Additionally, the valuation firm’s analysis includes significant assumptions with respect to discount rates and assumed royalty rates. If the fair value is less than the carrying value, the asset is reduced to fair value.
As of October 31, 2018 and
2019
, we completed our annual assessment of goodwill and concluded that HCN’s fair value was more than the carrying value; consequently, there was no impairment. Our October 31, 2019 annual assessment concluded that the fair value of HCN exceeded the carrying value by approximately 4%, or $1.5 million. During the year ended
December 31, 2019
, the Company completed interim goodwill impairment tests during the first and third quarters, as a result of circumstances that included HCN’s continued underperformance against revised 2019 internal targets and overall 2019 financial performance. The valuations determined that the fair value was less than the carrying value. As a result, we recorded pretax, non-cash impairment charges of
$7.3 million
. The
2018
and
2019
annual testing also concluded the indefinite-lived assets were not impaired. For additional details regarding goodwill and indefinite-lived intangible assets refer to “Note 6. Goodwill and Intangible Assets” included in our Consolidated Financial Statements.
For additional information on our critical accounting policies, including information regarding estimates and assumptions, refer to “Note 2. Significant Accounting Policies” included in our Consolidated Financial Statements.
Recent Accounting Pronouncements
We consider the applicability and impact of all Accounting Standards Updates, or ASUs. See “Note 2 Significant Accounting Policies” included in our Consolidated Financial Statements for information relating to our discussion of the effects of recent accounting pronouncements.
86
Results of Operations
The following table sets forth statements of income data as a percentage of revenue for each of the years ended:
|
|
2017
|
2018
|
2019
|
||||||
|
Revenue
|
100.0
|
%
|
100.0
|
%
|
100.0
|
%
|
|||
|
Costs and expenses:
|
|
|
|
|
|
|
|||
|
Instructional costs and services
|
38.8
|
%
|
38.7
|
%
|
39.1
|
%
|
|||
|
Selling and promotional
|
19.5
|
%
|
19.1
|
%
|
21.0
|
%
|
|||
|
General and administrative
|
23.1
|
%
|
25.0
|
%
|
27.3
|
%
|
|||
|
Loss on disposals of long-lived assets
|
0.7
|
%
|
0.3
|
%
|
0.2
|
%
|
|||
|
Impairment of goodwill
|
—
|
%
|
—
|
%
|
2.5
|
%
|
|||
|
Depreciation and amortization
|
6.3
|
%
|
5.9
|
%
|
5.4
|
%
|
|||
|
Total costs and expenses
|
88.4
|
%
|
89.0
|
%
|
95.5
|
%
|
|||
|
Income from operations before interest income and income taxes
|
11.6
|
%
|
11.0
|
%
|
4.5
|
%
|
|||
|
Interest income, net
|
—
|
%
|
1.0
|
%
|
1.4
|
%
|
|||
|
Income from operations before income taxes
|
11.6
|
%
|
12.0
|
%
|
5.9
|
%
|
|||
|
Income tax expense
|
3.8
|
%
|
3.1
|
%
|
1.8
|
%
|
|||
|
Equity investment loss
|
(0.8
|
)%
|
(0.2
|
)%
|
(0.5
|
)%
|
|||
|
Net income
|
7.0
|
%
|
8.7
|
%
|
3.6
|
%
|
|||
Year Ended
December 31, 2019
Compared to Year Ended
December 31, 2018
Revenue
Our consolidated revenue in
2019
was
$286.3
million, a decrease of
$11.4
million or
3.8%
, compared to
$297.7
million in
2018
.
The revenue decrease resulted from a decrease in net course registrations at APUS and a decrease in student enrollment at HCN. APUS net course registrations decreased approximately
1.1%
to approximately
316,700
in
2019
from approximately
320,300
in
2018
. The decrease in APUS’s net course registrations was due in part to the temporary exhaustion of Navy TA program funds, which resulted in registration declines during the second and third quarters of 2019, and ongoing declines in new student course registrations resulting in decreased student net course registrations. HCN average student enrollment decreased
23.1%
in
2019
compared to
2018
. The decrease in HCN’s enrollment in
2019
was primarily attributable to changes in academic standards and admissions policies instituted in 2018 and the first quarter of 2019, among other factors. In addition, HCN enrollments appear to have been impacted by negative perceptions by certain and prospective student cohorts.
Costs and Expenses
Costs and expenses were
$273.5
million in
2019
, an increase of
$8.3
million, or
3.1%
, compared to
$265.2
million in
2018
. In
2019
, costs and expenses include the following items on a pretax basis: a non-cash impairment of goodwill of
$7.3 million
in our HCN Segment; $3.5 million increase in advertising costs in our APEI and HCN Segments; $2.8 million in employee compensation costs in our APEI Segment for post-employment benefits that will be payable to the APUS President upon retirement; $2.1 million in information technology costs related to the evaluation and investment in replacements and upgrades to our information technology systems, including one-time expenses to upgrade our learning management system, and to inform the scope and duration of our larger overall information technology transformation program in our APEI Segment; and $1.4 million in in professional fees associated with the evaluation of a potential acquisition in our APEI Segment. In
2018
, costs and expenses include pretax expenses of approximately $1.7 million resulting from the voluntary reduction in force program in our APEI Segment.
Costs and expenses as a percentage of revenue increased to
95.5%
in
2019
from
89.0%
in
2018
. Our income before interest and income taxes, or our operating margin, decreased to
4.5%
from
11.0%
compared to the same period. Our costs and expenses as a percentage of revenue increased largely due to the changes in costs and expenses described above.
Instructional costs and services expenses.
Instructional costs and services expenses in
2019
were
$111.9
million, a decrease of approximately $
3.4
million, or
2.9%
, compared to
$115.3
million in
2018
. Instructional costs and services expenses as a percentage of revenue were
39.1%
in
2019
, compared to
38.7%
in
2018
. The decrease in instructional costs and services
87
expenses was primarily due to a decrease in employee compensation costs and instructional materials costs in both our APEI and HCN Segments, partially offset by an increase in payment processing fees in our APEI Segment. In
2018
, employee compensation costs include approximately $0.8 million of pretax expenses from the voluntary reduction in force program in our APEI Segment. The increase in instructional costs and services expenses as a percentage of revenue was primarily due to our consolidating revenue decreasing at a rate greater than the decrease in instructional costs and services expenses.
Selling and promotional expenses.
Selling and promotional expenses in
2019
were
$60.0
million, an increase of $
3.0
million, or
5.3%
, compared to
$57.0
million in
2018
. This increase was primarily the result of increased advertising costs in our APEI and HCN Segments, partially offset by a decrease in employee compensation costs in our APEI Segment. In
2018
, employee compensation costs include approximately $0.5 million of pretax expenses from the voluntary reduction in force program in our APEI Segment. Selling and promotional expenses as a percentage of revenue were
21.0%
in
2019
compared to
19.1%
in
2018
. The increase in selling and promotional expenses as a percentage of revenue was primarily due to an increase in selling and promotional expenses during a period when consolidated revenue decreased.
General and administrative expenses.
General and administrative expenses in
2019
were
$78.1
million, an increase of $
3.6
million, or
4.8%
, compared to
$74.5
million in
2018
. The increase in general and administrative expenses was primarily related to the following items on a pretax basis: $2.8 million in employee compensation costs for post-employment benefits that will be payable to the APUS President upon retirement in our APEI Segment; $1.4 million of professional fees related to the evaluation of an acquisition in our APEI Segment; and $2.1 million in information technology costs related to the evaluation of replacements or upgrades to our information technology systems, including one-time expenses to upgrade our learning management system in our APEI Segment. In
2018
, employee compensation costs include approximately $0.4 million of pretax expenses from the voluntary reduction in force program in our APEI Segment. General and administrative expenses as a percentage of revenue were
27.3%
in
2019
compared to
25.0%
in
2018
. The increase in general and administrative expenses as a percentage of revenue was primarily due to the increase in general and administrative expenses during a period when consolidated revenue decreased.
Bad debt expense decreased to
$3.9
million, or approximately
1.4%
of revenue, in
2019
, from
$4.6
million, or approximately
1.5%
of revenue, in
2018
. We believe the decrease in bad debt expense in our APEI Segment was primarily due to changes in student mix, changes in admissions and verification processes, and other changes partially offset by an increase in bad debt expense in our HCN Segment primarily driven by the implementation of the HCN extended payment program in 2018.
Loss on disposal of long-lived assets
. The loss on disposal of long-lived assets was
$0.6
million in
2019
, compared to
$0.9
million in
2018
.
Impairment of goodwill.
The Company completed interim goodwill impairment tests during the first and third quarters of
2019
as a result of circumstances that included HCN’s continued underperformance against revised 2019 internal targets and overall 2019 financial performance. The implied fair value of goodwill was calculated and compared to the recorded goodwill, and the Company determined the fair value of goodwill was $26.6 million, or
$7.3 million
less than its carrying value. There was no impairment of the indefinite-lived intangible assets. As a result, the Company recorded a pretax, non-cash charge of $
7.3 million
to reduce the carrying value of its goodwill in the HCN Segment in
2019
. Our October 31, 2019 annual assessment concluded there was no additional impairment.
Depreciation and amortization.
Depreciation and amortization expenses were
$15.6
million in
2019
, compared to
$17.5
million in
2018
, a decrease of
$1.9
million or
10.9%
. When compared to the prior year, the decrease in depreciation and amortization was due to lower capital expenditures, lower amortization of intangible assets and lower total investment in property and equipment net of depreciation.
Stock-based compensation.
Stock-based compensation expenses included in instructional costs and services, selling and promotional, and general and administrative expenses in
2019
were
$6.0 million
in the aggregate, representing a decrease of
$1.2 million
, or
17.0%
, compared to
$7.2 million
in
2018
. Stock-based compensation costs include accelerated expense for retirement-eligible employees and additional performance stock unit incentive costs. The decrease in stock-based compensation costs was due to decrease in performance-based stock unit costs.
88
The table below reflects our stock-based compensation expense recorded in our Consolidated Statements of Income included in our Consolidated Financial Statements for the years ended
2018
and
2019
(in thousands):
|
|
Year Ended December 31,
|
|||||||
|
|
2018
|
2019
|
||||||
|
Instructional costs and services
|
$
|
1,610
|
|
$
|
1,570
|
|
||
|
Selling and promotional
|
512
|
|
766
|
|
||||
|
General and administrative
|
5,058
|
|
3,624
|
|
||||
|
Total stock-based compensation expense
|
$
|
7,180
|
|
$
|
5,960
|
|
||
Interest income
Interest income was
$3.9 million
in
2019
, compared to income of
$2.9 million
in
2018
. The increase is due to an increase in the average rate of interest earned on invested funds during
2019
.
Income Tax Expense
We recognized tax expense from operations for
2019
and
2018
of
$5.2
million and
$9.3
million, respectively, or an effective tax rate of
34.1%
and
26.6%
in
2019
and
2018
, respectively. The increase in our effective tax rate for
2019
is primarily due to a higher amount of non-deductible expenses compared to
2018
in our APEI Segment, and lower pretax income in our APEI and HCN Segments, partially offset by the benefit from ASU No. 2016-09
Compensation - Stock Compensation
(Topic 718)
in our APEI Segment. The effective tax rate for
2019
includes a benefit of approximately $0.4 million related to ASU No. 2016-09, compared to additional income tax expense of $0.1 million for
2018
.
Equity Investment Loss
Equity investment loss was
$1.5
million in
2019
, compared to equity investment loss of
$0.5
million in
2018
, an increase of
$1.0
million. For additional information on our investments please refer to “Note 5. Investments” in our Consolidated Financial Statements.
Net Income
Net income was
$10.0
million in
2019
, compared to net income of
$25.6
million in
2018
, a decrease of
$15.6
million, or
60.9%
. This decrease was related to the factors discussed above.
Operating Results by Reportable Segment - Year Ended
December 31, 2019
Compared to Year Ended
December 31, 2018
The table below details our operating results by reportable segment for the periods indicated (in thousands):
|
Year Ended December 31,
|
||||||||||||||
|
|
2018
|
2019
|
$ Change
|
% Change
|
||||||||||
|
Revenue
|
||||||||||||||
|
American Public Education Segment
|
$
|
260,062
|
|
$
|
256,899
|
|
$
|
(3,163
|
)
|
(1.2
|
)%
|
|||
|
Hondros College of Nursing Segment
|
37,625
|
|
29,479
|
|
(8,146
|
)
|
(21.7
|
)%
|
||||||
|
Intersegment elimination
|
—
|
|
(108
|
)
|
(108
|
)
|
NA
|
|
||||||
|
Total Revenue
|
$
|
297,687
|
|
$
|
286,270
|
|
$
|
(11,417
|
)
|
(3.8
|
)%
|
|||
|
Income (loss) from operations before interest income and income taxes
|
||||||||||||||
|
American Public Education Segment
|
$
|
28,561
|
|
$
|
23,522
|
|
$
|
(5,039
|
)
|
(17.6
|
)%
|
|||
|
Hondros College of Nursing Segment
|
3,965
|
|
(10,768
|
)
|
(14,733
|
)
|
(371.6
|
)%
|
||||||
|
Intersegment elimination
|
—
|
|
2
|
|
2
|
|
NA
|
|
||||||
|
Total income from operations before interest income and income taxes
|
$
|
32,526
|
|
$
|
12,756
|
|
$
|
(19,770
|
)
|
(60.8
|
)%
|
|||
89
Effective January 1, 2019, the APEI Segment began charging the HCN Segment for the value of courses taken by HCN Segment employees at APUS. Intersegment elimination represents the elimination of this intersegment revenue in consolidation.
APEI Segment
Our APEI Segment revenue was approximately
$256.9 million
in
2019
, a decrease of
$3.2 million
, or
1.2%
, compared to
$260.1 million
in
2018
, which is primarily attributable to lower net course registrations. Net course registrations at APUS decreased
1.1%
to approximately
316,700
in
2019
compared to the same period in
2018
. The decrease in APUS’s net course registrations was primarily attributable to the temporary exhaustion of Navy TA program funds, which resulted in registration declines during the second and third quarter of 2019, and ongoing declines in new student course registration resulting in decreased student net course registrations. Income from operations before interest income and income taxes was approximately
$23.5 million
in
2019
, a decrease of
$5.0 million
, or
17.6%
, compared to
2018
, as a result of the decrease in revenue resulting from lower net course registrations and increases in selling and promotional expenses and general and administrative expenses. For information regarding the APEI Segment’s net course registrations please refer to “Year Ended
December 31, 2019
Compared to Year Ended
December 31, 2018
- Revenue” above.
HCN Segment
Our HCN Segment revenue was approximately
$29.5 million
in
2019
, a decrease of
$8.1 million
, or
21.7%
compared to
$37.6 million
in
2018
, due to a decrease in student enrollment. HCN average student enrollment decreased
23.1%
in
2019
compared to
2018
. We believe that the decrease in HCN’s enrollment in
2019
was primarily attributable to changes in academic standards and admissions policies instituted in the first quarter of 2019, among other factors. Additionally, our enrollments appear to have been impacted by negative perceptions by certain current and prospective student cohorts. The loss from operations before interest income and income taxes in the HCN Segment was approximately
$10.8 million
in
2019
compared to income from operations before income tax of
$4.0 million
in
2018
, as a result of the goodwill impairment of
$7.3 million
and decrease in revenue due to lower enrollment in
2019
.
Year Ended
December 31, 2018
Compared to Year Ended
December 31, 2017
Revenue
Our consolidated revenue for the year ended
December 31, 2018
was
$297.7
million, a decrease of
$1.5
million or
0.5%
, compared to
$299.2
million for the year ended
December 31, 2017
.
The decrease in revenue was a result of a decrease in net course registrations and lower revenue per net course registration at APUS, due, in part, to changes in the general education requirements, partially offset by an increase in average student enrollments at HCN. APUS net course registrations decreased to approximately
320,300
in the year ended
December 31, 2018
from approximately
325,000
in the year ended
December 31, 2017
, a decrease of approximately
1.4%
. We believe that the decrease in APUS’s net course registrations for the year ended
December 31, 2018
, was primarily attributable to challenges associated with competition for students, the continuing effects of prior periods of decreased registrations and ongoing declines in new student course registrations resulting in decreased returning student net course registrations. We believe that HCN’s average student enrollment increase is attributable to the opening of the Toledo campus in January 2017.
Costs and Expenses
Costs and expenses were
$265.2
million for the year ended
December 31, 2018
, an increase of
$0.8
million, or
0.3%
, compared to
$264.4
million for the year ended
December 31, 2017
. The increase in costs and expenses was primarily due to increased employee compensation costs in both our APEI Segment and our HCN Segment, including severance costs related to the voluntary reduction in force program in our APEI Segment during the three months ended March 31, 2018, increases in stock-based compensation expense, and professional fees associated with an acquisition we are no longer pursuing in our APEI Segment. These increased costs were partially offset by decreases in advertising expense and instructional materials costs in our APEI Segment.
Costs and expenses as a percentage of revenue increased to
89.0%
in the year ended
December 31, 2018
from
88.4%
in the year ended
December 31, 2017
. Our income before interest and income taxes, or our operating margin, decreased to
11.0%
from
11.6%
over that same period. Our costs and expenses as a percentage of revenue increased due to increased general and administrative costs as a percentage of revenue partially offset by decreases in instructional costs and services expenses as a percentage of revenue and selling and promotional expenses as a percentage of revenue.
90
Instructional costs and services.
Instructional costs and services expenses for the year ended
December 31, 2018
were
$115.3
million, a decrease of approximately
$0.9
million, or
0.8%
, compared to
$116.2
million for the year ended
December 31, 2017
. Instructional costs and services expenses as a percentage of revenue were
38.7%
for the year ended
December 31, 2018
, compared to
38.8%
for the year ended
December 31, 2017
. The decrease in instructional costs and services expenses is primarily the result of decreased instructional materials costs in our APEI Segment, partially offset by increases in stock compensation costs in our APEI Segment and employee compensation costs in our HCN Segment. Our instructional costs and services expenses as a percentage of revenue decreased primarily due to our instructional costs and services expenses decreasing at a rate greater than the decrease in consolidated revenue.
Selling and promotional.
Selling and promotional expenses for the year ended
December 31, 2018
were
$57.0
million, a decrease of
$1.3
million, or
2.2%
, compared to
$58.3
million for the year ended
December 31, 2017
. This decrease was primarily due to decreases in advertising costs and marketing support materials costs in our APEI Segment partially offset by increased advertising costs in our HCN Segment. Selling and promotional expenses as a percentage of revenue were
19.1%
for the year ended
December 31, 2018
compared to
19.5%
for the year ended
December 31, 2017
. Selling and promotional expenses as a percentage of revenue decreased year over year due to our selling and promotional expenses decreasing at a rate greater than the decrease in consolidated revenue.
General and administrative.
General and administrative expenses for the year ended
December 31, 2018
were
$74.5
million, an increase of
$5.5
million, or
8.0%
compared to
$69.0
million for the year ended
December 31, 2017
. The increase in general and administrative expenses was primarily related to increases in employee compensation costs including the voluntary reduction in force program, reduced capitalized labor for APUS capital projects, stock-based and other incentive compensation expense, and professional fees in our APEI Segment and increased bad debt expense in our HCN Segment partially offset by decreases in bad debt expense in our APEI Segment. General and administrative expenses as a percentage of revenue were
25.0%
for the year ended
December 31, 2018
, compared to
23.1%
for the year ended
December 31, 2017
. The increase in general and administrative expenses as a percentage of revenue was primarily due to the increase in general and administrative expenses during a period when consolidated revenue decreased.
Bad debt expense decreased to
$4.6 million
, or approximately
1.5%
of revenue, for the year ended
December 31, 2018
, from
$4.7 million
, or approximately
1.6%
of revenue, in the year ended
December 31, 2017
. We believe the decrease in bad debt expense was primarily due to changes in student mix, changes in admissions and verification, and other changes, partially offset by increases in bad debt expense in our HCN Segment.
Loss on disposal of long-lived assets.
The loss on disposal of long-lived assets was
$0.9
million in the year ended
December 31, 2018
, compared to
$2.1
million in the year ended
December 31, 2017
.
Depreciation and amortization.
Depreciation and amortization expenses were
$17.5
million for the year ended
December 31, 2018
, compared to
$18.8
million for the year ended
December 31, 2017
, a decrease of
$1.3
million or
6.9%
. When compared to the prior year, the decrease in depreciation and amortization was due to lower capital expenditures, lower amortization of intangible assets and lower total investment in property and equipment net of depreciation.
Stock-based compensation.
Stock-based compensation expenses included in instructional costs and services, selling and promotional, and general and administrative expenses for the year ended
December 31, 2018
were
$7.2 million
in the aggregate, representing an increase of
$1 million
or
15.0%
, compared to
$6.2 million
for the year ended
December 31, 2017
. The increase in stock-based compensation was primarily due to the accelerated stock-based compensation expense of awards to employees who reached retirement eligibility and additional performance unit incentive costs.
The table below reflects our stock-based compensation expense recognized in our Consolidated Statements of Income for the years ended
December 31, 2017
and
2018
(in thousands):
|
|
Year Ended December 31,
|
|||||||
|
|
2017
|
2018
|
||||||
|
Instructional costs and services
|
$1,310
|
$1,610
|
||||||
|
Selling and promotional
|
789
|
|
512
|
|
||||
|
General and administrative
|
4,147
|
|
5,058
|
|
||||
|
Total stock-based compensation expense
|
$
|
6,246
|
|
$
|
7,180
|
|
||
Interest income
91
Interest income was
$2.9 million
for the year ended
December 31, 2018
compared to income of
$0.2 million
for the year ended
December 31, 2017
. The increase was related to an increase in interest rates and larger invested balances in cash and cash equivalents during the year ended
December 31, 2018
.
Income Tax Expense
We recognized tax expense from operations for the years ended
December 31, 2018
and
2017
of
$9.3
million and
$11.5
million, respectively, or an effective tax rate of
26.6%
and
35.2%
in
2018
and
2017
, respectively. The decrease in our effective tax rate for the year ended
December 31, 2018
is primarily due to the reduction in the federal corporate tax rate to 21% from the prior maximum rate of 35% effective January 1, 2018 under the U.S Tax Cuts and Jobs Act, or the Tax Act and favorable adjustments related to taxes paid for the 2017 tax year, partially offset by additional income tax expense of approximately $0.1 million related to the adoption of ASU 2016-09. The effective tax rate for the year ended
December 31, 2017
includes approximately $0.5 million in additional income tax expense due to the adoption of ASU 2016-09.
Equity Investment Loss
Equity investment loss was
$0.5
million for the year ended
December 31, 2018
, compared to equity investment loss of
$2.4
million for the year ended
December 31, 2017
, an increase of
$1.9
million. The investment loss was due to other-than-temporary impairments totaling $0.5 million on certain minority investments during the year ended December 31, 2018 compared to other-than-temporary impairments totaling $2.7 million on certain minority investments during the year ended December 31, 2017. For additional information on our investments and other than temporary impairments please refer to “Note 5. Investments” in our Consolidated Financial Statements. At
December 31, 2017
and
December 31, 2018
our total equity method investments were
$12.5 million
and
$12.0 million
, respectively.
Net Income
Net income was
$25.6
million for the year ended
December 31, 2018
, compared to net income of
$21.1
million for the year ended
December 31, 2017
, an increase of
$4.5
million, or
21.3%
. This increase was related to the factors discussed above.
Operating Results by Reportable Segment - Year Ended
December 31, 2018
Compared to Year Ended
December 31, 2017
The table below details our operating results by reportable segment for the periods indicated (in thousands):
|
Year Ended December 31,
|
||||||||||||||
|
|
2017
|
2018
|
$ Change
|
% Change
|
||||||||||
|
Revenue
|
||||||||||||||
|
American Public Education Segment
|
$
|
265,246
|
|
$
|
260,062
|
|
$
|
(5,184
|
)
|
(2.0
|
)%
|
|||
|
Hondros College of Nursing Segment
|
34,002
|
|
37,625
|
|
3,623
|
|
10.7
|
%
|
||||||
|
Total Revenue
|
$
|
299,248
|
|
$
|
297,687
|
|
$
|
(1,561
|
)
|
(0.5
|
)%
|
|||
|
Income from operations before interest income and income taxes
|
||||||||||||||
|
American Public Education Segment
|
$
|
30,873
|
|
$
|
28,561
|
|
$
|
(2,312
|
)
|
(7.5
|
)%
|
|||
|
Hondros College of Nursing Segment
|
3,986
|
|
3,965
|
|
(21
|
)
|
(0.5
|
)%
|
||||||
|
Total income from operations before interest income and income taxes
|
$
|
34,859
|
|
$
|
32,526
|
|
$
|
(2,333
|
)
|
(6.7
|
)%
|
|||
APEI Segment
For the year ended
December 31, 2018
, our APEI Segment earned approximately
$260.1 million
in revenue, a
$5.2 million
, or
2.0%
, decrease as compared to the year ended
December 31, 2017
, which is primarily attributable to lower net course registrations and lower revenue per net course registration, due in part to changes in the general education requirements. Net course registrations at APUS decreased
1.4%
to approximately
320,300
for the year ended
December 31, 2018
compared to the same period in
2017
. We believe the decrease in APUS’s net course registrations was primarily attributable to challenges associated with competition for students, the continuing effects of prior periods of decreased registrations, and ongoing declines in new student net course registrations resulting in decreased returning student net course registrations. Income from operations before interest income and income taxes was approximately
$28.6 million
for the year ended
December 31, 2018
, a decrease of
$2.3 million
, or
7.5%
, compared to the year ended
December 31, 2017
, as a result of the decrease in revenue resulting from
92
lower net course registrations and increases in general and administrative expenses. For information regarding the APEI Segment’s net course registrations please refer to “Year Ended
December 31, 2018
Compared to Year Ended
December 31, 2017
- Revenue” above.
HCN Segment
For the year ended
December 31, 2018
, the HCN Segment earned approximately
$37.6 million
in revenue, a
$3.6 million
, or
10.7%
increase as compared to the year ended
December 31, 2017
, which is due to the opening of the Toledo campus during 2017. HCN student enrollment was approximately 2,100 for the year-ended
December 31, 2018
and
December 31, 2017
with higher average enrollment during 2018 primarily as a result of the new Toledo campus. Income from operations before interest income and income taxes was approximately
$4.0 million
for the years ended
December 31, 2018
and
December 31, 2017
as a result of an increase in revenue from higher enrollments offset by increased employee compensation, advertising, and bad debt expense during the year ended
December 31, 2018
.
Quarterly Results
The following table presents our unaudited quarterly results of operations for the last eight quarters, and should be reviewed in conjunction with our Consolidated Financial Statements and related notes contained elsewhere in this Annual Report. We have prepared the unaudited information on the same basis as our audited Consolidated Financial Statements. Results of operations for any quarter are not necessarily indicative of results for any future quarters or for a full year (in thousands).
|
|
Quarter Ended
|
|||||||||||||||||||||||
|
March 31,
2018 |
June 30,
2018 |
September 30,
2018 |
December 31,
2018 |
March 31,
2019 |
June 30,
2019 |
September 30,
2019 |
December 31,
2019 |
|||||||||||||||||
|
(Unaudited)
|
||||||||||||||||||||||||
|
Statement of Operations Data:
|
|
|
|
|
|
|
|
|
|
|
|
|
|
|
|
|
||||||||
|
Revenue
|
$
|
74,967
|
|
$
|
72,798
|
|
$
|
72,992
|
|
$
|
76,930
|
|
$
|
73,441
|
|
$
|
70,560
|
|
$
|
67,888
|
|
$
|
74,381
|
|
|
Costs and expenses:
|
|
|
|
|
|
|
|
|
|
|
|
|
|
|
|
|
||||||||
|
Instructional costs and services
|
29,686
|
|
28,967
|
|
28,186
|
|
28,441
|
|
27,915
|
|
28,725
|
|
27,268
|
|
28,008
|
|
||||||||
|
Selling and promotional
|
15,581
|
|
13,284
|
|
14,139
|
|
14,038
|
|
15,047
|
|
14,087
|
|
15,873
|
|
15,021
|
|
||||||||
|
General and administrative
|
18,888
|
|
17,594
|
|
19,298
|
|
18,676
|
|
19,065
|
|
18,123
|
|
22,021
|
|
18,873
|
|
||||||||
|
Loss on disposals of long-lived assets
|
128
|
|
558
|
|
196
|
|
—
|
|
126
|
|
4
|
|
394
|
|
32
|
|
||||||||
|
Impairment of goodwill
|
—
|
|
—
|
|
—
|
|
—
|
|
5,855
|
|
—
|
|
1,481
|
|
—
|
|
||||||||
|
Depreciation and amortization
|
4,522
|
|
4,347
|
|
4,289
|
|
4,343
|
|
4,051
|
|
3,943
|
|
3,764
|
|
3,838
|
|
||||||||
|
Total costs and expenses
|
68,805
|
|
64,750
|
|
66,108
|
|
65,498
|
|
72,059
|
|
64,882
|
|
70,801
|
|
65,772
|
|
||||||||
|
Income from operations before interest income and income taxes
|
6,162
|
|
8,048
|
|
6,884
|
|
11,432
|
|
1,382
|
|
5,678
|
|
(2,913
|
)
|
8,609
|
|
||||||||
|
Interest income, net
|
493
|
|
661
|
|
774
|
|
987
|
|
1,053
|
|
1,135
|
|
1,019
|
|
701
|
|
||||||||
|
Income from operations before income taxes
|
6,655
|
|
8,709
|
|
7,658
|
|
12,419
|
|
2,435
|
|
6,813
|
|
(1,894
|
)
|
9,310
|
|
||||||||
|
Income tax expense
|
1,865
|
|
2,280
|
|
1,848
|
|
3,294
|
|
(63
|
)
|
1,898
|
|
(239
|
)
|
3,591
|
|
||||||||
|
Equity investment income (loss)
|
(201
|
)
|
29
|
|
(311
|
)
|
(32
|
)
|
(1,487
|
)
|
6
|
|
17
|
|
—
|
|
||||||||
|
Net income (loss)
|
$
|
4,589
|
|
$
|
6,458
|
|
$
|
5,499
|
|
$
|
9,093
|
|
$
|
1,011
|
|
$
|
4,921
|
|
$
|
(1,638
|
)
|
$
|
5,719
|
|
|
Other Data:
|
|
|
|
|
|
|
|
|
|
|
|
|
|
|
|
|
||||||||
|
Stock-based compensation
|
$
|
1,843
|
|
$
|
1,597
|
|
$
|
2,084
|
|
$
|
1,656
|
|
$
|
1,689
|
|
$
|
1,630
|
|
$
|
1,712
|
|
$
|
929
|
|
|
Net cash provided by operating activities
|
$
|
10,244
|
|
$
|
9,322
|
|
$
|
5,989
|
|
$
|
18,624
|
|
$
|
7,895
|
|
$
|
15,825
|
|
$
|
8,216
|
|
$
|
6,434
|
|
|
Capital expenditures
|
$
|
1,666
|
|
$
|
1,893
|
|
$
|
1,790
|
|
$
|
4,081
|
|
$
|
1,585
|
|
$
|
1,372
|
|
$
|
1,194
|
|
$
|
3,104
|
|
|
APUS net course registrations
|
83,300
|
|
76,800
|
|
80,800
|
|
79,400
|
|
84,300
|
|
75,900
|
|
76,700
|
|
79,800
|
|
||||||||
93
Liquidity and Capital Resources
We financed our operating activities and capital expenditures in
2018
and
2019
primarily with cash provided by operating activities. Cash, cash equivalents, and restricted cash were
$212.1
million and
$202.7
million at
December 31, 2018
and
December 31, 2019
, respectively, representing a decrease of
$9.4 million
, or
4.4%
, in
2019
. The decrease in cash, cash equivalents, and restricted cash in 2019 was primarily due to the repurchase of our common stock during the period. Cash, cash equivalents, and restricted cash increased by
$32.9 million
, or
18.4%
, to
$212.1
million in
2018
, which was due to cash provided by operating activities exceeding cash used in investing and financing activities.
We derive a significant portion of our revenue from tuition assistance programs from the DoD in our APEI Segment. We also participate in programs from the U.S. Department of Veterans Affairs, or VA. Generally, these funds are received within 60 days of the start of the applicable course. In both our APEI and HCN Segments, another significant source of revenue is derived from our participation in ED’s Title IV programs, for which disbursements are governed by federal regulations. We have typically received disbursements under Title IV programs within 30 days of the start of the applicable course or term. These factors, together with the number of courses starting each month, affect our operating cash flow.
We expect to continue to fund our costs and expenses through cash generated from operations. Based on our current level of operations, we believe that our cash flow from operations and our existing cash and cash equivalents will provide adequate funds for ongoing operations and planned capital expenditures for the foreseeable future. We expect operating expenditures to increase in future periods as we accelerate the investment in
and modernization of our information technology systems and increase marketing and other expenditures. In
2019
we incurred approximately $2.1 million to evaluate and invest in replacements and upgrades to our information technology systems, including one-time expenses to upgrade our learning management system, and to inform the scope and duration of the larger overall information technology transformation program. We anticipate spending between approximately $6.0 million and $8.0 million in 2020, focusing on specific information technology projects, including replacements of our learning management and customer relationship management systems. We estimate 80% of this anticipated spending to be one-time spending, with respect to the projects and systems to which these expenditures relate. APUS signed a contract for a replacement customer relationship management system in the first quarter of 2020 and began its first cohort of students in a new learning management system in March 2020. We will continue to evaluate our PAD system for possible changes and upgrades and anticipate that we will eventually make significant changes to that system, as well. In addition, our Board of Directors approved an increase in marketing expenditures for 2020, including in support of a planned advertising campaign focusing on affordability and return on investment for learners. As a result of these increased marketing expenses, we expect selling and promotional expenses as a percentage of revenue to increase in 2020 as compared to
2019
. Capital expenditures could be higher in the future as a result of, among other things, additional expenditures for technology or other business capabilities, the opening of new campuses at HCN, the acquisition or lease of existing structures or potential new construction projects, and necessary tenant improvements that arise as a result of our ongoing evaluation of our space needs and opportunities for physical growth. For example, in
2019
we incurred approximately $0.5 million in capital expenditures related to a new HCN campus in Indianapolis, Indiana. We also expect that we will continue to make expenditures to invest in strategic opportunities and to enhance our business capabilities. We will continue to explore opportunities to invest in the education industry, which could include purchasing or investing in other education-related companies or companies developing new technologies. We may need additional capital in connection with any change in our current level of operations, including if we were to pursue significant business acquisitions or investment opportunities, or determine to make other significant investments in our business.
Operating Activities
Net cash provided by operating activities was
$44.2 million
and
$38.4 million
in
2018
and
2019
, respectively. The decrease from
2018
to
2019
was primarily due to changes in working capital due to the timing of receipts and payments. Accounts receivable at
December 31, 2019
, was approximately
$2.7 million
lower than December 31, 2018 primarily due to improved payment processing by DoD tuition assistance programs. Accounts payable at
December 31, 2019
was approximately
$5.6 million
lower than December 31, 2018 primarily due to the timing of processing of purchases and payments.
Investing Activities
Net cash used in investing activities was
$9.4 million
and
$7.3 million
in
2018
, and
2019
, respectively. The decrease from
2018
to
2019
was primarily related to a decrease in technology-related capital expenditures partially offset by capital expenditures related to software development and program development within our APEI Segment and capital expenditures related to the new Indianapolis, Indiana campus in our HCN Segment. In
2019
, cash used in investing activities for capital expenditures was primarily for software development, including software development related to PAD, furniture and fixtures,
94
and program development within our APEI Segment and capital expenditures related to the new Indianapolis, Indiana campus in our HCN Segment. In
2018
, cash used in investing activities for capital expenditures was primarily for computer hardware and software, and software development, including software development related to PAD within our APEI Segment.
Financing Activities
Net cash used in financing activities was
$1.8 million
and
$40.5 million
in
2018
and
2019
, respectively. The increase in cash used in financing activities in
2019
was related to $39.0 million used to repurchase our common stock in accordance with our share repurchase programs and increased cash used for the deemed repurchase of our common stock to satisfy minimum tax-withholding requirements in connection with the vesting of restricted stock grants. The decrease in cash used in financing activities in
2018
was primarily due to excess tax expense related to stock-based compensation recorded as a component of income tax expense, partially offset by increased cash used for the deemed repurchase of our common stock to satisfy minimum tax-withholding requirements in connection with the vesting of restricted stock grants.
Contractual Obligations
We have various contractual obligations consisting of operating leases and purchase obligations. Purchase obligations include agreements with consultants, contracts with third-party service providers, and other future contracts or agreements. The following table sets forth our future contractual obligations as of
December 31, 2019
(in thousands):
|
|
|
Payments Due by Period
|
||||||||||||||||||
|
Total
|
Less than
1 Year
|
1-3 Years
|
3-5 Years
|
More than 5 Years
|
||||||||||||||||
|
Operating lease obligations
|
$
|
13,671
|
|
$
|
2,835
|
|
$
|
5,759
|
|
$
|
2,837
|
|
$
|
2,240
|
|
|||||
|
Purchase obligations
|
7,833
|
|
5,007
|
|
1,770
|
|
1,056
|
|
—
|
|
||||||||||
|
Total contractual obligations
|
$
|
21,504
|
|
$
|
7,842
|
|
$
|
7,529
|
|
$
|
3,893
|
|
$
|
2,240
|
|
|||||
In February 2020, APUS entered into a 48 month agreement with a customer relationship management platform provider. The total value of the contract over that 48 month period is approximately $3.5 million.
Off-Balance Sheet Arrangements
We do not have off-balance sheet financing arrangements, including any relationships with unconsolidated entities or financial partnerships, such as entities often referred to as structured finance or special purpose entities.
Impact of Inflation
We do not believe that inflation had a material impact on our results of operations in
2018
or
2019
. There can be no assurance that future inflation will not have an adverse impact on our operating results and financial condition.
ITEM 7A.
QUANTITATIVE AND QUALITATIVE DISCLOSURES ABOUT MARKET RISK
We are subject to the impact of interest rate changes and may be subject to changes in the market values of future investments. We invest our excess cash in bank overnight deposits, money market funds invested in federal securities, and short-term U.S. Treasuries with original maturities of three months or less when purchased.
Market Risk
We maintain our cash and cash equivalents in bank deposit accounts, money market funds invested in federal securities, and short-term U.S. Treasuries. The bank deposits exceed federally insured limits. We have historically not experienced any losses in such accounts. We believe we are not exposed to any significant credit risk on cash and cash equivalents. Due to the short-term duration of our investment portfolio and the low risk profile of our investments, an immediate 100 basis point change in interest rates would not have a material effect on the fair market value of our portfolio.
Interest Rate Risk
We are subject to risk from adverse changes in interest rates, primarily relating to our investment of funds in short-term U.S. treasury bills issued at a discount to their par value. Our future investment income will vary due to changes in interest rates. At
December 31, 2019
, a 10% increase or decrease in interest rates would not have a material impact on our future earnings, fair values, or cash flows.
95
ITEM 8.
FINANCIAL STATEMENTS AND SUPPLEMENTARY DATA
INDEX TO CONSOLIDATED FINANCIAL STATEMENTS
American Public Education, Inc. and Subsidiaries
|
|
Page
|
|
|
|
|
American Public Education, Inc. and Subsidiaries:
|
|
96
REPORT OF INDEPENDENT REGISTERED PUBLIC ACCOUNTING FIRM
To the Stockholders and the Board of Directors of American Public Education, Inc.
Opinion on the Financial Statements
We have audited the accompanying consolidated balance sheets of American Public Education, Inc. and subsidiaries (the "Company")
as of December 31, 2018 and 2019, the related consolidated statements of income, stockholders' equity, and cash flows, for each of the two years in the period ended December 31, 2019, and the related notes. In our opinion, the financial statements present fairly, in all material respects, the financial position of the Company as of December 31, 2018 and 2019, and the results of its operations and its cash flows for each of the two years in the period ended December 31, 2019, in conformity with accounting principles generally accepted in the United States of America.
We have also audited, in accordance with the standards of the Public Company Accounting Oversight Board (United States) (PCAOB), the Company's internal control over financial reporting as of December 31, 2019, based on criteria established in
Internal Control - Integrated Framework (2013)
issued by the Committee of Sponsoring Organizations of the Treadway Commission and our report dated March 10, 2020, expressed an unqualified opinion on the Company's internal control over financial reporting.
Basis for Opinion
These financial statements are the responsibility of the Company's management. Our responsibility is to express an opinion on the Company's financial statements based on our audits. We are a public accounting firm registered with the PCAOB and are required to be independent with respect to the Company in accordance with the U.S. federal securities laws and the applicable rules and regulations of the Securities and Exchange Commission and the PCAOB.
We conducted our audits in accordance with the standards of the PCAOB. Those standards require that we plan and perform the audit to obtain reasonable assurance about whether the financial statements are free of material misstatement, whether due to error or fraud. Our audits included performing procedures to assess the risks of material misstatement of the financial statements, whether due to error or fraud, and performing procedures that respond to those risks. Such procedures included examining, on a test basis, evidence regarding the amounts and disclosures in the financial statements. Our audits also included evaluating the accounting principles used and significant estimates made by management, as well as evaluating the overall presentation of the financial statements. We believe that our audits provide a reasonable basis for our opinion.
/s/ Deloitte & Touche LLP
McLean, VA
March 10, 2020
We have served as the Company's auditor since 2018.
97
REPORT OF INDEPENDENT REGISTERED PUBLIC ACCOUNTING FIRM
To the Stockholders and the Board of Directors of American Public Education, Inc.
Opinion on the Financial Statements
We have audited the accompanying consolidated statements of income, stockholders' equity, and cash flows for the year ended December 31, 2017 of American Public Education, Inc. and Subsidiaries (the Company), and the related notes to the consolidated financial statements and schedule (collectively, the financial statements). In our opinion, the financial statements present fairly, in all material respects, the results of operations and cash flows of the Company for the year ended December 31, 2017, in conformity with accounting principles generally accepted in the United States of America.
Basis for Opinion
These financial statements are the responsibility of the Company’s management. Our responsibility is to express an opinion on the Company’s financial statements based on our audit. We are a public accounting firm registered with the PCAOB and are required to be independent with respect to the Company in accordance with U.S. federal securities laws and the applicable rules and regulations of the Securities and Exchange Commission and the PCAOB.
We conducted our audit in accordance with the standards of the PCAOB. Those standards require that we plan and perform the audit to obtain reasonable assurance about whether the financial statements are free of material misstatement, whether due to error or fraud. Our audit included performing procedures to assess the risks of material misstatement of the financial statements, whether due to error or fraud, and performing procedures that respond to those risks. Such procedures included examining, on a test basis, evidence regarding the amounts and disclosures in the financial statements. Our audit also included evaluating the accounting principles used and significant estimates made by management, as well as evaluating the overall presentation of the financial statements. We believe that our audit provides a reasonable basis for our opinion.
/s/ RSM US LLP
Richmond, Virginia
February 27, 2018
We served as the Company's auditor from 2003 to 2018
98
Consolidated Balance Sheets
|
As of December 31,
|
||||||||
|
|
2018
|
2019
|
||||||
|
|
(In thousands, except per share amounts)
|
|||||||
|
Assets
|
|
|
||||||
|
Current assets:
|
|
|
|
|
||||
|
Cash, cash equivalents, and restricted cash (Note 2)
|
$
|
212,131
|
|
$
|
202,740
|
|
||
|
Accounts receivable, net of allowance of $6,648 in 2018 and $6,174 in 2019.
|
14,059
|
|
11,325
|
|
||||
|
Prepaid expenses
|
5,482
|
|
7,087
|
|
||||
|
Income tax receivable
|
898
|
|
1,757
|
|
||||
|
Total current assets
|
232,570
|
|
222,909
|
|
||||
|
Property and equipment, net
|
86,881
|
|
78,495
|
|
||||
|
Operating lease assets, net
|
—
|
|
11,658
|
|
||||
|
Investments
|
11,966
|
|
10,502
|
|
||||
|
Goodwill
|
33,899
|
|
26,563
|
|
||||
|
Other assets, net
|
5,642
|
|
4,770
|
|
||||
|
Total assets
|
$
|
370,958
|
|
$
|
354,897
|
|
||
|
Liabilities and Stockholders’ Equity
|
|
|
||||||
|
Current liabilities:
|
|
|
|
|
||||
|
Accounts payable
|
$
|
9,110
|
|
$
|
3,546
|
|
||
|
Accrued compensation and benefits
|
13,100
|
|
13,753
|
|
||||
|
Accrued liabilities
|
3,808
|
|
8,270
|
|
||||
|
Deferred revenue and student deposits
|
18,310
|
|
17,426
|
|
||||
|
Operating lease liabilities, current
|
—
|
|
2,283
|
|
||||
|
Total current liabilities
|
44,328
|
|
45,278
|
|
||||
|
Operating lease liability, long term
|
—
|
|
9,495
|
|
||||
|
Deferred income taxes
|
5,364
|
|
3,391
|
|
||||
|
Total liabilities
|
49,692
|
|
58,164
|
|
||||
|
Commitments and contingencies (Notes 7 and 11)
|
|
|
||||||
|
Stockholders’ equity:
|
|
|
||||||
|
Preferred Stock, $.01 par value; authorized shares - 10,000; no shares issued or outstanding
|
—
|
|
—
|
|
||||
|
Common Stock, $.01 par value; authorized shares - 100,000; 16,425 issued and outstanding in 2018; 15,178 issued and outstanding in 2019
|
164
|
|
152
|
|
||||
|
Additional paid-in capital
|
187,172
|
|
190,620
|
|
||||
|
Retained earnings
|
133,930
|
|
105,961
|
|
||||
|
Total stockholders’ equity
|
321,266
|
|
296,733
|
|
||||
|
Total liabilities and stockholders’ equity
|
$
|
370,958
|
|
$
|
354,897
|
|
||
The accompanying notes are an integral part of these consolidated statements.
99
Consolidated Statements of Income
|
Year Ended December 31,
|
||||||||||||
|
|
2017
|
2018
|
2019
|
|||||||||
|
|
(In thousands, except per share amounts)
|
|||||||||||
|
Revenue
|
$
|
299,248
|
|
$
|
297,687
|
|
$
|
286,270
|
|
|||
|
Costs and expenses:
|
|
|
|
|
|
|
||||||
|
Instructional costs and services
|
116,161
|
|
115,280
|
|
111,916
|
|
||||||
|
Selling and promotional
|
58,335
|
|
57,042
|
|
60,028
|
|
||||||
|
General and administrative
|
69,024
|
|
74,456
|
|
78,082
|
|
||||||
|
Loss on disposals of long-lived assets
|
2,093
|
|
882
|
|
556
|
|
||||||
|
Impairment of goodwill
|
—
|
|
—
|
|
7,336
|
|
||||||
|
Depreciation and amortization
|
18,776
|
|
17,501
|
|
15,596
|
|
||||||
|
Total costs and expenses
|
264,389
|
|
265,161
|
|
273,514
|
|
||||||
|
Income from operations before interest income and income taxes
|
34,859
|
|
32,526
|
|
12,756
|
|
||||||
|
Interest income, net
|
185
|
|
2,915
|
|
3,908
|
|
||||||
|
Income from operations before income taxes
|
35,044
|
|
35,441
|
|
16,664
|
|
||||||
|
Income tax expense
|
11,493
|
|
9,287
|
|
5,187
|
|
||||||
|
Equity investment loss
|
(2,430
|
)
|
(515
|
)
|
(1,464
|
)
|
||||||
|
Net income
|
$
|
21,121
|
|
$
|
25,639
|
|
$
|
10,013
|
|
|||
|
Net income per common share:
|
|
|
||||||||||
|
Basic
|
$
|
1.30
|
|
$
|
1.56
|
|
$
|
0.62
|
|
|||
|
Diluted
|
$
|
1.29
|
|
$
|
1.54
|
|
$
|
0.62
|
|
|||
|
Weighted average number of shares outstanding:
|
|
|
|
|
|
|
||||||
|
Basic
|
16,236
|
|
16,404
|
|
16,094
|
|
||||||
|
Diluted
|
16,380
|
|
16,634
|
|
16,255
|
|
||||||
The accompanying notes are an integral part of these consolidated statements.
100
Consolidated Statements of Stockholders’ Equity
|
(In thousands, except shares)
|
|||||||||||||||||||||||||
|
|
|
|
|
|
Additional Paid-In Capital
|
Retained Earnings
|
Total Stockholders’ Equity
|
||||||||||||||||||
|
|
Preferred Stock
|
Common Stock
|
|||||||||||||||||||||||
|
|
Shares
|
Amount
|
Shares
|
Amount
|
|||||||||||||||||||||
|
Balance as of December 31, 2016
|
—
|
|
$
|
—
|
|
16,108,893
|
|
$
|
161
|
|
$
|
177,061
|
|
$
|
87,448
|
|
$
|
264,670
|
|
||||||
|
Issuance of common stock under employee benefit plans
|
—
|
|
—
|
|
226,986
|
|
2
|
|
96
|
|
—
|
|
98
|
|
|||||||||||
|
Deemed repurchased shares of common and restricted stock for tax withholding
|
—
|
|
—
|
|
(68,065
|
)
|
—
|
|
(1,587
|
)
|
—
|
|
(1,587
|
)
|
|||||||||||
|
Stock-based compensation
|
—
|
|
—
|
|
—
|
|
—
|
|
5,104
|
|
—
|
|
5,104
|
|
|||||||||||
|
Net income
|
—
|
|
—
|
|
—
|
|
—
|
|
—
|
|
21,121
|
|
21,121
|
|
|||||||||||
|
Balance as of December 31, 2017
|
—
|
|
—
|
|
16,267,814
|
|
163
|
|
180,674
|
|
108,569
|
|
289,406
|
|
|||||||||||
|
Impact of adoption of ASC 606
|
(278
|
)
|
(278
|
)
|
|||||||||||||||||||||
|
Issuance of common stock under employee benefit plans
|
—
|
|
—
|
|
223,059
|
|
2
|
|
(2
|
)
|
—
|
|
—
|
|
|||||||||||
|
Deemed repurchased shares of common and restricted stock for tax withholding
|
—
|
|
—
|
|
(66,088
|
)
|
(1
|
)
|
(1,822
|
)
|
—
|
|
(1,823
|
)
|
|||||||||||
|
Stock-based compensation
|
—
|
|
—
|
|
—
|
|
—
|
|
8,322
|
|
—
|
|
8,322
|
|
|||||||||||
|
Net income
|
—
|
|
—
|
|
—
|
|
—
|
|
—
|
|
25,639
|
|
25,639
|
|
|||||||||||
|
Balance as of December 31, 2018
|
—
|
|
—
|
|
16,424,785
|
|
164
|
|
187,172
|
|
133,930
|
|
321,266
|
|
|||||||||||
|
Issuance of common stock under employee benefit plans
|
—
|
|
—
|
|
252,597
|
|
3
|
|
(3
|
)
|
—
|
|
—
|
|
|||||||||||
|
Deemed repurchased shares of common and restricted stock for tax withholding
|
—
|
|
—
|
|
(83,214
|
)
|
(1
|
)
|
(2,509
|
)
|
—
|
|
(2,510
|
)
|
|||||||||||
|
Stock-based compensation
|
—
|
|
—
|
|
—
|
|
—
|
|
5,960
|
|
—
|
|
5,960
|
|
|||||||||||
|
Repurchased and retired shares of common stock
|
—
|
|
—
|
|
(1,416,304
|
)
|
(14
|
)
|
—
|
|
(37,982
|
)
|
(37,996
|
)
|
|||||||||||
|
Net income
|
—
|
|
—
|
|
—
|
|
—
|
|
—
|
|
10,013
|
|
10,013
|
|
|||||||||||
|
Balance as of December 31, 2019
|
—
|
|
$
|
—
|
|
15,177,864
|
|
$
|
152
|
|
$
|
190,620
|
|
$
|
105,961
|
|
$
|
296,733
|
|
||||||
The accompanying notes are an integral part of these consolidated statements.
101
Consolidated Statements of Cash Flows
|
Year Ended December 31,
|
||||||||||||
|
|
2017
|
2018
|
2019
|
|||||||||
|
|
(In thousands)
|
|||||||||||
|
Operating activities
|
|
|
|
|
|
|
||||||
|
Net income
|
$
|
21,121
|
|
$
|
25,639
|
|
$
|
10,013
|
|
|||
|
Adjustments to reconcile net income to net cash provided by operating activities:
|
|
|
|
|
|
|
||||||
|
Depreciation and amortization
|
18,776
|
|
17,501
|
|
15,596
|
|
||||||
|
Stock-based compensation
|
6,246
|
|
7,180
|
|
5,960
|
|
||||||
|
Equity investment loss
|
2,430
|
|
515
|
|
1,464
|
|
||||||
|
Deferred income taxes
|
(2,494
|
)
|
(917
|
)
|
(1,973
|
)
|
||||||
|
Loss on disposal of long-lived assets
|
2,093
|
|
882
|
|
556
|
|
||||||
|
Impairment of goodwill
|
—
|
|
—
|
|
7,336
|
|
||||||
|
Other
|
353
|
|
302
|
|
145
|
|
||||||
|
Changes in operating assets and liabilities:
|
|
|
|
|
|
|
||||||
|
Accounts receivable, net of allowance for bad debt
|
(187
|
)
|
(6,923
|
)
|
2,734
|
|
||||||
|
Prepaid expenses
|
571
|
|
(560
|
)
|
(1,149
|
)
|
||||||
|
Income tax receivable
|
—
|
|
(898
|
)
|
(859
|
)
|
||||||
|
Operating lease assets, net
|
—
|
|
—
|
|
120
|
|
||||||
|
Other assets
|
(653
|
)
|
71
|
|
550
|
|
||||||
|
Accounts payable
|
1,991
|
|
266
|
|
(5,564
|
)
|
||||||
|
Accrued compensation and benefits
|
(1,455
|
)
|
3,298
|
|
653
|
|
||||||
|
Accrued liabilities
|
(740
|
)
|
875
|
|
3,672
|
|
||||||
|
Income tax payable
|
1,151
|
|
(1,710
|
)
|
—
|
|
||||||
|
Deferred revenue and student deposits
|
(1,265
|
)
|
(1,342
|
)
|
(884
|
)
|
||||||
|
Net cash provided by operating activities
|
47,938
|
|
44,179
|
|
38,370
|
|
||||||
|
Investing activities
|
|
|
|
|
|
|
||||||
|
Capital expenditures
|
(14,788
|
)
|
(9,430
|
)
|
(7,255
|
)
|
||||||
|
Proceeds from the sale of real property
|
1,493
|
|
—
|
|
—
|
|
||||||
|
Equity investments
|
(300
|
)
|
—
|
|
—
|
|
||||||
|
Net cash used in investing activities
|
(13,595
|
)
|
(9,430
|
)
|
(7,255
|
)
|
||||||
|
Financing activities
|
|
|
|
|
|
|
||||||
|
Cash paid for repurchase of common/restricted stock
|
(1,587
|
)
|
(1,823
|
)
|
(40,506
|
)
|
||||||
|
Cash received from issuance of common stock
|
98
|
|
—
|
|
—
|
|
||||||
|
Net cash used in financing activities
|
(1,489
|
)
|
(1,823
|
)
|
(40,506
|
)
|
||||||
|
Net increase (decrease) in cash, cash equivalents, and restricted cash
|
32,854
|
|
32,926
|
|
(9,391
|
)
|
||||||
|
Cash, cash equivalents, and restricted cash at beginning of period
|
146,351
|
|
179,205
|
|
212,131
|
|
||||||
|
Cash, cash equivalents, and restricted cash at end of period
|
$
|
179,205
|
|
$
|
212,131
|
|
$
|
202,740
|
|
|||
|
Supplemental disclosures of cash flow information
|
|
|
|
|
|
|
||||||
|
Income taxes paid
|
$
|
12,836
|
|
$
|
12,712
|
|
$
|
8,019
|
|
|||
The accompanying notes are an integral part of these consolidated statements.
102
Notes to Consolidated Financial Statements
Note 1. Nature of Business
American Public Education, Inc., or APEI, which together with its subsidiaries is referred to as the “Company,” is a provider of online and campus-based postsecondary education to approximately
82,600
students through
two
subsidiary institutions:
|
•
|
American Public University System, Inc., or APUS, provides online postsecondary education directed primarily at the needs of the military, military-affiliated, public service and service-minded communities through American Military University, or AMU, and American Public University, or APU. APUS is institutionally accredited by the Higher Learning Commission.
|
|
•
|
National Education Seminars, Inc., which is referred to herein as Hondros College of Nursing, or HCN, provides nursing education to students at
five
campuses in Ohio, and, beginning in the second quarter of 2020, at a campus in Indianapolis, Indiana, to serve the needs of the nursing and healthcare communities. HCN is institutionally accredited by the Accrediting Bureau for Health Education Schools, or ABHES.
|
The Company’s institutions are licensed or otherwise authorized, or are in the process of obtaining such licenses or authorizations, to offer postsecondary education programs by state authorities to the extent the institutions believe such licenses or authorizations are required, and are certified by the U.S. Department of Education, or ED, to participate in student financial aid programs authorized under Title IV of the Higher Education Act of 1965, as amended, or Title IV programs.
The Company’s operations are organized into
two
reportable segments:
|
•
|
American Public Education Segment, or APEI Segment.
This segment reflects the operational activities at APUS, other corporate activities, and minority investments.
|
|
•
|
Hondros College of Nursing Segment, or HCN Segment.
This segment reflects the operational activities of HCN.
|
Note 2. Significant Accounting Policies
A summary of the Company’s significant accounting policies follows:
Basis of presentation and accounting.
The accompanying consolidated financial statements have been prepared in accordance with accounting principles generally accepted in the United States of America, or GAAP. Certain prior year amounts have been reclassified for comparative purposes to conform to the 2019 presentation.
Principles of consolidation.
The accompanying consolidated financial statements include the accounts of APEI and its wholly owned subsidiaries. All material intercompany transactions and balances have been eliminated in consolidation.
Use of estimates.
In preparing financial statements in conformity with GAAP, the Company is required to make estimates and assumptions that affect the reported amounts of assets and liabilities, the disclosure of contingent assets and liabilities at the date of the financial statements, and the reported amounts of revenue and expenses during the reporting period. The Company evaluates these estimates and judgments on an ongoing basis and bases its estimates on experience, current and expected future conditions and various other assumptions that the Company believes are reasonable under the circumstances. Actual results may differ from those estimates under different assumptions or conditions, and the impact of such differences may be material to the Company’s Consolidated Financial Statements.
Cash and cash equivalents.
The Company considers all short-term highly liquid investments with maturities of three months or less when purchased to be cash equivalents. Cash and cash equivalents consist of demand deposits with financial institutions, money market funds invested in securities backed by the U.S. government and U.S. Treasury bills. Cash and cash equivalents are Level 1 assets in the fair value reporting hierarchy.
Restricted cash.
Cash and cash equivalents includes funds held for students for unbilled educational services that were received from Title IV programs. As a trustee of these Title IV program funds, the Company is required to maintain and restrict these funds pursuant to the terms of the program participation agreement with the U.S. Department of Education. Restricted cash on the Company’s Consolidated Balance Sheets as of
December 31, 2018
and
2019
was
$1.7 million
and
$1.3 million
, respectively.
103
Accounts receivable.
The Company accounts for receivables in accordance with Financial Accounting Standards Board, or FASB, Accounting Standards Codification Subtopic 310, or ASC 310,
Receivables.
Course tuition is recorded as accounts receivable and deferred revenue at the time students begin a course or term. Students may remit tuition payments at any time or they may elect various other payment options with payment terms extending beyond the start of the course or term. These other payment options include payments by sponsors, financial aid, alternative loans, or tuition assistance programs that remit payments directly to the subsidiary. HCN also offers extended payment plan options.
When a student remits payment after a course or term has begun, accounts receivable is reduced. If payment is made prior to the start of a course or term, the payment is recorded as a student deposit, and the student is provided access to the online classroom when courses start, in the case of APUS, or allowed to start the term, in the case of HCN. If a payment option is confirmed, the student is allowed to start the course or term. Generally, if no receipt is confirmed or payment option secured, the student will be dropped from the online course or not allowed to start the term. Therefore, billed amounts represent charges that have been prepared and sent to students or the applicable third-party payor according to the terms agreed upon in advance.
DoD tuition assistance programs are billed by branch of service on a course-by-course basis when a student starts a course, whereas Title IV programs are billed based on the courses included in a student’s term. Billed accounts receivable are considered past due if the invoice has been outstanding for more than 30 days.
Allowance for doubtful accounts.
The allowance for doubtful accounts is based on management’s evaluation of the status of existing accounts receivable. Among other factors, management considers the age of the receivable, the anticipated source of payment, and historical allowance considerations. Consideration is also given to any specific known risk areas among the existing accounts receivable balances. Recoveries of receivables previously written off are recorded when received. APUS does not charge interest on past due accounts receivable. HCN charges interest on payment plans when a student leaves the payment plan program upon graduation or exits the program. The interest earned in 2019 was approximately
$15,000
.
Property and equipment.
All property and equipment is carried at cost less accumulated depreciation and amortization. Depreciation and amortization are calculated on a straight-line basis over the estimated useful lives of the assets. Leasehold improvement depreciation is calculated on a straight-line basis over the lesser of the estimated useful life of the asset or the term of the lease. For tax purposes, different methods are used. Maintenance and repairs are expensed as incurred, while other costs are capitalized if they extend the useful life of the asset.
The Company’s Partnership At a Distance
system, or PAD, is a customized student information and services system used by APUS to manage admissions, online orientation, course registrations, tuition payments, grade reporting, progress toward degrees, and various other functions. Costs associated with this system have been capitalized in accordance with FASB ASC 350-40,
Accounting for the Costs of Computer Software Developed or Obtained for Internal Use
, and classified as property and equipment. These costs are amortized over the estimated useful life of
five
years. The Company also capitalizes certain costs for academic program development, and these costs are amortized over an estimated life not to exceed
three
years.
Leases.
In February 2016 FASB issued Accounting Standards Update, or ASU, No. 2016-02,
Leases (Topic 842)
. This standard requires entities to recognize most operating leases on their balance sheets as right-of-use assets, or ROU assets, with a corresponding lease liability, in addition to disclosing certain key information about leasing arrangements. The Company adopted the standard effective January 1, 2019 using the cumulative-effect adjustment transition method, which applies the provisions of the standard at the effective date without adjusting the comparative periods presented. The Company adopted the following practical expedients and elected the following accounting policies related to this standard:
|
•
|
Carry forward of historical lease classification;
|
|
•
|
Short-term lease accounting policy election allowing lessees to not recognize ROU assets and lease liabilities for leases with a term of 12 months or less; and
|
|
•
|
Not separate lease and non-lease components for office space and campus leases.
|
The adoption of this standard resulted in the recognition of operating lease ROU assets and corresponding lease liabilities of approximately
$12.1 million
on the Consolidated Balance Sheet as of January 1, 2019. There was no impact to the Company’s net income or liquidity as a result of the adoption of this ASU. Disclosures related to the amount, timing, and uncertainty of cash flows arising from leases are included in “Note 7. Leases” below.
Investments.
The Company accounts for its investments in less than majority owned companies in accordance with FASB ASC 323,
Investments - Equity Method and Joint Ventures
and
FASB ASC 321,
Investments - Equity Securities
. The Company applies the equity method to investments when it has the ability to exercise significant influence, but does not control
104
the operating and financial policies of the company. This is generally represented by equity ownership of at least 20 percent but not more than 50 percent. Investments accounted for under the equity method are initially recorded at cost and subsequently adjusted by the Company’s share of equity in income or losses after the date of acquisition. The pro-rata share of the operating results of the investee is reported in the Consolidated Statements of Income as “Equity investment loss.” Investments that do not meet the equity method requirements are accounted for under ASC 321,
Investments - Equity Securities,
with changes in the fair value of the investment reported in the Consolidated Statements of Income as “Equity investment loss.”
The Company periodically evaluates equity method investments for indicators of other-than-temporary impairments. Factors the Company considers when evaluating for other-than-temporary impairments include the duration and severity of the impairment, the reasons for the decline in value, and the potential recovery period. For an investee with impairment indicators, the Company measures fair value on the basis of discounted cash flows or other appropriate valuation methods. If it is probable that the Company will not recover the carrying amount of the investment, the impairment is considered other-than-temporary and recorded in equity earnings, and the equity investment balance is reduced to its fair value accordingly.
Each reporting period the Company evaluates its cost method investments for observable prices changes. Factors the Company may consider when evaluating an observable price may include significant changes in the regulatory, economic or technological environment, changes in the general market condition, bona fide offers to purchase or sell similar investments, and other criteria.
Management must exercise significant judgment in evaluating the potential impairment of its equity investments.
The Company’s investments are presented on a one-line basis as “Investments” in the accompanying Consolidated Balance Sheets. Additional information regarding the Company’s investments is located in “Note 5. Investments” below, in these Consolidated Financial Statements.
Goodwill and indefinite-lived intangible assets.
Goodwill represents the excess of the purchase price of an acquired business over the amount assigned to the assets acquired and liabilities assumed. Goodwill is not amortized. The Company accounts for goodwill and indefinite-lived intangible assets in accordance with FASB ASC 350,
Intangibles Goodwill and Other,
and in 2018 adopted ASU 2017-04,
Intangibles - Goodwill and Other (Topic 350): Simplifying the Test for Goodwill Impairment
.
The Company annually assesses goodwill for impairment on October 31
st
, or more frequently if events and circumstances indicate that goodwill might be impaired. In connection with the Company’s November 1, 2013 acquisition of HCN, the Company recorded
$38.6 million
of goodwill, representing the excess of the purchase price over the amount assigned to the new assets acquired and the fair value assigned to identified intangible assets. The Company also recorded
$3.7 million
of indefinite-lived intangible assets as part of the HCN acquisition.
During the year ended December 31, 2019, the Company used an independent valuation firm to complete interim assessments of goodwill after qualitative analysis indicated that goodwill might be impaired. The valuations performed during the first and third quarters of 2019, determined that the fair value was less than the carrying value. As a result, the Company recorded pretax, non-cash impairment charges of
$7.3 million
during the year ended December 31, 2019.
Indefinite-lived intangible assets are tested at least annually for impairment by comparing the fair value of the asset to the carrying value. APEI utilizes the services of an independent valuation firm to estimate fair value of goodwill and indefinite-lived intangibles. In completing their analysis, the valuation firm uses a discounted cash flow analysis as well as other valuation methods. The discounted cash flow analysis includes significant estimates and assumptions from management, including revenue growth rates, operating margins and future economic and market conditions, among others. Additionally, the valuation firm’s analysis includes significant assumptions with respect to discount rates and assumed royalty rates. If the fair value is less than the carrying value, the asset is reduced to fair value. The
2018
and
2019
annual testing, and
2019
interim testing, concluded the indefinite-lived assets were not impaired.
For additional details regarding goodwill and indefinite-lived intangible assets refer to “Note 6. Goodwill and Intangible Assets” below in these Consolidated Financial Statements.
Valuation of long-lived assets.
The Company accounts for the valuation of long-lived assets under FASB ASC 360,
Accounting for the Impairment or Disposal of Long-Lived Assets.
ASC 360 requires that long-lived assets and certain identifiable definite-lived intangible assets be reviewed for impairment whenever events or changes in circumstances indicate that the carrying amount of an asset may not be recoverable. Recoverability of the long-lived asset is measured by a comparison of the carrying amount of the asset to future undiscounted net cash flows expected to be generated by the asset.
105
If such assets are considered to be impaired, the impairment to be recognized is measured by the amount by which the carrying amount of the assets exceeds the estimated fair value of the assets. Assets to be disposed of are reported at the lower of the carrying amount or fair value, less costs to sell.
Deferred revenue and student deposits.
Deferred revenue and student deposits at
December 31, 2018
and
2019
was
$18.3 million
and
$17.4 million
, respectively. Deferred revenue includes payments that have been received from students for courses that are still in process and student deposits represent cash received from students prior to the commencement of a course and are refundable to the student in the event the student withdrawals before the start of the course. Student deposits at
December 31, 2018
and
2019
were
$8.4 million
and
$7.8 million
, respectively.
Revenue recognition.
The Company adopted FASB ASC 606,
Revenue from Contracts with Customers,
with a date of initial application of January 1, 2018. For periods prior to January 1, 2018, the Company recognized revenue in accordance with the previous accounting standard, ASC 605,
Revenue Recognition
. Under ASC 606, revenue is recognized when evidence of a contract exists, delivery has occurred or as instructional services are delivered, the price is determinable, and collectability is reasonably assured. Revenue from fees is recognized as information or services are delivered to customers, assuming all other revenue recognition criteria are met. For additional information regarding the Company’s adoption of ASC 606 and revenue recognition refer to “Note 3. Revenue” below in these Consolidated Financial Statements.
The Company provides scholarships and technology fee grants to certain students to assist them financially and promote their registration. Scholarship assistance and technology fee grants of
$26.7 million
,
$26.7 million
and
$26.1 million
were provided for the years ended
December 31, 2017
,
2018
and
2019
, respectively, and are included as a reduction to revenue in the accompanying Consolidated Statements of Income.
Advertising costs.
Advertising costs are expensed as incurred during the year pursuant to FASB ASC 720-35. Advertising expenses for the years ended
December 31, 2017
,
2018
and
2019
were
$37.7 million
,
$37.4 million
and
$40.9 million
, respectively, and are included in selling and promotional expenses in the accompanying Consolidated Statements of Income.
Income taxes.
Deferred taxes are determined using the liability method, whereby deferred tax assets are recognized for deductible temporary differences and deferred tax liabilities are recognized for taxable temporary differences. Temporary differences are the differences between the reported amounts of assets and liabilities and their tax basis. As these differences reverse, they will enter into the determination of future taxable income. Deferred tax assets are reduced by a valuation allowance when, in the opinion of management, it is more likely than not that some portion or all of the deferred tax assets will not be realized. Deferred tax assets and liabilities are adjusted for the effects of changes in tax laws and rates on the date of enactment of such changes. As a result of the U.S. Tax Cuts and Jobs Act, or Tax Act, the Company revalued its net deferred tax liability and recorded a
$3.7 million
reduction in income tax expense for the year ended December 31, 2017.
There were no material uncertain tax positions as of
December 31, 2017
,
2018
or
2019
. Interest and penalties associated with uncertain income tax positions would be classified as income tax expense. The Company has not recorded any material interest or penalties during any of the years presented.
Stock-based compensation.
The Company accounts for stock-based compensation in accordance with FASB ASC 718,
Stock Compensation
, which requires companies to expense share-based compensation based on fair value, and adopted ASU 2016-09,
Compensation-Stock Compensation (Topic 718): Improvements to Employee Share-Based Payment Accounting
in January 2017. Stock-based payments may include: incentive stock options or non-qualified stock options, stock appreciation rights, restricted stock, restricted stock units, dividend equivalent rights, performance shares, performance units, cash-based awards, other stock-based awards, including unrestricted shares, or any combination of the foregoing.
Stock-based compensation cost is recognized as expense generally over a
three
-year vesting period using the straight-line method for employees and the graded-vesting method for members of the Board of Directors, and is measured using APEI’s stock price on the date of grant. An accelerated
one
-year period is used to recognize stock-based compensation cost for employees who have reached certain service and retirement eligibility criteria on the date of grant. The fair value of each option award is estimated at the date of grant using a Black-Scholes option-pricing model that uses certain assumptions, which have been noted in “Note 10. Stockholders’ Equity” in these Consolidated Financial Statements. The Company makes assumptions with respect to expected stock price volatility based on the average historical volatility of APEI’s common stock. In addition, the Company determines the risk-free interest rate by selecting the U.S. Treasury constant maturity for the same maturity as the estimated life of the option quoted on an investment basis in effect at the time of grant for that business day.
Judgment is required in estimating the percentage of share-based awards that are expected to vest, and in the case of performance stock units, or PSUs, the level of performance that will be achieved and the number of shares that will be earned. If actual results differ significantly from these estimates, stock-based compensation expense could be higher and have a material impact on the
106
Company’s consolidated financial statements. The Company
estimates forfeitures of share-based awards at the time of grant and revise such estimates in subsequent periods if actual forfeitures differ from original estimates. The forfeiture assumption is ultimately adjusted to the actual forfeiture rate. For additional information regarding stock-based compensation, refer to “Note 10. Stockholders’ Equity” in these Consolidated Financial Statements.
If actual results differ significantly from these estimates, stock-based compensation expense could be higher and have a material impact on the Company’s consolidated financial statements. Estimates of fair value are subjective and are not intended to predict actual future events, and subsequent events are not indicative of the reasonableness of the original estimates of fair value made under ASC 718
.
Income per common share.
Basic net income per common share is based on the weighted average number of shares of common stock outstanding during the period. Diluted net income per common share increases the shares used in the per share calculation by the dilutive effects of options, warrants, and restricted stock.
Fair value of financial instruments.
Cash equivalents are measured and recorded at fair value. The Company also measures certain financial assets at fair value for disclosure purposes, as well as on a nonrecurring basis when they are deemed to be other-than-temporary impairments.
Fair value represents the amount that would be received to sell an asset or paid to transfer a liability in an orderly transaction between market participants. As such, fair value is a market-based measurement that is determined based on assumptions that market participants would use in pricing an asset. Assets recorded at fair value are measured and classified in accordance with a three-tier fair value hierarchy based on the observability of the inputs available in the market used to measure fair value:
Level 1 - inputs to the valuation techniques that are quoted prices in active markets for identical assets or liabilities;
Level 2 - inputs to the valuation techniques that are other than quoted prices but are observable for the assets or liabilities, either directly or indirectly; or
Level 3 - inputs to the valuation techniques that are unobservable for the assets or liabilities.
The fair value hierarchy requires an entity to maximize the use of observable inputs and minimize the use of unobservable inputs when measuring fair value.
The Company’s cash, cash equivalents, and restricted cash, accounts receivable, accounts payable and accrued liabilities are all short-term in nature. As such, their carrying amounts approximate fair value and fall within Level 1 of the fair value hierarchy.
Concentration of credit risk.
The Company maintains its cash, cash equivalents, and restricted cash in bank deposit accounts with various financial institutions. Cash, cash equivalents, and restricted cash balances may exceed the FDIC insurance limit. The Company has historically not experienced any losses in such accounts.
Recent Accounting Pronouncements.
The Company considers the applicability and impact of all ASUs. ASUs issued but not listed below were assessed and determined to be either not applicable or expected to have minimal impact on its consolidated financial position and/or results of operations.
In February 2016, the FASB issued ASU No. 2016-02,
Leases (Topic 842)
. This standard requires entities that lease assets to recognize on the balance sheet the assets and liabilities for the rights and obligations created by those leases in addition to disclosing certain key information about leasing arrangements. Entities may elect not to recognize lease assets and liabilities for most leases with terms of 12 months or less. ASU 2016-02 required lessees and lessors to recognize and measure leases at the beginning of the earliest period presented using a modified retrospective approach. In July 2018, the FASB issued ASU No. 2018-11, which allows companies to apply the requirements of ASU 2016-02 retrospectively, either in all prior periods presented, or through a cumulative adjustment in the year of adoption. This standard is effective for fiscal years, and the interim periods within those fiscal years, beginning after December 15, 2018. Early adoption was permitted. The Company adopted this standard effective January 1, 2019 using a cumulative effect adjustment transition method and recognized an increase in assets and liabilities due to the recording of the required right-of-use-asset and corresponding liability for all lease obligations that were previously classified as operating leases. The increase in assets and liabilities was approximately
$12.1 million
. There was no impact to the Company’s net income or liquidity as a result of the adoption of this ASU.
In June 2016, the FASB issued ASU No. 2016-13,
Financial Instruments - Credit Losses,
which is included in
ASC Topic 326, Measurement of Credit Losses on Financial Instruments
with certain
amendments made to the standard in November 2018 through ASU No. 2018-9,
Codification Improvements to Topic 326, Financial Instruments - Credit Losses.
The new guidance revises the accounting requirements related to the measurement of credit losses and will require entities to measure all expected credit losses for financial assets based on historical experience, current conditions, and reasonable and
107
supportable forecasts about collectability. Assets must be presented in the financial statements at the net amount expected to be collected. The guidance will be effective for the fiscal years beginning after December 15, 2019, including interim periods within those fiscal years. Early adoption was permitted with fiscal years beginning after December 15, 2018. The Company adopted this standard effective January 1, 2020 and does not expect the adoption of this ASU to have a material impact on its Consolidated Financial Statements.
In August 2018, the FASB issued ASU No. 2018-15,
Intangibles - Goodwill and Other - Internal-Use Software (Subtopic 350-40):
Customer’s Accounting for Implementation Costs Incurred in a Cloud Computing Arrangement That is a Service Contract
, which amends ASC 350-40 to address a customer’s accounting for implementation costs incurred in a cloud computing arrangement that is a service contract.
The amendments in this ASU provide clarifications which align the requirements for capitalizing implementation costs incurred in a hosting arrangement that is a service contract with the requirements for capitalizing implementation costs incurred to develop or obtain internal-use software or software licenses. The accounting for the service element of a hosting arrangement that is a service contract is not affected by these amendments. The guidance will be effective for fiscal years beginning after December 15, 2019, including interim periods within those fiscal years. Early adoption was permitted. The Company adopted this standard effective January 1, 2020 using the prospective approach, and will evaluate future implementation costs incurred after January 1, 2020 under the new standard.
Note 3. Revenue
On January 1, 2018, the Company adopted ASC 606,
Revenue from Contracts with Customers,
using the modified retrospective approach. Results for reporting periods beginning after January 1, 2018 are presented under ASC 606, while prior period amounts are not adjusted and continue to be reported in accordance with previous accounting under ASC 605,
Revenue Recognition
.
The following is a description of principal activities from which the Company generates its revenue.
Instructional services
. Instructional services revenue includes tuition, technology, and laboratory fees. The Company generally recognizes revenue ratably as instructional services are provided over the period or term, which is, for APUS, either an eight- or sixteen-week period, and for HCN, a quarterly term. Tuition is charged by course or term, technology fees are charged to APUS students on a per course basis, and technology and laboratory fees are charged to HCN students on a per term basis, when applicable. Generally, instructional services are billed when a course or term begins, and paid within
thirty
days of the bill date.
Graduation fees
. APUS graduation fee revenue represents a one-time, non-refundable
$100
fee per degree, charged to students upon submission of a program graduation application. The fee covers administrative costs associated with completing a review of the student’s academic and financial standing prior to graduation. The Company recognizes revenue once graduation review services are completed. Generally, graduation fees are billed and paid when the student submits the graduation application.
Textbook and other course material fees
. Textbook and other course materials revenue represent fees related to the sale of textbooks and other course materials to HCN students. Revenue is recognized at the beginning of the term when the textbooks and other course materials fees are billed. Payment is generally received within
thirty
days of the bill date. Sales tax collected from students on the sale of textbooks and other course materials is excluded from revenue.
Other fees
. Other fees revenue represents one-time, non-refundable fees such as application, enrollment, transcript, and other miscellaneous fees. Generally other fees revenue is recognized when the fee is charged to the student, which coincides with the completion of the specific performance obligation to the student.
APUS provides a tuition grant to support students who are U.S. Military active-duty service members, National Guard members, reservists, military spouses and dependents, and, until January 2020, veterans, as well as a grant to cover the technology fee for students using Department of Defense, or DoD, tuition assistance programs. APUS and HCN also provide scholarships to certain students to assist them financially with their educational goals.
The statement of retained earnings at January 1, 2018 was adjusted by
$278,000
to reflect the after tax impact of the adoption of ASC 606, related to the recognition of graduation fee revenue at APUS. There were no adjustments to any other revenue type as a result of the adoption of ASC 606. The impact of adoption on the Company’s Consolidated Statement of Income of the twelve months ended December 31, 2018 and 2019 was not material.
108
Disaggregation of Revenue
In the following table, revenue, shown net of grants and scholarships, is disaggregated by type of service provided. The table also includes a reconciliation of the disaggregated revenue with the reportable segments:
|
Twelve Months Ended December 31, 2018
|
|||||||||||||||
|
(In thousands)
|
|||||||||||||||
|
APEI
|
HCN
|
Intersegment
|
Consolidated
|
||||||||||||
|
Instructional services, net of grants and scholarships
|
$
|
258,253
|
|
$
|
32,468
|
|
$
|
—
|
|
$
|
290,721
|
|
|||
|
Graduation fees
|
1,069
|
|
—
|
|
—
|
|
1,069
|
|
|||||||
|
Textbook and other course materials
|
—
|
|
4,678
|
|
—
|
|
4,678
|
|
|||||||
|
Other fees
|
740
|
|
479
|
|
—
|
|
1,219
|
|
|||||||
|
Total Revenue
|
$
|
260,062
|
|
$
|
37,625
|
|
$
|
—
|
|
$
|
297,687
|
|
|||
|
Twelve Months Ended December 31, 2019
|
|||||||||||||||
|
(In thousands)
|
|||||||||||||||
|
APEI
|
HCN
|
Intersegment
|
Consolidated
|
||||||||||||
|
Instructional services, net of grants and scholarships
|
$
|
254,961
|
|
$
|
25,369
|
|
$
|
(108
|
)
|
$
|
280,222
|
|
|||
|
Graduation fees
|
1,138
|
|
—
|
|
—
|
|
1,138
|
|
|||||||
|
Textbook and other course materials
|
—
|
|
3,650
|
|
—
|
|
3,650
|
|
|||||||
|
Other fees
|
800
|
|
460
|
|
—
|
|
1,260
|
|
|||||||
|
Total Revenue
|
$
|
256,899
|
|
$
|
29,479
|
|
$
|
(108
|
)
|
$
|
286,270
|
|
|||
Effective January 1, 2019, the APEI Segment began charging the HCN Segment for the value of courses taken by HCN Segment employees at APUS. The intersegment elimination represents the elimination of this intersegment revenue in consolidation.
Contract Balances and Performance Obligations
The Company has
no
contract assets or deferred contract costs as of
December 31, 2019
.
The Company recognizes a contract liability, or deferred revenue, when a student begins an online course, in the case of APUS, or starts a term, in the case of HCN, and revenue is recognized as described earlier in this footnote. Deferred revenue at
December 31, 2018
was
$18.3 million
and includes
$9.9 million
in future revenue that has not yet been earned for courses and terms that are in progress, as well as
$8.4 million
in consideration received in advance for future courses or terms, or student deposits, and represents the Company’s performance obligation to transfer future instructional services to students. Deferred revenue at
December 31, 2019
was
$17.4 million
and includes
$9.6 million
in future revenue that has not yet been earned for courses and terms that are in progress as well as
$7.8 million
in student deposits.
The Company has elected, as a practical expedient, not to disclose additional information about unsatisfied performance obligations for contracts with customers that have an expected duration of one year or less.
When the Company begins providing the performance obligations, a contract receivable is created, resulting in accounts receivable on the Company’s Consolidated Balance Sheets. The Company accounts for receivables in accordance with ASC 310,
Receivables
. The Company uses the portfolio approach, a practical expedient, to evaluate if a contract exists and to assess collectability at the time of contract inception based on historical experience. Contracts are subsequently reviewed for collectability if significant events or circumstances indicate a change.
The allowance for doubtful accounts is based on management’s evaluation of the status of existing accounts receivable. Among other factors, management considers the age of the receivable, the anticipated source of payment, and historical allowance considerations. Consideration is also given to any specific known risk areas among the existing accounts receivable balances. Recoveries of receivables previously written off are recorded when received. APUS does not charge interest on past due accounts receivable. HCN charges interest on payment plans when a student leaves the payment plan program upon graduation or exit of the program. The interest earned in 2019 was approximately
$15,000
.
109
Refund Policies
The Company provides a stated period of time during which students may withdraw from a course, for APUS, or a term, for HCN, without further financial obligation resulting in a refund liability. The refund policy for each company is as follows:
American Public University System
APUS’s tuition revenue varies from period to period based on the number of students enrolled, the number of net course registrations, the volume of undergraduate versus graduate registrations, and student payor source. Students may remit tuition payments through the online registration process at any time or they may elect various payment options, including payments by sponsors, alternative loans, financial aid, or the DoD tuition assistance program, which remits payments directly to APUS. If one of the various other payment options is confirmed as secured, the student is allowed to start the course. These other payment options can delay the receipt of payment up until the course starts or longer, resulting in the recording of an account receivable at the beginning of each session. Tuition revenue that has not yet been earned by APUS is presented as deferred revenue in the accompanying Consolidated Balance Sheets.
APUS refunds 100% of tuition for courses that are dropped before the conclusion of the first seven days of a course. The Company does not recognize revenue for dropped courses. After a course begins, APUS uses the following refund policy:
|
8-Week Course- Tuition Refund Schedule
|
|||
|
Withdrawal Date
|
Tuition Refund Percentage
|
||
|
Before or During Week 1
|
100%
|
||
|
During Week 2
|
75%
|
||
|
During Weeks 3 through 4
|
50%
|
||
|
During Weeks 5 through 8
|
No Refund
|
||
|
16-Week Course- Tuition Refund Schedule
|
|||
|
Withdrawal Date
|
Tuition Refund Percentage
|
||
|
Before or During Week 1
|
100%
|
||
|
During Week 2
|
100%
|
||
|
During Weeks 3 through 4
|
75%
|
||
|
During Weeks 5 through 8
|
50%
|
||
|
During Weeks 9 through 16
|
No Refund
|
||
Students affiliated with certain organizations may have an alternate refund policy.
If a student withdraws during the academic term, APUS calculates the portion of instructional services and technology fees that are non-refundable based on the tuition refund policy and recognizes it as revenue in the period the withdrawal occurs.
Hondros College of Nursing.
HCN’s tuition revenue varies from period to period based on the number of students enrolled and the programs in which they are enrolled. Students may remit tuition payments at any time, or they may elect various payment options that can delay receipt of payment up until the term starts or longer. These other payment options include payments by sponsors, financial aid, alternative loans, and payment plan options. Beginning July 1, 2018, HCN began offering its students extended payment plan options, and with enrollments beginning in January 2020, HCN will add an additional extended payment program. The extended payment plan options are designed to assist students with educational costs consisting of tuition, textbooks, and fees, and are only available after all other student financial assistance has been applied to those costs. Payment plans require monthly payments while the student is enrolled in a program and extend for a period up to six months after the last day of attendance or graduation. To the extent interest is applied, it is generally fixed and does not accrue until the student departs the program or graduates. The extended payment plan options do not impose any origination fees. Borrowers are advised about the terms of the loans and counseled to use all federal funding options. In addition, beginning January 1, 2020,
110
HCN will begin offering an institutional grant to students demonstrating financial need to cover the difference between the total cost of tuition and fees less the amount of all eligible financial aid resources. The grant is designed to limit a student’s monthly payment to
$200
through an award of up to
$200
per month or
$600
per term after consideration of financial aid, employer tuition reimbursement, and other financial resources.
Generally, financial aid is awarded prior to the start of the term and requests for authorization of disbursement begin in the second week of the term. Tuition revenue that has not yet been earned by HCN is presented as deferred revenue in the accompanying Consolidated Balance Sheets.
HCN’s refund policy complies with the rules of the Ohio State Board of Career Colleges and Schools and is applicable to each term. For a course with an on-campus or other in-person component, the date of withdrawal is determined by a student’s last attended day of clinical offering, laboratory session, or lecture. For an online course, the date of withdrawal is determined by a student’s last submitted assignment in the course. HCN uses the following refund policy:
|
Quarterly Term
|
|||
|
Withdrawal Date
|
Tuition Refund Percentage
|
||
|
Before first full calendar week of the quarter
|
100%
|
||
|
During first full calendar week of the quarter
|
75%
|
||
|
During second full calendar week of the quarter
|
50%
|
||
|
During third full calendar week of the quarter
|
25%
|
||
|
During fourth full week of the quarter
|
No Refund
|
||
If a student withdraws during the term, HCN calculates the portion of tuition that is non-refundable based on the tuition refund policy and recognizes it as revenue in the period the withdrawal occurs.
Refund Liability
APUS uses the portfolio approach and applies the expected value method to determine if a refund liability exists. This requires management judgment and the use of estimates and historical data to assess the likelihood and magnitude of a revenue reversal due to a refund liability. Due to the short duration of the courses, and the refund policy described above, any uncertainty regarding a student’s withdrawal is resolved in a short time period. Based on measurement and analysis, the Company determined that a significant reversal in the cumulative amount of revenue recognized is not expected. The Company includes this estimate in the transaction price. At
December 31, 2018
and
2019
, there was approximately
$12,000
and
$9,000
, respectively, of refund liabilities for APUS included in deferred revenue. APUS updates the measurement of the refund liability at the end of each reporting period for changes in expectations, and if the reversal becomes significant, recognizes corresponding adjustments to revenue.
Because each HCN term coincides with the Company’s fiscal quarter period, there is
no
refund liability as of
December 31, 2018
and
December 31, 2019
.
111
Note 4. Property and Equipment
Property and equipment at
December 31, 2018
and
2019
consisted of the following:
|
Useful
Life |
2018
|
2019
|
||||||||
|
|
|
(in thousands)
|
||||||||
|
Land
|
—
|
$
|
9,244
|
|
$
|
9,244
|
|
|||
|
Building and building improvements
|
15 - 39 years
|
54,496
|
|
54,592
|
|
|||||
|
Leasehold improvements
|
up to 15 years
|
1,473
|
|
1,536
|
|
|||||
|
Office equipment
|
5 years
|
2,240
|
|
911
|
|
|||||
|
Computer equipment
|
3 years
|
25,618
|
|
22,090
|
|
|||||
|
Furniture and fixtures
|
7 years
|
8,391
|
|
9,035
|
|
|||||
|
Other capital assets
|
5 years
|
128
|
|
128
|
|
|||||
|
Software development
|
5 years
|
87,058
|
|
87,774
|
|
|||||
|
Program development
|
3 years
|
12,597
|
|
13,103
|
|
|||||
|
|
|
201,245
|
|
198,413
|
|
|||||
|
Accumulated depreciation and amortization
|
|
114,364
|
|
119,918
|
|
|||||
|
|
|
$
|
86,881
|
|
$
|
78,495
|
|
|||
The Company disposed of long-lived assets resulting in a loss of
$2.1 million
,
$0.9 million
, and
$0.6 million
during the years ended December 31, 2017, 2018, and 2019, respectively. The loss was primarily related to assets no longer in use. The losses on long-lived assets are included as loss on disposals of long-lived assets in these Consolidated Financial Statements.
During the years ended
December 31, 2017
,
2018
and
2019
, the Company recorded depreciation expense of
$18.2 million
,
$16.9 million
and
$15.3 million
, respectively. In addition, the Company recorded amortization expense related to other assets of
$0.6 million
,
$0.6 million
, and
$0.3 million
during the years ended
December 31, 2017
,
2018
and
2019
, respectively.
Note 5. Investments
On September 30, 2012, the Company made a
$6.8 million
investment in preferred stock, treated as in-substance common stock, of NWHW Holdings, Inc., or NWHW Holdings, a holding company that operates an information technology training company, New Horizons Worldwide, Inc., or New Horizons, representing approximately
20%
of the fully diluted equity of NWHW Holdings. The Company initially accounted for its investment in New Horizons under ASC 323,
Investments - Equity Method and Joint Ventures
. Therefore, the Company recorded the investment at cost and recognized its share of earnings or losses in the investee in the periods for which they were reported with a corresponding adjustment in the carrying amount of the investment. During the first quarter of 2019, the Company determined that it no longer qualified to account for its investment in NWHW Holdings under ASC 323 because the Company is unable to exercise significant influence over operating and financial policies of NWHW Holdings; therefore, the Company elected to account for the investment under ASC 321,
Equity Investments
. Under ASC 321, for each reporting period, the Company completes a qualitative assessment considering impairment indicators to evaluate whether the investment is impaired. There were no indicators of impairment for the year ended
December 31, 2019
. Earnings or losses that were previously recorded remain as part of the carrying amount of the investment. As of
December 31, 2018
and
2019
, the carrying value of the investment was approximately
$6.7 million
and
$5.2 million
, respectively.
On February 20, 2013, the Company made a
$4.0 million
investment in preferred stock of Fidelis Education, Inc., or Fidelis Education, representing approximately
22%
of its fully diluted equity. On February 1, 2016, the Company made an additional
$950,000
investment in preferred stock increasing its investment in Fidelis Education to approximately
23%
of its fully diluted equity. Fidelis Education offers a learning relationship management platform that has the goal of improving education advising and career mentoring services offered to students as they pursue college degrees. In connection with the investment, the Company is entitled to certain rights, including the right to representation on the Board of Directors of Fidelis Education. The Company accounts for its investment in Fidelis Education under ASC 323,
Investments - Equity Method and Joint Ventures
. Therefore, the Company recorded the investment at cost and recognizes its share of earnings or losses in the investee in the periods for which they are reported with a corresponding adjustment in the carrying amount of the investment. During the fourth quarter of 2017, the Company determined that the fair value of its investment in Fidelis Education was less
112
than its carrying value and that the impairment was other-than-temporary. As a result, an approximately
$2.2 million
non-cash impairment charge was recorded for the year ended December 31, 2017. This impairment charge is included in equity investment loss in the Consolidated Statements of Income. As of
December 31, 2018
and
2019
, the carrying value of the investment was approximately
$1.2 million
and
$1.1 million
, respectively.
On April 2, 2014, the Company made a
$1.5 million
investment in preferred stock of Second Avenue Software, Inc., or Second Avenue Software, representing approximately
26%
of its fully diluted equity. Second Avenue Software is a game-based education software company that develops software on a proprietary and “work-for-hire” basis. The Company initially accounted for its investment in Second Avenue under ASC 323,
Investments - Equity Method and Joint Ventures
. Therefore, the Company recorded the investment at cost and recognized its share of earnings or losses in the investee in the periods for which they were reported with a corresponding adjustment in the carrying amount of the investment. During the fourth quarter of 2017 and 2018, the Company determined that the fair value of its investment in Second Avenue Software was less than its carrying value and that the impairment was other-than-temporary. As a result, the Company recorded approximately
$0.2 million
and
$0.1 million
pretax non-cash impairment charges for the years ended
December 31, 2017
and
2018
, respectively. These impairment charges are included in equity investment loss in the Consolidated Statements of Income. During the first quarter of
2019
, the Company determined that it no longer qualified to account for its investment in Second Avenue Software under ASC 323 because the Company is no longer able to exercise significant influence over operating and financial policies of Second Avenue Software; therefore, the Company has elected to account for the investment under ASC 321,
Equity Investments
. Under ASC 321, for each reporting period, the Company completes a qualitative assessment considering impairment indicators to evaluate whether the investment is impaired. There were no indicators of impairment for the year ended
December 31, 2019
. Earnings or losses that were previously recorded remain as part of the carrying amount of the investment. The carrying value of the investment is approximately
$0.8 million
as of
December 31, 2018
and
2019
.
On December 21, 2015, the Company made a
$3.5 million
investment in preferred stock of RallyPoint, an online social network for members of the military, representing approximately
14%
of its fully diluted equity. The Company accounts for its investment in RallyPoint using ASC 321,
Investments - Equity Securities
. On October 24, 2017, the Company made an additional
$0.3 million
investment in preferred stock of Rally Point. Subsequent to the additional investment, the Company’s fully diluted ownership was unchanged. Under ASC 321, for each reporting period, the Company completes a qualitative assessment considering impairment indicators to evaluate whether the investment is impaired. During the year ended
December 31, 2018
, the Company determined that impairment indicators existed and utilized an independent valuation firm to assess the fair value of the investment. The assessment concluded that the fair value of its investment was less than the carrying amount resulting in a pretax non-cash impairment charge of approximately
$0.5 million
. This impairment charge is included in equity investment loss in the Consolidated Statements of Income. There was
no
impairment for the year ended
December 31, 2019
. The carrying value of the investment was approximately
$3.3 million
as of
December 31, 2018
and
2019
.
The Company evaluated its equity method investment for impairment as of
December 31, 2019
and determined the investment was not impaired. During the years ended
December 31, 2017
, and
2018
, the Company recorded impairment charges of approximately
$2.4 million
, and
$0.1 million
on its equity method investments, respectively.
The Company evaluated its cost method investments for impairment as of
December 31, 2019
and determined none of the investments were impaired. During the years ended
December 31, 2017
and
2018
the Company recorded impairment charges of approximately
$0.3 million
and
$0.5 million
on its cost method investments, respectively.
The aggregate carrying amount of the Company’s investments accounted for under ASC 321,
Investments - Equity Securities
, presented on its Consolidated Balance Sheet on a one-line basis as “Investments”, was approximately
$3.3 million
and
$9.4 million
as of
December 31, 2018
and
2019
, respectively.
Note 6. Goodwill and Intangible Assets
In connection with its November 1, 2013 acquisition of HCN, the Company applied ASC 805, Business Combinations, using the acquisition method of accounting. The Company recorded $
38.6 million
of goodwill, representing the excess of the purchase price over the amount assigned to the net assets acquired and the fair value assigned to identified intangible assets, and recorded
$8.1 million
of identified intangible assets.
The Company accounts for goodwill and indefinite-lived intangible assets in accordance with FASB ASC 350,
Intangibles Goodwill and Other,
and in 2018 adopted ASU 2017-04,
Intangibles - Goodwill and Other (Topic 350): Simplifying the Test for Goodwill Impairment
.
The Company annually assesses goodwill for impairment on October 31
st
, or more frequently if events and circumstances indicate that goodwill might be impaired. Goodwill impairment testing consists of an
113
optional qualitative assessment as well as a quantitative test. The quantitative test compares the fair value of the reporting unit to its carrying value. If the carrying value of the reporting unit is greater than zero and its fair value is greater than its carrying amount, there is no impairment. If the carrying value is greater than the fair value, the difference between the two values is recorded as an impairment.
In addition to goodwill, HCN recorded identified intangible assets with an indefinite useful life in the aggregate amount of
$3.7 million
, which includes trade names, accreditation, licensing and Title IV, and affiliate agreements, and recorded
$4.4 million
of identified intangible assets with a definite useful life. At the acquisition date, the useful life assigned to each type of intangible asset with a definite useful life was as follows:
|
Useful Life
|
|
|
Student contracts and relationships
|
6 years
|
|
Curricula
|
3 years
|
|
Non-compete agreements
|
5 years
|
At
December 31, 2019
, all identified intangible assets with a useful life were fully amortized.
During the year ended
December 31, 2019
, as a result of circumstances that included HCN’s continued underperformance against revised 2019 internal targets and overall 2019 financial performance, the Company completed interim goodwill impairment tests during the first and third quarters. The implied fair value of goodwill was calculated and compared to the recorded goodwill, and the Company determined the fair value of goodwill was
$26.6 million
, or
$7.3 million
less than its carrying value. There was
no
impairment of the intangible assets. As a result, the Company recorded a pretax, non-cash charge of
$7.3 million
to reduce the carrying value of its goodwill in the HCN Segment during 2019.
The Company engaged an independent valuation firm to assist with the valuation and determination of the fair value of HCN for both assessments. The independent valuation firm weighted the results of four different valuation methods: (1) discounted cash flows; (2) guideline company; (3) guideline transaction for comparable transactions; and (4) guideline transaction for private equity transactions. Under the discounted cash flow method, cash flows were discounted by an estimated risk weighted average cost of capital, which was intended to reflect the overall level of inherent risk of HCN. Under the guideline company method, valuation metrics from other education companies were used to determine the value. Under the comparable transaction method, pricing terms from other transactions in the higher education market were used to determine the value. Under the private equity method, pricing terms from private equity transactions were used to determine the value. Values derived under the four valuation methods were then weighted to estimate HCN’s enterprise value.
The goodwill impairment charges recorded in the quarters ended March 31, 2019 and September 30, 2019 eliminated the difference between the fair value of goodwill and the carrying value of goodwill. As such, future changes, including even minor changes in revenue, operating income, market multiples, discount rates, and other inputs to the valuation process may result in future impairment charges and those charges could be material.
As of October 31, 2018 and 2019, the Company completed its annual assessment of goodwill and concluded that HCN’s fair value was more than the carrying value; consequently, there was
no
impairment. The Company’s October 31, 2019 annual assessment concluded that the fair value of HCN exceeded the carrying value by approximately
4%
, or
$1.5 million
.
Changes in the carrying amount of goodwill by reportable segment during the year ended
December 31, 2019
are as follows (in thousands):
|
APEI Segment
|
HCN Segment
|
Total Goodwill
|
|||||||||
|
Goodwill as of December 31, 2018
|
$
|
—
|
|
$
|
33,899
|
|
$
|
33,899
|
|
||
|
Impairment
|
—
|
|
(7,336
|
)
|
(7,336
|
)
|
|||||
|
Goodwill as of December 31, 2019
|
$
|
—
|
|
$
|
26,563
|
|
$
|
26,563
|
|
||
There were no changes in the carrying amount of goodwill by reportable segment during the years ended
December 31, 2017
and
2018
.
114
Other intangible assets, included in Other Assets on the Consolidated Balance Sheets in these Consolidated Financial Statements, consist of the following as of
December 31, 2018
(in thousands):
|
2018
|
|||||||||||
|
Gross Carrying Amount
|
Accumulated Amortization
|
Net Carrying Amount
|
|||||||||
|
Finite-lived intangible assets
|
|||||||||||
|
Curricula
|
$
|
405
|
|
$
|
405
|
|
$
|
—
|
|
||
|
Non-compete agreements
|
86
|
|
86
|
|
—
|
|
|||||
|
Student contracts and relationships
|
3,870
|
|
3,548
|
|
322
|
|
|||||
|
Total finite-lived intangible assets
|
4,361
|
|
4,039
|
|
322
|
|
|||||
|
Indefinite-lived intangible assets
|
|||||||||||
|
Trade name
|
1,998
|
|
—
|
|
1,998
|
|
|||||
|
Accreditation, licensing and Title IV
|
1,686
|
|
—
|
|
1,686
|
|
|||||
|
Affiliation agreements
|
37
|
|
—
|
|
37
|
|
|||||
|
Total indefinite-lived intangible assets
|
3,721
|
|
—
|
|
3,721
|
|
|||||
|
Total intangible assets
|
$
|
8,082
|
|
$
|
4,039
|
|
$
|
4,043
|
|
||
Other intangible assets consist of the following as of
December 31, 2019
(in thousands):
|
2019
|
|||||||||||
|
|
Gross Carrying Amount
|
Accumulated Amortization
|
Net Carrying Amount
|
||||||||
|
Finite-lived intangible assets
|
|||||||||||
|
Curricula
|
$
|
405
|
|
$
|
405
|
|
$
|
—
|
|
||
|
Non-compete agreements
|
86
|
|
86
|
|
—
|
|
|||||
|
Student contracts and relationships
|
3,870
|
|
3,870
|
|
—
|
|
|||||
|
Total finite-lived intangible assets
|
4,361
|
|
4,361
|
|
—
|
|
|||||
|
Indefinite-lived intangible assets
|
|||||||||||
|
Trade name
|
1,998
|
|
—
|
|
1,998
|
|
|||||
|
Accreditation, licensing and Title IV
|
1,686
|
|
—
|
|
1,686
|
|
|||||
|
Affiliation agreements
|
37
|
|
—
|
|
37
|
|
|||||
|
Total indefinite-lived intangible assets
|
3,721
|
|
—
|
|
3,721
|
|
|||||
|
Total intangible assets
|
$
|
8,082
|
|
$
|
4,361
|
|
$
|
3,721
|
|
||
Identified intangible assets are amortized in a manner that reflects the estimated economic benefit of the intangible assets. Curricula and Non-compete agreements were amortized on a straight-line basis. Student contracts and relationships were amortized using an accelerated method.
Determining the fair value of HCN requires judgment and the use of significant estimates and assumptions, including fluctuations in enrollments, revenue growth rates, EBITDA margins, discount rates, and future market conditions, among others. Given the current competitive and regulatory environment, and the uncertainties regarding the related impact on HCN’s business, there can be no assurance that the estimates and assumptions made for purposes of the Company’s interim and annual goodwill impairment tests will prove to be accurate predictions of the future. If the Company’s assumptions are not realized, the Company may record additional goodwill impairment charges in future periods. It is not possible at this time to determine if any such future impairment charge would result or whether such charge would be material.
115
Note 7. Leases
The Company has operating leases for office space and campus facilities. Some leases include options to terminate or extend for one or more years. These options are included in the lease term when it is reasonably certain that the option will be exercised.
Operating lease assets are ROU assets, which represent the right to use an underlying asset for the lease term. Operating lease liabilities represent the obligation to make lease payments arising from the lease. Operating leases are included in the Operating lease assets, net, and Operating lease liabilities, current and long-term on the Consolidated Balance Sheet as of
December 31, 2019
. These assets and lease liabilities are recognized at the lease commencement date based on the present value of lease payments over the lease term. When the lease does not provide an implicit interest rate, the Company uses an incremental borrowing rate based on information available at lease commencement to determine the present value of the lease payments. The ROU asset includes all lease payments and excludes lease incentives.
Lease expense for operating leases is recognized on a straight-line basis over the lease term. There are
no
variable lease payments. Lease expense for the year ended
December 31, 2019
was approximately
$2.6 million
. These costs are primarily related to long-term operating leases, but also include amounts for short-term leases with terms greater than 30 days that are not material.
The following tables present information about the amount and timing of cash flows arising from the Company’s operating leases as of
December 31, 2019
(dollars in thousands):
|
Maturity of Lease Liabilities
|
Lease Payments
|
||
|
2020
|
2,835
|
|
|
|
2021
|
2,903
|
|
|
|
2022
|
2,857
|
|
|
|
2023
|
1,909
|
|
|
|
2024
|
928
|
|
|
|
2025 and beyond
|
2,239
|
|
|
|
Total future minimum lease payments
|
$
|
13,671
|
|
|
Less imputed interest
|
(1,893
|
)
|
|
|
Present value of operating lease liabilities
|
$
|
11,778
|
|
|
Balance Sheet Classification
|
|||
|
Operating lease liabilities, current
|
$
|
2,283
|
|
|
Operating lease liabilities, long-term
|
9,495
|
|
|
|
Total operating lease liabilities
|
$
|
11,778
|
|
|
Other Information
|
||
|
Weighted average remaining lease term (in years)
|
5.53
|
|
|
Weighted average discount rate
|
5.1
|
%
|
The APEI Segment leases corporate and administrative office space in Maryland and Virginia under operating leases that expire through
June 2023
. Lease expense related to the APEI Segment’s operating leases was
$0.7 million
,
$0.6 million
and
$0.5 million
for the years ended
December 31, 2017
,
2018
and
2019
, respectively. HCN operates
five
campuses, which are located in the suburban areas of Cincinnati, Cleveland, Columbus, Dayton, and Toledo, Ohio, a new campus planned in Indianapolis, Indiana is expected to open in the second quarter of 2020, and one administrative office in suburban Columbus under operating leases that expire through
June 2029
. Lease expense related to the HCN Segment’s operating leases was
$2.7 million
,
$2.8 million
, and
$2.1 million
for the years ended
December 31, 2017
,
2018
and
2019
, respectively. A majority of the leases provide for the payment of taxes, maintenance, insurance and certain other operating expenses applicable to the leased premises.
116
Note 8. Income Taxes
The components of income tax expense for the years ended
December 31, 2017
,
2018
and
2019
were as follows (in thousands):
|
|
2017
|
2018
|
2019
|
|||||||||
|
|
|
|
||||||||||
|
Current income tax expense:
|
|
|
|
|
|
|
||||||
|
Federal
|
$
|
11,989
|
|
$
|
8,034
|
|
$
|
5,803
|
|
|||
|
State
|
1,998
|
|
2,170
|
|
1,425
|
|
||||||
|
13,987
|
|
10,204
|
|
7,228
|
|
|||||||
|
Deferred tax expense:
|
|
|
|
|
|
|
||||||
|
Federal
|
(2,810
|
)
|
(776
|
)
|
(1,766
|
)
|
||||||
|
State
|
316
|
|
(141
|
)
|
(275
|
)
|
||||||
|
|
(2,494
|
)
|
(917
|
)
|
(2,041
|
)
|
||||||
|
Income Tax Expense
|
$
|
11,493
|
|
$
|
9,287
|
|
$
|
5,187
|
|
|||
The tax effects of principal temporary differences are as follows (in thousands):
|
|
2018
|
2019
|
||||||
|
|
||||||||
|
Deferred tax assets
|
|
|
|
|
||||
|
Operating lease liability
|
$
|
—
|
|
$
|
2,912
|
|
||
|
Allowance for doubtful accounts
|
1,637
|
|
1,528
|
|
||||
|
Restricted stock
|
1,625
|
|
1,232
|
|
||||
|
Accrued vacation and severance
|
571
|
|
660
|
|
||||
|
Investment
|
35
|
|
304
|
|
||||
|
Other
|
32
|
|
232
|
|
||||
|
Deferred rent
|
71
|
|
—
|
|
||||
|
Stock option compensation expense
|
—
|
|
1
|
|
||||
|
Total deferred tax assets
|
3,971
|
|
6,869
|
|
||||
|
Deferred tax liabilities
|
||||||||
|
Income tax deductible capitalized software development costs
|
(4,701
|
)
|
(3,330
|
)
|
||||
|
Operating lease asset
|
—
|
|
(2,882
|
)
|
||||
|
Property and equipment
|
(1,484
|
)
|
(1,670
|
)
|
||||
|
Prepaid expenses
|
(1,259
|
)
|
(1,607
|
)
|
||||
|
Goodwill and intangibles
|
(1,891
|
)
|
(771
|
)
|
||||
|
Total deferred tax liabilities
|
(9,335
|
)
|
(10,260
|
)
|
||||
|
Deferred tax liabilities, net
|
$
|
(5,364
|
)
|
$
|
(3,391
|
)
|
||
Income tax expense differs from the amount of tax determined by applying the United States Federal income tax rates to pretax income and loss due to the application of state apportionment laws, permanent tax differences, and the impact of the change in the federal statutory rate as follows (in thousands):
117
|
|
2017
|
2018
|
2019
|
||||||||||||||||||
|
|
Amount
|
%
|
Amount
|
%
|
Amount
|
%
|
|||||||||||||||
|
|
|
|
|
|
|||||||||||||||||
|
Tax expense at statutory rate
|
$
|
11,415
|
|
35.00
|
%
|
$
|
7,320
|
|
21.00
|
%
|
$
|
3,192
|
|
21.00
|
%
|
||||||
|
State taxes, net
|
1,626
|
|
4.98
|
%
|
1,575
|
|
4.51
|
%
|
852
|
|
5.60
|
%
|
|||||||||
|
Permanent differences
|
2,060
|
|
6.31
|
%
|
433
|
|
1.24
|
%
|
244
|
|
1.61
|
%
|
|||||||||
|
Change in statutory rate
|
(3,741
|
)
|
(11.47
|
)%
|
—
|
|
—
|
%
|
—
|
|
—
|
%
|
|||||||||
|
Equity-based compensation benefits
|
—
|
|
—
|
%
|
(126
|
)
|
(0.36
|
)%
|
371
|
|
2.44
|
%
|
|||||||||
|
Post-employment benefits
|
—
|
|
—
|
%
|
—
|
|
—
|
%
|
345
|
|
2.27
|
%
|
|||||||||
|
Uncertain tax position
|
—
|
|
—
|
%
|
154
|
|
0.44
|
%
|
93
|
|
0.61
|
%
|
|||||||||
|
Valuation allowance on capital loss
|
—
|
|
—
|
%
|
—
|
|
—
|
%
|
213
|
|
1.40
|
%
|
|||||||||
|
Other
|
133
|
|
0.42
|
%
|
(69
|
)
|
(0.19
|
)%
|
(123
|
)
|
(0.80
|
)%
|
|||||||||
|
|
$
|
11,493
|
|
35.24
|
%
|
$
|
9,287
|
|
26.64
|
%
|
$
|
5,187
|
|
34.13
|
%
|
||||||
On December 22, 2017 the Tax Act was enacted by the U.S. government. Among other provisions, the Tax Act reduced the federal corporate tax rate to 21% from the existing maximum rate of 35%, effective January 1, 2018. The Company recorded a tax benefit of
$3.7 million
related to the revaluation of its net deferred tax liabilities for the year ended December 31, 2017.
Permanent differences in the table above are mainly attributable to executive and stock compensation, minority investment earnings and/or losses including other-than-temporary impairment charges, nondeductible meals and entertainment expenses, and non-deductible employer contributions to the American Public Education, Inc. Employee Stock Purchase Plan, or ESPP.
There were no material uncertain tax positions as of
December 31, 2017
,
2018
or
2019
. Interest and penalties associated with uncertain income tax positions would be classified as income tax expense. The Company has not recorded any material interest or penalties during any of the years presented.
The Company is subject to U.S. federal income taxes as well as income tax of multiple state jurisdictions. For U.S. federal and state tax purposes, tax years
2016
-
2018
remain open to examination.
Note 9. Other Employee Benefits
The Company has established a tax deferred 401(k) retirement plan that provides retirement benefits to its eligible employees. Participants may elect to contribute up to
60%
of their gross annual earnings not to exceed ERISA and IRS limits. The plan provides for Company discretionary profit sharing contributions at matching percentages. Employees immediately vest
100%
in all salary reduction contributions and employer contributions.
The Company made discretionary contributions to the plan of
$3.8 million
,
$3.7 million
and
$3.7 million
for the years ended
December 31, 2017
,
2018
and
2019
, respectively.
118
In November 2007, the Company adopted the American Public Education, Inc. Employee Stock Purchase Plan, or the ESPP, which was implemented effective July 1, 2008 with quarterly enrollment periods. Eligible participants may only enter the plan and establish their withholdings at the start of an enrollment period. Participating employees may withdraw from the plan and end payroll deductions at any time up to
five
days before the share purchase date and funds will be returned to them. Under the ESPP, participating employees may purchase shares of the Company’s common stock, subject to certain limitations, at
85%
of its fair market value on the last day of the quarterly period. The total value of contributions per participant may not exceed
$21,000
annually or the value of the common stock purchased per participant cannot exceed
$25,000
. There were initially
100,000
shares of common stock available for purchase by participating employees under the ESPP. On June 13, 2014, the Company’s stockholders approved an amendment to the ESPP to increase the number of shares of the Company’s common stock available for issuance under the plan by
100,000
shares, extend the term of the ESPP to March 7, 2024, and make other administrative changes. Shares purchased in the open market for issuance to employees pursuant to the plan for the years ended
December 31, 2017
,
2018
and
2019
were as follows:
|
Purchase Date
|
Shares
|
Common Stock
Fair Value
|
Purchase Price
|
Compensation Expense
|
|||||||||||
|
March 31, 2017
|
4,161
|
|
$
|
22.90
|
|
$
|
19.47
|
|
$
|
14,272
|
|
||||
|
June 30, 2017
|
3,535
|
|
$
|
23.65
|
|
$
|
20.10
|
|
$
|
12,549
|
|
||||
|
September 30, 2017
|
4,613
|
|
$
|
21.15
|
|
$
|
17.98
|
|
$
|
14,623
|
|
||||
|
December 31, 2017
|
3,065
|
|
$
|
25.80
|
|
$
|
21.93
|
|
$
|
11,862
|
|
||||
|
Total/Weighted Average
|
15,374
|
|
$
|
23.13
|
|
$
|
19.66
|
|
$
|
53,306
|
|
||||
|
March 31, 2018
|
1,931
|
|
$
|
42.15
|
|
$
|
35.83
|
|
$
|
12,209
|
|
||||
|
June 30, 2018
|
1,661
|
|
$
|
43.15
|
|
$
|
36.68
|
|
$
|
10,751
|
|
||||
|
September 30, 2018
|
2,779
|
|
$
|
32.17
|
|
$
|
27.34
|
|
$
|
13,410
|
|
||||
|
December 31, 2018
|
2,475
|
|
$
|
28.46
|
|
$
|
24.19
|
|
$
|
10,566
|
|
||||
|
Total/Weighted Average
|
8,846
|
|
$
|
35.37
|
|
$
|
30.07
|
|
$
|
46,936
|
|
||||
|
March 31, 2019
|
2,905
|
|
$
|
30.74
|
|
$
|
26.13
|
|
$
|
13,395
|
|
||||
|
June 30, 2019
|
2,465
|
|
$
|
29.35
|
|
$
|
24.94
|
|
$
|
10,873
|
|
||||
|
September 30, 2019
|
4,511
|
|
$
|
22.34
|
|
$
|
18.99
|
|
$
|
15,116
|
|
||||
|
December 31, 2019
|
3,339
|
|
$
|
27.39
|
|
$
|
23.28
|
|
$
|
13,723
|
|
||||
|
Total/Weighted Average
|
13,220
|
|
$
|
26.77
|
|
$
|
22.75
|
|
$
|
53,107
|
|
||||
Note 10. Stockholders’ Equity
Stock Incentive Plans
The American Public Education, Inc. 2017 Omnibus Incentive Plan, or 2017 Incentive Plan, became effective on May 12, 2017, or the Effective Date. Upon effectiveness of the 2017 Incentive Plan, the Company ceased making awards under the American Public Education, Inc. 2011 Omnibus Incentive Plan, or the 2011 Incentive Plan. The 2017 Incentive Plan allows the Company to grant up to
1,675,000
shares, as well as shares of the Company’s common stock that were available for issuance under the 2011 Incentive Plan as of the Effective Date. In addition, the number of shares of common stock available under the 2017 Incentive Plan will be increased from time to time by the number of shares subject to outstanding awards granted under the 2011 Incentive Plan that terminate by expiration, forfeiture, cancellation or otherwise without issuance of such shares following the Effective Date. The 2017 Incentive Plan includes a provision that allows individuals who have reached certain service and retirement eligibility criteria on the date of grant an accelerated service period of
one
year. The Company recognizes compensation expense for these individuals over the accelerated period.
Restricted Stock and Restricted Stock Unit Awards
The fair value of APEI’s restricted stock and restricted stock unit awards is calculated based on the closing price of APEI’s stock on the date of grant. The estimated fair value of these awards is recognized as stock-based compensation expense and is expensed over the vesting period using the straight-line method for Company employees and the graded-vesting method for members of the Board of Directors. APEI recognizes the estimated fair value of performance-based restricted stock units by assuming the satisfaction of any performance-based objectives at the “target” level, which is the most probable outcome determined for accounting purposes at the time of grant, and multiplying the corresponding number of shares earned based upon
119
such achievement by the closing price of APEI’s stock on the date of grant. To the extent performance goals are not met, compensation cost is not ultimately recognized against the goals and, to the extent previously recognized, compensation cost is reversed. The Company also estimates forfeitures of share-based awards at the time of grant and revises such estimates in subsequent periods if actual forfeitures differ from original estimates.
The table below sets forth the restricted stock and restricted stock unit activity for the year ended
December 31, 2017
:
|
Number
of Shares
|
Weighted
Average Grant
Price and Fair Value
|
||||||
|
Non vested, December 31, 2016
|
437,971
|
|
$
|
21.54
|
|
||
|
Shares granted
|
279,729
|
|
23.35
|
|
|||
|
Vested shares
|
(212,984
|
)
|
25.98
|
|
|||
|
Shares forfeited
|
(43,454
|
)
|
21.04
|
|
|||
|
Non vested, December 31, 2017
|
461,262
|
|
$
|
20.91
|
|
||
The table below sets forth the restricted stock and restricted stock unit activity for the year ended
December 31, 2018
:
|
Number
of Shares
|
Weighted
Average Grant
Price and Fair Value
|
||||||
|
Non vested, December 31, 2017
|
461,262
|
|
$
|
20.91
|
|
||
|
Shares granted
|
302,781
|
|
27.00
|
|
|||
|
Vested shares
|
(222,069
|
)
|
21.33
|
|
|||
|
Shares forfeited
|
(51,632
|
)
|
22.94
|
|
|||
|
Non vested, December 31, 2018
|
490,342
|
|
$
|
24.23
|
|
||
The table below sets forth the restricted stock and restricted stock unit activity for the year ended
December 31, 2019
:
|
Number
of Shares
|
Weighted
Average Grant
Price and Fair Value
|
||||||
|
Non vested, December 31, 2018
|
490,342
|
|
$
|
24.23
|
|
||
|
Shares granted
|
333,635
|
|
29.48
|
|
|||
|
Vested shares
|
(255,918
|
)
|
22.98
|
|
|||
|
Shares forfeited
|
(21,119
|
)
|
26.86
|
|
|||
|
Non vested, December 31, 2019
|
546,940
|
|
$
|
27.81
|
|
||
There were no shares of restricted stock or restricted stock units excluded in the computation of diluted net income per share for the year ended
December 31, 2017
. There were
35,688
and
37,738
shares of restricted stock or restricted stock units excluded in the computation of diluted net income per common share for the years ended
December 31, 2018
and 2019, respectively.
At
December 31, 2019
, total unrecognized compensation expense in the amount of
$7.3 million
relates to non-vested restricted stock, restricted stock units, and stock options, which will be recognized over a weighted average period of
1.8
years.
As a result of termination of employment, the Company accepted the following common shares for forfeiture:
43,454
shares for
$914,272
in
2017
,
48,814
shares for
$1,118,842
in
2018
, and
17,825
shares for
$488,974
in
2019
.
Option Awards
The fair value of each option award is estimated at the date of grant using a Black-Scholes option-pricing model. The Company makes assumptions with respect to expected stock price volatility based on the average historical volatility of the Company’s common stock. In addition, the Company determines the risk-free interest rate by selecting the U.S. Treasury constant maturity
for the same maturity as the estimated life of the option
, quoted on an investment basis in effect at the time of
120
grant for that business day. Estimates of fair value are subjective and are not intended to predict actual future events, and subsequent events are not necessarily indicative of the reasonableness of the original estimates of fair value made under
FASB ASC Topic 718.
Prior to 2012, the Company issued a mix of stock options and restricted stock, but since 2011 the Company did
no
t issue any stock options until 2019 when options were issued to the Company’s new Chief Executive Officer. Options currently outstanding vest ratably over a period of
three
years and expire in
ten
years from the date of grant.
A summary of the status of the Company’s Stock Incentive Plans as of
December 31, 2017
and the changes during the periods then ended is as follows:
|
Number
of Options
|
Weighted
Average Exercise
Price
|
Weighted
Average
Contractual
Life (years)
|
Aggregate
Intrinsic
Value
|
||||||||||
|
|
|
|
(in thousands)
|
||||||||||
|
Outstanding, December 31, 2016
|
259,969
|
|
$
|
34.68
|
|
|
|
||||||
|
Options granted
|
—
|
|
—
|
|
|
|
|||||||
|
Awards exercised
|
(14,002
|
)
|
6.99
|
|
|
|
|||||||
|
Options forfeited
|
(136,351
|
)
|
35.24
|
|
|
|
|||||||
|
Outstanding, December 31, 2017
|
109,616
|
|
$
|
37.52
|
|
0.01
|
$
|
—
|
|
||||
|
Exercisable, December 31, 2017
|
109,616
|
|
$
|
37.52
|
|
0.01
|
$
|
—
|
|
||||
A summary of the status of the Company’s Stock Incentive Plans as of
December 31, 2018
and the changes during the periods then ended is as follows:
|
Number
of Options
|
Weighted
Average Exercise
Price
|
Weighted
Average
Contractual
Life (years)
|
Aggregate
Intrinsic
Value
|
||||||||||
|
|
|
|
(in thousands)
|
||||||||||
|
Outstanding, December 31, 2017
|
109,616
|
|
$
|
37.52
|
|
|
|
||||||
|
Options granted
|
—
|
|
—
|
|
|
|
|||||||
|
Awards exercised
|
—
|
|
—
|
|
|
|
|||||||
|
Options forfeited
|
(109,616
|
)
|
37.52
|
|
|
|
|||||||
|
Outstanding, December 31, 2018
|
—
|
|
$
|
—
|
|
|
$
|
—
|
|
||||
|
Exercisable, December 31, 2018
|
—
|
|
$
|
—
|
|
|
$
|
—
|
|
||||
121
A summary of the status of the Company’s Stock Incentive Plans as of
December 31, 2019
and the changes during the periods then ended is as follows:
|
Number
of Options
|
Weighted
Average Exercise
Price
|
Weighted
Average
Contractual
Life (years)
|
Aggregate
Intrinsic
Value
|
||||||||||
|
|
|
|
(in thousands)
|
||||||||||
|
Outstanding, December 31, 2018
|
—
|
|
$
|
—
|
|
|
|||||||
|
Options granted
|
43,134
|
|
23.77
|
|
10
|
|
|||||||
|
Awards exercised
|
—
|
|
—
|
|
|
|
|||||||
|
Options forfeited
|
—
|
|
—
|
|
|
|
|||||||
|
Outstanding, December 31, 2019
|
43,134
|
|
$
|
23.77
|
|
9.73
|
$
|
156
|
|
||||
|
Exercisable, December 31, 2019
|
—
|
|
$
|
—
|
|
|
$
|
—
|
|
||||
The following table sets forth the assumptions used in calculating the fair value at the date of grant of each option award granted:
|
Year Ended December 31,
|
||||||||||||
|
|
2017
|
2018
|
2019
|
|||||||||
|
Expected volatility
|
—
|
%
|
—
|
%
|
47.37
|
%
|
||||||
|
Expected dividends
|
—
|
%
|
—
|
%
|
—
|
%
|
||||||
|
Expected term, in years
|
0
|
|
0
|
|
10
|
|
||||||
|
Risk-free interest rate
|
—
|
%
|
—
|
%
|
1.74
|
%
|
||||||
|
Weighted-average fair value of options granted during the year
|
$
|
—
|
|
$
|
—
|
|
$
|
13.91
|
|
|||
The following table summarizes information regarding stock option exercises:
|
Year Ended December 31,
|
||||||||||||
|
|
2017
|
2018
|
2019
|
|||||||||
|
(In thousands)
|
||||||||||||
|
Proceeds from stock options exercised
|
$
|
98
|
|
$
|
—
|
|
$
|
—
|
|
|||
|
Intrinsic value of stock options exercised
|
$
|
194
|
|
$
|
—
|
|
$
|
—
|
|
|||
|
Tax benefit from exercises
|
$
|
60
|
|
$
|
—
|
|
$
|
—
|
|
|||
There were
123,267
anti-dilutive stock options excluded from the calculation of diluted net income per common share for the year ended
December 31, 2017
. There were
no
anti-dilutive stock options excluded from the calculation of diluted net income per common share for the year ended
December 31, 2018
. There were
43,134
anti-dilutive stock options excluded from the calculation of diluted net income per share for the year ended
December 31, 2019
.
122
Stock-Based Compensation Expense
As of
December 31, 2019
, there were
484,400
and
62,540
shares subject to outstanding awards under the 2017 Incentive Plan and the 2011 Incentive Plan, respectively.
For the years ended December 31,
2017
,
2018
and
2019
, the Company recognized stock-based compensation expense as follows:
|
|
Year Ended December 31,
|
|||||||||||
|
|
2017
|
2018
|
2019
|
|||||||||
|
|
(In thousands)
|
|||||||||||
|
Instructional costs and services
|
$
|
1,310
|
|
$
|
1,610
|
|
$
|
1,570
|
|
|||
|
Selling and promotional
|
789
|
|
512
|
|
766
|
|
||||||
|
General and administrative
|
4,147
|
|
5,058
|
|
3,624
|
|
||||||
|
Total stock-based compensation expense
|
$
|
6,246
|
|
$
|
7,180
|
|
$
|
5,960
|
|
|||
The Company recognized income tax benefits of
$2.5 million
,
$1.9 million
, and
$2.0 million
from vested restricted stock and restricted stock units for the years ended December 31,
2017
,
2018
and
2019
, respectively.
Repurchase
During the years ended
December 31, 2017
and
2018
, the Company did
no
t repurchase shares of the Company’s common stock, par value
$0.01
per share, other than shares deemed to have been repurchased to satisfy employee minimum tax withholding requirements in connection with the vesting of restricted stock grants. During the year ended
December 31, 2019
, the Company repurchased
1,416,304
shares of the Company’s common stock, par value
$0.01
per share. The chart and footnotes below provide the detail as to the Company’s repurchases during the period.
|
Total Number of Shares Purchased
|
Average Price Paid per Share
|
Total Number of Shares Purchased as Part of Publicly Announced Plans or Programs
|
Maximum Number of Shares that May Yet Be Purchased Under the Plans or Programs
(1)
|
Approximate Dollar Value of Shares that May Yet Be Purchased Under the Plans or Programs
(2)(3)
|
|||||||||||||
|
January 1, 2019
|
—
|
|
$
|
—
|
|
—
|
|
—
|
|
$
|
148,008
|
|
|||||
|
January 1, 2019 – January 31, 2019
|
—
|
|
—
|
|
—
|
|
283,876
|
|
148,008
|
|
|||||||
|
February 1, 2019 – February 28, 2019
|
—
|
|
—
|
|
—
|
|
283,876
|
|
148,008
|
|
|||||||
|
March 1, 2019 – March 31, 2019
|
—
|
|
—
|
|
—
|
|
283,876
|
|
148,008
|
|
|||||||
|
April 1, 2019 – April 30, 2019
|
—
|
|
—
|
|
—
|
|
284,252
|
|
148,008
|
|
|||||||
|
May 1, 2019 – May 31, 2019
|
129,973
|
|
29.38
|
|
129,973
|
|
299,060
|
|
31,181,393
|
|
|||||||
|
June 1, 2019 – June 30, 2019
|
197,488
|
|
29.03
|
|
197,488
|
|
299,060
|
|
25,448,317
|
|
|||||||
|
July 1, 2019 – July 31, 2019
|
218,699
|
|
30.79
|
|
218,699
|
|
299,436
|
|
18,714,574
|
|
|||||||
|
August 1, 2019 – August 31, 2019
|
220,000
|
|
28.16
|
|
220,000
|
|
299,436
|
|
12,519,374
|
|
|||||||
|
September 1, 2019 – September 30, 2019
|
199,921
|
|
24.12
|
|
199,921
|
|
352,104
|
|
7,697,280
|
|
|||||||
|
October 1, 2019 – October 31, 2019
|
229,849
|
|
22.34
|
|
229,849
|
|
352,480
|
|
2,562,453
|
|
|||||||
|
November 1, 2019 – November 30, 2019
|
110,374
|
|
23.21
|
|
110,374
|
|
352,480
|
|
673
|
|
|||||||
|
December 1, 2019 – December 31, 2019
|
110,000
|
|
27.23
|
|
110,000
|
|
352,480
|
|
22,004,700
|
|
|||||||
|
Total
|
1,416,304
|
|
$
|
26.83
|
|
1,416,304
|
|
352,480
|
|
$
|
22,004,700
|
|
|||||
123
|
(1)
|
On December 9, 2011, our Board of Directors approved a stock repurchase program for our common stock, under which we could annually purchase up to the cumulative number of shares issued or deemed issued in that year under our equity incentive and stock purchase plans. Repurchases may be made from time to time in the open market at prevailing market prices or in privately negotiated transactions based on business and market conditions. The stock repurchase program does not obligate us to repurchase any shares, may be suspended or discontinued at any time, and is funded using our available cash.
|
|
(2)
|
On May 2, 2019, the Company’s Board of Directors authorized the repurchase of up to
$35.0 million
of the Company’s common stock, and on December 5, 2019, the Board approved an additional authorization of up to
$25.0 million
of shares. Subject to market conditions, applicable legal requirements, and other factors, the repurchases may be made from time to time in the open market or in privately negotiated transactions. The authorization does not obligate the Company to acquire any shares, and purchases may be commenced or suspended at any time based on market conditions and other factors the Company deem appropriate. The Company may purchase shares at management’s discretion in the open market, in privately negotiated transactions, in transactions structured through investment banking institutions, or a combination of the foregoing. The Company may also, from time to time, enter into Rule 10b5-1 plans to facilitate repurchases of shares under this authorization. The amount and timing of repurchases are subject to a variety of factors, including liquidity, cash flow, stock price and general business and market conditions. The Company has no obligation to repurchase shares and may modify, suspend or discontinue the repurchase program at any time. The authorization under this program is in addition to the Company’s repurchase program under which we may annually purchase up to the cumulative number of shares issued or deemed issued in that year under our equity incentive and stock purchase plan.
|
|
(3)
|
During the year-ended
December 31, 2019
, the Company was deemed to have repurchased
83,214
shares of common stock forfeited by employees to satisfy minimum tax-withholding requirements in connection with the vesting of restricted stock grants. These repurchases were not part of the stock repurchase programs authorized by our Board of Directors as described in footnotes 1 and 2 of this table.
|
Note 11. Contingencies
The Company accrues for costs associated with contingencies including, but not limited to, regulatory compliance and legal matters when such costs are probable and can be reasonably estimated. Liabilities established to provide for contingencies are adjusted as further information develops, circumstances change, or contingencies are resolved. The Company bases these accruals on management’s estimate of such costs, which may vary from the ultimate costs and expenses, associated with any such contingency.
From time to time the Company may be involved in legal matters in the normal course of its business.
Note 12. Concentration
APUS students utilize various payment sources and programs to finance their education expenses, including funds from: Department of Defense, or DoD, tuition assistance programs; federal student aid from Title IV programs; and education benefit programs administered by the U.S. Department of Veteran’s Affairs, or VA, education benefit programs; as well as cash and other sources. Reductions in or changes to DoD tuition assistance, VA education benefits, Title IV programs and other payments sources could have a significant impact on the Company’s operations. As of
December 31, 2019
approximately
57%
of APUS students self-reported that they served in the military on active duty at the time of initial enrollment. Active duty military students generally take fewer courses per year on average than non-military students.
A summary of APEI Segment revenue derived from students by primary funding source for the years ended
December 31, 2017
,
2018
and
2019
is as follows:
|
Year Ended December 31,
|
|||||
|
2017
|
2018
|
2019
|
|||
|
DoD tuition assistance programs
|
37%
|
37%
|
39%
|
||
|
Title IV programs
|
27%
|
26%
|
25%
|
||
|
VA education benefits
|
23%
|
23%
|
23%
|
||
|
Cash and other sources
|
13%
|
14%
|
13%
|
||
124
A summary of HCN Segment revenue derived from students by primary funding source for the years ended
December 31, 2017
,
2018
and
2019
is as follows:
|
Year Ended December 31,
|
|||||
|
2017
|
2018
|
2019
|
|||
|
Title IV programs
|
83%
|
82%
|
80%
|
||
|
Cash and other sources
|
14%
|
16%
|
18%
|
||
|
VA education benefits
|
3%
|
2%
|
2%
|
||
A reduction in, or change to, any of these programs could have a significant impact on the Company’s operations and financial condition.
Note 13. Segment Information
The Company has
two
operating segments that are managed in the following reportable segments:
•
American Public Education Segment, or APEI Segment, and
•
Hondros College of Nursing Segment, or HCN Segment.
In accordance with FASB ASC Topic 280,
Segment Reporting
, the chief operating decision-maker has been identified as the Chief Executive Officer. The Chief Executive Officer reviews operating results to make decisions about allocating resources and assessing performance for APEI and HCN.
125
A summary of financial information by reportable segment is as follows (in thousands):
|
Year Ended December 31,
|
|||||||||||
|
|
2017
|
2018
|
2019
|
||||||||
|
Revenue
|
|||||||||||
|
American Public Education Segment
|
$
|
265,246
|
|
$
|
260,062
|
|
$
|
256,899
|
|
||
|
Hondros College of Nursing Segment
|
34,002
|
|
37,625
|
|
29,479
|
|
|||||
|
Intersegment elimination
|
—
|
|
—
|
|
(108
|
)
|
|||||
|
Total Revenue
|
$
|
299,248
|
|
$
|
297,687
|
|
$
|
286,270
|
|
||
|
Depreciation and Amortization
|
|||||||||||
|
American Public Education Segment
|
$
|
17,376
|
|
$
|
16,175
|
|
$
|
14,659
|
|
||
|
Hondros College of Nursing Segment
|
1,400
|
|
1,326
|
|
937
|
|
|||||
|
Total Depreciation and Amortization
|
$
|
18,776
|
|
$
|
17,501
|
|
$
|
15,596
|
|
||
|
Income from operations before interest income and income taxes
|
|||||||||||
|
American Public Education Segment
|
$
|
30,873
|
|
$
|
28,561
|
|
$
|
23,522
|
|
||
|
Hondros College of Nursing Segment
|
3,986
|
|
3,965
|
|
(10,768
|
)
|
|||||
|
Intersegment elimination
|
—
|
|
—
|
|
2
|
|
|||||
|
Total income from operations before interest income and income taxes
|
$
|
34,859
|
|
$
|
32,526
|
|
$
|
12,756
|
|
||
|
Interest Income, Net
|
|
|
|
||||||||
|
American Public Education Segment
|
$
|
185
|
|
$
|
2,867
|
|
$
|
3,866
|
|
||
|
Hondros College of Nursing Segment
|
—
|
|
48
|
|
42
|
|
|||||
|
Total Interest Income, Net
|
$
|
185
|
|
$
|
2,915
|
|
$
|
3,908
|
|
||
|
Income Tax Expense (Benefit)
|
|
|
|
||||||||
|
American Public Education Segment
|
$
|
10,289
|
|
$
|
8,267
|
|
$
|
7,754
|
|
||
|
Hondros College of Nursing Segment
|
1,204
|
|
1,020
|
|
(2,567
|
)
|
|||||
|
Total Income Tax Expense
|
$
|
11,493
|
|
$
|
9,287
|
|
$
|
5,187
|
|
||
|
Capital Expenditures
|
|||||||||||
|
American Public Education Segment
|
$
|
14,347
|
|
$
|
8,793
|
|
$
|
6,479
|
|
||
|
Hondros College of Nursing Segment
|
441
|
|
637
|
|
776
|
|
|||||
|
Total Capital Expenditures
|
$
|
14,788
|
|
$
|
9,430
|
|
$
|
7,255
|
|
||
Effective January 1, 2019, the APEI Segment began charging the HCN Segment for the value of courses taken by HCN Segment employees at American Public University System. Intersegment elimination represents the elimination of this intersegment revenue in consolidation.
A summary of the Company’s consolidated assets by reportable segment is as follows (in thousands):
|
As of December 31,
|
|||||||
|
|
2018
|
2019
|
|||||
|
Assets
|
|||||||
|
American Public Education Segment
|
$
|
322,523
|
|
$
|
305,896
|
|
|
|
Hondros College of Nursing Segment
|
48,435
|
|
49,001
|
|
|||
|
Total Assets
|
$
|
370,958
|
|
$
|
354,897
|
|
|
Note 14. Subsequent Events
The Company has reviewed its business activities and has no subsequent events to report.
126
Note 15. Quarterly Financial Summary (unaudited)
The following unaudited consolidated interim financial information presented should be read in conjunction with other information included in the Company’s consolidated financial statements. In the opinion of management, the following unaudited consolidated financial information reflects all adjustments necessary for the fair presentation of the results of interim periods. Historical results are not necessarily indicative of the results of operations to be expected for future periods. The following tables set forth selected unaudited quarterly financial information for each of the Company’s last eight quarters:
|
1st Quarter
|
2nd Quarter
|
3rd Quarter
|
4th Quarter
|
||||||||||||
|
(in thousands, except per share data)
|
|||||||||||||||
|
2019
|
|||||||||||||||
|
Revenue
|
$
|
73,441
|
|
$
|
70,560
|
|
$
|
67,888
|
|
$
|
74,381
|
|
|||
|
Income (loss) from operations before income taxes
|
2,435
|
|
6,813
|
|
(1,894
|
)
|
9,310
|
|
|||||||
|
Net income (loss)
|
1,011
|
|
4,921
|
|
(1,638
|
)
|
5,719
|
|
|||||||
|
Net income (loss) per common share:
|
|||||||||||||||
|
Basic
|
$
|
0.06
|
|
$
|
0.30
|
|
$
|
(0.10
|
)
|
$
|
0.37
|
|
|||
|
Diluted
|
$
|
0.06
|
|
$
|
0.30
|
|
$
|
(0.10
|
)
|
$
|
0.37
|
|
|||
|
2018
|
|||||||||||||||
|
Revenue
|
$
|
74,967
|
|
$
|
72,798
|
|
$
|
72,992
|
|
$
|
76,930
|
|
|||
|
Income from operations before income taxes
|
6,655
|
|
8,709
|
|
7,658
|
|
12,419
|
|
|||||||
|
Net income
|
4,589
|
|
6,458
|
|
5,499
|
|
9,093
|
|
|||||||
|
Net income per common share:
|
|||||||||||||||
|
Basic
|
$
|
0.28
|
|
$
|
0.39
|
|
$
|
0.33
|
|
$
|
0.55
|
|
|||
|
Diluted
|
$
|
0.28
|
|
$
|
0.39
|
|
$
|
0.33
|
|
$
|
0.55
|
|
|||
127
ITEM 9.
CHANGES IN AND DISAGREEMENTS WITH ACCOUNTANTS ON ACCOUNTING AND FINANCIAL DISCLOSURE
None.
ITEM 9A. CONTROLS AND PROCEDURES
Evaluation of Disclosure Controls and Procedures
We have carried out an evaluation, under the supervision and with the participation of our management, including our principal executive officer and principal financial officer, of the effectiveness of our disclosure controls and procedures (as defined in Rules 13a-15(e) and 15d-15(e) under the Securities Exchange Act of 1934, as amended, or the Securities Exchange Act), as of
December 31, 2019
. Based upon that evaluation, our principal executive officer and principal financial officer concluded that, as of the end of that period, our disclosure controls and procedures were effective.
Changes in Internal Control Over Financial Reporting.
Beginning January 1, 2018, we implemented ASC 606,
Revenue from Contracts with Customers
. Although the new revenue standard has had an immaterial impact on our ongoing revenue and net income, we implemented changes to our processes related to revenue recognition and the related control activities. These included the development of new policies based on the five-step model provided in the new revenue standard, new training, ongoing contract review requirements, and gathering information provided for disclosures.
Beginning January 1, 2019, we implemented ASC 842,
Leases
. We implemented changes to our processes related to contract evaluations, operating lease asset and liability recognition, and the related control activities. These included the development of new policies, training, ongoing contract review requirements, and gathering information provided for disclosures.
There were no other changes in our internal control over financial reporting identified in connection with the evaluation required by Rules 13a-15(d) and 15d-15(d) of the Exchange Act that occurred during the fourth quarter of
2019
that has materially affected or is reasonably likely to materially affect our internal control over financial reporting.
128
MANAGEMENT’S ANNUAL REPORT ON INTERNAL CONTROL OVER FINANCIAL REPORTING
Our management is responsible for establishing and maintaining adequate internal control over financial reporting for the Company. Internal control over financial reporting is defined in Rule 13a-15(f) or 15d-15(f) promulgated under the Securities Exchange Act of 1934, as amended, as a process designed by, or under the supervision of, the Company’s Principal Executive and Principal Financial Officers and effected by the Company’s Board of Directors, management and other personnel, to provide reasonable assurance regarding the reliability of financial reporting and the preparation of financial statements for external purposes in accordance with generally accepted accounting principles and includes those policies and procedures that:
|
•
|
pertain to the maintenance of records that in reasonable detail accurately and fairly reflect the transactions and dispositions of the assets of the Company;
|
|
•
|
provide reasonable assurance that transactions are recorded as necessary to permit preparation of financial statements in accordance with generally accepted accounting principles, and that receipts and expenditures of the company are being made only in accordance with authorizations of management and directors of the Company; and
|
|
•
|
provide reasonable assurance regarding prevention or timely detection of unauthorized acquisition, use or disposition of the company’s assets that could have a material effect on the financial statements.
|
Because of its inherent limitations, internal control over financial reporting may not prevent or detect misstatements. Projections of any evaluation of effectiveness to future periods are subject to the risk that controls may become inadequate because of changes in conditions, or that the degree of compliance with the policies or procedures may deteriorate.
Under the supervision and with the participation of our Principal Executive Officer and Principal Financial Officer, our management assessed the effectiveness of our internal control over financial reporting as of
December 31, 2019
. In making this assessment, our management used the criteria established in
Internal Control - Integrated Framework
issued by the Committee of Sponsoring Organizations of the Treadway Commission in 2013.
Based on its assessment, management concluded that, as of
December 31, 2019
, our internal control over financial reporting is effective based on those criteria. Management reviewed the results of its assessment with the Audit Committee of our Board of Directors.
Our independent registered public accounting firm, Deloitte & Touche LLP, who audited and reported on the Consolidated Financial Statements of the Company included in this Annual Report, have also audited the effectiveness of the Company’s internal control over financial reporting as of
December 31, 2019
, as stated in its report that appears below.
129
REPORT OF INDEPENDENT REGISTERED PUBLIC ACCOUNTING FIRM
To the Stockholders and the Board of Directors of American Public Education Inc.
Opinion on Internal Control over Financial Reporting
We have audited the internal control over financial reporting of American Public Education Inc. and subsidiaries (the “Company”) as of December 31, 2019, based on criteria established in
Internal Control - Integrated Framework (2013)
issued by the Committee of Sponsoring Organizations of the Treadway Commission (COSO). In our opinion, the Company maintained, in all material respects, effective internal control over financial reporting as of December 31, 2019, based on criteria established in
Internal Control - Integrated Framework (2013)
issued by COSO.
We have also audited, in accordance with the standards of the Public Company Accounting Oversight Board (United States) (PCAOB), the consolidated financial statements as of and for the year ended December 31, 2019, of the Company and our report dated March 10, 2020, expressed an unqualified opinion on those financial statements.
Basis for Opinion
The Company’s management is responsible for maintaining effective internal control over financial reporting and for its assessment of the effectiveness of internal control over financial reporting, included in the accompanying Management's Annual Report on Internal Control over Financial Reporting. Our responsibility is to express an opinion on the Company’s internal control over financial reporting based on our audit. We are a public accounting firm registered with the PCAOB and are required to be independent with respect to the Company in accordance with the U.S. federal securities laws and the applicable rules and regulations of the Securities and Exchange Commission and the PCAOB.
We conducted our audit in accordance with the standards of the PCAOB. Those standards require that we plan and perform the audit to obtain reasonable assurance about whether effective internal control over financial reporting was maintained in all material respects. Our audit included obtaining an understanding of internal control over financial reporting, assessing the risk that a material weakness exists, testing and evaluating the design and operating effectiveness of internal control based on the assessed risk, and performing such other procedures as we considered necessary in the circumstances. We believe that our audit provides a reasonable basis for our opinion.
Definition and Limitations of Internal Control over Financial Reporting
A company’s internal control over financial reporting is a process designed to provide reasonable assurance regarding the reliability of financial reporting and the preparation of financial statements for external purposes in accordance with generally accepted accounting principles. A company’s internal control over financial reporting includes those policies and procedures that (1) pertain to the maintenance of records that, in reasonable detail, accurately and fairly reflect the transactions and dispositions of the assets of the company; (2) provide reasonable assurance that transactions are recorded as necessary to permit preparation of financial statements in accordance with generally accepted accounting principles, and that receipts and expenditures of the company are being made only in accordance with authorizations of management and directors of the company; and (3) provide reasonable assurance regarding prevention or timely detection of unauthorized acquisition, use, or disposition of the company’s assets that could have a material effect on the financial statements.
Because of its inherent limitations, internal control over financial reporting may not prevent or detect misstatements. Also, projections of any evaluation of effectiveness to future periods are subject to the risk that controls may become inadequate because of changes in conditions, or that the degree of compliance with the policies or procedures may deteriorate.
/s/ Deloitte & Touche LLP
McLean, Virginia
March 10, 2020
130
ITEM 9B.
OTHER INFORMATION
None.
131
PART III
ITEM 10.
DIRECTORS, EXECUTIVE OFFICERS, AND CORPORATE GOVERNANCE
Executive Officers
Pursuant to General Instruction G(3) of Form 10-K and the Instruction to Item 401 of Regulation S-K, information regarding our executive officers is set forth in Item 1 of Part I of this Annual Report under the caption “Information about our Executive Officers.”
Code of Ethics
As part of our system of corporate governance, our Board of Directors has adopted a Code of Business Conduct and Ethics that is applicable to all of our employees, officers and directors and also contains provisions only applicable to our principal executive officer and senior financial officers. Our Code of Business Conduct and Ethics is available on the Governance page of our website at http://www.apei.com. We intend to satisfy any disclosure requirement under Item 5.05 of Form 8-K regarding an amendment to, or waiver from, a provision of the Code of Business Conduct and Ethics that applies to our principal executive officer or senior financial officers, by posting such information on our website at the address above. The information on our website is expressly not incorporated by reference in this Annual Report on Form 10-K.
Additional Information
The additional information regarding directors, executive officers, and corporate governance required by this Item is hereby incorporated by reference from the information contained under the captions “Corporate Governance Standards and Director Independence,” “Board Committees and Their Functions,” “Director Nominations and Communication with Directors,” “Proposal No. 1 - Election of Directors” and “Delinquent Section 16(a) Reports” in our Proxy Statement, which will be filed with the SEC no later than 120 days following
December 31, 2019
with respect to our
2020
Annual Meeting of Stockholders.
ITEM 11.
EXECUTIVE COMPENSATION
The information required by this Item is hereby incorporated by reference from the information contained under the captions “Director Compensation,” “Executive Compensation,” and “Compensation Committee Report” in our Proxy Statement, which will be filed with the Securities and Exchange Commission no later than 120 days following
December 31, 2019
with respect to our
2020
Annual Meeting of Stockholders.
ITEM 12.
SECURITY OWNERSHIP OF CERTAIN BENEFICIAL OWNERS AND MANAGEMENT AND RELATED STOCKHOLDER MATTERS
The information required by this Item is hereby incorporated by reference from the information contained under the captions “Beneficial Ownership of Common Stock” and “Equity Compensation Plan Information” in our Proxy Statement, which will be filed with the Securities and Exchange Commission no later than 120 days following
December 31, 2019
with respect to our
2020
Annual Meeting of Stockholders.
ITEM 13.
CERTAIN RELATIONSHIPS AND RELATED PARTY TRANSACTIONS, AND DIRECTOR INDEPENDENCE
The information required by this Item is hereby incorporated by reference from the information contained under the captions “Certain Relationships and Related Person Transactions” and “Board Independence and Leadership Structure” in our Proxy Statement, which will be filed with the Securities and Exchange Commission no later than 120 days following
December 31, 2019
with respect to our
2020
Annual Meeting of Stockholders.
ITEM 14.
PRINCIPAL ACCOUNTANT FEES AND SERVICES
The information required by this Item is hereby incorporated by reference from the information contained under the captions “Principal Accountant Fees and Services” and “Audit Committee’s Pre-Approval Policies and Procedures” in our Proxy Statement, which will be filed with the Securities and Exchange Commission no later than 120 days following
December 31, 2019
with respect to our
2020
Annual Meeting of Stockholders.
132
PART IV
ITEM 15.
EXHIBITS AND FINANCIAL STATEMENT SCHEDULES
|
(a)
|
List of documents filed as part of this Annual Report:
|
|
(1)
|
The required financial statements are included in Item 8 of Part II of this Annual Report.
|
|
(2)
|
The required financial statement schedules are included in Item 8 of Part II of this Annual Report.
|
|
(3)
|
See the Index to Exhibits included in this Annual Report and incorporated herein by reference.
|
|
(b)
|
See the Index to Exhibits included in this Annual Report and incorporated herein by reference.
|
|
(c)
|
See Schedule II: Valuation and Qualifying Accounts included in this Annual Report and incorporated herein by reference.
|
Other schedules are omitted because they are not required.
ITEM 16.
FORM 10-K SUMMARY
None.
133
|
INDEX TO EXHIBITS
|
|||
|
Exhibit No.
|
|
Exhibit Description
|
|
|
|
|||
|
3.1
|
|
|
|
|
3.2
|
|
|
|
|
4.1
|
|
|
|
|
4.2
|
|
Description of Securities (filed herewith)
|
|
|
10.1+
|
|
|
|
|
10.2+
|
|
||
|
10.3+
|
|
||
|
10.4+
|
|
||
|
10.5+
|
|
|
|
|
10.6+
|
|
|
|
|
10.7+
|
|
||
|
10.8+
|
|
|
|
|
10.9+
|
|
||
|
10.10+
|
|
|
|
|
10.11+
|
|
||
|
21.1
|
|
|
|
|
23.1
|
|
||
|
23.2
|
|
|
|
|
31.1
|
|
|
|
|
31.2
|
|
|
|
|
32.1
|
|
|
|
|
32.2
|
|
|
|
|
|
|
|
|
|
EX-101.INS
|
XBRL Instance Document
|
|
|
|
|
EX-101.SCH
|
XBRL Taxonomy Extension Schema Document
|
|
|
|
|
EX-101.CAL
|
XBRL Taxonomy Extension Calculation Linkbase Document
|
|
|
|
|
EX-101.DEF
|
XBRL Taxonomy Extension Definition Linkbase Document
|
|
|
|
|
EX-101.LAB
|
XBRL Taxonomy Extension Label Linkbase Document
|
|
|
|
|
EX-101.PRE
|
XBRL Taxonomy Extension Presentation Linkbase Document
|
134
|
+
|
|
|
Management contract or compensatory plan or arrangement.
|
|
|
|
||
|
(1
|
)
|
|
Incorporated by reference to exhibit filed with Registrant’s Current Report on Form 8-K (File No. 001-33810), filed with the Commission on November 14, 2007.
|
|
(2
|
)
|
|
Incorporated by reference to exhibit filed with Registrant’s Registration Statement on Form S-1 (File No. 333-145185).
|
|
(3
|
)
|
Incorporated by reference to exhibit filed with Registrant’s Quarterly Report on Form 10-Q for the quarterly period ended June 30, 2014 (File No. 001-33810), filed with the Commission on August 5, 2014.
|
|
|
(4
|
)
|
Incorporated by reference to exhibit filed with Registrant’s Current Report on Form 8-K (File No. 001-33810), filed with the Commission on June 17, 2014.
|
|
|
(5
|
)
|
|
Incorporated by reference to exhibit filed with Registrant’s Current Report on Form 8-K (File No. 001-33810), filed with the Commission on May 10, 2011.
|
|
(6
|
)
|
Incorporated by reference to exhibit filed with Registrant’s Annual Report on Form 10-K for the year ended December 31, 2013 (File No. 001-33810), filed with the Commission on February 27, 2014.
|
|
|
(7
|
)
|
Incorporated by reference to exhibit filed with Registrant’s Current Report on Form 8-K (File No. 001-33810), filed with the Commission on December 15, 2016.
|
|
|
(8
|
)
|
Incorporated by reference to exhibit filed with Registrant’s Current Report on Form 8-K (File No. 001-33810), filed with the Commission on May 15, 2017.
|
|
|
(9
|
)
|
Incorporated by reference to exhibit filed with Registrant's Quarterly Report on Form 10-Q for the quarterly period ended June 30, 2018 (File No. 001-33810), filed with the Commission on August 8, 2018.
|
|
|
(10
|
)
|
Incorporated by reference to exhibit filed with Registrant's Current Report on Form 8-K (File No. 001-33810), filed with the Commission on August 22, 2019.
|
|
135
AMERICAN PUBLIC EDUCATION, INC.
Schedule II
Valuation and Qualifying Accounts
|
|
Balance at
Beginning of Period |
Additions/ (Reductions)
|
Write-Offs
|
Balance at
End of Period |
||||||||||||
|
(in thousands)
|
||||||||||||||||
|
Year ended December 31, 2019:
|
||||||||||||||||
|
American Public Education Segment
|
$
|
2,669
|
|
$
|
2,004
|
|
$
|
(2,433
|
)
|
$
|
2,240
|
|
||||
|
Hondros College of Nursing Segment
|
3,979
|
|
2,174
|
|
(2,219
|
)
|
3,934
|
|
||||||||
|
Allowance for receivables
|
$
|
6,648
|
|
$
|
4,178
|
|
$
|
(4,652
|
)
|
$
|
6,174
|
|
||||
|
Year ended December 31, 2018:
|
|
|
|
|||||||||||||
|
American Public Education Segment
|
$
|
3,253
|
|
$
|
1,937
|
|
$
|
(2,521
|
)
|
$
|
2,669
|
|
||||
|
Hondros College of Nursing Segment
|
3,023
|
|
2,634
|
|
(1,678
|
)
|
3,979
|
|
||||||||
|
Allowance for receivables
|
$
|
6,276
|
|
$
|
4,571
|
|
$
|
(4,199
|
)
|
$
|
6,648
|
|
||||
|
Year ended December 31, 2017:
|
|
|
|
|
||||||||||||
|
American Public Education Segment
|
$
|
4,712
|
|
$
|
2,631
|
|
$
|
(4,090
|
)
|
$
|
3,253
|
|
||||
|
Hondros College of Nursing Segment
|
3,365
|
|
2,040
|
|
(2,382
|
)
|
3,023
|
|
||||||||
|
Allowance for receivables
|
$
|
8,077
|
|
$
|
4,671
|
|
$
|
(6,472
|
)
|
$
|
6,276
|
|
||||
136
SIGNATURES
Pursuant to the requirements of Section 13 or 15(d) of the Securities Exchange Act of 1934, the registrant has duly caused this report to be signed on its behalf by the undersigned, thereunto duly authorized.
|
|
AMERICAN PUBLIC EDUCATION, INC.
|
||
|
|
|
|
|
|
|
|
|
|
|
|
|
|
|
|
Date:
|
March 10, 2020
|
By:
|
/s/ Angela Selden
|
|
|
Name:
|
Angela Selden
|
|
|
|
Title:
|
President and Chief Executive Officer
|
|
Pursuant to the requirements of the Securities Exchange Act of 1934, this Report has been signed below by the following persons on behalf of the registrant and in the capacities and on the date indicated.
|
Name
|
|
Date
|
|
Title
|
|
|
||||
|
|
|
|
|
|
|
/s/ Angela Selden
|
|
March 10, 2020
|
|
President, Chief Executive Officer and Director
|
|
Angela Selden
|
|
|
|
(Principal Executive Officer)
|
|
|
|
|
|
|
|
/s/ Richard W. Sunderland, Jr., CPA
|
|
March 10, 2020
|
|
Executive Vice President and
|
|
Richard W. Sunderland, Jr., CPA
|
|
|
|
Chief Financial Officer
(Principal Financial Officer and
Principal Accounting Officer)
|
|
|
|
|
|
|
|
/s/ Barbara G. Fast
|
|
March 10, 2020
|
|
Chairperson of the Board of Directors
|
|
Barbara G. Fast
|
|
|
|
|
|
|
|
|
|
|
|
/s/ Eric C. Andersen
|
March 10, 2020
|
|
Director
|
|
|
Eric C. Andersen
|
||||
|
/s/ Dr. Wallace E. Boston
|
March 10, 2020
|
|
Director
|
|
|
Dr. Wallace E. Boston
|
||||
|
/s/ Jean C. Halle
|
|
March 10, 2020
|
|
Director
|
|
Jean C. Halle
|
|
|
|
|
|
/s/ Dr. Barbara Kurshan
|
|
March 10, 2020
|
|
Director
|
|
Dr. Barbara Kurshan
|
|
|
|
|
|
|
|
|
|
|
|
/s/ Timothy J. Landon
|
|
March 10, 2020
|
|
Director
|
|
Timothy J. Landon
|
|
|
|
|
|
/s/ William G. Robinson, Jr.
|
March 10, 2020
|
|
Director
|
|
|
William G. Robinson, Jr.
|
||||
137
TABLE OF CONTENTS
Part IItem 1. BusinessItem 1A. Risk FactorsItem 1B. Unresolved Staff CommentsItem 2. PropertiesItem 3. Legal ProceedingsItem 4. Mine Safety DisclosuresPart IIItem 5. Market For Registrant S Common Equity, Related Stockholder Matters and Issuer Purchases Of Equity SecuritiesItem 6. Selected Financial DataItem 7. Management S Discussion and Analysis Of Financial Condition and Results Of OperationsItem 7A. Quantitative and Qualitative Disclosures About Market RiskItem 8. Financial Statements and Supplementary DataNote 1. Nature Of BusinessNote 2. Significant Accounting PoliciesNote 3. RevenueNote 4. Property and EquipmentNote 5. InvestmentsNote 6. Goodwill and Intangible AssetsNote 7. LeasesNote 8. Income TaxesNote 9. Other Employee BenefitsNote 10. Stockholders EquityNote 11. ContingenciesNote 12. ConcentrationNote 13. Segment InformationNote 14. Subsequent EventsNote 15. Quarterly Financial Summary (unaudited)Item 9. Changes in and Disagreements with Accountants on Accounting and Financial DisclosureItem 9A. Controls and ProceduresItem 9B. Other InformationPart IIIItem 10. Directors, Executive Officers, and Corporate GovernanceItem 11. Executive CompensationItem 12. Security Ownership Of Certain Beneficial Owners and Management and Related Stockholder MattersItem 13. Certain Relationships and Related Party Transactions, and Director IndependenceItem 14. Principal Accountant Fees and ServicesPart IVItem 15. Exhibits and Financial Statement SchedulesItem 16. Form 10-k Summary