APOLLO GLOBAL MANAGEMENT, INC.
UNITED STATES
SECURITIES AND EXCHANGE COMMISSION
WASHINGTON, D.C. 20549
Form
10-K
(Mark One)
|
x
|
ANNUAL REPORT PURSUANT TO SECTION 13 OR 15(d) OF THE SECURITIES EXCHANGE ACT OF 1934
|
FOR THE FISCAL YEAR ENDED
DECEMBER 31, 2018
OR
|
¨
|
TRANSITION REPORT PURSUANT TO SECTION 13 OR 15(d) OF THE SECURITIES EXCHANGE ACT OF 1934
|
FOR THE TRANSITION PERIOD FROM
TO
Commission File Number: 001-35107
APOLLO GLOBAL MANAGEMENT, LLC
(Exact name of Registrant as specified in its charter)
|
Delaware
|
|
20-8880053
|
|
(State or other jurisdiction of incorporation or organization)
|
|
(I.R.S. Employer Identification No.)
|
9 West 57th Street, 43rd Floor
New York, New York 10019
(Address of principal executive offices) (Zip Code)
(212) 515-3200
(Registrant’s telephone number, including area code)
Securities registered pursuant to Section 12(b) of the Act:
|
Title of each class
|
Name of each exchange on which registered
|
|
|
Class A shares representing limited liability company interests
|
|
New York Stock Exchange
|
|
6.375% Series A Preferred shares
|
New York Stock Exchange
|
|
|
6.375% Series B Preferred shares
|
New York Stock Exchange
|
|
Securities registered pursuant to Section 12(g) of the Act: None
Indicate by check mark if the Registrant is a well-known seasoned issuer, as defined in Rule 405 of the Securities.
Yes
x
No
¨
Indicate by check mark if the Registrant is not required to file reports pursuant to Section 13 or Section 15(d) of the Act. Yes
¨
No
x
Indicate by check mark whether the Registrant (1) has filed all reports required to be filed by Section 13 or 15(d) of the Securities Exchange Act of 1934 during the preceding 12 months (or for such shorter period that the Registrant was required to file such reports), and (2) has been subject to such filing requirements for the past 90 days. Yes
x
No
¨
Indicate by check mark whether the registrant has submitted electronically every Interactive Data File required to be submitted pursuant to Rule 405 of Regulation S-T (§232.405 of this chapter) during the preceding 12 months (or for such shorter period that the registrant was required to submit such files). Yes
x
No
¨
Indicate by check mark if disclosure of delinquent filers pursuant to Item 405 of Regulation S-K (§229.405 of this chapter) is not contained herein and will not be contained, to the best of the Registrant’s knowledge, in definitive proxy or information statements incorporated by reference in Part III of this Form 10-K or any amendment to this Form 10-K.
¨
Indicate by check mark whether the Registrant is a large accelerated filer, an accelerated filer, a non-accelerated filer or a smaller reporting company. See the definitions of “large accelerated filer”, “accelerated filer” and “smaller reporting company” in Rule 12b-2 of the Exchange Act.
|
Large accelerated filer
|
x
|
Accelerated filer
|
o
|
|||
|
Non-accelerated filer
|
o
|
Smaller reporting company
|
o
|
|||
|
Emerging growth company
|
o
|
|||||
|
If an emerging growth company, indicate by check mark if the registrant has elected not to use the extended transition period for complying with any new or revised financial accounting standards provided pursuant to Section 13(a) of the Exchange Act.
|
||||||
|
o
|
||||||
Indicate by check mark whether the Registrant is a shell company (as defined in Rule 12b-2 of the Exchange Act). Yes
¨
No
T
The aggregate market value of the Class A shares of the Registrant held by non-affiliates as of June 30,
2018
was approximately $6,349.1 million, which includes non-voting Class A shares with a value of approximately $557.7 million.
As of February 26, 2019 there were 202,398,070 Class A shares and 1 Class B share outstanding.
|
TABLE OF CONTENTS
|
||
|
|
|
Page
|
|
PART I
|
||
|
ITEM 1.
|
||
|
ITEM 1A.
|
||
|
ITEM 1B.
|
||
|
ITEM 2.
|
||
|
ITEM 3.
|
||
|
ITEM 4.
|
||
|
PART II
|
||
|
ITEM 5.
|
||
|
ITEM 6.
|
||
|
ITEM 7.
|
||
|
ITEM 7A.
|
||
|
ITEM 8.
|
||
|
ITEM 8A.
|
||
|
ITEM 9.
|
||
|
ITEM 9A.
|
||
|
ITEM 9B.
|
||
|
PART III
|
||
|
ITEM 10.
|
||
|
ITEM 11.
|
||
|
ITEM 12.
|
||
|
ITEM 13.
|
||
|
ITEM 14.
|
||
|
PART IV
|
||
|
ITEM 15.
|
||
|
ITEM 16.
|
||
-
2
-
Forward-Looking Statements
This
report
may contain forward-looking statements that are within the meaning of Section 27A of the Securities Act of 1933, as amended (the “Securities Act”), and Section 21E of the Securities Exchange Act of 1934, as amended (the “Exchange Act”). These statements include, but are not limited to, discussions related to Apollo’s expectations regarding the performance of its business, liquidity and capital resources and the other non-historical statements in the discussion and analysis. These forward-looking statements are based on management’s beliefs, as well as assumptions made by, and information currently available to, management. When used in this
report
, the words “believe,” “anticipate,” “estimate,” “expect,” “intend” and similar expressions are intended to identify forward-looking statements. Although management believes that the expectations reflected in these forward-looking statements are reasonable, it can give no assurance that these expectations will prove to have been correct. These statements are subject to certain risks, uncertainties and assumptions, including risks relating to our dependence on certain key personnel, our ability to raise new credit, private equity, or real assets funds, market conditions generally, our ability to manage our growth, fund performance, changes in our regulatory environment and tax status, the variability of our revenues, net income and cash flow, our use of leverage to finance our businesses and investments by our funds and litigation risks, among others. We believe these factors include but are not limited to those described under the section entitled “Risk Factors” in this report; as such factors may be updated from time to time in our periodic filings with the United States Securities and Exchange Commission (the “SEC”), which are accessible on the SEC’s website at www.sec.gov. These factors should not be construed as exhaustive and should be read in conjunction with the other cautionary statements that are included in this report and in our other filings. We undertake no obligation to publicly update or review any forward-looking statements, whether as a result of new information, future developments or otherwise, except as required by applicable law.
Terms Used in This Report
In this
report
, references to “Apollo,” “we,” “us,” “our” and the “Company” refer collectively to Apollo Global Management, LLC, a Delaware limited liability company, and its subsidiaries, including the Apollo Operating Group and all of its subsidiaries, or as the context may otherwise require;
“AMH” refers to Apollo Management Holdings, L.P., a Delaware limited partnership, that is an indirect subsidiary of Apollo Global Management, LLC;
“Apollo funds”, “our funds” and references to the “funds” we manage, refer to the funds (including the parallel funds and alternative investment vehicles of such funds), partnerships, accounts, including strategic investment accounts or “SIAs,” alternative asset companies and other entities for which subsidiaries of the Apollo Operating Group provide investment management or advisory services;
“Apollo Operating Group” refers to (i) the limited partnerships and limited liability companies through which our Managing Partners currently operate our businesses and (ii) one or more limited partnerships or limited liability companies formed for the purpose of, among other activities, holding certain of our gains or losses on our principal investments in the funds, which we refer to as our “principal investments”;
“Assets Under Management”, or “AUM”, refers to the assets of the funds, partnerships and accounts to which we provide investment management, advisory, or certain other investment-related services, including, without limitation, capital that such funds, partnerships and accounts have the right to call from investors pursuant to capital commitments. Our AUM equals the sum of:
|
(i)
|
the fair value of the investments of the private equity funds, partnerships and accounts we manage or advise plus the capital that such funds, partnerships and accounts are entitled to call from investors pursuant to capital commitments;
|
|
(ii)
|
the net asset value, or “NAV”, of the credit funds, partnerships and accounts for which we provide investment management or advisory services, other than certain collateralized loan obligations (“CLOs”) and collateralized debt obligations (“CDOs”), which have a fee-generating basis other than the mark-to-market value of the underlying assets, plus used or available leverage and/or capital commitments;
|
|
(iii)
|
the gross asset value or net asset value of the real assets funds, partnerships and accounts we manage, and the structured portfolio company investments of the funds, partnerships and accounts we manage or advise, which includes the leverage used by such structured portfolio company investments;
|
|
(iv)
|
the incremental value associated with the reinsurance investments of the portfolio company assets we manage or advise; and
|
-
3
-
|
(v)
|
the fair value of any other assets that we manage or advise for the funds, partnerships and accounts to which we provide investment management, advisory, or certain other investment-related services, plus unused credit facilities, including capital commitments to such funds, partnerships and accounts for investments that may require pre-qualification or other conditions before investment plus any other capital commitments to such funds, partnerships and accounts available for investment that are not otherwise included in the clauses above.
|
Our AUM measure includes Assets Under Management for which we charge either nominal or zero fees. Our AUM measure also includes assets for which we do not have investment discretion, including certain assets for which we earn only investment-related service fees, rather than management or advisory fees. Our definition of AUM is not based on any definition of Assets Under Management contained in our operating agreement or in any of our Apollo fund management agreements. We consider multiple factors for determining what should be included in our definition of AUM. Such factors include but are not limited to (1) our ability to influence the investment decisions for existing and available assets; (2) our ability to generate income from the underlying assets in our funds; and (3) the AUM measures that we use internally or believe are used by other investment managers. Given the differences in the investment strategies and structures among other alternative investment managers, our calculation of AUM may differ from the calculations employed by other investment managers and, as a result, this measure may not be directly comparable to similar measures presented by other investment managers. Our calculation also differs from the manner in which our affiliates registered with the SEC report “Regulatory Assets Under Management” on Form ADV and Form PF in various ways;
“Fee-Generating AUM” consists of assets of the funds, partnerships and accounts to which we provide investment management, advisory, or certain other investment-related services and on which we earn management fees, monitoring fees or other investment-related fees pursuant to management or other fee agreements on a basis that varies among the Apollo funds, partnerships and accounts. Management fees are normally based on “net asset value,” “gross assets,” “adjusted par asset value,” “adjusted cost of all unrealized portfolio investments,” “capital commitments,” “adjusted assets,” “stockholders’ equity,” “invested capital” or “capital contributions,” each as defined in the applicable management agreement. Monitoring fees, also referred to as advisory fees, with respect to the structured portfolio company investments of the funds, partnerships and accounts we manage or advise, are generally based on the total value of such structured portfolio company investments, which normally includes leverage, less any portion of such total value that is already considered in Fee-Generating AUM;
“Non-Fee-Generating AUM” refers to AUM that does not produce management fees or monitoring fees. This measure generally includes the following:
|
(i)
|
fair value above invested capital for those funds that earn management fees based on invested capital;
|
|
(ii)
|
net asset values related to general partner and co-investment interests;
|
|
(iii)
|
unused credit facilities;
|
|
(iv)
|
available commitments on those funds that generate management fees on invested capital;
|
|
(v)
|
structured portfolio company investments that do not generate monitoring fees; and
|
|
(vi)
|
the difference between gross asset and net asset value for those funds that earn management fees based on net asset value.
|
“Performance Fee-Eligible AUM” refers to the AUM that may eventually produce performance fees. All funds for which we are entitled to receive a performance fee allocation or incentive fee are included in Performance Fee-Eligible AUM, which consists of the following:
|
(i)
|
“Performance Fee-Generating AUM”, which refers to invested capital of the funds, partnerships and accounts we manage, advise, or to which we provide certain other investment-related services, that is currently above its hurdle rate or preferred return, and profit of such funds, partnerships and accounts is being allocated to, or earned by, the general partner in accordance with the applicable limited partnership agreements or other governing agreements;
|
|
(ii)
|
“AUM Not Currently Generating Performance Fees”, which refers to invested capital of the funds, partnerships and accounts we manage, advise, or to which we provide certain other investment-related services, that is currently below its hurdle rate or preferred return; and
|
-
4
-
|
(iii)
|
“Uninvested Performance Fee-Eligible AUM”, which refers to capital of the funds, partnerships and accounts we manage, advise, or to which we provide certain other investment-related services, that is available for investment or reinvestment subject to the provisions of applicable limited partnership agreements or other governing agreements, which capital is not currently part of the NAV or fair value of investments that may eventually produce performance fees allocable to, or earned by, the general partner.
|
“AUM with Future Management Fee Potential”
refers to the committed uninvested capital portion of total AUM not
currently earning management fees. The amount depends on the specific terms and conditions of each fund;
We use AUM as a performance measure of our funds’ investment activities, as well as to monitor fund size in relation to professional resource and infrastructure needs. Non-Fee-Generating AUM includes assets on which we could earn performance fees;
“Advisory” refers to certain assets advised by Apollo Asset Management Europe PC LLP, a wholly-owned subsidiary of Apollo Asset Management Europe LLP (collectively, “AAME”). The AAME entities are subsidiaries of Apollo;
“capital deployed” or “deployment” is the aggregate amount of capital that has been invested during a given period (which may, in certain cases, include leverage) by (i) our drawdown funds, (ii) SIAs that have a defined maturity date and (iii) funds and SIAs in our real estate debt strategy;
“Contributing Partners” refer to those of our partners and their related parties (other than our Managing Partners) who indirectly beneficially own (through Holdings) Apollo Operating Group units;
“drawdown” refers to commitment-based funds and certain SIAs in which investors make a commitment to provide capital at the formation of such funds and SIAs and deliver capital when called as investment opportunities become available. It includes assets of Athene Holding Ltd. (“Athene Holding”) and its subsidiaries (collectively “Athene”) managed by Athene Asset Management LLC (“Athene Asset Management” or “AAM”) that are invested in commitment-based funds;
“gross IRR” of a credit fund represents the annualized return of a fund based on the actual timing of all cumulative fund cash flows before management fees, performance fees allocated to the general partner and certain other expenses. Calculations may include certain investors that do not pay fees. The terminal value is the net asset value as of the reporting date. Non-U.S. dollar denominated (“USD”) fund cash flows and residual values are converted to USD using the spot rate as of the reporting date. In addition, gross IRRs at the fund level will differ from those at the individual investor level as a result of, among other factors, timing of investor-level inflows and outflows. Gross IRR does not represent the return to any fund investor;
“gross IRR” of a private equity fund represents the cumulative investment-related cash flows (i) for a given investment for the fund or funds which made such investment, and (ii) for a given fund, in the relevant fund itself (and not any one investor in the fund), in each case, on the basis of the actual timing of investment inflows and outflows (for unrealized investments assuming disposition on
December 31, 2018
or other date specified) aggregated on a gross basis quarterly, and the return is annualized and compounded before management fees, performance fees and certain other expenses (including interest incurred by the fund itself) and measures the returns on the fund’s investments as a whole without regard to whether all of the returns would, if distributed, be payable to the fund’s investors. In addition, gross IRRs at the fund level will differ from those at the individual investor level as a result of, among other factors, timing of investor-level inflows and outflows. Gross IRR does not represent the return to any fund investor;
“gross IRR” of a real assets fund represents the cumulative investment-related cash flows in the fund itself (and not any one investor in the fund), on the basis of the actual timing of cash inflows and outflows (for unrealized investments assuming disposition on
December 31, 2018
or other date specified) starting on the date that each investment closes, and the return is annualized and compounded before management fees, performance fees, and certain other expenses (including interest incurred by the fund itself) and measures the returns on the fund’s investments as a whole without regard to whether all of the returns would, if distributed, be payable to the fund’s investors. Non-USD fund cash flows and residual values are converted to USD using the spot rate as of the reporting date. In addition, gross IRRs at the fund level will differ from those at the individual investor level as a result of, among other factors, timing of investor-level inflows and outflows. Gross IRR does not represent the return to any fund investor;
“gross return” of a credit or real assets fund is the monthly or quarterly time-weighted return that is equal to the percentage change in the value of a fund’s portfolio, adjusted for all contributions and withdrawals (cash flows) before the effects of management fees, performance fees allocated to the general partner, or other fees and expenses. Returns of Athene sub-advised portfolios and CLOs represent the gross returns on invested assets, which exclude cash. Returns over multiple periods are calculated by geometrically linking each period’s return over time;
-
5
-
“Holdings” means AP Professional Holdings, L.P., a Cayman Islands exempted limited partnership through which our Managing Partners and Contributing Partners indirectly beneficially own their interests in the Apollo Operating Group units;
“inflows” represents (i) at the individual segment level, subscriptions, commitments, and other increases in available capital, such as acquisitions or leverage, net of inter-segment transfers, and (ii) on an aggregate basis, the sum of inflows across the credit, private equity and real assets segments;
“IRS” refers to the Internal Revenue Service;
“liquid/performing” includes CLOs and other performing credit vehicles, hedge fund style credit funds, structured credit funds and SIAs, as well as sub-advised managed accounts owned by or related to Athene. Certain commitment-based SIAs are included as the underlying assets are liquid;
“Managing Partners” refer to Messrs. Leon Black, Joshua Harris and Marc Rowan collectively and, when used in reference to holdings of interests in Apollo or Holdings, includes certain related parties of such individuals;
“net IRR” of a credit fund represents the annualized return of a fund after management fees, performance fees allocated to the general partner and certain other expenses, calculated on investors that pay such fees. The terminal value is the net asset value as of the reporting date. Non-USD fund cash flows and residual values are converted to USD using the spot rate as of the reporting date. In addition, net IRR at the fund level will differ from that at the individual investor level as a result of, among other factors, timing of investor-level inflows and outflows. Net IRR does not represent the return to any fund investor;
“net IRR” of a private equity fund means the gross IRR applicable to a fund, including returns for related parties which may not pay fees or performance fees, net of management fees, certain expenses (including interest incurred or earned by the fund itself) and realized performance fees all offset to the extent of interest income, and measures returns at the fund level on amounts that, if distributed, would be paid to investors of the fund. The timing of cash flows applicable to investments, management fees and certain expenses, may be adjusted for the usage of a fund’s subscription facility. To the extent that a fund exceeds all requirements detailed within the applicable fund agreement, the estimated unrealized value is adjusted such that a percentage of up to 20.0% of the unrealized gain is allocated to the general partner of such fund, thereby reducing the balance attributable to fund investors. In addition, net IRR at the fund level will differ from that at the individual investor level as a result of, among other factors, timing of investor-level inflows and outflows. Net IRR does not represent the return to any fund investor;
“net IRR” of a real assets fund represents the cumulative cash flows in the fund (and not any one investor in the fund), on the basis of the actual timing of cash inflows received from and outflows paid to investors of the fund (assuming the ending net asset value as of
December 31, 2018
or other date specified is paid to investors), excluding certain non-fee and non-performance fee bearing parties, and the return is annualized and compounded after management fees, performance fees, and certain other expenses (including interest incurred by the fund itself) and measures the returns to investors of the fund as a whole. Non-USD fund cash flows and residual values are converted to USD using the spot rate as of the reporting date. In addition, net IRR at the fund level will differ from that at the individual investor level as a result of, among other factors, timing of investor-level inflows and outflows. Net IRR does not represent the return to any fund investor;
“net return” of a credit or real assets fund represents the gross return after management fees, performance fees allocated to the general partner, or other fees and expenses. Returns of Athene sub-advised portfolios and CLOs represent the gross or net returns on invested assets, which exclude cash. Returns over multiple periods are calculated by geometrically linking each period’s return over time;
“our manager” means AGM Management, LLC, a Delaware limited liability company that is controlled by our Managing Partners;
“performance allocations”, “performance fees”, “performance revenues”, “incentive fees” and “incentive income” refer to interests granted to Apollo by an Apollo fund that entitle Apollo to receive allocations, distributions or fees which are based on the performance of such fund or its underlying investments;
“permanent capital vehicles” refers to (a) assets that are owned by or related to Athene or Athora Holding Ltd. (“Athora Holding” and together with its subsidiaries, “Athora”), (b) assets that are owned by or related to MidCap FinCo Designated Activity Company (“MidCap”) and managed by Apollo, (c) assets of publicly traded vehicles managed by Apollo such as Apollo Investment Corporation (“AINV”), Apollo Commercial Real Estate Finance, Inc. (“ARI”), Apollo Tactical Income Fund Inc. (“AIF”), and Apollo Senior Floating Rate Fund Inc. (“AFT”), in each case that do not have redemption provisions or a requirement to return capital to investors upon exiting the investments made with such capital, except as required by applicable law and (d) a non-traded business development company from which Apollo earns certain investment-related service fees. The investment management agreements of AINV, AIF and AFT have one year terms, are reviewed annually and remain in effect only if approved by the boards of directors of such companies or by the affirmative vote of the holders of a majority of the outstanding voting shares of such
-
6
-
companies, including in either case, approval by a majority of the directors who are not “interested persons” as defined in the Investment Company Act of 1940. In addition, the investment management agreements of AINV, AIF and AFT may be terminated in certain circumstances upon 60 days’ written notice. The investment management agreement of ARI has a one year term and is reviewed annually by ARI’s board of directors and may be terminated under certain circumstances by an affirmative vote of at least two-thirds of ARI’s independent directors. The investment management or advisory arrangements between MidCap and Apollo, as well as between Athene and Apollo, may also be terminated under certain circumstances. The agreement pursuant to which Apollo earns certain investment-related service fees from a non-traded business development company may be terminated under certain limited circumstances;
“private equity fund appreciation (depreciation)” refers to gain (loss) and income for the traditional private equity funds (as defined below), Apollo Natural Resources Partners, L.P. (“ANRP I”), Apollo Natural Resources Partners II, L.P. (“ANRP II”), Apollo Special Situations Fund, L.P., AION Capital Partners Limited (“AION”) and Apollo Hybrid Value Fund, L.P. (together with its parallel funds and alternative investment vehicles,“Hybrid Value Fund”) for the periods presented on a total return basis before giving effect to fees and expenses. The performance percentage is determined by dividing (a) the change in the fair value of investments over the period presented, minus the change in invested capital over the period presented, plus the realized value for the period presented, by (b) the beginning unrealized value for the period presented plus the change in invested capital for the period presented. Returns over multiple periods are calculated by geometrically linking each period’s return over time;
“private equity investments” refer to (i) direct or indirect investments in existing and future private equity funds managed or sponsored by Apollo, (ii) direct or indirect co-investments with existing and future private equity funds managed or sponsored by Apollo, (iii) direct or indirect investments in securities which are not immediately capable of resale in a public market that Apollo identifies but does not pursue through its private equity funds, and (iv) investments of the type described in (i) through (iii) above made by Apollo funds;
“Realized Value” refers to all cash investment proceeds received by the relevant Apollo fund, including interest and dividends, but does not give effect to management fees, expenses, incentive compensation or performance fees to be paid by such Apollo fund;
“Redding Ridge” refers to Redding Ridge Asset Management, LLC and its subsidiaries, which is a standalone, self-managed asset management business established in connection with risk retention rules that manages CLOs and retains the required risk retention interests;
“Remaining Cost” represents the initial investment of the fund in a portfolio investment, reduced for any return of capital distributed to date on such portfolio investment;
“Strategic Investor” refers to the California Public Employees’ Retirement System, or “CalPERS”;
“Total Invested Capital” refers to the aggregate cash invested by the relevant Apollo fund and includes capitalized costs relating to investment activities, if any, but does not give effect to cash pending investment or available for reserves;
“Total Value” represents the sum of the total Realized Value and Unrealized Value of investments;
“traditional private equity funds” refers to Apollo Investment Fund I, L.P. (“Fund I”), AIF II, L.P. (“Fund II”), a mirrored investment account established to mirror Fund I and Fund II for investments in debt securities (“MIA”), Apollo Investment Fund III, L.P. (together with its parallel funds, “Fund III”), Apollo Investment Fund IV, L.P. (together with its parallel fund, “Fund IV”), Apollo Investment Fund V, L.P. (together with its parallel funds and alternative investment vehicles, “Fund V”), Apollo Investment Fund VI, L.P. (together with its parallel funds and alternative investment vehicles, “Fund VI”), Apollo Investment Fund VII, L.P. (together with its parallel funds and alternative investment vehicles, “Fund VII”), Apollo Investment Fund VIII, L.P. (together with its parallel funds and alternative investment vehicles, “Fund VIII”) and Apollo Investment Fund IX, L.P. (together with its parallel funds and alternative investment vehicles, “Fund IX”);
“Unrealized Value” refers to the fair value consistent with valuations determined in accordance with generally accepted accounting principles in the United States of America (“U.S. GAAP”), for investments not yet realized and may include payments in kind, accrued interest and dividends receivable, if any, and before the effect of certain taxes. In addition, amounts include committed and funded amounts for certain investments; and
“Vintage Year” refers to the year in which a fund’s final capital raise occurred, or, for certain funds, the year in which a fund’s investment period commences pursuant to its governing agreements.
-
7
-
Overview
Founded in 1990, Apollo is a leading global alternative investment manager. We are a contrarian, value-oriented investment manager in credit, private equity and real assets, with significant distressed investment expertise. We have a flexible mandate in many of the funds we manage which enables our funds to invest opportunistically across a company’s capital structure. We raise, invest and manage funds on behalf of some of the world’s most prominent pension, endowment and sovereign wealth funds, as well as other institutional and individual investors. As of
December 31, 2018
, we had total AUM of
$280 billion
, including approximately
$193 billion
in credit,
$69 billion
in private equity and
$18 billion
in real assets. We have consistently produced attractive long-term investment returns in our traditional private equity funds, generating a
39%
gross IRR and a
25%
net IRR on a compound annual basis from inception through
December 31, 2018
.
Apollo is led by our Managing Partners, Leon Black, Joshua Harris and Marc Rowan, who have worked together for more than
32
years and lead a team of
1,143
employees, including
410
investment professionals, as of
December 31, 2018
. This team possesses a broad range of transaction, financial, managerial and investment skills. We have offices in New York, Los Angeles, San Diego, Houston, Bethesda, London, Frankfurt, Madrid, Luxembourg, Mumbai, Delhi, Singapore, Hong Kong, Shanghai and Tokyo. We operate our credit, private equity and real assets investment management businesses in a highly integrated manner, which we believe distinguishes us from other alternative investment managers. Our investment professionals frequently collaborate across disciplines. We believe that this collaboration, including market insight, management, banking and consultant contacts, and investment opportunities, enables the funds we manage to more successfully invest across a company’s capital structure. This platform and the depth and experience of our investment team have enabled us to deliver strong long-term investment performance for our funds throughout a range of economic cycles.
Our objective is to achieve superior long-term risk-adjusted returns for our fund investors. The majority of the investment funds we manage are designed to invest capital over periods of seven or more years from inception, thereby allowing us to generate attractive long-term returns throughout economic cycles. Our investment approach is value-oriented, focusing on nine core industries in which we have considerable knowledge and experience, and emphasizing downside protection and the preservation of capital. Our core industry sectors include chemicals, manufacturing and industrial, natural resources, consumer and retail, consumer services, business services, financial services, leisure, and media and telecom and technology. Our contrarian investment management approach is reflected in a number of ways, including:
|
•
|
our willingness to pursue investments in industries that our competitors typically avoid;
|
|
•
|
the often complex structures employed in some of the investments of our funds, including our willingness to pursue difficult corporate carve-out transactions;
|
|
•
|
our experience investing during periods of uncertainty or distress in the economy or financial markets when many of our competitors simply reduce their investment activity;
|
|
•
|
our orientation towards sole sponsored transactions when other firms have opted to partner with others; and
|
|
•
|
our willingness to undertake transactions that have substantial business, regulatory or legal complexity.
|
We have applied this investment philosophy to identify what we believe are attractive investment opportunities, deploy capital across the balance sheet of industry leading, or “franchise,” businesses and create value throughout economic cycles.
We rely on our deep industry, credit and financial structuring experience, coupled with our strengths as a value-oriented, distressed investment manager, to deploy significant amounts of new capital within challenging economic environments. Our approach towards investing in distressed situations often requires our funds to purchase particular debt securities as prices are declining, since this allows us both to reduce our funds’ average cost and accumulate sizable positions which may enhance our ability to influence any restructuring plans and maximize the value of our funds’ distressed investments. As a result, our investment approach may produce negative short-term unrealized returns in certain of the funds we manage. However, we concentrate on generating attractive, long-term, risk-adjusted realized returns for our fund investors, and we therefore do not overly depend on short-term results and quarterly fluctuations in the unrealized fair value of the holdings in our funds.
In addition to deploying capital in new investments, we seek to enhance value in the investment portfolios of the funds we manage. We have relied on our transaction, restructuring and credit experience to work proactively with our private equity funds’ portfolio company management teams to identify and execute strategic acquisitions, joint ventures, and other transactions, generate cost and working capital savings, reduce capital expenditures, and optimize capital structures through several means such as debt exchange offers and the purchase of portfolio company debt at discounts to par value.
-
8
-
We have grown our total AUM at a
20%
compound annual growth rate from December 31, 2008 to
December 31, 2018
. In addition, we benefit from mandates with long-term capital commitments in our credit, private equity and real assets businesses. Our long-lived capital base allows us to invest our funds' assets with a long-term focus, which is an important component in generating attractive returns for our fund investors. We believe the long-term capital we manage also leaves us well-positioned during economic downturns, when the fundraising environment for alternative assets has historically been more challenging than during periods of economic expansion. As of
December 31, 2018
, more than
90%
of our AUM was in funds with a contractual life at inception of seven years or more, and
49%
of our AUM was in permanent capital vehicles.
We expect our growth in AUM to continue over time by seeking to create value in our funds’ existing credit, private equity and real assets investments, continuing to deploy our funds’ available capital in what we believe are attractive investment opportunities, and raising new funds and investment vehicles as market opportunities present themselves. See “Item 1A. Risk Factors—Risks Related to Our Businesses—We may not be successful in raising new funds or in raising more capital for certain of our existing funds and may face pressure on performance fees and fee arrangements of our future funds.”
Our financial results are highly variable, since performance fees (which generally constitute a large portion of the income that we receive from the funds we manage), and the transaction and advisory fees that we receive, can vary significantly from quarter to quarter and year to year. We manage our business and monitor our performance with a focus on long-term performance, an approach that is generally consistent with the investment horizons of the funds we manage and is driven by the investment returns of our funds.
Our Businesses
We have three business segments: credit, private equity and real assets. The diagram below summarizes our businesses as of December 31, 2018:
|
Apollo Global Management, LLC
|
||||||
|
Credit
|
Private Equity
|
Real Assets
|
||||
|
•
Liquid/Performing
•
Drawdown
•
Permanent Capital Vehicles - MidCap, AINV, AFT, AIF
•
Athene and Athora
•
Athene and Athora Non-Sub-Advised
•
Advisory
|
•
Distressed Buyouts, Debt and Other Investments
•
Corporate Carve-outs
•
Opportunistic Buyouts
•
Hybrid Capital
•
Natural Resources
|
•
Opportunistic equity investing in real estate and infrastructure assets, portfolios, companies and platforms
•
Commercial real estate and infrastructure debt investments including first mortgage and mezzanine loans and commercial mortgage backed securities
|
||||
|
AUM: $193.2 billion
(1)(2)(3)(4)
|
AUM: $69.1 billion
(1)
|
AUM: $17.9 billion
(1)(2)(3)
|
||||
|
Strategic Investment Accounts
Generally invest in or alongside certain Apollo funds
and other Apollo-sponsored transactions
|
||||||
|
(1)
|
See Item 7. "Management's Discussion and Analysis of Financial Condition and Results of Operations" for additional information.
|
|
(2)
|
Includes funds that are denominated in Euros and translated into U.S. dollars at an exchange rate of €1.00 to
$1.15
as of
December 31, 2018
.
|
|
(3)
|
Includes funds that are denominated in pound sterling and translated into U.S. dollars at an exchange rate of £1.00 to
$1.28
as of
December 31, 2018
.
|
|
(4)
|
Includes funds that are denominated in yen and translated into U.S. dollars at an exchange rate of ¥1.00 to
$0.0091
as of
December 31, 2018
.
|
Credit
Since Apollo’s founding in 1990, we believe our expertise in credit has served as an integral component of our company’s growth and success. Our credit-oriented approach to investing commenced in 1990 with the management of a high-yield bond and
-
9
-
leveraged loan portfolio. Since that time, our credit activities have grown significantly, through both organic growth and strategic acquisitions. As of
December 31, 2018
, Apollo’s credit segment had total AUM and Fee-Generating AUM of
$193.2 billion
and
$158.0 billion
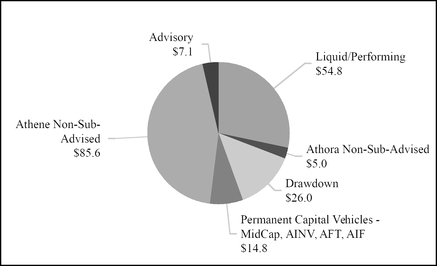
, respectively, across a diverse range of credit-oriented investments that utilize the same disciplined, value-oriented investment philosophy that we employ with respect to our private equity funds. Apollo’s broad credit platform, which we believe is adaptable to evolving market conditions and different risk tolerances, is categorized as follows:
Credit AUM as of
December 31, 2018
(1)
(in billions)
|
(1)
|
AUM components may not sum due to rounding.
|
Liquid/Performing
Our liquid/performing category within the credit segment generally includes funds and accounts where the underlying assets are liquid in nature. These funds and accounts may have some form of periodic redemption right. Liquid/performing includes a variety of hedge funds, CLOs and SIAs that utilize a range of investment strategies including performing credit, structured credit, and liquid opportunistic credit. Performing credit strategies focus on income-oriented, senior loan and bond investment strategies that target issuers primarily domiciled in the U.S. and in Europe. Structured credit strategies target multiple tranches of structured securities with favorable and protective lending terms, predictable payment schedules, well diversified portfolios and low default rates. Liquid opportunistic strategies primarily focus on credit investments that are generally liquid in nature and that utilize a similar value-oriented investment philosophy as our private equity business. This includes investments by our credit funds in a broad array of primary and secondary opportunities encompassing stressed and distressed public and private securities primarily within corporate credit, including senior loans (secured and unsecured), high yield, mezzanine, derivative securities, debtor in possession financings, rescue or bridge financings, and other debt investments. In aggregate, our AUM and Fee-Generating AUM within the liquid/performing category totaled
$54.8 billion
and
$40.3 billion
, respectively, as of
December 31, 2018
.
Hedge Funds
Hedge Funds primarily
includes Apollo Credit Strategies Master Fund Ltd. and Apollo Credit Master Fund Ltd. Collectively, our hedge fund AUM and Fee-Generating AUM totaled
$7.2 billion
and
$2.9 billion
, respectively, as of
December 31, 2018
. Our hedge funds may utilize a mix of the investment strategies outlined above. Investments in these funds may be made on a long or short basis and employ leverage to finance the acquisition of various credit investments. Accordingly, the difference between AUM and Fee-Generating AUM for hedge funds is driven by non-fee paying leverage.
CLOs
In aggregate, our AUM and Fee-Generating AUM in CLOs totaled
$14.4 billion
and
$8.9 billion
, respectively, as of
December 31, 2018
. Through their lifecycle, CLOs employ structured credit and performing credit strategies with the goal of providing investors with competitive yields achieved through highly diversified pools of historically low defaulting assets. Included within total AUM of CLOs is
$5.5 billion
of AUM related to Redding Ridge.
-
10
-
SIAs / Other
SIAs / Other
includes a diverse group of separately managed accounts and certain commitment-based funds where the underlying assets are liquid and generally employ a mix of performing credit, structured credit, and liquid opportunistic credit investment strategies. In aggregate, our AUM and Fee-Generating AUM in SIAs and other accounts totaled
$33.3 billion
and
$28.6 billion
as of
December 31, 2018
, respectively. The managed accounts comprising the majority of AUM and Fee-Generating AUM within this subcategory are customized according to an investor’s specified risk and target return preferences.
Drawdown
Our drawdown category within the credit segment generally includes commitment-based funds and certain SIAs in which investors make a commitment to provide capital at the formation of such funds and deliver capital when called as investment opportunities become available. Drawdown comprises our fund series’ including Credit Opportunity Funds, European Principal Finance Funds, and Structured Credit Funds, including Financial Credit Investment Funds and Structured Credit Recovery Funds, as well as other commitment-based funds not included within a series of funds and certain SIAs. Drawdown funds and SIAs utilize a range of investment strategies including illiquid opportunistic, principal finance, and structured credit strategies. In aggregate, our AUM and Fee-Generating AUM within the drawdown category totaled
$26.0 billion
and
$14.1 billion
, respectively, as of
December 31, 2018
.
Credit Opportunity Funds
The Credit Opportunity Fund (“COF”) series primarily employs our illiquid opportunistic investment strategy, which focuses on credit investments that are less liquid in nature and that utilize a similar value-oriented investment philosophy as our private equity business. This includes investments in a broad array of primary and secondary opportunities encompassing stressed and distressed public and private securities primarily within corporate credit, including senior loans (secured and unsecured), high yield, mezzanine, debtor in possession financings, rescue or bridge financings, and other debt investments. Additionally, for certain illiquid opportunistic investments our underwriting process may result in selective and at times concentrated investments by the funds in the various industries on which we focus. In certain cases, leverage can be employed in connection with this strategy by having fund subsidiaries or special-purpose vehicles incur debt or by entering into credit facilities or other debt transactions to finance the acquisition of various credit investments. Our AUM and Fee-Generating AUM within the Credit Opportunity Funds totaled
$2.0 billion
and
$1.2 billion
, respectively, as of
December 31, 2018
.
European Principal Finance Funds
The European Principal Finance Fund (“EPF”) series primarily employs our principal finance investment strategy, which is utilized to invest in European commercial and residential real estate, performing loans, non-performing loans, and unsecured consumer loans, as well as acquiring assets as a result of distressed market situations. Certain of the EPF investment vehicles we manage own captive pan-European financial institutions, loan servicing and property management platforms. These entities perform banking and lending activities and manage and service consumer credit receivables and loans secured by commercial and residential properties. In aggregate, these financial institutions, loan servicing, and property management platforms operate in five European countries and employed approximately 1,450 individuals as of
December 31, 2018
. We believe the post-investment loan servicing and real estate asset management requirements, combined with the illiquid nature of these investments, limits participation by traditional long-only investors, hedge funds, and private equity funds, resulting in what we believe to be an opportunity for our credit business. Our AUM and Fee-Generating AUM within the European Principal Finance Funds totaled
$7.1 billion
and
$5.5 billion
, respectively, as of
December 31, 2018
.
Structured Credit Funds - FCI and SCRF
Our Structured Credit Funds include the Financial Credit Investment Fund series (“FCI”) and the Structured Credit Recovery Fund series (“SCRF”)
.
Collectively, the Structured Credit Funds employ our structured credit investing strategy, which targets multiple tranches of less liquid structured securities with favorable and protective lending terms, predictable payment schedules, well-diversified portfolios and low default rates. Our SCRF series recently expanded as we held a final closing for our fourth Structured Credit Recovery Fund series during the year ended December 31, 2018. Our AUM and Fee-Generating AUM within Structured Credit Funds totaled
$8.1 billion
and
$4.3 billion
, respectively, as of
December 31, 2018
.
Permanent Capital Vehicles - Credit
Our permanent capital vehicles category within the credit segment generally includes pools of assets which are not subject to redemption and are generally associated with long term asset management or advisory contracts. This category is comprised of (a) Athene assets managed or advised by Apollo; (b) Athora assets managed or advised by Apollo; (c) assets that are owned by or related to MidCap and managed by Apollo; (d) assets of certain publicly traded vehicles managed by Apollo such as AINV, AIF,
-
11
-
and AFT and (e) a non-traded business development company from which Apollo earns certain investment-related service fees. The permanent capital vehicles within credit utilize a range of investment strategies including performing credit and structured credit as described previously, as well as directly originated credit. Direct origination generally relates to the sourcing of senior credit assets, both secured and unsecured, including asset-backed loans, leveraged loans, mezzanine debt, real estate loans, re-discount loans and venture loans. Directly originated credit is primarily employed by Midcap, AINV, and a non-traded business development company from which Apollo earns certain investment-related service fees. In aggregate, our AUM and Fee-Generating AUM within our credit permanent capital vehicles totaled
$131.6 billion
and
$129.8 billion
, respectively, as of
December 31, 2018
.
Permanent Capital Vehicles - MidCap, AINV, AFT, AIF
The AUM and Fee-Generating AUM we managed within MidCap, AINV, AFT and AIF totaled
$14.8 billion
and
$13.5 billion
, respectively, as of
December 31, 2018
.
MidCap is a middle market-focused specialty finance firm that provides senior debt solutions to companies across all industries. Our AUM and Fee-Generating AUM within MidCap totaled
$8.8 billion
and
$8.6 billion
, respectively, as of
December 31, 2018
.
Athene
Athene Holding was founded in 2009 to capitalize on favorable market conditions in the dislocated life insurance sector. Athene Holding, through its subsidiaries, is a leading retirement services company that issues, reinsures and acquires retirement savings products designed for the increasing number of individuals and institutions seeking to fund retirement needs. The products and services offered by Athene include fixed and fixed indexed annuity products, reinsurance services offered to third-party annuity providers and institutional products, such as funding agreements. Athene Holding is a registrant under the Exchange Act and is currently listed on the New York Stock Exchange (NYSE) under the symbol “ATH”.
The Company, through its consolidated subsidiary AAM, provides asset management and advisory services to Athene, including asset allocation services, direct asset management services, asset and liability matching management, mergers and acquisitions, asset diligence hedging and other asset management services. Additionally, the Company, through AAM, provides sub-advisory services with respect to a portion of the assets that it manages in accounts owned by Athene in the U.S. and Bermuda or in accounts supporting reinsurance ceded to U.S. and Bermuda subsidiaries of Athene Holding by third-party insurers (collectively, the “Athene North American Accounts”). As of
December 31, 2018
, Apollo managed or advised
$108.8 billion
of AUM, all of which was Fee-Generating AUM, in accounts owned by or related to Athene (the “Athene Accounts”). See note
14
to our
consolidated
financial statements for details regarding the fee arrangements between the Company and Athene.
Athene Non-Sub-Advised Assets
This category includes the Athene assets which are managed by Apollo but not sub-advised by Apollo nor invested in Apollo funds or investment vehicles. We refer to these assets collectively as “Athene Non-Sub-Advised Assets”. Our AUM within the Athene Non-Sub-Advised category totaled
$85.6 billion
as of
December 31, 2018
, all of which was Fee-Generating AUM.
Athora
The Company, through its consolidated subsidiary, AAME, provides investment advisory services to certain portfolio companies of Apollo funds and Athora, a strategic platform established to acquire or reinsure blocks of insurance business in the German and broader European life insurance market (collectively, the “Athora Accounts”). As of
December 31, 2018
, Apollo, through its subsidiaries, managed or advised
$8.0 billion
of AUM and
$5.8 billion
of Fee-Generating AUM in accounts owned by or related to Athora. See note
14
to our
consolidated
financial statements for details regarding the fee arrangements between the Company and Athora.
Athora Non-Sub-Advised Assets
This category includes the Athora assets which are managed by Apollo but not sub-advised by Apollo nor invested in Apollo funds or investment vehicles. We refer to these assets collectively as “Athora Non-Sub-Advised Assets”. Our AUM within the Athora Non-Sub-Advised category totaled
$5.0 billion
as of
December 31, 2018
, of which
$4.5 billion
was Fee-Generating AUM.
Advisory
Advisory refers to certain assets advised by AAME. AAME is a subsidiary of Apollo which provides asset allocation and risk management advisory services principally to certain of the insurance and bank institutions acquired by Apollo managed funds. Our AUM as of
December 31, 2018
within the Advisory category totaled
$7.1 billion
.
-
12
-
Private Equity
As a result of our long history of private equity investing across market cycles, we believe we have developed a unique set of skills on which we rely to make new investments and to maximize the value of our existing investments. As an example, through our experience with traditional private equity buyouts, which we also refer to herein as buyout equity, we apply a highly disciplined approach towards structuring and executing transactions, the key tenets of which include seeking to acquire companies at below industry average purchase price multiples, and establishing flexible capital structures with long-term debt maturities and few, if any, financial maintenance covenants.
We believe we have a demonstrated ability to adapt quickly to changing market environments and capitalize on market dislocations through our traditional, distressed and corporate buyout approach. In prior periods of strained financial liquidity and economic recession, our private equity funds have made attractive investments by buying the debt of quality businesses (which we refer to as “classic” distressed debt), converting that debt to equity, seeking to create value through active participation with management and ultimately monetizing the investment. This combination of traditional and corporate buyout investing with a “distressed option” has been deployed through prior economic cycles and has allowed our funds to achieve attractive long-term rates of return in different economic and market environments. In addition, during prior economic downturns we have relied on our restructuring experience and worked closely with our funds’ portfolio companies to seek to maximize the value of our funds’ investments.
We seek to focus on investment opportunities where competition is limited or non-existent. We believe we are often sought out early in the investment process because of our industry expertise, sizable amounts of available long-term capital, willingness to pursue investments in complicated situations and ability to provide value-added advice to portfolio companies regarding operational improvements, acquisitions and strategic direction. We generally prefer sole sponsored transactions and since inception through
December 31, 2018
, approximately 68% of the investments made by our private equity funds have been proprietary in nature. We believe that by emphasizing our proprietary sources of deal flow, our private equity funds will be able to acquire businesses at more compelling valuations which will ultimately create a more attractive risk/reward proposition. As of
December 31, 2018
, our private equity segment had total and Fee-Generating AUM of approximately
$69.1 billion
and
$44.0 billion
, respectively.
During periods of market dislocation and volatility, we rely on our credit and capital markets expertise to build positions in distressed debt. We target assets with what we believe are high-quality operating businesses but low-quality balance sheets, consistent with our traditional buyout strategies. The distressed securities our funds purchase include bank debt, public high-yield debt and privately held instruments, often with significant downside protection in the form of a senior position in the capital structure, and in certain situations our funds also provide debtor-in-possession financing to companies in bankruptcy. Our investment professionals generate these distressed buyout and debt investment opportunities based on their many years of experience in the debt markets, and as such they are generally proprietary in nature.
We believe distressed buyouts and debt investments represent a highly attractive risk/reward profile. Our funds’ investments in debt securities have generally resulted in two outcomes. The first and preferred potential outcome, which we refer to as a distressed for control investment, is when our funds are successful in taking control of a company through its investment in the distressed debt. By working proactively through the restructuring process, we are often able to equitize the debt position of our funds to create a well-financed buyout which would then typically be held by the fund for a three-to-five year period, similar to other traditional leveraged buyout transactions. The second potential outcome, which we refer to as a non-control distressed investment is when our funds do not gain control of the company. This typically occurs as a result of an increase in the price of the debt investments to levels which are higher than what we consider to be an attractive acquisition valuation. In these instances, we may forgo seeking control, and instead our funds may seek to sell the debt investments over time, typically generating a higher short-term IRR with a lower multiple of invested capital than in the case of a typical distressed for control transaction. We believe that we are a market leader in distressed investing and that this is one of the key areas that differentiates us from our peers.
We also maintain the flexibility to deploy capital of our private equity funds in other types of investments such as the creation of new companies, which allows us to leverage our deep industry and distressed expertise and collaborate with experienced management teams to seek to capitalize on market opportunities that we have identified, particularly in asset-intensive industries that are in distress. In these types of situations, we have the ability to establish new entities that can acquire distressed assets at what we believe are attractive valuations without the burden of managing an existing portfolio of legacy assets. Other investments, such as the creation of new companies, historically have not represented a large portion of our overall investment activities, although our private equity funds do make these types of investments selectively.
-
13
-
Corporate Carve-outs
Corporate carve-outs are less market-dependent than distressed investing, but are equally complicated. In these transactions, our funds seek to extract a business that is highly integrated within a larger corporate parent to create a stand-alone business. These are labor-intensive transactions, which we believe require deep industry knowledge, patience and creativity, to unlock value that has largely been overlooked or undermanaged. Importantly, because of the highly negotiated nature of many of these transactions, Apollo believes it is often difficult for the seller to run a competitive process, which ultimately allows our funds to achieve compelling purchase prices.
Opportunistic Buyouts
We have extensive experience completing leveraged buyouts across various market cycles. We take an opportunistic and disciplined approach to these transactions, generally avoiding highly competitive situations in favor of proprietary transactions where there may be opportunities to purchase a company at a discount to prevailing market averages. Oftentimes, we will focus on complex situations such as out-of-favor industries or “broken” (or discontinued) sales processes where the inherent value may be less obvious to potential acquirers. In the case of more conventional buyouts, we seek investment opportunities where we believe our focus on complexity and sector expertise will provide us with a significant competitive advantage, whereby we can leverage our knowledge and experience from the nine core industries in which our investment professionals have historically invested private equity capital. We believe such knowledge and experience can result in our ability to find attractive opportunities for our funds to acquire portfolio company investments at lower purchase price multiples.
To further alter the risk/reward profile in our funds’ favor, we often focus on certain types of buyouts such as physical asset acquisitions and investments in non-correlated assets where underlying values tend to change in a manner that is independent of broader market movements In the case of physical asset acquisitions, our private equity funds seek to acquire physical assets at discounts to where those assets trade in the financial markets, and to lock in that value arbitrage through comprehensive hedging and structural enhancements.
We believe buyouts of non-correlated assets or businesses also represent attractive investments since they are generally less correlated to the broader economy and provide an element of diversification to our funds' overall portfolio of private equity investments.
Hybrid Capital
During 2018, we launched our hybrid value strategy which pursues the provision to companies of, among other things, rescue financing or customized capital solutions, including senior secured and unsecured debt or preferred equity securities, often with equity-linked or equity-like upside. The strategy also focuses on structured equity investments, which are non-control or control equity opportunities with enhanced protection through structural components or a fundamental characteristic of the business, such as long-term supply agreements. Typically, in these scenarios, companies are looking for an equity partner to fund initiatives such as organic growth, acquisitions, deleveraging or build-ups. We believe Apollo’s strategic relationships with industry executives and experience in business repositioning, platform build-ups and complex integration provide a benefit to companies seeking a capital partner, especially in situations that have an element of complexity.
Natural Resources
In addition to our traditional private equity funds which pursue opportunities in nine core industries, one of which is natural resources, we have three dedicated private equity natural resources funds. In 2011, we established our first dedicated private equity natural resources fund, Apollo Natural Resources Partners, L.P. (together with its alternative investment vehicles, “ANRP I”) and assembled a team of dedicated investment professionals to capitalize on private equity investment opportunities in the natural resources industry, principally in the metals and mining, energy and select other natural resources sectors. In 2015 and 2018, we launched our second and third natural resources funds, Apollo Natural Resources Partners II, L.P. (together with its alternative investment vehicles, “ANRP II”) and Apollo Natural Resources Partners III, L.P. (together with its parallel vehicles and alternative investment vehicles, “ANRP III”), respectively. We believe we can source and execute compelling, value-oriented investment opportunities for our funds irrespective of the commodity price environment.
AP Alternative Assets, L.P. (“AAA”)
We also manage AAA, a publicly listed permanent capital vehicle. The sole investment held by AAA is its investment in AAA Investments, L.P. (“AAA Investments”).
AAA is a Guernsey limited partnership whose partners are comprised of (i) AAA Guernsey Limited (“AAA Guernsey”), which holds 100% of the general partner interests in AAA, and (ii) the holders of common units representing limited partner interests in AAA. The common units are non-voting and are listed on Euronext in Amsterdam under the symbol “AAA”. AAA
-
14
-
Guernsey is a Guernsey limited company and is owned 55% by an individual who is not an affiliate of Apollo and 45% by Apollo Principal Holdings III, L.P., an indirect subsidiary of Apollo. AAA Guernsey is responsible for managing the business and affairs of AAA. AAA generally makes all of its investments through AAA Investments, of which AAA is the sole limited partner. AAA Investments’ portfolio consists of a single opportunistic investment in Athene Holding.
Building Value in Portfolio Companies
We are a “hands-on” investor organized around nine core industries where we believe we have significant knowledge and expertise, and we remain actively engaged with the management teams of the portfolio companies of our private equity funds. We have established relationships with operating executives that assist in the diligence review of new opportunities and provide strategic and operational oversight for portfolio investments. We actively work with the management of each of the portfolio companies of the funds we manage to maximize the underlying value of the business. To achieve this, we take a holistic approach to value-creation, concentrating on both the asset side and liability side of the balance sheet of a company. On the asset side of the balance sheet, Apollo works with management of the portfolio companies to enhance the operations of such companies. Our investment professionals assist portfolio companies in rationalizing non-core and underperforming assets, generating cost and working capital savings, and maximizing liquidity. On the liability side of the balance sheet, Apollo relies on its deep credit structuring experience and works with management of the portfolio companies to help optimize the capital structure of such companies through proactive restructuring of the balance sheet to address near-term debt maturities. The companies in which our private equity funds invest also seek to capture discounts on publicly traded debt securities through exchange offers and potential debt buybacks. In addition, we have established a group purchasing program to help our funds' portfolio companies leverage the combined corporate spending among Apollo and portfolio companies of the funds it manages in order to seek to reduce costs, optimize payment terms and improve service levels for all program participants.
Exiting Investments
The value of the investments that have been made by our funds are typically realized through either an initial public offering of common stock on a nationally recognized exchange or through the private sale of the companies in which our funds have invested. We believe the advantage of having long-lived funds and investment discretion is that we are able to time our funds’ exit to maximize value.
-
15
-
Private Equity Fund Holdings
The following table presents a list of certain significant portfolio companies of our private equity funds as of
December 31, 2018
:
|
Company
|
Year of Initial Investment
|
Fund(s)
|
Buyout Type
|
Industry
|
Region
|
|||||
|
OneMain Financial
|
2018
|
Fund VIII
|
Opportunistic Buyout
|
Financial Services
|
North America
|
|||||
|
Northwoods Energy
|
2018
|
Fund VIII & ANRP II
|
Corporate Carve-Out
|
Natural Resources
|
North America
|
|||||
|
West Corporation
|
2017
|
Fund VIII
|
Opportunistic Buyout
|
Media, Telecom, Technology
|
North America
|
|||||
|
Chisholm Oil & Gas
|
2017
|
Fund VIII & ANRP II
|
Opportunistic Buyout
|
Natural Resources
|
North America
|
|||||
|
ClubCorp
|
2017
|
Fund VIII
|
Opportunistic Buyout
|
Leisure
|
North America
|
|||||
|
Double Eagle Energy III
|
2017
|
Fund VIII & ANRP II
|
Opportunistic Buyout
|
Natural Resources
|
North America
|
|||||
|
Apollo Education Group
|
2017
|
Fund VIII
|
Opportunistic Buyout
|
Consumer Services
|
Global
|
|||||
|
Lumileds
|
2017
|
Fund VIII
|
Corporate Carve-Out
|
Manufacturing & Industrial
|
Global
|
|||||
|
Rackspace
|
2016
|
Fund VIII
|
Opportunistic Buyout
|
Media, Telecom, Technology
|
North America
|
|||||
|
Diamond Resorts
|
2016
|
Fund VIII
|
Opportunistic Buyout
|
Leisure
|
North America
|
|||||
|
Outerwall
|
2016
|
Fund VIII
|
Opportunistic Buyout
|
Consumer Services
|
North America
|
|||||
|
Maxim Crane Works
|
2016
|
Fund VIII
|
Opportunistic Buyout
|
Manufacturing & Industrial
|
North America
|
|||||
|
Vistra Energy
|
2016
|
Fund VII & ANRP II
|
Distressed buyout
|
Natural Resources
|
North America
|
|||||
|
Nova KBM
|
2016
|
Fund VIII
|
Opportunistic Buyout
|
Financial Services
|
Western Europe
|
|||||
|
Pegasus
|
2016
|
ANRP II
|
Opportunistic Buyout
|
Natural Resources
|
North America
|
|||||
|
Constellis
|
2016
|
Fund VIII
|
Opportunistic Buyout
|
Business Services
|
North America
|
|||||
|
ADT
|
2015
|
Fund VIII
|
Opportunistic Buyout
|
Consumer Services
|
North America
|
|||||
|
LifePoint Health
|
2015
|
Fund VIII
|
Opportunistic Buyout
|
Consumer Services
|
North America
|
|||||
|
Verallia
|
2015
|
Fund VIII
|
Corporate Carve-Out
|
Manufacturing & Industrial
|
Western Europe
|
|||||
|
Presidio
|
2015
|
Fund VIII
|
Opportunistic Buyout
|
Business Services
|
North America
|
|||||
|
Tranquilidade
|
2015
|
Fund VIII
|
Corporate Carve-Out
|
Financial Services
|
Western Europe
|
|||||
|
Amissima
|
2015
|
Fund VIII
|
Corporate Carve-Out
|
Financial Services
|
Western Europe
|
|||||
|
American Petroleum Partners
|
2015
|
Fund VIII & ANRP II
|
Opportunistic Buyout
|
Natural Resources
|
North America
|
|||||
|
CEC Entertainment
|
2014
|
Fund VIII
|
Opportunistic Buyout
|
Leisure
|
North America
|
|||||
|
Jupiter Resources
|
2014
|
Fund VIII & ANRP I
|
Corporate Carve-Out
|
Natural Resources
|
North America
|
|||||
|
McGraw Hill Education
|
2013
|
Fund VII
|
Corporate Carve-Out
|
Consumer Services
|
North America
|
|||||
|
Watches of Switzerland (f/k/a Aurum)
|
2013
|
Fund VII
|
Opportunistic Buyout
|
Consumer & Retail
|
Western Europe
|
|||||
|
PlayAGS
|
2013
|
Fund VIII
|
Opportunistic Buyout
|
Leisure
|
North America
|
|||||
|
Talos Energy
|
2012
|
Fund VII & ANRP I
|
Opportunistic Buyout
|
Natural Resources
|
North America
|
|||||
|
Endemol Shine Group
|
2011
|
Fund VII
|
Distressed buyout
|
Media, Telecom, Technology
|
Global
|
|||||
|
Caesars Entertainment
|
2008
|
Fund VI
|
Opportunistic Buyout
|
Leisure
|
North America
|
|||||
|
Momentive Performance Materials
|
2006
|
Fund VI
|
Corporate Carve-Out
|
Chemicals
|
North America
|
|||||
|
Note:
|
The table above includes portfolio companies of Fund VI, Fund VII, Fund VIII, ANRP I and ANRP II with a remaining value greater than $250 million, excluding the value associated with any portion of such private equity funds' portfolio company investments held by co-investment vehicles.
|
Real Assets
Our real assets group has a dedicated team of multi-disciplinary real estate and infrastructure professionals whose investment activities are integrated and coordinated with our credit and private equity business segments. We take a broad view of markets and property types in targeting debt and equity investment opportunities, including the acquisition and recapitalization of real estate portfolios, platforms and operating companies and distressed for control situations, as well as infrastructure equity and debt assets. As of
December 31, 2018
, our real assets business had total and fee generating AUM of approximately
$17.9 billion
and
$12.4 billion
, respectively, through a combination of investment funds, SIAs and Apollo Commercial Real Estate Finance, Inc. (“ARI”), a publicly-traded commercial mortgage real estate investment trust managed by Apollo.
-
16
-
Real Assets AUM as of
December 31, 2018
(in billions)
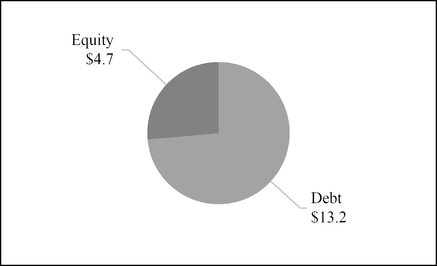
With respect to our real assets funds' equity investments, we take a value-oriented approach and our funds will invest in assets located in primary, secondary and tertiary markets across North America and Asia. The U.S. real estate equity funds we manage pursue opportunistic investments in various real estate asset classes, which historically have included hospitality, office, industrial, retail, healthcare, residential and non-performing loans. The Asia real estate equity funds we manage have a primary focus on investing in China, India and Southeast Asia, while executing Apollo’s strategy of opportunistic value investing in real estate related assets, portfolios, companies, operating platforms, and structured finance. Our real estate equity funds under management currently include (i) AGRE U.S. Real Estate Fund, L.P. (“U.S. RE Fund I”) and Apollo U.S. Real Estate Fund II, L.P. (“U.S. RE Fund II”), our U.S. focused opportunistic funds, and their related co-investment vehicles, (ii) Apollo Asia Real Estate Fund, L.P. (“Asia RE Fund”), our Asia-focused opportunistic fund, and its related co-investment vehicles and (iii) our legacy Citi Property Investors (“CPI”) business, the real estate investment management business we acquired from Citigroup in November 2010.
With respect to our real estate debt activities, our real assets funds and accounts offer financing across a broad spectrum of property types and at various points within a property’s capital structure, including first mortgage and mezzanine financing and preferred equity. In addition to ARI, we also manage strategic accounts focused on investing in commercial mortgage-backed securities and other commercial real estate loans.
With respect to our infrastructure equity strategy, during 2018 we established our first vehicles dedicated to investing primarily in infrastructure assets. These vehicles are expected to invest in a broad range of asset types, including renewables, thermal power generation, and oil and gas midstream and we seek to target long-lived assets with stable, contracted cash flows and structural downside protection. Our infrastructure debt vehicles target similar asset types as the infrastructure equity strategy with a heightened focus on the investment’s position in the capital structure and current yield.
Strategic Investment Accounts
We manage SIAs established to facilitate investments by third-party investors directly in Apollo funds and other securities. Institutional investors are expressing increasing levels of interest in SIAs since these accounts can provide investors with greater levels of transparency, liquidity and control over their investments as compared to more traditional investment funds. Based on the trends we are currently witnessing among a select group of large institutional investors, we expect our AUM that is managed through SIAs to continue to grow over time. As of
December 31, 2018
, approximately
$24 billion
of our total AUM was managed through SIAs.
Recent Developments
Subsequent to December 31, 2018, the Company determined to change the business segment in which it reports certain funds and accounts to align its segment reporting with the manner in which such funds and accounts were managed subsequent to December 31, 2018. Effective January 1, 2019, the European Principal Fund series which the Company has historically reported in the credit segment, moved to the Company’s real assets segment. In addition, one of the fund’s in the Company’s Credit
-
17
-
Opportunity Fund series as well as several other funds and accounts that generally invest in illiquid opportunistic investments, which the Company historically reported within its credit segment, moved to the Company’s private equity segment.
Fundraising and Investor Relations
We believe our performance track record across our funds and our focus on client service have resulted in strong relationships with our fund investors. Our fund investors include many of the world’s most prominent pension and sovereign wealth funds, university endowments and financial institutions, as well as individuals. We maintain an internal team dedicated to investor relations across our credit, private equity and real assets businesses.
In our credit business, we have raised private capital from prominent institutional investors and have also raised capital from public market investors, as in the case of AINV, AFT and AIF. AINV is listed on the NASDAQ Global Select Market and complies with the reporting requirements of that exchange. ATH, AFT and AIF are listed on the NYSE and comply with the reporting requirements of that exchange.
In our private equity business, fundraising activities for new funds begin once the investor capital commitments for the current fund are largely invested or committed to be invested. The investor base of our private equity funds includes both investors from prior funds and new investors. In many instances, investors in our private equity funds have increased their commitments to subsequent funds as our private equity funds have increased in size. During the fundraising effort for Fund IX, investors representing over 85% of Fund VIII’s third party capital committed to Fund IX. The single largest unaffiliated investor in Fund IX represents 4% of Fund IX’s total fund size. In addition, many of our investment professionals commit their own capital to each private equity fund.
During the management of a private equity fund, we maintain an active dialogue with the fund's investors. We host quarterly webcasts that are led by members of our senior management team and we provide quarterly reports to the investors detailing recent performance by investment. We also organize an annual meeting for our private equity funds' investors that consists of detailed presentations by the senior management teams of many of our funds' current investments. From time to time, we also hold meetings for the advisory board members of our private equity funds.
In our real assets business, we have raised capital from prominent institutional investors and we have also raised capital from public market investors, as in the case of ARI. ARI is currently listed on the NYSE under the symbol “ARI.”
Investment Process
We maintain a rigorous investment process and a comprehensive due diligence approach across all of our funds. We have developed policies and procedures, the adequacy of which are reviewed annually, that govern the investment practices of our funds. Moreover, each fund is subject to certain investment criteria set forth in its governing documents that generally contain requirements and limitations for investments, such as limitations relating to the amount that will be invested in any one company and the geographic regions in which the fund will invest. Our investment professionals are familiar with our investment policies and procedures and the investment criteria applicable to the funds that they manage. Our investment professionals interact frequently across our businesses on a formal and informal basis.
We have in place certain procedures to allocate investment opportunities among our funds. These procedures are meant to ensure that each fund is treated fairly and that transactions are allocated in a way that is equitable, fair and in the best interests of each fund, subject to the terms of the governing agreements of such funds.
Private Equity Investment Process
Our private equity investment professionals are responsible for selecting, evaluating, structuring, due diligence, negotiating, executing, monitoring and exiting investments for our traditional private equity funds, as well as pursuing operational improvements in our funds’ portfolio companies through management consulting arrangements. These investment professionals perform significant research into each prospective investment, including a review of the company’s financial statements, comparisons with other public and private companies and relevant industry data. The due diligence effort will also typically include:
|
•
|
on-site visits;
|
|
•
|
interviews with management, employees, customers and vendors of the potential portfolio company;
|
|
•
|
research relating to the company’s management, industry, markets, products and services, and competitors; and
|
|
•
|
background checks.
|
-
18
-
After an initial selection, evaluation and diligence process, the relevant team of investment professionals will prepare a detailed analysis of the investment opportunity for our private equity investment committee. Our private equity investment committee generally meets weekly to review the investment activity and performance of our private equity funds.
After discussing the proposed transaction with the deal team, the investment committee will decide whether to give its preliminary approval to the deal team to continue the selection, evaluation, diligence and negotiation process. The investment committee will typically conduct several meetings to consider a particular investment before finally approving that investment and its terms. Both at such meetings and in other discussions with the deal team, our Managing Partners and other investment professionals will provide guidance to the deal team on strategy, process and other pertinent considerations. Every private equity investment of our traditional private equity funds requires the approval of our Managing Partners.
Our private equity investment professionals are responsible for monitoring an investment once it is made and for making recommendations with respect to exiting an investment. Disposition decisions made on behalf of our private equity funds are subject to review and approval by the private equity investment committee, including our Managing Partners.
Credit and Real Assets Investment Process
Our credit and real assets investment professionals are responsible for selecting, evaluating, structuring, due diligence, negotiating, executing, monitoring and exiting investments for our credit funds and real assets funds, respectively. The investment professionals perform significant research into and due diligence of each prospective investment, and prepare analyses of recommended investments for the investment committee of the relevant fund.
Investment decisions are scrutinized by the investment committees where applicable, who review potential transactions, provide input regarding the scope of due diligence and approve recommended investments and dispositions. Close attention is given to how well a proposed investment is aligned with the distinct investment objectives of the fund in question, which in many cases have specific geographic or other focuses. The investment committee of each of our credit funds and real assets funds generally is provided with a summary of the investment activity and performance of the relevant funds on at least a monthly basis.
Overview of Fund Operations
Investors in our private equity funds and certain of our credit and real assets funds make commitments to provide capital at the outset of a fund and deliver capital when called by us as investment opportunities become available. We determine the amount of initial capital commitments for such funds by taking into account current market opportunities and conditions, as well as investor expectations. The general partner’s capital commitment is determined through negotiation with the fund’s underlying investor base. The commitments are generally available for approximately six years during what we call the investment period. We have typically invested the capital committed to such funds over a three to four year period. Generally, as each investment is realized, these funds first return the capital and expenses related to that investment and any previously realized investments to fund investors and then distribute any profits. These profits are typically shared 80% to the investors in our private equity funds and 20% to us so long as the investors receive at least an 8% compounded annual return on their investment, which we refer to as a “preferred return” or “hurdle.” Allocation of profits between fund investors and us, as well as the amount of the preferred return, among other provisions, varies for our real estate equity and many of our credit funds. Our private equity funds typically terminate ten years after the final closing, subject to the potential for two one-year extensions. Dissolution of those funds can be accelerated upon a majority vote of investors not affiliated with us and, in any case, all of our funds also may be terminated upon the occurrence of certain other events. Ownership interests in our private equity funds and certain of our credit and real assets funds are not, however, subject to redemption prior to termination of the funds.
The processes by which our credit and real assets funds receive and invest capital vary by type of fund. As noted above, certain of our credit and real assets funds have drawdown structures where investors made a commitment to provide capital at the formation of such funds and deliver capital when called by us as investment opportunities become available. In addition, we have several permanent capital vehicles with unlimited duration. Each of these publicly traded vehicles raises capital by selling shares in the public markets and these vehicles can also issue debt. We also have several credit funds which continuously offer and sell shares or limited partner interests via private placements through monthly subscriptions, which are payable in full upon a fund’s acceptance of an investor’s subscription. These hedge fund style credit funds have customary redemption rights (in many cases subject to the expiration of an initial lock-up period), and are generally structured as limited partnerships, the terms of which are determined through negotiation with the funds' underlying investor base. Management fees and performance fees that we earn for management of these credit funds and from their performance as well as the terms governing their operation vary across our credit funds.
We conduct the management of our credit, private equity and real assets funds primarily through a partnership structure, in which partnerships organized by us accept commitments and/or funds for investment from investors. Funds are generally organized as limited partnerships with respect to private equity funds and other U.S. domiciled vehicles and limited partnership
-
19
-
and limited liability (and other similar) companies with respect to non-U.S. domiciled vehicles. Typically, each fund has an investment adviser registered under the Investment Advisers Act of 1940, as amended (the “Investment Advisers Act”). Responsibility for the day-to-day operations of the funds is typically delegated to the funds’ respective investment managers pursuant to an investment management (or similar) agreement. Generally, the material terms of our investment management agreements relate to the scope of services to be rendered by the investment manager to the applicable funds, certain rights of termination in respect of our investment management agreements and, generally, with respect to certain of our credit and real assets funds (as these matters are covered in the limited partnership agreements of the private equity funds), the calculation of management fees to be borne by investors in such funds, as well as the calculation of the manner and extent to which other fees received by the investment manager from fund portfolio companies serve to offset or reduce the management fees payable by investors in our funds. The funds themselves generally do not register as investment companies under the Investment Company Act of 1940, as amended (the “Investment Company Act”), generally in reliance on Section 3(c)(7) or Section 7(d) thereof or, typically in the case of funds formed prior to 1997, Section 3(c)(1) thereof. Section 3(c)(7) of the Investment Company Act excepts from its registration requirements funds privately placed in the United States whose securities are owned exclusively by persons who, at the time of acquisition of such securities, are “qualified purchasers” or “knowledgeable employees” for purposes of the Investment Company Act. Section 3(c)(1) of the Investment Company Act exempts from its registration requirements privately placed funds whose securities are beneficially owned by not more than 100 persons. In addition, under current interpretations of the SEC, Section 7(d) of the Investment Company Act exempts from registration any non-U.S. fund all of whose outstanding securities are beneficially owned either by non-U.S. residents or by U.S. residents that are qualified purchasers.
In addition to having an investment manager, each fund that is a limited partnership also has a general partner that makes all policy and investment decisions relating to the conduct of the fund’s business. The general partner is responsible for all decisions concerning the making, monitoring and disposing of investments, but such responsibilities are typically delegated to the fund’s investment manager pursuant to an investment management (or similar) agreement. The limited partners of the funds take no part in the conduct or control of the business of the funds, have no right or authority to act for or bind the funds and have no influence over the voting or disposition of the securities or other assets held by the funds. These decisions are made by the fund’s general partner in its sole discretion, subject to the investment limitations set forth in the agreements governing each fund. The limited partners often have the right to remove the general partner or investment manager for cause or cause an early dissolution by a simple majority vote. In connection with the private offering transactions that occurred in 2007 pursuant to which we sold shares of Apollo Global Management, LLC to certain initial purchasers and accredited investors in transactions exempt from the registration requirements of the Securities Act (“Private Offering Transactions”) and the reorganization of the Company’s predecessor business (the “2007 Reorganization”), we deconsolidated certain of our credit and private equity funds that have historically been consolidated in our financial statements and amended the governing agreements of those funds to provide that a simple majority of a fund’s investors have the right to accelerate the dissolution date of the fund.
In addition, the governing agreements of our private equity funds and certain of our credit and real assets funds enable the limited partners holding a specified percentage of the interests entitled to vote, to elect not to continue the limited partners’ capital commitments for new portfolio investments in the event certain of our Managing Partners do not devote the requisite time to managing the fund or in connection with certain triggering events (as defined in the applicable governing agreements). In addition to having a significant, immeasurable negative impact on our revenue, net income and cash flow, the occurrence of such an event with respect to any of our funds would likely result in significant reputational damage to us. The loss of the services of any of our Managing Partners would have a material adverse effect on us, including our ability to retain and attract investors and raise new funds, and the performance of our funds. We do not carry any “key man” insurance that would provide us with proceeds in the event of the death or disability of any of our Managing Partners.
Fees and Performance Fees
Our revenues and other income consist principally of (i) management fees, which may be based upon a percentage of the committed or invested capital, adjusted assets, gross invested capital, fund net asset value, stockholders' equity or the capital accounts of the limited partners of the funds, and may be subject to offset as discussed in note
2
to the consolidated financial statements, (ii) advisory and transaction fees, net relating to certain actual and potential credit, private equity and real assets investments as more fully discussed in note
2
to the consolidated financial statements, (iii) income based on the performance of our funds, which consists of allocations, distributions or fees from our credit, private equity and real assets funds, and (iv) investment income from our investments as general partner in the form of principal investment income and income from other direct investments primarily in the form of net gains from investment activities as well as interest and dividend income.
The composition of our revenues will vary based on market conditions and the cyclicality of the different businesses in which we operate. Our funds’ returns are driven by investment opportunities and general market conditions, including the availability of debt capital on attractive terms and the availability of distressed debt opportunities. Our funds initially record fund investments at cost and then such investments are subsequently recorded at fair value. Fair values are affected by changes in the fundamentals
-
20
-
of the underlying portfolio company investments of the funds, the industries in which the portfolio companies operate, the overall economy as well as other market conditions.
General Partner and Professionals Investments and Co-Investments
General Partner Investments
Certain of our management companies, general partners and co-invest vehicles are committed to contribute to our funds and affiliates. As a limited partner, general partner and manager of the Apollo funds, Apollo had unfunded capital commitments as of
December 31, 2018
of
$1.2 billion
.
Managing Partners and Other Professionals Investments
To further align our interests with those of investors in our funds, our Managing Partners and other professionals have invested their own capital in our funds. Our Managing Partners and other professionals will either re-invest their performance fees to fund these investments or use cash on hand or funds borrowed from third parties. We generally have not historically charged management fees or performance fees on capital invested by our Managing Partners and other professionals directly in our credit, private equity and real assets funds.
Co-Investments
Investors in many of our funds, as well as certain other investors, may have the opportunity to make co-investments with the funds. Co-investments are investments in portfolio companies or other fund assets generally on the same terms and conditions as those to which the applicable fund is subject.
Competition
The investment management industry is intensely competitive, and we expect it to remain so. We compete globally and on a regional, industry and niche basis.
We face competition both in the pursuit of outside investors for our funds and in our funds acquiring investments in attractive portfolio companies and making other fund investments. We compete for outside investors for our funds based on a variety of factors, including:
|
•
|
investment performance;
|
|
•
|
investor perception of investment managers’ drive, focus and alignment of interest;
|
|
•
|
quality of service provided to and duration of relationship with investors;
|
|
•
|
business reputation; and
|
|
•
|
the level of fees and expenses charged for services.
|
Competition is also intense for the attraction and retention of qualified employees. Our ability to continue to compete effectively in our businesses will depend upon our ability to attract new employees and retain and motivate our existing employees.
For additional information concerning the competitive risks that we face, see “Item 1A. Risk Factors—Risks Related to Our Businesses—The investment management business is intensely competitive, which could have a material adverse impact on us.”
Regulatory and Compliance Matters
Our businesses, as well as the financial services industry generally, are subject to extensive regulation in the United States and elsewhere.
Regulation under the Investment Advisers Act.
All of the investment advisers of our funds are registered as investment advisers either directly or as a “relying adviser” with the SEC. A “relying adviser” is an investment adviser that relies on the investment adviser registration of a directly registered investment adviser. Registered investment advisers are subject to the requirements and regulations of the Investment Advisers Act. Such requirements relate to, among other things, fiduciary duties to clients, maintaining an effective compliance program, managing conflicts of interest and general anti-fraud prohibitions. Each “relying adviser” is an investment adviser registered with the SEC and, as such, is required to comply with all of the provisions of the Investment Advisers Act and the rules thereunder that apply to registered advisers.
Regulation under the Investment Company Act.
Each of AFT and AIF is a registered management investment company under the Investment Company Act. AINV is an investment company that has elected to be treated as a business development company under the Investment Company Act. Each of AFT, AIF and AINV has elected for U.S. Federal tax purposes to be treated
-
21
-
as a regulated investment company under Subchapter M of the Internal Revenue Code of 1986, as amended (the “Internal Revenue Code”). As such, each of AFT, AIF and AINV is required to distribute during each taxable year at least 90% of its ordinary income and realized, net short-term capital gains in excess of realized net long-term capital losses, if any, to its shareholders. In addition, in order to avoid excise tax, each needs to distribute during each calendar year at least 98% of its ordinary income and 98.2% of its capital gains net income for the one-year period ended on October 31st of such calendar year, plus any shortfalls from any prior year's distribution, which would take into account short-term and long-term capital gains and losses. In addition, as a business development company, AINV must not acquire any assets other than “qualifying assets” specified in the Investment Company Act unless, at the time the acquisition is made, at least 70% of AINV’s total assets are qualifying assets (with certain limited exceptions).
Real Estate Investment Trust.
ARI has elected to be taxed as a real estate investment trust, or REIT, under the Internal Revenue Code. To maintain its qualification as a REIT, ARI must distribute at least 90% of its taxable income to its shareholders and meet, on a continuing basis, certain other complex requirements under the Internal Revenue Code.
Regulation as a Broker-Dealer.
Apollo Global Securities, LLC (“AGS”) is a registered broker dealer with the SEC and is a member of the Financial Industry Regulatory Authority, Inc. (“FINRA”). From time to time, this entity is involved in transactions with affiliates of Apollo, including portfolio companies of the funds we manage, whereby AGS will earn fees for its services.
Broker-dealers are subject to regulations that cover all aspects of the securities business. In particular, as a registered broker-dealer and member of a self-regulatory organization, AGS is subject to the SEC’s uniform net capital rule, Rule 15c3-1. Rule 15c3-1 specifies the minimum level of net capital a broker-dealer must maintain and also requires that a significant part of a broker-dealer’s assets be kept in relatively liquid form. The SEC and various self-regulatory organizations impose rules that require notification when net capital falls below certain predefined criteria, limit the ratio of subordinated debt to equity in the regulatory capital composition of a broker-dealer and constrain the ability of a broker-dealer to expand its business under certain circumstances. Additionally, the SEC’s uniform net capital rule imposes certain requirements that may have the effect of prohibiting a broker-dealer from distributing or withdrawing capital and requiring prior notice to the SEC for certain withdrawals of capital.
Regulation as a Commodity Pool Operator and Commodity Trading Advisor
. Certain investment activities entered into by Apollo managers may subject those managers to provisions of the Commodities Exchange Act and oversight by the Commodities Futures Trading Commission (the “CFTC”), including registration as a commodity pool operator (“CPO”). Apollo intends to rely on exemptions from registration when available. Certain Apollo funds are deemed to be CPOs or commodity trading advisors (“CTAs”) as a result of trading commodity interests. These CPOs and CTAs are regulated by the CFTC and National Futures Association and subject to registration and periodic reporting requirements.
United States Insurance Regulation.
We are subject to insurance holding company system laws and regulations in the states of domicile of certain insurance companies for which we are (or, with respect to certain pending transactions, will be) deemed to be a control person for purposes of such laws. Specifically, under state insurance laws, we are deemed to be the ultimate parent of (i) Athene Holding’s insurance company subsidiaries, which are domiciled in Delaware, Iowa and New York, (ii) Catalina Holdings (Bermuda) Ltd.’s (“Catalina’s”) insurance company subsidiaries, which are domiciled in California, Colorado, Connecticut, the District of Columbia and New York, (iii) OneMain Holdings, Inc.’s (“OneMain’s”) insurance company subsidiaries, which are domiciled in Indiana and Texas, (iv) Venerable Holdings, Inc.’s (“Venerable’s”) insurance company subsidiary, which is domiciled in Iowa and (v) LifePoint Health, Inc.’s (f/k/a RegionalCare Hospital Partners Holdings, Inc.) (“LifePoint’s”), health maintenance organization subsidiary, which is domiciled in Michigan and (vi) Aspen Insurance Holdings Limited’s (“Aspen’s”) insurance company subsidiaries, which are domiciled in North Dakota and Texas. Each of California, Colorado, Connecticut, Delaware, the District of Columbia, Indiana, Iowa, Michigan, New York, North Dakota and Texas is a “Domiciliary State”.
The insurance holding company system laws and regulations in the Domiciliary States generally require each insurance company subsidiary to register with the insurance department in its Domiciliary State and to furnish financial and other information about the operations of companies within its holding company system. These regulations also impose restrictions and limitations on the ability of an insurance company subsidiary to pay dividends and make other distributions to its parent company. In addition, transactions between an insurance company and other companies within its holding company system, including sales, loans, investments, reinsurance agreements, management agreements and service agreements, must be on terms that are fair and reasonable and, if material or within a specified category, require prior notice and approval or non-disapproval by the applicable Domiciliary State insurance department.
The insurance laws of each of the Domiciliary States prohibit any person from acquiring direct or indirect control of a domestic insurance company or its parent company unless that person has filed a notification with specified information with that state’s Commissioner or Superintendent of Insurance (the “Commissioner”) and has obtained the Commissioner’s prior approval. Under applicable statutes in each of the Domiciliary States, the acquisition of 10% or more of the voting securities of an insurance company or its parent company is presumptively considered an acquisition of control of the insurance company, although such
-
22
-
presumption may be rebutted. Accordingly, subject to the Apollo control condition (as defined below), any person or entity that acquires, directly or indirectly, 10% or more of the voting securities of Apollo without the requisite prior approvals will be in violation of these laws and may be subject to injunctive action requiring the disposition or seizure of those securities or prohibiting the voting of those securities, or to other actions that may be taken by the applicable state insurance regulators.
The New York State Department of Financial Services (the “NYSDFS”) adopted an amendment to its holding company system regulations which requires prospective acquirers of New York domiciled insurers to provide greater disclosure with respect to intended changes to the business operations of the insurer, and which expressly authorizes the NYSDFS to impose additional conditions on such an acquisition and limit changes that the acquirer may make to the insurer’s business operations for a specified period of time following the acquisition without the NYSDFS’ prior approval. In particular, the amendment provides the NYSDFS with the specific authority to require acquirers of New York domiciled life insurers to post assets in a trust account for the benefit of the target company’s policyholders. In making such determination, the NYSDFS may consider whether the acquirer is, or is controlled by or under common control with, an investment manager such as Apollo. The National Association of Insurance Commissioners (the “NAIC”) has also published in its Financial Analysis Handbook specific narrative guidance for state insurance examiners to consider in reviewing applications for an acquisition of an insurer by a private equity firm.
In addition, many U.S. state insurance laws require prior notification to state insurance departments of an acquisition of control of a non-domiciliary insurance company doing business in that state if the acquisition would result in specified levels of market concentration. While these pre-acquisition notification statutes do not authorize the state insurance departments to disapprove the acquisition of control, they authorize regulatory action in the affected state, including requiring the insurance company to cease and desist from doing certain types of business in the affected state or denying a license to do business in the affected state, if particular conditions exist, such as substantially lessening competition in any line of business in such state. Any transactions that would constitute an acquisition of control of Apollo may require prior notification in those states that have adopted pre-acquisition notification laws. These laws may discourage potential acquisition proposals and may delay, deter or prevent an acquisition of control of Apollo (in particular through an unsolicited transaction), even if Apollo might consider such transaction to be desirable for its shareholders.
Currently, there are proposals to increase the scope of regulation of insurance holding companies in both the United States and internationally. The NAIC has adopted amendments to the Holding Company Model Act that introduced the concept of “enterprise risk” within an insurance holding company system and imposed more extensive informational reporting regarding parents and other affiliates of insurance companies, with the purpose of protecting domestic insurers from enterprise risk, including requiring an annual enterprise risk report by the ultimate controlling person identifying the material risks within the insurance holding company system that could pose enterprise risk to domestic insurers. Changes to existing NAIC model laws or regulations must be adopted by individual states or foreign jurisdictions before they will become effective. To date, each of the Domiciliary States has enacted laws to adopt such amendments.
Internationally, the International Association of Insurance Supervisors (the “IAIS”) is in the process of adopting a Common Framework for the Supervision of Internationally Active Insurance Groups (“ComFrame”). ComFrame will be applicable to entities which meet the IAIS’ criteria for internationally active insurance groups (or "IAIGs") and are designated as such. Under the current draft of ComFrame, an IAIG is defined as an insurance group which has (i) premiums written in three or more jurisdictions, with the percentage of gross premiums written outside the home jurisdiction comprising at least 10% of the group's total gross written premium, and (ii) based on a rolling three-year average, total assets of at least $50 billion, or gross written premiums of at least $10 billion. ComFrame is expected to include measures such as group supervision, group capital requirements, uniform standards for insurer corporate governance, enterprise risk management and other control functions and resolution planning. In 2016 the IAIS released a public consultation requesting comments on their risk-based global insurance capital standard (“ICS”) which is the group capital component of ComFrame. The current version of the ICS is in the extended field testing stage. When field testing is completed in 2019, the ICS will be implemented in the following two phases: In the first phase, which will last for five years and which is referred to as the “monitoring period,” the ICS will be used for confidential reporting to group-wide supervisors and discussion in supervisory colleges, and the ICS will not be used as a prescribed capital requirement. After the monitoring period, the ICS will be implemented as a group-wide prescribed capital standard. In addition, in the United States, the NAIC and the Federal Reserve Board are developing an aggregation method to a group capital calculation. The NAIC has stated that the group capital calculation will be a regulatory tool and will not constitute a requirement or standard; however, it is currently expected that the calculation methodology will incorporate existing risk-based capital concepts. In the United States, the NAIC has also promulgated additional amendments to its insurance holding company system model law that address “group wide” supervision of internationally active insurance groups. To date, each of the Domiciliary States (except for Colorado, the District of Columbia, Michigan and New York) has adopted a form of these provisions. The NAIC has made these amendments to the insurance holding company system model law a part of its accreditation standards for state solvency regulation beginning January 1, 2020, which is likely to motivate the remaining Domiciliary States to adopt the amendments. We cannot predict with any degree of certainty the additional capital requirements, compliance costs or other burdens these requirements may impose on us and our insurance company affiliates.
-
23
-
In addition, state insurance departments also have broad administrative powers over the insurance business of our insurance company affiliates, including insurance company licensing and examination, agent licensing, establishment of reserve requirements and solvency standards, premium rate regulation, admissibility of assets, policy form approval, unfair trade and claims practices and other matters. State regulators regularly review and update these and other requirements.
Although the federal government does not directly regulate the insurance business, federal legislation and administrative policies in several areas, including pension regulation, age and sex discrimination, financial services regulation, securities regulation and federal taxation, can significantly affect the insurance business. The Dodd-Frank Wall Street Reform and Consumer Protection Act (the “Dodd-Frank Act”) established the Federal Insurance Office (the “FIO”) within the U.S. Department of the Treasury headed by a Director appointed by the Treasury Secretary. While currently not having a general supervisory or regulatory authority over the business of insurance, the Director of the FIO performs various functions with respect to insurance, including serving as a non-voting member of the Financial Stability Oversight Council (“FSOC”) and making recommendations to the FSOC regarding non-bank financial companies to be designated as systemically important financial institutions (“SIFIs”). The Director of the FIO has also submitted reports to the U.S. Congress on (i) modernization of U.S. insurance regulation (provided in December 2013) and (ii) the U.S. and global reinsurance market (provided in November 2013 and January 2015, respectively). Such reports could ultimately lead to changes in the regulation of insurers and reinsurers in the U.S.
In addition, the Dodd-Frank Act authorized the Treasury Secretary and the Office of the U.S. Trade Representative to negotiate covered agreements. A covered agreement is an agreement between the United States and one or more foreign governments, authorities or regulatory entities, regarding prudential measures with respect to insurance or reinsurance. Pursuant to this authority, in September 2017, the U.S. and the EU signed a covered agreement to address, among other things, group supervision and reinsurance collateral requirements (the “EU Covered Agreement”). In addition, on December 11, 2018, the U.S. Department of the Treasury and the Office of the U.S. Trade Representative announced their intent to sign a Bilateral Agreement between the U.S. and the United Kingdom on Prudential Measures Regarding Insurance and Reinsurance in anticipation of the United Kingdom’s exit from the European Union in March 2019 (the “U.K. Covered Agreement”). The U.K. Covered Agreement is subject to a 90-day notification period to the U.S. Congress before it can be signed and come into effect. U.S. state regulators have 60 months, or five years, to adopt reinsurance reforms removing reinsurance collateral requirements for EU and U.K. reinsurers that meet the prescribed minimum conditions set forth in the EU Covered Agreement and U.K. Covered Agreement or else state laws imposing such reinsurance collateral requirements may be subject to federal preemption. The NAIC is currently working to adopt amendments to the Credit for Reinsurance Model Law and Regulation to conform to the requirements of the EU Covered Agreement and U.K. Covered Agreement. The reinsurance collateral provisions of the EU Covered Agreement or U.K. Covered Agreement may increase competition, in particular with respect to pricing for reinsurance transactions, by lowering the cost at which competitors of the reinsurance subsidiaries of our insurance company affiliates, such as Athene Holding’s direct, wholly owned subsidiary, Athene Life Re Ltd. (“ALRe”), are able to provide reinsurance to U.S. insurers.
Bermuda Insurance Regulation.
We are subject to certain insurance laws and regulations in Bermuda, where Athene Holding’s direct, wholly owned subsidiary, ALRe, is registered as a Class E insurer. ALRe is subject to regulation and supervision by the Bermuda Monetary Authority (“BMA”) and compliance with all applicable Bermuda law and Bermuda insurance statutes and regulations, including but not limited to the Insurance Act of 1978 (Bermuda) and the rules and regulations promulgated thereunder (the “Bermuda Insurance Act”).
Under the Bermuda Insurance Act, the BMA maintains supervision over the “controllers” of all registered insurers in Bermuda. For these purposes, a “controller” includes a “shareholder controller.” The definition of shareholder controller is set out in the Bermuda Insurance Act but generally refers to (a) a person who holds 10% or more of the shares carrying rights to vote at a shareholders’ meeting of the registered insurer or its parent company, (b) a person who is entitled to exercise 10% or more of the voting power at any shareholders’ meeting of such registered insurer or its parent company or (c) a person who is able to exercise significant influence over the management of the registered insurer or its parent company by virtue of its shareholding or its entitlement to exercise, or control the exercise of, the voting power at any shareholders’ meeting.
Apollo is a shareholder controller as defined above of (a) ALRe, a Bermuda Class E insurance company and a wholly owned subsidiary of Athene Holding, a company listed on the New York Stock Exchange, (b) Athora Life Re Ltd., a Bermuda Class E insurance company and a wholly owned subsidiary of Athora, a Bermuda private company, (c) Catalina General Insurance Ltd, a Bermuda Class 3A and Class C insurer and a wholly owned subsidiary of Catalina and (d) Aspen Bermuda Limited, a Class 4 insurer, and wholly owned subsidiary of Aspen.
The Bermuda Insurance Act imposes certain notice requirements upon any person that has become, or as a result of a disposition ceased to be, a shareholder controller, and failure to comply with such requirements is an offense punishable by a fine or imprisonment or both. Where the shares of a registered insurer, or the shares of its parent company, are traded on a recognized stock exchange, the required notices must be given to the BMA within 45 days after such person becomes, or as a result of a disposition ceases to be, a shareholder controller. Where neither the shares of a registered insurer nor the shares of its parent
-
24
-
company are traded on a recognized stock exchange (i.e., private companies), the required notices must be given to the BMA (1) without objection from the BMA, at least 45 days before such person becomes a shareholder controller and (2) before such person, as a result of a disposition, ceases to be a shareholder controller.
In addition, the BMA may file a notice of objection to any person or entity who has become a controller of any description where it appears that such person or entity is not, or is no longer, fit and proper to be a controller of the registered insurer. Any person or entity who continues to be a controller of any description after having received a notice of objection is guilty of an offense and liable on summary conviction to a fine or imprisonment or both.
The BMA may, in accordance with the Bermuda Insurance Act and in respect of an insurance group, determine whether it is appropriate for it to act as its group supervisor. The BMA has not yet designated ALRe for group supervision; accordingly, our insurance company affiliates are not currently subject to group supervision by the BMA. The BMA may, however, exercise its authority to act as group supervisor for our insurance company affiliates in the future. We cannot predict with any degree of certainty the additional capital requirements, compliance costs or other burdens that such a determination may impose on us and our insurance company affiliates.
European Insurance Regulation.
Apollo is considered the parent of certain European insurance companies and insurance intermediaries for purposes of certain European insurance laws. A new European solvency framework and prudential regime for insurers and reinsurers, under the Solvency II Directive 2009/138/EC (“Solvency II”), took effect in full on January 1, 2016. Solvency II is a regulatory regime which imposes economic risk-based solvency requirements across all EU Member States and consists of three pillars: Pillar I-quantitative capital requirements, based on a valuation of the entire balance sheet; Pillar II-qualitative regulatory review, which includes governance, internal controls, enterprise risk management and supervisory review process; and Pillar III-market discipline, which is accomplished through reporting of the insurer’s financial condition to regulators and the public. Solvency II is supplemented by European Commission Delegated Regulation (E.U.) 2015/35 (the “Delegated Regulation”), other European Commission “delegated acts” and binding technical standards, and guidelines issued by the European Insurance and Occupational Pensions Authority (“EIOPA”). The Delegated Regulation sets out detailed requirements for individual insurance and reinsurance undertakings, as well as for groups, based on the overarching provisions of Solvency II, which together make up the core of the single prudential rulebook for insurance and reinsurance undertakings in the EU.
The Insurance Distribution Directive 2016/97 (“IDD”) came into force on October 1, 2018 and replaced the Insurance Mediation Directive 2002/92/EC. It aims to enhance consumer protection when buying insurance and to support competition between insurance distributors by creating a level playing field. In addition, the IDD aims to ensure consistent prudential standards for insurance intermediaries, through enhanced conduct standards, thereby improving consumer protection and effective competition.
Following the implementation of Solvency II and the IDD, regulators may continue to issue guidance and other interpretations of applicable requirements, which could ultimately require our EU insurance company affiliates or our EU insurance intermediary affiliates (respectively) to make adjustments, which could impact their businesses.
Insurers and reinsurers established in a Member State of the EU have the freedom to establish branches in, and provide services to, all European Economic Area (“EEA”) states through “passporting” rights. This right currently applies to the U.K. Regulated Entities (defined below). However, following the U.K. referendum on June 23, 2016 in which a majority of the voting U.K. citizens voted in favor of the U.K. leaving the EU (“Brexit”), the U.K. withdrawal from the EU on March 29, 2019 (unless an extension to this deadline is agreed between the U.K. government and the EU) will lead to a loss of passporting rights for financial institutions in the U.K., except to the extent that any aspect of the regime is preserved in a separate agreement between the EU and the U.K. Following the House of Commons vote on January 15, 2019, rejecting the U.K. government’s withdrawal from the EU and pending agreement on an alternative solution, there remains considerable uncertainty as to exactly when Brexit will take effect; the extent of any transitional period allowing a continuation of passporting; and the ultimate structure of the U.K.’s future relationship in the EU, creating continuing uncertainty as to the full extent to which the businesses of the U.K. Regulated Entities could be adversely affected by Brexit. See “Item 1A. Risk Factors—Risks Related to Our Businesses—
Difficult market or economic conditions may adversely affect our businesses in many ways, including by reducing the value or hampering the performance of the investments made by our funds or reducing the ability of our funds to raise or deploy capital, each of which could materially reduce our revenue, net income and cash flow and adversely affect our financial prospects and condition.”
United Kingdom Insurance Regulation.
Apollo is considered the parent of certain insurance company subsidiaries of Catalina and Aspen, including Aspen Insurance U.K. Limited (“Aspen U.K.”), which is domiciled in the United Kingdom and operates branch jurisdictions in Ireland and Switzerland, and Aspen Managing Agency Limited (“AMAL” and together with Aspen U.K., the “U.K. Insurance Entities”). AMAL is a managing agent of Aspen’s Lloyd’s Syndicate Services Limited (“AUSSL”) and Aspen Risk Management Limited (“ARML”), each of which are also domiciled in the United Kingdom (together the “U.K. Intermediary Entities” and together with the U.K. Insurance Entities the “U.K. Regulated Entities”) for purposes of certain U.K.
-
25
-
insurance regulations. The U.K. Insurance Entities are each authorized by the Prudential Regulation Authority (“PRA”) and regulated by both the PRA and the Financial Conduct Authority (“FCA”). The U.K. Intermediary Entities are only authorized and regulated by the FCA. In addition, AMAL is a Lloyd’s managing agent and is therefore also regulated by Lloyd’s, as is AUSSL, which is a Lloyd’s corporate member.
The objectives of the PRA are to promote the safety and soundness of all firms it supervises and to secure an appropriate degree of protection for policyholders. The objectives of the FCA are to ensure customers receive financial services and products that meet their needs, to promote sound financial systems and markets and to ensure that firms are stable and resilient with transparent pricing information, compete effectively, have the interests of their customers and the integrity of the market at the heart of how they run their business. The PRA has responsibility for the prudential regulation of banks and insurers, while the FCA has responsibility for the conduct of business regulation in the wholesale and retail markets. The PRA and the FCA adopt separate methods of assessing regulated firms on a periodic basis. Each of the PRA and FCA apply rules to support their statutory and operational objectives. PRA rules are maintained in a PRA Rulebook, which includes rules for Solvency II insurance firms (and, also, for insurers that do not fall within Solvency II) that closely reflect the provisions of Solvency II, including requirements for Solvency II insurance firms to meet economic risk-based solvency requirements and to adhere to governance and risk management requirements and reporting and disclosure requirements. In addition to Solvency II requirements, the PRA Rulebook contains Fundamental Rules (high-level principles), relating to individuals in senior management and general provisions relating to the supervision of U.K. insurance firms. The FCA Handbook contains rules that concern the conduct of firms including the scope of systems and controls and conduct of business requirements.
Further, as AMAL is regulated by Lloyd’s as a Lloyd’s Managing Agent, it is also subject to the Lloyd’s Minimum Standards, which contain requirements representing the minimum level of performance required by Lloyd’s entities, the Lloyd’s By-Laws and other Lloyd’s rules and requirements (together the “Lloyd’s Rules”). AUSSL, as a Lloyd’s corporate member, is also subject to the Lloyd’s Rules.
In addition, in certain situations, subject to the required application of, as appropriate, the U.K. Covered Agreement, Solvency II and other applicable law and regulation, there may also be scope for elements of group supervision to be exercised by the PRA (or other relevant EEA Member State or non-EEA regulator, such as the BMA).
Under the Financial Services and Markets Act 2000 (the “FSMA”), the prior consent of the PRA and/or FCA, as applicable (depending on the regulated entity), is required, before any person can be become a “controller” or increase its control over any regulated company, including the U.K. Regulated Entities, or over the parent undertaking of any regulated company. No prior approval for reducing control below one of the thresholds referred to below is needed, though notification must still be given to the appropriate regulator of the relevant transaction. In addition, the authorized firm itself is expected to discuss any prospective changes of which it is aware with the appropriate regulator, regardless of whether the controller or the proposed controller proposes to submit a change in control application. A proposed “controller” for the purposes of the PRA controller regime, which is applicable to the U.K. Insurance Entities, is any natural or legal person who holds (either alone or in concert with others) 10% or more of the shares or voting power in the relevant company or its parent undertaking. In respect of increases and decreases, the relevant thresholds are 20%, 30% and 50% or an acquired insurance company becoming (or ceasing to be) a subsidiary undertaking of the acquirer. However, a proposed “controller” for the purposes of the FCA controller regime, which is applicable to the U.K. Intermediary Entities, is any natural or legal person who holds (either alone or in concert with others) 20% or more of the shares or voting power in the relevant company or its parent undertaking. This 20% threshold is the only threshold that is applicable to the Insurance Intermediary Entities. In both cases, the appropriate regulator has 60 working days from the day on which it acknowledges the receipt of a complete notice of control to determine whether to approve the new controller or object to the transaction, although if the regulator requires further information to be provided in order to complete its review this period will be interrupted for up to 30 working days while the regulator is awaiting the provision of that further information. If the approval is given, it may be given unconditionally or subject to conditions. Breach of the requirement to notify the regulator of a decision to acquire or increase control, or of the requirement to obtain approval before completing the relevant control transaction is a criminal offense attracting potentially unlimited fines. The relevant regulator can also seek other remedies, including suspension of voting rights or a forced disposition of shares acquired without prior approval. As a result of the above requirements, direct controllers, and holding companies who indirectly acquire control of the U.K. Regulated Entities are required to apply for PRA and/or FCA approval prior to acquiring such entities. In addition, a similar process also applies for Lloyd’s Managing Agents and Lloyd’s Corporate Members, therefore the acquisition of control of these types of entities will also require separate Lloyd’s approval. The “controller” thresholds for such entities are the same as the thresholds that are applicable to the U.K. Insurance Entities.
Under English law, all companies are restricted from declaring a dividend to their shareholders unless they have “profits available for distribution”. The calculation as to whether a company has sufficient profits is based on its accumulated realized profits minus its accumulated realized losses. U.K. insurance regulatory rules do not prohibit the payment of dividends, but the PRA requires that insurance companies maintain certain solvency margins and may restrict the payment of a dividend by any of the U.K. Insurance Entities.
-
26
-
Irish Insurance Regulation.
Apollo is deemed to hold an indirect qualifying holding in (i) Catalina Insurance Ireland DAC, which is Catalina’s wholly-owned Irish subsidiary insurance undertaking, and (ii) Athora Ireland plc, which is a direct wholly-owned subsidiary of ALRe, each of which are authorized and regulated by the Central Bank of Ireland (the “CBI”). In addition, Apollo will be deemed to hold an indirect qualifying holding in Aspen Insurance Ireland Designated Activity Company, which is currently pending authorization by the CBI, and upon such authorization, will be Aspen’s wholly-owned Irish subsidiary.
Pursuant to Solvency II, and related law and regulation of Ireland, in regard to an Irish authorized and regulated insurance undertaking, such as Catalina Insurance Ireland DAC or Aegon Ireland plc, the CBI has broad supervisory and administrative powers. The CBI has power over such matters as scope of authorized activity, standards of solvency, investments, reporting requirements relating to capital structure, ownership, financial condition and general business operations, special reporting and prior approval requirements with respect to certain transactions, reserves for unpaid losses and related matters, reinsurance, minimum capital and surplus requirements, dividends and other distributions to shareholders, periodic examinations and annual and other report filings. In relevant prescribed scenarios, subject to the required application of, as appropriate, the EU Covered Agreement, Solvency II and other applicable law and regulation, there may also be scope for elements of group supervision to be exercised by the CBI (or other EEA Member State or non-EEA regulator, such as the BMA).
For the purposes of Solvency II, as implemented in Ireland, a “qualifying holding” means a direct or indirect holding in an insurance company which represents 10% or more of the capital or of the voting rights or which makes it possible to exercise a significant influence over the management of the company. With respect to each of Catalina Insurance Ireland DAC and Athora Ireland plc, Solvency II, as implemented in Ireland, prohibits any person from acquiring, directly or indirectly, such a qualifying holding unless: (a) the proposed acquirer has notified the CBI of the acquisition; (b) the CBI has acknowledged receipt of that notification and; (c) either the statutory assessment period in relation to the acquisition has ended and the CBI has not notified the proposed acquirer that it opposes the acquisition, or the CBI has notified the proposed acquirer that it does not oppose the acquisition. If a proposed acquirer purports to complete a proposed acquisition in contravention of the aforementioned, as matter of Irish law: (i) the purported acquisition is not effective to pass title to any share or any other interest; and (ii) any exercise of powers based on the purported acquisition of the holding concerned is void.
Italian Insurance Regulation
. Apollo is deemed to be the holder of an indirect qualifying holding in (i) Amissima Assicurazioni S.p.A. and (ii) Amissima Vita S.p.A., which are Italian insurance undertakings, duly authorized and regulated by the Italian insurance regulator (“Istituto per la vigilanza sulle Assicurazioni” or “IVASS”). The two Italian insurance companies belong to the Amissima Italian insurance group, whose parent undertaking is Amissima Holding S.r.l..
Pursuant to Solvency II, as implemented within the Italian legal framework, Italian insurance undertakings (such as Amissima Assicurazioni S.p.A. and Amissima Vita S.p.A.) are subject to extensive supervisory powers of IVASS on a broad array of matters including calculation of technical provisions, own funds requirements, solvency capital requirements, ownership structure, internal governance and organizational requirements, reporting obligations and extraordinary transactions. Moreover, in accordance with the provisions set forth under the EU Covered Agreement, Solvency II and other relevant provisions of law and regulation, supervision at a group level may be exercised by IVASS or by regulator of a EEA or non-EEA State.
With particular regard to the ownership structure of Italian insurance undertakings, in accordance with Solvency II regime, IVASS must authorize, in advance any acquisition of participations in an insurance undertaking amounting to a controlling interest or the acquisition of a qualifying holding; for such purpose, a “qualifying holding” means a direct or indirect holding in an insurance undertaking which represents 10% or more of the capital or of the voting rights or which makes it possible to exercise a significant influence over the management of that undertaking.
IVASS must issue the authorization for acquiring qualifying holdings in Italian insurance companies when the conditions for the sound and prudent management of the undertaking are met. The voting rights and the other rights which make it possible to exercise an influence over the insurance undertaking may not be exercised when they pertain to participations for which the IVASS authorization has not been obtained, or has been suspended or withdrawn, and the participation shall be transferred within the deadline established by IVASS.
IVASS may ask insurance undertakings as well as companies and bodies of any nature which own participations in said undertakings to indicate the names of the holders of participations as they are recorded in the share register. To verify all financial interrelationships between insurance undertakings and their parent companies, subsidiaries and affiliated companies, IVASS may require that such companies produce information and records and make checks.
Portuguese Insurance Regulation. Apollo is deemed to hold an indirect qualifying holding in Seguradoras Unidas, which is authorized and regulated by the Portuguese Insurance Supervisory Authority (Autoridade de Supervisão de Seguros e Fundos de Pensões or the “ASF”).
-
27
-
Pursuant to Solvency II, and Portuguese related laws and regulations applicable to a Portuguese authorized and regulated insurance undertaking, such as Seguradoras Unidas, ASF has broad supervisory and administrative powers over such matters as scope of authorized activity, standards of solvency, investments, reporting requirements relating to capital structure and the existence of shareholders agreements, ownership, pledge over shares, financial condition and general business operations, special reporting and prior approval requirements with respect to certain amendments to Seguradoras Unidas’ bylaws, certain transactions (including but not limited to intra-group transactions which may, in certain cases, be subject to prior approval of ASF), reserves for unpaid losses and related matters, reinsurance, minimum capital and surplus requirements, reimbursement of supplementary capital, dividends and other distributions to shareholders, periodic examinations and other report filings. According to Solvency II and other applicable law and regulation, ASF may also exercise its supervision powers over the Apollo group. In fact, currently, ASF supervision at group level also includes the following Seguradoras Unidas’ holding companies: Calm Eagle Holdings, S.à.r.l (Luxembourg), Calm Eagle Intermediate Holdings, S.à.r.l. (Luxembourg), Calm Eagle Parent Holdings, SCA (Luxembourg) and AP VIII Calm Eagle Holdings, SCA (Luxembourg).
For the purposes of Solvency II, as implemented in Portugal, a “qualifying holding” means a direct or indirect holding in an insurance company which represents 10% or more of the capital or of the voting rights or which makes it possible to exercise a significant influence over the management of the company. With respect to Seguradoras Unidas, Solvency II, as implemented in Portugal, prohibits any person from acquiring, directly or indirectly, such a qualifying holding (or a part of it, to the extent the relevant acquirer becomes the owner of a stake higher than 20%, one third or 50%) unless: (a) the proposed acquirer and seller has notified ASF of the acquisition; (b) ASF has acknowledged receipt of that notification and; (c) either (i) ASF has notified the proposed acquirer that it does not oppose the acquisition or (ii) the statutory assessment period in relation to the acquisition has ended and ASF has not notified the proposed acquirer that it opposes the acquisition. If a proposed acquirer purports to complete a proposed acquisition in contravention of the aforementioned, as a matter of Portuguese law ASF may, without prejudice of other applicable sanctions (including requesting the annulment of the transaction or determining the suspension of the voting rights in the part exceeding the above-mentioned thresholds (20%, one third or 50%)).
Swiss Insurance Regulation.
Apollo is considered an indirect qualified participant of Glacier Reinsurance Ltd. (“Glacier Re”) for purposes of certain Swiss insurance laws. As a qualified indirect participant of Glacier Re, a reinsurance company domiciled in Switzerland holding a license for the operation of a reinsurance business in the insurance class C1 “Reinsurance by insurance companies that conduct solely reinsurance business,” Apollo is subject to certain provisions of Swiss insurance supervisory laws and regulations. Glacier Re is subject to regulation and supervision by the Swiss Financial Market Supervisory Authority FINMA (“FINMA”) and compliance with all applicable laws and regulations of Switzerland, including but not limited to the Swiss Federal Act of 17 December 2004 on the Supervision of Insurance Companies (“ISA”), its implementing ordinances as well as circulars and guidelines of FINMA.
Any person who intends to directly or indirectly participate in a Swiss domiciled insurance or reinsurance undertaking is required to notify FINMA of such intent if the participation reaches or exceeds the thresholds of 10%, 20%, 33% or 50% of the capital or voting rights of the insurance or reinsurance undertaking. Similarly, any person who intends to decrease its direct or indirect participation in an insurance undertaking domiciled in Switzerland below the thresholds of 10%, 20%, 33% or 50% of the capital or voting rights or to change the participation in a way that the insurance or reinsurance undertaking is no longer a subsidiary must notify FINMA. Consequently, although indirect shareholders of Glacier Re are not directly supervised by FINMA, an intended change of the qualified direct or indirect participation in Glacier Re may require a notification to FINMA. FINMA may disapprove such change in qualified participation or subject the change to certain conditions, if the nature or scope of the participation potentially jeopardizes the interests of the Swiss domiciled reinsurance company or the insured. Failure to comply with such notification is punishable by a fine of up to CHF 500,000 in case of intent and up to CHF 150,000 in case of negligence. In addition, if a change of persons who directly or indirectly hold a participation of 10% of the capital or voting rights or who may otherwise materially influence the business conduct of Glacier Re has occurred, Glacier Re is required to file a submission to seek for FINMA’s approval of the relevant change of its regulatory business plan under art. 4 para. 2 lit. f ISA (business plan form F) within 14 days upon the occurrence of the event.
Furthermore, a substantial dividend distribution or other form of profit repatriation from Glacier Re to its shareholders may potentially qualify as a change of the regulatory business plan of Glacier Re under art. 4 para. 2 lit. d ISA, if such substantial dividend distribution would be considered as a relevant change of the financial resources and reserves of Glacier Re. Such change of the business plan must be notified to FINMA no later than 14 days after the occurrence of the event and is subject to FINMA’s approval. To this extent, future dividend distributions or other forms of profit repatriation might be subject to FINMA’s approval. Apollo is also considered the parent or qualified participant of Aspen U.K. Aspen U.K. holds a FINMA license for a Swiss branch of a foreign insurance undertaking for its Swiss insurance branch Aspen Insurance UK Limited, London, Zurich Insurance Branch. Furthermore, Aspen U.K. holds a reinsurance branch in Switzerland, Aspen Insurance UK Limited, London, Zurich Branch. A change of a direct or indirect participation in a foreign insurance undertaking (in the present case Aspen U.K.) that holds a Swiss insurance branch license does not, in principle, trigger any Swiss insurance regulatory notification or approval requirements. However, Aspen U.K. might notify FINMA out of courtesy of such changes.
-
28
-
German Insurance Regulation.
Apollo is deemed to hold an indirect qualifying holding in German (i) Athora Deutschland Verwaltungs GmbH, (ii) Athora Deutschland Holding GmbH & Co. KG, (iii) Athora Deutschland GmbH, (iv) Athora Lebensversicherung AG and (v) Athora Pensionskasse AG, which are either German regulated insurance undertakings or German insurance holding companies (together the “Regulated German Entities”). The indirect qualifying holding in the Regulated German Entities is attributed to Apollo via its indirect interest in Athora Holding Ltd. (“Athora”), which is the 100% indirect parent company of the Regulated German Entities. The Regulated German Entities are subject to the relevant laws and regulations applicable to insurers or insurance holding companies in Germany which regulate and mandate, among other things, eligibility criteria for investments, policyholder participation in income, accounting principles, corporate governance requirements, regulatory capital, reporting, insurance contracts, insurance distribution requirements, consumer protection laws, data protection requirements (including GDPR) and anti-money-laundering requirements. The Regulated German Entities are subject to supervision by the German Federal Financial Supervisory Authority, Bundesanstalt für Finanzdienstleistungsaufsicht (“BaFin”). BaFin is the central financial regulatory authority for Germany and has wide powers to interpret and execute the insurance supervisory law in Germany, in particular via issuing regulatory ordinances and guidelines as well as orders and decisions with a view to individual insurance undertakings or insurance holding companies.
Pursuant to German regulatory law, the direct or indirect acquisition of a qualified participating interest in a German insurance undertaking or the increase of a qualified participating interest in a German insurance undertaking exceeding certain thresholds is subject to BaFin approval or the expiration of a statutory non-objection period. Generally, indirectly or directly acquiring a 10% or greater capital or voting interest in an insurance undertaking or otherwise obtaining the ability to significantly influence the management of the insurance undertaking is considered a qualified participating interest under German insurance regulatory laws. Laws such as these prevent any person from directly or indirectly acquiring qualified participating interests in any of the German insurance undertakings unless that person has filed a notification requiring specified information with BaFin and has obtained BaFin’s prior approval or waited for the expiration of a statutory non-objection period after having filed a formally complete notification. Since Apollo is holding indirectly a significant interest in the German insurance undertakings the acquisition of an interest in Apollo could qualify as an acquisition of an indirect qualified participating interest in German insurance undertakings on a look through basis.
Additional Insurance Regulated Jurisdictions.
Aspen also carries on insurance business in jurisdictions located outside of the EU, U.K., Switzerland and the U.S. through its Jersey-domiciled insurance company subsidiary and its Singapore Lloyd’s service company, the branch locations of Aspen U.K., which operate in Australia, Canada, Singapore, in addition to its European branches located in Ireland and Switzerland and the branch location of AUSSL, which operates in Dubai. The operations of these subsidiaries and branches are subject to the local regulatory and supervisory schemes in the jurisdictions in which they operate, which vary widely from country to country; however, regulators typically grant licenses to operate and control an insurance business in that jurisdiction. In general, insurance regulators in these jurisdictions have the administrative power to supervise the registration of agents, regulation of product features and product approvals, asset allocation, minimum capital requirements, solvency and reserves, policyholder liabilities, and investments. Regulatory authorities may also regulate affiliations with other financial institutions, shareholder structures and may impose restrictions on declaring dividends and the ability to effect certain capital transactions, and many jurisdictions require insurance companies to participate in policyholder protection schemes.
German Banking Regulation.
Apollo is deemed to be the holder an indirect qualifying (but not controlling) interest in the German bank Oldenburgische Landesbank AG (“OLB”) and, following the completion of the pending acquisition of Wüstenrot Bank AG Pfandbriefbank (“WRB”) by OLB, also of WRB.
While the holder of a qualifying interest in a bank is not subject to the full scope of European and German financial regulatory supervision, certain limited requirements set out in, among others, the German Banking Act (Kreditwesengesetz) apply. Compliance with these rules is supervised by the German Federal Financial Services Authority (Bundesanstalt für Finanzdienstleistungsaufsicht), the German Central Bank (Deutsche Bundesbank) and the European Central Bank (the “ECB”). Under these requirements, holders of qualifying interest must, among others, (i) make certain notifications to the competent authorities (e.g., of the intention to reduce or increase the interest below or above certain thresholds, of the appointment of new authorized representatives or general partners, and in case control is obtained over certain other EEA regulated entities such as credit institutions or insurance companies), and (ii) maintain certain standards of reliability, transparency (enabling effective supervision), and financial stability.
Noncompliance with the aforementioned requirements may result in, among others, administrative fines or administrative measures such as a prohibition of the intended increase of a qualifying holding, a prohibition to exercise the voting rights in the bank, or mandatory divestment of the qualifying interest.
Slovenian Banking Regulation.
Funds managed by Apollo hold a controlling stake in NOVA KREDITNA BANKA MARIBOR d.d. (“NKBM”), a Slovenian banking institution. As such, Apollo is considered to be a holder an indirect qualifying interest in NKBM. NKBM is a significant supervised entity subject to direct supervision of the ECB. Under Regulation (EU) No
-
29
-
575/ 2013 of the European Parliament and of the Council of 26 June 2013 on prudential requirements for credit institutions and investment firms (“CRR”), NKBM is also required to disclose relevant information and data on the consolidated situation at the level of Biser Topco S.a r.l., the indirect sole owner of NKBM (as the EU financial parent holding company).
While Apollo, as a holder of a qualifying interest in NKBM, is not subject to the full scope of the European and the Slovenian financial regulatory supervision, certain limited requirements set out in, among others, the Slovenian Banking Act (Zakon o bančništvu – “ZBan-2”) apply to Apollo. Compliance with these rules is supervised by the Bank of Slovenia (“BSI”) and the ECB. Under these requirements, holders of qualifying interest must make certain notifications to the competent authorities (i) of the intention to reduce the interest such that they would no longer hold a qualifying holding or their holding would fall below the lower limit of the range for which authorization applies, (ii) on any merger or demerger in which they participate, (iii) on any material corporate change, and (iv) on any change which could affect the fulfilment of the requirements with respect to suitability of the qualifying holder.
Qualifying holders must obtain a new authorization to acquire a qualifying holding prior to any further acquisition of shares, directly or indirectly, based on which they would exceed the range to which a previously issued authorization to acquire a qualifying holding relates.
Noncompliance with the aforementioned requirements may result in, among others, administrative fines or administrative measures such as withdrawal of the authorization for the qualifying holding, rejection of a request to obtain or increase a qualifying holding, a prohibition to exercise the voting rights in the bank, a prohibition to exercise any rights from the shares in the bank, or mandatory disposal of the qualifying interest.
Spanish Banking Regulation.
Smart Holdco, S. à r.l., an entity wholly-owned by funds managed by Apollo, is the sole shareholder of EVO Banco, S.A. (“EVO Banco”), a bank incorporated under the laws of Spain which, in turn, owns the entire share capital in Evofinance, Establecimiento Financiero de Crédito, S.A. (“Evofinance”), a regulated financial institution, incorporated in Spain and authorized as a consumer finance institution. Both EVO Banco and Evofinance operate under regulations applicable to credit instititions in Spain which, regulations are largely based on EU rules. As such, both EVO Banco and Evofinance are subject to prudential and conduct rules generally in line with banking regulations elsewhere in the EU and are under the supervision of the Bank of Spain and, as far as EVO Banco is concerned, the ECB, which, among other matters, must authorize any direct or indirect transfers of significant holdings in the capital of the aforementioned institutions.
Regulated Entities Outside of the U.S.
Apollo Management International LLP (“AMI”), registered in England and Wales, is authorized and regulated by the FCA in the United Kingdom under the FSMA and the rules promulgated thereunder. AMI has permission to engage in certain specified regulated activities, including providing investment advice, undertaking discretionary investment management, trade execution, dealing as agent and arranging deals in relation to certain types of investments. Most aspects of AMI’s investment business are governed by the FSMA and related rules, including sales, research, trading practices, provision of investment advice, corporate finance, regulatory capital, record keeping, approval standards for individuals, anti-money laundering and periodic reporting and settlement procedures. The FCA is responsible for administering these requirements and supervising AMI’s compliance with the FSMA and related rules.
Apollo Credit Management International Limited ("ACMI"), registered in England and Wales, is a subsidiary of Apollo whose primary purpose is to act as a sub-adviser to certain of Apollo's credit funds. As an appointed representative of AMI, ACMI can undertake certain activities that are regulated under the FSMA, including all relevant sub-advisory activities, without a separate FCA authorization.
Apollo Asset Management Europe LLP and its subsidiary Apollo Asset Management Europe PC LLP (together "AAME") are each registered in England and Wales and are authorized and regulated by the FCA in the United Kingdom under the FSMA and the rules promulgated thereunder for the primary purpose of providing a centralized asset management and risk function to European clients in the financial services and insurance sectors. AAME has permission to engage in certain specified regulated activities including providing investment advice, undertaking discretionary investment management and arranging deals in relation to certain types of investment. As is the position for AMI, most aspects of AAME's investment business are governed by the FSMA and related rules, with the FCA responsible for administering those requirements and supervising AAME's compliance with the FSMA and related rules.
Apollo Investment Management Europe LLP (“AIME”), registered in England and Wales, is authorized and regulated by the FCA in the United Kingdom as an alternative investment fund manager, with permission to manage and market alternative investment funds (“AIFs”), such as, among others, certain private equity funds, credit funds and real estate funds. AIME markets and distributes certain EEA AIFs to institutional investors in the EEA and has overall responsibility for risk and portfolio management in relation to those AIFs. The FCA is responsible for supervising AIME’s compliance with the FSMA, in particular with the Alternative Investment Fund Managers Regulations 2013 which were implemented into U.K. law because of the EU Alternative Investment Fund Managers Directive (the “AIFMD”), and related rules. Apollo Investment Management Europe
-
30
-
(Luxembourg) S.à r.l. ("AIME Lux") was incorporated by Apollo in Luxembourg on January 2, 2019 and has received approval from Commission de Surveillance du Secteur Financier ("CSSF") to carry out certain activities regulated by the CSSF (including managing and marketing AIFs), with registration effective from such date. AIME Lux will be subject to the regulatory requirements imposed by the AIFMD, including with respect to conduct of business, regulatory capital, valuations, disclosures and marketing and rules on the structure of remuneration for certain personnel.
AAA is regulated under the Authorized Closed-ended Investment Scheme Rules 2008 issued by the Guernsey Financial Services Commission (“GFSC”) with effect from December 15, 2008 under The Protection of Investors (Bailiwick of Guernsey) Law 1987, as amended (the “New Rules”). AAA is deemed to be an authorized closed-ended investment scheme under the New Rules.
Apollo Advisors (Mauritius) Ltd (“Apollo Mauritius”), one of our subsidiaries, and AION Capital Management Limited (“AION Manager”), one of our joint venture investments, are licensed providers of investment management services in the Republic of Mauritius and are subject to applicable Mauritian securities laws and the oversight of the Financial Services Commission (Mauritius) (the “FSC”). Each of Apollo Mauritius and AION Manager is subject to limited regulatory requirements under the Mauritian Securities Act 2005, Mauritian Financial Services Act 2007 and relevant ancillary regulations, including ongoing reporting and record keeping requirements, anti-money laundering obligations, obligations to ensure that it and its directors, key officers and representatives are fit and proper and requirements to maintain positive shareholders’ equity. The FSC is responsible for administering these requirements and ensuring the compliance of Apollo Mauritius and AION Manager with them. If Apollo Mauritius or AION Manager contravenes any such requirements, such entities and/or their officers or representatives may be subject to a fine, reprimand, prohibition order or other regulatory sanctions.
AGM India Advisors Private Limited is a private company incorporated in India under the Companies Act, 1956 and is regulated by the Ministry of Corporate Affairs. Additionally, since there are foreign investments in the company, AGM India Advisors Private Limited is also subject to the Foreign Exchange Management Act, 1999 (and rules and regulations made thereunder) which falls within the purview of Reserve Bank of India.
Apollo Management Singapore Pte Ltd. was granted a Capital Markets Service License with the Monetary Authority of Singapore in October 2013. In addition, Apollo Capital Management, L.P. is registered with the Securities and Exchange Board of India as a foreign portfolio investor. Investments by Apollo Capital Management, L.P. in any Indian entity will also be subject to the rules and regulations applicable under the Foreign Exchange Management Act, 1999 which falls within the purview of Reserve Bank of India.
ARCION Revitalization Private Limited is a private company incorporated in India under the Companies Act, 2013 and is regulated by the Ministry of Corporate Affairs. ARCION Revitalization Private Limited is registered with the Reserve Bank of India to operate as an asset reconstruction company and is subject to the directions and regulations issued by the Reserve Bank of India in relation to asset reconstruction activities in India. Such regulations and directions primarily stipulate minimum capital requirements, conditions for reconstruction activities, fit and proper governance norms and reporting requirements for such entities. If ARCION Revitalization Private Limited contravenes any such requirements, it and/or its directors (as may be applicable) may be subject to a penalty, prohibition order or other regulatory sanctions. Additionally, since there are foreign investments in the company, ARCION Revitalization Private Limited is also subject to the Foreign Exchange Management Act, 1999 (and rules and regulations made thereunder) which falls within the purview of Reserve Bank of India.
AION India Opportunities Trust is a trust organized in India and registered with the Securities and Exchange Board of India as a Category II Alternative Investment Fund. AION India Opportunities Trust is subject to the regulatory requirements under the Securities and Exchange Board of India Act, 1992 and the regulations issued thereunder governing alternative investment funds in India. Such regulations primarily govern the permitted investment activities, concentration and governance norms and reporting requirements for alternative investment funds. If AION India Opportunities Trust contravenes any such requirements, it (as may be applicable) may be subject to a penalty, prohibition order or other regulatory sanctions. Additionally, since there are foreign investments in the trust, AION India Opportunities Trust is also subject to the Foreign Exchange Management Act, 1999 (and rules and regulations made thereunder) which falls within the purview of Reserve Bank of India.
Apollo Management Hong Kong Limited was granted a Type 1: Dealing in Securities license by the Hong Kong Securities and Futures Commission (“SFC”) in November 2018 and is therefore subject to oversight by the SFC.
Other Regulatory Considerations.
Certain of our businesses are subject to compliance with laws and regulations of U.S. Federal and state governments, non-U.S. governments, their respective agencies and/or various self-regulatory organizations or exchanges relating to, among other things, the privacy of client information, and any failure to comply with these regulations could expose us to liability and/or reputational damage. Our businesses have operated for many years within a legal framework that requires our being able to monitor and comply with a broad range of legal and regulatory developments that affect our activities.
-
31
-
However, additional legislation, changes in rules promulgated by self-regulatory organizations or changes in the interpretation or enforcement of existing laws and rules, either in the United States or elsewhere, may directly affect our mode of operation and profitability. For additional information concerning the regulatory environment in which we operate, see “Item 1A. Risk Factors—Risks Related to Our Businesses—
Extensive regulation of our businesses affects our activities and creates the potential for significant liabilities and penalties. The possibility of increased regulatory focus could result in additional burdens on our businesses.
”
Rigorous legal and compliance analysis of our businesses and investments is important to our culture. We strive to maintain a culture of compliance through the use of policies and procedures, such as our code of ethics, compliance systems, communication of compliance guidance and employee education and training. We have a compliance group that monitors our compliance with the regulatory requirements to which we are subject and manages our compliance policies and procedures. Our Chief Compliance Officer supervises our compliance group, which is responsible for addressing all regulatory and compliance matters that affect our activities. Our compliance policies and procedures address a variety of regulatory and compliance risks such as the handling of material non-public information, personal securities trading, valuation of investments on a fund-specific basis, document retention, potential conflicts of interest and the allocation of investment opportunities.
We generally operate without information barriers between our businesses. In an effort to manage possible risks resulting from our decision not to implement these barriers, our compliance personnel maintain a list of issuers for which we have access to material, non-public information and whose securities our funds and investment professionals are not permitted to trade. We could in the future decide that it is advisable to establish information barriers, particularly as our business expands and diversifies. In such event our ability to operate as an integrated platform will be restricted. See “Item 1A. Risk Factors—Risks Related to Our Businesses—Our failure to deal appropriately with conflicts of interest could damage our reputation and adversely affect our businesses.”
Available Information
Apollo Global Management, LLC is a Delaware limited liability company that was formed on July 3, 2007. Our Annual Reports on Form 10-K, Quarterly Reports on Form 10-Q, Current Reports on Form 8-K and amendments to reports filed or furnished pursuant to Section 13(a) of the Exchange Act are made available free of charge on or through our website at www.apollo.com as soon as reasonably practicable after such reports are filed with, or furnished to, the SEC. The information on our website is not, and shall not be deemed to be, part of this report or incorporated into any other filings we make with the SEC. The reports and the other documents we file with the SEC are available on the SEC’s website at www.sec.gov.
From time to time, we may use our website as a channel of distribution of material information. Financial and other material information regarding the Company is routinely posted on and accessible at www.apollo.com.
ITEM 1A
.
RISK FACTORS
Risks Related to Our Businesses
Poor performance of the funds we manage would cause a decline in our revenue and results of operations, may obligate us to repay performance fees previously paid to us and would adversely affect our ability to raise capital for future funds.
We derive revenues in part from:
|
•
|
management fees, which are based generally on the amount of capital committed or invested in our funds;
|
|
•
|
transaction and advisory fees relating to the investments our funds make;
|
|
•
|
performance fees, based on the performance of our funds; and
|
|
•
|
investment income from our investments as general partner.
|
If a fund performs poorly, we will receive little or no performance fees with regard to the fund and little income or possibly losses from any principal investment in the fund. Furthermore, if, as a result of poor performance of later investments in a fund’s life, the fund does not achieve total investment returns that exceed a specified investment return threshold for the life of the fund, we may be obligated to repay the amount by which performance fees that was previously distributed to us exceeds amounts to which we are ultimately entitled. Our fund investors and potential fund investors continually assess our funds’ performance and our ability to raise capital. Accordingly, poor fund performance may deter future investment in our funds and thereby decrease the capital committed or invested in our funds and ultimately, our management fee income.
-
32
-
We depend on Leon Black, Joshua Harris and Marc Rowan, and other key personnel, including Scott Kleinman and James Zelter, and the loss of their services would have a material adverse effect on us.
The success of our businesses depends on the efforts, judgment and personal reputations of our Managing Partners, Leon Black, Joshua Harris and Marc Rowan, and other key personnel, including Scott Kleinman and James Zelter. Their reputations, expertise in investing, relationships with our fund investors and relationships with members of the business community on whom our funds depend for investment opportunities and financing are each critical elements in operating and expanding our businesses. We believe our performance is strongly correlated to the performance of these individuals. Accordingly, our retention of our Managing Partners and other key personnel is crucial to our success. Our Managing Partners and other key personnel may resign, join our competitors or form a competing firm. If our Managing Partners or other key personnel were to join or form a competitor, some of our fund investors could choose to invest with that competitor, another competitor or not at all, rather than in our funds. The loss of the services of our Managing Partners and other key personnel would have a material adverse effect on us, including our ability to retain and attract investors and raise new funds, and the performance of our funds. We do not carry any “key man” insurance that would provide us with proceeds in the event of the death or disability of any of our Managing Partners or other key personnel. In addition, the loss of two or more of our Managing Partners or certain other key personnel may result in the termination of our role as general partner of certain of our funds and the termination of the commitment periods of certain of our funds. See
“—If two or more of our Managing Partners or certain other investment professionals leave our company, the commitment periods of certain of our funds may be terminated, and we may be in default under the governing documents of certain of our funds
.”
Changes in the debt financing markets may negatively impact the ability of our funds and their portfolio companies to obtain attractive financing for their investments and may increase the cost of such financing if it is obtained, which could lead to lower-yielding investments and potentially decrease our net income.
In the event that our funds are unable to obtain committed debt financing for potential acquisitions or can only obtain debt at an increased interest rate or on unfavorable terms, our funds may have difficulty completing otherwise profitable acquisitions or may generate profits that are lower than would otherwise be the case, either of which could lead to a decrease in the investment income earned by us. Any failure by lenders to provide previously committed financing can also expose us to potential claims by sellers of businesses which our funds may have contracted to purchase. Our funds’ portfolio companies regularly utilize the corporate debt and securitization markets in order to obtain financing for their operations. To the extent that the current credit markets and/or regulatory changes have rendered financing difficult to obtain or more expensive, this may negatively impact the operating performance of such portfolio companies and funds, and lead to lower-yielding investments with respect to such funds and, therefore, the investment returns on our funds. Conversely, certain of the strategies pursued by funds we manage benefit from higher interest rates, and a sustained low interest rate environment may negatively impact expected returns for these funds. In addition, to the extent that the current markets make it difficult or impossible to refinance debt that is maturing in the near term, a relevant portfolio company may face substantial doubt as to its status as a going concern (which may result in an event of default under various agreements) or be unable to repay such debt at maturity and may be forced to sell assets, undergo a recapitalization or seek bankruptcy protection.
Changes in the U.S. political environment and the potential for governmental policy changes and regulatory reform by the Trump administration and the U.S. Congress could negatively impact our business.
Governmental policy changes and regulatory reform could have a material impact on our business. Uncertainty with respect to legislation, regulation and government policy at the federal level, as well as the state and local levels have introduced new and difficult-to-quantify macroeconomic and political risks with potentially far-reaching implications. There has been a corresponding meaningful increase in the uncertainty surrounding interest rates, inflation, foreign exchange rates, trade volumes and fiscal and monetary policy. New legislative, regulatory or policy changes could significantly impact our business and the business of portfolio companies of funds we manage, as well as the markets in which we compete. In addition, disagreements over the federal budget have led to the shutdown of the U.S. federal government for periods of time and may recur in the future. Each federal shutdown may have a negative impact on the operations and business of certain of our funds’ portfolio companies. To the extent changes in the political environment have a negative impact on us or portfolio companies of funds we manage, or on the markets in which we operate, our business, results of operations and financial condition could be materially and adversely impacted in the future.
Difficult market or economic conditions may adversely affect our businesses in many ways, including by reducing the value or hampering the performance of the investments made by our funds or reducing the ability of our funds to raise or deploy capital, each of which could materially reduce our revenue, net income and cash flow and adversely affect our financial prospects and condition.
Our businesses and the businesses of the companies in which our funds invest are materially affected by conditions in the global financial markets and economic conditions throughout the world, such as interest rates, availability of credit, inflation
-
33
-
rates, economic uncertainty, changes in laws (including laws relating to taxation), trade barriers, commodity prices, currency exchange rates and controls and national and international political circumstances (including wars, terrorist acts or security operations). Recently, markets have been affected by increases in interest rates in the U.S., uncertainty about the consequences of the U.S. and other governments withdrawing monetary stimulus measures, imposition of trade barriers, ongoing trade negotiations with major U.S. trading partners and changes in the U.S. tax regulations. Additionally, operating outside the United States may also expose us to increased compliance risks, as well as higher compliance costs to comply with U.S. and non-U.S. anti-corruption, anti-money laundering and sanctions laws and regulations. These factors are outside our control and may affect the level and volatility of securities prices and the liquidity and the value of investments, and we may not be able to or may choose not to manage our exposure to these conditions.
Volatility in the financial markets can materially hinder the initiation of new, large-sized transactions for our private equity segment and, together with volatility in valuations of equity and debt securities, may adversely impact our operating results. During 2018 the markets experienced a heightened level of volatility, as well as declines in market indices in the fourth quarter. If market conditions deteriorate, our businesses could be affected in different ways. In addition, these events and general economic trends are likely to impact the performance of portfolio companies in many industries, particularly industries that are more affected by changes in consumer demand, such as the packaging, manufacturing, chemical and refining industries, as well as travel and leisure, gaming and real estate industries. The performance of our funds and our performance may be adversely affected to the extent our fund portfolio companies in these industries experience adverse performance or additional pressure due to downward trends. There is also a risk of both sector-specific and broad-based corrections and/or downturns in the equity and credit markets. Our profitability may also be adversely affected by our fixed costs and the possibility that we would be unable to scale back other costs, within a time frame sufficient to match any further decreases in net income or increases in net losses relating to changes in market and economic conditions.
A financial downturn could adversely affect our operating results in a number of ways, and if the economy was to enter a recessionary or inflationary period, it may cause our revenue and results of operations to decline by causing:
|
•
|
our AUM to decrease, lowering management fees and other income from our funds;
|
|
•
|
increases in costs of financial instruments;
|
|
•
|
adverse conditions for the portfolio companies of our funds (e.g., decreased revenues, liquidity pressures, limits on interest deductibility, increased difficulty in obtaining access to financing and complying with the terms of existing financings as well as increased financing costs);
|
|
•
|
lower investment returns, reducing performance fees;
|
|
•
|
higher interest rates, which could increase the cost of the debt capital our funds use to acquire companies in our private equity business; and
|
|
•
|
material reductions in the value of our fund investments, affecting our ability to realize performance fees from these investments.
|
Lower investment returns and such material reductions in value may result because, among other reasons, during periods of difficult market conditions or slowdowns (which may be across one or more industries, sectors or geographies), companies in which our funds invest may experience decreased revenues, financial losses, difficulty in obtaining access to financing and increased funding costs. During such periods, these companies may also have difficulty in expanding their businesses and operations and be unable to meet their debt service obligations or other expenses as they become due, including expenses payable to us. In addition, during periods of adverse economic conditions, our funds and their portfolio companies may have difficulty accessing financial markets, which could make it more difficult or impossible to obtain funding for additional investments and harm our AUM and operating results. Furthermore, such conditions would also increase the risk of default with respect to debt investments made by our funds, which could have a negative impact on our funds with significant debt investments, such as our credit funds. Our funds may be affected by reduced opportunities to exit and realize value from their investments, by lower than expected returns on investments made prior to the deterioration of the credit markets, and by the fact that we may not be able to find suitable investments for the funds to effectively deploy capital, which could adversely affect our ability to raise new funds and thus adversely impact our prospects for future growth.
To the extent the uncertainty in the market prompts sellers to readjust their valuations, attractive investment opportunities may present themselves. On the other hand, the reduction in the availability of credit financing and limits on interest deductibility could impact our funds’ ability to consummate transactions, particularly larger transactions. In the event that our investment pace slows, it could have an adverse impact on our ability to generate future performance fees and fully invest the capital in our funds. Our funds may also be affected by reduced opportunities to exit and realize value from their investments via a sale or merger upon a general slowdown in corporate mergers and acquisitions activity. Additionally, we may not be able to find suitable investments for the funds to effectively deploy capital and these factors could adversely affect the timing of and our ability to raise new funds.
-
34
-
In addition, many other economies continue to experience weakness, tighter credit conditions and a decreased availability of foreign capital. Further, there is concern that the favorability of conditions in certain markets may be dependent on continued monetary policy accommodation from central banks, especially the Board of Governors of the Federal Reserve System (the “Federal Reserve”) and the European Central Bank (“ECB”). Since the most recent recession, the Federal Reserve has taken actions which have resulted in low interest rates prevailing in the marketplace for a historically long period of time. The Federal Reserve raised its benchmark interest rate by a quarter of a percentage point in 2016, three quarters of a percentage point in 2017 and one percentage point in 2018, and indicated it may continue raising interest rates in the coming twelve months. Higher interest rates generally impact the investment management industry by making it harder to obtain financing for new investments, refinance existing investments or liquidate debt investments, which can lead to reduced investment returns and missed investment opportunities. Consequently, such increases in interest rates may have an adverse impact on our business.
Changing political environments, regulatory restrictions and changes in government institutions and policies outside of the U.S. could adversely affect our businesses.
Our businesses may be adversely affected by the planned exit of the U.K. from the EU. The U.K. held a referendum on June 23, 2016 at which the electorate voted to leave the EU. On March 29, 2017, the government of the U.K. invoked article 50 of the Treaty on the European Union (which has the effect of formally initiating the withdrawal of the U.K. from the EU) and subsequently entered into withdrawal negotiations with the EU. The Treaty on the European Union provides for a period of up to two years for negotiation of withdrawal arrangements, at the end of which (whether or not agreement has been reached) EU treaties cease to apply to the withdrawing member state unless the European Council, in agreement with the member state concerned, unanimously decides to extend this period. Negotiations between the government of the U.K. and the EU Council began on June 19, 2017. The negotiations resulted in (a) an Agreement on the withdrawal of the U.K. from the EU and (b) a Political Declaration setting out the framework for the future relationship between the EU and the U.K. (together, the "Withdrawal Proposal"). The Withdrawal Proposal was subject to political agreement and ratification and on January 15, 2019, the U.K. Parliament voted to reject the Withdrawal Proposal. It is unclear whether it will be possible for the U.K. Government to obtain further concessions from the EU in order for the U.K. Parliament to vote to approve a revised withdrawal proposal. While there is much that could still happen, including an extension to the exit timeline, inroads to an alternative withdrawal proposal, a change of U.K. Government or even political support for a second referendum, there is a risk that no withdrawal proposal between the U.K. and the EU will be reached concerning the U.K.’s departure from the EU. Notwithstanding any withdrawal proposal that may be put in place, there is likely to be considerable uncertainty as to the position of the U.K. and the arrangement which will apply to its relationships with the EU and other countries following its withdrawal (including in the event that no withdrawal proposal is ratified and the U.K. leaves without agreeing transitional arrangements with the EU, which cannot currently be ruled out). Such positions and anticipated arrangements may be subject to change and/or develop at short notice. This uncertainty may affect other countries in the EU, or elsewhere. Additionally, political parties in several other EU member states have proposed that a similar referendum be held on their country’s membership in the EU. It is unclear whether any other EU member states will hold such referendums, but such referendums could result in one or more other countries leaving the EU or in major reforms being made to the EU or to the eurozone. The nature and extent of the impact of such events on our businesses is difficult to predict but they may adversely affect the operations of the portfolio companies of our funds, the availability of credit and liquidity for our businesses and the return on our funds and their investments. There may be detrimental implications, e.g., for the value of certain of our funds’ investments, their ability to enter into transactions or to value or realize such investments or otherwise to implement their investment program. This may be due to, among other things:
|
•
|
increased uncertainty and volatility in the U.K. and EU financial markets;
|
|
•
|
fluctuations in the market value of British Pounds and of U.K. and EU assets;
|
|
•
|
fluctuations in exchange rates between British Pounds, the Euro and other currencies;
|
|
•
|
increased illiquidity of investments located or listed within the U.K. or the EU;
|
|
•
|
lower economic growth in various markets in the U.K., Europe, and globally;
|
|
•
|
disruption of the free movement of goods, services (right of establishment), capital, and people between the U.K. and the EU (including the potential loss of passporting rights for financial institutions in the U.K. and for EU financial institutions passporting into the U.K., which broadly facilitates mutual access to markets among EU member states) and the effectiveness of steps taken to mitigate that disruption at the point at which the U.K. leaves the EU;
|
|
•
|
disruption to mutual recognition arrangements between the U.K. and the EU (e.g. cross-border insolvency and other regimes) and access to market infrastructure in other EU regions;
|
|
•
|
changes in the willingness or ability of financial and other counterparties to enter into transactions, or the price at which and terms on which they are prepared to transact; and/or
|
|
•
|
changes in legal and regulatory regimes to which we, our funds, and/or certain of our funds’ assets and portfolio companies are, or become, subject.
|
-
35
-
Once the position of the U.K. and the arrangements which will apply to its relationships with the EU and other countries have been established, or if the U.K. ceases to be a member of the EU without having agreed on such arrangements or before such arrangements become effective, it is possible that certain of our funds’ investments may need to be restructured to enable their objectives fully to be pursued (e.g. because of a loss of passporting rights for U.K. financial institutions or the failure to put equally effective arrangements in place). This may increase costs or make it more difficult for us to pursue our objectives.
The U.K.’s decision to leave the EU may bring an extended period of uncertainty and regulatory change in the EEA, in the U.K. and in the way in which Apollo is able to operate from the U.K. into the remainder of the EEA (and, vice versa, in relation to any new Apollo entities established and licensed in a remaining EEA territory). This may have an impact on Apollo including the cost of, risk to, manner of conducting, and location of, its European business and its ability to hire and retain key staff in Europe. This may also impact the markets in which Apollo operates; the funds managed or advised by Apollo; Apollo’s fund investors and Apollo’s ability to raise capital from them; and ultimately the returns which may be achieved. In this connection, there can be no guarantee that plans to deal with, or mitigate adverse consequences of, various Brexit outcomes following the U.K.'s departure from the EU will perfectly or efficiently replicate current arrangements available to Apollo while the U.K. is a member of the EU.
Our operating results will most likely continue to be affected by ongoing economic, fiscal, and political conditions in eurozone countries and developments relating to the Euro. The deterioration of the sovereign debt of several eurozone countries together with the risk of contagion to other more stable economies exacerbated the global economic crisis. This situation raised a number of uncertainties regarding the stability and overall standing of the EU. Economic, political or other factors could still result in changes to the composition of the EU and the eurozone and its participating members. The risk that other eurozone countries could be subject to higher borrowing costs and face further deterioration in their economies, together with the risk that some countries could withdraw from the eurozone, could have a negative impact on our funds’ investment activities. A reintroduction of national currencies in one or more eurozone countries or, in more extreme circumstances, the possible dissolution of the EU cannot be ruled out. The departure or risk of departure from the EU by one or more eurozone countries and/or the abandonment of the Euro as a currency could have major negative effects on our business. These potential developments, or market perceptions concerning these and related issues, could adversely affect our businesses.
A decline in the pace of investment in our funds, an increase in the pace of sales of investments in our funds or an increase in the amount of transaction and advisory fees we share with our fund investors would result in our receiving less revenue from fees.
A variety of fees that we earn, such as transaction and advisory fees, are driven in part by the pace at which our funds make investments. Many factors could cause a decline in the pace of investment, including the inability of our investment professionals to identify attractive investment opportunities, competition for such opportunities, decreased availability of capital on attractive terms and our failure to consummate identified investment opportunities because of business, regulatory or legal complexities and adverse developments in the U.S. or global economy or financial markets. Any decline in the pace at which our funds make investments would reduce our transaction and advisory fees and could make it more difficult for us to raise capital. Likewise, during attractive selling environments, our funds may capitalize on increased opportunities to exit investments. Any increase in the pace at which our funds exit investments would reduce transaction and advisory fees. In addition, some of our fund investors have requested, and we expect to continue to receive requests from fund investors, that we share with them a larger portion, or all, of the transaction and advisory fees generated by our funds’ investments. To the extent we accommodate such requests, it would result in a decrease in the amount of fee revenue we could earn. For example, in Fund VIII and Fund IX we agreed that 100% of certain transaction and advisory fees will be shared with the management fee paying investors in the fund through a management fee offset mechanism, whereas the percentage was 68% in Fund VII.
If two or more of our Managing Partners or certain other investment professionals leave our company, the commitment periods of certain of our funds may be terminated, and we may be in default under the governing documents of certain of our funds.
The governing agreements of certain of our funds provide that in the event certain “key persons” (such as two or more of Messrs. Black, Harris and Rowan and/or certain other of our investment professionals) fail to devote the requisite time to our businesses, the commitment period will terminate if a certain percentage in interest of the fund investors do not vote to continue the commitment period, or the commitment period may terminate for a variety of other reasons. This is true for example of Fund VI, Fund VII, Fund VIII and Fund IX. Certain of our other funds have similar provisions. In addition to having a significant negative impact on our revenue, net income and cash flow, the occurrence of such an event with respect to any of our funds would likely result in significant reputational damage to us.
Messrs. Black, Harris and Rowan and other key personnel may terminate their employment with us at any time.
-
36
-
We may not be successful in raising new funds or in raising more capital for certain of our existing funds and may face pressure on performance fees and fee arrangements of our future funds.
Our funds may not be successful in consummating their current capital-raising efforts or others that they may undertake, or they may consummate them at investment levels lower than those currently anticipated. Any capital raising that our funds undertake may be on terms that are unfavorable to us or that are otherwise different from the terms that we have been able to obtain in the past. These risks could occur for reasons beyond our control, including general economic or market conditions, regulatory changes or increased competition.
Certain institutional investors have also publicly criticized certain fund fee and expense structures, including management, transaction and advisory fees. The Institutional Limited Partners Association, or “ILPA,” published a set of Private Equity Principles, or the “Principles,” which called for enhanced “alignment of interests” between general partners and limited partners through modifications of some of the terms of fund arrangements, including proposed guidelines for fees and performance fees structures. We provided ILPA our endorsement of the Principles, representing an indication of our general support for the efforts of ILPA. Although we have no obligation to modify any of our fees with respect to our existing funds, we may experience pressure to do so.
In addition, certain institutional investors, including sovereign wealth funds and public pension funds, have demonstrated an increased preference for alternatives to the traditional investment fund structure, such as managed accounts, specialized funds and co-investment vehicles. We also have entered into strategic partnerships with individual investors whereby we manage that investor’s capital across a variety of our products on separately negotiated terms. There can be no assurance that such alternatives will be as profitable to us as traditional investment fund structures, and the impact such a trend could have on our results of operations, if widely implemented, is unclear. Moreover, certain institutional investors are demonstrating a preference to in-source their own investment professionals and to make direct investments in alternative assets without the assistance of investment advisors like us. Such institutional investors may become our competitors and could cease to be our clients. Further, certain investors have implemented or may implement restrictions against investing in certain types of asset classes such as fossil fuels, which would affect our ability to raise new funds focused on those asset classes, such as funds focused on energy or natural resources. Finally, the ability of our funds to raise capital from certain investors may also be adversely impacted as a result of countries implementing certain tax avoidance measures as part of the OECD/G20 Base Erosion and Profit Shifting (BEPS) project if these investors decide to invest on their own or only in funds with similarly situated investors. See
“—Some of our funds invest in foreign countries and securities of issuers located outside the U.S., which may involve foreign exchange, political, social, economic and tax uncertainties and risks
.”
The failure of our funds to raise capital in sufficient amounts and on satisfactory terms could result in a decrease in AUM, performance fees and/or fee revenue or could result in us being unable to achieve an increase in AUM, performance fees and/or fee revenue, and could have a material adverse effect on our financial condition and results of operations. Similarly, any modification of our existing fee arrangements or the fee structures for new funds could adversely affect our results of operations.
Investors in our funds with commitment-based structures may not satisfy their contractual obligation to fund capital calls when requested by us, which could adversely affect a fund’s operations and performance.
Investors in all of our private equity and certain of our credit and real assets funds make capital commitments to those funds that we are entitled to call from those investors at any time during prescribed periods. We depend on fund investors fulfilling their commitments when we call capital from them in order for those funds to consummate investments and otherwise pay their obligations when due. Any investor that does not fund a capital call would be subject to several possible penalties, including forfeiting a significant amount of its existing investment in that fund. However, the impact of the penalty is directly correlated to the amount of capital previously invested, and if an investor has invested little or no capital, for instance early in the life of the fund, then the forfeiture penalty may not be as meaningful. If investors were to fail to satisfy a significant amount of capital calls for any particular fund or funds, the operation and performance of those funds could be materially and adversely affected.
We may not have sufficient cash to satisfy general partner obligations to return performance fees if and when they are triggered under the governing agreements with our fund investors.
Performance fees from our private equity funds and certain of our credit and real assets funds is subject to contingent repayment by the general partner if, upon the final distribution, the relevant fund’s general partner has received cumulative performance fees on individual portfolio investments in excess of the amount of performance fees it would be entitled to from the profits calculated for all portfolio investments in the aggregate. Adverse economic conditions may increase the likelihood of triggering these general partner obligations. The Managing Partners, Contributing Partners and certain other investment professionals have personally guaranteed, subject to certain limitations, these general partner obligations. We have agreed to indemnify the Managing Partners and certain Contributing Partners against all amounts that they pay pursuant to any of these
-
37
-
personal guarantees in favor of certain funds that we manage (including costs and expenses related to investigating the basis for or objecting to any claims made in respect of the guarantees) for all interests that the Managing Partners and Contributing Partners have contributed or sold to the Apollo Operating Group. To the extent one or more such general partner obligations were to be triggered, we might not have available cash to repay the performance fees and satisfy such obligations, or if applicable, to reimburse the Managing Partners and certain Contributing Partners for the indemnifiable percentage of amounts that they are required to pay under their guarantees. If we were unable to repay such performance fees, we would be in breach of the relevant governing agreements with our fund investors and could be subject to liability.
The historical returns attributable to our funds should not be considered as indicative of the future results of our funds or of our future results or of any returns expected on an investment in our Class A shares and our Preferred shares.
We have presented in this report the returns relating to the historical performance of our private equity, credit and real assets funds. The returns are relevant to us primarily insofar as they are indicative of performance fees we have earned in the past and may earn in the future, our reputation and our ability to raise new funds. The returns of the funds we manage are not, however, directly linked to returns on our Class A shares, our 6.375% Series A Preferred Shares (the “Series A Preferred shares”) or our 6.375% Series B Preferred Shares (the “Series B Preferred shares” and collectively with the Series A Preferred shares, the “Preferred shares”). Therefore, you should not conclude that any continued positive performance of the funds we manage will necessarily result in positive returns on an investment in Class A shares or Preferred shares. However, poor performance of the funds we manage will cause a decline in our revenue from such funds, and would therefore have a negative effect on our performance and the value of our Class A shares and our Preferred shares. An investment in our Class A shares or our Preferred shares is not an investment in any of the Apollo funds.
Moreover, the historical returns of our funds should not be considered indicative of the future returns of such funds or any future funds we may raise, in part because:
|
•
|
market conditions during previous periods may have been significantly more favorable for generating positive performance, particularly in our private equity business, than the market conditions we may experience in the future;
|
|
•
|
our private equity funds’ and certain other funds’ rates of return, which are calculated on the basis of net asset value of the funds’ investments, reflect unrealized gains, which may never be realized;
|
|
•
|
our funds’ returns have benefited from investment opportunities and general market conditions that may not repeat themselves, including the availability of debt financing on attractive terms and the availability of distressed debt opportunities, and we may not be able to achieve the same returns or secure the same profitable investment opportunities or deploy capital as quickly;
|
|
•
|
the historical returns that we present in this report derive largely from the performance of our existing funds, whereas future fund returns will depend increasingly on the performance of our newer funds or funds not yet formed, which may have little or no realized investment track record and may have lower target returns than our existing funds;
|
|
•
|
the attractive returns of certain of our funds have been driven by the rapid return of invested capital, which has not occurred with respect to all of our funds and we believe is less likely to occur in the future;
|
|
•
|
in recent years, there has been increased competition for private equity investment opportunities resulting from, among other things, the increased amount of capital invested in private equity funds and high liquidity in debt markets;
|
|
•
|
our newly established funds may generate lower returns during the period that they take to deploy their capital; and
|
|
•
|
we may create new funds in the future that reflect a different asset mix, investment strategy, and/or geographic and industry exposure, as well as target returns and economic terms, compared to our current funds, and any such new funds could have different returns from our existing or previous funds.
|
Finally, the IRR of our funds has historically varied greatly from fund to fund. Accordingly, you should realize that the IRR going forward for any current or future fund may vary considerably from the historical IRR generated by any particular fund, or for our funds as a whole. Future returns will also be affected by the risks described elsewhere in this report and risks of the industries and businesses in which a particular fund invests. See “Item 7. Management’s Discussion and Analysis of Financial Condition and Results of Operations-The Historical Investment Performance of Our Funds.”
Our funds’ reported net asset values, rates of return and the performance fees we receive are subject to a number of factors beyond our control and are based in large part upon estimates of the fair value of our funds’ investments, which are based on subjective standards that may prove to be incorrect.
A large number of investments held by our funds are illiquid and thus have no readily ascertainable market prices. We value these investments based on our estimate of their fair value as of the date of determination. We estimate the fair value of our funds’ investments based on third-party models, or models developed by us, which include discounted cash flow analyses and other techniques and may be based, at least in part, on independently sourced market parameters. The material estimates and assumptions used in these models include the timing and expected amount of cash flows, the appropriateness of discount rates
-
38
-
used, and, in some cases, the ability to execute, the timing of and the estimated proceeds from expected financings. The actual results related to any particular investment often vary materially as a result of the inaccuracy of these estimates and assumptions.
In addition, because many of the illiquid investments held by our funds are in industries or sectors that are unstable, in distress, or undergoing some uncertainty, such investments are subject to rapid changes in value caused by sudden company-specific or industry-wide developments.
We include the fair value of illiquid assets in the calculations of net asset values, returns of our funds and our AUM. Furthermore, we recognize performance fees based in part on these estimated fair values. Because these valuations are inherently uncertain, they may fluctuate greatly from period to period. Also, they may vary greatly from the prices that would be obtained if the assets were to be liquidated on the date of the valuation and often do vary greatly from the prices our funds eventually realize. See note
2
to our consolidated financial statements for more detail.
In addition, the values of our funds’ investments in publicly traded assets are subject to significant volatility due to a number of factors beyond our control. These include actual or anticipated fluctuations in the quarterly and annual results of these companies or other companies in their industries, market perceptions concerning the availability of additional securities for sale, general economic, social or political developments, changes in industry conditions or government regulations, changes in management or capital structure and significant acquisitions and dispositions. Because the market prices of these securities can be volatile, the valuation of these assets may change from period to period, and the valuation for any particular period may not be realized at the time of disposition. In addition, because our private equity funds often hold very large amounts of the securities of their portfolio companies, the disposition of these securities often takes place over a long period of time, which can further expose us to volatility risk. Even if our funds hold a quantity of public securities that may be difficult to sell in a single transaction, we do not discount the market price of the security for purposes of our valuations.
If a fund realizes value on an investment that is significantly lower than the value at which it was reflected in a fund’s net asset values, the fund would suffer losses. This could in turn lead to a decline in our management fees and a loss equal to the portion of the performance fees reported in prior periods that was not actually realized upon disposition. These effects could become applicable to a large number of our funds’ investments if our funds’ current valuations differ from future valuations due to market developments or other factors that are beyond our control. See “Item 7. Management’s Discussion and Analysis of Financial Condition and Results of Operations-Segment Analysis” for information related to fund activity that is no longer consolidated. If asset values turn out to be materially different than values reflected in fund net asset values, fund investors could lose confidence which could, in turn, result in redemptions from our funds that permit redemptions or difficulties in raising additional capital.
We have experienced rapid growth, which may be difficult to sustain and which may place significant demands on our administrative, operational and financial resources.
Our AUM has grown significantly in the past and we are pursuing further growth in the near future. Our rapid growth has caused, and planned growth, if successful, will continue to cause, significant demands on our legal, regulatory, accounting and operational infrastructure, and increased expenses. The complexity of these demands, and the expense required to address them, is a function not simply of the amount by which our AUM has grown, but also of the growth in the variety, including the differences in strategy among, and complexity of, our different funds. In addition, we are required to continuously develop our systems and infrastructure in response to the increasing complexity of the investment management market and legal, accounting, regulatory and tax developments.
Our future growth will depend in part on our ability to maintain an operating platform, infrastructure and management system sufficient to address our growth and will require us to incur significant additional expenses and to commit additional senior management and operational resources. As a result, we face significant challenges:
|
•
|
in maintaining adequate financial, regulatory and business controls;
|
|
•
|
in implementing new or updated information and financial systems and procedures; and
|
|
•
|
in training, managing and appropriately sizing our work force and other components of our businesses in a timely and cost-effective manner.
|
We may not be able to manage our expanding operations effectively or be able to continue to grow, and any failure to do so could adversely affect our ability to generate revenue and control our expenses.
-
39
-
Changes to the method of determining the London Interbank Offered Rate (“LIBOR”) or the selection of a replacement for LIBOR may affect the value of investments held by or due to our funds and could affect our results of operations and financial results.
In July 2017, the U.K. Financial Conduct Authority announced that it intends to stop collecting LIBOR rates from banks after 2021. The announcement indicates that LIBOR will not continue to exist on the current basis. We are unable to predict the effect of any changes to LIBOR, the establishment and success of any alternative reference rates, or any other reforms to LIBOR or any replacement of LIBOR that may be enacted in the U.K. or elsewhere. Such changes, reforms or replacements relating to LIBOR could have an adverse impact on the market for or value of any LIBOR-linked securities, loans, derivatives or other financial instruments or extensions of credit held by or due to us or our funds. Furthermore, a significant number of our funds’ portfolio companies are borrowers of LIBOR-linked debt obligations, such as LIBOR-based credit agreements and floating rate notes, and may be negatively impacted by any changes to LIBOR and the uncertainty relating thereto. As such, LIBOR-related changes could affect our overall results of operations and financial condition.
Extensive regulation of our businesses affects our activities and creates the potential for significant liabilities and penalties
.
The possibility
of
increased regulatory focus could result in additional burdens on our businesses.
Overview of Our Regulatory Environment
. We are subject to extensive regulation, including periodic examinations, by governmental and self-regulatory organizations in the jurisdictions in which we operate around the world. Many of these regulators, including U.S. and foreign government agencies and self-regulatory organizations, as well as state securities commissions in the U.S., are empowered to conduct investigations and administrative proceedings that can result in fines, suspensions of personnel or other sanctions, including censure, the issuance of cease-and-desist orders or the suspension or expulsion of an investment advisor from registration or memberships. Even if an investigation or proceeding does not result in a sanction or the sanction imposed against us or our personnel by a regulator is small in monetary amount, the adverse publicity relating to the investigation, proceeding or imposition of these sanctions could harm our reputation and cause us to lose existing investors or fail to gain new investors. These requirements imposed by our regulators are designed primarily to ensure the integrity of the financial markets and to protect investors in our funds and may not necessarily be designed to protect our shareholders. Other regulations, such as those promulgated by the Committee on Foreign Investment in the United States (“CFIUS”), may impair our ability to invest our funds and/or for our funds to realize investments in certain industries. Consequently, these regulations often limit our activities.
Our businesses may be adversely affected as a result of new or revised legislation or regulations imposed by the SEC, U.S. Department of Treasury or other U.S. or foreign governmental regulatory authorities or self-regulatory organizations that supervise the financial markets. We also may be adversely affected by changes in the interpretation or enforcement of existing laws and rules by these governmental authorities and self-regulatory organizations.
Regulatory changes in the U.S. could adversely affect our business
.
Federal regulation
. The Dodd-Frank Act continues to impose significant regulations on almost every aspect of the U.S. financial services industry, including aspects of our businesses and the markets in which we operate. Among other things, the Dodd-Frank Act includes the following provisions that could have an adverse impact on our ability to continue to operate our businesses.
Dodd-Frank Act
|
•
|
The Dodd-Frank Act established the Financial Stability Oversight Council (“FSOC”), which is comprised of representatives of all the major U.S. financial regulators, to act as the financial system’s systemic risk regulator. FSOC has the authority to designate non-bank financial companies as “systemically important” in certain circumstances, including where material financial distress of the company could pose risk to the financial stability of the U.S. Designation as a systemically important non-bank financial company would subject a company to heightened prudential standards and Federal Reserve regulation. In 2016, under the prior administration, the FSOC released an update on its multi-year review of asset management products and activities and created an interagency working group to assess potential risks associated with certain leveraged funds. To date, the FSOC has not designated any investment management firms, including us, as systemically important financial institutions. While we believe it is unlikely that we would be designated as systemically important, if such designation were to occur, we would be subject to significantly increased levels of regulation, including heightened standards relating to capital, leverage, liquidity, risk management, credit exposure reporting and concentration limits, restrictions on acquisitions and being subject to annual stress tests by the Federal Reserve.
|
|
•
|
The Dodd-Frank Act requires many private equity and hedge fund advisers to register with the SEC under the Investment Advisers Act, to maintain extensive records and to file reports if deemed necessary for purposes of systemic risk assessment by certain governmental bodies. As described elsewhere in this Form 10-K, all of the investment
|
-
40
-
advisers of our funds operated in the U.S. are registered as investment advisers either directly or as a “relying advisor” with the SEC.
|
•
|
The Dodd-Frank Act amends the Exchange Act to compensate and protect whistleblowers who voluntarily provide original information to the SEC and establishes a fund to be used to pay whistleblowers who will be entitled to receive a payment equal to between 10% and 30% of certain monetary sanctions imposed in a successful government action resulting from the information provided by the whistleblower. A similar whistleblower program was also established with the CFTC under the direction of the Dodd-Frank Act. We expect that these whistleblower programs will result in a significant increase in whistleblower claims across our industry, and investigating such claims could generate significant expenses and take up significant management time, even for frivolous and non-meritorious claims.
|
Many of these provisions are subject to further rulemaking and to the discretion of regulatory bodies, such as the FSOC, the Federal Reserve and the SEC. The current administration’s legislative agenda may include certain modifications to the Dodd-Frank Act and other potentially deregulatory measures affecting the financial services industry. For example, in May 2018, the President signed into law the Economic Growth, Regulatory Relief, and Consumer Protection Act (the “EGRRCPA”), which amended certain provisions of the Dodd-Frank Act. Some of these provisions are subject to further rulemaking and regulatory discretion. The prospects for further legislative reform are uncertain. As the impact of these rules required by the Dodd-Frank Act and the EGRRCPA will become evident over time, it is not yet possible to predict the ultimate effects that these laws or subsequent implementing regulations and decisions will have on us. Any changes in the regulatory framework applicable to our business may impose additional costs, require attention from our senior management, result in limitations on the conduct of our business, or affect how we compete with other financial services organizations.
Foreign Investment Risk Review Modernization Act (“FIRRMA”) –
In August 2018, the U.S. Congress passed FIRRMA, which included enhancements to the oversight by CFIUS of U.S. cross-border investment. Given our funds’ diverse investor base, these additional restrictions on foreign ownership and investments may delay or prevent transactions that might otherwise be in our funds’ interests. Additionally, FIRRMA provides CFIUS with the authority to review and potentially block both controlling and certain non-controlling investments in critical infrastructure and technology companies and other transactions, which may limit the number of potential buyers for our funds’ investments in various portfolio companies. We may have greater difficulty in realizing value from these portfolio companies through sales to non-U.S. buyers.
State regulation
. A number of our investing activities, such as our lending business, are also subject to regulation by various U.S. state regulators. Moreover, regulations enacted by various U.S. state regulators could impact us indirectly. For example, the State of California has enacted a law that will require California pension plans to disclose fee and expense information in relation to investments in alternative investment vehicles. This new legislation may impact our contractual arrangements with such investors and increase the costs and risks to us in maintaining relationships with such investors.
It is impossible to determine the full extent of the impact on us of existing regulation or any other new laws, regulations or initiatives that may be proposed or whether any of the proposals will become law. Any changes in the regulatory framework applicable to our businesses, including the changes described above, may impose additional costs on us, require the attention of our senior management or result in limitations on the manner in which we conduct our business. Moreover, as calls for additional regulation have increased, there may be a related increase in regulatory investigations of the trading and other investment activities of alternative investment management funds, including our funds. Complying with any new laws or regulations could be more difficult and expensive, affect the manner in which we conduct our businesses and adversely affect our profitability.
Regulatory changes in jurisdictions outside of the U.S. could adversely affect our business
. Apollo provides investment management services in various jurisdictions around the world. Investment advisers are subject to extensive regulation not only in the U.S., but also in the other countries in which our investment activities occur. In the U.K., we are subject to regulation by the U.K. Financial Conduct Authority. Our other European operations, and our investment activities around the globe, are subject to a variety of regulatory regimes that vary country by country. A failure to comply with the obligations imposed by the regulatory regimes to which we are subject, could result in investigations, sanctions and/or reputational damage.
The EU Alternative Investment Fund Managers Directive (“AIFMD”) came into force on July 22, 2013. The AIFMD imposes significant regulatory requirements on fund managers operating within the EEA, including with respect to conduct of business, regulatory capital, valuations, disclosures and marketing, and rules on the structure of remuneration for certain personnel. Compliance with the AIFMD has also increased the cost and complexity of raising capital for our funds and consequently may also slow the pace of fundraising. Alternative investment funds (i) organized outside of the EEA and (ii) in which interests are marketed to investors who are registered or domiciled in the EEA are also subject to significant compliance requirements. For example, currently such funds may only be marketed in EEA jurisdictions in compliance with certain requirements under the AIFMD, for example, to register the fund for marketing in each relevant jurisdiction and to undertake periodic investor and
-
41
-
regulatory reporting. In some countries, additional obligations are imposed: for example, in Germany, marketing of a non-EEA fund also requires the appointment of one or more depositaries (with cost implications for the fund). In order to manage and market EEA alternative investment funds more broadly for and to EEA investors, two new entities have been created: (i) Apollo Investment Management Europe LLP (“AIME”), was incorporated by Apollo in the U.K. on March 31, 2016, and obtained authorization from the FCA on October 28, 2016 to carry out activities regulated by the FCA (including managing and marketing alternative investment funds); and (ii) Apollo Investment Management Europe (Luxembourg) S.à r.l. ("AIME Lux") was incorporated by Apollo in Luxembourg on January 2, 2019 and has received approval from Commission de Surveillance du Secteur Financier ("CSSF") to carry out certain activities regulated by the CSSF (including managing and marketing alternative investment funds), with registration effective from such date. AIME and AIME Lux are or will be subject to significant regulatory requirements imposed by the AIFMD, including with respect to conduct of business, regulatory capital, valuations, disclosures and marketing and rules on the structure of remuneration for certain personnel. From January 2017, certain European fund structures have been managed by AIME and marketed by AIME’s European FCA regulated affiliate, Apollo Management International LLP (“AMI”), as permitted under the AIFMD. Going forward, some European funds may be managed by AIME Lux and marketed by it or its regulated affiliates, as permitted under the AIFMD. The European fund structures are subject to ongoing full compliance with all the requirements of the AIFMD, which include (among other things) investor and regulatory disclosures and reporting; satisfying the competent authority of the robustness of internal arrangements with respect to risk management, in particular liquidity risks and additional operational and counterparty risks associated with short selling; the management and disclosure of conflicts of interest; the fair valuation of assets; and the security of depository/custodial arrangements. Additional requirements and restrictions apply where funds invest in an EEA portfolio company, including restrictions that may impose limits on certain investment and realization strategies, such as dividend recapitalizations and reorganizations. Such rules could potentially impose significant additional costs on the operation of our businesses or investments in the EEA and could limit our operating flexibility within the relevant jurisdictions. Some changes to the AIFMD are yet to come; others are under negotiation; and a wider review has commenced which may lead to further changes possibly leading to increased costs and/or burdens and more limit operational flexibility within the EEA and access to EEA investors.
On January 3, 2018, the EU introduced significant changes to the EU Markets in Financial Instruments Directive (Directive 2004/39/EC) (“MiFID”), in the form of the recast Markets in Financial Instruments Directive (Directive 2014/65/EU) (which, along with its relevant EU delegated and implementing legislation and guidance, is collectively referred as “MiFID II”). The original MiFID, which came into force in 2007, is the foundational piece of legislation for financial services firms operating in the EU. Many aspects of MiFID II imposed significant new organizational, conduct, governance and reporting requirements, including new requirements around the receipt of inducements and the use of soft dollars / dealing commissions, enhanced transaction reporting and post-trade transparency requirements, formal telephone taping and communication recording requirements, and new best execution rules. Further, new rules in MiFID II may restrict the ability of entities domiciled outside of the EU (known as “third-country firms”) to provide services to clients domiciled in the EU. MiFID II includes research unbundling rules requiring firms subject to MiFID II to be charged and pay for research independently of dealing commissions. The U.S. SEC has issued temporary no-action relief that, among other things, enables U.S. broker-dealers, on a temporary basis, to receive research payments from money managers in hard dollars without breaching U.S. federal securities laws, where such payment is necessary for the money manager to comply with MiFID II. If such no-action relief is discontinued or withdrawn, this may limit the ability of Apollo’s U.K. MiFID firms to access research from U.S. broker-dealers. Other changes resulting from MiFID II may have an impact (indirectly) on any entity or client that trades on EU markets or trading venues, or does business with EU-regulated banks or brokers. This may include venue trading requirements for certain categories of shares and derivatives, product banning powers, algorithmic trading restrictions, and enhanced requirements around the provision of direct market access services. Such new compliance requirements on our European operations increase our compliance costs. We may be required to invest significant additional management time and resources as market practice relating to the new requirements continues to settle and if additional regulatory guidance is published. Failure to comply with MiFID II and its implementing provisions, as interpreted from time to time, could have a number of serious consequences, including, but not limited to, sanctions from the relevant regulator, inability to access some markets and liquidity sources and a more limited selection of counterparties and providers from which to source services. Sanctions from regulators can include, but are not limited to, public censure (with related reputational damage), significant fines, remediation and withdrawal of license to operate.
The European Parliament has adopted the Regulation on OTC Derivatives, Central Counterparties and Trade Repositories, known as “EMIR.” EMIR and the implementing rules thereunder have come into force in stages and implement requirements similar to, but not the same as, those in Title VII of the Dodd-Frank Act, in particular requiring reporting of most derivative transactions, record keeping, risk mitigation (in particular mandatory initial and variation margin requirements for uncleared OTC derivative transactions entered into by certain market participants) and centralized clearing of certain OTC derivative transactions entered into by certain market participants. EMIR does not have a direct material impact on Apollo’s non-European funds at present, but (i) it impacts funds managed by Apollo’s AIFMs, and (ii) it affects Apollo’s non-European funds indirectly as a result of its impact on many of the Apollo funds’ counterparties to OTC derivatives. Compliance with the relevant requirements is likely to continue to increase the burdens and costs of doing business.
-
42
-
Regulation (EU) 2017/2402 of the European Parliament and of the Council of 12 December 2017 (the “EU Securitization Regulation”) is a new framework for European securitizations which came into effect January 1, 2019. There is a risk that a non-EU alternative investment fund manager (a “non-EU AIFM”), such as the Company that markets an alternative investment fund in the EU which invests in securitization positions could be caught within scope of certain requirements under the EU Securitization Regulation when investing in such positions. To the extent a non-EU AIFM is within the scope of the EU Securitization Regulation it could only hold a securitization exposure where the originator, sponsor or original lender retains 5% of the securitization. There are certain other requirements with which the non-EU AIFM would also need to comply.
The U.K. has implemented transparency legislation that requires many large businesses to publish their U.K. tax strategies on their websites before the end of each financial year. Apollo’s U.K. business is required to comply with these rules. As part of the requirement, organizations must publish information on tax risk management and governance, tax planning, tax risk appetite and their approach to HMRC. Apollo’s refreshed ‘tax strategy’ is published on our website. During the course of 2017, the U.K. implemented a new corporate criminal offense for the failure to prevent the facilitation of tax evasion. The scope of the law and guidance is extremely wide and covers tax evasion committed both in the U.K. and abroad and so could have a global impact for Apollo’s businesses. Criminal liability can be mitigated where a relevant business has proportionate policies and procedures in place to manage the risk. These changes illustrate an evolving approach from HMRC and bring tax matters further into the public domain. As such, tax matters may now be seen to pose a greater reputational risk to the business.
Additional laws and regulations will come into force in the EU in coming years. In addition, pan-EU and European national regulators may also issue extra-statutory guidance. These are expected to (or in the case of new guidance, could) have an impact on Apollo including the costs of, risk to and manner of conducting its business; the markets in which Apollo operates; the assets managed or advised by Apollo; Apollo’s ability to raise capital from investors; and ultimately there may be an impact on the returns which can be achieved. Examples include requirements under the new regulation relating to securities financing transactions (including recently finalized reporting requirements); further changes to or reviews of the extent and interpretation of pay regulation (which may have an impact on the retention and recruitment of key personnel); proposals relating to re-designing the prudential rules applicable to EU investment firms and potentially changes to existing rules in the interim (covering, e.g., revised pay regulation and disclosure requirements and changes to regulatory capital, liquidity, and governance rules); proposals for enhanced regulation of loan origination, servicing of credit agreements and the secondary loan markets; and significant focus on entities considered to be “shadow banks.” In the U.K., there will be additional changes (effective in 2019) to the rules concerning the approval of certain Apollo U.K. professionals to work in the regulated financial services sector. Assessing the impact and implementing these new rules may create additional compliance burden and cost for Apollo. Regulations affecting specific investor types, such as insurance companies, may impact their businesses; their ability to invest and the assets in which they are permitted to invest; and the requirements which their investments place on us, such as extensive disclosure and reporting obligations. The regulation of some institutions has an effect on their ability and willingness to extend credit and the costs of credit. This has, and is likely to continue to have, an impact on the price and availability of credit. Changes to the regulation of benchmarks, such as LIBOR, may affect the way in which those benchmarks are calculated, with commercial implications, including on the stability of the benchmark and returns.
Recent changes to regulations regarding derivatives and commodity interest transactions could adversely impact various aspects of our business.
Derivatives rules and regulations promulgated under the Dodd-Frank Act have become effective over time and comprehensively regulate the “over the counter” (“OTC”) derivatives markets. The Dodd-Frank Act and the regulations promulgated thereunder require mandatory clearing and execution on a swap execution facility of certain swaps and derivative transactions (including formerly unregulated OTC derivatives). The CFTC currently requires that certain interest rate and credit default index swaps be centrally cleared and executed through a swap execution facility. Additional standardized swap contracts are expected to be subject to the clearing and execution requirements in the future. OTC derivatives submitted for clearing are subject to minimum initial and variation margin requirements set by the relevant clearinghouse, as well as margin requirements imposed by the clearing brokers. For swaps that are cleared through a clearinghouse, the funds face the clearinghouse as legal counterparty and are exposed to clearinghouse performance and credit risks. Clearinghouse collateral requirements may differ from and be greater than the collateral terms negotiated with derivatives counterparties in the OTC market. Such increased collateral requirements may increase a fund’s cost in entering into certain products and impact its ability to pursue certain investment strategies. Moreover, OTC derivative dealers are also required to post margin to the clearinghouses through which their customers’ trades are cleared, instead of using such margin in their operations. This will increase the OTC derivative dealers’ costs and such increased costs are expected to be passed through to other market participants in the form of higher upfront and mark-to-market margin, less favorable trade pricing, and possibly new or increased fees. In addition, our derivatives and commodity interest transactions may be subject to similar laws and regulations imposed by non-U.S. jurisdictions and regulators, which may further increase such costs.
OTC trades not cleared through a registered clearinghouse may not be subject to the protections afforded to participants in cleared swaps (for example, centralized counterparty, customer asset segregation and clearinghouse-imposed margin
-
43
-
requirements). The CFTC and various prudential regulators’ final rules on margin requirements for certain uncleared swaps recently went into effect. The final rules generally require banks and dealers, subject to thresholds and certain limited exemptions, to collect and post margin in respect of uncleared swaps. Variation margin requirements for uncleared swaps became effective in 2017, and initial margin requirements for uncleared swaps are expected to phase in through 2020, depending on the aggregate notional amount of over-the-counter swaps traded by a fund. These newly adopted rules on margin requirements for uncleared swaps could adversely affect our businesses, including our ability to enter such swaps or our available liquidity. Although the Dodd-Frank Act includes limited exemptions from the clearing and margin requirements for so-called “end-users,” our funds and portfolio companies may not be able to rely on such exemptions.
The Dodd-Frank Act also creates new categories of regulated market participants, such as “swap-dealers,” “security-based swap dealers,” “major swap participants” and “major security-based swap participants” who will be subject to significant new capital, registration, recordkeeping, reporting, disclosure, business conduct and other regulatory requirements, which will give rise to new administrative costs. Even if certain new requirements are not directly applicable to us, they may still increase our costs of entering into transactions with the parties to whom the requirements are directly applicable.
Position limits imposed by various regulators, self-regulatory organizations or trading facilities on derivatives may also limit our ability to effect desired trades. Position limits are the maximum amounts of net long or net short positions that any one person or entity may own or control in a particular financial instrument. For example, the CFTC, on December 5, 2016, voted to re-propose rules that would establish specific limits on positions in 25 physical commodity futures and option contracts as well as swaps that are economically equivalent to such contracts. In addition, the Dodd-Frank Act requires the SEC to set position limits on security-based swaps. If such proposed rules are adopted, we may be required to aggregate the positions of our various investment funds and the positions of our funds’ portfolio companies. It is possible that trading decisions may have to be modified and that positions held may have to be liquidated in order to avoid exceeding such limits. Such modification or liquidation, if required, could adversely affect our operations and profitability.
Effective 2019, the Federal Reserve, the Federal Deposit Insurance Corporation and the Office of the Comptroller of the Currency have issued regulations, which impose requirements on certain financial contracts of global systemically important banking organizations (“G-SIBs”) to expressly recognize limits on the exercise of default remedies (such as temporary suspension and transfer) by their trading counterparties in the event such G-SIB enters into insolvency proceedings. Regulators in other G20 jurisdictions have implemented, or are in the process of implementing, similar rules regarding the recognition of the application of temporary stay or overrides of certain termination rights under the relevant home-country special resolution regime. These regulations aim to achieve the same policy goal of an orderly resolution of systemically important financial institutions in the event of insolvency. The application of such regulations could adversely impact the exercise of the funds’ contractual rights in the event of an insolvency of a G-SIB trading counterparty.
Risk retention rules could adversely affect our CLO business
.
Effective as of December 24, 2016, “risk retention” rules promulgated by U.S. Federal regulators under the Dodd-Frank Act require a “securitizer” or “sponsor” of a collateralized loan obligation, or “CLO”, to retain at least 5% of the credit risk of the securitized assets, either directly or through a majority-owned affiliate (the “U.S. Risk Retention Rules”). The EU has in place similar 5% risk retention rules (the “EU Risk Retention Rules”, and together with the U.S. Risk Retention Rules, the “Risk Retention Rules”) that apply to certain EU investors such as credit institutions (including banks), investment firms, authorized investment fund managers and insurance and reorganization undertakings. In instances in which any such entities subject to the EU Risk Retention Rules invest in a CLO (as a noteholder or otherwise), such investors must ensure that the CLO satisfies the EU Risk Retention Rules.
The U.S. Risk Retention Rules became effective December 24, 2016. Thus, to the extent they continue to remain in effect, any CLO issued after such date is required to satisfy the U.S. Risk Retention Rules, and any existing CLO issued prior to December 24, 2016 may be structured to satisfy the U.S. Risk Retention Rules to facilitate the later refinancing, re-pricing or material amendment thereof. The EU Risk Retention rules became effective January 1, 2011.
On February 9, 2018, the United States Court of Appeals for the District of Columbia (the “DC Circuit Court”) ruled in favor of an appeal brought by the Loan Syndications and Trading Association (the “LSTA”) from a district court (“District Court”) ruling granting summary judgment to the SEC and the Board of Governors of the Federal Reserve System on the issue of whether the U.S. Risk Retention Rules apply to collateral managers of “open market” CLOs under Section 941 of the Dodd-Frank Act (the “DC Circuit Court Decision”). The District Court entered summary judgment in favor of the LSTA on April 5, 2018. As of the date hereof, CLO managers of “open-market CLOs” (as defined in the DC Circuit Court Decision) will no longer be required to comply with the U.S. Risk Retention Rules. It should be noted, however, that the DC Circuit Court Decision would not apply with respect to any “balance sheet CLOs” (such as middle market CLOs).
The Risk Retention Rules have caused, and are expected to continue to cause, significant changes to the CLO business generally, and to our CLO business specifically. In connection with the Risk Retention Rules, we established Redding Ridge,
-
44
-
which manages CLOs and retains the required risk retention interests. Investors in Redding Ridge include certain of our affiliates as well as accounts and/or funds managed by our affiliates. There can be no assurance that the applicable governmental authorities will agree that Redding Ridge or any CLO it manages will satisfy the requirements of the Risk Retention Rules, which could have an adverse effect on us and/or Redding Ridge.
Redding Ridge has various service arrangements in place with certain of our affiliates pursuant to which such affiliates provide administrative and credit research related services as well as access to certain shared employees. The fees earned by our affiliates under such service arrangements may be less than the fees such affiliates would have otherwise earned as a CLO manager. In addition, to the extent any of our affiliates (and accounts and/or funds managed by our affiliates) invests in Redding Ridge, there is no guarantee that such deployment of capital will generate positive returns or any returns at all. Furthermore, the relationship of our affiliates with Redding Ridge will subject us to various conflicts of interest.
Given that the DC Circuit Court Decision discussed above would not apply with respect to any “balance sheet CLOs” (such as middle market CLOs) undertaken by us or Redding Ridge, such “balance sheet CLOs” would remain subject to the requirements of the U.S. Risk Retention Rules. In addition, the DC Circuit Court Decision would have no applicability with respect to compliance with the EU Risk Retention rules, which continue to remain in effect. Thus, to the extent that we or Redding Ridge were managing a U.S. CLO that was structured to comply with the EU Risk Retention rules (which is done to expand the potential universe of investors for such U.S. CLO) or an European CLO, then we or Redding Ridge, as applicable, would continue to have to comply with the EU Risk Retention rules. Finally, the DC Circuit Court decision would not impact any letter or other contractual agreements (“Risk Retention Undertakings”) that we or Redding Ridge may have or will in the future enter into with investors or other third parties designed to ensure such CLOs comply with the Risk Retention Rules. Depending on the terms of such Risk Retention Undertakings, there may be an ongoing obligation to continue to comply with the U.S. Risk Retention Rules for some period, which if breached could result in claims by investors or third parties.
No assurance can be made that in the future any governmental authority will not take further legislative, regulatory or judicial action with respect to the Risk Retention Rules, and the effect of any such action cannot be known or predicted.
The Risk Retention Rules are also subject to varying interpretations, and one or more agencies or governmental officials could take positions regarding such matters that differ from the approach taken or embodied in the Risk Retention Undertakings, which position could be informed by varying regulatory considerations as well as differing legal analyses. Available interpretive authority to date addressing the Risk Retention Rules applicable to CLOs is limited. Accordingly, no assurance can be made that the currently applicable rules and regulations will not be interpreted differently in the future by any applicable authority, or that there will not be a change in applicable law or rules and regulations in the future that could adversely affect us or the CLOs we manage.
No assurance can be given as to whether the Risk Retention Rules will have a future material adverse effect on our business. The Risk Retention Rules also may have an adverse effect on the leveraged loan market generally, which may adversely affect our CLO management business or the CLO management business of Redding Ridge. As a result of the launch of Redding Ridge, it is less likely that we will manage new CLOs.
Exemptions from certain laws
. In conducting our activities, we regularly rely on exemptions from various requirements of law or regulation in the United States and other jurisdictions, including the Securities Act, the Exchange Act, the Investment Company Act, the Commodity Exchange Act of 1936 and the Employment Retirement Income Securities Act of 1974, each as amended, and the regulations promulgated under each of them. These exemptions are sometimes highly complex.
In certain circumstances we depend on compliance by third parties whom we do not control. For example, in raising new funds, we typically rely on Regulation D for exemption from registration under the Security Act, which was amended in 2013 to prohibit issuers (including our funds) from relying on certain of the exemptions from registration if the fund or any of its “covered persons” (including certain officers and directors, but also including certain third parties including, among others, promoters, placement agents and beneficial owners of 20% of outstanding voting securities of the fund) has been the subject of a “disqualifying event,” or constitutes a “bad actor,” which can result from a variety of criminal, regulatory and civil matters. If any of the covered persons associated with our funds is subject to a disqualifying event, one or more of our funds could lose the ability to raise capital in a Rule 506 private offering for a significant period of time, which could significantly impair our ability to raise new funds, and, therefore, could materially adversely affect our businesses, financial condition and results of operations. In addition, if certain of our employees or any potential significant fund investor has been the subject of a disqualifying event, we could be required to reassign or terminate such an employee or we could be required to refuse the investment of such an investor, which could impair our relationships with investors, harm our reputation, or make it more difficult to raise new funds.
Certain other exemptions require monitoring of ongoing compliance with the applicable requirements throughout the life of the applicable fund. For example, with respect to certain of our funds we rely on the so-called “de minimis” exemption from
-
45
-
commodity pool operator registration, codified in CFTC Rule 4.13(a)(3). If any of those funds cease to qualify for this (or another applicable) exemption, certain Apollo entities associated with and/or affiliated with those funds will be required to register with the CFTC as commodity pool operators. This exemption requires that the amount of commodities interest positions in the applicable commodity pool remain below specified thresholds; in the event that those thresholds are crossed, registration is required and the commodity pool operator may be out of compliance with the applicable regulations until registration is complete. Several Apollo entities are already registered with the CFTC as commodity pool operators. However, registration entails several potentially costly and time-consuming requirements, including, without limitation, membership with the National Futures Association, a self-regulatory organization for the U.S. derivatives industry, and compliance with the regulatory framework applicable to registered commodity pool operators. Certain of our investment management entities are registered as a commodity pool operator. The increased costs associated with such registration may affect the manner in which the funds managed by such investment management entity conducts its business and may adversely affect such fund’s and our profitability. If for any reason any of these exemptions were to become unavailable to us, we could become subject to regulatory action, third-party claims or be required to register under certain regulatory regimes, and our businesses could be materially and adversely affected. See, for example,
“—Risks Related to Our Organization and Structure-If we were deemed an investment company under the Investment Company Act, applicable restrictions could make it impractical for us to continue our businesses as contemplated and could have a material adverse effect on our businesses and the price of our Class A shares and our Preferred shares
.”
Regulatory environment of our funds and portfolio companies of our funds
. The regulatory environment in which our funds and portfolio companies of our funds operate may affect our businesses. Certain laws, such as environmental laws, insurance regulations, gaming laws, takeover laws, anti-bribery and other anti-corruption laws, sanctions laws, escheat or abandoned property laws, CIFIUS review and antitrust laws, may impose requirements on us, our funds and portfolio companies of our funds. For example, certain of our funds or vehicles may invest in the manufacturing sector, natural resources industry or own real assets where environmental laws, regulations and regulatory initiatives and various zoning laws can play a significant role and can have a substantial effect on investments in the industry. Such investments or assets may increase our exposure to regulatory compliance expense and risk of liability under environmental laws that impose, regardless of fault, joint and several liability for the cost of remediating contamination and compensation for damages. In addition, changes in environmental laws or regulations or the environmental condition of an investment may create liabilities that did not exist at the time of acquisition. Even in cases where our funds are indemnified by a seller against liabilities arising out of violations of environmental laws and regulations, there can be no assurance as to the financial viability of the seller or its insurers to satisfy such indemnities or our ability to achieve enforcement of such indemnities. Additionally, changes in antitrust laws or the enforcement of antitrust laws could affect the level of mergers and acquisitions activity, and changes in state laws may limit investment activities of state pension plans. See for additional examples “—
Insurance regulation” and “U.S. and foreign anti-corruption, sanctions and export control laws applicable to us and our funds and portfolio companies create the potential for significant liabilities and penalties and reputational harm
.” See “Item 1. Business-Regulatory and Compliance Matters” for a further discussion of the regulatory environment in which we conduct our businesses.
Certain of the funds and accounts we manage or advise as well as certain of our funds’ portfolio companies that engage in originating, lending and/or servicing loans may be subject to state and federal regulation, borrower disclosure requirements, limits on fees and interest rates on some loans, state lender licensing requirements and other regulatory requirements in the conduct of their business. These funds and accounts may also be subject to consumer disclosures and substantive requirements on consumer loan terms and other federal regulatory requirements applicable to consumer lending that are administered by the Consumer Financial Protection Bureau. These state and federal regulatory programs are designed to protect borrowers. For example, OneMain’s subsidiaries include consumer finance companies operating in the U.S. The consumer finance business is subject to federal and state laws, and failure to comply with applicable laws and regulations could result in regulatory actions, including substantial fines or penalties, lawsuits and damage to our reputation. In addition, certain of the states in which OneMain is licensed to originate loans have laws or regulations which require regulatory approval for the acquisition of “control” of regulated entities. Therefore, any person acquiring directly or indirectly 10% or more of a licensed entity’s common stock may need the prior approval of licensing regulators, or a determination from such regulators that “control” has not been acquired, which could significantly delay or otherwise impede our ability to complete a transaction.
State and federal regulators and other governmental entities have authority to bring administrative enforcement actions or litigation to enforce compliance with applicable lending or consumer protection laws, with remedies that can include fines and monetary penalties, restitution of borrowers, injunctions to conform to law, or limitation or revocation of licenses and other remedies and penalties. In addition, lenders and servicers may be subject to litigation brought by or on behalf of borrowers for violations of laws or unfair or deceptive practices. Failure to conform to applicable regulatory and legal requirements could be costly and have a detrimental impact on certain of our funds or our funds’ portfolio companies and ultimately on Apollo.
Our funds along with their affiliates may obtain a controlling interest (e.g., 80% or more voting control) in certain portfolio companies which may impose risks of liability to such funds under ERISA for a portfolio company’s underfunded pension plans,
-
46
-
including withdrawal liability under any multiemployer plans in which such portfolio company contributes or previously contributed. Such liabilities might arise if any fund (or its general partner or management company, on behalf of such fund) were deemed to be engaged in a “trade or business” under ERISA. The determination of whether an investment fund is engaged in a trade or business under ERISA is uncertain and could depend upon which U.S. Federal Circuit has jurisdiction over the matter. At least one Circuit Court has held that an investment fund was in a “trade or business” for this purpose. Activities that may indicate the existence of a trade or business rather than a passive investment include, but are not limited to, involvement in the management of a portfolio company’s operations, exercising authority with respect to the hiring, termination and compensation of such portfolio company’s employees and agents and receiving fees or other compensation that offset the management fee for services provided to such portfolio company by the relevant fund manager or its affiliates. If any of our funds (along with its affiliates) were treated as engaged in a trade or business for purposes of ERISA and own together with related funds, 80% or more voting control of a portfolio company, then that fund (and certain affiliates of such fund in the same ERISA controlled group (e.g., other controlled portfolio companies)) could be jointly and severally liable to satisfy the liabilities of a specific portfolio company to an ERISA pension plan (i.e., one of our funds might suffer a loss that is greater than its actual investment in a specific portfolio company to the extent that such portfolio company becomes insolvent and is unable to satisfy its own obligations). It should be noted that the test as to whether a fund is engaged in a trade or business for purposes of ERISA may not necessarily be the same as the test that would be used for U.S. Federal income tax purposes.
In addition, regulators may scrutinize, investigate or take action against us as a result of actions or inactions by portfolio companies operating in a regulated industry if such a regulator were to deem, or potentially deem, such portfolio company to be under our control. For example, based on positions taken by European governmental authorities, we or certain of our investment funds potentially could be liable for fines if portfolio companies deemed to be under our control are found to have violated European antitrust laws. Such potential, or future, liability may materially affect our business.
Regulatory environment for control persons
. We could become jointly and severally liable for all or part of fines imposed on portfolio companies of our funds or be fined directly for violations committed by portfolio companies, and such fines imposed directly on us could be greater than those imposed on the portfolio company. The fact that we or one of our funds exercises control or exerts influence (or merely has the ability to exercise control or exert influence) over a company may impose risks of liability (including under various theories of parental liability and piercing the corporate veil doctrines) to us and our funds for, among other things, environmental damage, product defects, employee benefits (including pension and other fringe benefits), failure to supervise management, violation of laws and governmental regulations (including securities laws, anti-trust laws, employment laws, and anti-bribery and other anti-corruption laws) and other types of liability for which the limited liability characteristic of business ownership and the relevant fund itself (and the limited liability structures that may be utilized by such fund in connection with its ownership of our portfolio companies or otherwise) may be ignored or pierced, as if such limited liability characteristics or structures did not exist for purposes of the application of such laws, rules regulations and court decisions. Under certain circumstances, we could also be held liable under federal securities or state common law for statements made by or on behalf of portfolio companies of our funds. These risks of liability may arise pursuant to U.S. and non-U.S. laws, rules, regulations, court decisions or otherwise (including the laws, rules, regulations and court decisions that apply in jurisdictions in which our funds’ portfolio companies or their subsidiaries are organized, headquartered or conduct business). Such liabilities may also arise to the extent that any such laws, rules, regulations or court decisions are interpreted or applied in a manner that imposes liability on all persons that stand to economically benefit (directly or indirectly) from ownership of portfolio companies, even if such persons do not exercise control or otherwise exert influence over such portfolio companies (e.g., limited partners). Lawmakers, regulators and plaintiffs have recently made (and may continue to make) claims along the lines of the foregoing, some of which have been successful. If these liabilities were to arise with respect to any of our funds or portfolio companies of our funds, the fund or portfolio company might suffer significant losses and incur significant liabilities and obligations that may, in turn, affect our results of operations. The possession or exercise of control or influence over a portfolio company could expose our assets and those of our relevant fund, its partners, general partner, management company and their respective affiliates to claims by such portfolio company, its security holders and its creditors and regulatory authorities or other bodies. While we intend to manage our operations to minimize exposure to these risks, the possibility of successful claims cannot be precluded, nor can there be any assurance to whether such laws, rules, regulations and court decisions will be expanded or otherwise applied in a manner that is adverse to us. Moreover, it is possible that, when evaluating a potential portfolio investment, we, as manager of our funds, funds may choose not to pursue or consummate such portfolio investment, if any of the foregoing risks may create liabilities or other obligations for us, any of our funds or any of their respective affiliates.
Insurance regulation
. State insurance departments in the U.S. have broad administrative powers over the insurance business of our U.S. insurance company affiliates, including insurance company licensing and examination, agent licensing, establishment of reserve requirements and solvency standards, premium rate regulation, admissibility of assets, policy form approval, unfair trade and claims practices, marketing practices, advertising, maintaining policyholder privacy, payment of dividends and distributions to shareholders, investments, review and/or approval of transactions with affiliates, reinsurance, acquisitions, mergers and other matters. State regulators regularly review and update these and other requirements.
-
47
-
We are subject to insurance holding company system laws and regulations in the states of domicile of certain insurance companies for which we are (or, with respect to certain pending transactions, will be) deemed to be a control person for purposes of such laws. Specifically, under state insurance laws, we are deemed to be the ultimate parent of (i) Athene Holding’s insurance company subsidiaries, which are domiciled in Delaware, Iowa and New York, (ii) Catalina’s insurance company subsidiaries, which are domiciled in California, Colorado, Connecticut, the District of Columbia and New York, (iii) OneMain’s insurance company subsidiaries, which are domiciled in Indiana and Texas, (iv) Venerable’s insurance subsidiary, which is domiciled in Iowa, (v) LifePoint’s health maintenance organization subsidiary, which is domiciled in Michigan and (vi) Aspen’s insurance company subsidiaries domiciled in North Dakota and Texas for purposes of such laws. Each of California, Colorado, Connecticut, Delaware, the District of Columbia, Indiana, Iowa, Michigan, New York, North Dakota and Texas is a “Domiciliary State”.
Currently, there are proposals to increase the scope of regulation of insurance holding companies in both the U.S. and internationally. The National Association of Insurance Commissioners (the “NAIC”) adopted amendments to the Holding Company Model Act that introduced the concept of “enterprise risk” within an insurance holding company system and imposed more extensive informational reporting regarding parents and other affiliates of insurance companies, with the purpose of protecting domestic insurers from enterprise risk, including requiring an annual enterprise risk report by the ultimate controlling person identifying the material risks within the insurance holding company system that could pose enterprise risk to domestic insurers. Changes to existing NAIC model laws or regulations must be adopted by individual states or foreign jurisdictions before they will become effective. To date, each of the Domiciliary States has enacted laws to adopt such amendments.
Internationally, the International Association of Insurance Supervisors (the “IAIS”) is in the process of adopting a framework for the “group wide” supervision of internationally active insurance groups, including the development of a risk-based global insurance capital standard (“ICS”). The current version of the ICS is in the extended field testing stage. When field testing is completed in 2019, the ICS will be implemented in the following two phases: In the first phase, which will last for five years and which is referred to as the “monitoring period,” the ICS will be used for confidential reporting to group-wide supervisors and discussion in supervisory colleges, and the ICS will not be used as a prescribed capital requirement. After the monitoring period, the ICS will be implemented as a group-wide prescribed capital standard. In addition, in the U.S., the NAIC and the Federal Reserve Board are developing an aggregation method for a group capital calculation. The NAIC has stated that the group capital calculation will be a regulatory tool and will not constitute a requirement or standard; however, it is currently expected that the calculation methodology will incorporate existing risk-based capital concepts. In the U.S., the NAIC has promulgated additional amendments to its insurance holding company system model law that address “group wide” supervision of internationally active insurance groups. To date, each of the Domiciliary States (except for Colorado, the District of Columbia, Michigan and New York) has adopted a form of these provisions. The NAIC has made these amendments to the insurance holding company system model law a part of its accreditation standards for state solvency regulation beginning January 1, 2020, which is likely to motivate the remaining Domiciliary States to adopt the amendments. We cannot predict with any degree of certainty the additional capital requirements, compliance costs or other burdens these requirements may impose on us and our insurance company affiliates.
The Dodd-Frank Act established the Federal Insurance Office (the “FIO”) within the U.S. Department of the Treasury headed by a Director appointed by the Treasury Secretary. While currently not having a general supervisory or regulatory authority over the business of insurance, the Director of the FIO performs various functions with respect to insurance, including serving as a non-voting member of the FSOC and making recommendations to the FSOC regarding non-bank financial companies to be designated as SIFIs. The Director of the FIO has also submitted reports to the U.S. Congress on (i) modernization of U.S. insurance regulation (provided in December 2013) and (ii) the U.S. and global reinsurance market (provided in November 2013 and January 2015, respectively). Such reports could ultimately lead to changes in the regulation of insurers and reinsurers in the U.S.
In addition, the Dodd-Frank Act authorized the Treasury Secretary and the Office of the U.S. Trade Representative to negotiate covered agreements. A covered agreement is an agreement between the U.S. and one or more foreign governments, authorities or regulatory entities, regarding prudential measures with respect to insurance or reinsurance. Pursuant to this authority, in September 2017, the U.S. and the EU signed a covered agreement (the “EU Covered Agreement”) to address, among other things, group supervision and reinsurance collateral requirements. In addition, on December 11, 2018, the U.S. Department of the Treasury and the Office of the U.S. Trade Representative announced their intent to sign a Bilateral Agreement between the U.S. and the U.K. on Prudential Measures Regarding Insurance and Reinsurance in anticipation of the U.K.’s exit from the EU in March 2019 (the “U.K. Covered Agreement”). The U.K. Covered Agreement is subject to a 90-day notification period to the U.S. Congress before it can be signed and come into effect. The NAIC is currently working to adopt amendments to the Credit for Reinsurance Model Law and Regulation to conform to the requirements of the EU Covered Agreement and U.K. Covered Agreement. The reinsurance collateral provisions of the EU Covered Agreement and the U.K. Covered Agreement may increase competition, in particular with respect to pricing for reinsurance transactions, by lowering the cost at which competitors of reinsurance subsidiaries of companies of which Apollo may be deemed to be the ultimate parent pursuant to applicable insurance laws, such as Athene Life Re Ltd. (“ALRe”), are able to provide reinsurance to U.S. insurers. We cannot predict with any degree
-
48
-
of certainty what impact this increased competition will have on the business of such reinsurance subsidiaries, whether the EU Covered Agreement will be implemented or what the impact of such implementation will be on Apollo.
As the ultimate parent of the general partner or manager of certain shareholders of Athene Holding, we are subject to certain insurance laws and regulations in Bermuda, where Apollo is considered a “shareholder controller” of (a) ALRe, a Bermuda Class E insurance company and a wholly owned subsidiary of Athene Holding, a company listed on the New York Stock Exchange, (b) Athora Life Re Ltd., a Bermuda Class E insurance company and a wholly owned subsidiary of Athora Holding Ltd., a Bermuda private company, (c) Catalina General Insurance Ltd, a Bermuda Class 3A and Class C insurer and a wholly owned subsidiary of Catalina Holding (Bermuda) Ltd., and (d) Aspen Bermuda Limited, a Class 4 insurer and a wholly-owned subsidiary of Aspen. Each of ALRe, Athora Life Re Ltd., Catalina General Insurance Ltd and Aspen Bermuda Limited is subject to regulation and supervision by the BMA and compliance with all applicable Bermuda law and Bermuda insurance statutes and regulations, including but not limited to the Bermuda Insurance Act. Under the Bermuda Insurance Act, the BMA maintains supervision over the “controllers” of all registered insurers in Bermuda. For these purposes, a “controller” includes a shareholder controller (as defined in the Bermuda Insurance Act). The Bermuda Insurance Act imposes certain notice requirements upon any person that has become, or as a result of a disposition ceased to be, a shareholder controller, and failure to comply with such requirements is punishable by a fine or imprisonment or both. In addition, the BMA may file a notice of objection to any person or entity who has become a controller of any description where it appears that such person or entity is not, or is no longer, fit and proper to be a controller of the registered insurer, and such person or entity can be subject to fines or imprisonment or both. These laws may discourage potential acquisition proposals and may delay, deter or prevent an acquisition of controllers of Bermuda insurers.
In addition, for purposes of insurance laws Apollo is considered to be the parent of certain European insurance companies domiciled in Belgium, Germany, Ireland, Italy, Switzerland and the U.K. See “Business-Regulatory and Compliance Matters.” These laws and regulations may discourage potential acquisition offers and may delay, deter or prevent the acquisition of qualifying holdings as these affect insurance undertakings in such countries.
Future regulatory changes could adversely affect our businesses. The regulatory environment in which we operate both in the U.S. and outside the U.S. may be subject to changes in regulation. There have been active debates both nationally and internationally over the appropriate extent of regulation and oversight in a number of areas which are or may be relevant to us, including private investment funds and their managers and the so-called “shadow banking” sector.
The regulatory and legal requirements that apply to our activities are subject to change from time to time and may become more restrictive, which may impose additional expenses on us, make compliance with applicable requirements more difficult, require attention of senior management, or otherwise restrict our ability to conduct our business activities in the manner in which they are now conducted. They also may result in fines or other sanctions if we or any of our funds are deemed to have violated any law or regulations. We also may be adversely affected by changes in the interpretation or enforcement of existing laws and rules. Changes in applicable regulatory and legal requirements, including changes in their enforcement, could materially and adversely affect our businesses and our financial condition and results of operations.
Investment advisors have come under increased scrutiny from regulators, including the SEC and other government and self-regulatory organizations, with a particular focus on fees, allocation of expenses to funds, valuation practices, and related disclosures to fund investors. Public statements by regulators, in particular the SEC, indicate increased enforcement attention will continue to be focused on investment advisors, which has the potential to affect us. We also may be adversely affected by changes in the interpretation or enforcement of existing laws and rules by these governmental authorities and self-regulatory organizations.
Regulatory investigations and enforcement actions may adversely affect our operations and create the potential for significant liabilities, penalties and reputational harm.
There can be no assurance that we or our affiliates will avoid regulatory examination and possibly enforcement actions. SEC enforcement actions and settlements involving U.S.-based private fund advisors have involved a number of issues, including the undisclosed allocation of the fees, costs and expenses related to unconsummated co-investment transactions (i.e., the allocation of broken deal expenses), undisclosed legal fee arrangements affording the applicable advisor with greater discounts than those afforded to funds advised by such advisor and the undisclosed acceleration of certain special fees. Recent SEC focus areas have also included the use and compensation of, and disclosure regarding, operating partners or consultants, outside business activities of firm principals and employees, group purchasing arrangements and general conflicts of interest disclosures.
If the SEC or any other governmental authority, regulatory agency or similar body takes issue with our past practices, we will be at risk for regulatory sanction. Even if an investigation or proceeding does not result in a sanction or the sanction imposed is small in monetary amount, the adverse publicity relating to the investigation, proceeding or imposition of these sanctions could harm us and our reputation which may adversely affect our results of operations.
-
49
-
U.S. and foreign anti-corruption, sanctions and export control laws applicable to us and our funds and portfolio companies create the potential for significant liabilities and penalties and reputational harm.
We are subject to a number of laws and regulations governing payments and contributions to political persons or other third parties, including restrictions imposed by the U.S. Foreign Corrupt Practices Act (“FCPA”), as well as trade sanctions and export control laws administered by the Office of Foreign Assets Control, or OFAC, the U.S. Department of Commerce and the U.S. Department of State. The FCPA is intended to prohibit bribery of foreign governments and their employees and political parties, and requires public companies in the U.S. to keep books and records that accurately and fairly reflect their transactions. OFAC, the U.S. Department of Commerce and the U.S. Department of State administer and enforce various export control laws and regulations, including economic and trade sanctions based on U.S. foreign policy and national security goals against targeted foreign states, organizations and individuals. These laws and regulations relate to a number of aspects of our businesses, including servicing existing fund investors, finding new fund investors, and sourcing new investments, as well as activities by the portfolio companies of our funds. In recent years, the U.S. Department of Justice and the SEC have devoted greater resources to enforcement of the FCPA. In addition, the U.K. has significantly expanded the reach of its anti-bribery laws. While we have developed and implemented policies and procedures designed to ensure compliance by us and our personnel with the FCPA and other applicable anti-bribery laws, such policies and procedures may not be effective in all instances to prevent violations. Any determination that we have violated the FCPA or other applicable anticorruption laws or anti-bribery laws could subject us to, among other things, civil and criminal penalties, material fines, profit disgorgement, injunctions on future conduct, securities litigation and a general loss of investor confidence, any one of which could adversely affect our business prospects and/or financial position.
In addition, we may also be adversely affected if there is misconduct by personnel of portfolio companies in which our funds invest. For example, failures by personnel at our funds’ portfolio companies to comply with anti-bribery or trade sanctions requirements could cause significant reputational and business harm to us. Such misconduct may undermine our due diligence efforts with respect to such portfolio companies and could negatively affect the valuations of a fund’s investments.
The SEC, the Financial Industry Regulatory Authority (“FINRA”), as well as certain U.S. states, localities, and public instrumentalities, have adopted ‘‘pay-to-play’’ laws, rules, regulations and/or policies which restrict the political activities of investment managers that seek investment from or manage funds on behalf of state and local government entities. Such restrictions can include limits on the ability of the managers covered investment advisors, certain covered employees of the advisor or covered political action committees controlled by the advisor or its employees to make political contributions to or fundraise for certain state and local candidates, officials, and political organizations, as well as obligations to make regular disclosures about such political activities to federal, state, or local regulators. In addition, many pay-to-play regimes (including the SEC pay-to-play rule for investment advisors) impute the personal political activities of certain executives and employees, and in some instances their spouses and family members, to the covered advisor for purposes of potential pay-to-play liability. Violation of pay-to-play laws can lead to the loss of management fees, rescission of current commitments to our funds, and a loss of future investment opportunities, and issues involving pay-to-play violations and alleged pay-to-play violations often receive substantial media coverage. Any failure on our part or a party acting on our behalf to comply with applicable pay-to-play laws, regulations or policies could expose us to significant penalties and reputational damage, and could have a material adverse impact on us.
The Iran Threat Reduction and Syrian Human Rights Act of 2012 (“ITRA”) expanded the scope of U.S. sanctions against Iran. Notably, ITRA generally prohibits foreign entities that are majority owned or controlled by U.S. persons from engaging in transactions with Iran. This restriction was alleviated by the Joint Comprehensive Plan of Action (the “JCPOA”), which was implemented on January 16, 2016 and authorized foreign entities with U.S. ownership to engage in certain Iran-related transactions under OFAC’s General License H. However, on November 4, 2018, the JCPOA and General License H were terminated by the U.S. government, reverting to pre-JCPOA restrictions for U.S.-owned foreign entities. In addition, Section 219 of ITRA amended the Exchange Act to require public reporting companies to disclose in their annual or quarterly reports certain dealings or transactions the company or its affiliates engaged in during the previous reporting period involving Iran or other individuals and entities targeted by certain OFAC sanctions. In some cases, ITRA requires companies to disclose these types of transactions even if they were permissible under U.S. law or were conducted outside of the U.S. by a non-U.S. entity. Companies that may be considered our affiliates have publicly filed and/or provided to us the disclosures reproduced in each of the Company’s Annual Reports on Form 10-K filed on March 3, 2014 and March 1, 2013 and the Company’s Quarterly Report on Form 10-Q filed on November 12, 2013. We have not independently verified or participated in the preparation of these disclosures. We are required to separately file, concurrently with our annual report, a notice that such activities have been disclosed in our annual report. The SEC is required to post this notice of disclosure on its website and send the report to the U.S. President and certain U.S. Congressional committees. Disclosure of such activity, even if such activity is not subject to penalties or sanctions under applicable law, and any penalties or sanctions actually imposed on us or our affiliates as a result of these activities, could harm our reputation and have a negative impact on our business.
-
50
-
Differences between U.S. and foreign anti-corruption, sanctions and export control laws increase the risks and complexities of compliance, and sometimes present actual conflicts of law (especially in the sanctions area). If we fail to comply with this multitude of laws and regulations, even where conflicts of law arise, we could be exposed to claims for damages, civil or criminal penalties, reputational harm, incarceration of our employees, restrictions on our operations and other liabilities, which could negatively affect our businesses, operating results and financial condition. In addition, depending on the circumstances, we could be subject to liability for violations of applicable anti-corruption, sanctions or export control laws committed by companies in which we or our funds invest or which we or our funds acquire.
A portion of our revenues, earnings and cash flow is highly variable, which may make it difficult for us to achieve steady earnings growth on a quarterly basis, and we do not intend to regularly provide comprehensive earnings guidance, which may cause the price of our Class A shares and our Preferred shares to be volatile.
A portion of our revenues, earnings and cash flow is highly variable, primarily due to the fact that performance fees from our private equity funds and certain of our credit and real assets funds, which constitutes the largest portion of income from our combined businesses, and the transaction and advisory fees that we receive, can vary significantly from quarter to quarter and year to year. In addition, the investment returns of most of our funds are volatile. We may also experience fluctuations in our results from quarter to quarter and year to year due to a number of other factors, including changes in the values of our funds’ investments, changes in the amount of distributions, dividends or interest paid in respect of investments, changes in our operating expenses, the degree to which we encounter competition and general economic and market conditions. Our future results will also be significantly dependent on the success of our larger funds (e.g., Fund VIII and Fund IX), changes in the value of which may result in fluctuations in our results. In addition, performance fees from our private equity funds and certain of our credit and real assets funds is subject to contingent repayment by the general partner if, upon the final distribution, the relevant fund’s general partner has received cumulative performance fees on individual portfolio investments in excess of the amount of performance fees it would be entitled to from the profits calculated for all portfolio investments in the aggregate. See
“—Poor performance of our funds would cause a decline in our revenue and results of operations, may obligate us to repay performance fees previously paid to us and would adversely affect our ability to raise capital for future funds
.” Such variability may lead to volatility in the trading price of our Class A shares and our Preferred shares and cause our results for a particular period not to be indicative of our performance in a future period. It may be difficult for us to achieve steady growth in earnings and cash flow on a quarterly basis, which could in turn lead to large adverse movements in the price of our Class A shares and our Preferred shares or increased volatility in the price of our Class A shares and our Preferred shares in general.
The timing of performance fees generated by our funds is uncertain and will contribute to the volatility of our results. Performance fees depends on our funds’ performance. It takes a substantial period of time to identify attractive investment opportunities, to raise all the funds needed to make an investment and then to realize the cash value or other proceeds of an investment through a sale, public offering, recapitalization or other exit. Even if an investment proves to be profitable, it may be several years before any profits can be realized in cash or other proceeds. We cannot predict when, or if, any realization of investments will occur. Generally, with respect to our private equity funds, although we recognize performance fees on an accrual basis, we receive private equity performance fees payments only upon disposition of an investment by the relevant fund, which contributes to the volatility of our cash flow. If our funds were to have a realization event in a particular quarter or year, it may have a significant impact on our results for that particular quarter or year that may not be replicated in subsequent periods. We recognize revenue on investments in our funds based on our allocable share of realized and unrealized gains (or losses) reported by such funds, and a decline in realized or unrealized gains, or an increase in realized or unrealized losses, would adversely affect our revenue, which could further increase the volatility of our results. With respect to a number of our credit funds, our performance fees is generally paid annually, semi-annually or quarterly, and the varying frequency of these payments will contribute to the volatility of our revenues and cash flow. Furthermore, we earn this performance fees only if the net asset value of a fund has increased or, in the case of certain funds, increased beyond a particular threshold. The general partners of certain of our credit funds accrue certain performance fees when the fair value of investments exceeds the cost basis of the individual investor’s investments in the fund, including any allocable share of expenses incurred in connection with such investment, which is referred to as a “high water mark.” The general partners for the remainder of our credit funds generally defer such performance fees until the fees are crystallized or are no longer subject to clawback or reversal. For certain performance fee arrangements, high water marks are applied on an individual investor basis. If the high water mark for a particular investor is not surpassed, we would not earn such performance fees with respect to such investor during a particular period even though such investor had positive returns in such period as a result of losses in prior periods. If such an investor experiences losses, we will not be able to earn such performance fees from such investor until it surpasses the previous high water mark. Such performance fees we earn are therefore dependent on the net asset value of investors’ investments in the fund, which could lead to significant volatility in our results.
Because a portion of our revenue, earnings and cash flow can be highly variable from quarter to quarter and year to year, we do not plan to provide any comprehensive guidance regarding our expected quarterly and annual revenues, earnings and cash
-
51
-
flow. The lack of comprehensive guidance on a regular and consistent basis may affect the expectations of public market investors and could cause increased volatility in the price of our Class A shares and our Preferred shares.
The investment management business is intensely competitive, which could have a material adverse impact on us.
The investment management business is intensely competitive. We face competition both in the pursuit of outside investors for our funds and in acquiring investments in attractive portfolio companies and making other investments. It is possible that it will become increasingly difficult for our funds to raise capital as funds compete for investments from a limited number of qualified investors.
Competition among funds is based on a variety of factors, including:
|
•
|
investment performance;
|
|
•
|
investor liquidity and willingness to invest;
|
|
•
|
investor perception of investment managers’ drive, focus and alignment of interest;
|
|
•
|
quality of service provided to and duration of relationship with investors;
|
|
•
|
business reputation; and
|
|
•
|
the level of fees and expenses charged for services.
|
We compete in all aspects of our businesses with a large number of investment management firms, private equity, credit and real assets fund sponsors and other financial institutions. A number of factors serve to increase our competitive risks:
|
•
|
fund investors may develop concerns that we will allow a business to grow to the detriment of its performance;
|
|
•
|
investors may reduce their investments in our funds or not make additional investments in our funds based upon current market conditions, their available capital or their perception of the health of our businesses;
|
|
•
|
the attractiveness of our funds relative to investments in other investment products could change depending on economic and market conditions;
|
|
•
|
some of our competitors have greater capital, lower targeted returns or greater sector or investment strategy-specific expertise than we do, which creates competitive disadvantages with respect to investment opportunities;
|
|
•
|
some of our competitors may also have a lower cost of capital and access to funding sources that are not available to us, which may create competitive disadvantages for us with respect to investment opportunities;
|
|
•
|
some of our competitors may perceive risk differently than we do, which could allow them either to outbid us for investments in particular sectors or, generally, to consider a wider variety of investments;
|
|
•
|
some of our funds may not perform as well as competitors’ funds or other available investment products;
|
|
•
|
our funds’ competitors that are corporate buyers may be able to achieve synergistic cost savings in respect of an investment, which may provide them with a competitive advantage in bidding for an investment;
|
|
•
|
our competitors have instituted or may institute low cost, high speed financial applications and services based on artificial intelligence and new competitors may enter the investment management space using new investment platforms based on artificial intelligence;
|
|
•
|
developments in financial technology (or fintech), such as a distributed ledger technology (or blockchain), have the potential to disrupt the financial industry and change the way financial institutions, as well as investment managers, do business, and could exacerbate these competitive pressures;
|
|
•
|
some fund investors may prefer to invest with an investment manager that is not publicly traded;
|
|
•
|
the successful efforts of new entrants into our various businesses, including former “star” portfolio managers at large diversified financial institutions as well as such institutions themselves, may result in increased competition;
|
|
•
|
there are relatively few barriers to entry impeding other alternative investment management firms from implementing an integrated platform similar to ours or the strategies that we deploy at our funds, such as distressed investing, which we believe are competitive strengths of ours; and
|
|
•
|
other industry participants continuously seek to recruit our investment professionals away from us.
|
These and other factors could reduce our earnings and revenues and have a material adverse effect on our businesses. In addition, if we are forced to compete with other alternative investment managers on the basis of price, we may not be able to maintain our current management fee and performance fees structures. We have historically competed primarily on the performance of our funds, and not on the level of our fees or performance fees relative to those of our competitors. However, there is a risk that fees and performance fees in the alternative investment management industry will decline, without regard to the historical performance of a manager. Fee or performance fees reductions on existing or future funds, without corresponding decreases in our cost structure, would adversely affect our revenues and profitability.
-
52
-
Our ability to retain our investment professionals is critical to our success and our ability to grow depends on our ability to attract and retain key personnel.
Our success depends on our ability to retain our investment professionals and recruit additional qualified personnel. We anticipate that it will be necessary for us to add investment professionals as we pursue our growth strategy. However, we may not succeed in recruiting additional personnel or retaining current personnel, as the market for qualified investment professionals is extremely competitive. Our investment professionals possess substantial experience and expertise in investing, are responsible for locating and executing our funds’ investments, have significant relationships with the institutions that are the source of many of our funds’ investment opportunities, and in certain cases have key relationships with our fund investors. Therefore, if our investment professionals join competitors or form competing companies it could result in the loss of significant investment opportunities and certain existing fund investors. Additionally, recent changes in law in the U.S. and U.K. have increased the tax rate on various income streams used to compensate investment professionals. More specifically, in December 2017, President Trump signed into law Public Law Number 115-97, formerly known as the Tax Cuts and Jobs Act (the “TCJA”). The TCJA changed the holding period requirement for investment professionals to receive long-term capital gain treatment on performance fees for taxable years beginning after December 31, 2017. Going forward, performance fees attributable to gains with respect to assets held for three years or less will be treated as short-term capital gains and taxed at ordinary income rates. There remains uncertainty as to whether these rules may be further modified in the future to be even broader in scope. States and other jurisdictions in the past have also considered legislation to increase taxes with respect to performance fees. For example, New York has periodically considered legislation under which non-residents of New York could be subject to New York state income tax on income in respect of our Class A shares as a result of certain activities of our affiliates in New York, and recently Governor Cuomo, as a response to certain aspects of the TCJA, proposed legislation to reform the treatment of incentive income in New York to tax such income at higher rates. Additional details of Governor Cuomo’s proposal remain unclear, and it is uncertain when or whether such legislation would be enacted. Legislation similar to Governor Cuomo’s proposal in New York has been considered in California and Connecticut (and passed in New Jersey although it is not currently effective), where a significant portion of our employees reside and could impact our ability to recruit investment professionals. In addition, the U.K. implemented legislation effective from April 2015 that changed the scope and tax rate for performance fees, particularly for individuals who have immigrated to the U.K., so called “non-domiciled individuals.” Further, from 2016, legislation that taxes performance fees as deemed trading income has come into force affecting partners of Apollo Management International LLP who have an interest in funds that have a weighted average holding period of fewer than 40 months. Because a portion of certain investment professionals’ compensation arises from equity interests in our businesses or a right to receive performance fees, the potentially less favorable tax treatment of performance fees in the U.S. or the U.K. could adversely affect our ability to recruit, retain and motivate our current and future investment professionals or require us to alter our approach to compensating investment professionals. Fluctuations in the distributions to investment professionals generated from performance fees could also impair our ability to attract and retain qualified personnel.
Furthermore, the SEC has proposed mandatory clawback rules that would require listed companies to adopt a clawback policy providing for recovery of incentive-based compensation awarded to executive officers if the company is required to prepare an accounting restatement resulting from material noncompliance with financial reporting requirements. However, these proposals have not yet been finalized and the specific long-term impact on us is not yet clear. There is the potential that new compensation rules will make it more difficult for us to attract and retain investment professionals by capping the amount of variable compensation compared to fixed pay, requiring the deferral of certain types of compensation over time, implementing “clawback” requirements, or making other changes deemed onerous by such investment professionals.
Amounts earned by our employees who participate in performance fees will vary year-to-year depending on the overall realized performance of the Company. As a result, there may be periods when the executive committee of the Company’s manager determines that allocations of realized performance fees are not sufficient to compensate individuals, which may result in an increase in salary, bonus and benefits, the modification of existing programs or the use of new remuneration programs, which may increase our overall compensation costs. Reductions in performance fee revenues could also make it harder to retain employees and cause employees to seek other employment opportunities.
The loss of even a small number of our investment professionals could jeopardize the performance of our funds, which would have a material adverse effect on our results of operations. Efforts to retain or attract investment professionals and other personnel may result in significant additional expenses, which could adversely affect our profitability.
We strive to maintain a work environment that promotes our culture of collaboration, motivation and alignment of interests with our fund investors and shareholders. If we do not continue to develop and implement effective processes and tools to manage growth and reinforce this vision, our ability to compete successfully and achieve our business objectives could be impaired, which could negatively affect our businesses, financial condition and results of operations.
-
53
-
We may not be successful in expanding into new investment strategies, markets and businesses.
We actively consider the opportunistic expansion of our businesses, both geographically and into complementary new investment strategies. We may not be successful in any such attempted expansion. Attempts to expand our businesses involve a number of special risks, including some or all of the following:
|
•
|
the diversion of management’s attention from our core businesses;
|
|
•
|
the disruption of our ongoing businesses;
|
|
•
|
entry into markets or businesses in which we may have limited or no experience;
|
|
•
|
increasing demands on our operational systems and infrastructure;
|
|
•
|
potential increase in investor concentration; and
|
|
•
|
the broadening of our geographic footprint, increasing the risks associated with conducting operations in foreign jurisdictions (including regulatory, tax, legal and reputational consequences).
|
Additionally, any expansion of our businesses could result in significant increases in our outstanding indebtedness and debt service requirements, which would increase the risks of investing in our Class A shares and our Preferred shares, and may adversely impact our results of operations and financial condition.
We also may not be successful in identifying new investment strategies or geographic markets that increase our profitability, or in identifying and acquiring new businesses that increase our profitability. Because we have not yet identified these potential new investment strategies, geographic markets or businesses, we cannot identify for you all the risks we may face and the potential adverse consequences on us and your investment that may result from our attempted expansion. We also do not know how long it may take for us to expand, if we do so at all. We have also entered into strategic partnerships, separately managed accounts and sub-advisory arrangements, which lack the scale of our traditional funds and are more costly to administer. The prevalence of these accounts may also present conflicts and introduce complexity in the deployment of capital. We have total discretion, at the direction of our manager, without needing to seek approval from our board of directors or shareholders, to enter into new investment strategies, geographic markets and businesses, other than expansions involving transactions with affiliates which may require board approval.
Many of our funds invest in relatively high-risk, illiquid assets and we may fail to realize any profits from these activities for a considerable period of time or lose some or all of the principal amount we invest in these activities.
Many of our funds invest in securities that are not publicly traded. In many cases, our funds may be prohibited by contract or by applicable securities laws from selling such securities for a period of time. Our funds will generally not be able to sell these securities publicly unless their sale is registered under applicable securities laws, or unless an exemption from such registration requirements is available. The ability of many of our funds, particularly our private equity funds, to dispose of investments is heavily dependent on the public equity markets, inasmuch as the ability to realize value from an investment may depend upon the ability to complete an IPO of the portfolio company in which such investment is held. Furthermore, large holdings even of publicly traded equity securities can often be disposed of only over a substantial period of time, exposing the investment returns to risks of downward movement in market prices during the disposition period. Moreover, because the investment strategy of many of our funds often entails our having representation on public portfolio company boards of our funds, our funds may be restricted in their ability to affect such sales during certain time periods. Accordingly, our funds may be forced, under certain conditions, to sell securities at a loss.
Dependence on significant leverage in investments by our funds could adversely affect our ability to achieve attractive rates of return on those investments.
Because certain of our funds’ investments rely heavily on the use of leverage, our ability to achieve attractive rates of return on investments will depend on our continued ability to access sufficient sources of indebtedness at attractive rates. For example, in many of our private equity fund investments, indebtedness may constitute 70% or more of a portfolio company’s total debt and equity capitalization, including debt that may be incurred in connection with the investment, and a portfolio company’s leverage may increase as a result of recapitalization transactions subsequent to the company’s acquisition by a private equity fund. The absence of available sources of senior debt financing for extended periods of time could therefore materially and adversely affect our funds. An increase in either the general levels of interest rates or in the risk spread demanded by sources of indebtedness would make it more expensive to finance those investments. Increases in interest rates could also make it more difficult to locate and consummate private equity investments because other potential buyers, including operating companies acting as strategic buyers, may be able to bid for an asset at a higher price due to a lower overall cost of capital. Conversely, certain of the strategies pursued by funds we manage benefit from higher interest rates, and a sustained low interest rate environment may negatively impact expected returns for these funds. The TCJA also introduced a new limitation on the deductibility of interest for U.S. Federal income tax purposes for corporations and pass-through entities. For taxable years beginning after December 31, 2017, taxpayers
-
54
-
may no longer deduct business interest expense in excess of the sum of (i) business interest income and (ii) 30% of “adjusted taxable income” (which is similar to EBITDA for taxable years beginning before January 1, 2022, and similar to EBIT for taxable years beginning thereafter). Notably these limitations apply to existing debt and there are no transitional rules. Although the impact of this limitation will vary across our funds’ portfolio companies, it is possible that we may not be able to utilize the same amount of leverage to finance investments going forward or that a material amount of interest expense may not be deductible for U.S. Federal income tax purposes by our portfolio companies, both of which may have a material impact on our rates of return on investments. See “—
Recently enacted U.S. tax legislation may materially adversely affect our results of operation and cash flows and may have adverse tax consequences for certain of our Class A shareholders
.”
In addition, a portion of the indebtedness used to finance certain of our fund investments often includes high-yield debt securities. Availability of capital from the high-yield debt markets is subject to significant volatility, and there may be times when we might not be able to access those markets at attractive rates, or at all. To the extent that there are limits the amount or cost of financing our funds are able to obtain, the returns on our funds’ investments may suffer.
Investments in highly leveraged entities are inherently more sensitive to declines in revenues, increases in expenses and interest rates and adverse economic, market and industry developments. The incurrence of a significant amount of indebtedness by an entity could, among other things:
|
•
|
give rise to an obligation to make mandatory prepayments of debt using excess cash flow, which might limit the entity’s ability to respond to changing industry conditions to the extent additional cash is needed for the response, to make unplanned but necessary capital expenditures or to take advantage of growth opportunities;
|
|
•
|
allow even moderate reductions in operating cash flow to render it unable to service its indebtedness, leading to a bankruptcy or other reorganization of the entity and a loss of part or all of the equity investment in it;
|
|
•
|
limit the entity’s ability to adjust to changing market conditions, thereby placing it at a competitive disadvantage compared to its competitors who have relatively less debt;
|
|
•
|
limit the entity’s ability to engage in strategic acquisitions that might be necessary to generate attractive returns or further growth; and
|
|
•
|
limit the entity’s ability to obtain additional financing or increase the cost of obtaining such financing, including for capital expenditures, working capital or general corporate purposes.
|
As a result, the risk of loss associated with a leveraged entity is generally greater than for companies with comparatively less debt. For example, many investments consummated by private equity sponsors during 2005, 2006 and 2007 that utilized significant amounts of leverage subsequently experienced severe economic stress and in certain cases defaulted on their debt obligations due to a decrease in revenues and cash flow precipitated by the economic downturn.
When certain of our funds’ existing portfolio investments reach the point when debt incurred to finance those investments matures in significant amounts and must be either repaid or refinanced, those investments may materially suffer if they have generated insufficient cash flow to repay maturing debt and there is insufficient capacity and availability in the financing markets to permit them to refinance maturing debt on satisfactory terms, or at all. If a limited availability of financing for such purposes were to persist for an extended period of time, when significant amounts of the debt incurred to finance these funds’ existing portfolio investments came due, these funds could be materially and adversely affected. Additionally, if such limited availability of financing persists, our funds may also not be able to recoup their investments, as issuers of debt become unable to repay their borrowings.
In addition to our private equity funds, many of our other funds may choose to use leverage as part of their respective investment programs and regularly borrow a substantial amount of their capital. The use of leverage poses a significant degree of risk and enhances the possibility of a significant loss in the value of the investment portfolio. Our credit and real assets funds may borrow money from time to time to purchase or carry securities. The interest expense and other costs incurred in connection with such borrowing may not be recovered by appreciation in the securities purchased or carried, and will be lost-and the timing and magnitude of such losses may be accelerated or exacerbated-in the event of a decline in the market value of such securities. Gains realized with borrowed funds may cause the fund’s net asset value to increase at a faster rate than would be the case without borrowings. However, if investment results fail to cover the cost of borrowings, the fund’s net asset value could also decrease faster than if there had been no borrowings. The inability to obtain such financing on attractive terms may impact our funds’ ability to achieve targeted rates of return.
In addition, under the provisions of the Investment Company Act, AINV is permitted, as a business development company, to issue senior securities in amounts such that its asset coverage, as defined in the Investment Company Act, equals at least 200% after each issuance of senior securities. Effective April 4, 2019, AINV will be permitted to decrease its asset coverage to 150%. Further, AFT and AIF, as registered investment companies, are restricted in the (i) issuance of preferred shares to amounts such that their respective asset coverage (as defined in Section 18 of the Investment Company Act) equals at least 200% after issuance
-
55
-
and (ii) incurrence of indebtedness, including through the issuance of debt securities, such that, immediately after issuance the fund will have an asset coverage (as defined in the Investment Company Act) of at least 300%. The ability of AFT and AIF to pay dividends on their common stock may be restricted if the asset coverage of their indebtedness falls below 300% and if the asset coverage on their preferred stock falls below 200% (150% effective April 4, 2019). AINV will be restricted if its asset coverage ratio falls below 200% and any amounts that it uses to service its indebtedness are not available for dividends to its common shareholders. An increase in interest rates could also decrease the value of fixed-rate debt investments that our funds make. Any of the foregoing circumstances could have a material adverse effect on our financial condition, results of operations and cash flow.
Certain of our funds may invest in high-yield, below investment grade or unrated debt, or securities of companies that are experiencing significant financial or business difficulties, including companies involved in bankruptcy or other reorganization and liquidation proceedings. Such investments are subject to a greater risk of poor performance or loss.
Certain of our funds, especially our credit funds, may invest in below investment grade or unrated debt, including corporate loans and bonds, each of which generally involves a higher degree of risk than investment grade rated debt, and may be less liquid. Issuers of high yield or unrated debt may be highly leveraged, and their relatively high debt-to-equity ratios create increased risks that their operations might not generate sufficient cash flow to service their debt obligations. As a result, high yield or unrated debt is often less liquid than investment grade rated debt. Also, investments may be made in loans and other forms of debt that are not marketable securities and therefore are not liquid. In the absence of hedging measures, changes in interest rates generally will also cause the value of debt investments to vary inversely to such changes. The obligor of a debt security or instrument may not be able or willing to pay interest or to repay principal when due in accordance with the terms of the associated agreement and collateral may not be available or sufficient to cover such liabilities. Commercial bank lenders and other creditors may be able to contest payments to the holders of other debt obligations of the same obligor in the event of default under their commercial bank loan agreements. Sub-participation interests in syndicated debt may be subject to certain risks as a result of having no direct contractual relationship with underlying borrowers. Debt securities and instruments may be rated below investment grade by recognized rating agencies or unrated and face ongoing uncertainties and exposure to adverse business, financial or economic conditions and the issuer’s failure to make timely interest and principal payments.
Certain of our funds, especially our credit funds, may invest in business enterprises that are or may become involved in work-outs, liquidations, spin-offs, reorganizations, bankruptcies and similar transactions, and may purchase non-performing loans or other high-risk receivables. An investment in such a business enterprise entails the risk that the transaction in which such business enterprise is involved either will be unsuccessful, will take considerable time or will result in a distribution of cash or a new security the value of which will be less than the purchase price to the fund of the security or other financial instrument in respect of which such distribution is received. In addition, if an anticipated transaction does not in fact occur, the fund may be required to sell its investment at a loss. Investments in troubled companies may also be adversely affected by U.S. Federal and state laws relating to, among other things, fraudulent conveyances, voidable preferences, lender liability and a bankruptcy court’s discretionary power to disallow, subordinate or disenfranchise particular claims. Investments in securities and private claims of troubled companies made in connection with an attempt to influence a restructuring proposal or plan of reorganization in a bankruptcy case may also involve substantial litigation. Because there is substantial uncertainty concerning the outcome of transactions involving financially troubled companies, there is a potential risk of loss by a fund of its entire investment in such company. Moreover, a major economic recession could have a materially adverse impact on the value of such securities.
Adverse publicity and investor perceptions, whether or not based on fundamental analysis, may also decrease the value and liquidity of securities rated below investment grade or otherwise adversely affect our reputation. For example, certain of our funds, especially our credit funds, may receive equity in exchange for debt securities of troubled companies in which they have invested, and thus become equity owners of business enterprises that have not been subject to the same level or kind of due diligence investigation that our funds would typically conduct in connection with an equity investment. This could result in adverse publicity, reputational harm, and possibly control person liability in certain circumstances depending on the size of the funds’ equity stake and other factors.
We rely on technology and information systems to conduct our businesses, and any failures and interruptions of these systems could adversely affect our businesses and results of operations. Additionally, we face operational risks in the execution, confirmation or settlement of transactions and our dependence on our New York-based offices and third-party providers.
We rely on a host of computer software and hardware systems, all of which are vulnerable to an increasing number of data security threats. We further rely on financial, accounting and other data processing systems to mitigate the risk of errors in the execution, confirmation or settlement of transactions. As we depend on our New York-based offices and third-party service providers for hosting solutions and technologies, a disaster or disruption in the related infrastructure could impair our operations and could impact our reputation, adversely affect our businesses and limit our ability to grow. The materialization of one or more of these risks is likely to have a material adverse effect on us.
-
56
-
Reliance on computer hardware and software systems
. There has been an increase in the frequency and sophistication of the data security threats we face, with attacks ranging from those common to businesses generally to those that are more advanced and persistent, which may target us because, as an alternative investment management firm, we hold a significant amount of confidential and sensitive information about, among other things, our investors, the portfolio companies of our funds and potential fund investments. As a result, we may face a heightened risk of a security breach or disruption with respect to this information resulting from an attack by computer hackers, foreign governments or cyber terrorists. For example, we and our employees may be the target of fraudulent emails or other targeted attempts to gain unauthorized access to proprietary or sensitive information. If successful, these types of attacks on our network or other systems could have a material adverse effect on our business and results of operations, due to, among other things, the loss of investor or proprietary data, interruptions or delays in our business and damage to our reputation.
Although we are not currently aware of any cyberattacks or other incidents that, individually or in the aggregate, have materially affected, or would reasonably be expected to materially affect, our operations or financial condition, there can be no assurance that the various procedures and controls we utilize to mitigate these threats will be sufficient to prevent disruptions to our systems, especially because the cyberattack techniques used change frequently and are not recognized until launched, the full scope of a cyberattack may not be realized until an investigation has been performed and cyberattacks can originate from a wide variety of sources. We rely on industry accepted security measures and technology to securely maintain confidential and proprietary information maintained on our information systems. Although we take protective measures and endeavors to strengthen our computer systems, software, technology assets and networks to prevent and address potential cyberattacks, there can be no assurance that any of these measures prove effective. Moreover, due to the complexity and interconnectedness of our systems, the process of upgrading or patching the Company’s protective measures could itself create a risk of security issues or system disruptions for the Company, as well as for clients who rely upon, or have exposure to, our systems.
In addition, the unavailability of the information systems or the failure of these systems to perform as anticipated for any reason could disrupt our businesses and could result in decreased performance and increased operating costs, causing our businesses and results of operations to suffer. Any significant interruption or failure of our information systems or any significant breach of security could have a material effect on our businesses and results of operations due to, among other things, the loss of investor or proprietary data, interruptions or delays in our business and damage to our reputation. If our systems are compromised, do not operate properly or are disabled, or we fail to provide the appropriate regulatory or other notifications in a timely manner, we could suffer a financial loss, a disruption of our businesses, liability to our investment funds, regulatory intervention or reputational damage. Our funds’ portfolio companies also rely on data processing systems and the secure processing, storage and transmission of information, including payment and health information. A disruption or compromise of these systems could have a material adverse effect on the value of these businesses. Breaches in security could potentially jeopardize our, our employees’ or our fund investors’ or counterparties’ confidential and other information processed and stored in, and transmitted through, our computer systems and networks, or otherwise cause interruptions or malfunctions in our, our employees’, our fund investors’, our counterparties’ or third parties’ operations, which could result in significant losses, increased costs, disruption of our business, liability to our fund investors and other counterparties, regulatory intervention or reputational damage.
The costs related to data security threats or disruptions may not be fully insured or indemnified by other means. In addition, data security has become a top priority for regulators around the world. For example, one of the 2018 examination priorities identified by the SEC’s Office of Compliance Inspections and Examinations’ (OCIE) was to continue to examine for data security compliance procedures and controls, including testing the implementation of those procedures and controls. Additionally, any jurisdictions in which we operate have laws and regulations relating to data privacy, cybersecurity and protection of personal information, including the General Data Protection Regulation in the European Union that went into effect in May 2018. Some jurisdictions have also enacted laws requiring companies to notify individuals of data security breaches involving certain types of personal data. If we fail to comply with the relevant laws and regulations, it could result in regulatory investigations and penalties, which could lead to negative publicity and may cause our fund investors and clients to lose confidence in the effectiveness of our security measures.
Errors made in the execution, confirmation or settlement of transactions
. We face operational risk from errors made in the execution, confirmation or settlement of transactions. We also face operational risk from transactions not being properly recorded, evaluated or accounted for in our funds. In particular, our credit business is highly dependent on our ability to process and evaluate, on a daily basis, transactions across markets and geographies in a time-sensitive, efficient and accurate manner. New investment products we may introduce could create a significant risk that our existing systems may not be adequate to identify or control the relevant risks in the investment strategies employed by such new investment products. In addition, our and our third party service providers’ information systems and technology might not be able to accommodate our growth, may not be suitable for new products and strategies and may be subject to security risks, and the cost of maintaining such systems and technology might increase from its current level. These risks could cause us to suffer financial loss, a disruption of our businesses, liability to our funds, regulatory intervention and reputational damage.
-
57
-
Dependence on our New York based offices and third-party vendors
. Much of our operational personnel and our information system and technology infrastructure are located in our New York City offices, and any disruption in the operation of, or inability to access, our New York City offices could have a significant impact on our business. We are also dependent on an increasingly concentrated group of third party vendors that we do not control for hosting solutions and technologies. We also rely on third-party service providers for certain aspects of our businesses, including for certain information systems, technology and administration of our funds and compliance matters. A disaster, disruption or compromise in technology or infrastructure that supports our businesses, including a disruption involving electronic communications or other services used by us, our vendors or third parties with whom we conduct business, or directly affecting our New York based offices, may have an adverse impact on our ability to continue to operate our businesses without interruption which could have a material adverse effect on us. These risks could increase as vendors increasingly offer cloud-based software services rather than software services that can be operated within our own data centers. We also rely on data processing systems and the secure processing, storage and transmission of information, including payment and health information. A disruption or compromise of these systems could have a material adverse effect on our business. Our disaster recovery and business continuity programs may not be sufficient to mitigate the harm that may result from such a disaster or disruption. In addition, insurance and other safeguards might only partially reimburse us for our losses, if at all.
Failure to maintain the security of our information and technology networks, including personally identifiable and investor information, intellectual property and proprietary business information could have a material adverse effect on us.
We are subject to various risks and costs associated with the collection, handling, storage and transmission of sensitive information, including those related to compliance with U.S. and foreign data collection and privacy laws and other contractual obligations, as well as those associated with the compromise of our systems collecting such information. In the ordinary course of our business, we collect and store sensitive data, including our proprietary business information and intellectual property, and personally identifiable information of our employees and our investors, in our data centers and on our networks. The secure processing, maintenance and transmission of this information are critical to our operations. Although we take various measures and have made, and expect to continue to make, significant investments to ensure the integrity of our systems and to safeguard against such failures or security breaches, there can be no assurance that these measures and investments will provide protection.
These risks are exacerbated by the rapidly increasing volume of highly sensitive data, including our proprietary business information and intellectual property, and personally identifiable information of our employees and our fund investors, that we collect and store in our data centers and on our networks. The secure processing, maintenance and transmission of this information are critical to our operations.
A significant actual or potential theft, loss, corruption, exposure, fraudulent use or misuse of investor, employee or other personally identifiable or proprietary business data, whether by third parties or as a result of employee malfeasance or otherwise, non-compliance with our contractual or other legal obligations regarding such data or intellectual property or a violation of our privacy and security policies with respect to such data could result in significant remediation and other costs, fines, litigation or regulatory actions against us by the U.S. Federal and state governments, the EU or other jurisdictions or by various regulatory organizations or exchanges, in addition to significant reputational harm. Many jurisdictions in which we operate have laws and regulations related to data privacy, cyber security and protection of personal information, including the EU General Data Protection Regulation (“GDPR”) adopted by the EU in May 2016, which provides for significant penalties for noncompliance beginning in May 2018. The GDPR introduces new obligations and expands its territorial reach. It applies to all organizations processing or holding personal data of EU data subjects (regardless of the organization’s location) as well as to organizations outside the EU that offer goods or services in the EU, or that monitor the behavior of EU data subjects. The GDPR defines personal data as information that can be used to identify a natural person, including a name, a photo, an email address, or a computer IP address. Compliance with the GDPR requires companies to analyze and evaluate how they handle data in the ordinary course of their business, from processes to technology. It imposes a prescriptive approach to compliance requiring organizations to demonstrate and record compliance and to provide much more detailed information to data subjects regarding processing. EU data subjects need to be given full disclosure about how their personal data is used and stored. In that connection, consent must be explicit, and companies must be in a position to delete information from their global systems permanently if consent were withdrawn. As with any other organization that holds personal data of EU data subjects, we have to comply with the GDPR because, among other things, we process European individuals’ personal data in the U.S. via our global technology systems. Financial regulators and data protection authorities throughout the EU have significantly increased audit and investigatory powers under GDPR to probe how personal data is being used and processed. Penalties for non-compliance are substantial. Serious breaches of GDPR include fines on companies of up to the greater of €20 million or 4% of global group turnover (revenue) in the preceding year, regulatory action and reputational risk.
Any inability, or perceived inability, to adequately address privacy and data protection concerns, or comply with applicable laws, regulations, policies, industry standards, contractual obligations, or other legal obligations, even if unfounded, could result
-
58
-
in additional cost and liability, disrupt our operations and the services we provide to investors, damage our reputation, result in a loss of a competitive advantage, impact our ability to provide timely and accurate financial data, and cause a loss of confidence in our services and financial reporting, which could adversely affect our businesses, revenues, competitive position and investor confidence.
We derive a substantial portion of our revenues from funds managed pursuant to management agreements that may be terminated or fund partnership agreements that permit fund investors to request liquidation of investments in our funds on short notice.
The terms of our funds generally give either the general partner of the fund, the fund’s board of directors or the third-party advisor the right to terminate our investment management agreement with the fund. However, insofar as we control the general partner of our funds that are limited partnerships, the risk of termination of investment management agreement for such funds is limited, subject to our fiduciary or contractual duties as general partner. This risk is more significant for certain of our funds which have independent boards of directors.
With respect to our funds that are subject to the Investment Company Act, following the initial two years of operation, each fund’s investment management agreement must be approved annually by (i) such fund’s board of directors or by the vote of a majority of the funds’ shareholders and (ii) in each case, also by a majority of the independent members of such fund’s board of directors. Each investment management agreement for such funds can also be terminated on not more than 60 days’ notice by the funds’ board of directors or by a vote of a majority of the outstanding shares. Currently, AFT and AIF, each a closed-end management investment company, registered investment company under the Investment Company Act, and AINV, a closed-end management investment company that has elected to be treated as a business development company under the Investment Company Act, are subject to these provisions of the Investment Company Act. We have also been engaged as a sub-advisor for funds that are subject to the Investment Company Act, and those sub-advisory agreements contain, among other things, renewal and termination provisions that are substantially similar to the investment management agreements for each of AFT, AIF and AINV. Termination of these agreements would reduce the fees we earn from the relevant funds, which could have a material adverse effect on our results of operations.
The governing documents of certain of our funds provide that a simple majority of a fund’s unaffiliated investors have the right to liquidate that fund, which would cause management fees and performance fees to terminate. Our ability to realize performance fees from such funds also would be adversely affected if we are required to liquidate fund investments at a time when market conditions result in our obtaining less for investments than could be obtained at later times. We do not know whether, and under what circumstances, the investors in our funds are likely to exercise such right.
In addition, the management agreements of our funds would terminate if we were to experience a change of control without obtaining fund investor consent. Such a change of control could be deemed to occur in the event our Managing Partners exchange enough of their interests in the Apollo Operating Group into our Class A shares such that our Managing Partners no longer own a controlling interest in us. We cannot be certain that consents required for the assignment of our management agreements will be obtained if such a deemed change of control occurs. Termination of these agreements would affect the fees we earn from the relevant funds and the transaction and advisory fees we earn from the underlying portfolio companies, which could have a material adverse effect on our results of operations.
Our use of leverage to finance our businesses will expose us to substantial risks, which are exacerbated by our funds’ use of leverage to finance investments.
We have senior notes and loans outstanding and an undrawn revolving credit facility described in note
10
to our consolidated financial statements. We may choose to finance our business operations through further borrowings. Our existing and future indebtedness exposes us to the typical risks associated with the use of leverage, including those discussed above under “—
Dependence on significant leverage in investments by our funds could adversely affect our ability to achieve attractive rates of return on those investments
.” These risks are exacerbated by certain of our funds’ use of leverage to finance investments and, if they were to occur, could cause us to incur additional cash taxes due to limits on interest deductibility or to suffer a decline in the credit ratings assigned to our debt by rating agencies, if any, which might result in an increase in our borrowing costs or result in other material adverse effects on our businesses.
As these borrowings, notes and other indebtedness mature (or are otherwise repaid prior to their scheduled maturities), we may be required to either refinance them by entering into new facilities or issuing new notes, which could result in higher borrowing costs, or issuing equity, which would dilute existing shareholders. We could also repay them by using cash on hand or cash from the sale of our assets. We could have difficulty entering into new facilities, issuing new notes or issuing equity in the future on attractive terms, or at all.
-
59
-
Additionally, our credit rating outlook suffered a decline in connection with the issuance of our 4.872% Senior Notes due 2029. Our credit rating outlook may not improve or may continue to decline, whether or not we incur additional indebtedness, which, in each case, might result in an increase in our borrowing costs or result in other material adverse effects on our business.
We are subject to third-party litigation from time to time that could result in significant liabilities and reputational harm, which could have a material adverse effect on our results of operations, financial condition and liquidity.
In general, we will be exposed to risk of litigation by our investors if our management of any fund is alleged to constitute bad faith, gross negligence, willful misconduct, fraud, willful or reckless disregard for our duties to the fund or other forms of misconduct. Fund investors could sue us to recover amounts lost by our funds due to our alleged misconduct, up to the entire amount of loss. Further, we may be subject to litigation arising from investor dissatisfaction with the performance of our funds or from third-party allegations that we (i) improperly exercised control or influence over companies in which our funds have large investments or (ii) are liable for actions or inactions taken by portfolio companies that such third parties argue we control. By way of example, we, our funds and certain of our employees are each exposed to the risks of litigation relating to investment activities in our funds and actions taken by the officers and directors (some of whom may be Apollo employees) of portfolio companies, such as the risk of shareholder litigation by other shareholders of public companies in which our funds have large investments. As an additional example, we are sometimes listed as a co-defendant in actions against portfolio companies on the theory that we control such portfolio companies. We are also exposed to risks of litigation or investigation relating to transactions that presented conflicts of interest that were not properly addressed. See “—
Our failure to deal appropriately with conflicts of interest could damage our reputation and adversely affect our businesses
.” In addition, our rights to indemnification by the funds we manage may not be upheld if challenged, and our indemnification rights generally do not cover bad faith, gross negligence, willful misconduct, fraud, willful or reckless disregard for our duties to the fund or other forms of misconduct. If we are required to incur all or a portion of the costs arising out of litigation or investigations as a result of inadequate insurance proceeds or failure to obtain indemnification from our funds, our results of operations, financial condition and liquidity could be materially adversely affected.
In addition, with many highly paid investment professionals and complex compensation and incentive arrangements, we face the risk of lawsuits relating to claims for compensation, which may individually or in the aggregate be significant in amount. Such claims are more likely to occur in situations where individual employees may experience significant volatility in their year-to-year compensation due to company performance or other issues and in situations where previously highly compensated employees were terminated for performance or efficiency reasons. The cost of settling such claims could adversely affect our results of operations.
If any civil or criminal litigation brought against us were to result in a finding of substantial legal liability or culpability, the litigation could, in addition to any financial damage, cause significant reputational harm to us, which could seriously harm our business. We depend to a large extent on our business relationships and our reputation for integrity and high-caliber professional services to attract and retain investors and qualified professionals and to pursue investment opportunities for our funds. As a result, allegations of improper conduct by private litigants or regulators, whether the ultimate outcome is favorable or unfavorable to us, as well as negative publicity and press speculation about us, our investment activities or the private equity industry in general, whether or not valid, may harm our reputation, which may be more damaging to our businesses than to other types of businesses. See “Item 3. Legal Proceedings.”
In addition, we may not be able to obtain or maintain sufficient insurance on commercially reasonable terms or with adequate coverage levels against potential liabilities we may face in connection with potential claims, which could have a material adverse affect on our business. We may face a risk of loss from a variety of claims, including related to securities, antitrust, contracts, fraud and various other potential claims, whether or not such claims are valid. Insurance and other safeguards might only partially reimburse us for our losses, if at all, and if a claim is successful and exceeds or is not covered by our insurance policies, we may be required to pay a substantial amount in respect of such successful claim. Certain losses of a catastrophic nature, such as wars, earthquakes, typhoons, terrorist attacks or other similar events, may be uninsurable or may only be insurable at rates that are so high that maintaining coverage would cause an adverse impact on our business, our investment funds and their portfolio companies. In general, losses related to terrorism are becoming harder and more expensive to insure against. Some insurers are excluding terrorism coverage from their all-risk policies. In some cases, insurers are offering significantly limited coverage against terrorist acts for additional premiums, which can greatly increase the total cost of casualty insurance for a property. As a result, we, our investment funds and their portfolio companies may not be insured against terrorism or certain other catastrophic losses.
Our failure to deal appropriately with conflicts of interest could damage our reputation and adversely affect our businesses.
As we have expanded and as we continue to expand the number and scope of our businesses, we increasingly confront potential conflicts of interest relating to our funds’ investment activities. Certain of our funds have overlapping investment
-
60
-
objectives, including funds that have different fee structures, and potential conflicts may arise with respect to our decisions regarding how to allocate investment opportunities among those funds. For example, a decision to acquire material non-public information about a company while pursuing an investment opportunity for a particular fund gives rise to a potential conflict of interest when it results in our having to restrict the ability of other funds to take any action. Conflicts of interest may also exist in the valuation of our investments and regarding decisions about the allocation of specific investment opportunities among us and our funds and the allocation of fees and costs among us, our funds and portfolio companies of our funds. In addition, fund investors (or holders of Class A shares or Preferred shares) may perceive conflicts of interest regarding investment decisions for funds in which our Managing Partners, who have and may continue to make significant personal investments in a variety of Apollo funds, are personally invested. Similarly, conflicts of interest may exist with our manager, which is allowed under our organizational documents to manage our actions as it desires, without considering the interests of our shareholders. Finally, due to recent changes in the tax treatment of performance fees introduced by the TCJA in the U.S. and various Finance Acts in the U.K., conflicts of interest may arise with investors in certain of our funds in connection with the general partner’s decisions with respect to investments of our funds.
Allocation of investment opportunities
. Certain inherent conflicts of interest arise from the fact that (i) we provide investment management services to more than one fund, and (ii) our funds often have one or more overlapping investment strategies. Also, the investment strategies employed by us for current and future clients could conflict with each other, and may adversely affect the prices and availability of other securities or instruments held by, or potentially considered for, one or more clients. If participation in specific investment opportunities is appropriate for more than one of our funds, participation in such opportunities will be allocated pursuant to our allocation policies and procedures, which include the relevant partnership or investment management agreement as well as the decisions of our allocations committee. While we have established policies and procedures to guide the determination of such allocations, there can be no assurance that we will be successful in avoiding all conflicts of interest in allocating investment opportunities.
Certain of the funds we manage also have overlapping investment strategies with other funds we manage that are registered under the Investment Company Act, and the Investment Company Act prohibits registered funds from co-investing with non-registered funds where non-price terms are negotiated (such as financial and negative covenants, guarantees and collateral packages and indemnification provisions), unless an exception or exemption applies. Certain of the funds we manage that are registered under the Investment Company Act, including Apollo Investment Corporation and certain of its related entities, received an exemptive order from the SEC (the “Co-Investment Order”) (Company Act Release No. 32057) permitting Apollo to negotiate, among other things, these types of provisions for co-investment opportunities that involve the participation of both non-registered and registered funds managed by Apollo. As a result, to the extent specific investment opportunities are appropriate for a non-registered fund and one or more registered funds, in addition to being subject to our allocation policies and procedures, the opportunity will also be subject to the conditions of the Co-Investment Order. There can be no assurance that the Co-Investment Order will facilitate the successful consummation of investment opportunities that Apollo believes are now available to funds it manages as a result of the Co-Investment Order, or that each fund will be able to participate in investment opportunities pursued under the Co-Investment Order that are within its investment objectives.
In addition to the potential for conflict among our funds, we face the potential for conflict between us and our funds or clients. These conflicts may include: (i) the allocation of investment opportunities between Apollo and Apollo’s funds; (ii) the allocation of investment opportunities among funds with different incentive fee structures, or where our personnel have invested more heavily in one fund than another; and (iii) the determination of what constitutes fund-related expenses and the allocation of such expenses between our advised funds and us.
Restrictions on transactions due to other Apollo businesses
. Our funds engage in a broad range of business activities and invest in portfolio companies whose operations may be substantially similar to and/or competitive with the portfolio companies in which our other funds have invested. The performance and operation of such competing businesses could conflict with and adversely affect the performance and operation of our funds’ portfolio companies, and may adversely affect the prices and availability of business opportunities or transactions available to such portfolio companies. In addition, we may give advice, or take action with respect to, the investments of one or more of our funds that may not be given or taken with respect to other of our funds with similar investment programs, objectives or strategies. Accordingly, some of our funds with similar strategies may not hold the same securities or instruments or achieve the same performance. For example, one of our private equity funds could have an interest in pursuing an acquisition, divestiture or other transaction that, in its judgment, could enhance the value of the private equity investment, even though the proposed transaction would subject one of our credit fund’s debt investments to additional or increased risks. We may also advise clients with conflicting investment objectives or strategies. These activities also may adversely affect the prices and availability of other securities or instruments held by, or potentially considered for, one or more funds. We, our funds or our funds’ portfolio companies may also have ongoing relationships with issuers whose securities have been acquired by, or are being considered for investment by us.
-
61
-
Investing throughout the corporate capital structure
. Our funds invest in a broad range of asset classes throughout the corporate capital structure. These investments include investments in corporate loans and debt securities, preferred equity securities and common equity securities. In certain cases, we may manage separate funds that invest in different parts of the same company’s capital structure. For example, our credit funds may invest in different classes of the same company’s debt. In those cases, the interests of our funds may not always be aligned, which could create actual or potential conflicts of interest or the appearance of such conflicts.
Information barriers
. We currently operate without information barriers that some other investment management firms implement to separate business units and/or to separate persons who make investment decisions from others who might possess material non-public information that could influence such decisions. Our Managing Partners, investment professionals or other employees may acquire confidential or material non-public information and, as a result, be restricted from initiating transactions in certain securities. In an effort to manage possible risks arising from our decision not to implement such screens, we maintain a code of ethics and provide training to relevant personnel. In addition, our compliance department maintains a list of restricted securities with respect to which we may have access to material non-public information and in which our funds may be subject to trading restrictions. In the event that any of our employees obtains such material non-public information, we may be restricted in acquiring or disposing of investments on behalf of our funds, which could impact the returns generated for such funds. Notwithstanding the maintenance of restricted securities lists and other internal controls, it is possible that the internal controls relating to the management of material non-public information could fail and result in us, or one of our investment professionals, buying or selling a security while, at least constructively, in possession of material non-public information. Inadvertent trading on material non-public information could have adverse effects on our reputation, result in the imposition of regulatory or financial sanctions and, as a consequence, negatively impact our ability to provide our investment management services to our funds and clients. While we currently operate without information barriers on an integrated basis, we could be required by certain regulations, or decide that it is advisable, to establish information barriers. In such event, our ability to operate as an integrated platform could also be impaired, which would limit management’s access to our personnel and impair its ability to manage our investments. The establishment of such information barriers may also lead to operational disruptions and result in restructuring costs, including costs related to hiring additional personnel as existing investment professionals are allocated to either side of such barriers, which may adversely affect our business.
Broker-dealer
. AGS, an affiliate of ours, which is a broker-dealer registered with the SEC and a member of FINRA, is authorized to perform services relating to, among other things, the placement of debt and securities. AGS also provides advisory services to portfolio companies and our funds in connection with corporate transactions. Additionally, certain of our affiliates and/or our funds’ portfolio companies are engaged in the loan origination and/or servicing businesses, and may originate, structure, arrange and/or place loans to our funds and portfolio companies. In connection with their services to our funds and fund portfolio companies, such affiliates and/or our funds’ portfolio companies may receive transaction and other fees from our funds and/or portfolio companies of our funds. Consequently, our relationship with these entities may give rise to conflicts of interest between us and portfolio companies of our funds.
Potential conflicts of interest with our Managing Partners or our directors
. Pursuant to the terms of our operating agreement, whenever a potential conflict of interest exists or arises between any of the Managing Partners, one or more directors or their respective affiliates, on the one hand, and us, any of our subsidiaries or any shareholder other than a Managing Partner, on the other, any resolution or course of action by our board of directors shall be permitted and deemed approved by all shareholders if the resolution or course of action (i) has been specifically approved by a majority of the voting power of our outstanding voting shares (excluding voting shares owned by our manager or its affiliates) or by a conflicts committee of the board of directors composed entirely of one or more independent directors, (ii) is on terms no less favorable to us or our shareholders (other than a Managing Partner) than those generally being provided to or available from unrelated third parties or (iii) it is fair and reasonable to us and our shareholders taking into account the totality of the relationships between the parties involved. All conflicts of interest described in this report will be deemed to have been specifically approved by all shareholders. Notwithstanding the foregoing, it is possible that potential or perceived conflicts could give rise to investor dissatisfaction or litigation or regulatory enforcement actions.
Our Managing Partners have established family offices to provide investment advisory, accounting, administrative and other services to their respective family accounts (including certain charitable accounts) in connection with their personal investment activities unrelated to their investments in Apollo entities. The investment activities of the family offices, and the involvement of the Managing Partners in these activities, could give rise to potential conflicts between the personal financial interests of the Managing Partners and the interests of us, any of our subsidiaries or any shareholder other than a Managing Partner.
Potential conflicts of interest with our manager
. Our operating agreement contains provisions that waive or consent to conduct by our manager and its affiliates that might otherwise raise issues about compliance with fiduciary duties or applicable law. For example, our operating agreement provides that when our manager is acting in its individual capacity, as opposed to in
-
62
-
its capacity as our manager, it may act without any fiduciary obligations to us or our shareholders whatsoever. When our manager, in its capacity as our manager, is permitted to or required to make a decision in its “sole discretion” or “discretion” or that it deems “necessary or appropriate” or “necessary or advisable,” then our manager will be entitled to consider only such interests and factors as it desires, including its own interests, and will have no duty or obligation (fiduciary or otherwise) to give any consideration to any interest of or factors affecting us or any of our shareholders and will not be subject to any different standards imposed by our operating agreement, the Delaware Limited Liability Company Act or under any other law, rule or regulation or in equity.
Whenever a potential conflict of interest exists between us and our manager, our manager shall resolve such conflict of interest. If our manager determines that its resolution of the conflict of interest is on terms no less favorable to us than those generally being provided to or available from unrelated third parties or is fair and reasonable to us, taking into account the totality of the relationships between us and our manager, then it will be presumed that in making this determination, our manager acted in good faith. A shareholder seeking to challenge this resolution of the conflict of interest would bear the burden of overcoming such presumption. This is different from the situation with Delaware corporations, where a conflict resolution by an interested party would be presumed to be unfair and the interested party would have the burden of demonstrating that the resolution was fair. Such modifications of fiduciary duties are expressly permitted by Delaware law. Hence, we and our shareholders would have recourse and be able to seek remedies against our manager only if our manager breaches its obligations pursuant to our operating agreement. Unless our manager breaches its obligations pursuant to our operating agreement, we and our shareholders would not have any recourse against our manager even if our manager were to act in a manner that was inconsistent with traditional fiduciary duties. Furthermore, even if there has been a breach of the obligations set forth in our operating agreement, our operating agreement provides that our manager and its officers and directors would not be liable to us or our shareholders for errors of judgment or for any acts or omissions unless there has been a final and non-appealable judgment by a court of competent jurisdiction determining that the manager or its officers and directors acted in bad faith or engaged in fraud or willful misconduct. These provisions are detrimental to the shareholders because they restrict the remedies available to them for actions that without those limitations might constitute breaches of duty, including fiduciary duties.
Also, if our manager obtains the approval of the conflicts committee of the Company’s board of directors, the resolution will be conclusively deemed to be fair and reasonable to us and not a breach by our manager of any duties it may owe to us or our shareholders. This is different from the situation with Delaware corporations, where a conflict resolution by a committee consisting solely of independent directors may, in certain circumstances, merely shift the burden of demonstrating unfairness to the plaintiff. If you purchase a Class A share or a Preferred share, you will be treated as having consented to the provisions set forth in the operating agreement, including provisions regarding conflicts of interest situations that, in the absence of such provisions, might be considered a breach of fiduciary or other duties under applicable state law. As a result, shareholders will, as a practical matter, not be able to successfully challenge an informed decision by the conflicts committee.
Potential performance fee related conflicts with investors in our funds
. Under recently enacted amendments to U.S. tax law pursuant to the TCJA, capital gain in respect of a general partner’s distributions of performance fees from certain of our funds will be treated as short-term capital gain unless the fund holds the relevant investment for more than three years, as opposed to the general rule that capital gain from the disposition of investments held for more than one year is treated as long-term capital gain. Similar rules introduced in the U.K. applying to partners of our U.K. LLPs tax as ordinary income returns from certain funds that have a weighted average holding period of fewer than 40 months (with transitional rules applying between 36-40 months). As a consequence, conflicts of interest may arise in connection with a general partner’s investment decisions, including regarding the identification, making, management, disposition and, in each case, timing of a fund’s investments, and we may not realize the most tax efficient treatment of our performance fees in all of our funds going forward.
Appropriately dealing with conflicts of interest is complex and difficult and our reputation could be damaged if we fail, or appear to fail, to deal appropriately with one or more potential or actual conflicts of interest. Regulatory scrutiny of, or litigation in connection with, conflicts of interest could have a material adverse effect on our reputation which would materially adversely affect our businesses in a number of ways, including as a result of redemptions by our investors from our funds, an inability to raise additional funds and a reluctance of counterparties to do business with us. See “—
Extensive regulation of our businesses affects our activities and creates the potential for significant liabilities and penalties. The possibility of increased regulatory focus could result in additional burdens on our businesses
.”
Use of subscription line facilities by our funds may give rise to conflicts of interests.
Certain of our investment funds obtain subscription line facilities to facilitate investments, support ongoing operations and activities of the funds’ and their respective portfolio companies and/or investments and to enable the funds to pay management fees, expenses and other liabilities. Subscription line facilities may be entered into on a cross-collateralized basis with the assets of any other fund, alternative investment vehicle, portfolio company or investment, and such entities may be held jointly and severally liable for the full amount of the obligations arising out of such subscription line facility. If an investment fund obtains a subscription line facility, the fund’s interim capital needs will in most instances be satisfied through borrowings by the fund under the subscription line facility, and, less so, drawdowns
-
63
-
of capital contributions by the fund, which capital calls would generally be expected to be conducted in larger, less frequent capital calls in order to, among other things, repay borrowings and related interest expenses made under such subscription line facilities.
Where an investment fund uses borrowings under a subscription line facility in advance or in lieu of receiving capital contributions from investors to repay any such borrowings and related interest expenses, the use of such facility will result in a different (and perhaps higher) reported internal rate of return than if the facility had not been utilized and instead capital contributions from investors had been contributed at the inception of an investment. This may present conflicts of interest, including the interest rate on such borrowings which may be less than the rate of the preferred return and the fact that the preferred return of investment funds typically does not accrue on such borrowings, but rather only accrues on capital contributions when made. As a result, use of such subscription line facilities may reduce or eliminate the preferred return received by the investors and accelerate or increase distributions of performance-based allocation to the relevant general partner, providing the general partner with an economic incentive to fund investments through such facilities in lieu of capital contributions. However, since interest expense and other costs of borrowings under subscription lines of credit are an expense of the investment fund, the investment fund’s net multiple of invested capital will be reduced, as will the amount of performance fees generated by the fund. Any material reduction in the amount of performance fees generated by a fund will adversely affect our revenues.
Our organizational documents do not limit our ability to enter into new lines of businesses, and we may expand into new investment strategies, geographic markets and businesses, each of which may result in additional risks and uncertainties in our businesses.
We intend, to the extent that market conditions warrant, to grow our businesses by increasing AUM in existing businesses and expanding into new investment strategies, geographic markets, businesses and distribution channels, including the retail channel. Our organizational documents, however, do not limit us to the investment management business. Accordingly, we may pursue growth through acquisitions of other investment management companies, acquisitions of critical business partners or other strategic initiatives, which may include entering into new lines of business, such as the insurance, broker-dealer or financial advisory industries. In addition, we expect opportunities will arise to acquire other alternative or traditional asset managers. To the extent we make strategic investments or acquisitions, undertake other strategic initiatives or enter into a new line of business, we will face numerous risks and uncertainties, including risks associated with (i) the required investment of capital and other resources, (ii) the possibility that we have insufficient expertise to engage in such activities profitably or without incurring inappropriate amounts of risk, (iii) the diversion of management’s attention from our core businesses, (iv) assumption of liabilities of any acquired business, (v) the disruption of our ongoing businesses, (vi) combining or integrating operational and management systems and controls and (vii) the broadening of our geographic footprint, including the risks associated with conducting operations in foreign jurisdictions. Entry into certain lines of business may subject us to new laws and regulations with which we are not familiar, or from which we are currently exempt, and may lead to increased litigation and regulatory risk. For example, our planned business initiatives include offering additional registered investment products and creating investment products open to retail investors. These products may have different economic structures than our traditional investment funds and may require a different marketing approach. In addition, to the extent we distribute products through new channels, including through unaffiliated firms, we may not be able to effectively monitor or control the manner of their distribution. These activities also will impose additional compliance burdens on us, subject us to enhanced regulatory scrutiny and expose us to greater reputation and litigation risk. Further, these activities may give rise to conflicts of interest, related party transaction risks and may lead to litigation or regulatory scrutiny. If a new business generates insufficient revenues or if we are unable to efficiently manage our expanded operations, our results of operations will be adversely affected. Our strategic initiatives may include joint ventures, in which case we will be subject to additional risks and uncertainties in that we may be dependent upon, and subject to liability, losses or reputational damage relating to, systems, controls and personnel that are not under our control.
Employee misconduct or misconduct by our advisors or third party-service providers could harm us by impairing our ability to attract and retain investors and by subjecting us to significant legal liability, regulatory scrutiny and reputational harm.
Our reputation is critical to maintaining and developing relationships with the investors in our funds, potential fund investors and third parties with whom we do business, and there is a risk that our employees, advisors or third party-service providers could engage, deliberately or recklessly, in misconduct or fraud that creates legal exposure for us and adversely affects our businesses. In recent years, there have been a number of highly publicized cases involving fraud, conflicts of interest or other misconduct by individuals in the financial services industry. Employee misconduct or fraud could include, among other things, binding our funds to transactions that exceed authorized limits or present unacceptable risks and other unauthorized activities or concealing unsuccessful investments (which, in either case, may result in unknown and unmanaged risks or losses), or otherwise charging (or seeking to charge) inappropriate expenses. If an employee were to engage in illegal or suspicious activities, we could be subject to penalties or sanctions and suffer serious harm to our reputation, financial position, investor relationships and ability to attract future investors. For example, we could lose our ability to raise new investment funds if any of our “covered persons” is the subject of a criminal, regulatory or court order or other “disqualifying event.” See “—
Recent changes to regulations regarding
-
64
-
derivatives and commodity interest transactions could adversely impact various aspects of our business—Exemption from certain laws.
” Additionally, our current and former employees, consultants or sub-contractors and those of our funds’ portfolio companies becoming subject to allegations of sexual harassment, racial and gender discrimination or other similar misconduct, could, regardless of the ultimate outcome, result in adverse publicity that could significantly harm our and such portfolio company's brand and reputation. Furthermore, our business often requires that we deal with confidential matters of great significance to us, our funds and companies in which our funds may invest, as well as trade secrets. If our employees, consultants or sub-contractors were improperly to use or disclose confidential information, we could suffer serious harm to our reputation, financial position and current and future business relationships, as well as face potentially significant litigation or investigation. It is not always possible to deter misconduct or fraud by employees or service providers, and the precautions we take to detect and prevent this activity may not be effective in all cases. Misconduct or fraud by our employees, advisors, third-party service providers, or those of our funds’ portfolio companies, or even unsubstantiated allegations, could result in a material adverse effect on our reputation and our businesses.
Fraud, payment or solicitation of bribes and other deceptive practices or other misconduct at our funds’ portfolio companies could similarly subject us to liability and reputational damage and also harm our performance. For example, failures by personnel, or individuals acting on behalf, of our funds’ portfolio companies to comply with anti-bribery, sanctions or other legal and regulatory requirements could adversely affect our businesses and reputation. There are a number of grounds upon which such misconduct at a portfolio company could subject us to criminal and/or civil liability, including on the basis of actual knowledge, willful blindness, or control person liability. Such misconduct might also undermine our funds’ due diligence efforts with respect to such companies and could negatively affect the valuation of a fund’s investments.
Underwriting activities expose us to risks.
AGS may act as an underwriter in securities offerings. We may incur losses and be subject to reputational harm to the extent that, for any reason, AGS is unable to sell securities or indebtedness that it purchased as an underwriter at the anticipated price levels. As an underwriter, AGS is also subject to potential liability for material misstatements or omissions in prospectuses and other offering documents relating to offerings that AGS underwrites.
The due diligence process that we undertake in connection with investments by our funds may not reveal all facts that may be relevant in connection with an investment.
Before making fund investments, we conduct due diligence that we deem reasonable and appropriate based on the facts and circumstances applicable to each investment. When conducting due diligence, we may be required to evaluate important and complex business, financial, tax, accounting, environmental and legal issues. Outside consultants, legal advisors, accountants and investment banks may be involved in the due diligence process in varying degrees depending on the type of investment. Nevertheless, when conducting due diligence and making an assessment regarding an investment, we rely on the resources available to us, including information provided by the target of the investment and, in some circumstances, third-party investigations. The due diligence investigation that we will carry out with respect to any fund investment opportunity may not reveal or highlight all relevant facts (including fraud) or issues that may be necessary or helpful in evaluating such investment opportunity, including past or current violations of law and related legal exposure, and we may not identify or foresee future developments that could have a material adverse effect on an investment (e.g., technological disruption across an industry). Moreover, such an investigation will not necessarily result in the investment being successful.
Certain of our funds utilize special situation and distressed debt investment strategies that involve significant risks.
Our funds often invest in companies with weak financial conditions, poor operating results, substantial financial needs, negative net worth and/or special competitive or regulatory problems. These funds also invest in companies that are or are anticipated to be involved in bankruptcy or reorganization proceedings. In such situations, it may be difficult to obtain full information as to the exact financial and operating conditions of these companies. Additionally, the fair values of such investments are subject to abrupt and erratic market movements and significant price volatility if they are publicly traded securities, and are subject to significant uncertainty in general if they are not publicly traded securities. Furthermore, some of our funds’ distressed investments may not be widely traded or may have no recognized market. A fund’s exposure to such investments may be substantial in relation to the market for those investments, and the assets are likely to be illiquid and difficult to sell or transfer. As a result, it may take a number of years for the market value of such investments to ultimately reflect their intrinsic value as perceived by us, if at all.
Our distressed investment strategies depend in part on our ability to successfully predict the occurrence of certain corporate events, such as debt and/or equity offerings, restructurings, reorganizations, mergers, takeover offers and other transactions, that we believe will improve the condition of the business. If the corporate event we predict is delayed, changed or never completed, the market price and value of the applicable fund’s investment could decline sharply.
-
65
-
In addition, these investments could subject us to certain potential additional liabilities that may exceed the value of our original investment. Under certain circumstances, payments or distributions on certain investments may be reclaimed if any such payment or distribution is later determined to have been a fraudulent conveyance, a preferential payment or similar transaction under applicable bankruptcy and insolvency laws. In addition, under certain circumstances, a lender that has inappropriately exercised control of the management and policies of a debtor may have its claims subordinated or disallowed, or may be found liable for damages suffered by parties as a result of such actions. In the case where the investment in securities of troubled companies is made in connection with an attempt to influence a restructuring proposal or plan of reorganization in bankruptcy, our funds and/or we may become involved in substantial litigation.
Risk management activities may adversely affect the return on our funds’ investments.
When managing our exposure to market risks, we may (on our own behalf or on behalf of our funds) from time to time use forward contracts, options, swaps, caps, collars and floors or pursue other strategies or use other forms of derivative instruments (OTC and otherwise) to limit our exposure to changes in the relative values of investments that may result from market developments, including changes in prevailing interest rates, currency exchange rates and commodity prices. The scope of risk management activities undertaken by us varies based on the level and volatility of interest rates, prevailing foreign currency exchange rates, the types of investments that are made and other changing market conditions. The use of hedging transactions and other derivative instruments to reduce the effects of a decline in the value of a position does not eliminate the possibility of fluctuations in the value of the position or prevent losses if the value of the position declines. Such transactions may also limit the opportunity for gain if the value of a position increases. Moreover, it may not be possible to limit the exposure to a market development that is so generally anticipated that a hedging or other derivative transaction cannot be entered into at an acceptable price. The success of any hedging or other derivative transaction generally will depend on our ability to correctly predict market changes, the degree of correlation between price movements of a derivative instrument and the position being hedged, the creditworthiness of the counterparty and other factors. As a result, while we may enter into such a transaction in order to reduce our exposure to market risks, the transaction may result in poorer overall investment performance than if it had not been executed. Such transactions may also limit the opportunity for gain if the value of a hedged position increases.
While such hedging arrangements may reduce certain risks, such arrangements themselves may entail certain other risks. These arrangements may require the posting of cash collateral at a time when a fund has insufficient cash or illiquid assets such that the posting of the cash is either impossible or requires the sale of assets at prices that do not reflect their underlying value. Moreover, these hedging arrangements may generate significant transaction costs, including potential tax costs, that reduce the returns generated by a fund. In addition, the expected phase out of LIBOR in the next few years may adversely affect the effectiveness of certain interest rate hedging arrangements and create economic uncertainties in the relevant market. Finally, the CFTC has made several public statements that it may soon issue a proposal for certain foreign exchange products to be subject to mandatory clearing, which could increase the cost of entering into currency hedges. Similar developments abroad may indirectly affect our funds as a result of their direct impact on our trading counterparties.
We often pursue investment opportunities that involve business, regulatory, legal or other complexities.
As an element of our investment style, we often pursue unusually complex investment opportunities. This can often take the form of substantial business, regulatory or legal complexity that we believe may deter other investment managers. Our tolerance for complexity presents risks, as such transactions can be more difficult, expensive and time-consuming to finance and execute; it can be more difficult to manage or realize value from the assets acquired in such transactions; and such transactions sometimes entail a higher level of regulatory scrutiny or a greater risk of contingent liabilities. Any of these risks could harm the performance of our funds.
Funds we manage may invest in assets denominated in currencies that differ from the currency in which the fund is denominated.
When our funds invest in assets denominated in currencies that differ from the currency that the relevant fund is denominated in, fluctuations in currency rates could impact fund performance. We also manage a number of funds which are denominated in U.S. Dollars but invest primarily or exclusively in assets denominated in foreign currencies and therefore whose performance can be negatively impacted by strengthening of the U.S. Dollar even if the underlying investments perform well in local currency.
Our funds may employ hedging techniques to minimize these risks, but we can offer no assurance that such strategies will be effective or tax-efficient. If our funds engage in hedging transactions, we may be exposed to additional risks associated with such transactions.
-
66
-
Certain of our funds make investments in companies that we do not control.
Investments by certain of our funds include debt instruments, equity securities, and other financial instruments of companies that our funds do not control. Such investments may be acquired by our funds through trading activities or through purchases of securities or other financial instruments from the issuer. In addition, in the future, our funds may seek to acquire minority equity interests more frequently and may also dispose of a portion of their majority equity investments in portfolio companies over time in a manner that results in the funds retaining a minority investment. Those investments will be subject to the risk that the company in which the investment is made may make business, financial or management decisions with which we do not agree or that the majority stakeholders or the management of the company may take risks or otherwise act in a manner that does not serve our funds’ interests. If any of the foregoing were to occur, the values of investments by our funds could decrease, we could be exposed to increased legal risk related to compliance failures by such company, and our financial condition, results of operations and cash flow could suffer as a result.
Our funds may face risks relating to undiversified investments.
While diversification is generally an objective of many of our funds, we cannot give assurance as to the degree of diversification that will actually be achieved in any fund investments. Because a significant portion or all of a fund’s capital may be invested in a single investment or portfolio company, a loss with respect to such an investment or portfolio company could have a significant adverse impact on such fund’s capital. Accordingly, a lack of diversification on the part of a fund could adversely affect its performance, which could have a material adverse effect on our business, financial condition and results of operations.
We have a strategic relationship with Athene and Athora from which we derive a significant contribution to our revenue and that could give rise to real or apparent conflicts of interest.
We currently derive a significant contribution to our revenue across our business segments from our investment in and strategic relationship with Athene and Athora. Certain of our subsidiaries receive investment management and advisory fees from Athene or Athora in exchange for a suite of services for their investment portfolio. Through its subsidiaries, Apollo managed or advised
$116.8 billion
of AUM in accounts owned by or related to Athene and Athora as of
December 31, 2018
. Our investment management and advisory agreements with Athene and Athora are terminable under certain circumstances. If such investment management and advisory agreements were terminated or fees lowered or changed further it could have a material adverse effect on our business, results of operations and financial condition. In addition, Apollo had an approximate
10.2%
economic ownership interest in Athene Holding as of
December 31, 2018
. Fluctuations in the value of Athene and Athora, including as a result of changes in taxation of Athene introduced by the TCJA, could have an adverse effect on our results and financial condition. See “—
Recently enacted U.S. tax legislation may materially adversely affect our results of operation and cash flows and may have adverse tax consequences for certain of our Class A shareholders
.”
A number of Apollo entities receive management fees and performance fees from Athene and Athora, have investments in Athene and Athora, and manage funds or accounts with investments in Athene and Athora from which performance fees may be earned. Athene also invests directly in various Apollo-managed funds and entities and we earn fees in respect of such investments. The Chairman, Chief Executive Officer and Chief Investment Officer of Athene is also an employee of Athene Asset Management LLC and six of Athene’s 15 directors are employees of, or consultants to, Apollo. These persons have fiduciary duties to Athene in addition to the duties that they have to Apollo. As a result, there may be real or apparent conflicts of interest with respect to matters affecting Apollo, Apollo-managed funds and their portfolio companies and Athene and Athora. In addition, conflicts of interest could arise with respect to transactions involving business dealings between Apollo, Athene and Athora and their respective affiliates.
While we expect our strategic relationship with Athene and Athora to continue for the foreseeable future, there can be no assurance that the benefit we receive from Athene and Athora will not decline due to a disruption or decline in Athene’s or Athora’s business or a change in our relationship with Athene and Athora, including our investment management agreements with Athene and Athora. Moreover, Athene and Athora are subject to significant regulatory oversight, changes to which may adversely affect either of their performance. We may be unable to replace a decline in the revenue that we derive from our investment in, and strategic relationship with, Athene and Athora on a timely basis or at all if our relationship with Athene and Athora were to change or if Athene or Athora were to experience a material adverse impact to their businesses.
Our funds’ investments in infrastructure assets may expose us and our funds to increased risks and liabilities and may expose our shareholders to adverse tax consequences
.
Investments in infrastructure assets may expose us and our funds to increased risks and liabilities that are inherent in the ownership of real assets. For example:
-
67
-
|
•
|
Ownership of infrastructure assets may also present additional risk of liability for personal and property injury or impose significant operating challenges and costs with respect to, for example, compliance with zoning, environmental, anti-financial fraud or other applicable laws.
|
|
•
|
Infrastructure asset investments may face construction risks including, without limitation: (a) labor disputes, shortages of material and skilled labor, or work stoppages, (b) slower than projected construction progress and the unavailability or late delivery of necessary equipment, (c) less than optimal coordination with public utilities in the relocation of their facilities, (d) adverse weather conditions and unexpected construction conditions, (e) accidents or the breakdown or failure of construction equipment or processes; and (f) catastrophic events such as explosions, fires, terrorist activities and other similar events. These risks could result in substantial unanticipated delays or expenses (which may exceed expected or forecasted budgets) and, under certain circumstances, could prevent completion of construction activities once undertaken. Certain infrastructure asset investments may remain in construction phases for a prolonged period and, accordingly, may not be cash generative for a prolonged period. Recourse against the contractor may be subject to liability caps or may be subject to default or insolvency on the part of the contractor.
|
|
•
|
The operation of infrastructure assets is exposed to potential unplanned interruptions caused by significant catastrophic or force majeure events. These risks could, among other effects, adversely impact the cash flows available from investments in infrastructure assets, cause personal injury or loss of life, damage property, or instigate disruptions of service. In addition, the cost of repairing or replacing damaged assets could be considerable. Repeated or prolonged service interruptions may result in permanent loss of customers, litigation, or penalties for regulatory or contractual noncompliance. Force majeure events that are incapable of, or too costly to, cure may also have a permanent adverse effect on an investment.
|
|
•
|
The management of the business or operations of an infrastructure asset may be contracted to a third-party management company unaffiliated with us. Although it would be possible to replace any such operator, the failure of such an operator to adequately perform its duties or to act in ways that are in our or our funds’ best interest, or the breach by an operator of applicable agreements or laws, rules and regulations, could have an adverse effect on the investment’s financial condition or results of operations. Infrastructure investments may involve the subcontracting of design and construction activities in respect of projects, and as a result our investments are subject to the risks that contractual provisions passing liabilities to a subcontractor could be ineffective, the subcontractor fails to perform services which it has agreed to perform and the subcontractor becomes insolvent.
|
Infrastructure investments often involve an ongoing commitment to a municipal, state, federal or foreign government or regulatory agencies. The nature of these obligations expose us to a higher level of regulatory oversight than typically imposed on other businesses and may require us to rely on complex government licenses, concessions, leases or contracts, which may be difficult to obtain or maintain. Infrastructure investments may require operators to manage such investments and such operators’ failure to comply with laws, including prohibitions against bribing of government officials, may adversely affect the value of such investments and cause us serious reputational and legal harm. Revenues for such investments may rely on contractual agreements for the provision of services with a limited number of counterparties, and are consequently subject to counterparty default risk. The operations and cash flow of infrastructure investments are also more sensitive to inflation and, in certain cases, commodity price risk. Furthermore, services provided by infrastructure investments may be subject to rate regulations by government entities that determine or limit prices that may be charged. Similarly, users of applicable services or government entities in response to such users may react negatively to any adjustments in rates and thus reduce the profitability of such infrastructure investments.
In addition, investments in infrastructure assets may cause adverse tax consequences for certain non-U.S. shareholders regarding income effectively connected with the conduct of a U.S. trade or business and the imposition of certain tax withholding. See — Risks Related to Taxation — “
Non-U.S. persons face unique U.S. tax issues from owning Class A shares that may result in adverse tax consequences to them
.” Moreover, investments in infrastructure assets may also require all our shareholders to file tax returns and pay taxes in various state and local jurisdictions in the U.S. and abroad where these infrastructure assets are located. See — Risks Related to Taxation — “
Class A shareholders may be subject to foreign, state and local taxes and return filing requirements as a result of investing in our Class A shares
.”
Some of our funds invest in foreign countries and securities of issuers located outside of the U.S., which may involve foreign exchange, political, social, economic and tax uncertainties and risks.
Some of our funds invest all or a portion of their assets in the equity, debt, loans or other securities of issuers located outside the U.S. In addition to business uncertainties, such investments may be affected by changes in exchange rates as well as political, social and economic uncertainty affecting a country or region. Many financial markets are not as developed or as efficient as those in the U.S., and as a result, liquidity may be reduced and price volatility may be higher. The legal and regulatory environment may also be different, particularly with respect to bankruptcy and reorganization. Financial accounting standards and practices may differ, and there may be less publicly available information in respect of such companies.
-
68
-
Restrictions imposed or actions taken by foreign governments may adversely impact the value of our funds’ investments. Such restrictions or actions could include exchange controls, seizure or nationalization of foreign deposits or other assets and adoption of other governmental restrictions that adversely affect the prices of securities or the ability to repatriate profits on investments or the capital invested itself. Income received by our funds from sources in some countries may be reduced by withholding and other taxes. Any such taxes paid by a fund will reduce the net income or return from such investments. Our fund investments could also expose us to risks associated with trade and economic sanctions prohibitions or other restrictions imposed by the U.S. or other governments or organizations, including the United Nations, the EU and its member countries, such as the sanctions against certain Russian entities and individuals. While our funds will take these factors into consideration in making investment decisions, including when hedging positions, our funds may not be able to fully avoid these risks or generate targeted risk-adjusted returns.
The Organization for Economic Co-operation and Development (“OECD”) and other government agencies in jurisdictions where we and our affiliates invest or conduct business have continued to recommend and implement changes related to the taxation of multinational companies.
In the United Kingdom, the U.K. Criminal Finances Act 2017 creates two new separate corporate criminal offences: failure to prevent facilitation of U.K. tax evasion and failure to prevent facilitation of overseas tax evasion. The scope of the new law and guidance is extremely wide and could have an impact on Apollo’s global businesses. Separately, the United Kingdom has implemented transparency legislation that will require many large businesses to publish their U.K. tax strategies on their websites. As part of the publication requirement, organizations must disclose information on tax risk management and governance, tax planning, tax risk appetite and their approach to Her Majesty’s Revenue and Customs. These developments show that the United Kingdom is seeking to bring corporate tax matters further into the public domain. As a result, tax matters may pose an increased reputational risk to our business.
On October 5, 2015 the OECD published 13 final reports and an explanatory statement outlining consensus actions under the BEPS project. This project involves a coordinated multijurisdictional approach to increase transparency and exchange of information in tax matters, and to address weaknesses of the international tax system that create opportunities for BEPS by multinational companies. The reports cover measures such as new minimum standards, the revision of existing standards, common approaches which will facilitate the convergence of national practices, and guidance drawing on best practices. The outcome of the BEPS project, including limiting interest deductibility, changes in transfer pricing, new rules around hybrid instruments or entities, and loss of eligibility for benefits of double tax treaties could increase tax uncertainty and impact the tax treatments of funds’ earnings and adversely impact the investment returns of funds or limit future investment opportunities due to potential withholding tax leakage or non-resident capital gain taxes.
Implementation into domestic legislation may not be uniform across the participating states; certain actions give states options for implementation, certain actions are recommendations only and other jurisdictions may elect to only partially implement rules where it is in the state’s interest. On November 24, 2016, the OECD published the text of the Multilateral Convention to Implement Tax Treaty Related Measures to Prevent BEPS, which is intended to expedite the interaction of the tax treaty changes of the BEPS project. Several of the proposed measures, including measures covering treaty abuse, the deductibility of interest expense, local nexus requirements, transfer pricing and hybrid mismatch arrangements are potentially relevant to some of our fund structures and could have an adverse tax impact on our funds, investors and/or our portfolio companies. On June 7, 2017, the first wave of countries (68 in total) participated in the signing ceremony of the multilateral instrument (“MLI”). As of December 4, 2018, 17 other countries have signed the MLI. The MLI went into effect on July 1, 2018 with the intention to override and complement certain provisions in existing bilateral Tax Treaties. The MLI may not have immediate effect but, rather, when it applies will depend on a number of factors, including further steps required to ratify changes to treaties according to the local law of the signatory countries. As of January 2019, 86 countries have signed the MLI meanwhile only 18 have ratified it. Therefore, there is a lack of certainty as to how the majority of the signatories will apply the MLI and from when. Luxembourg recently ratified the MLI, but there are some important countries that have not yet signed including the US and Brazil. As a result, significant uncertainty remains around the access to tax treaties for the investments’ holding patterns, which could create situations of double taxation and adversely impact the investment returns of our funds.
It should be noted that Luxembourg opted for the application of a principal purpose test (“PPT”) clause being included in all the treaties in force as part of the anti-treaty abuse provisions (“BEPS Action 6”). The purpose of the PPT is in essence to deny treaty relief where broadly it is reasonable to conclude that obtaining the benefit of the treaty was one of the principal purposes of the arrangement or transaction leading to such benefit. Limitation on benefits (“LOB”) provisions have historically been used as anti-avoidance measures in tax treaties, and certain countries, including the U.S. and China, continue to opt for LOB provisions. The PPT will be a consideration for the relevant underlying countries and there is no current consistent interpretative view, thus posing a risk that our investment structures may be challenged and additional taxes and penalties imposed.
-
69
-
In addition, there are additional transfer pricing and standardized country by country (“CbC”) reporting requirements being implemented under the BEPS actions which may place additional administrative burden on our management team or portfolio company management and ultimately could lead to increased cost which could adversely affect profitability. For example, Luxembourg has introduced additional transfer pricing regulations as from January 1, 2017, that apply to intragroup financing activities and that are in line with the recommendations with the BEPS Action Plan. This has not significantly impacted our investments to date but has required some actions and adjustments in the structuring of our investments and in the maintenance and documentation of our investments. Additional information from these sources and other documentation held by tax authorities is expected to be subject to greater information sharing under Automatic Exchange of Information provisions under BEPS and specific local arrangements such as the EU’s automatic exchange of cross-border rulings directive, or the mandatory disclosure of certain cross-border transactions (“DAC6”). There is significant uncertainty regarding how the provisions of DAC6 will be applied and interpreted, and failure to comply can result in fines and penalties. Many tax authorities are unfamiliar with asset management businesses and dealing with challenges from tax authorities reviewing such information may also place additional administrative burden on our management team or portfolio company management and ultimately could lead to increased cost which could adversely affect profitability.
Countries including various EU countries have been moving forward on the BEPS agenda independent of agreement and finalization of the BEPS action items and currently are in the process of adapting and introducing the necessary legislation. Certain European jurisdictions have adopted legislation that may limit deductibility of interest and other financing expenses in companies in which our funds have invested or may invest in the future. For example, under the German interest barrier rule, the tax deduction available to a company in respect of a net interest expense (interest expense less interest income) is limited to 30% of EBITDA. Interest expense in excess of the interest deduction limitation may be carried forward indefinitely (subject to change in ownership restrictions) and used in future periods against all profits and gains (again subject to the interest barrier rule in the respective year in the future). France has also introduced similar limits on interest deductibility. Our businesses are subject to the risk that similar measures will be introduced in other EU countries in which they currently have investments or plan to invest in the future as a result of the Anti-Tax Avoidance Directive issued by the European Council on July 12, 2016 (“ATAD”), and amended on February 28, 2017 and on May 12, 2017 (“ATAD II”), or that other legislative or regulatory measures might be promulgated in any of the countries in which we operate that adversely affect our businesses.
Similarly, the U.K. introduced Anti-Hybrid provisions with effect from 1 January 2017. The scope of these rules is wide-reaching, in certain instances beyond the scope proposed by the BEPS initiative, and can apply to disallow certain payments or ‘quasi-payments’ for U.K. corporation tax purposes involving U.K. or non-U.K. hybrid entities. Where hybrid entities exist within a portfolio company structure, this may place additional administrative burden on our management team or portfolio company management to assess the impact of the rules and potentially create additional tax costs.
The European Union has taken steps to implement a consistent application of BEPS project type principles between Member States through the ATAD and ATAD II. The Directive should be transcribed in local law and applicable as from January 1, 2019 and January 1, 2020 for some provisions (exit taxation and anti-hybrid rules). This would result in the introduction into the tax laws of EU Member States, of interest limitation rules similar to the German interest barrier rules described above but also controlled foreign company rules, a general anti-abusive provision, an exit taxation provision and some anti-hybrid rules impacting the transactions between EU Member States but also between EU Member States and third countries. The ATAD rules may place additional administrative burden on our management team or portfolio company management to assess the impact of such rules on the investments of our funds and ultimately could lead to increased cost which could adversely affect profitability. The ATAD rules may also impact the investment returns of our funds.
For example, as a result of ATAD, as of January 2019, the Netherlands has adopted interest deductibility rules similar to Germany (30% of Fiscal EBITDA limitation) and CFC-rules, and a consultation document has been published by the Dutch government containing legislative proposals to implement the ATAD II directive measures aimed at preventing hybrid mismatch structures and abuse of reversed hybrid entities. Luxembourg has similarly adopted interest deductibility rules and CFC rules with proposals affecting hybrid entities and transactions to come in the future. For both the Netherlands and Luxembourg, the rules regarding hybrid payments should be implemented before January 1, 2020 while the rules with regard to reversed hybrid entities should be implemented before January 1, 2022. The Netherlands has also announced that it intends to implement a withholding tax on certain interest and royalty payments to entities located in certain selected jurisdictions with a low statutory tax rate (less than 9%) or on the EU blacklist of non-cooperative countries. The announced withholding tax is intended to be applicable from 2021 and should be equal to the Dutch corporate income tax rate at that time. However, no law proposal has been adopted (nor published) yet.
Separately, as a result of the complexity of, and lack of clear precedent or authority with respect to, the application of various income tax laws to our structures, the application of rules governing how transactions and structures should be reported is also subject to differing interpretations. Certain jurisdictions where our funds have made investments, have sought to tax
-
70
-
investment gains or other returns (including those from real estate) derived by nonresident investors, including private equity funds, from the disposition of the equity in companies operating in those jurisdictions. In some cases this development is the result of new legislation or changes in the interpretation of existing legislation and local authority assertions that investors have a local taxable presence or are holding companies for trading purposes rather than for capital purposes, or are not otherwise entitled to treaty benefits. In addition, the tax authorities in certain jurisdictions have sought to deny the benefits of income tax treaties for withholding taxes on interest and dividends of nonresident entities, if the entity is not the beneficial owner of the income but rather a mere conduit company inserted primarily to access treaty benefits.
The Netherlands recently changed its domestic dividend withholding rules effective as of January 1, 2018. Distributions by a Dutch Cooperative after such date are in principle subject to 15% Dutch dividend withholding tax if the Cooperative’s main function is that of holding certain equity investments of 5% or more (so-called “Holding Cooperatives”). Depending on the investment structure utilized, however, this withholding tax may be reduced or eliminated under application of a domestic dividend withholding tax exemption or applicable tax treaties. Depending on the specific investment structure utilized, the new rules may require investment structures used by our funds to have additional substance in the entity holding the Dutch entity in order to apply the domestic dividend withholding tax exemption with respect to distributions from certain Dutch entities. If such exemption is not available, reduced rates of withholding under applicable tax treaties may be available (whereby the impact of the MLI should be considered, possibly requiring ‘additional’ substance in the entity holding the Dutch entity), and there may be alternatives to repatriate funds out of the Netherlands in a way that does not trigger a dividend distribution subject to withholding tax, but there is no guarantee our investment structures would qualify for such reduced rates or be able to repatriate funds without Dutch withholding tax in the future. If these reduced treaty rates or other alternatives are not available, the returns on certain investments made by our funds may be adversely impacted due to the imposition of this Dutch withholding tax.
In December 2018, the Cayman Islands Legislative Assembly passed The International Tax Co-Operation (Economic Substance) Law, 2018 (the “CI Law”) and the Bermuda House of Assembly passed a bill entitled the Economic Substance Act 2018 (the “Bermuda Act”). Effective as of January 1, 2019, the CI Law and the Bermuda Act require every Cayman Islands or Bermuda relevant entity engaging in a relevant activity to maintain a substantial economic presence in the Cayman Islands or Bermuda. Outside of the BEPS agenda countries continue to develop their own domestic anti-avoidance provisions. Such provisions can be general or targeted in nature. For example, India has introduced General Anti-Avoidance Rule (“GAAR”) provisions in its tax law in 2012 that have become effective as of April 1, 2017. The objective of GAAR is to deny tax benefit in an arrangement which has been entered into with the main purpose to obtain tax benefit and which lacks commercial substance or creates rights and obligations which are not at arm’s length principle or results in misuse or abuse of tax law provisions or is carried out by means or in a manner which are not ordinarily employed for bona fide purposes. Such an arrangement is termed in the GAAR provisions as “impermissible avoidance agreement”. As regards foreign investors, GAAR provisions would mainly impact those investors who claim treaty benefits to eliminate or minimize tax outlay in India. Acceding to the representations made by the foreign investors and other stakeholders, the Indian government has clarified that GAAR provisions would not apply in the following cases:
|
•
|
an arrangement where tax benefit in a fiscal year in aggregate to all the concerned parties does not exceed INR 30 million;
|
|
•
|
investments made by Foreign Portfolio Investors (“FPIs”) in India on which no treaty benefits have been claimed;
|
|
•
|
investments made by non-resident investors in the FPIs by way of offshore derivative instruments or any other way; or
|
|
•
|
investments made by any investor prior to April 2017.
|
Outside of GAAR, there are certain exemptions available to foreign investors in specified circumstances, including where the non-resident investors have invested directly or indirectly in specified FPIs registered in India. Accordingly, Indian taxation of the capital gains of a foreign investor, upon a direct or indirect transfer sale of an Indian company, remains uncertain.
The U.K. has also enacted legislation that may affect our funds’ investments. The U.K. Diverted Profits Tax (“DPT”) regime was introduced with effect from April 1, 2015 as a tax separate from the U.K.’s existing Corporate Income Tax regime. DPT charges a rate of 25% on profits that, under the terms of the legislation, are considered to have been eroded from the U.K. tax base. The DPT legislation is intended to counteract and deter contrived arrangements used by multinational corporate groups which, it is argued, have resulted in the erosion of the U.K. tax base. DPT operates through two main rules: (i) the first rule aims to prevent U.K. tax resident companies (“U.K. PEs”) from creating tax advantages through transacting with entities that lack economic substance; and (ii) the second rule aims to counteract arrangements by which foreign companies sell into the U.K. while avoiding the creation of a U.K. PE. The legislation is worded so that where it is “reasonable to assume” a U.K. company is party to an arrangement that lacks economic substance and which results in a tax advantage in the U.K., or where it is “reasonable to assume” the activity of the involved parties is designed in such a way as to avoid a U.K. PE, DPT could apply.
In many jurisdictions, there is an increasing political, legislative and regulatory focus on identifying the ultimate beneficial owners of corporate entities. The need to provide beneficial ownership information when forming new corporate
-
71
-
entities or when seeking regulatory consents in relation to prospective transactions may in certain cases require the disclosure of additional information relating to Apollo or its investors, and the need to obtain and verify such information may potentially have an impact on transaction costs and timelines.
Third-party investors in our funds have the right under certain circumstances to terminate commitment periods or to dissolve the funds, and investors in some of our credit funds may redeem their investments in such funds at any time after an initial holding period. These events would lead to a decrease in our revenues, which could be substantial.
The governing agreements of certain of our funds allow the investors of those funds to, among other things, (i) terminate the commitment period of the fund in the event that certain “key persons” (for example, one or more of our Managing Partners and/or certain other investment professionals) fail to devote the requisite time to managing the fund, (ii) (depending on the fund) terminate the commitment period, dissolve the fund or remove the general partner if we, as general partner or manager, or certain “key persons” engage in certain forms of misconduct, or (iii) dissolve the fund or terminate the commitment period upon the affirmative vote of a specified percentage of limited partner interests entitled to vote. Each of Fund VI, Fund VII, Fund VIII and Fund IX, on which our near-to medium-term performance will heavily depend, include a number of such provisions. HVF, EPF II, EPF III and certain other funds have similar provisions. Also, after undergoing the 2007 Reorganization, subsequent to which we deconsolidated certain funds that had historically been consolidated in our financial statements, we amended the governing documents of our funds at that time to provide that a simple majority of a fund’s unaffiliated investors have the right to liquidate that fund. In addition to having a significant negative impact on our revenue, net income and cash flow, the occurrence of such an event with respect to any of our funds would likely result in significant reputational damage to us.
Investors in some of our credit funds may also generally redeem their investments on an annual, semiannual or quarterly basis following the expiration of a specified period of time when capital may not be redeemed (typically between one and five years). Fund investors may decide to move their capital away from us to other investments for any number of reasons in addition to poor investment performance. Factors which could result in investors leaving our funds include changes in interest rates that make other investments more attractive, poor investment performance, changes in investor perception regarding our focus or alignment of interest, unhappiness with changes in or broadening of a fund’s investment strategy, changes in our reputation and departures or changes in responsibilities of key investment professionals. In a declining market, the pace of redemptions and consequent reduction in our AUM could accelerate. The decrease in revenues that would result from significant redemptions in these funds could have a material adverse effect on our businesses, revenues, net income and cash flows.
In addition, the management agreements of all of our funds would be terminated upon an “assignment,” without the requisite consent, of these agreements, which may be deemed to occur in the event the investment advisors of our funds were to experience a change of control. We cannot be certain that consents required to assign our investment management agreements will be obtained if a change of control occurs. In addition, with respect to our publicly traded closed-end funds, each fund’s investment management agreement must be approved annually by the independent members of such fund’s board of directors and, in certain cases, by its shareholders, as required by law. Termination of these agreements would cause us to lose the fees we earn from such funds.
Our financial projections for portfolio companies and other fund investments could prove inaccurate.
Our funds generally establish the capital structure of portfolio companies and certain other fund investments, including real estate investments, on the basis of financial projections for such investments. These projected operating results will normally be based primarily on management judgments. In all cases, projections are only estimates of future results that are based upon assumptions made at the time that the projections are developed. General economic conditions, which are not predictable, along with other factors may cause actual performance to fall short of the financial projections we used to establish a given investment’s capital structure. Because of the leverage we typically employ in our fund investments, this could cause a substantial decrease in the value of the equity holdings of our funds in such investments. The inaccuracy of financial projections could thus cause our funds’ performance to fall short of our expectations.
Our funds’ performance, and our performance, may be adversely affected by the financial performance of our funds’ portfolio companies and the industries in which our funds invest.
Our performance and the performance of our private equity funds, as well as many of our credit and real assets funds, are significantly affected by the value of the companies in which our funds have invested. Our funds invest in companies in many different industries, each of which is subject to volatility based upon a variety of factors, including economic and market factors. The credit crisis caused significant fluctuations in the value of securities held by our funds, and the global economic recession had a significant impact on the performance of the portfolio companies owned by the funds we manage. Although the U.S. economy has improved, conditions in economies outside the U.S. have generally improved at a less rapid pace (and in some cases have deteriorated), and there remain many obstacles to continued growth in the economy such as global geopolitical events, risks of
-
72
-
inflation and high deficit levels for governments in the U.S. and abroad. These factors and other general economic trends may impact the performance of portfolio companies in many industries and in particular, industries that are more impacted by changes in consumer demand, such as the packaging, manufacturing, energy, chemical and refining industries, as well as travel and leisure, gaming, financial services and real estate industries. The performance of our funds, and our performance, may be adversely affected to the extent our fund portfolio companies in these industries experience adverse performance or additional pressure due to downward trends. For example, the performance of certain of the portfolio companies of our funds in the packaging, manufacturing, energy, chemical and refining industries is subject to the cyclical and volatile nature of the supply-demand balance in these industries. These industries historically have experienced alternating periods of capacity shortages leading to tight supply conditions, causing prices and profit margins to increase, followed by periods when substantial capacity is added, resulting in oversupply, declining capacity utilization rates and declining prices and profit margins. In addition to changes in the supply and demand for products, the volatility these industries experience occurs as a result of changes in energy prices, costs of raw materials and changes in various other economic conditions around the world.
The performance of our funds’ investments in the commodities markets is also subject to a high degree of business and market risk, as it is substantially dependent upon prevailing prices of oil and natural gas. Certain of our funds have investments in businesses involved in oil and gas exploration and development, which can be a speculative business involving a high degree of risk, including: the volatility of oil and natural gas prices; the use of new technologies; reliance on estimates of oil and gas reserves in the evaluation of available geological, geophysical, engineering and economic data; and encountering unexpected formations or pressures, premature declines of reservoirs, blow-outs, equipment failures and other accidents in completing wells and otherwise, cratering, sour gas releases, uncontrollable flows of oil, natural gas or well fluids, adverse weather conditions, pollution, fires, spills and other environmental risks. Prices for oil and natural gas have not fully recovered since their significant decrease in the latter part of 2014 and throughout 2015, and there can be no assurance that prices will fully recover. If prices remain at their current level for an extended period of time, there could be an adverse impact on the performance of certain of our funds, and this impact may be material. These prices are also subject to wide fluctuation in response to relatively minor changes in the supply and demand for oil and natural gas, market uncertainty and a variety of additional factors that are beyond our control, such as level of consumer product demand, the refining capacity of oil purchasers, weather conditions, government regulations, the price and availability of alternative fuels, political conditions, foreign supply of such commodities and overall economic conditions. It is common in making investments in the commodities markets to deploy hedging strategies to protect against pricing fluctuations but such strategies may or may not be employed by us or our funds’ portfolio companies, and even when they are employed they may not protect our funds’ investments.
Our funds’ investments in companies in the financial services sector are subject to a variety of factors, such as market uncertainty, additional government regulations, disclosure requirements, limits on fees, increasing borrowing costs or limits on the terms or availability of credit to such portfolio companies, and other regulatory requirements each of which may impact the conduct of such portfolio companies. Compliance with changing regulatory requirements will likely impose staffing, legal, compliance and other costs and administrative burdens upon our funds’ investments in financial services. Various sectors of the global financial markets have been experiencing an extended period of adverse conditions.
In respect of real estate, even though the U.S. residential real estate market remains stable after recovering from a lengthy and deep downturn, various factors could halt or limit a recovery in the housing market and have an adverse effect on the performance of certain of our funds’ investments, including, but not limited to, rising mortgage interest rates and a low level of consumer confidence in the economy and/or the residential real estate market.
In addition, our funds’ investments in commercial mortgage loans and other commercial real-estate related loans are subject to risks of delinquency and foreclosure, and risks of loss that are greater than similar risks associated with mortgage loans made on the security of residential properties. If the net operating income of the commercial property is reduced, the borrower’s ability to repay the loan may be impaired. Net operating income of a commercial property can be affected by various factors, such as success of tenant businesses, property management decisions, competition from comparable types of properties and declines in regional or local real estate values and rental or occupancy rates.
Our credit funds are subject to numerous additional risks.
Our credit funds are subject to numerous additional risks, including the risks set forth below.
|
•
|
Generally, there may be few limitations on the execution of these funds’ investment strategies, which are in many cases subject to the sole discretion of the management company or the general partner of such funds, or there may be numerous investment limitations or restrictions that require monitoring, compliance and maintenance.
|
|
•
|
While we monitor the concentration of the portfolios of our credit funds, concentration in any one borrower or other issuer, product category, industry, region or country may arise from time to time.
|
-
73
-
|
•
|
Given the flexibility and overlapping nature of the mandates and investment strategies of our credit funds, situations arise where certain of these funds hold (including outright positions in issuers and exposure to such issuers derived through any synthetic and/or derivative instrument) in multiple tranches of securities of an issuer (or other interests of an issuer) or multiple funds having interests in the same tranche of an issuer.
|
|
•
|
Certain of these funds may engage in short-selling, which is subject to a theoretically unlimited risk of loss.
|
|
•
|
These funds are exposed to the risk that a counterparty will not settle a transaction in accordance with its terms and conditions because of a dispute over the terms of the contract (whether or not bona fide) or because of a credit or liquidity problem, thus causing the fund to suffer a loss.
|
|
•
|
Credit risk may arise through a default by one of several large institutions that are dependent on one another to meet their respective liquidity or operational needs, so that a default by one institution causes a series of defaults by the other institutions.
|
|
•
|
The efficacy of the investment and trading strategies of certain credit funds may depend largely on the ability to establish and maintain an overall market position in a combination of different financial instruments, which can be difficult to execute.
|
|
•
|
These funds may make investments or hold trading positions in markets that are volatile and which are or may become illiquid.
|
|
•
|
Certain of these funds may seek to originate loans, including, but not limited to, secured and unsecured notes, senior and second lien loans, mezzanine loans, and other similar investments.
|
|
•
|
These funds’ investments are subject to risks relating to investments in commodities, swaps, futures, options and other derivatives, the prices of which are highly volatile and may be subject to a theoretically unlimited risk of loss in certain circumstances.
|
Fraud and other deceptive practices could harm fund performance and our performance.
Instances of bribery, fraud and other deceptive practices committed by senior management of portfolio companies in which an Apollo fund invests may undermine our due diligence efforts with respect to such companies, and if such fraud is discovered, negatively affect the valuation of a fund’s investments. Fraud or other deceptive practices by our own employees or advisors could have a similar effect on fund performance and our performance. In addition, when discovered, financial fraud may create legal exposure and may contribute to reputational harm and overall market volatility that can negatively impact an Apollo fund’s investment program. As a result, instances of bribery, fraud and other deceptive practices could result in performance that is poorer than expected.
Contingent liabilities could harm fund performance.
We may cause our funds to acquire an investment that is subject to contingent liabilities. Such contingent liabilities could be unknown to us at the time of acquisition or, if they are known to us, we may not accurately assess or protect against the risks that they present. Acquired contingent liabilities could thus result in unforeseen losses for our funds. In addition, in connection with the disposition of an investment in a portfolio company, a fund may be required to make representations about the business and financial affairs of such portfolio company typical of those made in connection with the sale of a business. A fund may also be required to indemnify the purchasers of such investment to the extent that any such representations are inaccurate. These arrangements may result in the incurrence of contingent liabilities by a fund, even after the disposition of an investment. Accordingly, the inaccuracy of representations and warranties made by a fund could harm such fund’s performance.
Our funds may be forced to dispose of investments at a disadvantageous time.
Our funds may make investments that they do not advantageously dispose of prior to the date the applicable fund is dissolved, either by expiration of such fund’s term or otherwise. Although we generally expect that investments will be disposed of prior to dissolution or be suitable for in-kind distribution at dissolution, and the general partners of the funds generally have a limited ability to extend the term of the fund with the consent of fund investors or the advisory board of the fund, as applicable, our funds may have to sell, distribute or otherwise dispose of investments at a disadvantageous time as a result of dissolution. This would result in a lower than expected return on the investments and, perhaps, on the fund itself.
Regulations governing AINV’s operation as a business development company, and AINV’s tax status, affect its ability to raise, and the way in which it raises, additional capital.
As a business development company under the Investment Company Act, AINV may issue debt securities or preferred stock and/or borrow money from banks or other financial institutions (referred to collectively as “senior securities”) up to the maximum amount permitted by the Investment Company Act. As a business development company, AINV is generally required to meet an asset coverage ratio of total assets to total borrowings and other senior securities, which include all of its borrowings and any preferred stock it may issue in the future, of at least 200%. If this ratio declines below 200%, the contractual arrangements
-
74
-
governing these securities may require AINV to sell a portion of its investments and, depending on the nature of its leverage, repay a portion of its indebtedness at a time when such sales may be disadvantageous. On March 23, 2018, the President signed into law the Small Business Credit Availability Act (the “SBCAA”), which included various changes to regulations under the federal securities laws that impact business development companies, including changes to the Investment Company Act to allow business development companies to decrease their asset coverage requirement to 150% from 200% under certain circumstances. On April 4, 2018, the board of directors of AINV approved the application of the modified asset coverage requirements for AINV. Accordingly, effective April 4, 2019, for every $100 of net assets, AINV may raise $200 from senior securities, such as borrowings or issuing preferred stock. After April 4, 2019, if the asset coverage ratio declines below 150%, the contractual arrangements governing these securities may require AINV to sell a portion of its investments and, depending on the nature of its leverage, repay a portion of its indebtedness at a time when such sales may be disadvantageous.
Business development companies may issue and sell common stock at a price below net asset value per share only in limited circumstances, one of which is during the one-year period after shareholder approval. In the past, AINV’s shareholders have approved a plan so that during the subsequent 12-month period, AINV could, in one or more public or private offerings of its common stock, sell or otherwise issue shares of its common stock at a price below the then current net asset value per share, subject to certain conditions including parameters on the level of permissible dilution, approval of the sale by a majority of its independent directors and a requirement that the sale price be not less than approximately the market price of the shares of its common stock at specified times, less the expenses of the sale. Although AINV currently does not have such authority, it may in the future seek to receive such authority on terms and conditions set forth in the corresponding proxy statement. There is no assurance such approvals will be obtained.
In the event AINV sells, or otherwise issues, shares of its common stock at a price below net asset value per share, existing AINV stockholders will experience net asset value dilution and the investors who acquire shares in such offering may thereafter experience the same type of dilution from subsequent offerings at a discount. For example, if AINV sells an additional 10% of its common shares at a 5% discount from net asset value, an AINV stockholder who does not participate in that offering for its proportionate interest will suffer net asset value dilution of up to 0.5% or $5 per $1,000 of net asset value.
In addition to issuing securities to raise capital as described above, AINV may in the future securitize its loans to generate cash for funding new investments. To securitize loans, it may create a wholly-owned subsidiary, contribute a pool of loans to the subsidiary and have the subsidiary issue primarily investment grade debt securities to purchasers who it would expect would be willing to accept a substantially lower interest rate than the loans earn. AINV would retain all or a portion of the equity in the securitized pool of loans. AINV’s retained equity would be exposed to any losses on the portfolio of loans before any of the debt securities would be exposed to such losses. An inability to successfully securitize its loan portfolio could limit its ability to grow its business and fully execute its business strategy and adversely affect its earnings, if any. Moreover, the successful securitization of its loan portfolio might expose it to losses as the residual loans in which it does not sell interests will tend to be those that are riskier and more apt to generate losses.
Regulations governing AFT’s and AIF’s operation affect their ability to raise, and the way in which they raise, additional capital.
As investment companies registered under the Investment Company Act, AFT and AIF may issue debt securities or preferred stock and/or borrow money from banks or other lenders, up to the maximum amount permitted by the Investment Company Act. Under the provisions of the Investment Company Act, AFT and AIF are restricted in the (i) issuance of preferred shares to amounts such that their respective asset coverage (as defined in the Investment Company Act) equals at least 200% after issuance and (ii) incurrence of indebtedness, including through the issuance of debt securities, such that immediately after issuance the fund will have an asset coverage (as defined in the Investment Company Act) of at least 300%. Lenders to the funds may demand higher asset coverage ratios. Further, if the value of a funds’ assets declines, such fund may be unable to satisfy its asset coverage requirements. If that happens, such fund, in order to pay dividends or repurchase its stock or to satisfy the requirements of its lenders, may be required to sell a portion of its investments and, depending on the nature of its leverage, repay a portion of its indebtedness at a time when such sales may be disadvantageous. Further, AFT and AIF may raise capital by issuing common shares, however, the offering price per common share generally must equal or exceed the net asset value per share, exclusive of any underwriting commissions or discounts, of the funds’ shares.
Risks Related to Our Class A Shares and Our Preferred Shares
The market price and trading volume of our Class A shares and our Preferred shares may be volatile, which could result in rapid and substantial losses for our shareholders.
The market price of our Class A shares and our Preferred shares may be highly volatile and could be subject to wide fluctuations. In addition, the trading volume in our Class A shares and our Preferred shares may fluctuate and cause significant
-
75
-
price variations to occur. You may be unable to resell your Class A shares and Preferred shares at or above your purchase price, if at all. The market price of our Class A shares and our Preferred shares may fluctuate or decline significantly in the future. Some of the factors that could negatively affect the price of our Class A shares and our Preferred shares or result in fluctuations in the price or trading volume of our Class A shares and our Preferred shares include:
|
•
|
variations in our quarterly operating results or distributions, which variations we expect will be substantial;
|
|
•
|
our policy of taking a long-term perspective on making investment, operational and strategic decisions, which is expected to result in significant and unpredictable variations in our quarterly returns;
|
|
•
|
our creditworthiness, results of operations and financial condition;
|
|
•
|
the credit ratings of the Preferred shares;
|
|
•
|
the prevailing interest rates or rates of return being paid by other companies similar to us and the market for similar securities;
|
|
•
|
failure to meet analysts’ earnings estimates;
|
|
•
|
publication of research reports about us or the investment management industry or the failure of securities analysts to cover our Class A shares and our Preferred shares;
|
|
•
|
additions or departures of our Managing Partners and other key management personnel;
|
|
•
|
adverse market reaction to any indebtedness we may incur or securities we may issue in the future;
|
|
•
|
actions by shareholders;
|
|
•
|
changes in market valuations of similar companies;
|
|
•
|
speculation in the press or investment community;
|
|
•
|
changes or proposed changes in laws or regulations or differing interpretations thereof affecting our businesses or enforcement of these laws and regulations, or announcements relating to these matters;
|
|
•
|
a lack of liquidity in the trading of our Class A shares and our Preferred shares;
|
|
•
|
adverse publicity about the investment management industry generally or individual scandals, specifically;
|
|
•
|
a breach of our computer systems, software or networks, or misappropriation of our proprietary information;
|
|
•
|
the fact that we do not provide comprehensive guidance regarding our expected quarterly and annual revenues, earnings and cash flow; and
|
|
•
|
economic, financial, geopolitical, regulatory or judicial events or conditions that affect us or the financial markets.
|
In addition, from time to time, we may also declare special quarterly distributions based on investment realizations. Volatility in the market price of our Class A shares may be heightened at or around times of investment realizations as well as following such realizations, as a result of speculation as to whether such a distribution may be declared.
Our performance, market conditions and prevailing interest rates have fluctuated in the past and can be expected to fluctuate in the future. Fluctuations in these factors could have an adverse effect on the price and liquidity of the Preferred shares. In general, as market interest rates rise, securities with fixed interest rates or fixed distribution rates, such as the Preferred shares, decline in value. Consequently, if you purchase the Preferred shares and market interest rates increase, the market price of the Preferred shares may decline. We cannot predict the future level of market interest rates.
Our ability to pay quarterly distributions on the Preferred shares will be subject to, among other things, general business conditions, our financial results, restrictions under the terms of our existing and future indebtedness, and our liquidity needs. Any reduction or discontinuation of quarterly distributions could cause the market price of the Preferred shares to decline significantly. Accordingly, the Preferred shares may trade at a discount to their purchase price.
An investment in Class A shares and our Preferred shares is not an investment in any of our funds, and the assets and revenues of our funds are not directly available to us.
Class A shares and our Preferred shares are securities of Apollo Global Management, LLC only. While our historical consolidated and combined financial information includes financial information, including assets and revenues of certain Apollo funds on a consolidated basis, and our future financial information will continue to consolidate certain of these funds, such assets and revenues are available to the fund, and not to us except through management fees, performance fees, distributions and other proceeds arising from agreements with funds, as discussed in more detail in this report.
Our Class A share price may decline due to the large number of shares eligible for future sale and for exchange into Class A shares.
The market price of our Class A shares could decline as a result of sales of a large number of our Class A shares or the perception that such sales could occur. These sales, or the possibility that these sales may occur, also might make it more difficult for us to sell equity securities in the future at a time and price that we deem appropriate. As of
December 31, 2018
, we had
201,400,500
Class A shares outstanding. The Class A shares reserved under our equity incentive plan are increased on the first
-
76
-
day of each fiscal year by (i) the amount (if any) by which (a) 15% of the number of outstanding Class A shares and Apollo Operating Group units (“AOG Units”) exchangeable for Class A shares on a fully converted and diluted basis on the last day of the immediately preceding fiscal year exceeds (b) the number of shares then reserved and available for issuance under the Equity Plan, or (ii) such lesser amount by which the administrator may decide to increase the number of Class A shares. Taking into account grants of restricted share units (“RSUs”) and options made through
December 31, 2018
, 45,978,889 Class A shares remained available for future grant under our equity incentive plan. In addition, as of
December 31, 2018
, Holdings could at any time exchange its AOG Units for up to
202,345,561
Class A shares on behalf of our Managing Partners and Contributing Partners subject to the Amended and Restated Exchange Agreement. See “Item 13. Certain Relationships and Related Party Transactions-Amended and Restated Exchange Agreement.” We may also elect to sell additional Class A shares in one or more future primary offerings.
Our Managing Partners and Contributing Partners, through their partnership interests in Holdings, owned an aggregate of
50.1%
of the AOG Units as of
December 31, 2018
. Subject to certain prior notice provisions and other procedures and restrictions (including any transfer restrictions and lock-up agreements applicable to our Managing Partners and Contributing Partners), each Managing Partner and Contributing Partner has the right to exchange the AOG Units for Class A shares. These Class A shares are eligible for resale from time to time, subject to certain contractual restrictions and applicable securities laws.
Our Managing Partners and Contributing Partners (through Holdings) have the ability to cause us to register the Class A shares they acquire upon exchange of their AOG Units, as was done in connection with the Company’s Secondary Offering in May 2013. See “Item 13. Certain Relationships and Related Party Transactions-Managing Partner Shareholders Agreement- Registration Rights.”
The Strategic Investor has the ability to cause us to register its non-voting Class A shares, as was done in connection with the Company’s Secondary Offering in May 2013. See “Item 13. Certain Relationships and Related Party Transactions-Lenders Rights Agreement.”
We have on file with the SEC a registration statement on Form S-8 covering the shares issuable under our equity incentive plan. Subject to vesting and contractual lock-up arrangements, such shares will be freely tradable.
We cannot assure you that our intended quarterly distributions will be paid each quarter or at all.
Our intention is to distribute to the holders of our Class A shares and our Preferred shares on a quarterly basis substantially all of our net after-tax cash flow from operations in excess of amounts determined by our manager to be necessary or appropriate to provide for the conduct of our businesses, to make appropriate investments in our businesses and our funds, to comply with applicable laws and regulations, to service our indebtedness or to provide for future distributions to the holders of our Class A shares and our Preferred shares for any ensuing quarter. The declaration, payment and determination of the amount of our quarterly distribution, if any, will be at the sole discretion of our manager, who may change our distribution policy at any time. We cannot assure you that any distributions, whether quarterly or otherwise, will or can be paid. In making decisions regarding our quarterly distribution, our manager considers general economic and business conditions, our strategic plans and prospects, our businesses and investment opportunities, our financial condition and operating results, working capital requirements and anticipated cash needs, contractual restrictions and obligations, legal, tax, regulatory and other restrictions that may have implications on the payment of distributions by us to the holders of our Class A shares and our Preferred shares or by our subsidiaries to us, and such other factors as our manager may deem relevant.
Our Preferred shares rank senior to our Class A shares with respect to the payment of distributions. Subject to certain exceptions, unless distributions have been declared and paid or declared and set apart for payment on the Preferred shares for a quarterly distribution period, during the remainder of that distribution period, we may not declare or pay or set apart payment for distributions on any Class A shares and any other equity securities that the Company may issue in the future ranking, as to the payment of distributions, junior to our Preferred shares and we may not repurchase any such junior shares. Distributions on the Preferred shares are discretionary and non-cumulative.
If distributions on a series of the Preferred shares have not been declared and paid for the equivalent of six or more quarterly distribution periods, whether or not consecutive, holders of the Preferred shares, together as a class with holders of any other series of parity shares with like voting rights, will be entitled to vote for the election of two additional directors to the board of directors. When quarterly distributions have been declared and paid on such series of the Preferred shares for four consecutive quarters following such a nonpayment event, the right of the holders of the Preferred shares and such parity shares to elect these two additional directors will cease, the terms of office of these two directors will forthwith terminate and the number of directors constituting the board of directors will be reduced accordingly.
-
77
-
Our Managing Partners’ beneficial ownership of interests in the Class B share that we have issued to BRH Holdings GP, Ltd. (“BRH”), the control exercised by our manager and anti-takeover provisions in our charter documents and Delaware law could delay or prevent a change in control.
Our Managing Partners, through their ownership of BRH, beneficially own the Class B share that we have issued to BRH. The Managing Partners interests in such Class B share represented
52.4%
of the total combined voting power of our shares entitled to vote as of
December 31, 2018
. As a result, they are able to exercise control over all matters requiring the approval of shareholders and are able to prevent a change in control of our company. In addition, our operating agreement provides that so long as the Apollo control condition (as described in “Item 10. Directors, Executive Officers and Corporate Governance-Our Manager”) is satisfied, our manager, which is owned and controlled by our Managing Partners, manages all of our operations and activities. The control of our manager will make it more difficult for a potential acquirer to assume control of our Company. Other provisions in our operating agreement may also make it more difficult and expensive for a third party to acquire control of us even if a change of control would be beneficial to the interests of our shareholders. For example, our operating agreement requires advance notice for proposals by shareholders and nominations, places limitations on convening shareholder meetings, and authorizes the issuance of preferred shares that could be issued by our board of directors to thwart a takeover attempt. In addition, certain provisions of Delaware law give us the ability to delay or prevent a transaction that could cause a change in our control. The market price of our Class A shares and our Preferred shares could be adversely affected to the extent that our Managing Partners’ control over our Company, the control exercised by our manager as well as provisions of our operating agreement discourage potential takeover attempts that our shareholders may favor.
We are a Delaware limited liability company, and there are certain provisions in our operating agreement regarding exculpation and indemnification of our officers and directors that differ from the Delaware General Corporation Law ( the “DGCL”) in a manner that may be less protective of the interests of the holders of our Class A shares and our Preferred shares.
Our operating agreement provides that to the fullest extent permitted by applicable law our directors or officers will not be liable to us. However, under the DGCL, a director or officer would be liable to us for (i) breach of duty of loyalty to us or our shareholders, (ii) intentional misconduct or knowing violations of the law that are not done in good faith, (iii) improper redemption of shares or declaration of dividend, or (iv) a transaction from which the director derived an improper personal benefit. In addition, our operating agreement provides that we indemnify our directors and officers for acts or omissions to the fullest extent provided by law. However, under the DGCL, a corporation can indemnify directors and officers for acts or omissions only if the director or officer acted in good faith, in a manner he reasonably believed to be in the best interests of the corporation, and, in criminal action, if the officer or director had no reasonable cause to believe his conduct was unlawful. Accordingly, our operating agreement may be less protective of the interests of the holders of our Class A shares and our Preferred shares, when compared to the DGCL, insofar as it relates to the exculpation and indemnification of our officers and directors.
Awards of our Class A shares may increase shareholder dilution and reduce profitability.
We grant Class A restricted share units to certain of our investment professionals and other personnel, both when hired and as a portion of the discretionary annual compensation they may receive. We require that a portion of the performance fees distributions payable by the general partners of certain of the funds we manage be used by the recipients of those distributions to purchase restricted Class A shares issued under our equity incentive plan. While this practice promotes alignment with shareholders and encourages investment professionals to maximize the success of the Company as a whole, these equity awards, if fulfilled by issuances of new shares by us rather than by open market purchases (which do not cause any dilution), may increase personnel-related shareholder dilution. In addition, volatility in the price of our Class A shares could adversely affect our ability to attract and retain our investment professionals and other personnel. To recruit and retain existing and future investment professionals, we may need to increase the level of compensation that we pay to them, which may cause a higher percentage of our revenue to be paid out in the form of compensation, which would have an adverse impact on our profit margins.
Purchases of our Class A shares pursuant to our share repurchase program may affect the value of our Class A shares, and there can be no assurance that our share repurchase program will enhance shareholder value.
Pursuant to our publicly announced share repurchase program, we are authorized to repurchase up to
$500 million
in the aggregate of our Class A shares, including through the repurchase of our outstanding Class A shares through a share repurchase program and through a reduction of Class A shares to be issued to employees to satisfy associated tax obligations in connection with the settlement of equity-based awards granted under the 2007 Equity Plan (and any successor equity plan thereto). The timing and amount of any share repurchases will be determined based on legal requirements, price, market and economic conditions and other factors. This activity could increase (or reduce the size of any decrease in) the market price of our Class A shares at that time. Additionally, repurchases under our share repurchase program have and will continue to diminish our cash reserves, which could impact our ability to pursue possible strategic opportunities and acquisitions and could result in lower overall returns on our cash balances. There can be no assurance that any share repurchases will enhance shareholder value because the market price of
-
78
-
our Class A shares could decline. Although our share repurchase program is intended to enhance long-term shareholder value, short-term share price fluctuations could reduce the program’s effectiveness.
Risks Related to Our Organization and Structure
Our shareholders do not elect our manager and have limited ability to influence decisions regarding our businesses.
So long as the Apollo control condition is satisfied, our manager, AGM Management, LLC, which is owned and controlled by our Managing Partners, will manage all of our operations and activities. AGM Management, LLC is managed by BRH, a Cayman Islands limited company owned by our Managing Partners and managed by an executive committee composed of our Managing Partners. Our shareholders do not elect our manager, its manager or its manager’s executive committee and, unlike the holders of common stock in a corporation, have only limited voting rights on matters affecting our businesses and therefore limited ability to influence decisions regarding our businesses. Furthermore, if our shareholders are dissatisfied with the performance of our manager, they will have little ability to remove our manager. As discussed below, the Managing Partners collectively had
52.4%
of the voting power of Apollo Global Management, LLC as of
December 31, 2018
. Therefore, they have the ability to control any shareholder vote that occurs, including any vote regarding the removal of our manager.
In addition, holders of the Preferred shares generally have no voting rights and have none of the voting rights given to holders of our Class A shares, subject to certain exceptions.
Our board of directors has no authority over our operations other than that which our manager has chosen to delegate to it.
For so long as the Apollo control condition is satisfied, our manager, which is owned and controlled by our Managing Partners, manages all of our operations and activities, and our board of directors has no authority other than that which our manager chooses to delegate to it. In the event that the Apollo control condition is not satisfied, our board of directors will manage all of our operations and activities.
For so long as the Apollo control condition is satisfied, our manager (i) nominates and elects all directors to our board of directors, (ii) sets the number of directors of our board of directors and (iii) fills any vacancies on our board of directors. After the Apollo control condition is no longer satisfied, each of our directors will be elected by the vote of a plurality of our shares entitled to vote, voting as a single class, to serve until his or her successor is duly elected or appointed and qualified or until his or her earlier death, retirement, disqualification, resignation or removal.
Control by our Managing Partners of the combined voting power of our shares and holding their economic interests through the Apollo Operating Group may give rise to conflicts of interests.
Our Managing Partners controlled
52.4%
of the combined voting power of our shares entitled to vote as of
December 31, 2018
. Accordingly, our Managing Partners have the ability to control our management and affairs to the extent not controlled by our manager. In addition, they are able to determine the outcome of all matters requiring shareholder approval (such as a proposed sale of all or substantially of our assets, the approval of a merger or consolidation involving the company, and an election by our manager to dissolve the company) and are able to cause or prevent a change of control of our company and could preclude any unsolicited acquisition of our company. The control of voting power by our Managing Partners could deprive Class A shareholders of an opportunity to receive a premium for their Class A shares as part of a sale of our company, and might ultimately affect the market price of the Class A shares.
In addition, our Managing Partners and Contributing Partners, through their beneficial ownership of partnership interests in Holdings, were entitled to
50.1%
of Apollo Operating Group’s economic returns through the AOG Units owned by Holdings as of
December 31, 2018
. Because they hold their economic interest in our businesses directly through the Apollo Operating Group, rather than through the issuer of the Class A shares, our Managing Partners and Contributing Partners may have conflicting interests with holders of Class A shares including relating to the selection, structuring, and disposition of investments and any decision to alter our structure, including a decision to convert us to an entity taxed as a corporation for U.S. Federal income tax purposes. For example, our Managing Partners and Contributing Partners may have different tax positions from us, in part because our Managing Partners and Contributing Partners hold their AOG Units through entities that are not subject to corporate income taxation and we hold the AOG Units in part through a wholly-owned subsidiary that is subject to corporate income taxation. In addition, the earlier taxable disposition of assets following an exchange transaction by a Managing Partner or Contributing Partner may accelerate payments under the tax receivable agreement and increase the present value of such payments, and the taxable disposition of assets before an exchange or transaction by a Managing Partner or Contributing Partner may increase the tax liability of a Managing Partner or Contributing Partner without giving rise to any rights to such Managing Partner or Contributing Partner to receive payments under the tax receivable agreement. For a description of the tax receivable agreement, see “Item 13. Certain Relationships and Related Party Transactions-Amended and Restated Tax Receivable Agreement.” Additionally, as a result of the
-
79
-
reduction in the corporate tax rate to 21%, there is a significant differential in tax rates that apply to our wholly-owned corporate subsidiary and our Managing Partners and Contributing Partners, which may influence when and to what extent our manager decides to cause the Apollo Operating Group to make distributions to Holdings, which is 100% beneficially owned, directly and indirectly, by our Managing Partners and our Contributing Partners, and the five intermediate holding companies, which are 100% owned by us. In addition, the structuring of future transactions may take into consideration the Managing Partners’ and Contributing Partners’ tax considerations even where no similar benefit would accrue to us.
We qualify for, and rely on, exceptions from certain corporate governance and other requirements under the rules of the NYSE.
We qualify for exceptions from certain corporate governance and other requirements under the rules of the NYSE. Pursuant to these exceptions, we may elect not to comply with certain corporate governance requirements of the NYSE, including the requirements (i) that a majority of our board of directors consist of independent directors, (ii) that we have a nominating/corporate governance committee that is composed entirely of independent directors and (iii) that we have a compensation committee that is composed entirely of independent directors. In addition, we are not required to hold annual meetings of our shareholders. Pursuant to the exceptions available to a controlled company under the rules of the NYSE, we have elected not to have a nominating and corporate governance committee comprised entirely of independent directors, nor a compensation committee comprised entirely of independent directors. Although we currently have a board of directors comprised of a majority of independent directors, we plan to continue to avail ourselves of these exceptions. Accordingly, you will not have the same protections afforded to equity holders of entities that are subject to all of the corporate governance requirements of the NYSE.
Potential conflicts of interest may arise among our manager, on the one hand, and us and our shareholders on the other hand. Our manager and its affiliates have limited fiduciary duties to us and our shareholders, which may permit them to favor their own interests to the detriment of us and our shareholders.
Conflicts of interest may arise among our manager, on the one hand, and us and our shareholders, on the other hand. As a result of these conflicts, our manager may favor its own interests and the interests of its affiliates over the interests of us and our shareholders. These conflicts include, among others, the conflicts described below.
|
•
|
Our manager determines the amount and timing of our investments and dispositions, indebtedness, issuances of additional shares and amounts of reserves, each of which can affect the amount of cash that is available for distribution to you.
|
|
•
|
Our manager is allowed to take into account the interests of parties other than us in resolving conflicts of interest, which has the effect of limiting its duties (including fiduciary duties) to our shareholders; for example, our affiliates that serve as general partners of our funds have fiduciary and contractual obligations to our fund investors, and such obligations may cause such affiliates to regularly take actions that might adversely affect our near-term results of operations or cash flow; our manager has no obligation to intervene in, or to notify our shareholders of, such actions by such affiliates.
|
|
•
|
Other than as provided in the non-competition, non-solicitation and confidentiality obligations to which our Managing Partners and other professionals are subject, which may not be enforceable or may involve costly litigation, affiliates of our manager and existing and former personnel employed by our manager are not prohibited from engaging in other businesses or activities, including those that might be in direct competition with us.
|
|
•
|
Our manager has limited its liability and reduced or eliminated its duties (including fiduciary duties) under our operating agreement, while also restricting the remedies available to our shareholders for actions that, without these limitations, might constitute breaches of duty (including fiduciary duty). In addition, we have agreed to indemnify our manager and its affiliates to the fullest extent permitted by law, except with respect to conduct involving bad faith, fraud or willful misconduct. By purchasing our Class A shares or our Preferred shares, you have agreed and consented to the provisions set forth in our operating agreement, including the provisions regarding conflicts of interest situations that, in the absence of such provisions, might constitute a breach of fiduciary or other duties under applicable state law.
|
|
•
|
Our operating agreement does not restrict our manager from causing us to pay it or its affiliates for any services rendered, or from entering into additional contractual arrangements with any of these entities on our behalf, so long as the terms of any such additional contractual arrangements are fair and reasonable to us as determined under the operating agreement.
|
|
•
|
Our manager determines how much debt we incur and that decision may adversely affect our credit ratings.
|
|
•
|
Our manager determines which costs incurred by it and its affiliates are reimbursable by us.
|
|
•
|
Our manager controls the enforcement of obligations owed to us by it and its affiliates.
|
|
•
|
Our manager decides whether to retain separate counsel, accountants or others to perform services for us.
|
See “Item 13. Certain Relationships and Related Party Transactions” for a more detailed discussion of these conflicts.
-
80
-
The control of our manager may be transferred to a third-party without shareholder consent.
Our manager may transfer its manager interest to a third-party in a merger or consolidation or in a transfer of all or substantially all of its assets without the consent of our shareholders. Furthermore, at any time, the members of our manager may sell or transfer all or part of their membership interests in our manager without the approval of the shareholders, subject to certain restrictions as described elsewhere in this report. A new manager may not be willing or able to form new funds and could form funds that have investment objectives and governing terms that differ materially from those of our current funds. A new owner could also have a different investment philosophy, employ investment professionals who are less experienced, be unsuccessful in identifying investment opportunities or have a track record that is not as successful as Apollo’s track record. If any of the foregoing were to occur, our funds could experience difficulty in making new investments, and the value of our funds’ existing investments, our businesses, our results of operations and our financial condition could materially suffer.
Our ability to pay regular distributions may be limited by our holding company structure. We are dependent on distributions from the Apollo Operating Group to pay distributions, taxes and other expenses.
As a holding company, our ability to pay distributions will be subject to the ability of our subsidiaries to provide cash to us. We intend to make quarterly distributions to the holders of our Class A shares and our Preferred shares. Accordingly, we expect to cause the Apollo Operating Group to make distributions to its shareholders (Holdings, which is 100% beneficially owned, directly and indirectly, by our Managing Partners and our Contributing Partners, and the intermediate holding companies, which are 100% owned by us), pro rata in an amount sufficient to enable us to pay such distributions to the holders of our Class A shares and our Preferred shares; however, such distributions may not be made. In addition, our manager can reduce or eliminate our distributions at any time, in its discretion.
There may be circumstances under which we are restricted from paying distributions under applicable law or regulation (for example, due to Delaware limited partnership or limited liability company act limitations on making distributions if liabilities of the entity after the distribution would exceed the value of the entity’s assets).
We are required to pay our Managing Partners and Contributing Partners for most of the actual tax benefits we realize as a result of the tax basis step-up we receive in connection with our acquisitions of units from our Managing Partners and Contributing Partners.
Subject to certain restrictions, each Managing Partner and Contributing Partner has the right to exchange the AOG Units that he holds through his partnership interest in Holdings for our Class A shares in a taxable transaction. These exchanges, as well as our acquisitions of units from our Managing Partners or Contributing Partners, may result in increases in the tax basis of the intangible assets of the Apollo Operating Group that otherwise would not have been available. Any such increases may reduce the amount of tax that APO Corp., a wholly owned subsidiary of Apollo Global Management, LLC, would otherwise be required to pay in the future.
We have entered into a tax receivable agreement with our Managing Partners and Contributing Partners that provides for the payment by APO Corp., to our Managing Partners and Contributing Partners of 85% of the amount of actual tax savings, if any, that APO Corp. realizes (or is deemed to realize in the case of an early termination payment by APO Corp. or a change of control, as discussed below) as a result of these increases in tax deductions and tax basis and certain other tax benefits, including imputed interest expense, related to entering into the tax receivable agreement. Future payments that APO Corp. may make to our Managing Partners and Contributing Partners could be material in amount. In the event that any other of our current or future U.S. subsidiaries become taxable as corporations and acquire AOG Units in the future, or if we become taxable as a corporation for U.S. Federal income tax purposes, we expect, and have agreed that, each U.S corporation will become subject to a tax receivable agreement with substantially similar terms.
The IRS could challenge our claim to any increase in the tax basis of the assets owned by the Apollo Operating Group that results from the exchanges entered into by the Managing Partners or Contributing Partners. The IRS could also challenge any additional tax depreciation and amortization deductions or other tax benefits (including deductions for imputed interest expense associated with payments made under the tax receivable agreement) we claim as a result of, or in connection with, such increases in the tax basis of such assets. If the IRS were to successfully challenge a tax basis increase or tax benefits we previously claimed from a tax basis increase, Holdings would not be obligated under the tax receivable agreement to reimburse APO Corp. for any payments previously made to them (although any future payments would be adjusted to reflect the result of such challenge). As a result, in certain circumstances, payments could be made to our Managing Partners and Contributing Partners under the tax receivable agreement in excess of 85% of the actual aggregate cash tax savings of APO Corp. APO Corp.’s ability to achieve benefits from any tax basis increase and the payments to be made under this agreement will depend upon a number of factors, including the timing and amount of its future income.
-
81
-
In addition, the tax receivable agreement provides that, upon a merger, asset sale or other form of business combination or certain other changes of control, APO Corp.’s (or its successor’s) obligations with respect to exchanged or acquired units (whether exchanged or acquired before or after such change of control) would be based on certain assumptions, including that APO Corp. would have sufficient taxable income to fully utilize the deductions arising from the increased tax deductions and tax basis and other benefits related to entering into the tax receivable agreement. See “Item 13. Certain Relationships and Related Party Transactions-Amended and Restated Tax Receivable Agreement.”
If we were deemed an investment company under the Investment Company Act, applicable restrictions could make it impractical for us to continue our businesses as contemplated and could have a material adverse effect on our businesses and the price of our Class A shares and our Preferred shares.
We do not believe that we are an “investment company” under the Investment Company Act because the nature of our assets and the income derived from those assets allow us to rely on the exception provided by Rule 3a-1 issued under the Investment Company Act. In addition, we believe we are not an investment company under Section 3(b)(1) of the Investment Company Act because we are primarily engaged in non-investment company businesses. We intend to conduct our operations so that we will not be deemed an investment company. However, if we were to be deemed an investment company, we would be taxed as a corporation and other restrictions imposed by the Investment Company Act, including limitations on our capital structure and our ability to transact with affiliates, could make it impractical for us to continue our businesses as contemplated and would have a material adverse effect on our businesses and the price of our Class A shares and our Preferred shares.
Risks Related to Taxation
Recently enacted U.S. tax legislation may adversely affect our results of operations and cash flows and may have adverse tax consequences for certain of our Class A shareholders.
The TCJA is the most comprehensive tax legislation passed in decades and contains many significant changes to the U.S. Federal income tax laws, the consequences of which have not yet been fully determined. In particular, the TCJA makes various changes to the U.S. Federal income tax laws that significantly impact the taxation of individuals, corporations and the taxation of taxpayers with overseas assets and operations. The TCJA, among other things, reduces the corporate income tax rate from 35% to 21%, limits the deductibility of net business interest expense for most businesses to 30% of “adjusted taxable income” (which is similar to EBITDA for taxable years beginning before January 1, 2022, and similar to EBIT for taxable years beginning thereafter), limits the deduction for net operating losses generated after 2017 to 80% of taxable income, eliminates the corporate alternative minimum tax, provides for immediate deductions for certain investments instead of deductions for depreciation expense over time, changes the timing of certain income recognition, introduces a longer holding period requirement for performance fees to receive long-term capital gain treatment, denies dividends received deductions for hybrid dividends and certain interest or royalty deductions involving hybrid transactions or hybrid entities, creates a new minimum tax on certain foreign income and combats base erosion in the U.S. through a new alternative tax.
Although we expect that the reduction in the corporate tax rate from 35% to 21%, the immediate expensing of certain capital expenditures, and certain other changes introduced by the TCJA will be beneficial to us and the portfolio companies of our funds, other changes introduced by the TCJA are expected to have an adverse effect. In particular, the new provisions addressing interest deductibility may limit the amount of interest expense that is deductible for U.S. Federal income tax purposes by certain of our funds’ portfolio companies and thus increase taxes paid by such portfolio companies. In addition, introduction of the new “base erosion and anti-abuse tax” or “BEAT,” which imposes a minimum tax on certain entities that make significant deductible payments to related foreign entities may result in a material additional tax burden for certain portfolio companies owned by our funds and Athene, which may reduce cash flow and make these investments less valuable over time.
To date, the IRS has issued several notices and proposed regulations with respect to certain provisions of the TCJA, however there remains limited guidance. There are numerous interpretive issues and ambiguities that will require guidance and that are not clearly addressed in the Conference Report that accompanied the TCJA or guidance produced by the IRS to date. Technical corrections legislation will likely be needed to clarify certain of the new provisions and give proper effect to Congressional intent. There can be no assurance, however, that technical clarifications or other legislative changes that may be needed to prevent unintended or unforeseen adverse tax consequences will be enacted by Congress. We continue to examine the impact of the TCJA, but the compliance costs for us to ensure proper compliance with changes introduced by the TCJA may prove burdensome in the future and the TCJA may adversely affect our results of operations and cash flows. The impact of the TCJA on our Class A shareholders also remains uncertain but may cause adverse tax consequences for certain of our Class A shareholders.
-
82
-
We may hold or acquire certain investments in or through entities classified as PFICs or CFCs for U.S. Federal income tax purposes, which may have adverse U.S. tax consequences for certain Class A shareholders.
Certain of our investments may be in foreign corporations or may be acquired through foreign subsidiaries that would be classified as corporations for U.S. Federal income tax purposes. Such entities may be passive foreign investment companies, or “PFICs,” or controlled foreign corporations, or “CFCs,” for U.S. Federal income tax purposes. For example, APO (FC), LLC, APO (FC II), LLC and certain portfolio companies owned by our funds are considered to be CFCs for U.S. Federal income tax purposes. Class A shareholders otherwise subject to U.S. tax that indirectly own an interest in a PFIC or a CFC may experience adverse U.S. tax consequences, including the recognition of taxable income prior to the receipt of cash relating to such income. In addition, gain on the sale of a PFIC or CFC, including certain non-U.S. portfolio companies owned by our funds may be taxable at ordinary income tax rates.
The TCJA also introduced changes to the determination of when a foreign corporation is treated as a CFC and whether a U.S. shareholder of a CFC is required to include its pro rata share of certain income generated by the CFC into income currently regardless of whether the shareholder receives any related distributions of cash. Although aspects of these changes are uncertain and may be modified by regulations issued by the U.S. Treasury Department, Class A shareholders may experience adverse U.S. tax consequences as a result of our ownership of non-U.S. companies, including the recognition of taxable income attributable to such companies’ non-U.S. operations at applicable ordinary income tax rates prior to the receipt of cash relating to such income. In addition, gain generated by our sale of shares of such companies may be taxable at ordinary income tax rates rather than preferential capital gains tax rates.
As described above, the TCJA introduced a new minimum tax on “Global Intangible Low-Taxed Income” or “GILTI,” which may require certain Class A shareholders to pay tax at the highest rates applicable to ordinary income on their pro rata share of GILTI generated by certain CFCs that we own directly or indirectly prior to the receipt of cash relating to such income. Although we are still evaluating the new minimum tax imposed on GILTI and the full impact of such tax is unclear at this point, it is possible that certain Class A shareholders may be required to recognize income without the receipt of cash relating to such income.
You may be subject to U.S. Federal income tax on your share of our taxable income, regardless of whether you receive any cash distributions from us.
Under current law, so long as we are not required to register as an investment company under the Investment Company Act and 90% of our gross income for each taxable year constitutes “qualifying income” within the meaning of the Internal Revenue Code on a continuing basis, we currently expect that we will be treated, for U.S. Federal income tax purposes, as a partnership and not as an association or a publicly traded partnership taxable as a corporation. As described above, you may be subject to U.S. Federal, state, local and possibly, in some cases, foreign income taxation on your allocable share of our items of income, gain, loss, deduction and credit for each of our taxable years ending with or within your taxable year, regardless of whether or not you receive cash distributions from us. Accordingly, you may be required to make tax payments in connection with your ownership of Class A shares that significantly exceed your cash distributions in any specific year.
If we are treated as a corporation for U.S. Federal income tax purposes or state tax purposes, the impact on the value of our Class A shares is uncertain.
The value of your investment may depend in part on our company being treated as a partnership for U.S. Federal income tax purposes, which requires that 90% or more of our gross income for every taxable year consist of qualifying income, as defined in Section 7704 of the Internal Revenue Code, and that we are not required to register as an investment company under the Investment Company Act and related rules. Although we currently intend to manage our affairs so that our partnership will meet the 90% test described above in each taxable year, we may not meet these requirements or our manager may determine it is prudent to change our structure. In either case, we may be treated as a corporation for U.S. Federal income tax purposes in the future. If we were treated as a corporation for U.S. Federal income tax purposes, (i) we would become subject to corporate income tax, currently at the recently reduced rate of 21% and (ii) distributions to shareholders would be taxable as dividends for U.S. Federal income tax purposes to the extent of our earnings and profits. While our effective tax rate would likely increase and the amount of distributions to our shareholders would likely decrease as a result of our conversion to be treated as a corporation for U.S. federal income tax purposes, it is possible that the value of our Class A shares may go up as a result of our Class A shares becoming available to a more diverse investor base and being included on major stock market indices and in certain sector groupings.
Separately, because of widespread state budget deficits, several states have in the past evaluated ways to subject partnerships to entity level taxation through the imposition of state income, franchise or other forms of taxation. If any state were to impose a tax upon us as an entity, our distributions to you may be reduced and the value of our Class A shares may be affected.
-
83
-
Our structure involves complex provisions of U.S. Federal income tax law for which no clear precedent or authority may be available
.
Our structure is also subject to on-going future potential legislative, judicial
or
administrative change
and
differing interpretations, possibly on a retroactive basis.
The U.S. Federal income tax treatment of holders of Class A shares depends in some instances on determinations of fact and interpretations of complex provisions of U.S. Federal income tax law for which no clear precedent or authority may be available. In particular, there is limited guidance regarding the application and interpretation of the TCJA, as discussed above under “—
Risks Related to Taxation-Recently enacted U.S. tax legislation may materially adversely affect our results of operations and cash flows and may have adverse tax consequences for certain of our Class A shareholders
.” As a result, there is significant uncertainty regarding how the provisions of the TCJA will be interpreted, and guidance may not be forthcoming from the government. To date, the IRS has issued several notices and proposed regulations with respect to certain provisions of the TCJA, however there remains limited guidance. There can be no assurance that technical clarifications or other legislative changes that may be needed to prevent unintended or unforeseen adverse tax consequences will be enacted by Congress. Any changes to, clarifications of, or guidance under the TCJA could have an adverse effect on our results of operations or the value of our Class A shares.
You should also be aware that the U.S. Federal income tax rules are constantly under review by persons involved in the legislative process, the IRS and the U.S. Department of the Treasury, frequently resulting in revised interpretations of established concepts, statutory changes, revisions to regulations and other modifications and interpretations. The IRS pays close attention to the proper application of tax laws to partnerships and entities taxed as partnerships. The present U.S. Federal income tax treatment of an investment in our Class A shares may be modified by administrative, legislative or judicial interpretation at any time, and any such action may affect investments and commitments previously made. Changes to the U.S. Federal income tax laws and interpretations thereof could make it more difficult or impossible to meet the exception for us to be treated as a partnership for U.S. Federal income tax purposes that is not taxable as a corporation, affect or cause us to change our investments and commitments, affect the tax considerations of an investment in us, change the character or treatment of portions of our income (including, for instance, the treatment of performance fees short-term capital gain or as ordinary income rather than long-term capital gain) and adversely affect an investment in our Class A shares. In addition, it is possible that future legislation increases the U.S. federal income tax rates applicable to corporations again. No prediction can be made as to whether any particular proposed legislation will be enacted or, if enacted, what the specific provisions or the effective date of any such legislation would be, or whether it would have any effect on us. As such, we cannot assure you that future legislative, administrative or judicial developments will not result in an increase in the amount of U.S. tax payable by us, our funds, portfolio companies owned by our funds or by investors in our Class A shares. If any such developments occur, our business, results of operation and cash flows could be adversely affected and such developments could have an adverse effect on your investment in our Class A shares.
Our operating agreement permits our manager to modify our operating agreement from time to time, without the consent of the holders of Class A shares, to address certain changes in U.S. Federal income tax regulations, legislation or interpretation. In some circumstances, such revisions could have an adverse impact on some or all holders of Class A shares. For instance, as discussed above, our manager could elect at some point to treat us as an association taxable as a corporation for U.S. Federal (and applicable state) income tax purposes. If our manager were to do this, the U.S. Federal income tax consequences of owning our Class A shares would be materially different. Moreover, we will apply certain assumptions and conventions in an attempt to comply with applicable rules and to report income, gain, deduction, loss and credit to holders of Class A shares in a manner that reflects such beneficial ownership of items by holders of Class A shares, taking into account variation in ownership interests during each taxable year because of trading activity. However, those assumptions and conventions may not be in compliance with all aspects of applicable tax requirements. It is possible that the IRS will assert successfully that the conventions and assumptions used by us do not satisfy the technical requirements of the Internal Revenue Code and/or U.S. Department of the Treasury regulations and could require that items of income, gain, deductions, loss or credit, including interest deductions, be adjusted, reallocated or disallowed in a manner that adversely affects holders of Class A shares.
Our interests in certain of our businesses are held through entities that are treated as corporations for U.S. Federal income tax purposes; such corporations may be liable for significant taxes and may create other adverse tax consequences, which could potentially adversely affect the value of your investment.
In light of the publicly traded partnership rules under U.S. Federal income tax law and other requirements, we currently hold our interests in certain of our businesses through entities that are treated as corporations for U.S. Federal income tax purposes. Each such corporation could be liable for significant U.S. Federal income taxes and applicable state, local and other taxes that would not otherwise be incurred, which could adversely affect the value of your investment. Furthermore, it is possible that the IRS could challenge the manner in which such corporation’s taxable income is computed by us.
-
84
-
Changes in U.S. and foreign tax law could adversely affect our ability to raise funds from certain investors.
Under the Foreign Account Tax Compliance Act, or “FATCA”, certain U.S. withholding agents, or USWAs, foreign financial institutions, or “FFIs”, and non-financial foreign entities, or “NFFEs”, are required to report information about offshore accounts and investments to the U.S. or their local taxing authorities annually. In response to this legislation, various foreign governments have entered into Intergovernmental Agreements, or “IGAs”, with the U.S. Government and some have enacted similar legislation.
In order to meet these regulatory obligations, Apollo is required to register FFIs with the IRS, evaluate internal FATCA procedures, expand the review of investor Anti-Money Laundering/Know Your Customer requirements and tax forms, evaluate the FATCA offerings by third-party administrators and ensure that Apollo is prepared for the new global tax and information reporting requirements created under the U.S. and Non-U.S. FATCA regimes like the Common Reporting Standards (“CRS”).
Further, FATCA as well as Chapters 3 and 61 of the Internal Revenue Code, require Apollo to collect new IRS Tax Forms (W-9 and W-8 series), and, in some cases, Cayman Self-Certifications and other supporting documentation from their investors. Similarly, CRS requires Apollo to collect CRS Self-Certifications. Apollo has undertaken efforts to re-paper their pre-existing investors and new investors.
Failure to meet these regulatory requirements could expose Apollo and/or its investors to a punitive withholding tax of 30% on certain U.S. payments and possibly limit their ability to open bank accounts and secure funding the global capital markets. Beginning in 2019, a 30% withholding tax applies to the gross proceeds from the sale of U.S. stocks and securities. Recently proposed regulations were issued eliminating withholding on the payments of gross proceeds and further delaying the effective date of foreign pass-thru payment withholding, however aspects of these changes are uncertain and may be modified by regulations issued by the U.S. Treasury Department. The reporting obligations imposed under FATCA require FFIs to comply with agreements with the IRS to obtain and disclose information about certain investors to the IRS. The administrative and economic costs of compliance with FATCA may discourage some investors from investing in U.S. funds, which could adversely affect our ability to raise funds from these investors. Like FATCA, CRS imposes reporting obligations on Financial Institutions (“FIs”) not residents in the United States, but CRS does not impose withholding tax obligations. Compliance with CRS and other similar regimes could result in increased administrative and compliance costs and could subject our investment entities to increased non-U.S. withholding taxes.
Complying with certain tax-related requirements may cause us to forego otherwise attractive business or investment opportunities or enter into acquisitions, borrowings, financings or arrangements we may not have otherwise entered into.
In order for us to be treated as a partnership for U.S. Federal income tax purposes, and not as an association or publicly traded partnership taxable as a corporation, we must meet the qualifying income exception discussed above on a continuing basis and we must not be required to register as an investment company under the Investment Company Act. In order to effect such treatment we (or our subsidiaries) may be required to invest through foreign or domestic corporations, forego attractive business or investment opportunities or enter into borrowings or financings we may not have otherwise entered into. This may cause us to incur additional tax liability and/or adversely affect our ability to operate solely to maximize our cash flow. Our structure also may impede our ability to engage in certain corporate acquisitive transactions because we generally intend to hold all of our assets through the Apollo Operating Group. In addition, we may be unable to participate in certain corporate reorganization transactions that would be tax free to our holders if we were a corporation. To the extent we hold assets other than through the Apollo Operating Group, we will make appropriate adjustments to the Apollo Operating Group agreements so that distributions to Holdings and us would be the same as if such assets were held at that level.
Tax gain or loss on disposition of our Class A shares could be more or less than expected.
If you sell your Class A shares, you will recognize a gain or loss equal to the difference between the amount realized and your adjusted tax basis allocated to those Class A shares. Prior distributions to you in excess of the total net taxable income allocated to you will have decreased the tax basis in your Class A shares. Therefore, such excess distributions will increase your taxable gain, or decrease your taxable loss, when the Class A shares are sold and may result in a taxable gain even if the sale price is less than the original cost. A portion of the amount realized, whether or not representing a gain, may be ordinary income to you.
We cannot match transferors and transferees of Class A shares, and we have therefore adopted certain income tax accounting conventions that may not conform with all aspects of applicable tax requirements
.
The IRS may challenge this treatment, which could adversely affect the value
of
our Class A shares.
Because we cannot match transferors and transferees of Class A shares, we have adopted depreciation, amortization and other tax accounting positions that may not conform with all aspects of existing U.S. Department of the Treasury regulations. A
-
85
-
successful IRS challenge to those positions could adversely affect the amount of tax benefits available to holders of Class A shares. It also could affect the timing of these tax benefits or the amount of gain on the sale of Class A shares and could have a negative impact on the value of Class A shares or result in audits of and adjustments to the tax returns of holders of Class A shares.
In addition, our taxable income and losses will be determined and apportioned among investors using conventions we regard as consistent with applicable law. As a result, if you transfer your Class A shares, you may be allocated income, gain, loss and deduction realized by us after the date of transfer. Similarly, a transferee may be allocated income, gain, loss and deduction realized by us prior to the date of the transferee’s acquisition of our Class A shares. A transferee may also bear the cost of withholding tax imposed with respect to income allocated to a transferor through a reduction in the cash distributed to the transferee.
Non-U.S. persons face unique U.S. tax issues from owning Class A shares that may result in adverse tax consequences to them.
In light of our investment activities, we may be, or may become, engaged in a U.S. trade or business for U.S. Federal income tax purposes, in which case some portion of our income would be treated as effectively connected income with respect to non-U.S. holders of our Class A shares, or “ECI.” Moreover, dividends paid by an investment that we make in a real estate investment trust, or “REIT,” that are attributable to gains from the sale of U.S. real property interests and sales of certain investments in interests in U.S. real property, including stock of certain U.S. corporations owning significant U.S. real property, may be treated as ECI with respect to non-U.S. holders of our Class A shares. In addition, certain income of non-U.S. holders from U.S. sources not connected to any U.S. trade or business conducted by us could be treated as ECI. To the extent our income is treated as ECI, each non-U.S. holder generally would be subject to withholding tax on its allocable share of such income, would be required to file a U.S. Federal income tax return for such year reporting its allocable share of income effectively connected with such trade or business and any other income treated as ECI, and would be subject to U.S. Federal income tax at regular U.S. tax rates on any such income (state and local income taxes and filings may also apply in that event). Non-U.S. holders that are corporations may also be subject to a 30% branch profits tax on their allocable share of such income. In addition, certain income from U.S. sources that is not ECI allocable to non-U.S. holders may be reduced by withholding taxes imposed at the highest effective applicable tax rate.
As a result of new rules introduced by the TCJA, if we are treated as engaged (directly or indirectly) in a trade or business within the United States, any gain realized by a non-U.S. holder from the sale or exchange of Class A shares would constitute ECI to the extent such holder’s distributive share of the amount of gain would have been treated as ECI if we had sold all of our assets at their fair market value as of the date of the sale or exchange of such Class A share. Furthermore, the transferee of such Class A shares may be required to deduct and withhold a tax equal to 10% of the amount realized (or deemed realized) on the sale or exchange such Class A shares. If the transferee fails to withhold the required amount, we may be required to deduct and withhold from distributions to the transferee a tax in an amount equal to the amount the transferee failed to withhold (plus interest on such amount). Even if a non-U.S. holder disposes of its Class A shares in a transaction that otherwise qualifies as a non-recognition transaction, such non-U.S. holder may recognize gain and be subject to the withholding if we are treated as engaged in a U.S. trade or business. The TCJA provides that the U.S. Treasury Department has the regulatory authority to prescribe circumstances in which certain non-recognition provisions will continue to apply to defer the recognition of gain. In addition, the IRS recently released a notice suspending the withholding requirements described above for shares of publicly traded partnerships, such as us, and providing several exceptions to this 10% withholding tax that may or may not apply with respect to a non-U.S. holder’s transfer of its Class A shares, until such time as regulations or other guidance have been issued. As a result, it is unclear how this provision may impact transfers of Class A shares in the future.
An investment in Class A shares will give rise to UBTI to certain tax-exempt holders.
We will not make investments through taxable U.S. corporations solely for the purpose of limiting unrelated business taxable income (“UBTI”) from “debt-financed” property and, thus, an investment in Class A shares will give rise to UBTI to tax-exempt holders of Class A shares. For example, APO Asset Co., LLC will hold interests in entities treated as partnerships, or otherwise subject to tax on a flow-through basis, that will incur indebtedness. Moreover, if the IRS successfully asserts that we are engaged in a trade or business, then additional amounts of income could be treated as UBTI.
Under new rules introduced by the TCJA, a tax-exempt holder will be required to calculate UBTI separately with respect to each trade or business in which it has an interest and will not be able to use a net operating loss from one trade or business to offset UBTI from another trade or business. Accordingly, losses generated by one operating pass-through entity, in which such tax-exempt holder has an interest, may not be used to reduce UBTI generated by another operating pass-through entity in which such tax-exempt holder has an interest, and such loss must instead be carried forward to subsequent years to offset UBTI generated by the same operating pass-through entity. The use of a net operating loss arising in a taxable year beginning before January 1, 2018, is not subject to such limitation. For these purposes, the IRS recently issued a notice that permits tax-exempt organizations to aggregate their investments in partnerships and treat them as one trade or business if certain de minimis or control requirements are satisfied with respect to the relevant partnership.
-
86
-
We do not intend to make, or cause to be made, an election under Section 754 of the Internal Revenue Code to adjust our asset basis or the asset basis of certain of the Apollo Operating Group Partnerships
.
Thus, a holder
of Class A shares could be allocated more taxable income in respect
of
those Class A shares prior to disposition than if such an election were made.
We did not make and currently do not intend to make, or cause to be made, an election to adjust asset basis under Section 754 of the Internal Revenue Code with respect to Apollo Principal Holdings I, L.P., Apollo Principal Holdings II, L.P., Apollo Principal Holdings III, L.P., Apollo Principal Holdings IV, L.P., Apollo Principal Holdings V, L.P., Apollo Principal Holdings VI, L.P., Apollo Principal Holdings VII, L.P., Apollo Principal Holdings VIII, L.P., Apollo Principal Holdings IX, L.P., Apollo Principal Holdings X, L.P., Apollo Principal Holdings XI, LLC and Apollo Principal Holdings XII, L.P. If no such election is made, there will generally be no adjustment for a transferee of Class A shares even if the purchase price of those Class A shares is higher than the Class A shares’ share of the aggregate tax basis of our assets immediately prior to the transfer. In that case, on a sale of an asset, gain allocable to a transferee could include built-in gain allocable to the transferor at the time of the transfer, which built-in gain would otherwise generally be eliminated if a Section 754 election had been made.
Class A shareholders may be subject to foreign, state and local taxes and return filing requirements as a result of investing in our Class A shares.
In addition to U.S. Federal income taxes, our Class A shareholders may be subject to other taxes, including foreign, state and local taxes, unincorporated business taxes and estate, inheritance or intangible taxes that are imposed by the various jurisdictions in which we do business or own property now or in the future, even if our Class A shareholders do not reside in any of those jurisdictions. Our Class A shareholders may also be required to file foreign, state and local income tax returns and pay state and local income taxes in some or all of these jurisdictions. As a result of the TCJA, for Class A shareholders that are non-corporate U.S. shareholders, the deductibility of foreign, state and local taxes will be subject to substantial limitations for taxable years 2018 through 2025. Further, Class A shareholders may be subject to penalties for failure to comply with those requirements. It is the responsibility of each Class A shareholder to file all U.S. Federal, foreign, state and local tax returns that may be required of such Class A shareholder.
We may not be able to furnish to each Class A shareholder specific tax information within 90 days after the close of each calendar year, which means that holders of Class A shares who are U.S. taxpayers should anticipate the need to file annually a request for an extension of the due date of their income tax return
.
In addition, it is possible that Class A shareholders may be required to file amended income tax returns.
As a publicly traded partnership, our operating results, including distributions of income, dividends, gains, losses or deductions and adjustments to carrying basis, will be reported on Schedule K-1 and distributed to each Class A shareholder annually. It may require longer than 90 days after the end of our fiscal year to obtain the requisite information from all lower-tier entities so that K-1s may be prepared for us. For this reason, Class A shareholders who are U.S. taxpayers should anticipate the need to file annually with the IRS (and certain states) a request for an extension past April 15 or the otherwise applicable due date of their income tax return for the taxable year.
In addition, it is possible that a Class A shareholder will be required to file amended income tax returns as a result of adjustments to items on the corresponding income tax returns of the partnership. Any obligation for a Class A shareholder to file amended income tax returns for that or any other reason, including any costs incurred in the preparation or filing of such returns, are the responsibility of each Class A shareholder.
You may be subject to an additional U.S. Federal income tax on net investment income allocated to you by us and on gain on the sale of the Class A shares.
Individuals, estates and trusts are currently subject to an additional 3.8% tax on “net investment income” (or undistributed “net investment income,” in the case of estates and trusts) for each taxable year, with such tax applying to the lesser of such income or the excess of such person’s adjusted gross income (with certain adjustments) over a specified amount. Net investment income includes net income from interest, dividends, annuities, royalties and rents and net gain attributable to the disposition of investment property. It is anticipated that net income and gain attributable to an investment in us will be included in a holder of the Class A share’s “net investment income” subject to this additional tax.
We may be liable for adjustments to our tax returns as a result of partnership audit legislation that has recently become effective.
Legislation enacted in 2015 and effective the 2018 taxable year significantly changes the rules for U.S. Federal income tax audits of partnerships. Such audits will continue to be conducted at the partnership level, but with respect to tax returns for taxable years beginning after December 31, 2017, any adjustments to the amount of tax due (including interest and penalties) will be payable by the partnership rather than the partners of such partnership unless the partnership qualifies for and affirmatively
-
87
-
elects an alternative procedure. In general, under the default procedures, taxes imposed on us would be assessed at the highest rate of tax applicable for the reviewed year and determined without regard to the character of the income or gain, the tax status of our shareholders or the benefit of any shareholder-level tax attributes (that could otherwise reduce any tax due).
Under the elective alternative procedure, we would issue information returns to persons who were shareholders in the audited year, who would then be required to take the adjustments into account in calculating their own tax liability, and we would not be liable for the adjustments to the amount of tax due (including interest and penalties). The Treasury recently released final regulations relating to the elective alternative procedure mechanics, which resolved several uncertain aspects of these mechanics, however aspects of these changes remain unclear. Our manager has discretion whether or not to make use of this elective alternative procedure and has not yet determined whether or to what extent the election will be available or appropriate.
|
ITEM 1B.
|
UNRESOLVED STAFF COMMENTS
|
None.
|
ITEM 2.
|
PROPERTIES
|
Our principal executive offices are located in leased office space at 9 West 57th Street, New York, New York 10019. We also lease the space for our offices in New York, Los Angeles, San Diego, Houston, Bethesda, London, Frankfurt, Madrid, Luxembourg, Mumbai, Delhi, Singapore, Hong Kong, Shanghai and Tokyo. We do not own any real property. We consider these facilities to be suitable and adequate for the management and operation of our businesses.
|
ITEM 3.
|
LEGAL PROCEEDINGS
|
See note
15
to our
consolidated
financial statements for a summary of the Company’s legal proceedings.
|
ITEM 4.
|
MINE SAFETY DISCLOSURES
|
Not applicable.
|
ITEM
5
.
|
MARKET FOR REGISTRANT'S COMMON EQUITY, RELATED STOCKHOLDER MATTERS AND ISSUER PURCHASES OF EQUITY SECURITIES
|
Our Class A shares are traded on the NYSE under the symbol “APO.” Our Class A shares began trading on the NYSE on March 30, 2011.
The number of holders of record of our Class A shares as of
February 26, 2019
was
142
. This does not include the number of shareholders that hold shares in “street name” through banks or broker-dealers. As of
February 26, 2019
, there was 1 holder of our Class B share.
Cash Distribution Policy
The quarterly cash distributions paid to our Class A shareholders can be found in note
13
to our consolidated financial statements. We have declared an additional cash distribution of
$0.56
per Class A share in respect of the
fourth
quarter of
2018
which will be paid on
February 28, 2019
to holders of record of Class A shares at the close of business on
February 21, 2019
.
Distributable Earnings (“DE”), as well as DE After Taxes and Related Payables are derived from our segment reported results, and are supplemental non-U.S. GAAP measures to assess performance and the amount of earnings available for distribution to Class A shareholders, holders of RSUs that participate in distributions and holders of AOG Units. DE represents the amount of net realized earnings without the effects of the consolidation of any of the related funds. DE, which is a component of Economic Income (“EI”), is the sum across all segments of (i) total management fees and advisory and transaction fees, (ii) other income (loss), (iii) realized performance fees, excluding realizations received in the form of shares and (iv) realized investment income, less (x) compensation expense, excluding the expense related to equity-based awards, (y) realized profit sharing expense, and (z) non-compensation expenses, excluding depreciation and amortization expense. DE After Taxes and Related Payables represents DE less estimated current corporate, local and non-U.S. taxes as well as the payable under Apollo’s tax receivable agreement. DE After Taxes and Related Payables is net of preferred distributions, if any, to Series A and Series B Preferred shareholders.
-
88
-
Subject to certain exceptions, unless distributions have been declared and paid or declared and set apart for payment on the Series A Preferred shares for a quarterly distribution period, during the remainder of that distribution period, we may not declare or pay or set apart payment for distributions on any Class A shares and any other equity securities that the Company may issue in the future ranking, as to the payment of distributions, junior to our Series A Preferred shares and we may not repurchase any such junior shares. See “Risk Factors—Risks Related to Our Class A Shares and Our Preferred Shares—We cannot assure you that our intended quarterly distributions will be paid such quarter or at all.”
Our current intention is to distribute to our Class A shareholders on a quarterly basis substantially all of our Distributable Earnings attributable to Class A shareholders, in excess of amounts determined by our manager to be necessary or appropriate to provide for the conduct of our businesses, to make appropriate investments in our businesses and our funds, to comply with applicable law, any of our debt instruments or other agreements, or to provide for future distributions to our Class A shareholders for any ensuing quarter. Because we will not know what our actual available cash flow from operations will be for any year until sometime after the end of such year, our fourth quarter distribution may be adjusted to take into account actual net after-tax cash flow from operations for that year.
The declaration, payment and determination of the amount of our quarterly distribution will be at the sole discretion of our manager, which may change our cash distribution policy at any time. We cannot assure you that any distributions, whether quarterly or otherwise, will or can be paid. In making decisions regarding our quarterly distribution, our manager will take into account general economic and business conditions, our strategic plans and prospects, our businesses and investment opportunities, our financial condition and operating results, working capital requirements and anticipated cash needs, contractual restrictions and obligations, legal, tax and regulatory restrictions, restrictions and other implications on the payment of distributions by us to our common shareholders or by our subsidiaries to us and such other factors as our manager may deem relevant.
Because we are a holding company that owns intermediate holding companies, the funding of each distribution, if declared, will occur in three steps, as follows.
|
•
|
First
, we will cause one or more entities in the Apollo Operating Group to make a distribution to all of its partners or members (as applicable), including our wholly-owned subsidiaries APO Corp., APO Asset Co., LLC, APO (FC), LLC, APO (FC II), LLC, APO UK (FC), Limited and APO (FC III), LLC (as applicable), and Holdings, on a pro rata basis;
|
|
•
|
Second
, we will cause our intermediate holding companies, APO Corp., APO Asset Co., LLC, APO (FC), LLC, APO (FC II), LLC, APO UK (FC), Limited and APO (FC III), LLC (as applicable), to distribute to us, from their net after-tax proceeds, amounts equal to the aggregate distribution we have declared; and
|
|
•
|
Third
, we will distribute the proceeds received by us to our Class A shareholders on a pro rata basis.
|
Payments that any of our intermediate holding companies make under the tax receivable agreement will reduce amounts that would otherwise be available for distribution by us on our Class A shares. See note
14
to our
consolidated
financial statements for information regarding the tax receivable agreement.
Under Delaware law we are prohibited from making a distribution to the extent that our liabilities, after such distribution, exceed the fair value of our assets. Our operating agreement does not contain any restrictions on our ability to make distributions, except that we may only distribute Class A shares to holders of Class A shares. The debt arrangements, as described in note
10
to our
consolidated
financial statements, do not contain restrictions on our or our subsidiaries' ability to pay distributions; however, instruments governing indebtedness that we or our subsidiaries incur in the future may contain restrictions on our or our subsidiaries' ability to pay distributions or make other cash distributions to equity holders.
In addition, the Apollo Operating Group’s cash flow from operations may be insufficient to enable it to make tax distributions to its partners, in which case the Apollo Operating Group may have to borrow funds or sell assets, and thus our liquidity and financial condition could be materially adversely affected. Furthermore, by paying cash distributions rather than investing that cash in our businesses, we might risk slowing the pace of our growth, or not having a sufficient amount of cash to fund our operations, new investments or unanticipated capital expenditures, should the need arise.
Our cash distribution policy has certain risks and limitations, particularly with respect to liquidity. Although we expect to pay distributions according to our cash distribution policy, we may not pay distributions according to our policy, or at all, if, among other things, we do not have the cash necessary to pay the intended distributions.
As of
December 31, 2018
, approximately
9.8 million
RSUs granted to Apollo employees (net of forfeited awards) were entitled to distribution equivalents, which are paid in cash.
-
89
-
Securities Authorized for Issuance Under Equity Compensation Plans
See the table under “Securities Authorized for Issuance Under Equity Compensation Plans” set forth in “Item 12. Security Ownership of Certain Beneficial Owners and Management and Related Stockholder Matters.”
Unregistered Sale of Equity Securities
On
November 2, 2018
,
November 15, 2018
,
November 16, 2018
and
November 29, 2018
, we issued
156,907
,
253,694
,
10,833
, and
758
Class A shares, respectively, net of taxes to Apollo Management Holdings, L.P., a subsidiary of Apollo Global Management, LLC, in connection with issuances of shares to participants in the 2007 Equity Plan for an aggregate purchase price of
$4.8 million
,
$7.6 million
,
$0.3 million
and
$21.5 thousand
, respectively. The issuance was exempt from registration under the Securities Act in accordance with Section 4(a)(2) and Rule 506(b) thereof, as transactions by the issuer not involving a public offering. We determined that the purchaser of Class A shares in the transactions, Apollo Management Holdings, L.P., was an accredited investor.
Issuer Purchases of Equity Securities
The following table sets forth purchases of our Class A shares made by us or on our behalf during the fiscal quarter ended
December 31, 2018
.
|
Period
|
|
Number of Class A Shares Purchased
(1)
|
Average Price
Paid per Share |
Class A Shares Purchased as Part of Publicly Announced Plans or Programs
(2)
|
Approximate Dollar Value of Class A Shares that May be Purchased Under the Plan or Programs
|
|||||||||
|
October 1, 2018 through October 31, 2018
|
—
|
|
$
|
—
|
|
—
|
|
$
|
76,007,061
|
|
||||
|
November 1, 2018 through November 30, 2018
|
300,000
|
|
30.17
|
|
36,571
|
|
74,903,714
|
|
||||||
|
December 1, 2018 through December 31, 2018
|
—
|
|
—
|
|
—
|
|
74,903,714
|
|
||||||
|
Total
|
300,000
|
|
36,571
|
|
||||||||||
|
(1)
|
Certain Apollo employees receive a portion of the profit sharing proceeds of certain funds in the form of (a) restricted Class A shares of AGM that they are required to purchase with such proceeds or (b) RSUs, in each case which equity-based awards generally vest over three years. These equity-based awards are granted under the Company's 2007 Equity Plan. To prevent dilution on account of these awards, Apollo may, in its discretion, repurchase Class A shares on the open market and retire them. During the three months ended
December 31, 2018
, we repurchased
263,429
Class A shares at an average price paid per share of
$30.17
in open-market transactions not pursuant to a publicly-announced repurchase plan or program on account of these awards. See note
13
for further information on Class A shares.
|
|
(2)
|
Pursuant to a publicly announced share repurchase program, the Company is authorized to repurchase up to
$500 million
in the aggregate of its Class A shares, including through the repurchase of outstanding Class A shares and through a reduction of Class A shares to be issued to employees to satisfy associated tax obligations in connection with the settlement of equity-based awards granted under the 2007 Equity Plan (or any successor equity plan thereto). Class A shares may be repurchased from time to time in open market transactions, in privately negotiated transactions, pursuant to a trading plan adopted in accordance with Rule 10b5-1 of the Exchange Act, or otherwise, with the size and timing of these repurchases depending on legal requirements, price, market and economic conditions and other factors. The Company is not obligated under the terms of the program to repurchase any of its Class A shares. The repurchase program has no expiration date and may be suspended or terminated by the Company at any time without prior notice. Class A shares repurchased as part of this program are canceled by the Company. Reductions of Class A shares issued to employees to satisfy associated tax obligations in connection with the settlement of equity-based awards granted under the 2007 Equity Plan are not included in the table.
|
|
ITEM 6.
|
SELECTED FINANCIAL DATA
|
The following selected historical consolidated and other data of Apollo Global Management, LLC should be read together with “Item
7
. Management’s Discussion and Analysis of Financial Condition and Results of Operations” and the historical financial statements and related notes included in “Item
8
. Financial Statements and Supplementary Data.”
The selected historical consolidated statements of operations data of Apollo Global Management, LLC for each of the years ended
December 31, 2018
,
2017
and
2016
and the selected historical consolidated statements of financial condition data as of
December 31, 2018
and
2017
have been derived from our audited consolidated financial statements which are included in “Item
8
. Financial Statements and Supplementary Data.”
We derived the selected historical consolidated statements of operations data of Apollo Global Management, LLC for the years ended
December 31, 2015
and
2014
and the selected consolidated statements of financial condition data as of
December 31, 2016
,
2015
and
2014
from our audited consolidated financial statements which are not included in this report.
-
90
-
|
|
For the Years Ended December 31,
|
||||||||||||||||||
|
|
2018
|
2017
(1)
|
2016
(1)
|
2015
(1)
|
2014
(1)
|
||||||||||||||
|
|
(in thousands, except per share data)
|
||||||||||||||||||
|
Statement of Operations Data
|
|||||||||||||||||||
|
Revenues:
|
|||||||||||||||||||
|
Management fees
|
$
|
1,345,252
|
|
$
|
1,154,925
|
|
$
|
1,043,513
|
|
$
|
930,194
|
|
$
|
850,441
|
|
||||
|
Advisory and transaction fees, net
|
112,278
|
|
117,624
|
|
146,665
|
|
14,186
|
|
315,587
|
|
|||||||||
|
Investment income (loss):
|
|||||||||||||||||||
|
Performance allocations
|
(400,305
|
)
|
1,306,193
|
|
712,865
|
|
45,079
|
|
365,399
|
|
|||||||||
|
Principal investment income
|
5,122
|
|
161,630
|
|
103,178
|
|
14,855
|
|
53,856
|
|
|||||||||
|
Total investment income (loss)
|
(395,183
|
)
|
1,467,823
|
|
816,043
|
|
59,934
|
|
419,255
|
|
|||||||||
|
Incentive fees
|
30,718
|
|
31,431
|
|
67,341
|
|
52,211
|
|
28,656
|
|
|||||||||
|
Total Revenues
|
1,093,065
|
|
2,771,803
|
|
2,073,562
|
|
1,056,525
|
|
1,613,939
|
|
|||||||||
|
Expenses:
|
|||||||||||||||||||
|
Compensation and benefits:
|
|||||||||||||||||||
|
Salary, bonus and benefits
|
459,604
|
|
428,882
|
|
389,130
|
|
354,524
|
|
338,049
|
|
|||||||||
|
Equity-based compensation
|
173,228
|
|
91,450
|
|
102,983
|
|
97,676
|
|
126,320
|
|
|||||||||
|
Profit sharing expense
|
(57,833
|
)
|
515,073
|
|
357,074
|
|
85,229
|
|
276,190
|
|
|||||||||
|
Total compensation and benefits
|
574,999
|
|
1,035,405
|
|
849,187
|
|
537,429
|
|
740,559
|
|
|||||||||
|
Interest expense
|
59,374
|
|
52,873
|
|
43,482
|
|
30,071
|
|
22,393
|
|
|||||||||
|
General, administrative and other
|
266,444
|
|
257,858
|
|
247,000
|
|
255,061
|
|
265,189
|
|
|||||||||
|
Placement fees
|
2,122
|
|
13,913
|
|
26,249
|
|
8,414
|
|
15,422
|
|
|||||||||
|
Total Expenses
|
902,939
|
|
1,360,049
|
|
1,165,918
|
|
830,975
|
|
1,043,563
|
|
|||||||||
|
Other Income (Loss):
|
|||||||||||||||||||
|
Net gains (losses) from investment activities
|
(186,449
|
)
|
95,104
|
|
139,721
|
|
121,723
|
|
213,243
|
|
|||||||||
|
Net gains from investment activities of consolidated variable interest entities
|
45,112
|
|
10,665
|
|
5,015
|
|
19,050
|
|
22,564
|
|
|||||||||
|
Interest income
|
20,654
|
|
6,421
|
|
4,072
|
|
3,232
|
|
10,392
|
|
|||||||||
|
Other income, net
|
35,829
|
|
245,640
|
|
4,562
|
|
7,673
|
|
60,592
|
|
|||||||||
|
Total Other Income (Loss)
|
(84,854
|
)
|
357,830
|
|
153,370
|
|
151,678
|
|
306,791
|
|
|||||||||
|
Income before income tax provision
|
105,272
|
|
1,769,584
|
|
1,061,014
|
|
377,228
|
|
877,167
|
|
|||||||||
|
Income tax provision
|
(86,021
|
)
|
(325,945
|
)
|
(90,707
|
)
|
(26,733
|
)
|
(147,245
|
)
|
|||||||||
|
Net Income
|
19,251
|
|
1,443,639
|
|
970,307
|
|
350,495
|
|
729,922
|
|
|||||||||
|
Net income attributable to Non-Controlling Interests
|
(29,627
|
)
|
(814,535
|
)
|
(567,457
|
)
|
(215,998
|
)
|
(561,693
|
)
|
|||||||||
|
Net Income (Loss) Attributable to Apollo Global Management, LLC
|
(10,376
|
)
|
629,104
|
|
402,850
|
|
134,497
|
|
168,229
|
|
|||||||||
|
Net income attributable to Series A Preferred Shareholders
|
(17,531
|
)
|
(13,538
|
)
|
—
|
|
—
|
|
—
|
|
|||||||||
|
Net income attributable to Series B Preferred Shareholders
|
(14,131
|
)
|
—
|
|
—
|
|
—
|
|
—
|
|
|||||||||
|
Net Income (Loss) Attributable to Apollo Global Management, LLC Class A Shareholders
|
$
|
(42,038
|
)
|
$
|
615,566
|
|
$
|
402,850
|
|
$
|
134,497
|
|
$
|
168,229
|
|
||||
|
Distributions Declared per Class A Share
|
$
|
1.93
|
|
$
|
1.85
|
|
$
|
1.25
|
|
$
|
1.96
|
|
$
|
3.11
|
|
||||
|
Net Income (Loss) Available to Class A Share – Basic
|
$
|
(0.30
|
)
|
$
|
3.12
|
|
$
|
2.11
|
|
$
|
0.61
|
|
$
|
0.62
|
|
||||
|
Net Income (Loss) Available to Class A Share – Diluted
|
$
|
(0.30
|
)
|
$
|
3.10
|
|
$
|
2.11
|
|
$
|
0.61
|
|
$
|
0.62
|
|
||||
|
|
For the Years Ended December 31,
|
||||||||||||||||||
|
|
2018
|
2017
(1)
|
2016
(1)
|
2015
(1)
|
2014
(1)
|
||||||||||||||
|
|
(in thousands)
|
||||||||||||||||||
|
Statement of Financial Condition Data
|
|||||||||||||||||||
|
Total assets
|
$
|
5,991,654
|
|
$
|
6,991,070
|
|
$
|
5,629,553
|
|
$
|
4,559,808
|
|
$
|
23,172,788
|
|
||||
|
Debt (excluding obligations of consolidated variable interest entities)
|
1,360,448
|
|
1,362,402
|
|
1,352,447
|
|
1,025,255
|
|
1,027,965
|
|
|||||||||
|
Debt obligations of consolidated variable interest entities
|
855,461
|
|
1,002,063
|
|
786,545
|
|
801,270
|
|
14,123,100
|
|
|||||||||
|
Total shareholders’ equity
|
2,451,840
|
|
2,897,796
|
|
1,867,528
|
|
1,388,981
|
|
5,943,461
|
|
|||||||||
|
Total Non-Controlling Interests
|
1,075,644
|
|
1,434,870
|
|
1,032,412
|
|
739,476
|
|
4,156,979
|
|
|||||||||
-
91
-
|
(1)
|
Apollo adopted new revenue recognition accounting guidance during the
year ended
December 31, 2018
on a modified retrospective basis. The adoption did not impact periods prior to 2018. However, in conjunction with the adoption of the new revenue recognition accounting guidance, the Company implemented a change in accounting principle for performance allocations on a full retrospective basis which did impact presentation of various line items within the statements of operations and financial condition in all periods presented. See note
2
to the consolidated financial statements for details regarding the Company’s adoption of the new revenue recognition accounting guidance and change in accounting principle.
|
|
ITEM
7
.
|
MANAGEMENT’S DISCUSSION AND ANALYSIS OF FINANCIAL CONDITION AND RESULTS OF OPERATIONS
|
The following discussion should be read in conjunction with Apollo Global Management, LLC’s consolidated financial statements and the related notes as of December 31, 2018 and 2017 and for the years ended December 31, 2018, 2017 and 2016. This discussion contains forward-looking statements that are subject to known and unknown risks and uncertainties. Actual results and the timing of events may differ significantly from those expressed or implied in such forward-looking statements due to a number of factors, including those included in the section of this report entitled “Item 1A. Risk Factors.” The highlights listed below have had significant effects on many items within our consolidated financial statements and affect the comparison of the current period’s activity with those of prior periods.
General
Our Businesses
Founded in 1990, Apollo is a leading global alternative investment manager. We are a contrarian, value-oriented investment manager in credit, private equity and real assets with significant distressed expertise and a flexible mandate in the majority of our funds which enables our funds to invest opportunistically across a company’s capital structure. We raise, invest and manage funds on behalf of some of the world’s most prominent pension, endowment and sovereign wealth funds as well as other institutional and individual investors. Apollo is led by our Managing Partners, Leon Black, Joshua Harris and Marc Rowan, who have worked together for more than
32
years and lead a team of
1,143
employees, including
410
investment professionals, as of
December 31, 2018
.
Apollo conducts its business primarily in the United States and substantially all of its revenues are generated domestically. These businesses are conducted through the following three reportable segments:
|
(i)
|
Credit
—primarily invests in non-control corporate and structured debt instruments including performing, stressed and distressed instruments across the capital structure;
|
|
(ii)
|
Private equity
—primarily invests in control equity and related debt instruments, convertible securities and distressed debt instruments; and
|
|
(iii)
|
Real assets
—primarily invests in real estate equity and infrastructure equity for the acquisition and recapitalization of real estate and infrastructure assets, portfolios, platforms and operating companies, and real estate and infrastructure debt including first mortgage and mezzanine loans, preferred equity and commercial mortgage backed securities.
|
These business segments are differentiated based on the varying investment strategies. The performance is measured by management on an unconsolidated basis because management makes operating decisions and assesses the performance of each of Apollo’s business segments based on financial and operating metrics and data that exclude the effects of consolidation of any of the managed funds.
Our financial results vary since performance fees, which generally constitute a large portion of the income we receive from the funds that we manage, as well as the transaction and advisory fees that we receive, can vary significantly from quarter to quarter and year to year. As a result, we emphasize long-term financial growth and profitability to manage our business.
In addition, the growth in our Fee-Generating AUM during the last year has primarily been in our credit segment. The average management fee rate for these new credit products is at market rates for such products and in certain cases is below our historical rates. Also, due to the complexity of these new product offerings, the Company has incurred and will continue to incur additional costs associated with managing these products. To date, these additional costs have been offset by realized economies of scale and ongoing cost management.
As of
December 31, 2018
, we had total AUM of
$280.3 billion
across all of our businesses. More than
90%
of our total AUM was in funds with a contractual life at inception of seven years or more, and
49%
of such AUM was in permanent capital vehicles. For our credit segment, total gross and net returns, excluding Athene and Athora assets that are managed or advised
-
92
-
by Apollo but not directly invested in Apollo funds and investment vehicles or sub-advised by Apollo, were
2.2%
and
1.2%
, respectively, for the
year ended December 31, 2018
.
As of December 31, 2017, Fund IX held its final closing, raising a total of
$23.5 billion
in third-party capital and approximately
$1.2 billion
of additional capital from Apollo and affiliated investors for total commitments of
$24.7 billion
. On December 31, 2013, Fund VIII held a final closing raising a total of
$17.5 billion
in third-party capital and approximately
$880 million
of additional capital from Apollo and affiliated investors, and as of
December 31, 2018
, Fund VIII had
$3.4 billion
of uncalled commitments remaining. Additionally, Fund VII held a final closing in December 2008, raising a total of
$14.7 billion
, and as of
December 31, 2018
, Fund VII had
$2.0 billion
of uncalled commitments remaining. We have consistently produced attractive long-term investment returns in our traditional private equity funds, generating a
39%
gross IRR and a
25%
net IRR on a compound annual basis from inception through
December 31, 2018
. Apollo’s private equity fund depreciation was
(9.8)%
for the
year ended
December 31, 2018
.
For our real assets segment, total combined gross and net returns for U.S. RE Fund I and U.S. RE Fund II including co-investment capital were
10.2%
and
8.8%
, respectively, for the
year ended December 31, 2018
.
For further detail related to fund performance metrics across all of our businesses, see “—The Historical Investment Performance of Our Funds.”
Subsequent to December 31, 2018, the Company determined to change the business segment in which it reports certain funds and accounts to align its segment reporting with the manner in which such funds and accounts were managed subsequent to December 31, 2018. Effective January 1, 2019, the European Principal Fund series which the Company has historically reported in the credit segment, moved to the Company’s real assets segment. In addition, one of the fund’s in the Company’s Credit Opportunity Fund series as well as several other funds and accounts that generally invest in illiquid opportunistic investments, which the Company historically reported within its credit segment, moved to the Company’s private equity segment.
-
93
-
Holding Company Structure
The diagram below depicts our current organizational structure:
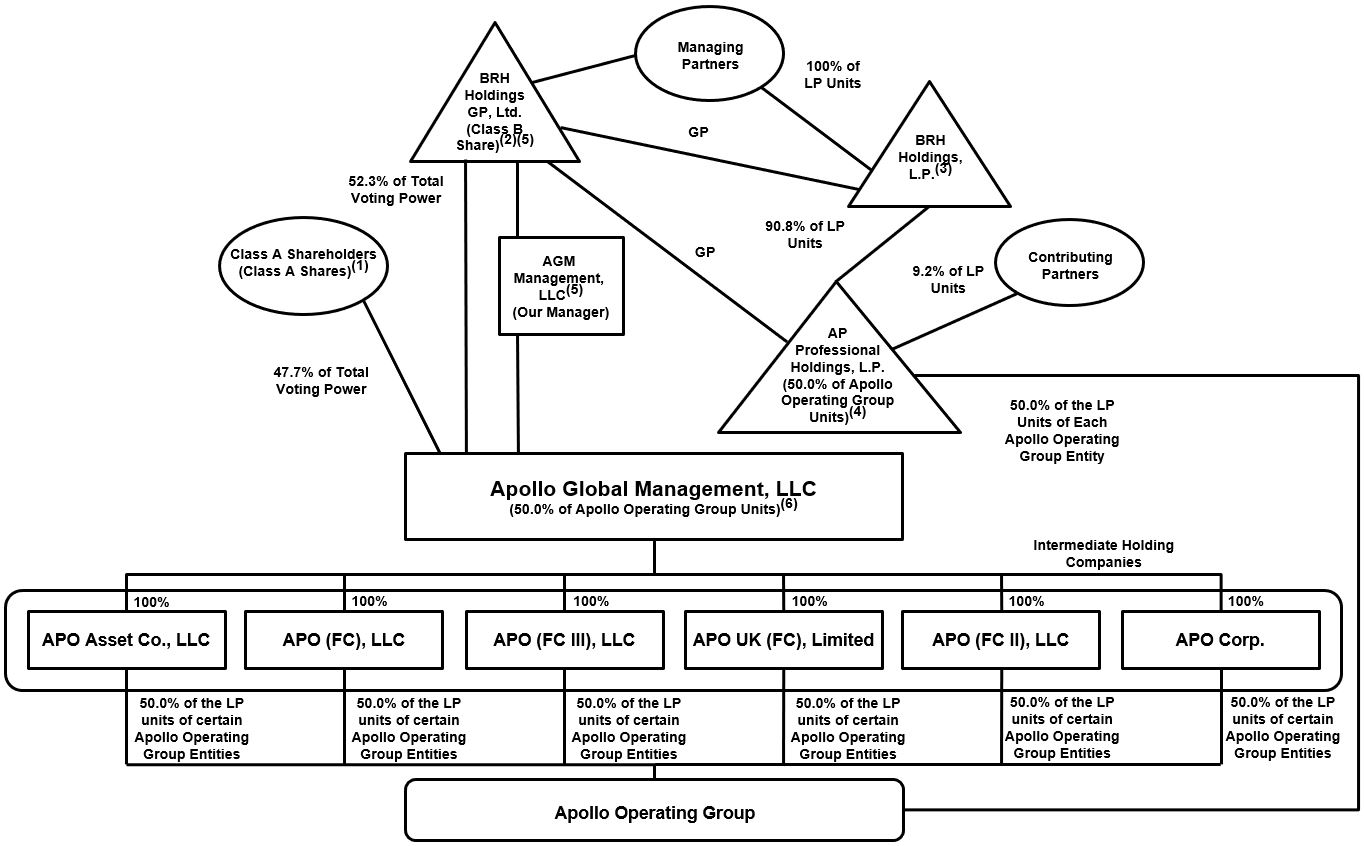
Note: The organizational structure chart above depicts a simplified version of the Apollo structure. It does not include all legal entities in the structure. Ownership percentages are as of
February 26, 2019
.
|
(1)
|
Based on a Form 13F for the quarter ended December 31, 2018 filed with the SEC on February 8, 2019 by the Strategic Investor, the Strategic Investor holds 8.8% of the Class A shares outstanding and 4.4% of the economic interests in the Apollo Operating Group. The Class A shares held by investors other than the Strategic Investor represent 47.7% of the total voting power of our shares entitled to vote and 45.6% of the economic interests in the Apollo Operating Group. Class A shares held by the Strategic Investor do not have voting rights. However, such Class A shares will become entitled to vote upon transfers by the Strategic Investor in accordance with the agreements entered into in connection with the investments made by the Strategic Investor.
|
|
(2)
|
Our Managing Partners own BRH Holdings GP, Ltd., which in turn holds our only outstanding Class B share. The Class B share represents 52.3% of the total voting power of our shares entitled to vote but no economic interest in Apollo Global Management, LLC. Our Managing Partners’ economic interests are instead represented by their indirect beneficial ownership, through Holdings, of 45.4% of the limited partner interests in the Apollo Operating Group.
|
|
(3)
|
Through BRH Holdings, L.P., our Managing Partners indirectly beneficially own through estate planning vehicles, limited partner interests in Holdings.
|
|
(4)
|
Holdings owns 50.0% of the limited partner interests in each Apollo Operating Group entity. The AOG Units held by Holdings are exchangeable for Class A shares. Our Managing Partners, through their interests in BRH and Holdings, beneficially own 45.4% of the AOG Units. Our Contributing Partners, through their ownership interests in Holdings, beneficially own 4.6% of the AOG Units.
|
|
(5)
|
BRH Holdings GP, Ltd. is the sole member of AGM Management, LLC, our manager. The management of Apollo Global Management, LLC is vested in our manager as provided in our operating agreement.
|
|
(6)
|
Represents 50.0% of the limited partner interests in each Apollo Operating Group entity, held through the intermediate holding companies. Apollo Global Management, LLC, also indirectly owns 100% of the general partner interests in each Apollo Operating Group entity.
|
Each of the Apollo Operating Group entities holds interests in different businesses or entities organized in different jurisdictions.
Our structure is designed to accomplish a number of objectives, the most important of which are as follows:
-
94
-
|
•
|
We are a holding company that is qualified as a partnership for U.S. federal income tax purposes. Our intermediate holding companies enable us to maintain our partnership status and to meet the qualifying income exception.
|
|
•
|
We have historically used multiple management companies to segregate operations for business, financial and other reasons. Going forward, we may increase or decrease the number of our management companies, partnerships or other entities within the Apollo Operating Group based on our views regarding the appropriate balance between (a) administrative convenience and (b) continued business, financial, tax and other optimization.
|
Business Environment
As a global investment manager, we are affected by numerous factors, including the condition of financial markets and the economy. Price fluctuations within equity, credit, commodity, foreign exchange markets, as well as interest rates, which may be volatile and mixed across geographies, can significantly impact the valuation of our funds' portfolio companies and related income we may recognize.
In the U.S., the S&P 500 Index decreased by 6.2% during 2018, following an increase of 19.4% in 2017. Outside the U.S., global equity markets depreciated during 2018, with the MSCI All Country World ex USA Index decreasing 14.4% following an increase of 25.9% in 2017.
Conditions in the credit markets also have a significant impact on our business, and in 2018, indices posted mixed returns. The BofAML HY Master II Index fell 2.3% in 2018, following an increase of 7.5% in 2017. The S&P/LSTA Leveraged Loan Index increased 0.4% in 2018, following an increase of 4.1% in 2017. Benchmark interest rates finished the year higher from where they were at the end of 2017, as the Federal Reserve raised the target rate four times during the year and nine times since December 2015. The U.S. 10-year Treasury yield rose slightly to finish the year at 2.7%.
Foreign exchange rates can materially impact the valuations of our investments and those of our funds that are denominated in currencies other than the U.S. dollar. Relative to the U.S. dollar, the Euro depreciated 4.5% during the year after appreciating 14.1% in 2017, and the British pound depreciated 5.6% in 2018, after appreciating 9.5% in 2017. Commodities generally depreciated in 2018, with gold, copper, natural gas and sugar decreasing, while wheat appreciated. The price of crude oil decreased by 24.8% during the year ended December 31, 2018.
In terms of economic conditions in the U.S., the Bureau of Economic Analysis reported real GDP increased at an annual rate of 2.6% in 2018, higher than the 2.3% growth experienced in 2017. As of January 2019, the International Monetary Fund estimated that the U.S. economy will expand by 2.5% in 2019 and 1.8% in 2020. Additionally, the U.S. unemployment rate stood at 3.9% as of December 31, 2018.
Regardless of the market or economic environment at any given time, Apollo relies on its contrarian, value-oriented approach to consistently invest capital on behalf of its fund investors by focusing on opportunities that management believes are often overlooked by other investors. As such, Apollo’s global integrated investment platform deployed
$16.1 billion
of capital through the funds it manages during the year ended
December 31, 2018
. We believe Apollo’s expertise in credit and its focus on nine core industry sectors, combined with more than
28
years of investment experience, has allowed Apollo to respond quickly to changing environments. Apollo’s core industry sectors include chemicals, manufacturing and industrial, natural resources, consumer and retail, consumer services, business services, financial services, leisure, and media/telecom/technology. Apollo believes that these attributes have contributed to the success of its private equity funds investing in buyouts and credit opportunities during both expansionary and recessionary economic periods.
In general, institutional investors continue to allocate capital towards alternative investment managers for more attractive risk-adjusted returns in a low interest rate environment, and we believe the business environment remains generally accommodative to raise larger successor funds, launch new products, and pursue attractive strategic growth opportunities, such as continuing to grow the assets of our permanent capital vehicles. As such, Apollo had
$60.0 billion
of capital inflows during the year ended
December 31, 2018
. While Apollo continues to attract capital inflows, it also continues to generate realizations for fund investors. Apollo returned
$11.1 billion
of capital and realized gains to the investors in the funds it manages during the year ended
December 31, 2018
.
Managing Business Performance
We believe that the presentation of Economic Income, or “EI”, supplements a reader’s understanding of the economic operating performance of each of our segments.
-
95
-
Economic Income (Loss)
EI has certain limitations in that it does not take into account certain items included under U.S. GAAP. EI represents segment income before income tax provision excluding transaction-related charges arising from the 2007 private placement, and any acquisitions. Transaction-related charges includes equity-based compensation charges, the amortization of intangible assets, contingent consideration and certain other charges associated with acquisitions. In addition, EI excludes non-cash revenue and expense related to equity awards granted by unconsolidated related parties to employees of the Company, compensation and administrative related expense reimbursements, as well as the assets, liabilities and operating results of the funds and variable interest entities (“VIEs”) that are included in the
consolidated
financial statements. We believe the exclusion of the non-cash charges related to the 2007 Reorganization for equity-based compensation provides investors with a meaningful indication of our performance because these charges relate to the equity portion of our capital structure and not our core operating performance. EI also excludes impacts of the remeasurement of the tax receivable agreement which arises from changes in the associated deferred tax balance, including the impacts related to the Tax Cuts and Jobs Act (the “TCJA”).
Economic Net Income (“ENI”) represents EI adjusted to reflect income tax provision on EI that has been calculated assuming that all income is allocated to Apollo Global Management, LLC, which would occur following an exchange of all AOG Units for Class A shares of Apollo Global Management, LLC. ENI excludes the impacts of the remeasurement of deferred tax assets and liabilities which arises from changes in estimated future tax rates, including impacts related to the TCJA. The economic assumptions and methodologies that impact the implied income tax provision are similar to those methodologies and certain assumptions used in calculating the income tax provision for Apollo’s
consolidated
statements of operations under U.S. GAAP. ENI is net of preferred distributions, if any, to Series A and Series B Preferred shareholders.
We believe that EI is helpful for an understanding of our business and that investors should review the same supplemental financial measure that management uses to analyze our segment performance. This measure supplements and should be considered in addition to and not in lieu of the results of operations discussed below in “—Overview of Results of Operations” that have been prepared in accordance with U.S. GAAP. See note
16
to the
consolidated
financial statements for more details regarding management’s consideration of EI.
EI may not be comparable to similarly titled measures used by other companies and is not a measure of performance calculated in accordance with U.S. GAAP. We use EI as a measure of operating performance, not as a measure of liquidity. EI should not be considered in isolation or as a substitute for net income or other income data prepared in accordance with U.S. GAAP. The use of EI without consideration of related U.S. GAAP measures is not adequate due to the adjustments described above. Management compensates for these limitations by using EI as a supplemental measure to U.S. GAAP results, to provide a more complete understanding of our performance as management measures it. A reconciliation of EI to its most directly comparable U.S. GAAP measure of income before income tax provision can be found in the notes to our
consolidated
financial statements.
Management believes that excluding the remeasurement of the tax receivable agreement and deferred taxes from EI and ENI, respectively, is meaningful as it increases comparability between periods. Remeasurement of the tax receivable agreement and deferred taxes are estimates, and may change due to changes in interpretations and assumptions based on additional guidance that may be issued pertaining to the TCJA.
Fee Related Earnings
Fee Related Earnings (“FRE”) is derived from our segment reported results and refers to a component of EI that is used as a supplemental performance measure to assess whether revenues that we believe are generally more stable and predictable in nature, primarily consisting of management fees, are sufficient to cover associated operating expenses and generate profits. FRE is the sum across all segments of (i) management fees, (ii) advisory and transaction fees, (iii) performance fees earned from business development companies and Redding Ridge Holdings and (iv) other income, net, less (x) salary, bonus and benefits, excluding equity-based compensation, (y) other associated operating expenses and (z) non-controlling interests in the management companies of certain funds the Company manages.
Distributable Earnings
Distributable Earnings (“DE”), as well as DE After Taxes and Related Payables are derived from our segment reported results, and are supplemental non-U.S. GAAP measures to assess performance and the amount of earnings available for distribution to Class A shareholders, holders of RSUs that participate in distributions and holders of AOG Units. DE represents the amount of net realized earnings without the effects of the consolidation of any of the related funds. DE, which is a component of EI, is the sum across all segments of (i) total management fees and advisory and transaction fees, (ii) other income (loss), (iii) realized performance fees, excluding realizations received in the form of shares and (iv) realized investment income, less (x) compensation expense, excluding the expense related to equity-based awards, (y) realized profit sharing expense, and (z) non-compensation
-
96
-
expenses, excluding depreciation and amortization expense. DE After Taxes and Related Payables represents DE less estimated current corporate, local and non-U.S. taxes as well as the payable under Apollo’s tax receivable agreement. DE After Taxes and Related Payables is net of preferred distributions, if any, to Series A and Series B Preferred shareholders. A reconciliation of DE and EI to their most directly comparable U.S. GAAP measure of income before income tax provision can be found in “—Summary of Non-U.S. GAAP Measures”.
Fee Related EBITDA
Fee related EBITDA is a non-U.S. GAAP measure derived from our segment reported results and is used to assess the performance of our operations as well as our ability to service current and future borrowings. Fee related EBITDA represents FRE plus amounts for depreciation and amortization. “Fee related EBITDA +100% of net realized performance fees” represents fee-related EBITDA plus realized performance fees less realized profit sharing.
We use FRE, DE and Fee related EBITDA as measures of operating performance, not as measures of liquidity. These measures should not be considered in isolation or as a substitute for net income or other income data prepared in accordance with U.S. GAAP. The use of these measures without consideration of their related U.S. GAAP measures is not adequate due to the adjustments described above.
Operating Metrics
We monitor certain operating metrics that are common to the alternative investment management industry. These operating metrics include Assets Under Management, capital deployed and uncalled commitments.
Assets Under Management
The table below presents Fee-Generating and Non-Fee-Generating AUM by segment:
|
As of December 31, 2018
|
As of December 31, 2017
|
||||||||||||||||||||||||||||||
|
Credit
|
Private Equity
|
Real Assets
|
Total
|
Credit
|
Private Equity
|
Real Assets
|
Total
|
||||||||||||||||||||||||
|
|
(in millions)
|
(in millions)
|
|||||||||||||||||||||||||||||
|
Fee-Generating AUM
|
$
|
158,031
|
|
$
|
43,951
|
|
$
|
12,385
|
|
$
|
214,367
|
|
$
|
130,150
|
|
$
|
29,792
|
|
$
|
9,023
|
|
$
|
168,965
|
|
|||||||
|
Non-Fee-Generating AUM
|
35,205
|
|
25,137
|
|
5,550
|
|
65,892
|
|
33,963
|
|
42,640
|
|
3,360
|
|
79,963
|
|
|||||||||||||||
|
Total AUM
|
$
|
193,236
|
|
$
|
69,088
|
|
$
|
17,935
|
|
$
|
280,259
|
|
$
|
164,113
|
|
$
|
72,432
|
|
$
|
12,383
|
|
$
|
248,928
|
|
|||||||
The table below presents AUM with Future Management Fee Potential, which is a component of Non-Fee-Generating AUM, for each of Apollo’s three segments.
|
As of
December 31, 2018 |
As of
December 31, 2017 |
||||||
|
(in millions)
|
|||||||
|
Credit
|
$
|
10,603
|
|
$
|
10,057
|
|
|
|
Private Equity
|
8,677
|
|
25,912
|
|
|||
|
Real Assets
|
2,097
|
|
464
|
|
|||
|
Total AUM with Future Management Fee Potential
|
$
|
21,377
|
|
$
|
36,433
|
|
|
-
97
-
The following tables present the components of Performance Fee-Eligible AUM for each of Apollo’s three segments:
|
As of December 31, 2018
|
As of December 31, 2017
|
||||||||||||||||||||||||||||||
|
Credit
|
Private Equity
|
Real Assets
|
Total
|
Credit
|
Private Equity
|
Real Assets
|
Total
|
||||||||||||||||||||||||
|
|
(in millions)
|
(in millions)
|
|||||||||||||||||||||||||||||
|
Performance Fee-Generating AUM
(1)
|
$
|
25,053
|
|
$
|
22,848
|
|
$
|
666
|
|
$
|
48,567
|
|
$
|
25,814
|
|
$
|
26,775
|
|
$
|
694
|
|
$
|
53,283
|
|
|||||||
|
AUM Not Currently Generating Performance Fees
|
21,414
|
|
1,620
|
|
1,335
|
|
24,369
|
|
17,901
|
|
494
|
|
437
|
|
18,832
|
|
|||||||||||||||
|
Uninvested Performance Fee-Eligible AUM
|
12,627
|
|
34,478
|
|
1,786
|
|
48,891
|
|
11,607
|
|
33,412
|
|
923
|
|
45,942
|
|
|||||||||||||||
|
Total Performance Fee-Eligible AUM
|
$
|
59,094
|
|
$
|
58,946
|
|
$
|
3,787
|
|
$
|
121,827
|
|
$
|
55,322
|
|
$
|
60,681
|
|
$
|
2,054
|
|
$
|
118,057
|
|
|||||||
|
(1)
|
As of
December 31, 2018
,
$0.2 billion
of the Performance Fee-Generating AUM is currently above its hurdle rate or preferred return, but in accordance with the adoption of the revenue recognition standard effective January 1, 2018, recognition of performance fees associated with such Performance Fee-Generating AUM has been deferred to future periods when the fees are probable to not be significantly reversed.
|
The following table presents AUM Not Currently Generating Performance Fees for funds that have commenced investing capital for more than 24 months as of
December 31, 2018
and the corresponding appreciation required to reach the preferred return or high watermark in order to generate performance fees:
|
Category / Fund
|
Invested AUM Not Currently Generating Performance Fees
|
Investment Period Active > 24 Months
|
Appreciation Required to Achieve Performance Fees
(1)
|
|||||||
|
(in millions)
|
||||||||||
|
Credit:
|
||||||||||
|
Drawdown
|
$
|
5,109
|
|
$
|
2,875
|
|
55%
|
|||
|
Liquid/Performing
|
16,002
|
|
3,002
|
|
< 250bps
|
|||||
|
10,545
|
|
250-500bps
|
||||||||
|
1,613
|
|
> 500bps
|
||||||||
|
Athora Non-Sub-Advised
|
303
|
|
—
|
|
< 250bps
|
|||||
|
Total Credit
|
21,414
|
|
18,035
|
|
12%
|
|||||
|
Private Equity:
|
||||||||||
|
ANRP I
|
389
|
|
389
|
|
58%
|
|||||
|
Other PE
|
1,231
|
|
224
|
|
66%
|
|||||
|
Total Private Equity
|
1,620
|
|
613
|
|
61%
|
|||||
|
Real Assets:
|
||||||||||
|
Total Real Assets
|
1,335
|
|
404
|
|
> 250bps
|
|||||
|
Total
|
$
|
24,369
|
|
$
|
19,052
|
|
||||
|
(1)
|
All investors in a given fund are considered in aggregate when calculating the appreciation required to achieve performance fees presented above. Appreciation required to achieve performance fees may vary by individual investor.
|
-
98
-
The components of Fee-Generating AUM by segment are presented below:
|
|
As of December 31, 2018
|
||||||||||||||
|
|
Credit
|
Private
Equity
|
Real
Assets
|
Total
|
|||||||||||
|
|
(in millions)
|
||||||||||||||
|
Fee-Generating AUM based on capital commitments
|
$
|
8,037
|
|
$
|
26,849
|
|
$
|
784
|
|
$
|
35,670
|
|
|||
|
Fee-Generating AUM based on invested capital
|
4,128
|
|
16,326
|
|
5,825
|
|
26,279
|
|
|||||||
|
Fee-Generating AUM based on gross/adjusted assets
|
125,335
|
|
776
|
|
5,625
|
|
131,736
|
|
|||||||
|
Fee-Generating AUM based on NAV
|
20,531
|
|
—
|
|
151
|
|
20,682
|
|
|||||||
|
Total Fee-Generating AUM
|
$
|
158,031
|
|
$
|
43,951
|
|
(1)
|
$
|
12,385
|
|
$
|
214,367
|
|
||
|
(1)
|
The weighted average remaining life of the private equity funds excluding permanent capital vehicles at
December 31, 2018
was
79
months.
|
|
|
As of December 31, 2017
|
||||||||||||||
|
|
Credit
|
Private
Equity
|
Real
Assets
|
Total
|
|||||||||||
|
|
(in millions)
|
||||||||||||||
|
Fee-Generating AUM based on capital commitments
|
$
|
8,771
|
|
$
|
21,803
|
|
$
|
784
|
|
$
|
31,358
|
|
|||
|
Fee-Generating AUM based on invested capital
|
6,186
|
|
7,197
|
|
4,535
|
|
17,918
|
|
|||||||
|
Fee-Generating AUM based on gross/adjusted assets
|
97,514
|
|
792
|
|
3,658
|
|
101,964
|
|
|||||||
|
Fee-Generating AUM based on NAV
|
17,679
|
|
—
|
|
46
|
|
17,725
|
|
|||||||
|
Total Fee-Generating AUM
|
$
|
130,150
|
|
$
|
29,792
|
|
(1)
|
$
|
9,023
|
|
$
|
168,965
|
|
||
|
(1)
|
The weighted average remaining life of the private equity funds excluding permanent capital vehicles at
December 31, 2017
was
57
months.
|
The following table presents total AUM and Fee-Generating AUM amounts for our credit segment by category type:
|
|
Total AUM
|
Fee-Generating AUM
|
|||||||||||||
|
|
As of December 31,
|
As of December 31,
|
|||||||||||||
|
2018
|
2017
|
2018
|
2017
|
||||||||||||
|
|
(in millions)
|
||||||||||||||
|
Liquid/Performing
|
$
|
54,825
|
|
$
|
43,306
|
|
$
|
40,323
|
|
$
|
36,863
|
|
|||
|
Drawdown
|
25,988
|
|
28,468
|
|
14,124
|
|
16,778
|
|
|||||||
|
MidCap, AINV, AFT, AIF
|
14,831
|
|
13,428
|
|
13,524
|
|
12,623
|
|
|||||||
|
Athene Non-Sub-Advised
(1)
|
85,575
|
|
59,670
|
|
85,575
|
|
59,670
|
|
|||||||
|
Athora Non-Sub-Advised
(1)
|
4,952
|
|
6,719
|
|
4,485
|
|
4,216
|
|
|||||||
|
Advisory
|
7,065
|
|
12,522
|
|
—
|
|
—
|
|
|||||||
|
Total
|
$
|
193,236
|
|
$
|
164,113
|
|
$
|
158,031
|
|
$
|
130,150
|
|
|||
|
(1)
|
The Company refers to the portion of the AUM related to Athora that is not sub-advised by Apollo or invested in funds and or investment vehicles managed by Apollo as “Athora Non-Sub-Advised” AUM. Athene Non-Sub-Advised AUM and Athora Non-Sub-Advised AUM reflects total combined Athene and Athora AUM of
$116.8 billion
less
$26.2 billion
of assets that were either sub-advised by Apollo or invested in funds and investment vehicles managed by Apollo included within other asset categories.
|
Investment Management and Sub-Advisory Agreements - AAM
Apollo, through its consolidated subsidiary, AAM, provides asset management services to Athene with respect to assets in the Athene Accounts, including asset allocation services, direct asset management services, asset and liability matching management, mergers and acquisitions, asset diligence, hedging and other asset management services and receives management fees for providing these services. The Company, through AAM, also provides sub-advisory services with respect to a portion of the assets in the Athene Accounts. From time to time, Athene also invests in funds and investment vehicles that Apollo manages. The Company refers to such assets which are invested directly as “Athene Assets Directly Invested.” The Company broadly refers to “Athene Sub-Advised” assets as those assets in the Athene Accounts which the Company explicitly sub-advises as well as Athene Assets Directly Invested. See note
14
to the
consolidated
financial statements for more details regarding the fee rates of the investment management, sub-advisory and other fee arrangements with respect to the assets in the Athene Accounts.
-
99
-
Investment Advisory and Sub-Advisory Agreements - AAME
Apollo, through AAME, provides investment advisory services with respect to certain assets in certain portfolio companies of Apollo funds and the Athora Accounts and sub-advises certain assets in certain portfolio companies of Apollo funds and the Athora Accounts. From time to time, Athora also invests in funds and investment vehicles Apollo manages. The Company broadly refers to “Athora Sub-Advised” assets as those assets in the Athora Accounts which the Company explicitly sub-advises as well as those assets in the Athora Accounts which are invested directly in funds and investment vehicles Apollo manages. See note
14
to the
consolidated
financial statements for more details regarding the fee rates of the investment advisory, sub-advisory and other fee arrangements with respect to the assets in the Athora Accounts.
The following table presents the aggregate Athene Sub-Advised AUM and Athora Sub-Advised AUM by segment:
|
|
Total AUM
|
||||||
|
|
As of December 31,
|
||||||
|
2018
|
2017
|
||||||
|
|
(in millions)
|
||||||
|
Credit
|
|||||||
|
Liquid/Performing
|
$
|
15,150
|
|
$
|
10,986
|
|
|
|
Drawdown
|
1,264
|
|
1,327
|
|
|||
|
Total Credit
|
16,414
|
|
12,313
|
|
|||
|
Private Equity
|
1,617
|
|
1,121
|
|
|||
|
Real Assets
|
|||||||
|
Debt
|
7,046
|
|
4,509
|
|
|||
|
Equity
|
1,170
|
|
488
|
|
|||
|
Total Real Assets
|
8,216
|
|
4,997
|
|
|||
|
Total
|
$
|
26,247
|
|
$
|
18,431
|
|
|
Athene and Athora Non-Sub-Advised AUM
The Company refers to the portion of the AUM in the Athene North American Accounts that is not Athene Sub-Advised AUM as “Athene Non-Sub-Advised” AUM. The Company refers to the portion of the Athora AUM that is not Athora Sub-Advised AUM as “Athora Non-Sub-Advised” AUM.
The following table presents the AUM for Athene and Athora:
|
As of December 31, 2018
|
As of December 31, 2017
|
||||||||||||||||||||||
|
Sub-Advised AUM
(1)
|
Non-Sub-Advised AUM
|
Total AUM
|
Sub-Advised AUM
(1)
|
Non-Sub-Advised AUM
|
Total AUM
|
||||||||||||||||||
|
(in millions)
|
|||||||||||||||||||||||
|
Athene
|
$
|
23,215
|
|
$
|
85,575
|
|
$
|
108,790
|
|
$
|
17,241
|
|
$
|
59,670
|
|
$
|
76,911
|
|
|||||
|
Athora
|
3,032
|
|
4,952
|
|
7,984
|
|
1,190
|
|
6,719
|
|
7,909
|
|
|||||||||||
|
Total
|
$
|
26,247
|
|
$
|
90,527
|
|
$
|
116,774
|
|
$
|
18,431
|
|
$
|
66,389
|
|
$
|
84,820
|
|
|||||
|
(1)
|
Of the total Athene Sub-Advised AUM and Athora Sub-Advised AUM,
$4.3 billion
and
$3.0 billion
, respectively, were Athene Assets Directly Invested as of
December 31, 2018
and
2017
, respectively.
|
The following table presents total AUM and Fee-Generating AUM amounts for our private equity segment:
|
|
Total AUM
|
Fee-Generating AUM
|
|||||||||||||
|
|
As of December 31,
|
As of December 31,
|
|||||||||||||
|
2018
|
2017
|
2018
|
2017
|
||||||||||||
|
|
(in millions)
|
||||||||||||||
|
Traditional Private Equity Funds
|
$
|
50,758
|
|
$
|
57,250
|
|
$
|
38,345
|
|
$
|
23,580
|
|
|||
|
Natural Resources
|
5,034
|
|
4,709
|
|
3,981
|
|
4,058
|
|
|||||||
|
Other
(1)
|
13,296
|
|
10,473
|
|
1,625
|
|
2,154
|
|
|||||||
|
Total
|
$
|
69,088
|
|
$
|
72,432
|
|
$
|
43,951
|
|
$
|
29,792
|
|
|||
-
100
-
|
(1)
|
Includes co-investments and other private equity vehicles.
|
The following table presents total AUM and Fee-Generating AUM amounts for our real assets segment:
|
|
Total AUM
|
Fee-Generating AUM
|
|||||||||||||
|
|
As of December 31,
|
As of December 31,
|
|||||||||||||
|
2018
|
2017
|
2018
|
2017
|
||||||||||||
|
|
(in millions)
|
||||||||||||||
|
Debt
|
$
|
13,186
|
|
$
|
9,965
|
|
$
|
9,398
|
|
$
|
7,451
|
|
|||
|
Equity
|
4,749
|
|
2,418
|
|
2,987
|
|
1,572
|
|
|||||||
|
Total
|
$
|
17,935
|
|
$
|
12,383
|
|
$
|
12,385
|
|
$
|
9,023
|
|
|||
The following tables summarize changes in total AUM for each of Apollo’s three segments:
|
For the Years Ended December 31,
|
|||||||||||||||||||||||||||||||
|
|
2018
|
2017
|
|||||||||||||||||||||||||||||
|
Credit
|
Private Equity
|
Real Assets
|
Total
|
Credit
|
Private Equity
|
Real Assets
|
Total
|
||||||||||||||||||||||||
|
|
(in millions)
|
||||||||||||||||||||||||||||||
|
Change in Total AUM
(1)
:
|
|||||||||||||||||||||||||||||||
|
Beginning of Period
|
$
|
164,113
|
|
$
|
72,432
|
|
$
|
12,383
|
|
$
|
248,928
|
|
$
|
136,607
|
|
$
|
43,628
|
|
$
|
11,453
|
|
$
|
191,688
|
|
|||||||
|
Inflows
|
46,806
|
|
6,642
|
|
6,514
|
|
59,962
|
|
28,242
|
|
25,179
|
|
3,099
|
|
56,520
|
|
|||||||||||||||
|
Outflows
(2)
|
(11,758
|
)
|
(209
|
)
|
—
|
|
(11,967
|
)
|
(3,730
|
)
|
(83
|
)
|
(489
|
)
|
(4,302
|
)
|
|||||||||||||||
|
Net Flows
|
35,048
|
|
6,433
|
|
6,514
|
|
47,995
|
|
24,512
|
|
25,096
|
|
2,610
|
|
52,218
|
|
|||||||||||||||
|
Realizations
|
(5,312
|
)
|
(4,466
|
)
|
(1,275
|
)
|
(11,053
|
)
|
(4,048
|
)
|
(4,568
|
)
|
(2,075
|
)
|
(10,691
|
)
|
|||||||||||||||
|
Market Activity
(3)
|
(613
|
)
|
(5,311
|
)
|
313
|
|
(5,611
|
)
|
7,042
|
|
8,276
|
|
395
|
|
15,713
|
|
|||||||||||||||
|
End of Period
|
$
|
193,236
|
|
$
|
69,088
|
|
$
|
17,935
|
|
$
|
280,259
|
|
$
|
164,113
|
|
$
|
72,432
|
|
$
|
12,383
|
|
$
|
248,928
|
|
|||||||
|
(1)
|
At the individual segment level, inflows include new subscriptions, commitments, capital raised, other increases in available capital, purchases, acquisitions and portfolio company appreciation. Outflows represent redemptions, other decreases in available capital and portfolio company depreciation. Realizations represent fund distributions of realized proceeds. Market activity represents gains (losses), the impact of foreign exchange rate fluctuations and other income.
|
|
(2)
|
Outflows for Total AUM include redemptions of
$2.0 billion
and
$1.1 billion
during the
years ended
December 31, 2018
and
2017
, respectively.
|
|
(3)
|
Includes foreign exchange impacts of
$(1.5) billion
,
$(73.8) million
and
$(22.5) million
for credit, private equity and real assets, respectively, during the
year ended December 31, 2018
, and foreign exchange impacts of
$3.3 billion
,
$249.1 million
and
$146.1 million
for credit, private equity and real assets, respectively, during the
year ended December 31, 2017
.
|
Total AUM was
$280.3 billion
at
December 31, 2018
, an increase of
$31.3 billion
, or
12.6%
, compared to
$248.9 billion
at
December 31, 2017
. The net increase was primarily due to:
Net flows of
$48.0 billion
primarily related to:
|
•
|
a
$35.0 billion
increase related to funds we manage in the credit segment primarily consisting of an increase in AUM relating to Athene of $33.2 billion as a result of its completion of the reinsurance transactions relating to Lincoln Financial Group and the fixed annuity business of Voya Financial and subscriptions of $8.5 billion, offset by net segment transfers of $5.5 billion and a decrease in AUM relating to Advisory assets of $3.9 billion driven by portfolio company activity;
|
|
•
|
a
$6.5 billion
increase related to funds we manage in the real assets segment primarily consisting of net segment transfers of $3.6 billion, subscriptions of $1.6 billion and an increase in net leverage of $1.0 billion; and
|
|
•
|
a
$6.4 billion
increase related to funds we manage in the private equity segment consisting of subscriptions of $5.3 billion primarily related to Hybrid Value Fund and co-investments for Fund VIII transactions of $2.8 billion and $0.8 billion, respectively, and net segment transfers of $0.9 billion.
|
Offsetting these increases were:
Realizations of
$11.1 billion
primarily related to:
-
101
-
|
•
|
$5.3 billion
related to funds we manage in the credit segment primarily consisting of distributions of $1.4 billion, $1.3 billion, $1.2 billion and $1.0 billion from certain drawdown funds, Apollo Credit Opportunity Fund III, L.P. (“COF III”), certain liquid/performing funds and Apollo European Principal Finance Fund II, L.P. (“EPF II”), respectively;
|
|
•
|
$4.5 billion
related to funds we manage in the private equity segment primarily consisting of distributions of $1.7 billion, $1.3 billion, $0.6 billion and $0.5 billion from Fund VIII, Fund VI, Fund VII and certain natural resources funds, respectively; and
|
|
•
|
$1.3 billion
related to funds we manage in the real assets segment primarily consisting of distributions of $1.0 billion from our real estate debt funds.
|
Market activity of
$5.6 billion
primarily related to:
|
•
|
a
$5.3 billion
decrease related to funds we manage in the private equity segment as a result of depreciation in Fund VIII and co-investment vehicles.
|
The following tables summarize changes in Fee-Generating AUM for each of Apollo’s three segments:
|
For the Years Ended December 31,
|
|||||||||||||||||||||||||||||||
|
|
2018
|
2017
|
|||||||||||||||||||||||||||||
|
Credit
|
Private Equity
|
Real Assets
|
Total
|
Credit
|
Private Equity
|
Real Assets
|
Total
|
||||||||||||||||||||||||
|
|
(in millions)
|
||||||||||||||||||||||||||||||
|
Change in Fee-Generating AUM
(1)
:
|
|||||||||||||||||||||||||||||||
|
Beginning of Period
|
$
|
130,150
|
|
$
|
29,792
|
|
$
|
9,023
|
|
$
|
168,965
|
|
$
|
111,781
|
|
$
|
30,722
|
|
$
|
8,295
|
|
$
|
150,798
|
|
|||||||
|
Inflows
|
43,816
|
|
25,616
|
|
4,745
|
|
74,177
|
|
23,469
|
|
428
|
|
2,249
|
|
26,146
|
|
|||||||||||||||
|
Outflows
(2)
|
(12,974
|
)
|
(10,552
|
)
|
(792
|
)
|
(24,318
|
)
|
(6,503
|
)
|
(590
|
)
|
(417
|
)
|
(7,510
|
)
|
|||||||||||||||
|
Net Flows
|
30,842
|
|
15,064
|
|
3,953
|
|
49,859
|
|
16,966
|
|
(162
|
)
|
1,832
|
|
18,636
|
|
|||||||||||||||
|
Realizations
|
(2,618
|
)
|
(937
|
)
|
(779
|
)
|
(4,334
|
)
|
(1,946
|
)
|
(874
|
)
|
(1,328
|
)
|
(4,148
|
)
|
|||||||||||||||
|
Market Activity
(3)
|
(343
|
)
|
32
|
|
188
|
|
(123
|
)
|
3,349
|
|
106
|
|
224
|
|
3,679
|
|
|||||||||||||||
|
End of Period
|
$
|
158,031
|
|
$
|
43,951
|
|
$
|
12,385
|
|
$
|
214,367
|
|
$
|
130,150
|
|
$
|
29,792
|
|
$
|
9,023
|
|
$
|
168,965
|
|
|||||||
|
(1)
|
At the individual segment level, inflows include new subscriptions, commitments, capital raised, other increases in available capital, purchases, acquisitions and portfolio company appreciation. Outflows represent redemptions, other decreases in available capital and portfolio company depreciation. Realizations represent fund distributions of realized proceeds. Market activity represents gains (losses), the impact of foreign exchange rate fluctuations and other income.
|
|
(2)
|
Outflows for Fee-Generating AUM include redemptions of
$2.0 billion
and
$840.0 million
during the
years ended
December 31, 2018
and
2017
, respectively.
|
|
(3)
|
Includes foreign exchange impacts of
$(861.6) million
,
$(2.6) million
and
$(27.9) million
for credit, private equity and real assets, respectively, during the
year ended December 31, 2018
, and foreign exchange impacts of
$1.5 billion
and
$78.5 million
for credit and real assets, respectively, during the
year ended December 31, 2017
.
|
Total Fee-Generating AUM was
$214.4 billion
at
December 31, 2018
, an increase of
$45.4 billion
or
26.9%
, compared to
$169.0 billion
at
December 31, 2017
. The net increase was primarily due to:
Net flows of
$49.9 billion
primarily related to:
|
•
|
a
$30.8 billion
increase related to funds we manage in the credit segment primarily consisting of an increase in AUM relating to Athene of $33.2 billion as a result of its completion of the reinsurance transactions relating to Lincoln Financial Group and the fixed annuity business of Voya Financial and subscriptions of $4.0 billion related to our liquid/performing funds, offset by fee-generating capital reduction of $5.2 billion;
|
|
•
|
a
$15.1 billion
increase related to funds we manage in the private equity segment primarily consisting of an increase of $23.5 billion relating to the commencement of Fund IX’s investment period, offset by a fee basis adjustment of $5.0 billion in Fund VIII related to the commencement of Fund IX’s investment period and a decrease of $2.8 billion relating to the termination of the management fee with respect to Fund VI; and
|
|
•
|
a
$4.0 billion
increase related to funds we manage in the real assets segment primarily consisting of net segment transfers of $2.5 billion, $0.6 billion of capital raised for real estate equity funds and $0.4 billion of capital raised for Infrastructure Equity Fund.
|
Offsetting these increases were:
Realizations of
$4.3 billion
primarily related to:
-
102
-
|
•
|
$2.6 billion
related to funds we manage in the credit segment primarily driven by distributions from EPF II, a strategic investment account and certain liquid/performing funds of $1.1 billion, $0.8 billion and $0.3 billion, respectively;
|
|
•
|
$0.9 billion
related to funds we manage in the private equity segment driven by distributions from Fund VIII and Fund VII of $0.4 billion and $0.4 billion, respectively; and
|
|
•
|
$0.8 billion
related to funds we manage in the real assets segment primarily consisting of distributions of $0.6 billion from our real estate debt funds.
|
Capital Deployed and Uncalled Commitments
Capital deployed is the aggregate amount of capital that has been invested during a given period by our drawdown funds, SIAs that have a defined maturity date and funds and SIAs in our real estate debt strategy. Uncalled commitments, by contrast, represents unfunded capital commitments that certain of Apollo’s funds and SIAs have received from fund investors to fund future or current fund investments and expenses.
Capital deployed and uncalled commitments are indicative of the pace and magnitude of fund capital that is deployed or will be deployed, and which therefore could result in future revenues that include management fees, transaction fees and performance fees to the extent they are fee-generating. Capital deployed and uncalled commitments can also give rise to future costs that are related to the hiring of additional resources to manage and account for the additional capital that is deployed or will be deployed. Management uses capital deployed and uncalled commitments as key operating metrics since we believe the results measure our fund’s investment activities.
Capital Deployed
The following table summarizes by segment the capital deployed for funds and SIAs with a defined maturity date and certain funds and SIAs in Apollo’s real estate debt strategy:
|
|
For the Years Ended December 31,
|
||||||||||
|
|
2018
|
2017
|
2016
|
||||||||
|
|
(in millions)
|
||||||||||
|
Credit
|
$
|
4,318
|
|
$
|
6,279
|
|
$
|
3,713
|
|
||
|
Private Equity
|
5,505
|
|
5,029
|
|
9,582
|
|
|||||
|
Real Assets
(1)
|
6,255
|
|
3,505
|
|
2,638
|
|
|||||
|
Total capital deployed
|
$
|
16,078
|
|
$
|
14,813
|
|
$
|
15,933
|
|
||
|
(1)
|
Included in capital deployed is
$4.8 billion
,
$3.2 billion
and
$2.5 billion
for the
years ended
December 31, 2018, 2017 and 2016
, respectively, related to funds in Apollo’s real estate debt strategy.
|
Uncalled Commitments
The following table summarizes the uncalled commitments by segment:
|
As of
December 31, 2018 |
As of
December 31, 2017 |
||||||
|
|
(in millions)
|
||||||
|
Credit
|
$
|
15,797
|
|
$
|
15,225
|
|
|
|
Private Equity
|
37,950
|
|
36,810
|
|
|||
|
Real Assets
|
1,884
|
|
1,074
|
|
|||
|
Total uncalled commitments
(1)
|
$
|
55,631
|
|
$
|
53,109
|
|
|
|
(1)
|
As of
December 31, 2018
and
December 31, 2017
,
$48.5 billion
and
$47.6 billion
, respectively, represented the amount of capital available for investment or reinvestment subject to the provisions of the applicable limited partnership agreements or other governing agreements of the funds, partnerships and accounts we manage. These amounts exclude uncalled commitments which can only be called for fund fees and expenses.
|
The Historical Investment Performance of Our Funds
Below we present information relating to the historical performance of our funds, including certain legacy Apollo funds that do not have a meaningful amount of unrealized investments, and in respect of which the general partner interest has not been contributed to us.
-
103
-
When considering the data presented below, you should note that the historical results of our funds are not indicative of the future results that you should expect from such funds, from any future funds we may raise or from your investment in our Class A shares.
An investment in our Class A shares is not an investment in any of the Apollo funds, and the assets and revenues of our funds are not directly available to us. The historical and potential future returns of the funds we manage are not directly linked to returns on our Class A shares. Therefore, you should not conclude that continued positive performance of the funds we manage will necessarily result in positive returns on an investment in our Class A shares. However, poor performance of the funds that we manage would cause a decline in our revenue from such funds, and would therefore have a negative effect on our performance and in all likelihood the value of our Class A shares.
Moreover, the historical returns of our funds should not be considered indicative of the future results you should expect from such funds or from any future funds we may raise. There can be no assurance that any Apollo fund will continue to achieve the same results in the future.
Finally, our private equity IRRs have historically varied greatly from fund to fund. For example, Fund IV generated a
12%
gross IRR and a
9%
net IRR since its inception through
December 31, 2018
, while Fund V generated a
61%
gross IRR and a
44%
net IRR since its inception through
December 31, 2018
. Accordingly, the IRR going forward for any current or future fund may vary considerably from the historical IRR generated by any particular fund, or for our private equity funds as a whole. Future returns will also be affected by the applicable risks, including risks of the industries and businesses in which a particular fund invests. See “Item
1A
. Risk Factors—Risks Related to Our Businesses—The historical returns attributable to our funds should not be considered as indicative of the future results of our funds or of our future results or of any returns expected on an investment in our Class A shares and our Preferred shares.”
-
104
-
Investment Record
The following table summarizes the investment record by segment of Apollo’s significant drawdown funds and SIAs that have a defined maturity date in which investors make a commitment to provide capital at the formation of such funds and deliver capital when called as investment opportunities become available. The funds included in the investment record table below have greater than $500 million of AUM and/or form part of a flagship series of funds. The SIAs included in the investment record table below have greater than $200 million of AUM and did not predominantly invest in other Apollo funds or SIAs.
All amounts are as of
December 31, 2018
, unless otherwise noted:
|
($ in millions)
|
Vintage
Year (1) |
Total AUM
|
Committed
Capital |
Total Invested Capital
(1)
|
Realized Value
(1)
|
Remaining Cost
(1)
|
Unrealized Value
(1)
|
Total Value
(1)
|
Gross
IRR (1) |
Net
IRR (1) |
||||||||||||||||||||||||||
|
Private Equity:
|
||||||||||||||||||||||||||||||||||||
|
Fund IX
|
2018
|
$
|
24,769
|
|
$
|
24,729
|
|
NM
|
|
(2)
|
NM
|
|
(2)
|
NM
|
|
(2)
|
NM
|
|
(2)
|
NM
|
|
(2)
|
NM
|
|
(2)
|
NM
|
|
(2)
|
||||||||
|
Fund VIII
|
2013
|
19,518
|
|
18,377
|
|
$
|
15,370
|
|
$
|
5,227
|
|
$
|
12,686
|
|
$
|
15,864
|
|
$
|
21,091
|
|
17
|
%
|
11
|
%
|
||||||||||||
|
Fund VII
|
2008
|
4,573
|
|
14,677
|
|
16,233
|
|
30,797
|
|
2,975
|
|
2,330
|
|
33,127
|
|
34
|
|
25
|
|
|||||||||||||||||
|
Fund VI
|
2006
|
1,618
|
|
10,136
|
|
12,457
|
|
19,983
|
|
1,523
|
|
1,007
|
|
20,990
|
|
12
|
|
9
|
|
|||||||||||||||||
|
Fund V
|
2001
|
267
|
|
3,742
|
|
5,192
|
|
12,715
|
|
120
|
|
12
|
|
12,727
|
|
61
|
|
44
|
|
|||||||||||||||||
|
Fund I, II, III, IV & MIA
(3)
|
Various
|
13
|
|
7,320
|
|
8,753
|
|
17,400
|
|
—
|
|
—
|
|
17,400
|
|
39
|
|
26
|
|
|||||||||||||||||
|
Traditional Private Equity Funds
(4)
|
$
|
50,758
|
|
$
|
78,981
|
|
$
|
58,005
|
|
$
|
86,122
|
|
$
|
17,304
|
|
$
|
19,213
|
|
$
|
105,335
|
|
39
|
%
|
25
|
%
|
|||||||||||
|
ANRP II
|
2016
|
3,363
|
|
3,454
|
|
1,884
|
|
818
|
|
1,525
|
|
1,763
|
|
2,581
|
|
32
|
|
18
|
|
|||||||||||||||||
|
ANRP I
|
2012
|
672
|
|
1,323
|
|
1,118
|
|
936
|
|
650
|
|
417
|
|
1,353
|
|
6
|
|
2
|
|
|||||||||||||||||
|
AION
|
2013
|
740
|
|
826
|
|
634
|
|
272
|
|
448
|
|
565
|
|
837
|
|
19
|
|
9
|
|
|||||||||||||||||
|
Hybrid Value Fund
|
N/A
|
2,814
|
|
2,822
|
|
114
|
|
3
|
|
114
|
|
112
|
|
115
|
|
NM
|
|
(2)
|
NM
|
|
(2)
|
|||||||||||||||
|
Total Private Equity
(9)
|
$
|
58,347
|
|
$
|
87,406
|
|
$
|
61,755
|
|
$
|
88,151
|
|
$
|
20,041
|
|
$
|
22,070
|
|
$
|
110,221
|
|
|||||||||||||||
|
Credit:
|
||||||||||||||||||||||||||||||||||||
|
Credit Opportunity Funds
|
||||||||||||||||||||||||||||||||||||
|
COF III
|
2014
|
$
|
1,679
|
|
$
|
3,426
|
|
$
|
5,076
|
|
$
|
4,159
|
|
$
|
1,194
|
|
$
|
1,012
|
|
$
|
5,171
|
|
1
|
%
|
—
|
%
|
||||||||||
|
COF II
|
2008
|
42
|
|
1,583
|
|
2,176
|
|
3,142
|
|
32
|
|
32
|
|
3,174
|
|
14
|
|
11
|
|
|||||||||||||||||
|
COF I
|
2008
|
308
|
|
1,485
|
|
1,611
|
|
4,355
|
|
25
|
|
39
|
|
4,394
|
|
30
|
|
27
|
|
|||||||||||||||||
|
European Principal Finance Funds
|
||||||||||||||||||||||||||||||||||||
|
EPF III
(5)
|
2017
|
4,466
|
|
4,543
|
|
1,455
|
|
13
|
|
1,443
|
|
1,478
|
|
1,491
|
|
NM
|
|
(2)
|
NM
|
|
(2)
|
|||||||||||||||
|
EPF II
(5)
|
2012
|
2,155
|
|
3,462
|
|
3,468
|
|
3,821
|
|
1,013
|
|
1,354
|
|
5,175
|
|
17
|
|
10
|
|
|||||||||||||||||
|
EPF I
(5)
|
2007
|
251
|
|
1,485
|
|
1,952
|
|
3,268
|
|
—
|
|
13
|
|
3,281
|
|
23
|
|
17
|
|
|||||||||||||||||
|
Structured Credit Funds
|
||||||||||||||||||||||||||||||||||||
|
FCI III
|
2017
|
2,729
|
|
1,906
|
|
1,751
|
|
612
|
|
1,454
|
|
1,603
|
|
2,215
|
|
NM
|
|
(2)
|
NM
|
|
(2)
|
|||||||||||||||
|
FCI II
|
2013
|
2,229
|
|
1,555
|
|
2,511
|
|
1,399
|
|
1,705
|
|
1,636
|
|
3,035
|
|
9
|
|
6
|
|
|||||||||||||||||
|
FCI I
|
2012
|
802
|
|
559
|
|
1,506
|
|
1,391
|
|
707
|
|
658
|
|
2,049
|
|
14
|
|
11
|
|
|||||||||||||||||
|
SCRF IV
(12)
|
2017
|
2,339
|
|
2,502
|
|
1,750
|
|
447
|
|
1,730
|
|
1,613
|
|
2,060
|
|
NM
|
|
(2)
|
NM
|
|
(2)
|
|||||||||||||||
|
SCRF III
|
2015
|
—
|
|
1,238
|
|
2,110
|
|
2,428
|
|
—
|
|
—
|
|
2,428
|
|
18
|
|
14
|
|
|||||||||||||||||
|
SCRF II
|
2012
|
—
|
|
104
|
|
467
|
|
528
|
|
—
|
|
—
|
|
528
|
|
15
|
|
12
|
|
|||||||||||||||||
|
SCRF I
|
2008
|
—
|
|
118
|
|
240
|
|
357
|
|
—
|
|
—
|
|
357
|
|
33
|
|
26
|
|
|||||||||||||||||
|
Other Drawdown Funds & SIAs
(6)
|
Various
|
6,766
|
|
10,083
|
|
10,348
|
|
10,301
|
|
2,280
|
|
2,162
|
|
12,463
|
|
9
|
|
6
|
|
|||||||||||||||||
|
Total Credit
(10)
|
$
|
23,766
|
|
$
|
34,049
|
|
|
$
|
36,421
|
|
$
|
36,221
|
|
$
|
11,583
|
|
$
|
11,600
|
|
$
|
47,821
|
|
||||||||||||||
|
Real Assets:
|
||||||||||||||||||||||||||||||||||||
|
U.S. RE Fund II
(7)
|
2016
|
$
|
1,328
|
|
$
|
1,233
|
|
$
|
710
|
|
$
|
349
|
|
$
|
498
|
|
$
|
620
|
|
$
|
969
|
|
19
|
%
|
16
|
%
|
||||||||||
|
U.S. RE Fund I
(7)
|
2012
|
418
|
|
651
|
|
633
|
|
668
|
|
238
|
|
279
|
|
947
|
|
15
|
|
11
|
|
|||||||||||||||||
|
AGRE Debt Fund I
(13)
|
2011
|
664
|
|
2,278
|
|
2,283
|
|
1,836
|
|
670
|
|
656
|
|
2,492
|
|
9
|
|
7
|
|
|||||||||||||||||
|
CPI Funds
(8)
|
Various
|
364
|
|
4,947
|
|
2,561
|
|
2,640
|
|
259
|
|
48
|
|
2,688
|
|
14
|
|
11
|
|
|||||||||||||||||
|
Asia RE Fund
(7)
|
2017
|
624
|
|
709
|
|
303
|
|
199
|
|
150
|
|
177
|
|
376
|
|
18
|
|
15
|
|
|||||||||||||||||
|
Infrastructure Equity Fund
|
2018
|
893
|
|
897
|
|
620
|
|
—
|
|
620
|
|
620
|
|
620
|
|
NM
|
|
(2)
|
NM
|
|
(2)
|
|||||||||||||||
|
Total Real Assets
(11)
|
$
|
4,291
|
|
$
|
10,715
|
|
$
|
7,110
|
|
$
|
5,692
|
|
$
|
2,435
|
|
$
|
2,400
|
|
$
|
8,092
|
|
|||||||||||||||
|
(1)
|
Refer to the definitions of Vintage Year, Total Invested Capital, Realized Value, Remaining Cost, Unrealized Value, Total Value, Gross IRR and Net IRR described elsewhere in this report.
|
|
(2)
|
Data has not been presented as the fund commenced investing capital less than 24 months prior to the period indicated and such information was deemed not meaningful.
|
|
(3)
|
The general partners and managers of Funds I, II and MIA, as well as the general partner of Fund III, were excluded assets in connection with the 2007 Reorganization. As a result, Apollo did not receive the economics associated with these entities. The investment performance of these funds, combined with Fund IV, is presented to illustrate fund performance associated with Apollo’s Managing Partners and other investment professionals.
|
|
(4)
|
Total IRR is calculated based on total cash flows for all funds presented.
|
-
105
-
|
(5)
|
Funds are denominated in Euros and historical figures are translated into U.S. dollars at an exchange rate of €1.00 to
$1.15
as of
December 31, 2018
.
|
|
(6)
|
Amounts presented have been aggregated for (i) drawdown funds with AUM greater than $500 million that do not form part of a flagship series of funds and (ii) SIAs with AUM greater than $200 million that do not predominantly invest in other Apollo funds or SIAs. Certain SIAs’ historical figures are denominated in Euros and translated into U.S. dollars at an exchange rate of €1.00 to
$1.15
as of
December 31, 2018
. Additionally, certain SIAs totaling
$1.7 billion
of AUM have been excluded from Total Invested Capital, Realized Value, Remaining Cost, Unrealized Value and Total Value. These SIAs have an open ended life and a significant turnover in their portfolio assets due to the ability to recycle capital. These SIAs had
$10.7 billion
of Total Invested Capital through
December 31, 2018
.
|
|
(7)
|
U.S. RE Fund I, U.S. RE Fund II and Asia RE Fund had
$155 million
,
$761 million
and
$366 million
of co-investment commitments as of
December 31, 2018
, respectively, which are included in the figures in the table. A co-invest entity within U.S. RE Fund I is denominated in pound sterling and translated into U.S. dollars at an exchange rate of £1.00 to
$1.28
as of
December 31, 2018
.
|
|
(8)
|
As part of the acquisition of CPI, Apollo acquired general partner interests in fully invested funds. CPI Funds refers to CPI Capital Partners North America, CPI Capital Partners Asia Pacific, CPI Capital Partners Europe and other CPI funds or individual investments of which Apollo is not the general partner or manager and only receives fees pursuant to either a sub-advisory agreement or an investment management and administrative agreement. For CPI Capital Partners North America, CPI Capital Partners Asia Pacific and CPI Capital Partners Europe, the gross and net IRRs are presented in the investment record table since acquisition on November 12, 2010. The aggregate net IRR for these funds from their inception to
December 31, 2018
was
(2)%
. This net IRR was primarily achieved during a period in which Apollo did not make the initial investment decisions and Apollo only became the general partner or manager of these funds upon completing the acquisition on November 12, 2010.
|
|
(9)
|
Private equity co-investment vehicles, funds with AUM less than $500 million and certain vehicles through which Apollo and certain funds and accounts managed or advised by Apollo hold an investment in a single asset, have been excluded. These vehicles and funds had
$10.7 billion
of aggregate AUM as of
December 31, 2018
.
|
|
(10)
|
Certain credit funds and SIAs with AUM less than $500 million and $200 million, respectively, have been excluded. These funds and SIAs had
$2.2 billion
of aggregate AUM as of
December 31, 2018
.
|
|
(11)
|
Certain accounts owned by or related to Athene, certain co-investment vehicles and certain funds with AUM less than $500 million have been excluded. These accounts, co-investment vehicles and funds had
$8.1 billion
of aggregate AUM as of
December 31, 2018
.
|
|
(12)
|
Remaining cost for certain of our credit funds may include physical cash called, invested or reserved for certain levered investments.
|
|
(13)
|
The investor in this U.S. Dollar denominated fund has chosen to make contributions and receive distributions in the local currency of each underlying investment. As a result, Apollo has not entered into foreign currency hedges for this fund and the returns presented include the impact of foreign currency gains or losses. The investor’s gross and net IRR, before the impact of foreign currency gains or losses, from the fund’s inception to
December 31, 2018
was
10%
and
9%
, respectively.
|
Private Equity
The following table summarizes the investment record for distressed investments made in our traditional private equity fund portfolios, since the Company’s inception. All amounts are as of
December 31, 2018
:
|
Total Invested
Capital |
Total Value
|
Gross IRR
|
||||||||
|
|
(in millions)
|
|
||||||||
|
Distressed for Control
|
$
|
7,890
|
|
$
|
19,072
|
|
29
|
%
|
||
|
Non-Control Distressed
|
5,416
|
|
8,399
|
|
71
|
|
||||
|
Total
|
13,306
|
|
27,471
|
|
49
|
|
||||
|
Corporate Carve-outs, Opportunistic Buyouts and Other Credit
(1)
|
44,699
|
|
77,864
|
|
21
|
|
||||
|
Total
|
$
|
58,005
|
|
$
|
105,335
|
|
39
|
%
|
||
|
(1)
|
Other Credit is defined as investments in debt securities of issuers other than portfolio companies that are not considered to be distressed.
|
The following tables provide additional detail on the composition of the Fund VIII, Fund VII and Fund VI private equity portfolios based on investment strategy. Amounts for Fund I, II, III, IV and V are included in the table above but not presented below as their remaining value is less than $100 million or the fund has been liquidated. All amounts are as of
December 31, 2018
:
Fund VIII
(1)
|
Total Invested
Capital
|
Total Value
|
||||||
|
|
(in millions)
|
||||||
|
Corporate Carve-outs
|
$
|
2,673
|
|
|
$
|
5,037
|
|
|
Opportunistic Buyouts
|
12,177
|
|
|
15,231
|
|
||
|
Distressed
|
520
|
|
|
823
|
|
||
|
Total
|
$
|
15,370
|
|
$
|
21,091
|
|
|
-
106
-
Fund VII
(1)
|
Total Invested
Capital |
Total Value
|
||||||
|
|
(in millions)
|
||||||
|
Corporate Carve-outs
|
$
|
2,312
|
|
|
$
|
4,079
|
|
|
Opportunistic Buyouts
|
4,338
|
|
|
10,353
|
|
||
|
Distressed/Other Credit
(2)
|
9,583
|
|
|
18,695
|
|
||
|
Total
|
$
|
16,233
|
|
$
|
33,127
|
|
|
Fund VI
|
Total Invested
Capital |
Total Value
|
||||||
|
|
(in millions)
|
||||||
|
Corporate Carve-outs
|
$
|
3,397
|
|
|
$
|
5,828
|
|
|
Opportunistic Buyouts
|
6,374
|
|
|
10,188
|
|
||
|
Distressed/Other Credit
(2)
|
2,686
|
|
|
4,974
|
|
||
|
Total
|
$
|
12,457
|
|
$
|
20,990
|
|
|
|
(1)
|
Committed capital less unfunded capital commitments for Fund VIII and Fund VII was
$15.0 billion
and
$14.1 billion
, respectively, which represents capital commitments from limited partners to invest in such funds less capital that is available for investment or reinvestment subject to the provisions of the applicable limited partnership agreement or other governing agreements.
|
|
(2)
|
The distressed investment strategy includes distressed for control, non-control distressed and other credit.
|
During the recovery and expansionary periods of 1994 through 2000 and late 2003 through the first half of 2007, our private equity funds invested or committed to invest approximately
$13.7 billion
primarily in traditional and corporate partner buyouts. During the recessionary periods of 1990 through 1993, 2001 through late 2003 and the recessionary and post recessionary periods (beginning the second half of 2007 through
December 31, 2018
), our private equity funds have invested
$49.9 billion
, of which
$19.1 billion
was in distressed buyouts and debt investments when the debt securities of quality companies traded at deep discounts to par value. Our average entry multiple for Fund VIII, VII and VI was
5.7x
,
6.1x
and
7.7x
, respectively, as of
December 31, 2018
. Our average entry multiple for a private equity fund is the average of the total enterprise value over an applicable adjusted earnings before interest, taxes, depreciation and amortization which may incorporate certain adjustments based on the investment team’s estimate and we believe captures the true economics of our funds’ investments in portfolio companies. The average entry multiple of actively investing funds may include committed investments not yet closed.
Credit
The following table presents the AUM and gross and net returns information for Apollo’s credit segment by category type:
|
|
As of December 31, 2018
|
Gross Returns
(1)
|
Net Returns
(1)
|
||||||||||||||||
|
AUM
|
Fee-Generating AUM
|
Performance Fee-Eligible AUM
|
Performance Fee-Generating AUM
(2)
|
For the Year Ended December 31, 2018
|
For the Year Ended December 31, 2018
|
||||||||||||||
|
Category
|
(in millions)
|
||||||||||||||||||
|
Liquid/Performing
(3)
|
$
|
54,825
|
|
$
|
40,323
|
|
$
|
25,481
|
|
$
|
7,979
|
|
1.2%
|
0.8%
|
|||||
|
Drawdown
(4)
|
25,988
|
|
14,124
|
|
19,603
|
|
6,164
|
|
1.7
|
(0.1)
|
|||||||||
|
Permanent capital vehicles ex Athene Non-Sub-Advised
(5)
|
14,831
|
|
13,524
|
|
12,151
|
|
10,910
|
|
13.3
|
8.8
|
|||||||||
|
Athene Non-Sub-Advised
(5)
|
85,575
|
|
85,575
|
|
—
|
|
—
|
|
N/A
|
N/A
|
|||||||||
|
Athora Non-Sub-Advised
(5)
|
4,952
|
|
4,485
|
|
1,859
|
|
—
|
|
N/A
|
N/A
|
|||||||||
|
Advisory
|
7,065
|
|
—
|
|
—
|
|
—
|
|
N/A
|
N/A
|
|||||||||
|
Total Credit
|
$
|
193,236
|
|
$
|
158,031
|
|
$
|
59,094
|
|
$
|
25,053
|
|
2.2%
|
(2.2)%
|
|||||
|
(1)
|
The gross and net returns for the
year ended
December 31, 2018
for total credit excludes assets managed by AAM that are not directly invested in Apollo funds and investment vehicles or sub-advised by Apollo.
|
|
(2)
|
As of
December 31, 2018
,
$0.2 billion
of the Performance Fee-Generating AUM is currently above its hurdle rate or preferred return, but in accordance with the adoption of the revenue recognition standard effective January 1, 2018, recognition of performance fees associated with such Performance Fee-Generating AUM has been deferred to future periods when the fees are probable to not be significantly reversed.
|
-
107
-
|
(3)
|
Liquid/Performing AUM includes
$14.4 billion
of CLOs,
$8.9 billion
of which Apollo earns fees based on gross assets and
$5.5 billion
of which Apollo earns fees based on net equity.
|
|
(4)
|
Significant drawdown funds and SIAs had inception-to-date gross and net IRRs of
15.0%
and
11.2%
, respectively, as of
December 31, 2018
. Significant drawdown funds and SIAs include funds and SIAs with AUM greater than $200 million that do not predominantly invest in other Apollo funds or SIAs.
|
|
(5)
|
Athene Non-Sub-Advised and Athora Non-Sub Advised reflects total combined AUM of
$116.8 billion
less
$26.2 billion
of assets that were either sub-advised by Apollo or invested in funds and investment vehicles managed by Apollo included within other asset categories.
|
Liquid/Performing
The following table summarizes the investment record for funds in the liquid/performing category within Apollo’s credit segment. The significant funds included in the investment record table below have greater than $200 million of AUM and do not predominantly invest in other Apollo funds or SIAs.
|
|
|
Total AUM
|
Net Returns
|
||||||||
|
|
Vintage
Year |
As of December 31, 2018
|
For the Year Ended December 31, 2018
|
For the Year Ended December 31, 2017
|
|||||||
|
Credit:
|
(in millions)
|
||||||||||
|
Hedge Funds
(1)
|
Various
|
$
|
7,159
|
|
1
|
%
|
5
|
%
|
|||
|
CLOs
(2)
|
Various
|
14,371
|
|
1
|
|
4
|
|
||||
|
SIAs / Other
|
Various
|
33,295
|
|
1
|
%
|
7
|
%
|
||||
|
Total
|
$
|
54,825
|
|
||||||||
|
(1)
|
Hedge Funds primarily includes Apollo Credit Strategies Master Fund Ltd. and Apollo Credit Master Fund Ltd.
|
|
(2)
|
CLO returns are calculated based on gross return on invested assets, which excludes cash. Included within Total AUM of CLOs is
$5.5 billion
of AUM related to Redding Ridge, from which Apollo earns investment-related service fees, but for which Apollo does not provide management or advisory services. CLO returns exclude performance related to this AUM.
|
Permanent Capital
The following table summarizes the investment record for our permanent capital vehicles by segment, excluding Athene-related and Athora-related assets managed or advised by Athene Asset Management and AAME:
|
Total AUM
|
Total Returns
(1)
|
||||||||||
|
IPO Year
(2)
|
As of December 31, 2018
|
For the Year Ended December 31, 2018
|
For the Year Ended December 31, 2017
|
||||||||
|
Credit:
|
(in millions)
|
||||||||||
|
MidCap
(3)
|
N/A
|
$
|
8,771
|
|
19
|
%
|
12
|
%
|
|||
|
AIF
|
2013
|
365
|
|
(5
|
)
|
10
|
|
||||
|
AFT
|
2011
|
404
|
|
(4
|
)
|
—
|
|
||||
|
AINV/Other
(4)
|
2004
|
4,503
|
|
(18
|
)
|
6
|
|
||||
|
Real Assets:
|
|||||||||||
|
ARI
(5)
|
2009
|
5,224
|
|
—
|
%
|
22
|
%
|
||||
|
Total
|
$
|
19,267
|
|
||||||||
|
(1)
|
Total returns are based on the change in closing trading prices during the respective periods presented taking into account dividends and distributions, if any, as if they were reinvested without regard to commission.
|
|
(2)
|
An IPO year represents the year in which the vehicle commenced trading on a national securities exchange.
|
|
(3)
|
MidCap is not a publicly traded vehicle and therefore IPO year is not applicable. The returns presented are a gross return based on NAV. The net returns based on NAV were
14%
and
8%
for the
years ended
December 31, 2018
and
December 31, 2017
, respectively.
|
|
(4)
|
Included within Total AUM of AINV/Other is
$2.0 billion
of AUM related to a non-traded business development company from which Apollo earns investment-related service fees, but for which Apollo does not provide management or advisory services. Net returns exclude performance related to this AUM.
|
|
(5)
|
Amounts are as of
September 30, 2018
. Refer to www.apolloreit.com for the most recent financial information on ARI. The information contained on ARI’s website is not part of this presentation.
|
Athene, Athora and SIAs
As of
December 31, 2018
, Apollo managed or advised
$116.8 billion
of total AUM in accounts owned by or related to Athene and Athora, of which approximately
$26.2 billion
was either sub-advised by Apollo or invested in Apollo funds and
-
108
-
investment vehicles managed by Apollo. Of the approximately
$26.2 billion
of AUM, the vast majority were in sub-advisory managed accounts that manage high grade credit asset classes, such as CLO debt, commercial mortgage backed securities, and insurance-linked securities.
As of
December 31, 2018
, Apollo managed approximately
$24 billion
of total AUM in SIAs, which include certain SIAs in the investment record tables above and capital deployed from certain SIAs across Apollo’s credit, private equity and real assets funds.
Overview of Results of Operations
Revenues
Advisory
and Transaction Fees, Net.
As a result of providing advisory services with respect to actual and potential credit, private equity, and real assets investments, we are entitled to receive fees for transactions related to the acquisition and, in certain instances, disposition of portfolio companies as well as fees for ongoing monitoring of portfolio company operations and directors’ fees. We also receive advisory fees for advisory services provided to certain credit funds. In addition, monitoring fees are generated on certain structured portfolio company investments. Under the terms of the limited partnership agreements for certain funds, the management fee payable by the funds may be subject to a reduction based on a certain percentage of such advisory and transaction fees, net of applicable broken deal costs (“Management Fee Offset”). Such amounts are presented as a reduction to advisory and transaction fees, net, in the
consolidated
statements of operations (see note
2
to our
consolidated
financial statements for more detail on advisory and transaction fees, net).
The Management Fee Offsets are calculated for each fund as follows:
|
•
|
65%-100% for certain credit funds, gross advisory, transaction and other special fees;
|
|
•
|
65%-100% for private equity funds, gross advisory, transaction and other special fees; and
|
|
•
|
100% for certain real assets funds, gross advisory, transaction and other special fees.
|
Management Fees.
The significant growth of the assets we manage has had a positive effect on our revenues. Management fees are typically calculated based upon any of “net asset value,” “gross assets,” “adjusted par asset value,” “adjusted costs of all unrealized portfolio investments,” “capital commitments,” “invested capital,” “adjusted assets,” “capital contributions,” or “stockholders’ equity,” each as defined in the applicable limited partnership agreement and/or management agreement of the unconsolidated funds.
Performance Fees.
The general partners of our funds are entitled to an incentive return of normally up to 20% of the total returns of a fund’s capital, depending upon performance of the underlying funds and subject to preferred returns and high water marks, as applicable. Performance fees, categorized as performance allocations, are accounted for as an equity method investment, and effectively, the performance fees for any period are based upon an assumed liquidation of the funds’ assets at the reporting date, and distribution of the net proceeds in accordance with the funds’ allocation provisions. Performance fees categorized as incentive fees, which are not accounted as an equity method investment, are deferred until fees are probable to not be significantly reversed. Prior to the adoption of the new revenue recognition guidance, incentive fees were recognized on an assumed liquidation basis.The majority of performance fees are comprised of performance allocations.
As of
December 31, 2018
, approximately
55%
of the value of our funds’ investments on a gross basis was determined using market-based valuation methods (i.e., reliance on broker or listed exchange quotes) and the remaining
45%
was determined primarily by comparable company and industry multiples or discounted cash flow models. For our credit, private equity and real assets segments, the percentage determined using market-based valuation methods as of
December 31, 2018
was
71%
,
20%
and
35%
, respectively. See “Item
1A
. Risk Factors—Risks Related to Our Businesses—Our funds’ performance, and our performance, may be adversely affected by the financial performance of our funds’ portfolio companies and the industries in which our funds invest” for a discussion regarding certain industry-specific risks that could affect the fair value of our private equity funds’ portfolio company investments.
In our private equity funds, the Company does not earn performance fees until the investors in the fund have achieved cumulative investment returns on invested capital (including management fees and expenses) in excess of an 8% hurdle rate. Additionally, certain of our credit and real assets funds have various performance fee rates and hurdle rates. Certain of our credit and real assets funds allocate performance fees to the general partner in a similar manner as the private equity funds. In our private equity, certain credit and real assets funds, so long as the investors achieve their priority returns, there is a catch-up formula whereby the Company earns a priority return for a portion of the return until the Company’s performance fees equate to its incentive fee rate for that fund; thereafter, the Company participates in returns from the fund at the performance fee rate. Performance fees,
-
109
-
categorized as performance allocations, are subject to reversal to the extent that the performance fees distributed exceed the amount due to the general partner based on a fund’s cumulative investment returns. The Company recognizes potential repayment of previously received performance fees as a general partner obligation representing all amounts previously distributed to the general partner that would need to be repaid to the Apollo funds if these funds were to be liquidated based on the current fair value of the underlying funds’ investments as of the reporting date. The actual general partner obligation, however, would not become payable or realized until the end of a fund’s life or as otherwise set forth in the respective limited partnership agreement of the fund.
The table below presents an analysis of Apollo’s (i) performance fees receivable on an unconsolidated basis and (ii) realized and unrealized performance fees for Apollo’s combined segments:
|
As of December 31,
|
|||||||||||||||||||||||||||||||||||||||||||
|
|
2018
|
2017
|
For the Year Ended December 31, 2018
|
For the Year Ended December 31, 2017
|
For the Year Ended December 31, 2016
|
||||||||||||||||||||||||||||||||||||||
|
|
Performance Fees Receivable on an Unconsolidated Basis
|
Unrealized
Performance Fees |
Realized
Performance Fees |
Total
Performance Fees |
Unrealized
Performance Fees |
Realized
Performance Fees |
Total
Performance Fees |
Unrealized
Performance Fees |
Realized
Performance Fees |
Total
Performance Fees |
|||||||||||||||||||||||||||||||||
|
|
(in thousands)
|
||||||||||||||||||||||||||||||||||||||||||
|
Credit:
|
|||||||||||||||||||||||||||||||||||||||||||
|
Drawdown
(1)
|
$
|
253,525
|
|
$
|
323,860
|
|
$
|
(57,536
|
)
|
$
|
80,435
|
|
$
|
22,899
|
|
$
|
35,493
|
|
$
|
137,786
|
|
$
|
173,279
|
|
$
|
119,925
|
|
$
|
65,047
|
|
$
|
184,972
|
|
||||||||||
|
Liquid/Performing
|
16,505
|
|
52,803
|
|
436
|
|
25,400
|
|
25,836
|
|
(12,103
|
)
|
41,521
|
|
29,418
|
|
(3,197
|
)
|
92,041
|
|
88,844
|
|
|||||||||||||||||||||
|
Permanent capital vehicles
|
111,303
|
|
63,588
|
|
50,189
|
|
24,644
|
|
74,833
|
|
27,835
|
|
17,666
|
|
45,501
|
|
20,546
|
|
22,941
|
|
43,487
|
|
|||||||||||||||||||||
|
Total Credit
|
381,333
|
|
440,251
|
|
(6,911
|
)
|
130,479
|
|
123,568
|
|
51,225
|
|
196,973
|
|
248,198
|
|
137,274
|
|
180,029
|
|
317,303
|
|
|||||||||||||||||||||
|
Total Credit, net of profit share
|
141,808
|
|
174,461
|
|
(6,388
|
)
|
59,859
|
|
53,471
|
|
32,957
|
|
119,172
|
|
152,129
|
|
74,261
|
|
95,315
|
|
169,576
|
|
|||||||||||||||||||||
|
Private Equity:
|
|||||||||||||||||||||||||||||||||||||||||||
|
Fund VIII
(2)
|
441,736
|
|
1,017,000
|
|
(575,264
|
)
|
213,549
|
|
(361,715
|
)
|
693,772
|
|
206,393
|
|
900,165
|
|
323,228
|
|
10,653
|
|
333,881
|
|
|||||||||||||||||||||
|
Fund VII
(1)(2)
|
214
|
|
70,499
|
|
(108,938
|
)
|
7,350
|
|
(101,588
|
)
|
(4,156
|
)
|
19,817
|
|
15,661
|
|
5,922
|
|
9,844
|
|
15,766
|
|
|||||||||||||||||||||
|
Fund VI
(1)(2)
|
312
|
|
38,758
|
|
(51,851
|
)
|
3,338
|
|
(48,513
|
)
|
80,996
|
|
—
|
|
80,996
|
|
(94,798
|
)
|
—
|
|
(94,798
|
)
|
|||||||||||||||||||||
|
Fund IV and V
(1)
|
—
|
|
—
|
|
(4,459
|
)
|
—
|
|
(4,459
|
)
|
(13,775
|
)
|
—
|
|
(13,775
|
)
|
(6,442
|
)
|
266
|
|
(6,176
|
)
|
|||||||||||||||||||||
|
ANRP I and II
(1)(2)
|
34,017
|
|
34,710
|
|
(3,325
|
)
|
11,612
|
|
8,287
|
|
(52,167
|
)
|
59,519
|
|
7,352
|
|
80,924
|
|
13,326
|
|
94,250
|
|
|||||||||||||||||||||
|
AAA/Other
(3)
|
46,328
|
|
243,809
|
|
(197,853
|
)
|
205,514
|
|
7,661
|
|
(62,544
|
)
|
148,254
|
|
85,710
|
|
59,973
|
|
48,203
|
|
108,176
|
|
|||||||||||||||||||||
|
Total Private Equity
|
522,607
|
|
1,404,776
|
|
(941,690
|
)
|
441,363
|
|
(500,327
|
)
|
642,126
|
|
433,983
|
|
1,076,109
|
|
368,807
|
|
82,292
|
|
451,099
|
|
|||||||||||||||||||||
|
Total Private Equity, net of profit share
|
321,001
|
|
929,220
|
|
(621,751
|
)
|
243,490
|
|
(378,261
|
)
|
430,150
|
|
242,413
|
|
672,563
|
|
254,163
|
|
38,399
|
|
292,562
|
|
|||||||||||||||||||||
|
Real Assets Funds:
|
|||||||||||||||||||||||||||||||||||||||||||
|
U.S. RE Fund I & II
|
16,158
|
|
18,311
|
|
(1,137
|
)
|
1,448
|
|
311
|
|
(2,968
|
)
|
11,925
|
|
8,957
|
|
1,268
|
|
8,160
|
|
9,428
|
|
|||||||||||||||||||||
|
Other
(3)
|
7,133
|
|
10,499
|
|
(3,031
|
)
|
5,169
|
|
2,138
|
|
(1,818
|
)
|
6,144
|
|
4,326
|
|
3,650
|
|
4,406
|
|
8,056
|
|
|||||||||||||||||||||
|
Total Real Assets
|
23,291
|
|
28,810
|
|
(4,168
|
)
|
6,617
|
|
2,449
|
|
(4,786
|
)
|
18,069
|
|
13,283
|
|
4,918
|
|
12,566
|
|
17,484
|
|
|||||||||||||||||||||
|
Total Real Assets, net of profit share
|
12,281
|
|
17,882
|
|
(3,195
|
)
|
2,858
|
|
(337
|
)
|
(859
|
)
|
8,600
|
|
7,741
|
|
2,717
|
|
4,382
|
|
7,099
|
|
|||||||||||||||||||||
|
Total
|
$
|
927,231
|
|
$
|
1,873,837
|
|
$
|
(952,769
|
)
|
$
|
578,459
|
|
$
|
(374,310
|
)
|
$
|
688,565
|
|
$
|
649,025
|
|
$
|
1,337,590
|
|
$
|
510,999
|
|
$
|
274,887
|
|
$
|
785,886
|
|
||||||||||
|
Total, net of profit share
(4)
|
$
|
475,090
|
|
$
|
1,121,563
|
|
$
|
(631,334
|
)
|
$
|
306,207
|
|
$
|
(325,127
|
)
|
$
|
462,248
|
|
$
|
370,185
|
|
$
|
832,433
|
|
$
|
331,141
|
|
$
|
138,096
|
|
$
|
469,237
|
|
||||||||||
|
(1)
|
As of
December 31, 2018
, certain credit funds and certain private equity funds had
$44.1 million
and
$93.0 million
, respectively, in general partner obligations to return previously distributed performance fees. The fair value gain on investments and income at the fund level needed to reverse the general partner obligations for certain credit funds and certain private equity funds was
$355.2 million
and
$723.2 million
, respectively, as of
December 31, 2018
.
|
|
(2)
|
As of
December 31, 2018
, the remaining investments and escrow cash of Fund VIII were valued at 118% of the fund’s unreturned capital, which was above the required escrow ratio of 115%. As of
December 31, 2018
, the remaining investments and escrow cash of Fund VII, Fund VI, ANRP and ANRP II were valued at
77%
,
73%
, 63% and
107%
of the fund’s unreturned capital, respectively, which were below the required escrow ratio of 115%. As a result, these funds are required to place in escrow current and future performance fee distributions to the general partner until the specified return ratio of 115% is met (at the time of a future distribution) or upon liquidation. As of
December 31, 2018
, Fund VII had
$128.5 million
of gross performance fees, or
$73.1 million
net of profit sharing, in escrow. As of
December 31, 2018
, Fund VI had
$167.6 million
of gross performance fees, or
$112.4 million
net of profit sharing, in escrow. As of
December 31, 2018
, ANRP had
$38.7 million
of gross performance fees, or
$24.3 million
net of profit sharing, in escrow. As of
December 31, 2018
, ANRP II had $
18.4 million
of gross performance fees, or $
12.5 million
net of profit sharing, in escrow. With respect to Fund VII, Fund VI, ANRP II and ANRP I, realized performance fees currently distributed to the general partner are limited to potential tax distributions and interest on escrow balances per the funds’ partnership agreements. Performance fees receivable as of
December 31, 2018
includes interest earned on escrow balances that is not subject to contingent repayment.
|
|
(3)
|
The year ended December 31, 2018 includes realized performance fees of
$169.9 million
(
$123.3 million
net of profit sharing expense) from AAA, settled in the form of shares of Athene Holding. Other includes certain SIAs.
|
|
(4)
|
There was a corresponding profit sharing payable of
$452.1 million
as of
December 31, 2018
, including profit sharing payable related to amounts in escrow and contingent consideration obligations of
$74.5 million
.
|
The general partners of certain of our credit funds accrue performance fees, categorized as performance allocations, when the fair value of investments exceeds the cost basis of the individual investors’ investments in the fund, including any allocable share of expenses incurred in connection with such investments, which we refer to as “high water marks.” These high water marks
-
110
-
are applied on an individual investor basis. Certain of our credit funds have investors with various high water marks, the achievement of which is subject to market conditions and investment performance.
Performance fees from our private equity funds and certain credit and real assets funds are subject to contingent repayment by the general partner in the event of future losses to the extent that the cumulative performance fees distributed from inception to date exceeds the amount computed as due to the general partner at the final distribution. These general partner obligations, if applicable, are included in due to related parties on the
consolidated
statements of financial condition.
The following table summarizes our performance fees since inception for our combined segments through
December 31, 2018
:
|
Performance Fees Since Inception
(1)
|
|||||||||||||||||||
|
|
Undistributed by Fund and Recognized
|
Distributed by Fund and Recognized
(2)
|
Total Undistributed and Distributed by Fund and Recognized
(3)
|
General Partner Obligation as of December 31, 2018
(3)
|
Maximum Performance Fees Subject to Potential Reversal
(4)
|
||||||||||||||
|
|
(in millions)
|
||||||||||||||||||
|
Credit
(5)
:
|
|||||||||||||||||||
|
Drawdown
|
$
|
249.8
|
|
$
|
1,160.7
|
|
$
|
1,410.5
|
|
$
|
42.7
|
|
$
|
425.6
|
|
||||
|
Liquid/Performing
|
16.5
|
|
546.3
|
|
562.8
|
|
1.4
|
|
20.5
|
|
|||||||||
|
Permanent capital vehicles
|
102.1
|
|
—
|
|
102.1
|
|
—
|
|
102.1
|
|
|||||||||
|
Total Credit
|
368.4
|
|
1,707.0
|
|
2,075.4
|
|
44.1
|
|
548.2
|
|
|||||||||
|
Private Equity:
|
|||||||||||||||||||
|
Fund VIII
|
441.7
|
|
430.6
|
|
872.3
|
|
—
|
|
692.1
|
|
|||||||||
|
Fund VII
|
0.2
|
|
3,128.8
|
|
3,129.0
|
|
38.7
|
|
454.4
|
|
|||||||||
|
Fund VI
|
0.3
|
|
1,662.0
|
|
1,662.3
|
|
13.1
|
|
482.1
|
|
|||||||||
|
Fund IV and V
|
—
|
|
2,053.1
|
|
2,053.1
|
|
29.2
|
|
2.4
|
|
|||||||||
|
ANRP I and II
|
34.0
|
|
90.6
|
|
124.6
|
|
12.0
|
|
53.9
|
|
|||||||||
|
AAA/Other
(5)
|
46.3
|
|
564.7
|
|
611.0
|
|
|
|
89.2
|
|
|||||||||
|
Total Private Equity
|
522.5
|
|
7,929.8
|
|
8,452.3
|
|
93.0
|
|
1,774.1
|
|
|||||||||
|
Real Assets:
|
|||||||||||||||||||
|
U.S. RE Fund I and II
|
16.2
|
|
26.2
|
|
42.4
|
|
—
|
|
36.1
|
|
|||||||||
|
Other
(6)
|
7.1
|
|
25.9
|
|
33.0
|
|
—
|
|
25.6
|
|
|||||||||
|
Total Real Assets
|
23.3
|
|
52.1
|
|
75.4
|
|
—
|
|
61.7
|
|
|||||||||
|
Total
|
$
|
914.2
|
|
$
|
9,688.9
|
|
$
|
10,603.1
|
|
$
|
137.1
|
|
$
|
2,384.0
|
|
||||
|
(1)
|
Certain funds are denominated in Euros and historical figures are translated into U.S. dollars at an exchange rate of €1.00 to
$1.15
as of
December 31, 2018
. Certain funds are denominated in pound sterling and translated into U.S. dollars at an exchange rate of £1.00 to
$1.28
as of
December 31, 2018
.
|
|
(2)
|
Amounts in “Distributed by Fund and Recognized” for the CPI, Gulf Stream Asset Management, LLC (“Gulf Stream”) and Stone Tower funds and SIAs are presented for activity subsequent to the respective acquisition dates.
|
|
(3)
|
Amounts were computed based on the fair value of fund investments on
December 31, 2018
. Performance fees have been allocated to and recognized by the general partner. Based on the amount allocated, a portion is subject to potential reversal or, to the extent applicable, has been reduced by the general partner obligation to return previously distributed performance fees at
December 31, 2018
. The actual determination and any required payment of any such general partner obligation would not take place until the final disposition of the fund’s investments based on contractual termination of the fund.
|
|
(4)
|
Represents the amount of performance fees that would be reversed if remaining fund investments became worthless on
December 31, 2018
. Amounts subject to potential reversal of performance fees include amounts undistributed by a fund (i.e., the performance fees receivable), as well as a portion of the amounts that have been distributed by a fund, net of taxes not subject to a general partner obligation to return previously distributed performance fees, except for those funds that are gross of taxes as defined in the respective funds’ governing documents.
|
|
(5)
|
Amounts exclude certain performance fees from business development companies and Redding Ridge Holdings.
|
|
(6)
|
Other includes certain SIAs.
|
-
111
-
Expenses
Compensation and Benefits.
Our most significant expense is compensation and benefits expense. This consists of fixed salary, discretionary and non-discretionary bonuses, profit sharing expense associated with the performance fees earned from credit, private equity, and real assets funds and compensation expense associated with the vesting of non-cash equity-based awards.
Our compensation arrangements with certain partners and employees contain a significant performance-based incentive component. Therefore, as our net revenues increase, our compensation costs rise. Our compensation costs also reflect the increased investment in people as we expand geographically and create new funds.
In addition, certain professionals and selected other individuals have a profit sharing interest in the performance fees earned in relation to our private equity, certain credit and real assets funds in order to better align their interests with our own and with those of the investors in these funds. Profit sharing expense is part of our compensation and benefits expense and is generally based upon a fixed percentage of credit, private equity and real assets performance fees. Profit sharing expense can reverse during periods when there is a decline in performance fees that were previously recognized. Profit sharing amounts are normally distributed to employees after the corresponding investment gains have been realized and generally before preferred returns are achieved for the investors. Therefore, changes in our unrealized performance fees have the same effect on our profit sharing expense. Profit sharing expense increases when unrealized performance fees increases. Realizations only impact profit sharing expense to the extent that the effects on investments have not been recognized previously. If losses on other investments within a fund are subsequently realized, the profit sharing amounts previously distributed are normally subject to a general partner obligation to return performance fees previously distributed back to the funds. This general partner obligation due to the funds would be realized only when the fund is liquidated, which generally occurs at the end of the fund’s term. However, indemnification obligations also exist for realized gains with respect to Fund IV, Fund V and Fund VI, which, although our Managing Partners and Contributing Partners would remain personally liable, may indemnify our Managing Partners and Contributing Partners for 17.5% to 100% of the previously distributed profits regardless of the fund’s future performance. See note
14
to our
consolidated
financial statements for further information regarding the Company’s indemnification liability.
Each Managing Partner receives
$100,000
per year in base salary for services rendered to us. Additionally, our Managing Partners can receive other forms of compensation. In addition, AHL Awards (as defined in note
12
to our
consolidated
financial statements) and other equity-based compensation awards have been granted to the Company and certain employees, which amortize over the respective vesting periods. The Company grants equity awards to certain employees, including RSUs, restricted Class A shares and options, that generally vest and become exercisable in quarterly installments or annual installments depending on the contract terms over a period of three to six years. In some instances, vesting of an RSU is also subject to the Company’s receipt of performance fees, within prescribed periods, sufficient to cover the associated equity-based compensation expense. See note
12
to our
consolidated
financial statements for further discussion of equity-based compensation.
Other Expenses.
The balance of our other expenses includes interest, placement fees, and general, administrative and other operating expenses. Interest expense consists primarily of interest related to the 2013 AMH Credit Facilities, the 2018 AMH Credit Facility, the 2024 Senior Notes, the 2026 Senior Notes and the 2048 Senior Notes as discussed in note
10
to our
consolidated
financial statements. Placement fees are incurred in connection with our capital raising activities. General, administrative and other expenses includes occupancy expense, depreciation and amortization, professional fees and costs related to travel, information technology and administration. Occupancy expense represents charges related to office leases and associated expenses, such as utilities and maintenance fees. Depreciation and amortization of fixed assets is normally calculated using the straight-line method over their estimated useful lives, ranging from two to sixteen years, taking into consideration any residual value. Leasehold improvements are amortized over the shorter of the useful life of the asset or the expected term of the lease. Intangible assets are amortized based on the future cash flows over the expected useful lives of the assets.
Other Income (Loss)
Net Gains (Losses) from Investment Activities.
Net gains (losses) from investment activities include both realized gains and losses and the change in unrealized gains and losses in our investment portfolio between the opening reporting date and the closing reporting date. Net unrealized gains (losses) are a result of changes in the fair value of unrealized investments and reversal of unrealized gains (losses) due to dispositions of investments during the reporting period. Significant judgment and estimation goes into the assumptions that drive these models and the actual values realized with respect to investments could be materially different from values obtained based on the use of those models. The valuation methodologies applied impact the reported value of investment company holdings and their underlying portfolios in our
consolidated
financial statements.
Net Gains (Losses) from Investment Activities of Consolidated Variable Interest Entities.
Changes in the fair value of the consolidated VIEs’ assets and liabilities and related interest, dividend and other income and expenses subsequent to
-
112
-
consolidation are presented within net gains (losses) from investment activities of consolidated variable interest entities and are attributable to Non-Controlling Interests in the
consolidated
statements of operations.
Other Income (Losses), Net.
Other income (losses), net includes gains (losses) arising from the remeasurement of foreign currency denominated assets and liabilities, remeasurement of the tax receivable agreement liability related to the TCJA and other miscellaneous non-operating income and expenses.
Income Taxes
. The Apollo Operating Group and its subsidiaries generally operate as partnerships for U.S. federal income tax purposes. As a result, except as described below, the Apollo Operating Group has not been subject to U.S. income taxes. However, the U.S. entities, in some cases, are subject to New York City unincorporated business tax (“NYC UBT”), and non-U.S. entities, in some cases, are subject to non-U.S. corporate income taxes. In addition, certain consolidated entities are, or are treated as, corporations for U.S. and non-U.S. tax purposes and therefore subject to federal, state, local and foreign corporate income tax. The Company's provision for income taxes is accounted for in accordance with U.S. GAAP.
Significant judgment is required in determining the provision for income taxes and in evaluating income tax positions, including evaluating uncertainties. We recognize the income tax benefits of uncertain tax positions only where the position is “more likely than not” to be sustained upon examination, including resolutions of any related appeals or litigation, based on the technical merits of the positions. The tax benefit is measured as the largest amount of benefit that has a greater than 50% likelihood of being realized upon ultimate settlement. If a tax position is not considered more likely than not to be sustained, then no benefits of the position are recognized. The Company’s income tax positions are reviewed and evaluated quarterly to determine whether or not we have uncertain tax positions that require financial statement recognition or de-recognition.
Deferred tax assets and liabilities are recognized for the expected future tax consequences, using currently enacted tax rates, of differences between the carrying amount of assets and liabilities and their respective tax basis. The effect on deferred tax assets and liabilities of a change in tax rates is recognized in income in the period when the change is enacted. Deferred tax assets are reduced by a valuation allowance when it is more likely than not that some portion or all of the deferred tax assets will not be realized.
Non-Controlling Interests
For entities that are consolidated, but not 100% owned, a portion of the income or loss and corresponding equity is allocated to owners other than Apollo. The aggregate of the income or loss and corresponding equity that is not owned by the Company is included in Non-Controlling Interests in the
consolidated
financial statements. The Non-Controlling Interests relating to Apollo Global Management, LLC primarily include the
50.1%
and
51.5%
ownership interest in the Apollo Operating Group held by the Managing Partners and Contributing Partners through their limited partner interests in Holdings as of
December 31, 2018
and
2017
, respectively. Non-Controlling Interests also include limited partner interests in certain consolidated funds and VIEs.
The authoritative guidance for Non-Controlling Interests in the
consolidated
financial statements requires reporting entities to present Non-Controlling Interest as equity and provides guidance on the accounting for transactions between an entity and Non-Controlling Interests. According to the guidance, (1) Non-Controlling Interests are presented as a separate component of shareholders’ equity on the Company’s
consolidated
statements of financial condition, (2) net income (loss) includes the net income (loss) attributable to the Non-Controlling Interest holders on the Company’s
consolidated
statements of operations, (3) the primary components of Non-Controlling Interest are separately presented in the Company’s
consolidated
statements of changes in shareholders’ equity to clearly distinguish the interests in the Apollo Operating Group and other ownership interests in the consolidated entities and (4) profits and losses are allocated to Non-Controlling Interests in proportion to their ownership interests regardless of their basis.
-
113
-
Results of Operations
Below is a discussion of our
consolidated
results of operations for the
years ended
December 31, 2018, 2017 and 2016
. For additional analysis of the factors that affected our results at the segment level, see “—Segment Analysis” below:
|
|
For the Years Ended December 31,
|
Amount
Change |
Percentage
Change |
For the Years Ended December 31,
|
Amount
Change |
Percentage
Change |
|||||||||||||||||||||||
|
|
2018
|
2017
|
2017
|
2016
|
|||||||||||||||||||||||||
|
(in thousands)
|
(in thousands)
|
||||||||||||||||||||||||||||
|
Revenues:
|
|||||||||||||||||||||||||||||
|
Management fees
|
$
|
1,345,252
|
|
$
|
1,154,925
|
|
$
|
190,327
|
|
16.5
|
%
|
$
|
1,154,925
|
|
$
|
1,043,513
|
|
$
|
111,412
|
|
10.7
|
%
|
|||||||
|
Advisory and transaction fees, net
|
112,278
|
|
117,624
|
|
(5,346
|
)
|
(4.5
|
)
|
117,624
|
|
146,665
|
|
(29,041
|
)
|
(19.8
|
)
|
|||||||||||||
|
Investment income (loss):
|
|||||||||||||||||||||||||||||
|
Performance allocations
|
(400,305
|
)
|
1,306,193
|
|
(1,706,498
|
)
|
NM
|
|
1,306,193
|
|
712,865
|
|
593,328
|
|
83.2
|
|
|||||||||||||
|
Principal investment income
|
5,122
|
|
161,630
|
|
(156,508
|
)
|
(96.8
|
)
|
161,630
|
|
103,178
|
|
58,452
|
|
56.7
|
|
|||||||||||||
|
Total investment income (loss)
|
(395,183
|
)
|
1,467,823
|
|
(1,863,006
|
)
|
NM
|
|
1,467,823
|
|
816,043
|
|
651,780
|
|
79.9
|
|
|||||||||||||
|
Incentive fees
|
30,718
|
|
31,431
|
|
(713
|
)
|
(2.3
|
)
|
31,431
|
|
67,341
|
|
(35,910
|
)
|
(53.3
|
)
|
|||||||||||||
|
Total Revenues
|
1,093,065
|
|
2,771,803
|
|
(1,678,738
|
)
|
(60.6
|
)
|
2,771,803
|
|
2,073,562
|
|
698,241
|
|
33.7
|
|
|||||||||||||
|
Expenses:
|
|||||||||||||||||||||||||||||
|
Compensation and benefits:
|
|||||||||||||||||||||||||||||
|
Salary, bonus and benefits
|
459,604
|
|
428,882
|
|
30,722
|
|
7.2
|
|
428,882
|
|
389,130
|
|
39,752
|
|
10.2
|
|
|||||||||||||
|
Equity-based compensation
|
173,228
|
|
91,450
|
|
81,778
|
|
89.4
|
|
91,450
|
|
102,983
|
|
(11,533
|
)
|
(11.2
|
)
|
|||||||||||||
|
Profit sharing expense
|
(57,833
|
)
|
515,073
|
|
(572,906
|
)
|
NM
|
|
515,073
|
|
357,074
|
|
157,999
|
|
44.2
|
|
|||||||||||||
|
Total compensation and benefits
|
574,999
|
|
1,035,405
|
|
(460,406
|
)
|
(44.5
|
)
|
1,035,405
|
|
849,187
|
|
186,218
|
|
21.9
|
|
|||||||||||||
|
Interest expense
|
59,374
|
|
52,873
|
|
6,501
|
|
12.3
|
|
52,873
|
|
43,482
|
|
9,391
|
|
21.6
|
|
|||||||||||||
|
General, administrative and other
|
266,444
|
|
257,858
|
|
8,586
|
|
3.3
|
|
257,858
|
|
247,000
|
|
10,858
|
|
4.4
|
|
|||||||||||||
|
Placement fees
|
2,122
|
|
13,913
|
|
(11,791
|
)
|
(84.7
|
)
|
13,913
|
|
26,249
|
|
(12,336
|
)
|
(47.0
|
)
|
|||||||||||||
|
Total Expenses
|
902,939
|
|
1,360,049
|
|
(457,110
|
)
|
(33.6
|
)
|
1,360,049
|
|
1,165,918
|
|
194,131
|
|
16.7
|
|
|||||||||||||
|
Other Income (Loss):
|
|||||||||||||||||||||||||||||
|
Net gains (losses) from investment activities
|
(186,449
|
)
|
95,104
|
|
(281,553
|
)
|
NM
|
|
95,104
|
|
139,721
|
|
(44,617
|
)
|
(31.9
|
)
|
|||||||||||||
|
Net gains from investment activities of consolidated variable interest entities
|
45,112
|
|
10,665
|
|
34,447
|
|
323.0
|
|
10,665
|
|
5,015
|
|
5,650
|
|
112.7
|
|
|||||||||||||
|
Interest income
|
20,654
|
|
6,421
|
|
14,233
|
|
221.7
|
|
6,421
|
|
4,072
|
|
2,349
|
|
57.7
|
|
|||||||||||||
|
Other income, net
|
35,829
|
|
245,640
|
|
(209,811
|
)
|
(85.4
|
)
|
245,640
|
|
4,562
|
|
241,078
|
|
NM
|
|
|||||||||||||
|
Total Other Income (Loss)
|
(84,854
|
)
|
357,830
|
|
(442,684
|
)
|
NM
|
|
357,830
|
|
153,370
|
|
204,460
|
|
133.3
|
|
|||||||||||||
|
Income before income tax provision
|
105,272
|
|
1,769,584
|
|
(1,664,312
|
)
|
(94.1
|
)
|
1,769,584
|
|
1,061,014
|
|
708,570
|
|
66.8
|
|
|||||||||||||
|
Income tax provision
|
(86,021
|
)
|
(325,945
|
)
|
239,924
|
|
(73.6
|
)
|
(325,945
|
)
|
(90,707
|
)
|
(235,238
|
)
|
259.3
|
|
|||||||||||||
|
Net Income
|
19,251
|
|
1,443,639
|
|
(1,424,388
|
)
|
(98.7
|
)
|
1,443,639
|
|
970,307
|
|
473,332
|
|
48.8
|
|
|||||||||||||
|
Net income attributable to Non-Controlling Interests
|
(29,627
|
)
|
(814,535
|
)
|
784,908
|
|
(96.4
|
)
|
(814,535
|
)
|
(567,457
|
)
|
(247,078
|
)
|
43.5
|
|
|||||||||||||
|
Net Income (Loss) Attributable to Apollo Global Management, LLC
|
(10,376
|
)
|
629,104
|
|
(639,480
|
)
|
NM
|
|
629,104
|
|
402,850
|
|
226,254
|
|
56.2
|
|
|||||||||||||
|
Net income attributable to Series A Preferred Shareholders
|
(17,531
|
)
|
(13,538
|
)
|
(3,993
|
)
|
29.5
|
|
(13,538
|
)
|
—
|
|
(13,538
|
)
|
NM
|
|
|||||||||||||
|
Net income attributable to Series B Preferred Shareholders
|
(14,131
|
)
|
—
|
|
(14,131
|
)
|
NM
|
|
—
|
|
—
|
|
—
|
|
NM
|
|
|||||||||||||
|
Net Income (Loss) Attributable to Apollo Global Management, LLC Class A Shareholders
|
$
|
(42,038
|
)
|
$
|
615,566
|
|
$
|
(657,604
|
)
|
NM
|
|
$
|
615,566
|
|
$
|
402,850
|
|
$
|
212,716
|
|
52.8
|
%
|
|||||||
|
Note:
|
“NM” denotes not meaningful. Changes from negative to positive amounts and positive to negative amounts are not considered meaningful. Increases or decreases from zero and changes greater than 500% are also not considered meaningful.
|
Revenues
Our revenues and other income include fixed components that result from measures of capital and asset valuations and variable components that result from realized and unrealized investment performance, as well as the value of successfully completed transactions.
Year Ended
December 31, 2018
Compared to
Year Ended
December 31, 2017
Management fees
increase
d by
$190.3 million
for the
year ended December 31, 2018
as compared to the
year ended December 31, 2017
. This change was primarily attributable to the commencement of Fund IX’s investment period in April 2018, resulting in $240.3 million in management fees during the
year ended December 31, 2018
and an increase in management fees earned from Athene of $62.1 million primarily due to its completion of the reinsurance transaction relating to the fixed annuity
-
114
-
business of VA Capital Company, L.P. (“VA Capital”) during 2018. This increase in management fees was partially offset by decreased management fees earned from Fund VIII and Fund VI of $79.5 million and $23.0 million, respectively, during the
year ended December 31, 2018
as compared to the
year ended December 31, 2017
. The decrease in management fees earned from Fund VIII was the result of a change in the basis upon which management fees are earned from capital commitments to invested capital. The decrease in management fees earned from Fund VI resulted from the termination of the fund’s management fee.
Advisory and transaction fees, net,
decrease
d by
$5.3 million
for the
year ended December 31, 2018
as compared to the
year ended December 31, 2017
. This change was primarily attributable to a
decrease
in net advisory and transaction fees earned with respect to FCI III of $20.3 million, partially offset by an increase in net advisory and transaction fees earned with respect to a managed account of $16.7 million during the
year ended December 31, 2018
as compared to the same period during
2017
.
Performance allocations were
$(400.3) million
for the
year ended December 31, 2018
as compared to performance allocations of
$1.3 billion
for the
year ended December 31, 2017
. This change was primarily attributable to
decrease
d performance allocations earned from our private equity funds and our credit funds of
$1.6 billion
and
$124.6 million
, respectively, during the
year ended December 31, 2018
as compared to the same period in
2017
. For additional details regarding changes in performance allocations in each segment, see “—Segment Analysis” below.
Principal investment income
decrease
d by
$156.5 million
for the
year ended December 31, 2018
as compared to the
year ended December 31, 2017
. This change was primarily driven by a
decrease
in the value of investments held by certain Apollo funds and other entities in which the Company has a direct interest, mainly with respect to Fund VIII and AAA of $153.5 million and $10.0 million, respectively, which was partially offset by an increase in income from Apollo’s equity ownership interest in VA Capital of $16.8 million during the
year ended December 31, 2018
, as compared to the same period in
2017
.
Year Ended December 31, 2017 Compared to Year Ended December 31, 2016
Management fees increased by $111.4 million for the year ended December 31, 2017 as compared to the year ended December 31, 2016. This change was primarily attributable to increased management fees earned from EPF III, Athene and FCI III of $59.3 million, $33.9 million and $11.9 million, respectively, during the year ended December 31, 2017 as compared to the same period during 2016. Management fees earned from EPF III and FCI III increased as a result of capital raises that occurred after December 31, 2016, as well as a one-time catch-up of management fees during the year ended December 31, 2017 of $15.1 million and $7.0 million from EPF III and FCI III, respectively.
Advisory and transaction fees, net, decreased by $29.0 million for the year ended December 31, 2017 as compared to the year ended December 31, 2016. This change was primarily attributable to a decrease in net advisory and transaction fees earned with respect to Fund VIII’s portfolio companies of $46.2 million, partially offset by an increase in net advisory and transaction fees earned with respect to FCI III of $20.3 million during the year ended December 31, 2017 as compared to the same period during 2016.
Performance allocations increased by
$593.3 million
for the year ended December 31, 2017 as compared to the year ended December 31, 2016. This change was primarily attributable to increased performance fees earned from our private equity funds of
$625.0 million
, offset by decreased performance fees earned from our credit funds of
$69.1 million
during the year ended December 31, 2017 as compared to the same period in 2016. For additional details regarding changes in performance fees in each segment, see “—Segment Analysis” below.
Principal investment income increased by $58.5 million for the year ended December 31, 2017, as compared to the year ended December 31, 2016. This change was primarily driven by increases in the value of investments held by certain Apollo funds and other entities in which the Company has a direct interest, mainly with respect to Fund VIII of $64.5 million, which was partially offset by a decrease in Apollo Energy Opportunity Fund, L.P. (“AEOF”) of $6.8 million during the year ended December 31, 2017, as compared to the same period in 2016.
Incentive fees decreased by
$35.9 million
for the year ended December 31, 2017 as compared to the year ended December 31, 2016. This change was primarily attributable to a decrease in incentive fees recognized from CLOs of $24.4 million during the year ended December 31, 2017 as compared to the same period in 2016.
Expenses
Year Ended
December 31, 2018
Compared to
Year Ended
December 31, 2017
Compensation and benefits
decrease
d by
$460.4 million
for the
year ended December 31, 2018
, as compared to the
year ended December 31, 2017
. This change was primarily attributable to a
decrease
in profit sharing expense of
$572.9 million
due to
decrease
d performance allocations during the
year ended December 31, 2018
, as compared to the same period in
2017
. In
-
115
-
any period the blended profit sharing percentage is impacted by the respective profit sharing ratios of the funds generating performance allocations in the period. This
decrease
was partially offset by an increase in equity-based compensation of
$81.8 million
, primarily attributable to increased amortization expense relating to grants of RSUs to certain employees under the 2007 Equity Plan during 2018. In addition, salary, bonus and benefits increased
$30.7 million
during the
year ended December 31, 2018
, as compared to the same period in
2017
, primarily due to increased headcount.
Included in profit sharing expense is
$62.0 million
and
$62.3 million
for the
years ended
December 31, 2018
and
2017
, respectively, related to a performance based incentive arrangement for certain Apollo partners and employees designed to more closely align compensation on an annual basis with the overall realized performance of the Company (referred to herein as the “Incentive Pool”). Allocations to participants in the Incentive Pool contain both a mandatory component and a discretionary component, each of which may vary year to year. The Incentive Pool is separate from the fund related profit sharing expense and may result in greater variability in compensation and have a variable impact on the blended profit sharing percentage during a particular period. See “—Profit Sharing Expense” in the Critical Accounting Policies section for an overview of the Incentive Pool.
Interest expense
increase
d by
$6.5 million
for the
year ended December 31, 2018
, as compared to the
year ended December 31, 2017
as a result of additional interest expense incurred due to the issuance of the 2048 Senior Notes in March 2018, partially offset by a decrease in interest expense as a result of the repayment of the remaining amount of the Term Facility, as described in note
10
to our
consolidated
financial statements.
General, administrative and other expenses
increase
d by
$8.6 million
for the
year ended December 31, 2018
, as compared to the
year ended December 31, 2017
. This change was primarily driven by an increase in professional fees during the
year ended December 31, 2018
as compared to the same period in
2017
.
Placement fees
decrease
d by
$11.8 million
for the
year ended December 31, 2018
, as compared to the
year ended December 31, 2017
. This change was primarily driven by placement fees incurred in connection with capital raising activities relating to EPF III and Fund IX of $8.5 million and $3.5 million, respectively, during the
year ended December 31, 2017
. Placement fees are normally payable to placement agents, who are third parties that assist in identifying potential investors, securing commitments to invest from such potential investors, preparing or revising offering marketing materials, developing strategies for attempting to secure investments by potential investors and/or providing feedback and insight regarding issues and concerns of potential investors.
Year Ended December 31, 2017 Compared to Year Ended December 31, 2016
Compensation and benefits increased by $186.2 million for the year ended December 31, 2017, as compared to the year ended December 31, 2016. This change was primarily attributable to an increase in profit sharing expense of $158.0 million due to increased performance allocations during the year ended December 31, 2017, as compared to the same period in 2016. In any period the blended profit sharing percentage is impacted by the respective profit sharing ratios of the funds generating performance allocations in the period.
Included in profit sharing expense is $62.3 million and $62.1 million for the years ended December 31, 2017 and 2016, respectively, related to the Incentive Pool. See “—Profit Sharing Expense” in the Critical Accounting Policies section for an overview of the Incentive Pool.
Interest expense increased by $9.4 million for the year ended December 31, 2017, as compared to the year ended December 31, 2016 primarily as a result of the issuance of the 2026 Senior Notes in May 2016, as described in note
10
to our consolidated financial statements.
Placement fees decreased by $12.3 million for the year ended December 31, 2017, as compared to the year ended December 31, 2016. This change was primarily driven by a decrease in placement fees incurred in connection with capital raising activity relating to EPF III of $10.8 million during the year ended December 31, 2017, as compared to the year ended December 31, 2016.
Other Income (Loss)
Year Ended
December 31, 2018
Compared to
Year Ended
December 31, 2017
Net losses from investment activities were
$186.4 million
for the
year ended December 31, 2018
, as compared to net gains from investment activities of
$95.1 million
for the
year ended December 31, 2017
. This change was primarily attributable to a loss on the Company’s investment in Athene Holding during the
year ended December 31, 2018
as compared to a gain on the
-
116
-
Company’s investment in Athene Holding during the year ended December 31, 2017. See note
7
to the
consolidated
financial statements for further information regarding the Company’s investment in Athene Holding.
Net gains from investment activities of consolidated VIEs
increase
d by
$34.4 million
for the
year ended December 31, 2018
, as compared to the
year ended December 31, 2017
, primarily driven by increases in net gains from Champ, L.P. during the
year ended December 31, 2018
. See note
6
to the
consolidated
financial statements for details regarding net gains from investment activities of consolidated VIEs.
Interest income
increase
d by
$14.2 million
for the
year ended December 31, 2018
, as compared to the
year ended December 31, 2017
primarily due to additional interest income earned from money market funds and U.S. Treasury securities held after
December 31, 2017
.
Other income, net
decrease
d by
$209.8 million
during the
year ended December 31, 2018
, as compared to the
year ended December 31, 2017
. This change was primarily attributable to a $35.4 million gain from remeasurement of the tax receivable agreement liability due to a decrease in state tax rates during the year ended December 31, 2018, compared to a $200.2 million gain from remeasurement of the tax receivable agreement liability due to changes in estimated tax rates resulting from legislative reforms in the TCJA during the year ended December 31, 2017. The decrease was also attributable to $19.0 million in proceeds recognized in connection with the Company’s early termination of a lease during the year ended December 31, 2017 and $17.5 million in insurance proceeds recognized during the
year ended December 31, 2017
in connection with fees and expenses relating to a legal proceeding which did not recur in 2018.
Year Ended December 31, 2017 Compared to Year Ended December 31, 2016
Net gains from investment activities decreased by $44.6 million for the year ended December 31, 2017, as compared to the year ended December 31, 2016. This change was primarily attributable to reduced gains on the Company’s investment in Athene Holding during the year ended December 31, 2017, as compared to the same period in 2016. See note
7
to the consolidated financial statements for further information regarding the Company’s investment in Athene Holding.
Net gains from investment activities of consolidated VIEs increased by $5.7 million for the year ended December 31, 2017, as compared to the year ended December 31, 2016. See note
6
to the
consolidated
financial statements for details regarding net gains from investment activities of consolidated VIEs.
Other income, net increased by $241.1 million for the year ended December 31, 2017, as compared to the year ended December 31, 2016 primarily attributable to $200.2 million related to the gain from remeasurement of the tax receivable agreement liability due to changes in estimated tax rates resulting from legislative reforms in the TCJA during the year ended December 31, 2017, $19.0 million in proceeds recognized in connection with the Company’s early termination of a lease during the year ended December 31, 2017, $17.5 million in insurance proceeds recognized during the year ended December 31, 2017 in connection with fees and expenses relating to a legal proceeding and $6.2 million from the assignment of a CLO collateral management agreement during the year ended December 31, 2017.
Net Income Attributable to Non-Controlling Interests and Series A and Series B Preferred Shareholders
For information related to net income attributable to Non-Controlling Interests and net income attributable to Series A and Series B Preferred shareholders, see note
13
to the
consolidated
financial statements.
Income Tax Provision
The Apollo Operating Group and its subsidiaries generally operate as partnerships for U.S. federal income tax purposes. As a result, only a portion of the income we earn is subject to corporate-level tax in the United States and foreign jurisdictions. The provision for income taxes includes federal, state and local income taxes in the United States and foreign income taxes.
Year Ended
December 31, 2018
Compared to
Year Ended
December 31, 2017
The income tax provision
decrease
d by
$239.9 million
for the
year ended December 31, 2018
, as compared to the
year ended December 31, 2017
. The
decrease
was due to the following: i) additional tax expense recorded in 2017 for the remeasurement of deferred taxes as a result of legislative reforms in the TCJA enacted during the year ended December 31, 2017, ii) a decrease in pre-tax GAAP net income during the
year ended December 31, 2018
as compared to the
year ended December 31, 2017
and iii) an overall change in the mix of earnings when comparing the amount of earnings that are subject to corporate-level tax to those earnings that are not subject to corporate-level tax as these earnings are passed through to Non-Controlling Interests and Class A shareholders. The provision for income taxes includes federal, state, local and foreign income taxes resulting in an effective income tax rate of
81.7%
and
18.4%
for the
years ended
December 31, 2018
and
2017
, respectively. The most
-
117
-
significant reconciling items between our U.S. federal statutory income tax rate and our effective income tax rate were due to the following: (i) income passed through to Non-Controlling Interests; (ii) income passed through to Class A shareholders; (iii) state and local income taxes including NYC UBT and (iv) the remeasurement of income taxes due to state tax planning (see note
9
to the
consolidated
financial statements for further details regarding the Company’s income tax provision).
Year Ended December 31, 2017 Compared to Year Ended December 31, 2016
The income tax provision increased by $235.2 million for the year ended December 31, 2017, as compared to the year ended December 31, 2016. The increase was primarily due to the remeasurement of deferred taxes as a result of legislative reforms in the TCJA enacted on December 22, 2017 as well as an overall change in the mix of earnings when comparing the amount of earnings that are subject to corporate-level taxation to those earnings that are not subject to corporate-level tax as these earnings are passed through to Non-Controlling Interests and Class A shareholders. The provision for income taxes includes federal, state, local and foreign income taxes resulting in an effective income tax rate of 18.4% and 8.5% for the years ended December 31, 2017 and 2016, respectively. The most significant reconciling items between our U.S. federal statutory income tax rate and our effective income tax rate were due to the following: (i) income passed through to Non-Controlling Interests; (ii) income passed through to Class A shareholders; (iii) state and local income taxes including NYC UBT; and (iv) impact of U.S. tax reform legislation (see note
9
to the consolidated financial statements for further details regarding the Company’s income tax provision).
Segment Analysis
Discussed below are our results of operations for each of our reportable segments. They represent the segment information available and utilized by our executive management, which consists of our Managing Partners, who operate collectively as our chief operating decision maker, to assess performance and to allocate resources. Management divides its operations into three reportable segments: credit, private equity and real assets. These segments were established based on the nature of investment activities in each underlying fund, including the specific type of investment made and the level of control over the investment. Segment results represent segment income (loss) before income tax provision excluding transaction-related charges arising from the 2007 private placement, and any acquisitions. Transaction-related charges include equity-based compensation charges, the amortization of intangible assets and contingent consideration and certain other charges associated with acquisitions. In addition, segment results exclude non-cash revenue and expense related to equity awards granted by unconsolidated related parties to employees of the Company, as well as the assets, liabilities and operating results of the funds and VIEs that are included in the
consolidated
financial statements.
Our financial results vary, since performance fees, which generally constitute a large portion of the income from the funds that we manage, as well as the transaction and advisory fees that we receive, can vary significantly from quarter to quarter and year to year. As a result, we emphasize long-term financial growth and profitability to manage our business.
-
118
-
Credit
The following table sets forth our segment statement of operations information and our supplemental performance measure, EI, within our credit segment.
|
|
For the Years Ended December 31,
|
Total Change
|
Percentage Change
|
For the Years Ended December 31,
|
Total Change
|
Percentage Change
|
|||||||||||||||||||||||
|
|
2018
|
2017
|
2017
|
2016
|
|||||||||||||||||||||||||
|
|
(in thousands)
|
(in thousands)
|
|||||||||||||||||||||||||||
|
Credit:
|
|||||||||||||||||||||||||||||
|
Revenues:
|
|||||||||||||||||||||||||||||
|
Management fees
|
$
|
763,958
|
|
$
|
702,191
|
|
$
|
61,767
|
|
8.8
|
%
|
$
|
702,191
|
|
$
|
596,709
|
|
$
|
105,482
|
|
17.7
|
%
|
|||||||
|
Advisory and transaction fees, net
|
9,530
|
|
30,733
|
|
(21,203
|
)
|
(69.0
|
)
|
30,733
|
|
12,533
|
|
18,200
|
|
145.2
|
|
|||||||||||||
|
Performance fees
(1)
:
|
|||||||||||||||||||||||||||||
|
Unrealized
|
(6,911
|
)
|
51,225
|
|
(58,136
|
)
|
NM
|
|
51,225
|
|
137,274
|
|
(86,049
|
)
|
(62.7
|
)
|
|||||||||||||
|
Realized
|
130,479
|
|
196,973
|
|
(66,494
|
)
|
(33.8
|
)
|
196,973
|
|
180,029
|
|
16,944
|
|
9.4
|
|
|||||||||||||
|
Total performance fees
|
123,568
|
|
248,198
|
|
(124,630
|
)
|
(50.2
|
)
|
248,198
|
|
317,303
|
|
(69,105
|
)
|
(21.8
|
)
|
|||||||||||||
|
Principal investment income
|
44,976
|
|
27,718
|
|
17,258
|
|
62.3
|
|
27,718
|
|
33,290
|
|
(5,572
|
)
|
(16.7
|
)
|
|||||||||||||
|
Total Revenues
|
942,032
|
|
1,008,840
|
|
(66,808
|
)
|
(6.6
|
)
|
1,008,840
|
|
959,835
|
|
49,005
|
|
5.1
|
|
|||||||||||||
|
Expenses:
|
|
||||||||||||||||||||||||||||
|
Compensation and benefits:
|
|||||||||||||||||||||||||||||
|
Salary, bonus and benefits
|
232,751
|
|
231,592
|
|
1,159
|
|
0.5
|
|
231,592
|
|
209,256
|
|
22,336
|
|
10.7
|
|
|||||||||||||
|
Equity-based compensation
|
37,132
|
|
37,453
|
|
(321
|
)
|
(0.9
|
)
|
37,453
|
|
34,185
|
|
3,268
|
|
9.6
|
|
|||||||||||||
|
Profit sharing expense:
|
|||||||||||||||||||||||||||||
|
Unrealized
|
(523
|
)
|
18,268
|
|
(18,791
|
)
|
NM
|
|
18,268
|
|
63,012
|
|
(44,744
|
)
|
(71.0
|
)
|
|||||||||||||
|
Realized
|
70,620
|
|
77,801
|
|
(7,181
|
)
|
(9.2
|
)
|
77,801
|
|
84,715
|
|
(6,914
|
)
|
(8.2
|
)
|
|||||||||||||
|
Equity-based
|
11,100
|
|
1,876
|
|
9,224
|
|
491.7
|
|
1,876
|
|
—
|
|
1,876
|
|
NM
|
|
|||||||||||||
|
Total profit sharing expense
|
81,197
|
|
97,945
|
|
(16,748
|
)
|
(17.1
|
)
|
97,945
|
|
147,727
|
|
(49,782
|
)
|
(33.7
|
)
|
|||||||||||||
|
Total compensation and benefits
|
351,080
|
|
366,990
|
|
(15,910
|
)
|
(4.3
|
)
|
366,990
|
|
391,168
|
|
(24,178
|
)
|
(6.2
|
)
|
|||||||||||||
|
Non-compensation expenses
|
|||||||||||||||||||||||||||||
|
General, administrative and other
|
145,691
|
|
139,374
|
|
6,317
|
|
4.5
|
|
139,374
|
|
125,639
|
|
13,735
|
|
10.9
|
|
|||||||||||||
|
Placement fees
|
1,530
|
|
10,130
|
|
(8,600
|
)
|
(84.9
|
)
|
10,130
|
|
22,047
|
|
(11,917
|
)
|
(54.1
|
)
|
|||||||||||||
|
Total non-compensation expenses
|
147,221
|
|
149,504
|
|
(2,283
|
)
|
(1.5
|
)
|
149,504
|
|
147,686
|
|
1,818
|
|
1.2
|
|
|||||||||||||
|
Total Expenses
|
498,301
|
|
516,494
|
|
(18,193
|
)
|
(3.5
|
)
|
516,494
|
|
538,854
|
|
(22,360
|
)
|
(4.1
|
)
|
|||||||||||||
|
Other Income (Loss):
|
|||||||||||||||||||||||||||||
|
Net gains (losses) from investment activities
|
(135,285
|
)
|
85,135
|
|
(220,420
|
)
|
NM
|
|
85,135
|
|
127,229
|
|
(42,094
|
)
|
(33.1
|
)
|
|||||||||||||
|
Net interest loss
|
(18,778
|
)
|
(23,709
|
)
|
4,931
|
|
(20.8
|
)
|
(23,709
|
)
|
(20,669
|
)
|
(3,040
|
)
|
14.7
|
|
|||||||||||||
|
Other income (loss), net
|
2,071
|
|
17,037
|
|
(14,966
|
)
|
(87.8
|
)
|
17,037
|
|
(4,500
|
)
|
21,537
|
|
NM
|
|
|||||||||||||
|
Total Other Income (Loss)
|
(151,992
|
)
|
78,463
|
|
(230,455
|
)
|
NM
|
|
78,463
|
|
102,060
|
|
(23,597
|
)
|
(23.1
|
)
|
|||||||||||||
|
Non-Controlling Interest
|
(5,008
|
)
|
(4,379
|
)
|
(629
|
)
|
14.4
|
|
(4,379
|
)
|
(7,464
|
)
|
3,085
|
|
(41.3
|
)
|
|||||||||||||
|
Economic Income
|
$
|
286,731
|
|
$
|
566,430
|
|
$
|
(279,699
|
)
|
(49.4
|
)%
|
$
|
566,430
|
|
$
|
515,577
|
|
$
|
50,853
|
|
9.9
|
%
|
|||||||
|
(1)
|
Performance fees includes performance allocations and incentive fees.
|
Revenues
Year Ended
December 31, 2018
Compared to
Year Ended
December 31, 2017
Management fees
increase
d by
$61.8 million
for the
year ended December 31, 2018
, as compared to the
year ended December 31, 2017
. This change was primarily attributable to
increase
s in management fees earned from Athene and Apollo Total Return Fund L.P. of $62.1 million and $9.8 million, respectively, during the
year ended December 31, 2018
, as compared to the same period during
2017
. The increase in management fees earned from Athene was primarily attributable to its completion of the reinsurance transaction relating to the fixed annuity business of VA Capital in 2018. These increases were partially offset by a decrease in management fees earned from EPF II of $12.2 million during the year ended December 31, 2018, as compared to the same period during 2017.
Advisory and transaction fees, net
decrease
d by
$21.2 million
during the
year ended December 31, 2018
, as compared to the
year ended December 31, 2017
. This
decrease
was primarily driven by a
decrease
in net advisory and transaction fees earned with respect to FCI III of $20.3 million during the
year ended December 31, 2018
, as compared to the same period during
2017
.
-
119
-
Performance fees
decrease
d by
$124.6 million
for the
year ended December 31, 2018
, as compared to the
year ended December 31, 2017
. This change was primarily attributable to
decrease
s in performance fees earned from EPF II, FCI III, FCI II and Apollo Structured Credit Recovery Master Fund III, L.P. (“SCRF III”) of $92.5 million, $21.8 million, $13.7 million and $12.8 million, respectively, during the
year ended December 31, 2018
, as compared to the same period during
2017
. The decrease was partially offset by increases in performance fees earned from MidCap and Redding Ridge of $20.8 million and $17.0 million, respectively.
The decrease in performance fees from EPF II was primarily attributable to a loss in connection with the partial sale of a Spanish financial services investment during the year ended December 31, 2018, as well as lower appreciation of a German commercial real estate investment in the fund’s portfolio for the
year ended December 31, 2018
as compared to the same period in
2017
. The decrease in performance fees from FCI III was primarily attributable due to a decrease in the valuation of the fund’s life settlements portfolio for the
year ended December 31, 2018
as compared to the same period in
2017
. The decrease in performance fees from FCI II was primarily attributable due to a decrease in the valuation of the fund’s life settlements portfolio, lower realized gains and an increase in interest expense for the
year ended December 31, 2018
as compared to the same period in
2017
. The decrease in performance fees earned from SCRF III was attributable to performance fees being generated at a slower rate compared to the same period in 2017 as the fund has unwound its portfolio.
The increase in performance fees earned from MidCap was a result of stronger loan portfolio returns and fee income during the
year ended December 31, 2018
, as compared to the same period in
2017
. The increase in performance fees from Redding Ridge was primarily due to an increase in fair value from CLO issuances during the
year ended December 31, 2018
as compared to the same period in
2017
.
Principal investment income
increase
d by
$17.3 million
for the
year ended December 31, 2018
, as compared to the
year ended December 31, 2017
. This change was primarily driven by
increase
s in income from Apollo’s equity ownership interest in VA Capital and Redding Ridge of $16.8 million and $13.2 million, respectively, during the
year ended December 31, 2018
, as compared to the same period in
2017
. This increase in principal investment income was partially offset by a decrease in income from Apollo’s equity ownership interest in EPF II of $7.7 million during the
year ended December 31, 2018
, as compared to the same period in
2017
.
Year Ended December 31, 2017 Compared to Year Ended December 31, 2016
Management fees increased by $105.5 million for the year ended December 31, 2017, as compared to the year ended December 31, 2016. This change was primarily attributable to increases in management fees earned from EPF III, Athene, FCI III and Apollo Total Return Fund L.P. of $59.3 million, $33.9 million, $11.9 million and $9.9 million, respectively, during the year ended December 31, 2017, as compared to the same period during 2016. Management fees earned from EPF III and FCI III increased as a result of capital raises that occurred after December 31, 2016, as well as a one-time catch-up of management fees during the year ended December 31, 2017 of $15.1 million and $7.0 million from EPF III and FCI III, respectively. These increases were partially offset by a decrease in management fees earned from EPF II of $23.0 million during the year ended December 31, 2017, as compared to the same period during 2016, primarily resulting from a step down in fee basis from committed capital to invested capital during the year ended December 31, 2017.
Advisory and transaction fees, net, increased by $18.2 million during the year ended December 31, 2017, as compared to the year ended December 31, 2016. The change was primarily driven by increases in net advisory and transaction fees from FCI III of $20.3 million during the year ended December 31, 2017, as compared to the same period during 2016.
Performance fees decreased by $69.1 million for the year ended December 31, 2017, as compared to the year ended December 31, 2016. This change was primarily attributable to decreases in performance fees earned from Apollo Credit Master Fund Ltd, CLOs, SCRF III and AEOF of $29.3 million, $27.1 million, $16.3 million and $14.2 million, respectively, partially offset by an increase in performance fees earned from FCI III of $28.4 million during the year ended December 31, 2017, as compared to the same period during 2016.
The decrease in performance fees related to Apollo Credit Master Fund Ltd. was due to under-performance relative to the fund’s hurdle rate during the year ended December 31, 2017, as compared to the same period in 2016 as a result of lower appreciation on investments in the financial and technology sectors during the year ended December 31, 2017. The decrease in performance fees earned from the CLOs was due to under-performance relative to each respective CLO hurdle rate and lower appreciation from the leveraged loan assets during the year ended December 31, 2017 as compared to the same period in 2016. The decrease in performance fees related to SCRF III was attributable to performance fees being generated at a slower rate as the fund unwound its portfolio during the year ended December 31, 2017. The decrease in performance fees earned from AEOF was primarily due to lower mark-to-market performance on energy positions during the year ended December 31, 2017, as compared
-
120
-
to the same period in 2016. FCI III was in its first year of its investment cycle and the increase in performance fees earned from FCI III was due to higher valuations of the fund’s life settlements portfolio during the year ended December 31, 2017.
Principal investment income decreased by $5.6 million for the year ended December 31, 2017, as compared to the year ended December 31, 2016. This change was primarily driven by a decrease in income from Apollo’s equity ownership interest in AEOF, EPF II and Apollo Senior Loan Fund, L.P. of $6.8 million, $1.7 million and $1.3 million, respectively, partially offset by an increase in income from Apollo’s equity ownership interest in AINV of $5.0 million during the year ended December 31, 2017, as compared to the same period in 2016.
Expenses
Year Ended
December 31, 2018
Compared to
Year Ended
December 31, 2017
Compensation and benefits expense
decrease
d by
$15.9 million
for the
year ended December 31, 2018
, as compared to the
year ended December 31, 2017
. This change was primarily attributable to a
decrease
in total profit sharing expense of
$16.7 million
during the
year ended December 31, 2018
, as compared to the same period in
2017
. Profit sharing expense
decrease
d as a result of a corresponding decrease in performance fees as described above. In any period the blended profit sharing percentage is impacted by the respective profit sharing ratios of the funds generating performance fees in the period. Equity-based profit sharing expense increased as a result of grants under the 2007 Equity Plan during the
year ended December 31, 2018
(see note
12
to the consolidated financial statements).
Included in profit sharing expense is
$13.0 million
and
$16.3 million
related to the Incentive Pool for the
years ended
December 31, 2018
and
2017
, respectively. The Incentive Pool is separate from the fund related profit sharing expense and may result in greater variability in compensation and have a variable impact on the blended profit sharing percentage during a particular period.
General, administrative and other
increase
d by
$6.3 million
during the
year ended December 31, 2018
, as compared to the
year ended December 31, 2017
. The change was primarily driven by an
increase
in professional fees, partially offset by a decrease in fund organizational expenses related to EPF III during the
year ended December 31, 2018
, as compared to the same period in
2017
.
Placement fees
decrease
d by
$8.6 million
during the
year ended December 31, 2018
, as compared to the
year ended December 31, 2017
. This change was primarily driven by placement fees incurred in connection with capital raising activity relating to EPF III of $8.5 million during the
year ended December 31, 2017
.
Year Ended December 31, 2017 Compared to Year Ended December 31, 2016
Compensation and benefits expense decreased by $24.2 million for the year ended December 31, 2017, as compared to the year ended December 31, 2016. This change was primarily attributable to a decrease in profit sharing expense of $49.8 million during the year ended December 31, 2017, as compared to the year ended December 31, 2016 as a result of a corresponding decrease in performance fees as described above. In any period the blended profit sharing percentage is impacted by the respective profit sharing ratios of the funds generating performance fees in the period. The decrease in profit sharing expense was partially offset by an increase in salary, bonus and benefits of $22.3 million during the year ended December 31, 2017, as compared to the year ended December 31, 2016 primarily due to increased headcount.
Included in profit sharing expense is $16.3 million and $38.0 million related to the Incentive Pool for the years ended December 31, 2017 and 2016, respectively. The Incentive Pool is separate from the fund related profit sharing expense and may result in greater variability in compensation and have a variable impact on the blended profit sharing percentage during a particular period.
General, administrative and other increased by $13.7 million during the year ended December 31, 2017, as compared to the year ended December 31, 2016. The change was primarily driven by an increase in fund organizational expenses related to the launch of EPF III as well as an increase in professional fees during the year ended December 31, 2017, as compared to the same period in 2016.
Placement fees decreased by $11.9 million during the year ended December 31, 2017, as compared to the year ended December 31, 2016. This change was primarily driven by a decrease in placement fees incurred in connection with capital raising activity relating to EPF III of $10.8 million during the year ended December 31, 2017, as compared to the year ended December 31, 2016.
-
121
-
Other Income (Loss)
Year Ended
December 31, 2018
Compared to
Year Ended
December 31, 2017
Net losses from investment activities were
$135.3 million
for the
year ended December 31, 2018
, as compared to net gains from investment activities of
$85.1 million
for the
year ended December 31, 2017
. This change was primarily attributable to a loss on the Company’s investment in Athene Holding during the
year ended December 31, 2018
as compared to a gain on the Company’s investment in Athene Holding during the year ended December 31, 2017. See note
7
to the
consolidated
financial statements for further information regarding the Company’s investment in Athene Holding.
Net interest loss
decrease
d by
$4.9 million
for the
year ended December 31, 2018
, as compared to the
year ended December 31, 2017
, primarily due to additional interest income earned from money market funds and U.S. Treasury securities held after
December 31, 2017
. Interest income was partially offset by additional interest expense incurred during the
year ended December 31, 2018
as a result of the issuance of the 2048 Senior Notes in March 2018, as described in note
10
to our
consolidated
financial statements.
Other income (loss), net
decrease
d by
$15.0 million
for the
year ended December 31, 2018
, as compared to the
year ended December 31, 2017
. This change was primarily attributable to proceeds received in connection with the Company’s early termination of a lease and the Company’s recognition of $6.2 million of other income from the assignment of a CLO collateral management agreement during the
year ended December 31, 2017
.
Year Ended December 31, 2017 Compared to Year Ended December 31, 2016
Net gains from investment activities decreased by $42.1 million for the year ended December 31, 2017, as compared to the year ended December 31, 2016, due to reduced gains on the Company’s investment in Athene Holding during the year ended December 31, 2017, as compared to the year ended December 31, 2016. See note
7
to the consolidated financial statements for further information regarding the Company’s investment in Athene Holding.
Net interest loss increased by $3.0 million for the year ended December 31, 2017, as compared to the year ended December 31, 2016, primarily due to additional interest expense incurred during the year ended December 31, 2017 as a result of the issuance of the 2026 Senior Notes in May 2016, as described in note
10
to our consolidated financial statements.
Other income (loss), net increased by $21.5 million for the year ended December 31, 2017, as compared to the year ended December 31, 2016. This change was primarily attributable to proceeds recognized in connection with the Company’s early termination of a lease and proceeds recognized from the assignment of a CLO collateral management agreement during the year ended December 31, 2017.
Non-Controlling Interests
For information related to Non-Controlling Interests, see note
13
to the
consolidated
financial statements.
-
122
-
Private Equity
The following table sets forth our segment statement of operations information and our supplemental performance measure, EI, within our private equity segment.
|
For the Years Ended December 31,
|
Total Change
|
Percentage Change
|
For the Years Ended December 31,
|
Total Change
|
Percentage Change
|
||||||||||||||||||||||||
|
|
2018
|
2017
|
2017
|
2016
|
|||||||||||||||||||||||||
|
|
(in thousands)
|
(in thousands)
|
|||||||||||||||||||||||||||
|
Private Equity:
|
|||||||||||||||||||||||||||||
|
Revenues:
|
|||||||||||||||||||||||||||||
|
Management fees
|
$
|
440,719
|
|
$
|
306,734
|
|
$
|
133,985
|
|
43.7
|
%
|
$
|
306,734
|
|
$
|
321,995
|
|
$
|
(15,261
|
)
|
(4.7
|
)%
|
|||||||
|
Advisory and transaction fees, net
|
89,385
|
|
84,063
|
|
5,322
|
|
6.3
|
|
84,063
|
|
128,675
|
|
(44,612
|
)
|
(34.7
|
)
|
|||||||||||||
|
Performance fees
(1)
:
|
|||||||||||||||||||||||||||||
|
Unrealized
|
(941,690
|
)
|
642,126
|
|
(1,583,816
|
)
|
NM
|
|
642,126
|
|
368,807
|
|
273,319
|
|
74.1
|
|
|||||||||||||
|
Realized
|
441,363
|
|
433,983
|
|
7,380
|
|
1.7
|
|
433,983
|
|
82,292
|
|
351,691
|
|
427.4
|
|
|||||||||||||
|
Total performance fees
|
(500,327
|
)
|
1,076,109
|
|
(1,576,436
|
)
|
NM
|
|
1,076,109
|
|
451,099
|
|
625,010
|
|
138.6
|
|
|||||||||||||
|
Principal investment income (loss)
|
(39,382
|
)
|
132,376
|
|
(171,758
|
)
|
NM
|
|
132,376
|
|
66,281
|
|
66,095
|
|
99.7
|
|
|||||||||||||
|
Total Revenues
|
(9,605
|
)
|
1,599,282
|
|
(1,608,887
|
)
|
NM
|
|
1,599,282
|
|
968,050
|
|
631,232
|
|
65.2
|
|
|||||||||||||
|
Expenses:
|
|||||||||||||||||||||||||||||
|
Compensation and benefits:
|
|||||||||||||||||||||||||||||
|
Salary, bonus and benefits
|
138,855
|
|
123,095
|
|
15,760
|
|
12.8
|
|
123,095
|
|
124,463
|
|
(1,368
|
)
|
(1.1
|
)
|
|||||||||||||
|
Equity-based compensation
|
29,021
|
|
27,516
|
|
1,505
|
|
5.5
|
|
27,516
|
|
27,549
|
|
(33
|
)
|
(0.1
|
)
|
|||||||||||||
|
Profit sharing expense:
|
|||||||||||||||||||||||||||||
|
Unrealized
|
(319,939
|
)
|
211,976
|
|
(531,915
|
)
|
NM
|
|
211,976
|
|
114,643
|
|
97,333
|
|
84.9
|
|
|||||||||||||
|
Realized
|
197,873
|
|
191,569
|
|
6,304
|
|
3.3
|
|
191,569
|
|
43,893
|
|
147,676
|
|
336.4
|
|
|||||||||||||
|
Equity-based
|
76,906
|
|
2,184
|
|
74,722
|
|
NM
|
|
2,184
|
|
—
|
|
2,184
|
|
NM
|
|
|||||||||||||
|
Total profit sharing expense
|
(45,160
|
)
|
405,729
|
|
(450,889
|
)
|
NM
|
|
405,729
|
|
158,536
|
|
247,193
|
|
155.9
|
|
|||||||||||||
|
Total compensation and benefits
|
122,716
|
|
556,340
|
|
(433,624
|
)
|
(77.9
|
)
|
556,340
|
|
310,548
|
|
245,792
|
|
79.1
|
|
|||||||||||||
|
Non-compensation expenses:
|
|||||||||||||||||||||||||||||
|
General, administrative and other
|
67,423
|
|
68,504
|
|
(1,081
|
)
|
(1.6
|
)
|
68,504
|
|
71,323
|
|
(2,819
|
)
|
(4.0
|
)
|
|||||||||||||
|
Placement fees
|
585
|
|
3,783
|
|
(3,198
|
)
|
(84.5
|
)
|
3,783
|
|
2,297
|
|
1,486
|
|
64.7
|
|
|||||||||||||
|
Total non-compensation expenses
|
68,008
|
|
72,287
|
|
(4,279
|
)
|
(5.9
|
)
|
72,287
|
|
73,620
|
|
(1,333
|
)
|
(1.8
|
)
|
|||||||||||||
|
Total Expenses
|
190,724
|
|
628,627
|
|
(437,903
|
)
|
(69.7
|
)
|
628,627
|
|
384,168
|
|
244,459
|
|
63.6
|
|
|||||||||||||
|
Other Income (Loss):
|
|||||||||||||||||||||||||||||
|
Net gains (losses) from investment activities
|
(51,185
|
)
|
9,652
|
|
(60,837
|
)
|
NM
|
|
9,652
|
|
11,379
|
|
(1,727
|
)
|
(15.2
|
)
|
|||||||||||||
|
Net interest loss
|
(14,694
|
)
|
(16,597
|
)
|
1,903
|
|
(11.5
|
)
|
(16,597
|
)
|
(14,187
|
)
|
(2,410
|
)
|
17.0
|
|
|||||||||||||
|
Other income (loss), net
|
(2,053
|
)
|
26,299
|
|
(28,352
|
)
|
NM
|
|
26,299
|
|
1,650
|
|
24,649
|
|
NM
|
|
|||||||||||||
|
Total Other Income (Loss)
|
(67,932
|
)
|
19,354
|
|
(87,286
|
)
|
NM
|
|
19,354
|
|
(1,158
|
)
|
20,512
|
|
NM
|
|
|||||||||||||
|
Economic Income (Loss)
|
$
|
(268,261
|
)
|
$
|
990,009
|
|
$
|
(1,258,270
|
)
|
NM
|
|
$
|
990,009
|
|
$
|
582,724
|
|
$
|
407,285
|
|
69.9
|
%
|
|||||||
|
(1)
|
Performance fees includes performance allocations and incentive fees.
|
Revenues
Year Ended
December 31, 2018
Compared to
Year Ended
December 31, 2017
Management fees
increase
d by
$134.0 million
for the
year ended December 31, 2018
, as compared to the
year ended December 31, 2017
. This change was primarily attributable to the commencement of Fund IX’s investment period in April 2018, resulting in $240.3 million in management fees during the
year ended December 31, 2018
. The increase in management fees was partially offset by decreased management fees earned from Fund VIII and Fund VI of $79.5 million and $23.0 million, respectively, during the
year ended December 31, 2018
as compared to the
year ended December 31, 2017
. The decrease in management fees earned from Fund VIII was the result of a change in the basis upon which management fees are earned from capital commitments to invested capital. The decrease in management fees earned from Fund VI resulted from the termination of the fund’s management fee.
Advisory and transaction fees, net
increase
d by
$5.3 million
for the
year ended December 31, 2018
, as compared to the
year ended December 31, 2017
. This change was primarily attributable to an
increase
in net advisory and transaction fees earned as a result of the Catalina Holdings transaction of $16.7 million, partially offset by a decrease in net advisory and transaction
-
123
-
fees earned with respect to Fund VIII’s portfolio companies of $13.7 million during the
year ended December 31, 2018
, as compared to the same period during
2017
.
Performance fees were
$(500.3) million
for the
year ended December 31, 2018
, as compared to performance fees of
$1.1 billion
for the
year ended December 31, 2017
. This change was primarily attributable to decreases in performance fees earned from Fund VIII, Fund VI and Fund VII of $1.3 billion, $129.5 million and $117.2 million, respectively, during the
year ended December 31, 2018
as compared to the
year ended December 31, 2017
. The decrease in performance fees from Fund VIII was primarily driven by depreciation of the fund’s public and private portfolio companies primarily in the consumer services, business services and leisure sectors and lower appreciation in the manufacturing and industrial sector. The decrease in performance fees from Fund VI was primarily driven by depreciation of the fund’s public portfolio companies primarily in the leisure sector. The decrease in performance fees from Fund VII was primarily driven by depreciation of the fund’s private portfolio companies primarily in the consumer services, media, telecom and technology, leisure and business services sectors.
Principal investment loss was
$39.4 million
for the
year ended December 31, 2018
, as compared to principal investment income of
$132.4 million
for the
year ended December 31, 2017
. This change was primarily attributable to decreases in income from Apollo’s equity ownership interest in Fund VIII and AAA of $153.5 million and $10.0 million, respectively, during the
year ended December 31, 2018
, as compared to the same period in
2017
.
Year Ended December 31, 2017 Compared to Year Ended December 31, 2016
Management fees decreased by $15.3 million for the year ended December 31, 2017, as compared to the year ended December 31, 2016. This change was primarily attributable to decreases in management fees earned with respect to ANRP II, AION and Fund VI of $7.9 million, $4.2 million and $2.1 million, respectively, during the year ended December 31, 2017 as compared to the year ended December 31, 2016. The decrease in management fees earned from ANRP II was primarily due to catch-up of management fees in connection with capital raised during the year ended December 31, 2016. The decrease in management fees earned from AION and Fund VI primarily resulted from a reduction in fee basis after December 31, 2016.
Advisory and transaction fees, net decreased by $44.6 million for the year ended December 31, 2017, as compared to the year ended December 31, 2016. This change was primarily attributable to a decrease in net advisory and transaction fees earned with respect to Fund VIII’s portfolio companies of $46.2 million during the year ended December 31, 2017 as compared to the year ended December 31, 2016.
Performance fees increased by $625.0 million for the year ended December 31, 2017, as compared to the year ended December 31, 2016. This change was primarily attributable to increases in performance fees earned from Fund VIII and Fund VI of $566.3 million and $175.8 million, respectively, offset by decreases in performance fees earned from ANRP I of $67.3 million during the year ended December 31, 2017 as compared to the year ended December 31, 2016. The increase in performance fees earned from Fund VIII was primarily driven by appreciation in value in the fund’s private portfolio companies. The increase in performance fees earned from Fund VI was primarily driven by appreciation in value in the fund’s public portfolio companies. The decrease in performance fees earned from ANRP I was primarily driven by lower appreciation in value in the fund’s private portfolio companies.
Principal investment income increased by $66.1 million for the year ended December 31, 2017, as compared to the year ended December 31, 2016. This change was primarily attributable to increases in income from Apollo’s equity ownership interest in Fund VIII of $64.5 million during the year ended December 31, 2017, as compared to the same period in 2016.
Expenses
Year Ended
December 31, 2018
Compared to
Year Ended
December 31, 2017
Compensation and benefits expense
decrease
d by
$433.6 million
for the
year ended December 31, 2018
as compared to the
year ended December 31, 2017
. This change was primarily attributable to a
decrease
in total profit sharing expense of
$450.9 million
during the
year ended December 31, 2018
, as compared to the same period in
2017
, as a result of a corresponding
decrease
in performance fees as described above. In any period the blended profit sharing percentage is impacted by the respective profit sharing ratios of the funds generating performance fees in the period. Equity-based profit sharing expense increased as a result of grants under the 2007 Equity Plan during the
year ended December 31, 2018
(see note
12
to the consolidated financial statements).
Included in profit sharing expense is
$47.7 million
and
$44.4 million
related to the Incentive Pool for the
years ended
December 31, 2018
and
2017
, respectively. The Incentive Pool is separate from the fund related profit sharing expense and may result in greater variability in compensation and have a variable impact on the blended profit sharing percentage during a particular period.
-
124
-
Placement fees
decrease
d by
$3.2 million
during the
year ended December 31, 2018
, as compared to the
year ended December 31, 2017
. This change was primarily driven by placement fees incurred in connection with capital raising activity relating to Fund IX of $3.5 million during the
year ended December 31, 2017
.
Year Ended December 31, 2017 Compared to Year Ended December 31, 2016
Compensation and benefits expense increased by $245.8 million for the year ended December 31, 2017 as compared to the year ended December 31, 2016. This change was primarily attributable to an increase in profit sharing expense of $247.2 million as a result of a corresponding increase in performance fees as described above. In any period the blended profit sharing percentage is impacted by the respective profit sharing ratios of the funds generating performance fees in the period.
Included in profit sharing expense is $44.4 million and $20.6 million related to the Incentive Pool for the years ended December 31, 2017 and 2016, respectively. The Incentive Pool is separate from the fund related profit sharing expense and may result in greater variability in compensation and have a variable impact on the blended profit sharing percentage during a particular period.
General, administrative and other decreased by $2.8 million during the year ended December 31, 2017, as compared to the year ended December 31, 2016. The change was primarily driven by a decrease in professional fees during the year ended December 31, 2017, as compared to the same period in 2016.
Placement fees increased by $1.5 million during the year ended December 31, 2017, as compared to the year ended December 31, 2016. This change was primarily driven by placement fees incurred during the year ended December 31, 2017 of $3.5 million in connection with capital raising activity relating to Fund IX. Placement fees during the year ended December 31, 2016 were primarily incurred in connection with capital raising activity relating to ANRP II of $2.0 million.
Other Income (Loss)
Year Ended
December 31, 2018
Compared to
Year Ended
December 31, 2017
Net losses from investment activities were
$51.2 million
for the
year ended December 31, 2018
, as compared to net gains from investment activities of
$9.7 million
for the
year ended December 31, 2017
. This change was primarily attributable to a loss on the Company’s investment in Athene Holding during the
year ended December 31, 2018
as compared to a gain on the Company’s investment in Athene Holding during the year ended December 31, 2017. See note
7
to the
consolidated
financial statements for further information regarding the Company’s investment in Athene Holding.
Net interest loss
decrease
d by
$1.9 million
for the
year ended December 31, 2018
, as compared to the
year ended December 31, 2017
, primarily due to additional interest income earned from money market funds and U.S. Treasury securities held after
December 31, 2017
. Interest income was partially offset by additional interest expense incurred during the
year ended December 31, 2018
as a result of the issuance of the 2048 Senior Notes in March 2018, as described in note
10
to our
consolidated
financial statements.
Other loss, net was
$2.1 million
for the
year ended December 31, 2018
, as compared to other income, net of
$26.3 million
for the
year ended December 31, 2017
. This change was primarily attributable to proceeds received in connection with the Company’s early termination of a lease during the
year ended December 31, 2017
, in addition to insurance proceeds of $17.5 million received during the
year ended December 31, 2017
in connection with fees and expenses relating to a legal proceeding.
Year Ended December 31, 2017 Compared to Year Ended December 31, 2016
Net gains from investment activities decreased by $1.7 million for the year ended December 31, 2017, as compared to the year ended December 31, 2016, due to reduced gains on the Company’s investment in Athene Holding during the year ended December 31, 2017, as compared to the year ended December 31, 2016. See note
7
to the consolidated financial statements for further information regarding the Company’s investment in Athene Holding.
Net interest loss increased by $2.4 million for the year ended December 31, 2017, as compared to the year ended December 31, 2016, primarily due to additional interest expense incurred during the year ended December 31, 2017 as a result of the issuance of the 2026 Senior Notes in May 2016, as described in note
10
to our consolidated financial statements.
Other income, net increased by $24.6 million for the year ended December 31, 2017, as compared to the year ended December 31, 2016. This change was primarily attributable to proceeds recognized in connection with the Company’s early termination of a lease which occurred during the year ended December 31, 2017, in addition to $17.5 million in insurance proceeds recognized during the year ended December 31, 2017 in connection with fees and expenses relating to a legal proceeding.
-
125
-
Real Assets
The following table sets forth our segment statement of operations information and our supplemental performance measure, EI, within our real assets segment.
|
|
For the Years Ended December 31,
|
Total Change
|
Percentage Change
|
For the Years Ended December 31,
|
Total Change
|
Percentage Change
|
|||||||||||||||||||||||
|
|
2018
|
2017
|
2017
|
2016
|
|||||||||||||||||||||||||
|
|
(in thousands)
|
(in thousands)
|
|||||||||||||||||||||||||||
|
Real Assets:
|
|||||||||||||||||||||||||||||
|
Revenues:
|
|||||||||||||||||||||||||||||
|
Management fees
|
$
|
78,011
|
|
$
|
73,390
|
|
$
|
4,621
|
|
6.3
|
%
|
$
|
73,390
|
|
$
|
58,945
|
|
$
|
14,445
|
|
24.5
|
%
|
|||||||
|
Advisory and transaction fees, net
|
12,652
|
|
2,828
|
|
9,824
|
|
347.4
|
|
2,828
|
|
5,907
|
|
(3,079
|
)
|
(52.1
|
)
|
|||||||||||||
|
Performance fees
(1)
:
|
|||||||||||||||||||||||||||||
|
Unrealized
|
(4,168
|
)
|
(4,786
|
)
|
618
|
|
(12.9
|
)
|
(4,786
|
)
|
4,918
|
|
(9,704
|
)
|
NM
|
|
|||||||||||||
|
Realized
|
6,617
|
|
18,069
|
|
(11,452
|
)
|
(63.4
|
)
|
18,069
|
|
12,566
|
|
5,503
|
|
43.8
|
|
|||||||||||||
|
Total performance fees
|
2,449
|
|
13,283
|
|
(10,834
|
)
|
(81.6
|
)
|
13,283
|
|
17,484
|
|
(4,201
|
)
|
(24.0
|
)
|
|||||||||||||
|
Principal investment income
|
2,020
|
|
2,857
|
|
(837
|
)
|
(29.3
|
)
|
2,857
|
|
3,010
|
|
(153
|
)
|
(5.1
|
)
|
|||||||||||||
|
Total Revenues
|
95,132
|
|
92,358
|
|
2,774
|
|
3.0
|
|
92,358
|
|
85,346
|
|
7,012
|
|
8.2
|
|
|||||||||||||
|
Expenses:
|
|||||||||||||||||||||||||||||
|
Compensation and benefits:
|
|||||||||||||||||||||||||||||
|
Salary, bonus and benefits
|
43,356
|
|
39,468
|
|
3,888
|
|
9.9
|
|
39,468
|
|
33,171
|
|
6,297
|
|
19.0
|
|
|||||||||||||
|
Equity-based compensation
|
3,617
|
|
2,905
|
|
712
|
|
24.5
|
|
2,905
|
|
2,734
|
|
171
|
|
6.3
|
|
|||||||||||||
|
Profit sharing expense:
|
|||||||||||||||||||||||||||||
|
Unrealized
|
(973
|
)
|
(3,925
|
)
|
2,952
|
|
(75.2
|
)
|
(3,925
|
)
|
2,202
|
|
(6,127
|
)
|
NM
|
|
|||||||||||||
|
Realized
|
3,759
|
|
9,468
|
|
(5,709
|
)
|
(60.3
|
)
|
9,468
|
|
8,185
|
|
1,283
|
|
15.7
|
|
|||||||||||||
|
Equity-based
|
1,504
|
|
—
|
|
1,504
|
|
NM
|
|
—
|
|
—
|
|
—
|
|
NM
|
|
|||||||||||||
|
Total profit sharing expense
|
4,290
|
|
5,543
|
|
(1,253
|
)
|
(22.6
|
)
|
5,543
|
|
10,387
|
|
(4,844
|
)
|
(46.6
|
)
|
|||||||||||||
|
Total compensation and benefits
|
51,263
|
|
47,916
|
|
3,347
|
|
7.0
|
|
47,916
|
|
46,292
|
|
1,624
|
|
3.5
|
|
|||||||||||||
|
Non-compensation expenses:
|
|||||||||||||||||||||||||||||
|
General, administrative and other
|
26,177
|
|
20,701
|
|
5,476
|
|
26.5
|
|
20,701
|
|
21,528
|
|
(827
|
)
|
(3.8
|
)
|
|||||||||||||
|
Placement fees
|
7
|
|
—
|
|
7
|
|
NM
|
|
—
|
|
89
|
|
(89
|
)
|
(100.0
|
)
|
|||||||||||||
|
Total non-compensation expenses
|
26,184
|
|
20,701
|
|
5,483
|
|
26.5
|
|
20,701
|
|
21,617
|
|
(916
|
)
|
(4.2
|
)
|
|||||||||||||
|
Total Expenses
|
77,447
|
|
68,617
|
|
8,830
|
|
12.9
|
|
68,617
|
|
67,909
|
|
708
|
|
1.0
|
|
|||||||||||||
|
Other Loss:
|
|||||||||||||||||||||||||||||
|
Net gains (losses) from investment activities
|
44
|
|
(13
|
)
|
57
|
|
NM
|
|
(13
|
)
|
—
|
|
(13
|
)
|
NM
|
|
|||||||||||||
|
Net interest loss
|
(4,101
|
)
|
(4,678
|
)
|
577
|
|
(12.3
|
)
|
(4,678
|
)
|
(4,163
|
)
|
(515
|
)
|
12.4
|
|
|||||||||||||
|
Other income, net
|
490
|
|
2,460
|
|
(1,970
|
)
|
(80.1
|
)
|
2,460
|
|
692
|
|
1,768
|
|
255.5
|
|
|||||||||||||
|
Total Other Loss
|
(3,567
|
)
|
(2,231
|
)
|
(1,336
|
)
|
59.9
|
|
(2,231
|
)
|
(3,471
|
)
|
1,240
|
|
(35.7
|
)
|
|||||||||||||
|
Economic Income
|
$
|
14,118
|
|
$
|
21,510
|
|
$
|
(7,392
|
)
|
(34.4
|
)%
|
$
|
21,510
|
|
$
|
13,966
|
|
$
|
7,544
|
|
54.0
|
%
|
|||||||
|
(1)
|
Performance fees includes performance allocations and incentive fees.
|
Revenues
Year Ended
December 31, 2018
Compared to
Year Ended
December 31, 2017
Management fees
increase
d by
$4.6 million
for the
year ended December 31, 2018
, as compared to the
year ended December 31, 2017
. This change was primarily attributable to increases in management fees earned from ARI and real estate debt managed accounts of $5.0 million and $3.0 million, respectively, during the
year ended December 31, 2018
, as compared to the same period during
2017
. The increase in management fees was partially offset by a decrease in management fees earned from Trophy Property Development Fund, L.P. of $3.3 million during the
year ended December 31, 2018
, as compared to the same period during
2017
.
Advisory and transaction fees, net,
increase
d by
$9.8 million
for the
year ended December 31, 2018
, as compared to the
year ended December 31, 2017
. This change was primarily attributable to an
increase
in net advisory and transaction fees earned with respect to Apollo Infrastructure Equity Fund and the acquisition of management contracts for India-based funds of $6.0 million and $3.5 million, respectively, during the
year ended December 31, 2018
.
Performance fees
decrease
d by
$10.8 million
for the
year ended December 31, 2018
, as compared to the
year ended December 31, 2017
. Performance fees earned from certain funds, including U.S. RE Fund I and U.S. RE Fund II, includes an
-
126
-
allocation of performance fees from a strategic investment account that invests in the funds. The decrease in performance fees was primarily attributable to decreases in performance fees earned from strategic investment accounts, U.S. RE Fund I and U.S. RE Fund II of $4.5 million, $4.5 million and $4.2 million, respectively, during the
year ended December 31, 2018
, as compared to the
year ended December 31, 2017
. The decrease in performance fees earned from strategic investment accounts is primarily due to the reversal of cumulative unrealized performance fees for one of our strategic investment accounts that invests in Asia and lower appreciation of several of U.S. RE Fund II’s investments during the year ended December 31, 2018. Performance fees earned from U.S. RE Fund I decreased primarily due to unrealized depreciation on several of the fund’s investments during the year ended December 31, 2018, as compared to the year ended December 31, 2017. Performance fees earned from U.S. RE Fund II decreased primarily due to lower appreciation of several of the fund’s real estate investments during the year ended December 31, 2018, as compared to the year ended December 31, 2017.
Year Ended December 31, 2017 Compared to Year Ended December 31, 2016
Management fees increased by $14.4 million for the year ended December 31, 2017, as compared to the year ended December 31, 2016. This change was primarily attributable to increases in management fees earned with respect to ARI and Asia RE Fund of $8.2 million and $3.3 million, respectively, during the year ended December 31, 2017, as compared to the year ended December 31, 2016, in connection with capital raises for the funds during 2017.
Advisory and transaction fees, net, decreased by $3.1 million for the year ended December 31, 2017, as compared to the year ended December 31, 2016. This change was primarily attributable to decreases in net advisory and transaction fees earned with respect to AGRE Debt Fund I and U.S. RE Fund II of $2.4 million and $0.4 million, respectively, during the year ended December 31, 2017, as compared to the year ended December 31, 2016.
Performance fees decreased by $4.2 million for the year ended December 31, 2017, as compared to the year ended December 31, 2016. Performance fees earned from certain funds, including U.S. RE Fund I and II, includes an allocation of performance fees from a strategic investment account that invests in the funds. This change was primarily attributable to decreases in performance fees earned from strategic investment accounts of $4.3 million during the year ended December 31, 2017, as compared to the same period during 2016. In addition, U.S. RE Fund I had a decrease of $2.4 million during the year ended December 31, 2017, as compared to the year ended December 31, 2016. The decrease in performance fees earned from U.S. RE Fund I was primarily due to lower appreciation of several investments during the year ended December 31, 2017, as compared to the same period during 2016. The decrease was partially offset by an increase in performance fees earned from U.S. RE Fund II of $1.9 million. The increase in performance fees earned from U.S. RE Fund II was primarily due to strong operating performance across many of the fund’s underlying properties and appreciation of several real estate investments during the year ended December 31, 2017.
Expenses
Year Ended
December 31, 2018
Compared to
Year Ended
December 31, 2017
Compensation and benefits
increase
d by
$3.3 million
for the
year ended December 31, 2018
, as compared to the
year ended December 31, 2017
. Salary, bonus and benefits increased by
$3.9 million
during the
year ended December 31, 2018
, as compared to the same period during
2017
primarily due to increased headcount. The increase was partially offset by a decrease in total profit sharing expense of
$1.3 million
during the
year ended December 31, 2018
, as compared to the same period in
2017
, as a result of a corresponding decrease in performance fees as described above. In any period the blended profit sharing percentage is impacted by the respective profit sharing ratios of the funds generating performance fees in the period. Equity-based profit sharing expense increased as a result of grants under the 2007 Equity Plan during the
year ended December 31, 2018
(see note
12
to the consolidated financial statements).
Included in profit sharing expense is
$1.3 million
and
$1.6 million
related to the Incentive Pool for the
years ended
December 31, 2018
and
2017
, respectively. The Incentive Pool is separate from the fund related profit sharing expense and may result in greater variability in compensation and have a variable impact on the blended profit sharing percentage during a particular period.
General, administrative and other
increase
d by
$5.5 million
during the
year ended December 31, 2018
, as compared to the
year ended December 31, 2017
. This change was primarily attributable to
increase
s in professional fees during the
year ended December 31, 2018
, as compared to the same period in
2017
.
Year Ended December 31, 2017 Compared to Year Ended December 31, 2016
Compensation and benefits increased by $1.6 million for the year ended December 31, 2017, as compared to the year ended December 31, 2016. This change was primarily attributable to an increase in salary, bonus and benefits of $6.3 million
-
127
-
during the year ended December 31, 2017, as compared to the same period during 2016 primarily due to increased headcount. The increase in salary, bonus and benefits was partially offset by a decrease in profit sharing expense of $4.8 million during the year ended December 31, 2017 as compared to the year ended December 31, 2016 as a result of a corresponding decrease in performance fees as described above. In any period the blended profit sharing percentage is impacted by the respective profit sharing ratios of the funds generating performance fees in the period.
Included in profit sharing expense is $1.6 million and $3.5 million related to the Incentive Pool for the years ended December 31, 2017 and 2016, respectively. The Incentive Pool is separate from the fund related profit sharing expense and may result in greater variability in compensation and have a variable impact on the blended profit sharing percentage during a particular period.
Other Income (Loss)
Year Ended
December 31, 2018
Compared to
Year Ended
December 31, 2017
Other income, net
decrease
d by
$2.0 million
for the
year ended December 31, 2018
, as compared to the
year ended December 31, 2017
, primarily attributable to proceeds received in connection with the Company’s early termination of a lease during the
year ended December 31, 2017
.
Year Ended December 31, 2017 Compared to Year Ended December 31, 2016
Other income, net increased by $1.8 million for the year ended December 31, 2017, as compared to the year ended December 31, 2016, primarily attributable to proceeds recognized in connection with the Company’s early termination of a lease during the year ended December 31, 2017.
Summary of Fee Related Earnings
The following table is a summary of Fee Related Earnings.
|
For the Years Ended December 31,
|
|||||||||||
|
2018
|
2017
|
2016
|
|||||||||
|
(in thousands)
|
|||||||||||
|
Management Fees
|
$
|
1,282,688
|
|
$
|
1,082,315
|
|
$
|
977,649
|
|
||
|
Advisory and Transaction Fees, net
|
111,567
|
|
117,624
|
|
147,115
|
|
|||||
|
Performance fees
(1)
|
28,390
|
|
17,666
|
|
22,941
|
|
|||||
|
Salary, Bonus and Benefits
|
(414,962
|
)
|
(394,155
|
)
|
(366,890
|
)
|
|||||
|
Non-compensation Expenses
|
(241,413
|
)
|
(242,492
|
)
|
(242,923
|
)
|
|||||
|
Other Income (Loss) attributable to Fee Related Earnings
(2)
|
9,977
|
|
47,834
|
|
(554
|
)
|
|||||
|
Non-Controlling Interest
|
(5,008
|
)
|
(4,379
|
)
|
(7,464
|
)
|
|||||
|
Fee Related Earnings
|
$
|
771,239
|
|
$
|
624,413
|
|
$
|
529,874
|
|
||
|
(1)
|
Represents certain performance fees earned from business development companies and Redding Ridge Holdings.
|
|
(2)
|
Includes $19.0 million in proceeds received in connection with the Company’s early termination of a lease and $17.5 million in insurance proceeds received in connection with fees and expenses relating to a legal proceeding during the
year ended
December 31, 2017
.
|
-
128
-
Summary of Distributable Earnings
The following table is a reconciliation of Distributable Earnings per share of common and equivalents to net distribution per share of common and equivalent.
|
For the Years Ended December 31,
|
|||||||||||
|
2018
|
2017
|
2016
|
|||||||||
|
(in thousands, except per share data)
|
|||||||||||
|
Distributable Earnings
|
$
|
963,707
|
|
$
|
1,010,002
|
|
$
|
647,932
|
|
||
|
Taxes and related payables
(1)
|
(44,215
|
)
|
(26,337
|
)
|
(9,635
|
)
|
|||||
|
Preferred distributions
|
(31,662
|
)
|
(13,538
|
)
|
—
|
|
|||||
|
Distributable Earnings After Taxes and Related Payables
|
887,830
|
|
970,127
|
|
638,297
|
|
|||||
|
Add back: Tax and related payables attributable to common and equivalents
|
36,645
|
|
18,213
|
|
110
|
|
|||||
|
Distributable Earnings before certain payables
(2)
|
924,475
|
|
988,340
|
|
638,407
|
|
|||||
|
Percent to common and equivalents
|
51
|
%
|
49
|
%
|
47
|
%
|
|||||
|
Distributable Earnings before other payables attributable to common and equivalents
|
472,095
|
|
486,799
|
|
302,899
|
|
|||||
|
Less: Taxes and related payables attributable to common and equivalents
|
(36,645
|
)
|
(18,213
|
)
|
(110
|
)
|
|||||
|
Distributable Earnings attributable to common and equivalents
|
$
|
435,450
|
|
$
|
468,586
|
|
$
|
302,789
|
|
||
|
Distributable Earnings per share of common and equivalent
(3)
|
$
|
2.15
|
|
$
|
2.37
|
|
$
|
1.56
|
|
||
|
Retained capital per share of common and equivalent
(3)(4)
|
(0.32
|
)
|
(0.31
|
)
|
(0.14
|
)
|
|||||
|
Net distribution per share of common and equivalent
(3)
|
$
|
1.83
|
|
$
|
2.06
|
|
$
|
1.42
|
|
||
|
(1)
|
Represents the estimated current corporate, local and non-U.S. taxes as well as the payable under Apollo’s tax receivable agreement. DE After Taxes and Related Payables is calculated after current taxes and the impact of the tax receivable agreement (“TRA”). The TRA component of taxes used in calculating DE After Taxes was previously estimated based on the tax asset used to reduce the prior year’s tax liability. In 2018, the DE effective tax rate, using this estimation methodology, results in an increase in the tax rate despite the significantly reduced federal tax rate under tax reform. We believe it is more meaningful to estimate the current year impact of the TRA component of taxes when calculating DE After Taxes. The impact of this change is not significant to DE After Taxes and Related Payables as previously reported; giving effect to this change, DE After Taxes and Related Payables would have been
$937.8 million
and
$620.4 million
for the
years ended
December 31, 2017
and
2016
, respectively.
|
|
(2)
|
Distributable earnings before certain payables represents Distributable Earnings before the deduction for the estimated current corporate taxes and the payable under Apollo’s TRA.
|
|
(3)
|
Per share calculations are based on end of period Distributable Earnings Shares Outstanding, which consists of total Class A shares outstanding, AOG Units and RSUs that participate in distributions (collectively referred to as “common and equivalents”).
|
|
(4)
|
Retained capital is withheld pro-rata from common and equivalent holders.
|
-
129
-
Summary of Non-U.S. GAAP Measures
The table below sets forth a reconciliation of net income attributable Apollo Global Management, LLC Class A Shareholders to our non-U.S. GAAP performance measures:
|
For the Years Ended December 31,
|
|||||||||||
|
2018
|
2017
|
2016
|
|||||||||
|
(in thousands)
|
|||||||||||
|
Net Income (Loss) Attributable to Apollo Global Management, LLC Class A Shareholders
|
$
|
(42,038
|
)
|
$
|
615,566
|
|
$
|
402,850
|
|
||
|
Preferred distributions
|
31,662
|
|
13,538
|
|
—
|
|
|||||
|
Net income attributable to Non-Controlling Interests in consolidated entities
|
31,648
|
|
8,891
|
|
5,789
|
|
|||||
|
Net income (loss) attributable to Non-Controlling Interests in the Apollo Operating Group
|
(2,021
|
)
|
805,644
|
|
561,668
|
|
|||||
|
Net Income
|
$
|
19,251
|
|
$
|
1,443,639
|
|
$
|
970,307
|
|
||
|
Income tax provision
|
86,021
|
|
325,945
|
|
90,707
|
|
|||||
|
Income Before Income Tax Provision
|
$
|
105,272
|
|
$
|
1,769,584
|
|
$
|
1,061,014
|
|
||
|
Transaction-related charges and equity-based compensation
|
(5,631
|
)
|
17,496
|
|
57,042
|
|
|||||
|
Gain from remeasurement of tax receivable agreement liability
|
(35,405
|
)
|
(200,240
|
)
|
—
|
|
|||||
|
Net income attributable to Non-Controlling Interests in consolidated entities
|
(31,648
|
)
|
(8,891
|
)
|
(5,789
|
)
|
|||||
|
Economic Income
(1)
|
$
|
32,588
|
|
$
|
1,577,949
|
|
$
|
1,112,267
|
|
||
|
Income tax provision on Economic Income
|
(85,513
|
)
|
(127,280
|
)
|
(165,522
|
)
|
|||||
|
Preferred distributions
|
(31,662
|
)
|
(13,538
|
)
|
—
|
|
|||||
|
Economic Net Income (Loss)
|
$
|
(84,587
|
)
|
$
|
1,437,131
|
|
$
|
946,745
|
|
||
|
Preferred distributions
|
31,662
|
|
13,538
|
|
—
|
|
|||||
|
Income tax provision on Economic Income
|
85,513
|
|
127,280
|
|
165,522
|
|
|||||
|
Performance fees
(2)
|
402,700
|
|
(1,319,924
|
)
|
(762,945
|
)
|
|||||
|
Profit sharing expense
|
40,327
|
|
509,217
|
|
316,650
|
|
|||||
|
Equity-based compensation
(3)
|
69,770
|
|
67,874
|
|
64,468
|
|
|||||
|
Principal investment income
|
(7,614
|
)
|
(162,951
|
)
|
(102,581
|
)
|
|||||
|
Net (gains) losses from investment activities
|
186,426
|
|
(94,774
|
)
|
(138,608
|
)
|
|||||
|
Net interest loss
|
37,573
|
|
44,984
|
|
39,019
|
|
|||||
|
Other
|
9,469
|
|
2,038
|
|
1,604
|
|
|||||
|
Fee Related Earnings
|
$
|
771,239
|
|
$
|
624,413
|
|
$
|
529,874
|
|
||
|
Gain from remeasurement of tax receivable agreement liability
|
—
|
|
—
|
|
3,208
|
|
|||||
|
Depreciation, amortization and other, net
|
9,140
|
|
13,179
|
|
9,928
|
|
|||||
|
Fee Related EBITDA
|
$
|
780,379
|
|
$
|
637,592
|
|
$
|
543,010
|
|
||
|
Realized performance fees
(4)
|
380,188
|
|
631,359
|
|
251,946
|
|
|||||
|
Realized profit sharing expense
(4)
|
(225,629
|
)
|
(278,838
|
)
|
(136,793
|
)
|
|||||
|
Fee Related EBITDA + 100% of Net Realized Performance Fees
|
$
|
934,938
|
|
$
|
990,113
|
|
$
|
658,163
|
|
||
|
Non-cash revenues
|
(3,369
|
)
|
(3,369
|
)
|
(3,369
|
)
|
|||||
|
Realized principal investment income
|
69,711
|
|
68,242
|
|
37,180
|
|
|||||
|
Net interest loss
|
(37,573
|
)
|
(44,984
|
)
|
(39,019
|
)
|
|||||
|
Gain from remeasurement of tax receivable agreement liability
|
—
|
|
—
|
|
(3,208
|
)
|
|||||
|
Other
|
—
|
|
—
|
|
(1,815
|
)
|
|||||
|
Distributable Earnings
|
$
|
963,707
|
|
$
|
1,010,002
|
|
$
|
647,932
|
|
||
|
Taxes and related payables
|
(44,215
|
)
|
(26,337
|
)
|
(9,635
|
)
|
|||||
|
Preferred distributions
|
(31,662
|
)
|
(13,538
|
)
|
—
|
|
|||||
|
Distributable Earnings After Taxes and Related Payables
|
$
|
887,830
|
|
$
|
970,127
|
|
$
|
638,297
|
|
||
|
(1)
|
See note
16
for more details regarding Economic Income for the combined segments.
|
|
(2)
|
Excludes certain performance fees from business development companies and Redding Ridge Holdings.
|
-
130
-
|
(3)
|
Includes equity-based compensation related to RSUs (excluding RSUs granted in connection with the 2007 private placement), share options and restricted share awards.
|
|
(4)
|
Excludes realized performance fees and realized profit sharing expense in the form of Athene shares.
|
Liquidity and Capital Resources
Overview
Apollo’s business model primarily derives revenues and cash flows from the assets it manages. Apollo targets operating expense levels such that fee income exceeds total operating expenses each period. The company intends to distribute to its shareholders on a quarterly basis substantially all of its distributable earnings after taxes and related payables in excess of amounts determined to be necessary or appropriate to provide for the conduct of the business. As a result, the Company requires limited capital resources to support the working capital or operating needs of the business. While primarily met by cash flows generated through fee income received, liquidity needs are also met (to a limited extent) through proceeds from borrowings and equity issuances as described in notes
10
and
13
to the
consolidated
financial statements, respectively. The Company had cash and cash equivalents of
$609.7 million
at
December 31, 2018
.
Primary Sources and Uses of Cash
The Company has multiple sources of short-term liquidity to meet its capital needs, including cash on hand, annual cash flows from its activities, and available funds from the Company’s $750 million revolving credit facility as of
December 31, 2018
. The Company believes these sources will be sufficient to fund our capital needs for at least the next twelve months. If the Company determines that market conditions are favorable after taking into account our liquidity requirements, we may seek to issue additional senior notes, preferred equity, or other financing instruments.
The section below discusses in more detail the Company’s primary sources and uses of cash and the primary drivers of cash flows within the Company’s
consolidated
statements of cash flows:
|
|
For the Years Ended December 31,
|
||||||||||
|
|
2018
|
2017
|
2016
|
||||||||
|
|
(in thousands)
|
||||||||||
|
Operating Activities
|
$
|
814,259
|
|
$
|
859,852
|
|
$
|
599,785
|
|
||
|
Investing Activities
|
(247,260
|
)
|
(417,819
|
)
|
(183,781
|
)
|
|||||
|
Financing Activities
|
(752,184
|
)
|
(453,635
|
)
|
(236,157
|
)
|
|||||
|
Net Increase (Decrease) in Cash and Cash Equivalents, Restricted Cash and Cash Held at Consolidated Variable Interest Entities
|
$
|
(185,185
|
)
|
$
|
(11,602
|
)
|
$
|
179,847
|
|
||
Operating Activities
The Company’s operating activities support its investment management activities. The primary sources of cash within the operating activities section include: (a) management fees, (b) advisory and transaction fees, (c) realized performance revenues, and (d) realized principal investment income. The primary uses of cash within the operating activities section include: (a) compensation and non-compensation related expenses, (b) placement fees, and (c) interest and taxes.
|
•
|
During the
years ended
December 31, 2018, 2017 and 2016
, cash provided by operating activities primarily includes cash inflows from the receipt of management fees, advisory and transaction fees, realized performance revenues, and realized principal investment income, offset by cash outflows for compensation, general, administrative, and other expenses. Net cash provided by operating activities also reflects the operating activity of our consolidated funds and VIEs, which primarily include cash inflows from the sale of investments offset by cash outflows for purchases of investments.
|
Investing Activities
The Company’s investing activities support growth of its business. The primary sources of cash within the investing activities section include distributions from investments. The primary uses of cash within the investing activities section include: (a) capital expenditures, (b) investment purchases, including purchases of U.S. Treasury securities, and (c) equity method investments in the funds we manage.
|
•
|
During the
year ended December 31, 2018
, cash used by investing activities primarily reflects purchases of U.S. Treasury securities and other investments and net contributions to equity method investments, offset by proceeds from maturities of U.S. Treasury securities.
|
-
131
-
|
•
|
During the
year ended December 31, 2017
, cash used by investing activities primarily reflects purchases of U.S. Treasury securities and net contributions to equity method investments, offset by repayment of related party loans.
|
|
•
|
During the
year ended December 31, 2016
, cash used by investing activities primarily reflects purchases of other investments and net contributions to equity method investments.
|
Financing Activities
The Company’s financing activities reflect its capital market transactions and transactions with owners. The primary sources of cash within the financing activities section includes proceeds from debt and preferred equity issuances. The primary uses of cash within the financing activities section include: (a) distributions, (b) TRA payments, (c) share repurchases, (d) cash paid to settle tax withholding obligations in connection with net share settlements of equity-based awards, and (e) repayments of debt.
|
•
|
During the
year ended December 31, 2018
, cash used by financing activities primarily reflects repayments on the Term Facility and distributions to Class A shareholders and Non-Controlling interest holders, partially offset by proceeds from the issuance of the Series B Preferred shares and the 2048 Senior Notes.
|
|
•
|
During the
year ended December 31, 2017
, cash used by financing activities primarily reflects distributions to Class A shareholders and Non-Controlling interest holders, offset by proceeds from the issuance of Series A Preferred shares. Net cash provided by financing activities also reflects the financing activity of our consolidated funds and VIEs, which primarily include cash inflows from the issuance of debt offset by cash outflows for the principal repayment of debt.
|
|
•
|
During the
year ended December 31, 2016
, cash used by financing activities primarily reflects repayments on the Term Facility, distributions to Class A shareholders and Non-Controlling interest holders, offset by proceeds from the issuance of the 2026 Senior Notes.
|
Future Debt Obligations
The Company had long-term debt of
$1.4 billion
at
December 31, 2018
, which includes
$1.3 billion
of senior notes with maturities in 2024, 2026 and 2048. See note
10
to the
consolidated
financial statements for further information regarding the Company’s debt arrangements. Additionally, see note
17
to the consolidated financial statements for information regarding the 2029 Senior Notes.
Contractual Obligations, Commitments and Contingencies
The Company had unfunded general partner commitments of
$1.2 billion
at
December 31, 2018
, of which
$469 million
related to Fund IX. For a summary and a description of the nature of the Company’s commitments, contingencies and contractual obligations, see note
15
to the
consolidated
financial statements and “—Contractual Obligations, Commitments and Contingencies”. The Company’s commitments are primarily fulfilled through cash flows from operations and (to a limited extent) through borrowings and equity issuances as described in notes
10
and
13
to the
consolidated
financial statements, respectively.
Consolidated Funds and VIEs
The Company manages its liquidity needs by evaluating unconsolidated cash flows; however, the Company’s financial statements reflect the financial position of Apollo as well as Apollo’s consolidated funds and VIEs. The primary sources and uses of cash at Apollo’s consolidated funds and VIEs include: (a) raising capital from their investors, which have been reflected historically as Non-Controlling Interests of the consolidated subsidiaries in our financial statements, (b) using capital to make investments, (c) generating cash flows from operations through distributions, interest and the realization of investments, (d) distributing cash flow to investors, and (e) issuing debt to finance investments (CLOs).
Other Liquidity and Capital Resource Considerations
Future Cash Flows
Our ability to execute our business strategy, particularly our ability to increase our AUM, depends on our ability to establish new funds and to raise additional investor capital within such funds. Our liquidity will depend on a number of factors, such as our ability to project our financial performance, which is highly dependent on our funds and our ability to manage our projected costs, fund performance, access to credit facilities, compliance with existing credit agreements, as well as industry and market trends. Also during economic downturns the funds we manage might experience cash flow issues or liquidate entirely. In these situations we might be asked to reduce or eliminate the management fee and performance fees we charge, which could adversely impact our cash flow in the future.
-
132
-
An increase in the fair value of our funds’ investments, by contrast, could favorably impact our liquidity through higher management fees where the management fees are calculated based on the net asset value, gross assets or adjusted assets. Additionally, higher performance fees not yet realized would generally result when investments appreciate over their cost basis which would not have an impact on the Company’s cash flow until realized.
Consideration of Financing Arrangements
As noted above, in limited circumstances, the Company may issue debt or equity to supplement its liquidity. The decision to enter into a particular financing arrangement is made after careful consideration of various factors including the Company’s cash flows from operations, future cash needs, current sources of liquidity, demand for the Company’s debt or equity, and prevailing interest rates.
Revolver Facility
As further described in note
10
to the
consolidated
financial statements, the 2013 AMH Credit Facilities and all related loan documents were terminated as of July 11, 2018. Under the Company’s 2018 AMH Credit Facility, the Company may borrow in an aggregate amount not to exceed $750 million and may incur incremental facilities in an aggregate amount not to exceed $250 million plus additional amounts so long as the Borrower is in compliance with a net leverage ratio not to exceed 4.00 to 1.00. Borrowings under the 2018 AMH Credit Facility may be used for working capital and general corporate purposes, including without limitation, permitted acquisitions. As of
December 31, 2018
, the 2018 AMH Credit Facility was undrawn.
Distributions
For information regarding the quarterly distributions which were made at the sole discretion of the Company’s manager during
2018
and
2017
to Class A shareholders, Non-Controlling Interest holders in the Apollo Operating Group and participating securities, see note
13
to the
consolidated
financial statements.
Although the Company expects to pay distributions according to our distribution policy, we may not pay distributions according to our policy, or at all, if, among other things, we do not have the cash necessary to pay the intended distributions. To the extent we do not have cash on hand sufficient to pay distributions, we may have to borrow funds to pay distributions, or we may determine not to pay distributions. The declaration, payment and determination of the amount of our quarterly distributions are at the sole discretion of our manager.
On
January 31, 2019
, the Company declared a cash distribution of
$0.56
per Class A share, which will be paid on
February 28, 2019
to holders of record on
February 21, 2019
. Also, the Company declared a cash distribution of
$0.398438
per Series A Preferred share and Series B Preferred share which will be paid on
March 15, 2019
to holders of record on
March 1, 2019
.
Tax Receivable Agreement
The tax receivable agreement provides for the payment to the Managing Partners and Contributing Partners of 85% of the amount of cash savings, if any, in U.S. federal, state, local and foreign income taxes that APO Corp. realizes subject to the agreement. For more information regarding the tax receivable agreement, see note
14
to the
consolidated
financial statements.
APO Share Repurchases
In February 2016, Apollo announced its adoption of a program to repurchase up to
$250 million
in the aggregate of its Class A shares. In January 2019, the Company increased its authorized share repurchase amount by
$250 million
bringing the total share repurchase plan authorization to
$500 million
, which may be used to repurchase outstanding Class A shares as well as to reduce Class A shares to be issued to employees to satisfy associated tax obligations in connection with the settlement of equity-based awards granted under the Company’s 2007 Equity Plan (and any successor equity plan thereto). Under the share repurchase program, shares may be repurchased from time to time in open market transactions, in privately negotiated transactions, pursuant to a trading plan adopted in accordance with Rule 10b5-1 of the Exchange Act, or otherwise, with the size and timing of these repurchases depending on legal requirements, price, market and economic conditions and other factors. Apollo is not obligated under the terms of the share repurchase program to repurchase any of its Class A shares. The repurchase program has no expiration date and may be suspended or terminated by the Company at any time without prior notice. Class A shares repurchased as part of the program will be canceled by the Company.
AINV Share Purchases
On March 11, 2016, it was announced that Apollo intended to embark on a program to purchase $50 million of AINV’s common stock, subject to certain regulatory approvals. Under the program, shares may be purchased from time to time in open
-
133
-
market transactions and in accordance with applicable law. As of
December 31, 2018
, Apollo had purchased approximately
871 thousand
shares, or approximately
$4.9 million
of AINV’s common stock.
Athora
On April 14, 2017, Apollo made an unfunded commitment of €125 million to purchase new Class B-1 equity interests in Athora, a strategic platform established to acquire traditional closed life insurance policies and provide capital and reinsurance solutions to insurers in Europe. In January 2018, Apollo purchased Class C-1 equity interests in Athora that represent a profits interest in Athora which, upon meeting certain vesting triggers, will be convertible by Apollo into additional Class B-1 equity interests in Athora. Apollo and Athene are minority investors in Athora and long term strategic partners with aggregate voting power of 35% and 10%, respectively. For more information regarding unfunded general partner commitments, see “—Contractual Obligations, Commitments and Contingencies”.
Fund VIII, Fund VII, Fund VI, ANRP I and ANRP II Escrow
As of
December 31, 2018
, the remaining investments and escrow cash of Fund VIII were valued at
118%
of the fund’s unreturned capital, which was above the required escrow ratio of 115%. As of
December 31, 2018
, the remaining investments and escrow cash of Fund VII, Fund VI, ANRP I and ANRP II were valued at
77%
,
73%
,
63%
and
107%
of the fund’s unreturned capital, respectively, which were below the required escrow ratio of 115%. As a result, these funds are required to place in escrow current and future performance fee distributions to the general partner until the specified return ratio of 115% is met (at the time of a future distribution) or upon liquidation.
Clawback
Performance fees from our private equity funds and certain credit and real assets funds are subject to contingent repayment by the general partner in the event of future losses to the extent that the cumulative performance fees distributed from inception to date exceeds the amount computed as due to the general partner at the final distribution. See “—Overview of Results of Operations—Performance Fees” for the maximum performance fees subject to potential reversal by each fund.
Indemnification Liability
The Company recorded an indemnification liability in the event that our Managing Partners, Contributing Partners and certain investment professionals are required to pay amounts in connection with a general partner obligation to return previously distributed performance fees. See note
14
to the
consolidated
financial statements for further information regarding the Company’s indemnification liability.
Investment Management Agreements - Athene Asset Management
On September 20, 2018, a subsidiary of Apollo Global Management, LLC entered into a letter agreement (the “Letter Agreement”) with Athene Holding Ltd. In the Letter Agreement, each of the Company and Athene agreed that, if the shareholders of Athene approve an amendment and restatement of the bye-laws of Athene (further described below), it will execute the amendment and restatement of the Sixth Amended and Restated Fee Agreement, dated June 7, 2018, between the Company and Athene (the “Existing Fee Agreement”) in substantially the form attached as an exhibit to the Letter Agreement (the “Proposed Amended Fee Agreement”).
The Proposed Amended Fee Agreement provides for a monthly fee to be payable by Athene to the Company in arrears, with retroactive effect to the month beginning on January 1, 2019, in an amount equal to the following, to the extent not otherwise payable to the Company pursuant to any one or more investment management or sub-advisory agreements or arrangements:
(1)
a base management fee equal to the sum of (i) 0.225% per annum of the lesser of (A) the aggregate market value of substantially all of the assets in substantially all of the investment accounts of or relating to Athene (collectively, the “Accounts”) on December 31, 2018 (the “Backbook Value”) and (B) the aggregate market value of substantially all of the assets in the Accounts at the end of the respective month,
plus
(ii) 0.15% per annum of the amount, if any (the “Incremental Value”), by which the aggregate market value of substantially all of the assets in the Accounts at the end of the respective month exceeds the Backbook Value;
plus
(2)
with respect to each asset in an Account, subject to certain exceptions, that is managed by the Company and that belongs to a specified asset class tier (“core,” “core plus,” “yield,” and “high alpha”), a sub-allocation fee as follows, which will, in the case of assets acquired after January 1, 2019, be subject to a cap of 10% of the applicable asset’s gross book yield:
-
134
-
(i)
0.065% of the market value of “core assets,” which include public investment grade corporate bonds, municipal securities, and agency residential mortgage backed securities (“RMBS”);
(ii)
0.13% of the market value of “core plus assets,” which include private investment grade corporate bonds, first lien commercial mortgage loans (“CML”), and long-term fixed rate mortgages;
(iii)
0.375% of the market value of “yield assets,” which include non-agency RMBS, investment grade CLOs, commercial mortgage backed securities and other asset-backed securities (other than RMBS), emerging market investments, below investment grade corporate bonds, residential mortgage loans, triple net leases, bank loans, investment grade infrastructure debt, and lower yielding floating rate mortgages;
(iv)
0.70% of the market value of “high alpha assets,” which include mezzanine CMLs, below investment grade CLOs, preferred equity, assets originated by MidCap, higher yielding mortgages and below investment grade infrastructure debt; and
(v)
0.00% of the market value of cash, treasuries, equities and alternatives.
The base management fee covers a range of investment services that Athene receives from the Company, including investment management, asset allocation, mergers and acquisition asset diligence and certain operational support services such as investment compliance, tax, legal and risk management support, among others. Additionally, the Proposed Amended Fee Agreement provides for a possible payment by the Company to Athene, or a possible payment by Athene to the Company, equal to 0.025% of the Incremental Value as of the end of each year, beginning on December 31, 2019, depending upon the percentage of Athene’s investments that consist of core assets and core plus assets. In furtherance of yield support for Athene, if more than 60% of Athene’s invested assets which are subject to the sub-allocation fees are invested in core and core plus assets, Athene will receive a 0.025% fee reduction on the Incremental Value. As an incentive for differentiated asset management, if less than 50% of Athene’s invested assets which are subject to the sub-allocation fee are invested in core and core plus assets, thereby reflecting a higher allocation toward assets with the highest alpha-generating abilities, Athene will pay an additional fee of 0.025% on Incremental Value.
The Proposed Amended Fee Agreement is intended to provide for further alignment of interests between Athene and the Company. On the Backbook Value, assuming constant portfolio allocations, the near-term impact of the Proposed Amended Fee Agreement is anticipated to be immaterial. On the Incremental Value, assuming the same allocations as the Backbook Value, total fees paid by Athene to the Company are expected to be marginally lower than fees paid by Athene to the Company would be under the Existing Fee Agreement. If invested asset allocations are more heavily weighted to assets with lower alpha-generating abilities than Athene’s current investment portfolio, the fees that Athene pays to the Company under the Proposed Amended Fee Agreement would be expected to decline relative to the Existing Fee Agreement. Conversely, if a greater proportion of Athene’s investment portfolio is allocated to differentiated assets with higher alpha-generating abilities, Athene’s net investment earned rates would be expected to increase, and so would the fees Athene pays to the Company relative to the Existing Fee Agreement.
To incentivize the Company to make long-term investments that enhances its ability to continue to provide Athene with differentiated asset management, Athene has proposed changes to its existing Bye-Laws (the “Existing Bye-Laws”) set forth in an amendment and restatement of the Existing Bye-Laws in substantially the form attached as an exhibit to the Letter Agreement (the “Proposed Bye-Laws”). Specifically, the Proposed Bye-Laws, if adopted as the Bye-Laws of Athene, will (1) provide for the IMA and each New IMA (each such term as defined in the Existing Bye-Laws) to have initial terms of four years, beginning on the date on which the Proposed Bye-Laws are adopted as the Bye-Laws of Athene (the “Adoption Date”), that extend automatically for successive two-year periods unless otherwise terminated (with any such termination being effective no earlier than two years after the end of the then existing term), and (2) reflect conforming amendments, including by amending the IMA Termination Election Date (as defined in the Existing Bye-Laws) to be the fourth anniversary of the Adoption Date and each two-year anniversary of the Adoption Date. The Proposed Bye-Laws, if adopted as the Bye-Laws of Athene, will continue to permit Athene to terminate the IMA, or any New IMA, for cause. In the Letter Agreement, Athene (1) confirmed that its board of directors approved, and recommended that its shareholders approve, the Proposed Bye-Laws and (2) agreed that it will seek the approval of its shareholders of the Proposed Bye-Laws at the next annual general meeting of its shareholders.
Equity-Based Profit Sharing Expense
Profit sharing amounts are generally not paid until the related performance fees are distributed to the general partner upon realization of the fund’s investments. Under certain profit sharing arrangements, a portion of the performance fees distributed to the general partner is allocated by issuance of equity-based awards, rather than cash, to employees. See note
2
to the
consolidated
financial statements for further information regarding the accounting for the Company’s profit sharing arrangements.
-
135
-
Strategic Relationship Agreement with CalPERS
On April 20, 2010, the Company announced that it entered into a strategic relationship agreement with CalPERS. The strategic relationship agreement provides that Apollo will reduce fees charged to CalPERS on funds it manages, or in the future will manage, solely for CalPERS by $125 million over a five-year period or as close a period as required to provide CalPERS with that benefit. The agreement further provides that Apollo will not use a placement agent in connection with securing any future capital commitments from CalPERS. As of
December 31, 2018
, the Company had reduced fees charged to CalPERS on the funds it manages by approximately
$107.8 million
.
Critical Accounting Policies
This Management’s Discussion and Analysis of Financial Condition and Results of Operations is based upon the
consolidated
financial statements, which have been prepared in accordance with U.S. GAAP. The preparation of financial statements in accordance with U.S. GAAP requires the use of estimates and assumptions that could affect the reported amounts of assets and liabilities, the disclosure of contingent assets and liabilities and the reported amounts of revenues and expenses. Actual results could differ from these estimates. A summary of our significant accounting policies is presented in note
2
to our
consolidated
financial statements. The following is a summary of our accounting policies that are affected most by judgments, estimates and assumptions.
Consolidation
The Company assesses all entities with which it is involved for consolidation on a case by case basis depending on the specific facts and circumstances surrounding each entity. Pursuant to the consolidation guidance, the Company first evaluates whether it holds a variable interest in an entity. Apollo factors in all economic interests including proportionate interests through related parties, to determine if such interests are to be considered a variable interest. As Apollo’s interest in many of these entities is solely through market rate fees and/or insignificant indirect interests through related parties, Apollo is generally not considered to have a variable interest in many of these entities under the guidance and no further consolidation analysis is performed. For entities where the Company has determined that it does hold a variable interest, the Company performs an assessment to determine whether each of those entities qualify as a VIE.
The determination as to whether an entity qualifies as a VIE depends on the facts and circumstances surrounding each entity and therefore certain of Apollo’s funds may qualify as VIEs under the variable interest model whereas others may qualify as voting interest entities (“VOEs”) under the voting interest model. The granting of substantive kick-out rights is a key consideration in determining whether a limited partnership or similar entity is a VIE and whether or not that entity should be consolidated.
Under the voting interest model, Apollo consolidates those entities it controls through a majority voting interest. Apollo does not consolidate those VOEs in which substantive kick-out rights have been granted to the unaffiliated investors to either dissolve the fund or remove the general partner.
Under the variable interest model, Apollo consolidates those entities where it is determined that the Company is the primary beneficiary of the entity. The Company is determined to be the primary beneficiary if it holds a controlling financial interest in the VIE defined as possessing both (i) the power to direct the activities of the VIE that most significantly impact the VIE’s economic performance and (ii) the obligation to absorb losses of the VIE or the right to receive benefits from the VIE that could potentially be significant to the VIE. If Apollo alone is not considered to have a controlling financial interest in the VIE but Apollo and its related parties under common control in the aggregate have a controlling financial interest in the VIE, Apollo will still be deemed to be the primary beneficiary if it is the party within the related party group that is most closely associated with the VIE. If Apollo and its related parties not under common control in the aggregate have a controlling financial interest in a VIE, then Apollo is deemed to be the primary beneficiary if substantially all the activities of the entity are performed on behalf of Apollo. Apollo determines whether it is the primary beneficiary of a VIE at the time it becomes initially involved with the VIE and reconsiders that conclusion continuously. Investments and redemptions (either by Apollo, related parties of Apollo or third parties) or amendments to the governing documents of the respective entity may affect an entity’s status as a VIE or the determination of the primary beneficiary.
The assessment of whether an entity is a VIE and the determination of whether Apollo should consolidate such VIE requires judgment by our management. Those judgments include, but are not limited to: (i) determining whether the total equity investment at risk is sufficient to permit the entity to finance its activities without additional subordinated financial support, (ii) evaluating whether the holders of equity investment at risk, as a group, can make decisions that have a significant effect on the success of the entity, (iii) determining whether the equity investors have proportionate voting rights to their obligations to absorb losses or rights to receive the expected residual returns from an entity and (iv) evaluating the nature of the relationship and activities of those related parties with shared power or under common control for purposes of determining which party within the
-
136
-
related-party group is most closely associated with the VIE. Judgments are also made in determining whether a member in the equity group has a controlling financial interest including power to direct activities that most significantly impact the VIE’s economic performance and rights to receive benefits or obligations to absorb losses that could be potentially significant to the VIE. This analysis considers all relevant economic interests including proportionate interests held through related parties.
Revenue Recognition
Performance Fees.
We earn performance fees from our funds as a result of such funds achieving specified performance criteria. Such performance fees generally are earned based upon a fixed percentage of realized and unrealized gains of various funds after meeting any applicable hurdle rate or threshold minimum.
Performance allocations are performance fees that are generally structured from a legal standpoint as an allocation of capital to the Company. Performance allocations from certain of the funds that we manage are subject to contingent repayment and is generally paid to us as particular investments made by the funds are realized. If, however, upon liquidation of a fund, the aggregate amount paid to us as performance fees exceeds the amount actually due to us based upon the aggregate performance of the fund, the excess (in certain cases net of taxes) is required to be returned by us to that fund. We account for performance allocations as an equity method investment, and accordingly, we accrue performance allocations quarterly based on fair value of the underlying investments and separately assess if contingent repayment is necessary. The determination of performance allocations and contingent repayment considers both the terms of the respective partnership agreements and the current fair value of the underlying investments within the funds. Estimates and assumptions are made when determining the fair value of the underlying investments within the funds and could vary depending on the valuation methodology that is used. See “Investments, at Fair Value” below for further discussion related to significant estimates and assumptions used for determining fair value of the underlying investments in our credit, private equity and real assets funds.
Incentive fees are performance fees structured as a contractual fee arrangement rather than a capital allocation. Incentive fees are generally received from the management of CLOs, managed accounts and AINV. For a majority of our incentive fees, once the quarterly or annual incentive fees have been determined, there is no look-back to prior periods for a potential contingent repayment, however, certain other incentive fees can be subject to contingent repayment at the end of the life of the entity. In accordance with the new revenue recognition standard, certain incentive fees are considered a form of variable consideration and therefore are deferred until fees are probable to not be significantly reversed. There is significant judgment involved in determining if the incentive fees are probable to not be significantly reversed, but generally the Company will defer the revenue until the fees are crystallized or are no longer subject to clawback or reversal. Prior to the adoption of the new revenue recognition guidance, incentive fees were recognized on an assumed liquidation basis.
Management Fees.
Management fees related to our credit funds, can be based on net asset value, gross assets, adjusted cost of all unrealized portfolio investments, capital commitments, adjusted assets, capital contributions, or stockholders’ equity all as defined in the respective partnership agreements. The credit management fee calculations that consider net asset value, gross assets, adjusted cost of all unrealized portfolio investments and adjusted assets are normally based on the terms of the respective partnership agreements and the current fair value of the underlying investments within the funds. Estimates and assumptions are made when determining the fair value of the underlying investments within the funds and could vary depending on the valuation methodology that is used. The management fees related to our private equity funds, by contrast, are generally based on a fixed percentage of the committed capital or invested capital. The corresponding fee calculations that consider committed capital or invested capital are both objective in nature and therefore do not require the use of significant estimates or assumptions. The management fees related to our real assets funds are generally based on a specific percentage of the funds’ stockholders’ equity or committed or net invested capital or the capital accounts of the limited partners. See “Investments, at Fair Value” below for further discussion related to significant estimates and assumptions used for determining fair value of the underlying investments in our credit, private equity and real assets funds.
Investments, at Fair Value
On a quarterly basis, Apollo utilizes valuation committees consisting of members from senior management, to review and approve the valuation results related to the investments of the funds it manages. For certain publicly traded vehicles managed by Apollo, a review is performed by an independent board of directors. The Company also retains independent valuation firms to provide third-party valuation consulting services to Apollo, which consist of certain limited procedures that management identifies and requests them to perform. The limited procedures provided by the independent valuation firms assist management with validating their valuation results or determining fair value. The Company performs various back-testing procedures to validate their valuation approaches, including comparisons between expected and observed outcomes, forecast evaluations and variance analyses. However, because of the inherent uncertainty of valuation, the estimated values may differ significantly from the values that would have been used had a ready market for the investments existed, and the differences could be material.
-
137
-
The fair values of the investments in our funds can be impacted by changes to the assumptions used in the underlying valuation models. For further discussion on the impact of changes to valuation assumptions see “Item 7A. Quantitative and Qualitative Disclosures About Market Risk—Sensitivity” in this Annual Report on Form 10-K. There have been no material changes to the valuation approaches utilized during the periods that our financial results are presented in this report.
Fair Value of Financial Instruments
Except for the Company’s debt obligations (each as defined in note
10
to our
consolidated
financial statements), Apollo’s financial instruments are recorded at fair value or at amounts whose carrying values approximate fair value. See “—Investments, at Fair Value” above. While Apollo’s valuations of portfolio investments are based on assumptions that Apollo believes are reasonable under the circumstances, the actual realized gains or losses will depend on, among other factors, future operating results, the value of the assets and market conditions at the time of disposition, any related transaction costs and the timing and manner of sale, all of which may ultimately differ significantly from the assumptions on which the valuations were based. Financial instruments’ carrying values generally approximate fair value because of the short-term nature of those instruments or variable interest rates related to the borrowings.
Profit Sharing Expense.
Profit sharing expense is primarily a result of agreements with our Contributing Partners and employees to compensate them based on the ownership interest they have in the general partners of the Apollo funds. Therefore, changes in the fair value of the underlying investments in the funds we manage and advise affect profit sharing expense. The Contributing Partners and employees are allocated approximately 30% to 50%, of the total performance fees which is driven primarily by changes in fair value of the underlying fund’s investments and is treated as compensation expense. Additionally, profit sharing expenses paid may be subject to clawback from employees, former employees and Contributing Partners to the extent not indemnified. When applicable, the accrual for potential clawback of previously distributed profit sharing amounts, which is a component of due from related parties on the
consolidated
statements of financial condition, represents all amounts previously distributed to employees, former employees and Contributing Partners that would need to be returned to the general partner if the Apollo funds were to be liquidated based on the current fair value of the underlying funds’ investments as of the reporting date. The actual general partner receivable, however, would not become realized until the end of a fund’s life.
Several of the Company’s employee remuneration programs are dependent upon performance fee realizations, including the Incentive Pool, dedicated performance fee rights and certain RSU awards for which vesting is contingent, in part, on the realization of performance fees in a specified period. The Company established these programs to attract and retain, and provide incentive to, partners and employees of the Company and to more closely align the overall compensation of partners and employees with the overall realized performance of the Company. Dedicated performance fee rights entitle their holders to payments arising from performance fee realizations. The Incentive Pool enables certain partners and employees to earn discretionary compensation based on realized performance fees in a given year, which amounts are reflected in profit sharing expense in the Company’s
consolidated
financial statements. Amounts earned by participants as a result of their performance fee rights (whether dedicated or Incentive Pool) will vary year-to-year depending on the overall realized performance of the Company (and, in the case of the Incentive Pool, on their individual performance). There is no assurance that the Company will continue to compensate individuals through the same types of arrangements in the future and there may be periods when the executive committee of the Company’s manager determines that allocations of realized performance fees are not sufficient to compensate individuals, which may result in an increase in salary, bonus and benefits, the modification of existing programs or the use of new remuneration programs. Reductions in performance fee revenues could also make it harder to retain employees and cause employees to seek other employment opportunities.
Fair Value Option.
Apollo has elected the fair value option for the Company’s investment in Athene Holding, the assets and liabilities of certain of its consolidated VIEs (including CLOs), the Company’s U.S. Treasury securities with original maturities greater than three months when purchased and certain of the Company’s other investments. Such election is irrevocable and is applied to financial instruments on an individual basis at initial recognition. See notes
4
,
6
, and
7
to the
consolidated
financial statements for further disclosure.
Equity-Based Compensation.
Equity-based compensation is accounted for in accordance with U.S. GAAP, which requires that the cost of employee services received in exchange for an award is generally measured based on the grant date fair value of the award. Equity-based awards that do not require future service (i.e., vested awards) are expensed immediately. Equity-based employee awards that require future service are recognized over the relevant service period. In addition, certain RSUs granted by the Company vest subject to continued employment and the Company’s receipt of performance fees, within prescribed periods, sufficient to cover the associated equity-based compensation expense. In accordance with U.S. GAAP, equity-based compensation expense for such awards, if and when granted, will be recognized on an accelerated recognition method over the requisite service period to the extent the performance fee metrics are met or deemed probable. The addition of these performance measures helps to promote the interests of our Class A shareholders and fund investors by making RSU vesting contingent on the realization and distribution of profits on our funds. In connection with the adoption of new share-based payment guidance during the quarter ended
-
138
-
March 31, 2017, the Company made an accounting policy election to no longer estimate forfeitures in determining the number of equity-based awards that are expected to vest. Under the Company’s new policy, which was applied prospectively as of January 1, 2017, forfeitures are accounted for when they occur. Apollo’s equity-based awards consist of, or provide rights with respect to, AOG Units, RSUs, share options, restricted shares, AHL Awards and other equity-based compensation awards. For more information regarding Apollo’s equity-based compensation awards, see note
12
to our
consolidated
financial statements. The Company’s assumptions made to determine the fair value on grant date are embodied in the calculations of compensation expense.
A significant part of our compensation expense is derived from amortization of RSUs. The fair value of all RSU grants after March 29, 2011 is based on the grant date fair value, which considers the public share price of the Company. The Company has three types of RSU grants, which we refer to as Plan Grants, Bonus Grants, and Performance Grants. Plan Grants may or may not provide the right to receive distribution equivalents until the RSUs vest and, for grants made after 2011, the underlying shares are generally issued by March 15th after the year in which they vest. For Plan Grants, the grant date fair value is based on the public share price of the Company, and is discounted for transfer restrictions and lack of distributions until vested if applicable. Bonus Grants provide the right to receive distribution equivalents on both vested and unvested RSUs and Performance Grants provide the right to receive distribution equivalents on vested RSUs and may also provide the right to receive distribution equivalents on unvested RSUs. Both Bonus Grants and Performance Grants are generally issued by March 15th of the year following the year in which they vest. For Bonus Grants and Performance Grants, the grant date fair value for the periods presented is based on the public share price of the Company, and is discounted for transfer restrictions.
We utilized the present value of a growing annuity formula to calculate a discount for the lack of pre-vesting distributions on certain Plan Grant and Performance Grant RSUs. The weighted average for the inputs utilized for the shares granted are presented in the table below for Plan Grants and Performance Grants:
|
|
For the Years Ended December 31,
|
||||
|
|
2018
|
2017
|
2016
|
||
|
Plan Grants:
|
|||||
|
Distribution Yield
(1)
|
5.7%
|
6.1%
|
6.6%
|
||
|
Cost of Equity Capital Rate
(3)
|
10.8%
|
11.0%
|
11.3%
|
||
|
Performance Grants:
|
|||||
|
Distribution Yield
(2)
|
6.8%
|
N/A
|
N/A
|
||
|
Cost of Equity Capital Rate
(3)
|
10.8%
|
N/A
|
N/A
|
||
|
(1)
|
Calculated based on the historical distributions paid during the year ended
December 31, 2018
and the Company’s Class A share price as of the measurement date of the grant on a weighted average basis.
|
|
(2)
|
Calculated based on the historical distributions paid during the three months ended
December 31, 2018
and the Company’s Class A share price as of the measurement date of the grant on a weighted average basis.
|
|
(3)
|
Assumes a discount rate that was equivalent to the opportunity cost of foregoing distributions on unvested Plan Grant and Performance Grant RSUs as of the valuation date, based on the Capital Asset Pricing Model (“CAPM”). CAPM is a commonly used mathematical model for developing expected returns.
|
The following table summarizes the weighted average discounts for certain Plan Grants and Performance Grants:
|
For the Years Ended December 31,
|
|||||
|
2018
|
2017
|
2016
|
|||
|
Plan Grants:
|
|||||
|
Discount for the lack of distributions until vested
(1)
|
12.0%
|
11.8%
|
14.0%
|
||
|
Performance Grants:
|
|||||
|
Discount for the lack of distributions until vested
(1)
|
12.8%
|
N/A
|
N/A
|
||
|
(1)
|
Based on the present value of a growing annuity calculation.
|
We utilize the Finnerty Model to calculate a marketability discount on the Plan Grant, Bonus Grant and Performance Grant RSUs to account for the lag between vesting and issuance. The Finnerty Model provides for a valuation discount reflecting the holding period restriction embedded in a restricted security preventing its sale over a certain period of time.
The Finnerty Model proposes to estimate a discount for lack of marketability such as transfer restrictions by using an option pricing theory. This model has gained recognition through its ability to address the magnitude of the discount by considering the volatility of a company’s stock price and the length of restriction. The concept underpinning the Finnerty Model is that a restricted security cannot be sold over a certain period of time. Further simplified, a restricted share of equity in a company can
-
139
-
be viewed as having forfeited a put on the average price of the marketable equity over the restriction period (also known as an “Asian Put Option”). If we price an Asian Put Option and compare this value to that of the assumed fully marketable underlying security, we can effectively estimate the marketability discount.
The inputs utilized in the Finnerty Model are (i) length of holding period, (ii) volatility and (iii) distribution yield. The weighted average for the inputs utilized for the shares granted are presented in the table below for Plan Grants, Bonus Grants and Performance Grants:
|
|
For the Years Ended December 31,
|
||||
|
2018
|
2017
|
2016
|
|||
|
Plan Grants:
|
|||||
|
Holding Period Restriction (in years)
|
0.8
|
0.6
|
0.5
|
||
|
Volatility
(1)
|
24.9%
|
22.1%
|
24.7%
|
||
|
Distribution Yield
(2)
|
5.7%
|
6.1%
|
6.6%
|
||
|
Bonus Grants:
|
|||||
|
Holding Period Restriction (in years)
|
0.2
|
0.2
|
0.2
|
||
|
Volatility
(1)
|
22.5%
|
22.6%
|
20.6%
|
||
|
Distribution Yield
(2)
|
5.3%
|
5.4%
|
6.5%
|
||
|
Performance Grants:
|
|||||
|
Holding Period Restriction (in years)
|
1.2
|
N/A
|
N/A
|
||
|
Volatility
(1)
|
23.9%
|
N/A
|
N/A
|
||
|
Distribution Yield
(2)
|
5.7%
|
N/A
|
N/A
|
||
|
(1)
|
The Company determined the expected volatility based on the volatility of the Company’s Class A share price as of the grant date with consideration to comparable companies.
|
|
(2)
|
Calculated based on the historical distributions paid during the years ended
December 31, 2018, 2017 and 2016
and the Company’s Class A share price as of the measurement date of the grant on a weighted average basis.
|
The following table summarizes the weighted average marketability discounts for Plan Grants, Bonus Grants and Performance Grants:
|
For the Years Ended December 31,
|
|||||
|
2018
|
2017
|
2016
|
|||
|
Plan Grants:
|
|||||
|
Marketability discount for transfer restrictions
(1)
|
4.7%
|
3.6%
|
3.8%
|
||
|
Bonus Grants:
|
|||||
|
Marketability discount for transfer restrictions
(1)
|
2.3%
|
2.3%
|
2.1%
|
||
|
Performance Grants:
|
|||||
|
Marketability discount for transfer restrictions
(1)
|
5.6%
|
N/A
|
N/A
|
||
|
(1)
|
Based on the Finnerty Model calculation.
|
For awards granted prior to the adoption of the new share-based payment guidance, which was applied prospectively as of January 1, 2017, after the grant date fair value was determined, an estimated forfeiture rate was applied. The estimated fair value was determined and recognized over the vesting period on a straight-line basis and a 4.0% forfeiture rate was estimated for RSUs, based on the Company’s historical attrition rate as well as industry comparable rates. If award recipients were no longer associated with Apollo or if there were no turnover, we would revise the estimated compensation expense to the actual amount of expense based on the RSUs vested at the reporting date in accordance with U.S. GAAP.
Bonus Grants constitute a component of the discretionary annual compensation awarded to certain of our professionals. During 2016, the Company increased the default portion of annual compensation to be awarded as a discretionary Bonus Grant relative to the portion awarded in previous years. The increase in the proportion of discretionary annual compensation awarded as a Bonus Grant has generally been offset by a decrease in discretionary annual cash bonuses. These changes are intended to further align the interests of Apollo’s employees and stakeholders and strengthen the long-term commitment of our partners and employees.
-
140
-
Fair Value Measurements
See note
7
to our
consolidated
financial statements for a discussion of the Company’s fair value measurements.
Recent Accounting Pronouncements
A list of recent accounting pronouncements that are relevant to Apollo and its industry is included in note
2
to our
consolidated
financial statements.
Off-Balance Sheet Arrangements
In the normal course of business, we engage in off-balance sheet arrangements, including transactions in derivatives, guarantees, commitments, indemnifications and potential contingent repayment obligations. See note
15
to our
consolidated
financial statements for a discussion of guarantees and contingent obligations.
Contractual Obligations, Commitments and Contingencies
The Company’s material contractual obligations consisted of lease obligations, contractual commitments as part of the ongoing operations of the funds and debt obligations. Fixed and determinable payments due in connection with these obligations are as follows as of
December 31, 2018
:
|
2019
|
2020
|
2021
|
2022
|
2023
|
Thereafter
|
Total
|
|||||||||||||||||||||
|
|
(in thousands)
|
||||||||||||||||||||||||||
|
Operating lease obligations
|
$
|
39,970
|
|
$
|
25,923
|
|
$
|
33,022
|
|
$
|
36,243
|
|
$
|
35,231
|
|
$
|
400,889
|
|
$
|
571,278
|
|
||||||
|
Other long-term obligations
(1)
|
21,677
|
|
1,761
|
|
1,511
|
|
927
|
|
688
|
|
688
|
|
27,252
|
|
|||||||||||||
|
2018 AMH Credit Facility
(2)
|
675
|
|
675
|
|
675
|
|
675
|
|
358
|
|
—
|
|
3,058
|
|
|||||||||||||
|
2024 Senior Notes
(3)
|
20,000
|
|
20,000
|
|
20,000
|
|
20,000
|
|
20,000
|
|
508,333
|
|
608,333
|
|
|||||||||||||
|
2026 Senior Notes
(4)
|
22,000
|
|
22,000
|
|
22,000
|
|
22,000
|
|
22,000
|
|
552,983
|
|
662,983
|
|
|||||||||||||
|
2048 Senior Notes
(5)
|
15,000
|
|
15,000
|
|
15,000
|
|
15,000
|
|
15,000
|
|
663,750
|
|
738,750
|
|
|||||||||||||
|
2014 AMI Term Facility I
|
313
|
|
313
|
|
15,885
|
|
—
|
|
—
|
|
—
|
|
16,511
|
|
|||||||||||||
|
2014 AMI Term Facility II
|
309
|
|
309
|
|
309
|
|
17,737
|
|
—
|
|
—
|
|
18,664
|
|
|||||||||||||
|
2016 AMI Term Facility I
|
252
|
|
252
|
|
252
|
|
252
|
|
252
|
|
19,633
|
|
20,893
|
|
|||||||||||||
|
2016 AMI Term Facility II
|
262
|
|
262
|
|
262
|
|
262
|
|
18,845
|
|
—
|
|
19,893
|
|
|||||||||||||
|
Obligations
|
$
|
120,458
|
|
$
|
86,495
|
|
$
|
108,916
|
|
$
|
113,096
|
|
$
|
112,374
|
|
$
|
2,146,276
|
|
$
|
2,687,615
|
|
||||||
|
(1)
|
Includes (i) payments on management service agreements related to certain assets and (ii) payments with respect to certain consulting agreements entered into by the Company. Note that a significant portion of these costs are reimbursable by funds.
|
|
(2)
|
The commitment fee as of
December 31, 2018
on the $750 million undrawn 2018 AMH Credit Facility was
0.09%
. See note
10
of the
consolidated
financial statements for further discussion of the 2018 AMH Credit Facility.
|
|
(3)
|
$500 million
of the 2024 Senior Notes matures in May 2024. The interest rate on the 2024 Senior Notes as of
December 31, 2018
was
4.00%
. See note
10
of the
consolidated
financial statements for further discussion of the 2024 Senior Notes.
|
|
(4)
|
$500 million
of the 2026 Senior Notes matures in May 2026. The interest rate on the 2026 Senior Notes as of
December 31, 2018
was
4.40%
. See note
10
of the
consolidated
financial statements for further discussion of the 2026 Senior Notes.
|
|
(5)
|
$300 million
of the 2048 Senior Notes matures in March 2048. The interest rate on the 2048 Senior Notes as of
December 31, 2018
was
5.00%
. See note
10
of the
consolidated
financial statements for further discussion of the 2048 Senior Notes.
|
|
Note:
|
Due to the fact that the timing of certain amounts to be paid cannot be determined or for other reasons discussed below, the following contractual commitments have not been presented in the table above.
|
|
(i)
|
As noted previously, we have entered into a tax receivable agreement with our Managing Partners and Contributing Partners which requires us to pay to our Managing Partners and Contributing Partners 85% of any tax savings received by APO Corp. from our step-up in tax basis. The tax savings achieved may not ensure that we have sufficient cash available to pay this liability and we might be required to incur additional debt to satisfy this liability.
|
|
(ii)
|
Debt amounts related to the consolidated VIEs are not presented in the table above as the Company is not a guarantor of these non-recourse liabilities.
|
|
(iii)
|
In connection with the Stone Tower acquisition, the Company agreed to pay the former owners of Stone Tower a specified percentage of any future performance fees earned from certain of the Stone Tower funds, CLOs and strategic investment accounts. This contingent consideration liability is remeasured to fair value at each reporting period until the obligations are satisfied. See note
15
to the
consolidated
financial statements for further information regarding the contingent consideration liability.
|
|
(iv)
|
Commitments from certain of our subsidiaries to contribute to the funds we manage and certain related parties.
|
-
141
-
Commitments
Certain of our management companies and general partners are committed to contribute to the funds we manage and certain related parties. While a small percentage of these amounts are funded by us, the majority of these amounts have historically been funded by our related parties, including certain of our employees and certain Apollo funds. The table below presents the commitment and remaining commitment amounts of Apollo and its related parties, the percentage of total fund commitments of Apollo and its related parties, the commitment and remaining commitment amounts of Apollo only (excluding related parties), and the percentage of total fund commitments of Apollo only (excluding related parties) for each credit, private equity and real assets fund as of
December 31, 2018
as follows ($ in millions):
-
142
-
|
Fund
|
Apollo and Related Party Commitments
|
% of Total Fund Commitments
|
Apollo Only (Excluding Related Party) Commitments
|
Apollo Only (Excluding Related Party) % of Total Fund Commitments
|
Apollo and Related Party Remaining Commitments
|
Apollo Only (Excluding Related Party) Remaining Commitments
|
|||||||||||||||
|
Credit:
|
|||||||||||||||||||||
|
COF III
|
$
|
358.1
|
|
10.45
|
%
|
$
|
83.1
|
|
2.43
|
%
|
$
|
82.0
|
|
$
|
20.1
|
|
|||||
|
Apollo Credit Opportunity Fund II, L.P. (“COF II”)
|
30.5
|
|
1.93
|
|
23.4
|
|
1.48
|
|
0.8
|
|
0.6
|
|
|||||||||
|
Apollo Credit Opportunity Fund I, L.P. (“COF I”)
|
449.2
|
|
30.26
|
|
29.7
|
|
2.00
|
|
237.1
|
|
4.2
|
|
|||||||||
|
Apollo European Principal Finance Fund III, L.P. (“EPF III”)
(1)
|
609.4
|
|
13.41
|
|
93.2
|
|
2.05
|
|
407.8
|
|
64.2
|
|
|||||||||
|
EPF II
(1)
|
411.4
|
|
11.88
|
|
60.2
|
|
1.74
|
|
99.2
|
|
18.9
|
|
|||||||||
|
Apollo European Principal Finance Fund, L.P. (“EPF I”)
(1)
|
308.1
|
|
20.74
|
|
20.3
|
|
1.37
|
|
50.1
|
|
4.7
|
|
|||||||||
|
Financial Credit Investment III, L.P. (“FCI III”)
|
224.3
|
|
11.76
|
|
0.1
|
|
0.01
|
|
142.8
|
|
0.1
|
|
|||||||||
|
Financial Credit Investment II, L.P. (“FCI II”)
|
244.6
|
|
15.72
|
|
—
|
|
—
|
|
115.9
|
|
—
|
|
|||||||||
|
Financial Credit Investment I, L.P. (“FCI I”)
|
151.3
|
|
27.07
|
|
—
|
|
—
|
|
76.8
|
|
—
|
|
|||||||||
|
Apollo Structured Credit Recovery Master Fund IV, L.P. (“SCRF IV”)
|
416.1
|
|
16.63
|
|
33.1
|
|
1.32
|
|
180.5
|
|
14.4
|
|
|||||||||
|
MidCap
|
1,672.6
|
|
80.23
|
|
110.9
|
|
5.32
|
|
169.0
|
|
31.0
|
|
|||||||||
|
Apollo Moultrie Credit Fund, L.P.
|
400.0
|
|
100.00
|
|
—
|
|
—
|
|
220.0
|
|
—
|
|
|||||||||
|
Apollo/Palmetto Short-Maturity Loan Portfolio, L.P.
|
300.0
|
|
100.00
|
|
—
|
|
—
|
|
—
|
|
—
|
|
|||||||||
|
Apollo Asia Private Credit Fund, L.P. (“APC”)
|
126.5
|
|
55.12
|
|
0.1
|
|
0.04
|
|
32.0
|
|
—
|
|
|||||||||
|
AEOF
|
125.5
|
|
12.01
|
|
25.5
|
|
2.44
|
|
92.7
|
|
18.8
|
|
|||||||||
|
Apollo Accord Master Fund II, L.P.
|
274.7
|
|
35.17
|
|
11.6
|
|
1.49
|
|
233.5
|
|
9.9
|
|
|||||||||
|
Athora
(1)
|
679.4
|
|
27.37
|
|
143.3
|
|
5.77
|
|
530.5
|
|
119.7
|
|
|||||||||
|
Other Credit
|
2,679.1
|
|
Various
|
|
259.9
|
|
Various
|
|
974.4
|
|
129.4
|
|
|||||||||
|
Private Equity:
|
|||||||||||||||||||||
|
Fund IX
|
1,849.5
|
|
7.48
|
|
468.7
|
|
1.90
|
|
1,849.5
|
|
468.7
|
|
|||||||||
|
Fund VIII
|
1,543.5
|
|
8.40
|
|
396.4
|
|
2.16
|
|
292.6
|
|
76.3
|
|
|||||||||
|
Fund VII
|
467.2
|
|
3.18
|
|
178.1
|
|
1.21
|
|
66.3
|
|
24.9
|
|
|||||||||
|
Fund VI
|
246.3
|
|
2.43
|
|
6.1
|
|
0.06
|
|
9.7
|
|
0.2
|
|
|||||||||
|
Fund V
|
100.0
|
|
2.67
|
|
0.5
|
|
0.01
|
|
6.2
|
|
—
|
|
|||||||||
|
Fund IV
|
100.0
|
|
2.78
|
|
0.2
|
|
0.01
|
|
0.5
|
|
—
|
|
|||||||||
|
AION
|
151.5
|
|
18.34
|
|
50.0
|
|
6.05
|
|
30.3
|
|
9.8
|
|
|||||||||
|
ANRP I
|
426.1
|
|
32.21
|
|
10.1
|
|
0.76
|
|
68.0
|
|
1.3
|
|
|||||||||
|
ANRP II
|
561.2
|
|
16.25
|
|
25.9
|
|
0.75
|
|
256.3
|
|
11.6
|
|
|||||||||
|
ANRP III
|
640.7
|
|
64.11
|
|
20.7
|
|
2.07
|
|
640.7
|
|
20.7
|
|
|||||||||
|
A.A. Mortgage Opportunities, L.P.
|
625.0
|
|
80.31
|
|
—
|
|
—
|
|
200.0
|
|
—
|
|
|||||||||
|
Apollo Rose, L.P.
|
299.1
|
|
100.00
|
|
—
|
|
—
|
|
—
|
|
—
|
|
|||||||||
|
Apollo Rose II, L.P.
|
887.1
|
|
51.07
|
|
33.0
|
|
1.9
|
|
439.7
|
|
16.6
|
|
|||||||||
|
Champ, L.P.
|
193.2
|
|
78.25
|
|
26.7
|
|
10.8
|
|
7.2
|
|
1.1
|
|
|||||||||
|
Apollo Royalties Management, LLC
|
108.6
|
|
100.00
|
|
—
|
|
—
|
|
—
|
|
—
|
|
|||||||||
|
Apollo Hybrid Value Fund, L.P.
|
821.9
|
|
29.13
|
|
76.9
|
|
2.73
|
|
787.4
|
|
73.6
|
|
|||||||||
|
Other Private Equity
|
369.6
|
|
Various
|
|
6.3
|
|
Various
|
|
126.4
|
|
1.9
|
|
|||||||||
|
Real Assets:
|
|||||||||||||||||||||
|
U.S. RE Fund II
(2)
|
693.8
|
|
56.26
|
|
4.7
|
|
0.39
|
|
435.0
|
|
3.0
|
|
|||||||||
|
U.S. RE Fund I
(2)
|
434.4
|
|
66.76
|
|
16.5
|
|
2.53
|
|
120.2
|
|
2.7
|
|
|||||||||
|
CPI Capital Partners Europe, L.P.
(1)
|
6.3
|
|
0.47
|
|
—
|
|
—
|
|
—
|
|
—
|
|
|||||||||
|
CPI Capital Partners Asia Pacific, L.P.
|
6.9
|
|
0.53
|
|
0.5
|
|
0.04
|
|
0.1
|
|
—
|
|
|||||||||
|
Asia RE Fund
(2)
|
376.9
|
|
53.12
|
|
8.4
|
|
1.18
|
|
250.8
|
|
5.9
|
|
|||||||||
|
Apollo Infrastructure Equity Fund
(3)
|
246.1
|
|
27.43
|
|
13.1
|
|
1.46
|
|
59.7
|
|
2.7
|
|
|||||||||
|
Other Real Assets
|
365.3
|
|
Various
|
|
1.7
|
|
Various
|
|
63.3
|
|
0.1
|
|
|||||||||
|
Other:
|
|||||||||||||||||||||
|
Apollo SPN Investments I, L.P.
|
12.5
|
|
0.27
|
|
12.5
|
|
0.27
|
|
7.2
|
|
7.2
|
|
|||||||||
|
Total
|
$
|
20,993.5
|
|
$
|
2,251.4
|
|
$
|
9,362.2
|
|
$
|
1,164.3
|
|
|||||||||
|
(1)
|
Apollo’s commitment in these funds is denominated in Euros and translated into U.S. dollars at an exchange rate of €1.00 to
$1.15
as of
December 31, 2018
.
|
-
143
-
|
(2)
|
Figures for U.S. RE Fund I include base, additional, and co-investment commitments. A co-investment vehicle within U.S. RE Fund I is denominated in pound sterling and translated into U.S. dollars at an exchange rate of £1.00 to
$1.28
as of
December 31, 2018
. Figures for U.S. RE Fund II and Asia RE Fund include co-investment commitments.
|
|
(3)
|
Figures for Apollo Infrastructure Equity Fund include Apollo Infra Equity US Fund, L.P. and Apollo Infra Equity International Fund, L.P. commitments.
|
On April 30, 2015, Apollo entered into the AAA Investments Credit Agreement (see note
14
of our
consolidated
financial statements for further disclosure regarding this facility). The 2018 AMH Credit Facility, 2024 Senior Notes, 2026 Senior Notes, 2048 Senior Notes, and 2029 Senior Notes will have future impacts on our cash uses. See note
10
of our
consolidated
financial statements for information regarding the Company’s debt arrangements. Additionally, see note
17
to the consolidated financial statements for information regarding the 2029 Senior Notes.
Contingent Obligation—
Performance fees with respect to certain credit and private equity funds and real assets funds is subject to reversal in the event of future losses to the extent of the cumulative performance fees recognized in income to date. See note
15
of our
consolidated
financial statements for a description of our contingent obligation.
One of the Company’s subsidiaries, AGS, provides underwriting commitments in connection with securities offerings to the portfolio companies of the funds Apollo manages. As of
December 31, 2018
, there were no underwriting commitments outstanding related to such offerings.
As of
December 31, 2018
, one of the Company’s subsidiaries had unfunded contingent commitments of
$32.0 million
, to facilitate fundings at closing by lead arrangers for syndicated term loans issued by portfolio companies of funds managed by Apollo. The commitments expire by
March 31, 2019
. As of
March 1, 2019
, the unfunded commitments were approximately
$5.3 million
.
|
ITEM
7A
.
|
QUANTITATIVE AND QUALITATIVE DISCLOSURES ABOUT MARKET RISK
|
Our predominant exposure to market risk is related to our role as investment manager and general partner for our funds and the sensitivity to movements in the fair value of their investments and resulting impact on performance fees and management fee revenues. Our direct investments in the funds also expose us to market risk whereby movements in the fair values of the underlying investments will increase or decrease both net gains (losses) from investment activities and income (loss) from equity method investments. For a discussion of the impact of market risk factors on our financial instruments see “Item
7
. Management’s Discussion and Analysis of Financial Condition and Results of Operations—Critical Accounting Policies—Investments, at Fair Value.”
The fair value of our financial assets and liabilities of our funds may fluctuate in response to changes in the value of investments, foreign exchange, commodities and interest rates. The net effect of these fair value changes impacts the gains and losses from investments in our
consolidated
statements of operations. However, the majority of these fair value changes are absorbed by the Non-Controlling Interests.
The Company is subject to a concentration risk related to the investors in its funds. Although there are more than
1,000
investors in Apollo’s active credit, private equity and real assets funds, no individual investor accounts for more than
10%
of the total committed capital to Apollo’s active funds.
Risks are analyzed across funds from the “bottom up” and from the “top down” with a particular focus on asymmetric risk. We gather and analyze data, monitor investments and markets in detail, and constantly strive to better quantify, qualify and circumscribe relevant risks.
Each risk management process is subject to our overall risk tolerance and philosophy and our enterprise-wide risk management framework. This framework includes identifying, measuring and managing market, credit and operational risks at each segment, as well as at the fund and Company level.
Each segment runs its own investment and risk management process subject to our overall risk tolerance and philosophy:
|
•
|
Our credit funds continuously monitor a variety of markets for attractive trading opportunities, applying a number of traditional and customized risk management metrics to analyze risk related to specific assets or portfolios, as well as, fund-wide risks.
|
|
•
|
The investment process of our private equity funds involves a detailed analysis of potential acquisitions, and investment management teams assigned to monitor the strategic development, financing and capital deployment decisions of each portfolio investment.
|
-
144
-
At the direction of the Company’s manager, the Company has established a risk committee comprised of various members of senior management including the Company’s Chief Financial Officer, Chief Legal Officer, and the Company’s Chief Risk Officer. The risk committee is tasked with assisting the Company’s manager in monitoring and managing enterprise-wide risk. The risk committee generally meets on a quarterly basis and reports to senior management of the Company’s manager at such times as the committee deems appropriate and at least on an annual basis.
On at least a monthly basis, the Company’s risk department provides a summary analysis of fund level market and credit risk to the portfolio managers of the Company’s funds and the heads of the various business segments. On a periodic basis, the Company’s risk department presents a consolidated summary analysis of fund level market and credit risk to the Company’s risk committee. In addition, the Company’s Chief Risk Officer reviews specific investments from the perspective of risk mitigation and discusses such analysis with the Company’s risk committee and/or the executive committee of the Company’s manager at such times as the Company’s Chief Risk Officer determines such discussions are warranted. On an annual basis, the Company’s Chief Risk Officer provides senior management of the Company’s manager with a comprehensive overview of risk management along with an update on current and future risk initiatives.
Impact on
Management Fees
—Our management fees are based on one of the following:
|
•
|
capital commitments to an Apollo fund;
|
|
•
|
capital invested in an Apollo fund;
|
|
•
|
the gross, net or adjusted asset value of an Apollo fund, as defined; or
|
|
•
|
as otherwise defined in the respective agreements.
|
Management fees could be impacted by changes in market risk factors and management could consider an investment permanently impaired as a result of (i) such market risk factors causing changes in invested capital or in market values to below cost, in the case of certain credit funds and our private equity funds or (ii) such market risk factors causing changes in gross or net asset value, for the credit funds. The proportion of our management fees that are based on NAV is dependent on the number and types of our funds in existence and the current stage of each fund’s life cycle.
Impact on Advisory and Transaction Fees
—We earn transaction fees relating to the negotiation of credit, private equity and real assets transactions and may obtain reimbursement for certain out-of-pocket expenses incurred. Subsequently, on a quarterly or annual basis, ongoing advisory fees, and additional transaction fees in connection with additional purchases, dispositions, or follow-on transactions, may be earned. Management Fee Offsets and any broken deal costs, if applicable, are reflected as a reduction to advisory and transaction fees. Advisory and transaction fees will be impacted by changes in market risk factors to the extent that they limit our opportunities to engage in credit, private equity and real assets transactions or impair our ability to consummate such transactions. The impact of changes in market risk factors on advisory and transaction fees is not readily predicted or estimated.
Impact on Performance Fees
—We earn performance fees from our funds as a result of such funds achieving specified performance criteria. Our performance fees will be impacted by changes in market risk factors. However, several major factors will influence the degree of impact:
|
•
|
the performance criteria for each individual fund in relation to how that fund’s results of operations are impacted by changes in market risk factors;
|
|
•
|
whether such performance criteria are annual or over the life of the fund;
|
|
•
|
to the extent applicable, the previous performance of each fund in relation to its performance criteria; and
|
|
•
|
whether each funds’ performance fee distributions are subject to contingent repayment.
|
As a result, the impact of changes in market risk factors on performance fees will vary widely from fund to fund. The impact is heavily dependent on the prior and future performance of each fund, and therefore is not readily predicted or estimated.
Market Risk
—We are directly and indirectly affected by changes in market conditions. Market risk generally represents the risk that values of assets and liabilities or revenues and expenses will be adversely affected by changes in market conditions. Market risk is inherent in each of our investments and activities, including equity investments, loans, short-term borrowings, long-term debt, hedging instruments, credit default swaps and derivatives. Just a few of the market conditions that may shift from time to time, thereby exposing us to market risk, include fluctuations in interest and currency exchange rates, equity prices, changes in the implied volatility of interest rates and price deterioration. Volatility in debt and equity markets can impact our pace of capital deployment, the timing of receipt of transaction fee revenues and the timing of realizations. These market conditions could have
-
145
-
an impact on the value of fund investments and rates of return. Accordingly, depending on the instruments or activities impacted, market risks can have wide ranging, complex adverse effects on our results from operations and our overall financial condition. We monitor market risk using certain strategies and methodologies which management evaluates periodically for appropriateness. We intend to continue to monitor this risk going forward and continue to monitor our exposure to all market factors.
Interest Rate Risk—
Interest rate risk represents exposure we and our funds have to instruments whose values vary with the change in interest rates. These instruments include, but are not limited to, loans, borrowings, investments in interest bearing securities and derivative instruments. We may seek to mitigate risks associated with the exposures by having our funds take offsetting positions in derivative contracts. Hedging instruments allow us to seek to mitigate risks by reducing the effect of movements in the level of interest rates, changes in the shape of the yield curve, as well as, changes in interest rate volatility. Hedging instruments used to mitigate these risks may include related derivatives such as options, futures and swaps.
Credit Risk—
Certain of our funds are subject to certain inherent risks through their investments.
Certain of our entities invest substantially all of their excess cash in open-end money market funds and money market demand accounts, which are included in cash and cash equivalents. The money market funds invest primarily in government securities and other short-term, highly liquid instruments with a low risk of loss. We continually monitor the funds’ performance in order to manage any risk associated with these investments.
Certain of our funds hold derivative instruments that contain an element of risk in the event that the counterparties may be unable to meet the terms of such agreements. We seek to minimize our risk exposure by limiting the counterparties with which our funds enter into contracts to banks and investment banks who meet established credit and capital guidelines. As of
December 31, 2018
, we do not expect any counterparty to default on its obligations and therefore do not expect to incur any loss due to counterparty default.
Foreign Exchange Risk—
Foreign exchange risk represents exposures our funds have to changes in the values of current fund holdings and future cash flows denominated in other currencies and investments in non-U.S. companies. The types of investments exposed to this risk include investments in foreign subsidiaries, foreign currency-denominated loans, foreign currency-denominated transactions, and various foreign exchange derivative instruments whose values fluctuate with changes in currency exchange rates or foreign interest rates. Instruments used to mitigate this risk are foreign exchange options, currency swaps, futures and forwards. These instruments may be used to help insulate our funds against losses that may arise due to volatile movements in foreign exchange rates and/or interest rates.
In our capacity as investment manager of the funds we manage, we continuously monitor a variety of markets for attractive opportunities for managing risk. For example, certain of the funds we manage may put in place foreign exchange hedges or borrowings with respect to certain foreign currency denominated investments to provide a hedge against foreign exchange exposure.
Non-U.S. Operations—
We conduct business throughout the world and are continuing to expand into foreign markets. We currently have offices outside the U.S. in Toronto, London, Frankfurt, Madrid, Luxembourg, Mumbai, Delhi, Singapore, Hong Kong, Shanghai and Tokyo and have been strategically growing our international presence. Our fund investments and our revenues are primarily derived from our U.S. operations. With respect to our non-U.S. operations, we are subject to risk of loss from currency fluctuations, social instability, changes in governmental policies or policies of central banks, expropriation, nationalization, unfavorable political and diplomatic developments and changes in legislation relating to non-U.S. ownership. Our funds also invest in the securities of companies which are located in non-U.S. jurisdictions. As we continue to expand globally, we will continue to focus on monitoring and managing these risk factors as they relate to specific non-U.S. investments.
Sensitivity
Interest Rate Risk—
Apollo has debt obligations that accrue interest at variable rates. Interest rate changes may therefore affect the amount of our interest payments, future earnings and cash flows. Based on our debt obligations payable as of December 31,
2018
and
2017
, we estimate that interest expense would increase on an annual basis, in the event interest rates were to increase by one percentage point, by approximately
$0.7 million
and
$3.7 million
, respectively.
In addition to our debt obligations, we are also subject to interest rate risk through the investments of our funds. For funds that pay management fees based on NAV or other bases that are sensitive to market value fluctuations, we anticipate our management fees would change consistent with the increase or decrease experienced by the underlying funds’ portfolios. In the event that interest rates were to increase by one percentage point, we estimate that management fees earned on a segment basis that were dependent upon estimated fair value would decrease by approximately
$26.6 million
and
$18.4 million
during the years ended December 31,
2018
and
2017
, respectively.
-
146
-
Credit Risk—
Similar to interest rate risk, we are also subject to credit risk through the investments of our funds. In the event that credit spreads were to increase by one percentage point, we estimate that management fees earned on a segment basis that were dependent upon estimated fair value would decrease by approximately
$37.5 million
and
$26.6 million
during the years ended December 31,
2018
and
2017
, respectively.
Foreign Exchange Risk—
We estimate for the years ended December 31,
2018
and
2017
, a 10% decline in the rate of exchange of all foreign currencies against the U.S. dollar would result in the following declines in management fees, performance fees and principal investment income:
|
For the Years Ended December 31,
|
||||||||
|
2018
|
2017
|
|||||||
|
(in thousands)
|
||||||||
|
Management fees
|
$
|
8,406
|
|
$
|
7,600
|
|
||
|
Performance fees
|
—
|
|
(1
|
)
|
3,021
|
|
||
|
Principal investment income
|
—
|
|
(1
|
)
|
109
|
|
||
|
(1)
|
We estimate a 10% decline in the rate of exchange of all foreign currencies against the U.S. dollar would result in increases in performance fees and principal investment income as a result of losses incurred during the year ended December 31, 2018.
|
Net Gains from Investment Activities and Principal Investment Income—
Our assets and unrealized gains, and our related equity and net income are sensitive to changes in the valuations of our funds’ underlying investments and could vary materially as a result of changes in our valuation assumptions and estimates. See “Item 7. Management’s Discussion and Analysis of Financial Conditions and Results of Operations—Critical Accounting Policies—Investments, at Fair Value” for details related to the valuation methods that are used and the key assumptions and estimates employed by such methods. We also quantify the Level III investments that are included on our consolidated statements of financial condition by valuation methodology in note
7
to the consolidated financial statements. We employ a variety of valuation methods. Furthermore, the investments that we manage but are not on our consolidated statements of financial condition, and therefore impact performance fees, also employ a variety of valuation methods of which no single methodology is used more than any other.
Management Fees—
Management fees from the funds in our credit segment are based on the net asset value of the relevant fund, gross assets, capital commitments or invested capital, each as defined in the respective management agreements. Changes in the fair values of the investments in credit funds that earn management fees based on net asset value or gross assets will have a direct impact on the amount of management fees that are earned. Management fees earned from our credit segment on a segment basis that were dependent upon estimated fair value during the years ended December 31,
2018
and
2017
would decrease by approximately
$62.6 million
and
$50.0 million
, respectively, if the fair values of the investments held by such funds were 10% lower during the same respective periods.
Management fees for our private equity, real assets and certain credit funds are generally charged on either (a) a fixed percentage of committed capital over a stated investment period or (b) a fixed percentage of invested capital of unrealized portfolio investments. Changes in values of investments could indirectly affect future management fees from private equity funds by, among other things, reducing the funds’ access to capital or liquidity and their ability to currently pay the management fees or if such change resulted in a write-down of investments below their associated invested capital.
Performance Fees—
Performance fees from most of our credit, private equity and real assets funds generally is earned based on achieving specified performance criteria and is impacted directly by changes in the fair value of the funds’ investments. We anticipate that a 10% decline in the fair values of investments held by all of the credit, private equity and real assets funds at December 31,
2018
and
2017
would decrease performance fees on a segment basis as presented in the table below:
|
For the Years Ended December 31,
|
|||||||
|
2018
|
2017
|
||||||
|
(in thousands)
|
|||||||
|
10% Decline in Fair Value of Investments Held
|
|||||||
|
Credit
|
$
|
165,184
|
|
$
|
186,692
|
|
|
|
Private Equity
|
776,461
|
|
505,297
|
|
|||
|
Real Assets
|
26,162
|
|
14,271
|
|
|||
Net Gains From Investment Activities—
Net gains from investment activities related to the Company's investment in Athene Holding would decrease by approximately
$76.1 million
and
$80.2 million
for the years ended December 31,
2018
and
-
147
-
2017
, respectively, if the fair value of the Company's investment in Athene Holding decreased by 10% during the same respective periods.
Principal Investment Income—
For select Apollo funds, our share of income from equity method investments as a general partner in such funds is derived from unrealized gains or losses on investments in funds included in the consolidated financial statements. For funds in which we have an interest, but are not consolidated, our share of investment income is limited to our direct investments in the funds.
We anticipate that a 10% decline in the fair value of investments at December 31,
2018
and
2017
would result in an approximate
$105.6 million
and
$93.6 million
decrease in principal investment income in our consolidated financial statements, respectively.
-
148
-
|
ITEM
8
.
|
FINANCIAL STATEMENTS AND SUPPLEMENTARY DATA
|
|
Index to Consolidated Financial Statements
|
|
|
|
Page
|
|
Audited Consolidated Financial Statements
|
|
-
149
-
REPORT OF INDEPENDENT REGISTERED PUBLIC ACCOUNTING FIRM
To the Shareholders and the Board of Directors of
Apollo Global Management, LLC
New York, New York
Opinions on the Financial Statements and Internal Control over Financial Reporting
We have audited the accompanying consolidated balance sheets of Apollo Global Management, LLC and subsidiaries (the “Company”) as of December 31, 2018 and 2017, the related consolidated statements of operations, comprehensive income (loss), shareholders’ equity, and cash flows, for each of the three years in the period ended December 31, 2018, and the related notes (collectively referred to as the “financial statements”). We also have audited the Company’s internal control over financial reporting as of December 31, 2018, based on criteria established in
Internal Control-Integrated Framework (2013)
issued by the Committee of Sponsoring Organizations of the Treadway Commission (COSO).
In our opinion, the financial statements referred to above present fairly, in all material respects, the financial position of the Company as of December 31, 2018 and 2017, and the results of its operations and its cash flows for each of the three years in the period ended December 31, 2018, in conformity with accounting principles generally accepted in the United States of America. Also, in our opinion, the Company maintained, in all material respects, effective internal control over financial reporting as of December 31, 2018, based on criteria established in
Internal Control-Integrated Framework (2013)
issued by COSO.
Basis for Opinions
The Company’s management is responsible for these financial statements, for maintaining effective internal control over financial reporting, and for its assessment of the effectiveness of internal control over financial reporting, included in the accompanying Management’s Report on Internal Control over Financial Reporting. Our responsibility is to express an opinion on these financial statements and an opinion on the Company’s internal control over financial reporting based on our audits. We are a public accounting firm registered with the Public Company Accounting Oversight Board (United States) (PCAOB) and are required to be independent with respect to the Company in accordance with the U.S. federal securities laws and the applicable rules and regulations of the Securities and Exchange Commission and the PCAOB.
We conducted our audits in accordance with the standards of the PCAOB. Those standards require that we plan and perform the audits to obtain reasonable assurance about whether the financial statements are free of material misstatement, whether due to error or fraud, and whether effective internal control over financial reporting was maintained in all material respects.
Our audits of the financial statements included performing procedures to assess the risks of material misstatement of the financial statements, whether due to error or fraud, and performing procedures to respond to those risks. Such procedures included examining, on a test basis, evidence regarding the amounts and disclosures in the financial statements. Our audit also included evaluating the accounting principles used and significant estimates made by management, as well as evaluating the overall presentation of the financial statements. Our audit of internal control over financial reporting included obtaining an understanding of internal control over financial reporting, assessing the risk that a material weakness exists, and testing and evaluating the design and operating effectiveness of internal control based on the assessed risk. Our audits also included performing such other procedures as we considered necessary in the circumstances. We believe that our audits provide a reasonable basis for our opinions.
Definition and Limitations of Internal Control over Financial Reporting
A company’s internal control over financial reporting is a process designed to provide reasonable assurance regarding the reliability of financial reporting and the preparation of financial statements for external purposes in accordance with generally accepted accounting principles. A company’s internal control over financial reporting includes those policies and procedures that (1) pertain to the maintenance of records that, in reasonable detail, accurately and fairly reflect the transactions and dispositions of the assets of the company; (2) provide reasonable assurance that transactions are recorded as necessary to permit preparation of financial statements in accordance with generally accepted accounting principles, and that receipts and expenditures of the company are being made only in accordance with authorizations of management and directors of the company; and (3) provide reasonable assurance regarding prevention or timely detection of unauthorized acquisition, use, or disposition of the company’s assets that could have a material effect on the financial statements.
Because of its inherent limitations, internal control over financial reporting may not prevent or detect misstatements. Also, projections of any evaluation of effectiveness to future periods are subject to the risk that controls may become inadequate
-
150
-
because of changes in conditions, or that the degree of compliance with the policies or procedures may deteriorate.
/s/ Deloitte & Touche LLP
New York, New York
March 1, 2019
We have served as the Company's auditor since 2007.
-
151
-
APOLLO GLOBAL MANAGEMENT, LLC
CONSOLIDATED
STATEMENTS OF FINANCIAL CONDITION
AS OF
DECEMBER 31, 2018
AND
DECEMBER 31, 2017
(dollars in thousands, except share data)
|
As of
December 31, 2018 |
As of
December 31, 2017 |
||||||
|
Assets:
|
|||||||
|
Cash and cash equivalents
|
$
|
609,747
|
|
$
|
751,273
|
|
|
|
Restricted cash
|
3,457
|
|
3,875
|
|
|||
|
U.S. Treasury securities, at fair value
|
392,932
|
|
364,649
|
|
|||
|
Investments
(includes performance allocations of $912,182 and $1,828,930 as of December 31, 2018 and December 31, 2017, respectively)
|
2,722,612
|
|
3,559,834
|
|
|||
|
Assets of consolidated variable interest entities:
|
|||||||
|
Cash and cash equivalents
|
49,671
|
|
92,912
|
|
|||
|
Investments, at fair value
|
1,175,677
|
|
1,196,190
|
|
|||
|
Other assets
|
65,543
|
|
39,484
|
|
|||
|
Incentive fees receivable
|
6,792
|
|
43,176
|
|
|||
|
Due from related parties
|
378,108
|
|
262,588
|
|
|||
|
Deferred tax assets, net
|
306,094
|
|
337,638
|
|
|||
|
Other assets
|
173,270
|
|
231,757
|
|
|||
|
Goodwill
|
88,852
|
|
88,852
|
|
|||
|
Intangible assets, net
|
18,899
|
|
18,842
|
|
|||
|
Total Assets
|
$
|
5,991,654
|
|
$
|
6,991,070
|
|
|
|
Liabilities and Shareholders’ Equity
|
|||||||
|
Liabilities:
|
|||||||
|
Accounts payable and accrued expenses
|
$
|
70,878
|
|
$
|
68,873
|
|
|
|
Accrued compensation and benefits
|
73,583
|
|
62,474
|
|
|||
|
Deferred revenue
|
111,097
|
|
128,146
|
|
|||
|
Due to related parties
|
425,435
|
|
428,013
|
|
|||
|
Profit sharing payable
|
452,141
|
|
752,276
|
|
|||
|
Debt
|
1,360,448
|
|
1,362,402
|
|
|||
|
Liabilities of consolidated variable interest entities:
|
|||||||
|
Debt, at fair value
|
855,461
|
|
1,002,063
|
|
|||
|
Other liabilities
|
78,977
|
|
115,658
|
|
|||
|
Other liabilities
|
111,794
|
|
173,369
|
|
|||
|
Total Liabilities
|
3,539,814
|
|
4,093,274
|
|
|||
|
Commitments and Contingencies (see note 15)
|
|
|
|
|
|||
|
Shareholders’ Equity:
|
|||||||
|
Apollo Global Management, LLC shareholders’ equity:
|
|||||||
|
Series A Preferred shares, 11,000,000 shares issued and outstanding as of December 31, 2018 and December 31, 2017
|
264,398
|
|
264,398
|
|
|||
|
Series B Preferred shares, 12,000,000 and 0 shares issued and outstanding as of December 31, 2018 and December 31, 2017, respectively
|
289,815
|
|
—
|
|
|||
|
Class A shares, no par value, unlimited shares authorized, 201,400,500 and 195,267,669 shares issued and outstanding as of December 31, 2018 and December 31, 2017, respectively
|
—
|
|
—
|
|
|||
|
Class B shares, no par value, unlimited shares authorized, 1 share issued and outstanding as of December 31, 2018 and December 31, 2017
|
—
|
|
—
|
|
|||
|
Additional paid in capital
|
1,299,418
|
|
1,579,797
|
|
|||
|
Accumulated deficit
|
(473,276
|
)
|
(379,460
|
)
|
|||
|
Accumulated other comprehensive loss
|
(4,159
|
)
|
(1,809
|
)
|
|||
|
Total Apollo Global Management, LLC shareholders’ equity
|
1,376,196
|
|
1,462,926
|
|
|||
|
Non-Controlling Interests in consolidated entities
|
271,522
|
|
140,086
|
|
|||
|
Non-Controlling Interests in Apollo Operating Group
|
804,122
|
|
1,294,784
|
|
|||
|
Total Shareholders’ Equity
|
2,451,840
|
|
2,897,796
|
|
|||
|
Total Liabilities and Shareholders’ Equity
|
$
|
5,991,654
|
|
$
|
6,991,070
|
|
|
See accompanying notes to
consolidated
financial statements.
-
152
-
APOLLO GLOBAL MANAGEMENT, LLC
CONSOLIDATED
STATEMENTS OF OPERATIONS
FOR THE
YEARS ENDED
DECEMBER 31, 2018
,
2017
AND
2016
(dollars in thousands, except share data)
|
For the Years Ended
December 31, |
|||||||||||
|
|
2018
|
2017
|
2016
|
||||||||
|
Revenues:
|
|||||||||||
|
Management fees
|
$
|
1,345,252
|
|
$
|
1,154,925
|
|
$
|
1,043,513
|
|
||
|
Advisory and transaction fees, net
|
112,278
|
|
117,624
|
|
146,665
|
|
|||||
|
Investment income (loss):
|
|||||||||||
|
Performance allocations
|
(400,305
|
)
|
1,306,193
|
|
712,865
|
|
|||||
|
Principal investment income
|
5,122
|
|
161,630
|
|
103,178
|
|
|||||
|
Total investment income (loss)
|
(395,183
|
)
|
1,467,823
|
|
816,043
|
|
|||||
|
Incentive fees
|
30,718
|
|
31,431
|
|
67,341
|
|
|||||
|
Total Revenues
|
1,093,065
|
|
2,771,803
|
|
2,073,562
|
|
|||||
|
Expenses:
|
|||||||||||
|
Compensation and benefits:
|
|||||||||||
|
Salary, bonus and benefits
|
459,604
|
|
428,882
|
|
389,130
|
|
|||||
|
Equity-based compensation
|
173,228
|
|
91,450
|
|
102,983
|
|
|||||
|
Profit sharing expense
|
(57,833
|
)
|
515,073
|
|
357,074
|
|
|||||
|
Total compensation and benefits
|
574,999
|
|
1,035,405
|
|
849,187
|
|
|||||
|
Interest expense
|
59,374
|
|
52,873
|
|
43,482
|
|
|||||
|
General, administrative and other
|
266,444
|
|
257,858
|
|
247,000
|
|
|||||
|
Placement fees
|
2,122
|
|
13,913
|
|
26,249
|
|
|||||
|
Total Expenses
|
902,939
|
|
1,360,049
|
|
1,165,918
|
|
|||||
|
Other Income (Loss):
|
|||||||||||
|
Net gains (losses) from investment activities
|
(186,449
|
)
|
95,104
|
|
139,721
|
|
|||||
|
Net gains from investment activities of consolidated variable interest entities
|
45,112
|
|
10,665
|
|
5,015
|
|
|||||
|
Interest income
|
20,654
|
|
6,421
|
|
4,072
|
|
|||||
|
Other income, net
|
35,829
|
|
245,640
|
|
4,562
|
|
|||||
|
Total Other Income (Loss)
|
(84,854
|
)
|
357,830
|
|
153,370
|
|
|||||
|
Income before income tax provision
|
105,272
|
|
1,769,584
|
|
1,061,014
|
|
|||||
|
Income tax provision
|
(86,021
|
)
|
(325,945
|
)
|
(90,707
|
)
|
|||||
|
Net Income
|
19,251
|
|
1,443,639
|
|
970,307
|
|
|||||
|
Net income attributable to Non-Controlling Interests
|
(29,627
|
)
|
(814,535
|
)
|
(567,457
|
)
|
|||||
|
Net Income (Loss) Attributable to Apollo Global Management, LLC
|
(10,376
|
)
|
629,104
|
|
402,850
|
|
|||||
|
Net income attributable to Series A Preferred Shareholders
|
(17,531
|
)
|
(13,538
|
)
|
—
|
|
|||||
|
Net income attributable to Series B Preferred Shareholders
|
(14,131
|
)
|
—
|
|
—
|
|
|||||
|
Net Income (Loss) Attributable to Apollo Global Management, LLC Class A Shareholders
|
$
|
(42,038
|
)
|
$
|
615,566
|
|
$
|
402,850
|
|
||
|
Distributions Declared per Class A Share
|
$
|
1.93
|
|
$
|
1.85
|
|
$
|
1.25
|
|
||
|
Net Income (Loss) Per Class A Share:
|
|||||||||||
|
Net Income (Loss) Available to Class A Share – Basic
|
$
|
(0.30
|
)
|
$
|
3.12
|
|
$
|
2.11
|
|
||
|
Net Income (Loss) Available to Class A Share – Diluted
|
$
|
(0.30
|
)
|
$
|
3.10
|
|
$
|
2.11
|
|
||
|
Weighted Average Number of Class A Shares Outstanding – Basic
|
199,946,632
|
|
190,931,743
|
|
183,998,080
|
|
|||||
|
Weighted Average Number of Class A Shares Outstanding – Diluted
|
199,946,632
|
|
192,581,693
|
|
183,998,080
|
|
|||||
See accompanying notes to
consolidated
financial statements.
-
153
-
APOLLO GLOBAL MANAGEMENT, LLC
CONSOLIDATED
STATEMENTS OF
COMPREHENSIVE INCOME (LOSS)
FOR THE
YEARS ENDED
DECEMBER 31, 2018
,
2017
AND
2016
(dollars in thousands, except share data)
|
For the Years Ended
December 31, |
|||||||||||
|
2018
|
2017
|
2016
|
|||||||||
|
Net Income
|
$
|
19,251
|
|
$
|
1,443,639
|
|
$
|
970,307
|
|
||
|
Other Comprehensive Income (Loss), net of tax:
|
|||||||||||
|
Currency translation adjustments, net of tax
|
(19,078
|
)
|
13,953
|
|
(4,214
|
)
|
|||||
|
Net gain from change in fair value of cash flow hedge instruments
|
105
|
|
105
|
|
106
|
|
|||||
|
Net gain (loss) on available-for-sale securities
|
(786
|
)
|
36
|
|
418
|
|
|||||
|
Total Other Comprehensive Income (Loss), net of tax
|
(19,759
|
)
|
14,094
|
|
(3,690
|
)
|
|||||
|
Comprehensive Income (Loss)
|
(508
|
)
|
1,457,733
|
|
966,617
|
|
|||||
|
Comprehensive Income attributable to Non-Controlling Interests
|
(12,218
|
)
|
(821,715
|
)
|
(564,870
|
)
|
|||||
|
Comprehensive Income (Loss) Attributable to Apollo Global Management, LLC
|
$
|
(12,726
|
)
|
$
|
636,018
|
|
$
|
401,747
|
|
||
See accompanying notes to
consolidated
financial statements.
-
154
-
APOLLO GLOBAL MANAGEMENT, LLC
CONSOLIDATED
STATEMENTS OF CHANGES
IN SHAREHOLDERS’ EQUITY
FOR THE
YEARS ENDED
DECEMBER 31, 2018
,
2017
AND
2016
(dollars in thousands, except share data)
|
|
Apollo Global Management, LLC Shareholders
|
|
|
|
|
||||||||||||||||||||||||||||||||||||
|
|
Class A
Shares
|
Class B
Shares
|
Series A Preferred Shares
|
Series B Preferred Shares
|
Additional
Paid in
Capital
|
Accumulated
Deficit
|
Accumulated
Other
Comprehensive Loss
|
Total Apollo
Global
Management,
LLC
Shareholders’
Equity
|
Non-
Controlling
Interests in
Consolidated
Entities
|
Non-
Controlling
Interests in
Apollo
Operating
Group
|
Total
Shareholders’
Equity
|
||||||||||||||||||||||||||||||
|
Balance at January 1, 2016
|
181,078,937
|
|
1
|
|
$
|
—
|
|
$
|
—
|
|
$
|
2,005,509
|
|
$
|
(1,348,384
|
)
|
$
|
(7,620
|
)
|
$
|
649,505
|
|
$
|
86,561
|
|
$
|
652,915
|
|
$
|
1,388,981
|
|
||||||||||
|
Dilution impact of issuance of Class A shares
|
—
|
|
—
|
|
—
|
|
—
|
|
388
|
|
—
|
|
—
|
|
388
|
|
—
|
|
—
|
|
388
|
|
|||||||||||||||||||
|
Capital increase related to equity-based compensation
|
—
|
|
—
|
|
—
|
|
—
|
|
69,587
|
|
—
|
|
—
|
|
69,587
|
|
—
|
|
—
|
|
69,587
|
|
|||||||||||||||||||
|
Capital contributions
|
—
|
|
—
|
|
—
|
|
—
|
|
—
|
|
—
|
|
—
|
|
—
|
|
13,236
|
|
—
|
|
13,236
|
|
|||||||||||||||||||
|
Distributions
|
—
|
|
—
|
|
—
|
|
—
|
|
(239,109
|
)
|
—
|
|
—
|
|
(239,109
|
)
|
(12,777
|
)
|
(269,781
|
)
|
(521,667
|
)
|
|||||||||||||||||||
|
Issuances of Class A shares for equity-based awards
|
4,623,187
|
|
—
|
|
—
|
|
—
|
|
186
|
|
(40,652
|
)
|
—
|
|
(40,466
|
)
|
—
|
|
—
|
|
(40,466
|
)
|
|||||||||||||||||||
|
Repurchase of Class A shares
|
(954,447
|
)
|
—
|
|
—
|
|
—
|
|
(12,902
|
)
|
—
|
|
—
|
|
(12,902
|
)
|
—
|
|
—
|
|
(12,902
|
)
|
|||||||||||||||||||
|
Exchange of AOG Units for Class A shares
|
712,617
|
|
—
|
|
—
|
|
—
|
|
6,366
|
|
—
|
|
—
|
|
6,366
|
|
—
|
|
(2,612
|
)
|
3,754
|
|
|||||||||||||||||||
|
Net income
|
—
|
|
—
|
|
—
|
|
—
|
|
—
|
|
402,850
|
|
—
|
|
402,850
|
|
5,789
|
|
561,668
|
|
970,307
|
|
|||||||||||||||||||
|
Currency translation adjustments, net of tax
|
—
|
|
—
|
|
—
|
|
—
|
|
—
|
|
—
|
|
(1,571
|
)
|
(1,571
|
)
|
(2,746
|
)
|
103
|
|
(4,214
|
)
|
|||||||||||||||||||
|
Net gain from change in fair value of cash flow hedge instruments
|
—
|
|
—
|
|
—
|
|
—
|
|
—
|
|
—
|
|
50
|
|
50
|
|
—
|
|
56
|
|
106
|
|
|||||||||||||||||||
|
Net income on available-for-sale securities
|
—
|
|
—
|
|
—
|
|
—
|
|
—
|
|
—
|
|
418
|
|
418
|
|
—
|
|
—
|
|
418
|
|
|||||||||||||||||||
|
Balance at December 31, 2016
|
185,460,294
|
|
1
|
|
$
|
—
|
|
$
|
—
|
|
$
|
1,830,025
|
|
$
|
(986,186
|
)
|
$
|
(8,723
|
)
|
$
|
835,116
|
|
$
|
90,063
|
|
$
|
942,349
|
|
$
|
1,867,528
|
|
||||||||||
|
Adoption of new accounting guidance
|
—
|
|
—
|
|
—
|
|
—
|
|
—
|
|
22,901
|
|
—
|
|
22,901
|
|
—
|
|
—
|
|
22,901
|
|
|||||||||||||||||||
|
Dilution impact of issuance of Class A shares
|
—
|
|
—
|
|
—
|
|
—
|
|
(344
|
)
|
—
|
|
—
|
|
(344
|
)
|
—
|
|
—
|
|
(344
|
)
|
|||||||||||||||||||
|
Equity issued in connection with Preferred shares offering
|
—
|
|
—
|
|
264,398
|
|
—
|
|
—
|
|
—
|
|
—
|
|
264,398
|
|
—
|
|
—
|
|
264,398
|
|
|||||||||||||||||||
|
Capital increase related to equity-based compensation
|
—
|
|
—
|
|
—
|
|
—
|
|
72,174
|
|
—
|
|
—
|
|
72,174
|
|
—
|
|
—
|
|
72,174
|
|
|||||||||||||||||||
|
Capital contributions
|
—
|
|
—
|
|
—
|
|
—
|
|
—
|
|
—
|
|
—
|
|
—
|
|
47,455
|
|
—
|
|
47,455
|
|
|||||||||||||||||||
|
Distributions
|
—
|
|
—
|
|
(13,538
|
)
|
—
|
|
(366,700
|
)
|
—
|
|
—
|
|
(380,238
|
)
|
(16,327
|
)
|
(410,776
|
)
|
(807,341
|
)
|
|||||||||||||||||||
|
Issuances of Class A shares for equity-based awards
|
2,323,205
|
|
—
|
|
—
|
|
—
|
|
—
|
|
(31,741
|
)
|
—
|
|
(31,741
|
)
|
—
|
|
—
|
|
(31,741
|
)
|
|||||||||||||||||||
|
Repurchase of Class A shares
|
(233,248
|
)
|
—
|
|
—
|
|
—
|
|
(6,903
|
)
|
—
|
|
—
|
|
(6,903
|
)
|
—
|
|
—
|
|
(6,903
|
)
|
|||||||||||||||||||
|
Exchange of AOG Units for Class A shares
|
7,717,418
|
|
—
|
|
—
|
|
—
|
|
51,545
|
|
—
|
|
—
|
|
51,545
|
|
—
|
|
(39,609
|
)
|
11,936
|
|
|||||||||||||||||||
|
Net income
|
—
|
|
—
|
|
13,538
|
|
—
|
|
—
|
|
615,566
|
|
—
|
|
629,104
|
|
8,891
|
|
805,644
|
|
1,443,639
|
|
|||||||||||||||||||
|
Currency translation adjustments, net of tax
|
—
|
|
—
|
|
—
|
|
—
|
|
—
|
|
—
|
|
6,579
|
|
6,579
|
|
10,004
|
|
(2,630
|
)
|
13,953
|
|
|||||||||||||||||||
|
Net gain from change in fair value of cash flow hedge instruments
|
—
|
|
—
|
|
—
|
|
—
|
|
—
|
|
—
|
|
50
|
|
50
|
|
—
|
|
55
|
|
105
|
|
|||||||||||||||||||
|
Net income on available-for-sale securities
|
—
|
|
—
|
|
—
|
|
—
|
|
—
|
|
—
|
|
285
|
|
285
|
|
—
|
|
(249
|
)
|
36
|
|
|||||||||||||||||||
|
Balance at December 31, 2017
|
195,267,669
|
|
1
|
|
$
|
264,398
|
|
$
|
—
|
|
$
|
1,579,797
|
|
$
|
(379,460
|
)
|
$
|
(1,809
|
)
|
$
|
1,462,926
|
|
$
|
140,086
|
|
$
|
1,294,784
|
|
$
|
2,897,796
|
|
||||||||||
|
|
Apollo Global Management, LLC Shareholders
|
|
|
|
|
||||||||||||||||||||||||||||||||||||
|
|
Class A
Shares
|
Class B
Shares
|
Series A Preferred Shares
|
Series B Preferred Shares
|
Additional
Paid in
Capital
|
Accumulated
Deficit
|
Accumulated
Other
Comprehensive Loss
|
Total Apollo
Global
Management,
LLC
Shareholders’
Equity
|
Non-
Controlling
Interests in
Consolidated
Entities
|
Non-
Controlling
Interests in
Apollo
Operating
Group
|
Total
Shareholders’
Equity
|
||||||||||||||||||||||||||||||
|
Balance at December 31, 2017
|
195,267,669
|
|
1
|
|
$
|
264,398
|
|
$
|
—
|
|
$
|
1,579,797
|
|
$
|
(379,460
|
)
|
$
|
(1,809
|
)
|
$
|
1,462,926
|
|
$
|
140,086
|
|
$
|
1,294,784
|
|
$
|
2,897,796
|
|
||||||||||
|
Adoption of new accounting guidance
|
—
|
|
—
|
|
—
|
|
—
|
|
(34
|
)
|
(8,116
|
)
|
—
|
|
(8,150
|
)
|
—
|
|
(11,210
|
)
|
(19,360
|
)
|
|||||||||||||||||||
|
Dilution impact of issuance of Class A shares
|
—
|
|
—
|
|
—
|
|
—
|
|
113
|
|
—
|
|
—
|
|
113
|
|
—
|
|
—
|
|
113
|
|
|||||||||||||||||||
|
Equity issued in connection with Preferred shares offering
|
—
|
|
—
|
|
—
|
|
289,815
|
|
—
|
|
—
|
|
—
|
|
289,815
|
|
—
|
|
—
|
|
289,815
|
|
|||||||||||||||||||
|
Capital increase related to equity-based compensation
|
—
|
|
—
|
|
—
|
|
—
|
|
147,537
|
|
—
|
|
—
|
|
147,537
|
|
—
|
|
—
|
|
147,537
|
|
|||||||||||||||||||
|
Capital contributions
|
—
|
|
—
|
|
—
|
|
—
|
|
—
|
|
—
|
|
—
|
|
—
|
|
146,465
|
|
—
|
|
146,465
|
|
|||||||||||||||||||
|
Distributions
|
—
|
|
—
|
|
(17,531
|
)
|
(14,131
|
)
|
(406,863
|
)
|
—
|
|
—
|
|
(438,525
|
)
|
(31,434
|
)
|
(441,355
|
)
|
(911,314
|
)
|
|||||||||||||||||||
|
Issuances of Class A shares for equity-based awards
|
3,440,447
|
|
—
|
|
—
|
|
—
|
|
28,740
|
|
(43,662
|
)
|
—
|
|
(14,922
|
)
|
—
|
|
—
|
|
(14,922
|
)
|
|||||||||||||||||||
|
Repurchase of Class A shares
|
(2,701,876
|
)
|
—
|
|
—
|
|
—
|
|
(90,908
|
)
|
—
|
|
—
|
|
(90,908
|
)
|
—
|
|
—
|
|
(90,908
|
)
|
|||||||||||||||||||
|
Exchange of AOG Units for Class A shares
|
5,394,260
|
|
—
|
|
—
|
|
—
|
|
41,036
|
|
—
|
|
—
|
|
41,036
|
|
—
|
|
(33,910
|
)
|
7,126
|
|
|||||||||||||||||||
|
Net income (loss)
|
—
|
|
—
|
|
17,531
|
|
14,131
|
|
—
|
|
(42,038
|
)
|
—
|
|
(10,376
|
)
|
31,648
|
|
(2,021
|
)
|
19,251
|
|
|||||||||||||||||||
|
Currency translation adjustments, net of tax
|
—
|
|
—
|
|
—
|
|
—
|
|
—
|
|
—
|
|
(2,010
|
)
|
(2,010
|
)
|
(15,243
|
)
|
(1,825
|
)
|
(19,078
|
)
|
|||||||||||||||||||
|
Net gain from change in fair value of cash flow hedge instruments
|
—
|
|
—
|
|
—
|
|
—
|
|
—
|
|
—
|
|
52
|
|
52
|
|
—
|
|
53
|
|
105
|
|
|||||||||||||||||||
|
Net loss on available-for-sale securities
|
—
|
|
—
|
|
—
|
|
—
|
|
—
|
|
—
|
|
(392
|
)
|
(392
|
)
|
—
|
|
(394
|
)
|
(786
|
)
|
|||||||||||||||||||
|
Balance at December 31, 2018
|
201,400,500
|
|
1
|
|
$
|
264,398
|
|
$
|
289,815
|
|
$
|
1,299,418
|
|
$
|
(473,276
|
)
|
$
|
(4,159
|
)
|
$
|
1,376,196
|
|
$
|
271,522
|
|
$
|
804,122
|
|
$
|
2,451,840
|
|
||||||||||
See accompanying notes to
consolidated
financial statements.
-
155
-
APOLLO GLOBAL MANAGEMENT, LLC
CONSOLIDATED
STATEMENTS OF CASH FLOWS
FOR THE
YEARS ENDED
DECEMBER 31, 2018
,
2017
AND
2016
(dollars in thousands, except share data)
|
For the Years Ended
December 31, |
|||||||||||
|
2018
|
2017
|
2016
|
|||||||||
|
Cash Flows from Operating Activities:
|
|||||||||||
|
Net income
|
$
|
19,251
|
|
$
|
1,443,639
|
|
$
|
970,307
|
|
||
|
Adjustments to reconcile net income to net cash provided by operating activities:
|
|||||||||||
|
Equity-based compensation
|
173,228
|
|
91,450
|
|
102,983
|
|
|||||
|
Depreciation and amortization
|
15,233
|
|
18,379
|
|
18,735
|
|
|||||
|
Unrealized (gains) losses from investment activities
|
191,896
|
|
(99,376
|
)
|
(136,417
|
)
|
|||||
|
Principal investment income
|
(5,122
|
)
|
(161,630
|
)
|
(103,178
|
)
|
|||||
|
Performance allocations
|
400,305
|
|
(1,306,193
|
)
|
(712,865
|
)
|
|||||
|
Change in fair value of contingent obligations
|
(11,166
|
)
|
9,916
|
|
40,424
|
|
|||||
|
Gain from remeasurements of tax receivable agreement liability
|
(35,405
|
)
|
(200,240
|
)
|
(3,208
|
)
|
|||||
|
Deferred taxes, net
|
79,188
|
|
314,127
|
|
81,880
|
|
|||||
|
Other non-cash amounts included in net income, net
|
(18,363
|
)
|
(42
|
)
|
(20,989
|
)
|
|||||
|
Cash flows due to changes in operating assets and liabilities:
|
|||||||||||
|
Incentive fees receivable
|
660
|
|
5,674
|
|
6,173
|
|
|||||
|
Due from related parties
|
(108,684
|
)
|
(23,184
|
)
|
(4,084
|
)
|
|||||
|
Accounts payable and accrued expenses
|
2,005
|
|
11,408
|
|
(34,360
|
)
|
|||||
|
Accrued compensation and benefits
|
11,109
|
|
9,720
|
|
(1,651
|
)
|
|||||
|
Deferred revenue
|
(13,680
|
)
|
(43,378
|
)
|
387
|
|
|||||
|
Due to related parties
|
(5,668
|
)
|
(6,949
|
)
|
(4,281
|
)
|
|||||
|
Profit sharing payable
|
(224,796
|
)
|
215,809
|
|
227,771
|
|
|||||
|
Other assets and other liabilities, net
|
3,677
|
|
(16,543
|
)
|
1,250
|
|
|||||
|
Cash distributions of earnings from principal investments
|
66,860
|
|
65,448
|
|
33,909
|
|
|||||
|
Cash distributions of earnings from performance allocations
|
397,432
|
|
650,457
|
|
142,077
|
|
|||||
|
Satisfaction of contingent obligations
|
(6,947
|
)
|
(23,597
|
)
|
(13,721
|
)
|
|||||
|
Apollo Fund and VIE related:
|
|||||||||||
|
Net realized and unrealized gains from investing activities and debt
|
(40,850
|
)
|
(9,773
|
)
|
(572
|
)
|
|||||
|
Purchases of investments
|
(479,674
|
)
|
(709,928
|
)
|
(581,226
|
)
|
|||||
|
Proceeds from sale of investments
|
467,367
|
|
562,150
|
|
592,941
|
|
|||||
|
Changes in other assets and other liabilities, net
|
(63,597
|
)
|
62,508
|
|
(2,500
|
)
|
|||||
|
Net Cash Provided by Operating Activities
|
$
|
814,259
|
|
$
|
859,852
|
|
$
|
599,785
|
|
||
|
Cash Flows from Investing Activities:
|
|||||||||||
|
Purchases of fixed assets
|
$
|
(14,741
|
)
|
$
|
(8,529
|
)
|
$
|
(6,356
|
)
|
||
|
Proceeds from sale of investments
|
49,239
|
|
—
|
|
—
|
|
|||||
|
Purchase of investments
|
(104,786
|
)
|
(12,711
|
)
|
(46,880
|
)
|
|||||
|
Purchase of U.S. Treasury securities
|
(449,865
|
)
|
(363,812
|
)
|
—
|
|
|||||
|
Proceeds from maturities of U.S. Treasury securities
|
423,342
|
|
—
|
|
—
|
|
|||||
|
Cash contributions to principal investments
|
(268,933
|
)
|
(153,309
|
)
|
(224,946
|
)
|
|||||
|
Cash distributions from principal investments
|
121,555
|
|
117,577
|
|
102,768
|
|
|||||
|
Issuance of related party loans
|
(3,295
|
)
|
(6,114
|
)
|
(8,648
|
)
|
|||||
|
Repayment of related party loans
|
—
|
|
17,700
|
|
—
|
|
|||||
|
Other investing activities
|
224
|
|
(8,621
|
)
|
281
|
|
|||||
|
Net Cash Used in Investing Activities
|
$
|
(247,260
|
)
|
$
|
(417,819
|
)
|
$
|
(183,781
|
)
|
||
|
Cash Flows from Financing Activities:
|
|||||||||||
|
Principal repayments of debt
|
$
|
(300,000
|
)
|
$
|
—
|
|
$
|
(200,000
|
)
|
||
|
Issuance of Preferred shares, net of issuance costs
|
289,815
|
|
264,398
|
|
—
|
|
|||||
|
Distributions to Preferred Shareholders
|
(31,662
|
)
|
(13,538
|
)
|
—
|
|
|||||
|
Issuance of debt
|
303,267
|
|
—
|
|
532,706
|
|
|||||
|
Satisfaction of tax receivable agreement
|
(50,267
|
)
|
(17,895
|
)
|
—
|
|
|||||
|
Purchase of Class A shares
|
(90,908
|
)
|
(18,463
|
)
|
(13,377
|
)
|
|||||
|
Payments related to deliveries of Class A shares for RSUs
|
(43,662
|
)
|
(31,741
|
)
|
(40,652
|
)
|
|||||
|
Distributions paid
|
(406,863
|
)
|
(366,700
|
)
|
(239,109
|
)
|
|||||
|
Distributions paid to Non-Controlling Interests in Apollo Operating Group
|
(441,355
|
)
|
(410,776
|
)
|
(269,781
|
)
|
|||||
|
Other financing activities
|
(9,637
|
)
|
(3,471
|
)
|
(13,809
|
)
|
|||||
|
Apollo Fund and VIE related:
|
|||||||||||
|
Issuance of debt
|
—
|
|
553,034
|
|
396,266
|
|
|||||
|
Principal repayment of debt
|
(92,153
|
)
|
(443,082
|
)
|
(397,275
|
)
|
|||||
|
Distributions paid to Non-Controlling Interests in consolidated entities
|
(25,948
|
)
|
(10,776
|
)
|
(4,326
|
)
|
|||||
|
Contributions from Non-Controlling Interests in consolidated entities
|
147,189
|
|
45,375
|
|
13,200
|
|
|||||
|
Net Cash Used in Financing Activities
|
$
|
(752,184
|
)
|
$
|
(453,635
|
)
|
$
|
(236,157
|
)
|
||
|
Net Increase (Decrease) in Cash and Cash Equivalents, Restricted Cash and Cash Held at Consolidated Variable Interest Entities
|
(185,185
|
)
|
(11,602
|
)
|
179,847
|
|
|||||
|
Cash and Cash Equivalents, Restricted Cash and Cash Held at Consolidated Variable Interest Entities, Beginning of Period
|
848,060
|
|
859,662
|
|
679,815
|
|
|||||
|
Cash and Cash Equivalents, Restricted Cash and Cash Held at Consolidated Variable Interest Entities, End of Period
|
$
|
662,875
|
|
$
|
848,060
|
|
$
|
859,662
|
|
||
|
Supplemental Disclosure of Cash Flow Information:
|
|||||||||||
|
Interest paid
|
$
|
55,135
|
|
$
|
57,310
|
|
$
|
44,524
|
|
||
|
Interest paid by consolidated variable interest entities
|
16,553
|
|
13,207
|
|
18,208
|
|
|||||
|
Income taxes paid
|
10,220
|
|
13,624
|
|
8,353
|
|
|||||
|
Supplemental Disclosure of Non-Cash Investing Activities:
|
|||||||||||
|
Non-cash contributions to principal investments
|
$
|
—
|
|
$
|
—
|
|
$
|
1,231
|
|
||
|
Non-cash distributions from principal investments
|
(26,465
|
)
|
(52,683
|
)
|
(13,433
|
)
|
|||||
|
Non-cash purchases of other investments, at fair value
|
194,003
|
|
51,248
|
|
8,937
|
|
|||||
|
Non-cash sales of other investments, at fair value
|
(48,587
|
)
|
—
|
|
—
|
|
|||||
|
Supplemental Disclosure of Non-Cash Financing Activities:
|
|||||||||||
|
Capital increases related to equity-based compensation
|
$
|
147,537
|
|
$
|
72,174
|
|
$
|
69,587
|
|
||
|
Issuance of restricted shares
|
28,740
|
|
—
|
|
—
|
|
|||||
|
Other non-cash financing activities
|
113
|
|
(345
|
)
|
559
|
|
|||||
|
Adjustments related to exchange of Apollo Operating Group units:
|
|||||||||||
|
Deferred tax assets
|
$
|
45,017
|
|
$
|
56,908
|
|
$
|
7,342
|
|
||
|
Due to related parties
|
(37,891
|
)
|
(44,972
|
)
|
(3,588
|
)
|
|||||
|
Additional paid in capital
|
(7,126
|
)
|
(11,936
|
)
|
(3,754
|
)
|
|||||
|
Non-Controlling Interest in Apollo Operating Group
|
33,910
|
|
39,609
|
|
2,612
|
|
|||||
|
Reconciliation of Cash and Cash Equivalents, Restricted Cash and Cash Held at Consolidated Variable Interest Entities to the Consolidated Statements of Financial Condition:
|
|||||||||||
|
Cash and cash equivalents
|
$
|
609,747
|
|
$
|
751,273
|
|
$
|
813,664
|
|
||
|
Restricted cash
|
3,457
|
|
3,875
|
|
4,680
|
|
|||||
|
Cash held at consolidated variable interest entities
|
49,671
|
|
92,912
|
|
41,318
|
|
|||||
|
Total Cash and Cash Equivalents, Restricted Cash and Cash and Cash Equivalents Held at Consolidated Variable Interest Entities
|
$
|
662,875
|
|
$
|
848,060
|
|
$
|
859,662
|
|
||
See accompanying notes to
consolidated
financial statements.
-
156
-
APOLLO GLOBAL MANAGEMENT, LLC
NOTES TO CONSOLIDATED
FINANCIAL STATEMENTS
(dollars in thousands, except share data, except where noted)
1
. ORGANIZATION
Apollo Global Management, LLC (“AGM”, together with its consolidated subsidiaries, the “Company” or “Apollo”) is a global alternative investment manager whose predecessor was founded in 1990. Its primary business is to raise, invest and manage credit, private equity and real assets funds as well as strategic investment accounts, on behalf of pension, endowment and sovereign wealth funds, as well as other institutional and individual investors. For these investment management services, Apollo receives management fees generally related to the amount of assets managed, transaction and advisory fees, incentive fees and performance allocations related to the performance of the respective funds that it manages. Apollo has
three
primary business segments:
|
•
|
Credit
—primarily invests in non-control corporate and structured debt instruments including performing, stressed and distressed investments across the capital structure;
|
|
•
|
Private equity
—primarily invests in control equity and related debt instruments, convertible securities and distressed debt investments; and
|
|
•
|
Real assets
—primarily invests in real estate equity and infrastructure equity for the acquisition and recapitalization of real estate and infrastructure assets, portfolios, platforms and operating companies, and real estate and infrastructure debt including first mortgage and mezzanine loans, preferred equity and commercial mortgage backed securities.
|
Organization of the Company
The Company was formed as a Delaware limited liability company on July 3, 2007 and completed a reorganization of its predecessor businesses on July 13, 2007 (the “2007 Reorganization”). The Company is managed and operated by its manager, AGM Management, LLC, which in turn is indirectly wholly-owned and controlled by Leon Black, Joshua Harris and Marc Rowan, its Managing Partners.
As of
December 31, 2018
, the Company owned, through
six
intermediate holding companies that include APO Corp., a Delaware corporation that is a domestic corporation for U.S. federal income tax purposes, APO Asset Co., LLC, a Delaware limited liability company that is a disregarded entity for U.S. federal income tax purposes, APO (FC), LLC, an Anguilla limited liability company that is treated as a corporation for U.S. federal income tax purposes, APO (FC II), LLC, an Anguilla limited liability company that is treated as a corporation for U.S. federal income tax purposes, APO UK (FC), Limited, a United Kingdom incorporated company that is treated as a corporation for U.S. federal income tax purposes, and APO (FC III), LLC, a Cayman Islands limited liability company (collectively, the “Intermediate Holding Companies”),
49.9%
of the economic interests of, and operated and controlled all of the businesses and affairs of, the Apollo Operating Group through its wholly-owned subsidiaries.
AP Professional Holdings, L.P., a Cayman Islands exempted limited partnership (“Holdings”), is the entity through which the Managing Partners and certain of the Company’s other partners (the “Contributing Partners”) indirectly beneficially own interests in each of the entities that comprise the Apollo Operating Group (“AOG Units”). As of
December 31, 2018
, Holdings owned the remaining
50.1%
of the economic interests in the Apollo Operating Group. The Company consolidates the financial results of the Apollo Operating Group and its consolidated subsidiaries. Holdings’ ownership interest in the Apollo Operating Group is reflected as a Non-Controlling Interest in the accompanying
consolidated
financial statements.
2
. SUMMARY OF SIGNIFICANT ACCOUNTING POLICIES
Basis of Presentation
The accompanying
consolidated
financial statements are prepared in accordance with generally accepted accounting principles in the United States of America (“U.S. GAAP”). The
consolidated
financial statements include the accounts of the Company, its wholly-owned or majority-owned subsidiaries, the consolidated entities which are considered to be variable interest entities (“VIEs”) and for which the Company is considered the primary beneficiary, and certain entities which are not considered VIEs but which the Company controls through a majority voting interest. Intercompany accounts and transactions, if any, have been eliminated upon consolidation.
Certain reclassifications, when applicable, have been made to the prior periods’
consolidated
financial statements and notes to conform to the current period’s presentation and are disclosed accordingly.
-
157
-
APOLLO GLOBAL MANAGEMENT, LLC
NOTES TO CONSOLIDATED
FINANCIAL STATEMENTS
(dollars in thousands, except share data, except where noted)
Consolidation
The types of entities with which Apollo is involved generally include subsidiaries (e.g., general partners and management companies related to the funds the Company manages), entities that have all the attributes of an investment company (e.g., funds) and securitization vehicles (e.g., CLOs). Each of these entities is assessed for consolidation on a case by case basis depending on the specific facts and circumstances surrounding that entity.
Pursuant to the consolidation guidance, the Company first evaluates whether it holds a variable interest in an entity. Fees that are customary and commensurate with the level of services provided, and where the Company does not hold other economic interests in the entity that would absorb more than an insignificant amount of the expected losses or returns of the entity, would not be considered a variable interest. Apollo factors in all economic interests including proportionate interests through related parties, to determine if such interests are considered a variable interest. As Apollo’s interests in many of these entities are solely through market rate fees and/or insignificant indirect interests through related parties, Apollo is not considered to have a variable interest in many of these entities and no further consolidation analysis is performed. For entities where the Company has determined that it does hold a variable interest, the Company performs an assessment to determine whether each of those entities qualify as a VIE.
The determination as to whether an entity qualifies as a VIE depends on the facts and circumstances surrounding each entity and therefore certain of Apollo’s funds may qualify as VIEs under the variable interest model whereas others may qualify as voting interest entities (“VOEs”) under the voting interest model. The granting of substantive kick-out rights is a key consideration in determining whether a limited partnership or similar entity is a VIE and whether or not that entity should be consolidated.
Under the variable interest model, Apollo consolidates those entities where it is determined that the Company is the primary beneficiary of the entity. The Company is determined to be the primary beneficiary when it has a controlling financial interest in the VIE, which is defined as possessing both (i) the power to direct the activities of the VIE that most significantly impact the VIE’s economic performance and (ii) the obligation to absorb losses of the VIE or the right to receive benefits from the VIE that could potentially be significant to the VIE. When Apollo alone is not considered to have a controlling financial interest in the VIE but Apollo and its related parties under common control in the aggregate have a controlling financial interest in the VIE, Apollo will be deemed the primary beneficiary if it is the party that is most closely associated with the VIE. When Apollo and its related parties not under common control in the aggregate have a controlling financial interest in the VIE, Apollo would be deemed to be the primary beneficiary if substantially all the activities of the entity are performed on behalf of Apollo.
Apollo determines whether it is the primary beneficiary of a VIE at the time it becomes initially involved with the VIE and reconsiders that conclusion continuously. Investments and redemptions (either by Apollo, related parties of Apollo or third parties) or amendments to the governing documents of the respective entity may affect an entity’s status as a VIE or the determination of the primary beneficiary.
Assets and liabilities of the consolidated VIEs are primarily shown in separate sections within the
consolidated
statements of financial condition. Changes in the fair value of the consolidated VIEs’ assets and liabilities and related interest, dividend and other income and expenses are presented within net gains from investment activities of consolidated variable interest entities in the
consolidated
statements of operations. The portion attributable to Non-Controlling Interests is reported within net income attributable to Non-Controlling Interests in the
consolidated
statements of operations. For additional disclosures regarding VIEs, see note
6
.
Under the voting interest model, Apollo consolidates those entities it controls through a majority voting interest. Apollo does not consolidate those VOEs in which substantive kick-out rights have been granted to the unrelated investors to either dissolve the fund or remove the general partner.
Cash and Cash Equivalents
Apollo considers all highly liquid short-term investments with original maturities of three months or less when purchased to be cash equivalents. Cash and cash equivalents include money market funds and U.S. Treasury securities with original maturities of three months or less when purchased. Interest income from cash and cash equivalents is recorded in interest income in the
consolidated
statements of operations. The carrying values of the money market funds and U.S. Treasury securities were
$231.8 million
and
$404.7 million
as of
December 31, 2018 and 2017
, respectively, which approximate their fair values due to their short-term nature and are categorized as Level I within the fair value hierarchy. Substantially all of the Company’s cash on deposit is in interest bearing accounts with major financial institutions and exceed insured limits.
-
158
-
APOLLO GLOBAL MANAGEMENT, LLC
NOTES TO CONSOLIDATED
FINANCIAL STATEMENTS
(dollars in thousands, except share data, except where noted)
Restricted Cash
Restricted Cash represents cash deposited at a bank, which is pledged as collateral in connection with leased premises.
U.S. Treasury securities, at fair value
U.S. Treasury securities, at fair value includes U.S. Treasury bills with original maturities greater than three months when purchased. These securities are recorded at fair value. Interest income on such securities is separately presented from the overall change in fair value and is recognized in interest income in the
consolidated
statements of operations. Any remaining change in fair value of such securities, that is not recognized as interest income, is recognized in net gains (losses) from investment activities in the
consolidated
statements of operations.
Fair Value of Financial Instruments
Apollo has elected the fair value option for the Company’s investment in Athene Holding, the assets and liabilities of certain of its consolidated VIEs (including CLOs), the Company’s U.S. Treasury securities with original maturities greater than three months when purchased, and certain of the Company’s other investments. Such election is irrevocable and is applied to financial instruments on an individual basis at initial recognition.
The fair value of a financial instrument is the price that would be received to sell an asset or paid to transfer a liability in an orderly transaction between market participants at the measurement date under current market conditions.
Except for the Company’s debt obligations, financial instruments are generally recorded at fair value or at amounts whose carrying values approximate fair value. The actual realized gains or losses will depend on, among other factors, future operating results, the value of the assets and market conditions at the time of disposition, any related transaction costs and the timing and manner of sale, all of which may ultimately differ significantly from the assumptions on which the valuations were based.
Fair Value Hierarchy
U.S. GAAP establishes a hierarchical disclosure framework which prioritizes and ranks the level of market price observability used in measuring financial instruments at fair value. Market price observability is affected by a number of factors, including the type of financial instrument, the characteristics specific to the financial instrument and the state of the marketplace, including the existence and transparency of transactions between market participants. Financial instruments with readily available quoted prices in active markets generally will have a higher degree of market price observability and a lesser degree of judgment used in measuring fair value.
Financial instruments measured and reported at fair value are classified and disclosed based on the observability of inputs used in the determination of fair values, as follows:
Level I
- Quoted prices are available in active markets for identical financial instruments as of the reporting date. The types of financial instruments included in Level I include listed equities and debt. The Company does not adjust the quoted price for these financial instruments, even in situations where the Company holds a large position and the sale of such position would likely deviate from the quoted price.
Level II
- Pricing inputs are other than quoted prices in active markets, which are either directly or indirectly observable as of the reporting date, and fair value is determined through the use of models or other valuation methodologies. Financial instruments that are generally included in this category include corporate bonds and loans, less liquid and restricted equity securities and certain over-the-counter derivatives where the fair value is based on observable inputs. These financial instruments exhibit higher levels of liquid market observability as compared to Level III financial instruments.
Level III
- Pricing inputs are unobservable for the financial instrument and includes situations where there is little observable market activity for the financial instrument. The inputs into the determination of fair value may require significant management judgment or estimation. Financial instruments that are included in this category generally include general and limited partner interests in corporate private equity and real assets funds, opportunistic credit funds, distressed debt and non-investment grade residual interests in securitizations and CDOs and CLOs where the fair value is based on observable inputs as well as unobservable inputs.
-
159
-
APOLLO GLOBAL MANAGEMENT, LLC
NOTES TO CONSOLIDATED
FINANCIAL STATEMENTS
(dollars in thousands, except share data, except where noted)
When a security is valued based on broker quotes, the Company subjects those quotes to various criteria in making the determination as to whether a particular financial instrument would qualify for classification as Level II or Level III. These criteria include, but are not limited to, the number and quality of the broker quotes, the standard deviations of the observed broker quotes, and the percentage deviation from independent pricing services.
In certain cases, the inputs used to measure fair value may fall into different levels of the fair value hierarchy. In such cases, a financial instrument’s level within the fair value hierarchy is based on the lowest level of input that is significant to the fair value measurement. The Company’s assessment of the significance of a particular input to the fair value measurement in its entirety requires judgment and considers factors specific to the financial instrument when the fair value is based on unobservable inputs.
Equity Method Investments
For investments in entities over which the Company exercises significant influence but which do not meet the requirements for consolidation and for which the Company has not elected the fair value option, the Company uses the equity method of accounting, whereby the Company records its share of the underlying income or loss of such entities. The Company’s share of the underlying net income or loss of such entities is recorded in principal investment income in the
consolidated
statements of operations.
The carrying amounts of equity method investments are recorded in investments in the
consolidated
statements of financial condition. As the underlying entities that the Company manages and invests in are, for U.S. GAAP purposes, primarily investment companies which reflect their investments at estimated fair value, the carrying value of the Company’s equity method investments in such entities approximates fair value.
Financial Instruments held by Consolidated VIEs
The Company measures both the financial assets and financial liabilities of the consolidated CLOs in its
consolidated
financial statements using the fair value of the financial assets of the consolidated CLOs, which are more observable than the fair value of the financial liabilities of the consolidated CLOs. As a result, the financial assets of the consolidated CLOs are measured at fair value and the financial liabilities are measured in consolidation as: (i) the sum of the fair value of the financial assets and the carrying value of any non-financial assets that are incidental to the operations of the CLOs less (ii) the sum of the fair value of any beneficial interests retained by the Company (other than those that represent compensation for services) and the Company’s carrying value of any beneficial interests that represent compensation for services. The resulting amount is allocated to the individual financial liabilities (other than the beneficial interest retained by the Company) using a reasonable and consistent methodology. Under the measurement alternative, net income attributable to Apollo Global Management, LLC reflects the Company’s own economic interests in the consolidated CLOs including (i) changes in the fair value of the beneficial interests retained by the Company and (ii) beneficial interests that represent compensation for collateral management services.
The consolidated VIEs hold investments that could be traded over-the-counter. Investments in securities that are traded on a securities exchange or comparable over-the-counter quotation systems are valued based on the last reported sale price at that date. If no sales of such investments are reported on such date, and in the case of over-the-counter securities or other investments for which the last sale date is not available, valuations are based on independent market quotations obtained from market participants, recognized pricing services or other sources deemed relevant, and the prices are based on the average of the “bid” and “ask” prices, or at ascertainable prices at the close of business on such day. Market quotations are generally based on valuation pricing models or market transactions of similar securities adjusted for security-specific factors such as relative capital structure priority and interest and yield risks, among other factors. When market quotations are not available, a model based approach is used to determine fair value.
Due from/to Related Parties
Due from/to related parties includes Apollo’s existing partners, employees, certain former employees, portfolio companies of the funds and nonconsolidated credit, private equity and real assets funds. See note
14
for further disclosure of transactions with related parties.
Fixed Assets
Fixed assets consist primarily of leasehold improvements, furniture, fixtures, equipment, and computer hardware and are recorded at cost, net of accumulated depreciation and amortization. Depreciation and amortization is calculated using the
-
160
-
APOLLO GLOBAL MANAGEMENT, LLC
NOTES TO CONSOLIDATED
FINANCIAL STATEMENTS
(dollars in thousands, except share data, except where noted)
straight-line method over the assets’ estimated useful lives and in the case of leasehold improvements the lesser of the useful life or the term of the lease. Expenditures for repairs and maintenance are charged to expense when incurred. The Company evaluates long-lived assets for impairment periodically and whenever events or changes in circumstances indicate the carrying amounts of the assets may be impaired.
Business Combinations
The Company accounts for business combinations using the acquisition method of accounting, under which the purchase price of the acquisition is allocated to the assets acquired and liabilities assumed using the fair values determined by management as of the acquisition date. Contingent consideration obligations that are elements of the consideration transferred are recognized as of the acquisition date as part of the fair value transferred in exchange for the acquired business. Acquisition-related costs incurred in connection with a business combination are expensed as incurred.
Goodwill and Intangible Assets
Goodwill represents the excess of cost over the fair value of identifiable net assets of an acquired business. Goodwill and other indefinite lived intangible assets are tested annually for impairment or more frequently if circumstances indicate impairment may have occurred.
The Company performed its annual goodwill impairment test as of October 1, 2018 and 2017 and did not identify any impairment.
Finite-lived intangible assets such as contractual rights to earn future management fees and incentive fees acquired in business combinations are amortized over their estimated useful lives, which are periodically re-evaluated for impairment or when circumstances indicate an impairment may have occurred. Apollo amortizes its identifiable finite-lived intangible assets using a method of amortization reflecting the pattern in which the economic benefits of the finite-lived intangible assets are consumed or otherwise used up. If that pattern cannot be reliably determined, Apollo uses the straight-line method of amortization.
Deferred Revenue
Apollo records deferred revenue, which is a type of contract liability, when consideration is received in advance of management services provided.
Apollo also earns management fees subject to the Management Fee Offset (described below). When advisory and transaction fees are earned by the management company, the Management Fee Offset reduces the management fee obligation of the fund. When the Company receives cash for advisory and transaction fees, a certain percentage of such advisory and/or transaction fees, as applicable, is allocated as a credit to reduce future management fees, otherwise payable by such fund. Such credit is recorded as deferred revenue in the
consolidated
statements of financial condition. A portion of any excess advisory and transaction fees may be required to be returned to the limited partners of certain funds upon such fund’s liquidation. As the management fees earned by the Company are presented on a gross basis, any Management Fee Offsets calculated are presented as a reduction to advisory and transaction fees in the
consolidated
statements of operations.
Additionally, Apollo earns advisory fees pursuant to the terms of the advisory agreements with certain of the portfolio companies that are owned by the funds Apollo manages. When Apollo receives a payment from a portfolio company that exceeds the advisory fees earned at that point in time, the excess payment is recorded as deferred revenue in the
consolidated
statements of financial condition. The advisory agreements with the portfolio companies vary in duration and the associated fees are received monthly, quarterly or annually. Deferred revenue is reversed and recognized as revenue over the period that the agreed upon services are performed. There was
$121.4 million
of revenue recognized during the
year ended
December 31, 2018
that was previously deferred as of January 1, 2018.
Under the terms of the funds’ partnership agreements, Apollo is normally required to bear organizational expenses over a set dollar amount and placement fees or costs in connection with the offering and sale of interests in the funds it manages to investors. The placement fees are payable to placement agents, who are independent third parties that assist in identifying potential investors, securing commitments to invest from such potential investors, preparing or revising offering and marketing materials, developing strategies for attempting to secure investments by potential investors and/or providing feedback and insight regarding issues and concerns of potential investors, when a limited partner either commits or funds a commitment to a fund. In certain instances the placement fees are paid over a period of time. Based on the management agreements with the funds, Apollo considers placement fees and organizational costs paid in determining if cash has been received in excess of the management fees
-
161
-
APOLLO GLOBAL MANAGEMENT, LLC
NOTES TO CONSOLIDATED
FINANCIAL STATEMENTS
(dollars in thousands, except share data, except where noted)
earned. Placement fees and organizational costs are normally the obligation of Apollo but can be paid for by the funds. When these costs are paid by the fund, the resulting obligations are included within deferred revenue. The deferred revenue balance will also be reduced during future periods when management fees are earned but not paid.
Debt Issuance Costs
Debt issuance costs consist of costs incurred in obtaining financing and are amortized over the term of the financing using the effective interest method. These costs are generally recorded as a direct deduction from the carrying amount of the related debt liability on the consolidated statements of financial condition.
Foreign Currency
The Company may, from time to time, hold foreign currency denominated assets and liabilities. The functional currency of the Company’s international subsidiaries is generally the U.S. Dollar, as their operations are considered an extension of U.S. parent operations. Nonmonetary assets and liabilities of the Company’s international subsidiaries are remeasured into the functional currency using historical exchange rates specific to each asset and liability, the exchange rates prevailing at the end of each reporting period is used for all others. The results of the Company’s foreign operations are normally remeasured using an average exchange rate for the respective reporting period. Currency remeasurement adjustments are included within other income, net in the consolidated statements of operations. Gains and losses on the settlement of foreign currency transactions are also included within other income, net in the consolidated statements of operations. Foreign currency denominated assets and liabilities are translated into the reporting currency using the exchange rates prevailing at the end of each reporting period. The results of the Company’s foreign operations are normally translated using an average exchange rate for the respective reporting period. Currency translation adjustments are included within other comprehensive income (loss), net of tax within the consolidated statements of comprehensive income.
Revenues
The Company’s revenues are reported in four separate categories that include (i) management fees; (ii) advisory and transaction fees, net; (iii) investment income, which is comprised of performance allocations and principal investment income; and (iv) incentive fees.
On January 1, 2018, the Company adopted new revenue guidance issued by the FASB for recognizing revenue from contracts with customers. The new revenue guidance requires that an entity should recognize revenue to depict the transfer of promised goods or services to customers in an amount that reflects the consideration to which the entity expects to be entitled in exchange for those goods or services (i.e., the transaction price). When determining the transaction price under the new revenue guidance, an entity may recognize variable consideration only to the extent that it is probable to not be significantly reversed. The new revenue guidance also requires improved disclosures to help users of financial statements better understand the nature, amount, timing, and uncertainty of revenue that is recognized.
The Company has concluded that its management fees, advisory and transaction fees, and incentive fees are within the scope of the new revenue guidance. For incentive fees, the new revenue guidance delays the timing of certain revenues compared to the prior accounting treatment. These amounts were previously recognized in carried interest income in the
consolidated
statements of operations and are now recognized within a separate line, incentive fees.
Effective January 1, 2018, the Company implemented a change in accounting principle for performance allocations to be accounted for under guidance applicable to equity method investments, and therefore not within the scope of the new revenue guidance. The accounting change does not change the timing or amount of revenue recognized related to performance allocation arrangements. These amounts were previously recognized within carried interest income in the
consolidated
statements of operations and carried interest receivable within the
consolidated
statements of financial condition. As a result of the change in accounting principle, the Company recognizes performance allocations within investment income along with the related principal investment income (as further described below) in the
consolidated
statements of operations and within the investments line in the
consolidated
statements of financial condition. The Company applied this change in accounting principle on a full retrospective basis.
The new revenue guidance was adopted on a modified retrospective basis. The adoption of the new revenue guidance did not have a material impact on the Company. In connection with the adoption of the new revenue guidance, the Company recorded a cumulative effect adjustment to total shareholders’ equity as of January 1, 2018 in the amount of
$19.4 million
net of taxes. Prior periods have not been recast to reflect the new revenue guidance. Accordingly, prior periods reflect recognition under
-
162
-
APOLLO GLOBAL MANAGEMENT, LLC
NOTES TO CONSOLIDATED
FINANCIAL STATEMENTS
(dollars in thousands, except share data, except where noted)
the previous guidance whereby incentive fees were recorded on an assumed liquidation basis at each reporting date. Refer to disclosures below for additional information on each of the Company’s revenue streams.
Management Fees
Management fees are recognized over time during the periods in which the related services are performed in accordance with the contractual terms of the related agreement. Management fees are generally based on (1) a percentage of the capital committed during the commitment period, and thereafter based on the remaining invested capital of unrealized investments, or (2) net asset value, gross assets or as otherwise defined in the respective agreements. Included in management fees are certain expense reimbursements where the Company is considered the principal under the agreements and is required to record the expense and related reimbursement revenue on a gross basis.
Advisory and Transaction Fees, Net
Advisory fees, including management consulting fees and directors’ fees, are generally recognized over time as the underlying services are provided in accordance with the contractual terms of the related agreement. The Company receives such fees in exchange for ongoing management consulting services provided to portfolio companies of funds it manages. Transaction fees, including structuring fees and arranging fees are generally recognized at a point in time when the underlying services rendered are complete.
The amounts due from fund portfolio companies are recorded in due from related parties, which is discussed further in note
14
. Under the terms of the limited partnership agreements for certain funds, the management fee payable by the funds may be subject to a reduction based on a certain percentage of such advisory and transaction fees, net of applicable broken deal costs (“Management Fee Offset”). Advisory and transaction fees are presented net of the Management Fee Offset in the
consolidated
statements of operations.
Underwriting fees, which are also included within advisory and transaction fees, net, include gains, losses and fees, arising from securities offerings in which one of the Company’s subsidiaries participates in the underwriter syndicate. Underwriting fees are recognized at a point in time when the underwriting is completed. Underwriting fees recognized but not received are recorded in other assets on the
consolidated
statements of financial condition.
During the normal course of business, the Company incurs certain costs related to certain transactions that are not consummated (“broken deal costs”). These costs (e.g., research costs, due diligence costs, professional fees, legal fees and other related items) are determined to be broken deal costs upon management’s decision to no longer pursue the transaction. In accordance with the related fund agreement, in the event the deal is deemed broken, all of the costs are reimbursed by the funds and then included as a component of the calculation of the Management Fee Offset. If a deal is successfully completed, Apollo is reimbursed by the fund or fund’s portfolio company for all costs incurred and no offset is generated. As the Company acts as an agent for the funds it manages, any transaction costs incurred and paid by the Company on behalf of the respective funds relating to successful or broken deals are recorded net on the Company’s
consolidated
statements of operations, and any receivable from the respective funds is recorded in due from related parties on the
consolidated
statements of financial condition.
Investment Income
Investment income is comprised of performance allocations and principal investment income.
Performance Allocations
Performance allocations are a type of performance revenue (i.e., income earned based on the extent to which an entity’s performance exceeds predetermined thresholds). Performance allocations are generally structured from a legal standpoint as an allocation of capital in which the Company’s capital account receives allocations of the returns of an entity when those returns exceed predetermined thresholds. The determination of which performance revenues are considered performance allocations is primarily based on the terms of an agreement with the entity.
As noted above, as a result of a change in accounting principle, the Company recognizes performance allocations within investment income along with the related principal investment income (as described further below) in the
consolidated
statements of operations and within the investments line in the
consolidated
statements of financial condition.
-
163
-
APOLLO GLOBAL MANAGEMENT, LLC
NOTES TO CONSOLIDATED
FINANCIAL STATEMENTS
(dollars in thousands, except share data, except where noted)
Principal Investment Income
Principal investment income includes the Company’s income or loss from equity method investments and certain other investments in entities in which the Company is generally eligible to receive performance allocations. Income from equity method investments includes the Company’s share of net income or loss generated from its investments, which are not consolidated, but in which the Company exerts significant influence. Prior to the change in accounting principle noted above, income from equity method investments was included within other income (loss) in the
consolidated
statements of operations. All prior periods have been conformed to reflect this change in presentation.
Incentive Fees
Incentive fees are a type of performance revenue. Incentive fees differ from performance allocations in that incentive fees do not represent an allocation of capital but rather a contractual fee arrangement with the entity.
Incentive fees are considered a form of variable consideration under the new revenue recognition guidance as they are subject to clawback or reversal and therefore must be deferred until the fees are probable to not be significantly reversed. Accrued but unpaid incentive fees are reported within incentive fees receivable in the Company’s
consolidated
statements of financial condition. As noted earlier, prior to the adoption of the new revenue recognition guidance, incentive fees were recognized on an assumed liquidation basis. The Company’s incentive fees primarily relate to the credit segment and are generally received from CLOs, managed accounts and AINV.
Compensation and Benefits
Salaries, Bonus and Benefits
Salaries, bonus and benefits include base salaries, discretionary and non-discretionary bonuses, severance and employee benefits. Bonuses are generally accrued over the related service period.
Equity-Based Compensation
Equity-based awards granted to employees and non-employees as compensation are measured based on the grant date fair value of the award. Equity-based awards that do not require future service (i.e., vested awards) are expensed immediately. Equity-based employee awards that require future service are expensed over the relevant service period. In addition, certain restricted share units (“RSUs”) granted by the Company vest based on both continued service and the Company’s receipt of performance revenues, within prescribed periods, sufficient to cover the associated equity-based compensation expense. In accordance with U.S. GAAP, equity-based compensation expense for such awards, if and when granted, will be recognized on an accelerated recognition method over the requisite service period to the extent the performance revenue metrics are met or deemed probable. The Company accounts for forfeitures of equity-based awards when they occur.
Profit Sharing
Profit sharing expense and profit sharing payable primarily consist of a portion of performance revenues earned from certain funds that are allocated to employees, former employees and Contributing Partners. Profit sharing amounts are recognized as the related performance revenues are earned. Accordingly, profit sharing amounts can be reversed during periods when there is a decline in performance revenues that were previously recognized.
Profit sharing amounts are generally not paid until the related performance revenue is distributed to the general partner upon realization of the fund’s investments. Under certain profit sharing arrangements, the Company requires that a portion of certain of the performance revenues distributed to our employees be used to purchase Class A restricted shares issued under the Company’s 2007 Omnibus Equity Incentive Plan (the “2007 Equity Plan”). Prior to distribution of the performance revenue, the Company records the value of the equity-based awards expected to be granted in other assets and other liabilities within the
consolidated
statements of financial condition. Such equity-based awards are recorded as equity-based compensation expense over the relevant service period once granted.
Additionally, profit sharing amounts previously distributed may be subject to clawback from employees, former employees and Contributing Partners. When applicable, the accrual for potential clawback of previously distributed profit sharing amounts, which is a component of due from related parties on the
consolidated
statements of financial condition, represents all amounts previously distributed to employees, former employees and Contributing Partners that would need to be returned to the
-
164
-
APOLLO GLOBAL MANAGEMENT, LLC
NOTES TO CONSOLIDATED
FINANCIAL STATEMENTS
(dollars in thousands, except share data, except where noted)
general partner if the Apollo funds were to be liquidated based on the fair value of the underlying funds’ investments as of the reporting date. The actual general partner receivable, however, would not become realized until the end of a fund’s life.
Profit sharing payable also includes contingent consideration obligations that were recognized in connection with certain Apollo acquisitions. Changes in the fair value of the contingent consideration obligations are reflected in the Company’s
consolidated
statements of operations as profit sharing expense.
The Company has a performance-based incentive arrangement for certain Apollo partners and employees designed to more closely align compensation on an annual basis with the overall realized performance of the Company. This arrangement enables certain partners and employees to earn discretionary compensation based on performance revenue earned by the Company in a given year, which amounts are reflected in profit sharing expense in the accompanying
consolidated
financial statements.
401(k) Savings Plan
The Company sponsors a 401(k) savings plan (the “401(k) Plan”) whereby U.S.-based employees are entitled to participate in the 401(k) Plan based upon satisfying certain eligibility requirements. The Company matches
50%
of eligible annual employee contributions up to
3%
of the eligible employees’ annual compensation. Matching contributions vest after
three
years of service.
General, Administrative and Other
General, administrative and other primarily includes professional fees, occupancy, depreciation and amortization, travel, information technology and administration expenses. For the year ended December 31, 2016, presentation of professional fees, occupancy, and depreciation and amortization was combined with general, administrative and other on the consolidated statements of operations.
Other Income (Loss)
Net Gains (Losses) from Investment Activities
Net gains (losses) from investment activities include both realized gains and losses and the change in unrealized gains and losses in the Company’s
investments, at fair value between the opening reporting date and the closing reporting date.
Net Gains from Investment Activities of Consolidated Variable Interest Entities
Changes in the fair value of the consolidated VIEs’ assets and liabilities and related interest, dividend and other income and expenses are presented within net gains from investment activities of consolidated variable interest entities and are attributable to Non-Controlling Interests in the
consolidated
statements of operations.
Other Income, Net
Other income, net includes the recognition of gains (losses) arising from the remeasurement of foreign currency denominated assets and liabilities, gains arising from the remeasurement of the tax receivable agreement liability (see note
14
), and other miscellaneous non-operating income and expenses.
Income Taxes
The Apollo Operating Group and its subsidiaries generally operate as partnerships for U.S. Federal income tax purposes. As a result, except as described below, the Apollo Operating Group has not been subject to U.S. income taxes. However, certain of these entities are subject to New York City unincorporated business taxes (“NYC UBT”) and certain non-U.S. entities are subject to non-U.S. corporate income taxes. In addition, certain consolidated entities are corporations for U.S. and non-U.S. tax purposes and therefore subject to U.S. federal, state and local corporate income tax.
Significant judgment is required in determining tax expense and in evaluating tax positions, including evaluating uncertainties. The Company recognizes the tax benefits of uncertain tax positions only where the position is “more likely than not” to be sustained upon examination, including resolutions of any related appeals or litigation processes, based on the technical merits of the position. The tax benefit is measured as the largest amount of benefit that has a greater than 50% likelihood of being realized upon ultimate settlement. If a tax position is not considered more likely than not to be sustained, then no benefits of the
-
165
-
APOLLO GLOBAL MANAGEMENT, LLC
NOTES TO CONSOLIDATED
FINANCIAL STATEMENTS
(dollars in thousands, except share data, except where noted)
position are recognized. The Company’s tax positions are reviewed and evaluated quarterly to determine whether or not the Company has uncertain tax positions that require financial statement recognition.
Deferred tax assets and liabilities are recognized for the expected future tax consequences of differences between the carrying amount of assets and liabilities and their respective tax basis using currently enacted tax rates. The effect on deferred tax assets and liabilities of a change in tax rates is recognized in income in the period when the change is enacted. Deferred tax assets are reduced by a valuation allowance when it is more likely than not that some portion or all of the deferred tax assets will not be realized.
Non-Controlling Interests
For entities that are consolidated, but not 100% owned, a portion of the income or loss and corresponding equity is allocated to owners other than Apollo. The aggregate of the income or loss and corresponding equity that is not owned by the Company is included in Non-Controlling Interests in the
consolidated
financial statements. The Non-Controlling Interests relating to Apollo Global Management, LLC primarily include the ownership interest in the Apollo Operating Group held by the Managing Partners and Contributing Partners through their limited partner interests in Holdings and other ownership interests in consolidated entities. Non-Controlling Interests also include limited partner interests of Apollo managed funds in certain consolidated VIEs.
Non-Controlling Interests are presented as a separate component of shareholders’ equity on the Company’s
consolidated
statements of financial condition. The primary components of Non-Controlling Interests are separately presented in the Company’s
consolidated
statements of changes in shareholders’ equity to clearly distinguish the interest in the Apollo Operating Group and other ownership interests in the consolidated entities. Net income includes the net income attributable to the holders of Non-Controlling Interests on the Company’s
consolidated
statements of operations. Profits and losses are allocated to Non-Controlling Interests in proportion to their relative ownership interests regardless of their basis.
Net Income Per Class A Share
As Apollo has issued participating securities, U.S. GAAP requires use of the two-class method of computing earnings per share for all periods presented for each class of common stock and participating security as if all earnings for the period had been distributed. Under the two-class method, during periods of net income, the net income is first reduced for distributions declared on all classes of securities to arrive at undistributed earnings. During periods of net losses, the net loss is reduced for distributions declared on participating securities only if the security has the right to participate in the earnings of the entity and an objectively determinable contractual obligation to share in net losses of the entity. Participating securities include vested and unvested RSUs that participate in distributions, as well as unvested restricted shares.
Whether during a period of net income or net loss, under the two-class method the remaining earnings are allocated to Class A shares and participating securities to the extent that each security shares in earnings as if all of the earnings for the period had been distributed. Earnings or losses allocated to each class of security are then divided by the applicable weighted average outstanding shares to arrive at basic earnings per share. For the diluted earnings, the denominator includes all outstanding Class A shares and includes the number of additional Class A shares that would have been outstanding if the dilutive potential Class A shares had been issued. The numerator is adjusted for any changes in income or loss that would result from the issuance of these potential Class A shares.
Comprehensive Income (Loss)
U.S. GAAP guidance establishes standards for reporting comprehensive income and its components in a financial statement that is displayed with the same prominence as other financial statements. U.S. GAAP requires that the Company classify items of other comprehensive income (loss) (“OCI”) by their nature in the financial statements and display the accumulated balance of OCI separately in the shareholders’ equity section of the Company’s consolidated statements of financial condition. Comprehensive income (loss) consists of net income and OCI. Apollo’s OCI is primarily comprised of foreign currency translation adjustments associated with the Company's non-U.S. dollar denominated subsidiaries.
Use of Estimates
The preparation of the
consolidated
financial statements requires management to make estimates and assumptions that affect the reported amounts of assets and liabilities at the date of the
consolidated
financial statements, the disclosure of contingent assets and liabilities at the date of the
consolidated
financial statements and the reported amounts of revenues and expenses during the reporting periods. Apollo’s most significant estimates include goodwill, intangible assets, income taxes,
-
166
-
APOLLO GLOBAL MANAGEMENT, LLC
NOTES TO CONSOLIDATED
FINANCIAL STATEMENTS
(dollars in thousands, except share data, except where noted)
performance allocations, incentive fees, contingent consideration obligation related to an acquisition, non-cash compensation, and fair value of investments and debt. Actual results could differ materially from those estimates.
Recent Accounting Pronouncements
Recently Issued Accounting Standards Adopted in 2018
In November 2016, the Financial Accounting Standards Board (“FASB”) issued guidance to reduce diversity in practice in the classification and presentation of changes in restricted cash on the statements of cash flows. The new guidance requires that a statement of cash flows explain the change during the period in the total of cash, cash equivalents, and amounts generally described as restricted cash. Entities are also required to reconcile such total to amounts on the Company’s
consolidated
statements of financial condition and disclose the nature of the restrictions. The Company adopted the standard beginning January 1, 2018 using a retrospective transition method to each period presented. Upon adoption of this standard restricted, cash and cash and cash equivalents held at consolidated VIEs are included within the beginning of period and end of period balances in the Company’s
consolidated
statements of cash flows. Refer to the Company’s
consolidated
statements of cash flows for the impact of this standard.
In January 2017, the FASB issued guidance that changes the definition of a business with the objective of adding guidance to assist companies with evaluating whether transactions should be accounted for as acquisitions (or disposals) of assets or businesses. The Company adopted the standard beginning January 1, 2018. The adoption of this standard did not have an impact on the
consolidated
financial statements of the Company.
In June 2018, the FASB issued guidance which generally aligns the measurement and classification for share-based payments to non-employees with the accounting guidance for share-based payments to employees. Among other requirements, the new guidance requires equity-classified non-employee share-based payment awards to be measured at the grant date, rather than remeasured to fair value at the end of each reporting period. The guidance is effective for public business entities on January 1, 2019, however early adoption is permitted. The Company early adopted this standard retroactive to January 1, 2018 and the impact of this guidance was not material to the
consolidated
financial statements.
In August 2018, the FASB issued guidance which changes the fair value disclosure requirements. The guidance includes new fair value disclosure requirements and eliminates and modifies certain other fair value disclosure requirements. Among other requirements, the guidance requires the following new disclosures: (i) disclosure of changes in unrealized gains or losses included in other comprehensive income for recurring Level III fair value measurements held at the end of the reporting period and (ii) a description of how the weighted average used to develop significant unobservable inputs for Level III fair value measurements was calculated. The guidance eliminates the following disclosure requirements: (i) disclosure of the amount and reason for transfers between Level I and Level II and (ii) disclosure of the policy for timing of transfers between levels of the fair value hierarchy. The guidance is effective for all entities for interim and annual periods beginning after December 15, 2019. Early adoption is permitted for any eliminated or modified disclosure requirements upon issuance of the guidance. The Company early adopted the eliminated and modified disclosure requirements upon issuance of the guidance during the three month period ended September 30, 2018 and will adopt the new disclosure requirements upon their effective date. Eliminated disclosures have been applied retroactively to all periods presented.
Recently Issued Accounting Standards Effective on January 1, 2019
In February 2016, the FASB issued guidance that amends the accounting for leases. The amended guidance requires recognition of a right-of-use lease asset and a lease liability by lessees for leases classified as operating leases. The lease liability represents the aggregate discounted amount of the Company’s minimum future lease payments under lease obligations. The right-of-use asset represents the right to use the underlying asset over the lease term. The Company will adopt the guidance in the first quarter of 2019 under the simplified transition method. The simplified transition method allows companies to forgo the comparative reporting requirements initially required under the modified retrospective transition approach and apply the new guidance prospectively. The Company expects to elect to use the practical expedients under which the Company would not need to reassess whether an arrangement is or contains a lease, lease classification, and the accounting for initial direct costs. The Company does not expect the adoption to have a material impact on the consolidated statements of operations because the Company’s leases are classified as operating leases, which under the guidance will continue to be recognized as expense on a straight-line basis. The adoption, however, will result in an increase in total assets and total liabilities on the consolidated statements of financial condition. As of December 31, 2018, the lease liability is estimated to be between approximately
$110 million
to
$125 million
which is the primary determinant of the right-of-use lease asset. The Company also has additional operating leases for office space that have not yet commenced as of December 31, 2018, which include additional undiscounted minimum future lease payments of
-
167
-
APOLLO GLOBAL MANAGEMENT, LLC
NOTES TO CONSOLIDATED
FINANCIAL STATEMENTS
(dollars in thousands, except share data, except where noted)
approximately
$331 million
. These operating leases are expected to commence between fiscal year 2019 and fiscal year 2021 with lease terms of approximately
15 years
.
Recently Issued Accounting Standards Effective on January 1, 2020
In January 2017, the FASB issued guidance to simplify the test for goodwill impairment. The new guidance removes the requirement to perform a hypothetical purchase price allocation to measure goodwill impairment (Step 2). Under the new guidance, a goodwill impairment is calculated as the amount by which a reporting unit’s carrying value exceeds its fair value, not to exceed the carrying amount of goodwill in the reporting unit. The guidance is effective for annual or any interim goodwill impairment tests in fiscal years beginning after December 15, 2019, and should be performed prospectively. Early adoption is permitted for interim or annual goodwill impairment tests performed after January 1, 2017. The guidance is not expected to have a material impact on the
consolidated
financial statements of the Company.
3
. GOODWILL AND INTANGIBLE ASSETS
The carrying value of goodwill was
$88.9 million
as of December 31,
2018
and
2017
. Goodwill primarily relates to the 2007 Reorganization and the Company’s acquisition of Stone Tower Capital LLC and its related management companies (“Stone Tower”) in 2012. As of December 31,
2018
and
2017
, there was,
$64.8 million
,
$23.1 million
and
$1.0 million
of goodwill related to the credit, private equity and real asset segments, respectively.
Intangible assets, net consists of the following:
|
As of December 31,
|
|||||||
|
2018
|
2017
|
||||||
|
Finite-lived intangible assets/management contracts
|
$
|
254,295
|
|
$
|
248,609
|
|
|
|
Accumulated amortization
|
(235,396
|
)
|
(229,767
|
)
|
|||
|
Intangible assets, net
|
$
|
18,899
|
|
$
|
18,842
|
|
|
The changes in intangible assets, net consist of the following and includes approximately
$1.0 million
of indefinite-lived intangible assets as of both December 31,
2018
and
2017
.
|
For the Years Ended December 31,
|
|||||||||||
|
2018
|
2017
|
2016
|
|||||||||
|
Balance, beginning of year
|
$
|
18,842
|
|
$
|
22,721
|
|
$
|
28,620
|
|
||
|
Amortization expense
|
(5,629
|
)
|
(6,428
|
)
|
(9,095
|
)
|
|||||
|
Acquisitions / additions
|
5,686
|
|
2,549
|
|
3,196
|
|
|||||
|
Balance, end of year
|
$
|
18,899
|
|
$
|
18,842
|
|
$
|
22,721
|
|
||
Expected amortization of these intangible assets for each of the next 5 years and thereafter is as follows:
|
2019
|
2020
|
2021
|
2022
|
2023
|
Thereafter
|
Total
|
|||||||||||||||||||||
|
Amortization of intangible assets
|
$
|
6,507
|
|
$
|
6,174
|
|
$
|
3,976
|
|
$
|
1,103
|
|
$
|
108
|
|
$
|
71
|
|
$
|
17,939
|
|
||||||
There was
no
impairment of indefinite lived intangible assets as of
December 31, 2018
and
2017
.
4
. INVESTMENTS
The following table represents Apollo’s investments:
|
As of
December 31, 2018 |
As of
December 31, 2017 |
||||||
|
Investments, at fair value
|
$
|
900,959
|
|
$
|
866,998
|
|
|
|
Equity method investments
|
909,471
|
|
863,906
|
|
|||
|
Performance allocations
|
912,182
|
|
1,828,930
|
|
|||
|
Total Investments
|
$
|
2,722,612
|
|
$
|
3,559,834
|
|
|
-
168
-
APOLLO GLOBAL MANAGEMENT, LLC
NOTES TO CONSOLIDATED
FINANCIAL STATEMENTS
(dollars in thousands, except share data, except where noted)
Investments, at Fair Value
Investments, at fair value, consist of investments for which the fair value option has been elected and primarily include the Company’s investment in Athene Holding and investments in debt of unconsolidated CLOs. Changes in the fair value related to these investments are presented in net gains (losses) from investment activities except for certain investments for which the Company is entitled to receive performance allocations. For those investments, changes in fair value are presented in principal investment income.
The Company’s equity investment in Athene Holding, for which the fair value option was elected, met the significance criteria as defined by the SEC as of
December 31, 2018
and
2017
. As such, the following tables present summarized financial information of Athene Holding:
|
|
As of December 31,
|
||||||
|
2018
|
2017
|
||||||
|
(in millions)
|
|||||||
|
Statements of Financial Condition
|
|||||||
|
Investments
|
$
|
89,340
|
|
$
|
82,062
|
|
|
|
Assets
|
125,505
|
|
100,161
|
|
|||
|
Liabilities
|
117,229
|
|
90,985
|
|
|||
|
Equity
|
8,276
|
|
9,176
|
|
|||
|
|
For the Years Ended December 31,
|
||||||||||
|
2018
|
2017
|
2016
|
|||||||||
|
Statements of Operations
|
|||||||||||
|
Revenues
|
$
|
6,543
|
|
$
|
8,727
|
|
$
|
4,105
|
|
||
|
Expenses
|
5,368
|
|
7,263
|
|
3,393
|
|
|||||
|
Income before income tax provision (benefit)
|
1,175
|
|
1,464
|
|
712
|
|
|||||
|
Income tax provision (benefit)
|
122
|
|
106
|
|
(61
|
)
|
|||||
|
Net income
|
$
|
1,053
|
|
$
|
1,358
|
|
$
|
773
|
|
||
Net Gains (Losses) from Investment Activities
The following table presents the realized and net change in unrealized gains (losses) reported in net gains (losses) from investment activities:
|
|
For the Years Ended December 31,
|
||||||||||
|
|
2018
|
2017
|
2016
|
||||||||
|
Realized gains on sales of investments, net
|
$
|
67
|
|
$
|
103
|
|
$
|
400
|
|
||
|
Net change in unrealized gains (losses) due to changes in fair value
|
(186,516
|
)
|
95,001
|
|
139,321
|
|
|||||
|
Net gains (losses) from investment activities
|
$
|
(186,449
|
)
|
$
|
95,104
|
|
$
|
139,721
|
|
||
Equity Method Investments
Apollo’s equity method investments include its investments in the credit, private equity and real assets funds it manages, which are not consolidated, but in which the Company exerts significant influence. Apollo’s share of net income generated by these investments is recorded in principal investment income in the
consolidated
statements of operations.
-
169
-
APOLLO GLOBAL MANAGEMENT, LLC
NOTES TO CONSOLIDATED
FINANCIAL STATEMENTS
(dollars in thousands, except share data, except where noted)
Equity method investments consisted of the following:
|
|
Equity Held as of
|
|||||||
|
|
December 31, 2018
|
(4)
|
December 31, 2017
|
(4)
|
||||
|
Credit
(2)
|
$
|
396,384
|
|
$
|
325,267
|
|
||
|
Private Equity
(1)
|
473,657
|
|
509,707
|
|
||||
|
Real Assets
|
39,430
|
|
28,932
|
|
||||
|
Total equity method investments
(3)
|
$
|
909,471
|
|
$
|
863,906
|
|
||
|
(1)
|
The equity method investment in Fund VIII was
$356.6 million
and
$385.7 million
as of
December 31, 2018 and 2017
, respectively, representing an ownership percentage of
2.2%
and
2.2%
as of
December 31, 2018 and 2017
, respectively.
|
|
(2)
|
The equity method investment in AINV was
$53.9 million
and
$56.5 million
as of
December 31, 2018 and 2017
, respectively. The value of the Company’s investment in AINV was
$36.7 million
and
$50.2 million
based on the quoted market price of AINV as of
December 31, 2018 and 2017
, respectively.
|
|
(3)
|
Certain funds invest across multiple segments. The presentation in the table above is based on the classification of the majority of such funds’ investments.
|
|
(4)
|
Some amounts included are a quarter in arrears.
|
The tables below present summarized financial information of the Company’s equity method investments in aggregate:
|
|
Credit
|
Private Equity
|
Real Assets
|
Aggregate Totals
|
|||||||||||||||||||||||||||
|
|
As of
December 31, |
As of
December 31, |
As of
December 31, |
As of
December 31, |
|||||||||||||||||||||||||||
|
Statement of Financial Condition
|
2018
(1)
|
2017
(1)
|
2018
(1)
|
2017
(1)
|
2018
(1)
|
2017
(1)
|
2018
(1)
|
2017
(1)
|
|||||||||||||||||||||||
|
Investments
|
$
|
35,114,212
|
|
$
|
22,829,749
|
|
$
|
23,479,794
|
|
$
|
26,967,402
|
|
$
|
6,247,916
|
|
$
|
4,676,444
|
|
$
|
64,841,922
|
|
$
|
54,473,595
|
|
|||||||
|
Assets
|
38,570,948
|
|
25,300,139
|
|
24,498,401
|
|
27,936,030
|
|
6,640,389
|
|
4,854,334
|
|
69,709,738
|
|
58,090,503
|
|
|||||||||||||||
|
Liabilities
|
18,583,397
|
|
5,819,426
|
|
524,846
|
|
133,870
|
|
2,723,138
|
|
2,066,612
|
|
21,831,381
|
|
8,019,908
|
|
|||||||||||||||
|
Equity
|
19,987,551
|
|
19,480,713
|
|
23,973,555
|
|
27,802,160
|
|
3,917,251
|
|
2,787,722
|
|
47,878,357
|
|
50,070,595
|
|
|||||||||||||||
|
Credit
|
Private Equity
|
Real Assets
|
Aggregate Totals
|
||||||||||||||||||||||||||||||||||||||||||||
|
For the Years Ended
December 31, |
For the Years Ended
December 31, |
For the Years Ended
December 31, |
For the Years Ended
December 31, |
||||||||||||||||||||||||||||||||||||||||||||
|
Statement of Operations
|
2018
(1)
|
2017
(1)
|
2016
(1)
|
2018
(1)
|
2017
(1)
|
2016
(1)
|
2018
(1)
|
2017
(1)
|
2016
(1)
|
2018
(1)
|
2017
(1)
|
2016
(1)
|
|||||||||||||||||||||||||||||||||||
|
Revenues/Investment Income
|
$
|
1,546,880
|
|
$
|
1,774,987
|
|
$
|
1,384,414
|
|
$
|
445,249
|
|
$
|
726,464
|
|
$
|
235,231
|
|
$
|
414,313
|
|
$
|
280,440
|
|
$
|
215,738
|
|
$
|
2,406,442
|
|
$
|
2,781,891
|
|
$
|
1,835,383
|
|
|||||||||||
|
Expenses
|
1,351,556
|
|
700,660
|
|
483,335
|
|
571,689
|
|
311,171
|
|
298,705
|
|
221,908
|
|
65,141
|
|
66,869
|
|
2,145,153
|
|
1,076,972
|
|
848,909
|
|
|||||||||||||||||||||||
|
Net Investment Income (Loss)
|
195,324
|
|
1,074,327
|
|
901,079
|
|
(126,440
|
)
|
415,293
|
|
(63,474
|
)
|
192,405
|
|
215,299
|
|
148,869
|
|
261,289
|
|
1,704,919
|
|
986,474
|
|
|||||||||||||||||||||||
|
Net Realized and Unrealized Gain (Loss)
|
(179,024
|
)
|
1,000,922
|
|
1,033,550
|
|
(2,990,133
|
)
|
5,728,099
|
|
2,999,627
|
|
38,694
|
|
45,455
|
|
21,193
|
|
(3,130,463
|
)
|
6,774,476
|
|
4,054,370
|
|
|||||||||||||||||||||||
|
Net Income (Loss)
|
$
|
16,300
|
|
$
|
2,075,249
|
|
$
|
1,934,629
|
|
$
|
(3,116,573
|
)
|
$
|
6,143,392
|
|
$
|
2,936,153
|
|
$
|
231,099
|
|
$
|
260,754
|
|
$
|
170,062
|
|
$
|
(2,869,174
|
)
|
$
|
8,479,395
|
|
$
|
5,040,844
|
|
|||||||||||
|
(1)
|
Certain credit, private equity and real assets fund amounts are as of and for the twelve months ended
September 30, 2018
,
2017
and
2016
and exclude amounts related to Athene Holding.
|
Performance Allocations
Performance allocations from credit, private equity and real assets funds consisted of the following:
|
As of December 31, 2018
|
As of December 31, 2017
|
||||||
|
Credit
|
$
|
374,541
|
|
$
|
395,340
|
|
|
|
Private Equity
|
514,350
|
|
1,404,777
|
|
|||
|
Real Assets
|
23,291
|
|
28,813
|
|
|||
|
Total performance allocations
|
$
|
912,182
|
|
$
|
1,828,930
|
|
|
-
170
-
APOLLO GLOBAL MANAGEMENT, LLC
NOTES TO CONSOLIDATED
FINANCIAL STATEMENTS
(dollars in thousands, except share data, except where noted)
The table below provides a roll forward of the performance allocations balance:
|
Credit
|
Private Equity
|
Real Assets
|
Total
|
||||||||||||
|
Performance allocations, January 1, 2017
|
$
|
372,205
|
|
$
|
798,465
|
|
$
|
32,526
|
|
$
|
1,203,196
|
|
|||
|
Change in fair value of funds
|
212,768
|
|
1,050,141
|
|
13,283
|
|
1,276,192
|
|
|||||||
|
Fund distributions to the Company
|
(189,633
|
)
|
(443,829
|
)
|
(16,996
|
)
|
(650,458
|
)
|
|||||||
|
Performance allocations, December 31, 2017
|
$
|
395,340
|
|
$
|
1,404,777
|
|
$
|
28,813
|
|
$
|
1,828,930
|
|
|||
|
Change in fair value of funds
|
93,312
|
|
(444,476
|
)
|
1,730
|
|
(349,434
|
)
|
|||||||
|
Fund distributions to the Company
|
(114,111
|
)
|
(445,951
|
)
|
(1)
|
(7,252
|
)
|
(567,314
|
)
|
||||||
|
Performance allocations, December 31, 2018
|
$
|
374,541
|
|
$
|
514,350
|
|
$
|
23,291
|
|
$
|
912,182
|
|
|||
|
(1)
|
Includes realized performance allocations of
$169.9 million
from AP Alternative Assets, L.P. (“AAA”), settled in the form of shares of Athene Holding.
|
The change in fair value of funds excludes the reversal of previously realized performance allocations due to the general partner obligation to return previously distributed performance allocations, which is recorded in due to related parties in the consolidated statements of financial condition. See note
14
for further disclosure regarding the general partner obligation.
The timing of the payment of performance allocations due to the general partner or investment manager varies depending on the terms of the applicable fund agreements. Generally, performance allocations with respect to the private equity funds and certain credit and real assets funds are payable and are distributed to the fund’s general partner upon realization of an investment if the fund’s cumulative returns are in excess of the preferred return.
5
. PROFIT SHARING PAYABLE
Profit sharing payable consisted of the following:
|
As of December 31, 2018
|
As of December 31, 2017
|
||||||
|
Credit
|
$
|
239,525
|
|
$
|
265,791
|
|
|
|
Private Equity
|
201,607
|
|
475,556
|
|
|||
|
Real Assets
|
11,009
|
|
10,929
|
|
|||
|
Total profit sharing payable
|
$
|
452,141
|
|
$
|
752,276
|
|
|
The table below provides a roll forward of the profit sharing payable balance:
|
Credit
|
Private Equity
|
Real Assets
|
Total
|
||||||||||||
|
Profit sharing payable, January 1, 2017
|
$
|
268,855
|
|
$
|
268,170
|
|
$
|
13,123
|
|
$
|
550,148
|
|
|||
|
Profit sharing expense
|
104,475
|
|
402,963
|
|
5,544
|
|
512,982
|
|
|||||||
|
Payments/other
|
(107,539
|
)
|
(195,577
|
)
|
(7,738
|
)
|
(310,854
|
)
|
|||||||
|
Profit sharing payable, December 31, 2017
|
$
|
265,791
|
|
$
|
475,556
|
|
$
|
10,929
|
|
$
|
752,276
|
|
|||
|
Profit sharing expense
|
60,279
|
|
(91,088
|
)
|
2,785
|
|
(28,024
|
)
|
|||||||
|
Payments/other
(1)
|
(86,545
|
)
|
(182,861
|
)
|
(2)
|
(2,705
|
)
|
(272,111
|
)
|
||||||
|
Profit sharing payable, December 31, 2018
|
$
|
239,525
|
|
$
|
201,607
|
|
$
|
11,009
|
|
$
|
452,141
|
|
|||
|
(1)
|
Includes
$10.6 million
associated with the adoption of new revenue recognition accounting guidance, as discussed in note
2
.
|
|
(2)
|
Includes
$46.6 million
associated with profit sharing expense related to AAA that was settled in the form of shares of Athene Holding.
|
Profit sharing expense includes (i) changes in amounts payable to employees and former employees entitled to a share of performance revenues in Apollo’s funds and (ii) changes to the fair value of the contingent consideration obligations recognized in connection with certain Apollo acquisitions. Profit sharing expense excludes the potential return of profit sharing distributions that would be due if certain funds were liquidated, which is recorded in due from related parties in the consolidated statements of financial condition. See note
14
for further disclosure regarding the potential return of profit sharing distributions.
-
171
-
APOLLO GLOBAL MANAGEMENT, LLC
NOTES TO CONSOLIDATED
FINANCIAL STATEMENTS
(dollars in thousands, except share data, except where noted)
As discussed in note
2
, under certain profit sharing arrangements, the Company requires that a portion of certain of the performance revenues distributed to its employees be used to purchase Class A restricted shares issued under its 2007 Equity Plan. Prior to distribution of the performance revenues, the Company records the value of the equity-based awards expected to be granted in other assets and other liabilities within the
consolidated
statements of financial condition. See note
8
for further disclosure regarding deferred equity-based compensation.
6
. VARIABLE INTEREST ENTITIES
As described in note
2
, the Company consolidates entities that are VIEs for which the Company has been designated as the primary beneficiary. There is no recourse to the Company for the consolidated VIEs’ liabilities.
Consolidated Variable Interest Entities
Apollo has consolidated VIEs in accordance with the policy described in note
2
. Through its role as investment manager of these VIEs, the Company determined that Apollo has the power to direct the activities that most significantly impact the economic performance of these VIEs. Additionally, Apollo determined that its interests, both directly and indirectly from these VIEs, represent rights to returns that could potentially be significant to such VIEs. As a result, Apollo determined that it is the primary beneficiary and therefore should consolidate the VIEs.
Certain CLOs are consolidated by Apollo as the Company is considered to hold a controlling financial interest through direct and indirect interests in these CLOs exclusive of management and performance-based fees received. Through its role as collateral manager of these VIEs, the Company determined that Apollo has the power to direct the activities that most significantly impact the economic performance of these VIEs. These CLOs were formed for the sole purpose of issuing collateralized notes to investors. The assets of these VIEs are primarily comprised of senior secured loans and the liabilities are primarily comprised of debt.
The assets of consolidated CLOs are not available to creditors of the Company. In addition, the investors in these consolidated CLOs have no recourse against the assets of the Company. The Company measures both the financial assets and the financial liabilities of the CLOs using the fair value of the financial assets as further described in note
2
. The Company has elected the fair value option for financial instruments held by its consolidated CLOs, which includes investments in loans and corporate bonds, as well as debt obligations and contingent obligations held by such consolidated CLOs. Other assets include amounts due from brokers and interest receivables. Other liabilities include payables for securities purchased, which represent open trades within the consolidated CLOs and primarily relate to corporate loans that are expected to settle within
60 days
. As of
December 31, 2018
and
December 31, 2017
, the Company held investments of
$44.2 million
and
$47.2 million
, respectively, in consolidated foreign currency denominated CLOs, which eliminate in consolidation.
Net Gains from Investment Activities of Consolidated Variable Interest Entities
The following table presents net gains from investment activities of the consolidated VIEs:
|
|
For the Years Ended December 31,
|
|||||||||||
|
|
2018
|
(1)
|
2017
|
(1)
|
2016
|
(1)
|
||||||
|
Net gains from investment activities
|
$
|
23,922
|
|
$
|
7,960
|
|
$
|
10,334
|
|
|||
|
Net gains (losses) from debt
|
16,875
|
|
6,416
|
|
(11,921
|
)
|
||||||
|
Interest and other income
|
35,612
|
|
35,154
|
|
41,791
|
|
||||||
|
Interest and other expenses
|
(31,297
|
)
|
(38,865
|
)
|
(35,189
|
)
|
||||||
|
Net gains from investment activities of consolidated variable interest entities
|
$
|
45,112
|
|
$
|
10,665
|
|
$
|
5,015
|
|
|||
|
(1)
|
Amounts reflect consolidation eliminations.
|
-
172
-
APOLLO GLOBAL MANAGEMENT, LLC
NOTES TO CONSOLIDATED
FINANCIAL STATEMENTS
(dollars in thousands, except share data, except where noted)
Senior Secured Notes, Subordinated Notes and Secured Borrowings
Included within debt are amounts due to third-party institutions by the consolidated VIEs. The following table summarizes the principal provisions of the debt of the consolidated VIEs:
|
|
As of December 31, 2018
|
As of December 31, 2017
|
|||||||||||||||
|
|
Principal Outstanding
|
Weighted Average Interest Rate
|
Weighted Average Remaining Maturity in Years
|
Principal Outstanding
|
Weighted Average Interest Rate
|
Weighted Average Remaining Maturity in Years
|
|||||||||||
|
Senior Secured Notes
(2)
|
$
|
768,860
|
|
1.67
|
%
|
11.2
|
$
|
806,603
|
|
1.68
|
%
|
12.2
|
|||||
|
Subordinated Notes
(2)
|
95,686
|
|
N/A
|
|
(1)
|
21.4
|
100,188
|
|
N/A
|
|
(1)
|
22.4
|
|||||
|
Secured Borrowings
(2)(3)
|
18,976
|
|
3.42
|
%
|
8.8
|
109,438
|
|
2.70
|
%
|
9.3
|
|||||||
|
Total
|
$
|
883,522
|
|
$
|
1,016,229
|
|
|||||||||||
|
(1)
|
The subordinated notes do not have contractual interest rates but instead receive distributions from the excess cash flows of the VIEs.
|
|
(2)
|
The debt of the consolidated VIEs is collateralized by assets of the consolidated VIEs and assets of one vehicle may not be used to satisfy the liabilities of another vehicle. The fair value of the debt and collateralized assets of the Senior Secured Notes, Subordinated Notes and Secured Borrowings are presented below:
|
|
As of December 31, 2018
|
As of December 31, 2017
|
||||||
|
Debt, at fair value
|
$
|
855,461
|
|
$
|
1,002,063
|
|
|
|
Collateralized assets
|
$
|
1,290,891
|
|
$
|
1,328,586
|
|
|
|
(3)
|
Secured borrowings consist of a consolidated VIE’s obligation through a repurchase agreement redeemable at maturity with a third party lender. The fair value of the secured borrowings as of
December 31, 2018
and
December 31, 2017
was
$19.0 million
and
$109.4 million
, respectively.
|
The consolidated VIEs’ debt obligations contain various customary loan covenants. As of
December 31, 2018
, the Company was
not
aware of any instances of non-compliance with any of these covenants.
As of
December 31, 2018
, the contractual maturities for debt of the consolidated VIEs is greater than 5 years.
Variable Interest Entities Which are Not Consolidated
The Company holds variable interests in certain VIEs which are not consolidated, as it has been determined that Apollo is not the primary beneficiary.
-
173
-
APOLLO GLOBAL MANAGEMENT, LLC
NOTES TO CONSOLIDATED
FINANCIAL STATEMENTS
(dollars in thousands, except share data, except where noted)
The following table presents the carrying amounts of the assets and liabilities of the VIEs for which Apollo has concluded that it holds a significant variable interest, but that it is not the primary beneficiary. In addition, the table presents the maximum exposure to losses relating to these VIEs.
|
As of
December 31, 2018 |
As of
December 31, 2017 |
||||||
|
Assets:
|
|||||||
|
Cash
|
$
|
404,660
|
|
$
|
254,791
|
|
|
|
Investments
|
4,919,118
|
|
6,230,397
|
|
|||
|
Receivables
|
126,873
|
|
36,601
|
|
|||
|
Total Assets
|
$
|
5,450,651
|
|
$
|
6,521,789
|
|
|
|
Liabilities:
|
|||||||
|
Debt and other payables
|
$
|
3,673,219
|
|
$
|
3,285,263
|
|
|
|
Total Liabilities
|
$
|
3,673,219
|
|
$
|
3,285,263
|
|
|
|
Apollo Exposure
(1)
|
$
|
244,894
|
|
$
|
252,605
|
|
|
|
(1)
|
Represents Apollo’s direct investment in those entities in which Apollo holds a significant variable interest and certain other investments. Additionally, cumulative performance allocations are subject to reversal in the event of future losses, as discussed in note
15
.
|
7
. FAIR VALUE MEASUREMENTS OF FINANCIAL INSTRUMENTS
The following tables summarize the Company’s financial assets and financial liabilities recorded at fair value by fair value hierarchy level:
|
|
As of December 31, 2018
|
||||||||||||||||||
|
Level I
|
Level II
|
Level III
|
Total
|
Cost
|
|||||||||||||||
|
Assets
|
|||||||||||||||||||
|
U.S. Treasury securities, at fair value
|
$
|
392,932
|
|
$
|
—
|
|
$
|
—
|
|
$
|
392,932
|
|
$
|
390,336
|
|
||||
|
Investments, at fair value:
|
|||||||||||||||||||
|
Investment in Athene Holding
|
761,807
|
|
—
|
|
—
|
|
761,807
|
|
592,572
|
|
|||||||||
|
Other investments
|
—
|
|
42,782
|
|
96,370
|
|
(1)
|
139,152
|
|
124,379
|
|
||||||||
|
Total investments, at fair value
|
761,807
|
|
42,782
|
|
96,370
|
|
900,959
|
|
716,951
|
|
|||||||||
|
Investments of VIEs, at fair value
|
—
|
|
877,427
|
|
295,987
|
|
1,173,414
|
|
|
|
|||||||||
|
Investments of VIEs, valued using NAV
|
—
|
|
—
|
|
—
|
|
2,263
|
|
|||||||||||
|
Total investments of VIEs, at fair value
|
—
|
|
877,427
|
|
295,987
|
|
1,175,677
|
|
|||||||||||
|
Derivative assets
(2)
|
—
|
|
388
|
|
—
|
|
388
|
|
|||||||||||
|
Total Assets
|
$
|
1,154,739
|
|
$
|
920,597
|
|
$
|
392,357
|
|
$
|
2,469,956
|
|
|||||||
|
Liabilities
|
|||||||||||||||||||
|
Liabilities of VIEs, at fair value
|
$
|
—
|
|
$
|
855,461
|
|
$
|
—
|
|
$
|
855,461
|
|
|||||||
|
Contingent consideration obligations
(3)
|
—
|
|
—
|
|
74,487
|
|
74,487
|
|
|||||||||||
|
Derivative liabilities
(2)
|
—
|
|
681
|
|
—
|
|
681
|
|
|||||||||||
|
Total Liabilities
|
$
|
—
|
|
$
|
856,142
|
|
$
|
74,487
|
|
$
|
930,629
|
|
|||||||
-
174
-
APOLLO GLOBAL MANAGEMENT, LLC
NOTES TO CONSOLIDATED
FINANCIAL STATEMENTS
(dollars in thousands, except share data, except where noted)
|
|
As of December 31, 2017
|
||||||||||||||||||
|
Level I
|
Level II
|
Level III
|
Total
|
Cost
|
|||||||||||||||
|
Assets
|
|||||||||||||||||||
|
U.S. Treasury securities, at fair value
|
$
|
364,649
|
|
$
|
—
|
|
$
|
—
|
|
$
|
364,649
|
|
$
|
363,812
|
|
||||
|
Investments, at fair value:
|
|||||||||||||||||||
|
Investment in Athene Holding
|
—
|
|
802,985
|
|
—
|
|
802,985
|
|
387,526
|
|
|||||||||
|
Other investments
|
205
|
|
28,107
|
|
35,701
|
|
64,013
|
|
61,179
|
|
|||||||||
|
Total investments, at fair value
|
205
|
|
831,092
|
|
35,701
|
|
866,998
|
|
448,705
|
|
|||||||||
|
Investments of VIEs, at fair value
|
—
|
|
1,058,999
|
|
132,348
|
|
1,191,347
|
|
|||||||||||
|
Investments of VIEs, valued using NAV
|
—
|
|
—
|
|
—
|
|
4,843
|
|
|||||||||||
|
Total investments of VIEs, at fair value
|
—
|
|
1,058,999
|
|
132,348
|
|
1,196,190
|
|
|||||||||||
|
Derivative assets
(2)
|
—
|
|
478
|
|
—
|
|
478
|
|
|||||||||||
|
Total Assets
|
$
|
364,854
|
|
$
|
1,890,569
|
|
$
|
168,049
|
|
$
|
2,428,315
|
|
|||||||
|
Liabilities
|
|||||||||||||||||||
|
Liabilities of VIEs, at fair value
|
$
|
—
|
|
$
|
1,002,063
|
|
$
|
12,620
|
|
$
|
1,014,683
|
|
|||||||
|
Contingent consideration obligations
(3)
|
—
|
|
—
|
|
92,600
|
|
92,600
|
|
|||||||||||
|
Derivative liabilities
(2)
|
—
|
|
1,537
|
|
—
|
|
1,537
|
|
|||||||||||
|
Total Liabilities
|
$
|
—
|
|
$
|
1,003,600
|
|
$
|
105,220
|
|
$
|
1,108,820
|
|
|||||||
|
(1)
|
Other investments excludes
$17.0 million
of performance allocations classified as Level III related to certain investments for which the Company has elected the fair value option. The Company’s policy is to account for performance allocations as investments.
|
|
(2)
|
Derivative assets and derivative liabilities are presented as a component of Other assets and Other liabilities, respectively, in the
consolidated
statements of financial condition.
|
|
(3)
|
Profit sharing payable includes contingent obligations classified as Level III.
|
The following tables summarize the changes in financial assets measured at fair value for which Level III inputs have been used to determine fair value:
|
|
For the Year Ended December 31, 2018
|
||||||||||
|
Other Investments
|
Investments of Consolidated VIEs
|
Total
|
|||||||||
|
Balance, Beginning of Period
|
$
|
35,701
|
|
$
|
132,348
|
|
$
|
168,049
|
|
||
|
Purchases
|
112,645
|
|
151,877
|
|
264,522
|
|
|||||
|
Sale of investments/distributions
|
(49,288
|
)
|
(17,000
|
)
|
(66,288
|
)
|
|||||
|
Net realized losses
|
(106
|
)
|
(1,084
|
)
|
(1,190
|
)
|
|||||
|
Changes in net unrealized gains
|
12,683
|
|
45,506
|
|
58,189
|
|
|||||
|
Cumulative translation adjustment
|
(591
|
)
|
(16,787
|
)
|
(17,378
|
)
|
|||||
|
Transfer into Level III
(1)
|
4,682
|
|
18,783
|
|
23,465
|
|
|||||
|
Transfer out of Level III
(1)
|
(19,356
|
)
|
(17,656
|
)
|
(37,012
|
)
|
|||||
|
Balance, End of Period
|
$
|
96,370
|
|
$
|
295,987
|
|
$
|
392,357
|
|
||
|
Change in net unrealized gains included in principal investment income related to investments still held at reporting date
|
$
|
12,618
|
|
$
|
—
|
|
$
|
12,618
|
|
||
|
Change in net unrealized gains included in net gains from investment activities of consolidated VIEs related to investments still held at reporting date
|
—
|
|
44,350
|
|
44,350
|
|
|||||
-
175
-
APOLLO GLOBAL MANAGEMENT, LLC
NOTES TO CONSOLIDATED
FINANCIAL STATEMENTS
(dollars in thousands, except share data, except where noted)
|
|
For the Year Ended December 31, 2017
|
||||||||||
|
Other Investments
|
Investments of Consolidated VIEs
|
Total
|
|||||||||
|
Balance, Beginning of Period
|
$
|
45,721
|
|
$
|
92,474
|
|
$
|
138,195
|
|
||
|
Purchases
|
12,760
|
|
116,674
|
|
129,434
|
|
|||||
|
Sale of investments/distributions
|
—
|
|
(70,740
|
)
|
(70,740
|
)
|
|||||
|
Net realized gains (losses)
|
(5
|
)
|
6,986
|
|
6,981
|
|
|||||
|
Changes in net unrealized gains (losses)
|
(607
|
)
|
4,592
|
|
3,985
|
|
|||||
|
Cumulative translation adjustment
|
5,939
|
|
6,759
|
|
12,698
|
|
|||||
|
Transfer into Level III
(1)
|
—
|
|
16,392
|
|
16,392
|
|
|||||
|
Transfer out of Level III
(1)
|
(28,107
|
)
|
(40,789
|
)
|
(68,896
|
)
|
|||||
|
Balance, End of Period
|
$
|
35,701
|
|
$
|
132,348
|
|
$
|
168,049
|
|
||
|
Change in net unrealized losses included in principal investment income related to investments still held at reporting date
|
$
|
(614
|
)
|
$
|
—
|
|
$
|
(614
|
)
|
||
|
Change in net unrealized gains included in net gains from investment activities of consolidated VIEs related to investments still held at reporting date
|
—
|
|
3,638
|
|
3,638
|
|
|||||
|
(1)
|
Transfers between Level II and III were a result of subjecting the broker quotes on these financial assets to various criteria which include the number and quality of broker quotes, the standard deviation of obtained broker quotes and the percentage deviation from independent pricing services.
|
The following table summarizes the changes in fair value in financial liabilities measured at fair value for which Level III inputs have been used to determine fair value:
|
|
For the Years Ended December 31,
|
||||||||||||||||||||||
|
|
2018
|
2017
|
|||||||||||||||||||||
|
Liabilities of Consolidated VIEs & Apollo Funds
|
Contingent Consideration Obligations
|
Total
|
Liabilities of Consolidated VIEs & Apollo Funds
|
Contingent Consideration Obligations
|
Total
|
||||||||||||||||||
|
Balance, Beginning of Period
|
$
|
12,620
|
|
$
|
92,600
|
|
$
|
105,220
|
|
$
|
11,055
|
|
$
|
106,282
|
|
$
|
117,337
|
|
|||||
|
Additions
|
—
|
|
—
|
|
—
|
|
(97
|
)
|
—
|
|
(97
|
)
|
|||||||||||
|
Payments
|
(12,620
|
)
|
(6,947
|
)
|
(19,567
|
)
|
94
|
|
(23,597
|
)
|
(23,503
|
)
|
|||||||||||
|
Net realized gains
|
—
|
|
—
|
|
—
|
|
10
|
|
—
|
|
10
|
|
|||||||||||
|
Changes in net unrealized (gains) losses
(1)
|
—
|
|
(11,166
|
)
|
(11,166
|
)
|
1,558
|
|
9,915
|
|
11,473
|
|
|||||||||||
|
Balance, End of Period
|
$
|
—
|
|
$
|
74,487
|
|
$
|
74,487
|
|
$
|
12,620
|
|
$
|
92,600
|
|
$
|
105,220
|
|
|||||
|
Change in net unrealized losses included in net gains from investment activities of consolidated VIEs related to liabilities still held at reporting date
|
$
|
—
|
|
$
|
—
|
|
$
|
—
|
|
$
|
1,565
|
|
$
|
—
|
|
$
|
1,565
|
|
|||||
|
(1)
|
Changes in fair value of contingent consideration obligations are recorded in profit sharing expense in the
consolidated
statements of operations.
|
-
176
-
APOLLO GLOBAL MANAGEMENT, LLC
NOTES TO CONSOLIDATED
FINANCIAL STATEMENTS
(dollars in thousands, except share data, except where noted)
The following tables summarize the quantitative inputs and assumptions used for financial assets and liabilities categorized as Level III under the fair value hierarchy:
|
|
As of December 31, 2018
|
||||||||||
|
Fair Value
|
Valuation Techniques
|
Unobservable Inputs
|
Ranges
|
Weighted Average
|
|||||||
|
Financial Assets
|
|||||||||||
|
Other investments
|
$
|
6,901
|
|
Third Party Pricing
|
N/A
|
N/A
|
N/A
|
||||
|
89,469
|
|
Discounted cash flow
|
Discount rate
|
15.0% - 16.0%
|
15.5%
|
||||||
|
Investments of consolidated VIEs:
|
|||||||||||
|
Corporate loans/bonds/CLO notes
|
4,116
|
|
Third party pricing
|
N/A
|
N/A
|
N/A
|
|||||
|
Equity securities
|
291,871
|
|
Book value multiple
|
Book value multiple
|
0.65x
|
0.65x
|
|||||
|
Discounted cash flow
|
Discount rate
|
15.2%
|
15.2%
|
||||||||
|
Total investments of consolidated VIEs
|
295,987
|
|
|||||||||
|
Total Financial Assets
|
$
|
392,357
|
|
||||||||
|
Financial Liabilities
|
|||||||||||
|
Contingent consideration obligation
|
$
|
74,487
|
|
Discounted cash flow
|
Discount rate
|
17.0%
|
17.0%
|
||||
|
Total Financial Liabilities
|
$
|
74,487
|
|
||||||||
|
|
As of December 31, 2017
|
||||||||||
|
Fair Value
|
Valuation Techniques
|
Unobservable Inputs
|
Ranges
|
Weighted Average
|
|||||||
|
Financial Assets
|
|||||||||||
|
Other investments
|
$
|
20,641
|
|
Third party pricing
|
N/A
|
N/A
|
N/A
|
||||
|
15,060
|
|
Cost
(1)
|
N/A
|
N/A
|
N/A
|
||||||
|
Investments of consolidated VIEs:
|
|||||||||||
|
Corporate loans/bonds/CLO notes
|
6,824
|
|
Third party pricing
|
N/A
|
N/A
|
N/A
|
|||||
|
Equity securities
|
125,524
|
|
Book value multiple
|
Book value multiple
|
0.71x
|
0.71x
|
|||||
|
Discounted cash flow
|
Discount rate
|
13.4%
|
13.4%
|
||||||||
|
Total investments of consolidated VIEs
|
132,348
|
|
|||||||||
|
Total Financial Assets
|
$
|
168,049
|
|
||||||||
|
Financial Liabilities
|
|||||||||||
|
Liabilities of consolidated VIEs
|
$
|
12,620
|
|
Other
|
N/A
|
N/A
|
N/A
|
||||
|
Contingent consideration obligation
|
92,600
|
|
Discounted cash flow
|
Discount rate
|
17.3%
|
17.3%
|
|||||
|
Total Financial Liabilities
|
$
|
105,220
|
|
||||||||
(1) The valuation technique used is cost as it approximates the fair value of the investment.
Fair Value Measurement of Investment in Athene Holding
As of
December 31, 2018
, the fair value of Apollo’s Level I investment in Athene Holding was calculated using the closing market price of Athene Holding shares of
$39.83
. As of
December 31, 2017
, the fair value of Apollo’s Level II investment in Athene Holding was estimated using the closing market price of Athene Holding shares of
$51.71
less a discount due to a lack of marketability (“DLOM”) of
4.0%
, as applicable. The DLOM was derived based on the average remaining lock up restrictions on the shares of Athene Holding held by Apollo (
11.3
months as of
December 31, 2017
) and the estimated volatility in such shares of Athene Holding. Due to the limited trading history in Athene Holding shares, the historical share price volatility of a representative set of Athene Holding’s publicly traded insurance peers was calculated over a period equivalent to the remaining average lock up on the shares of Athene Holding held by Apollo and used as a proxy to estimate the projected volatility in Athene Holding’s shares.
Discounted Cash Flow Model
When a discounted cash flow model is used to determine fair value, the significant input used in the valuation model is the discount rate applied to present value the projected cash flows. Increases in the discount rate can significantly lower the fair value of an investment and the contingent consideration obligations; conversely decreases in the discount rate can significantly increase the fair value of an investment and the contingent consideration obligations.
-
177
-
APOLLO GLOBAL MANAGEMENT, LLC
NOTES TO CONSOLIDATED
FINANCIAL STATEMENTS
(dollars in thousands, except share data, except where noted)
Consolidated VIEs
Investments
As of
December 31, 2018 and 2017
, the significant unobservable inputs used in the fair value measurement of the equity securities include the discount rate applied and the book value multiples applied in the valuation models. These unobservable inputs in isolation can cause significant increases or decreases in fair value. The discount rate is determined based on the market rates an investor would expect for a similar investment with similar risks. When a comparable multiple model is used to determine fair value, the comparable multiples are generally multiplied by the underlying companies’ earnings before interest, taxes, depreciation and amortization (“EBITDA”) to establish the total enterprise value of the company. The comparable multiple is determined based on the implied trading multiple of public industry peers.
Liabilities
As of
December 31, 2018 and 2017
, the debt obligations of the consolidated CLOs were measured on the basis of the fair value of the financial assets of the CLOs as the financial assets were determined to be more observable and, as a result, categorized as Level II in the fair value hierarchy.
Contingent Consideration Obligations
The significant unobservable input used in the fair value measurement of the contingent consideration obligations is the discount rate applied in the valuation models. This input in isolation can cause significant increases or decreases in fair value. The discount rate was based on the hypothetical cost of equity in connection with the acquisition of Stone Tower. See note
15
for further discussion of the contingent consideration obligations.
Valuation of Underlying Investments of Equity Method Investees
As discussed previously, the underlying entities that the Company manages and invests in are primarily investment companies which account for their investments at estimated fair value.
On a quarterly basis, Apollo utilizes valuation committees consisting of members from senior management, to review and approve the valuation results related to the investments of the funds it manages. For certain publicly traded vehicles managed by the Company, a review is performed by an independent board of directors. The Company also retains independent valuation firms to provide third-party valuation consulting services to Apollo, which consist of certain limited procedures that management identifies and requests them to perform. The limited procedures provided by the independent valuation firms assist management with validating their valuation results or determining fair value. The Company performs various back-testing procedures to validate their valuation approaches, including comparisons between expected and observed outcomes, forecast evaluations and variance analyses. However, because of the inherent uncertainty of valuation, those estimated values may differ significantly from the values that would have been used had a ready market for the investments existed, and the differences could be material.
Credit Investments
The majority of investments in Apollo’s credit funds are valued based on quoted market prices and valuation models. Quoted market prices are valued based on the average of the “bid” and the “ask” quotes provided by multiple brokers wherever possible without any adjustments. Apollo will designate certain brokers to use to value specific securities. In order to determine the designated brokers, Apollo considers the following: (i) brokers with which Apollo has previously transacted, (ii) the underwriter of the security and (iii) active brokers indicating executable quotes. In addition, when valuing a security based on broker quotes wherever possible Apollo tests the standard deviation amongst the quotes received and the variance between the concluded fair value and the value provided by a pricing service. When broker quotes are not available Apollo considers the use of pricing service quotes or other sources to mark a position. When relying on a pricing service as a primary source, Apollo (i) analyzes how the price has moved over the measurement period, (ii) reviews the number of brokers included in the pricing service’s population and (iii) validates the valuation levels with Apollo’s pricing team and traders.
Debt and equity securities that are not publicly traded or whose market prices are not readily available are valued at fair value utilizing a model based approach to determine fair value. Valuation approaches used to estimate the fair value of illiquid credit investments also may include the market approach and the income approach, as previously described above. The valuation approaches used consider, as applicable, market risks, credit risks, counterparty risks and foreign currency risks.
-
178
-
APOLLO GLOBAL MANAGEMENT, LLC
NOTES TO CONSOLIDATED
FINANCIAL STATEMENTS
(dollars in thousands, except share data, except where noted)
Private Equity Investments
The majority of the illiquid investments within our private equity funds are valued using the market approach, which provides an indication of fair value based on a comparison of the subject company to comparable publicly traded companies and transactions in the industry.
Market Approach
The market approach is driven by current market conditions, including actual trading levels of similar companies and, to the extent available, actual transaction data of similar companies. Judgment is required by management when assessing which companies are similar to the subject company being valued. Consideration may also be given to any of the following factors: (1) the subject company’s historical and projected financial data; (2) valuations given to comparable companies; (3) the size and scope of the subject company’s operations; (4) the subject company’s individual strengths and weaknesses; (5) expectations relating to the market’s receptivity to an offering of the subject company’s securities; (6) applicable restrictions on transfer; (7) industry and market information; (8) general economic and market conditions; and (9) other factors deemed relevant. Market approach valuation models typically employ a multiple that is based on one or more of the factors described above. Enterprise value as a multiple of EBITDA is common and relevant for most companies and industries, however, other industry specific multiples are employed where available and appropriate.
Sources for gaining additional knowledge related to comparable companies include public filings, annual reports, analyst research reports, and press releases. Once a comparable company set is determined, we review certain aspects of the subject company’s performance and determine how its performance compares to the group and to certain individuals in the group. We compare certain measurements such as EBITDA margins, revenue growth over certain time periods, leverage ratios and growth opportunities. In addition, we compare our entry multiple and its relation to the comparable set at the time of acquisition to understand its relation to the comparable set on each measurement date.
Income Approach
For investments where the market approach does not provide adequate fair value information, we rely on the income approach. The income approach is also used to validate the market approach within our private equity funds. The income approach provides an indication of fair value based on the present value of cash flows that a business or security is expected to generate in the future. The most widely used methodology for the income approach is a discounted cash flow method. Inherent in the discounted cash flow method are significant assumptions related to the subject company’s expected results, the determination of a terminal value and a calculated discount rate, which is normally based on the subject company’s weighted average cost of capital, or “WACC.” The WACC represents the required rate of return on total capitalization, which is comprised of a required rate of return on equity, plus the current tax-effected rate of return on debt, weighted by the relative percentages of equity and debt that are typical in the industry. The most critical step in determining the appropriate WACC for each subject company is to select companies that are comparable in nature to the subject company and the credit quality of the subject company. Sources for gaining additional knowledge about the comparable companies include public filings, annual reports, analyst research reports, and press releases. The general formula then used for calculating the WACC considers the after-tax rate of return on debt capital and the rate of return on common equity capital, which further considers the risk-free rate of return, market beta, market risk premium and small stock premium, if applicable. The variables used in the WACC formula are inferred from the comparable market data obtained. The Company evaluates the comparable companies selected and concludes on WACC inputs based on the most comparable company or analyzes the range of data for the investment.
The value of liquid investments, where the primary market is an exchange (whether foreign or domestic), is determined using period end market prices. Such prices are generally based on the close price on the date of determination.
Real Assets Investments
The estimated fair value of commercial mortgage-backed securities (“CMBS”) in Apollo’s real assets funds is determined by reference to market prices provided by certain dealers who make a market in these financial instruments. Broker quotes are only indicative of fair value and may not necessarily represent what the funds would receive in an actual trade for the applicable instrument. Additionally, the loans held-for-investment are stated at the principal amount outstanding, net of deferred loan fees and costs for certain investments. The loans in Apollo’s real assets funds are evaluated for possible impairment on a quarterly basis. For Apollo’s real assets funds, valuations of non-marketable underlying investments are determined using methods that include, but are not limited to (i) discounted cash flow estimates or comparable analysis prepared internally, (ii) third party appraisals or valuations by qualified real estate appraisers and (iii) contractual sales value of investments/properties subject to
-
179
-
APOLLO GLOBAL MANAGEMENT, LLC
NOTES TO CONSOLIDATED
FINANCIAL STATEMENTS
(dollars in thousands, except share data, except where noted)
bona fide purchase contracts. Methods (i) and (ii) also incorporate consideration of the use of the income, cost, or sales comparison approaches of estimating property values.
Certain of the credit, private equity, and real assets funds may also enter into foreign currency exchange contracts, total return swap contracts, credit default swap contracts, and other derivative contracts, which may include options, caps, collars and floors. Foreign currency exchange contracts are marked-to-market by recognizing the difference between the contract exchange rate and the current market rate as unrealized appreciation or depreciation. If securities are held at the end of the period, the changes in value are recorded in income as unrealized. Realized gains or losses are recognized when contracts are settled. Total return swap and credit default swap
contracts are recorded at fair value as an asset or liability with changes in fair value recorded as unrealized appreciation or depreciation. Realized gains or losses are recognized at the termination of the contract based on the difference between the close-out price of the total return or credit default swap contract and the original contract price. Forward contracts are valued based on market rates obtained from counterparties or prices obtained from recognized financial data service providers.
8
. OTHER ASSETS
Other assets consisted of the following:
|
As of
December 31, 2018 |
As of
December 31, 2017 |
||||||
|
Fixed assets
|
$
|
109,039
|
|
$
|
102,694
|
|
|
|
Less: Accumulated depreciation and amortization
|
(89,049
|
)
|
(83,510
|
)
|
|||
|
Fixed assets, net
|
19,990
|
|
19,184
|
|
|||
|
Prepaid expenses
|
130,091
|
|
189,542
|
|
|||
|
Tax receivables
|
10,464
|
|
9,236
|
|
|||
|
Other
|
12,725
|
|
13,795
|
|
|||
|
Total Other Assets
|
$
|
173,270
|
|
$
|
231,757
|
|
|
Prepaid expenses includes
$80.4 million
and
$135.0 million
as of
December 31, 2018 and 2017
, respectively, of deferred equity-based compensation related to the value of the equity-based awards that have been or are expected to be granted in connection with the settlement of certain profit sharing arrangements. A corresponding amount for awards expected to be granted of
$54.5 million
and
$124.3 million
, as of
December 31, 2018 and 2017
, respectively, is included in other liabilities on the
consolidated
statements of financial condition.
Depreciation expense was
$8.5 million
,
$12.1 million
and
$9.6 million
for the
years ended
December 31, 2018, 2017 and 2016
, respectively, and is presented as a component of general, administrative and other expense in the
consolidated
statements of operations.
9
. INCOME TAXES
The Company’s income tax provision totaled
$86.0 million
,
$325.9 million
and
$90.7 million
for the
years ended
December 31, 2018, 2017 and 2016
, respectively. The Company’s effective income tax rate was
81.7%
,
18.4%
and
8.5%
for the
years ended
December 31, 2018, 2017 and 2016
, respectively. The Company’s high effective income tax rate for the year ended December 31, 2018 results primarily from a significant portion of the losses from performance allocations and investment activities that are not subject to U.S. income taxes. As a result, these losses have reduced the Company’s net income, but do not generate a tax benefit. The Company’s effective income tax rate was also impacted by the remeasurement of income taxes due to state tax planning.
-
180
-
APOLLO GLOBAL MANAGEMENT, LLC
NOTES TO CONSOLIDATED
FINANCIAL STATEMENTS
(dollars in thousands, except share data, except where noted)
The provision for income taxes is presented in the following table:
|
|
For the Years Ended December 31,
|
||||||||||
|
|
2018
|
2017
|
2016
|
||||||||
|
Current:
|
|
|
|
||||||||
|
Federal income tax
|
$
|
—
|
|
$
|
3,314
|
|
$
|
—
|
|
||
|
Foreign income tax
(1)
|
4,208
|
|
3,271
|
|
5,843
|
|
|||||
|
State and local income tax
|
1,633
|
|
6,364
|
|
2,847
|
|
|||||
|
Subtotal
|
5,841
|
|
12,949
|
|
8,690
|
|
|||||
|
Deferred:
|
|||||||||||
|
Federal income tax
|
33,936
|
|
290,213
|
|
66,567
|
|
|||||
|
Foreign income tax
(1)
|
—
|
|
—
|
|
(16
|
)
|
|||||
|
State and local income tax
|
46,244
|
|
22,783
|
|
15,466
|
|
|||||
|
Subtotal
|
80,180
|
|
312,996
|
|
82,017
|
|
|||||
|
Total Income Tax Provision
|
$
|
86,021
|
|
$
|
325,945
|
|
$
|
90,707
|
|
||
|
(1)
|
The foreign income tax provision was calculated on
$41.8 million
,
$24.0 million
and
$38.8 million
of pre-tax income generated in foreign jurisdictions for the years ended
December 31, 2018, 2017 and 2016
, respectively.
|
The following table reconciles the U.S. Federal statutory tax rate to the effective income tax rate:
|
|
For the Years Ended December 31,
|
|||||||
|
|
2018
|
2017
|
2016
|
|||||
|
U.S. Federal Statutory Tax Rate
|
21.0
|
%
|
35.0
|
%
|
35.0
|
%
|
||
|
Income Passed Through to Non-Controlling Interests
|
(24.2
|
)
|
(16.3
|
)
|
(18.9
|
)
|
||
|
(Income) Loss Passed Through to Class A Shareholders
|
53.8
|
|
(10.4
|
)
|
(9.2
|
)
|
||
|
State and Local Income Taxes (net of Federal Benefit)
|
29.8
|
|
1.2
|
|
1.4
|
|
||
|
Impact of Federal Tax Reform
|
—
|
|
9.7
|
|
—
|
|
||
|
Other
|
1.3
|
|
(0.8
|
)
|
0.2
|
|
||
|
Effective Income Tax Rate
|
81.7
|
%
|
18.4
|
%
|
8.5
|
%
|
||
Deferred income taxes are provided for the effects of temporary differences between the tax basis of an asset or liability and its reported amount in the consolidated statements of financial condition. These temporary differences result in taxable or deductible amounts in future years.
Existing accounting rules require the effect of a change in tax law or rates to be recognized in income as a component of the income tax provision on the date a bill is signed into law. Existing accounting rules also require deferred tax assets and liabilities to be measured at the enacted rate. The Tax Cuts and Jobs Act (the “TCJA”) was signed into law on December 22, 2017 and includes a broad range of tax reforms including a reduction in the corporate income tax rate to 21% from 35% effective January 1, 2018. As of December 31, 2017, the rate change resulted in a reduction of our net deferred tax assets of
$254.3 million
, resulting primarily from the remeasurement of tax assets arising from the exchanges of AOG units for Class A shares.
As existing accounting rules do not address all circumstances that may arise for companies in accounting for the income tax effects of the TCJA, the SEC staff issued guidance on December 22, 2017 to clarify the application of existing rules in situations where an entity did not have the necessary information available, prepared, or analyzed (including computations) in reasonable detail to complete the accounting for the income tax effects of the TCJA in the period the TCJA was enacted.
During the year ended December 31, 2018, the Company completed its analysis based on available guidance and no material adjustments were made to the provisional amounts previously recorded. The allowable measurement period is now closed.
-
181
-
APOLLO GLOBAL MANAGEMENT, LLC
NOTES TO CONSOLIDATED
FINANCIAL STATEMENTS
(dollars in thousands, except share data, except where noted)
The Company’s deferred tax assets and liabilities in the consolidated statements of financial condition consist of the following:
|
|
As of December 31,
|
||||||
|
|
2018
|
2017
|
|||||
|
Deferred Tax Assets:
|
|
||||||
|
Depreciation and amortization
|
$
|
275,793
|
|
$
|
300,882
|
|
|
|
Net operating loss carryforwards
|
16,039
|
|
21,091
|
|
|||
|
Deferred revenue
|
6,469
|
|
14,652
|
|
|||
|
Equity-based compensation
|
3,849
|
|
3,196
|
|
|||
|
Foreign tax credit
|
15,563
|
|
13,338
|
|
|||
|
Other
|
7,174
|
|
3,030
|
|
|||
|
Total Deferred Tax Assets
|
324,887
|
|
356,189
|
|
|||
|
Deferred Tax Liabilities:
|
|||||||
|
Unrealized gains from investments
|
18,108
|
|
17,818
|
|
|||
|
Other
|
685
|
|
733
|
|
|||
|
Total Deferred Tax Liabilities
|
18,793
|
|
18,551
|
|
|||
|
Total Deferred Tax Assets, Net
|
$
|
306,094
|
|
$
|
337,638
|
|
|
As of
December 31, 2018
, the Company had approximately
$48.7 million
of federal net operating loss (“NOL”) carryforwards and
$85.7 million
of state and local net operating loss carryforwards that will begin to expire after 2035. In addition, the Company’s foreign tax credit carryforwards will begin to expire after 2021.
The Company considered its historical and current year earnings, current utilization of existing deferred tax assets and deferred tax liabilities, the
15
year amortization periods of the tax basis of its intangible assets, the 20 year carry forward periods of any NOLs, short and long term business forecasts and the impact of the TCJA on future earnings in evaluating whether it should establish a valuation allowance. The Company concluded it is more likely than not that the deferred tax assets will be realized and that
no
valuation allowance was needed at
December 31, 2018
.
Under U.S. GAAP, a tax benefit from an uncertain tax position may be recognized when it is more likely than not that the position will be sustained upon examination, including resolutions of any related appeals or litigation processes, based on the technical merits of the position. Based upon the Company’s review of its federal, state, local and foreign income tax returns and tax filing positions, the Company determined that
no
unrecognized tax benefits for uncertain tax positions were required to be recorded. In addition, the Company does not believe that it has any tax positions for which it is reasonably possible that it will be required to record significant amounts of unrecognized tax benefits within the next twelve months.
The Company’s primary jurisdictions in which it operates are the United States, New York State, New York City, California and the United Kingdom. There are
no
unremitted earnings with respect to the United Kingdom and other foreign entities due to the flow-through nature of these entities.
In the normal course of business, the Company is subject to examination by federal and certain state, local and foreign tax authorities. With a few exceptions, as of
December 31, 2018
, the Company’s U.S. federal, state, local and foreign income tax returns for the years 2015 through 2018 are open under the general statute of limitations provisions and therefore subject to examination. Currently, the Internal Revenue Service is examining the tax return of a subsidiary for the 2011 tax year. The State and City of New York are examining certain subsidiaries’ tax returns for tax years 2011 to 2018.
The Company has recorded a deferred tax asset for the future amortization of tax basis intangibles as a result of the 2007 Reorganization. The Company recorded additional deferred tax assets as a result of the step-up in tax basis of intangibles from subsequent exchanges of AOG Units for Class A shares. A related tax receivable agreement liability is recorded in due to related parties in the
consolidated
statements of financial condition for the expected payments under the tax receivable agreement entered into by and among APO Corp., the Managing Partners, the Contributing Partners, and other parties thereto (as amended, the “tax receivable agreement”) (see note
14
). The benefit the Company obtains from the difference in the tax asset recognized and the related liability results in an increase to additional paid in capital. The amortization period for these tax basis intangibles is
15 years
and the deferred tax assets will reverse over the same period.
-
182
-
APOLLO GLOBAL MANAGEMENT, LLC
NOTES TO CONSOLIDATED
FINANCIAL STATEMENTS
(dollars in thousands, except share data, except where noted)
The table below presents the impact to the deferred tax asset, tax receivable agreement liability and additional paid in capital related to the exchange of AOG Units for Class A shares.
|
Exchange of AOG Units
for Class A shares
|
Increase in Deferred Tax Asset
|
Increase in Tax Receivable Agreement Liability
|
Increase to Additional Paid In Capital
|
|||||||||
|
For the Year Ended December 31, 2018
|
$
|
45,017
|
|
$
|
37,891
|
|
$
|
7,126
|
|
|||
|
For the Year Ended December 31, 2017
|
$
|
56,908
|
|
$
|
44,972
|
|
$
|
11,936
|
|
|||
|
For the Year Ended December 31, 2016
|
$
|
7,342
|
|
$
|
6,187
|
|
$
|
1,155
|
|
|||
10
. DEBT
Debt consisted of the following:
|
|
As of December 31, 2018
|
As of December 31, 2017
|
|||||||||||||||||||
|
|
Outstanding
Balance
|
Fair Value
|
Annualized
Weighted
Average
Interest Rate
|
Outstanding
Balance
|
Fair Value
|
Annualized
Weighted
Average
Interest Rate
|
|||||||||||||||
|
2013 AMH Credit Facilities - Term Facility
(1)
|
$
|
—
|
|
$
|
—
|
|
N/A
|
|
$
|
299,655
|
|
$
|
298,875
|
|
(3)
|
2.33
|
%
|
||||
|
2024 Senior Notes
(1)
|
496,512
|
|
498,736
|
|
(4)
|
4.00
|
%
|
495,860
|
|
511,096
|
|
(4)
|
4.00
|
|
|||||||
|
2026 Senior Notes
(1)
|
496,191
|
|
502,107
|
|
(4)
|
4.40
|
|
495,678
|
|
525,273
|
|
(4)
|
4.40
|
|
|||||||
|
2048 Senior Notes
(1)
|
296,386
|
|
290,714
|
|
(4)
|
5.00
|
|
—
|
|
—
|
|
—
|
|
||||||||
|
2014 AMI Term Facility I
(2)
|
15,633
|
|
15,633
|
|
(3)
|
2.00
|
|
16,399
|
|
16,482
|
|
(3)
|
2.00
|
|
|||||||
|
2014 AMI Term Facility II
(2)
|
17,657
|
|
17,657
|
|
(3)
|
1.75
|
|
18,548
|
|
18,605
|
|
(3)
|
1.75
|
|
|||||||
|
2016 AMI Term Facility I
(2)
|
19,371
|
|
19,371
|
|
(3)
|
1.32
|
|
20,372
|
|
20,372
|
|
(3)
|
1.75
|
|
|||||||
|
2016 AMI Term Facility II
(2)
|
18,698
|
|
18,698
|
|
(3)
|
1.70
|
|
15,890
|
|
15,931
|
|
(3)
|
2.00
|
|
|||||||
|
Total Debt
|
$
|
1,360,448
|
|
$
|
1,362,916
|
|
$
|
1,362,402
|
|
$
|
1,406,634
|
|
|||||||||
|
(1)
|
Includes amortization of note discount, as applicable. Outstanding balance is presented net of unamortized debt issuance costs:
|
|
As of December 31, 2018
|
As of December 31, 2017
|
||||||
|
2013 AMH Credit Facilities - Term Facility
|
$
|
—
|
|
$
|
345
|
|
|
|
2024 Senior Notes
|
2,946
|
|
3,498
|
|
|||
|
2026 Senior Notes
|
3,483
|
|
3,951
|
|
|||
|
2048 Senior Notes
|
3,298
|
|
—
|
|
|||
|
(2)
|
Apollo Management International LLP (“AMI”), a subsidiary of the Company, entered into several five year credit facilities (collectively referred to as the “AMI Facilities”) to fund the Company’s investment in certain European CLOs it manages.
|
|
Facility
|
Date
|
Loan Amount
|
||||
|
2014 AMI Term Facility I
|
July 3, 2014
|
€
|
13,636
|
|
||
|
2014 AMI Term Facility II
|
December 9, 2014
|
€
|
15,400
|
|
||
|
2016 AMI Term Facility I
|
January 18, 2016
|
€
|
16,895
|
|
||
|
2016 AMI Term Facility II
|
June 22, 2016
|
€
|
16,308
|
|
||
|
(3)
|
Fair value is based on obtained broker quotes. These notes are classified as a Level III liability within the fair value hierarchy based on the number and quality of broker quotes obtained, the standard deviations of the observed broker quotes and the percentage deviation from independent pricing services. For instances where broker quotes are not available, a discounted cash flow method is used to obtain a fair value.
|
|
(4)
|
Fair value is based on obtained broker quotes. These notes are classified as a Level II liability within the fair value hierarchy based on the number and quality of broker quotes obtained, the standard deviations of the observed broker quotes and the percentage deviation from independent pricing services.
|
-
183
-
APOLLO GLOBAL MANAGEMENT, LLC
NOTES TO CONSOLIDATED
FINANCIAL STATEMENTS
(dollars in thousands, except share data, except where noted)
2013 AMH Credit Facilities
—On December 18, 2013, AMH and its subsidiaries and certain other subsidiaries of the Company entered into credit facilities (the “2013 AMH Credit Facilities”) with the lenders and issuing banks party thereto and JPMorgan Chase Bank, N.A., as administrative agent for the lenders. The 2013 AMH Credit Facilities provided for (i) a term loan facility to AMH (the “Term Facility”) that included
$750 million
of term loan from third-party lenders and
$271.7 million
of term loan held by a subsidiary of the Company and (ii) a
$500 million
revolving credit facility (the “Revolver Facility”), in each case, with an original maturity date of January 18, 2019. On March 11, 2016, the maturity date of both the Term Facility and the Revolver Facility was extended by
two years
to January 18, 2021. The extension was determined to be a modification of the 2013 AMH Credit Facilities in accordance with U.S. GAAP.
In connection with the issuance of the 2024 Senior Notes, the 2026 Senior Notes and the 2048 Senior Notes (as described below),
$250 million
,
$200 million
and
$300 million
of the proceeds, respectively, were used to repay the entire remaining amount of both the term loan from third-party lenders and the term loan held by a subsidiary of the Company as of March 15, 2018. The Revolver Facility was replaced as of July 11, 2018 by the 2018 AMH Credit Facility, as described below. The 2013 AMH Credit Facilities and all related loan documents were terminated as of July 11, 2018.
2018 AMH Credit Facility
—On July 11, 2018, AMH as borrower (the “Borrower”) entered into a new credit agreement (the “2018 AMH Credit Facility”) with the lenders and issuing banks party thereto and Citibank, N.A., as administrative agent for the lenders. The 2018 AMH Credit Facility provides for a
$750 million
revolving credit facility to the Borrower with a final maturity date of July 11, 2023. The 2018 AMH Credit Facility is to remain available until its maturity, and any undrawn revolving commitments bear a commitment fee. The interest rate on the 2018 AMH Credit Facility is based on adjusted LIBOR and the applicable margin as of
December 31, 2018
was
1.00%
. The commitment fee on the
$750 million
undrawn 2018 AMH Credit Facility as of
December 31, 2018
was
0.09%
.
Borrowings under the 2018 AMH Credit Facility may be used for working capital and general corporate purposes, including, without limitation, permitted acquisitions. The Borrower may incur incremental facilities in respect of the 2018 AMH Credit Facility in an aggregate amount not to exceed
$250 million
plus additional amounts so long as the Borrower is in compliance with a net leverage ratio not to exceed
4.00
to
1.00
. As of
December 31, 2018
, the 2018 AMH Credit Facility was undrawn.
2024 Senior Notes
—On May 30, 2014, AMH issued
$500 million
in aggregate principal amount of its
4.000%
Senior Notes due 2024 (the “2024 Senior Notes”), at an issue price of
99.722%
of par. Interest on the 2024 Senior Notes is payable semi-annually in arrears on May 30 and November 30 of each year. The 2024 Senior Notes will mature on May 30, 2024. The discount is amortized into interest expense on the
consolidated
statements of operations over the term of the 2024 Senior Notes. The face amount of
$500 million
related to the 2024 Senior Notes is the amount for which the Company is obligated to settle the 2024 Senior Notes.
2026 Senior Notes
—On May 27, 2016, AMH issued
$500 million
in aggregate principal amount of its
4.400%
Senior Notes due 2026 (the “2026 Senior Notes”), at an issue price of
99.912%
of par. Interest on the 2026 Senior Notes is payable semi-annually in arrears on May 27 and November 27 of each year. The 2026 Senior Notes will mature on May 27, 2026. The discount is amortized into interest expense on the
consolidated
statements of operations over the term of the 2026 Senior Notes. The face amount of
$500 million
related to the 2026 Senior Notes is the amount for which the Company is obligated to settle the 2026 Senior Notes.
2048 Senior Notes
—On March 15, 2018, AMH issued
$300 million
in aggregate principal amount of its
5.000%
Senior Notes due 2048 (the “2048 Senior Notes”), at an issue price of
99.892%
of par. Interest on the 2048 Senior Notes is payable semi-annually in arrears on March 15 and September 15 of each year. The 2048 Senior Notes will mature on March 15, 2048. The discount is amortized into interest expense on the
consolidated
statements of operations over the term of the 2048 Senior Notes. The face amount of
$300 million
related to the 2048 Senior Notes is the amount for which the Company is obligated to settle the 2048 Senior Notes.
As of
December 31, 2018
, the 2026 Senior Notes, the 2024 Senior Notes and the 2048 Senior Notes were guaranteed by Apollo Principal Holdings I, L.P., Apollo Principal Holdings II, L.P., Apollo Principal Holdings III, L.P., Apollo Principal Holdings IV, L.P., Apollo Principal Holdings V, L.P., Apollo Principal Holdings VI, L.P., Apollo Principal Holdings VII, L.P., Apollo Principal Holdings VIII, L.P., Apollo Principal Holdings IX, L.P., Apollo Principal Holdings X, L.P., Apollo Principal Holdings XI, LLC, Apollo Principal Holdings XII, L.P., AMH Holdings (Cayman), L.P. and any other entity that is required to become a guarantor of the notes under the terms of the indentures governing the 2026 Senior Notes, the 2024 Senior Notes and the 2048 Senior Notes (the “Indentures”). The Indentures include covenants that restrict the ability of AMH and, as applicable,
-
184
-
APOLLO GLOBAL MANAGEMENT, LLC
NOTES TO CONSOLIDATED
FINANCIAL STATEMENTS
(dollars in thousands, except share data, except where noted)
the guarantors to incur indebtedness secured by liens on voting stock or profit participating equity interests of their respective subsidiaries or merge, consolidate or sell, transfer or lease assets. The Indentures also provide for customary events of default.
The following table presents the interest expense incurred related to the Company’s debt:
|
|
For the Years Ended December 31,
|
||||||||||
|
|
2018
|
2017
|
2016
|
||||||||
|
Interest Expense:
(1)
|
|||||||||||
|
2013 AMH Credit Facilities
|
$
|
2,387
|
|
$
|
8,328
|
|
$
|
8,253
|
|
||
|
2018 AMH Credit Facility
|
489
|
|
—
|
|
—
|
|
|||||
|
2024 Senior Notes
|
20,652
|
|
20,652
|
|
20,652
|
|
|||||
|
2026 Senior Notes
|
22,513
|
|
22,513
|
|
13,372
|
|
|||||
|
2048 Senior Notes
|
12,009
|
|
—
|
|
—
|
|
|||||
|
AMI Term Facilities
|
1,324
|
|
1,380
|
|
1,205
|
|
|||||
|
Total Interest Expense
|
$
|
59,374
|
|
$
|
52,873
|
|
$
|
43,482
|
|
||
|
(1)
|
Debt issuance costs incurred in connection with the 2013 AMH Credit Facilities, the 2018 AMH Credit Facility, the 2024 Senior Notes, the 2026 Senior Notes and the 2048 Senior Notes are amortized into interest expense over the term of the debt arrangement.
|
The table below presents the contractual maturities for the Company's debt arrangements as of
December 31, 2018
:
|
2019
|
2020
|
2021
|
2022
|
2023
|
Thereafter
|
Total
|
|||||||||||||||||||||
|
2024 Senior Notes
|
$
|
—
|
|
$
|
—
|
|
$
|
—
|
|
$
|
—
|
|
$
|
—
|
|
$
|
500,000
|
|
$
|
500,000
|
|
||||||
|
2026 Senior Notes
|
—
|
|
—
|
|
—
|
|
—
|
|
—
|
|
500,000
|
|
500,000
|
|
|||||||||||||
|
2048 Senior Notes
|
—
|
|
—
|
|
—
|
|
—
|
|
—
|
|
300,000
|
|
300,000
|
|
|||||||||||||
|
2014 AMI Term Facility I
|
—
|
|
—
|
|
15,633
|
|
—
|
|
—
|
|
—
|
|
15,633
|
|
|||||||||||||
|
2014 AMI Term Facility II
|
—
|
|
—
|
|
—
|
|
17,657
|
|
—
|
|
—
|
|
17,657
|
|
|||||||||||||
|
2016 AMI Term Facility I
|
—
|
|
—
|
|
—
|
|
—
|
|
—
|
|
19,371
|
|
19,371
|
|
|||||||||||||
|
2016 AMI Term Facility II
|
—
|
|
—
|
|
—
|
|
—
|
|
18,698
|
|
—
|
|
18,698
|
|
|||||||||||||
|
Total Obligations as of December 31, 2018
|
$
|
—
|
|
$
|
—
|
|
$
|
15,633
|
|
$
|
17,657
|
|
$
|
18,698
|
|
$
|
1,319,371
|
|
$
|
1,371,359
|
|
||||||
-
185
-
APOLLO GLOBAL MANAGEMENT, LLC
NOTES TO CONSOLIDATED
FINANCIAL STATEMENTS
(dollars in thousands, except share data, except where noted)
11
. NET INCOME PER CLASS A SHARE
The table below presents basic and diluted net income per Class A share using the two-class method:
|
|
Basic and Diluted
|
|||||||||||
|
For the Years Ended December 31,
|
||||||||||||
|
2018
|
2017
|
2016
|
||||||||||
|
Numerator:
|
||||||||||||
|
Net Income (Loss) Attributable to Apollo Global Management, LLC Class A Shareholders
|
$
|
(42,038
|
)
|
$
|
615,566
|
|
$
|
402,850
|
|
|||
|
Distributions declared on Class A shares
(1)
|
(388,744
|
)
|
(354,878
|
)
|
(230,713
|
)
|
||||||
|
Distributions on participating securities
(2)
|
(18,119
|
)
|
(11,822
|
)
|
(8,396
|
)
|
||||||
|
Earnings allocable to participating securities
|
—
|
|
(3)
|
(8,828
|
)
|
(6,430
|
)
|
|||||
|
Undistributed income (loss) attributable to Class A shareholders: Basic
|
$
|
(448,901
|
)
|
$
|
240,038
|
|
$
|
157,311
|
|
|||
|
Dilution effect on distributable income attributable to unvested RSUs
|
—
|
|
2,706
|
|
—
|
|
||||||
|
Undistributed income (loss) attributable to Class A shareholders: Diluted
|
$
|
(448,901
|
)
|
$
|
242,744
|
|
$
|
157,311
|
|
|||
|
Denominator:
|
||||||||||||
|
Weighted average number of Class A shares outstanding: Basic
|
199,946,632
|
|
190,931,743
|
|
183,998,080
|
|
||||||
|
Dilution effect of unvested RSUs
|
—
|
|
1,649,950
|
|
—
|
|
||||||
|
Weighted average number of Class A shares outstanding: Diluted
|
199,946,632
|
|
192,581,693
|
|
183,998,080
|
|
||||||
|
Net Income per Class A Share: Basic
|
||||||||||||
|
Distributed Income
|
$
|
1.93
|
|
$
|
1.85
|
|
$
|
1.25
|
|
|||
|
Undistributed Income (Loss)
|
(2.23
|
)
|
1.27
|
|
0.86
|
|
||||||
|
Net Income (Loss) per Class A Share: Basic
|
$
|
(0.30
|
)
|
|
$
|
3.12
|
|
$
|
2.11
|
|
||
|
Net Income (Loss) per Class A Share: Diluted
(4)
|
||||||||||||
|
Distributed Income
|
$
|
1.93
|
|
$
|
1.84
|
|
$
|
1.25
|
|
|||
|
Undistributed Income (Loss)
|
(2.23
|
)
|
1.26
|
|
0.86
|
|
||||||
|
Net Income (Loss) per Class A Share: Diluted
|
$
|
(0.30
|
)
|
$
|
3.10
|
|
$
|
2.11
|
|
|||
|
(1)
|
See note
13
for information regarding the quarterly distributions declared and paid during
2018
,
2017
and
2016
.
|
|
(2)
|
Participating securities consist of vested and unvested RSUs that have rights to distributions and unvested restricted shares.
|
|
(3)
|
No allocation of undistributed losses was made to the participating securities as the holders do not have a contractual obligation to share in the losses of the Company with Class A shareholders.
|
|
(4)
|
For the year ended December 31, 2017, unvested RSUs were determined to be dilutive, and were accordingly included in the diluted earnings per share calculation. For the year ended December 31, 2017, the share options, AOG Units and participating securities were determined to be anti-dilutive and were accordingly excluded from the diluted earnings per share calculation. For the years ended December 31, 2018 and 2016, all of the classes of securities were determined to be anti-dilutive.
|
The Company has granted RSUs that provide the right to receive, subject to vesting during continued employment, Class A shares pursuant to the 2007 Equity Plan. The Company has
three
types of RSU grants, which we refer to as Plan Grants, Bonus Grants and Performance Grants. “Plan Grants” vest over time (generally
one
to
six years
) and may or may not provide the right to receive distribution equivalents on vested RSUs on an equal basis with the Class A shareholders any time a distribution is declared. “Bonus Grants” vest over time (generally
three years
) and generally provide the right to receive distribution equivalents on both vested and unvested RSUs on an equal basis with the Class A shareholders any time a distribution is declared. “Performance Grants” generally vest over time (
three
to
five years
), subject to the Company’s receipt of performance revenues, within prescribed periods, sufficient to cover the associated equity-based compensation expense. Performance Grants provide the right to receive distribution equivalents on vested RSUs and may also provide the right to receive distribution equivalents on unvested RSUs.
Any distribution equivalent paid to an employee will not be returned to the Company upon forfeiture of the award by the employee. Vested and unvested RSUs that are entitled to non-forfeitable distribution equivalents qualify as participating securities and are included in the Company’s basic and diluted earnings per share computations using the two-class method. The holder of an RSU participating security would have a contractual obligation to share in the losses of the entity if the holder is obligated to fund the losses of the issuing entity or if the contractual principal or mandatory redemption amount of the participating
-
186
-
APOLLO GLOBAL MANAGEMENT, LLC
NOTES TO CONSOLIDATED
FINANCIAL STATEMENTS
(dollars in thousands, except share data, except where noted)
security is reduced as a result of losses incurred by the issuing entity. The RSU participating securities do not have a mandatory redemption amount and the holders of the participating securities are not obligated to fund losses, therefore, neither the vested RSUs nor the unvested RSUs are subject to any contractual obligation to share in losses of the Company.
Holders of AOG Units are subject to the transfer restrictions set forth in the agreements with the respective holders and may, a limited number of times each year, upon notice (subject to the terms of the Exchange Agreement), exchange their AOG Units for Class A shares on a
one
-for-
one
basis. An AOG Unit holder must exchange one unit in each of the Apollo Operating Group partnerships to effectuate an exchange for
one
Class A share.
Apollo Global Management, LLC has
one
Class B share outstanding, which is held by BRH Holdings GP, Ltd. (“BRH”). The voting power of the Class B share is reduced on a
one
vote per
one
AOG Unit basis in the event of an exchange of AOG Units for Class A shares, as discussed above. The Class B share has
no
net income (loss) per share as it does not participate in Apollo’s earnings (losses) or distributions. The Class B share has
no
distribution or liquidation rights. The Class B share has voting rights on a pari passu basis with the Class A shares. The Class B share represented
52.4%
,
53.9%
and
60.5%
of the total voting power of the Company’s shares entitled to vote as of
December 31, 2018, 2017 and 2016
, respectively.
The following table summarizes the anti-dilutive securities.
|
For the Years Ended December 31,
|
||||||||
|
2018
|
2017
|
2016
|
||||||
|
Weighted average vested RSUs
|
384,592
|
|
454,929
|
|
1,466,803
|
|
||
|
Weighted average unvested RSUs
|
8,850,291
|
|
N/A
|
|
5,975,293
|
|
||
|
Weighted average unexercised options
|
204,167
|
|
213,545
|
|
222,920
|
|
||
|
Weighted average AOG Units outstanding
|
203,019,177
|
|
211,360,975
|
|
215,917,462
|
|
||
|
Weighted average unvested restricted shares
|
872,252
|
|
300,921
|
|
82,301
|
|
||
12
. EQUITY-BASED COMPENSATION
Equity-based awards granted to employees and non-employees as compensation are measured based on the grant date fair value of the award. Equity-based awards that do not require future service (i.e., vested awards) are expensed immediately. Equity-based employee awards that require future service are expensed over the relevant service period. Equity-based awards that require performance metrics to be met are expensed only when the performance metric is met or deemed probable.
RSUs
The Company grants RSUs under the 2007 Equity Plan. The fair value of all grants is based on the grant date fair value, which considers the public share price of the Company’s Class A shares subject to certain discounts, as applicable. The following table summarizes the weighted average discounts for Plan Grants, Bonus Grants and Performance Grants.
|
For the Years Ended December 31,
|
||||||||
|
2018
|
2017
|
2016
|
||||||
|
Plan Grants:
|
||||||||
|
Discount for the lack of distributions until vested
(1)
|
12.0
|
%
|
11.8
|
%
|
14.0
|
%
|
||
|
Marketability discount for transfer restrictions
(2)
|
4.7
|
%
|
3.6
|
%
|
3.8
|
%
|
||
|
Bonus Grants:
|
||||||||
|
Marketability discount for transfer restrictions
(2)
|
2.3
|
%
|
2.3
|
%
|
2.1
|
%
|
||
|
Performance Grants:
|
||||||||
|
Discount for the lack of distributions until vested
(1)
|
12.8
|
%
|
N/A
|
|
N/A
|
|
||
|
Marketability discount for transfer restrictions
(2)
|
5.6
|
%
|
N/A
|
|
N/A
|
|
||
|
(1)
|
Based on the present value of a growing annuity calculation.
|
|
(2)
|
Based on the Finnerty Model calculation.
|
-
187
-
APOLLO GLOBAL MANAGEMENT, LLC
NOTES TO CONSOLIDATED
FINANCIAL STATEMENTS
(dollars in thousands, except share data, except where noted)
The estimated total grant date fair value for Plan Grants and Bonus Grants is charged to compensation expense on a straight-line basis over the vesting period, which for Plan Grants is generally
one
to
six
years, with the first installment vesting
one
year after grant and quarterly vesting thereafter, and for Bonus Grants is generally annual vesting over
three
years.
During the year ended
December 31, 2018
, the Company awarded Performance Grants of
5.6 million
RSUs to certain employees with a grant date fair value of
$171.7 million
, which vest over time (generally
3
to
5
years) subject to the receipt of performance revenues, within prescribed periods, sufficient to cover the associated equity-based compensation expense. In accordance with U.S. GAAP, equity-based compensation expense for such awards will be recognized on an accelerated recognition method over the requisite service period to the extent the performance revenue metrics are met or deemed probable. Accordingly, for the
year ended
December 31, 2018
, equity-based compensation expense of
$75.2 million
was recognized relating to these Performance Grants.
Additionally, the Company entered into an agreement in 2018 with several employees under which it expects to grant them RSUs beginning in 2020 if year-over-year growth in certain discretionary earnings metrics is attained prior to grant and they remain employed at the grant date. Once granted, these RSUs will vest based on both continued service and the Company’s receipt of performance revenues, within prescribed periods, sufficient to cover the associated equity-based compensation expense. In accordance with U.S. GAAP, equity-based compensation expense for such awards, if and when granted, will be recognized on an accelerated recognition method over the requisite service period to the extent the performance revenue metrics are met or deemed probable.
No
equity-based compensation expense was recognized related to these RSUs for the year ended December 31, 2018.
The fair value of all RSU grants made during the
years ended
December 31, 2018, 2017 and 2016
was
$256.1 million
,
$33.2 million
and
$62.6 million
, respectively.
The following table presents the actual forfeiture rates and equity-based compensation expense recognized:
|
For the Years Ended December 31,
|
|||||||||||
|
2018
|
2017
|
2016
|
|||||||||
|
Actual forfeiture rate
|
7.8
|
%
|
9.8
|
%
|
8.8
|
%
|
|||||
|
Equity-based compensation
|
$
|
146,708
|
|
$
|
68,225
|
|
$
|
67,958
|
|
||
The following table summarizes RSU activity:
|
Unvested
|
Weighted Average Grant Date Fair Value
|
Vested
|
Total Number of RSUs Outstanding
|
||||||||||
|
Balance at January 1, 2018
|
6,262,288
|
|
$
|
15.58
|
|
2,802,277
|
|
9,064,565
|
|
(1)
|
|||
|
Granted
|
8,143,541
|
|
31.45
|
|
—
|
|
8,143,541
|
|
|||||
|
Forfeited
|
(1,127,396
|
)
|
19.74
|
|
—
|
|
(1,127,396
|
)
|
|||||
|
Vested
|
(3,438,465
|
)
|
20.48
|
|
3,438,465
|
|
—
|
|
|||||
|
Issued
|
—
|
|
18.63
|
|
(3,859,959
|
)
|
(3,859,959
|
)
|
|||||
|
Balance at December 31, 2018
|
9,839,968
|
|
(2)
|
$
|
26.52
|
|
2,380,783
|
|
12,220,751
|
|
(1)
|
||
|
(1)
|
Amount excludes RSUs which have vested and have been issued in the form of Class A shares.
|
|
(2)
|
RSUs were expected to vest over the weighted average period of
3.3
years.
|
-
188
-
APOLLO GLOBAL MANAGEMENT, LLC
NOTES TO CONSOLIDATED
FINANCIAL STATEMENTS
(dollars in thousands, except share data, except where noted)
Restricted Share Awards
The Company has granted restricted share awards under the 2007 Equity Plan primarily in connection with certain profit sharing arrangements. The fair value of restricted share grants is the public share price of the Company’s Class A shares on the grant date. The grant date fair value of these awards is recognized as equity-based compensation expense on a straight-line basis over the vesting period.
The fair value of restricted share award grants made during the
years ended
December 31, 2018, 2017 and 2016
was
$30.2 million
,
$13.9 million
and
$0.5 million
, respectively.
The following table presents the actual forfeiture rates and equity-based compensation expense recognized:
|
For the Years Ended December 31,
|
|||||||||||
|
2018
|
2017
|
2016
|
|||||||||
|
Actual forfeiture rate
|
2.9
|
%
|
0.8
|
%
|
1.6
|
%
|
|||||
|
Equity-based compensation
|
$
|
13,515
|
|
$
|
5,064
|
|
$
|
3,478
|
|
||
The following table summarizes the restricted share award activity:
|
Unvested
|
Weighted Average Grant Date Fair Value
|
Vested
|
Total Number of Restricted Share Awards Outstanding
|
|||||||||
|
Balance at January 1, 2018
|
508,202
|
|
$
|
27.21
|
|
—
|
|
508,202
|
|
|||
|
Granted
|
927,020
|
|
32.57
|
|
—
|
|
927,020
|
|
||||
|
Forfeited
|
(41,674
|
)
|
30.16
|
|
—
|
|
(41,674
|
)
|
||||
|
Issued
|
—
|
|
29.74
|
|
(304,565
|
)
|
(304,565
|
)
|
||||
|
Vested
|
(304,565
|
)
|
29.74
|
|
304,565
|
|
—
|
|
||||
|
Balance at December 31, 2018
|
1,088,983
|
|
(1)
|
$
|
30.96
|
|
—
|
|
1,088,983
|
|
||
|
(1)
|
Restricted share awards were expected to vest over the next
1.9
years.
|
Restricted Stock and Restricted Stock Unit Awards—ARI and AMTG
ARI granted restricted stock awards and restricted stock unit awards ("ARI Awards") and Apollo Residential Mortgage, Inc. (“AMTG”) granted restricted stock unit awards (“AMTG RSUs”) to the Company and certain employees of the Company. These awards generally vest over
three years
, either quarterly or annually.
The awards granted to the Company are recorded as investments under the equity method of accounting and deferred revenue in the consolidated statements of financial condition. As these awards vest, the deferred revenue is recognized as management fees.
The awards granted to the Company’s employees are recorded in other assets and other liabilities in the consolidated statements of financial condition. The grant date fair value of the asset is amortized through equity-based compensation on a straight-line basis over the vesting period. The fair value of the liability is remeasured each period with any changes in fair value recorded in compensation expense in the consolidated statements of operations. Compensation expense is offset by related management fees earned by the Company from ARI and AMTG, respectively.
The grant date fair value of the employees’ awards is based on the then public share price of ARI and AMTG at grant, less discounts for transfer restrictions, and has been categorized as Level II within the fair value hierarchy as a result.
The following table summarizes the management fees, compensation expense, and actual forfeiture rates for the AMTG RSUs.
-
189
-
APOLLO GLOBAL MANAGEMENT, LLC
NOTES TO CONSOLIDATED
FINANCIAL STATEMENTS
(dollars in thousands, except share data, except where noted)
|
For the Year Ended December 31, 2016
|
|||
|
Management fees
|
$
|
2,478
|
|
|
Equity-based compensation
|
2,478
|
|
|
|
Actual forfeiture rate
|
0.1
|
%
|
|
During the year ended December 31, 2016, AMTG merged with and into ARI, with ARI continuing as the surviving entity in the merger. The following table summarizes the management fees, equity-based compensation expense, and actual forfeiture rates for the ARI Awards:
|
For the Years Ended December 31,
|
|||||||||||
|
2018
|
2017
|
2016
|
|||||||||
|
Management fees
|
$
|
11,952
|
|
$
|
11,120
|
|
$
|
6,643
|
|
||
|
Equity-based compensation
|
11,952
|
|
11,120
|
|
6,643
|
|
|||||
|
Actual forfeiture rate
|
2.6
|
%
|
2.5
|
%
|
3.8
|
%
|
|||||
The following tables summarize activity for the ARI Awards that were granted to certain of the Company’s employees:
|
ARI Awards Unvested
|
Weighted Average Grant Date Fair Value
|
ARI Awards Vested
|
Total Number of ARI Awards Outstanding
|
|||||||||
|
Balance at January 1, 2018
|
1,202,365
|
|
$
|
17.09
|
|
1,040,711
|
|
2,243,076
|
|
|||
|
Granted
|
1,006,800
|
|
16.35
|
|
—
|
|
1,006,800
|
|
||||
|
Forfeited
|
(56,552
|
)
|
18.01
|
|
—
|
|
(56,552
|
)
|
||||
|
Delivered
|
—
|
|
18.29
|
|
(610,959
|
)
|
(610,959
|
)
|
||||
|
Vested
|
(737,999
|
)
|
16.35
|
|
737,999
|
|
—
|
|
||||
|
Balance at December 31, 2018
|
1,414,614
|
|
(1)
|
$
|
16.91
|
|
1,167,751
|
|
2,582,365
|
|
||
|
(1)
|
ARI Awards were expected to vest over the next
2.4
years.
|
Athene Holding
The Company has granted Athene Holding restricted share awards to certain employees of the Company. Separately, Athene Holding has also granted restricted share awards to certain employees of the Company. Both awards are collectively referred to as the “AHL Awards.” Certain of the AHL Awards function similarly to options as they are exchangeable for Class A shares of Athene Holding upon payment of a conversion price and the satisfaction of certain other conditions. The awards granted are either subject to time-based vesting conditions that generally vest over
three
to
five
years or vest upon achieving certain metrics, such as attainment of certain rates of return and realized cash received by certain investors in Athene Holding upon sale of their shares.
The Company records the AHL Awards in other assets and other liabilities in the
consolidated
statements of financial condition. The fair value of the asset is amortized through equity-based compensation over the vesting period. The fair value of the liability is remeasured each period, with any changes in fair value recorded in compensation expense in the
consolidated
statements of operations. For AHL Awards granted by Athene Holding, compensation expense related to amortization of the asset is offset, with certain exceptions, by related management fees earned by the Company from Athene.
The grant date fair value of the AHL Awards is based on the share price of Athene Holding, less discounts for transfer restrictions, and has been categorized as Level II within the fair value hierarchy as a result. The AHL Awards that function similarly to options were valued using a multiple-scenario model, which considers the price volatility of the underlying share price of Athene Holding, time to expiration and the risk-free rate, while the other awards were valued using the share price of Athene Holding less any discounts for transfer restrictions.
-
190
-
APOLLO GLOBAL MANAGEMENT, LLC
NOTES TO CONSOLIDATED
FINANCIAL STATEMENTS
(dollars in thousands, except share data, except where noted)
The following table summarizes the management fees, equity-based compensation expense and actual forfeiture rates for the AHL Awards:
|
For the Years Ended December 31,
|
|||||||||||
|
2018
|
2017
|
2016
|
|||||||||
|
Management fees
|
$
|
(2,743
|
)
|
$
|
4,058
|
|
$
|
19,173
|
|
||
|
Equity-based compensation
|
(2,136
|
)
|
6,913
|
|
20,560
|
|
|||||
|
Actual forfeiture rate
|
3.6
|
%
|
0.1
|
%
|
3.2
|
%
|
|||||
The following table summarizes activity for the AHL Awards that were granted to certain employees of the Company:
|
AHL Awards Unvested
|
Weighted Average Grant Date Fair Value
|
AHL Awards Vested
|
Total Number of AHL Awards Outstanding
|
|||||||||
|
Balance at January 1, 2018
|
334,791
|
|
$
|
16.45
|
|
632,290
|
|
967,081
|
|
|||
|
Granted
|
843
|
|
44.74
|
|
—
|
|
843
|
|
||||
|
Vested
|
(180,275
|
)
|
11.83
|
|
180,275
|
|
—
|
|
||||
|
Forfeited
|
(11,960
|
)
|
24.66
|
|
—
|
|
(11,960
|
)
|
||||
|
Delivered
|
—
|
|
10.68
|
|
(206,214
|
)
|
(206,214
|
)
|
||||
|
Balance at December 31, 2018
|
143,399
|
|
(1)
|
$
|
21.75
|
|
606,351
|
|
749,750
|
|
||
|
(1)
|
135,649
AHL Awards are expected to vest over the next
1.1
years and
7,750
AHL Awards may vest if certain performance metrics are achieved.
|
Equity-Based Compensation Allocation
Equity-based compensation is allocated based on ownership interests. Therefore, the amortization of equity-based compensation is allocated to shareholders’ equity attributable to AGM and the Non-Controlling Interests, which results in a difference in the amounts charged to equity-based compensation expense and the amounts credited to shareholders’ equity attributable to AGM in the Company’s
consolidated
financial statements.
Below is a reconciliation of the equity-based compensation allocated to Apollo Global Management, LLC:
|
For the Year Ended December 31, 2018
|
||||||||||||||
|
Total Amount
|
Non-Controlling Interest % in Apollo Operating Group
|
Allocated to Non-Controlling Interest in Apollo Operating Group
(1)
|
Allocated to Apollo Global Management, LLC
|
|||||||||||
|
RSUs, share options and restricted share awards
|
$
|
159,575
|
|
—
|
%
|
$
|
—
|
|
$
|
159,575
|
|
|||
|
AHL Awards
|
(2,136
|
)
|
50.1
|
|
(1,070
|
)
|
(1,066
|
)
|
||||||
|
Other equity-based compensation awards
|
15,789
|
|
50.1
|
|
7,913
|
|
7,876
|
|
||||||
|
Total equity-based compensation
|
$
|
173,228
|
|
6,843
|
|
166,385
|
|
|||||||
|
Less other equity-based compensation awards
(2)
|
(6,843
|
)
|
(18,848
|
)
|
||||||||||
|
Capital increase related to equity-based compensation
|
$
|
—
|
|
$
|
147,537
|
|
||||||||
-
191
-
APOLLO GLOBAL MANAGEMENT, LLC
NOTES TO CONSOLIDATED
FINANCIAL STATEMENTS
(dollars in thousands, except share data, except where noted)
|
For the Year Ended December 31, 2017
|
||||||||||||||
|
Total Amount
|
Non-Controlling Interest % in Apollo Operating Group
|
Allocated to Non-Controlling Interest in Apollo Operating Group
(1)
|
Allocated to Apollo Global Management, LLC
|
|||||||||||
|
RSUs, share options and restricted share awards
|
$
|
73,352
|
|
—
|
%
|
$
|
—
|
|
$
|
73,352
|
|
|||
|
AHL Awards
|
6,913
|
|
51.5
|
|
3,560
|
|
3,353
|
|
||||||
|
Other equity-based compensation awards
|
11,185
|
|
51.5
|
|
5,760
|
|
5,425
|
|
||||||
|
Total equity-based compensation
|
$
|
91,450
|
|
9,320
|
|
82,130
|
|
|||||||
|
Less other equity-based compensation awards
(2)
|
(9,320
|
)
|
(9,956
|
)
|
||||||||||
|
Capital increase related to equity-based compensation
|
$
|
—
|
|
$
|
72,174
|
|
||||||||
|
For the Year Ended December 31, 2016
|
||||||||||||||
|
Total Amount
|
Non-Controlling Interest % in Apollo Operating Group
|
Allocated to Non-Controlling Interest in Apollo Operating Group
(1)
|
Allocated to Apollo Global Management, LLC
|
|||||||||||
|
RSUs, share options and restricted share awards
|
$
|
71,562
|
|
—
|
%
|
$
|
—
|
|
$
|
71,562
|
|
|||
|
AHL Awards
|
20,560
|
|
53.7
|
|
11,049
|
|
9,511
|
|
||||||
|
Other equity-based compensation awards
|
10,861
|
|
53.7
|
|
5,837
|
|
5,024
|
|
||||||
|
Total equity-based compensation
|
$
|
102,983
|
|
16,886
|
|
86,097
|
|
|||||||
|
Less other equity-based compensation awards
(2)
|
(16,886
|
)
|
(16,510
|
)
|
||||||||||
|
Capital increase related to equity-based compensation
|
$
|
—
|
|
$
|
69,587
|
|
||||||||
|
(1)
|
Calculated based on average ownership percentage for the period considering Class A share issuances during the period.
|
|
(2)
|
Includes equity-based compensation reimbursable by certain funds.
|
13
. EQUITY
Class A Shares
Class A shares represent limited liability company interests in the Company. Holders of Class A shares are entitled to participate in distributions from the Company on a pro rata basis. Class A shareholders do not elect the Company’s manager or the manager’s executive committee and have limited voting rights.
During the
years ended
December 31, 2018, 2017 and 2016
, the Company issued Class A shares in settlement of vested RSUs. The Company has generally allowed holders of vested RSUs and exercised share options to settle their tax liabilities by reducing the number of Class A shares issued to them, which the Company refers to as “net share settlement.” Additionally, the Company has generally allowed holders of share options to settle their exercise price by reducing the number of Class A shares issued to them at the time of exercise by an amount sufficient to cover the exercise price. The net share settlement results in a liability for the Company and a corresponding accumulated deficit adjustment.
In February 2016, Apollo announced its adoption of a program to repurchase up to
$250 million
in the aggregate of its Class A shares, including up to
$150 million
in the aggregate of its outstanding Class A shares through a share repurchase program and up to
$100 million
through net share settlement of equity-based awards granted under the 2007 Equity Plan. In January 2019, Apollo increased its authorized share repurchase amount (see note
17
for details).
-
192
-
APOLLO GLOBAL MANAGEMENT, LLC
NOTES TO CONSOLIDATED
FINANCIAL STATEMENTS
(dollars in thousands, except share data, except where noted)
The table below summarizes the issuance of Class A shares for equity-based awards:
|
For the Years Ended December 31,
|
||||||||
|
2018
|
2017
|
2016
|
||||||
|
Class A shares issued in settlement of vested RSUs and share options exercised
(1)
|
3,866,209
|
|
3,565,098
|
|
7,325,834
|
|
||
|
Reduction of Class A shares issued
(2)
|
(1,311,108
|
)
|
(1,318,632
|
)
|
(2,700,530
|
)
|
||
|
Class A shares purchased related to share issuances and forfeitures
(3)
|
(208,521
|
)
|
76,739
|
|
(2,117
|
)
|
||
|
Issuance of Class A shares for equity-based awards
|
2,346,580
|
|
2,323,205
|
|
4,623,187
|
|
||
|
(1)
|
The gross value of shares issued was
$129.0 million
,
$85.1 million
and
$108.7 million
for the
years ended
December 31, 2018, 2017 and 2016
, respectively, based on the closing price of a Class A share at the time of issuance.
|
|
(2)
|
Cash paid for tax liabilities associated with net share settlement was
$43.7 million
,
$31.7 million
and
$40.7 million
for the
years ended
December 31, 2018, 2017 and 2016
, respectively.
|
|
(3)
|
Certain Apollo employees receive a portion of the profit sharing proceeds of certain funds in the form of (a) restricted Class A shares of AGM that they are required to purchase with such proceeds or (b) RSUs, in each case which equity-based awards generally vest over
three
years. These equity-based awards are granted under the Company's 2007 Equity Plan. To prevent dilution on account of these awards, Apollo may, in its discretion, repurchase Class A shares on the open market and retire them. During the
years ended
December 31, 2018, 2017 and 2016
, we issued
927,020
,
495,326
and
27,151
of such restricted shares and
85,371
,
zero
and
zero
of such RSUs under the 2007 Equity Plan, respectively, and repurchased
1,093,867
,
413,850
and
27,151
Class A shares in open-market transactions not pursuant to a publicly-announced repurchase plan or program, respectively. In addition, there were
41,674
,
4,737
and
2,117
restricted shares forfeited during the
years ended
December 31, 2018, 2017 and 2016
, respectively.
|
Additionally, during the
years ended
December 31, 2018, 2017 and 2016
,
1,608,009
,
233,248
and
954,447
Class A shares were repurchased in open market transactions as part of the publicly announced share repurchase program adopted in February 2016, respectively, and such shares were subsequently canceled by the Company. The Company paid
$55.4 million
,
$6.9 million
and
$12.9 million
for these open market share repurchases during the
years ended
December 31, 2018, 2017 and 2016
, respectively.
Preferred Share Issuance
On March 7, 2017, Apollo issued
11,000,000
6.375%
Series A Preferred shares (the “Series A Preferred shares”) for gross proceeds of
$275.0 million
, or
$264.4 million
net of issuance costs and on March 19, 2018, Apollo issued
12,000,000
6.375%
Series B Preferred shares (the “Series B Preferred shares” and collectively with the Series A Preferred shares, the “Preferred shares”) for gross proceeds of
$300.0 million
, or
$289.8 million
net of issuance costs. When, as and if declared by the manager of Apollo, distributions on the Preferred shares will be payable quarterly on March 15, June 15, September 15 and December 15 of each year, beginning on June 15, 2018 for the Series B Preferred shares, at a rate per annum equal to
6.375%
. Distributions on the Preferred shares are discretionary and non-cumulative.
Subject to certain exceptions, unless distributions have been declared and paid or declared and set apart for payment on the Preferred shares for a quarterly distribution period, during the remainder of that distribution period Apollo may not declare or pay or set apart payment for distributions on any Class A shares or any other equity securities that the Company may issue in the future ranking as to the payment of distributions, junior to the Preferred shares (“Junior Shares”) and Apollo may not repurchase any Junior Shares. These restrictions were not applicable during the initial distribution period, which was the period from March 19, 2018 to but excluding June 15, 2018 for the Series B Preferred shares.
The Series A Preferred shares and the Series B Preferred shares may be redeemed at Apollo’s option, in whole or in part, at any time on or after March 15, 2022 and March 15, 2023, respectively, at a price of
$25.00
per Preferred share, plus declared and unpaid distributions to, but excluding, the redemption date, without payment of any undeclared distributions. Holders of the Preferred shares will have no right to require the redemption of the Preferred shares and there is no maturity date.
If a certain change of control event or a certain tax redemption event occurs prior to March 15, 2022 and March 15, 2023 for the Series A Preferred shares and the Series B Preferred shares, respectively, the Preferred shares may be redeemed at Apollo’s option, in whole but not in part, upon at least
30
days’ notice, within
60
days of the occurrence of such change of control event or such tax redemption event, as applicable, at a price of
$25.25
per Preferred share, plus declared and unpaid distributions to, but excluding, the redemption date, without payment of any undeclared distributions. If a certain rating agency event occurs prior to March 15, 2023, the Series B Preferred shares may be redeemed at Apollo’s option, in whole but not in part, upon at least
30
days’ notice, within
60
days of the occurrence of such rating agency event, at a price of
$25.50
per Series B Preferred share,
-
193
-
APOLLO GLOBAL MANAGEMENT, LLC
NOTES TO CONSOLIDATED
FINANCIAL STATEMENTS
(dollars in thousands, except share data, except where noted)
plus declared and unpaid distributions to, but excluding, the redemption date, without payment of any undeclared distributions. If (i) a change of control event occurs (whether before, on or after March 15, 2022 and March 15, 2023 for the Series A Preferred shares and the Series B Preferred shares, respectively) and (ii) Apollo does not give notice prior to the 31st day following the change of control event to redeem all the outstanding Preferred shares, the distribution rate per annum on the Preferred shares will increase by
5.00%
, beginning on the 31st day following such change of control event.
The Preferred shares are not convertible into Class A shares and have no voting rights, except in limited circumstances as provided in the Company’s limited liability company agreement. In connection with the issuance of the Preferred shares, certain Apollo Operating Group entities issued for the benefit of Apollo a series of preferred units with economic terms that mirror those of the Preferred shares.
The table below summarizes the distributions on the Preferred shares:
|
For the Years Ended December 31,
|
||||||||||
|
2018
|
2017
|
2016
|
||||||||
|
Series A Preferred Shares total distribution
|
$
|
17,531
|
|
$
|
13,538
|
|
—
|
|
||
|
Series B Preferred Shares total distribution
|
14,131
|
|
—
|
|
—
|
|
||||
Distributions
The table below presents information regarding the quarterly distributions which were made at the sole discretion of the manager of the Company (in millions, except per share data). Certain subsidiaries of AGM may be subject to U.S. federal, state, local and non-U.S. income taxes at the entity level and may pay taxes and/or make payments under the tax receivable agreement in a given fiscal year; therefore, the net amounts ultimately distributed by AGM to its Class A shareholders in respect of each fiscal year are generally expected to be less than the net amounts distributed to AOG Unitholders.
|
Distribution Declaration Date
|
Distribution per Class A Share
|
Distribution Payment Date
|
Distribution to Class A Shareholders
|
Distribution to Non-Controlling Interest Holders in the Apollo Operating Group
|
Total Distributions from Apollo Operating Group
|
Distribution Equivalents on Participating Securities
|
||||||||||||||||
|
February 3, 2016
|
$
|
0.28
|
|
February 29, 2016
|
$
|
51.4
|
|
$
|
60.5
|
|
$
|
111.9
|
|
$
|
2.1
|
|
||||||
|
May 6, 2016
|
0.25
|
|
May 31, 2016
|
46.0
|
|
54.0
|
|
100.0
|
|
1.8
|
|
|||||||||||
|
August 3, 2016
|
0.37
|
|
August 31, 2016
|
68.4
|
|
79.9
|
|
148.3
|
|
2.4
|
|
|||||||||||
|
October 28, 2016
|
0.35
|
|
November 30, 2016
|
64.9
|
|
75.4
|
|
140.3
|
|
2.1
|
|
|||||||||||
|
For the year ended December 31, 2016
|
$
|
1.25
|
|
$
|
230.7
|
|
$
|
269.8
|
|
$
|
500.5
|
|
$
|
8.4
|
|
|||||||
|
February 3, 2017
|
$
|
0.45
|
|
February 28, 2017
|
$
|
84.2
|
|
$
|
97.0
|
|
$
|
181.2
|
|
$
|
2.9
|
|
||||||
|
April 13, 2017
|
—
|
|
April 13, 2017
|
—
|
|
20.5
|
|
(1)
|
20.5
|
|
—
|
|
||||||||||
|
April 28, 2017
|
0.49
|
|
May 31, 2017
|
94.5
|
|
102.9
|
|
197.4
|
|
3.3
|
|
|||||||||||
|
August 2, 2017
|
0.52
|
|
August 31, 2017
|
100.6
|
|
108.8
|
|
209.4
|
|
3.2
|
|
|||||||||||
|
November 1, 2017
|
0.39
|
|
November 30, 2017
|
75.6
|
|
81.6
|
|
157.2
|
|
2.4
|
|
|||||||||||
|
For the year ended December 31, 2017
|
$
|
1.85
|
|
$
|
354.9
|
|
$
|
410.8
|
|
$
|
765.7
|
|
$
|
11.8
|
|
|||||||
|
February 1, 2018
|
$
|
0.66
|
|
February 28, 2018
|
$
|
133.0
|
|
$
|
133.7
|
|
$
|
266.7
|
|
$
|
5.4
|
|
||||||
|
April 12, 2018
|
—
|
|
April 12, 2018
|
—
|
|
50.5
|
|
(1)
|
50.5
|
|
—
|
|
||||||||||
|
May 03, 2018
|
0.38
|
|
May 31, 2018
|
76.6
|
|
77.0
|
|
153.6
|
|
4.1
|
|
|||||||||||
|
August 2, 2018
|
0.43
|
|
August 31, 2018
|
86.5
|
|
87.1
|
|
173.6
|
|
4.2
|
|
|||||||||||
|
November 1, 2018
|
0.46
|
|
November 30, 2018
|
92.6
|
|
93.0
|
|
185.6
|
|
4.4
|
|
|||||||||||
|
For the year ended December 31, 2018
|
$
|
1.93
|
|
$
|
388.7
|
|
$
|
441.3
|
|
$
|
830.0
|
|
$
|
18.1
|
|
|||||||
|
(1)
|
On April 13, 2017 and April 12, 2018, the Company made a
$0.10
and
$0.25
per AOG Unit pro rata distribution, respectively, to the Non-Controlling Interest holders in the Apollo Operating Group, in connection with taxes and payments made under the tax receivable agreement. See note
14
for more information regarding the tax receivable agreement.
|
-
194
-
APOLLO GLOBAL MANAGEMENT, LLC
NOTES TO CONSOLIDATED
FINANCIAL STATEMENTS
(dollars in thousands, except share data, except where noted)
Non-Controlling Interests
The table below presents equity interests in Apollo’s consolidated, but not wholly-owned, subsidiaries and funds. Net income and comprehensive income attributable to Non-Controlling Interests consisted of the following:
|
For the Years Ended December 31,
|
|||||||||||
|
|
2018
|
2017
|
2016
|
||||||||
|
Net income attributable to Non-Controlling Interests in consolidated entities:
|
|||||||||||
|
Interest in management companies and a co-investment vehicle
(1)
|
$
|
4,176
|
|
$
|
4,415
|
|
$
|
7,403
|
|
||
|
Other consolidated entities
|
27,472
|
|
4,476
|
|
(1,614
|
)
|
|||||
|
Net income attributable to Non-Controlling Interests in consolidated entities
|
$
|
31,648
|
|
$
|
8,891
|
|
$
|
5,789
|
|
||
|
Net income attributable to Non-Controlling Interests in the Apollo Operating Group:
|
|||||||||||
|
Net income
|
$
|
19,251
|
|
$
|
1,443,639
|
|
$
|
970,307
|
|
||
|
Net income attributable to Non-Controlling Interests in consolidated entities
|
(31,648
|
)
|
(8,891
|
)
|
(5,789
|
)
|
|||||
|
Net income (loss) after Non-Controlling Interests in consolidated entities
|
(12,397
|
)
|
1,434,748
|
|
964,518
|
|
|||||
|
Adjustments:
|
|||||||||||
|
Income tax provision
(2)
|
86,021
|
|
325,945
|
|
90,707
|
|
|||||
|
NYC UBT and foreign tax benefit
(3)
|
(9,764
|
)
|
(9,798
|
)
|
(9,899
|
)
|
|||||
|
Net loss in non-Apollo Operating Group entities
|
(35,072
|
)
|
(200,225
|
)
|
(3,156
|
)
|
|||||
|
Net income attributable to Series A Preferred Shareholders
|
(17,531
|
)
|
(13,538
|
)
|
—
|
|
|||||
|
Net income attributable to Series B Preferred Shareholders
|
(14,131
|
)
|
—
|
|
—
|
|
|||||
|
Total adjustments
|
9,523
|
|
102,384
|
|
77,652
|
|
|||||
|
Net income (loss) after adjustments
|
(2,874
|
)
|
1,537,132
|
|
1,042,170
|
|
|||||
|
Weighted average ownership percentage of Apollo Operating Group
|
50.3
|
%
|
52.5
|
%
|
54.0
|
%
|
|||||
|
Net income (loss) attributable to Non-Controlling Interests in Apollo Operating Group
|
$
|
(2,021
|
)
|
$
|
805,644
|
|
$
|
561,668
|
|
||
|
Net income attributable to Non-Controlling Interests
|
$
|
29,627
|
|
$
|
814,535
|
|
$
|
567,457
|
|
||
|
Other comprehensive income (loss) attributable to Non-Controlling Interests
|
(17,409
|
)
|
7,180
|
|
(2,587
|
)
|
|||||
|
Comprehensive Income Attributable to Non-Controlling Interests
|
$
|
12,218
|
|
$
|
821,715
|
|
$
|
564,870
|
|
||
|
(1)
|
Reflects the remaining interest held by certain individuals who receive an allocation of income from certain of the credit funds managed by Apollo.
|
|
(2)
|
Reflects all taxes recorded in our
consolidated
statements of operations. Of this amount, U.S. federal, state, and local corporate income taxes attributable to APO Corp. are added back to income of the Apollo Operating Group before calculating Non-Controlling Interests as the income allocable to the Apollo Operating Group is not subject to such taxes.
|
|
(3)
|
Reflects New York City Unincorporated Business Tax (“NYC UBT”) and foreign taxes that are attributable to the Apollo Operating Group and its subsidiaries related to its operations in the U.S. as partnerships and in non-U.S. jurisdictions as corporations. As such, these amounts are considered in the income attributable to the Apollo Operating Group.
|
14
. RELATED PARTY TRANSACTIONS AND INTERESTS IN CONSOLIDATED ENTITIES
Management fees, transaction and advisory fees and reimbursable expenses from the funds the Company manages and their portfolio companies are included in due from related parties in the
consolidated
statements of financial condition. The Company also typically facilitates the payment of certain operating costs incurred by the funds that it manages as well as their related parties. These costs are normally reimbursed by such funds and are included in due from related parties. Other related party transactions include loans to employees and periodic sales of ownership interests in Apollo funds to employees. Due from related parties and due to related parties are comprised of the following:
-
195
-
APOLLO GLOBAL MANAGEMENT, LLC
NOTES TO CONSOLIDATED
FINANCIAL STATEMENTS
(dollars in thousands, except share data, except where noted)
|
As of
December 31, 2018 |
As of
December 31, 2017 |
||||||
|
Due from Related Parties:
|
|||||||
|
Due from credit funds
|
$
|
175,562
|
|
$
|
128,198
|
|
|
|
Due from private equity funds
|
14,526
|
|
18,120
|
|
|||
|
Due from real assets funds
|
26,063
|
|
20,105
|
|
|||
|
Due from portfolio companies
|
67,740
|
|
37,366
|
|
|||
|
Due from Contributing Partners, employees and former employees
|
94,217
|
|
58,799
|
|
|||
|
Total Due from Related Parties
|
$
|
378,108
|
|
$
|
262,588
|
|
|
|
Due to Related Parties:
|
|||||||
|
Due to Managing Partners and Contributing Partners
|
$
|
285,598
|
|
$
|
333,379
|
|
|
|
Due to credit funds
|
46,554
|
|
63,491
|
|
|||
|
Due to private equity funds
|
92,968
|
|
30,848
|
|
|||
|
Due to real assets funds
|
315
|
|
283
|
|
|||
|
Distributions payable to employees
|
—
|
|
12
|
|
|||
|
Total Due to Related Parties
|
$
|
425,435
|
|
$
|
428,013
|
|
|
Tax Receivable Agreement and Other
Subject to certain restrictions, each of the Managing Partners and Contributing Partners has the right to exchange their vested AOG Units for the Company’s Class A shares. Certain Apollo Operating Group entities have made an election under Section 754 of the U.S. Internal Revenue Code of 1986, as amended (the “Internal Revenue Code”), which will result in an adjustment to the tax basis of the assets owned by the Apollo Operating Group at the time of the exchange. These exchanges will result in increases in tax deductions that will reduce the amount of tax that APO Corp. will otherwise be required to pay in the future.
The tax receivable agreement provides for the payment to the Managing Partners and Contributing Partners of
85%
of the amount of cash savings, if any, in U.S. federal, state, local and foreign income taxes that APO Corp. would realize as a result of the increases in tax basis of assets that resulted from the 2007 Reorganization and exchanges of AOG Units for Class A shares. APO Corp. retains the benefit from the remaining
15%
of actual cash tax savings. If the Company does not make the required annual payment on a timely basis as outlined in the tax receivable agreement, interest is accrued on the balance until the payment date. These payments are expected to occur approximately over the next
15 years
.
As a result of the exchanges of AOG Units for Class A shares during the
years ended
December 31, 2018, 2017 and 2016
, a
$37.9 million
,
$45.0 million
and
$6.2 million
liability was recorded, respectively, to estimate the amount of the future expected payments to be made by APO Corp. to the Managing Partners and Contributing Partners pursuant to the tax receivable agreement.
In April 2018, Apollo made a
$50.3 million
cash payment pursuant to the tax receivable agreement resulting from the realized tax benefit for the 2017 tax year. Additionally, in connection with this payment, the Company made a corresponding pro rata distribution of
$50.5 million
(
$0.25
per AOG Unit) to the Non-Controlling Interest holders in the Apollo Operating Group. In April 2017, Apollo made a
$17.9 million
cash payment pursuant to the tax receivable agreement resulting from the realized tax benefit for the 2016 tax year. Additionally, in connection with this payment, the Company made a corresponding pro rata distribution of
$20.5 million
(
$0.10
per AOG Unit) to the Non-Controlling Interest holders in the Apollo Operating Group.
During the year ended
December 31, 2018
, the Company remeasured the tax receivable agreement liability and recorded
$35.4 million
in other income, net in the consolidated statements of operations due to a change in estimated state tax rates during the year. During the year ended
December 31, 2017
, the Company remeasured the tax receivable agreement liability and recorded
$200.2 million
in other income, net in the consolidated statements of operations due to changes in estimated tax rates resulting from legislative reforms in the TCJA. During the year ended
December 31, 2016
, Company remeasured the tax receivable agreement liability and recorded
$3.2 million
in other income, net in the consolidated statements of operations due to changes in estimated tax rates.
-
196
-
APOLLO GLOBAL MANAGEMENT, LLC
NOTES TO CONSOLIDATED
FINANCIAL STATEMENTS
(dollars in thousands, except share data, except where noted)
Due from Contributing Partners, Employees and Former Employees
As of
December 31, 2018
and
December 31, 2017
, due from Contributing Partners, Employees and Former Employees includes various amounts due to the Company including employee loans and return of profit sharing distributions. As of
December 31, 2018
and
December 31, 2017
, the balance included interest-bearing employee loans receivable of
$16.8 million
and
$15.3 million
, respectively. The outstanding principal amount of the loans as well as all accrued and unpaid interest is required to be repaid at the earlier of the eighth anniversary of the date of the relevant loan or at the date of the relevant employee’s resignation from the Company.
The Company recorded a receivable from the Contributing Partners and certain employees and former employees for the potential return of profit sharing distributions that would be due if certain funds were liquidated as of
December 31, 2018
and
December 31, 2017
of
$66.3 million
and
$36.4 million
, respectively.
Indemnity
Performance revenues from certain funds can be distributed to the Company on a current basis, but is subject to repayment by the subsidiaries of the Apollo Operating Group that act as general partners of the funds in the event that certain specified return thresholds are not ultimately achieved. The Managing Partners, Contributing Partners and certain other investment professionals have personally guaranteed, subject to certain limitations, the obligations of these subsidiaries in respect of this general partner obligation. Such guarantees are several and not joint and are limited to a particular Managing Partner’s or Contributing Partner’s distributions. Pursuant to an existing shareholders agreement, the Company has agreed to indemnify each of the Company’s Managing Partners and certain Contributing Partners against all amounts that they pay pursuant to any of these personal guarantees in favor of certain funds that the Company manages (including costs and expenses related to investigating the basis for or objecting to any claims made in respect of the guarantees) for all interests that the Company’s Managing Partners and Contributing Partners have contributed or sold to the Apollo Operating Group.
Accordingly, in the event that the Company’s Managing Partners, Contributing Partners and certain investment professionals are required to pay amounts in connection with a general partner obligation for the return of previously made distributions with respect to Fund IV, Fund V and Fund VI, the Company will be obligated to reimburse the Company’s Managing Partners and certain Contributing Partners for the indemnifiable percentage of amounts that they are required to pay even though the Company did not receive the certain distribution to which that general partner obligation related. The Company recorded an indemnification liability of
$12.2 million
and
$10.5 million
as of
December 31, 2018
and
December 31, 2017
, respectively.
Due to Credit and Private Equity Funds
Based upon an assumed liquidation of certain of the credit and private equity funds the Company manages, the Company has recorded a general partner obligation to return previously distributed performance allocations, which represents amounts due to these funds. The general partner obligation is recognized based upon an assumed liquidation of a fund’s net assets as of the reporting date. The actual determination and any required payment of any such general partner obligation would not take place until the final disposition of a fund’s investments based on the contractual termination of the fund or as otherwise set forth in the respective limited partnership agreement or other governing document of the fund.
There was a general partner obligation to return previously distributed performance allocations related to certain private equity funds of
$93.0 million
and
$30.1 million
accrued as of
December 31, 2018
and
December 31, 2017
, respectively. There was a general partner obligation to return previously distributed performance allocations related to certain credit funds of
$44.1 million
and
$56.1 million
accrued as of
December 31, 2018
and
December 31, 2017
, respectively.
Athene
Athene Holding was founded in 2009 to capitalize on favorable market conditions in the dislocated life insurance sector. Athene Holding, through its subsidiaries, is a leading retirement services company that issues, reinsures and acquires retirement savings products designed for the increasing number of individuals and institutions seeking to fund retirement needs. The products and services offered by Athene include fixed and fixed indexed annuity products, reinsurance services offered to third-party annuity providers; and institutional products, such as funding agreements. Athene Holding became an effective registrant under the Exchange Act on December 9, 2016. Athene Holding is currently listed on the New York Stock Exchange (NYSE) under the symbol “ATH”.
-
197
-
APOLLO GLOBAL MANAGEMENT, LLC
NOTES TO CONSOLIDATED
FINANCIAL STATEMENTS
(dollars in thousands, except share data, except where noted)
The Company provides asset management and advisory services to Athene, including asset allocation services, direct asset management services, asset and liability matching management, mergers and acquisitions, asset diligence hedging and other asset management services.
The Company, through its consolidated subsidiary Athene Asset Management, or AAM, earns management fees of
0.40%
per year on all assets that it manages in accounts owned by Athene in the U.S. and Bermuda or in accounts supporting reinsurance ceded to U.S. and Bermuda subsidiaries of Athene Holding by third-party insurers (collectively, the “Athene Accounts”) up to
$65.846 billion
(the level of assets in the Athene North American Accounts as of December 31, 2016) and
0.30%
per year on all assets in excess of
$65.846 billion
, respectively, subject to certain discounts and exceptions.
Athora
The Company, through its consolidated subsidiary, AAME, provides investment advisory services to certain portfolio companies of Apollo funds and Athora, a strategic platform established to acquire or reinsure blocks of insurance business in the German and broader European life insurance market (collectively, the “Athora Accounts”).
Athene and Athora Sub-Advised
The Company, through AAM, provides sub-advisory services with respect to a portion of the assets in the Athene Accounts. In addition, Apollo, through AAME, provides sub-advisory services with respect to a portion of the assets in certain portfolio companies of Apollo funds and the Athora Accounts.
From time to time, Athene also invests in funds and investment vehicles that Apollo manages. The Company refers to such assets which are invested directly as “Athene Assets Directly Invested.”
The Company broadly refers to “Athene Sub-Advised” assets as those assets in the Athene Accounts which the Company explicitly sub-advises as well as Athene Assets Directly Invested. The Company broadly refers to “Athora Sub-Advised” assets as those assets in the Athora Accounts which the Company explicitly sub-advises as well as those assets in the Athora Accounts which are invested directly in funds and investment vehicles Apollo manages.
With limited exceptions, the sub-advisory fee arrangements between the Company, Athene, Athora and the fee arrangements with respect to Athene Assets Directly Invested are presented in the following table:
|
As of
December 31, 2018 |
||
|
Athene Accounts sub-advised by AAM
(1)
:
|
||
|
Assets up to $10.0 billion
|
0.40
|
%
|
|
Assets between $10.0 billion to $12.4 billion
|
0.35
|
%
|
|
Assets between $12.4 billion to $16.0 billion
|
0.40
|
%
|
|
Assets in excess of $16.0 billion
|
0.35
|
%
|
|
Athora Accounts sub-advised by AAME
|
0.35
|
%
|
|
Athene Assets Directly Invested
(2)
|
0% to 1.75%
|
|
|
(1)
|
The sub-advisory fees with respect to the assets in the Athene North American Accounts are in addition to the management fee earned by the Company described above.
|
|
(2)
|
With respect to Athene Assets Directly Invested, Apollo earns performance revenues of
0%
to
20%
in addition to the fees presented above. The fees set forth above with respect to the Athene Assets Directly Invested, and the performance revenues that Apollo earns on such assets, are in addition to the fees described above, with certain limited exceptions.
|
Investment Management Agreement Proposed Amendments - Athene Asset Management
On September 20, 2018, Athene and Apollo agreed to revise the existing fee arrangements between Athene and Apollo (the “proposed amended fee agreement”). The proposed amended fee agreement remains subject to approval by Athene’s shareholders in 2019 of a bye-law amendment providing that Athene will not elect to terminate the investment management arrangement between Athene and Apollo, except for cause, for a period of
four years
from the date of the bye-law amendment and
-
198
-
APOLLO GLOBAL MANAGEMENT, LLC
NOTES TO CONSOLIDATED
FINANCIAL STATEMENTS
(dollars in thousands, except share data, except where noted)
thereafter only on each successive
two
-year anniversary of the expiration of the initial
four
-year period. Following the approval by Athene’s shareholders, the proposed amended fee agreement would have retroactive effect to the month beginning January 1, 2019. The proposed amended fee agreement amends the existing management fee and sub-advisory terms described above and provides for sub-allocation fees which vary based on portfolio allocation differentiation.
AAA Investments
Apollo, as general partner of AAA Investments, is generally entitled to performance allocations equal to
20%
of the realized returns (net of related expenses, including borrowing costs) on AAA Investments’ investment in Athene Holding, except that Apollo is not entitled to receive any performance allocations with respect to the shares of Athene Holding that were acquired (and not in satisfaction of prior commitments to buy such shares) by AAA Investments in the contribution of certain assets by AAA to Athene in October 2012.
The following table presents the performance allocations earned from AAA Investments:
|
For the Years Ended December 31,
|
|||||||||||
|
2018
|
2017
|
2016
|
|||||||||
|
Performance Allocations from AAA Investments, net
(1)
|
$
|
(5,158
|
)
|
$
|
23,119
|
|
$
|
47,785
|
|
||
|
(1)
|
Net of related profit sharing expense.
|
The following table presents the revenues earned in aggregate from Athene, Athora and AAA Investments:
|
For the Years Ended December 31,
|
|||||||||||
|
2018
|
2017
|
2016
|
|||||||||
|
Revenues earned in aggregate from Athene, Athora and AAA Investments, net
(1)(2)
|
$
|
310,412
|
|
$
|
529,150
|
|
$
|
547,031
|
|
||
|
(1)
|
Consisting of management fees, sub-advisory fees, performance revenues from Athene, Athora and AAA Investments, as applicable (net of related profit sharing expense) and changes in the market value of the Athene Holding shares owned directly by Apollo. These amounts exclude the deferred revenue recognized as management fees associated with the vesting of AHL Awards granted to employees of Apollo as further described in note
12
.
|
|
(2)
|
Gains (losses) on the market value of the shares of Athene Holding owned directly by Apollo were
$(186.6) million
,
$95.5 million
and
$138.5 million
for the
years ended
December 31, 2018, 2017 and 2016
, respectively.
|
During the
year ended
December 31, 2018
, the Company received performance allocations of
$169.9 million
and settled
$46.6 million
of profit sharing expense in the form of Athene Holding shares. The following table presents performance allocations and profit sharing payable from AAA Investments:
|
As of
December 31, 2018 |
As of
December 31, 2017 |
||||||
|
Performance allocations
|
$
|
1,611
|
|
$
|
178,600
|
|
|
|
Profit sharing payable
|
442
|
|
49,038
|
|
|||
The Company’s economic ownership interest in Athene Holding is comprised of the following:
|
As of
December 31, 2018 |
(1)
|
As of
December 31, 2017 |
(1)
|
|||
|
Indirect interest in Athene Holding:
|
||||||
|
Interest in AAA
|
2.2
|
%
|
2.2
|
%
|
||
|
Plus: Interest in AAA Investments
|
0.1
|
%
|
0.1
|
%
|
||
|
Total Interest in AAA and AAA Investments
|
2.3
|
%
|
2.3
|
%
|
||
|
Multiplied by: AAA Investments’ interest in Athene Holding
|
—
|
%
|
14.0
|
%
|
||
|
Indirect interest in Athene Holding
|
—
|
%
|
0.3
|
%
|
||
|
Plus: Direct interest in Athene Holding
|
10.2
|
%
|
8.5
|
%
|
||
|
Total interest in Athene Holding
|
10.2
|
%
|
8.8
|
%
|
||
-
199
-
APOLLO GLOBAL MANAGEMENT, LLC
NOTES TO CONSOLIDATED
FINANCIAL STATEMENTS
(dollars in thousands, except share data, except where noted)
|
(1)
|
Ownership interest percentages are based on approximate share count as of the reporting date.
|
AAA Investments Credit Agreement
On April 30, 2015, Apollo entered into a revolving credit agreement with AAA Investments (“AAA Investments Credit Agreement”). Under the terms of the AAA Investments Credit Agreement, the Company shall make available to AAA Investments one or more advances at the discretion of AAA Investments in the aggregate amount not to exceed a balance of
$10.0 million
at an applicable rate of LIBOR plus
1.5%
. The Company receives an annual commitment fee of
0.125%
on the unused portion of the loan. As of
December 31, 2018
and
December 31, 2017
,
$6.7 million
and
$4.5 million
, respectively, had been advanced by the Company and remained outstanding on the AAA Investments Credit Agreement. AAA Investments was obligated to pay the aggregate borrowings plus accrued interest at the earlier of (a) the third anniversary of the closing date, or (b) the date that was
fifteen months
following the initial public offering of shares of Athene Holding Ltd. (the “Maturity Date”). On January 30, 2019, the Company and AAA agreed to extend the maturity date of the AAA Investments Credit Agreement to April 30, 2020. See note
17
for more information regarding the AAA Investments Credit Agreement.
AINV Amended and Restated Investment Advisory Management Agreement
On May 17, 2018, the board of directors of AINV approved an amended and restated investment advisory management agreement with Apollo Investment Management, L.P., the Company’s consolidated subsidiary, which reduced the base management fee and revised the incentive fee on income to include a total return requirement. Effective April 1, 2018, the base management fee was reduced from
2.0%
to
1.5%
of the average value of AINV’s gross assets (excluding cash or cash equivalents but including other assets purchased with borrowed amounts) at the end of each of the two most recently completed calendar quarters; provided, however, the base management fee would be
1.0%
of the average value of AINV’s gross assets (excluding cash or cash equivalents but including other assets purchased with borrowed amounts) that exceeds the product of (i)
200%
and (ii) the value of AINV’s net asset value at the end of the most recently completed calendar quarter. In addition, beginning January 1, 2019, the incentive fee on income calculation included a total return requirement with a rolling twelve quarter look-back starting from April 1, 2018. The incentive fee rate remained
20%
and the performance threshold remained
1.75%
per quarter (
7%
annualized).
Regulated Entities
Apollo Global Securities, LLC (“AGS”) is a registered broker dealer with the SEC and is a member of the Financial Industry Regulatory Authority, subject to the minimum net capital requirements of the SEC. AGS was in compliance with these requirements at
December 31, 2018
. From time to time, this entity is involved in transactions with related parties of Apollo, including portfolio companies of the funds Apollo manages, whereby AGS earns underwriting and transaction fees for its services.
Other Transactions
The Company recognized
$3.8 million
and
$6.2 million
of other income in the
consolidated
statements of operations from the assignment of a CLO collateral management agreement to a related party during the years ended
December 31, 2018
and
2017
, respectively.
15
. COMMITMENTS AND CONTINGENCIES
Investment Commitments—
As a limited partner, general partner and manager of the Apollo funds, Apollo had unfunded capital commitments as of
December 31, 2018
and
December 31, 2017
of
$1.2 billion
and
$1.7 billion
, respectively, of which
$469 million
and
$823 million
related to Fund IX as of
December 31, 2018
and
December 31, 2017
, respectively.
Debt Covenants—
Apollo’s debt obligations contain various customary loan covenants. As of
December 31, 2018
, the Company was not aware of any instances of non-compliance with the financial covenants contained in the documents governing the Company’s debt obligations.
Litigation and Contingencies—
Apollo is, from time to time, party to various legal actions arising in the ordinary course of business including claims and lawsuits, reviews, investigations or proceedings by governmental and self-regulatory agencies regarding its business.
On April 15, 2013, Alfred J. Villalobos, the former principal of Arvco Capital Research (“Arvco”), a placement agent firm that Apollo at one time used, and related entities (the “Arvco Debtors”) brought a civil action in the United States Bankruptcy Court for the District of Nevada against Apollo. This action sought to recover purported fees the Arvco Debtors claimed Apollo
-
200
-
APOLLO GLOBAL MANAGEMENT, LLC
NOTES TO CONSOLIDATED
FINANCIAL STATEMENTS
(dollars in thousands, except share data, except where noted)
had not paid them for a portion of Arvco’s alleged placement agent services in connection with certain funds managed by Apollo. Subsequently, a Chapter 7 Trustee was appointed for the Arvco Debtors, and after a lengthy stay in light of a criminal case against Mr. Villalobos, and Mr. Villalobos’s death, the Trustee filed an amended complaint, and Apollo asserted counterclaims for indemnification. On March 20, 2017, the court granted Apollo’s motion to dismiss certain claims, leaving
two
breach of contract claims remaining. On October 20, 2017, the court granted summary judgment in favor of Apollo as to part of the remaining claims, and on August 2, 2018, the court granted summary judgment for Apollo on the remaining claims. On November 13, 2018, Apollo and the Trustee entered into a settlement agreement in which, in exchange for releases, the Trustee agreed not to appeal the grant of summary judgment in Apollo’s favor, and Apollo agreed to withdraw its counterclaims. The Court approved the settlement on January 3, 2019.
On June 18, 2014, BOKF N.A. (the “First Lien Trustee”), the successor indenture trustee under the indenture governing the First Lien Notes issued by Momentive Performance Materials, Inc. (“Momentive”), commenced a lawsuit in the Supreme Court for the State of New York, New York County against AGM and members of an ad hoc group of Second Lien Noteholders (including, but not limited to, Euro VI (BC) S.a.r.l.). The First Lien Trustee amended its complaint on July 2, 2014 (the “First Lien Intercreditor Action”). In the First Lien Intercreditor Action, the First Lien Trustee sought, among other things, a declaration that the defendants violated an intercreditor agreement entered into between holders of the First Lien Notes and holders of the second lien notes. On July 16, 2014, the successor indenture trustee under the indenture governing the 1.5 Lien Notes (the “1.5 Lien Trustee,” and, together with the First Lien Trustee, the “Indenture Trustees”) filed an action in the Supreme Court of the State of New York, New York County that was substantially similar to the First Lien Intercreditor Action (the “1.5 Lien Intercreditor Action,” and, together with the First Lien Intercreditor Action, the “Intercreditor Actions”). AGM subsequently removed the Intercreditor Actions to federal district court, and the Intercreditor Actions were automatically referred to the Bankruptcy Court adjudicating the Momentive chapter 11 bankruptcy cases. On August 15, 2014, the defendants in the Intercreditor Actions (including AGM) filed a motion to dismiss the 1.5 Lien Intercreditor Action and a motion for judgment on the pleadings in the First Lien Intercreditor Action (the “Dismissal Motions”). On September 30, 2014, the Bankruptcy Court granted the Dismissal Motions. Following the Bankruptcy Court’s denial of the Indenture Trustees’ attempts to amend their respective complaints, the Indenture Trustees appealed the orders issued by the Bankruptcy Court. The federal district court consolidated those appeals. On November 30, 2018, the federal district court issued its opinion affirming the Bankruptcy Court’s orders in their entirety.
On March 4, 2016, the Public Employees Retirement System of Mississippi filed a putative securities class action against Sprouts Farmers Market, Inc. (“SFM”), several SFM directors (including Andrew Jhawar, an Apollo partner), AP Sprouts Holdings, LLC and AP Sprouts Holdings (Overseas), L.P. (the “AP Entities”), which are controlled by entities managed by Apollo affiliates, and two underwriters of a March 2015 secondary offering of SFM common stock. The AP Entities sold SFM common stock in the March 2015 secondary offering. The complaint, filed in Arizona Superior Court and captioned Public Employees Retirement System of Mississippi v. Sprouts Farmers Market, Inc. (CV2016-050480), alleges that SFM filed a materially misleading registration statement for the secondary offering that incorporated alleged misrepresentations in SFM’s 2014 annual report regarding SFM’s business prospects, and failed to disclose alleged accelerating produce deflation. Plaintiff alleged causes of action against the AP Entities for violations of Sections 11 and 15 of the Securities Act of 1933, seeking compensatory damages for alleged losses sustained from a decline in SFM’s stock price. Defendants moved to dismiss the action, and the court dismissed the Section 11 claim against the AP Entities but not the Section 15 claim. On December 27, 2018, the parties executed a settlement agreement, and on December 28, 2018, the parties filed a motion for preliminary approval of the settlement.
On June 20, 2016 Banca Carige S.p.A. (“Carige”) commenced a lawsuit in the Court of Genoa (Italy) (No. 8965/2016), against its former Chairman, its former Chief Executive Officer, AGM and certain entities (the “Apollo Entities”) organized and owned by investment funds managed by affiliates of AGM. The complaint alleged that AGM and the Apollo Entities (i) aided and abetted breaches of fiduciary duty to Carige allegedly committed by Carige’s former Chairman and former CEO in connection with the sale to the Apollo Entities of Carige subsidiaries engaged in the insurance business; and (ii) took wrongful actions aimed at weakening Banca Carige’s financial condition supposedly to facilitate an eventual acquisition of Carige. The causes of action were based in tort under Italian law. Carige purportedly seeks damages of
€450 million
in connection with the sale of the insurance businesses and
€800 million
for other losses. With judgment no. 3118/2018 published on December 6, 2018, the Court of Genoa fully rejected all the claims raised by Carige against AGM and the Apollo Entities, also awarding attorneys' fees in their favor for an amount of
€428,996.10
. Carige filed an appeal on January 3, 2019. A hearing before the Court of Appeals of Genoa is scheduled for April 30, 2019. Although the case appears to be in its final stages, no reasonable estimate of possible loss, if any, can be made at this time.
-
201
-
APOLLO GLOBAL MANAGEMENT, LLC
NOTES TO CONSOLIDATED
FINANCIAL STATEMENTS
(dollars in thousands, except share data, except where noted)
On December 12, 2016, the CORE Litigation Trust (the “Trust”), which was created under the Chapter 11 reorganization plan for CORE Media and other affiliated entities, including CORE Entertainment, Inc. (“CORE”), commenced an action in California Superior Court for Los Angeles County, captioned Core Litigation Trust v. Apollo Global Management, LLC, et al., Case No. BC 643732, that was stayed on October 3, 2017, in favor of litigating in New York state court. On November 9, 2017, the Trust commenced an action in the Supreme Court of the State of New York, captioned Core Litigation Trust v. Apollo Global Management, LLC, et al., Index No. 656856/2017. The complaint names as defendants: (i) AGM and certain AGM affiliates including the Apollo-managed funds that were CORE’s beneficial owners (the “CORE Funds”), (ii) Twenty-First Century Fox, Inc. (“Fox”) and certain Fox affiliates, (iii) Endemol USA Holding, Inc. (“Endemol”) and certain Endemol-affiliated entities, and (iv) the joint venture through which the CORE Funds and Fox beneficially owned CORE Media and Endemol Shine (the “JV”). The Trust asserts claims against (i) all defendants for tortiously interfering with
$360 million
in loans under the 2011 loan agreements entered into between CORE and certain Lenders, and (ii) certain defendants for alter-ego and de-facto merger. The Trust seeks
$240 million
in compensatory, unspecified punitive damages, pre-judgment interests, and costs and expenses. The Court has scheduled further oral argument on Defendants’ motions to dismiss the complaint for May 6, 2019. On April 27, 2018, the Trust filed an adversary complaint in the Southern District of New York Bankruptcy Court captioned Core Litigation Trust v. Apollo Global Management, LLC, et al., Adv. Pro. No. 18-01539. The complaint names as defendants (i) AGM and certain AGM affiliates including the CORE Funds, (iii) certain former CORE directors who are current or former employees of AGM subsidiaries (the “Directors”), (iv) CORE Entertainment Holdings (CORE’s direct parent), and (v) the JV (which the Trust voluntarily dismissed on August 24, 2018). The Trust asserts (i) fiduciary-duty breach claims against the Directors and an aiding-and-abetting claim against AGM for allegedly preventing CORE Media from investing in the JV, and (ii) fiduciary-duty breach claims against the Directors and Apollo CORE Holdings, aiding-and-abetting claims against all defendants, and a fraudulent conveyance claim against AGM related to CORE Media paying
$93 million
to satisfy a legal judgment in March 2015. The Trust seeks unspecified compensatory damages, to avoid and recover the
$93 million
judgment payment, pre-judgment interest, and costs and fees. Defendants’ motion to abstain or, in the alternative, to dismiss, which was argued on December 11, 2018, is pending. Apollo believes the claims in each action are without merit. Because the actions are in their early stages, no reasonable estimate of possible loss, if any, can be made at this time.
On August 3, 2017, a complaint was filed in the United States District Court for the Middle District of Florida against AGM, a senior partner of Apollo and a former principal of Apollo by Michael McEvoy on behalf of a purported class of employees of subsidiaries of CEVA Group, LLC (“CEVA Group”) who purchased shares in CEVA Investment Limited (“CIL”), the former parent company of CEVA Group. The complaint alleged that the defendants breached fiduciary duties to and defrauded the plaintiffs by inducing them to purchase shares in CIL and subsequently participating in a debt restructuring of CEVA Group in which shareholders of CIL did not receive a recovery. On February 9, 2018, the Bankruptcy Court for the Southern District of New York held that the claims asserted in the complaint were assets of CIL, which is a chapter 7 debtor, and that the complaint was null and void as a violation of the automatic stay. McEvoy subsequently revised his complaint to attempt to assert claims that do not belong to CIL. The amended complaint no longer names any individual defendants, but Apollo Management VI, L.P. and CEVA Group have been added as defendants. The amended complaint purports to seek damages of approximately
€30 million
and asserts, among other things, claims for violations of the Investment Advisers Act of 1940, breach of fiduciary duties, and breach of contract. On December 7, 2018, after receiving permission from the Bankruptcy Court, McEvoy filed his amended complaint in the District Court in Florida. Apollo is currently seeking dismissal of this action and believes that there is no merit to the claims. Additionally, as the case is in its early stages, no reasonable estimate of possible loss, if any, can be made at this time.
On December 21, 2017, Harbinger Capital Partners II, LP, Harbinger Capital Partners Master Fund I, Ltd., Harbinger Capital Partners Special Situations Fund, L.P., Harbinger Capital Partners Special Situations GP, LLC, Harbinger Capital Partners Offshore Manager, L.L.C., Global Opportunities Breakaway Ltd. (in voluntary liquidation), and Credit Distressed Blue Line Master Fund, Ltd. (collectively, “Harbinger”) commenced an action in New York Supreme Court captioned Harbinger Capital Partners II LP et al. v. Apollo Global Management LLC, et al. (No. 657515/2017). The complaint names as defendants (i) AGM, (ii) the funds managed by Apollo that invested in SkyTerra Communications, Inc. (“SkyTerra”) equity before selling their interests to Harbinger under an April 2008 agreement that closed in 2010, and (iii)
six
former SkyTerra directors,
five
of whom are current or former Apollo employees. The complaint alleges that during the period of Harbinger’s various equity and debt investments in SkyTerra, from 2004 to 2010, Defendants concealed from Harbinger material defects in SkyTerra technology that was to be used to create a new mobile wi-fi network. The complaint alleges that Harbinger would not have made investments in SkyTerra totaling approximately
$1.9 billion
had it known of the defects, and that the public disclosure of these defects ultimately led to SkyTerra filing for bankruptcy in 2012 (after it had been renamed LightSquared). The complaint asserts claims against (i) all defendants for fraud, civil conspiracy, and negligent misrepresentation, (ii) AGM and the Apollo-managed funds only for breach of fiduciary duty, breach of contract, and unjust enrichment, and (iii) the SkyTerra director defendants only for aiding and abetting breach of
-
202
-
APOLLO GLOBAL MANAGEMENT, LLC
NOTES TO CONSOLIDATED
FINANCIAL STATEMENTS
(dollars in thousands, except share data, except where noted)
fiduciary duty. The complaint seeks
$1.9 billion
in damages, as well as punitive damages, interest, costs, and fees. On February 14, 2018, the parties filed a stipulation in the state court to stay the state court action until December 31, 2018. The Court entered the stay on February 21, 2018. On February 14, 2018, Defendants moved the United States Bankruptcy Court for the Southern District of New York to reopen the LightSquared bankruptcy proceeding for the limited purpose of enforcing Harbinger’s assignment and release in that bankruptcy of the claims that it asserts in the New York state court action. On February 23, 2018, Apollo filed a Notice of Adjournment on behalf of all parties that adjourned without date the hearing on the motion to reopen, to be rescheduled to a new date and time following the expiration of the state-court stay. On January 4, 2019, the state court entered a stipulation submitted by the parties extending the stay until April 3, 2019. On January 11, 2019, Apollo filed a Notice of Adjournment in the Bankruptcy Court on behalf of all parties that adjourned the hearing on the motion to reopen to May 29, 2019. Apollo believes these claims are without merit. Because this action is in its early stages, no reasonable estimate of possible loss, if any, can be made at this time.
On February 9, 2018, plaintiffs Joseph M. Dropp, Mary E. Dropp, Robert Levine, Susan Levine, and Kaarina Pakka filed a complaint in the United States District Court for the District of Nevada (the “Nevada Court”) against Apollo Management VIII, L.P. (“Management VIII”), AGM and Diamond Resorts International, Inc. (“Diamond”) and several of its affiliates and executives. Plaintiffs, who allege that they bought vacation interest points from Diamond, allege that the points are securities and that defendants violated federal securities laws by selling the points without registering them as securities. Plaintiffs also assert a “control person” claim against Management VIII and AGM. Plaintiffs assert their claims on their own behalf and on behalf of a purported class of Diamond customers who bought vacation interest points over a certain period of time. They seek injunctive relief prohibiting defendants from continuing to market and sell unregistered securities, the right to rescind their purchases, and unspecified compensatory damages. On April 11, 2018, Defendants filed motions to sever Ms. Pakka's claims from the claims of the other plaintiffs and to transfer those claims to the United States District Court for the District of Hawaii. On January 25, 2019, the Nevada Court entered an order granting defendants’ motion to compel the Dropps and Levines to arbitrate their claims individually and dismissing their claims without prejudice to pursue them in arbitration. The Nevada Court also severed Ms. Pakka’s claims and transferred the complaint as to Ms. Pakka only to the United States District Court for the District of Hawaii (the “Hawaii Court”). On January 28, 2019, the Hawaii Court entered an order directing Ms. Pakka to file an amended complaint to reflect only the claims that were transferred to that Court, after she obtains Hawaii counsel. Ms. Pakka has not yet filed an amended complaint. Apollo believes the claims in this action are without merit. Because this action is in the early stages, no reasonable estimate of possible loss, if any, can be made at this time.
Five
shareholders filed substantially similar putative class action lawsuits in the Circuit Court of the Fifteenth Judicial Circuit in and for Palm Beach County, Florida in March, April, and May 2018, alleging violations of the Securities Act in connection with the January 19, 2018 IPO of ADT Inc. common stock. The actions were consolidated on July 10, 2018, and the case was re-captioned In re ADT Inc. Shareholder Litigation. On August 24, 2018, the state-court plaintiffs filed a consolidated complaint naming as defendants ADT Inc., several ADT officers and directors, the IPO underwriters (including Apollo Global Securities, LLC), AGM and certain other Apollo affiliates. Plaintiffs generally allege that the registration statement and prospectus for the IPO contained false and misleading statements and failed to disclose material information about certain litigation in which ADT was involved, ADT’s efforts to protect its intellectual property, and competitive pressures ADT faced. Defendants filed motions to dismiss the consolidated complaint on October 23, 2018, and those motions are fully briefed. On May 21, 2018, a similar shareholder class action lawsuit was filed in the United States District Court for the Southern District of Florida, naming as defendants ADT, several officers and directors, and AGM. The federal action, captioned Perdomo v. ADT Inc., generally alleges that the registration statement was materially misleading because it failed to disclose ongoing deterioration in ADT’s financial results, along with certain customer and business metrics. On July 20, 2018, several alleged ADT shareholders filed competing motions to be named lead plaintiff in the federal action. On November 20, 2018, the court appointed a lead plaintiff, and on January 15, 2019, the lead plaintiff filed an amended complaint. The amended complaint names the same Apollo-affiliated defendants as the state-court action, along with three new Apollo entities. The defendants’ deadline to respond to the complaint is March 29, 2019. In September and October 2018,
four
shareholder derivative actions were also filed in the United States District Court for the Southern District of Florida. On November 19, 2018, the court consolidated the derivative actions, and on November 26, 2018, plaintiffs filed a notice of voluntary dismissal without prejudice. Based on the allegations in the complaints, Apollo believes that there is no merit to any of the claims against AGM or the other Apollo defendants. Thus, no reasonable estimate of possible loss, if any, can be made at this time.
On May 3, 2018, Caldera Holdings Ltd, Caldera Life Reinsurance Company, and Caldera Shareholder, L.P. (collectively, “Caldera”) filed a summons with notice in the Supreme Court of the State of New York, New York County, naming as defendants AGM, Apollo Management, L.P., Apollo Advisors VIII, L.P., Apollo Capital Management VIII, LLC, Athene Asset
-
203
-
APOLLO GLOBAL MANAGEMENT, LLC
NOTES TO CONSOLIDATED
FINANCIAL STATEMENTS
(dollars in thousands, except share data, except where noted)
Management, L.P., Athene Holding, Ltd., and Leon Black (collectively, “Defendants” and all but Athene Holding, Ltd., the “Apollo Defendants”). On July 12, 2018, Caldera filed a complaint, Index No. 652175/2018 (the “Complaint”), alleging three causes of action: (1) tortious interference with prospective business relations/prospective economic advantage; (2) defamation/trade disparagement/injurious falsehood; and (3) unfair competition. The Complaint seeks damages of no less than
$1.5 billion
, as well as exemplary and punitive damages, attorneys’ fees, interest, and an injunction.
D
efendants moved to dismiss the Complaint on September 21, 2018 and Caldera filed an amended complaint on January 21, 2019. The Apollo Defendants believe that the claims contained in the Complaint lack merit and intend to defend the case vigorously. Because this action is in the early stages, no reasonable estimate of possible loss, if any, can be made at this time.
Commitments and Contingencies—
Apollo leases office space and certain office equipment under various lease and sublease arrangements, which expire on various dates through 2036. As these leases expire, it can be expected that in the normal course of business, they will be renewed or replaced. Certain lease agreements contain renewal options, rent escalation provisions based on certain costs incurred by the landlord or other inducements provided by the landlord. Rent expense is accrued to recognize lease escalation provisions and inducements provided by the landlord, if any, on a straight-line basis over the lease term and renewal periods where applicable. Apollo has entered into various operating lease service agreements in respect of certain assets.
As of
December 31, 2018
, the approximate aggregate minimum future payments required for operating leases were as follows:
|
2019
|
2020
|
2021
|
2022
|
2023
|
Thereafter
|
Total
|
|||||||||||||||||||||
|
Aggregate minimum future payments
|
$
|
39,970
|
|
$
|
25,923
|
|
$
|
33,022
|
|
$
|
36,243
|
|
$
|
35,231
|
|
$
|
400,889
|
|
$
|
571,278
|
|
||||||
The Company received
$19.0 million
in proceeds in connection with the early termination of a lease during the year ended December 31, 2017 which was recorded in other income, net on the
consolidated
statements of operations.
Expenses related to non-cancellable contractual obligations for premises, equipment, auto and other assets were
$40.4 million
,
$38.2 million
and
$40.5 million
for the
years ended
December 31, 2018, 2017 and 2016
, respectively, and are included in general, administrative and other on the
consolidated
statements of operations.
Other long-term obligations relate to payments with respect to certain consulting agreements entered into by Apollo Investment Consulting LLC, a subsidiary of Apollo, as well as long-term service contracts. A significant portion of these costs are reimbursable by funds or portfolio companies. As of
December 31, 2018
, fixed and determinable payments due in connection with these obligations were as follows:
|
2019
|
2020
|
2021
|
2022
|
2023
|
Thereafter
|
Total
|
|||||||||||||||||||||
|
Other long-term obligations
|
$
|
21,677
|
|
$
|
1,761
|
|
$
|
1,511
|
|
$
|
927
|
|
$
|
688
|
|
$
|
688
|
|
$
|
27,252
|
|
||||||
Contingent Obligations—
Performance allocations with respect to certain funds are subject to reversal in the event of future losses to the extent of the cumulative revenues recognized in income to date. If all of the existing investments became worthless, the amount of cumulative revenues that have been recognized by Apollo through
December 31, 2018
and that would be reversed approximates
$2.4 billion
. Management views the possibility of all of the investments becoming worthless as remote. Performance allocations are affected by changes in the fair values of the underlying investments in the funds that Apollo manages. Valuations, on an unrealized basis, can be significantly affected by a variety of external factors including, but not limited to, bond yields and industry trading multiples. Movements in these items can affect valuations quarter to quarter even if the underlying business fundamentals remain stable.
Additionally, at the end of the life of certain funds that the Company manages, there could be a payment due to a fund by the Company if the Company, as general partner, has received more performance allocations than was ultimately earned. The general partner obligation amount, if any, will depend on final realized values of investments at the end of the life of each fund or as otherwise set forth in the respective limited partnership agreement of the fund. See note
14
to our
consolidated
financial statements for further details regarding the general partner obligation.
Certain funds may not generate performance allocations as a result of unrealized and realized losses that are recognized in the current and prior reporting period. In certain cases, performance allocations will not be generated until additional unrealized
-
204
-
APOLLO GLOBAL MANAGEMENT, LLC
NOTES TO CONSOLIDATED
FINANCIAL STATEMENTS
(dollars in thousands, except share data, except where noted)
and realized gains occur. Any appreciation would first cover the deductions for invested capital, unreturned organizational expenses, operating expenses, management fees and priority returns based on the terms of the respective fund agreements.
One
of the Company’s subsidiaries, AGS, provides underwriting commitments in connection with securities offerings to the portfolio companies of the funds Apollo manages. As of
December 31, 2018
, there were
no
underwriting commitments outstanding related to such offerings.
As of
December 31, 2018
,
one
of the Company’s subsidiaries had unfunded contingent commitments of
$32.0 million
, to facilitate fundings at closing by lead arrangers for syndicated term loans issued by portfolio companies of funds managed by Apollo. The commitments expire by
March 31, 2019
. As of
March 1, 2019
, the unfunded commitments were approximately
$5.3 million
.
Contingent Consideration—
In connection with the acquisition of Stone Tower in April 2012, the Company agreed to pay the former owners of Stone Tower a specified percentage of any future performance revenues earned from certain of the Stone Tower funds, CLOs, and strategic investment accounts. This contingent consideration liability was determined based on the present value of estimated future performance revenue payments, and is recorded in profit sharing payable in the
consolidated
statements of financial condition. The fair value of the remaining contingent obligation was
$74.5 million
and
$92.6 million
as of
December 31, 2018
and
December 31, 2017
, respectively.
The contingent consideration obligations will be remeasured to fair value at each reporting period until the obligations are satisfied and are characterized as Level III liabilities. The changes in the fair value of the contingent consideration obligations is reflected in profit sharing expense in the
consolidated
statements of operations. See note
7
for further information regarding fair value measurements.
16
. SEGMENT REPORTING
Apollo conducts its business primarily in the United States and substantially all of its revenues are generated domestically. Apollo’s business is conducted through
three
reportable segments: credit, private equity and real assets. Segment information is utilized by our Managing Partners, who operate collectively as our chief operating decision maker, to assess performance and to allocate resources. These segments were established based on the nature of investment activities in each underlying fund, including the specific type of investment made and the level of control over the investment.
The performance is measured by the Company’s chief operating decision maker on an unconsolidated basis because management makes operating decisions and assesses the performance of each of Apollo’s business segments based on financial and operating metrics and data that exclude the effects of consolidation of any of the affiliated funds.
Economic Income (Loss)
Economic Income (Loss), or “EI”, is a key performance measure used by management in evaluating the performance of Apollo’s credit, private equity and real assets segments. Management believes the components of EI, such as the amount of management fees, advisory and transaction fees and performance fees, are indicative of the Company’s performance. Management uses EI in making key operating decisions such as the following:
|
•
|
Decisions related
to the allocation of resources such as staffing decisions including hiring and locations for deployment of the new hires;
|
|
•
|
Decisions
related to capital deployment such as providing capital to facilitate growth for the business and/or to facilitate expansion into new businesses; and
|
|
•
|
Decisions related to expenses, such as determining annual discretionary bonuses and equity-based compensation awards to its employees. With respect to compensation, management seeks to align the interests of certain professionals and selected other individuals with those of the investors in such funds and those of the Company’s shareholders by providing such individuals a profit sharing interest in the performance fees earned in relation to the funds. To achieve that objective, a certain amount of compensation is based on the Company’s performance and growth for the year.
|
EI is a measure of profitability and has certain limitations in that it does not take into account certain items included under U.S. GAAP. EI represents segment income (loss) before income tax provision excluding transaction-related charges arising from the 2007 private placement, and any acquisitions. Transaction-related charges includes equity-based compensation charges,
-
205
-
APOLLO GLOBAL MANAGEMENT, LLC
NOTES TO CONSOLIDATED
FINANCIAL STATEMENTS
(dollars in thousands, except share data, except where noted)
the amortization of intangible assets, contingent consideration and certain other charges associated with acquisitions. In addition, EI excludes non-cash revenue and expense related to equity awards granted by unconsolidated related parties to employees of the Company, compensation and administrative related expense reimbursements, as well as the assets, liabilities and operating results of the funds and VIEs that are included in the
consolidated
financial statements. We believe the exclusion of the non-cash charges related to the 2007 Reorganization for equity-based compensation provides investors with a meaningful indication of our performance because these charges relate to the equity portion of our capital structure and not our core operating performance. EI also excludes impacts of the remeasurement of the tax receivable agreement recorded in other income, which arises from changes in the associated deferred tax balance, including the impacts related to the TCJA.
Management believes that excluding the remeasurement of the tax receivable agreement from EI is meaningful as it increases comparability between periods. Remeasurement of the tax receivable agreement is an estimate, and may change due to changes in interpretations and assumptions based on additional guidance that may be issued pertaining to the TCJA.
-
206
-
APOLLO GLOBAL MANAGEMENT, LLC
NOTES TO CONSOLIDATED
FINANCIAL STATEMENTS
(dollars in thousands, except share data, except where noted)
The following tables present financial data for Apollo’s reportable segments.
|
|
As of and for the Year Ended December 31, 2018
|
||||||||||||||
|
|
Credit
Segment
|
Private Equity
Segment
|
Real Assets
Segment
|
Total Reportable
Segments
|
|||||||||||
|
Revenues:
|
|||||||||||||||
|
Management fees
|
$
|
763,958
|
|
$
|
440,719
|
|
$
|
78,011
|
|
$
|
1,282,688
|
|
|||
|
Advisory and transaction fees, net
|
9,530
|
|
89,385
|
|
12,652
|
|
111,567
|
|
|||||||
|
Performance fees
(1)
:
|
|||||||||||||||
|
Unrealized
(2)
|
(6,911
|
)
|
(941,690
|
)
|
(4,168
|
)
|
(952,769
|
)
|
|||||||
|
Realized
|
130,479
|
|
441,363
|
|
6,617
|
|
578,459
|
|
|||||||
|
Total performance fees
|
123,568
|
|
(500,327
|
)
|
2,449
|
|
(374,310
|
)
|
|||||||
|
Principal investment income (loss)
|
44,976
|
|
(39,382
|
)
|
2,020
|
|
7,614
|
|
|||||||
|
Total Revenues
(3)
|
942,032
|
|
(9,605
|
)
|
95,132
|
|
1,027,559
|
|
|||||||
|
Expenses:
|
|||||||||||||||
|
Compensation and benefits:
|
|||||||||||||||
|
Salary, bonus and benefits
|
232,751
|
|
138,855
|
|
43,356
|
|
414,962
|
|
|||||||
|
Equity-based compensation
|
37,132
|
|
29,021
|
|
3,617
|
|
69,770
|
|
|||||||
|
Profit sharing expense:
|
|||||||||||||||
|
Unrealized
|
(523
|
)
|
(319,939
|
)
|
(973
|
)
|
(321,435
|
)
|
|||||||
|
Realized
|
70,620
|
|
197,873
|
|
3,759
|
|
272,252
|
|
|||||||
|
Equity-based
(4)
|
11,100
|
|
76,906
|
|
1,504
|
|
89,510
|
|
|||||||
|
Total profit sharing expense
|
81,197
|
|
(45,160
|
)
|
4,290
|
|
40,327
|
|
|||||||
|
Total compensation and benefits
|
351,080
|
|
122,716
|
|
51,263
|
|
525,059
|
|
|||||||
|
Non-compensation expenses:
|
|||||||||||||||
|
General, administrative and other
|
145,691
|
|
67,423
|
|
26,177
|
|
239,291
|
|
|||||||
|
Placement fees
|
1,530
|
|
585
|
|
7
|
|
2,122
|
|
|||||||
|
Total non-compensation expenses
|
147,221
|
|
68,008
|
|
26,184
|
|
241,413
|
|
|||||||
|
Total Expenses
(3)
|
498,301
|
|
190,724
|
|
77,447
|
|
766,472
|
|
|||||||
|
Other Loss:
|
|||||||||||||||
|
Net gains (losses) from investment activities
|
(135,285
|
)
|
(51,185
|
)
|
44
|
|
(186,426
|
)
|
|||||||
|
Net interest loss
|
(18,778
|
)
|
(14,694
|
)
|
(4,101
|
)
|
(37,573
|
)
|
|||||||
|
Other income (loss), net
|
2,071
|
|
(2,053
|
)
|
490
|
|
508
|
|
|||||||
|
Total Other Loss
(3)
|
(151,992
|
)
|
(67,932
|
)
|
(3,567
|
)
|
(223,491
|
)
|
|||||||
|
Non-Controlling Interests
|
(5,008
|
)
|
—
|
|
—
|
|
(5,008
|
)
|
|||||||
|
Economic Income (Loss)
(3)
|
$
|
286,731
|
|
$
|
(268,261
|
)
|
$
|
14,118
|
|
$
|
32,588
|
|
|||
|
Total Assets
(3)
|
$
|
2,569,872
|
|
$
|
1,982,553
|
|
$
|
239,221
|
|
$
|
4,791,646
|
|
|||
-
207
-
APOLLO GLOBAL MANAGEMENT, LLC
NOTES TO CONSOLIDATED
FINANCIAL STATEMENTS
(dollars in thousands, except share data, except where noted)
|
(1)
|
Performance fees includes performance allocations and incentive fees.
|
|
(2)
|
Included in unrealized performance fees for the
year ended
December 31, 2018
was a reversal of previously realized performance fees due to the general partner obligation to return previously distributed performance fees.
|
|
(3)
|
Refer below for a reconciliation of total revenues, total expenses, other loss and total assets for Apollo’s total reportable segments to total consolidated revenues, total consolidated expenses, total consolidated other income (loss) and total assets.
|
|
(4)
|
Relates to amortization of equity-based awards granted under certain profit sharing arrangements.
|
|
|
As of and for the Year Ended December 31, 2017
|
||||||||||||||
|
|
Credit
Segment
|
Private Equity
Segment
|
Real Assets
Segment
|
Total Reportable
Segments
|
|||||||||||
|
Revenues:
|
|||||||||||||||
|
Management fees
|
$
|
702,191
|
|
$
|
306,734
|
|
$
|
73,390
|
|
$
|
1,082,315
|
|
|||
|
Advisory and transaction fees, net
|
30,733
|
|
84,063
|
|
2,828
|
|
117,624
|
|
|||||||
|
Performance fees
(1)
:
|
|||||||||||||||
|
Unrealized
(2)
|
51,225
|
|
642,126
|
|
(4,786
|
)
|
688,565
|
|
|||||||
|
Realized
|
196,973
|
|
433,983
|
|
18,069
|
|
649,025
|
|
|||||||
|
Total performance fees
|
248,198
|
|
1,076,109
|
|
13,283
|
|
1,337,590
|
|
|||||||
|
Principal investment income
|
27,718
|
|
132,376
|
|
2,857
|
|
162,951
|
|
|||||||
|
Total Revenues
(3)
|
1,008,840
|
|
1,599,282
|
|
92,358
|
|
2,700,480
|
|
|||||||
|
Expenses:
|
|||||||||||||||
|
Compensation and benefits:
|
|||||||||||||||
|
Salary, bonus and benefits
|
231,592
|
|
123,095
|
|
39,468
|
|
394,155
|
|
|||||||
|
Equity-based compensation
|
37,453
|
|
27,516
|
|
2,905
|
|
67,874
|
|
|||||||
|
Profit sharing expense:
|
|||||||||||||||
|
Unrealized
|
18,268
|
|
211,976
|
|
(3,925
|
)
|
226,319
|
|
|||||||
|
Realized
|
77,801
|
|
191,569
|
|
9,468
|
|
278,838
|
|
|||||||
|
Equity-based
(4)
|
1,876
|
|
2,184
|
|
—
|
|
4,060
|
|
|||||||
|
Total profit sharing expense
|
97,945
|
|
405,729
|
|
5,543
|
|
509,217
|
|
|||||||
|
Total compensation and benefits
|
366,990
|
|
556,340
|
|
47,916
|
|
971,246
|
|
|||||||
|
Non-compensation expenses:
|
|||||||||||||||
|
General, administrative and other
|
139,374
|
|
68,504
|
|
20,701
|
|
228,579
|
|
|||||||
|
Placement fees
|
10,130
|
|
3,783
|
|
—
|
|
13,913
|
|
|||||||
|
Total non-compensation expenses
|
149,504
|
|
72,287
|
|
20,701
|
|
242,492
|
|
|||||||
|
Total Expenses
(3)
|
516,494
|
|
628,627
|
|
68,617
|
|
1,213,738
|
|
|||||||
|
Other Income (Loss):
|
|
|
|||||||||||||
|
Net gains (losses) from investment activities
|
85,135
|
|
9,652
|
|
(13
|
)
|
94,774
|
|
|||||||
|
Net interest loss
|
(23,709
|
)
|
(16,597
|
)
|
(4,678
|
)
|
(44,984
|
)
|
|||||||
|
Other income, net
|
17,037
|
|
26,299
|
|
2,460
|
|
45,796
|
|
|||||||
|
Total Other Income (Loss)
(3)
|
78,463
|
|
19,354
|
|
(2,231
|
)
|
95,586
|
|
|||||||
|
Non-Controlling Interests
|
(4,379
|
)
|
—
|
|
—
|
|
(4,379
|
)
|
|||||||
|
Economic Income
(3)
|
$
|
566,430
|
|
$
|
990,009
|
|
$
|
21,510
|
|
$
|
1,577,949
|
|
|||
|
Total Assets
(3)
|
$
|
2,640,014
|
|
$
|
2,880,922
|
|
$
|
220,007
|
|
$
|
5,740,943
|
|
|||
-
208
-
APOLLO GLOBAL MANAGEMENT, LLC
NOTES TO CONSOLIDATED
FINANCIAL STATEMENTS
(dollars in thousands, except share data, except where noted)
|
(1)
|
Performance fees includes performance allocations and incentive fees.
|
|
(2)
|
Included in unrealized performance fees for the
year ended
December 31, 2017
was a reversal of previously realized performance fees due to the general partner obligation to return previously distributed performance fees.
|
|
(3)
|
Refer below for a reconciliation of total revenues, total expenses and other income (loss) for Apollo’s total reportable segments to total consolidated revenues, total consolidated expenses and total consolidated other income (loss) and total assets.
|
|
(4)
|
Relates to amortization of equity-based awards granted under certain profit sharing arrangements.
|
|
|
For the Year Ended December 31, 2016
|
||||||||||||||
|
|
Credit Segment
|
Private Equity Segment
|
Real Assets Segment
|
Total Reportable Segments
|
|||||||||||
|
Revenues:
|
|||||||||||||||
|
Management fees
|
$
|
596,709
|
|
$
|
321,995
|
|
$
|
58,945
|
|
$
|
977,649
|
|
|||
|
Advisory and transaction fees, net
|
12,533
|
|
128,675
|
|
5,907
|
|
147,115
|
|
|||||||
|
Performance fees
(1)
:
|
|||||||||||||||
|
Unrealized
(2)
|
137,274
|
|
368,807
|
|
4,918
|
|
510,999
|
|
|||||||
|
Realized
|
180,029
|
|
82,292
|
|
12,566
|
|
274,887
|
|
|||||||
|
Total performance fees
|
317,303
|
|
451,099
|
|
17,484
|
|
785,886
|
|
|||||||
|
Principal investment income
|
33,290
|
|
66,281
|
|
3,010
|
|
102,581
|
|
|||||||
|
Total Revenues
(3)
|
959,835
|
|
968,050
|
|
85,346
|
|
2,013,231
|
|
|||||||
|
Expenses:
|
|||||||||||||||
|
Compensation and benefits:
|
|||||||||||||||
|
Salary, bonus and benefits
|
209,256
|
|
124,463
|
|
33,171
|
|
366,890
|
|
|||||||
|
Equity-based compensation
|
34,185
|
|
27,549
|
|
2,734
|
|
64,468
|
|
|||||||
|
Profit sharing expense:
|
|||||||||||||||
|
Unrealized
|
63,012
|
|
114,643
|
|
2,202
|
|
179,857
|
|
|||||||
|
Realized
|
84,715
|
|
43,893
|
|
8,185
|
|
136,793
|
|
|||||||
|
Total profit sharing expense
|
147,727
|
|
158,536
|
|
10,387
|
|
316,650
|
|
|||||||
|
Total compensation and benefits
|
391,168
|
|
310,548
|
|
46,292
|
|
748,008
|
|
|||||||
|
Non-compensation expenses:
|
|||||||||||||||
|
General, administrative and other
|
125,639
|
|
71,323
|
|
21,528
|
|
218,490
|
|
|||||||
|
Placement fees
|
22,047
|
|
2,297
|
|
89
|
|
24,433
|
|
|||||||
|
Total non-compensation expenses
|
147,686
|
|
73,620
|
|
21,617
|
|
242,923
|
|
|||||||
|
Total Expenses
(2)
|
538,854
|
|
384,168
|
|
67,909
|
|
990,931
|
|
|||||||
|
Other Income (Loss):
|
|||||||||||||||
|
Net gains from investment activities
|
127,229
|
|
11,379
|
|
—
|
|
138,608
|
|
|||||||
|
Net interest loss
|
(20,669
|
)
|
(14,187
|
)
|
(4,163
|
)
|
(39,019
|
)
|
|||||||
|
Other income, net
|
(4,500
|
)
|
1,650
|
|
692
|
|
(2,158
|
)
|
|||||||
|
Total Other Income (Loss)
(2)
|
102,060
|
|
(1,158
|
)
|
(3,471
|
)
|
97,431
|
|
|||||||
|
Non-Controlling Interests
|
(7,464
|
)
|
—
|
|
—
|
|
(7,464
|
)
|
|||||||
|
Economic Income
(2)
|
$
|
515,577
|
|
$
|
582,724
|
|
$
|
13,966
|
|
$
|
1,112,267
|
|
|||
|
(1)
|
Performance fees includes performance allocations and incentive fees.
|
|
(2)
|
Included in unrealized performance fees from related parties for the
year ended December 31, 2016
was a reversal of previously realized performance fees due to the general partner obligation to return previously distributed performance fees. See note
14
for further details regarding the general partner obligation.
|
|
(3)
|
Refer below for a reconciliation of total revenues, total expenses and other income (loss) for Apollo’s total reportable segments to total consolidated revenues, total consolidated expenses and total consolidated other income (loss).
|
-
209
-
APOLLO GLOBAL MANAGEMENT, LLC
NOTES TO CONSOLIDATED
FINANCIAL STATEMENTS
(dollars in thousands, except share data, except where noted)
The following table reconciles total consolidated revenues to total revenues for Apollo’s reportable segments:
|
|
For the Years Ended December 31,
|
||||||||||
|
2018
|
2017
|
2016
|
|||||||||
|
Total Consolidated Revenues
|
$
|
1,093,065
|
|
$
|
2,771,803
|
|
$
|
2,073,562
|
|
||
|
Equity awards granted by unconsolidated related parties, reimbursable expenses and other
(1)
|
(81,892
|
)
|
(75,940
|
)
|
(73,913
|
)
|
|||||
|
Adjustments related to consolidated funds and VIEs
(1)
|
16,386
|
|
4,617
|
|
13,582
|
|
|||||
|
Total Reportable Segments Revenues
|
$
|
1,027,559
|
|
$
|
2,700,480
|
|
$
|
2,013,231
|
|
||
|
(1)
|
Represents advisory fees, management fees and performance fees earned from consolidated VIEs which are eliminated in consolidation. Includes non-cash revenues related to equity awards granted by unconsolidated related parties to employees of the Company and certain compensation and administrative related expense reimbursements.
|
The following table reconciles total consolidated expenses to total expenses for Apollo’s reportable segments:
|
|
For the Years Ended December 31,
|
||||||||||
|
2018
|
2017
|
2016
|
|||||||||
|
Total Consolidated Expenses
|
$
|
902,939
|
|
$
|
1,360,049
|
|
$
|
1,165,918
|
|
||
|
Equity awards granted by unconsolidated related parties, reimbursable expenses and other
(1)
|
(82,724
|
)
|
(75,940
|
)
|
(75,653
|
)
|
|||||
|
Transaction-related compensation charges, net
(1)
|
9,558
|
|
(12,169
|
)
|
(46,293
|
)
|
|||||
|
Reclassification of interest expenses
|
(59,374
|
)
|
(52,873
|
)
|
(43,482
|
)
|
|||||
|
Amortization of transaction-related intangibles
(1)
|
(3,927
|
)
|
(5,329
|
)
|
(9,559
|
)
|
|||||
|
Total Reportable Segments Expenses
|
$
|
766,472
|
|
$
|
1,213,738
|
|
$
|
990,931
|
|
||
|
(1)
|
Represents the addition of expenses of consolidated funds and VIEs, transaction-related charges, non-cash expenses related to equity awards granted by unconsolidated related parties to employees of the Company and certain compensation and administrative expenses. Transaction-related charges include equity-based compensation charges, the amortization of intangible assets, contingent consideration and certain other charges associated with acquisitions.
|
The following table reconciles total consolidated other income (loss) to total other income (loss) for Apollo’s reportable segments:
|
|
For the Years Ended December 31,
|
||||||||||
|
2018
|
2017
|
2016
|
|||||||||
|
Total Consolidated Other Income (Loss)
|
$
|
(84,854
|
)
|
$
|
357,830
|
|
$
|
153,370
|
|
||
|
Reclassification of interest expense
|
(59,374
|
)
|
(52,873
|
)
|
(43,482
|
)
|
|||||
|
Adjustments related to consolidated funds and VIEs
(1)
|
(43,858
|
)
|
(9,131
|
)
|
(12,457
|
)
|
|||||
|
Gain from remeasurement of tax receivable agreement liability
|
(35,405
|
)
|
(200,240
|
)
|
—
|
|
|||||
|
Total Reportable Segments Other Income (Loss)
|
$
|
(223,491
|
)
|
$
|
95,586
|
|
$
|
97,431
|
|
||
|
(1)
|
Represents the addition of other income of consolidated funds and VIEs.
|
-
210
-
APOLLO GLOBAL MANAGEMENT, LLC
NOTES TO CONSOLIDATED
FINANCIAL STATEMENTS
(dollars in thousands, except share data, except where noted)
The following table presents the reconciliation of income before income tax provision reported in the
consolidated
statements of operations to Economic Income:
|
For the Years Ended December 31,
|
|||||||||||
|
2018
|
2017
|
2016
|
|||||||||
|
Income before income tax provision
|
$
|
105,272
|
|
$
|
1,769,584
|
|
$
|
1,061,014
|
|
||
|
Adjustments:
|
|||||||||||
|
Transaction-related charges
(1)
|
(5,631
|
)
|
17,496
|
|
57,042
|
|
|||||
|
Gain from remeasurement of tax receivable agreement liability
|
(35,405
|
)
|
(200,240
|
)
|
—
|
|
|||||
|
Net income attributable to Non-Controlling Interests in consolidated entities and appropriated partners’ capital
|
(31,648
|
)
|
(8,891
|
)
|
(5,789
|
)
|
|||||
|
Total consolidation adjustments and other
|
(72,684
|
)
|
(191,635
|
)
|
51,253
|
|
|||||
|
Economic Income
|
$
|
32,588
|
|
$
|
1,577,949
|
|
$
|
1,112,267
|
|
||
|
(1)
|
Transaction-related charges include equity-based compensation charges, the amortization of intangible assets, contingent consideration and certain other charges associated with acquisitions.
|
The following table presents the reconciliation of Apollo’s total reportable segment assets to total assets:
|
As of
December 31, 2018 |
As of
December 31, 2017 |
||||||
|
Total reportable segment assets
|
$
|
4,791,646
|
|
$
|
5,740,943
|
|
|
|
Adjustments
(1)
|
1,200,008
|
|
1,250,127
|
|
|||
|
Total assets
|
$
|
5,991,654
|
|
$
|
6,991,070
|
|
|
|
(1)
|
Represents the addition of assets of consolidated funds and VIEs and consolidation elimination adjustments.
|
17
. SUBSEQUENT EVENTS
On
January 31, 2019
, the Company declared a cash distribution of
$0.56
per Class A share, which will be paid on
February 28, 2019
to holders of record on
February 21, 2019
.
On
January 31, 2019
, the Company declared a cash distribution of
$0.398438
per Series A Preferred share and Series B Preferred share which will be paid on
March 15, 2019
to holders of record on
March 1, 2019
.
On January 30, 2019, the Company and AAA agreed to extend the maturity date of the AAA Investments Credit Agreement to December 31, 2020. See note
14
for information regarding the terms of the agreement.
In January 2019, Apollo increased its authorized share repurchase amount by
$250 million
bringing the total authorized repurchase amount to
$500 million
, which may be used to repurchase outstanding Class A shares as well as to reduce Class A shares to be issued to employees to satisfy associated tax obligations in connection with the settlement of equity-based awards granted under the Company’s 2007 Omnibus Equity Incentive Plan (and any successor equity plan thereto). Class A shares may be repurchased from time to time in open market transactions, in privately negotiated transactions, pursuant to a trading plan adopted in accordance with Rule 10b5-1 of the Exchange Act, or otherwise, with the size and timing of these repurchases depending on legal requirements, price, market and economic conditions and other factors. Apollo is not obligated under the terms of the program to repurchase any of its Class A shares. The repurchase program has no expiration date and may be suspended or terminated by the Company at any time without prior notice. Class A shares repurchased as part of this program will be canceled by the Company.
On February 7, 2019, AMH (the “Issuer”) issued
$550 million
in aggregate principal amount of its
4.872%
Senior Notes due 2029 (the “2029 Senior Notes”), at an issue price of
99.999%
of par. The notes are fully and unconditionally guaranteed by Apollo’s indirect subsidiaries, Apollo Principal Holdings I, L.P., Apollo Principal Holdings II, L.P., Apollo Principal Holdings III, L.P., Apollo Principal Holdings IV, L.P., Apollo Principal Holdings V, L.P., Apollo Principal Holdings VI, L.P., Apollo Principal Holdings VII, L.P., Apollo Principal Holdings VIII, L.P., Apollo Principal Holdings IX, L.P., Apollo Principal Holdings X, L.P., Apollo Principal Holdings XI, LLC, Apollo Principal Holdings XII, L.P. and AMH Holdings (Cayman), L.P. Interest on the 2029 Senior Notes is payable semi-annually in arrears on February 15 and August 15 of each year. The 2029 Senior Notes will mature
-
211
-
APOLLO GLOBAL MANAGEMENT, LLC
NOTES TO CONSOLIDATED
FINANCIAL STATEMENTS
(dollars in thousands, except share data, except where noted)
on February 15, 2029 unless earlier redeemed or repurchased. Net proceeds from the sale of the Notes will be used for general corporate purposes, including, at the Issuer’s option, to be held in a custody account managed by Bank of America, National Association Holdings, L.P. as custodian and invested in U.S. Treasury securities and money market funds (collectively, all such investments, the “Eligible Assets”). At the Issuer’s discretion, from time to time, the Issuer may (i) remove all or any portion of the Eligible Assets from the custody account or (ii) add Eligible Assets to the custody account.
18
. QUARTERLY FINANCIAL DATA (UNAUDITED)
|
For the Three Months Ended
|
|||||||||||||||
|
March 31,
2018 |
June 30,
2018 |
September 30,
2018 |
December 31, 2018
|
||||||||||||
|
Revenues
|
$
|
166,903
|
|
$
|
523,316
|
|
$
|
517,731
|
|
$
|
(114,885
|
)
|
|||
|
Expenses
|
214,875
|
|
301,394
|
|
312,727
|
|
73,943
|
|
|||||||
|
Other Income (Loss)
|
(52,796
|
)
|
(59,188
|
)
|
176,780
|
|
(149,650
|
)
|
|||||||
|
Income (Loss) Before Provision for Taxes
|
$
|
(100,768
|
)
|
$
|
162,734
|
|
$
|
381,784
|
|
$
|
(338,478
|
)
|
|||
|
Net Income (Loss)
|
$
|
(109,348
|
)
|
$
|
143,810
|
|
$
|
362,692
|
|
$
|
(377,903
|
)
|
|||
|
Net Income (Loss) Attributable to Apollo Global Management, LLC Class A Shareholders
|
$
|
(62,645
|
)
|
$
|
54,658
|
|
$
|
162,357
|
|
$
|
(196,408
|
)
|
|||
|
Net Income (Loss) per Class A Share - Basic
|
$
|
(0.34
|
)
|
$
|
0.25
|
|
$
|
0.77
|
|
$
|
(1.00
|
)
|
|||
|
Net Income (Loss) per Class A Share - Diluted
|
$
|
(0.34
|
)
|
$
|
0.25
|
|
$
|
0.77
|
|
$
|
(1.00
|
)
|
|||
|
For the Three Months Ended
|
|||||||||||||||
|
March 31,
2017 |
June 30,
2017 |
September 30,
2017 |
December 31, 2017
|
||||||||||||
|
Revenues
|
$
|
682,104
|
|
$
|
449,708
|
|
$
|
711,720
|
|
$
|
928,271
|
|
|||
|
Expenses
|
345,988
|
|
264,526
|
|
357,483
|
|
392,052
|
|
|||||||
|
Other Income
|
58,075
|
|
6,983
|
|
96,668
|
|
196,104
|
|
|||||||
|
Income Before Provision for Taxes
|
$
|
394,191
|
|
$
|
192,165
|
|
$
|
450,905
|
|
$
|
732,323
|
|
|||
|
Net Income
|
$
|
355,030
|
|
$
|
192,942
|
|
$
|
434,363
|
|
$
|
461,304
|
|
|||
|
Net Income Attributable to Apollo Global Management, LLC Class A Shareholders
|
$
|
145,196
|
|
$
|
86,908
|
|
$
|
198,569
|
|
$
|
184,893
|
|
|||
|
Net Income per Class A Share - Basic
|
$
|
0.75
|
|
$
|
0.44
|
|
$
|
1.00
|
|
$
|
0.92
|
|
|||
|
Net Income per Class A Share - Diluted
|
$
|
0.75
|
|
$
|
0.44
|
|
$
|
1.00
|
|
$
|
0.92
|
|
|||
-
212
-
ITEM
8A
. UNAUDITED SUPPLEMENTAL PRESENTATION OF STATEMENTS
OF FINANCIAL CONDITION
APOLLO GLOBAL MANAGEMENT, LLC
CONSOLIDATING STATEMENTS OF FINANCIAL CONDITION (Unaudited)
(dollars in thousands, except share data)
|
As of December 31, 2018
|
|||||||||||||||
|
Apollo Global Management, LLC and Consolidated Subsidiaries
|
Consolidated Funds and VIEs
|
Eliminations
|
Consolidated
|
||||||||||||
|
Assets:
|
|||||||||||||||
|
Cash and cash equivalents
|
$
|
609,743
|
|
$
|
4
|
|
$
|
—
|
|
$
|
609,747
|
|
|||
|
Restricted cash
|
3,457
|
|
—
|
|
—
|
|
3,457
|
|
|||||||
|
U.S. Treasury securities, at fair value
|
392,932
|
|
—
|
|
—
|
|
392,932
|
|
|||||||
|
Investments
|
2,811,445
|
|
558
|
|
(89,391
|
)
|
2,722,612
|
|
|||||||
|
Assets of consolidated variable interest entities:
|
|||||||||||||||
|
Cash and cash equivalents
|
—
|
|
49,671
|
|
—
|
|
49,671
|
|
|||||||
|
Investments, at fair value
|
—
|
|
1,175,985
|
|
(308
|
)
|
1,175,677
|
|
|||||||
|
Other assets
|
—
|
|
65,543
|
|
—
|
|
65,543
|
|
|||||||
|
Incentive fees receivable
|
6,792
|
|
—
|
|
—
|
|
6,792
|
|
|||||||
|
Due from related parties
|
379,525
|
|
—
|
|
(1,417
|
)
|
378,108
|
|
|||||||
|
Deferred tax assets, net
|
306,094
|
|
—
|
|
—
|
|
306,094
|
|
|||||||
|
Other assets
|
173,907
|
|
—
|
|
(637
|
)
|
173,270
|
|
|||||||
|
Goodwill
|
88,852
|
|
—
|
|
—
|
|
88,852
|
|
|||||||
|
Intangible assets, net
|
18,899
|
|
—
|
|
—
|
|
18,899
|
|
|||||||
|
Total Assets
|
$
|
4,791,646
|
|
$
|
1,291,761
|
|
$
|
(91,753
|
)
|
$
|
5,991,654
|
|
|||
|
Liabilities and Shareholders’ Equity
|
|||||||||||||||
|
Liabilities:
|
|||||||||||||||
|
Accounts payable and accrued expenses
|
$
|
70,878
|
|
$
|
—
|
|
$
|
—
|
|
$
|
70,878
|
|
|||
|
Accrued compensation and benefits
|
73,583
|
|
—
|
|
—
|
|
73,583
|
|
|||||||
|
Deferred revenue
|
111,097
|
|
—
|
|
—
|
|
111,097
|
|
|||||||
|
Due to related parties
|
425,435
|
|
—
|
|
—
|
|
425,435
|
|
|||||||
|
Profit sharing payable
|
452,141
|
|
—
|
|
—
|
|
452,141
|
|
|||||||
|
Debt
|
1,360,448
|
|
—
|
|
—
|
|
1,360,448
|
|
|||||||
|
Liabilities of consolidated variable interest entities:
|
|||||||||||||||
|
Debt, at fair value
|
—
|
|
899,651
|
|
(44,190
|
)
|
855,461
|
|
|||||||
|
Other liabilities
|
—
|
|
79,244
|
|
(267
|
)
|
78,977
|
|
|||||||
|
Due to related parties
|
—
|
|
1,787
|
|
(1,787
|
)
|
—
|
|
|||||||
|
Other liabilities
|
111,794
|
|
—
|
|
—
|
|
111,794
|
|
|||||||
|
Total Liabilities
|
2,605,376
|
|
980,682
|
|
(46,244
|
)
|
3,539,814
|
|
|||||||
|
Shareholders’ Equity:
|
|||||||||||||||
|
Apollo Global Management, LLC shareholders’ equity:
|
|||||||||||||||
|
Series A Preferred shares
|
264,398
|
|
—
|
|
—
|
|
264,398
|
|
|||||||
|
Series B Preferred shares
|
289,815
|
|
—
|
|
—
|
|
289,815
|
|
|||||||
|
Additional paid in capital
|
1,299,418
|
|
—
|
|
—
|
|
1,299,418
|
|
|||||||
|
Accumulated deficit
|
(473,275
|
)
|
17,673
|
|
(17,674
|
)
|
(473,276
|
)
|
|||||||
|
Accumulated other comprehensive loss
|
(3,925
|
)
|
(2,479
|
)
|
2,245
|
|
(4,159
|
)
|
|||||||
|
Total Apollo Global Management, LLC shareholders’ equity
|
1,376,431
|
|
15,194
|
|
(15,429
|
)
|
1,376,196
|
|
|||||||
|
Non-Controlling Interests in consolidated entities
|
5,717
|
|
295,885
|
|
(30,080
|
)
|
271,522
|
|
|||||||
|
Non-Controlling Interests in Apollo Operating Group
|
804,122
|
|
—
|
|
—
|
|
804,122
|
|
|||||||
|
Total Shareholders’ Equity
|
2,186,270
|
|
311,079
|
|
(45,509
|
)
|
2,451,840
|
|
|||||||
|
Total Liabilities and Shareholders’ Equity
|
$
|
4,791,646
|
|
$
|
1,291,761
|
|
$
|
(91,753
|
)
|
$
|
5,991,654
|
|
|||
-
213
-
APOLLO GLOBAL MANAGEMENT, LLC
CONSOLIDATING STATEMENTS OF FINANCIAL CONDITION (Unaudited)
(dollars in thousands, except share data)
|
As of December 31, 2017
|
|||||||||||||||
|
Apollo Global Management, LLC and Consolidated Subsidiaries
|
Consolidated Funds and VIEs
|
Eliminations
|
Consolidated
|
||||||||||||
|
Assets:
|
|||||||||||||||
|
Cash and cash equivalents
|
$
|
751,252
|
|
$
|
21
|
|
$
|
—
|
|
$
|
751,273
|
|
|||
|
Restricted cash
|
3,875
|
|
—
|
|
—
|
|
3,875
|
|
|||||||
|
U.S. Treasury securities, at fair value
|
364,649
|
|
—
|
|
—
|
|
364,649
|
|
|||||||
|
Investments
|
3,637,042
|
|
854
|
|
(78,062
|
)
|
3,559,834
|
|
|||||||
|
Assets of consolidated variable interest entities:
|
|||||||||||||||
|
Cash and cash equivalents
|
—
|
|
92,912
|
|
—
|
|
92,912
|
|
|||||||
|
Investments, at fair value
|
—
|
|
1,196,512
|
|
(322
|
)
|
1,196,190
|
|
|||||||
|
Other assets
|
—
|
|
39,484
|
|
—
|
|
39,484
|
|
|||||||
|
Incentive fees receivable
|
43,176
|
|
—
|
|
—
|
|
43,176
|
|
|||||||
|
Due from related parties
|
263,572
|
|
—
|
|
(984
|
)
|
262,588
|
|
|||||||
|
Deferred tax assets
|
337,638
|
|
—
|
|
—
|
|
337,638
|
|
|||||||
|
Other assets
|
232,045
|
|
5
|
|
(293
|
)
|
231,757
|
|
|||||||
|
Goodwill
|
88,852
|
|
—
|
|
—
|
|
88,852
|
|
|||||||
|
Intangible assets, net
|
18,842
|
|
—
|
|
—
|
|
18,842
|
|
|||||||
|
Total Assets
|
$
|
5,740,943
|
|
$
|
1,329,788
|
|
$
|
(79,661
|
)
|
$
|
6,991,070
|
|
|||
|
Liabilities and Shareholders’ Equity
|
|||||||||||||||
|
Liabilities:
|
|||||||||||||||
|
Accounts payable and accrued expenses
|
$
|
68,873
|
|
$
|
—
|
|
$
|
—
|
|
$
|
68,873
|
|
|||
|
Accrued compensation and benefits
|
62,474
|
|
—
|
|
—
|
|
62,474
|
|
|||||||
|
Deferred revenue
|
128,146
|
|
—
|
|
—
|
|
128,146
|
|
|||||||
|
Due to related parties
|
428,013
|
|
—
|
|
—
|
|
428,013
|
|
|||||||
|
Profit sharing payable
|
752,276
|
|
—
|
|
—
|
|
752,276
|
|
|||||||
|
Debt
|
1,362,402
|
|
—
|
|
—
|
|
1,362,402
|
|
|||||||
|
Liabilities of consolidated variable interest entities:
|
|||||||||||||||
|
Debt, at fair value
|
—
|
|
1,049,235
|
|
(47,172
|
)
|
1,002,063
|
|
|||||||
|
Other liabilities
|
—
|
|
115,951
|
|
(293
|
)
|
115,658
|
|
|||||||
|
Due to related parties
|
—
|
|
2,719
|
|
(2,719
|
)
|
—
|
|
|||||||
|
Other liabilities
|
173,369
|
|
—
|
|
—
|
|
173,369
|
|
|||||||
|
Total Liabilities
|
2,975,553
|
|
1,167,905
|
|
(50,184
|
)
|
4,093,274
|
|
|||||||
|
Shareholders’ Equity:
|
|||||||||||||||
|
Apollo Global Management, LLC shareholders’ equity:
|
|||||||||||||||
|
Series A Preferred shares
|
264,398
|
|
—
|
|
—
|
|
264,398
|
|
|||||||
|
Additional paid in capital
|
1,579,797
|
|
—
|
|
—
|
|
1,579,797
|
|
|||||||
|
Accumulated deficit
|
(379,461
|
)
|
9,037
|
|
(9,036
|
)
|
(379,460
|
)
|
|||||||
|
Accumulated other comprehensive loss
|
(1,878
|
)
|
(381
|
)
|
450
|
|
(1,809
|
)
|
|||||||
|
Total Apollo Global Management, LLC shareholders’ equity
|
1,462,856
|
|
8,656
|
|
(8,586
|
)
|
1,462,926
|
|
|||||||
|
Non-Controlling Interests in consolidated entities
|
7,750
|
|
153,227
|
|
(20,891
|
)
|
140,086
|
|
|||||||
|
Non-Controlling Interests in Apollo Operating Group
|
1,294,784
|
|
—
|
|
—
|
|
1,294,784
|
|
|||||||
|
Total Shareholders’ Equity
|
2,765,390
|
|
161,883
|
|
(29,477
|
)
|
2,897,796
|
|
|||||||
|
Total Liabilities and Shareholders’ Equity
|
$
|
5,740,943
|
|
$
|
1,329,788
|
|
$
|
(79,661
|
)
|
$
|
6,991,070
|
|
|||
-
214
-
|
ITEM 9.
|
CHANGES IN AND DISAGREEMENTS WITH ACCOUNTANTS ON ACCOUNTING AND FINANCIAL DISCLOSURES
|
None.
|
ITEM
9A
.
|
CONTROLS AND PROCEDURES
|
We maintain “disclosure controls and procedures”, as such term is defined in Rules 13a-15(e) and 15d-15(e) under the Exchange Act, that are designed to ensure that information required to be disclosed by us in reports that we file or submit under the Exchange Act is recorded, processed, summarized and reported within the time periods specified in Securities and Exchange Commission rules and forms, and that such information is accumulated and communicated to our management, including our Chief Executive Officer and Chief Financial Officer, as appropriate, to allow timely decisions regarding required disclosure. In designing disclosure controls and procedures, our management necessarily was required to apply its judgment in evaluating the cost-benefit relationship of possible disclosure controls and procedures. The design of any disclosure controls and procedures also is based in part upon certain assumptions about the likelihood of future events, and there can be no assurance that any design will succeed in achieving its stated goals under all potential future conditions. Any controls and procedures, no matter how well designed and operated, can provide only reasonable assurance of achieving the desired objectives.
Our management, including our Chief Executive Officer and Chief Financial Officer, evaluated the effectiveness of our disclosure controls and procedures pursuant to Rule 13a-15 under the Exchange Act as of the end of the period covered by this report. Based on that evaluation, our Chief Executive Officer and Chief Financial Officer have concluded that, as of the end of the period covered by this report, our disclosure controls and procedures (as defined in Rule 13a-15(e) under the Exchange Act) are effective at the reasonable assurance level to accomplish their objectives of ensuring that information we are required to disclose in reports that we file or submit under the Exchange Act is recorded, processed, summarized and reported within the time periods specified in Securities and Exchange Commission rules and forms, and that such information is accumulated and communicated to our management, including our Chief Executive Officer and Chief Financial Officer, as appropriate, to allow timely decisions regarding required disclosure.
No changes in our internal control over financial reporting (as such term is defined in Rules 13a–15(f) and 15d–15(f) under the Exchange Act) occurred during our most recent quarter, that have materially affected, or are reasonably likely to materially affect, our internal control over financial reporting.
Management’s Report on Internal Control Over Financial Reporting
Management of Apollo is responsible for establishing and maintaining adequate internal control over financial reporting. Apollo’s internal control over financial reporting is a process designed under the supervision of its principal executive and principal financial officers to provide reasonable assurance regarding the reliability of financial reporting and the preparation of its consolidated financial statements for external reporting purposes in accordance with accounting principles generally accepted in the United States of America.
Apollo’s internal control over financial reporting includes policies and procedures that pertain to the maintenance of records that, in reasonable detail, accurately and fairly reflect transactions and dispositions of assets, provide reasonable assurances that transactions are recorded as necessary to permit preparation of financial statements in accordance with generally accepted accounting principles, and that receipts and expenditures are being made only in accordance with authorizations of management and the directors, and provide reasonable assurance regarding prevention or timely detection of unauthorized acquisition, use or disposition of Apollo’s assets that could have a material effect on its financial statements.
Because of its inherent limitations, internal control over financial reporting may not prevent or detect misstatements. In addition, projections of any evaluation of effectiveness to future periods are subject to the risk that controls may become inadequate because of changes in conditions or that the degree of compliance with the policies or procedures may deteriorate.
Management conducted an assessment of the effectiveness of Apollo’s internal control over financial reporting as of
December 31, 2018
based on the framework established in
Internal Control - Integrated Framework (2013)
issued by the Committee of Sponsoring Organizations of the Treadway Commission. Based on this assessment, management has determined that Apollo’s internal control over financial reporting as of
December 31, 2018
was effective.
Deloitte & Touche LLP, an independent registered public accounting firm, has audited Apollo’s financial statements included in this annual report on Form 10-K and issued its report on the effectiveness of Apollo’s internal control over financial reporting as of
December 31, 2018
, which is included herein.
-
215
-
|
ITEM
9B
.
|
OTHER INFORMATION
|
None.
-
216
-
|
ITEM 10.
|
DIRECTORS, EXECUTIVE OFFICERS AND CORPORATE GOVERNANCE
|
Directors and Executive Officers
The following table presents certain information concerning our board of directors and executive officers:
|
Name
|
Age
|
Position(s)
|
||
|
Leon Black
|
67
|
Chairman, Chief Executive Officer and Director
|
||
|
Joshua Harris
|
54
|
Senior Managing Director and Director
|
||
|
Marc Rowan
|
56
|
Senior Managing Director and Director
|
||
|
Anthony Civale
|
44
|
Co-Chief Operating Officer
|
||
|
Martin Kelly
|
51
|
Chief Financial Officer and Co-Chief Operating Officer
|
||
|
Scott Kleinman
|
46
|
Co-President
|
||
|
John Suydam
|
59
|
Chief Legal Officer
|
||
|
James Zelter
|
56
|
Co-President
|
||
|
Michael Ducey
|
70
|
Director
|
||
|
Robert Kraft
|
77
|
Director
|
||
|
A.B. Krongard
|
82
|
Director
|
||
|
Pauline Richards
|
70
|
Director
|
||
Leon Black.
Mr. Black is the Chairman of the board of directors and Chief Executive Officer of Apollo and a Managing Partner of Apollo Management, L.P. In 1990, Mr. Black founded Apollo Management, L.P. and Lion Advisors, L.P. to manage investment capital on behalf of a group of institutional investors, focusing on corporate restructuring, leveraged buyouts and taking minority positions in growth-oriented companies. From 1977 to 1990, Mr. Black worked at Drexel Burnham Lambert Incorporated, where he served as a Managing Director, head of the Mergers & Acquisitions Group, and co-head of the Corporate Finance Department. Mr. Black previously served on the boards of directors of the general partner of AAA and of Sirius XM Radio Inc. Mr. Black is a Co-Chairman of The Museum of Modern Art and a trustee of The Mount Sinai Medical Center and The Asia Society. He is also a member of The Council on Foreign Relations and The Partnership for New York City. He is also a member of the board of directors of FasterCures. Mr. Black graduated summa cum laude from Dartmouth College in 1973 with a major in Philosophy and History and received an MBA from Harvard Business School in 1975. Mr. Black has significant experience making and managing private equity investments on behalf of Apollo and has over 39 years’ experience financing, analyzing and investing in public and private companies. In his prior positions with Drexel and in his positions at Apollo, Mr. Black is responsible for leading and overseeing teams of professionals. His extensive experience allows Mr. Black to provide insight into various aspects of Apollo’s business and is of significant value to the board of directors.
Joshua Harris.
Mr. Harris is a Senior Managing Director and a member of the board of directors of Apollo and a Managing Partner of Apollo Management, L.P., which he co-founded in 1990. Prior to 1990, Mr. Harris was a member of the Mergers and Acquisitions group of Drexel Burnham Lambert Incorporated. Mr. Harris is a member of the Federal Reserve Bank of New York’s Investor Advisory Committee on Financial Markets and the Council of Foreign Relations. He is a Managing Partner of the Philadelphia 76ers, Managing Member of the New Jersey Devils, a General Partner of the Crystal Palace Football Club and a member of the Board of Governors of the National Basketball Association. Mr. Harris also serves on the Board of Trustees of Mount Sinai Medical Center, Harvard Business School and the Wharton School at the University of Pennsylvania. Mr. Harris has previously served on the board of directors of Berry Plastics Group Inc., EP Energy Corporation, EPE Acquisition, LLC, CEVA Logistics, Constellium N.V., and LyondellBasell Industries B.V. Mr. Harris graduated summa cum laude and Beta Gamma Sigma from the University of Pennsylvania’s Wharton School of Business with a B.S. in Economics and received his M.B.A. from the Harvard Business School, where he graduated as a Baker and Loeb Scholar. Mr. Harris has significant experience in making and managing private equity investments on behalf of Apollo and has over 29 years’ experience in financing, analyzing and investing in public and private companies. Mr. Harris’s extensive knowledge of Apollo’s business and experience in a variety of senior leadership roles enhance the breadth of experience of the board of directors.
Marc Rowan.
Mr. Rowan is a Senior Managing Director and member of the board of directors of Apollo and a Managing Partner of Apollo Management, L.P., which he co-founded in 1990. Prior to 1990, Mr. Rowan was a member of the Mergers & Acquisitions Group of Drexel Burnham Lambert Incorporated, with responsibilities in high yield financing, transaction idea generation and merger structure negotiation. Mr. Rowan currently serves on the boards of directors of, inter alia, Athene Holding Ltd, Athora Holding Ltd. and VA Capital. He has previously served on the boards of directors of, inter alia, the general
-
217
-
partner of AAA, AMC Entertainment, Inc., Cablecom GmbH, Caesars Acquisition Co., Caesars Entertainment Corporation, Caesars Entertainment Operating Co., Culligan Water Technologies, Inc., Countrywide Holdings Limited, Furniture Brands International Inc., Mobile Satellite Ventures, LLC, National Cinemedia, Inc., National Financial Partners, Inc., New World Communications, Inc., the New York City Police Foundation, Norwegian Cruise Lines, Quality Distribution, Inc., Samsonite Corporation, SkyTerra Communications Inc., Unity Media SCA, Vail Resorts, Inc. and Wyndham International, Inc. Mr. Rowan is also active in charitable activities. He is a founding member and Chairman of the Youth Renewal Fund, is Chair of the Board of Overseers of the University of Pennsylvania’s Wharton School of Business and is a member of the Board of Trustees of the University of Pennsylvania. Mr. Rowan also serves on the boards of directors of Jerusalem U, Tapd, Inc. and Penthera Partners, Inc. Mr. Rowan graduated summa cum laude from the University of Pennsylvania’s Wharton School of Business with a B.S. and an M.B.A. in Finance. Mr. Rowan has significant experience making and managing private equity investments on behalf of Apollo and has over 30 years’ experience financing, analyzing and investing in public and private companies. Mr. Rowan’s extensive financial background and expertise in private equity investments enhance the breadth of experience of the board of directors.
Anthony Civale.
Mr. Civale joined Apollo in 1999 and serves as Co-Chief Operating Officer of Apollo. Prior to his recent appointment, Mr. Civale served as Lead Partner and Chief Operating Officer of Apollo’s credit business since 2011. Prior to 2011, Mr. Civale was a Senior Partner in Apollo's private equity business and served on the Board of Directors of Berry Plastics Group, Goodman Global, Harrah's Entertainment, HFA Holdings Limited, and Prestige Cruises. Mr. Civale has also been involved in charitable endeavors including his service on the Board of Trustees of Middlebury College and the Board of Directors of both Youth, I.N.C. and Focus For a Future. Before joining Apollo, Mr. Civale was employed by Deutsche Bank Securities, Inc. and Bankers Trust Company within the Corporate Finance division responsible for sourcing, structuring and executing financing and merger and acquisition advice for the firm's private equity clients. Mr. Civale graduated from Middlebury College with a B.A. in Political Science.
Martin Kelly
. Mr. Kelly joined Apollo in 2012 as Chief Financial Officer and now also serves as Co-Chief Operating Officer of Apollo. From 2008 to 2012, Mr. Kelly was with Barclays Capital and, from 2000 to 2008, Mr. Kelly was with Lehman Brothers Holdings Inc. Prior to departing Barclays Capital, Mr. Kelly served as Managing Director, CFO of the Americas, and Global Head of Financial Control for their Corporate and Investment Bank. Prior to joining Lehman Brothers in 2000, Mr. Kelly spent 13 years with PricewaterhouseCoopers LLP, including serving in the Financial Services Group in New York from 1994 to 2000. Mr. Kelly was appointed a Partner of the firm in 1999. Mr. Kelly received a degree in Commerce, majoring in Finance and Accounting, from the University of New South Wales in 1989.
Scott Kleinman.
Mr. Kleinman joined Apollo in 1996 and serves as Co-President of Apollo and Lead Partner for Apollo’s private equity business. Mr. Kleinman has served as Lead Partner for Apollo’s private equity business since 2009 and became Co-President in January 2018. Prior to 1996, Mr. Kleinman was a member of the Investment Banking division at Smith Barney Inc. from 1994 to 1996. Mr. Kleinman serves on the board of directors of Constellis Holdings and Momentive Performance Materials Holdings, Inc. In 2014, he founded the Kleinman Center for Energy Policy at the University of Pennsylvania. He is a member of the Board of Overseers at the University of Pennsylvania School of Design. Mr. Kleinman received a B.A. and B.S. from the University of Pennsylvania and the Wharton School of Business, respectively, graduating magna cum laude, Phi Beta Kappa.
John Suydam.
Mr. Suydam joined Apollo in 2006 and serves as Apollo’s Chief Legal Officer. From 2002 to 2006, Mr. Suydam was a partner at O’Melveny & Myers LLP where he served as head of Mergers and Acquisitions and co-head of the Corporate Department. Prior to that time, Mr. Suydam served as Chairman of the law firm O’Sullivan, LLP which specialized in representing private equity investors. Mr. Suydam serves on the boards of The Legal Action Center, Environmental Solutions Worldwide, Inc. and New York University School of Law, and is a member of the Department of Medicine Advisory Board of the Mount Sinai Medical Center. Mr. Suydam received his J.D. from New York University and graduated magna cum laude with a B.A. in History from the State University of New York at Albany.
James Zelter.
Mr. Zelter joined Apollo in 2006 and serves as Co-President of Apollo and Chief Investment Officer of Apollo’s credit business. Mr. Zelter has served as Chief Investment Officer of Apollo’s credit business since 2006 and became Co-President in January 2018. Since 2006, Mr. Zelter has also served in several senior roles at Apollo Investment Corporation, a publicly traded vehicle managed by Apollo, and remains a director on its board of directors. Prior to joining Apollo, Mr. Zelter was with Citigroup Inc. and its predecessor companies from 1994 to 2006. From 2003 to 2005, Mr. Zelter was Chief Investment Officer of Citigroup Alternative Investments, and prior to that he was responsible for Citigroup’s Global High Yield franchise. Prior to joining Citigroup in 1994, Mr. Zelter was a High Yield Trader at Goldman, Sachs & Co. Mr. Zelter has significant experience in global credit markets and has overseen the broad expansion of Apollo’s credit platform. He is a board member of DUMAC, the investment management company that oversees both Duke University’s endowment and the Duke Endowment. Mr. Zelter has a B.A. in Economics from Duke University.
-
218
-
Michael Ducey.
Mr. Ducey has served as an independent director of Apollo and a member of the audit committee and as Chairman of the conflicts committee of our board of directors since 2011. Mr. Ducey was with Compass Minerals International, Inc., from March 2002 to May 2006, where he served in a variety of roles, including as President, Chief Executive Officer and Director prior to his retirement in May 2006. Prior to joining Compass Minerals International, Inc., Mr. Ducey worked for nearly 30 years at Borden Chemical, Inc., in various management, sales, marketing, planning and commercial development positions, and ultimately as President, Chief Executive Officer and Director. Mr. Ducey joined Ciner Resources Corporation (formerly OCI Resources LP) as an independent member of the board of directors in September 2014, where he serves on the audit committee and the conflicts committee. From May 2006 to July 2016, Mr. Ducey was a member of the board of directors of Verso Paper Holdings, Inc. and served as Chairman of the audit committee. From September 2009 to December 2012, Mr. Ducey was the non-executive Chairman of TPC Group, Inc. and served on the audit committee and the environmental health and safety committee. From June 2006 to May 2008, Mr. Ducey served on the board of directors of and as a member of the governance and compensation committee of the board of directors of UAP Holdings Corporation. From July 2010 to May 2011, Mr. Ducey was a member of the board of directors and served on the audit committee of Smurfit-Stone Container Corporation. From October 2010 to April 2017, Mr. Ducey served as the Chairman of the compliance and governance committee and the nominations committee of the board of directors of HaloSource, Inc. Mr. Ducey graduated from Otterbein University with a degree in Economics and an M.B.A. in finance from the University of Dayton. Mr. Ducey’s comprehensive corporate background and his experience serving on various boards and committees add significant value to the board of directors.
Robert Kraft.
Mr. Kraft has served as an independent director of Apollo since 2014. Mr. Kraft is Chairman and Chief Executive Officer of The Kraft Group, which includes the New England Patriots, New England Revolution, Gillette Stadium, Rand-Whitney Group and International Forest Products Corporation. Mr. Kraft serves on a number of NFL Committees, including the Executive Committee, Finance Committee and Broadcast Committee (Chairman). He also serves as Chairman for both the New England Patriots Charitable Foundation and the Kraft Family Foundation, Inc., and is a Trustee of the Dana-Farber Cancer Institute. He is a member of the executive committee of the Massachusetts Competitive Partnership. From 2006 to 2015, Mr. Kraft served as a member of the board of directors of Viacom Inc. Mr. Kraft’s corporate strategic and operational experience combined with his strong relationships in the business community make him a valuable board member of the board of directors.
A.B. Krongard.
Mr. Krongard has served as an independent director of Apollo and as a member of the audit committee of our board of directors since 2011. Mr. Krongard also became a member of the conflicts committee of our board of directors in January 2019. From 2001 to 2004, Mr. Krongard served as Executive Director of the Central Intelligence Agency. From 1998 to 2001, Mr. Krongard served as Counselor to the Director of Central Intelligence. Prior to 1998, Mr. Krongard served in various capacities at Alex Brown, Incorporated, including serving as Chief Executive Officer beginning in 1991 and assuming additional duties as Chairman of the board of directors in 1994. Upon the merger of Alex Brown, Incorporated with Bankers Trust Corporation in 1997, Mr. Krongard served as Vice-Chairman of the Board of Bankers Trust Corporation and served in such capacity until assuming his position at the Central Intelligence Agency. Mr. Krongard serves as the Lead Director and chairman of the audit committee of Under Armour, Inc., and also serves as chairman of the nominating and corporate governance committee and a member of the compensation committee of Iridium Communications Inc. Mr. Krongard also serves on the board of trustees of In-Q-Tel, Inc. Mr. Krongard graduated with honors from Princeton University and received a J.D. from the University of Maryland School of Law, where he also graduated with honors. Mr. Krongard’s comprehensive corporate background contributes to the range of experience of the board of directors.
Pauline Richards.
Ms. Richards has served as an independent director of Apollo and as Chairman of the audit committee of our board of directors since 2011. Ms. Richards currently serves as Chief Operating Officer of Armour Group Holdings Limited, a position she has held since 2008. Ms. Richards also serves as a member of the Audit and Governance Committees of the board of directors of Wyndham Hotels and Resorts. Prior to mid-2018, Ms. Richards served on the board of Wyndham Worldwide, a position she held since 2006; is a director of Hamilton Insurance Group, serving on the audit and investment committees, a position she has held since 2013; and is the Treasurer of the board of directors of PRIDE Bermuda, a drug prevention organization of which she has been a member for over 20 years. Prior to 2008, Ms. Richards served as Director of Development of Saltus Grammar School from 2003 to 2008, as Chief Financial Officer of Lombard Odier Darier Hentsch (Bermuda) Limited from 2001 to 2003, and as Treasurer of Gulf Stream Financial Limited from 1999 to 2000. Ms. Richards also served as a member of the Audit Committee and chair of the Corporate Governance Committee of the board of directors of Butterfield Bank from 2006 to 2013. Ms. Richards graduated from Queen’s University, Ontario, Canada, with a BA in psychology and has obtained certification as a CPA, CMA. Ms. Richards’ extensive finance experience and her service on the boards of other public companies add significant value to the board of directors.
Our Manager
Our operating agreement provides that so long as the Apollo Group beneficially owns at least 10% of the aggregate number of votes that may be cast by holders of outstanding voting shares, our manager, which is owned and controlled by our Managing Partners, will manage all of our operations and activities and will have discretion over significant corporate actions,
-
219
-
such as the issuance of securities, payment of distributions, sales of assets, making certain amendments to our operating agreement and other matters, and our board of directors will have no authority other than that which our manager chooses to delegate to it. We refer to the Apollo Group’s beneficial ownership of at least 10% of such voting power as the “Apollo control condition.” For purposes of our operating agreement, the “Apollo Group” means (i) our manager and its affiliates, including their respective general partners, members and limited partners, (ii) Holdings and its affiliates, including their respective general partners, members and limited partners, (iii) with respect to each Managing Partner, such Managing Partner and such Managing Partner’s “group” (as defined in Section 13(d) of the Exchange Act), (iv) any former or current investment professional of or other employee of an “Apollo employer” (as defined below) or the Apollo Operating Group (or such other entity controlled by a member of the Apollo Operating Group), (v) any former or current executive officer of an Apollo employer or the Apollo Operating Group (or such other entity controlled by a member of the Apollo Operating Group); and (vi) any former or current director of an Apollo employer or the Apollo Operating Group (or such other entity controlled by a member of the Apollo Operating Group). With respect to any person, “Apollo employer” means Apollo Global Management, LLC or such other entity controlled by Apollo Global Management, LLC or its successor as may be such person’s employer but does not include any portfolio companies.
Decisions by our manager are made by its executive committee, the only voting members of which are our three Managing Partners. Each Managing Partner will remain on the executive committee for so long as he is employed by us, provided that Mr. Black, upon his retirement, may at his option remain on the executive committee until his death or disability or any commission of an act that would constitute cause if Mr. Black had still been employed by us. Other than those actions that require unanimous consent, actions by the executive committee are determined by majority vote of its voting members, except as to the following matters, as to which Mr. Black will have the right of veto: (i) the designations of directors to our board, or (ii) a sale or other disposition of the Apollo Operating Group and/or its subsidiaries or any portion thereof, through a merger, recapitalization, stock sale, asset sale or otherwise, to an unaffiliated third party (other than through an exchange of Apollo Operating Group units, transfers by a Managing Partner or a permitted transferee to another permitted transferee, or the issuance of bona fide equity incentives to any of our non-Managing Partner employees) that constitutes (x) a direct or indirect sale of a ratable interest (or substantially ratable interest) in each entity that constitutes the Apollo Operating Group or (y) a sale of all or substantially all of the assets of Apollo (this clause (ii), an “LB Approval Event”). Exchanges of Apollo Operating Group units for Class A shares that are not pro rata among our Managing Partners or in which each Managing Partner has the option not to participate are not subject to Mr. Black’s right of veto.
Subject to limited exceptions described in our operating agreement, our manager may not sell, exchange or otherwise dispose of all or substantially all of our assets and those of our subsidiaries, taken as a whole, in a single transaction or a series of related transactions without the approval of holders of a majority of the aggregate number of voting shares outstanding; provided, however, that this does not preclude or limit our manager’s ability, in its sole discretion, to mortgage, pledge, hypothecate or grant a security interest in all or substantially all of our assets and those of our subsidiaries (including for the benefit of persons other than us or our subsidiaries, including affiliates of our manager) and does not apply to any forced sale of any or all of our assets pursuant to the foreclosure of, or other realization upon, any such encumbrance.
We will reimburse our manager and its affiliates for all costs incurred in managing and operating us, and our operating agreement provides that our manager will determine the expenses that are allocable to us. The agreement does not limit the amount of expenses for which we will reimburse our manager and its affiliates.
Board Composition and Limited Powers of Our Board of Directors
For so long as the Apollo control condition is satisfied, our manager shall (i) nominate and elect all directors to our board of directors, (ii) set the number of directors of our board of directors and (iii) fill any vacancies on our board of directors. After the Apollo control condition is no longer satisfied, each of our directors will be elected by the vote of a plurality of our shares entitled to vote, voting as a single class, to serve until his or her successor is duly elected or appointed and qualified or until his or her earlier death, retirement, disqualification, resignation or removal. Our board currently consists of seven members. For so long as the Apollo control condition is satisfied, our manager may remove any director, with or without cause, at any time. After such condition is no longer satisfied, a director or the entire board of directors may be removed by the affirmative vote of holders of 50% or more of the total voting power of our shares.
As noted, so long as the Apollo control condition is satisfied, our manager will manage all of our operations and activities, and our board of directors will have no authority other than that which our manager chooses to delegate to it. In the event that the Apollo control condition is not satisfied, our board of directors will manage all of our operations and activities.
Pursuant to a delegation of authority from our manager, which may be revoked, our board of directors has established and at all times will maintain audit and conflicts committees of the board of directors that have the responsibilities described below under “—Committees of the Board of Directors—Audit Committee” and “—Committees of the Board of Directors—Conflicts Committee.”
-
220
-
Where action is required or permitted to be taken by our board of directors or a committee thereof, a majority of the directors or committee members present at any meeting of our board of directors or any committee thereof at which there is a quorum shall be the act of our board or such committee, as the case may be. Our board of directors or any committee thereof may also act by unanimous written consent.
Under the Agreement Among Managing Partners (as described under “Item 13. Certain Relationships and Related Transactions—Lenders Rights Agreement—Amendments to Managing Partner Transfer Restrictions”), the vote of a majority of the independent members of our board of directors will decide the following: (i) in the event that a vacancy exists on the executive committee of our manager and the remaining members of the executive committee cannot agree on a replacement (other than a replacement for Mr. Black nominated by Mr. Black or his representative, which requires the approval of only one member of the executive committee), the independent members of our board of directors shall select one of the two nominees to the executive committee of our manager presented to them by the remaining members of such executive committee to fill the vacancy on such executive committee and (ii) in the event that Mr. Black wishes to exercise his ability to cause an LB Approval Event, the affirmative vote of the majority of the independent members of our board of directors shall be required to approve such a transaction. We are not a party to the Agreement Among Managing Partners, and neither we nor our shareholders (other than our Strategic Investor, as described under “Item 13. Certain Relationships and Related Transactions—Lenders Rights Agreement—Amendments to Managing Partner Transfer Restrictions”) have any right to enforce the provisions described above. Such provisions can be amended or waived upon agreement of our Managing Partners at any time.
Committees of the Board of Directors
We have established an audit committee as well as a conflicts committee. Our audit committee has adopted a charter that complies with current SEC and NYSE rules relating to corporate governance matters. Our board of directors may from time to time establish other committees of our board of directors.
Audit Committee
The primary purpose of our audit committee is to assist our manager in overseeing and monitoring (i) the quality and integrity of our financial statements, (ii) our compliance with legal and regulatory requirements, (iii) our independent registered public accounting firm’s qualifications and independence and (iv) the performance of our independent registered public accounting firm.
The current members of our audit committee are Messrs. Ducey and Krongard and Ms. Richards. Ms. Richards currently serves as Chairperson of the committee. Each of the members of our audit committee meets the independence standards and financial literacy requirements for service on an audit committee of a board of directors pursuant to the Exchange Act and NYSE rules applicable to audit committees and corporate governance. Furthermore, our manager has determined that Ms. Richards is an “audit committee financial expert” within the meaning of Item 407(d)(5) of Regulation S-K. Our audit committee has a charter which is available on our website at www.apollo.com under the “Shareholders/Corporate Governance” section.
Conflicts Committee
The current members of our conflicts committee are Messrs. Ducey and Krongard. Mr. Ducey currently serves as Chairman of the committee. Mr. Krongard became a member of the conflicts committee in January 2019. The purpose of the conflicts committee is to review specific matters that our manager believes may involve conflicts of interest. The conflicts committee will determine whether the resolution of any conflict of interest submitted to it is fair and reasonable to us. Any matters approved by the conflicts committee will be conclusively deemed to be fair and reasonable to us and not a breach by us of any duties that we may owe to our shareholders. In addition, the conflicts committee may review and approve any related person transactions, other than those that are approved pursuant to our related person policy, as described under “Item 13. Certain Relationships and Related Party Transactions—Statement of Policy Regarding Transactions with Related Persons,” and may establish guidelines or rules to cover specific categories of transactions.
Code of Business Conduct and Ethics
We have a Code of Business Conduct and Ethics, which applies to, among others, our principal executive officer, principal financial officer and principal accounting officer. A copy of our Code of Business Conduct and Ethics is available on our website at www.apollo.com under the “Shareholders/Corporate Governance” section. We intend to disclose any amendment to or waiver of the Code of Business Conduct and Ethics on behalf of an executive officer or director either on our website or in an 8-K filing.
-
221
-
Corporate Governance Guidelines
We have Corporate Governance Guidelines that address significant issues of corporate governance and set forth procedures by which our manager and board of directors carry out their respective responsibilities. The guidelines are available for viewing on our website at
www.apollo.com under the “Shareholders/Corporate Governance” section. We will also provide the guidelines, free of charge, to shareholders who request them. Requests should be directed to our Secretary at Apollo Global Management, LLC, 9 West 57th Street, 43rd Floor, New York, New York 10019.
Communications with the Board of Directors
A shareholder or other interested party who wishes to communicate with our directors, a committee of our board of directors, our independent directors as a group or our board of directors generally may do so in writing. Any such communications may be sent to our board of directors by U.S. mail or overnight delivery and should be directed to our Secretary at Apollo Global Management, LLC, 9 West 57th Street, 43rd Floor, New York, New York 10019, who will forward them to the intended recipient(s). Any such communications may be made anonymously. Unsolicited advertisements, invitations to conferences or promotional materials, in the discretion of our Secretary, are not required, however, to be forwarded to the directors.
Executive Sessions of Independent Directors
The independent directors serving on our board of directors meet periodically in executive sessions during the year at regularly scheduled meetings of our board of directors. These executive sessions will be presided over by one of the independent directors serving on our board of directors selected on an ad-hoc basis.
Section 16(a) Beneficial Ownership Reporting Compliance
Section 16(a) of the Exchange Act requires our officers and directors, and persons who own more than ten percent of a registered class of the Company’s equity securities to file initial reports of ownership and reports of changes in ownership with the SEC and furnish us with copies of all Section 16(a) forms they file. To our knowledge, based solely on our review of the copies of such reports furnished to us or written representations from such persons that they were not required to file a Form 5 to report previously unreported ownership or changes in ownership, we believe that, with respect to the fiscal year ended
December 31, 2018
, such persons complied with all such filing requirements, with the exception of a Form 4 for Mr. Zelter reporting one transaction which was inadvertently filed late through no fault of the reporting person.
|
ITEM 11.
|
EXECUTIVE COMPENSATION
|
Compensation Discussion and Analysis
Overview of Compensation Philosophy
Alignment of Interests with Investors and Shareholders.
Our principal compensation philosophy is to align the interests of our Managing Partners and other senior professionals with those of our Class A shareholders and fund investors. This alignment, which we believe is a key driver of our success, has been achieved principally by our Managing Partners’ and other investment professionals’ direct beneficial ownership of equity in our business in the form of AOG Units and Class A shares, their rights to receive a portion of the performance fees earned from our funds or to receive compensation based on the level of performance fees earned, the direct investment by our Managing Partners and other investment professionals in our funds, and our practice of paying annual compensation partly in the form of equity-based grants that are subject to vesting. As a result of this alignment, the compensation of our professionals is closely tied to the performance of our businesses.
Significant Personal Investment.
Our investment professionals generally make significant personal investments in our funds (as more fully described under “Item 13. Certain Relationships and Related Party Transactions”), directly or indirectly, and our professionals who receive rights to performance fees (excluding rights in respect of non-drawdown-style funds and certain pooled performance fee vehicles) from our funds are generally required to invest their own capital in the funds on which they work in amounts that are proportionate to the size of their participation in performance fees. We believe that these investments help to ensure that our professionals have capital at risk and reinforce the linkage between the success of the funds we manage, the success of the Company and the compensation paid to our professionals. Our eligible professionals are generally permitted to invest in our funds free of management fees, and in certain instances, performance fees. These opportunities further align our employees with our fund investors and Class A shareholders, encourage our professionals to work across our integrated platform, and bolster links among our various businesses.
Long-Term Performance and Commitment.
Most of our professionals have been issued RSUs, which provide rights to receive Class A shares and, in some instances, distribution equivalents on those shares. The vesting requirements and minimum
-
222
-
retained ownership requirements for these awards contribute to our professionals’ focus on long-term performance while enhancing retention of these professionals. In 2018, we introduced grants of RSUs to certain professionals that vest based on both continued service and the Company’s receipt of performance fees, within prescribed periods, sufficient to cover the associated equity-based compensation expense. We believe that the addition of these performance measures helps to promote the interests of our Class A shareholders and fund investors by making RSU vesting contingent on the realization and distribution of profits on our funds. RSUs are not awarded to our Managing Partners, whose beneficial ownership of equity interests in the Company is generally in the form of AOG Units, as discussed below under “—Note on Distributions on Apollo Operating Group Units.” By requiring our named executive officers to be subject to non-competition, confidentiality and other limitations on behavior described below under “—Potential Payments upon Termination or Change in Control,” we further reinforce our culture of fiduciary protection of our fund investors and shareholders.
Discouragement of Excessive Risk-Taking.
Although investments in alternative assets can pose risks, we believe that our compensation program includes significant elements that discourage excessive risk-taking while aligning the compensation of our professionals with our long-term performance. For example, notwithstanding that we accrue compensation for our performance fee programs (described below) as increases in the value of the portfolio investments are recorded in the related funds, we generally make payments in respect of performance fee allocations to our employees only after profitable investments have actually been realized. Similarly, for our funds that pay incentive fees, employees receive distributions of such fees only after the fund has appreciated in value (typically above a specified level) during the applicable period. This helps to ensure that our professionals take a long-term view that is consistent with the interests of the Company, our shareholders and the investors in our funds. Moreover, if a drawdown-style fund fails to achieve specified investment returns due to diminished performance of later investments, our performance fee program relating to that fund generally permits, for the benefit of the limited partner investors in that fund, the return of performance fee distributions (generally net of tax) previously made to us or our employees. These provisions discourage excessive risk-taking and promote a long-term view that is consistent with the interests of our fund investors and shareholders. Our general requirement that our professionals who hold direct performance fee rights in our drawdown-style funds, invest in those funds, further aligns the interests of our professionals, fund investors and Class A shareholders. Finally, the minimum retained ownership requirements of our RSUs, as well as a requirement that a portion of the performance fee rights of certain investment professionals be settled either in the form of RSUs or by using a portion of the amounts received to purchase Class A restricted shares, discourage excessive risk-taking because the value of these interests is tied directly to the long-term performance of our Class A shares.
Note on Distributions on Apollo Operating Group Units
We note that all of our Managing Partners, as well as Scott Kleinman and James Zelter, beneficially own AOG Units that they received in 2007 in anticipation of our 2011 initial public offering, in exchange for contributing certain partnership interests they then held in the Company. As of
December 31, 2018
, the Managing Partners and Messrs. Kleinman and Zelter beneficially owned, through their interest in Holdings, approximately 47% of the total limited partner interests in the Apollo Operating Group. When made, distributions on these units are in the same amount per unit as distributions made to us in respect of the AOG Units we hold. Although distributions on AOG Units are distributions on equity rather than compensation, they play a central role in aligning their holders’ interests with those of our Class A shareholders, which is consistent with our compensation philosophy.
Compensation Elements for Named Executive Officers
Consistent with our emphasis on alignment of interests with our fund investors and Class A shareholders, compensation elements tied to the profitability of our different businesses and that of the funds that we manage are the primary means of compensating our five executive officers listed in the tables below, or the “named executive officers.” The key elements of the compensation of our named executive officers during fiscal year
2018
are described below. We distinguish among the compensation components applicable to our named executive officers as appropriate in the below summary. Messrs. Black, Harris and Rowan are the three members of the group referred to elsewhere in this report as the “Managing Partners.” In 2018 we promoted two of our investment professionals, Scott Kleinman and James Zelter, to the position of Co-President, causing them to become executive officers.
Annual Salary
.
Each of our named executive officers receives an annual salary. We believe that the compensation of our investment professionals, including Messrs. Kleinman and Zelter, should primarily be tied to the profitability of our different businesses and managed funds, and accordingly annual salaries constitute a relatively small component of the overall compensation of our named executive officers who are investment professionals. The base salaries of our named executive officers are set forth in the Summary Compensation Table below, and those base salaries were set by our Managing Partners in their judgment after considering the historic compensation levels of the officer, competitive market dynamics, and each officer’s level of responsibility and anticipated contributions to our overall success.
-
223
-
RSUs.
While we historically granted RSUs that constitute a portion of annual compensation (which we refer to as Bonus Grants) in the same year that the services to which they relate were provided, for services provided in 2017 and 2018, our Managing Partners determined that, for administrative convenience at year-end, such RSUs would instead be awarded in the following January. This change in the timing of the grant date does not affect the vesting terms or dates that the RSUs, upon issuance of the underlying class A shares, are treated as income to the named executive officers or the dates that we are able to deduct the associated compensation expense. The Bonus Grants are generally subject to three-year vesting and minimum retained ownership requirements. All named executive officers who receive RSUs are required to retain at least 50% of any Class A shares issued to them pursuant to Bonus Grants granted prior to September 1, 2016, and 25% of any Class A Shares issued to them pursuant to all other RSU awards (including Bonus Grants), in each case net of the number of gross shares sold or netted to pay applicable income or employment taxes. Because the Summary Compensation Table and Grant of Plan-Based Awards Table below properly list only those stock awards that were granted in 2018, those tables do not include Bonus Grants for services provided in 2018. The 2018 RSU awards made to Messrs. Zelter and Kleinman in connection with their promotions to Co-President vest based on both continued service and the Company’s receipt of performance fees, within prescribed periods, sufficient to cover the associated equity-based compensation expense. This feature conditions the RSU vesting on the realization and distribution of profits on our funds. Mr. Kelly received in 2018 a grant of 9,719 restricted stock units (having a grant date fair value of $158,680) in respect of shares of ARI, the publicly traded REIT that we manage, pursuant to an approval by its compensation committee consistent with a recommendation it received from us. That grant from ARI is properly not included in the Summary Compensation Table and Grant of Plan-Based Awards Table below.
Performance Fees.
Performance fee entitlements with respect to our funds confer rights to participate in distributions made to investors following the realization of an investment or receipt of operating profit from an investment by the fund, provided the fund has attained a specified performance return. Distributions of performance fees from limited life funds generally are subject to contingent repayment (generally net of tax) if the fund fails to achieve specified investment returns due to diminished performance of later investments, while distributions of operating profit earned from funds that are not designed to have a limited life are generally not subject to contingent repayment. The actual gross amount of performance fees available for distribution are a function of the performance of the applicable fund. For these reasons, we believe that participation in performance fees generated by our funds aligns the interests of our participating named executive officers with those of our Class A shareholders and fund investors.
We currently have two principal types of performance fee programs, which we refer to as dedicated and incentive pool. Messrs. Kelly, Kleinman, Suydam and Zelter have been awarded rights to participate in a dedicated percentage of the performance fee income earned by the general partners of certain of our funds and were awarded additional performance fee rights in 2018. Dedicated performance fee rights in our private equity funds are typically subject to vesting, which rewards long-term commitment to the firm and thereby enhances the alignment of participants’ interests with the Company. As with amounts distributed in respect of other performance fees, our financial statements characterize performance fee income allocated to participating professionals in respect of their dedicated performance fee rights as compensation. Amounts paid in respect of dedicated performance fees are included in the “All Other Compensation” column of the summary compensation table.
Our performance-based incentive arrangement referred to as the incentive pool further aligns the overall compensation of certain of our professionals to the realized performance of our business. The incentive pool provides for compensation based on realized performance fees and enhances our capacity to offer competitive compensation opportunities to our professionals. “Realized performance fees” means performance fees earned by the general partners of our funds under the applicable fund limited partnership agreements based upon transactions that have closed or other rights to cash that have become fixed in the applicable calendar year period. Under this arrangement, Messrs. Kelly and Kleinman, among other of our professionals, received incentive pool performance fees earned during
2018
. Allocations to participants in the incentive pool contain both a mandatory component and a discretionary component, both of which may vary year-to-year, including as a result of our overall realized performance and the contributions and performance of each participant. The Managing Partners determine the amount of the realized performance fees to place into the incentive pool in their discretion after considering various factors, including Company profitability, management company cash requirements and anticipated future costs, provided that the incentive pool consists of an amount equal to at least one percent (1%) of the realized performance fees attributable to profits generated after creation of the incentive pool that were taxable in the applicable year and not allocable to dedicated performance fee entitlements. Each participant in the incentive pool is entitled to receive, as a mandatory component of participation in the incentive pool, his or her pro rata share of this 1% amount each year, provided the participant remains employed by us at the time of allocation. Our financial statements characterize the performance fee income allocated to participating professionals in respect of incentive pool interests as compensation. The “All Other Compensation” column of the summary compensation table includes actual distributions paid from the incentive pool.
Performance Fee Restricted Shares and RSUs
. We require that a portion of the performance fees distributed by certain of the investment funds we manage be used by our employees who participate in those amounts to purchase Class A restricted shares, or that a portion is delivered to them as a grant of RSUs, in each case that are issued under our 2007 Omnibus Equity Incentive Plan. This practice further promotes alignment with our Class A shareholders and motivates participating professionals to maximize the success of the Company as a whole. Like our Bonus Grant RSUs, these restricted shares and RSUs
-
224
-
are generally subject to three-year vesting, which fosters retention. In accordance with applicable rules, the Summary Compensation Table and Grants of Plan-Based Awards Table include the restricted shares and RSUs they acquired by our named executive officers in
2018
in respect of performance fee amounts received.
Determination of Compensation of Named Executive Officers
Our Managing Partners make all final determinations regarding named executive officer compensation. Decisions about the variable elements of a named executive officer’s compensation, including participation in our performance fee programs, discretionary bonuses (if any) and grants of equity-based awards, are based primarily on our Managing Partners’ assessment of such named executive officer’s individual performance, operational performance for the department or division in which the officer (other than a Managing Partner) serves, and the officer’s impact on our overall operating performance and potential to contribute to long-term shareholder value. In evaluating these factors, our Managing Partners do not utilize quantitative performance targets but rather rely upon their judgment about each named executive officer’s performance to determine an appropriate reward for the current year’s performance. The determinations by our Managing Partners are ultimately subjective, are not tied to specified annual, qualitative or individual objectives or performance factors, and reflect discussions among the Managing Partners. Factors that our Managing Partners typically consider in making such determinations include the named executive officer’s type, scope and level of responsibilities, active participation in managing a team of professionals, corporate citizenship and the named executive officer’s overall contributions to our success. Our Managing Partners also consider each named executive officer’s prior-year compensation, the appropriate balance between incentives for long-term and short-term performance, competitive market dynamics, compensation provided to the named executive officer by other entities, and the compensation paid to the named executive officer’s peers within the Company.
We believe that the compensation of our investment professionals should primarily be tied to the profitability of our different businesses and managed funds. Consistent with past years, our Managing Partners in 2018 provided that annual salaries constituted a relatively small component of the overall compensation of our named executive officers who are investment professionals. The Managing Partners determined that it was appropriate for Messrs. Kleinman and Zelter, in connection with their promotions to the role of Co-President, to receive up-front RSU awards. Each such RSU is subject to five-year vesting and the Company’s receipt of performance fees, within prescribed periods, sufficient to cover its associated equity-based compensation expense. This requirement enhances alignment with the interests of our Class A shareholders and fund investors. The Managing Partners considered our Co-Presidents’ historical role, the particulars of the business units on which they focus, their capital contribution obligations and their performance fee entitlements when determining their individual compensation terms. The Managing Partners determined that, based on the above factors, including the named executive officers’ overall compensation levels, discretionary cash bonuses would not be awarded to any named executive officer for
2018
. For a discussion of our Managing Partners’ determinations in respect of our RSU program, see below under “—Narrative Disclosure to the Summary Compensation Table and Grants of Plan-Based Awards Table-Awards of Restricted Share Units Under the Equity Plan.”
Compensation Committee Interlocks and Insider Participation
Our board of directors does not have a compensation committee. Our Managing Partners make all compensation determinations with respect to executive officer compensation. For a description of certain transactions between us and the Managing Partners, see “Item 13. Certain Relationships and Related Party Transactions.”
Compensation Committee Report
As noted above, our board of directors does not have a compensation committee. The executive committee of our manager identified below has reviewed and discussed with management the foregoing Compensation Discussion and Analysis and, based on such review and discussion, has determined that the Compensation Discussion and Analysis should be included in this Annual Report on Form 10-K.
Leon Black
Joshua Harris
Marc Rowan
Summary Compensation Table
The following summary compensation table sets forth information concerning the compensation earned by, awarded to or paid to our principal executive officer, our principal financial officer, and our three other most highly compensated executive officers for the fiscal year ended December 31,
2018
. The earnings of Mr. Black, a Managing Partner and our chief executive officer, derive predominantly from distributions he receives as a result of his indirect beneficial ownership of AOG Units and his rights under the tax receivable agreement (described elsewhere in this report, including above under “Item 5. Market for Registrant’s Common Equity, Related Stockholder Matters and Issuer Purchases of Equity Securities-Cash Distribution Policy”), rather than from compensation, and accordingly are not included in the tables below. The earnings of Messrs. Zelter and Kleinman from their
-
225
-
AOG Units and tax receivable agreement rights also do not appear in the tables below. The executive officers named in the table are referred to as the named executive officers.
|
Name and Principal Position
|
Year
|
Salary
($)
|
Stock Awards
($)
(1)
|
All Other Compensation
($)
(2)
|
Total
($)
|
|||||||||
|
Leon Black,
Chairman, Chief Executive Officer and Director
|
2018
|
100,000
|
|
—
|
|
152,617
|
|
252,617
|
|
|||||
|
2017
|
100,000
|
|
—
|
|
151,888
|
|
251,888
|
|
||||||
|
2016
|
100,000
|
|
—
|
|
150,622
|
|
250,622
|
|
||||||
|
Martin Kelly,
Chief Financial Officer and
(effective January 15, 2019)
Co-Chief Operating Officer
|
2018
|
1,000,000
|
|
533,079
|
|
1,519,014
|
|
3,052,093
|
|
|||||
|
2017
|
1,000,000
|
|
19,183
|
|
1,499,776
|
|
2,518,959
|
|
||||||
|
2016
|
1,000,000
|
|
1,897,640
|
|
1,050,000
|
|
3,947,640
|
|
||||||
|
James Zelter,
Co-President
|
2018
|
100,000
|
|
82,582,612
|
|
2,706,864
|
|
85,389,476
|
|
|||||
|
Scott Kleinman,
Co-President
|
2018
|
1,200,000
|
|
30,151,932
|
|
13,964,975
|
|
45,316,907
|
|
|||||
|
John Suydam,
Chief Legal Officer
|
2018
|
2,000,000
|
|
726,338
|
|
1,688,644
|
|
4,414,982
|
|
|||||
|
2017
|
2,000,000
|
|
49,430
|
|
1,283,090
|
|
3,332,520
|
|
||||||
|
2016
|
2,500,000
|
|
498,260
|
|
668,934
|
|
3,667,194
|
|
||||||
|
(1)
|
For Messrs. Kelly, Kleinman, Suydam and Zelter, represents the aggregate grant date fair value of stock awards granted, as applicable, computed in accordance with FASB ASC Topic 718. The amounts shown do not reflect compensation actually received by the named executive officers, but instead represent the aggregate grant date fair value of the awards. See note
12
to our consolidated financial statements for further information concerning the assumptions made in valuing our RSU awards.
|
|
(2)
|
Amounts included for
2018
represent, in part, actual cash distributions in respect of dedicated performance fee rights for Mr. Kleinman of $6,703,711, for Mr. Suydam of $1,008,980 and for Mr. Kelly of $434,014. The
2018
amounts also include actual incentive pool cash distributions of $1,085,000 for Mr. Kelly, $2,589,526 for Mr. Kleinman and $21,821 for Mr. Suydam. In addition to the cash distributions Messrs. Kleinman and Suydam received in respect of their dedicated performance fees, in 2018 those interests also caused them to receive in-kind distributions of Athene Holding shares that had been held by AAA, the value of which shares upon delivery ($4,671,738 and $637,055, respectively) is included in this column. For Mr. Zelter, the amounts include $2,706,864 in cash he received in respect of dedicated performance fee rights. The “All Other Compensation” column for
2018
also includes costs relating to Company-provided cars and drivers for the business and personal use of Messrs. Black and Suydam. We provide this benefit because we believe that its cost is outweighed by the convenience, increased efficiency and added security and confidentiality that it offers. The personal use cost was approximately $136,592 for Mr. Black and $18,788 for Mr. Suydam. For Mr. Black, this amount includes both fixed and variable costs, including lease costs, driver compensation, driver meals, fuel, parking, tolls, repairs, maintenance and insurance. For Mr. Suydam, this amount includes the costs to the Company associated with his use of a car service. Except as discussed in this paragraph, no 2018 perquisites or personal benefits individually exceeded the greater of $25,000 or 10% of the total amount of all perquisites and other personal benefits reported for the named executive officer. The cost of excess liability insurance provided to our named executive officers falls below this threshold. Mr. Kleinman, Mr. Zelter and Mr. Kelly did not receive perquisites or personal benefits in 2018, except for incidental benefits having an aggregate value of less than $10,000. Our named executive officers also receive secretarial support with respect to personal matters. We incur no incremental cost for the provision of such additional benefits. Accordingly, no such amount is included in the Summary Compensation Table.
|
Narrative Disclosure to the Summary Compensation Table and Grants of Plan-Based Awards Table
Employment, Non-Competition and Non-Solicitation Agreement with Chairman and Chief Executive Officer
On January 4, 2017, we entered into an employment, non-competition and non-solicitation agreement with Leon Black, our chairman and chief executive officer and a member of our manager’s executive committee. This agreement, which provides for an annual salary of $100,000 and the right to participate in our employee benefit plans as in effect from time to time, has a three-year term.
Employment, Non-Competition and Non-Solicitation Agreement with Chief Financial Officer and Co-Chief Operating Officer
On July 2, 2012, we entered into an employment, non-competition and non-solicitation agreement with Martin Kelly, our chief financial officer and co-chief operating officer. His annual base salary is $1,000,000. Mr. Kelly is eligible for an annual bonus in an amount to be determined by the Managing Partners in their discretion. As provided in the agreement, Mr. Kelly participates in the incentive pool and is eligible to receive distributions thereunder.
Employment, Non-Competition and Non-Solicitation Agreement with Co-President, James Zelter
We entered into an amended and restated employment agreement with James Zelter on June 20, 2014, and further amended
-
226
-
that agreement on November 12, 2017 in connection with his promotion to Co-President. As amended, the agreement provides for base pay of $100,000 per year and a grant to Mr. Zelter of 2,500,000 RSUs. Pursuant to the agreement, Mr. Zelter holds dedicated performance fee rights in respect of our credit funds. These interests are subject to vesting or to the right to retain such interests for a limited period following his employment termination. As required by the terms of his performance fee arrangements, Mr. Zelter has made investments of his own capital in various of our funds.
Employment, Non-Competition and Non-Solicitation Agreement with Co-President, Scott Kleinman
On November 12, 2017, in connection with his promotion to Co-President, we entered into an employment agreement with Scott Kleinman that provided for a grant to him of 800,000 RSUs. On July 3, 2018, we entered into a letter agreement with Mr. Kleinman, effective as of January 1, 2018. The letter agreement provides that Mr. Kleinman is entitled to base pay of $1,200,000 per year and to distributions from our incentive pool or other amounts totaling at least $3,300,000 annually, a portion of which is provided in the form of Bonus Grant RSUs. Mr. Kleinman holds dedicated performance fee rights in respect of various of our funds. These interests are generally subject to vesting. As required by the terms of his performance fee arrangements, Mr. Kleinman has made investments of his own capital in various of our funds.
Employment Agreement with Chief Legal Officer
On July 19, 2017, we entered into an employment, non-competition and non-solicitation agreement with John Suydam, our chief legal officer. Pursuant to the agreement, Mr. Suydam is entitled to an annual base salary of $2,000,000 and an annual equity-based award that has an aggregate value of $500,000 and vests in three equal annual installments. On November 7, 2018, we entered into a letter agreement with Mr. Suydam regarding the vesting of his equity awards. Subject to his continued compliance with the non-competition and other obligations under his employment agreement, upon the earlier of (1) our termination of his employment without cause, and (2) January 1, 2020 (provided he has not terminated his employment or engaged in conduct constituting cause before such date), if Mr. Suydam agrees to be reasonably available to consult with us for two years, he will vest in all unvested RSUs and restricted shares then outstanding. RSUs and restricted shares that vest under the letter agreement are subject to forfeiture in the event of a breach of his noncompetition obligations.
Awards of Restricted Shares Under the Equity Plan
Our equity plan, known as the 2007 Omnibus Equity Incentive Plan, was last approved by our shareholders on March 10, 2011. Grants of restricted Class A shares under the plan have been made to Messrs. Zelter, Kleinman, Kelly and Suydam as a result of their participation in performance fee programs that require that a portion of the performance fee amounts be used to purchase restricted Class A shares, or is settled in the form of a grant of RSUs. The restricted Class A shares vest in three equal annual installments from a vesting date specified at the time of the award. The restricted Class A shares participate in any distributions made on our Class A shares and are not subject to our minimum retained share ownership requirements. The number of restricted Class A shares that were granted in 2018 was determined pursuant to the formula prescribed by the applicable performance fee program, which converts the specified portion of the carry to be distributed into a number of shares based on the volume weighted average price as of a prescribed date in the applicable calendar quarter.
Grants of Plan-Based Awards
The following table presents information regarding RSUs and restricted Class A shares granted to Messrs. Zelter, Kleinman, Kelly and Suydam under our 2007 Omnibus Equity Incentive Plan in
2018
. No options were granted to a named executive officer in 2018.
-
227
-
|
Name
|
Grant Date
|
All Other Stock Awards:
Number of Shares of Stock or Units
(#)
(1)
|
Grant Date Fair Value or Modification Date Incremental Fair Value of Stock and Option Awards
($)
(2)
|
||||||
|
Leon Black
|
—
|
|
—
|
|
—
|
|
|||
|
Martin Kelly
|
January 8, 2018
|
|
14,049
|
|
479,211
|
|
|||
|
February 5, 2018
|
|
532
|
|
18,359
|
|
||||
|
May 4, 2018
|
|
547
|
|
17,258
|
|
||||
|
August 15, 2018
|
|
167
|
|
5,813
|
|
||||
|
November 15, 2018
|
|
415
|
|
12,438
|
|
||||
|
James Zelter
|
January 8, 2018
|
|
2,500,000
|
|
82,575,000
|
|
|||
|
November 15, 2018
|
|
254
|
|
7,612
|
|
||||
|
Scott Kleinman
|
January 8, 2018
|
|
800,000
|
|
26,424,000
|
|
|||
|
February 5, 2018
|
|
38,791
|
|
1,338,677
|
|
||||
|
May 4, 2018
|
|
33,559
|
|
1,058,786
|
|
||||
|
August 15, 2018
|
|
12,182
|
|
424,055
|
|
||||
|
November 15, 2018
|
|
30,244
|
|
906,413
|
|
||||
|
John Suydam
|
January 8, 2018
|
|
14,788
|
|
504,419
|
|
|||
|
February 5, 2018
|
|
2,585
|
|
89,208
|
|
||||
|
May 4, 2018
|
|
1,408
|
|
44,422
|
|
||||
|
August 15, 2018
|
|
699
|
|
24,332
|
|
||||
|
November 15, 2018
|
|
2,134
|
|
63,956
|
|
||||
|
(1)
|
Represents the number of RSUs and restricted Class A shares granted, as applicable. RSUs and Restricted shares are discussed above under “—Compensation Elements for Named Executive Officers—RSUs” and “—Compensation Elements for Named Executive Officers—Restricted Shares,” respectively.
|
|
(2)
|
Represents the aggregate grant date fair value of the RSUs and restricted Class A shares granted in
2018
, computed in accordance with FASB ASC Topic 718. The amounts shown do not reflect compensation actually received, but instead represent the aggregate grant date fair value of the award.
|
Outstanding Equity Awards at Fiscal Year-End
The following table presents information regarding unvested RSU and restricted Class A share awards made by us to our named executive officers under our 2007 Omnibus Equity Incentive Plan that were outstanding at December 31,
2018
. Our named executive officers did not hold any options at fiscal year-end.
-
228
-
|
Stock Awards
|
|||||||||
|
Name
|
Date of Grant
|
Number of Unearned Shares, Units or Other Rights That Have Not Vested
(#)
|
Market or Payout Value of Unearned Shares, Units or Other Rights That Have Not Vested
($)
(16)
|
||||||
|
Leon Black
|
—
|
|
—
|
|
—
|
|
|||
|
Martin Kelly
|
November 15, 2018
|
|
415
|
|
(1)
|
10,184
|
|
||
|
August 15, 2018
|
|
167
|
|
(2)
|
4,098
|
|
|||
|
May 4, 2018
|
|
547
|
|
(3)
|
13,423
|
|
|||
|
February 5, 2018
|
|
355
|
|
(4)
|
8,712
|
|
|||
|
January 8, 2018
|
|
9,366
|
|
(5)
|
229,842
|
|
|||
|
November 17, 2017
|
|
21
|
|
(6)
|
515
|
|
|||
|
November 17, 2017
|
|
65
|
|
(7)
|
1,595
|
|
|||
|
August 3, 2017
|
|
81
|
|
(6)
|
1,988
|
|
|||
|
May 1, 2017
|
|
23
|
|
(8)
|
564
|
|
|||
|
May 1, 2017
|
|
253
|
|
(9)
|
6,209
|
|
|||
|
December 29, 2016
|
|
23,993
|
|
(10)
|
588,788
|
|
|||
|
December 29, 2016
|
|
12,211
|
|
(11)
|
299,658
|
|
|||
|
James Zelter
|
November 15, 2018
|
|
254
|
|
(1)
|
6,233
|
|
||
|
January 8, 2018
|
|
2,500,000
|
|
(12)
|
61,350,003
|
|
|||
|
August 3, 2017
|
|
1,585
|
|
(8)
|
38,896
|
|
|||
|
May 1, 2017
|
|
17,821
|
|
(9)
|
437,327
|
|
|||
|
May 1, 2017
|
|
2,417
|
|
(8)
|
59,313
|
|
|||
|
March 1, 2017
|
|
682
|
|
(8)
|
16,736
|
|
|||
|
December 29, 2016
|
|
14,910
|
|
(11)
|
365,891
|
|
|||
|
October 31, 2016
|
|
93
|
|
(13)
|
2,282
|
|
|||
|
October 31, 2016
|
|
1,892
|
|
(13)
|
46,430
|
|
|||
|
August 5, 2016
|
|
37
|
|
(14)
|
908
|
|
|||
|
May 6, 2016
|
|
284
|
|
(15)
|
6,969
|
|
|||
|
May 6, 2016
|
|
392
|
|
(15)
|
9,620
|
|
|||
|
Scott Kleinman
|
November 15, 2018
|
|
30,244
|
|
(1)
|
742,188
|
|
||
|
August 15, 2018
|
|
12,182
|
|
(2)
|
298,946
|
|
|||
|
May 4, 2018
|
|
33,559
|
|
(3)
|
823,538
|
|
|||
|
February 5, 2018
|
|
25,861
|
|
(4)
|
634,629
|
|
|||
|
January 8, 2018
|
|
800,000
|
|
(12)
|
19,632,001
|
|
|||
|
November 17, 2017
|
|
4,717
|
|
(7)
|
115,755
|
|
|||
|
November 17, 2017
|
|
1,538
|
|
(6)
|
37,743
|
|
|||
|
August 3, 2017
|
|
5,909
|
|
(6)
|
145,007
|
|
|||
|
May 1, 2017
|
|
566
|
|
(8)
|
13,890
|
|
|||
|
May 1, 2017
|
|
13,425
|
|
(9)
|
329,450
|
|
|||
|
John Suydam
|
November 15, 2018
|
|
2,134
|
|
(1)
|
52,368
|
|
||
|
August 15, 2018
|
|
699
|
|
(2)
|
17,153
|
|
|||
|
May 4, 2018
|
|
1,408
|
|
(3)
|
34,552
|
|
|||
|
February 5, 2018
|
|
1,724
|
|
(4)
|
42,307
|
|
|||
|
January 8, 2018
|
|
9,859
|
|
(5)
|
241,940
|
|
|||
|
August 3, 2017
|
|
208
|
|
(6)
|
5,104
|
|
|||
|
May 1, 2017
|
|
60
|
|
(8)
|
1,472
|
|
|||
|
May 1, 2017
|
|
650
|
|
(9)
|
15,951
|
|
|||
|
November 17, 2017
|
|
54
|
|
(6)
|
1,325
|
|
|||
|
November 17, 2017
|
|
166
|
|
(7)
|
4,074
|
|
|||
|
December 29, 2016
|
|
8,783
|
|
(11)
|
215,535
|
|
|||
|
(1)
|
Restricted Class A shares that vest in substantially equal annual installments on August 15 of each of 2019, 2020 and 2021.
|
|
(2)
|
Restricted Class A shares that vest in substantially equal annual installments on May 15 of each of 2019, 2020 and 2021.
|
|
(3)
|
Restricted Class A shares that vest in substantially equal annual installments on February 15 of each of 2019, 2020 and 2021.
|
-
229
-
|
(4)
|
Restricted Class A shares that vest in substantially equal annual installments on November 15 of each of 2019 and 2020.
|
|
(5)
|
Bonus Grant RSUs that vest in substantially equal annual installments on December 31 of each of 2019 and 2020.
|
|
(6)
|
Restricted Class A shares that vest on May 15 of each of 2019 and 2020.
|
|
(7)
|
Restricted Class A shares that vest on August 15 of each of 2019 and 2020.
|
|
(8)
|
Restricted Class A shares that vest on November 15, 2019.
|
|
(9)
|
Restricted Class A shares that vest on February 15 of each of 2019 and 2020.
|
|
(10)
|
RSUs that vest in substantially equal quarterly installments on March 31, 2019 and on the last day of each of the next three calendar quarters.
|
|
(11)
|
Bonus Grant RSUs that vest on December 31, 2019.
|
|
(12)
|
Performance RSUs that vest in substantially equal annual installments on January 1 of each of 2019, 2020, 2021, 2022 and 2023, subject to the availability of sufficient net cash incentive income to the Company as of such date.
|
|
(13)
|
Restricted Class A shares that vest on August 15, 2019.
|
|
(14)
|
Restricted Class A shares that vest on May 15, 2019.
|
|
(15)
|
Restricted Class A shares that vest on February 15, 2019.
|
|
(16)
|
Amounts calculated by multiplying the number of unvested RSUs held by the named executive officer by the closing price of $24.54 per Class A share on December 31, 2018.
|
Option Exercises and Stock Vested
The following table presents information regarding the number of outstanding initially unvested RSUs and restricted Class A shares held by our named executive officers that vested during
2018
and the number of options exercised by our named executive officers in
2018
. The amounts shown below do not reflect compensation actually received by the named executive officers, but instead are calculations of the number of RSUs and restricted Class A shares that vested during
2018
based on the closing price of our Class A shares on the date of vesting. Shares received by our named executive officers in respect of vested RSUs are subject to our retained ownership requirements. No options were exercised by our named executive officers in
2018
.
|
Stock Awards
|
||||||||
|
Name
|
Type of Award
|
Number of Shares Acquired on Vesting
(#)
|
Value Realized on Vesting
($)
(1)
|
|||||
|
Leon Black
|
—
|
—
|
|
—
|
|
|||
|
Martin Kelly
|
RSUs
|
103,053
|
|
3,013,708
|
|
|||
|
Restricted Shares
|
408
|
|
13,093
|
|
||||
|
James Zelter
|
RSUs
|
54,181
|
|
1,467,841
|
|
|||
|
Restricted Shares
|
22,068
|
|
730,054
|
|
||||
|
Scott Kleinman
|
Restricted Shares
|
26,288
|
|
841,701
|
|
|||
|
John Suydam
|
RSUs
|
24,907
|
|
611,218
|
|
|||
|
Restricted Shares
|
1,460
|
|
46,466
|
|
||||
|
(1)
|
Amounts calculated by multiplying the number of RSUs or restricted Class A shares held by the named executive officer that vested on each applicable vesting date in 2018 by the closing price per Class A share on that date. Class A shares underlying the vested RSUs were issued to the named executive officer shortly after they vested.
|
Potential Payments upon Termination or Change in Control
None of the named executive officers is entitled to payment or other benefits in connection with a change in control.
Mr. Black is not entitled to severance or other payments or benefits in connection with an employment termination. Mr. Black is required to protect the confidential information of Apollo both during and after employment. In addition, until one year after employment termination, he is required to refrain from soliciting employees under specified circumstances or interfering with our relationships with investors and to refrain from competing with us in a business that involves primarily (i.e., more than 50%) third-party capital. These post-termination covenants survive any termination or expiration of the Agreement Among Managing Partners (described elsewhere in this report under “Item 13. Certain Relationships and Related Party Transactions—Agreement Among Managing Partners”). If Mr. Black becomes subject to a potential termination for cause or by reason of disability, our manager may appoint an investment professional to perform his functional responsibilities and duties until cause or disability definitively results in his termination or is determined not to have occurred, but the manager may so appoint an investment professional only if he is unable to perform his responsibilities and duties or, as a matter of fiduciary duty, should be prohibited from doing so. During any such period, Mr. Black shall continue to serve on the executive committee of our manager unless otherwise prohibited from doing so pursuant to the Agreement Among Managing Partners.
If Mr. Kelly’s employment is terminated by us without cause or he resigns for good reason, he will be entitled to
-
230
-
severance of six months’ base pay and reimbursement of health insurance premiums paid in the six months following his employment termination. If his employment is terminated by us without cause, he will vest in 50% of any unvested portion of his restricted shares. If Mr. Kelly’s employment is terminated by reason of death or disability, he will vest in 50% of any unvested portion of his Plan Grant RSUs, Bonus Grant RSUs, restricted shares and dedicated performance fee rights that are subject to vesting. If Mr. Kelly’s employment is terminated without cause, or he resigns, he will also be entitled to retain his dedicated performance fee rights that are subject to vesting to the extent then vested. We may terminate Mr. Kelly’s employment with or without cause, and we will provide 90 days’ notice (or payment in lieu of such period of notice) prior to a termination without cause. Mr. Kelly is required to give us 90 days’ notice prior to a resignation for any reason. He is required to protect the confidential information of Apollo both during and after employment. In addition, during employment and for 12 months after employment, Mr. Kelly is also obligated to refrain from soliciting our employees, interfering with our relationships with investors or other business relations, and competing with us in a business that manages or invests in assets substantially similar to those managed or invested in by Apollo or its affiliates.
We may terminate Mr. Zelter’s employment with or without cause, and we will provide 90 days’ notice (or payment in lieu of such period of notice) prior to a termination without cause. Mr. Zelter is required to provide 90 days’ notice prior to a resignation for any reason. Upon his termination of employment by reason of death or disability, Mr. Zelter will vest in 50% of his then unvested RSUs, restricted shares and performance fee rights that are subject to vesting. Upon his termination by the Company other than for cause, Mr. Zelter will vest in 50% of his then unvested restricted shares. If Mr. Zelter’s employment is terminated without cause or he resigns, he will also be entitled to retain his dedicated performance fee rights that are subject to vesting to the extent then vested. During his employment and for 12 months thereafter, he is also obligated to refrain from soliciting our employees, interfering with our relationships with investors or other business relations, and competing with us in a business that manages or invests in assets substantially similar to those invested in or managed by Apollo or its affiliates.
We may terminate Mr. Kleinman’s employment with or without cause, and we will provide 90 days’ notice (or payment in lieu of such period of notice) prior to a termination without cause. Mr. Kleinman is required to provide 90 days’ notice prior to a resignation for any reason. Upon his termination of employment by reason of death or disability, Mr. Kleinman will vest in 50% of his then unvested RSUs, restricted shares and dedicated performance fee interests that are subject to vesting. If Mr. Kleinman’s employment is terminated without cause, or he resigns, he will also be entitled to retain his dedicated performance fee rights that are subject to vesting to the extent then vested. If Mr. Kleinman’s employment with us terminates for any reason other than in circumstances in which he could have been terminated for cause, he will receive the cash portion of his incentive pool or annual bonus amount on a prorated basis through the last day of his full-time employment. Mr. Kleinman is required to protect the confidential information of Apollo both during and after employment. In addition, during employment and for 12 months after employment, he is obligated to refrain from soliciting our employees, interfering with our relationships with investors or other business relations, and competing with us in a business that manages or invests in assets substantially similar to those managed or invested in by Apollo or its affiliates.
We may terminate Mr. Suydam’s employment with or without cause, and we will provide 90 days’ notice (or payment in lieu of such period of notice) prior to a termination without cause. If Mr. Suydam’s employment is terminated by us without cause or he resigns for good reason, he will be entitled to severance of six months’ base pay and reimbursement of health insurance premiums paid in the six months following his employment termination. If his employment is terminated by reason of death, he will vest in 50% of his then unvested RSUs, restricted shares and dedicated performance fee rights that are subject to vesting. If Mr. Suydam’s employment is terminated without cause, or he resigns, he will also be entitled to retain his dedicated performance fee rights that are subject to vesting to the extent then vested. If Mr. Suydam’s employment is terminated by us without cause or by reason of disability, he will vest in 100% of this then unvested RSUs and restricted shares, provided he complies with his restrictive covenants and agrees to be available to consult with us from time to time for two years from his employment termination date. Mr. Suydam is required to protect our confidential information at all times. During his employment and for 12 months thereafter, Mr. Suydam is also obligated to refrain from soliciting our employees, interfering with our relationships with investors or other business relations, and competing with us in a business that manages or invests in assets substantially similar to those invested in or managed by Apollo or its affiliates. Mr. Suydam is required to provide 90 days’ notice prior to a resignation for any reason.
The named executive officers’ obligations during and after employment were considered by the Managing Partners in determining appropriate post-employment payments and benefits for the named executive officers.
The following table lists the estimated amounts that would have been payable to each of our named executive officers in connection with a termination that occurred on the last day of our last completed fiscal year and the value of any additional equity that would vest upon such termination. When listing the potential payments to named executive officers under the plans and agreements described above, we have assumed that the applicable triggering event occurred on December 31,
2018
and that the price per share of our Class A shares was $24.54, which is equal to the closing price on such date. For purposes of this table, RSU values are based on the $24.54 closing price.
-
231
-
|
Name
|
Reason for Employment Termination
|
Estimated Value of Cash Payments
($)
(1)
|
Estimated Value of Equity Acceleration
($)
(2)
|
|||||
|
Leon Black
|
Cause
|
—
|
|
—
|
|
|||
|
Death, disability
|
—
|
|
—
|
|
||||
|
Martin Kelly
|
Without cause
|
516,659
|
|
23,644
|
|
|||
|
By executive for good reason
|
516,659
|
|
—
|
|
||||
|
Death, disability
|
—
|
|
582,788
|
|
||||
|
James Zelter
|
Without cause
|
—
|
|
312,357
|
|
|||
|
Death, disability
|
—
|
|
31,170,304
|
|
||||
|
Scott Kleinman
|
Without cause
|
—
|
|
1,570,572
|
|
|||
|
Death, disability
|
—
|
|
11,386,573
|
|
||||
|
John Suydam
|
Without cause
|
1,016,659
|
|
174,308
|
|
|||
|
By executive for good reason
|
1,016,659
|
|
—
|
|
||||
|
Disability
|
—
|
|
631,782
|
|
||||
|
Death
|
—
|
|
315,891
|
|
||||
|
(1)
|
This amount would have been payable to the named executive officer had his employment been terminated by the Company without cause (and other than by reason of death or disability) or for good reason on December 31,
2018
|
|
(2)
|
This amount represents the additional equity vesting that the named executive officer would have received had his employment terminated in the circumstances described in the column, “Reason for Employment Termination,” on December 31,
2018
, based on the closing price of a Class A share on such date. Please see our “Outstanding Equity Awards at Fiscal Year-End” table above for information regarding the named executive officer’s unvested equity as of December 31,
2018
.
|
CEO to Median Employee Pay Ratio
SEC rules require companies to disclose the ratio of the total annual compensation of the principal executive officer (“PEO”) to the total annual compensation of the median employee (calculated excluding the PEO). Our PEO is Mr. Black and our ratio is as follows:
Mr. Black’s total annual compensation: $252,617
Median employee total annual compensation: $235,000
Ratio of PEO to median employee total annual compensation: 1.1:1
In determining the median employee, we prepared a list of all employees as of December 31, 2018. Consistent with applicable rules, we used reasonable estimates both in the methodology used to identify the median employee and in calculating the annual total compensation for employees other than the PEO. In measuring our employees’ total compensation, for employees other than the PEO, we used their base salary paid in 2018, their annual cash bonus paid in 2018 and the value of the equity awards they received in 2018 (unless they received an equity award in January 2019 for services provided in 2018, in which case we included the value of that January 2019 equity award). As noted above under “—Note on Distributions on Apollo Operating Group Units,” Mr. Black receives distributions on his AOG Units that are distributions on equity rather than compensation, and accordingly are not included here.
Director Compensation
We do not pay additional remuneration to Messrs. Black, Harris and Rowan, our employee directors, for their service on our board of directors. The
2018
compensation of Mr. Black is set forth above on the Summary Compensation Table. Messrs. Harris and Rowan are not named executive officers.
During
2018
, each independent director received (1) a base annual director fee of $125,000, (2) an additional annual director fee of $25,000 if he or she was a member of the audit committee, (3) an additional annual director fee of $10,000 if he or she was a member of the conflicts committee, (4) an additional annual director fee of $25,000 (incremental to the fee described in (2)) if he or she served as the chairperson of the audit committee, and (5) an additional annual director fee of $15,000 (incremental to the fee described in (3)) if he or she served as the chairperson of the conflicts committee. In addition, independent directors were reimbursed for reasonable expenses incurred in attending board meetings.
Currently, upon initial election to the board of directors, an independent director receives a grant of RSUs with a value of $300,000 that vests in equal annual installments on June 30 of each of the first, second and third years following the year that the grant is made. Incumbent independent directors who have fully vested in their initial RSU award receive an annual RSU award
-
232
-
with a value of $125,000 that vests on June 30 of the year following the year that the grant is made, and the directors listed on the below table received that award on July 31, 2018.
The following table provides the compensation for our independent directors during the year ended December 31,
2018
. Paul Fribourg resigned from the board of directors on November 30, 2018.
|
Name
|
Fees Earned or Paid in Cash
($)
|
Stock Awards
($)
(1)
|
Total
($)
|
||||||
|
Michael Ducey
|
175,000
|
|
129,484
|
|
304,484
|
|
|||
|
Paul Fribourg
|
135,000
|
|
129,484
|
|
264,484
|
|
|||
|
Robert Kraft
|
125,000
|
|
129,484
|
|
254,484
|
|
|||
|
A. B. Krongard
|
150,000
|
|
129,484
|
|
279,484
|
|
|||
|
Pauline Richards
|
175,000
|
|
129,484
|
|
304,484
|
|
|||
|
(1)
|
Represents the aggregate grant date fair value of stock awards granted, as applicable, computed in accordance with FASB ASC Topic 718. See note
12
to our consolidated financial statements for further information concerning the assumptions made in valuing our RSU awards. The amounts shown do not reflect compensation actually received by the independent directors, but instead represent the aggregate grant date fair value of the awards. Unvested director RSUs are not entitled to distributions or distribution equivalents. As of December 31, 2018, each of our independent directors, other than Mr. Fribourg (who forfeited his July 31, 2018 RSU award when he resigned before the vesting date), held 3,978 RSUs that were unvested and outstanding.
|
|
ITEM
12
.
|
SECURITY OWNERSHIP OF CERTAIN BENEFICIAL OWNERS AND MANAGEMENT AND RELATED STOCKHOLDER MATTERS
|
The following table sets forth information regarding the beneficial ownership of our Class A shares as of February 26, 2019 by (i) each person known to us to beneficially own more than 5% of the voting Class A shares of Apollo Global Management, LLC, (ii) each of our directors, (iii) each person who is a named executive officer for 2018 and (iv) all directors and executive officers as a group.
Beneficial ownership is determined in accordance with the rules of the SEC. To our knowledge, each person named in the table below has sole voting and investment power with respect to all of the Class A shares and interests in our Class B share shown as beneficially owned by such person, except as otherwise set forth in the notes to the table and pursuant to applicable community property laws. Unless otherwise indicated, the address of each person named in the table is c/o Apollo Global Management, LLC, 9 West 57th Street, New York, NY 10019.
In respect of our Class A shares, the table set forth below assumes the exchange by Holdings of all AOG Units for our Class A shares with respect to which the person listed below has the right to direct such exchange pursuant to the Amended and Restated Exchange Agreement described under “Item 13. Certain Relationships and Related Party Transactions—Amended and Restated Exchange Agreement,” and the distribution of such shares to such person as a limited partner of Holdings.
-
233
-
|
Class A Shares Beneficially Owned
|
Class B Share Beneficially Owned
|
|||||||||||||||||
|
Number of
Shares
|
Percent
(1)
|
Total Percentage of Voting Power
(2)
|
Number of
Shares
|
Percent
|
Total Percentage of Voting Power
(2)
|
|||||||||||||
|
Directors and Executive Officers:
|
||||||||||||||||||
|
Leon Black
(3)(4)
|
92,727,166
|
|
31.4
|
%
|
52.3
|
%
|
1
|
|
100
|
%
|
52.3
|
%
|
||||||
|
Joshua Harris
(3)(4)
|
48,432,643
|
|
19.3
|
%
|
52.3
|
%
|
1
|
|
100
|
%
|
52.3
|
%
|
||||||
|
Marc Rowan
(3)(4)
|
42,481,402
|
|
17.3
|
%
|
52.3
|
%
|
1
|
|
100
|
%
|
52.3
|
%
|
||||||
|
Pauline Richards
|
47,669
|
|
*
|
|
*
|
|
—
|
|
—
|
|
—
|
|
||||||
|
Alvin Bernard Krongard
(5)
|
299,442
|
|
*
|
|
*
|
|
—
|
|
—
|
|
—
|
|
||||||
|
Michael Ducey
(6)
|
47,036
|
|
*
|
|
*
|
|
—
|
|
—
|
|
—
|
|
||||||
|
Robert Kraft
(7)
|
344,567
|
|
*
|
|
*
|
|
—
|
|
—
|
|
—
|
|
||||||
|
Martin Kelly
|
206,999
|
|
*
|
|
*
|
|
—
|
|
—
|
|
—
|
|
||||||
|
John Suydam
(8)
|
594,082
|
|
*
|
|
*
|
|
—
|
|
—
|
|
—
|
|
||||||
|
James Zelter
(9)
|
3,001,906
|
|
1.5
|
%
|
*
|
|
—
|
|
—
|
|
—
|
|
||||||
|
Scott Kleinman
(10)
|
3,375,819
|
|
1.6
|
%
|
*
|
|
—
|
|
—
|
|
—
|
|
||||||
|
All directors and executive officers as a group (twelve persons)
(11)
|
192,812,794
|
|
49.3
|
%
|
49.8
|
%
|
1
|
|
100
|
%
|
52.3
|
%
|
||||||
|
BRH
(4)
|
—
|
|
—
|
|
—
|
|
1
|
|
100
|
%
|
52.3
|
%
|
||||||
|
AP Professional Holdings, L.P.
(12)
|
202,245,561
|
|
50.0
|
%
|
52.3
|
%
|
—
|
|
—
|
|
—
|
|
||||||
|
5% Stockholders:
|
||||||||||||||||||
|
Tiger Global Management, LLC
(13)
|
37,663,500
|
|
18.6
|
%
|
9.7
|
%
|
—
|
|
—
|
|
—
|
|
||||||
|
Capital World Investors
(14)
|
10,657,700
|
|
5.3
|
%
|
2.8
|
%
|
||||||||||||
*Represents less than 1%.
|
(1)
|
The percentage of beneficial ownership of our Class A shares is based on voting and non-voting Class A shares outstanding.
|
|
(2)
|
The total percentage of voting power is based on voting Class A shares and the Class B share. The voting power calculations assume 17,710,039 Class A shares held by the Strategic Investor based on a Form 13F for the quarter ended December 31, 2018, filed with the SEC on February 8, 2019 by the Strategic Investor. Class A shares held by the Strategic Investor do not have voting rights.
|
|
(3)
|
The number of Class A shares presented are held by estate planning vehicles, for which this individual disclaims beneficial ownership except to the extent of his pecuniary interest therein. The number of Class A shares presented do not include any Class A shares owned by Holdings with respect to which this individual, as one of the three owners of all of the interests in BRH, the general partner of Holdings, or as a party to the Agreement Among Managing Partners described under “Item 13. Certain Relationships and Related Party Transactions—Agreement Among Managing Partners” or the Managing Partner Shareholders Agreement described under “Item 13. Certain Relationships and Related Party Transactions—Managing Partner Shareholders Agreement,” may be deemed to have shared voting or dispositive power. Each of these individuals disclaims any beneficial ownership of these shares, except to the extent of his pecuniary interest therein.
|
|
(4)
|
BRH, the holder of the Class B share, is one third owned by Mr. Black, one third owned by Mr. Harris and one third owned by Mr. Rowan. Pursuant to the Agreement Among Managing Partners, the Class B share is to be voted and disposed of by BRH based on the determination of at least two of the three Managing Partners; as such, they share voting and dispositive power with respect to the Class B share.
|
|
(5)
|
Includes 250,000 Class A shares held by a trust for the benefit of Mr. Krongard’s children, for which Mr. Krongard’s children are the trustees. Mr. Krongard disclaims beneficial ownership with respect to such shares, except to the extent of his pecuniary interest therein.
|
|
(6)
|
Includes 2,616 Class A shares held by two trusts for the benefit of Mr. Ducey’s grandchildren, for which Mr. Ducey and several of Mr. Ducey’s immediate family members are trustees and have shared investment power. Mr. Ducey disclaims beneficial ownership of the Class A shares held in the trusts, except to the extent of his pecuniary interest therein.
|
|
(7)
|
Includes 330,000 Class A shares held by two entities, which are under the sole control of Mr. Kraft, and may be deemed to be beneficially owned by Mr. Kraft.
|
|
(8)
|
Includes 64,260 Class A shares held by a trust for the benefit of Mr. Suydam’s spouse and children, for which Mr. Suydam’s spouse is the trustee. Mr. Suydam disclaims beneficial ownership with respect to such shares, except to the extent of his pecuniary interest therein.
|
|
(9)
|
Includes 469,741 Class A shares held by two entities, over which Mr. Zelter exercises voting and investment control, and may be deemed to be beneficially owned by Mr. Zelter.
|
|
(10)
|
Includes 289,209 Class A shares held by six entities, over which Mr. Kleinman exercises voting and investment control, and may be deemed to be beneficially owned by Mr. Kleinman.
|
|
(11)
|
Refers to shares beneficially owned by the individuals who were directors and executive officers as of February 26, 2019.
|
|
(12)
|
Assumes that no Class A shares are distributed to the limited partners of Holdings. The general partner of Holdings is BRH, which is one third owned by Mr. Black, one third owned by Mr. Harris and one third owned by Mr. Rowan. BRH is also the general partner of BRH Holdings, L.P., the limited partnership through which Messrs. Black, Harris and Rowan indirectly beneficially own (through estate planning vehicles) their limited partner interests in Holdings. These individuals disclaim any beneficial ownership of these Class A shares, except to the extent of their pecuniary interest therein.
|
-
234
-
|
(13)
|
Based on a Schedule 13G filed with the SEC on February 14, 2019, by Tiger Global Management, LLC. The address of Tiger Global Management, LLC is 9 West 57
th
Street, 35
th
Floor, New York, New York. Pursuant to an irrevocable proxy, all voting rights attaching to the shares held by Tiger Global Management, LLC are exercisable by Apollo Global Management, LLC.
|
|
(14)
|
Based on a Schedule 13G filed with the SEC on February 14, 2019, by Capital World Investors, a division of Capital Research and Management Company. The address of Capital World Investors is 333 South Hope Street, Los Angeles, California.
|
|
ITEM 13.
|
CERTAIN RELATIONSHIPS AND RELATED PARTY TRANSACTIONS
|
Agreement Among Managing Partners
Our Managing Partners have entered into the Agreement Among Managing Partners. The Managing Partners beneficially own Holdings in accordance with their respective sharing percentages, or “Sharing Percentages,” as set forth in the Agreement Among Managing Partners. For the purposes of the Agreement Among Managing Partners, “Pecuniary Interest” means, with respect to each Managing Partner, the number of AOG Units that would be distributable to him assuming that Holdings was liquidated and its assets distributed in accordance with its governing agreements.
Pursuant to the Agreement Among Managing Partners, each Managing Partner is vested in full in his respective AOG Units. We may not terminate a Managing Partner except for cause or by reason of disability.
The transfer by a Managing Partner of any portion of his Pecuniary Interest to a permitted transferee will in no way affect any of his obligations under the Agreement Among Managing Partners; provided, that all permitted transferees are required to sign a joinder to the Agreement Among Managing Partners.
The Managing Partners’ respective Pecuniary Interests in certain funds, or the “Heritage Funds,” within the Apollo Operating Group are not held in accordance with the Managing Partners’ respective Sharing Percentages. Instead, each Managing Partner’s Pecuniary Interest in such Heritage Funds is held in accordance with the historic ownership arrangements among the Managing Partners, and the Managing Partners continue to share the operating income in such Heritage Funds in accordance with their historic ownership arrangement with respect to such Heritage Funds.
The Agreement Among Managing Partners may be amended and the terms and conditions of the Agreement Among Managing Partners may be changed or modified upon the unanimous approval of the Managing Partners. We, our shareholders (other than the Strategic Investors, as set forth under “—Lenders Rights Agreement—Amendments to Managing Partner Transfer Restrictions”) and the Apollo Operating Group have no ability to enforce any provision of the Agreement Among Managing Partners or to prevent the Managing Partners from amending it.
Managing Partner Shareholders Agreement
We have entered into the Managing Partner Shareholders Agreement with our Managing Partners. The Managing Partner Shareholders Agreement provides the Managing Partners with certain rights with respect to the approval of certain matters and the designation of nominees to serve on our board of directors, as well as registration rights for our securities that they own.
Board Representation
The Managing Partner Shareholders Agreement requires our board of directors, so long as the Apollo control condition is satisfied, to nominate individuals designated by our manager such that our manager will have a majority of the designees on our board.
Transfers
The Managing Partner Shareholders Agreement provides that each Managing Partner and his permitted transferees may transfer all of the Pecuniary Interests (as defined in the Managing Partner Shareholders Agreement) of such Managing Partner to any person or entity in accordance with Rule 144, in a registered public offering or in a transaction exempt from the registration requirements of the Securities Act. The above transfer restrictions will lapse with respect to a Managing Partner if he dies or becomes disabled.
Indemnity
Realized performance fees from certain of our funds can be distributed to us on a current basis but are subject to repayment by the subsidiaries of the Apollo Operating Group that act as general partners of the funds in the event that certain specified return thresholds are not ultimately achieved. The Managing Partners, Contributing Partners and certain other investment professionals have personally guaranteed, subject to certain limitations, the obligations of these subsidiaries in respect of this general partner obligation. Such guarantees are several and not joint and are limited to a particular Managing Partner’s, Contributing
-
235
-
Partner’s or other investment professional’s distributions. Pursuant to the Managing Partner Shareholders Agreement, we agreed to indemnify each of our Managing Partners and certain Contributing Partners against all amounts that they pay pursuant to any of these personal guarantees in favor of Fund IV, Fund V and Fund VI (including costs and expenses related to investigating the basis for or objecting to any claims made in respect of the guarantees) for all interests that our Managing Partners and Contributing Partners have contributed or sold to the Apollo Operating Group.
Accordingly, in the event that our Managing Partners, Contributing Partners and certain other investment professionals are required to pay amounts in connection with a general partner obligation for the return of previously made distributions with respect to Fund IV, Fund V and Fund VI, we will be obligated to reimburse our Managing Partners and certain Contributing Partners for the indemnifiable percentage of amounts that they are required to pay even though we did not receive the distribution to which that general partner obligation related.
Registration Rights
Pursuant to the Managing Partner Shareholders Agreement, we have granted Holdings, an entity through which our Managing Partners and Contributing Partners beneficially own their AOG Units, and its permitted transferees the right, under certain circumstances and subject to certain restrictions, to require us to register under the Securities Act our Class A shares held or acquired by them. Under the Managing Partner Shareholders Agreement, the registration rights holders (i) have “demand” registration rights that require us to register under the Securities Act the Class A shares that they hold or acquire, (ii) may require us to make available registration statements permitting sales of Class A shares they hold or acquire in the market from time to time over an extended period and (iii) have the ability to exercise certain piggyback registration rights in connection with registered offerings requested by other registration rights holders or initiated by us. We have agreed to indemnify each registration rights holder and certain related parties against any losses or damages resulting from any untrue statement or omission of material fact in any registration statement or prospectus pursuant to which such holder sells our shares, unless such liability arose from the holder’s misstatement or omission, and each registration rights holder has agreed to indemnify us against all losses caused by his misstatements or omissions. We have filed a shelf registration statement in connection with the rights described above.
Roll-Up Agreements
Pursuant to the Roll-Up Agreements, the Contributing Partners received interests in Holdings, which we refer to as AOG Units, in exchange for their contribution of assets to the Apollo Operating Group. The AOG Units received by our Contributing Partners and any units into which they have been exchanged are fully vested and tradable. Our Contributing Partners have the ability to direct Holdings to exercise Holdings’ registration rights described above under “—Managing Partner Shareholders Agreement—Registration Rights.”
Under their Roll-Up Agreements or other agreements, each of our Contributing Partners is subject to a noncompetition provision until the first anniversary of the date of termination of his service as a partner to us. During that period, our Contributing Partners are prohibited from (i) engaging in any business activity in which we operate, (ii) rendering any services to any alternative asset management business (other than that of us or our affiliates) that involves primarily (i.e., more than 50%) third-party capital or (iii) acquiring a financial interest in, or becoming actively involved with, any competitive business (other than as a passive holding of a specified percentage of publicly traded companies). In addition, our Contributing Partners are subject to non-solicitation, non-hire and noninterference covenants during employment and for at least 12 months thereafter. Our Contributing Partners are also bound to a non-disparagement covenant with respect to us and our Contributing Partners and to confidentiality restrictions. Resignation by any of our Contributing Partners shall require ninety days’ notice. Any restricted period applicable to a Contributing Partner will commence after the ninety-day notice of termination period.
Amended and Restated Exchange Agreement
We have entered into an exchange agreement with Holdings under which, subject to certain procedures and restrictions (including any applicable transfer restrictions and lock-up agreements described above) upon 60 days’ written notice prior to a designated quarterly date, each Managing Partner and Contributing Partner (or certain transferees thereof) has the right to cause Holdings to exchange the AOG Units that he owns through Holdings for our Class A shares and to sell such Class A shares at the prevailing market price (or at a lower price that such Managing Partner or Contributing Partner is willing to accept). To affect the exchange, Holdings distributes the AOG Units to be exchanged to the applicable Managing Partner or Contributing Partner. Under the exchange agreement, the Managing Partner or Contributing Partner must then simultaneously exchange one AOG Unit (being an equal limited partner or limited liability company interest in each Apollo Operating Group entity) for each Class A share received from our intermediate holding companies. As a Managing Partner or Contributing Partner exchanges his AOG Units, our interest in the AOG Units will be correspondingly increased and the voting power of the Class B share will be correspondingly decreased.
The exchange agreement was amended and restated on May 6, 2013, and further amended and restated on each of March 5, 2014, May 5, 2016 and April 28, 2017. The amendments to the original exchange agreement (i) permit exchanging
-
236
-
holders certain rights to revoke exchanges of their AOG Units in whole, but not in part, in certain circumstances; (ii) permit transfers of a holder’s exchanged shares to a qualifying entity that can sell them under a Rule 10b5-1 trading plan; (iii) require the Company to use its commercially reasonable efforts to file and keep effective a shelf registration statement relating to the exchange of Class A shares received upon an exchange of AOG Units; (iv) modify the exchange mechanics to address certain tax considerations of an exchange for exchanging holders; and (v) require exchanging holders to reimburse APO Corp. for any incremental U.S. federal income tax incurred by APO Corp. as a result of the modification of the exchange mechanics.
Amended and Restated Tax Receivable Agreement
As a result of each of AMH Holdings (Cayman), L.P. and the Apollo Operating Group entities controlled by it or Apollo Management Holdings, L.P. having made an election under Section 754 of the Internal Revenue Code, any exchanges by a Managing Partner or Contributing Partner of AOG Units that he owns through Holdings (together with the corresponding interest in our Class B share) for our Class A shares in a taxable transaction may result in an adjustment to the tax basis of a portion of the assets owned by the Apollo Operating Group at the time of the exchange. The taxable exchanges may result in increases in the tax depreciation and amortization deductions from depreciable and amortizable assets, as well as an increase in the tax basis of other assets, of the Apollo Operating Group that otherwise would not have been available. A portion of these increases in tax depreciation and amortization deductions, as well as the increase in the tax basis of such other assets, will reduce the amount of tax that APO Corp. would otherwise be required to pay in the future. Additionally, our acquisition of AOG Units from the Managing Partners or Contributing Partners, such as our acquisition of AOG Units from the Managing Partners in the Strategic Investors Transaction, have resulted, and may continue to result, in increases in tax deductions and tax basis that reduces the amount of tax that APO Corp. would otherwise be required to pay in the future.
APO Corp. has entered into a tax receivable agreement with our Managing Partners and Contributing Partners that provides for the payment by APO Corp. to an exchanging or selling Managing Partner or Contributing Partner of 85% of the amount of actual cash savings, if any, in U.S. Federal, state, local and foreign income tax that APO Corp. realizes (or is deemed to realize in the case of an early termination payment by APO Corp. or a change of control, as discussed below) as a result of these increases in tax deductions and tax basis, and certain other tax benefits, including imputed interest expense, related to payments pursuant to the tax receivable agreement. APO Corp. expects to benefit from the remaining 15% of actual cash savings, if any, in income tax that it realizes. For purposes of the tax receivable agreement, cash savings in income tax will be computed by comparing our actual income tax liability to the amount of such taxes that APO Corp. would have been required to pay had there been no increase to the tax basis of the tangible and intangible assets of the applicable Apollo Operating Group entity as a result of the transaction and had APO Corp. not entered into the tax receivable agreement. The tax savings achieved may not ensure that we have sufficient cash available to pay our tax liability or generate additional distributions to our investors. Also, we may need to incur additional debt to repay the tax receivable agreement if our cash flow needs are not met. The term of the tax receivable agreement will continue until all such tax benefits have been utilized or expired, unless APO Corp. exercises the right to terminate the tax receivable agreement by paying an amount based on the present value of payments remaining to be made under the agreement with respect to units that have been exchanged or sold and units which have not yet been exchanged or sold. Such present value will be determined based on certain assumptions, including that APO Corp. would have sufficient taxable income to fully utilize the deductions that would have arisen from the increased tax deductions and tax basis and other benefits related to the tax receivable agreement. In the event that other of our current or future U.S. subsidiaries become taxable as corporations and acquire AOG Units in the future, or if we become taxable as a corporation for U.S. Federal income tax purposes, each U.S. corporation will become subject to a tax receivable agreement with substantially similar terms.
The IRS could challenge our claim to any increase in the tax basis of the assets owned by the Apollo Operating Group that results from the exchanges entered into by the Managing Partners or Contributing Partners. The IRS could also challenge any additional tax depreciation and amortization deductions or other tax benefits we claim as a result of such increase in the tax basis of such assets. If the IRS were to successfully challenge a tax basis increase or tax benefits we previously claimed from a tax basis increase, our Managing Partners and Contributing Partners would not be obligated under the tax receivable agreement to reimburse APO Corp. for any payments previously made to it (although future payments would be adjusted to reflect the result of such challenge). As a result, in certain circumstances, payments could be made to our Managing Partners and Contributing Partners under the tax receivable agreement in excess of 85% of APO Corp.’s actual cash tax savings. In general, estimating the amount of payments that may be made to our Managing Partners and Contributing Partners under the tax receivable agreement is by its nature, imprecise, in the absence of an actual transaction, insofar as the calculation of amounts payable depends on a variety of factors. The actual increase in tax basis and the amount and timing of any payments under the tax receivable agreement will vary depending upon a number of factors, including:
|
•
|
the timing of the transactions-for instance, the increase in any tax deductions will vary depending on the fair market value, which may fluctuate over time, of the depreciable or amortizable assets of the Apollo Operating Group entities at the time of the transaction;
|
-
237
-
|
•
|
the price of our Class A shares at the time of the transaction-the increase in any tax deductions, as well as tax basis increase in other assets, of the Apollo Operating Group entities, is directly proportional to the price of the Class A shares at the time of the transaction;
|
|
•
|
the taxability of exchanges–to the extent an exchange is not taxable for any reason, increased deductions will not be available; and
|
|
•
|
the amount and timing of our income–APO Corp. will be required to pay 85% of the tax savings as and when realized, if any. If APO Corp. does not have taxable income, it is not required to make payments under the tax receivable agreement for that taxable year because no tax savings were actually realized.
|
For the year ended December 31, 2018, we made payments totaling $46 million to our Managing Partners and executive officer Contributing Partners (or to their estate planning vehicles) pursuant to the tax receivable agreement, related to tax benefits treated as realized thereunder by APO Corp. in 2017. Those payments included the following amounts: $15,461,024 for Mr. Black, $13,103,457 for Mr. Harris, $16,620,168 for Mr. Rowan, $602,753 for Mr. Kleinman and $271,529 for Mr. Zelter. In connection with these payments, the Company made a pro rata distribution to APO Corp. and the Non-Controlling Interest Holders in the Apollo Operating Group, which resulted in Messrs. Black, Harris, Rowan, Kleinman and Zelter (or their estate planning vehicles) ultimately receiving the following additional amounts: $23,126,099, $12,079,072, $10,594,836, $759,093 and $543,760, respectively.
In addition, the tax receivable agreement provides that, upon a merger, asset sale or other form of business combination or certain other changes of control, APO Corp.’s (or its successor’s) obligations with respect to exchanged or acquired units (whether exchanged or acquired before or after such change of control) would be based on certain assumptions, including that APO Corp. would have sufficient taxable income to fully utilize the deductions arising from the increased tax deductions and tax basis and other benefits related to entering into the tax receivable agreement. As noted above, no payments will be made if a Managing Partner or Contributing Partner elects to exchange his or her AOG Units in a tax-free transaction.
In connection with the first amendment and restatement of the exchange agreement, the tax receivable agreement was amended and restated on May 6, 2013 to conform the agreement to the amended and restated exchange agreement, particularly to address the modified exchange mechanics, and to make non-substantive updates to recognize certain additional Apollo Operating Group entities that have been formed since the original tax receivable agreement was entered into in 2007.
Strategic Relationship Agreement
On April 20, 2010, we announced a strategic relationship agreement with CalPERS, whereby we agreed to reduce management fees and other fees charged to CalPERS on funds we manage, or in the future will manage, solely for CalPERS by $125 million over a five-year period or as close a period as required to provide CalPERS with that benefit. The agreement further provides that we will not use a placement agent in connection with securing any future capital commitments from CalPERS. Through
December 31, 2018
, the Company had reduced fees charged to CalPERS on the funds it manages by approximately
$107.8 million
.
Strategic Investors Transaction
On July 13, 2007, we sold securities to two strategic investors in return for a total investment of $1.2 billion. Through our intermediate holding companies, we used all of the proceeds from the issuance of such securities to purchase AOG Units from our Managing Partners, and to purchase from our Contributing Partners a portion of their points. As of December 31, 2018, one of the strategic investors, the California Public Employees’ Retirement System, or “CalPERS”, which we refer to herein as the “Strategic Investor”, continued to hold such securities. The securities held by the Strategic Investor are non-voting Class A shares. Based on a Form 13F for the quarter ended December 31, 2018 filed with the SEC on February 8, 2019 by the Strategic Investor, the Strategic Investor held 8.8% of our issued and outstanding Class A shares and 4.4% of the economic interest in the Apollo Operating Group, in each case as of
December 31, 2018
.
Lenders Rights Agreement
In connection with the Strategic Investors Transaction, we entered into a shareholders agreement, or the “Lenders Rights Agreement,” with the strategic investors.
Transfer Restrictions
The Strategic Investor may transfer 100% of its non-voting Class A shares at any time.
Notwithstanding the foregoing, at no time following the registration effectiveness date may the Strategic Investor make a transfer representing 2% or more of our total Class A shares to any one person or group of related persons.
-
238
-
Registration Rights
Pursuant to the Lenders Rights Agreement, the Strategic Investor is afforded four demand registrations with respect to its non-voting Class A shares, covering offerings of at least 2.5% of our total equity ownership and customary piggyback registration rights. All cutbacks between the Strategic Investor and Holdings (or its partners) in any such demand registration shall be pro rata based upon the number of shares available for sale at such time (regardless of which party exercises a demand).
Amendments to Managing Partner Transfer Restrictions
The Strategic Investor has a consent right with respect to any amendment or waiver of any transfer restrictions that apply to our Managing Partners.
Apollo Operating Group Governing Agreements
Pursuant to the governing agreements of the Apollo Operating Group entities, the indirect wholly-owned subsidiaries of Apollo Global Management, LLC that are the general partners or managers of those entities have the right to determine when distributions will be made to the partners or members of the Apollo Operating Group and the amount of any such distributions. If a distribution is authorized, such distribution will be made to the partners or members of the Apollo Operating Group pro rata in accordance with their respective ownership interests.
The governing agreements of the Apollo Operating Group entities also provide that substantially all of our expenses, including substantially all expenses solely incurred by or attributable to Apollo Global Management, LLC, will be borne by the Apollo Operating Group; provided that obligations incurred under the tax receivable agreement by Apollo Global Management, LLC and its wholly-owned subsidiaries, income tax expenses of Apollo Global Management, LLC and its wholly-owned subsidiaries and indebtedness incurred by Apollo Global Management, LLC and its wholly-owned subsidiaries shall be borne solely by Apollo Global Management, LLC and its wholly-owned subsidiaries.
Employment Arrangements
Please see the section entitled “Item 11. Executive Compensation—Narrative Disclosure to the Summary Compensation Table and Grants of Plan—Based Awards Table” and “—Potential Payments upon Termination or Change in Control” for a description of the employment agreements of our named executive officers who have employment agreements.
In addition, Joshua Black a son of Leon Black, is currently employed by the Company as a Principal in the Company’s private equity business. He is entitled to receive a base salary, incentive compensation and employee benefits comparable to those offered to similarly situated employees of the Company. He is also eligible to receive an annual performance-based bonus in an amount determined by the Company in its discretion.
Firm Use of Private Aircraft
In the normal course of business, our personnel have made use of aircraft owned as personal assets by entities controlled by Messrs. Black, Rowan and Harris. Messrs. Black, Rowan and Harris paid for their respective purchases of the aircraft and bear all operating, personnel and maintenance costs associated with their operation for personal use. Payments by us for the business use of these aircraft by Messrs. Black, Rowan and Harris and other of our personnel are determined based on a specified hourly market rate. In
2018
, we made payments of $1,438,042, $780,949 and $673,446 for the use of such aircraft owned by entities controlled by Messrs. Black, Rowan and Harris, respectively.
Investments In Apollo Funds
Our directors and executive officers are generally permitted to invest their own capital (or capital of estate planning vehicles that they control) directly in our funds and affiliated entities. In general, such investments are not subject to management fees, and in certain instances, may not be subject to performance fees. The opportunity to invest in our funds in the same manner is available to all of the senior Apollo professionals and to those of our employees whom we have determined to have a status that reasonably permits us to offer them these types of investments in compliance with applicable laws. From our inception through
December 31, 2018
, our professionals have committed or invested approximately $1.8 billion of their own capital to our funds.
The amount invested in our investment funds by our directors and executive officers (and in some cases, certain estate planning vehicles controlled by them or their immediate family members) during
2018
was $1,166,292, $6,917,902, $9,124,889, $4,457,091, $4,629,572, $1,056,836, $316,401, $392,992 and $1,445,073 for Messrs. Black, Harris, Rowan, Kleinman, Zelter, Suydam, Kelly, Ducey, and Kraft, respectively. The amount of distributions on their fund investments, including profits and return of capital to our directors and executive officers (and in some cases, certain estate planning vehicles controlled by them or their immediate family members) during
2018
was $34,711,789, $27,713,994, $38,528,656, $6,591,705, $7,465,459, $2,804,475,
-
239
-
$147,871, $262,666, $1,645,214 and $1,096 for Messrs. Black, Harris, Rowan, Kleinman, Zelter, Suydam, Kelly, Ducey, Kraft, and Krongard, respectively.
Sub-Advisory Arrangements and Strategic Investment Accounts
From time to time, we have entered into sub-advisory arrangements with, or established strategic investment accounts for, certain of our directors and executive officers or vehicles they manage. Such arrangements have been approved in advance in accordance with our policy regarding transactions with related persons. In addition, such sub-advisory arrangements or strategic investment accounts have been entered into with, or advised by, an Apollo entity serving as investment advisor registered under the Investment Advisers Act, and any fee arrangements, if applicable, have been on an arms-length basis. The amount of such fees paid by our directors and executive officers or vehicles they manage to the Company during
2018
was $143,341 for Mr. Harris and $132,471 for Mr. Rowan.
Irrevocable Proxy with Tiger Global Management
The Class A shares beneficially owned (the “Subject Shares”) by advisory clients of Tiger Global Management, LLC and/or its related persons’ proprietary accounts (“Tiger”), as disclosed in “Item 12. Security Ownership of Certain Beneficial Owners and Management and Related Stockholder Matters”, are subject to an irrevocable proxy pursuant to which our manager has the right to vote all of such Subject Shares at any meeting of our shareholders and in connection with any written consent of our shareholders as determined in the sole discretion of our manager. Upon the sale by Tiger of the Subject Shares to a person or entity that is not an affiliate of Tiger, such portion of Subject Shares that are sold will be released from the proxy. The proxy terminates on the earlier of (x) May 5, 2020 and (y) the first date Tiger does not own more than 10% of our outstanding Class A shares.
Indemnification of Directors, Officers and Others
Under our operating agreement, in most circumstances we will indemnify the following persons, to the fullest extent permitted by law, from and against all losses, claims, damages, liabilities, joint or several, expenses (including legal fees and expenses), judgments, fines, penalties, interest, settlements or other amounts: our manager; any departing manager; any person who is or was an affiliate of our manager or any departing manager; any person who is or was a member, partner, tax matters partner, officer, director, employee, agent, fiduciary or trustee of us or our subsidiaries, our manager or any departing manager or any affiliate of us or our subsidiaries, our manager or any departing manager; any person who is or was serving at the request of our manager or any departing manager or any affiliate of our manager or any departing manager as an officer, director, employee, member, partner, agent, fiduciary or trustee of another person; or any person designated by our manager. We have agreed to provide this indemnification unless there has been a final and non-appealable judgment by a court of competent jurisdiction determining that these persons acted in bad faith or engaged in fraud or willful misconduct. We have also agreed to provide this indemnification for criminal proceedings. Any indemnification under these provisions will only be out of our assets. We may purchase insurance against liabilities asserted against and expenses incurred by persons for our activities, regardless of whether we would have the power to indemnify the person against liabilities under our operating agreement.
We have entered into indemnification agreements with each of our directors, executive officers and certain of our employees which set forth the obligations described above.
We have also agreed to indemnify each of our Managing Partners and certain Contributing Partners against certain amounts that they are required to pay in connection with a general partner obligation for the return of previously made performance fee distributions in respect of Fund IV, Fund V and Fund VI. See the above description of the indemnity provisions of the Managing Partner Shareholders Agreement.
Statement of Policy Regarding Transactions with Related Persons
Our board of directors has adopted a written statement of policy regarding transactions with related persons, which we refer to as our “related person policy.” Our related person policy requires that a “related person” (as defined in paragraph (a) of Item 404 of Regulation S-K) must promptly disclose to our Chief Legal Officer any “related person transaction” (defined as any transaction that is reportable by us under Item 404(a) of Regulation S-K in which we were or are to be a participant and the amount involved exceeds $120,000 and in which any related person had or will have a direct or indirect material interest) and all material facts with respect thereto. Our Chief Legal Officer will then promptly communicate that information to our manager. No related person transaction will be consummated without the approval or ratification of the executive committee of our manager or any committee of our board of directors consisting exclusively of disinterested directors. It is our policy that persons interested in a related person transaction will recuse themselves from any vote of a related person transaction in which they have an interest.
-
240
-
Director Independence
For so long as the Apollo control condition is satisfied (as described in “Item 10. Directors, Executive Officers and Corporate Governance—Our Manager”), we are considered a “controlled company” as defined in the listing standards of the NYSE and we are exempt from the NYSE rules that require that:
|
•
|
our board of directors be comprised of a majority of independent directors;
|
|
•
|
we establish a compensation committee composed solely of independent directors; and
|
|
•
|
we establish a nominating and corporate governance committee composed solely of independent directors.
|
While our board of directors is currently comprised of a majority of independent directors, we plan on availing ourselves of the controlled company exceptions. We have elected not to have a nominating and corporate governance committee comprised entirely of independent directors, nor a compensation committee comprised entirely of independent directors. Our board of directors has determined that four of our seven directors meet the independence standards under the NYSE and the SEC. These directors are Messrs. Ducey, Kraft and Krongard and Ms. Richards.
At such time that we are no longer deemed a controlled company, our board of directors will take all action necessary to comply with all applicable rules within the applicable time period under the NYSE listing standards.
|
ITEM 14.
|
PRINCIPAL ACCOUNTING FEES AND SERVICES
|
The following table summarizes the aggregate fees for professional services provided by Deloitte & Touche LLP, the member firms of Deloitte Touche Tohmatsu, and their respective affiliates (collectively, the "Deloitte Entities").
|
|
For the Years Ended December 31,
|
|||||||
|
|
2018
|
2017
|
||||||
|
(in thousands)
|
||||||||
|
Audit fees
|
$
|
7,127
|
|
(1)
|
$
|
7,010
|
|
(1)
|
|
Audit fees for Apollo fund entities
|
16,198
|
|
(2)
|
14,374
|
|
(2)
|
||
|
Audit-related fees
|
1,635
|
|
(3)(4)
|
1,161
|
|
(3)(4)
|
||
|
Tax fees
|
7,019
|
|
(5)
|
6,047
|
|
(5)
|
||
|
Tax fees for Apollo fund entities
|
28,436
|
|
(2)
|
20,740
|
|
(2)
|
||
|
(1)
|
Audit fees consisted of fees for (a) the audits of our consolidated financial statements in our Annual Report on Form 10-K and services attendant to, or required by, statute or regulation; (b) reviews of the interim condensed consolidated financial statements included in our quarterly reports on Form 10-Q.
|
|
(2)
|
Audit and Tax fees for Apollo fund entities consisted of services to investment funds managed by Apollo in its capacity as the general partner and/or manager of such entities.
|
|
(3)
|
Audit-related fees consisted of comfort letters, consents and other services related to SEC and other regulatory filings.
|
|
(4)
|
Includes audit-related fees for Apollo fund entities of
$0.9 million
and
$0.3 million
for the years ended December 31,
2018
and
2017
, respectively.
|
|
(5)
|
Tax fees consisted of fees for services rendered for tax compliance and tax planning and advisory services.
|
Our audit committee charter requires the audit committee of our board of directors to approve in advance all audit and non-audit related services to be provided by our independent registered public accounting firm. All services reported in the Audit, Audit-related, Tax and Other categories above were approved by the committee.
-
241
-
|
ITEM
15
.
|
EXHIBITS
|
|
Exhibit
Number
|
|
Exhibit Description
|
|
3.1
|
|
|
|
3.2
|
|
|
|
4.1
|
|
|
|
4.2
|
||
|
4.3
|
||
|
4.4
|
||
|
4.5
|
||
|
4.6
|
||
|
4.7
|
||
|
4.8
|
||
|
4.9
|
||
-
242
-
|
Exhibit
Number
|
|
Exhibit Description
|
|
4.10
|
||
|
4.11
|
||
|
4.12
|
||
|
4.13
|
||
|
4.14
|
||
|
4.15
|
||
|
10.1
|
|
|
|
10.2
|
|
|
|
10.3
|
|
|
|
10.4
|
|
|
|
10.5
|
|
|
|
+10.6
|
|
|
-
243
-
|
Exhibit
Number
|
|
Exhibit Description
|
|
10.7
|
|
|
|
10.8
|
|
|
|
10.9
|
|
|
|
10.10
|
|
|
|
+10.11
|
|
|
|
+10.12
|
|
|
|
+10.13
|
|
|
|
10.14
|
|
|
|
10.15
|
|
|
|
10.16
|
|
|
|
10.17
|
|
|
-
244
-
|
Exhibit
Number
|
|
Exhibit Description
|
|
10.18
|
|
|
|
10.19
|
||
|
10.20
|
||
|
10.21
|
||
|
10.22
|
|
|
|
10.23
|
|
|
|
10.24
|
|
|
|
10.25
|
||
|
10.26
|
||
-
245
-
|
Exhibit
Number
|
|
Exhibit Description
|
|
10.27
|
|
|
|
+10.28
|
|
|
|
+10.29
|
|
|
|
*+10.30
|
||
|
+10.31
|
|
|
|
+10.32
|
|
|
|
+10.33
|
|
|
|
+10.34
|
|
|
|
+10.35
|
|
|
|
+10.36
|
|
|
|
10.37
|
|
|
|
10.38
|
||
|
+10.39
|
|
|
-
246
-
|
Exhibit
Number
|
|
Exhibit Description
|
|
+10.40
|
|
|
|
*+10.41
|
||
|
*+10.42
|
||
|
*+10.43
|
||
|
*+10.44
|
||
|
+10.45
|
||
|
*+10.46
|
||
|
+10.47
|
||
|
10.48
|
|
|
|
+10.49
|
|
|
|
+10.50
|
|
|
|
+10.51
|
||
|
+10.52
|
||
|
+10.53
|
||
-
247
-
|
Exhibit
Number
|
|
Exhibit Description
|
|
+10.54
|
||
|
+10.55
|
||
|
+10.56
|
||
|
+10.57
|
||
|
10.58
|
||
|
10.59
|
||
|
10.60
|
||
|
10.61
|
||
-
248
-
|
Exhibit
Number
|
|
Exhibit Description
|
|
10.62
|
||
|
10.63
|
||
|
+10.64
|
||
|
+10.65
|
||
|
+10.66
|
||
|
+10.67
|
||
|
+10.68
|
||
|
+10.69
|
||
|
+10.70
|
||
|
+10.71
|
||
-
249
-
|
Exhibit
Number
|
|
Exhibit Description
|
|
+10.72
|
||
|
+10.73
|
||
|
+10.74
|
||
|
+10.75
|
||
|
+10.76
|
||
|
+10.77
|
||
|
+10.78
|
||
|
+10.79
|
||
|
*+10.80
|
||
|
*+10.81
|
||
|
*+10.82
|
||
|
*+10.83
|
||
|
*21.1
|
||
|
*23.1
|
||
|
*31.1
|
|
|
-
250
-
|
Exhibit
Number
|
|
Exhibit Description
|
|
*31.2
|
|
|
|
*32.1
|
|
|
|
*32.2
|
|
|
|
99.1
|
||
|
*101.INS
|
|
XBRL Instance Document
|
|
*101.SCH
|
|
XBRL Taxonomy Extension Scheme Document
|
|
*101.CAL
|
|
XBRL Taxonomy Extension Calculation Linkbase Document
|
|
*101.DEF
|
|
XBRL Taxonomy Extension Definition Linkbase Document
|
|
*101.LAB
|
|
XBRL Taxonomy Extension Label Linkbase Document
|
|
*101.PRE
|
|
XBRL Taxonomy Extension Presentation Linkbase Document
|
|
*
|
Filed herewith.
|
|
+
|
Management contract or compensatory plan or arrangement.
|
The agreements and other documents filed as exhibits to this report are not intended to provide factual information or other disclosure other than with respect to the terms of the agreements or other documents themselves, and you should not rely on them for that purpose. In particular, any representations and warranties made by us in these agreements or other documents were made solely within the specific context of the relevant agreement or document and may not describe the actual state of affairs as of the date they were made or at any other time.
|
ITEM
16
.
|
FORM 10-K SUMMARY
|
Not applicable.
-
251
-
SIGNATURES
Pursuant to the requirements of the Securities Exchange Act of 1934, the registrant has duly caused this report to be signed on its behalf by the undersigned, thereunto duly authorized.
|
Apollo Global Management, LLC
|
|||
|
(Registrant)
|
|||
|
Date: March 1, 2019
|
By:
|
/s/ Martin Kelly
|
|
|
Name:
|
Martin Kelly
|
||
|
Title:
|
Chief Financial Officer and Co-Chief Operating Officer
(principal financial officer and authorized signatory)
|
||
-
252
-
Pursuant to the requirements of the Securities Exchange Act of 1934, this report has been signed below by the following persons on behalf of the registrant and in the capacities and on the dates indicated:
|
Name
|
|
Title
|
|
Date
|
|
/s/ Leon Black
|
|
Chairman and Chief Executive Officer and Director
|
|
March 1, 2019
|
|
Leon Black
|
|
(principal executive officer)
|
|
|
|
/s/ Martin Kelly
|
|
Chief Financial Officer and Co-Chief Operating Officer
|
|
March 1, 2019
|
|
Martin Kelly
|
|
(principal financial officer)
|
|
|
|
/s/ Robert MacGoey
|
|
Chief Accounting Officer
|
|
March 1, 2019
|
|
Robert MacGoey
|
|
(principal accounting officer)
|
|
|
|
/s/ Joshua Harris
|
|
Senior Managing Director and Director
|
|
March 1, 2019
|
|
Joshua Harris
|
|
|
||
|
/s/ Marc Rowan
|
|
Senior Managing Director and Director
|
|
March 1, 2019
|
|
Marc Rowan
|
|
|
||
|
/s/ Michael Ducey
|
|
Director
|
|
March 1, 2019
|
|
Michael Ducey
|
|
|
||
|
/s/ Robert Kraft
|
|
Director
|
|
March 1, 2019
|
|
Robert Kraft
|
|
|
||
|
/s/ AB Krongard
|
|
Director
|
|
March 1, 2019
|
|
AB Krongard
|
|
|
||
|
/s/ Pauline Richards
|
|
Director
|
|
March 1, 2019
|
|
Pauline Richards
|
|
|
||
-
253
-
TABLE OF CONTENTS
Part IItem 1. BusinessItem 1A . Risk FactorsItem 1B. Unresolved Staff CommentsItem 2. PropertiesItem 3. Legal ProceedingsItem 4. Mine Safety DisclosuresPart IIItem 5 . Market For Registrant's Common Equity, Related Stockholder Matters and Issuer Purchases Of Equity SecuritiesItem 6. Selected Financial DataItem 7 . Management S Discussion and Analysis Of Financial Condition and Results Of OperationsItem 7A . Quantitative and Qualitative Disclosures About Market RiskItem 8 . Financial Statements and Supplementary DataItem 8A . Unaudited Supplemental Presentation Of StatementsItem 9. Changes in and Disagreements with Accountants on Accounting and Financial DisclosuresItem 9A . Controls and ProceduresItem 9B . Other InformationPart IIIItem 10. Directors, Executive Officers and Corporate GovernanceItem 11. Executive CompensationItem 12 . Security Ownership Of Certain Beneficial Owners and Management and Related Stockholder MattersItem 13. Certain Relationships and Related Party TransactionsItem 14. Principal Accounting Fees and ServicesPart IVItem 15 . ExhibitsItem 16 . Form 10-k Summary