DIGITAL TURBINE, INC.
10-Ks and 10-Qs
|
|
|
|
|
|
|
|
|
|
|
|
|
|
|
|
|
|
|
|
|
|
|
|
|
|
|
|
|
|
|
|
|
|
|
|
|
|
|
|
|
|
|
|
|
|
|
UNITED STATES
SECURITIES AND EXCHANGE COMMISSION
WASHINGTON, D.C. 20549
FORM 10-K
(Mark One)
|
ý
|
ANNUAL REPORT PURSUANT TO SECTION 13 OR 15(d) OF THE SECURITIES EXCHANGE ACT OF 1934
|
For the fiscal year ended
March 31, 2018
or
|
¨
|
TRANSITION REPORT PURSUANT TO SECTION 13 OR 15(d) OF THE SECURITIES EXCHANGE ACT OF 1934
|
Commission File Number 001-35958
DIGITAL TURBINE, INC.
(Exact Name of Registrant as Specified in Its Charter)
|
Delaware
|
|
22-2267658
|
|
(State or Other Jurisdiction of
Incorporation or Organization)
|
|
(I.R.S. Employer
Identification No.)
|
|
|
|
|
|
111 Nueces Street, Austin TX
|
|
78701
|
|
(Address of Principal Executive Offices)
|
|
(Zip Code)
|
(512) 387-7717
(Issuer’s Telephone Number, Including Area Code)
Securities registered pursuant to Section 12(b) of the Act:
|
Common Stock, Par Value $0.0001 Per Share
|
|
The Nasdaq Stock Market LLC
(NASDAQ Capital Market)
|
|
(Title of Class)
|
|
(Name of Each Exchange on Which Registered)
|
Securities registered under Section 12(g) of the Exchange Act:
None
(Title of Class)
Indicate by check mark if the registrant is a well-known seasoned issuer, as defined in Rule 405 of the Securities Act. Yes
¨
No
ý
Indicate by check mark if the registrant is not required to file reports pursuant to Section 13 or 15(d) of the Exchange Act. Yes
¨
No
ý
Indicate by check mark whether the registrant: (1) has filed all reports required to be filed by Section 13 or 15(d) of the Exchange Act during the preceding 12 months (or for such shorter period that the registrant was required to file such reports), and (2) has been subject to such filing requirements for the past 90 days. Yes
ý
No
¨
Indicate by check mark whether the registrant has submitted electronically and posted on its corporate web site, if any, every Interactive Data File required to be submitted and posted pursuant to Rule 405 of Regulation S-T (§ 232.405 of this chapter) during the preceding 12 months (or for such shorter period that the registrant was required to submit and post such files). Yes
ý
No
¨
Indicate by check mark if disclosure of delinquent filers in response to Item 405 of Regulation S-K (§ 229.405) is not contained herein, and will not be contained, to the best of Registrant’s knowledge, in definitive proxy or information statements incorporated by reference in Part III of this Form 10-K or any amendment to this Form 10-K. Yes
ý
No
¨
Indicate by check mark whether the registrant is a large accelerated filer, an accelerated filer, a non-accelerated filer, a smaller reporting company, or an emerging growth company. See definitions of a “large accelerated filer,” “accelerated filer”, “smaller reporting company”, and "emerging growth company" in Rule 12b-2 of the Exchange Act. (Check One)
|
Large Accelerated Filer
|
¨
|
Accelerated Filer
|
ý
|
|
|
|
|
|
|
Non-Accelerated Filer
|
¨
(do not check if smaller reporting company)
|
Smaller Reporting Company
|
¨
|
|
Emerging Growth Company
|
¨
|
||
If an emerging growth company, indicate by check mark if the registrant has elected not to use the extended transition period for complying with any new or revised financial accounting standards provided pursuant to Section 13(a) of the Exchange Act.
o
Indicate by check mark whether the Registrant is a shell company (as defined in Rule 12b-2 of the Exchange Act). Yes
¨
No
ý
The aggregate market value of the voting and non-voting common equity held by non-affiliates computed by reference to the price at which the common equity was last sold on the NASDAQ Capital Market on
September 30, 2017
was
$101,774,788
.
As of
June 1, 2018
, the Company had
76,144,988
shares of its common stock,
$0.0001
par value per share, outstanding.
DOCUMENTS INCORPORATED BY REFERENCE
The Company’s definitive Proxy Statement for the Annual Meeting of Stockholders or amendments to Form 10-K, which the registrant will file with the Securities and Exchange Commission within 120 days after the end of the fiscal year covered by this report, is incorporated by reference in Part III of this Form 10-K to the extent stated herein.
Digital Turbine, Inc.
ANNUAL REPORT ON FORM 10-K
FOR THE PERIOD ENDED
March 31, 2018
TABLE OF CONTENTS
|
|
||
|
|
|
|
|
ITEM 1.
|
||
|
|
|
|
|
ITEM 1A.
|
||
|
|
|
|
|
ITEM 1B.
|
||
|
|
|
|
|
ITEM 2.
|
||
|
|
|
|
|
ITEM 3.
|
||
|
|
|
|
|
ITEM 4.
|
||
|
|
|
|
|
|
||
|
|
|
|
|
ITEM 5.
|
||
|
|
|
|
|
ITEM 6.
|
||
|
|
|
|
|
ITEM 7.
|
||
|
|
|
|
|
ITEM 7A.
|
||
|
|
|
|
|
ITEM 8.
|
||
|
|
|
|
|
ITEM 9.
|
||
|
|
|
|
|
ITEM 9A.
|
||
|
|
|
|
|
ITEM 9B.
|
||
|
|
|
|
|
|
||
|
|
|
|
|
ITEM 10.
|
||
|
|
|
|
|
ITEM 11.
|
||
|
|
|
|
|
ITEM 12.
|
||
|
|
|
|
|
ITEM 13.
|
||
|
|
|
|
|
ITEM 14.
|
||
|
|
|
|
|
|
||
|
|
|
|
|
ITEM 15.
|
||
|
ITEM 16.
|
||
|
|
|
|
|
|
||
Safe Harbor Statement under the Private Securities Litigation Reform Act of 1995
Information included in this Annual Report on Form 10-K (the “Form 10-K”) contains forward-looking statements within the meaning of Section 27A of the Securities Act of 1933, as amended (the “Securities Act”), and Section 21E of the Securities Exchange Act of 1934, as amended (the “Exchange Act”). We claim the protection of the safe harbor contained in the Private Securities Litigation Reform Act of 1995. All statements, other than statements of historical facts included in this Form 10-K regarding our strategy, future operations, future financial position, projected expenses, prospects and plans and objectives of management are forward-looking statements. These statements involve known and unknown risks, uncertainties and other factors which may cause our actual results, performance or achievements to be materially different from our future results, performance or achievements expressed or implied by any forward-looking statements. Forward-looking statements, which involve assumptions and describe our future plans, strategies and expectations, are generally identifiable by use of the words “may,” “will,” “should,” “expect,” “anticipate,” “estimate,” “believe,” “intend,” “future,” “plan,” or “project” or the negative of these words or other variations on these words or comparable terminology. Forward-looking statements are based on assumptions that may be incorrect, and there can be no assurance that any projections or other expectations included in any forward-looking statements will come to pass. Our actual results could differ materially from those expressed or implied by the forward-looking statements as a result of various factors, including, but not limited to:
|
•
|
a decline in general economic conditions nationally and internationally;
|
|
•
|
decreased market demand for our products and services;
|
|
•
|
market acceptance and brand awareness of our products;
|
|
•
|
risks associated with the level of our secured and unsecured indebtedness;
|
|
•
|
ability to comply with financial covenants in outstanding indebtedness;
|
|
•
|
the ability to protect our intellectual property rights;
|
|
•
|
impact of any litigation or infringement actions brought against us;
|
|
•
|
competition from other providers and products based on pricing and other activities;
|
|
•
|
risks and costs in product development;
|
|
•
|
the potential for unforeseen or underestimated cash requirements or liabilities;
|
|
•
|
risks associated with adoption of our products among existing customers (including the impact of possible delays with major carrier and OEM partners in the roll out for mobile phones deploying our products);
|
|
•
|
risks associated with delays in major mobile phone launches, or the failure of such launches to achieve the scale and customer adoption that either we or the market may expect;
|
|
•
|
the impact of currency exchange rate fluctuations on our reported GAAP financial statements, particularly in regard to the Australian dollar;
|
|
•
|
the challenges, given the Company’s comparatively small size, to expand the combined Company's global reach, accelerate growth and create a scalable, low-capex business model that drives EBITDA (as well as Adjusted EBITDA);
|
|
•
|
varying and often unpredictable levels of orders;
|
|
•
|
the challenges inherent in technology development necessary to maintain the Company’s competitive advantage such as adherence to release schedules and the costs and time required for finalization and gaining market acceptance in new products;
|
|
•
|
technology management risk as the Company needs to adapt to complex specifications of different carriers and the management of a complex technology platform given the Company's relatively limited resources;
|
|
•
|
new customer adoption and time to revenue with new carrier and OEM partners is subject to delays and factors out of our control;
|
|
•
|
inability to raise capital to fund continuing operations;
|
|
•
|
changes in government regulation;
|
|
•
|
volatility in the price of our common stock and ability to satisfy exchange continued listing requirements;
|
|
•
|
rapid and complex changes occurring in the mobile marketplace, and
|
|
•
|
other risks described in the risk factors in Item 1A of this Form 10-K under the heading “Risk Factors.”
|
Should one or more of these risks or uncertainties materialize, or should the underlying assumptions prove incorrect, our actual results may differ significantly from those anticipated, believed, estimated, expected, intended or planned. Except as required by applicable law, we do not undertake any obligation to update any forward-looking statements made in this Annual Report. Accordingly, investors should use caution in relying on past forward-looking statements, which are based on known results and trends at the time they are made, to anticipate future results or trends.
4
Unless the context otherwise indicates, the use of the terms “we,” “our”, “us”, “Digital Turbine”, “DT”, or the “Company” refer to the collective business and operations of Digital Turbine, Inc. through its operating and wholly-owned subsidiaries, Digital Turbine USA, Inc. (“DT USA”), Digital Turbine (EMEA) Ltd. (“DT EMEA”), Digital Turbine Australia Pty Ltd (“DT APAC”), Digital Turbine Singapore Pte. Ltd. (“DT Singapore”), Digital Turbine Luxembourg S.a.r.l. (“DT Luxembourg”), Digital Turbine Germany, GmbH (“DT Germany”), and Digital Turbine Media, Inc. (“DT Media”).
|
ITEM 1.
|
BUSINESS
|
Current Operations
Digital Turbine, through its subsidiaries, innovates at the convergence of media and mobile communications, delivering an end-to-end platform solution for mobile operators, application developers, device original equipment manufacturers ("OEMs"), and other third parties to enable them to effectively monetize mobile content and generate higher value user acquisition. The Company currently operates one reportable segment – Advertising.
The Company's Advertising business is consists of Operator and OEM ("O&O"), an advertiser solution for unique and exclusive carrier and OEM inventory which is comprised of services including:
|
◦
|
Ignite™ ("Ignite"), a mobile device management platform with targeted application distribution capabilities, and
|
|
◦
|
Other products and professional services directly related to the Ignite platform.
|
With global headquarters in Austin, Texas and offices in Durham, North Carolina; San Francisco, California; Singapore; Sydney, Australia; and Tel Aviv, Israel, Digital Turbine’s solutions are available worldwide.
Information about Discontinued Operations
On April 29, 2018, the Company entered into two distinct disposition agreements with respect to selected assets owned by our subsidiaries.
DT APAC and DT Singapore (together, “Pay Seller”), each wholly owned subsidiaries of the Company, entered into an Asset Purchase Pay Agreement (the “Pay Agreement”), dated as of April 23, 2018, with Chargewave Ptd Ltd (“Pay Purchaser”) to sell certain assets (the “Pay Assets”) owned by the Pay Seller related to the Company’s Direct Carrier Billing business. The Pay Purchaser is principally owned and controlled by Jon Mooney, an officer of the Pay Seller. At the closing of the asset sale, Mr. Mooney will no longer be employed by the Company or Pay Seller. As consideration for this asset sale, Digital Turbine is entitled to receive certain license fees, profit sharing and equity participation rights as outlined in the Company’s Form 8-K filed May 1, 2018 with the Securities and Exchange Commission (the "SEC"). The transaction is subject to closing conditions and is expected to be completed in June 2018. With the sale of these assets, the Company has determined that it will exit the segment previously referred to as the Content business.
DT Media (the “A&P Seller”), a wholly owned subsidiary of the Company, entered into an Asset Purchase Agreement (the “A&P Agreement”), dated as of April 28, 2018, with Creative Clicks B.V. (the “A&P Purchaser”) to sell business relationships with various advertisers and publishers (the “A&P Assets”) related to the Company’s Advertising and Publishing ("A&P") business. As consideration for this asset sale, we are entitled to receive a percentage of the gross profit derived from these customer agreements for a period of three years as outlined in the Company’s Form 8-K filed May 1, 2018 with the SEC. The transaction is subject to closing conditions and is expected to be completed in June 2018. With the sale of these assets, the Company has determined that it will exit the segment of its Advertising business previously referred to as the A&P business.
We believe that these dispositions will allow the Company to benefit from a streamlined business model, simplified operating structure, and enhanced management focus. Additionally, the Company expects to be able to generate additional cash via the announced transactions that can be re-invested into key O&O growth initiatives.
As a result of the dispositions, the results of operations from our Content reporting segment and A&P business within the Advertising reporting segment are reported as “Net loss from discontinued operations, net of taxes” and the related assets and liabilities are classified as “held for disposal" in the consolidated financial statements in Item 8 of this Annual Report. The Company has recast prior period amounts presented within this Report to provide visibility and comparability. All discussion herein, unless otherwise noted, refers to our remaining operating segment after the dispositions, the O&O business. See “Discontinued Operations” in Note 3 to the consolidated financial statements in Item 8 of this Report.
5
Information about Segment and Geographic Revenue
As a result of the dispositions, the Company now manages its business in one operating segment, the O&O business, which is presented as one reportable segment: Advertising. Information about segment and geographic revenue is set forth in Note 17 to our consolidated financial statements under Item 8 of this Annual Report.
Advertising
O&O Business
The Company's O&O business is an advertiser solution for unique and exclusive carrier and OEM inventory, which is comprised of Ignite and other professional services directly related to the Ignite platform.
Ignite is a mobile application management software that enables mobile operators and OEMs to control, manage, and monetize applications installed at the time of activation and over the life of a mobile device. Ignite allows mobile operators to personalize the application activation experience for customers and monetize their home screens via Cost-Per-Install or CPI arrangements, Cost-Per-Placement or CPP arrangements, Cost-Per-Action or CPA arrangements with third party advertisers, or via Per-Device-License Fees or PDL which allow operators and OEMs to deliver applications to their Ignite installed base on demand. There are several different delivery methods available to operators and OEMs on first boot of the device: Wizard, Silent, or Software Development Kit ("SDK"). Additionally, features are available throughout the life-cycle of the device that provide operators and OEMs additional opportunity for advertising revenue streams. The Company has launched Ignite with mobile operators and OEMs in North America, Latin America, Europe, Asia Pacific, India and Israel. Since inception, Ignite has delivered over
one billion
mobile application preloads.
Competition
The distribution of applications, mobile advertising, development, distribution and sale of mobile products and services is a highly competitive business. We compete for advertising partners on the basis of positioning, brand, quality and price. We compete for wireless carrier and manufacturer placement based on these factors, as well as historical performance. We compete for platform deployment contracts with other mobile platform companies. We also compete for experienced and talented employees.
Our primary competition for application and content distribution comes from the traditional application store businesses of Apple and Google, existing operator solutions built internally, as well as companies providing application install products and services as offered by Facebook, Snapchat, IronSource, InMobi, Cheetah Mobile, Baidu, Taptica, and others. These companies can be both customers for Digital Turbine products, as well as competitors in certain cases. With Ignite, we compete with smaller competitors, such as IronSource, Wild Tangent, and Sweet Labs, but the more material competition is internally developed operator solutions and specific mobile application management solutions built in-house by OEMs and wireless operators. Some of our existing wireless operators could make a strategic decision to develop their own solutions rather than continue to use our Ignite products, which could be a material source of competition. And finally, although we do not see any competition from larger Enterprise application players such as IBM, Citrix, Oracle, salesforce.com, or MobileIron, it is possible they could decide to compete against our Ignite solution.
Digital Turbine has internally developed solutions for top-tier mobile operators and equipment manufacturers including device application management solutions and application-based value added services. Ignite is a patent pending mobile application management solution that enables operators and device OEMs to pre-install and manage applications from a single web interface. We see competitors in internally developed operator solutions and specific mobile application management solutions built individually by OEMs.
Our competitors generally have substantially greater capital and other resources than we have.
6
Product Development and Research & Development
Our product development expenses consist primarily of salaries and benefits for employees working on campaign management, creating, developing, editing, programming, performing quality assurance, obtaining carrier certification and deploying our products across various mobile phone carriers and on our internal platforms. We devote substantial resources to the development, technology support, and quality assurance of our products. Total product development costs incurred for the years ended
March 31, 2018
,
2017
,
2016
were
$9.7 million
,
$9.3 million
, and
$4.9 million
, respectively. The amount spent on research and development activities for the years ended
March 31, 2018
,
2017
,
2016
were
$0.9 million
,
$0.7 million
, and
$1.1 million
, respectively.
Contracts with Customers
We have both exclusive and non-exclusive carrier and OEM agreements. Our agreements with advertisers are generally non-exclusive. Our carrier and OEM agreements for our Advertising business are multi-year agreements, with terms that are generally longer than one to two years. In addition, some carrier agreements provide that the carrier can terminate the agreement early and, in some instances, at any time without cause, which could give them the ability to renegotiate economic or other terms. The agreements generally do not obligate the carriers to market or distribute any of our products or services. In many of these agreements, we warrant that our products do not violate community standards, do not contain libelous content, do not contain material defects or viruses, and do not violate third-party intellectual property rights and we indemnify the carrier for any breach of a third party’s intellectual property. Most of our sales are made either directly to application developers, advertising agencies representing application developers or through advertising aggregators.
We generally have numerous advertisers who represent a significant level of business. Coupled with advertiser concentration, we distribute a significant level of advertising through one operator. If such advertising clients or this operator decided to materially reduce or discontinue its use of our platform, it could cause an immediate and significant decline in our revenue and negatively affect our results of operations and financial condition.
Business Seasonality
Our revenue, cash flow from operations, operating results and other key operating and financial measures may vary from quarter to quarter due to the seasonal nature of advertiser spending. For example, many advertisers (and their agencies) devote a disproportionate amount of their budgets to the fourth quarter of the calendar year to coincide with increased holiday spending. We expect our revenue, cash flow, operating results and other key operating and financial measures to fluctuate based on seasonal factors from period to period and expect these measures to be generally higher in the third and fourth fiscal quarters than in prior quarters.
Employees
As of
March 31, 2018
, the Company, including its subsidiaries, had
161
employees,
158
of whom were full-time and
3
of whom were part-time. We consider our relationships with our employees to be satisfactory. As of
March 31, 2018
, none of our employees are covered by a collective bargaining agreement. The Company also uses a number of contractors on an as-needed basis.
History of Digital Turbine, Inc.
The Company was originally incorporated in the State of Delaware on November 6, 1998 and operated under operated under several different company names including eB2B, Mediavest, Inc., Mandalay Media, Inc., NeuMedia, Inc., and Mandalay Digital Group, Inc. In January 2015, the Company changed its name to Digital Turbine, Inc. and its NASDAQ ticker symbol to “APPS” with a new CUSIP number of 25400W-102. In 2012, the Company increased its authorized shares of common stock and preferred stock to 200,000,000 and 2,000,000, respectively, and in 2013 the Company implemented a 1-for-5 reverse stock split of its common stock (without changing the authorized number of shares or the par value of common stock).
7
From 2005 to February 12, 2008, the Company was a public shell company with no operations. Throughout the years, the Company has made several acquisitions, such as (1) the acquisition in December 2011 by its wholly-owned subsidiary, Digital Turbine USA, Inc., of assets of Digital Turbine LLC, which were re-branded as “Discover,” (2) the acquisition in September 2012 by DT EMEA of ” Logia Content Development and Management Ltd. (“Logia Content”), Volas Entertainment Ltd. (“Volas”) and Mail Bit Logia (2008) Ltd. (“Mail Bit”), including the “LogiaDeck” software which has been rebranded as “Ignite,” (3) the acquisition in April 2013 of Mirror Image International Holdings Pty Ltd, and (4) the acquisition in October 2014 of the intellectual property assets of Xyologic Mobile Analysis, GmbH ("XYO" or "Xyologic). In February 2014, the Company disposed of its wholly-owned subsidiary, Twistbox Entertainment, Inc. (“Twistbox”), and as such, it is no longer reflected as part of our continuing operations in this Report. In March 2015, the Company, through its wholly-owned subsidiary, acquired Appia, Inc., which was renamed Digital Turbine Media, Inc. and which is referred to in this Form 10-K and the consolidated financial statements as “DT Media.”
In April 2018, the Company entered into two separate agreements to dispose of the Content reporting segment (through the Pay Agreement) and A&P business within the Advertising reporting segment (through the A&P Agreement). As a result of these dispositions, the results of operations from our Content reporting segment and A&P business within the Advertising reporting segment are reported as “Net loss from discontinued operations, net of taxes” and the related assets and liabilities are classified as "held for disposal" in the consolidated financial statements in Item 8 of this Report. The Pay Agreement and A&P Agreement are both expected to close in June 2018.
Available Information
Our Annual Report on Form 10-K, Quarterly Reports on Form 10-Q, Current Reports on Form 8-K and amendments to reports filed or furnished pursuant to Sections 13(a) and 15(d) of the Securities Exchange Act of 1934, as amended, are available free of charge on our website at http://www.digitalturbine.com generally when such reports are available on the SEC website. The contents of our website are not incorporated into this Annual Report on Form 10-K.
The public may read and copy any materials we file with the SEC at the SEC’s Public Reference Room at 100 F Street, NE, Washington, D.C. 20549. The public may obtain information on the operation of the Public Reference Room by calling the SEC at 1-800-SEC-0330. The SEC maintains an internet site that contains reports, proxy and information statements and other information regarding issuers that file electronically with the SEC at http://www.sec.gov.
8
|
ITEM 1A.
|
RISK FACTORS
|
Investing in our common stock involves a high degree of risk. Current investors and potential investors should consider carefully the risks and uncertainties described below together with all other information contained in this Form 10-K before making investment decisions with respect to our common stock. The business, financial condition and operating results of the Company can be affected by a number of factors, whether currently known or unknown, including but not limited to those described below, any one or more of which could, directly or indirectly, cause the Company’s actual results of operations and financial condition to vary materially from past, or from anticipated future, results of operations and financial condition. If any of the following risks actually occurs, our business, financial condition, results of operations and our future growth prospects would be materially and adversely affected. Under these circumstances, the trading price and value of our common stock could decline, resulting in a loss of all or part of your investment. The risks and uncertainties described in this Form 10-K are not the only ones facing us. Additional risks and uncertainties of which we are not presently aware, or that we currently consider immaterial, may also affect our business operations.
Past financial performance should not be considered to be a reliable indicator of future performance, and current and potential investors should not use historical trends to anticipate results or trends in future periods.
Risks Related to Our Business
General Risks
The Company has a history of net losses, may incur substantial net losses in the future, and may not achieve profitability.
We expect to continue to increase expenses as we implement initiatives designed to continue to grow our business, including, among other things, the development and marketing of new products and services, further international and domestic expansion, expansion of our infrastructure, development of systems and processes, acquisition of content, and general and administrative expenses associated with being a public company. If our revenues do not increase to offset these expected increases in operating expenses, we will continue to incur losses and we will not become profitable. Our revenue growth in past periods should not be considered indicative of our future performance. In fact, in future periods, our revenues could decline as they have in past years. Accordingly, we may not be able to achieve profitability in the future.
If there are delays in the distribution of our products or if we are unable to successfully negotiate with advertisers, application developers, carriers, mobile operators or OEMs or if these negotiations cannot occur on a timely basis, we may not be able to generate revenues sufficient to meet the needs of the business in the foreseeable future or at all.
9
We have a limited operating history for our current portfolio of assets, which may make it difficult to evaluate our business.
Evaluation of our business and our prospects must be considered in light of our limited operating history and the risks and uncertainties encountered by companies in our stage of development. As an early stage company in the emerging mobile application industry, we face increased risks, uncertainties, expenses and difficulties. To address these risks and uncertainties, we must do the following:
|
•
|
maintain our current, and develop new, wireless carrier and OEM relationships, in both international and domestic markets;
|
•
maintain and expand our current, and develop new, relationships with compelling content owners;
•
retain or improve our current revenue-sharing arrangements with carriers and content owners;
•
continue to develop new high-quality products and services that achieve significant market acceptance;
•
continue to develop and upgrade our technology;
•
continue to enhance our information processing systems;
•
increase the number of end users of our products and services;
•
execute our business and marketing strategies successfully;
•
respond to competitive developments; and
•
attract, integrate, retain and motivate qualified personnel.
We may be unable to accomplish one or more of these objectives, which could cause our business to suffer. In addition, accomplishing many of these efforts might be very expensive, which could adversely impact our operating results and financial condition.
10
Our financial results could vary significantly from quarter to quarter and are difficult to predict.
Our revenues and operating results could vary significantly from quarter to quarter because of a variety of factors, many of which are outside of our control. As a result, comparing our operating results on a period-to-period basis may not be meaningful. In addition, we are not able to predict our future revenues or results of operations. We base our current and future expense levels on our internal operating plans and sales forecasts, and our operating costs are to a large extent fixed. As a result, we may not be able to reduce our costs sufficiently to compensate for an unexpected shortfall in revenues, and even a small shortfall in revenues could disproportionately and adversely affect financial results for that quarter. Individual products and services, and carrier and OEM relationships, represent meaningful portions of our revenues and margins in any quarter.
In addition to other risk factors discussed in this section, factors that may contribute to the variability of our results include:
•
the number of new products and services released by us and our competitors;
|
•
|
the timing of release of new products and services by us and our competitors, particularly those that may represent a significant portion of revenues in a period;
|
•
the popularity of new products and services, and products and services released in prior periods;
•
changes in prominence of deck placement for our leading products and those of our competitors;
•
the timing of charges related to impairments of goodwill, and intangible assets;
•
changes in pricing policies by us, our competitors or our carriers and other distributors;
•
changes in the mix of original and licensed content, which have varying gross margins;
•
changes in the mix of direct versus indirect advertising sales, which have varying margin profiles;
•
changes in the mix of CPI, CPP, CPA, and license fee sales, which have varying revenue and margin profiles
•
the seasonality of our industry;
•
fluctuations in the size and rate of growth of overall consumer demand for mobile products and services;
|
•
|
strategic decisions by us or our competitors, such as acquisitions, divestitures, spin-offs, joint ventures, strategic investments or changes in business strategy;
|
•
our success in entering new geographic markets;
•
decisions by one or more of our partners and/or customers to terminate our business relationship(s);
•
foreign exchange fluctuations;
•
accounting rules governing recognition of revenue;
•
general economic, political and market conditions and trends;
•
the timing of compensation expense associated with equity compensation grants; and
•
decisions by us to incur additional expenses, such as increases in marketing or research and development.
As a result of these and other factors, including seasonality attributable to the holiday seasons, our operating results may not meet the expectations of investors or public market analysts who choose to follow our company. Our failure to meet market expectations would likely result in decreases in the trading price of our common stock.
Placement of our products, or the failure of the market to accept our products, would likely adversely impact our revenues and thus our operating results and financial condition.
Wireless carriers provide a limited selection of products that are accessible to their subscribers through their mobile handsets. The inherent limitation on the volume of products available on the handset is a function of the screen size of handsets and carriers’ perceptions of the depth of menus and numbers of choices end users will generally utilize. If carriers choose to give our products less favorable placement or reduce our slot count on the phone, our products may be less successful than we anticipate, our revenues may decline and our business, operating results and financial condition may be materially harmed. In addition, if carriers or other participants in the market favor another competitor’s products over our products, or opt not to enable and implement our technology to unify operating systems, our future growth could suffer and our revenues could be negatively affected.
11
If we are unsuccessful in establishing and increasing awareness of our brand and recognition of our products and services or if we incur excessive expenses promoting and maintaining our brand or our products and services, our potential revenues could be limited, our costs could increase and our operating results and financial condition could be harmed.
We believe that establishing and maintaining our brand is critical to retaining and expanding our existing relationships with wireless carriers, OEMs, and advertisers as well as developing new relationships. Promotion of the Company’s brands will depend on our success in providing high-quality products and services. Similarly, recognition of our products and services by end users will depend on our ability to develop engaging products and quality services to maintain existing, and attracts new, business relationships and end users. However, our success will also depend, in part, on the services and efforts of third parties, over which we have little or no control. For instance, if our carriers fail to provide high levels of service, our end users’ ability to access our products and services may be interrupted, which may adversely affect our brand. If end users, branded content owners and carriers do not perceive our offerings as high-quality or if we introduce new products and services that are not favorably received by our end users and carriers, then we may be unsuccessful in building brand recognition and brand loyalty in the marketplace. In addition, globalizing and extending our brand and recognition of our products and services will be costly and will involve extensive management time to execute successfully. Further, the markets in which we operate are highly competitive and some of our competitors already have substantially more brand name recognition and greater marketing resources than we do. If we fail to increase brand awareness and consumer recognition of our products and services, our potential revenues could be limited, our costs could increase and our business, operating results and financial condition could suffer.
Our business is dependent on the continued growth in usage of smartphones, tablets and other mobile connected devices.
Our business depends on the continued proliferation of mobile connected devices, such as smartphones and tablets, which can connect to the Internet over a cellular, wireless or other network, as well as the increased consumption of content through those devices. Consumer usage of these mobile connected devices may be inhibited for a number of reasons, such as:
|
•
|
inadequate network infrastructure to support advanced features beyond just mobile web access;
|
|
•
|
users’ concerns about the security of these devices;
|
|
•
|
inconsistent quality of cellular or wireless connection;
|
|
•
|
unavailability of cost-effective, high-speed Internet service; and
|
|
•
|
changes in network carrier pricing plans that charge device users based on the amount of data consumed.
|
|
•
|
new technology which is not compatible with our products and offerings.
|
For any of these reasons, users of mobile connected devices may limit the amount of time they spend on these devices and the number of applications or amount of content they download on these devices. If user adoption of mobile connected devices and consumer consumption of content on those devices do not continue to grow, our total addressable market size may be significantly limited, which could compromise our ability to increase our revenue and our ability to become profitable.
If mobile connected devices, their operating systems or content distribution channels, including those controlled by our competitors, develop in ways that prevent advertising from being delivered to their users, our ability to grow our business will be impaired.
A portion of our business model depends upon the continued demand for mobile advertising on connected devices, as well as the major operating systems that run on them and the thousands of applications that are downloaded onto them.
The design of mobile devices and operating systems is controlled by third parties with whom we do not have any formal relationships. These parties frequently introduce new devices, and from time to time they may introduce new operating systems or modify existing ones. Network carriers may also affect the ability of users to download applications or access specified content on mobile devices.
In some cases, the parties that control the development of mobile connected devices and operating systems include companies that we regard as our competitors. For example, Google controls the Android™ platform operating system. If our mobile software platform were unable to work on these operating systems, either because of technological constraints or because the developer of this operating systems wishes to impair our ability to provide ads on the operating system, our ability to generate revenue could be significantly harmed.
12
If we fail to deliver our products and services ahead of the commercial launch of new mobile handset models, our sales may suffer.
Our business is dependent, in part, on the commercial sale of smartphone handsets. We do not control the timing of these handset launches. Some new handsets are sold by carriers with certain of our products and applications pre-loaded, and many end users who use our services do so after they purchase their new handsets to experience the new features of those handsets. Some of our products require handset manufacturers give us access to their handsets prior to commercial release. If one or more major handset manufacturers were to cease to provide us access to new handset models prior to commercial release, we might be unable to introduce compatible versions of our products and services for those handsets in coordination with their commercial release, and we might not be able to make compatible versions for a substantial period following their commercial release. If, because of launch delays, we miss the opportunity to sell products and services when new handsets are shipped or our end users upgrade to a new handset, or if we miss the key holiday selling period, either because the introduction of a new handset is delayed or we do not deploy our products and services in time for seasonal increases in handset sales, our revenues would likely decline and our business, operating results and financial condition would likely suffer.
We may be unable to develop and introduce in a timely way new products or services, and our products and services may have defects, which could harm our brand.
The planned timing and introduction of new products and services are subject to risks and uncertainties. Unexpected technical, operational, deployment, distribution or other problems could delay or prevent the introduction of new products and services, which could result in a loss of, or delay in, revenues or damage to our reputation and brand. If any of our products or services is introduced with defects, errors or failures, we could experience decreased sales, loss of end users, damage to our carrier relationships and damage to our reputation and brand. In addition, new products and services may not achieve sufficient market acceptance to offset the costs of development, particularly when the introduction of a product or service is substantially later than a planned “day-and-date” launch, which could materially harm our business, operating results and financial condition.
If we fail to maintain and enhance our capabilities for our offerings to a broad array of mobile operating systems, our attractiveness to wireless carriers, equipment manufacturers, and application developers will be impaired, and our sales could suffer.
Changes to our design and development processes to address new features or functions of mobile operating systems or networks might cause inefficiencies that might result in more labor-intensive software integration processes. In addition, we anticipate that in the future we will be required to update existing and new products and applications to a broader array of mobile operating systems. If we utilize more labor intensive processes, our margins could be significantly reduced and it might take us longer to integrate our products and applications to additional mobile operating systems. This, in turn, could harm our business, operating results and financial condition.
A majority of our revenues are currently being derived from a limited number of wireless carriers, advertisers and application developers, if any one of these customers were to terminate their agreement with us or if they were unable to fulfill their payment obligations, our financial condition and results of operations would suffer.
If any of our primary customers were to terminate their commercial relationship with us or if they are unable to fulfill their payment obligations to us under our agreements with them, our revenues could decline significantly and our financial condition will be harmed.
13
We may be subject to legal liability associated with providing mobile and online services or content.
We provide a variety of products and services that enable carriers, manufactures, and users to engage in various mobile and online activities both domestically and internationally. The law relating to the liability of providers of these mobile and online services and products for such activities is still unsettled and constantly evolving in the U.S. and internationally. Claims have been threatened and have been brought against us in the past for breaches of contract, copyright or trademark infringement, tort or other theories based on the provision of these products and services. In addition, we are and have been and may again in the future be subject to domestic or international actions alleging that certain content we have generated or third-party content that we have made available within our services violates laws in domestic and international jurisdictions. We may be subject to claims concerning these products, services, or content by virtue of our involvement in marketing, branding, broadcasting, or providing access to them, even if we do not ourselves host, operate, provide, own, or license these products, services, or content. While we routinely insert indemnification provisions into our contracts with these parties, such indemnities to us, when obtainable, may not cover all damages and losses suffered by us and our customers from covered products and services. In addition, recorded reserves and/or insurance coverage may be exceeded by unexpected results from such claims which directly impacts profits. Defending such actions could be costly and involve significant time and attention of our management and other resources, may result in monetary liabilities or penalties, and may require us to change our business in an adverse manner.
Our business is dependent on our ability to maintain and scale our infrastructure, including our employees and 3rd parties; and any significant disruption in our service could damage our reputation, result in a potential loss of customers and adversely affect our financial results.
Our reputation and ability to attract, retain, and serve customers is dependent upon the reliable performance of our products and services and the underlying infrastructure, both internal and from third party providers. Our systems may not be adequately designed with the necessary reliability and redundancy to avoid performance delays or outages that could be harmful to our business. If our products and services are unavailable, or if they do not load as quickly as expected, customers may not use our products as often in the future, or at all. If our customer base grows, we will need an increasing amount of infrastructure, including network capacity, to continue to satisfy the needs of our customers. It is possible that we may fail to effectively scale and grow our infrastructure to accommodate these increased demands. In addition, our business may be subject to interruptions, delays, or failures resulting from earthquakes, adverse weather conditions, other natural disasters, power loss, terrorism, ineffective business execution or other catastrophic events.
A substantial portion of our network infrastructure is provided by third parties. Any disruption or failure in the services we receive from these providers could harm our ability to handle existing or increased traffic and could significantly harm our business. Any financial or other difficulties these providers face may adversely affect our business, and we exercise little control over these providers, which increases our vulnerability to problems with the services they provide.
Our products, services and systems rely on software that is highly technical, and if it contains undetected errors, our business could be adversely affected.
Our products, services and systems rely on software, including software developed or maintained internally and/or by third parties, that is highly technical and complex. In addition, our products, services and systems depend on the ability of such software to transfer, store, retrieve, process, and manage large amounts of data. The software on which we rely has contained, and may now or in the future contain, undetected errors, bugs, or vulnerabilities. Some errors may only be discovered after the code has been released for external or internal use. Errors or other design defects within the software on which we rely may result in a negative experience for customers and marketers who use our products, delay product introductions or enhancements, result in measurement or billing errors, or compromise our ability to protect the data of our users and/or our intellectual property. Any errors, bugs, or defects discovered in the software on which we rely could result in damage to our reputation, loss of users, loss of revenue, or liability for damages, any of which could adversely affect our business and financial results.
14
We plan to continue to review opportunities and possibly make acquisitions, which could require significant management attention, disrupt our business, result in dilution to our stockholders, and adversely affect our financial condition and results of operations.
As part of our business strategy, we have made and intend to continue to review opportunities and possibly make acquisitions to add specialized employees and complementary companies, products, technologies or distribution channels. In some cases, these acquisitions may be substantial and our ability to acquire and integrate such companies in a successful manner is unproven.
Any acquisitions we announce could be viewed negatively by mobile network operators, users, marketers, developers, or investors. In addition, we may not successfully evaluate, integrate, or utilize the products, technology, operations, or personnel we acquire. The integration of acquisitions may require significant time and resources, and we may not manage these integrations successfully. In addition, we may discover liabilities or deficiencies that we did not identify in advance associated with the companies or assets we acquire. The effectiveness of our due diligence with respect to acquisitions, and our ability to evaluate the results of such due diligence, is dependent upon the accuracy and completeness of statements and disclosures made or actions taken by the companies we acquire or their representatives. We may also fail to accurately forecast the financial impact of an acquisition transaction, including accounting charges. In the future, we may not be able to find suitable acquisition candidates, and we may not be able to complete acquisitions on favorable terms, if at all.
We may also incur substantial costs in making acquisitions. We may pay substantial amounts of cash or incur debt to pay for acquisitions, which could adversely affect our liquidity. The incurrence of indebtedness would also result in increased fixed obligations, interest expense, and could also include covenants or other restrictions that would impede our ability to manage our operations. Additionally, we may issue equity securities to pay for acquisitions or to retain the employees of the acquired company, which could increase our expenses, adversely affect our financial results, and result in dilution to our stockholders. In addition, acquisitions may result in our recording of substantial goodwill and amortizable intangible assets on our balance sheet upon closing, which could adversely affect our future financial results and financial condition. These factors related to acquisitions may require significant management attention, disrupt our business, result in dilution to our stockholders, and adversely affect our financial results and financial condition.
The Company’s business is highly dependent on decisions and developments in the mobile device industry over which the Company has no control.
The Company’s ability to maintain and grow its business will be impaired if mobile connected devices, their operating systems or content distribution channels, including those controlled by the primary competitors of the Company, develop in ways that prevent the Company’s advertising from being delivered to their users.
The Company’s business model will depend upon the continued compatibility of its mobile advertising platform with most mobile connected devices, as well as the major operating systems that run on them and the thousands of apps that are downloaded onto them.
The design of mobile devices and operating systems is controlled by third parties. These parties frequently introduce new devices, and from time to time they may introduce new operating systems or modify existing ones. Network carriers, such as Verizon, AT&T, Sprint, as well as other domestic and global operators, as well as OEMs, such as Samsung, may also affect the ability of users to download apps or access specified content on mobile devices. The Company also has some relationships with various other mobile carriers with relationships that are specific and subject to contractual performance which may not be achieved.
In some cases, the parties that control the development of mobile connected devices and operating systems include companies that the Company would regard as its most significant competitors. For example, Apple controls two of the most popular mobile devices, the iPhone® and the iPad®, as well as the iOS operating system that runs on them. Apple also controls the App Store for downloading apps that run on Apple® mobile devices. Similarly, Google controls the Google Play and Android™ platform operating system. If the Company’s mobile advertising platform were unable to work on these devices or operating systems, either because of technological constraints or because a maker of these devices or developer of these operating systems wished to impair the Company’s ability to provide ads on them or its ability to fulfill advertising space, or inventory, from developers whose apps are distributed through their controlled channels, the Company’s ability to maintain and grow its business will be impaired.
15
The Company’s business may depend in part on its ability to collect and use location-based information about mobile connected device users.
The Company’s business model will depend in part upon its ability to collect data about the location of mobile connected device users when they are interacting with their devices, and then to use that information to provide effective targeted advertising on behalf of its advertising clients. The Company’s ability to either collect or use location-based data could be restricted by a number of factors, including new laws or regulations, technology or consumer choice. Limitations on its ability to either collect or use location data could impact the effectiveness of the Company’s platform and its ability to target ads.
The Company does not have long-term agreements with its advertiser clients, and it may be unable to retain key clients, attract new clients or replace departing clients with clients that can provide comparable revenue to the Company.
The Company’s success will depend on its ability to maintain and expand its current advertiser client relationships and to develop new relationships. The Company’s contracts with its advertiser clients does not generally include long-term obligations requiring them to purchase the Company’s services and are cancelable upon short or no notice and without penalty. As a result, the Company may have limited visibility as to its future advertising revenue streams. The Company will not be able to provide assurance that its advertiser clients will continue to use its services or that it will be able to replace, in a timely or effective manner, departing clients with new clients that generate comparable revenue. If a major advertising client representing a significant portion of the Company’s business decides to materially reduce its use of the Company’s platform or to cease using the Company’s platform altogether, it is possible that the Company may not have a sufficient supply of ads to fill its developers’ advertising inventory, in which case the Company’s revenue could be significantly reduced. Revenue derived from performance advertisers in particular is subject to fluctuation and competitive pressures. Such advertisers, which seek to drive app downloads, are less consistent with respect to their spending volume, and may decide to substantially increase or decrease their use of the Company’s platform based on seasonality or popularity of a particular app.
Advertisers in general may shift their business to a competitor’s platform because of new or more compelling offerings, strategic relationships, technological developments, pricing and other financial considerations, or a variety of other reasons. Any non-renewal, renegotiation, cancellation or deferral of large advertising contracts, or a number of contracts that in the aggregate account for a significant amount of revenue, could cause an immediate and significant decline in the Company’s revenue and harm its business.
16
The Company’s business practices with respect to data could give rise to liabilities or reputational harm as a result of governmental regulation, legal requirements or industry standards relating to consumer privacy and data protection.
In the course of providing its services, the Company will transmit and store information related to mobile devices and the ads it places, which may include a device’s geographic location for the purpose of delivering targeted location-based ads to the user of the device, with that user’s consent. Federal, state and international laws and regulations govern the collection, use, retention, sharing and security of data that the Company will collect across its mobile advertising platform. The Company will strive to comply with all applicable laws, regulations, policies and legal obligations relating to privacy and data protection. However, it is possible that these requirements may be interpreted and applied in a manner that is inconsistent from one jurisdiction to another and may conflict with other rules or its practices. Any failure, or perceived failure, by it to comply with U.S. federal, state, or international laws, including laws and regulations regulating privacy, data security, or consumer protection, could result in proceedings or actions against the Company by governmental entities or others. Any such proceedings could hurt the Company’s reputation, force it to spend significant amounts in defense of these proceedings, distract its management, increase its costs of doing business, adversely affect the demand for its services and ultimately result in the imposition of monetary liability. The Company may also be contractually liable to indemnify and hold harmless its clients from the costs or consequences of inadvertent or unauthorized disclosure of data that it stores or handles as part of providing its services.
The regulatory framework for privacy issues worldwide is evolving, and various government and consumer agencies and public advocacy groups have called for new regulation and changes in industry practices, including some directed at the mobile industry in particular. For example, in early 2012, the State of California entered into an agreement with several major mobile application platforms under which the platforms have agreed to require mobile applications to meet specified standards to ensure consumer privacy. Subsequently, in January 2013, the State of California released a series of recommendations for privacy best practices for the mobile industry. In January 2014, a California law also became effective amending the required disclosures for online privacy policies. It is possible that new laws and regulations will be adopted in the United States and internationally, or existing laws and regulations may be interpreted in new ways, that would affect the Company’s business, particularly with regard to location-based services, collection or use of data to target ads, and communication with consumers via mobile devices.
The U.S. government, including the Federal Trade Commission, or FTC, and the Department of Commerce, is focused on the need for greater regulation of the collection of consumer information, including regulation aimed at restricting some targeted advertising practices. In December 2012, the FTC adopted revisions to the Children’s Online Privacy Protection Act, or COPPA, that went into effect on July 1, 2013. COPPA imposes a number of obligations on operators of websites and online services including mobile applications, such as obtaining parental consent, if the operator collects specified information from users and either the site or service is directed to children under 13 years old or the site or service knows that a specific user is a child under 13 years old. The changes broaden the applicability of COPPA, including the types of information that are subject to these regulations, and may apply to information that the Company will collect through mobile devices or apps that, prior to the adoption of these new regulations, was not subject to COPPA. These revisions will impose new compliance burdens on the Company. In February 2013, the FTC issued a staff report containing recommendations for best practices with respect to consumer privacy for the mobile industry. To the extent that the Company or its clients choose to adopt these recommendations, or other regulatory or industry requirements become applicable to the Company, it may have greater compliance burdens.
As the Company expands its operations globally, compliance with regulations that differ from country to country may also impose substantial burdens on its business. In particular, the European Union has traditionally taken a broader view as to what is considered personal information and has imposed greater obligations under data privacy regulations. In addition, individual EU member countries have had discretion with respect to their interpretation and implementation of the regulations, which has resulted in variation of privacy standards from country to country. Complying with any new regulatory requirements could force it to incur substantial costs or require us to change its business practices in a manner that could compromise its ability to effectively pursue its growth strategy.
17
The Company’s business may involve the use, transmission and storage of confidential information, and the failure to properly safeguard such information could result in significant reputational harm and monetary damages.
The Company may at times collect, store and transmit information of, or on behalf of, its clients that may include certain types of confidential information that may be considered personal or sensitive, and that are subject to laws that apply to data breaches. The Company intends to take reasonable steps to protect the security, integrity and confidentiality of the information it collects and stores, but there is no guarantee that inadvertent or unauthorized disclosure will not occur or that third parties will not gain unauthorized access to this information despite the Company’s efforts to protect this information. If such unauthorized disclosure or access does occur, the Company may be required to notify persons whose information was disclosed or accessed. Most states have enacted data breach notification laws and, in addition to federal laws that apply to certain types of information, such as financial information, federal legislation has been proposed that would establish broader federal obligations with respect to data breaches. The Company may also be subject to claims of breach of contract for such disclosure, investigation and penalties by regulatory authorities and potential claims by persons whose information was disclosed. The unauthorized disclosure of information may result in the termination of one or more of its commercial relationships or a reduction in client confidence and usage of its services. The Company may also be subject to litigation alleging the improper use, transmission or storage of confidential information, which could damage its reputation among its current and potential clients, require significant expenditures of capital and other resources and cause it to lose business and revenue.
Changes to current accounting principles could have a significant effect on the Company’s reported financial results or the way in which it conducts its business.
We prepare our financial statements in conformity with U.S. GAAP, which are subject to interpretation by the Financial Accounting Standards Board, the American Institute of Certified Public Accountants, the SEC, and various other authorities formed to interpret, recommend, and announce appropriate accounting principles, policies, and practices. A change in these principles could have a significant effect on our reported financial results and related financial disclosures, and may even retroactively affect the accounting for previously reported transactions. Our accounting policies that recently have been or may in the future be affected by changes in the accounting principles are as follows:
|
•
|
business consolidations;
|
|
•
|
revenue recognition;
|
|
•
|
leases;
|
|
•
|
stock-based compensation;
|
|
•
|
disclosure of uncertainties about an entity's ability to continue as a going concern; and
|
|
•
|
accounting for goodwill and other intangible assets.
|
Changes in these or other rules may have a significant adverse effect on our reported financial results, disclosures, or in the way in which we conduct our business. See the discussion in “Summary of Significant Accounting Policies” set forth in Note 4 to our consolidated financial statements under Item 8 of this Annual Report, for additional information about our accounting policies and estimates and associated risks.
System failures could significantly disrupt the Company’s operations and cause it to lose advertiser clients or advertising inventory.
The Company’s success will depend on the continuing and uninterrupted performance of its own internal systems, which the Company will utilize to place ads, monitor the performance of advertising campaigns and manage its inventory of advertising space. Its revenue will depend on the technological ability of its platforms to deliver ads. Sustained or repeated system failures that interrupt its ability to provide services to clients, including technological failures affecting its ability to deliver ads quickly and accurately and to process mobile device users’ responses to ads, could significantly reduce the attractiveness of its services to advertisers and reduce its revenue. The combined systems are vulnerable to damage from a variety of sources, including telecommunications failures, power outages, malicious human acts and natural disasters. In addition, any steps the Company takes to increase the reliability and redundancy of its systems may be expensive and may not ultimately be successful in preventing system failures.
18
System security risks, data protection breaches, cyber-attacks, and systems integration issues could disrupt our internal operations or information technology services provided to customers, and any such disruption could reduce our expected revenue, increase our expenses, damage our reputation and adversely affect our stock price.
Experienced computer programmers and hackers may be able to penetrate our network security and misappropriate or compromise our confidential information or that of third-parties, create system disruptions or cause shutdowns. Computer programmers and hackers also may be able to develop and deploy viruses, worms, and other malicious software programs that attack our products or otherwise exploit any security vulnerabilities of our products. In addition, sophisticated hardware and operating system software and applications that we produce or procure from third-parties may contain defects in design or manufacture, including ‘‘bugs’’ and other problems that could unexpectedly interfere with the operation of the system. The costs to us to eliminate or alleviate cyber or other security problems, bugs, viruses, worms, malicious software programs and security vulnerabilities could be significant, and our efforts to address these problems may not be successful and could result in interruptions, delays, cessation of service and loss of existing or potential customers that may impede our sales or other critical functions. We manage and store various proprietary information and sensitive or confidential data relating to our business. Breaches of our security measures or the accidental loss, inadvertent disclosure or unapproved dissemination of proprietary information or sensitive or confidential data about us, our clients or customers, including the potential loss or disclosure of such information or data as a result of fraud, trickery or other forms of deception, could expose us, our customers or the individuals affected to a risk of loss or misuse of this information, result in litigation and potential liability for us, damage our brand and reputation or otherwise harm our business. In addition, the cost and operational consequences of implementing further data protection measures could be significant. Portions of our IT infrastructure also may experience interruptions, delays or cessations of service or produce errors in connection with systems integration or migration work that takes place from time to time. We may not be successful in implementing new systems and transitioning data, which could cause business disruptions and be more expensive, time-consuming, disruptive and resource intensive. Such disruptions could adversely impact our ability to provide services and interrupt other processes. Delayed sales, lower margins, increased cost, or lost customers resulting from these disruptions could reduce our expected revenue, increase our expenses, damage our reputation and adversely affect our stock price.
If our goodwill or amortizable intangible assets become impaired, we may be required to record a significant charge to earnings.
We review our amortizable intangible assets for impairment when events or changes in circumstances indicate the carrying value may not be recoverable. We test goodwill for impairment at least annually or sooner if an indicator of impairment is present. If such goodwill or intangible assets are deemed impaired, an impairment loss would be recognized. We may be required to record a significant charge in our financial statements during the period in which any impairment of our goodwill or amortizable intangible assets is determined, which would negatively affect our results of operations.
Advertising Risks
Our revenues may fluctuate significantly based on mobile device sell-through, over which we have no control.
A significant portion of our revenue is impacted by the level of sell-through of mobile devices on which our software is installed. Demand for mobile devices sold by carriers varies materially by device, and if our software is installed on devices for which demand is lower than our expectations --a factor over which we have no control as we do not market mobile devices --our revenues will be impacted negatively, and this impact may be significant. As our software is deployed on a diversified universe of devices, this risk will be mitigated, as the relative performance of one device over another device will have less impact on us, but until we achieve diversification in our device installations, we will continue to be subject to revenue fluctuations based on device sell-through, and such fluctuations can be material. Further, it is difficult to predict the level of demand for a particular device, making our revenue projections correspondingly difficult. These issues can be ameliorated as we gain more significant carrier relationships and conversely these issues can be exacerbated with, as presently, a limited number of such relationships.
Our revenues may fluctuate significantly based on level of advertiser spend, over which we have no control.
A significant portion of our revenue is impacted by the level of advertising spend. If advertising spend is lower than our expectations -- a factor over which we have no control as we do not determine our customers' advertising budgets -- our revenues will be impacted negatively, and this impact may be significant.
19
Activities of the Company’s advertiser clients could damage the Company’s reputation or give rise to legal claims against it.
The Company’s advertiser clients’ promotion of their products and services may not comply with federal, state and local laws, including, but not limited to, laws and regulations relating to mobile communications. Failure of its clients to comply with federal, state or local laws or its policies could damage its reputation and expose it to liability under these laws. The Company may also be liable to third parties for content in the ads it delivers if the artwork, text or other content involved violates copyrights, trademarks or other intellectual property rights of third parties or if the content is defamatory, unfair and deceptive, or otherwise in violation of applicable laws. Although the Company will generally receive assurance from its advertisers that their ads are lawful and that they have the right to use any copyrights, trademarks or other intellectual property included in an ad, and although it will normally be indemnified by the advertisers, a third party or regulatory authority may still file a claim against the Company. Any such claims could be costly and time-consuming to defend and could also hurt the Company’s reputation. Further, if it is exposed to legal liability as a result of the activities of its advertiser clients, the Company could be required to pay substantial fines or penalties, redesign its business methods, discontinue some of its services or otherwise expend significant resources.
Loss or reduction of business from the Company’s large advertiser clients could have a significant impact on the Company’s revenues, results of operations and overall financial condition.
From time to time, a limited number of the Company’s advertiser clients will be expected to account for a significant share of its advertising revenue. This customer concentration increases the risk of quarterly fluctuations in the Company’s revenues and operating results. The Company’s advertiser clients may reduce or terminate their business with it at any time for any reason, including changes in their financial condition or other business circumstances. If a large advertising client representing a substantial portion of its business decided to materially reduce or discontinue its use of its platform, it could cause an immediate and significant decline in its revenue and negatively affect its results of operations and financial condition.
The Company’s customer concentration also increases the concentration of its accounts receivable and its exposure to payment defaults by key customers. The Company will generate significant accounts receivable for the services that it provides to its key advertiser clients, which could expose it to substantial and potentially unrecoverable costs if it does not receive payment from them.
Mobile applications and advertising are relatively new, as are our products are evolving and growth in revenues from those areas is uncertain and changes in the industry may negatively affect our revenue and financial results.
While we anticipate that mobile usage will continue to be the primary driver of revenues related to applications and advertising for the foreseeable future, there could be changes in the industry of mobile carriers and OEM’s that could have a negative impact on these growth prospects for our business and our financial performance. Additionally, advertising CPI revenue realized could be negatively impacted by end user application “open-rates”. The open-rates realized on advertising campaigns in the marketplace today could vary compared to the open-rates realized for applications distributed via our products. Reduced open-rates could have a negative impact on the success of our products and our potential revenues earned from CPI. Mobile advertising market remains a new and evolving market and if we are unable to grow revenues or successfully monetize our customer and potential customer relationships, or if we incur excessive expenses in these efforts, our financial performance and ability to grow revenue would be negatively affected.
Our growth and monetization on mobile devices depend upon effective operation with mobile operating systems, networks, and standards that we do not control as we are largely an Android-based technology provider.
There is no guarantee that mobile carriers and devices will use our products and services rather than competing products. We are dependent on the interoperability of our products and services with popular mobile operating systems that we do not control, such as Android and any changes in such systems and terms of service that degrade our products’ functionality, reduce or eliminate our ability to distribute applications, give preferential treatment to competitive products, limit our ability to target or measure the effectiveness of applications, or impose fees or other charges related to our delivery of applications could adversely affect our monetization on mobile devices. Currently, our product offerings are primarily compatible with Android only, and would require developmental modifications to support other operating platforms. Additionally, in order to deliver high quality user experience, it is important that our products and services work well with a range of mobile technologies, systems, networks, and standards that we do not control. We may not be successful in developing relationships with key participants in the mobile industry or in developing products that operate effectively with these technologies, systems, networks, or standards. In the event that our relationships with network operators, mobile operating systems or other business partners deteriorate, our growth and monetization could be adversely affected and our business could be harmed.
20
We currently rely on wireless carriers and OEMs to distribute our products and services and thus to generate much of our revenues. The loss of or a change in any of these significant carrier relationships could cause us to lose access to their subscribers and thus materially reduce our revenues.
The future success of our business is highly dependent upon maintaining successful relationships with the wireless carriers and OEMs with which we currently work and establishing new carrier and OEM relationships in geographies where we have not yet established a significant presence. A significant portion of our revenue is derived from a very limited number of carriers. We expect that we will continue to generate a substantial portion of our revenues, on a go-forward basis, through relationships with a limited number of carriers for the foreseeable future. Our failure to maintain our relationships with these carriers, establish relationships with new carriers, or a loss or change of terms would materially reduce our revenues and thus harm our business, operating results and financial condition.
We have both exclusive and non-exclusive carrier and OEM agreements. Historically, our carrier and OEM agreements have had terms of one or two years with automatic renewal provisions upon expiration of the initial term, absent a contrary notice from either party, but going forward terms in carrier and OEM agreements may vary. In addition, some carrier and OEM agreements provide that the parties can terminate the agreement early and, in some instances, at any time without cause, which could give them the ability to renegotiate economic or other terms. The agreements generally do not obligate the carriers and OEMs to market or distribute any of our products or services. In many of these agreements, we warrant that our products do not violate community standards, do not contain libelous content, do not contain material defects or viruses, and do not violate third-party intellectual property rights and we indemnify the carrier for any breach of a third party’s intellectual property.
Many other factors outside our control could impair our ability to generate revenues through a given carrier or OEM, including the following:
|
•
|
the carrier or OEM's preference for our competitors’ products and services rather than ours;
|
|
•
|
the carrier or OEM's decision not to include or highlight our products and services on the deck of its mobile handsets;
|
|
•
|
the carrier or OEM's decision to discontinue the sale of some or all of products and services;
|
|
•
|
the carrier’s decision to offer similar products and services to its subscribers without charge or at reduced prices;
|
|
•
|
a failure of the carrier or OEM's merchandising, provisioning or billing systems;
|
|
•
|
the carrier or OEM's decision to offer its own competing products and services;
|
|
•
|
the carrier or OEM's decision to transition to different platforms and revenue models; and
|
|
•
|
consolidation among carriers or OEMs.
|
If any of our carriers or OEMs decides not to market or distribute our products and services or decides to terminate, not renew or modify the terms of its agreement with us or if there is consolidation among carriers generally, we may be unable to replace the affected agreement with acceptable alternatives, causing us to lose access to that carrier’s subscribers and the revenues they afford us, which could materially harm our business, operating results and financial condition.
21
The mobile advertising business is an intensely competitive industry, and we may not be able to compete successfully.
The mobile advertising market is highly competitive, with numerous companies providing mobile advertising services. The Company’s mobile advertising platform will compete primarily with Facebook, Twitter, Snap, and Google, all of which are significantly larger than us and have far more capital to invest in their mobile advertising businesses. The Company will also compete with in-house solutions used by companies who choose to coordinate mobile advertising across their own properties, such as Yahoo!, Pandora, and other independent publishers. They, or other companies that offer competing mobile advertising solutions, may establish or strengthen cooperative relationships with their mobile operator partners, application developers or other parties, thereby limiting the Company’s ability to promote its services and generate revenue. Competitors could also seek to gain market share from us by reducing the prices they charge to advertisers or by introducing new technology tools for developers. Moreover, increased competition for mobile advertising space from developers could result in an increase in the portion of advertiser revenue that we must pay to developers to acquire that advertising space. The Company’s business will suffer to the extent that its developers and advertisers purchase and sell mobile advertising directly from each other or through other companies that are able to become intermediaries between developers and advertisers. For example, companies may have substantial existing platforms for developers who had previously not heavily used those platforms for mobile advertising campaigns. These companies could compete with us to the extent they expand into mobile advertising. Other companies, such as large application developers with a substantial mobile advertising business, may decide to directly monetize some or all of their advertising space without utilizing the Company’s services. Other companies that offer analytics, mediation, exchange or other third party services may also become intermediaries between mobile advertisers and developers and thereby compete with us. Any of these developments would make it more difficult for the Company to sell its services and could result in increased pricing pressure, reduced profit margins, increased sales and marketing expenses or the loss of market share.
The mobile advertising market may develop more slowly than expected, which could harm the business of the Company.
Advertisers have historically spent a smaller portion of their advertising budgets on mobile media as compared to traditional advertising methods, such as television, newspapers, radio and billboards, or online advertising over the internet, such as placing banner ads on websites. Future demand and market acceptance for mobile advertising is uncertain. Many advertisers still have limited experience with mobile advertising and may continue to devote larger portions of their advertising budgets to more traditional offline or online personal computer-based advertising, instead of shifting additional advertising resources to mobile advertising. If the market for mobile advertising deteriorates, or develops more slowly than we expect, the Company may not be able to increase its revenue.
22
The Company does not control the mobile networks over which it provides its advertising services.
The Company’s mobile advertising platform are dependent on the reliability of network operators and carriers who maintain sophisticated and complex mobile networks, as well as its ability to deliver content on those networks at prices that enable it to realize a profit. Mobile networks have been subject to rapid growth and technological change, particularly in recent years. The Company does not control these networks.
Mobile networks could fail for a variety of reasons, including new technology incompatibility, the degradation of network performance under the strain of too many mobile consumers using the network, a general failure from natural disaster or a political or regulatory shut-down. Individuals and groups who develop and deploy viruses, worms and other malicious software programs could also attack mobile networks and the devices that run on those networks. Any actual or perceived security threat to mobile devices or any mobile network could lead existing and potential device users to reduce or refrain from mobile usage or reduce or refrain from responding to the services offered by the Company’s advertising clients. If the network of a mobile operator should fail for any reason, the Company would not be able to effectively provide its services to its clients through that mobile network. This, in turn, could hurt the Company’s reputation and cause it to lose significant revenue.
Mobile carriers may also increase restrictions on the amounts or types of data that can be transmitted over their networks. The Company anticipates generating different amounts of revenue from its advertiser clients based on the content the Company delivers. In most cases, the Company will be paid by advertisers on a CPI basis, when an install of an advertised application occurs. Different types of advertising content consume differing amounts of bandwidth and network capacity. If a network carrier were to restrict the amounts of data that can be delivered on that carrier’s network, or otherwise control the kinds of content that may be downloaded to a device that operates on the network, it could negatively affect the Company’s pricing practices and inhibit its ability to deliver targeted advertising to that carrier’s users, both of which could impair the Company’s ability to generate revenue. Mobile connected device users may choose not to allow advertising on their devices.
The success of the Company’s advertising business model will depend on its ability to deliver targeted, highly relevant ads to consumers on their mobile connected devices. Targeted advertising is done primarily through analysis of data, much of which is collected on the basis of user-provided permissions. This data might include a device’s location or data collected when device users view an ad or video or when they click on or otherwise engage with an ad. Users may elect not to allow data sharing for targeted advertising for a number of reasons, such as privacy concerns, or pricing mechanisms that may charge the user based upon the amount or types of data consumed on the device. Users may also elect to opt out of receiving targeted advertising from Company’s platform. In addition, the designers of mobile device operating systems are increasingly promoting features that allow device users to disable some of the functionality, which may impair or disable the delivery of ads on their devices, and device manufacturers may include these features as part of their standard device specifications. Although we are not aware of any such products that are widely used in the market today, as has occurred in the online advertising industry, companies may develop products that enable users to prevent ads from appearing on their mobile device screens. If any of these developments were to occur, the Company’s ability to deliver effective advertising campaigns on behalf of its advertiser clients would suffer, which could hurt its ability to generate revenue and become profitable.
23
The Company may not be able to enhance its mobile advertising platform to keep pace with technological and market developments.
The market for mobile advertising services is characterized by rapid technological change, evolving industry standards and frequent new service introductions. To keep pace with technological developments, satisfy increasing advertiser and developer requirements, maintain the attractiveness and competitiveness of the Company’s mobile advertising solutions and ensure compatibility with evolving industry standards and protocols, the Company will need to regularly enhance its current services and to develop and introduce new services on a timely basis. If the Company’s platform is not attractive to its customers or is not able to compete with alternative mobile advertising solutions, the Company will not have access to as much advertising inventory and may experience increased pressure on margins.
In addition, advances in technology that allow developers to generate revenue from their apps without assistance from the Company could harm its relationships with developers and diminish its available advertising inventory within their apps. Similarly, technological developments that allow third parties to better mediate the delivery of ads between advertisers and developers by introducing an intermediate layer between the Company and its developers could impair its relationships with those developers. The Company’s inability, for technological, business or other reasons, to enhance, develop, introduce and deliver compelling mobile advertising services in response to changing market conditions and technologies or evolving expectations of advertisers or mobile device users could hurt its ability to grow its business and could result in its mobile advertising platform becoming obsolete.
The Company will depend on publishers, developers and distribution partners for mobile advertising space to deliver its advertiser clients’ advertising campaigns, and any decline in the supply of advertising inventory could hurt its business.
The Company will depend on publishers, developers and distribution partners to provide it with space within their applications, which we refer to as “advertising inventory,” on which the Company will deliver ads. We anticipate that a significant portion of the Company’s revenue will derive from the advertising inventory provided by a limited number of publishers, developers and distribution partners. The Company will have minimum or fixed commitments for advertising inventory with some but not all of its publishers, developers and distribution partners, including certain wireless carriers in the United States and internationally. The Company intends to expand the number of publishers, developers and distribution partners subject to minimum or fixed arrangements. Outside of those relationships however, the publishers, developers and distribution partners that will sell their advertising inventory to the Company are not required to provide any minimum amounts of advertising space to the Company, nor are they contractually bound to provide the Company with a consistent supply of advertising inventory. Such publishers, developers and distribution partners can change the amount of inventory they make available to the Company at any time. They may also change the price at which they offer inventory to the Company, or they may elect to make advertising space available to its competitors who offer ads to them on more favorable economic terms. In addition, publishers, developers and distribution partners may place significant restrictions on the Company’s use of their advertising inventory. These restrictions may prohibit ads from specific advertisers or specific industries, or they could restrict the use of specified creative content or format. They may also use a fee-based or subscription-based business model to generate revenue from their content, in lieu of or to reduce their reliance on ads.
If publishers, developers and distribution partners decide not to make advertising inventory available to the Company for any of these reasons, decide to increase the price of inventory, or place significant restrictions on the Company’s use of their advertising space, the Company may not be able to replace this with inventory from others that satisfy the Company’s requirements in a timely and cost-effective manner. If this happens, the Company’s revenue could decline or its cost of acquiring inventory could increase.
24
The Company’s advertising business depends on its ability to collect and use data to deliver applications, and any limitation on the collection and use of this data could significantly diminish the value of the Company’s services and cause it to lose clients and revenue.
When the Company delivers an application to a mobile device, it will often be able to collect anonymous information about the interaction of the mobile device user with the application, such as whether the user opened the application. As the Company collects and aggregates this data provided by billions of ad impressions, it intends to analyze it in order to optimize the placement and scheduling of applications across the advertising inventory provided to it by developers. For example, the Company may use the collected information to provide an application to only certain types of mobile devices, or to provide a report to an advertiser client on the number of its applications that were engaged.
Although the data the Company will collect is not personally identifiable information, its clients might decide not to allow it to collect some or all of this data or might limit its use of this data. For example, application developers may not agree to provide the Company with the data generated by interactions with the content on their applications, or device users may not consent to having information about their device usage provided to the developer. Any limitation on the Company’s ability to collect data about user behavior and interaction with mobile device content could make it more difficult for the Company to deliver effective mobile advertising programs that meet the demands of its advertiser clients.
Although the Company’s contracts with advertisers will generally permit it to aggregate data from advertising campaigns, these clients might nonetheless request that the Company discontinue using data obtained from their campaigns that have already been aggregated with other clients’ campaign data. It would be difficult, if not impossible, to comply with these requests, and responding to these kinds of requests could also cause the Company to spend significant amounts of resources. Interruptions, failures or defects in its data collection, mining, analysis and storage systems, as well as privacy concerns and regulatory restrictions regarding the collection of data, could also limit its ability to aggregate and analyze mobile device user data from its clients’ advertising campaigns. If that happens, the Company may not be able to optimize the placement of advertising for the benefit of its advertiser clients, which could make its services less valuable, and, as a result, it may lose clients and its revenue may decline.
The Company’s business depends on its ability to maintain the quality of its advertiser content.
The Company must be able to ensure that applications that are placed on devices are not unlawful or inappropriate. If the Company is unable to ensure that the quality of its advertiser content does not decline as the number of advertisers it works with continues to grow, then the Company’s reputation and business may suffer.
25
Risks Related to Our Market
The markets in which we operate are highly competitive, and many of our competitors have significantly greater resources than we do.
The distribution of applications, mobile advertising, development, distribution and sale of mobile products and services is a highly competitive business. We compete for advertisers primarily on the basis of positioning, brand, quality and price. We compete for wireless carriers placement based on these factors, as well as historical performance, technical know-how, perception of sales potential and relationships with advertisers and other intellectual property. We compete for platform deployment contracts amongst other mobile platform companies. We also compete for experienced and talented employees.
Our primary competition for application and content distribution comes from the traditional application store businesses of Apple and Google, existing operator solutions built internally, as well as companies providing app install products and services as offered by Facebook, Twitter, Snap, Yahoo!, Pandora and other ad networks such as RocketFuel. These companies can be both customers for Digital Turbines products, as well as competitors in certain cases. With Ignite, we see some smaller competitors, such as IronSource, Wild Tangent, and Sweet Labs, but the more material competition is internally developed operator solutions and specific mobile application management solutions built in-house by OEMs and wireless operators. Some of our existing wireless operators could make a strategic decision to develop their own solutions rather than continue to use our products.
Some of our competitors’ and our potential competitors’ advantages over us, either globally or in particular geographic markets, include the following:
|
•
|
significantly greater revenues and financial resources;
|
|
•
|
stronger brand and consumer recognition regionally or worldwide;
|
|
•
|
the capacity to leverage their marketing expenditures across a broader portfolio of mobile and non-mobile products;
|
|
•
|
more substantial intellectual property of their own from which they can develop products and services without having to pay royalties;
|
|
•
|
pre-existing relationships with brand owners or carriers that afford them access to intellectual property while blocking the access of competitors to that same intellectual property;
|
|
•
|
greater resources to make acquisitions;
|
|
•
|
lower labor and development costs; and
|
|
•
|
broader global distribution and presence.
|
If we are unable to compete effectively or we are not as successful as our competitors in our target markets, our sales could decline (or, in Digital Turbine’s case, inhibit generation of sales), our margins could decline and we could lose market share (or in Digital Turbine’s case, fail to penetrate the market), any of which would materially harm our business, operating results and financial condition.
End user tastes are continually changing and are often unpredictable; if we fail to develop and publish new products and services that achieve market acceptance, our sales would suffer.
Our business depends on deploying new products and services through wireless carriers and OEMs that end users buy. We must continue to invest significant resources in licensing efforts, research and development, marketing, and regional expansion to enhance our offering of new products and services, and we must make decisions about these matters well in advance of product release in order to implement them in a timely manner. Our success depends, in part, on unpredictable and volatile factors beyond our control, including end-user preferences, competing products and services, and the availability of other entertainment activities. If our products and services are not responsive to the requirements of our carriers or the entertainment preferences of end users, or are not brought to market in a timely and effective manner, our business, operating results, and financial condition would be harmed. Even if our products and services are successfully introduced, marketed effectively, and initially adopted, a subsequent shift in our carriers, the entertainment, shopping, and mobile preferences of end users, or our relationship with third-party billing aggregators could cause a decline in the popularity of, or access to, our offerings and could materially reduce our revenues and harm our business, operating results, and financial condition.
26
We rely on the current state of the law in certain territories where we operate our business and any adverse change in such laws may significantly adversely impact our revenues and thus our operating results and financial condition.
Decisions that regulators or governing bodies make with regard to the provision and marketing of mobile applications, content and/or billing can have a significant impact on the revenues generated in that market. Although most of our markets are mature with regulation clearly defined and implemented, there remains the potential for regulatory changes that would have adverse consequences on the business and subsequently our revenue.
We rely on our current understanding of regional regulatory requirements pertaining to the marketing, advertising and promotion of our products and services, and any adverse change in such regulations, or a finding that we did not properly understand such regulations, may significantly impact our ability to market, advertise and promote our products and services and thereby adversely impact our revenues, our operating results and our financial condition.
Some portions of our business rely extensively on marketing, advertising and promoting our products and services requiring it to have an understanding of the local laws and regulations governing our business. Additionally, we rely on the policies and procedures of wireless carriers and should those change, there could be an adverse impact on our products. In the event that we have relied on inaccurate information or advice, and engage in marketing, advertising or promotional activities that are not permitted, we may be subject to penalties, restricted from engaging in further activities or altogether prohibited from offering our products and services in a particular territory, all or any of which will adversely impact our revenues and thus our operating results and financial condition.
The strategic direction of the Company's businesses is in early stages and not completely proven or certain.
The business model that the Company is pursuing, mobile advertising and application installations, is in the early stages and not completely proven. There are many different types of models including, but not limited to, set-up fees, CPI, CPP, CPA, up-front fees (including licensing), revenue shares, per device license fees, as well as hybrids of each. Initial feedback from customers shows preference for different types of models. This could lead to risk in predicting future revenues and profits by individual customers. In particular, the ‘free’ download market is reliant upon mobile advertising, and the mobile advertising market is still in a nascent phase of monetization.
In addition, our strategy for the Company entails offering its platform to existing and new customers. There can be no assurance that we will be able to successfully market new services and offerings to existing and new customers. Moreover, in order to credibly offer the Ignite platform, we will need to achieve additional operational and technical achievements to further develop the product offering. Ignite is compatible with Android, and should the market shift to a different operating system there would need to be modifications to our products to adapt to such a change. While we remain optimistic about our ability to complete this change and build out, it will be subject to all of the risks attendant to these development efforts as well as the need to provide additional capital to the effort.
27
Risks Relating to Our Industry
Wireless communications technologies are changing rapidly, and we may not be successful in working with these new technologies.
Wireless network and mobile handset technologies are undergoing rapid innovation. New handsets with more advanced processors and advanced programming languages continue to be introduced. In addition, networks that enable enhanced features are being developed and deployed. We have no control over the demand for, or success of, these products or technologies. If we fail to anticipate and adapt to these and other technological changes, the available channels for our products and services may be limited and our market share and operating results may suffer. Our future success will depend on our ability to adapt to rapidly changing technologies and develop products and services to accommodate evolving industry standards with improved performance and reliability. In addition, the widespread adoption of networking or telecommunications technologies or other technological changes could require substantial expenditures to modify or adapt our products and services.
Technology changes in the wireless industry require us to anticipate, sometimes years in advance, which technologies we must implement and take advantage of in order to make our products and services, and other mobile entertainment products, competitive in the market. Therefore, we usually start our product development with a range of technical development goals that we hope to be able to achieve. We may not be able to achieve these goals, or our competition may be able to achieve them more quickly and effectively than we can. In either case, our products and services may be technologically inferior to those of our competitors, less appealing to end users, or both. If we cannot achieve our technology goals within our original development schedule, then we may delay their release until these technology goals can be achieved, which may delay or reduce our revenues, increase our development expenses and harm our reputation. Alternatively, we may increase the resources employed in research and development in an attempt either to preserve our product launch schedule or to keep up with our competition, which would increase our development expenses. In either case, our business, operating results and financial condition could be materially harmed.
The complexity of and incompatibilities among mobile handsets may require us to use additional resources for the development of our products and services.
To reach large numbers of wireless subscribers, application developers, and wireless carriers, we must support numerous mobile handsets and technologies. However, keeping pace with the rapid innovation of handset technologies together with the continuous introduction of new, and often incompatible, handset models by wireless carriers requires us to make significant investments in research and development, including personnel, technologies and equipment. In the future, we may be required to make substantial investments in our development if the number of different types of handset models continues to proliferate. In addition, as more advanced handsets are introduced that enable more complex, feature-rich products and services, we anticipate that our development costs will increase, which could increase the risks associated with one or more of our products or services and could materially harm our operating results and financial condition.
If wireless subscribers do not continue to use their mobile handsets to access mobile content and other applications, our business growth and future revenues may be adversely affected.
We operate in a developing industry. Our success depends on growth in the number of wireless subscribers who use their handsets to access data services we develop and distribute. New or different mobile content applications developed by our current or future competitors may be preferred by subscribers to our offerings. In addition, other mobile platforms may become widespread, and end users may choose to switch to these platforms. If the market for our products and services does not continue to grow or we are unable to acquire new end users, our business growth and future revenues could be adversely affected. If end users switch their entertainment spending away from the kinds of offerings that we publish, or switch to platforms or distribution where we do not have comparative strengths, our revenues would likely decline and our business, operating results and financial condition would suffer.
28
Our industry is subject to risks generally associated with advertising content delivery, any of which could significantly harm our operating results.
Our business is subject to risks that are generally associated with the advertising content delivery, many of which are beyond our control. These risks could negatively impact our operating results and include: the popularity, price and timing of release of our offerings and mobile handsets on which they are accessed; economic conditions that adversely affect discretionary consumer spending; changes in consumer demographics; the availability and popularity of other forms of entertainment; and critical reviews and public tastes and preferences, which may change rapidly and cannot necessarily be predicted.
A shift of technology platform by wireless carriers and mobile handset manufacturers could lengthen the development period for our offerings, increase our costs and cause our offerings to be of lower quality or to be published later than anticipated.
Mobile handsets require multimedia capabilities enabled by operating systems capable of running applications, products and services such as ours. Our development resources are concentrated in today’s most popular operating systems, and we have experience developing applications for these operating systems. Specifically, our Ignite products currently are compatible with the Android and iOS operating system. If this operating system falls out of favor with handset manufacturers and wireless carriers and there is a rapid shift to a new technology where we do not have development experience or resources, the development period for our products and services may be lengthened, increasing our costs, and the resulting products and services may be of lower quality, and may be published later than anticipated. In such an event, our reputation, business, operating results and financial condition might suffer.
System or network failures could reduce our sales, increase costs or result in a loss of end users of our products and services.
Mobile application developers rely on wireless carriers’ networks to deliver products and services to end users and on their or other third parties’ billing systems to track and account for the delivery of such offerings. In addition, certain products require access over the mobile Internet to our servers or third party servers in order to enable certain features. Any failure of, or technical problem with, carriers’, third parties’ or our billing systems, delivery systems, information systems or communications networks could result in the inability of end users to use our products, prevent the completion of a billing transaction, or interfere with access to some aspects of our products. If any of these systems fail or if there is an interruption in the supply of power, an earthquake, fire, flood or other natural disaster, or an act of war or terrorism, end users might be unable to access our offerings. For example, from time to time, our carriers have experienced failures with their billing and delivery systems and communication networks, including gateway failures that reduced the provisioning capacity of their branded e-commerce system. Any failure of, or technical problem with, the carriers’, other third parties’ or our systems could cause us to lose end users or revenues or incur substantial repair costs and distract management from operating our business. This, in turn, could harm our business, operating results and financial condition.
Our business depends on the growth and maintenance of wireless communications infrastructure.
Our success will depend on the continued growth and maintenance of wireless communications infrastructure in the United States and internationally. This includes deployment and maintenance of reliable next-generation digital networks with the speed, data capacity and security necessary to provide reliable wireless communications services. Wireless communications infrastructure may be unable to support the demands placed on it if the number of subscribers continues to increase, or if existing or future subscribers increase their bandwidth requirements. Wireless communications have experienced a variety of outages and other delays as a result of infrastructure and equipment failures, and could face outages and delays in the future. These outages and delays could reduce the level of wireless communications usage as well as our ability to distribute our products and services successfully. In addition, changes by a wireless carrier to network infrastructure may interfere with downloads and may cause end users to lose functionality. This could harm our business, operating results and financial condition.
29
Actual or perceived security vulnerabilities in mobile handsets or wireless networks could adversely affect our revenues.
Maintaining the security of mobile handsets and wireless networks is critical for our business. There are individuals and groups who develop and deploy viruses, worms and other illicit code or malicious software programs that may attack wireless networks and handsets. Security experts have identified computer “worm” programs that target handsets running on certain operating systems. Although these worms have not been widely released and do not present an immediate risk to our business, we believe future threats could lead some end users to seek to reduce or delay future purchases of our products or reduce or delay the use of their handsets. Wireless carriers and handset manufacturers may also increase their expenditures on protecting their wireless networks and mobile phone products from attack, which could delay adoption of new handset models. Any of these activities could adversely affect our revenues and this could harm our business, operating results and financial condition.
Changes in government regulation of the media and wireless communications industries may adversely affect our business.
A number of laws and regulations have been and likely will continue to be adopted in the United States and elsewhere that could restrict the media and wireless communications industries, including laws and regulations regarding customer privacy, taxation, content suitability, copyright, distribution and antitrust. Furthermore, the growth and development of the market for electronic commerce may prompt calls for more stringent consumer protection laws that may impose additional burdens on companies such as ours conducting business through wireless carriers. We anticipate that regulation of our industry will increase and that we will be required to devote legal and other resources to address this regulation. Changes in current laws or regulations or the imposition of new laws and regulations in the United States or elsewhere regarding the media and wireless communications industries may lessen the growth of wireless communications services and may materially reduce our ability to increase or maintain sales of our products and services.
A number of studies have examined the health effects of mobile phone use, and the results of some of the studies have been interpreted as evidence that mobile phone use causes adverse health effects. The establishment of a link between the use of mobile phone services and health problems, or any media reports suggesting such a link, could increase government regulation of, and reduce demand for, mobile phones and, accordingly, the demand for our products and services, and this could harm our business, operating results and financial condition.
Risks Related to Our Management, Employees and Acquisitions
Our business and growth may suffer if we are unable to hire and retain key personnel, who are in high demand.
We depend on the continued contributions of our domestic and international senior management and other key personnel. The loss of the services of any of our executive officers or other key employees could harm our business. Because not all of our executive officers and key employees are under employment agreements or are under agreement with short terms, their future employment with the Company is uncertain. Additionally, our workforce is comprised of a relatively small number of employees operating in different countries around the globe who support our existing and potential customers. Given the size and geographic dispersion of our workforce, we could experience challenges with execution as our business matures and expands.
Our future success also depends on our ability to identify, attract and retain highly skilled technical, managerial, finance, marketing and creative personnel. We face intense competition for qualified individuals from numerous technology, marketing and mobile entertainment companies. Further, we conduct international operations in Germany, Israel, India, South America, and Singapore, areas that, similar to our headquarters region, have high costs of living and consequently high compensation standards and/or intense demand for qualified individuals which may require us to incur significant costs to attract them. We may be unable to attract and retain suitably qualified individuals who are capable of meeting our growing creative, operational and managerial requirements, or may be required to pay increased compensation in order to do so. If we are unable to attract and retain the qualified personnel we need to succeed, our business would suffer.
Volatility or lack of performance in our stock price may also affect our ability to attract and retain our key employees. Some of our senior management personnel and other key employees have become, or will soon become, vested in a substantial amount of stock or stock options. Employees may be more likely to leave us if the shares they own or the shares underlying their options have significantly appreciated in value relative to the original purchase prices of the shares or the exercise prices of the options, or if the exercise prices of the options that they hold are significantly above the market price of our common stock. If we are unable to retain our employees, our business, operating results and financial condition would be harmed.
30
Growth may place significant demands on our management and our infrastructure.
We operate in an emerging market and have experienced, and may continue to experience, growth in our business through internal growth and acquisitions. This growth has placed, and may continue to place, significant demands on our management and our operational and financial infrastructure. Continued growth could strain our ability to:
|
•
|
develop and improve our operational, financial and management controls;
|
|
•
|
enhance our reporting systems and procedures;
|
|
•
|
recruit, train and retain highly skilled personnel;
|
|
•
|
maintain our quality standards; and
|
|
•
|
maintain branded content owner, wireless carrier and end-user satisfaction.
|
Managing our growth will require significant expenditures and allocation of valuable management resources. If we fail to achieve the necessary level of efficiency in our organization as it grows, our business, operating results and financial condition would be harmed.
The acquisition of other companies, businesses or technologies could result in operating difficulties, dilution and other harmful consequences.
We have made acquisitions and, although we have no present understandings, commitments or agreements to do so (except as otherwise disclosed within this document), we may pursue further acquisitions, any of which could be material to our business, operating results and financial condition. Future acquisitions could divert management’s time and focus from operating our business, even in instances where acquisition negotiations are unsuccessful. In addition, integrating an acquired company, business or technology is risky and may result in unforeseen operating difficulties and expenditures. We may also raise additional capital for the acquisition of, or investment in, companies, technologies, products or assets that complement our business. Future acquisitions or dispositions could result in potentially dilutive issuances of our equity securities, including our common stock, or the incurrence of debt, contingent liabilities, amortization expenses or acquired in-process research and development expenses, any of which could harm our financial condition and operating results. Future acquisitions may also require us to obtain additional financing, which may not be available on favorable terms or at all.
International acquisitions involve risks related to integration of operations across different cultures and languages, currency risks and the particular economic, political and regulatory risks associated with specific countries.
In addition, a significant portion of the purchase price of companies we acquire may be allocated to acquired goodwill and other intangible assets, which must be assessed for impairment at least annually. In the future, if our acquisitions do not yield expected returns, we may be required to take charges to our earnings based on this impairment assessment process, which could harm our operating results.
Changes to financial accounting standards could make it more expensive to issue stock options to employees, which would increase compensation costs and might cause us to change our business practices.
We prepare our financial statements to conform with accounting principles generally accepted in the United States. These accounting principles are subject to interpretation by the Financial Accounting Standards Board, or FASB, the Securities and Exchange Commission (“SEC” or the “Commission”) and various other bodies. A change in those principles could have a significant effect on our reported results and might affect our reporting of transactions completed before a change is announced. For example, we have used restricted stock and stock options grants as a fundamental component of our employee compensation packages. We believe that such grants directly motivate our employees to maximize long-term stockholder value and, through the use of vesting, encourage employees to remain in our employ. Several regulatory agencies and entities have made regulatory changes that could make it more difficult or expensive for us to grant stock options or restricted stock to employees. We may, as a result of these changes, incur increased compensation costs, change our equity compensation strategy or find it difficult to attract, retain and motivate employees, any of which could materially and adversely affect our business, operating results and financial condition.
31
Risks Related to the Economy in the United States and Globally
The effects of the past recession in the United States and general downturn in the global economy, including financial market disruptions, could have an adverse impact on our business, operating results or financial condition.
Our operating results also may be affected by uncertain or changing economic conditions such as the challenges that are currently affecting economic conditions in the United States and the global economy. If global economic and market conditions, or economic conditions in the United States or other key markets, remain uncertain or persist, spread, or deteriorate further, we may experience material impacts on our business, operating results, and financial condition in a number of ways including negatively affecting our profitability and causing our stock price to decline.
We face added business, political, regulatory, operational, financial and economic risks as a result of our international operations and distribution, any of which could increase our costs and hinder our growth.
We expect international sales to continue to be an important component of our revenues. Risks affecting our international operations include:
|
•
|
challenges caused by distance, language and cultural differences;
|
|
•
|
multiple and conflicting laws and regulations, including complications due to unexpected changes in these laws and regulations;
|
|
•
|
the burdens of complying with a wide variety of foreign laws and regulations;
|
|
•
|
higher costs associated with doing business internationally;
|
|
•
|
difficulties in staffing and managing international operations;
|
|
•
|
greater fluctuations in sales to end users and through carriers in developing countries, including longer payment cycles and greater difficulty collecting accounts receivable;
|
|
•
|
protectionist laws and business practices that favor local businesses in some countries;
|
|
•
|
foreign tax consequences;
|
|
•
|
foreign exchange controls that might prevent us from repatriating income earned in countries outside the United States;
|
|
•
|
price controls;
|
|
•
|
the servicing of regions by many different carriers;
|
|
•
|
imposition of public sector controls;
|
|
•
|
political, economic and social instability, including relating to the current European sovereign debt crisis;
|
|
•
|
restrictions on the export or import of technology;
|
|
•
|
trade and tariff restrictions;
|
|
•
|
variations in tariffs, quotas, taxes and other market barriers; and
|
|
•
|
difficulties in enforcing intellectual property rights in countries other than the United States.
|
In addition, developing user interfaces that are compatible with other languages or cultures can be expensive. As a result, our ongoing international expansion efforts may be more costly than we expect. Further, expansion into developing countries subjects us to the effects of regional instability, civil unrest and hostilities, and could adversely affect us by disrupting communications and making travel more difficult. These risks could harm our international expansion efforts, which, in turn, could materially and adversely affect our business, operating results and financial condition.
32
The Company is expanding and developing internationally, and our increasing foreign operations and exposure to fluctuations in foreign currency exchange rates may increase.
We have expanded, and we expect that we will continue to expand, our international operations. International operations inherently subject us to a number of risks and uncertainties, including:
|
•
|
changes in international regulatory and compliance requirements that could restrict our ability to develop, market and sell our products;
|
|
•
|
social, political or economic instability or recessions;
|
|
•
|
diminished protection of intellectual property in some countries outside of the United States;
|
|
•
|
difficulty in hiring, staffing and managing qualified and proficient local employees and advisors to run international operations;
|
|
•
|
the difficulty of managing and operating an international enterprise, including difficulties in maintaining effective communications with employees and customers due to distance, language and cultural barriers;
|
|
•
|
differing labor regulations and business practices;
|
|
•
|
higher operating costs due to local laws or regulations;
|
|
•
|
fluctuations in foreign economies and currency exchange rates;
|
|
•
|
difficulty in enforcing agreements; and
|
|
•
|
potentially negative consequences from changes in or interpretations of tax laws, post-acquisition.
|
Any of these factors may, individually or as a group, have a material adverse effect on our business and results of operations.
Risks Related to Potential Liability, our Intellectual Property and Content
If we do not adequately protect our intellectual property rights, it may be possible for third parties to obtain and improperly use our intellectual property and our competitive position may be adversely affected.
Our intellectual property is an essential element of our business. We rely on a combination of copyright, trademark, trade secret and other intellectual property laws and restrictions on disclosure to protect our intellectual property rights. To date, we have not obtained patent protection; however, applications have been submitted. Consequently, we may not be able to protect our technologies from independent invention by third parties.
We also seek to maintain certain intellectual property as trade secrets. The secrecy could be compromised by outside parties, or by our employees, which could cause us to lose the competitive advantage resulting from these trade secrets.
We also face risks associated with our trademarks. For example, there is a risk that our international trademark applications may be considered too generic or that the words “Digital” or “Turbine” could be separately or compositely trademarked by third parties with competitive products who may try and block our applications or sue us for trademark dilution which could have adverse effects on our financial status.
Despite our efforts to protect our intellectual property rights, unauthorized parties may attempt to copy or otherwise to obtain and use our intellectual property. Monitoring unauthorized use of our intellectual property is difficult and costly, and we cannot be certain that the steps we have taken will prevent infringement, piracy, and other unauthorized uses of our intellectual property, particularly internationally where the laws may not protect our intellectual property rights as fully as in the United States. In the future, we may have to resort to litigation to enforce our intellectual property rights, which could result in substantial costs and diversion of our management and resources.
In addition, although we require third parties to sign agreements not to disclose or improperly use our intellectual property, it may still be possible for third parties to obtain and improperly use our intellectual properties without our consent. This could harm our business, operating results and financial condition.
33
Third parties may sue us for intellectual property infringement, which, if successful, may disrupt our business and could require us to pay significant damage awards.
Third parties may sue us for intellectual property infringement or initiate proceedings to invalidate our intellectual property, either of which, if successful, could disrupt the conduct of our business, cause us to pay significant damage awards or require us to pay licensing fees. In the event of a successful claim against us, we might be enjoined from using our licensed intellectual property, we might incur significant licensing fees and we might be forced to develop alternative technologies. Our failure or inability to develop non-infringing technology or software or to license the infringed or similar technology or software on a timely basis could force us to withdraw products and services from the market or prevent us from introducing new products and services. In addition, even if we are able to license the infringed or similar technology or software, license fees could be substantial and the terms of these licenses could be burdensome, which might adversely affect our operating results. We might also incur substantial expenses in defending against third-party infringement claims, regardless of their merit. Successful infringement or licensing claims against us might result in substantial monetary liabilities and might materially disrupt the conduct of our business.
Litigation may harm our business.
Substantial, complex or extended litigation could cause us to incur significant costs and distract our management. For example, lawsuits by employees, stockholders, collaborators, distributors, customers, competitors, end-users or others could be very costly and substantially disrupt our business. Disputes from time to time with such companies, organizations or individuals are not uncommon, and we cannot assure you that we will always be able to resolve such disputes or on terms favorable to us. Unexpected results could cause us to have financial exposure in these matters in excess of recorded reserves and insurance coverage, requiring us to provide additional reserves to address these liabilities, therefore impacting profits. Carriers or other customers have and may try to include us as defendants in suits brought against them by their own customers or third parties. In such cases, the risks and expenses would be similar to those where we are the party directly involved in the litigation.
Indemnity provisions in various agreements potentially expose us to substantial liability for intellectual property infringement, damages caused by malicious software and other losses.
In the ordinary course of our business, most of our agreements with carriers and other distributors include indemnification provisions. In these provisions, we agree to indemnify them for losses suffered or incurred in connection with our products and services, including as a result of intellectual property infringement and damages caused by viruses, worms and other malicious software. The term of these indemnity provisions is generally perpetual after execution of the corresponding license agreement, and the maximum potential amount of future payments we could be required to make under these indemnification provisions is generally unlimited. Large future indemnity payments could harm our business, operating results and financial condition.
Our business in countries with a history of corruption and transactions with foreign governments, including with government owned or controlled wireless carriers, increase the risks associated with our international activities.
As we operate and sell internationally, we are subject to the U.S. Foreign Corrupt Practices Act, or the FCPA, and other laws that prohibit improper payments or offers of payments to foreign governments and their officials and political parties by the United States and other business entities for the purpose of obtaining or retaining business. We have operations, deal with carriers, and make sales in countries known to experience corruption, particularly certain emerging countries in Eastern Europe, Latin America, and Asia. Further international expansion may involve more of these countries. Our activities in these countries create the risk of unauthorized payments or offers of payments by one of our employees, consultants, sales agents or distributors that could be in violation of various laws including the FCPA, even though these parties are not always subject to our control. We have attempted to implement safeguards to discourage these practices by our employees, consultants, sales agents and distributors. However, our existing safeguards and any future improvements may prove to be less than effective, and our employees, consultants, sales agents or distributors may engage in conduct for which we might be held responsible. Violations of the FCPA may result in severe criminal or civil sanctions, and we may be subject to other liabilities, which could negatively affect our business, operating results and financial condition.
34
Government regulation of our marketing methods could restrict our ability to adequately advertise and promote our content, products and services available in certain jurisdictions.
The governments of some countries have sought to regulate the methods and manner in which certain of our products and services may be marketed to potential end-users. Regulation aimed at prohibiting, limiting or restricting various forms of advertising and promotion we use to market our products and services could also increase our cost of operations or preclude the ability to offer our products and services altogether. As a result, government regulation of our marketing efforts could have a material adverse effect on our business, financial condition or results of operations.
Risks Relating to Our Common Stock and Capital Structure
The Company has secured and unsecured indebtedness, which could limit its financial flexibility.
The Company’s incurrence of up to $5 million in secured indebtedness, and its $5.7 million in unsecured indebtedness could have significant negative consequences including:
|
•
|
increasing the Company’s vulnerability to general adverse economic and industry conditions;
|
|
•
|
limiting the Company’s ability to obtain additional financing;
|
|
•
|
violating a financial covenant, resulting in the indebtedness to be paid back immediately and thus negatively impacting our liquidity;
|
|
•
|
requiring additional financial covenant measurement consents or default waivers without enhanced financial performance in the short term;
|
|
•
|
requiring the use of a substantial portion of any cash flow from operations to service indebtedness, thereby reducing the amount of cash flow available for other purposes, including capital expenditures;
|
|
•
|
limiting the Company’s flexibility in planning for, or reacting to, changes in the Company’s business and the industry in which it competes, including by virtue of the requirement that the Company remain in compliance with certain negative operating covenants included in the credit arrangements under which the Company will be obligated as well as meeting certain reporting requirements; and
|
|
•
|
placing the Company at a possible competitive disadvantage to less leveraged competitors that are larger and may have better access to capital resources.
|
Our secured indebtedness contains current ratio and revenue financial covenants. There can be no assurance we will continue to satisfy these covenants. We may fail to satisfy the current ratio covenant due to increases in liabilities or decreases in current assets, which can occur despite our best efforts. Similarly, the revenue covenant can fail to be satisfied due to slowdowns in our business or failing to meet projections. See “Management’s Discussion and Analysis of Financial Condition and Results of Operations-Liquidity and Capital Resources-Recent Developments” for a description of these financial covenants. If we fail to satisfy these covenants, the lender may declare a default, which could lead to acceleration of the debt maturity. Further, acceleration could cause a cross default under our $5.7 million in unsecured notes (the "Notes) due 2020. Any such default or cross default would have a material adverse effect on the Company.
The secured indebtedness also contains a requirement that at all times two thirds of our Notes due 2020 remain subject subordination agreements. There is no assurance that this condition will always be satisfied due to potential sales, conversions or other events with respect to the Notes. If we failed to comply with his requirement the lender may declare a default, which could lead to acceleration and the other adverse consequences noted immediately above.
The collateral pledged to secured our secured debt, consisting of all of our and our subsidiaries’ assets, would be available to the secured creditor in a foreclosure, in addition to many other remedies. Accordingly, any adverse change in our ability to service our secured debt could result in an event of default, cross default and foreclosure or forced sale. Depending on the value of the assets, there could be little if any assets available for common stockholders or Noteholders in any foreclosure or forced sale.
To service our debt and fund our other capital requirements, we will require a significant amount of cash, and our ability to generate cash will depend on many factors beyond our control.
Our ability to meet our debt service obligations and to fund working capital, capital expenditures and investments in our business, will depend upon our future performance, which will be subject to financial, business and other factors affecting our operations, many of which are beyond our control. For example, this could include general and regional economic, financial, competitive, legislative, regulatory and other factors. We cannot ensure that we will generate cash flow
35
from operations, or that future borrowings will be available, in an amount sufficient to enable us to pay our debt or to fund our other liquidity needs.
If our cash flows and capital resources are insufficient to fund our debt service obligations, we could face substantial liquidity problems and could be forced to reduce or delay investments and capital expenditures or to dispose of material assets or operations, seek additional indebtedness or equity capital or restructure or refinance our indebtedness. We may not be able to effect any such alternative measures on commercially reasonable terms or at all and, even if successful, those alternative actions may not allow us to meet our scheduled debt service obligations.
The market price of our common stock is likely to be highly volatile and subject to wide fluctuations, and you may be unable to resell your shares at or above the current price.
The market price of our common stock is likely to be highly volatile and could be subject to wide fluctuations in response to a number of factors that are beyond our control, including announcements of new products or services by our competitors. In addition, the market price of our common stock could be subject to wide fluctuations in response to a variety of factors, including:
|
•
|
quarterly variations in our revenues and operating expenses;
|
|
•
|
developments in the financial markets, and the worldwide or regional economies;
|
|
•
|
announcements of innovations or new products or services by us or our competitors;
|
|
•
|
significant sales of our common stock or other securities in the open market; and
|
|
•
|
changes in accounting principles.
|
In the past, stockholders have often instituted securities class action litigation after periods of volatility in the market price of a company’s securities. If a stockholder were to file any such class action suit against us, we would incur substantial legal fees and our management’s attention and resources would be diverted from operating our business to respond to the litigation, which could harm our business.
If we fail to comply with the continued listing requirements of the NASDAQ Capital Market, our common stock may be delisted and the price of our common stock and our ability to access the capital markets could be negatively impacted.
Our common stock is listed for trading on the NASDAQ Capital Market (“NADSAQ”). On
June 1, 2018
, the last reported sale price for our common stock on the NASDAQ Capital Market was
$1.81
per share and the closing price of our common stock has traded in a range from a low of
$0.88
per share to a high of
$2.51
per share during fiscal
2018
. We must continue to satisfy NASDAQ’s continued listing requirements, including, among other things, a minimum closing bid price requirement of $1.00 per share for 30 consecutive business days. If a company trades for 30 consecutive business days below the $1.00 minimum closing bid price requirement, NASDAQ will send a deficiency notice to the company, advising that it has been afforded a “compliance period” of 180 calendar days to regain compliance with the applicable requirements. Thereafter, if such a company does not regain compliance with the bid price requirement, a second 180-day compliance period may be available.
A delisting of our common stock from NADSAQ could materially reduce the liquidity of our common stock and result in a corresponding material reduction in the price of our common stock. In addition, delisting could harm our ability to raise capital through alternative financing sources on terms acceptable to us, or at all, and may result in the potential loss of confidence by investors, employees and fewer business development opportunities.
The sale of securities by us in any equity or debt financing, or the issuance of new shares related to an acquisition, could result in dilution to our existing stockholders and have a material adverse effect on our earnings.
Any sale or issuance of common stock by us in a future offering or acquisition could result in dilution to the existing stockholders as a direct result of our issuance of additional shares of our capital stock. In addition, our business strategy may include expansion through internal growth by acquiring complimentary businesses, acquiring or licensing additional brands, or establishing strategic relationships with targeted customers and suppliers. In order to do so, or to finance the cost of our other activities, we may issue additional equity securities that could dilute our stockholders’ stock ownership. We may also assume additional debt and incur impairment losses related to goodwill and other tangible assets if we acquire another company, and this could negatively impact our earnings and results of operations.
36
We may choose to raise additional capital to accelerate the growth of our business, and we may not be able to raise capital to grow our business on terms acceptable to us or at all.
Should we choose to pursue alternatives to accelerate the growth or enhance our existing business, we may require significant cash outlays and commitments. If our cash, cash equivalents and short-term investments balances and any cash generated from operations are not sufficient to meet our cash requirements, we may seek additional capital, potentially through debt or equity financings, to fund our growth. We may not be able to raise needed cash on terms acceptable to us or at all. Financings, if available, may be on terms that are dilutive or potentially dilutive to our stockholders, and the prices at which new investors would be willing to purchase our securities may be lower than the fair market value of our common stock. The holders of new securities may also receive rights, preferences or privileges that are senior to those of existing holders of our common stock.
37
Our GAAP operating results could fluctuate substantially due to the accounting for the early conversion, anti-dilution and other features of the Notes.
The Notes are accounted for under Accounting Standards Codification 815, Derivatives and Hedging (or ASC 815) as an embedded derivative. For instance, the early conversion payment feature of the Notes is accounted for under ASC 815 as an embedded derivative. ASC 815 requires companies to bifurcate conversion options from their host instruments and account for them as free standing derivative financial instruments according to certain criteria. The fair value of the derivative is remeasured to fair value at each balance sheet date, with a resulting non-cash gain or loss related to the change in the fair value of the derivative being charged to earnings (loss). We have recorded this embedded derivative liability as a non-current liability on our consolidated balance sheet with a corresponding debt discount at the date of issuance that is netted against the principal amount of the Notes. The derivative liability is remeasured to fair value at each balance sheet date, with a resulting non-cash gain or loss related to the change in the fair value of the derivative liability being recorded in other income and loss. There is no current observable market for this type of derivative and, as such, we determine the fair value of the embedded derivative using the binomial lattice model. The valuation model uses the stock price, conversion price, maturity date, risk-free interest rate, estimated stock volatility and estimated credit spread. Changes in the inputs for these valuation models may have a significant impact on the estimated fair value of the embedded derivative liabilities. For example, an increase in the Company’s stock price results in an increase in the estimated fair value of the embedded derivative liabilities. The embedded derivative liability may have, on a GAAP basis, a substantial effect on our consolidated financial results from quarter to quarter and it is difficult to predict the effect on our future GAAP financial results, since valuation of these embedded derivative liabilities are based on factors largely outside of our control and may have a negative impact on our earnings and balance sheet.
We also have a material derivative liability recorded on our consolidated balance sheet as a result of the anti-dilution and other embedded derivative features in the warrants and Notes. Under applicable accounting rules, we are required to “mark to market” this liability each reporting period and record changes in the fair value associated with this liability in our consolidated statement of operations. As such, when our stock price increases, the fair value of this liability would increase, and we recognize an expense associated with this change in fair value. Similarly, when our stock price decreases, the fair value of this liability decreases, and we recognize a gain associated with this change in fair value. As such, though there is no cash flow impact to us caused by the volatility of our stock price, applicable accounting rules have a direct impact on our reported profit or loss as per GAAP.
We have not finalized the impact on our ability to use the treasury method to calculate diluted earnings per share as a result of the conversion option and warrant transactions. Our ability to use the treasury method may differ before and after shareholder approval of the issuance of the maximum shares in this offering, assuming such approval is granted. We cannot be sure that the accounting standards will permit the use of the treasury stock method. If we are unable to use the treasury stock method in accounting for the shares issuable upon conversion of the Notes, then our diluted earnings per share would be adversely affected.
The Notes are unsecured, are effectively subordinated to all of our current and future secured indebtedness and are structurally subordinated to all liabilities of our subsidiaries (other than the guarantors), including trade credit.
The Notes are unsecured, are effectively subordinated to all of our current and future secured indebtedness (although we are not permitted to incur any additional secured or unsecured indebtedness subject to limited exceptions) and are structurally subordinated to all indebtedness and liabilities of our subsidiaries (other than the guarantors), including trade payables. The Notes rank equally with all our future general unsecured and unsubordinated obligations, and senior to all our future subordinated debt. As noted, above, over two thirds of our Notes holders are subject to subordination agreements in favor of our senior secured lender. In the event of our bankruptcy, liquidation, reorganization or other winding up, although we are not permitted to incur any secured or unsecured indebtedness subject to limited exceptions (such as the consent to incur $5 million of secured debt we received, as noted above), our assets that secure debt ranking senior in right of payment to the Notes will be available to pay obligations on the Notes only after the secured debt has been repaid in full from these assets, and subject to the guarantees discussed below, the assets of our subsidiaries will be available to pay obligations on the Notes only after all claims senior to the Notes which includes all liabilities of such subsidiary, including trade payables have been repaid in full. There may not be sufficient assets remaining to pay amounts due on any or all of the Notes then outstanding.
38
The Notes do not contain restrictive financial covenants, other than debt incurrence and restrictions on payments, and we may take actions which may affect our ability to satisfy our obligations under the Notes.
The indenture governing the Notes does not contain any financial or operating covenants (other than restrictions on our incurrence of certain other indebtedness (including secured debt) and restrictions on certain payments) by us or any of our subsidiaries. In addition, the limited covenants applicable to the Notes do not require us to achieve or maintain any minimum financial results relating to our financial position or results of operations.
Our ability to recapitalize and take a number of other actions that are not limited by the terms of the Notes could have the effect of diminishing our ability to make payments on the Notes when due, including interest payments, payments of principal and payments due upon the election of a holder to require us to purchase Notes upon the occurrence of a fundamental change, and require us to dedicate a substantial portion of our cash flow from operations to payments on our indebtedness, which would reduce the availability of cash flow to fund our operations, working capital and capital expenditures.
Recent regulatory actions may adversely affect the trading price and liquidity of the Notes and of the warrants and our common stock.
We expect that many investors in, and potential purchasers of, the Notes and warrants will employ, or seek to employ, a convertible arbitrage strategy with respect to the Notes and warrants. Investors would typically implement such a strategy by selling short the common stock underlying the Notes and warrants and dynamically adjusting their short position while continuing to hold the Notes and warrants. Investors may also implement this type of strategy by entering into swaps on our common stock in lieu of or in addition to short selling the common stock. As a result, any specific rules regulating equity swaps or short selling of securities or other governmental action that interferes with the ability of market participants to effect short sales or equity swaps with respect to our common stock could adversely affect the ability of investors in, or potential purchasers of, the Notes and warrants to conduct the convertible arbitrage strategy with respect to the Notes and warrants.
The SEC and other regulatory and self-regulatory authorities have implemented various rules and taken certain actions, and may in the future adopt additional rules and take other actions, that may impact those engaging in short selling activity involving equity securities (including our common stock). Such rules and actions include Rule 201 of SEC Regulation SHO, the adoption by the Financial Industry Regulatory Authority, Inc. and the national securities exchanges of a “Limit Up-Limit Down” program, the imposition of market-wide circuit breakers that halt trading of securities for certain periods following specific market declines, and the implementation of certain regulatory reforms required by the Dodd-Frank Wall Street Reform and Consumer Protection Act of 2010. Any governmental or regulatory action that restricts the ability of investors in, or potential purchasers of, the Notes and warrants to effect short sales of our common stock, borrow our common stock or enter into swaps on our common stock could adversely affect the trading price and the liquidity of the Notes and warrants.
The adjustment to the conversion rate for Notes converted in connection with a make-whole fundamental change (including a redemption) may not adequately compensate the investor for any lost value of the investors' Notes as a result of such transaction.
If a make-whole fundamental change (as defined herein) occurs prior to maturity, under certain circumstances, we will increase the conversion rate by a number of additional shares of our common stock for Notes converted in connection with such make-whole fundamental change. The increase in the conversion rate will be determined based on the date on which the specified corporate transaction becomes effective and the price paid (or deemed paid) per share of our common stock in such transaction, as described in the indenture for the Notes. The adjustment to the conversion rate for Notes converted in connection with a make-whole fundamental change may not adequately compensate the investor for any lost value of the investors' Notes as a result of such transaction. In addition, if the price paid (or deemed paid) per share of our common stock in the transaction is greater than $1.25 per share of our common stock or less than $20 per share of our common stock (in each case, subject to adjustment), no adjustment will be made to the conversion rate. In addition, the investor will not be entitled to an Early Conversion Payment for any conversion on or after the effective time of a make-whole fundamental change.
Our obligation to increase the conversion rate upon the occurrence of a make-whole fundamental change could be considered a penalty, in which case the enforceability thereof would be subject to general principles of reasonableness of economic remedies.
39
Our GAAP operating results could fluctuate substantially due to the accounting for the early conversion payment features of the Notes.
Holders who convert their Notes prior to the September 23, 2019 receive an Early Conversion Payment. The Early Conversion Payment feature of the Notes is expected to be accounted for under Accounting Standards Codification 815, Derivatives and Hedging (“ASC 815”) as an embedded derivative.
ASC 815 requires companies to bifurcate conversion options from their host instruments and account for them as free standing derivative financial instruments according to certain criteria. The fair value of the derivative is remeasured to fair value at each balance sheet date, with a resulting non-cash gain or loss related to the change in the fair value of the derivative being charged to earnings (loss). We have tentatively determined that we must bifurcate and account for the Early Conversion Payment feature of the Notes as an embedded derivative in accordance with ASC 815. We tentatively will record this embedded derivative liability as a non-current liability on our consolidated balance sheet with a corresponding debt discount at the date of issuance that is netted against the principal amount of the Notes. The derivative liability is expected to be remeasured to fair value at each balance sheet date, with a resulting non-cash gain or loss related to the change in the fair value of the derivative liability being recorded in other income and loss. We expect we will estimate the fair value of these liabilities using a Monte Carlo simulation model.
We cannot predict the effect that the accounting for the Notes will have on our future GAAP financial results, the trading of our common stock and the trading price of the Notes, which could be material.
The conversion rate of the Notes and/or exercise price for the warrants may not be adjusted for all dilutive events.
The conversion rate of the Notes and the exercise price for the warrants are each subject to separate adjustments for certain events, including, but not limited to, the issuance of shares of our common stock without consideration or at a price per share less than the applicable conversion rate, subject to certain exceptions, the issuance of stock dividends on our common stock, the issuance of certain rights, options, or warrants, subdivisions, combinations, distributions of capital stock, evidences of indebtedness, assets or property, cash dividends and certain issuer tender offers or exchange offers as described in the indenture for the Notes. However, the conversion rate and exercise price, as applicable, will not be adjusted for all possible events, such as a third-party tender offer or exchange offer, that may adversely affect the trading price of the Notes or the market price of our common stock. An event that adversely affects the value of the Notes may occur, and that event may not result in an adjustment to the conversion rate.
Some significant restructuring transactions may not constitute a fundamental change, in which case we would not be obligated to purchase the Notes at the option of the holder.
Upon the occurrence of a fundamental change, subject to certain conditions, the investor will have the right, at the investors' option, to require us to purchase for cash all or any portion of the investors' Notes with a principal amount equal to $1,000 or an integral multiple of $1,000 in excess thereof. However, the fundamental change provisions will not afford protection to holders of Notes in the event of other transactions that do not constitute a fundamental change but that could nevertheless adversely affect the Notes. For example, transactions such as leveraged recapitalizations (subject to the limitations in the indenture to incur new debt), refinancings, restructurings or acquisitions initiated by us may not constitute a fundamental change requiring us to purchase the Notes. In the event of any such transaction, holders would not have the right to require us to purchase their Notes, even though each of these transactions could increase the amount of our indebtedness or otherwise adversely affect our capital structure or any credit ratings, thereby adversely affecting holders of the Notes.
We may not have the ability to raise the funds necessary to repurchase the Notes when required.
Holders of the Notes will have the right to require us to repurchase the Notes upon the occurrence of a fundamental change at 120% of their principal amount, plus accrued and unpaid interest (including additional interest), if any, as described in the indenture for the Notes. However, we may not have enough available cash or be able to obtain financing at the time we are required to make repurchases of the Notes surrendered therefor. Our failure to repurchase surrendered Notes at a time when the repurchase is required by the indenture would constitute a default under the indenture. A default under the indenture or the fundamental change itself could also lead to a default under the agreements governing other indebtedness. If the repayment of the related indebtedness were to be accelerated after any applicable notice or grace periods, we may not have sufficient funds to repay the indebtedness and repurchase the Notes.
40
We did not and do not intend to seek a rating on the Notes.
We do not intend to seek a rating on the Notes. However, if a rating service were to rate the Notes and if such rating service were to lower its rating on the Notes below the rating initially assigned to the Notes or otherwise announce its intention to put the Notes on credit watch, the trading price of the Notes could decline.
There is no public market for the Notes or for the warrants, which could limit their respective trading price or the investors' ability to sell them.
The Notes and warrants are new issues of securities for which there currently is no respective trading market. As a result, a market may not develop for the Notes or for the warrants and the investor may not be able to sell its Notes and warrants. Any Notes and warrants that are traded after their initial issuance may trade at a discount from their initial offering price. Future trading prices of the Notes and of the warrants will depend on many factors, including prevailing interest rates, the market for similar securities, general economic conditions and our financial condition, performance and prospects. Accordingly, the investor may be required to bear the financial risk of an investment in the Notes and warrants for an indefinite period of time. We do not intend to apply for listing or quotation of the Notes or the warrants on any securities exchange or automated quotation system. While the initial purchaser may make a market in the Notes and in the warrants, they are not required to do so and, consequently, any market making with respect to the Notes and warrants may be discontinued at any time without notice. Even if the initial purchaser makes a market in the Notes and in the warrants, the liquidity of such markets may be limited.
Conversion of the Notes and exercise of the warrants will dilute the ownership interest of existing stockholders, including holders who had previously converted their Notes, or may otherwise depress the market price of our common stock.
The conversion of some or all of the Notes and the exercise of some or all of the warrants will dilute the ownership interests of existing stockholders. Any sales in the public market of the shares of our common stock issuable upon such conversion or such exercise could adversely affect prevailing market prices of our common stock. In addition, the existence of the Notes and warrants may encourage short selling by market participants because the anticipated conversion of the Notes or upon exercise of the warrants into shares of our common stock could depress the market price of our common stock.
U.S. holders will recognize income for U.S. federal income tax purposes significantly in excess of interest payments on the Notes, and gains, if any, recognized on a disposition of Notes will generally be taxed as ordinary income.
For U.S. federal income tax purposes, we treat the Notes as contingent payment debt obligations under the contingent payment debt regulations and the rest of this discussion so assumes. Accordingly, all payments on the Notes, including stated interest, are taken into account under the contingent payment debt regulations and actual cash payments of interest on the Notes will not be reported separately as taxable income. As discussed more fully below, the effect of the contingent payment debt regulations will be to require a holder, regardless of such holder’s usual method of tax accounting, to use the accrual method with respect to the Notes. There is some uncertainty as to the proper application of the Treasury Regulations governing contingent payment debt instruments and, if the treatment described herein were to be successfully challenged by the Internal Revenue Service (IRS) (the “IRS”), it might be determined that, among other things, the investor should have accrued interest income at a lower or higher rate, or should have recognized capital gain or loss, rather than ordinary income or loss, upon the conversion or taxable disposition of the Notes.
41
The investor may be subject to tax if we make or fail to make certain adjustments to the conversion rate of the Notes, even though the investor will not receive a corresponding cash distribution.
The conversion rate of the Notes is subject to adjustment in certain circumstances, including the payment of cash dividends. If the conversion rate is adjusted as a result of a distribution that is taxable to our common stockholders, such as a cash dividend, the investor may be deemed to have received a dividend subject to U.S. federal income tax without the receipt of any cash. In addition, a failure to adjust (or to adjust adequately) the conversion rate after an event that increases the investors' proportionate interest in us could be treated as a deemed taxable dividend to the investor. If a make-whole fundamental change occurs on or prior to the maturity date of the Notes, under some circumstances, we will increase the conversion rate for Notes converted in connection with the make-whole fundamental change. Such increase also may be treated as a dividends subject to U.S. federal income tax. If the investor is a non-U.S. holder, such a deemed dividend may be subject to U.S. federal withholding tax at a 30% rate, or such lower rate as may be specified by an applicable treaty, or to backup withholding, both of which may be set off against subsequent payments of cash and common stock payable on the Notes.
Holders of Notes and warrants will not be entitled to any rights with respect to our common stock, but will be subject to all changes made with respect to our common stock.
Holders of Notes and warrants will not be entitled to any rights with respect to our common stock (including, without limitation, voting rights and rights to receive any dividends or other distributions on our common stock), but holders of Notes and warrants will be subject to all changes affecting our common stock. For example, if an amendment is proposed to our amended and restated certificate of incorporation requiring stockholder approval and the record date for determining the stockholders of record entitled to vote on the amendment occurs prior to the relevant conversion date, such holder will not be entitled to vote on the amendment, although such holder will nevertheless be subject to any changes in the powers, preferences or special rights of our common stock.
Volatility in the market price and trading volume of our common stock could adversely impact the trading price of the Notes and of the warrants.
The stock market in recent years has experienced significant price and volume fluctuations that have often been unrelated to the operating performance of companies. The market price of our common stock could fluctuate significantly for many reasons, including in response to the risks described in this section or for reasons unrelated to our operations, such as reports by industry analysts, investor perceptions or negative announcements by our customers, competitors or suppliers regarding their own performance, as well as industry conditions and general financial, economic and political instability. A decrease in the market price of our common stock would likely adversely impact the trading price of the Notes and of the warrants. The market price of our common stock could also be affected by possible sales of our common stock by investors who view the Notes and warrants as a more attractive means of equity participation in us and by hedging or arbitrage trading activity that we expect to develop involving our common stock. This trading activity could, in turn, affect the respective trading prices of the Notes and warrants.
Future sales of our common stock in the public market could lower the market price for our common stock and adversely impact the trading price of the Notes and of the warrants.
In the future, we may sell additional shares of our common stock or securities convertible into our common stock to raise capital. In addition, a substantial number of shares of our common stock is reserved for issuance upon the exercise of stock options, the vesting of restricted stock units and restricted stock pursuant to our employee benefit plans, for purchase by employees under our employee stock purchase plan, and upon conversion of the Notes offered hereby and in relation to the convertible note hedge and warrant transactions we expect to enter into in connection with the pricing of the Notes. We cannot predict the size of future issuances or the effect, if any, that they may have on the market price for our common stock. The issuance and sale of substantial amounts of common stock, or the perception that such issuances and sales may occur, could adversely affect the trading price of the Notes and of the warrants, and the market price of our common stock and impair our ability to raise capital through the sale of additional equity securities.
42
Federal and state statutes allow courts, under specific circumstances, to void the guarantees. In such event, holders of the Notes could be structurally subordinated to creditors of the guarantor.
Federal and state statutes allow courts, under specific circumstances, to void guarantees, subordinate claims under the guarantee to the guarantor’s other debt or take other action detrimental to holders of the guarantee of Notes. Under the federal bankruptcy law and comparable provisions of state fraudulent transfer laws, the guarantees made by the Digital Turbine’s subsidiaries could be voided or subordinated to other debt for a variety of reasons. To the extent that a subsidiary guarantee were to be voided as a fraudulent conveyance or was held to be unenforceable for any other reason, holders of the Notes would cease to have any claim in respect of such guarantor.
We could lose access to our NOLs as a result of the conversion of the Notes and exercises of the warrants.
We have significant net operating losses which could be lost or impaired if delivery of shares upon conversion or exercise of Notes or warrants causes an “ownership change” under Section 382 of the Internal Revenue Code.
Provisions in the indenture for the Notes and/or warrant agreement for the warrants may deter or prevent a business combination that may be favorable to the investor.
If a fundamental change occurs prior to the maturity date of the Notes, holders of the Notes will have the right, at their option, to require us to repurchase all or a portion of their Notes. In addition, if a make-whole fundamental change occurs prior to the maturity date of the Notes, we will in some cases be required to increase the conversion rate for a holder that elects to convert its Notes in connection with such fundamental change. Furthermore, the indenture for the Notes prohibits us from engaging in certain mergers or acquisitions unless, among other things, the surviving entity assumes our obligations under the Notes. These and other provisions in the indenture with respect to the Notes and in the warrant agreement with respect to the warrants could deter or prevent a third party from acquiring us even when the acquisition may be favorable to the investor.
If securities or industry analysts do not publish research or reports about our business, or if they downgrade their recommendations regarding our common stock, our stock price and trading volume could decline.
The trading market for our common stock will be influenced by the research and reports that industry or securities analysts publish about our business or us. If any of the analysts who cover us downgrade our common stock, our common stock price would likely decline. If analysts cease coverage of our Company or fail to regularly publish reports on us, we could lose visibility in the financial markets, which in turn could cause our common stock price or trading volume to decline.
We do not anticipate paying dividends.
Our secured and unsecured indebtedness essentially prevents all payments of dividends to our stockholders. Even if such dividends were permitted by the applicable lenders, we have never paid cash or other dividends on our common stock. Payment of dividends on our common stock is within the discretion of our Board of Directors and will depend upon our earnings, our capital requirements and financial condition, and other factors deemed relevant by our Board of Directors. However, the earliest our Board of Directors would likely consider a dividend is if we begin to generate excess cash flow.
The SEC has sent us a letter regarding an informal inquiry requesting information and documents, and a subsequent “Wells Notice,” generally related to the Company’s internal controls over financial reporting and disclosure controls and procedures.
As previously disclosed, in 2016 the Company received an informal inquiry from the staff of the Securities and Exchange Commission’s Division of Enforcement requesting the voluntary provision of documents and information generally related to the Company’s internal controls over financial reporting and disclosure controls and procedures. On April 17, 2018, the Company received a “Wells Notice,” stating that the staff of the SEC has made a preliminary determination to recommend to the SEC that it file an enforcement action against the Company alleging violations of Sections 13(a) and 13(b)(2)(B) of the Securities and Exchange Act of 1934 and Rules 13a-1, 13a-13 and 13a-15 thereunder. Although the Company seeks to resolve this matter by settlement, there is no assurance that a settlement will be reached or as to terms and conditions. Please see the section of this filing entitled “Item 9A--Controls and Procedures” regarding the Company’s remediation efforts and results to date regarding the material weaknesses that previously rendered its internal controls ineffective. The Company believes that the resolution of this matter is unlikely to have a material impact on its operations or financial position.
43
If we fail to maintain an effective system of internal controls, we might not be able to report our financial results accurately or prevent fraud; in that case, our stockholders could lose confidence in our financial reporting, which could negatively impact the price of our stock.
Effective internal controls are necessary for us to provide reliable financial reports and prevent fraud. In addition, Section 404 of the Sarbanes-Oxley Act of 2002, or the Sarbanes-Oxley Act, requires us to evaluate and report on our internal control over financial reporting. Although our management concluded that our internal control over financial reporting were effective as of March 31, 2018, our internal controls for prior periods were previously deemed ineffective ; refer to Item 9A of our Annual Report on Form 10-K/A for the year ended March 31, 2017, for more information about management’s assessment of internal controls. During fiscal 2018 and prior periods, we devoted considerable effort to strengthen and test our internal controls. The process of implementing our internal controls and complying with Section 404 is expensive and time consuming and requires significant attention of management. We cannot be certain that these measures will continue to ensure that we implement and maintain adequate controls over our financial processes and reporting in the future. Even if we are able to conclude that our internal control over financial reporting provides reasonable assurance regarding the reliability of financial reporting and the preparation of financial statements for external purposes in accordance with generally accepted accounting principles, because of its inherent limitations, internal control over financial reporting may not prevent or detect fraud or misstatements. Failure to implement required new or improved controls, or difficulties encountered in their implementation, could harm our operating results or cause us to fail to meet our reporting obligations. If we discover additional material weaknesses or significant deficiencies in our internal controls, the disclosure of that fact, even if quickly remedied, could reduce the market’s confidence in our financial statements and harm our stock price. In addition, if we fail to comply with the applicable portions of Section 404, we could be subject to a variety of civil and administrative sanctions and penalties, including ineligibility for short form resale registration, action by the SEC, and the inability of registered broker-dealers to make a market in our common stock, which could further reduce our stock price and harm our business. Refer to Item 9A of our Annual Report on Form 10-K for the year ended March 31, 2018, for more information about management’s assessment of internal controls.
Maintaining and improving our financial controls and the requirements of being a public company may strain our resources, divert management’s attention and affect our ability to attract and retain qualified members for our Board of Directors.
As a public company, we are subject to the reporting requirements of the Exchange Act and the Sarbanes-Oxley Act. Additionally, the time and effort required to maintain communications with shareholders and the public markets can be demanding on senior management, which can divert focus from operational and strategic efforts. The requirements of the public markets and the related regulatory requirements has resulted in an increase in our legal, accounting and financial compliance costs, may make some activities more difficult, time-consuming and costly and may place undue strain on our personnel, systems and resources.
The Sarbanes-Oxley Act requires, among other things, that we maintain effective disclosure controls and procedures and internal control over financial reporting. This can be difficult to do. For example, we depend on the reports of wireless carriers for information regarding the amount of sales of our products and services and to determine the amount of royalties we owe branded content licensors and the amount of our revenues. These reports may not be timely, and in the past they have contained, and in the future they may contain, errors.
In order to maintain and improve the effectiveness of our disclosure controls and procedures and internal control over financial reporting, we expend significant resources and provide significant management oversight. We have a substantial effort ahead of us to implement appropriate processes, document our system of internal control over relevant processes, assess their design, remediate any deficiencies identified and test their operation. As a result, management’s attention may be diverted from other business concerns, which could harm our business, operating results and financial condition. These efforts will also involve substantial accounting-related costs.
The Sarbanes-Oxley Act makes it more difficult and more expensive for us to maintain directors’ and officers’ liability insurance, and we may be required in the future to accept reduced coverage or incur substantially higher costs to maintain coverage. If we are unable to maintain adequate directors’ and officers’ insurance, our ability to recruit and retain qualified directors, and officers will be significantly curtailed.
|
ITEM 1B.
|
UNRESOLVED STAFF COMMENTS
|
None.
44
|
ITEM 2.
|
PROPERTIES
|
The principal offices of Digital Turbine, Inc. are located at 111 Nueces Street, Austin, Texas 78701. Digital Turbine also leases property in Durham, North Carolina through its wholly-owned subsidiary, DT Media; San Fransisco, California; and internationally in Israel; Sydney, Australia; and Singapore through its wholly-owned subsidiaries DT EMEA, DT APAC, and DT Singapore, respectively.
|
ITEM 3.
|
LEGAL PROCEEDINGS
|
The information required by this Item 3 is incorporated herein by reference to the information set forth under the caption “Legal Matters” in Note 19 of the Notes to the Consolidated Financial Statements.
|
ITEM 4.
|
MINE SAFETY DISCLOSURE
|
Not applicable.
|
ITEM 5.
|
MARKET FOR REGISTRANT’S COMMON EQUITY, RELATED STOCKHOLDER MATTERS AND ISSUER PURCHASES OF EQUITY SECURITIES
|
Market Information
As of
June 1, 2018
, the closing price of our common stock was
$1.81
. Our common stock is traded on the NASDAQ Capital Market under the symbol “APPS.” The following table sets forth the range of high and low closing sales prices reported on the NASDAQ Capital Market for our common stock for the following periods:
|
|
High
|
Low
|
||||||
|
Fiscal Year Ended March 31, 2018
|
|
|
||||||
|
First quarter
|
$
|
1.25
|
|
$
|
0.88
|
|
||
|
Second quarter
|
$
|
1.51
|
|
$
|
0.99
|
|
||
|
Third quarter
|
$
|
1.86
|
|
$
|
1.41
|
|
||
|
Fourth quarter
|
$
|
1.79
|
|
$
|
2.51
|
|
||
|
Fiscal Year Ended March 31, 2017
|
|
|
||||||
|
First quarter
|
$
|
1.15
|
|
$
|
0.75
|
|
||
|
Second quarter
|
$
|
1.47
|
|
$
|
0.97
|
|
||
|
Third quarter
|
$
|
1.08
|
|
$
|
0.59
|
|
||
|
Fourth quarter
|
$
|
0.96
|
|
$
|
0.66
|
|
||
Holders
As of
June 1, 2018
, there were 10,207 holders of record of our common stock. There were also an undetermined number of holders who hold their stock in nominee or “street” name.
Dividends
We have not declared cash dividends on our common stock since our inception and we do not anticipate paying any cash dividends in the foreseeable future. Further, any such dividends would be substantially restricted by our secured and unsecured indebtedness.
45
Adoption of Amended and Restated 2011 Equity Incentive Plan of Digital Turbine, Inc.
On May 26, 2011, our board of directors adopted the 2011 Equity Incentive Plan of Digital Turbine, Inc. and on April 27, 2012, our board of directors amended and restated the plan and the related plan documents and directed that they be submitted to our stockholders for their consideration and approval. On May 23, 2012, our stockholders approved and adopted by written consent the Amended and Restated 2011 Equity Incentive Plan of Digital Turbine, Inc. (the “2011 Plan”), the Digital Turbine, Inc. Amended and Restated 2011 Equity Incentive Plan Notice of Grant and Restricted Stock Agreement and the Digital Turbine, Inc. Amended and Restated 2011 Equity Incentive Plan Notice of Grant and Stock Option Agreement (collectively, the “Related Documents”).
The 2011 Plan provides for grants of stock options, stock appreciation rights (“SARs”), restricted stock and restricted stock units (sometimes referred to individually or collectively as “Awards”) to our and our subsidiaries’ officers, employees, non-employee directors and consultants. Stock options may be either “incentive stock options” (“ISOs”), as defined in Section 422 of the Internal Revenue Code of 1986, as amended (the “Code”), or non-qualified stock options (“NQSOs”). On September 10, 2012, the Company increased the 2011 Plan shares available for issuance from 4,000,000 to 20,000,000, of which
9,135,513
remain available for issuance as of
March 31, 2018
.
Equity Compensation Plan Information
The following table sets forth information concerning our 2007 Employee, Director and Consultant Stock Plan, our Amended and Restated 2011 Equity Incentive Plan, our Appia, Inc. 2008 Stock Incentive Plan and individual compensation arrangements with employees or consultants of the Company as of
March 31, 2018
.
|
Plan Category
|
Number of securities to be issued upon exercise of outstanding options, warrants, and rights (a)
|
Weighted average exercise price of outstanding options, warrants, and rights
|
Number of securities remaining available for future issuance under equity compensation plans (excluding securities
reflected in column (a))
|
|||||||
|
Equity compensation plan approved by security holders
|
|
|
|
|||||||
|
Amended and Restated 2011 Equity Incentive Plan
|
9,373,133
|
|
$
|
2.10
|
|
9,135,513
|
|
|||
|
2007 Employee, Director and Consultant Stock Plan
|
260,000
|
|
$
|
13.75
|
|
—
|
|
|||
|
Appia, Inc. 2008 Stock Incentive Plan
|
108,836
|
|
$
|
0.65
|
|
—
|
|
|||
|
Equity compensation plan not approved by security holders
|
—
|
|
—
|
|
—
|
|
||||
|
Total
|
9,741,969
|
|
9,135,513
|
|
||||||
Recent Sale of Unregistered Securities
None.
Purchases of Equity Securities by the Issuer and Affiliated Purchaser
There were no purchases of equity securities by us during the year ended
March 31, 2018
.
Performance Graph
This performance graph shall not be deemed ‘‘soliciting material’’ or to be ‘‘filed’’ with the SEC for purposes of Section 18 of the Securities Exchange Act of 1934, as amended, or otherwise subject to the liabilities under Section 18, and shall not be deemed to be incorporated by reference into any filing of ours under the Securities Act of 1933, as amended.
The graph set forth below compares the cumulative total stockholder return on an initial investment of $100 in our common stock between March 31,
2013
and March 31,
2018
, with the comparative cumulative total return of such amount on (i) the NASDAQ Composite Index (IXIC), and (ii) the Russell 2000 Index (RUT) over the same period. We have not paid any cash dividends and, therefore, the cumulative total return calculation for us is based solely upon stock price appreciation (depreciation) and not upon reinvestment of cash dividends. The comparisons shown in the graph below are based upon historical data. We caution that the stock price performance shown in the graph below is not necessarily indicative of, nor is it intended to forecast, the potential future performance of our common stock.
46
COMPARISON OF CUMULATIVE TOTAL RETURN
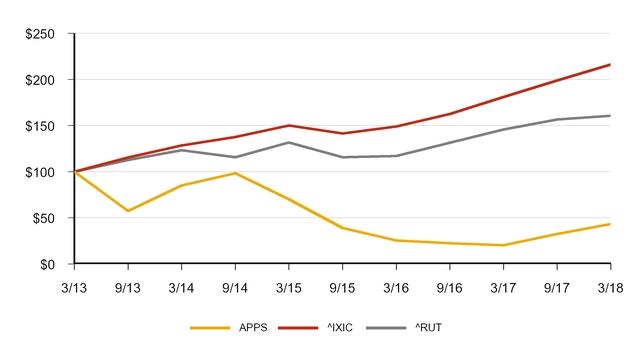
|
ITEM 6.
|
SELECTED FINANCIAL DATA
|
The following Selected Financial Data has been revised to reflect discontinued operations (see “Discontinued Operations” in Note 3 to the consolidated financial statements in Item 8 of this report).
The following selected consolidated financial data should be read in conjunction with Part II, Item 7, "Management's Discussion and Analysis of Financial Condition and Results of Operation," and our consolidated financial statements and the related notes included in Part II, Item 8, "Financial Statements and Supplementary Data," of this Annual Report on Form 10-K.
The consolidated statements of operations data for each of the three years ended
March 31, 2018
,
2017
, and
2016
and the consolidated balance sheet data as of
March 31, 2018
and
2017
are derived from and qualified by reference to our audited consolidated financial statements included in Part II, Item 8, "Financial Statements and Supplementary Data," of this Annual Report on Form 10-K. The consolidated statements of operations data for the two years ended
March 31,
2015
and
2014
and the consolidated balance sheet data as of
March 31, 2016
,
2015
, and
2014
are derived from our audited financial statements not included elsewhere in this Annual Report on Form 10-K. Our historical results are not necessarily indicative of our results in any future period.
For further information see Part I, Item 1, "Business" under the heading "History of Digital Turbine, Inc." of this Annual Report on Form 10-K.
47
|
|
Year ended March 31,
|
|||||||||||||||||||
|
2018
|
2017
|
2016
|
2015
|
2014
|
||||||||||||||||
|
(in thousands, except per share amounts)
|
||||||||||||||||||||
|
Results of Operations
|
||||||||||||||||||||
|
Net revenues
|
$
|
74,751
|
|
$
|
40,207
|
|
$
|
22,251
|
|
$
|
3,371
|
|
$
|
769
|
|
|||||
|
Loss from operations
|
(5,809
|
)
|
(16,971
|
)
|
(22,534
|
)
|
(16,556
|
)
|
(13,403
|
)
|
||||||||||
|
Net loss from operations, net of taxes
|
(19,697
|
)
|
(19,138
|
)
|
(24,492
|
)
|
(16,173
|
)
|
(15,788
|
)
|
||||||||||
|
Basic and diluted net loss per common share from continuing operations
|
$
|
(0.28
|
)
|
$
|
(0.29
|
)
|
$
|
(0.40
|
)
|
$
|
(0.41
|
)
|
$
|
(0.57
|
)
|
|||||
|
Weighted-average common shares outstanding from continuing operations, basic and diluted
|
70,263
|
|
66,511
|
|
61,763
|
|
38,967
|
|
27,478
|
|
||||||||||
|
Balance Sheet Data
|
||||||||||||||||||||
|
Cash
|
$
|
12,720
|
|
$
|
6,149
|
|
$
|
11,231
|
|
$
|
7,069
|
|
$
|
21,805
|
|
|||||
|
Working capital
(1)
|
(2,678
|
)
|
1,353
|
|
(4,531
|
)
|
(3,924
|
)
|
17,666
|
|
||||||||||
|
Total assets
(2)
|
$
|
86,607
|
|
$
|
107,580
|
|
$
|
121,940
|
|
$
|
122,571
|
|
$
|
45,095
|
|
|||||
|
Long-term obligations
|
12,529
|
|
14,676
|
|
815
|
|
7,090
|
|
238
|
|
||||||||||
|
Total stockholders' equity
|
$
|
27,672
|
|
$
|
62,045
|
|
$
|
82,271
|
|
$
|
91,529
|
|
$
|
32,951
|
|
|||||
(1)
Working capital number excludes assets and liabilities held for disposal on the balance sheet
(2)
Total assets include assets classified as held for disposal on the balance sheet as they were still owned by the Company at the balance sheet date.
|
ITEM 7.
|
MANAGEMENT’S DISCUSSION AND ANALYSIS OF FINANCIAL CONDITION AND RESULTS OF OPERATIONS
|
The following discussion should be read in conjunction with, and is qualified in its entirety by, the Financial Statements and the notes thereto included in this Report. This discussion contains certain forward-looking statements that involve substantial risks and uncertainties, and is subject to, and claims the protection of, the disclaimer regarding forward-looking contained immediately before Item 1, which disclaimer is incorporated herein by reference. When used in this Annual Report on Form 10-K, the words “anticipate,” “believe,” “estimate,” “expect,” “would,” “could,” “may,” and similar expressions, as they relate to our management or us, are intended to identify such forward-looking statements. Our actual results, performance or achievements could differ materially from those expressed in, or implied by, these forward-looking statements as a result of a variety of factors including those set forth under “Risk Factors” set forth under Item IA and elsewhere in this filing. Historical operating results are not necessarily indicative of the trends in operating results for any future period.
This Management’s Discussion and Analysis of Financial Condition and Results of Operations (“MD&A”) is intended to provide investors with an understanding of our recent performance, financial condition and prospects and should be read in conjunction with the consolidated financial statements contained in Item 8, “Financial Statements and Supplementary Data” in this annual report on Form 10-K. The following will be discussed and analyzed:
|
•
|
Company Overview
|
|
•
|
Disposition of the Content Reportable Segment and A&P Business
|
|
•
|
Discontinued Operations
|
|
•
|
Results of Operations
|
|
•
|
Liquidity and Capital Resources
|
|
•
|
Critical Accounting Policies
|
|
•
|
Recently Issued Accounting Pronouncements
|
|
•
|
Recent Developments
|
All numbers are in thousands, except share and per share amounts.
48
Company Overview
Digital Turbine, through its subsidiaries, innovates at the convergence of media and mobile communications, delivering end-to-end products and solutions for mobile operators, application advertisers, device original equipment manufacturers ("OEMs"), and other third parties to enable them to effectively monetize mobile content and generate higher value user acquisition. The Company operates its business in two reportable segments – Advertising and Content.
The Company's Advertising business is comprised of one businesses:
|
•
|
Operator and OEM ("O&O"), an advertiser solution for unique and exclusive carrier and OEM inventory which is comprised of services including:
|
|
◦
|
Ignite™ ("Ignite"), a mobile device management platform with targeted application distribution capabilities, and
|
|
◦
|
Other products and professional services directly related to the Ignite platform.
|
O&O Business
Ignite is a mobile application management software that enables mobile operators and original equipment manufacturers ("OEMs") to control, manage, and monetize applications installed at the time of activation and over the life of a mobile device. Ignite allows mobile operators to personalize the application activation experience for customers and monetize their home screens via Cost-Per-Install or CPI arrangements, Cost-Per-Placement or CPP arrangements, and/or Cost-Per-Action or CPA arrangements with third party advertisers. There are several different delivery methods available to operators and OEMs on first boot of the device: Wizard, Silent, Software Development Kit ("SDK"), or Direct through Discover. Optional notification features are available throughout the life-cycle of the device, providing operators additional opportunity for advertising revenue streams. The Company has launched Ignite with mobile operators and OEMs in North America, Latin America, Europe, Asia Pacific, India and Israel.
Disposition of the Content Reportable Segment and A&P Business
On April 29, 2018, the Company entered into two distinct disposition agreements with respect to selected assets owned by our subsidiaries.
DT APAC and DT Singapore (together, “Pay Seller”), each wholly owned subsidiaries of the Company, entered into an Asset Purchase Pay Agreement (the “Pay Agreement”), dated as of April 23, 2018, with Chargewave Ptd Ltd (“Pay Purchaser”) to sell certain assets (the “Pay Assets”) owned by the Pay Seller related to the Company’s Direct Carrier Billing business. The Pay Purchaser is principally owned and controlled by Jon Mooney, an officer of the Pay Seller. At the closing of the asset sale, Mr. Mooney will no longer be employed by the Company or Pay Seller. As consideration for this asset sale, Digital Turbine is entitled to receive certain license fees, profit sharing and equity participation rights as outlined in the Company’s Form 8-K filed May 1, 2018 with the Securities and Exchange Commission. The transaction is subject to closing conditions and is expected to be completed in June 2018. With the sale of these assets, the Company has determined that is will exit the segment of the business previously referred to as the Content business.
DT Media (the “A&P Seller”), a wholly owned subsidiary of the Company, entered into an Asset Purchase Agreement (the “A&P Agreement”), dated as of April 28, 2018, with Creative Clicks B.V. (the “A&P Purchaser”) to sell business relationships with various advertisers and publishers (the “A&P Assets”) related to the Company’s Advertising and Publishing business. As consideration for this asset sale, we are entitled to receive a percentage of the gross profit derived from these customer agreements for a period of three years as outlined in the Company’s Form 8-K filed May 1, 2018 with the Securities and Exchange Commission. The transaction is subject to closing conditions and is expected to be completed in June 2018. With the sale of these assets, the Company has determined that is will exit the segment of the business previously referred to as the A&P business.
These dispositions will allow the Company to benefit from a streamlined business model, simplified operating structure, and enhanced management focus. Additionally, the Company expects to be able to generate additional cash via the announced transactions that can be re-invested into key O&O growth initiatives.
Discontinued Operations
As a result of the dispositions, the results of operations from our Content reporting segment and A&P business within the Advertising reporting segment are reported as “Net loss from discontinued operations, net of taxes” and the related assets and liabilities are classified as “held for disposal" in the consolidated financial statements in Item 8 of this report. The Company has recast prior period amounts presented within this report to provide visibility and comparability. All discussion herein, unless otherwise noted, refers to our remaining operating segment after the dispositions, the O&O business.
49
All discussions in this Item 7 – Management’s Discussion and Analysis of Financial Condition and Results of Operations relate to continuing operations.
RESULTS OF OPERATIONS
Below are our revenues, cost of revenues, and expenses for fiscal
2018
,
2017
, and
2016
. This information should be read in conjunction with our Consolidated Financial Statements and notes thereto.
|
|
Years Ended March 31,
|
Years Ended March 31,
|
||||||||||||||||||||
|
2018
|
2017
|
% of
Change
|
2017
|
2016
|
% of
Change
|
|||||||||||||||||
|
(in thousands, except per share amounts)
|
|
(in thousands, except per share amounts)
|
|
|||||||||||||||||||
|
Net revenues
|
$
|
74,751
|
|
$
|
40,207
|
|
85.9
|
%
|
$
|
40,207
|
|
$
|
22,251
|
|
80.7
|
%
|
||||||
|
License fees and revenue share
|
47,967
|
|
26,374
|
|
81.9
|
%
|
26,374
|
|
13,314
|
|
98.1
|
%
|
||||||||||
|
Other direct cost of revenues
|
1,729
|
|
2,575
|
|
(32.9
|
)%
|
2,575
|
|
7,477
|
|
(65.6
|
)%
|
||||||||||
|
Gross profit
|
25,055
|
|
11,258
|
|
122.6
|
%
|
11,258
|
|
1,460
|
|
671.1
|
%
|
||||||||||
|
Total operating expenses
|
30,864
|
|
28,229
|
|
9.3
|
%
|
28,229
|
|
23,994
|
|
17.7
|
%
|
||||||||||
|
Loss from operations
|
(5,809
|
)
|
(16,971
|
)
|
(65.8
|
)%
|
(16,971
|
)
|
(22,534
|
)
|
(24.7
|
)%
|
||||||||||
|
Interest expense, net
|
(2,067
|
)
|
(2,625
|
)
|
(21.3
|
)%
|
(2,625
|
)
|
(1,716
|
)
|
53.0
|
%
|
||||||||||
|
Foreign exchange transaction loss
|
(148
|
)
|
(26
|
)
|
469.2
|
%
|
(26
|
)
|
(24
|
)
|
8.3
|
%
|
||||||||||
|
Change in fair value of convertible note embedded derivative liability
|
(7,559
|
)
|
475
|
|
(1,691.4
|
)%
|
475
|
|
—
|
|
100.0
|
%
|
||||||||||
|
Change in fair value of warrant liability
|
(3,208
|
)
|
147
|
|
(2,282.3
|
)%
|
147
|
|
—
|
|
100.0
|
%
|
||||||||||
|
Loss on extinguishment of debt
|
(1,785
|
)
|
(293
|
)
|
509.2
|
%
|
(293
|
)
|
—
|
|
(100.0
|
)%
|
||||||||||
|
Other income / (expense)
|
(72
|
)
|
11
|
|
(754.5
|
)%
|
11
|
|
(4
|
)
|
(375.0
|
)%
|
||||||||||
|
Loss from operations before income taxes
|
(20,648
|
)
|
(19,282
|
)
|
7.1
|
%
|
(19,282
|
)
|
(24,278
|
)
|
(20.6
|
)%
|
||||||||||
|
Income tax provision / (benefit)
|
(951
|
)
|
(144
|
)
|
560.4
|
%
|
(144
|
)
|
214
|
|
(167.3
|
)%
|
||||||||||
|
Net loss from operations, net of taxes
|
$
|
(19,697
|
)
|
$
|
(19,138
|
)
|
2.9
|
%
|
$
|
(19,138
|
)
|
$
|
(24,492
|
)
|
(21.9
|
)%
|
||||||
|
Basic and diluted net loss per common share, from continuing operations
|
$
|
(0.28
|
)
|
$
|
(0.29
|
)
|
(3.4
|
)%
|
$
|
(0.29
|
)
|
$
|
(0.40
|
)
|
(27.5
|
)%
|
||||||
|
Weighted-average common shares outstanding, basic and diluted
|
70,263
|
|
66,511
|
|
5.6
|
%
|
66,511
|
|
61,763
|
|
7.7
|
%
|
||||||||||
50
Net Revenues
Fiscal
2018
Compared to Fiscal
2017
During the year ended
March 31, 2018
, revenues increased
$34,544
or
85.9%
, compared to the prior year's period. Growth stemmed from significant growth driven by increased CPI and CPP revenue from Advertising partners across existing carrier distribution partners as well as expansion with multiple new carrier distribution partners, and the deployment of new Ignite services and products.
Fiscal
2017
Compared to Fiscal
2016
During the year ended
March 31, 2017
, revenues increased
$17,956
or
80.7%
, compared to the prior year's period primarily due to the Company experiencing organic growth in Ignite revenue. Growth in revenue was driven primarily by CPI and CPP revenue from new Advertising partners across two major US carrier distribution partners, and amounts earned from carrier partners related to software customization and integration.
Gross Margins
|
Years ended March 31,
|
Years ended March 31,
|
|||||||||||||||||||||
|
2018
|
2017
|
% of Change
|
2017
|
2016
|
% of Change
|
|||||||||||||||||
|
(in thousands)
|
(in thousands)
|
|||||||||||||||||||||
|
Gross margin $
|
$
|
25,055
|
|
$
|
11,258
|
|
122.6
|
%
|
$
|
11,258
|
|
$
|
1,460
|
|
671.1
|
%
|
||||||
|
Gross margin %
|
33.5
|
%
|
28.0
|
%
|
28.0
|
%
|
6.6
|
%
|
||||||||||||||
Fiscal
2018
Compared to Fiscal
2017
Total gross margin, inclusive of the impact of other direct cost of revenues (amortization of intangibles) was
$25,055
or
33.5%
for the year ended
March 31, 2018
versus
$11,258
or
28.0%
for the year ended
March 31, 2017
. The year ended
March 31, 2017
includes the impact of a $757 impairment charge taken for certain intangible assets related to the IP purchased in the XYO acquisition. Increase is primarily attributable to an increase in Carrier and Advertiser demand in the O&O business. Overall gross margin percentage increased as growth was coupled with higher gross margin O&O revenue contracts with new and existing partners, coupled with lower amortization of intangibles.
Fiscal
2017
Compared to Fiscal
2016
Total gross margin, inclusive of the impact of other direct cost of revenues (amortization of intangibles) was
$11,258
or
28.0%
for the year ended
March 31, 2017
, versus approximately
$1,460
or
6.6%
for the year ended
March 31, 2016
.
increase is due primarily to continued scaling of the Ignite platform across new and existing partners.
Operating Expenses
|
Years ended March 31,
|
Years ended March 31,
|
|||||||||||||||||||||
|
2018
|
2017
|
% of Change
|
2017
|
2016
|
% of Change
|
|||||||||||||||||
|
(in thousands)
|
|
(in thousands)
|
|
|||||||||||||||||||
|
Product development
|
$
|
9,653
|
|
$
|
9,283
|
|
4.0
|
%
|
$
|
9,283
|
|
$
|
4,883
|
|
90.1
|
%
|
||||||
|
Sales and marketing
|
6,087
|
|
4,180
|
|
45.6
|
%
|
4,180
|
|
2,908
|
|
43.7
|
%
|
||||||||||
|
General and administrative
|
15,124
|
|
14,766
|
|
2.4
|
%
|
14,766
|
|
16,203
|
|
(8.9
|
)%
|
||||||||||
|
Total operating expenses
|
$
|
30,864
|
|
$
|
28,229
|
|
9.3
|
%
|
$
|
28,229
|
|
$
|
23,994
|
|
17.7
|
%
|
||||||
Product development expenses include the development and maintenance of the Company's product suite. Expenses in this area are primarily a function of personnel.
Sales and marketing expenses represent the costs of sales and marketing personnel, advertising and marketing campaigns, and campaign management.
51
General and administrative expenses represent management, finance, and support personnel costs in both the parent and subsidiary companies, which include professional and consulting costs, in addition to other costs such as rent, stock-based compensation, and depreciation expense.
Fiscal
2018
Compared to Fiscal
2017
Total operating expenses for the year ended
March 31, 2018
and
March 31, 2017
were approximately
$30,864
and
$28,229
, respectively, representing a year over year increase of approximately
$2,635
or
9.3%
. This is a result of continued Company wide cost control measures and shows the Company's ability to scale revenue at a greater rate than operating expense.
Product development expenses for the year ended
March 31, 2018
and
March 31, 2017
remained flat at
$9,653
and
$9,283
, respectively, representing a year over year increase of approximately
$370
or
4.0%
. The cost of product development over both periods represents the Company's investment in the offices in Tel Aviv, Israel and Durham, North Carolina through developer headcount in those regions, and hosting expenses associated with development activity.
Sales and marketing expenses for the year ended
March 31, 2018
and
March 31, 2017
were approximately
$6,087
and
$4,180
, respectively, representing a year over year increase of approximately
$1,907
or
45.6%
. The increase in sales and marketing expenses over the comparative periods is primarily attributable to increased commissions associated with the sales team generating more revenue through new and existing partner relationships.
General and administrative expenses for the year ended
March 31, 2018
and
March 31, 2017
remained largely flat at
$15,124
and
$14,766
, respectively, an increase of approximately
$358
or
2.4%
. General and administrative expense is primarily attributable to accounting and professional consulting expenses, stock option expense related to stock option grants issued to employees, office related expenses, administrative employee payroll expense, and other payroll related expenses.
Fiscal
2017
Compared to Fiscal
2016
Total operating expenses for the year ended
March 31, 2017
and
March 31, 2016
were
$28,229
and
$23,994
, respectively, an increase of
$4,235
or
17.7%
.
Product development expenses for the year ended
March 31, 2017
and
March 31, 2016
were
$9,283
and
$4,883
, respectively, an increase of
$4,400
or
90.1%
. The increase in product development expenses year-over-year was primarily attributable to the Company's increased investment in the offices in Tel Aviv, Israel and Durham, North Carolina through additional headcount being added in those regions, as well as from increased hosting expenses driven by the growth in the business.
Sales and marketing expenses for the year ended
March 31, 2017
and
March 31, 2016
were
$4,180
and
$2,908
, respectively, an increase of
$1,272
or
43.7%
. The increase in sales and marketing expenses over the comparative periods is primarily attributable to increased commissions associated with the sales team generating more revenue through new and existing partner relationships.
General and administrative expenses for the year ended
March 31, 2017
and
March 31, 2016
were
$14,766
and
$16,203
, respectively, a decrease of
$1,437
or
8.9%
. The decrease in general and administrative is primarily attributable to lower accounting and professional consulting expenses, and reduced stock option expense over the comparative periods due to stock option grants issued over the comparative periods being issued at lower fair values, which has the impact of lower expense being recorded, and due to stock option forfeitures/cancellations over the comparative periods for older higher value options for which expense is no longer being recorded and which has the impact of further reducing stock option expense.
52
Other Income and Expenses
|
Years ended March 31,
|
Years ended March 31,
|
|||||||||||||||||||||
|
2018
|
2017
|
% of Change
|
2017
|
2016
|
% of Change
|
|||||||||||||||||
|
(in thousands)
|
|
(in thousands)
|
|
|||||||||||||||||||
|
Interest expense, net
|
$
|
(2,067
|
)
|
$
|
(2,625
|
)
|
(21.3
|
)%
|
$
|
(2,625
|
)
|
$
|
(1,716
|
)
|
53.0
|
%
|
||||||
|
Foreign exchange transaction loss
|
(148
|
)
|
(26
|
)
|
469.2
|
%
|
(26
|
)
|
(24
|
)
|
8.3
|
%
|
||||||||||
|
Change in fair value of convertible note embedded derivative liability
|
(7,559
|
)
|
475
|
|
(1,691.4
|
)%
|
475
|
|
—
|
|
(100.0
|
)%
|
||||||||||
|
Change in fair value of warrant liability
|
(3,208
|
)
|
147
|
|
(2,282.3
|
)%
|
147
|
|
—
|
|
(100.0
|
)%
|
||||||||||
|
Loss on extinguishment of debt
|
(1,785
|
)
|
(293
|
)
|
509.2
|
%
|
(293
|
)
|
—
|
|
100.0
|
%
|
||||||||||
|
Loss on disposal of fixed assets
|
—
|
|
—
|
|
—
|
%
|
—
|
|
—
|
|
#DIV/0!
|
|
||||||||||
|
Other income / (expense)
|
(72
|
)
|
11
|
|
(754.5
|
)%
|
11
|
|
(4
|
)
|
(375.0
|
)%
|
||||||||||
|
Total interest and other expense, net
|
$
|
(14,839
|
)
|
$
|
(2,311
|
)
|
542.1
|
%
|
$
|
(2,311
|
)
|
$
|
(1,744
|
)
|
32.5
|
%
|
||||||
Fiscal
2018
Compared to Fiscal
2017
Total interest and other expense, net, for the year ended
March 31, 2018
and
March 31, 2017
were
$14,839
and
$2,311
, respectively, an increase in net expenses of
$12,528
or
542.1%
. This change in total interest and other income / (expense), net, was primarily attributable to the change in fair value of convertible note embedded derivative liability, and the change in fair value of warrant liability, and loss on extinguishment of debt. The change in fair value of embedded derivative and warrant liabilities is due to the change in the Company's stock price from
$0.94
at
March 31, 2017
to
$2.01
at
March 31, 2018
partially offset by the settling of
$10,300
of the underlying debt instruments which resulted in the loss on extinguishment of
$1,785
.
Fiscal
2017
Compared to Fiscal
2016
Total interest and other expense, net, for the year ended March 31, 2017 and March 31, 2016 were
$2,311
and
$1,744
, respectively, an increase in net expenses of
$567
or
32.5%
. This change in total interest and other income / (expense), net, was primarily attributable to interest expense, net, the change in fair value of convertible note embedded derivative liability, and the change in fair value of warrant liability. The increase in interest expense is primarily due to changes in the structure of our debt including the issuance of the Notes and the extinguishment of secured indebtedness held in prior year, see Interest Expense, Net below. The change in fair value of embedded derivative and warrant liabilities is due to the change in the Company's stock price from
$0.99
upon initial measurement to
$0.94
at year end. Interest and other income / (expense), net, includes net interest expense, foreign exchange transaction loss, change in fair value of convertible note embedded derivative liability, change in fair value of warrant liability, loss on extinguishment of debt, loss on disposal of fixed assets, and other ancillary income / (expense) earned or incurred by the Company.
Interest Expense, Net
Interest expense is generated from the the
$16,000
aggregate principal amount of 8.75% Convertible Notes due 2020 (the “Notes”), issued on September 28, 2016, and from our business finance agreement (the “Credit Agreement”) with Western Alliance Bank (the “Bank”). The Credit Agreement provides for a
$5,000
total facility. Interest income consists of interest income earned on our cash. This increase in interest expense, net, was primarily attributable to 1) fees related to the obtainment of debt (recorded as debt issuance costs and expensed as a component of interest expense over the life of the debt); 2) interest expense incurred on the Notes at a stated interest rate of 8.75%, and interest expense incurred on the Credit Agreement at approximately 5.25% (Wall Street Journal Prime Rate +
1.25%
); and 3) amortization of debt discount related to the Notes which are expensed as a component of interest expense over the life of the debt. Inclusive of the Notes issued on September 28, 2016 and the Credit Agreement entered into on May 23, 2017 during the current fiscal year, and the Notes and the SVB and NAC subordinated debentures which were retired in full on September 28, 2016 during the prior fiscal years, the Company recorded
$2,067
,
$2,625
, and
$1,716
of aggregate interest expense, inclusive of debt discount and debt issuance cost amortization during the years ended
March 31, 2018
,
2017
, and
2016
, respectively.
53
Loss From Change in Fair Value of Convertible Note Embedded Derivative Liability
The Company accounts for the convertible note embedded derivative liability issued in accordance with US GAAP accounting guidance under ASC 815 applicable to derivative instruments, which requires every derivative instrument within its scope to be recorded on the balance sheet as either an asset or liability measured at its fair value, with changes in fair value recognized in earnings.
Due to the valuation of the derivative liability being highly sensitive to the trading price of the Company's stock, the increase and decrease in the trading price of the Company's stock has the impact of increasing the (loss) and gain, respectively. During the year ended
March 31, 2018
, the Company recorded a loss from change in fair value of convertible note embedded derivative liability of
$7,559
due to the increase of the Company's stock price from
$0.94
at
March 31, 2017
to
$2.01
at
March 31, 2018
partially offset by the settling of
$10,300
of the underlying debt instruments which resulted in the loss on extinguishment of
$1,785
.
During the year ended
March 31, 2017
, the Company recorded a gain from change in fair value of convertible note embedded derivative liability of
$475
due to the decrease in the Company's closing stock price during the period from September 28, 2016 to
March 31, 2017
from
$0.99
to
$0.94
. No gain or loss from change in fair value of convertible note embedded derivative liability was recorded during the years ended March 31, 2016 due to the transaction giving rise to these liabilities closed on September 28, 2016.
Loss From Change in Fair Value of Warrant Liability
The Company accounts for the warrants issued in connection with the above-noted sale of Notes in accordance with US GAAP accounting guidance under ASC 815 applicable to derivative instruments, which requires every derivative instrument within its scope to be recorded on the balance sheet as either an asset or liability measured at its fair value, with changes in fair value recognized in earnings. Based on this guidance, the Company determined that these warrants did not meet the criteria for classification as equity. Accordingly, the Company classified the warrants as long-term liabilities. The warrants are subject to re-measurement at each balance sheet date, with any change in fair value recognized as a component of other income (expense), net in the statements of operations.
Due to the valuation of the derivative liability being highly sensitive to the trading price of the Company's stock, the increase and decrease in the trading price of the Company's stock has the impact of increasing the (loss) and gain, respectively. During the year ended
March 31, 2018
, the Company recorded a loss from change in fair value of warrant liability of
$3,208
due to the increase of the Company's stock price from
$0.94
at
March 31, 2017
to
$2.01
at
March 31, 2018
.
During the year ended
March 31, 2017
, the Company recorded a gain from change in fair value of warrant liability of
$147
due to the decrease in the Company's closing stock price during the period from September 28, 2016 to
March 31, 2018
from
$0.99
to
$0.94
. No gain or loss from change in fair value of warrant liability was recorded during the years ended March 31, 2016 due to the transaction giving rise to these liabilities closed on September 28, 2016.
During the year ended
March 31, 2018
, connected with the settlement of a portion of the Notes, the Company recorded a loss on extinguishment of
$1,785
which represents the difference between the carrying value of the settled debt (including underlying derivative instruments) and the consideration given to settle the debt, in this case primarily stock. During the year ended
March 31, 2017
, as part of the payoff of the NAC and SVB debt on September 28, 2016, the Company fully expensed the remainder of the debt discount associated with the NAC debt and debt issuance costs associated with both the SVB and NAC debt to loss on extinguishment of debt of
$293
.
54
Revenue by Service Categories
The following table summarizes our net revenues by service categories for each of the past three fiscal years. The amount or percentage of total revenue contributed by class of services has been presented for those classes accounting for 10% or more of total net revenue in any of the three latest years, with all other amounts individually representing less than 10% of total net revenue included in the Other category.
|
Year Ended March 31,
|
Year Ended March 31,
|
Year Ended March 31,
|
|||||||||||||||||||||||||
|
2018
|
2017
|
2016
|
|||||||||||||||||||||||||
|
Dollars
|
% of Net Revenues
|
%
Change
|
Dollars
|
% of Net Revenues
|
%
Change
|
Dollars
|
% of Net Revenues
|
||||||||||||||||||||
|
Net revenues
|
(in thousands)
|
(in thousands)
|
(in thousands)
|
||||||||||||||||||||||||
|
Ignite
|
74,123
|
|
99
|
%
|
88.9
|
%
|
39,235
|
|
98
|
%
|
81.8
|
%
|
21,577
|
|
97
|
%
|
|||||||||||
|
Other
|
628
|
|
1
|
%
|
(35.4
|
)%
|
972
|
|
2
|
%
|
44.2
|
%
|
674
|
|
3
|
%
|
|||||||||||
|
Total net revenues
|
$
|
74,751
|
|
100.0
|
%
|
85.9
|
%
|
$
|
40,207
|
|
100.0
|
%
|
80.7
|
%
|
$
|
22,251
|
|
100.0
|
%
|
||||||||
Fiscal
2018
Compared to Fiscal
2017
The Company's O&O business is an advertiser solution for unique and exclusive carrier and OEM inventory. During the year ended
March 31, 2018
, the main revenue driver for the O&O business was the Ignite service. Ignite is a mobile application management software that enables mobile operators and OEMs to control, manage, and monetize applications installed at the time of activation and over the life of a mobile device. During the years ended
March 31, 2018
, and
2017
there was a
$34,888
or
88.9%
increase in year over year Ignite net revenues. This increase in Ignite net revenue was attributable to increased demand for the Ignite service, driven primarily by increased CPI and CPP revenue from advertising partners across existing commercial deployments of Ignite with carrier partners as well as expanded distribution with new carrier partners.
Fiscal
2017
Compared to Fiscal
2016
During the year ended
March 31, 2017
, the main revenue driver for the O&O business was the Ignite service. During the year ended
March 31, 2017
, there was an increase in year over year Ignite net revenues of
$17,658
or
81.8%
. This increase in Ignite net revenue was attributable to increased demand for the Ignite service, driven primarily by increased CPI and CPP revenue from advertising partners across existing commercial deployments of Ignite with carrier partners as well as expanded distribution with new carrier partners.
55
Liquidity and Capital Resources
Selected Financial Information
|
Years ended March 31,
|
||||||||
|
2018
|
2017
|
|||||||
|
(in thousands)
|
||||||||
|
Cash
|
$
|
12,720
|
|
$
|
6,149
|
|
||
|
Restricted cash
|
331
|
|
331
|
|
||||
|
Short-term debt
|
||||||||
|
Short-term debt, net of debt issuance costs of $205 and $0, respectively
|
1,445
|
|
—
|
|
||||
|
Total short-term debt
|
1,445
|
|
—
|
|
||||
|
Long-term debt
|
||||||||
|
Convertible notes, net of debt issuance costs and discounts of $1,827 and $6,315, respectively
|
3,873
|
|
9,685
|
|
||||
|
Total long-term debt
|
3,873
|
|
9,685
|
|
||||
|
Working capital
|
||||||||
|
Current assets
|
31,002
|
|
17,712
|
|
||||
|
Current liabilities
|
33,680
|
|
16,359
|
|
||||
|
Working capital
|
$
|
(2,678
|
)
|
$
|
1,353
|
|
||
Working Capital
Cash and restricted cash totaled approximately
$13,051
and approximately
$6,480
at
March 31, 2018
and
March 31, 2017
, respectively, an increase of approximately
$6,571
or
101.4%
. Current assets totaled approximately
$39,755
and approximately
$23,665
at
March 31, 2018
and
March 31, 2017
, respectively, an increase of approximately
$16,090
or
68.0%
. As of
March 31, 2018
and
March 31, 2017
, the Company had approximately
$17,050
and
$10,663
, respectively, in accounts receivable, an increase of
$6,387
or
59.9%
. As of
March 31, 2018
and
March 31, 2017
the Company's working capital (deficit) was
$(2,678)
and
$1,353
, respectively, a decrease of
$4,031
or
297.9%
. The decrease in working capital was primarily attributable to an increase in accounts payable and other current accrued liabilities of
$15,876
, offset by an increase in accounts receivable of
$6,387
, an increase in cash of
$6,571
.
Our primary sources of liquidity have historically been issuances of common and preferred stock and debt. As of
March 31, 2018
, we had cash totaling approximately
$12,720
.
On September 28, 2016, the Company sold to an investment bank as initial purchaser, $16,000 principal amount of Notes for net cash proceeds of $14,316, after deducting the initial purchaser's discounts and commissions and the estimated offering expenses payable by the Company. The net proceeds from the issuance of the Notes were used to repay $11,000 of secured indebtedness, consisting of approximately $3,000 to SVB and $8,000 to NAC, retiring both such debts in their entirety, and will otherwise be used for general corporate purposes and working capital (refer to Note 9 "Debt" for more details).
56
On May 23, 2017, the Company entered into a Business Finance Agreement (the "Credit Agreement") with Western Alliance Bank (the "Bank"). The Credit Agreement provides for a
$5,000
total facility. The amounts advanced under the Credit Agreement mature in two years and accrue interest at prime plus 1.25% subject to a 4.00% floor, with the prime rate defined as the prime rate published in the Wall Street Journal. The Credit Facility also carries an annual facility fee of
$45.5
, and an early termination fee of 0.5% if terminated during the first year. The obligations under the Credit Agreement are secured by a perfected first position security interest in all assets of the Company and its subsidiaries, subject to partial pledges of stock of non-US subsidiaries. In addition to customary covenants, including restrictions on payments and restrictions on indebtedness, the Credit Agreement requires the Company to comply with certain financial covenants as described in Note 9 - Debt.
With the proceeds resulting from the issuance of the Notes and the entrance into the Credit Agreement, the Company believes that it has sufficient cash and capital resources to operate its business for at least twelve months from the issuance date of this annual report on Form 10-K.
Cash Flow Summary
|
Year ended March 31,
|
Year ended March 31,
|
|||||||||||||||||
|
2018
|
2017
|
% of Change
|
2017
|
2016
|
% of Change
|
|||||||||||||
|
(in thousands)
|
|
(in thousands)
|
|
|||||||||||||||
|
Consolidated Statement of Cash Flows Data:
|
|
|
|
|||||||||||||||
|
Net cash provided by / (used in) operating activities - continuing operations
|
7,290
|
|
(11,589
|
)
|
(162.9
|
)%
|
(11,589
|
)
|
(11,571
|
)
|
0.2
|
%
|
||||||
|
Capital expenditures
|
(1,992
|
)
|
(1,418
|
)
|
40.5
|
%
|
(1,418
|
)
|
(1,549
|
)
|
(8.5
|
)%
|
||||||
|
Proceeds from sale of cost method investment in Sift
|
—
|
|
999
|
|
100.0
|
%
|
999
|
|
—
|
|
—
|
%
|
||||||
|
Net cash proceeds from cost method investment in Sift
|
—
|
|
—
|
|
(100.0
|
)%
|
—
|
|
875
|
|
100.0
|
%
|
||||||
|
Warrants exercised
|
350
|
|
—
|
|
100.0
|
%
|
—
|
|
—
|
|
—
|
%
|
||||||
|
Cash received from issuance of convertible notes
|
—
|
|
16,000
|
|
100.0
|
%
|
16,000
|
|
—
|
|
—
|
%
|
||||||
|
Options exercised
|
337
|
|
11
|
|
2,963.6
|
%
|
11
|
|
51
|
|
(78.4
|
)%
|
||||||
|
Stock issued for cash in stock offering, net
|
—
|
|
—
|
|
—
|
%
|
—
|
|
12,627
|
|
100.0
|
%
|
||||||
|
Repayment of debt obligations
|
(1,098
|
)
|
(11,000
|
)
|
(90.0
|
)%
|
(11,000
|
)
|
(600
|
)
|
100.0
|
%
|
||||||
|
Payment of debt issuance costs
|
(346
|
)
|
(2,383
|
)
|
100.0
|
%
|
—
|
|
—
|
|
—
|
%
|
||||||
|
Proceeds from short-term borrowings
|
2,500
|
|
—
|
|
—
|
%
|
—
|
|
—
|
|
100.0
|
%
|
||||||
|
Effect of exchange rate changes on cash
|
(4
|
)
|
(119
|
)
|
100.0
|
%
|
(119
|
)
|
(173
|
)
|
(31.2
|
)%
|
||||||
Operating Activities
During the year ended
March 31, 2018
and
March 31, 2017
, the Company's net cash provided by (used in) operating activities was
$7,290
and
$(11,589)
, respectively, an increase of
$18,879
or
162.9%
. The increase in net cash provided by operating activities is primarily attributable to the decrease in net loss from continuing operations over the years ended
March 31, 2018
and
2017
, amounting to
$19,697
and
$19,138
, respectively, a decrease of
$559
or
2.9%
, offset by other non-cash expenses and changes in working capital accounts.
During the year ended
March 31, 2018
, net cash provided by operating activities from continuing operations was
$7,290
, resulting from a net loss of
$19,697
offset by net non-cash expenses of
$19,507
, which included depreciation and amortization, stock-based compensation, amortization of debt discounts and issuance costs, change in the allowance for doubtful accounts, change in the fair value of warrant and embedded derivative liabilities, and loss on the extinguishment of debt of approximately
$2,660
,
$2,978
,
$1,018
,
$299
,
$10,767
, and
$1,785
, respectively. Depreciation and amortization expense decreased
$54
during fiscal
2018
compared to fiscal
2017
, due primarily to certain intangible assets being fully amortized in the year ended
March 31, 2017
. Net cash used in operating activities during fiscal
2018
was positively impacted by the change in net working capital accounts as of
March 31, 2018
compared to
March 31, 2017
, with a net increase over the comparative periods in liabilities of
$15,131
, and a decrease in assets of approximately
$7,651
.
During the year ended
March 31, 2017
, net cash used in operating activities from continuing operations was
$11,589
, resulting from a net loss of
$19,138
offset by net non-cash expenses of
$8,098
, which included depreciation and
57
amortization, stock-based compensation, stock-based compensation related to vesting of restricted stock for services, amortization of debt discount, change in the allowance for doubtful accounts, change in accrued interest, change in the fair value of warrant and embedded derivative liabilities, loss on the extinguishment of debt and impairment of intangible assets of approximately
$2,606
,
$3,362
,
$398
,
$1,256
,
$48
,
$36
,
$(622)
,
$293
, and
$757
, respectively. Net cash used in operating activities during fiscal 2016 was negatively impacted by the change in net working capital accounts as of
March 31, 2017
compared to
March 31, 2016
, with an increase over the comparative periods in accounts payable of approximately
$4,434
, offset by an increase in accounts receivable of approximately
$3,882
and a decrease in other current liabilities of
$1,323
.
During the year ended
March 31, 2016
, net cash used in operating activities from continuing operations was
$11,571
, resulting from a net loss of
$24,492
, offset by net non-cash expenses of
$14,093
, which included depreciation and amortization, stock-based compensation, stock-based compensation related to vesting of restricted stock for services, amortization of debt discount, a decrease in the allowance for doubtful accounts, and an increase in accrued interest of approximately
$7,873
,
$5,095
,
$867
,
$470
,
$(495)
,
$12
, and
$283
respectively. Net cash used in operating activities during fiscal
2016
was minimally impacted by the change in net working capital accounts as of
March 31, 2016
and March 31,
2015
.
Investing Activities
During the year ended
March 31, 2018
, cash used in investing activities was approximately
$1,992
, which includes capital expenditures of
$1,992
comprised mostly of internally-developed software.
During the year ended
March 31, 2017
, cash used in investing activities was approximately
$419
, which includes capital expenditures of
$1,418
comprised mostly of internally-developed software, offset by proceeds from sale of cost method investment in Sift of
$999
.
During the year ended
March 31, 2016
, cash used in investing activities was approximately
$674
, which includes capital expenditures of
$1,549
, offset by net cash proceeds from cost method investment in Sift of
$875
.
Financing Activities
During the year ended
March 31, 2018
, cash provided by financing activities was approximately
$1,743
, which is primarily attributable to cash proceeds from short-term borrowings of
$2,500
, offset by the repayment of debt obligations of approximately
$1,098
, and the payment of debt issuance costs of
$346
. Furthermore, proceeds received from the exercise of stock options and warrants of approximately
$337
and
$350
, respectively.
During the year ended
March 31, 2017
, cash provided by financing activities was approximately
$2,628
, which is primarily attributable to cash received from issuance of the Notes of
$16,000
and proceeds received from the exercise of stock options of approximately
$11
, offset by repayment of debt obligations and payment of debt issuance costs of approximately
$11,000
and
$2,383
, respectively.
During the year ended
March 31, 2016
, cash provided in financing activities was approximately
$12,078
, which is primarily attributable to stock issued for cash in stock offering of
$12,627
and proceeds received from the exercise of stock options of approximately
$51
, offset by repayment of debt obligations of approximately
$600
Off-Balance Sheet Arrangements
We do not have any relationships with unconsolidated entities or financial partners, such as entities often referred to as structured finance or special purpose entities, which would have been established for the purpose of facilitating off-balance sheet arrangements or other contractually narrow or limited purposes. In addition, we do not have any undisclosed borrowings or debt, and we have not entered into any synthetic leases. We believe, therefore, that we are not materially exposed to any financing, liquidity, market or credit risk that could arise if we had engaged in such relationships.
58
Contractual Cash Obligations
The following table summarizes our contractual cash obligations at
March 31, 2018
:
|
Payments Due by Period
|
|||||||||||||||
|
Contractual cash obligations
|
Total
|
Less Than 1 Year
|
1-3 Years
|
3 to 5 Years
|
More Than 5 Years
|
||||||||||
|
Convertible notes (a)
|
5,700
|
|
—
|
|
5,700
|
|
—
|
|
—
|
|
|||||
|
Operating leases (b)
|
6,305
|
|
1,177
|
|
2,333
|
|
1,763
|
|
1,032
|
|
|||||
|
Employment agreements and other obligations (c)
|
1,700
|
|
700
|
|
1,000
|
|
—
|
|
—
|
|
|||||
|
Interest and bank fees
|
1,403
|
|
590
|
|
813
|
|
—
|
|
—
|
|
|||||
|
Uncertain tax positions (d)
|
—
|
|
—
|
|
—
|
|
—
|
|
—
|
|
|||||
|
Total contractual cash obligations
|
15,108
|
|
2,467
|
|
9,846
|
|
1,763
|
|
1,032
|
|
|||||
|
(a)
|
Convertible notes maturing on September 23, 2020 (the “Notes”), unless converted, repurchased or redeemed within their terms prior to such date
|
|
(b)
|
Consists of operating leases for our office facilities
|
|
(c)
|
Consists of various employment agreements and severance agreements
|
|
(d)
|
We have approximately $948 in additional liabilities associated with uncertain tax positions that are not expected to be liquidated within the next twelve months. We are unable to reliably estimate the expected payment dates for these additional non-current liabilities.
|
Critical Accounting Policies
The discussion and analysis of our financial condition and results of operations are based on our financial statements, which have been prepared in accordance with U.S. generally accepted accounting principles. The preparation of these financial statements requires us to make estimates and judgments that affect the reported amounts of assets, liabilities, revenues and expenses, and related disclosure of contingent assets and liabilities. On an on-going basis, we evaluate our estimates, including those related to contingencies, litigation and goodwill and intangibles acquired relating to our acquisitions. We base our estimates on historical experience and on various other assumptions that we believe are reasonable under the circumstances, the results of which form the basis for making judgments about the carrying values of assets and liabilities that are not readily apparent from other sources. Actual results may differ from these estimates under different assumptions or conditions.
We believe the following critical accounting policies affect our more significant judgments and estimates used in the preparation of our financial statements.
Basis of Presentation
The financial statements have been prepared in accordance with accounting principles generally accepted in the United States of America (“GAAP”) and pursuant to the rules and regulations of the Securities and Exchange Commission (“SEC”) for annual financial statements. The financial statements, in the opinion of management, include all adjustments necessary for a fair statement of the results of operations, financial position and cash flows for each period presented.
Estimates and Assumptions
The preparation of our financial statements in conformity with GAAP requires management to make estimates and assumptions that affect the reported amounts of assets and liabilities and disclosure of contingent assets and liabilities at the dates of the financial statements and the reported amounts of revenue and expenses during the reporting period. Actual results could differ from those estimates.
59
Revenue Recognition
Advertising
Advertising revenues are generated via direct CPI, CPP, or CPA arrangements with application developers, or indirect CPI, CPP or CPA arrangements through advertising aggregators (ad networks). Transactions are processed by the Company’s mobile application management software, Ignite.
The Company recognizes as revenue the amount billed to the application developer or advertising aggregator. Revenue share payments to the carrier are recorded as a cost of revenues. The Company has evaluated its agreements with the developers and aggregators and the carriers in accordance with the guidance at FASB ASC 605-45 Revenue Recognition – Principal Agent Considerations and has concluded that it is the principal under these agreements. Key indicators that it evaluated to reach this determination include:
|
•
|
The Company has the contractual relationship with the application developers or advertising aggregators (collectively, the advertisers), and we have the performance obligation to these parties;
|
|
•
|
Through our Ignite and Discover software, we provide application installation and management as well as detailed reporting to advertisers and carriers. We are responsible for billing the advertisers, and for reporting revenues and revenue share to the carriers;
|
|
•
|
As part of the application management process, we use our data, and post-install event data provided back to us by the advertisers, to match applications to end users. We currently target end users based on carrier, geography, demographics (including by handset type), among other attributes, by leveraging carrier data. We have discretion as to which applications are delivered to each end user;
|
|
•
|
Pricing is established in our agreements with advertisers. We negotiate pricing with the advertisers, based on prevailing rates typical in the industry; and
|
|
•
|
The Company is responsible for billing and collecting the gross amount from the advertiser. Our carrier agreements do not include any specific provisions that allow us to mitigate our credit risk by reducing the revenue share payable to the carrier.
|
In certain instances the carrier may enter directly into a CPI, CPP or CPA arrangement with a developer, where the installation will be made using the Company’s Ignite and Discover software services. In these instances, the Company receives a share of the carrier’s revenue, which is recognized on a net basis.
In addition to revenues from application developers and advertising aggregators, the Company may receive fees from the carriers relating to the initial set-up of the arrangements with the carriers. Set-up activities typically include customization, testing and implementation of the Ignite software for specific handsets. When the Company determines that the set-up fees do not have standalone value, such fees are deferred and recognized over the estimated period the carrier benefits from the set-up fee, which is generally the estimated life of the related handsets.
The Company has determined that certain set-up activities are within the scope of FASB ASC 985-605 Software Revenue Recognition and, accordingly, the Company applies the provisions of ASC 985-605 to the software components. As a result, the Company typically defers recognition of the set-up fee until all elements of the arrangement have been delivered. In those instances where the set-up fee covers ongoing support and maintenance, the fee is deferred and amortized over the term of the carrier agreement.
Additionally, the Company may receive direct payment arrangements from carriers for direct access to the Ignite platform on handsets deployed on their network. These per device license fees are paid directly to the Company by the carrier for an installed base at a point in time, usually monthly, as designated in each arrangement. These fees are recognized gross at the point in time when the devices are measured.
Initial indications surrounding the adoption of ASC 606 do not indicate that there will be a material impact on the consolidated financial position, however the Company is currently reviewing the impact of the capitalization of costs to obtain a contract as defined in ASC 606, and a final determination regarding the impact has not yet been made. The Company currently plans to adopt under the modified retrospective method, however, a final decision regarding the adoption method has not been made at this time.
60
Carrier Revenue Share
Revenues generated from advertising via direct CPI, CPP or CPA arrangements with application developers, or indirect arrangements through advertising aggregators (ad networks) are shared with the carrier and the shared revenue is recorded as a cost of goods sold. In each case the revenue share with the carrier varies depending on the agreement with the carrier, and, in some cases, is based upon revenue tiers.
Software Development Costs
The Company applies the principles of FASB ASC 985-20, Accounting for the Costs of Computer Software to Be Sold, Leased, or Otherwise Marketed (“ASC 985-20”). ASC 985-20 requires that software development costs incurred in conjunction with product development be charged to research and development expense until technological feasibility is established. Thereafter, until the product is released for sale, software development costs must be capitalized and reported at the lower of unamortized cost or net realizable value of the related product.
The Company has adopted the “tested working model” approach to establishing technological feasibility for its products and games. Under this approach, the Company does not consider a product in development to have passed the technological feasibility milestone until the Company has completed a model of the product that contains essentially all the functionality and features of the final product and has tested the model to ensure that it works as expected. Through fiscal year 2016, the Company had not incurred significant costs between the establishment of technological feasibility and the release of a product for sale; thus, the Company had expensed all software development costs as incurred. In fiscal year 2017, the Company began capitalizing costs related the development of software to be sold, leased, or otherwise marketed as we believe we have met the "tested working model" threshold. Costs will continue to be capitalized until the related software is released. The Company considers the following factors in determining whether costs can be capitalized: the emerging nature of the mobile market; the gradual evolution of the wireless carrier platforms and mobile phones for which it develops products and games; the lack of pre-orders or sales history for its products and games; the uncertainty regarding a product’s or game’s revenue-generating potential; its lack of control over the carrier distribution channel resulting in uncertainty as to when, if ever, a product or game will be available for sale; and its historical practice of canceling products and games at any stage of the development process.
Presentation
In order to facilitate the comparison of financial information, certain amounts reported in the prior year have been reclassified to conform to the current year presentation.
Concentrations of Credit Risk and Significant Customers
Financial instruments that potentially subject the Company to significant concentrations of credit risk consist primarily of cash and accounts receivable. A significant portion of the Company’s cash is held at one major financial institution that the Company's management has assessed to be of high credit quality. The Company has not experienced any losses in such accounts.
The Company mitigates its credit risk with respect to accounts receivable by performing credit evaluations and monitoring advertisers' and carriers' accounts receivable balances. As of
March 31, 2018
, one major customers represented
28.3%
of the Company's net accounts receivable balance. As of
March 31, 2017
, thee major customers represented
17.8%
,
16.2%
, and
10.7%
of the Company's net accounts receivable balance, respectively.
With respect to revenue concentration, the Company defines a customer as an advertiser or a carrier that is a distinct source of revenue and is legally bound to pay for the services that the Company delivers on the advertiser’s or carrier's behalf. The Company counts all advertisers and carriers within a single corporate structure as one customer, even in cases where multiple brands, branches, or divisions of an organization enter into separate contracts with the Company. During the year ended
March 31, 2018
, Oath Inc., an Advertising customer, represented
23.5%
of our revenue, and Machine Zone Inc., an Advertising customer, represented
16.1%
of our revenue. During the year ended
March 31, 2017
, Oath Inc., an Advertising customer, represented
21.9%
of our revenue, and Jam City, Inc., an Advertising customer, represented
26.1%
of our revenue. During the year ended
March 31, 2016
, no single customer represented greater than 10% of our revenue.
61
The Company partners with mobile carriers and OEMS to deliver applications on our Ignite platform through the carrier network. During the years ended
March 31, 2018
and
2017
, Verizon Wireless, a carrier partner, generated 51.5%% and 61.1% of our net revenues, respectively; while AT&T Inc., a carrier partner, primarily through its Cricket subsidiary, generated 34.3% and 17.6% of our net revenue, respectively. During the year ended
March 31, 2016
, Verizon Wireless, generated 87.4% of our net revenues.
Goodwill and Indefinite Life Intangible Assets
Goodwill represents the excess of cost over fair value of net assets of businesses acquired. In accordance with FASB ASC 350-20 Goodwill and Other Intangible Assets, the value assigned to goodwill and indefinite lived intangible assets is not amortized to expense, but rather they are evaluated at least on an annual basis to determine if there are potential impairments. For goodwill and indefinite lived intangible assets, we complete what is referred to as the “Step 0” analysis which involves evaluating qualitative factors including macroeconomic conditions, industry and market considerations, cost factors, and overall financial performance. If our “Step 0” analysis indicates it is more likely than not that the fair value is less than the carrying amount, we would perform a quantitative two-step impairment test. The quantitative analysis compares the fair value of our reporting unit or indefinite-lived intangible assets to the carrying amounts, and an impairment loss is recognized equivalent to the excess of the carrying amount over the fair value. Fair value is determined based on discounted cash flows, market multiples or appraised values, as appropriate. Discounted cash flow analysis requires assumptions about the timing and amount of future cash inflows and outflows, risk, the cost of capital, and terminal values. Each of these factors can significantly affect the value of the intangible asset. The estimates of future cash flows, based on reasonable and supportable assumptions and projections, require management’s judgment. Any changes in key assumptions about the Company’s businesses and their prospects, or changes in market conditions, could result in an impairment charge. Some of the more significant estimates and assumptions inherent in the intangible asset valuation process include: the timing and amount of projected future cash flows; the discount rate selected to measure the risks inherent in the future cash flows; and the assessment of the asset’s life cycle and the competitive trends impacting the asset, including consideration of any technical, legal or regulatory trends.
In the year ended
March 31, 2018
the Company determined that there was an impairment of goodwill related to the divestiture of its A&P and Content business lines, see Note 8 "Goodwill", no impairment was recorded against the Company's continuing operations . In performing the related valuation analysis, the Company used various valuation methodologies including probability weighted discounted cash flows, comparable transaction analysis, and market capitalization and comparable company multiple comparison. In the year ended
March 31, 2017
the Company determined that there was no indicators of impairment of goodwill.
Impairment of Long-Lived Assets and Finite Life Intangibles
Long-lived assets, including, intangible assets subject to amortization primarily consist of customer lists, license agreements and software that have been acquired are amortized using the straight-line method over their useful life ranging from five to eight years and are reviewed for impairment in accordance with FASB ASC 360-10, Accounting for the Impairment or Disposal of Long-Lived Assets, whenever events or changes in circumstances indicate that the carrying amount of an asset may not be recoverable. Recoverability of assets to be held and used is measured by a comparison of the carrying amount of an asset to future undiscounted net cash flows expected to be generated by the asset. If such assets are considered to be impaired, the impairment to be recognized is measured by the amount by which the carrying amount of the assets exceeds the fair value of the assets. Assets to be disposed of are reported at the lower of the carrying amount or fair value less costs to sell.
62
Income Taxes
The Company accounts for income taxes in accordance with FASB ASC 740-10, Accounting for Income Taxes (“ASC 740-10”), which requires recognition of deferred tax assets and liabilities for the expected future tax consequences of events that have been included in its financial statements or tax returns. Under ASC 740-10, the Company determines deferred tax assets and liabilities for temporary differences between the financial reporting basis and the tax basis of assets and liabilities along with net operating losses, if it is more likely than not the tax benefits will be realized using the enacted tax rates in effect for the year in which it expects the differences to reverse. To the extent a deferred tax asset cannot be recognized, a valuation allowance is established if necessary.
ASC 740-10 prescribes that a company should use a more-likely-than-not recognition threshold based on the technical merits of the tax position taken. Tax positions that meet the “more-likely-than-not” recognition threshold should be measured as the largest amount of the tax benefits, determined on a cumulative probability basis, which is more likely than not to be realized upon ultimate settlement in the financial statements. We recognize interest and penalties related to income tax matters as a component of the provision for income taxes.
The Company’s income is subject to taxation in both the U.S. and foreign jurisdictions, including Israel, Germany, Luxembourg, Singapore and Australia. Significant judgment is required in evaluating the Company’s tax positions and determining its provision for income taxes. The Company establishes reserves for income tax-related uncertainties based on estimates of whether, and the extent to which, additional taxes will be due. These reserves for tax contingencies are established when the Company believes that positions do not meet the more-likely-than-not recognition threshold. The Company adjusts uncertain tax liabilities in light of changing facts and circumstances, such as the outcome of a tax audit or lapse of a statute of limitations. The provision for income taxes includes the impact of uncertain tax liabilities and changes in liabilities that are considered appropriate.
Stock-based compensation
We have applied FASB ASC 718 Share-Based Payment (“ASC 718”) and accordingly, we record stock-based compensation expense for all of our stock-based awards.
Under ASC 718, we estimate the fair value of stock options granted using the Black-Scholes option pricing model. The fair value for awards that are expected to vest is then amortized on a straight-line basis over the requisite service period of the award, which is generally the option vesting term. The amount of expense recognized represents the expense associated with the stock options we expect to ultimately vest based upon an estimated rate of forfeitures; this rate of forfeitures is updated as necessary and any adjustments needed to recognize the fair value of options that actually vest or are forfeited are recorded.
The Black-Scholes option pricing model, used to estimate the fair value of an award, requires the input of subjective assumptions, including the expected volatility of our common stock, interest rates, dividend rates and an option’s expected life. As a result, the financial statements include amounts that are based upon our best estimates and judgments relating to the expenses recognized for stock-based compensation.
Preferred Stock
The Company applies the guidance enumerated in FASB ASC 480-10, Accounting for Certain Financial Instruments with Characteristics of both Liabilities and Equity (“ASC 480-10”) when determining the classification and measurement of preferred stock. Preferred shares subject to mandatory redemption (if any) are classified as liability instruments and are measured at fair value in accordance with ASC 480-10. All other issuances of preferred stock are subject to the classification and measurement principles of ASC 480-10. Accordingly, the Company classifies conditionally redeemable preferred shares (if any), which includes preferred shares that feature redemption rights that are either within the control of the holder or subject to redemption upon the occurrence of uncertain events not solely within the Company’s control, as temporary equity. At all other times, the Company classifies its preferred shares in stockholders’ equity.
Recently Issued Accounting Pronouncements
Recent accounting pronouncements are detailed in Note 4 to our Consolidated Financial Statements included in PART II, Item 8 of this Annual Report on Form 10-K.
63
Recent Developments
None.
|
ITEM 7A.
|
QUANTITATIVE AND QUALITATIVE DISCLOSURES ABOUT MARKET RISK
|
We have operations both within the United States and internationally, and we are exposed to market risks in the ordinary course of our business. These risks primarily consist of interest rate and foreign currency exchange risks.
Interest Rate Fluctuation Risk
The primary objective of our investment activities is to preserve principal while maximizing income without significantly increasing risk. Our cash consists of cash and deposits which are not insensitive to interest rate changes.
Our borrowings under our credit facility are subject to variable interest rates and thus expose us to interest rate fluctuations depending on the extent to which we utilize the credit facility. If market interest rates materially increase, our results of operations could be adversely affected. Our borrowings under our credit facility are subject to variable interest rates and thus expose us to interest rate fluctuations depending on the extent to which we utilize the credit facility. If market interest rates materially increase, our results of operations could be adversely affected. A hypothetical increase in market interest rates of 100 basis points would result in an increase in our interest expense of $0.01 million per year for every $1 million of outstanding debt under the credit facility.
Foreign Currency Exchange Risk
We have foreign currency risks related to our revenue and operating expenses denominated in currencies other than the U.S. dollar, primarily the Australian dollar.
While a portion of our sales are denominated in these foreign currencies and then translated into the U.S. dollar, the vast majority of our media costs are billed in the U.S. dollar, causing both our revenue and, disproportionately, our operating loss and net loss to be impacted by fluctuations in the exchange rates. In addition, gains (losses) related to translating certain cash balances, trade accounts receivable balances and intercompany balances that are denominated in these currencies impact our net income (loss). As our foreign operations expand, our results may be more impacted by fluctuations in the exchange rates of the currencies in which we do business. At this time we do not, but we may in the future, enter into financial instruments to hedge our foreign currency exchange risk.
64
|
ITEM 8.
|
FINANCIAL STATEMENTS AND SUPPLEMENTARY DATA
|
DIGITAL TURBINE, INC.
INDEX TO CONSOLIDATED FINANCIAL STATEMENTS
|
Consolidated Financial Statements:
|
|
|
The supplementary financial information required by this Item 8 is set forth in Note 20 of the Notes to the Consolidated Financial Statements under the caption "Supplemental Consolidated Financial Information".
|
|
65
Report of Independent Registered Public Accounting Firm
To the Stockholders and the Board of Directors of Digital Turbine, Inc. and Subsidiaries
Opinion on the Financial Statements
We have audited the accompanying consolidated balance sheets of Digital Turbine, Inc. and Subsidiaries (collectively, the “Company”) as of March 31, 2018 and 2017, the related consolidated statements of operations and comprehensive loss, stockholders' equity and cash flows for each of the three years in the period ended March 31, 2018, and the related notes to the consolidated financial statements (collectively, the “financial statements”). In our opinion, the financial statements present fairly, in all material respects, the financial position of the Company as of March 31, 2018 and 2017, and the results of its operations and its cash flows for each of the three years in the period ended March 31, 2018, in conformity with accounting principles generally accepted in the United States of America.
We have also audited, in accordance with the standards of the Public Company Accounting Oversight Board (United States) (PCAOB), the Company's internal control over financial reporting as of March 31, 2018, based on criteria established in
Internal Control - Integrated Framework
issued by the Committee of Sponsoring Organizations of the Treadway Commission in 2013, and our report dated June 12, 2018, expressed an unqualified opinion on the effectiveness of the Company's internal control over financial reporting.
Basis for Opinion
These financial statements are the responsibility of the Company’s management. Our responsibility is to express an opinion on the Company’s financial statements based on our audits. We are a public accounting firm registered with the PCAOB and are required to be independent with respect to the Company in accordance with U.S. federal securities laws and the applicable rules and regulations of the Securities and Exchange Commission and the PCAOB.
We conducted our audits in accordance with the standards of the PCAOB. Those standards require that we plan and perform the audits to obtain reasonable assurance about whether the financial statements are free of material misstatement, whether due to error or fraud. Our audits included performing procedures to assess the risks of material misstatement of the financial statements, whether due to error or fraud, and performing procedures that respond to those risks. Such procedures included examining, on a test basis, evidence regarding the amounts and disclosures in the financial statements. Our audits also included evaluating the accounting principles used and significant estimates made by management, as well as evaluating the overall presentation of the financial statements. We believe that our audits provide a reasonable basis for our opinion.
/s/ SingerLewak LLP
We have served as the Company's auditor since 2009.
Los Angeles, California
June 12, 2018
66
Report of Independent Registered Public Accounting Firm
To the Stockholders and the Board of Directors of Digital Turbine, Inc. and Subsidiaries
Opinion on the Internal Control Over Financial Reporting
We have audited Digital Turbine, Inc. and Subsidiaries' (collectively, the “Company”) internal control over financial reporting as of March 31, 2018, based on criteria established in
Internal Control - Integrated Framework
issued by the Committee of Sponsoring Organizations of the Treadway Commission in 2013. In our opinion, the Company maintained, in all material respects, effective internal control over financial reporting as of March 31, 2018, based on criteria established in
Internal Control - Integrated Framework
issued by the Committee of Sponsoring Organizations of the Treadway Commission in 2013.
We have also audited, in accordance with the standards of the Public Company Accounting Oversight Board (United States) (PCAOB), the consolidated balance sheets of the Company as of March 31, 2018 and 2017, the related consolidated statements of operations and comprehensive loss, stockholders' equity and cash flows for each of the three years in the period ended March 31, 2018, and our report dated June 12, 2018 expressed an unqualified opinion.
Basis for Opinion
The Company’s management is responsible for maintaining effective internal control over financial reporting and for its assessment of the effectiveness of internal control over financial reporting in the accompanying Management’s Report on Internal Control over Financial Reporting. Our responsibility is to express an opinion on the Company’s internal control over financial reporting based on our audit. We are a public accounting firm registered with the PCAOB and are required to be independent with respect to the Company in accordance with U.S. federal securities laws and the applicable rules and regulations of the Securities and Exchange Commission and the PCAOB.
We conducted our audit in accordance with the standards of the PCAOB. Those standards require that we plan and perform the audit to obtain reasonable assurance about whether effective internal control over financial reporting was maintained in all material respects. Our audit included obtaining an understanding of internal control over financial reporting, assessing the risk that a material weakness exists, and testing and evaluating the design and operating effectiveness of internal control based on the assessed risk. Our audit also included performing such other procedures as we considered necessary in the circumstances. We believe that our audit provides a reasonable basis for our opinion.
Definition and Limitations of Internal Control Over Financial Reporting
A company's internal control over financial reporting is a process designed to provide reasonable assurance regarding the reliability of financial reporting and the preparation of financial statements for external purposes in accordance with generally accepted accounting principles. A company's internal control over financial reporting includes those policies and procedures that (1) pertain to the maintenance of records that, in reasonable detail, accurately and fairly reflect the transactions and dispositions of the assets of the company; (2) provide reasonable assurance that transactions are recorded as necessary to permit preparation of financial statements in accordance with generally accepted accounting principles, and that receipts and expenditures of the company are being made only in accordance with authorizations of management and directors of the company; and (3) provide reasonable assurance regarding prevention or timely detection of unauthorized acquisition, use or disposition of the company's assets that could have a material effect on the financial statements.
Because of its inherent limitations, internal control over financial reporting may not prevent or detect misstatements. Also, projections of any evaluation of effectiveness to future periods are subject to the risk that controls may become inadequate because of changes in conditions, or that the degree of compliance with the policies or procedures may deteriorate.
/s/ SingerLewak LLP
Los Angeles, California
June 12, 2018
67
Digital Turbine, Inc. and Subsidiaries
(in thousands, except share and per share amounts)
|
March 31, 2018
|
March 31, 2017
|
|||||||
|
ASSETS
|
|
|
||||||
|
Current assets
|
|
|
||||||
|
Cash
|
$
|
12,720
|
|
$
|
6,149
|
|
||
|
Restricted cash
|
331
|
|
331
|
|
||||
|
Accounts receivable, net of allowances of $512 and $228, respectively
|
17,050
|
|
10,663
|
|
||||
|
Deposits
|
151
|
|
121
|
|
||||
|
Prepaid expenses and other current assets
|
750
|
|
448
|
|
||||
|
Current assets held for disposal
|
8,753
|
|
5,953
|
|
||||
|
Total current assets
|
39,755
|
|
23,665
|
|
||||
|
Property and equipment, net
|
2,757
|
|
2,006
|
|
||||
|
Deferred tax assets
|
596
|
|
352
|
|
||||
|
Intangible assets, net
|
1,231
|
|
2,647
|
|
||||
|
Goodwill
|
42,268
|
|
42,268
|
|
||||
|
Long-lived assets held for disposal
|
—
|
|
36,642
|
|
||||
|
TOTAL ASSETS
|
$
|
86,607
|
|
$
|
107,580
|
|
||
|
LIABILITIES AND STOCKHOLDERS' EQUITY
|
|
|
||||||
|
Current liabilities
|
|
|
||||||
|
Accounts payable
|
$
|
19,895
|
|
$
|
11,787
|
|
||
|
Accrued license fees and revenue share
|
8,232
|
|
3,011
|
|
||||
|
Accrued compensation
|
2,966
|
|
520
|
|
||||
|
Short-term debt, net of debt issuance costs of $205 and $0, respectively
|
1,445
|
|
—
|
|
||||
|
Other current liabilities
|
1,142
|
|
1,041
|
|
||||
|
Current liabilities held for disposal
|
12,726
|
|
14,415
|
|
||||
|
Total current liabilities
|
46,406
|
|
30,774
|
|
||||
|
Convertible notes, net of debt issuance costs and discounts of $1,827 and $6,315, respectively
|
3,873
|
|
9,685
|
|
||||
|
Convertible note embedded derivative liability
|
4,676
|
|
3,218
|
|
||||
|
Warrant liability
|
3,980
|
|
1,076
|
|
||||
|
Other non-current liabilities
|
—
|
|
697
|
|
||||
|
Long-term liabilities held for disposal
|
—
|
|
85
|
|
||||
|
Total liabilities
|
58,935
|
|
45,535
|
|
||||
|
Stockholders' equity
|
|
|
||||||
|
Preferred stock
|
|
|
||||||
|
Series A convertible preferred stock at $0.0001 par value; 2,000,000 shares authorized, 100,000 issued and outstanding (liquidation preference of $1,000)
|
100
|
|
100
|
|
||||
|
Common stock
|
||||||||
|
$0.0001 par value: 200,000,000 shares authorized; 76,843,278 issued and 76,108,822 outstanding at March 31, 2018; 67,329,262 issued and 66,594,807 outstanding at March 31, 2017
|
10
|
|
8
|
|
||||
|
Additional paid-in capital
|
318,066
|
|
299,580
|
|
||||
|
Treasury stock (754,599 shares at March 31, 2018 and March 31, 2017)
|
(71
|
)
|
(71
|
)
|
||||
|
Accumulated other comprehensive loss
|
(325
|
)
|
(321
|
)
|
||||
|
Accumulated deficit
|
(290,108
|
)
|
(237,251
|
)
|
||||
|
Total stockholders' equity
|
27,672
|
|
62,045
|
|
||||
|
TOTAL LIABILITIES AND STOCKHOLDERS' EQUITY
|
$
|
86,607
|
|
$
|
107,580
|
|
||
The accompanying notes are an integral part of these consolidated financial statements.
68
Digital Turbine, Inc. and Subsidiaries
(in thousands, except per share amounts)
|
Years ended March 31,
|
||||||||||||
|
2018
|
2017
|
2016
|
||||||||||
|
Net revenues
|
$
|
74,751
|
|
$
|
40,207
|
|
$
|
22,251
|
|
|||
|
Cost of revenues
|
||||||||||||
|
License fees and revenue share
|
47,967
|
|
26,374
|
|
13,314
|
|
||||||
|
Other direct cost of revenues
|
1,729
|
|
2,575
|
|
7,477
|
|
||||||
|
Total cost of revenues
|
49,696
|
|
28,949
|
|
20,791
|
|
||||||
|
Gross profit
|
25,055
|
|
11,258
|
|
1,460
|
|
||||||
|
Operating expenses
|
|
|||||||||||
|
Product development
|
9,653
|
|
9,283
|
|
4,883
|
|
||||||
|
Sales and marketing
|
6,087
|
|
4,180
|
|
2,908
|
|
||||||
|
General and administrative
|
15,124
|
|
14,766
|
|
16,203
|
|
||||||
|
Total operating expenses
|
30,864
|
|
28,229
|
|
23,994
|
|
||||||
|
Loss from operations
|
(5,809
|
)
|
(16,971
|
)
|
(22,534
|
)
|
||||||
|
Interest and other expense, net
|
|
|||||||||||
|
Interest expense, net
|
(2,067
|
)
|
(2,625
|
)
|
(1,716
|
)
|
||||||
|
Foreign exchange transaction loss
|
(148
|
)
|
(26
|
)
|
(24
|
)
|
||||||
|
Change in fair value of convertible note embedded derivative liability
|
(7,559
|
)
|
475
|
|
—
|
|
||||||
|
Change in fair value of warrant liability
|
(3,208
|
)
|
147
|
|
—
|
|
||||||
|
Loss on extinguishment of debt
|
(1,785
|
)
|
(293
|
)
|
—
|
|
||||||
|
Other income / (expense)
|
(72
|
)
|
11
|
|
(4
|
)
|
||||||
|
Total interest and other expense, net
|
(14,839
|
)
|
(2,311
|
)
|
(1,744
|
)
|
||||||
|
Loss from operations before income taxes
|
(20,648
|
)
|
(19,282
|
)
|
(24,278
|
)
|
||||||
|
Income tax provision / (benefit)
|
(951
|
)
|
(144
|
)
|
214
|
|
||||||
|
Net loss from operations, net of taxes
|
(19,697
|
)
|
(19,138
|
)
|
(24,492
|
)
|
||||||
|
Discontinued operations, net of taxes
|
||||||||||||
|
Net loss from operations of discontinued components
|
(33,160
|
)
|
(5,126
|
)
|
(3,540
|
)
|
||||||
|
Net loss from discontinued operations, net of taxes
|
(33,160
|
)
|
(5,126
|
)
|
(3,540
|
)
|
||||||
|
Net loss
|
(52,857
|
)
|
(24,264
|
)
|
(28,032
|
)
|
||||||
|
Other comprehensive loss
|
|
|||||||||||
|
Foreign currency translation adjustment
|
(4
|
)
|
(119
|
)
|
(150
|
)
|
||||||
|
Comprehensive loss
|
$
|
(52,861
|
)
|
$
|
(24,383
|
)
|
$
|
(28,182
|
)
|
|||
|
Basic and diluted net loss per common share
|
$
|
(0.75
|
)
|
$
|
(0.36
|
)
|
$
|
(0.46
|
)
|
|||
|
Continuing operations
|
(0.28
|
)
|
(0.29
|
)
|
(0.40
|
)
|
||||||
|
Discontinued operations
|
(0.47
|
)
|
(0.07
|
)
|
(0.06
|
)
|
||||||
|
Net loss
|
(0.75
|
)
|
(0.36
|
)
|
(0.46
|
)
|
||||||
|
Weighted-average common shares outstanding, basic and diluted
|
70,263
|
|
66,511
|
|
61,763
|
|
||||||
The accompanying notes are an integral part of these consolidated financial statements.
69
Digital Turbine, Inc. and Subsidiaries
Consolidated Statements of Stockholders’ Equity
(in thousands, except share amounts)
|
Common Stock
Shares
|
Amount
|
Preferred Stock
Shares
|
Amount
|
Treasury Stock
Shares
|
Amount
|
Additional
Paid-In
Capital
|
Accumulated
Other
Comprehensive
Income/(Loss)
|
Accumulated
Deficit
|
Total
|
||||||||||||||||||||||||||||
|
Balance at March 31, 2015
|
57,162,967
|
|
$
|
7
|
|
100,000
|
|
$
|
100
|
|
754,599
|
|
$
|
(71
|
)
|
$
|
276,500
|
|
$
|
(52
|
)
|
$
|
(184,955
|
)
|
$
|
91,529
|
|
||||||||||
|
Net loss
|
|
|
|
|
|
|
|
|
|
|
|
|
|
|
|
|
(28,032
|
)
|
(28,032
|
)
|
|||||||||||||||||
|
Foreign currency translation
|
|
|
|
|
|
|
|
|
|
|
|
|
|
|
(150
|
)
|
|
|
(150
|
)
|
|||||||||||||||||
|
Cancellation of shares issued to employees
|
(454,164
|
)
|
|
|
|
|
|
|
|
|
|
|
|
|
|
|
|
|
—
|
|
|||||||||||||||||
|
Stock-based compensation
|
|
|
|
|
|
|
|
|
|
|
|
|
5,096
|
|
|
|
|
|
5,096
|
|
|||||||||||||||||
|
Stock-based compensation related to vesting of restricted stock for services
|
233,928
|
|
|
|
|
|
|
|
|
|
|
|
867
|
|
|
|
|
|
867
|
|
|||||||||||||||||
|
Options exercised
|
66,682
|
|
|
|
|
|
|
|
|
|
|
|
51
|
|
|
|
|
|
51
|
|
|||||||||||||||||
|
Cashless exercise of a warrant
|
452,974
|
|
|
|
|
|
|
|
|
|
|
|
|
|
|
|
|
|
—
|
|
|||||||||||||||||
|
Cancellation of shares held in escrow related to Appia acquisition
|
(10,874
|
)
|
|
|
|
|
|
|
|
|
|
|
|
|
|
|
|
|
—
|
|
|||||||||||||||||
|
Stock issued for settlement of liability
|
117,000
|
|
|
|
|
|
|
|
|
|
|
|
283
|
|
|
|
|
|
283
|
|
|||||||||||||||||
|
Shares cancelled
|
(23,907
|
)
|
|
|
|
|
|
|
|
|
|
|
|
|
|
|
|
|
—
|
|
|||||||||||||||||
|
Stock issued for cash in stock offering
|
8,740,000
|
|
$
|
1
|
|
|
|
|
|
|
|
|
|
12,626
|
|
|
|
|
|
12,627
|
|
||||||||||||||||
|
Balance at March 31, 2016
|
66,284,606
|
|
8
|
|
100,000
|
|
100
|
|
754,599
|
|
(71
|
)
|
295,423
|
|
(202
|
)
|
(212,987
|
)
|
$
|
82,271
|
|
||||||||||||||||
|
Net loss
|
(24,264
|
)
|
(24,264
|
)
|
|||||||||||||||||||||||||||||||||
|
Foreign currency translation
|
(119
|
)
|
(119
|
)
|
|||||||||||||||||||||||||||||||||
|
Stock-based compensation
|
331,363
|
|
3,748
|
|
3,748
|
|
|||||||||||||||||||||||||||||||
|
Compensation related to restricted shares and warrants issued for services rendered
|
|
|
408
|
|
408
|
|
|||||||||||||||||||||||||||||||
|
Options exercised
|
18,383
|
|
11
|
|
11
|
|
|||||||||||||||||||||||||||||||
|
Shares cancelled
|
(39,545
|
)
|
(10
|
)
|
(10
|
)
|
|||||||||||||||||||||||||||||||
|
Balance at March 31, 2017
|
66,594,807
|
|
8
|
|
100,000
|
|
100
|
|
754,599
|
|
(71
|
)
|
299,580
|
|
(321
|
)
|
(237,251
|
)
|
$
|
62,045
|
|
||||||||||||||||
|
Net loss
|
|
|
|
|
|
|
|
|
|
|
|
|
|
|
|
|
(52,857
|
)
|
(52,857
|
)
|
|||||||||||||||||
|
Foreign currency translation
|
|
|
|
|
|
|
|
|
|
|
|
|
|
|
(4
|
)
|
|
|
(4
|
)
|
|||||||||||||||||
|
Warrants issued for services rendered
|
|
|
|
|
|
|
|
|
|
|
|
|
28
|
|
|
|
|
|
28
|
|
|||||||||||||||||
|
Stock-based compensation
|
265,137
|
|
|
|
|
|
|
|
|
|
|
|
3,138
|
|
|
|
|
|
3,138
|
|
|||||||||||||||||
|
Options exercised
|
358,281
|
|
|
|
|
|
|
|
|
|
|
|
338
|
|
|
|
|
|
338
|
|
|||||||||||||||||
|
Cashless exercise of a warrant
|
9,552
|
|
|
|
|
|
|
|
|
|
|
|
|
|
|
|
|
|
—
|
|
|||||||||||||||||
|
Stock issued for the conversion of convertible notes
|
8,624,445
|
|
2
|
|
|
|
|
|
|
|
|
|
14,632
|
|
|
|
|
|
14,634
|
|
|||||||||||||||||
|
Stock issued for the conversion of warrants
|
256,600
|
|
|
|
|
|
|
|
|
|
|
|
350
|
|
|
|
|
|
350
|
|
|||||||||||||||||
|
Balance at March 31, 2018
|
76,108,822
|
|
$
|
10
|
|
100,000
|
|
$
|
100
|
|
754,599
|
|
$
|
(71
|
)
|
$
|
318,066
|
|
$
|
(325
|
)
|
$
|
(290,108
|
)
|
$
|
27,672
|
|
||||||||||
The accompanying notes are an integral part of these consolidated financial statements.
70
Digital Turbine, Inc. and Subsidiaries
(in thousands)
|
Year ended March 31,
|
||||||||||||
|
2018
|
2017
|
2016
|
||||||||||
|
Cash flows from operating activities
|
|
|
|
|
|
|
||||||
|
Net loss
|
(19,697
|
)
|
(19,138
|
)
|
(24,492
|
)
|
||||||
|
Adjustments to reconcile net loss to net cash used in operating activities:
|
|
|
|
|
|
|
||||||
|
Depreciation and amortization
|
2,660
|
|
2,606
|
|
7,873
|
|
||||||
|
Change in allowance for doubtful accounts
|
299
|
|
48
|
|
(495
|
)
|
||||||
|
Amortization of debt discount and debt issuance costs
|
1,018
|
|
1,256
|
|
470
|
|
||||||
|
Stock-based compensation
|
2,655
|
|
3,362
|
|
5,095
|
|
||||||
|
Stock-based compensation for services rendered
|
323
|
|
398
|
|
867
|
|
||||||
|
Change in fair value of convertible note embedded derivative liability
|
7,559
|
|
(475
|
)
|
—
|
|
||||||
|
Change in fair value of warrant liability
|
3,208
|
|
(147
|
)
|
—
|
|
||||||
|
Loss on extinguishment of debt
|
1,785
|
|
293
|
|
—
|
|
||||||
|
Impairment of intangible assets
|
—
|
|
757
|
|
—
|
|
||||||
|
Stock issued for settlement of liability
|
—
|
|
—
|
|
283
|
|
||||||
|
(Increase) / decrease in assets:
|
|
|
|
|
||||||||
|
Restricted cash transferred from operating cash
|
—
|
|
(331
|
)
|
200
|
|
||||||
|
Accounts receivable
|
(7,071
|
)
|
(3,882
|
)
|
(5,097
|
)
|
||||||
|
Deposits
|
(30
|
)
|
23
|
|
(35
|
)
|
||||||
|
Deferred tax assets
|
(244
|
)
|
148
|
|
(418
|
)
|
||||||
|
Prepaid expenses and other current assets
|
(306
|
)
|
81
|
|
(21
|
)
|
||||||
|
Increase / (decrease) in liabilities:
|
|
|
|
|
||||||||
|
Accounts payable
|
8,108
|
|
4,434
|
|
3,380
|
|
||||||
|
Accrued license fees and revenue share
|
5,221
|
|
(4
|
)
|
2,713
|
|
||||||
|
Accrued compensation
|
2,445
|
|
385
|
|
(1,100
|
)
|
||||||
|
Accrued interest
|
(26
|
)
|
36
|
|
12
|
|
||||||
|
Other current liabilities
|
78
|
|
(1,323
|
)
|
(806
|
)
|
||||||
|
Other non-current liabilities
|
(695
|
)
|
(116
|
)
|
—
|
|
||||||
|
Net cash provided by / (used in) operating activities - continuing operations
|
7,290
|
|
(11,589
|
)
|
(11,571
|
)
|
||||||
|
Net cash provided by / (used in) operating activities - discontinued operations
|
(324
|
)
|
4,594
|
|
4,502
|
|
||||||
|
Net cash provided by (used in) operating activities
|
6,966
|
|
(6,995
|
)
|
(7,069
|
)
|
||||||
|
Cash flows from investing activities
|
|
|
|
|
|
|
||||||
|
Capital expenditures
|
(1,992
|
)
|
(1,418
|
)
|
(1,549
|
)
|
||||||
|
Proceeds from sale of cost method investment in Sift
|
—
|
|
999
|
|
—
|
|
||||||
|
Net cash proceeds from cost method investment in Sift
|
—
|
|
—
|
|
875
|
|
||||||
|
Net cash provided by / (used in) investing activities - continuing operations
|
(1,992
|
)
|
(419
|
)
|
(674
|
)
|
||||||
|
Net cash provided by / (used in) investing activities - discontinued operations
|
(142
|
)
|
(177
|
)
|
—
|
|
||||||
|
Net cash used in investing activities
|
(2,134
|
)
|
(596
|
)
|
(674
|
)
|
||||||
|
Cash flows from financing activities
|
|
|
|
|
|
|
||||||
|
Cash received from issuance of convertible notes
|
—
|
|
16,000
|
|
—
|
|
||||||
|
Proceeds from short-term borrowings
|
2,500
|
|
—
|
|
—
|
|
||||||
|
Payment of debt issuance costs
|
(346
|
)
|
(2,383
|
)
|
—
|
|
||||||
|
Options exercised
|
337
|
|
11
|
|
51
|
|
||||||
|
Warrants exercised
|
350
|
|
—
|
|
—
|
|
||||||
|
Repayment of debt obligations
|
(1,098
|
)
|
(11,000
|
)
|
(600
|
)
|
||||||
|
Stock issued for cash in stock offering, net
|
—
|
|
—
|
|
12,627
|
|
||||||
|
Net cash provided by financing activities
|
1,743
|
|
2,628
|
|
12,078
|
|
||||||
|
Effect of exchange rate changes on cash
|
(4
|
)
|
(119
|
)
|
(173
|
)
|
||||||
|
Net change in cash
|
6,571
|
|
(5,082
|
)
|
4,162
|
|
||||||
|
Cash, beginning of period
|
6,149
|
|
11,231
|
|
7,069
|
|
||||||
|
Cash, end of period
|
$
|
12,720
|
|
$
|
6,149
|
|
$
|
11,231
|
|
|||
|
Supplemental disclosure of cash flow information
|
||||||||||||
|
Interest paid
|
$
|
1,071
|
|
$
|
1,406
|
|
$
|
1,101
|
|
|||
|
Supplemental disclosure of non-cash financing activities
|
|
|
|
|
||||||||
|
Common stock of the Company issued for extinguishment of debt
|
$
|
14,632
|
|
$
|
—
|
|
$
|
—
|
|
|||
|
Cashless exercise of warrants to purchase common stock of the Company
|
$
|
10
|
|
$
|
—
|
|
$
|
566
|
|
|||
The accompanying notes are an integral part of these consolidated financial statements.
71
Digital Turbine, Inc. and Subsidiaries
Notes to Consolidated Financial Statements
(in thousands, except share and per share amounts)
1. Organization
Digital Turbine was incorporated in the state of Delaware in 1998. Digital Turbine, through its subsidiaries, works at the convergence of media and mobile communications, delivering end-to-end products and solutions for mobile operators, application advertisers, device OEMs and other third parties to enable them to effectively monetize mobile content and generate higher value user acquisition.
2. Liquidity
The accompanying consolidated financial statements have been prepared in conformity with accounting principles generally accepted in the United States of America, which contemplate continuation of the Company as a going concern.
Our primary sources of liquidity have historically been issuance of common and preferred stock and debt. As of
March 31, 2018
, we had cash, including restricted cash, totaling approximately
$13,051
.
On September 28, 2016, the Company closed a private placement of
$16,000
aggregate principal amount of
8.75%
Convertible Senior Notes due 2020 (the “Notes”), netting cash proceeds to the Company of
$14,316
, after deducting the initial purchaser's discounts and commissions and the estimated offering expenses payable by Digital Turbine. The net proceeds from the issuance of the Notes were used to repay approximately
$11,000
of secured indebtedness, consisting of approximately
$3,000
to Silicon Valley Bank ("SVB") and
$8,000
to North Atlantic Capital ("NAC"), retiring both such debts in their entirety, and will otherwise be used for general corporate purposes and working capital. Refer to Note 9 "Debt" for more details.
On May 23, 2017, the Company entered into a Business Finance Agreement (the "Credit Agreement") with Western Alliance Bank (the "Bank"). The Credit Agreement provides for a
$5,000
total facility. Refer to Note 9 "Debt" for more details.
The Company anticipates that its primary sources of liquidity will continue be cash on hand, cash provided by operations, and the remaining credit available under the Credit Agreement. In addition, the Company may raise additional capital through future equity or, subject to restrictions contained in the indenture for the Notes and the Credit Agreement, debt financing to provide for greater flexibility to make acquisitions, make new investments in under-capitalized opportunities, or invest in organic opportunities. Additional financing may not be available on acceptable terms or at all. If the Company issues additional equity securities to raise funds, the ownership percentage of its existing stockholders would be reduced. New investors may demand rights, preferences, or privileges senior to those of existing holders of common stock.
During the evaluation by management of the Company’s financial position, factors such as working capital, current market capitalization, enterprise value, and the FY19 operating plan of the Company were considered when determining the ability of the Company to continue as a going concern. Recoverability of a major portion of the recorded asset amounts shown in the accompanying consolidated balance sheet is dependent upon continued operations of the Company, which, in turn, is dependent upon the Company’s ability to generate positive cash flows from operations. Based on the year over year revenue and gross margin increases, coupled with the Company’s management of operating expenses and access to debt, management has determined that when considering all relevant quantitative and qualitative factors that the Company has sufficient cash and capital resources to continue to operate its business for at least twelve months from the issuance date of this annual report on Form 10-K.
In view of the matters described in the preceding paragraphs, the consolidated financial statements do not include any adjustments related to the recoverability and classification of recorded asset amounts, or amounts and classifications of liabilities, that might be necessary should the Company be unable to continue its existence.
72
3. Discontinued Operations
On April 29, 2018, the Company entered into
two
distinct disposition agreements with respect to selected assets owned by our subsidiaries.
DT APAC and DT Singapore (together, “Pay Seller”), each wholly owned subsidiaries of the Company, entered into an Asset Purchase Pay Agreement (the “Pay Agreement”), dated as of April 23, 2018, with Chargewave Ptd Ltd (“Pay Purchaser”) to sell certain assets (the “Pay Assets”) owned by the Pay Seller related to the Company’s Direct Carrier Billing business. The Pay Purchaser is principally owned and controlled by Jon Mooney, an officer of the Pay Seller. At the closing of the asset sale, Mr. Mooney will no longer be employed by the Company or Pay Seller. As consideration for this asset sale, Digital Turbine is entitled to receive certain license fees, profit sharing and equity participation rights as outlined in the Company’s Form 8-K filed May 1, 2018 with the Securities and Exchange Commission. The transaction is subject to closing conditions and is expected to be completed in June 2018. With the sale of these assets, the Company has determined that is will exit the segment of the business previously referred to as the Content business.
DT Media (the “A&P Seller”), a wholly owned subsidiary of the Company, entered into an Asset Purchase Agreement (the “A&P Agreement”), dated as of April 28, 2018, with Creative Clicks B.V. (the “A&P Purchaser”) to sell business relationships with various advertisers and publishers (the “A&P Assets”) related to the Company’s Advertising and Publishing business. As consideration for this asset sale, we are entitled to receive a percentage of the gross profit derived from these customer agreements for a period of three years as outlined in the Company’s Form 8-K filed May 1, 2018 with the Securities and Exchange Commission. The transaction is subject to closing conditions and is expected to be completed in June 2018. With the sale of these assets, the Company has determined that is will exit the segment of the business previously referred to as the A&P business.
These dispositions will allow the Company to benefit from a streamlined business model, simplified operating structure, and enhanced management focus. Additionally, the Company expects to be able to generate additional cash via the announced transactions that can be re-invested into key O&O growth initiatives.
The following table summarizes the financial results of our discontinued operations for all periods presented herein:
Condensed Statements of Operations and Comprehensive Loss
For Discontinued Operations
(in thousands, except per share amounts)
|
Year ended March 31,
|
||||||||||||
|
2018
|
2017
|
2016
|
||||||||||
|
Net revenues
|
48,877
|
|
51,346
|
|
64,290
|
|
||||||
|
Total cost of revenues
|
42,950
|
|
49,241
|
|
55,931
|
|
||||||
|
Gross profit
|
5,927
|
|
2,105
|
|
8,359
|
|
||||||
|
Product development
|
2,194
|
|
2,752
|
|
6,100
|
|
||||||
|
Sales and marketing
|
1,444
|
|
2,357
|
|
3,158
|
|
||||||
|
General and administrative
|
1,835
|
|
2,045
|
|
2,502
|
|
||||||
|
Income / (loss) from operations
|
454
|
|
(5,049
|
)
|
(3,401
|
)
|
||||||
|
Loss on impairment of goodwill
|
(34,045
|
)
|
—
|
|
—
|
|
||||||
|
Interest and other income (expense), net
|
431
|
|
(77
|
)
|
(139
|
)
|
||||||
|
Loss from discontinued operations before income taxes
|
(33,160
|
)
|
(5,126
|
)
|
(3,540
|
)
|
||||||
|
Income tax provision
|
—
|
|
—
|
|
—
|
|
||||||
|
Net loss from discontinued operations, net of taxes
|
(33,160
|
)
|
(5,126
|
)
|
(3,540
|
)
|
||||||
|
Foreign currency translation adjustment
|
—
|
|
—
|
|
—
|
|
||||||
|
Comprehensive loss
|
(33,160
|
)
|
(5,126
|
)
|
(3,540
|
)
|
||||||
|
Basic and diluted net loss per common share
|
$
|
(0.47
|
)
|
$
|
(0.07
|
)
|
$
|
(0.06
|
)
|
|||
|
Weighted-average common shares outstanding, basic and diluted
|
70,263
|
|
66,511
|
|
61,763
|
|
||||||
73
Notes on the impairment of goodwill for discontinued operations
We perform an annual impairment assessment in the fourth quarter of each year, or more frequently if indicators of potential impairment exist, to determine whether it is more likely than not that the fair value of a reporting unit in which goodwill resides is less than its carrying value. Qualitative factors considered in this assessment include industry and market considerations, overall financial performance, and other relevant events and factors affecting the reporting unit. In connection with the planned sale of the Content reporting unit and the A&P business within the Advertising reporting segment, we performed a full analysis of the carrying value of the associated goodwill. Since the impairment assessment concluded, based on the future cash flows of the businesses, that it is more likely than not that the fair value is less than its carrying value, we performed the first step of the goodwill impairment test, which compares the fair value of the reporting unit to its carrying value. The carrying value of the net assets assigned to the afore mentioned reporting units exceeded the fair value of the reporting units, therefore the associated goodwill was impaired. The impairment recorded above represents the results of this assessment.
Based on the results of the annual impairment tests performed during the fourth quarter of fiscal
2018
, the Company recorded an impairment of approximately
$34,045
at
March 31, 2018
.
Details on assets and liabilities classified as held for disposal in the accompanying consolidated balance sheets are presented in the following table:
|
As of March 31,
|
||||||
|
2018
|
2017
|
|||||
|
Assets held for disposal
|
||||||
|
Accounts receivable, net of allowances of $578 and $369, respectively
|
8,013
|
|
5,891
|
|
||
|
Property and equipment, net
|
377
|
|
—
|
|
||
|
Goodwill
|
309
|
|
—
|
|
||
|
Prepaid expenses and other current assets
|
54
|
|
62
|
|
||
|
Current assets held for disposal
|
8,753
|
|
5,953
|
|
||
|
Property and equipment, net
|
—
|
|
371
|
|
||
|
Intangible assets, net
|
—
|
|
1,918
|
|
||
|
Goodwill
|
—
|
|
34,353
|
|
||
|
Long-lived assets held for disposal
|
—
|
|
36,642
|
|
||
|
Total assets held for disposal
|
8,753
|
|
42,595
|
|
||
|
Liabilities held for disposal
|
||||||
|
Accounts payable
|
8,789
|
|
8,081
|
|
||
|
Accrued license fees and revenue share
|
3,059
|
|
5,518
|
|
||
|
Accrued compensation
|
529
|
|
553
|
|
||
|
Other current liabilities
|
349
|
|
263
|
|
||
|
Current liabilities held for disposal
|
12,726
|
|
14,415
|
|
||
|
Other non-current liabilities
|
—
|
|
85
|
|
||
|
Long-term liabilities held for disposal
|
—
|
|
85
|
|
||
|
Total liabilities held for disposal
|
12,726
|
|
14,500
|
|
||
Assets and liabilities held for disposal as of March 31, 2018 are classified as current since we expect the dispositions to be completed within one year. In the prior year, the assets and liabilities held for disposal are classified separately as current or non-current because the non-current assets and liabilities do not meet the criteria for current classification as of March 31, 2017.
74
The following table provides reconciling cash flow information for our discontinued operations:
|
Year ended March 31,
|
|||||||||
|
2018
|
2017
|
2016
|
|||||||
|
Cash flows from operating activities
|
|||||||||
|
Net loss
|
(33,160
|
)
|
(5,126
|
)
|
(3,540
|
)
|
|||
|
Adjustments to reconcile net loss to net cash used in operating activities:
|
|||||||||
|
Depreciation and Amortization
|
1,037
|
|
5,564
|
|
3,101
|
|
|||
|
Change in allowance for doubtful accounts
|
194
|
|
85
|
|
261
|
|
|||
|
Stock-based compensation
|
189
|
|
386
|
|
—
|
|
|||
|
Impairment of intangible assets
|
1,065
|
|
—
|
|
—
|
|
|||
|
Impairment of goodwill
|
34,045
|
|
—
|
|
—
|
|
|||
|
(Increase) / decrease in assets:
|
|||||||||
|
Accounts receivable
|
(1,928
|
)
|
4,715
|
|
(14
|
)
|
|||
|
Deposits
|
—
|
|
69
|
|
(69
|
)
|
|||
|
Prepaid expenses and other current assets
|
8
|
|
(8
|
)
|
78
|
|
|||
|
Increase / (decrease) in liabilities:
|
|||||||||
|
Accounts payable
|
708
|
|
134
|
|
3,928
|
|
|||
|
Accrued license fees and revenue share
|
(2,459
|
)
|
(1,089
|
)
|
76
|
|
|||
|
Accrued compensation
|
(24
|
)
|
(665
|
)
|
269
|
|
|||
|
Other current liabilities
|
25
|
|
444
|
|
412
|
|
|||
|
Other non-current liabilities
|
(24
|
)
|
85
|
|
—
|
|
|||
|
Cash provided by / (used in) operating activities
|
(324
|
)
|
4,594
|
|
4,502
|
|
|||
|
Cash flows from investing activities
|
|||||||||
|
Capital expenditures
|
(142
|
)
|
(177
|
)
|
—
|
|
|||
|
Cash used in investing activities
|
(142
|
)
|
(177
|
)
|
—
|
|
|||
|
Cash provided by / (used in) discontinued operations
|
(466
|
)
|
4,417
|
|
4,502
|
|
|||
4. Summary of Significant Accounting Policies
Basis of Presentation
The financial statements have been prepared in accordance with accounting principles generally accepted in the United States of America (“GAAP”) and pursuant to the rules and regulations of the Securities and Exchange Commission (“SEC”) for annual financial statements. The financial statements, in the opinion of management, include all adjustments necessary for a fair statement of the results of operations, financial position and cash flows for each period presented.
Principles of Consolidation
The consolidated financial statements include the accounts of the Company and our wholly-owned subsidiaries. All material intercompany balances and transactions have been eliminated in consolidation.
Revenue Recognition
Advertising
Advertising revenues are generated via direct CPI, CPP, or CPA arrangements with application developers, or indirect CPI, CPP or CPA arrangements through advertising aggregators (ad networks). Transactions are processed by the Company’s mobile application management software, Ignite. The Company recognizes advertising related revenue when it has persuasive evidence of an arrangement, delivery of has occurred or services have been performed, the price is fixed or determinable, and collectability is reasonably assured.
75
The Company recognizes as revenue the amount billed to the application developer or advertising aggregator. Revenue share payments to the carrier are recorded as a cost of revenues. The Company has evaluated its agreements with the developers and aggregators and the carriers in accordance with the guidance at FASB ASC 605-45 Revenue Recognition – Principal Agent Considerations and has concluded that it is the principal under these agreements. Key indicators that it evaluated to reach this determination include:
|
•
|
The Company has the contractual relationship with the application developers or advertising aggregators (collectively, the advertisers), and we have the performance obligation to these parties;
|
|
•
|
Through our Ignite software, we provide application installation and management as well as detailed reporting to advertisers and carriers. We are responsible for billing the advertisers, and for reporting revenues and revenue share to the carriers;
|
|
•
|
As part of the application management process, we use our data, and post-install event data provided back to us by the advertisers, to match applications to end users. We currently target end users based on carrier, geography, demographics (including by handset type), among other attributes, by leveraging carrier data. We have discretion as to which applications are delivered to each end user;
|
|
•
|
Pricing is established in our agreements with advertisers. We negotiate pricing with the advertisers, based on prevailing rates typical in the industry; and
|
|
•
|
The Company is responsible for billing and collecting the gross amount from the advertiser. Our carrier agreements do not include any specific provisions that allow us to mitigate our credit risk by reducing the revenue share payable to the carrier.
|
In certain instances the carrier may enter directly into a CPI, CPP or CPA arrangement with a developer, where the installation will be made using the Company’s Ignite software services. In these instances, the Company receives a share of the carrier’s revenue, which is recognized on a net basis.
In addition to revenues from application developers and advertising aggregators, the Company may receive fees from the carriers relating to the initial set-up of the arrangements with the carriers. Set-up activities typically include customization, testing and implementation of the Ignite software for specific handsets. When the Company determines that the set-up fees do not have standalone value, such fees are deferred and recognized over the estimated period the carrier benefits from the set-up fee, which is generally the estimated life of the related handsets.
The Company has determined that certain set-up activities are within the scope of FASB ASC 985-605 Software Revenue Recognition and, accordingly, the Company applies the provisions of ASC 985-605 to the software components. As a result, the Company typically defers recognition of the set-up fee until all elements of the arrangement have been delivered. In those instances where the set-up fee covers ongoing support and maintenance, the fee is deferred and amortized over the term of the carrier agreement.
Additionally, the Company may receive direct payment arrangements from carriers for direct access to the Ignite platform on handsets deployed on their network. These per device license fees are paid directly to the Company by the carrier for an installed base at a point in time, usually monthly, as designated in each arrangement. These fees are recognized gross at the point in time when the devices are measured.
Comprehensive Loss
Comprehensive loss consists of two components, net loss and other comprehensive loss. Other comprehensive loss refers to gains and losses that under generally accepted accounting principles are recorded as an element of stockholders’ equity, but are excluded from net income. The Company’s other comprehensive income currently includes only foreign currency translation adjustments.
Cash and Cash Equivalents
The Company considers all highly liquid short-term investments purchased with a maturity of three months or less to be cash equivalents.
76
Restricted Cash
Cash accounts that are restricted as to withdrawal or usage are presented as restricted cash. As of
March 31, 2018
and
March 31, 2017
, the Company had
$331
and
$331
, respectively, of restricted cash held by a bank in a collateral account as collateral to cover the Company's corporate credit cards as well as a letter of credit issued to guarantee a facility lease.
Accounts Receivable
The Company maintains reserves for potential credit losses on accounts receivable. Management reviews the composition of accounts receivable and analyzes historical bad debts, customer concentrations, customer credit worthiness, current economic trends and changes in customer payment patterns to evaluate the adequacy of these reserves.
Deposits
As of
March 31, 2018
, the Company had deposits of
$151
comprised of facility and equipment lease deposits, as compared to
$121
as of
March 31, 2017
.
Fair Value of Financial Instruments
The Company measures certain financial assets and liabilities at fair value based on the exchange price that would be received for an asset or paid to transfer a liability (an exit price) in the principal or most advantageous market for the asset or liability in an orderly transaction between market participants. Where available, fair value is based on or derived from observable market prices or other observable inputs. Where observable prices or inputs are not available, valuation techniques are applied. These valuation techniques involve some level of management estimation and judgment, the degree of which is dependent on the price transparency for the instruments or market and the instruments’ complexity.
The carrying amounts of certain financial instruments, such as cash equivalents, short term investments, accounts receivable, accounts payable and accrued liabilities, approximate fair value due to their relatively short maturities. The fair value of the Notes issued on September 28, 2016 is determined using the residual method of accounting whereby, first, a portion of the proceeds from the issuance of the Notes is allocated to derivatives embedded in the Notes and the warrants issued in connection with the issuance of the Notes, and the proceeds so allocated are accounted for as a convertible note embedded derivative liability and warrant liability, respectively, and second, the remainder of the proceeds from the issuance of the Notes is allocated to the convertible notes, resulting in debt discount. The convertible notes are carried on the consolidated balance sheet on a historical cost basis, net of discounts and debt issuance costs.
The Company estimates the fair value of the convertible note embedded derivative liability and warrant liability using a lattice approach that incorporates a Monte Carlo simulation valuation model that considers the Company's future stock price, stock price volatility, probability of a change of control, and the trading information of the Company's common stock into which the Notes are or may become convertible.
Changes in the inputs into these valuation models have a significant impact on the estimated fair value of the convertible note embedded derivative liability and warrant liability. For example, a decrease (increase) in the stock price results in a decrease (increase) in the estimated fair value of the liabilities. The change in the fair value of the convertible note embedded derivative liability and warrant liability are primarily related to the change in price of the Company's underlying common stock and are reflected in the consolidated statements of operations and comprehensive loss as "Change in fair value of convertible note embedded derivative liability” and "Change in fair value of warrant liability." Refer to Note 10 "Fair Value Measurements" for more details.
77
Convertible Note Embedded Derivative Liability
Embedded derivatives that are required to be bifurcated from the underlying debt instrument (i.e. host) are accounted for and valued as a separate financial instrument. We evaluated the terms and features of the Notes issued on September 28, 2016 and identified embedded derivatives (i.e. conversion options that contain “make-whole interest” provisions, fundamental change provisions, or down round conversion price adjustment provisions) requiring bifurcation and accounting at fair value due to the economic and contractual characteristics of the embedded derivatives meeting the criteria for bifurcation and separate accounting. ASC 815-10-15-83 (c) states that if terms implicitly or explicitly require or permit net settlement, then it can readily be settled net by means outside the contract, or it provides for delivery of an asset that puts the recipient in a position not substantially different from net settlement. The conversion features related to the Notes consists of a “make-whole interest” provision, fundamental change provision, and down round conversion price adjustment provisions, which if the Notes were to be converted, would put the convertible note holder in a position not substantially different from net settlement. Given this fact pattern, the conversion features meet the definition of embedded derivatives and require bifurcation and accounting at fair value.
See Note 10, "Fair Value Measurements," of this report for a description of our embedded derivatives related to the Notes and information on the valuation model used to calculate the fair value of the embedded derivatives, otherwise called the convertible note embedded derivative liability. Changes in the inputs into the valuation model may have a significant impact on the estimated fair value of the convertible note embedded derivative liability. For example, a decrease (increase) in the stock price results in a decrease (increase) in the estimated fair value of the liability. Change in the fair value of the liability is primarily attributable to the change in price of the underlying common stock of the Company and is reflected in our consolidated statements of operations as “Change in fair value of convertible note embedded derivative liability.”
Warrant Liability
The Company issued detachable warrants with the Notes issued on September 28, 2016. The Company accounts for its warrants issued in accordance with US GAAP accounting guidance under ASC 815 applicable to derivative instruments, which requires every derivative instrument within its scope to be recorded on the balance sheet as either an asset or liability measured at its fair value, with changes in fair value recognized in earnings. Based on this guidance, the Company determined that these warrants did not meet the criteria for classification as equity. Accordingly, the Company classified the warrants as long-term liabilities. The warrants are subject to re-measurement at each balance sheet date, with any change in fair value recognized as a component of other income (expense), net in the consolidated statements of operations. We estimated the fair value of these warrants at the respective balance sheet dates using a lattice approach that incorporates a Monte Carlo simulation that considers the Company's future stock price. Option pricing models employ subjective factors to estimate warrant liability; and, therefore, the assumptions used in the model are judgmental.
See Note 10, "Fair Value Measurements," of this report for a description of our warrant liability and information on the valuation model used to calculate the fair value of the warrant liability. Changes in the inputs into the valuation model may have a significant impact on the estimated fair value of the warrant liability. For example, a decrease (increase) in the stock price results in a decrease (increase) in the estimated fair value of the liability. The change in the fair value of the liability is primarily related to the change in price of the underlying common stock of the Company and is reflected in our consolidated statements of operations as “Change in fair value of warrant liability.”
Debt Issuance Costs
In April 2015, the FASB issued accounting guidance which requires that debt issuance costs related to a recognized debt liability be presented in the balance sheet as a direct deduction from the carrying amount of that debt liability under ASU 2015-03. The guidance is effective for fiscal years beginning after December 15, 2015, including interim periods within those fiscal years; as such, the Company adopted this guidance in the quarter ended June 30, 2016. The Company has determined that adopting ASU 2015-03 did not have a significant impact on its consolidated results of operations, financial condition, and cash flows. Refer to Note 9 "Debt" for more details.
78
Carrier Revenue Share and Content Provider License Fees
Carrier Revenue Share
Revenues generated from advertising via direct CPI, CPP or CPA arrangements with application developers, or indirect arrangements through advertising aggregators (ad networks) are shared with the carrier and the shared revenue is recorded as a cost of goods sold. In each case the revenue share with the carrier varies depending on the agreement with the carrier, and, in some cases, is based upon revenue tiers.
Software Development Costs
The Company applies the principles of FASB ASC 985-20, Accounting for the Costs of Computer Software to Be Sold, Leased, or Otherwise Marketed (“ASC 985-20”). ASC 985-20 requires that software development costs incurred in conjunction with product development be charged to research and development expense until technological feasibility is established. Thereafter, until the product is released for sale, software development costs must be capitalized and reported at the lower of unamortized cost or net realizable value of the related product.
The Company has adopted the “tested working model” approach to establishing technological feasibility for its products. Under this approach, the Company does not consider a product in development to have passed the technological feasibility milestone until the Company has completed a model of the product that contains essentially all the functionality and features of the final product and has tested the model to ensure that it works as expected. Through fiscal year 2016, the Company had not incurred significant costs between the establishment of technological feasibility and the release of a product for sale; thus, the Company had expensed all software development costs as incurred. In fiscal year 2017, the Company began capitalizing costs related the development of software to be sold, leased, or otherwise marketed as we believe we have met the "tested working model" threshold. Costs will continue to be capitalized until the related software is released. The Company considers the following factors in determining whether costs can be capitalized: the emerging nature of the mobile market; the gradual evolution of the wireless carrier platforms and mobile phones for which it develops products; the lack of pre-orders or sales history for its products; the uncertainty regarding a product’s revenue-generating potential; its lack of control over the carrier distribution channel resulting in uncertainty as to when, if ever, a product will be available for sale; and its historical practice of canceling products at any stage of the development process.
The Company also applies the principles of FASB ASC 350-40, Accounting for the Cost of Computer Software Developed or Obtained for Internal Use (“ASC 350-40”). ASC 350-40 requires that software development costs incurred before the preliminary project stage be expensed as incurred. We capitalize development costs related to these software applications once the preliminary project stage is complete and it is probable that the project will be completed and the software will be used to perform the function intended. For fiscal 2018, 2017, and 2016 the Company capitalized software development costs in the amount of
$1,641
,
$1,387
, and
$1,263
.
Product Development Costs
The Company charges costs related to research, design and development and deployment of products to product development expense as incurred. The types of costs included in product development expenses include salaries, contractor fees and allocated facilities costs.
Advertising Expenses
The Company expenses the costs of advertising the first time the advertising takes place. Advertising expense was
$83
,
$263
, and
$396
in the years ended
March 31, 2018
,
2017
, and
2016
, respectively.
Fair Value of Financial Instruments
As of
March 31, 2018
and
2017
, the carrying value of cash, accounts receivable, prepaid expenses and other current assets, accounts payable, accrued license fees, accrued compensation, and other current liabilities approximates fair value due to the short-term nature of such instruments.
79
Foreign Currency Translation
The Company uses the United States dollar for financial reporting purposes. Assets and liabilities of foreign operations are translated using current rates of exchange prevailing at the balance sheet date. Equity accounts have been translated at their historical exchange rates when the capital transaction occurred. Statement of Operations amounts are translated at average rates in effect for the reporting period. The foreign currency translation adjustment loss of
$4
,
$119
, and
$150
in the years ended
March 31, 2018
,
2017
, and
2016
has been reported as a component of comprehensive loss in the consolidated statements of stockholders’ equity and comprehensive loss.
Concentrations of Credit Risk and Significant Customers
Financial instruments that potentially subject the Company to significant concentrations of credit risk consist primarily of cash and accounts receivable. A significant portion of the Company’s cash is held at one major financial institution that the Company's management has assessed to be of high credit quality. The Company has not experienced any losses in such accounts.
The Company mitigates its credit risk with respect to accounts receivable by performing credit evaluations and monitoring advertisers' and carriers' accounts receivable balances. As of
March 31, 2018
, one major customer represented
28.3%
of the Company's net accounts receivable balance. As of
March 31, 2017
, three major customers represented
17.8%
,
16.2%
, and
10.7%
of the Company's net accounts receivable balance.
With respect to revenue concentration, the Company defines a customer as an advertiser or a carrier that is a distinct source of revenue and is legally bound to pay for the services that the Company delivers on the advertiser’s or carrier's behalf. The Company counts all advertisers and carriers within a single corporate structure as one customer, even in cases where multiple brands, branches, or divisions of an organization enter into separate contracts with the Company. During the years ended
March 31, 2018
, two major customers represented
23.5%
, and
16.1%
of our consolidated net revenue, respectively. During the year ended
March 31, 2017
three major customers represented
26.1%
,
21.9%
, and
15.9%
of our consolidated net revenues. During the year ended
March 31, 2016
, no single customer represented greater than 10% of our revenue.
Property and Equipment
Property and equipment is stated at cost less accumulated depreciation and amortization. Depreciation and amortization is calculated using the straight-line method over the estimated useful lives of the related assets. Estimated useful lives are the lesser of
8
to
10
years or the term of the lease for leasehold improvements and
3
to
5
years for other assets.
Goodwill and Indefinite Life Intangible Assets
Goodwill represents the excess of cost over fair value of net assets of businesses acquired. In accordance with FASB ASC 350-20 Goodwill and Other Intangible Assets, the value assigned to goodwill and indefinite lived intangible assets, including trademarks and trade names, is not amortized to expense, but rather they are evaluated at least on an annual basis to determine if there are potential impairments. If the fair value of the reporting unit is less than its carrying value, an impairment loss is recorded to the extent that the implied fair value of the reporting unit goodwill is less than the carrying value. If the fair value of an indefinite lived intangible (such as trademarks and trade names) is less than its carrying amount, an impairment loss is recorded. Fair value is determined based on discounted cash flows, market multiples or appraised values, as appropriate. Discounted cash flow analysis requires assumptions about the timing and amount of future cash inflows and outflows, risk, the cost of capital, and terminal values. Each of these factors can significantly affect the value of the intangible asset. The estimates of future cash flows, based on reasonable and supportable assumptions and projections, require management’s judgment. Any changes in key assumptions about the Company’s businesses and their prospects, or changes in market conditions, could result in an impairment charge. Some of the more significant estimates and assumptions inherent in the intangible asset valuation process include: the timing and amount of projected future cash flows; the discount rate selected to measure the risks inherent in the future cash flows; and the assessment of the asset’s life cycle and the competitive trends impacting the asset, including consideration of any technical, legal or regulatory trends.
80
Impairment of Long-Lived Assets and Finite Life Intangibles
Long-lived assets, including, intangible assets subject to amortization primarily consist of customer lists, license agreements and software that have been acquired are amortized using the straight-line method over their useful life ranging from
two
to
fourteen
years and are reviewed for impairment in accordance with FASB ASC 360-10, Accounting for the Impairment or Disposal of Long-Lived Assets , whenever events or changes in circumstances indicate that the carrying amount of an asset may not be recoverable. Recoverability of assets to be held and used is measured by a comparison of the carrying amount of an asset to future undiscounted net cash flows expected to be generated by the asset. If such assets are considered to be impaired, the impairment to be recognized is measured by the amount by which the carrying amount of the assets exceeds the fair value of the assets. Assets to be disposed of are reported at the lower of the carrying amount or fair value less costs to sell.
There were no indications of impairment present or that the carrying amounts may not be recoverable during the fiscal years ended
March 31, 2018
.
In the fiscal year ended March 31, 2017, the Company determined that there was an impairment of intangible assets of
$757
related to the XYO developed technology being fully impaired. The impairment is detailed in Note 7 "Intangible Assets" to our consolidated financial statements under Item 8 of this Annual Report.
Income Taxes
The Company accounts for income taxes in accordance with FASB ASC 740-10, Accounting for Income Taxes (“ASC 740-10”), which requires recognition of deferred tax assets and liabilities for the expected future tax consequences of events that have been included in its financial statements or tax returns. Under ASC 740-10, the Company determines deferred tax assets and liabilities for temporary differences between the financial reporting basis and the tax basis of assets and liabilities along with net operating losses, if it is more likely than not the tax benefits will be realized using the enacted tax rates in effect for the year in which it expects the differences to reverse. To the extent a deferred tax asset cannot be recognized, a valuation allowance is established if necessary.
ASC 740-10 prescribes that a company should use a more-likely-than-not recognition threshold based on the technical merits of the tax position taken. Tax positions that meet the “more-likely-than-not” recognition threshold should be measured as the largest amount of the tax benefits, determined on a cumulative probability basis, which is more likely than not to be realized upon ultimate settlement in the financial statements. We recognize interest and penalties related to income tax matters as a component of the provision for income taxes.
81
Stock-Based Compensation
We have applied FASB ASC 718 Share-Based Payment (“ASC 718”) and accordingly, we record stock-based compensation expense for all of our stock-based awards.
Under ASC 718, we estimate the fair value of stock options granted using the Black-Scholes option pricing model. The fair value for awards that are expected to vest is then amortized on a straight-line basis over the requisite service period of the award, which is generally the option vesting term. The amount of expense recognized represents the expense associated with the stock options we expect to ultimately vest based upon an estimated rate of forfeitures; this rate of forfeitures is updated as necessary and any adjustments needed to recognize the fair value of options that actually vest or are forfeited are recorded.
The Black-Scholes option pricing model, used to estimate the fair value of an award, requires the input of subjective assumptions, including the expected volatility of our common stock, interest rates, dividend rates and an option’s expected life. As a result, the financial statements include amounts that are based upon our best estimates and judgments relating to the expenses recognized for stock-based compensation.
The Company grants restricted stock subject to market or performance conditions that vest based on the satisfaction of the conditions of the award. Unvested restricted stock entitles the grantees to dividends, if any, with voting rights determined in each agreement. The fair market values of market condition-based awards are determined using the Monte Carlo simulation method. The Monte Carlo simulation method is subject to variability as several factors utilized must be estimated, including the derived service period, which is estimated based on the Company’s judgment of likely future performance and the Company’s stock price volatility. The fair value of performance-based awards is determined using the market closing price on the grant date. Derived service periods and the periods charged with compensation expense for performance-based awards are estimated based on the Company’s judgment of likely future performance and may be adjusted in future periods depending on actual performance.
Preferred Stock
The Company applies the guidance enumerated in FASB ASC 480-10, Accounting for Certain Financial Instruments with Characteristics of both Liabilities and Equity (“ASC 480-10”) when determining the classification and measurement of preferred stock. Preferred shares subject to mandatory redemption (if any) are classified as liability instruments and are measured at fair value in accordance with ASC 480-10. All other issuances of preferred stock are subject to the classification and measurement principles of ASC 480-10. Accordingly, the Company classifies conditionally redeemable preferred shares (if any), which includes preferred shares that feature redemption rights that are either within the control of the holder or subject to redemption upon the occurrence of uncertain events not solely within the Company’s control, as temporary equity. At all other times, the Company classifies its preferred shares in stockholders’ equity.
Use of Estimates
The preparation of financial statements in accordance with GAAP requires the use of management's estimates. These estimates are subjective in nature and involve judgments that affect the reported amounts of assets and liabilities, the disclosure of contingent assets and liabilities at fiscal year-end, and the reported amounts of revenues and expenses during the fiscal year. Actual results could differ from those estimates.
Recently Issued Accounting Pronouncements
In August 2017, the FASB issued Accounting Standard Update 2017-12: Targeted Improvements to Accounting for Hedging Activities. This update makes more financial and non-financial hedging strategies eligible for hedge accounting. It also amends the presentation and disclosure requirements and changes how companies assess effectiveness. This guidance is effective for annual reporting periods, and interim periods within those annual periods, beginning after December 15, 2018. Early adoption is permitted upon its issuance. The amendments in this update should be applied on a modified retrospective basis except for the presentation and disclosure guidance which is required prospectively. The Company will adopt ASU 2017-12 during the quarter ended June 30, 2019, and is currently assessing the impact of the future adoption of this standard on its consolidated results of operations, financial condition and cash flows.
82
In July 2017, the FASB issued ASU 2017-11, Accounting for Certain Financial Instruments with Down Round Features, which addresses the complexity of accounting for certain financial instruments with down round features under current guidance criterion. With this new update, a down round feature no longer precludes equity classification when assessing whether the instrument is indexed to an entity’s own stock. The amendments also clarify existing disclosure requirements for equity-classified instruments. This guidance is to be applied retrospectively for instruments outstanding as of the adoption date. This guidance is effective for annual reporting periods, and interim periods within those annual periods, beginning after December 15, 2018. Early application is permitted. The Company will adopt ASU 2017-11 during the quarter ended June 30, 2019, and does not expect the impact of this ASU to have a material impact on its consolidated results of operations, financial condition and cash flows.
In May 2017, the FASB issued ASU 2017-09, Compensation – Stock Compensation, which modifies the scope of share-based payment award modification accounting in an effort to provide clarity and reduce diversity in practice under old guidance. Under this new standard, an entity should apply modification accounting (Topic 718) unless specific criterion related to fair value, vesting conditions, and equity/liability classification are all met. This guidance is to be applied prospectively for awards modified on or after the adoption date. This guidance is effective for annual reporting periods, and interim periods within those annual periods, beginning after December 15, 2017. Early application is permitted. The Company will adopt ASU 2017-09 during the quarter ended June 30, 2018, and does not expect the impact of this ASU to have a material impact on its consolidated results of operations, financial condition and cash flows.
In January 2017, the FASB issued ASU 2017-04, Intangibles – Goodwill and Other, which simplifies the subsequent measurement of goodwill by eliminating Step 2 of the goodwill impairment test. Under this new standard, an entity should perform its goodwill impairment test by comparing the fair value of a reporting unit with its carrying amount and then recognize an impairment charge, as necessary, for the amount by which the carrying amount exceeds the reporting unit’s fair value, not to exceed the total amount of goodwill allocated to that reporting unit. This guidance is effective for annual reporting periods beginning after December 15, 2019. Early application is permitted. The Company will adopt ASU 2017-04 during the quarter ended June 30, 2020, and does not expect the impact of this ASU to have a material impact on its consolidated results of operations, financial condition and cash flows.
February 2016, the FASB issued Accounting Standards Codification (“ASC”) 842 (“ASC 842”), Leases, which replaces the existing guidance in ASC 840, Leases. The amendment is effective for fiscal years, and interim periods within those years, beginning after December 15, 2018. ASC 842 requires a dual approach for lessee accounting under which a lessee would account for leases as finance leases or operating leases. Both finance leases and operating leases will result in the lessee recognizing a right-of-use ("ROU") asset and a corresponding lease liability. For finance leases the lessee would recognize interest expense and amortization of the ROU asset and for operating leases the lessee would recognize a straight-line total lease expense. The Company will adopt ASC 842 during the quarter ended June 30, 2019, and is evaluating the impact of the adoption on its consolidated results of operations, financial condition and cash flows.
In May 2014, the FASB issued ASU 2014-09, Revenue from Contracts with Customers, which requires an entity to recognize the amount of revenue to which it expects to be entitled for the transfer of promised goods or services to customers. The ASU will replace most existing revenue recognition guidance in U.S. GAAP when it becomes effective. Additionally, ASU 2014-09 requires enhanced disclosures about the nature, amount, timing and uncertainty of revenue and cash flows arising from customer contracts. In July 2015, the FASB decided to delay the effective date of ASU 2014-09 by one year. The deferral results in the new revenue standard being effective for fiscal years, and interim periods within those years, beginning after December 15, 2017. ASU 2014-09, as amended, is effective using either the full retrospective or modified retrospective transition approach for fiscal years, and for interim periods within those years. In 2016 and 2017, the FASB has issued several accounting standards updates to clarify certain topics within ASU 2014-09. The Company will adopt ASU 2014-09, and its related clarifying ASUs, during the quarter ended June 30, 2018. Initial indications surrounding the adoption of ASC 606 do not indicate that there will be a material impact on the consolidated financial position, however the Company is currently reviewing the impact of the capitalization of costs to obtain a contract as defined in ASC 606, and a final determination regarding the impact has not yet been made. The Company currently plans to adopt under the modified retrospective method, however, a final decision regarding the adoption method has not been made at this time.
Other authoritative guidance issued by the FASB (including technical corrections to the FASB Accounting Standards Codification), the American Institute of Certified Public Accountants, and the SEC did not, or are not expected to have a material effect on the Company’s consolidated financial statements.
83
5. Accounts Receivable
|
March 31, 2018
|
March 31, 2017
|
|||||||
|
Billed
|
$
|
9,172
|
|
$
|
6,582
|
|
||
|
Unbilled
|
8,390
|
|
4,309
|
|
||||
|
Allowance for doubtful accounts
|
(512
|
)
|
(228
|
)
|
||||
|
Accounts receivable, net
|
$
|
17,050
|
|
$
|
10,663
|
|
||
Billed accounts receivable represent amounts billed to customers that have yet to be collected. Unbilled accounts receivable represent revenue recognized, but billed after period end. All unbilled receivables as of
March 31, 2018
are expected to be billed and collected within twelve months.
The Company recorded
$530
,
$294
, and
$142
of bad debt expense during the years ended
March 31, 2018
,
2017
, and
2016
respectively.
6. Property and Equipment
|
March 31, 2018
|
March 31, 2017
|
|||||||
|
Computer-related equipment
|
$
|
5,464
|
|
$
|
3,621
|
|
||
|
Furniture and fixtures
|
115
|
|
112
|
|
||||
|
Leasehold improvements
|
166
|
|
12
|
|
||||
|
5,745
|
|
3,745
|
|
|||||
|
Accumulated depreciation
|
(2,988
|
)
|
(1,739
|
)
|
||||
|
Property and equipment, net
|
$
|
2,757
|
|
$
|
2,006
|
|
||
Depreciation expense for the years ended
March 31, 2018
,
2017
, and
2016
was
$1,244
,
$875
, and
$396
, respectively.
During the years ended
March 31, 2018
and
2017
, depreciation expense includes
$931
and
$867
respectively, related to internal use assets included in General and Administrative Expense and
$313
and
$8
, respectively, related to internally developed software to be sold, leased, or otherwise marketed included in Other Direct Costs of Revenue. Depreciation expense in the prior year comparative periods related exclusively to internal use assets and is included in General and Administrative Expense. During the year ended March 31,
2016
, all depreciation expense related to internal use assets and included entirely in General and Administrative Expense.
7. Intangible Assets
We make judgments about the recoverability of purchased finite-lived intangible assets whenever events or changes in circumstances indicate that an impairment may exist. Recoverability of finite-lived intangible assets is measured by comparing the carrying amount of the asset to the future undiscounted cash flows that the asset is expected to generate. We perform an annual impairment assessment in the fourth quarter of each year for indefinite-lived intangible assets, or more frequently if indicators of potential impairment exist, to determine whether it is more likely than not that the carrying value of the assets may not be recoverable. Recoverability of indefinite-lived intangible assets is measured by comparing the carrying amount of the asset to the future undiscounted cash flows that the asset is expected to generate. If we determine that an individual asset is impaired, the amount of any impairment is measured as the difference between the carrying value and the fair value of the impaired asset.
The assumptions and estimates used to determine future values and remaining useful lives of our intangible and other long-lived assets are complex and subjective. They can be affected by various factors, including external factors such as industry and economic trends, and internal factors such as changes in our business strategy and our forecasts.
We complete our annual impairment tests in the fourth quarter of each year unless events or circumstances indicate that an asset may be impaired. During the fiscal year ended
March 31, 2018
,
2017
, and
2016
, we determined that there were no indicators of impairment related to the Company's continuing operations.
84
The components of intangible assets as at
March 31, 2018
and
2017
were as follows:
|
|
As of March 31, 2018
|
|||||||||||
|
Cost
|
Accumulated Amortization
|
Net
|
||||||||||
|
Software
|
$
|
5,826
|
|
$
|
(4,595
|
)
|
$
|
1,231
|
|
|||
|
Total
|
$
|
5,826
|
|
$
|
(4,595
|
)
|
$
|
1,231
|
|
|||
|
|
As of March 31, 2017
|
|||||||||||
|
Cost
|
Accumulated Amortization
|
Net
|
||||||||||
|
Software
|
$
|
6,644
|
|
$
|
(3,997
|
)
|
$
|
2,647
|
|
|||
|
Total
|
$
|
6,644
|
|
$
|
(3,997
|
)
|
$
|
2,647
|
|
|||
The Company has included amortization of acquired intangible assets directly attributable to revenue-generating activities in cost of revenues.
During the years ended
March 31, 2018
,
2017
, and
2016
, the Company recorded amortization expense in the amount of
$1,416
,
$1,731
, and
$7,477
, respectively.
Based on the amortizable intangible assets as of
March 31, 2018
, we estimate amortization expense for the next five years to be as follows:
|
For the Year Ending March 31,
|
Amortization Expense
|
|||
|
2019
|
$
|
1,231
|
|
|
|
Thereafter
|
—
|
|
||
|
Total
|
$
|
1,231
|
|
|
The Company has
no
further amortization expense beyond fiscal 2019.
Below is a summary of intangible assets:
|
|
Intangible Assets
|
|||
|
Balance as of March 31, 2015
|
19,967
|
|
||
|
Amortization of intangibles
|
(7,477
|
)
|
||
|
Balance as of March 31, 2016
|
12,490
|
|
||
|
Amortization of intangibles
|
(7,087
|
)
|
||
|
Intangible asset write-off
|
(2,756
|
)
|
||
|
Balance as of March 31, 2017
|
2,647
|
|
||
|
Amortization of intangibles
|
(1,416
|
)
|
||
|
Balance as of March 31, 2018
|
$
|
1,231
|
|
|
85
8. Goodwill
A reconciliation of the changes to the Company’s carrying amount of goodwill for the periods or as of the dates indicated:
|
O&O
|
Total
|
|||||||
|
Goodwill as of March 31, 2015
|
$
|
42,268
|
|
$
|
42,268
|
|
||
|
Adjustments
|
—
|
|
—
|
|
||||
|
Goodwill as of March 31, 2016
|
$
|
42,268
|
|
$
|
42,268
|
|
||
|
Adjustments
|
—
|
|
—
|
|
||||
|
Goodwill as of March 31, 2017
|
42,268
|
|
42,268
|
|
||||
|
Adjustments
|
—
|
|
—
|
|
||||
|
Goodwill as of March 31, 2018
|
$
|
42,268
|
|
$
|
42,268
|
|
||
Fair value is defined under ASC 820, Fair Value Measurements and Disclosures as “the price that would be received to sell an asset or paid to transfer a liability in an orderly transaction between market participants at the measurement date.” The Company considered the income and market approaches to derive an opinion of value. Under the income approach, the Company utilized the discounted cash flow method, and under the market approach, consideration was given to the guideline public company method, the merger and acquisition method, and the market capitalization method.
Goodwill is recorded when the purchase price for an acquisition exceeds the estimated fair value of the net tangible and identified intangible assets acquired. Goodwill is allocated to our reporting units based on relative fair value of the future benefit of the purchased operations to our existing business units as well as the acquired business unit. Reporting units may be operating segments as a whole or an operation one level below an operating segment, referred to as a component. Our reporting units are consistent with the operating segments identified in Part I, Item 1 under the section “Business” of this Form 10-K.
We perform an annual impairment assessment in the fourth quarter of each year, or more frequently if indicators of potential impairment exist, to determine whether it is more likely than not that the fair value of a reporting unit in which goodwill resides is less than its carrying value. For reporting units in which this assessment concludes that it is more likely than not that the fair value is more than its carrying value, goodwill is not considered impaired and we are not required to perform the two-step goodwill impairment test. Qualitative factors considered in this assessment include industry and market considerations, overall financial performance, and other relevant events and factors affecting the reporting unit.
For reporting units in which the impairment assessment concludes that it is more likely than not that the fair value is less than its carrying value, we perform the first step of the goodwill impairment test, which compares the fair value of the reporting unit to its carrying value. If the fair value of the reporting unit exceeds the carrying value of the net assets assigned to that unit, goodwill is not considered impaired and we are not required to perform additional analysis. If the carrying value of the net assets assigned to the reporting unit exceeds the fair value of the reporting unit, then we must perform the second step of the goodwill impairment test to determine the implied fair value of the reporting unit’s goodwill. If we determine during the second step that the carrying value of a reporting unit’s goodwill exceeds its implied fair value, we record an impairment loss equal to the difference.
Determining the fair value of a reporting unit involves the use of significant estimates and assumptions. The goodwill impairment test we utilized in the fourth quarter ended
March 31, 2018
utilized an income method to estimate a reporting unit’s fair value. The Company believes that the income method is the best method of determining fair value for our Company. The income method is based on a discounted future cash flow approach that uses the following reporting unit estimates: revenue, based on assumed growth rates; estimated costs; and appropriate discount rates based on a reporting unit's weighted average cost of capital as determined by considering the observable weighted average cost of capital of comparable companies. We test the reasonableness of the inputs and outcomes of our discounted cash flow analysis against available comparable market data and against the Company’s market capitalization value which includes a control premium estimate. A reporting unit’s carrying value represents the assignment of various assets and liabilities.
Based on the analysis performed for fiscal
2018
all continuing operations, which is comprised entirely of the O&O reporting unit, have an estimated fair value in excess of the carrying value of the associated goodwill. The estimated fair value exceeded the carrying value by greater than 10%.
In the years ended March 31, 2017 and 2016, the Company determined there was
no
impairment to goodwill.
86
9. Debt
|
March 31, 2018
|
March 31, 2017
|
|||||
|
Short-term debt
|
||||||
|
Short-term debt, net of debt issuance costs of $205 and $0, respectively
|
1,445
|
|
—
|
|
||
|
March 31, 2018
|
March 31, 2017
|
|||||||
|
Long-term debt
|
||||||||
|
Convertible notes, net of debt issuance costs and discounts of $1,827 and $6,315, respectively
|
$
|
3,873
|
|
$
|
9,685
|
|
||
Convertible Notes
On September 28, 2016, the Company sold to the Initial Purchaser,
$16,000
aggregate principal amount of
8.75%
convertible notes maturing on September 23, 2020, unless converted, repurchased or redeemed in accordance with their terms prior to such date. The
$16,000
aggregate principal received from the issuance of the Notes was initially allocated between long-term debt at
$11,084
, the convertible note embedded derivative liability at
$3,693
(see Note 10 "Fair Value Measurements" for more information), and the warrant liability at
$1,223
(see Note 10 "Fair Value Measurements" for more information), within the consolidated balance sheet. The Company’s assessment of the significance of a particular input to the fair value measurement in its entirety requires management to make judgments and consider factors specific to the liability. Fair value of the Notes is determined using the residual method of accounting whereby, first, a portion of the proceeds from the issuance of the Notes is allocated to derivatives embedded in the Notes and the warrants issued in connection with the issuance of the Notes, and the proceeds so allocated are accounted for as a convertible note embedded derivative liability and warrant liability, respectively (see Note 10 "Fair Value Measurements for more information), and second, the remainder of the proceeds from the issuance of the Notes is allocated to the convertible notes, resulting in an original issue debt discount amounting to
$4,916
. As of the close of the issuance of the Notes on September 28, 2016, the Company incurred
$1,700
in debt issuance costs directly related to the issuance of the Notes, which in accordance with ASU 2015-03, the Company has recorded these costs as a direct reduction to the face value of the Notes and will amortize this amount over the life of the Notes as a component of interest expense on the consolidated statement of operation and comprehensive loss. During the remainder of fiscal 2017, the Company further incurred
$234
in costs directly associated with the issuance of the Notes, for the preparation and filing of the registration statement on Form S-1 to register the underlying common stock related to the Notes issued and related Warrants issued along with the Notes, which was required to be done in accordance with the Indenture (as defined below). The convertible notes will remain on the consolidated balance sheet at historical cost, accreted up for the amount of cumulative amortization of the debt discount over the life of the debt. If we or the note holders elect not to settle the debt through conversion, we must settle the Notes at face value at
$16,000
. Therefore, the liability component will be accreted up to the face value of the Notes, which will result in additional non-cash interest expense being recognized within the consolidated statements of operations and comprehensive loss through the Notes maturity date.
During the year ended
March 31, 2018
, holders of
$10,300
of Notes elected to convert such Notes. These Notes were extinguished by issuing shares of common stock, based on the applicable conversion price of
$1.364
per share, plus additional shares of common stock and cash to satisfy the early conversion payments required by the Indenture. Associated with this conversion, gross debt net of debt discount and capitalized debt issuance costs of
$2,591
and
$1,019
, respectively, was extinguished for a net debt extinguishment of
$6,690
. In total,
8,624,445
shares of common stock were issued and
$247
in cash was paid to settle these positions. This resulted in an adjustment of approximately
$14,238
to additional paid in capital to reflect the shares issued upon conversion. A loss on extinguishment of debt of
$1,785
was recorded as a result of the difference in carrying value of the debt, inclusive of the associated debt discount and capitalized debt issuance costs, compared to the fair market value of the consideration given comprising both common stock issued and cash paid. The proportionate amount of the underlying derivative instrument was also extinguished as calculated on the respective conversion dates. See Note 10 "Fair Value Measurements" for more information.
As of
March 31, 2018
, the outstanding principal on the Notes was
$5,700
, the unamortized debt issuance costs and debt discount in aggregate was
$1,827
, and the net carrying amount of the Notes was
$3,873
, which was recorded as long-term debt within the consolidated balance sheet. The Company recorded
$1,018
and
$1,256
of aggregate debt discount and debt issuance cost amortization during the years ended
March 31, 2018
, and
2017
, respectively.
87
The Company sold the Notes to the Initial Purchaser at a purchase price of
92.75%
of the principal amount. The initial purchaser also received an additional
250,000
warrants on the same terms as the warrants issued with the Notes (as detailed below) and has the right to receive
2.5%
of any cash consideration received by the Company in connection with a future exercise of any of the warrants issued with the Notes. The Notes were issued under an Indenture dated September 28, 2016, as amended on January 31, 2017 (the "Indenture"), between Digital Turbine, Inc., US Bank National Association, as trustee, and certain wholly-owned subsidiaries of the Company, specifically Digital Turbine, Inc. as the parent Company, DT USA, DT Media, and DT APAC (collectively referred to as the "Guarantors"). The Notes are senior unsecured obligations of the Company, and bear interest at a rate of
8.75%
per year, payable semiannually in arrears on March 15th and September 15th of each year, beginning on March 15, 2017. The Notes are unconditionally guaranteed by the Guarantors as to the payment of principal, premium, if any, and interest on a senior unsecured basis. The Notes were issued with an initial conversion price equal to
$1.364
per share of the Company's common stock, subject to proportional adjustment for adjustments to outstanding common stock and anti-dilution provisions in case of dividends or distributions, stock split or combination, or if the Company issues or sells shares of common stock at a price per share less than the conversion price on the trading day immediately preceding such issuance of sale. The conversion price is subject to change related to the modification to the Indenture made in connection with the solicitation of consents to incur the Bridge Bank credit facility.
With respect to any conversion prior to September 23, 2019, in addition to the shares deliverable upon conversion, holders of the Notes will be entitled to receive a payment equal to the remaining scheduled payments of interest that would have been made on the notes being converted from the date of conversion until September 23, 2019 (an “Early Conversion Payment”). We may pay the Early Conversion Payment in cash or, subject to certain equity-related conditions set forth in the Indenture, in shares of our common stock.
The Company may redeem the Notes, for cash, in whole or in part, at any time after September 23, 2018, at a redemption price equal to
$1
per $1 principal amount of the notes to be redeemed plus accrued and unpaid interest, if any, to, but excluding, the date of redemption, plus an additional payment (payable in cash or stock) equivalent to the amount of, and subject to equivalent terms and conditions applicable for, an Early Conversion Payment had the notes been converted on the date of redemption, if (1) the closing price of our common shares on the NASDAQ Capital Market has exceeded
200%
of the conversion price then in effect (but disregarding the effect on such price from certain anti-dilution adjustments) for at least
20
trading days (whether or not consecutive) during any
30
consecutive trading day period (including the last trading day of such period) ending within the
five
trading days immediately preceding the date on which we provide the redemption notice, (2) for the
15
consecutive trading days following the last trading day on which the closing price of our common shares was equal to or greater than
200%
of the conversion price in effect (but disregarding the effect on such price from certain anti-dilution adjustments) on such trading day for the purpose of the foregoing clause, the closing price of our common shares remains equal to or greater than
150%
of the conversion price in effect (but disregarding the effect on such price from certain anti-dilution adjustments) on the given trading day and (3) we are in compliance with certain other equity-related conditions as set forth in the Indenture.
If we undergo a fundamental change (as described below), holders may require us to purchase the Notes in whole or in part for cash at a price equal to
120%
of the principal amount of the Notes to be purchased plus any accrued and unpaid interest, including additional interest, if any, to, but excluding, the repurchase date. Conversions that occur in connection with a fundamental change may entitle the holder to receive an increased number of shares of common stock issuable upon such conversion, depending on the date of such fundamental change and the valuation of the Company’s common stock related thereto. A fundamental change is defined as follows:
|
•
|
a “person” or “group” within the meaning of Section 13(d) of the Exchange Act other than the Company, the Company’s Subsidiaries or the Company’s or the Company’s Subsidiaries’ employee benefit plans files a Schedule TO or any schedule, form or report under the Exchange Act disclosing that such person or group has become the direct or indirect “beneficial owner,” as defined in Rule 13d-3 under the Exchange Act, of the Company’s common equity representing more than
50%
of the voting power of all outstanding classes of the Company’s common equity entitled to vote generally in the election of the Company’s directors;
|
|
•
|
consummation of (A) any share exchange, consolidation or merger involving the Company pursuant to which the Common Stock will be converted into cash, securities or other property or (B) any sale, lease or other transfer in one transaction or a series of transactions of all or substantially all of the consolidated assets of the Company and the Company’s Subsidiaries, taken as a whole, to any person other than one or more of the Company’s Subsidiaries; provided, however, that a share exchange, consolidation or merger transaction described in clause (A) above in which the holders of more than
50%
of all shares of Common Stock entitled to vote generally in the election of the Company’s directors immediately prior to such transaction own, directly or indirectly, more than
50%
of all shares of Common Stock entitled to vote generally in the election of the directors of the continuing or surviving entity or
|
88
the parent entity thereof immediately after such transaction in substantially the same proportions (relative to each other) as such ownership immediately prior to such transaction will not, in either case, be a Fundamental Change;
|
•
|
the Company’s shareholders approve any plan or proposal for the liquidation or dissolution of the Company; or
|
|
•
|
the Common Stock (or other Capital Stock into which the Notes are then convertible pursuant to the terms of this Indenture) ceases to be listed on any of The New York Stock Exchange, The NASDAQ Global Select Market, The NASDAQ Global Market, The NASDAQ Capital Market or The NYSE MKT (or their respective successors) (each, an “Eligible Market ”).
|
Subject to limited exceptions, the Indenture prohibits us from incurring additional indebtedness at any time while the Notes remain outstanding. In connection with the Bridge Bank credit facility, we received consents from the requisite holders to incur up to
$5 million
of secured debt.
Each purchaser of the Notes also received warrants to purchase
256.60
shares of the Company's common stock for each $1 in Notes purchased, or up to
4,105,600
warrants in aggregate, in addition to the
250,000
warrants issued to the initial purchaser, as described above. The warrants were issued under a Warrant Agreement (the "Warrant Agreement"), dated as of September 28, 2016, between Digital Turbine, Inc. and US Bank National Association, as the warrant agent. In connection with soliciting consents for the Bridge Bank credit facility, we also agreed to modify the exercise price of the warrants.
The warrants are immediately exercisable on the date of issuance at an initial exercise price of
$1.364
per share and will expire on September 23, 2020. The exercise price is subject to proportional adjustment for adjustments to outstanding common stock and anti-dilution provisions in case of dividends or distributions, stock split or combination, or if the Company issues or sells shares of common stock at a price per share less than the conversion price on the trading day immediately preceding such issuance of sale. Certain caps on the number of shares that could be issued under the Notes and the Warrants were effectively lifted by our stockholders approving the full issuance of all potentially issuable shares at our January 2017 annual meeting of stockholders. However, as a result of the modification of our indenture for the Notes and related modification of the warrant agreement in connection with soliciting consent for incurrence of our May 2017 Bridge Bank credit facility, the January 2017 stockholder approval no longer applies and we would need to receive a new stockholder approval in order to issue the full amount of shares of our stock that could ultimately be issuable under the indenture for the Notes and the warrant agreement. We are required to seek such stockholder approval.
In the event of a fundamental change, as set forth in the Warrant Agreement, the holders can elect to exercise their warrants or to receive an amount of cash under a Black-Scholes calculation of the value of such warrants.
The Company received net cash proceeds of
$14,316
, after deducting the Initial Purchaser's discounts and commissions and the estimated offering expenses payable by Digital Turbine. The net proceeds from the issuance of the Notes were used to repay
$11,000
of secured indebtedness, consisting of approximately
$3,000
to SVB and
$8,000
to NAC, retiring both such debts in their entirety, and will otherwise be used for general corporate purposes and working capital.
On July 15, 2016, prior to the payoff of the
$8,000
debt with NAC, DTM and NAC entered into a Fourth Amendment to Common Stock Purchase Warrant dated March 6, 2015, where DTM agreed to pay NAC the amount of
$75
as consideration to extend the warrant vesting date (the "Retirement Date") to August 29, 2016.
On August 12, 2016, prior to the payoff of the
$3,000
debt with SVB, DTM and SVB entered into a Letter Agreement modifying amending the Third Amended and Restated Loan and Security Agreement dated June 11, 2015, whereby the Company agreed to pay SVB the amount of
$15
as consideration to extend the maturity date of the debt to September 28, 2016.
On August 26, 2016, prior to the payoff of the
$8,000
debt with NAC, DTM and NAC entered into a Fifth Amendment to Common Stock Purchase Warrant dated March 6, 2015, where DTM agreed to pay NAC the amount of
$50
as consideration to extend the Retirement Date to September 28, 2016.
89
Senior Secured Credit Facility
On May 23, 2017, the Company entered a Business Finance Agreement (the “Credit Agreement”) with Western Alliance Bank (the “Bank”). The Credit Agreement provides for a
$5,000
total facility.
The amounts advanced under the Credit Agreement mature in
two
(
2
) years, and accrue interest at the following rates and bear the following fees:
(1) Wall Street Journal Prime Rate +
1.25%
(currently approximately
5.25%
), with a floor of
4.0%
.
(2) Annual Facility Fee of
$45.5
.
(3) Early termination fee of
0.5%
if terminated during the first year.
The obligations under the Credit Agreement are secured by a perfected first position security interest in all assets of the Company and its subsidiaries, subject to partial (
65%
) pledges of stock of non-US subsidiaries. The Company’s subsidiaries Digital Turbine USA and Digital Turbine Media are co-borrowers.
In addition to customary covenants, including restrictions on payments (subject to specified exceptions), and restrictions on indebtedness (subject to specified exceptions), the Credit Agreement requires the Company to comply with the following financial covenants, measured on a monthly basis:
(1) Maintain a Current Ratio of at least
0.65
, defined as unrestricted cash plus accounts receivable, divided by all current liabilities.
(2) Revenue must exceed
85%
of projected quarterly revenue.
As of
March 31, 2018
, the Company was in compliance with the covenants of the Credit Agreement.
The Credit Agreement required that at least two-thirds (2/3rds) of the holders of the Notes at all times be subject to subordination agreements with the Bank. The Company obtained the consent of the holders of at least two-thirds (2/3rds) of the Notes, which were held by a small number of institutional investors. In consideration for such consents, the Company entered into a Second Supplemental Indenture, dated May 23, 2017 (the “Supplemental Indenture”) to the Indenture, and also entered into a First Amendment, dated May 23, 2017 (the “Warrant Amendment”) to the Warrant Agreement. The Supplemental Indenture and Warrant Amendment provided for a 30 day stock price measurement period to determine whether or not there would be any change to the conversion price or exercise price of the Company’s outstanding convertible notes or related warrants. The measurement period concluded on September 20, 2017, with no change to the existing
$1.364
per share conversion or exercise price of our convertible notes or related warrants.
The Credit Agreement contains other customary covenants, representations, indemnities and events of default.
At
March 31, 2018
, the gross outstanding principle on the Credit Agreement was
$1,650
which is presented, net of capitalized debt issuance costs of
$205
, as net secured short-term line of credit of
$1,445
.
Interest Expense
Inclusive of the Notes issued on September 28, 2016 and the Credit Agreement entered into on May 23, 2017 during the current fiscal year, and the Notes and the NAC subordinated debenture which was retired in full on September 28, 2016 during the prior fiscal year, the Company recorded
$1,049
and
$1,369
of interest expense during the years ended
March 31, 2018
, and
2017
respectively.
Additionally, aggregate debt discount and debt issuance cost amortization related to the Notes, detailed in the paragraph above, is reflected on the Consolidated Statement of Operations as interest expense. Inclusive of this amortization of
$1,018
recorded during the year ended
March 31, 2018
and the
$1,256
recorded during the year ended
March 31, 2017
, the Company recorded
$2,067
and
$2,625
of total interest expense for the years ended
March 31, 2018
, and
2017
, respectively.
90
10. Fair Value Measurements
The Company applies the provisions of ASC 820-10, “Fair Value Measurements and Disclosures.” ASC 820-10 defines fair value, and establishes a three-level valuation hierarchy for disclosures of fair value measurement that enhances disclosure requirements for fair value measures. The carrying amounts reported in the consolidated balance sheets for receivables and current liabilities each qualify as financial instruments and are a reasonable estimate of their fair values because of the short period of time between the origination of such instruments and their expected realization and their current market rate of interest. The three levels of valuation hierarchy are defined as follows:
|
•
|
Level 1 inputs to the valuation methodology are quoted prices for identical assets or liabilities in active markets.
|
|
•
|
Level 2 inputs to the valuation methodology include quoted prices for similar assets and liabilities in active markets, and inputs that are observable for the asset or liability, either directly or indirectly, for substantially the full term of the financial instrument.
|
|
•
|
Level 3 inputs to the valuation methodology are unobservable and significant to the fair value measurement.
|
The Company analyzes all financial instruments with features of both liabilities and equity under ASC 480, “Distinguishing Liabilities From Equity” and ASC 815, “Derivatives and Hedging.” Derivative liabilities are adjusted to reflect fair value at each period end, with any increase or decrease in the fair value being recorded in results of operations as adjustments to fair value of derivatives. The effects of interactions between embedded derivatives are calculated and accounted for in arriving at the overall fair value of the financial instruments. In addition, the fair values of freestanding derivative instruments such as warrant and option derivatives are valued using the Black-Scholes model.
The Company’s financial liabilities as of the issuance date of the convertible notes on the initial measurement date of September 28, 2016 are presented below at fair value and were classified within the fair value hierarchy as follows:
|
Level 1
|
Level 2
|
Level 3
|
Balance as of September 28, 2016
|
|||||||||||||
|
Financial Liabilities
|
||||||||||||||||
|
Convertible note embedded derivative liability
|
$
|
—
|
|
$
|
—
|
|
$
|
3,693
|
|
$
|
3,693
|
|
||||
|
Warrant liability
|
$
|
—
|
|
$
|
—
|
|
$
|
1,223
|
|
$
|
1,223
|
|
||||
|
Total
|
$
|
—
|
|
$
|
—
|
|
$
|
4,916
|
|
$
|
4,916
|
|
||||
The Company’s assessment of the significance of a particular input to the fair value measurement in its entirety requires management to make judgments and consider factors specific to the liability. Fair value of the Notes is determined using the residual method of accounting whereby, first, a portion of the proceeds from the issuance of the Notes is allocated to derivatives embedded in the Notes and the warrants issued in connection with the issuance of the Notes, and the proceeds so allocated are accounted for as a convertible note embedded derivative liability and warrant liability, respectively, and second, the remainder of the proceeds from the issuance of the Notes is allocated to the convertible notes, resulting in an original debt discount amounting to
$4,916
. The convertible notes will remain on the consolidated balance sheet at historical cost, accreted up for the amount of cumulative amortization of the debt discount over the life of the debt. The method of determining the fair value of the convertible note embedded derivative liability and warrant liability are described subsequently in this note. Market risk associated with the convertible note embedded derivative liability and warrant liability relates to the potential reduction in fair value and negative impact to future earnings from an increase in price of the Company's common stock. Please refer to Note 9 "Debt" for more information.
The carrying amounts of certain financial instruments, such as cash, accounts receivable, accounts payable and accrued liabilities, approximate fair value due to their relatively short maturities.
As of
March 31, 2018
, the Company’s financial assets and financial liabilities are presented below at fair value and were classified within the fair value hierarchy as follows (in thousands):
91
|
Level 1
|
Level 2
|
Level 3
|
Balance as of March 31, 2018
|
|||||||||||||
|
Financial Liabilities
|
||||||||||||||||
|
Convertible note embedded derivative liability
|
$
|
—
|
|
$
|
—
|
|
$
|
4,676
|
|
$
|
4,676
|
|
||||
|
Warrant liability
|
$
|
—
|
|
$
|
—
|
|
$
|
3,980
|
|
$
|
3,980
|
|
||||
|
Total
|
$
|
—
|
|
$
|
—
|
|
$
|
8,656
|
|
$
|
8,656
|
|
||||
|
Level 1
|
Level 2
|
Level 3
|
Balance as of March 31, 2017
|
|||||||||||||
|
Financial Liabilities
|
||||||||||||||||
|
Convertible note embedded derivative liability
|
$
|
—
|
|
$
|
—
|
|
$
|
3,218
|
|
$
|
3,218
|
|
||||
|
Warrant liability
|
$
|
—
|
|
$
|
—
|
|
$
|
1,076
|
|
$
|
1,076
|
|
||||
|
Total
|
$
|
—
|
|
$
|
—
|
|
$
|
4,294
|
|
$
|
4,294
|
|
||||
Convertible Note Embedded Derivative Liability
On September 28, 2016, the Company sold to an investment bank (the "Initial Purchaser"),
16,000
principal amount of
8.75%
convertible notes maturing on September 23, 2020 (the “Notes”), unless converted, repurchased, or redeemed in accordance with their terms prior to such date. We evaluated the terms and features of our convertible notes and identified embedded derivatives (conversion options that contain “make-whole interest” provisions, fundamental change provisions, or down round conversion price adjustment provisions; collectively called the "convertible note embedded derivative liability") requiring bifurcation and accounting at fair value because the economic and contractual characteristics of the embedded derivatives met the criteria for bifurcation and separate accounting. ASC 815-10-15-83 (c) states that if terms implicitly or explicitly require or permit net settlement, then it can readily be settled net by means outside the contract, or it provides for delivery of an asset that puts the recipient in a position not substantially different from net settlement. The conversion features related to the convertible notes consists of a “make-whole interest” provision, fundamental change provision, and down round conversion price adjustment provisions, which if the convertible notes were to be converted, would put the convertible note holder in a position not substantially different from net settlement. Given this fact pattern, the conversion features meet the definition of embedded derivatives and require bifurcation and accounting at fair value.
During fiscal year 2018, holders of
$10,300
of the Notes, respectively, elected to convert such Notes. At
March 31, 2018
, aggregate principal amount of
$5,700
remained outstanding and is reflected on the balance sheet, net of debt issuance costs and discounts of
$1,827
, in the amount of
$3,873
. Refer to Note 9 "Debt - Convertible Notes" and Note 12 "Capital Stock Transactions" for more details.
The convertible note embedded derivative liability represent the fair value of the conversion option, fundamental change provision, and "make-whole" provisions, as well as the down round conversion price adjustment or conversion rate adjustment provisions of the convertible notes. There is no current observable market for these types of derivatives and, as such, the Company determined the fair value of the derivative liability using a lattice approach that incorporates a Monte Carlo simulation valuation model. A Monte Carlo simulation valuation model considers the Company's future stock price, stock price volatility, probability of a change of control and the trading information of the Company's common stock into which the notes are or may become convertible. The Company marks the derivative liability to market at the end of each reporting period due to the conversion price not being indexed to the Company's own stock.
Changes in the fair value of the convertible note embedded derivative liability is reflected in our consolidated statements of operations as “Change in fair value of convertible note embedded derivative liability.”
The following table provides a reconciliation of the beginning and ending balances for the convertible note embedded derivative liability measured at fair value using significant unobservable inputs (Level 3):
|
Level 3
|
||||
|
Balance at March 31, 2017
|
$
|
3,218
|
|
|
|
Change in fair value of convertible note embedded derivative liability
|
7,559
|
|
||
|
Derecognition on extinguishment or conversion
|
(6,101
|
)
|
||
|
Balance at March 31, 2018
|
$
|
4,676
|
|
|
92
Due to the valuation of the derivative liability being highly sensitive to the trading price of the Company's stock, the increase and decrease in the trading price of the Company's stock has the impact of increasing the (loss) and gain, respectively.
Due to the Company's closing stock price increasing from
March 31, 2017
to
March 31, 2018
from
$0.94
to
$2.01
, the Company recorded a loss of
$7,559
during the year ended
March 31, 2018
.
Due to the Company's closing stock price decreasing from the inception of the Notes on September 28, 2016 to
March 31, 2017
from
$0.99
to
$0.94
, the Company recorded a gain of
$475
during the year ended
March 31, 2017
.
The market-based assumptions and estimates used in valuing the convertible note embedded derivative liability include amounts in the following amounts:
|
March 31, 2018
|
||
|
Stock price volatility
|
70
|
%
|
|
Probability of change in control
|
1.75
|
%
|
|
Stock price (per share)
|
$2.01
|
|
|
Expected term
|
2.50 years
|
|
|
Risk-free rate (1)
|
2.30
|
%
|
|
Assumed early conversion/exercise price (per share)
|
$2.73
|
|
(1) The Monte Carlo simulation assumes the continuously compounded equivalent (CCE) interest rate of
1.0%
based on the average of the 3-year and 5-year U.S. Treasury securities as of the valuation date.
Changes in valuation assumptions can have a significant impact on the valuation of the convertible note embedded derivative liability. For example, all other things being equal, a decrease/ increase in our stock price, probability of change of control, or stock price volatility decreases/increases the valuation of the liabilities, whereas a decrease/increase in risk-free interest rates increases/decreases the valuation of the liabilities.
Warrant Liability
The Company issued detachable warrants with the convertible notes issued on September 28, 2016. The Company accounts for its warrants issued in accordance with US GAAP accounting guidance under ASC 815 applicable to derivative instruments, which requires every derivative instrument within its scope to be recorded on the balance sheet as either an asset or liability measured at its fair value, with changes in fair value recognized in earnings. Based on this guidance, the Company determined that these warrants did not meet the criteria for classification as equity. Accordingly, the Company classified the warrants as long-term liabilities. The warrants are subject to re-measurement at each balance sheet date, with any change in fair value recognized as a component of other income (expense), net in the statements of operations. We estimated the fair value of these warrants at the respective balance sheet dates using a lattice approach that incorporates a Monte Carlo simulation that considers the Company's future stock price. Option pricing models employ subjective factors to estimate warrant liability; and, therefore, the assumptions used in the model are judgmental.
Changes in the fair value of the warrant liability is primarily related to the change in price of the underlying common stock of the Company and is reflected in our consolidated statements of operations as “Change in fair value of warrant liability.”
The following table provides a reconciliation of the beginning and ending balances for the warrant liability measured at fair value using significant unobservable inputs (Level 3):
|
Level 3
|
||||
|
Balance at March 31, 2017
|
$
|
1,076
|
|
|
|
Change in fair value of warrant liability
|
$
|
3,208
|
|
|
|
Derecognition on exercise
|
$
|
(304
|
)
|
|
|
Balance at March 31, 2018
|
$
|
3,980
|
|
|
Due to the valuation of the derivative liability being highly sensitive to the trading price of the Company's stock, the increase and decrease in the trading price of the Company's stock has the impact of increasing the (loss) and gain, respectively.
Due to the Company's closing stock price increasing from
March 31, 2017
to
March 31, 2018
from
$0.94
to
$2.01
, the Company recorded a loss of
$3,208
during the year ended
March 31, 2018
.
93
Due to the Company's closing stock price decreasing from the inception of the Notes on September 28, 2016 to
March 31, 2017
from
$0.99
to
$0.94
, the Company recorded a gain of
$147
during the year ended
March 31, 2017
.
The market-based assumptions and estimates used in valuing the warrant liability include amounts in the following amounts:
|
March 31, 2018
|
||
|
Stock price volatility
|
70
|
%
|
|
Probability of change in control
|
1.75
|
%
|
|
Stock price (per share)
|
$2.01
|
|
|
Expected term
|
2.50 years
|
|
|
Risk-free rate (1)
|
2.30
|
%
|
|
Assumed early conversion/exercise price (per share)
|
$2.73
|
|
(1) The Monte Carlo simulation assumes the continuously compounded equivalent (CCE) interest rate of
1.0%
based on the average of the 3-year and 5-year U.S. Treasury securities as of the valuation date.
Changes in valuation assumptions can have a significant impact on the valuation of the warrant liability. For example, all other things being equal, a decrease/increase in our stock price, probability of change of control, or stock price volatility decreases/increases the valuation of the liabilities, whereas a decrease/increase in risk-free interest rates increases/decreases the valuation of the liabilities.
11. Description of Stock Plans
Employee Stock Plan
The Company is currently issuing stock awards under the Amended and Restated Digital Turbine, Inc. 2011 Equity Incentive Plan (the “2011 Plan”), which was approved and adopted by our stockholders by written consent on May 23, 2012. No future grants will be made under the previous plan, the 2007 Employee, Director and Consultant Stock Plan (the “2007 Plan”). In the year ended March 31, 2015, in connection with the acquisition of Appia, the Company assumed the Appia, Inc. 2008 Stock Incentive Plan (the “Appia Plan”). The 2011 Plan and 2007 Plan are collectively referred to as “Digital Turbine’s Incentive Plans.” Digital Turbine’s Incentive Plans and the Appia Plan are all collectively referred to as the “Stock Plans.”
The 2011 Plan provides for grants of stock-based incentive awards to our and our subsidiaries’ officers, employees, non-employee directors and consultants. Awards issued under the 2011 Plan can include stock options, stock appreciation rights (“SARs”), restricted stock and restricted stock units (sometimes referred to individually or collectively as “Awards”). Stock options may be either “incentive stock options” (“ISOs”), as defined in Section 422 of the Internal Revenue Code of 1986, as amended (the “Code”), or non-qualified stock options (“NQSOs”).
The 2011 Plan reserves
20,000,000
shares for issuance, of which
9,135,513
and
9,665,123
remained available for future grants as of
March 31, 2018
and
2017
, respectively. The change over the comparative period represents stock option grants, stock option forfeitures/cancellations, and restricted shares of common stock of
1,963,378
,
1,698,906
, and
265,138
, respectively.
Stock Option Agreements
Stock options granted under the Company’s Incentive Plans typically vest over a
three
to
four years
period. These options, which are granted with option exercise prices equal to the fair market value of the Company’s common stock on the date of grant, generally expire up to
ten years
from the date of grant.
94
Stock Option Activity
The following table summarizes stock option activity for the Stock Plans during the years ended
March 31, 2018
and
2017
:
|
Number of
Shares
|
Weighted Average
Exercise Price
(per share)
|
Weighted Average
Remaining Contractual
Life (in years)
|
Aggregate Intrinsic
Value
(in thousands)
|
||||||||
|
Options Outstanding, March 31, 2016
|
7,824,395
|
|
3.61
|
|
8.24
|
110
|
|
||||
|
Granted
|
4,271,523
|
|
0.82
|
|
|||||||
|
Forfeited / Canceled
|
(2,378,523
|
)
|
2.90
|
|
|||||||
|
Exercised
|
18,383
|
|
0.64
|
|
|||||||
|
Options Outstanding, March 31, 2017
|
9,735,778
|
|
2.56
|
|
7.95
|
801
|
|
||||
|
Granted
|
1,963,378
|
|
1.53
|
|
|||||||
|
Forfeited / Canceled
|
(1,698,906
|
)
|
4.40
|
|
|||||||
|
Exercised
|
(258,281
|
)
|
1.04
|
|
|||||||
|
Options Outstanding, March 31, 2018
|
9,741,969
|
|
2.08
|
|
7.82
|
6,286
|
|
||||
|
Vested and expected to vest (net of estimated forfeitures) at March 31, 2018 (a)
|
8,031,223
|
|
2.28
|
|
7.59
|
4,740
|
|
||||
|
Exercisable, March 31, 2018
|
4,729,348
|
|
3.05
|
|
6.81
|
1,800
|
|
||||
(a)For options vested and expected to vest, options exercisable, and options outstanding, the aggregate intrinsic value in the table above represents the total pre-tax intrinsic value (the difference between Digital Turbine's closing stock price on
March 31, 2018
and the exercise price multiplied by the number of in-the-money options) that would have been received by the option holders had the holders exercised their options on
March 31, 2018
. The intrinsic value changes based on changes in the price of Digital Turbine's common stock.
Information about options outstanding and exercisable at
March 31, 2018
is as follows:
|
Options Outstanding
|
Options Exercisable
|
|||||||||||||||
|
|
Number of Shares
|
Weighted-Average Exercise Price
|
Weighted-Average Remaining Life (Years)
|
Number of Shares
|
Weighted-Average Exercise Price
|
|||||||||||
|
$0.00 - 0.50
|
6,204
|
|
$
|
0.24
|
|
1.99
|
7,652
|
|
$
|
0.24
|
|
|||||
|
$0.51 - 1.00
|
3,142,319
|
|
0.73
|
|
8.61
|
593,935
|
|
0.72
|
|
|||||||
|
$1.01 - 1.50
|
2,782,291
|
|
1.27
|
|
8.26
|
1,317,935
|
|
1.30
|
|
|||||||
|
$1.51 - 2.00
|
444,333
|
|
1.55
|
|
8.70
|
177,618
|
|
1.52
|
|
|||||||
|
$2.01 - 2.50
|
716,822
|
|
2.22
|
|
9.55
|
93,456
|
|
2.42
|
|
|||||||
|
$2.51 - 3.00
|
853,200
|
|
2.61
|
|
6.34
|
787,451
|
|
2.62
|
|
|||||||
|
$3.51 - 4.00
|
765,300
|
|
3.96
|
|
6.53
|
765,300
|
|
3.96
|
|
|||||||
|
$4.01 - 4.50
|
661,500
|
|
4.15
|
|
6.59
|
622,251
|
|
4.15
|
|
|||||||
|
$4.51 - 5.00
|
60,000
|
|
4.65
|
|
4.99
|
60,000
|
|
4.65
|
|
|||||||
|
$5.01 and over
|
310,000
|
|
$
|
12.48
|
|
1.22
|
303,750
|
|
$
|
12.62
|
|
|||||
|
9,741,969
|
|
4,729,348
|
|
|||||||||||||
Other information pertaining to stock options for the Stock Plans is as follows:
|
|
Year Ended March 31,
|
|||||||||||
|
|
2018
|
2017
|
2016
|
|||||||||
|
Total fair value of options vested
|
$
|
3,335
|
|
$
|
3,519
|
|
$
|
5,288
|
|
|||
|
Total intrinsic value of options exercised (a)
|
$
|
202
|
|
$
|
10
|
|
$
|
3
|
|
|||
|
(a)
|
The total intrinsic value of options exercised represents the total pre-tax intrinsic value (the difference between the stock price at exercise and the exercise price multiplied by the number of options exercised) that was received by the option holders who exercised their options during the fiscal year.
|
95
During the years ended March 31,
2018
,
2017
, and
2016
, the Company granted options to purchase
1,963,378
,
4,271,523
, and
3,959,150
shares of its common stock, respectively, to employees with weighted-average grant-date fair value of
$0.94
,
$0.82
, and
$1.60
respectively.
At
March 31, 2018
,
2017
, and
2016
, there was
$2,353
,
$5,038
, and
$9,377
of total unrecognized stock-based compensation expense, net of estimated forfeitures, related to unvested stock options expected to be recognized over a weighted-average period of
2.2
years,
2.2
years, and
2.6
years, respectively.
Valuation of Awards
For stock options granted under Digital Turbine’s Incentive Plans, Digital Turbine Inc. typically uses the Black-Scholes option pricing model to estimate the fair value of stock options at grant date. The Black-Scholes option pricing model incorporates various assumptions, including volatility, expected term risk-free interest rates, and dividend yields. The assumptions utilized in this model during fiscal
2018
,
2017
, and
2016
are presented below.
|
|
Year Ended March 31,
|
|||||
|
|
2018
|
2017
|
2016
|
|||
|
Risk-free interest rate
|
1.77% to 2.73%
|
1.34% to 2.38%
|
1.37% to 2.27%
|
|||
|
Expected life of the options
|
5.65 to 9.84 years
|
5.69 to 9.84 years
|
5.73 to 10 years
|
|||
|
Expected volatility
|
66% to 73%
|
73% to 130%
|
78% to 145%
|
|||
|
Expected dividend yield
|
—%
|
—%
|
—%
|
|||
|
Expected forfeitures
|
28-29%
|
10% to 35%
|
10% to 35%
|
|||
Expected volatility is based on a blend of implied and historical volatility of Digital Turbine's common stock over the most recent period commensurate with the estimated expected term of Digital Turbine’s stock options. Digital Turbine uses this blend of implied and historical volatility, as well as other economic data, because management believes such volatility is more representative of prospective trends. The expected term of an award is based on historical experience and on the terms and conditions of the stock awards granted to employees.
Total stock compensation expense for the Company’s equity plans, which includes both stock options, restricted stock, and warrants issued is included in the following statements of operations components. See Note 12 "Capital Stock Transactions" regarding restricted stock.
|
Year Ended March 31,
|
||||||||||||
|
2018
|
2017
|
2016
|
||||||||||
|
Product development
|
$
|
—
|
|
$
|
—
|
|
$
|
—
|
|
|||
|
Sales and marketing
|
—
|
|
—
|
|
—
|
|
||||||
|
General and administrative
|
2,978
|
|
3,760
|
|
5,962
|
|
||||||
|
Total
|
$
|
2,978
|
|
$
|
3,760
|
|
$
|
5,962
|
|
|||
12. Capital Stock Transactions
Preferred Stock
There are
2,000,000
shares of Series A Convertible Preferred Stock,
$0.0001
par value per share (“Series A”), authorized and
100,000
shares issued and outstanding, which are currently convertible into
20,000
shares of common stock. The Series A holders are entitled to: (1) vote on an equal per share basis as common stock, (2) dividends paid to the common stock holders on an as if-converted basis and (3) a liquidation preference equal to the greater of
$10
per share of Series A (subject to adjustment) or such amount that would have been paid to the common stock holders on an as if-converted basis.
Common Stock and Warrants
For the years ended
March 31, 2018
and
2017
, the Company issued
258,281
and
18,383
shares, respectively, of common stock for the exercise of employee options.
96
For the years ended
March 31, 2018
and
2017
, the Company issued
100,000
and
no
shares, respectively, of common stock for the exercise of options granted for services rendered.
For the years ended
March 31, 2018
and
2017
, the Company issued
8,624,445
and
no
shares, respectively, of common stock to the holders of those Notes in exchange for the extinguishment of the Notes. Refer to Note 9 "Debt" and Note 10 "Fair Value Measurements" for more details.
In September 2016, in connection with the issuance of the Notes, the Company issued
250,000
and
4,105,600
warrants to the initial purchaser and holders of the Notes, respectively. The warrants are immediately exercisable on the date of issuance at an initial exercise price of
$1.364
per share and will expire on September 23, 2020. The exercise price is subject to proportional adjustment for adjustments to outstanding common stock and anti-dilution provisions in case of dividends or distributions, stock split or combination, or if the Company issues or sells shares of common stock at a price per share less than the conversion price on the trading day immediately preceding such issuance of sale. Refer to Note 10 "Fair Value Measurements" and Note 9 "Debt" for more details.
For the years ended
March 31, 2018
and
2017
, the Company issued
256,600
and
no
shares, respectively, of common stock to the holders of these warrants upon exercise.
Additionally, during the years ended
March 31, 2018
, the Company issued
9,552
shares of common stock in exchange for the cashless exercise of
30,000
previously issued warrants for services rendered.
With respect to warrants for services rendered, the Company expensed
$28
during the year ended
March 31, 2018
, and recorded
$19
warrant expense during the year ended
March 31, 2017
.
The following table provides activity for warrants issued and outstanding during the year ended
March 31, 2018
:
|
Number of Warrants Outstanding
|
Weighted-Average Exercise Price
|
|||||
|
Outstanding as of March 31, 2017
|
5,003,813
|
|
1.62
|
|
||
|
Issued
|
25,000
|
|
2.04
|
|
||
|
Exercised
|
(286,600
|
)
|
1.33
|
|
||
|
Canceled/Expired
|
(205,356
|
)
|
3.50
|
|
||
|
Outstanding as of March 31, 2018
|
4,536,857
|
|
1.56
|
|
||
Restricted Stock Agreements
From time to time, the Company enters into restricted stock agreements (“RSAs”) with certain employees and consultants. The RSAs have performance conditions, market conditions, time conditions or a combination thereof. In some cases, once the stock vests, the individual is restricted from selling the shares of stock for a certain defined period, from
three
months to
two
years, depending on the terms of the RSA. As reported in our Current Reports on Form 8-K filed with the SEC on February 12, 2014 and June 25, 2014, the Company adopted a Board Member Equity Ownership Policy that supersedes any post-vesting lock-up in RSAs that are applicable to people covered by the policy, which includes the Company’s Board of Directors and Chief Executive Officer.
During the years ended
March 31, 2018
and
2017
, the Company issued
265,138
and
331,363
restricted shares, respectively, to its directors for services. The shares vest over
1
year.
During the years ended
March 31, 2018
and
2017
, the Company canceled
zero
and
39,545
restricted shares, respectively, related to the departure of a director prior to the vesting of the shares.
With respect to RSAs, during the years ended
March 31, 2018
,
2017
, and
2016
, the Company expensed
$294
,
$398
, and
$867
related to time condition RSAs, respectively. As of
March 31, 2018
,
132,569
shares remain unvested.
97
The following is a summary of restricted stock awards and activities for all vesting conditions for the years ended
March 31, 2018
and
2017
, respectively, were as follows:
|
Number of Shares
|
Weighted-Average Grant Date Fair Value
|
||||||
|
Unvested restricted stock outstanding as of March 31, 2016
|
110,046
|
|
$
|
1.45
|
|
||
|
Granted
|
331,363
|
|
1.10
|
|
|||
|
Vested
|
(262,546
|
)
|
1.23
|
|
|||
|
Cancelled
|
(39,545
|
)
|
1.10
|
|
|||
|
Unvested restricted stock outstanding as of March 31, 2017
|
139,318
|
|
1.10
|
|
|||
|
Granted
|
265,138
|
|
1.09
|
|
|||
|
Vested
|
(271,887
|
)
|
1.10
|
|
|||
|
Cancelled
|
—
|
|
—
|
|
|||
|
Unvested restricted stock outstanding as of March 31, 2018
|
132,569
|
|
$
|
1.09
|
|
||
All restricted shares, vested and unvested, cancellable and not cancelled, have been included in the outstanding shares as of
March 31, 2018
.
At
March 31, 2018
and
March 31, 2017
, there was
$97
and
$103
, respectively, of unrecognized stock-based compensation expense, net of estimated forfeitures, related to unvested restricted stock awards expected to be recognized over a weighted-average period of approximately
0.33
and
0.33
years, respectively.
13. Net Loss per Common Share
Basic net loss per share is calculated by dividing net loss by the weighted-average number of shares of common stock outstanding during the period, less shares subject to repurchase, and excludes any dilutive effects of employee stock-based awards in periods where the Company has net losses. Because the Company had net losses for the year ended
March 31, 2018
, all potentially dilutive shares of common stock were determined to be anti-dilutive, and accordingly, were not included in the calculation of diluted net loss per share.
The following table sets forth the computation of net loss per share of common stock (in thousands, except per share amounts):
|
Years Ended March 31,
|
||||||||||||
|
|
2018
|
2017
|
2016
|
|||||||||
|
Net loss from operations, net of taxes
|
$
|
(19,697
|
)
|
$
|
(19,138
|
)
|
$
|
(24,492
|
)
|
|||
|
Weighted-average common shares outstanding, basic and diluted
|
70,263
|
|
66,511
|
|
61,763
|
|
||||||
|
Basic and diluted net loss per common share
|
$
|
(0.28
|
)
|
$
|
(0.29
|
)
|
$
|
(0.40
|
)
|
|||
|
Common stock equivalents excluded from net loss per diluted share because their effect would have been anti-dilutive
|
2,572,147
|
|
825,675
|
|
1,438,355
|
|
||||||
14. Employee Benefit Plans
The Company has a qualified contributory retirement plan under section 401(k) of the IRC covering full-time eligible employees. Employees may voluntarily contribute eligible compensation up to the annual IRS limit. During the year ended
March 31, 2018
, the Company made matching contributions of
$172
. During the years ended
March 31, 2017
, and
2016
the Company made
no
matching contributions.
15. Related-Party Transactions
On April 29, 2018, Digital Turbine Asia Pacific Pty, Ltd. and Digital Turbine Singapore Pte Ltd. (together, “Pay Seller”), each wholly owned subsidiaries of the Company, entered into an Asset Purchase Pay Agreement (the “Pay Agreement”), dated as of April 23, 2018, with Chargewave Ptd Ltd (“Pay Purchaser”) to sell certain assets (the “Pay Assets”) owned by the Pay Seller related to the Company’s Direct Carrier Billing business. The Pay Purchaser is principally owned and
98
controlled by Jon Mooney, an officer of the Pay Seller. At the closing of the asset sale, Mr. Mooney will no longer be employed by the Company or Pay Seller. See Note 21 "Subsequent Events" for more information.
16.
I
ncome Taxes
The provision (benefit) for income taxes by taxing jurisdiction was as follows:
|
Year Ended Years Ended March 31,
|
||||||||||||
|
2018
|
2017
|
2016
|
||||||||||
|
Current U.S. federal
|
$
|
—
|
|
$
|
—
|
|
$
|
—
|
|
|||
|
Current state and local
|
—
|
|
17
|
|
—
|
|
||||||
|
Current non-U.S.
|
(116
|
)
|
(24
|
)
|
270
|
|
||||||
|
Total current
|
(116
|
)
|
(7
|
)
|
270
|
|
||||||
|
Deferred U.S. federal
|
—
|
|
—
|
|
—
|
|
||||||
|
Deferred state and local
|
—
|
|
—
|
|
—
|
|
||||||
|
Deferred non-U.S.
|
(835
|
)
|
(137
|
)
|
(56
|
)
|
||||||
|
Total deferred
|
(835
|
)
|
(137
|
)
|
(56
|
)
|
||||||
|
Total income tax provision
|
$
|
(951
|
)
|
$
|
(144
|
)
|
$
|
214
|
|
|||
A reconciliation of income tax expense using the statutory U.S. income tax rate compared with the actual income tax provision follows:
|
Year Ended Years Ended March 31,
|
||||||||||||
|
2018
|
2017
|
2016
|
||||||||||
|
Statutory federal income taxes
|
$
|
(5,750
|
)
|
$
|
(8,545
|
)
|
$
|
(9,736
|
)
|
|||
|
State income taxes, net of federal benefit
|
—
|
|
15
|
|
—
|
|
||||||
|
Non-deductible expenses
|
1,355
|
|
(350
|
)
|
821
|
|
||||||
|
Rate change
|
14,830
|
|
(88
|
)
|
(224
|
)
|
||||||
|
Change in uncertain tax liability
|
(103
|
)
|
158
|
|
(123
|
)
|
||||||
|
Change in valuation allowance
|
(10,528
|
)
|
8,896
|
|
10,106
|
|
||||||
|
Return-to-provision adjustments
|
(755
|
)
|
(230
|
)
|
(630
|
)
|
||||||
|
Income tax provision / (benefit)
|
$
|
(951
|
)
|
$
|
(144
|
)
|
$
|
214
|
|
|||
On December 22, 2017, the U.S. government enacted comprehensive tax legislation commonly referred to as the Tax Cuts and Jobs Act ("the Tax Act.") The Tax Act makes broad and complex changes to the U.S. tax code, including, but not limited to, (1) reducing the U.S. federal corporate tax rate from
35%
to
21%
; (2) requiring companies to pay a one-time deemed repatriation transition tax (the “Transition Tax”) on certain earnings of foreign subsidiaries; (3) generally eliminating U.S. federal income taxes on dividends from foreign subsidiaries; (4) requiring a current inclusion in U.S. federal taxable income of certain earnings of controlled foreign corporations; (5) eliminating the corporate alternative minimum tax (“AMT”) and changing how AMT credits can be realized; (6) capital expensing; (7) eliminating the deduction on U.S. manufacturing activities; and (8) creating new limitations on deductible interest expense and executive compensation.
The Securities Exchange Commission staff issued Staff Accounting Bulletin (“SAB”) 118 which provides guidance on accounting for the tax effects of the Tax Act. SAB 118 provides a measurement period that should not extend beyond one year from the Tax Act enactment date for companies to complete the accounting under ASC 740. In accordance with SAB 118, a company must reflect the income tax effects of those aspects of the Tax Act for which the accounting under ASC 740 is complete. To the extent that a company’s accounting for certain income tax effects of the Tax Act is incomplete but it is able to determine a reasonable estimate, it must record a provisional estimate in the financial statements. If a company cannot determine a provisional estimate to be included in the financial statements, it should continue to apply ASC 740 on the basis of the provisions of the tax laws that were in effect immediately before the enactment of the Tax Act.
In connection with our initial analysis of the impact of the Tax Act, we have determined that the tax law changes have no effect on the Company’s tax provision in the period ending March 31, 2018 due to the valuation allowance against the
99
U.S. deferred tax assets. The Company remeasured its U.S. deferred tax assets and liabilities as of March 31, 2018 using the reduced statutory rate of
21%
, resulting in a reduction of the U.S. deferred tax assets of
$14.8 million
, and adjusted the valuation allowance against the U.S. deferred taxes for a net zero impact on the tax provision. Additionally, the Company does not estimate having a liability for the Transition Tax as a result of deficits in earnings and profits of its non-U.S. subsidiaries.
Deferred tax assets and liabilities consist of the following:
|
Year Ended Years Ended March 31,
|
||||||||||||
|
2018
|
2017
|
2016
|
||||||||||
|
Deferred income tax assets
|
||||||||||||
|
Net operating loss carryforward
|
$
|
25,848
|
|
$
|
38,012
|
|
$
|
31,840
|
|
|||
|
Stock-based compensation
|
3,095
|
|
3,806
|
|
1,965
|
|
||||||
|
Credit carryforwards
|
—
|
|
98
|
|
129
|
|
||||||
|
Other
|
2,732
|
|
1,502
|
|
1,469
|
|
||||||
|
Gross deferred income tax assets
|
31,675
|
|
43,418
|
|
35,403
|
|
||||||
|
Valuation allowance
|
(30,394
|
)
|
(40,922
|
)
|
(32,026
|
)
|
||||||
|
Net deferred income tax assets
|
$
|
1,281
|
|
$
|
2,496
|
|
$
|
3,377
|
|
|||
|
Deferred income tax liabilities
|
||||||||||||
|
Depreciation and amortization
|
$
|
(680
|
)
|
$
|
(1,523
|
)
|
$
|
(754
|
)
|
|||
|
Intangibles and goodwill
|
—
|
|
(75
|
)
|
(1,947
|
)
|
||||||
|
Convertible Debt
|
—
|
|
(228
|
)
|
—
|
|
||||||
|
Other
|
(5
|
)
|
(318
|
)
|
(175
|
)
|
||||||
|
Net deferred income tax assets / (liabilities)
|
$
|
596
|
|
$
|
352
|
|
$
|
501
|
|
|||
As of
March 31, 2018
, the Company had net operating loss (NOL) carry-forwards for U.S. federal and state tax of approximately
$92,500
, Australia federal tax of approximately
$5,000
, and Israel federal tax of approximately
$4,300
. The U.S. federal and state NOLs expire between
2028
and
2037
, and the Australia and Israel NOLs have an unlimited carryover period. Utilization of the NOLs in the U.S. are subject to annual limitation due to ownership change limitations that may have occurred or that could occur in the future, as required by Section 382 of the Internal Revenue Code of 1986, as amended (the “Code”), as well as similar state and foreign limitations. These ownership changes limit the amount of NOLs that can be utilized annually to offset future taxable income and tax, respectively. In general, an “ownership change” as defined by Section 382 of the Code results from a transaction or series of transactions over a three-year period resulting in an ownership change of more than
50%
percentage points of the outstanding stock of a company by certain stockholders or public groups.
As of
March 31, 2018
, realization of a large portion of the Company’s gross deferred tax assets was not considered more likely than not and, accordingly, a valuation allowance of
$30,394
has been provided. During the year ended
March 31, 2018
, the valuation allowance decreased by
$10,528
. The reduction primarily relates to a
$14,830
remeasurement of U.S. deferreds due to the Tax Act, offset by a
$4,300
increase against deferred tax assets generated during the year.
ASC 740 requires the consideration of a valuation allowance, on a jurisdictional basis, to reflect the likelihood of realization of deferred tax assets. Significant management judgment is required in determining any valuation allowance recorded against deferred tax assets. Based on the history of cumulative book and tax losses, a valuation allowance has been recorded for assets that management believes are not more likely than not realizable.
ASC 740 provides guidance on the minimum threshold that an uncertain income tax position is required to meet before it can be recognized in the financial statements. ASC 740 contains a two-step approach to recognizing and measuring uncertain income tax positions. The first step is to evaluate the income tax position for recognition by determining if the weight of available evidence indicates that it is more likely than not that the position will be sustained on audit, including resolution of related appeals or litigation processes, if any. The second step is to measure the tax benefit as the largest amount that is more than 50% likely of being realized upon settlement. If it is not more likely than not that the benefit will be sustained on its technical merits, no benefit can be recorded. We recognize accrued interest and penalties related to uncertain income tax positions in income tax expense on our consolidated statement of income.
100
The Company’s income is subject to taxation in both the U.S. and foreign jurisdictions. Significant judgment is required in evaluating the Company’s tax positions and determining its provision for income taxes. The Company establishes liabilities for income tax-related uncertainties based on estimates of whether, and the extent to which, additional taxes will be due. These liabilities for tax contingencies are established when the Company believes that a tax position is not more likely than not sustainable. The Company adjusts these liabilities in light of changing facts and circumstances, such as the outcome of a tax audit or lapse of a statute of limitations. The provision for income taxes includes the impact of uncertain tax liabilities and changes in liabilities that are considered appropriate.
A reconciliation of the beginning and ending amount of unrecognized tax benefits for the years ended
March 31, 2018
,
2017
, and
2016
is as follows:
|
|
2018
|
2017
|
2016
|
|||||||||
|
Balance at April 1
|
$
|
941
|
|
$
|
783
|
|
$
|
905
|
|
|||
|
Additions for tax position of prior years
|
59
|
|
158
|
|
—
|
|
||||||
|
Reductions for tax positions of prior years
|
(162
|
)
|
—
|
|
(122
|
)
|
||||||
|
Balance at March 31
|
$
|
838
|
|
$
|
941
|
|
$
|
783
|
|
|||
Included in the balances at
March 31, 2018
,
2017
and
2016
are
$838
,
$941
, and
$783
, respectively, of unrecognized tax benefits, which would affect the annual effective tax rate if recognized. The Company recognized
$26
of expense for interest and penalties on uncertain income tax liabilities in its statement of operations for the year ended
March 31, 2018
. The Company recognized an interest benefit on uncertain income tax liabilities of
$52
and
$1
in its statement of operations for the years ended March 31,
2017
and
2016
, respectively. The Company does not expect the amount of unrecognized tax benefits to change significantly in the next twelve months.
The Company’s U.S. federal, state, and foreign income tax returns generally remain subject to examination for the tax years ended 2014 through 2018.
17. Segment and Geographic Information
The Company manages its business in
one
operating and reporting segment: O&O. This
one
operating segment is the only operating segment in our
one
reportable segment: Advertising. Our chief operating decision maker does not evaluate operating segments using asset information. The Company has considered guidance in Accounting Standards Codification (ASC) 280 in reaching its conclusion with respect to aggregating its operating segments into
one
reportable segment. Specifically, the Company has evaluated guidance in ASC 280-10-50-11 and determined that aggregation is consistent with the objectives of ASC 280 in that aggregation into
one
reportable segment allows users of our financial statements to view the Company’s business through the eyes of management based upon the way management reviews performance and makes decisions. Additional factors that were considered included: whether or not an operating segment has similar economic characteristics, the nature of the products/services under each operating segment, the nature of the production/go-to-market process, the type and geographic location of our customers, and the distribution of our products/services.
The Company attributes its long-lived assets, which primarily consist of property and equipment, to a country primarily based on the physical location of the assets. Goodwill and intangibles are not included in this allocation.
The following table sets forth geographic information on our net revenues and net property and equipment for the years ended
March 31, 2018
,
2017
, and
2016
. Net revenues by geography are based on the billing addresses of our customers.
101
|
|
Year ended March 31,
|
|||||||||||
|
|
2018
|
2017
|
2016
|
|||||||||
|
Net revenues
|
||||||||||||
|
United States and Canada
|
$
|
40,743
|
|
$
|
25,952
|
|
$
|
9,215
|
|
|||
|
Europe, Middle East, and Africa
|
5,691
|
|
3,494
|
|
12,488
|
|
||||||
|
Asia Pacific and China
|
23,608
|
|
9,269
|
|
503
|
|
||||||
|
Mexico, Central America, and South America
|
4,709
|
|
1,492
|
|
45
|
|
||||||
|
Consolidated net revenues
|
$
|
74,751
|
|
$
|
40,207
|
|
$
|
22,251
|
|
|||
|
Property and equipment, net
|
||||||||||||
|
United States & Canada
|
$
|
2,701
|
|
$
|
1,916
|
|
$
|
1,376
|
|
|||
|
Europe, Middle East, & Africa
|
41
|
|
73
|
|
94
|
|
||||||
|
Asia Pacific & China
|
15
|
|
17
|
|
—
|
|
||||||
|
Mexico, Central America, & South America
|
—
|
|
—
|
|
—
|
|
||||||
|
Consolidated property and equipment, net
|
$
|
2,757
|
|
$
|
2,006
|
|
$
|
1,470
|
|
|||
18. Guarantor and Non-Guarantor Financial Statements
On September 28, 2016, the Company sold to the Initial Purchaser,
$16,000
principal amount of
8.75%
convertible notes maturing on September 23, 2020, unless converted, repurchased or redeemed in accordance with their terms prior to such date. The Notes were issued under the Indenture, between Digital Turbine, Inc., US Bank National Association, as trustee, and certain wholly-owned subsidiaries of the Company, specifically Digital Turbine, Inc. as the parent Company, DT USA, DT Media, and DT APAC. Given the Notes are unconditionally guaranteed as to the payment of principal, premium, if any, and interest on a senior unsecured basis by
four
of the wholly-owned subsidiaries of the Company, the Company is required by SEC Reg S-X 210.3-10 to include, in a footnote, condensed consolidating financial information for the same periods with a separate column for:
|
•
|
The parent company;
|
|
•
|
The subsidiary guarantors on a combined basis;
|
|
•
|
Any other subsidiaries of the parent company on a combined basis;
|
|
•
|
Consolidating adjustments; and
|
|
•
|
The total consolidated amounts.
|
The following consolidated financial information and condensed consolidated financial information include:
(1) Condensed consolidated balance sheets as of March 31, 2018 and March 31, 2017; consolidated statements of operations and condensed consolidated statements of cash flows for the years ended March 31, 2018, 2017, and 2016; of (a) Digital Turbine, Inc. as the parent, (b) the guarantor subsidiaries, (c) the non-guarantor subsidiaries, and (d) Digital Turbine, Inc. on a consolidated basis; and
(2) Elimination entries necessary to consolidate Digital Turbine, Inc., as the parent, with its guarantor and non-guarantor subsidiaries.
Digital Turbine, Inc. owns 100% of all of the guarantor subsidiaries, and as a result, in accordance with Rule 3-10(d) of Regulation S-X promulgated by the SEC, no separate financial statements are required for these subsidiaries as of and for the years ended March 31, 2018, 2017, or 2016.
102
|
Consolidated Balance Sheet
|
||||||||||||
|
as of March 31, 2018
|
||||||||||||
|
(Unaudited)
|
||||||||||||
|
(dollars in thousands)
|
Parent
|
Guarantor Subsidiaries
|
Non-Guarantor Subsidiaries
|
Consolidated Total
|
||||||||
|
ASSETS
|
||||||||||||
|
Current assets
|
||||||||||||
|
Cash
|
501
|
|
11,800
|
|
419
|
|
12,720
|
|
||||
|
Restricted cash
|
156
|
|
175
|
|
—
|
|
331
|
|
||||
|
Accounts receivable, net of allowance of $512
|
—
|
|
16,777
|
|
273
|
|
17,050
|
|
||||
|
Deposits
|
34
|
|
113
|
|
4
|
|
151
|
|
||||
|
Prepaid expenses and other current assets
|
330
|
|
406
|
|
14
|
|
750
|
|
||||
|
Current assets held for disposal
|
—
|
|
8,610
|
|
143
|
|
8,753
|
|
||||
|
Total current assets
|
1,021
|
|
37,881
|
|
853
|
|
39,755
|
|
||||
|
Property and equipment, net
|
257
|
|
2,485
|
|
15
|
|
2,757
|
|
||||
|
Deferred tax assets
|
596
|
|
—
|
|
—
|
|
596
|
|
||||
|
Intangible assets, net
|
—
|
|
1,231
|
|
—
|
|
1,231
|
|
||||
|
Goodwill
|
—
|
|
41,268
|
|
1,000
|
|
42,268
|
|
||||
|
TOTAL ASSETS
|
1,874
|
|
82,865
|
|
1,868
|
|
86,607
|
|
||||
|
INTERCOMPANY
|
||||||||||||
|
Intercompany payable/receivable, net
|
117,873
|
|
(114,234
|
)
|
(3,639
|
)
|
—
|
|
||||
|
LIABILITIES AND STOCKHOLDERS' EQUITY
|
||||||||||||
|
Current liabilities
|
||||||||||||
|
Accounts payable
|
1,031
|
|
18,841
|
|
23
|
|
19,895
|
|
||||
|
Accrued license fees and revenue share
|
—
|
|
7,989
|
|
243
|
|
8,232
|
|
||||
|
Accrued compensation
|
2,285
|
|
661
|
|
20
|
|
2,966
|
|
||||
|
Short-term debt, net of debt issuance costs and discounts of $205
|
1,445
|
|
—
|
|
—
|
|
1,445
|
|
||||
|
Other current liabilities
|
911
|
|
231
|
|
—
|
|
1,142
|
|
||||
|
Current liabilities held for disposal
|
12,246
|
|
480
|
|
12,726
|
|
||||||
|
Total current liabilities
|
5,672
|
|
39,968
|
|
766
|
|
46,406
|
|
||||
|
Convertible notes, net of debt issuance costs and discounts of $1,827
|
3,873
|
|
—
|
|
—
|
|
3,873
|
|
||||
|
Convertible note embedded derivative liability
|
4,676
|
|
—
|
|
—
|
|
4,676
|
|
||||
|
Warrant liability
|
3,980
|
|
—
|
|
—
|
|
3,980
|
|
||||
|
Other non-current liabilities
|
—
|
|
—
|
|
—
|
|
—
|
|
||||
|
Non-current liabilities held for disposal
|
—
|
|
—
|
|
—
|
|
—
|
|
||||
|
Total liabilities
|
18,201
|
|
39,968
|
|
766
|
|
58,935
|
|
||||
|
Stockholders' equity
|
||||||||||||
|
Preferred stock
|
||||||||||||
|
Series A convertible preferred stock at $0.0001 par value; 2,000,000 shares authorized, 100,000 issued and outstanding (liquidation preference of $1,000)
|
100
|
|
—
|
|
—
|
|
100
|
|
||||
|
Common stock
|
||||||||||||
|
$0.0001 par value: 200,000,000 shares authorized; 76,843,278 issued and 76,108,822 outstanding at March 31, 2018.
|
10
|
|
—
|
|
—
|
|
10
|
|
||||
|
Additional paid-in capital
|
318,066
|
|
—
|
|
—
|
|
318,066
|
|
||||
|
Treasury stock (754,599 shares at December 31, 2017)
|
(71
|
)
|
—
|
|
—
|
|
(71
|
)
|
||||
|
Accumulated other comprehensive loss
|
(15
|
)
|
(621
|
)
|
311
|
|
(325
|
)
|
||||
|
Accumulated deficit
|
(216,544
|
)
|
(70,716
|
)
|
(2,848
|
)
|
(290,108
|
)
|
||||
|
Total stockholders' equity
|
101,546
|
|
(71,337
|
)
|
(2,537
|
)
|
27,672
|
|
||||
|
TOTAL LIABILITIES AND STOCKHOLDERS' EQUITY
|
119,747
|
|
(31,369
|
)
|
(1,771
|
)
|
86,607
|
|
||||
103
|
Consolidated Balance Sheet
|
||||||||||||
|
as of March 31, 2017
|
||||||||||||
|
(Unaudited)
|
||||||||||||
|
(dollars in thousands)
|
Parent
|
Guarantor Subsidiaries
|
Non-Guarantor Subsidiaries
|
Consolidated Total
|
||||||||
|
ASSETS
|
||||||||||||
|
Current assets
|
||||||||||||
|
Cash
|
257
|
|
5,335
|
|
557
|
|
6,149
|
|
||||
|
Restricted cash
|
156
|
|
175
|
|
—
|
|
331
|
|
||||
|
Accounts receivable, net of allowance of $228
|
—
|
|
10,131
|
|
532
|
|
10,663
|
|
||||
|
Deposits
|
—
|
|
121
|
|
—
|
|
121
|
|
||||
|
Prepaid expenses and other current assets
|
282
|
|
165
|
|
1
|
|
448
|
|
||||
|
Current assets held for disposal
|
—
|
|
5,671
|
|
282
|
|
5,953
|
|
||||
|
Total current assets
|
695
|
|
21,598
|
|
1,372
|
|
23,665
|
|
||||
|
Property and equipment, net
|
64
|
|
1,925
|
|
17
|
|
2,006
|
|
||||
|
Cost method investment
|
—
|
|
—
|
|
—
|
|
—
|
|
||||
|
Deferred tax assets
|
352
|
|
—
|
|
—
|
|
352
|
|
||||
|
Intangible assets, net
|
—
|
|
2,647
|
|
—
|
|
2,647
|
|
||||
|
Goodwill
|
—
|
|
41,268
|
|
1,000
|
|
42,268
|
|
||||
|
Long-term assets held for disposal
|
—
|
|
36,642
|
|
—
|
|
36,642
|
|
||||
|
TOTAL ASSETS
|
1,111
|
|
104,080
|
|
2,389
|
|
107,580
|
|
||||
|
INTERCOMPANY
|
||||||||||||
|
Intercompany payable/receivable, net
|
123,801
|
|
(119,493
|
)
|
(4,308
|
)
|
—
|
|
||||
|
LIABILITIES AND STOCKHOLDERS' EQUITY
|
||||||||||||
|
Current liabilities
|
||||||||||||
|
Accounts payable
|
1,022
|
|
10,749
|
|
16
|
|
11,787
|
|
||||
|
Accrued license fees and revenue share
|
—
|
|
2,979
|
|
32
|
|
3,011
|
|
||||
|
Accrued compensation
|
33
|
|
487
|
|
—
|
|
520
|
|
||||
|
Other current liabilities
|
768
|
|
273
|
|
—
|
|
1,041
|
|
||||
|
Current liabilities held for disposal
|
—
|
|
14,097
|
|
318
|
|
14,415
|
|
||||
|
Total current liabilities
|
1,823
|
|
28,585
|
|
366
|
|
30,774
|
|
||||
|
Convertible notes, net of debt issuance costs and discounts of $6,315
|
9,685
|
|
—
|
|
—
|
|
9,685
|
|
||||
|
Other non-current liabilities
|
697
|
|
—
|
|
—
|
|
697
|
|
||||
|
Convertible note embedded derivative liability
|
3,218
|
|
—
|
|
—
|
|
3,218
|
|
||||
|
Warrant liability
|
1,076
|
|
—
|
|
—
|
|
1,076
|
|
||||
|
Non-current liabilities held for disposal
|
—
|
|
85
|
|
—
|
|
85
|
|
||||
|
Total liabilities
|
16,499
|
|
28,670
|
|
366
|
|
45,535
|
|
||||
|
Stockholders' equity
|
||||||||||||
|
Preferred stock
|
||||||||||||
|
Series A convertible preferred stock at $0.0001 par value; 2,000,000 shares authorized, 100,000 issued and outstanding (liquidation preference of $1,000)
|
100
|
|
—
|
|
—
|
|
100
|
|
||||
|
Common stock
|
||||||||||||
|
$0.0001 par value: 200,000,000 shares authorized; 67,329,262 issued and 66,594,806 outstanding at March 31, 2017
|
8
|
|
—
|
|
—
|
|
8
|
|
||||
|
Additional paid-in capital
|
299,580
|
|
—
|
|
—
|
|
299,580
|
|
||||
|
Treasury stock (754,599 shares at March 31, 2017)
|
(71
|
)
|
—
|
|
—
|
|
(71
|
)
|
||||
|
Accumulated other comprehensive loss
|
(18
|
)
|
(613
|
)
|
310
|
|
(321
|
)
|
||||
|
Accumulated deficit
|
(191,186
|
)
|
(43,470
|
)
|
(2,595
|
)
|
(237,251
|
)
|
||||
|
Total stockholders' equity
|
108,413
|
|
(44,083
|
)
|
(2,285
|
)
|
62,045
|
|
||||
|
TOTAL LIABILITIES AND STOCKHOLDERS' EQUITY
|
124,912
|
|
(15,413
|
)
|
(1,919
|
)
|
107,580
|
|
||||
104
|
Consolidated Statement of Operations and Comprehensive Loss
|
|||||||||||||||
|
For the year ended March 31, 2018
|
|||||||||||||||
|
(Unaudited)
|
|||||||||||||||
|
(dollars in thousands)
|
Parent
|
Guarantor Subsidiaries
|
Non-Guarantor Subsidiaries
|
Elimination
|
Consolidated Total
|
||||||||||
|
Net revenues
|
—
|
|
135,687
|
|
905
|
|
(61,841
|
)
|
74,751
|
|
|||||
|
Cost of revenues
|
|||||||||||||||
|
License fees and revenue share
|
—
|
|
109,573
|
|
235
|
|
(61,841
|
)
|
47,967
|
|
|||||
|
Other direct cost of revenues
|
—
|
|
1,729
|
|
—
|
|
—
|
|
1,729
|
|
|||||
|
Total cost of revenues
|
—
|
|
111,302
|
|
235
|
|
(61,841
|
)
|
49,696
|
|
|||||
|
Gross profit
|
—
|
|
24,385
|
|
670
|
|
—
|
|
25,055
|
|
|||||
|
Operating expenses
|
|||||||||||||||
|
Product development
|
46
|
|
9,448
|
|
159
|
|
—
|
|
9,653
|
|
|||||
|
Sales and marketing
|
630
|
|
5,007
|
|
450
|
|
—
|
|
6,087
|
|
|||||
|
General and administrative
|
10,971
|
|
3,767
|
|
386
|
|
—
|
|
15,124
|
|
|||||
|
Total operating expenses
|
11,647
|
|
18,222
|
|
995
|
|
—
|
|
30,864
|
|
|||||
|
Income / (loss) from operations
|
(11,647
|
)
|
6,163
|
|
(325
|
)
|
—
|
|
(5,809
|
)
|
|||||
|
Interest and other income / (expense), net
|
|||||||||||||||
|
Interest income / (expense), net
|
(2,071
|
)
|
4
|
|
—
|
|
—
|
|
(2,067
|
)
|
|||||
|
Foreign exchange transaction gain / (loss)
|
2
|
|
(159
|
)
|
9
|
|
—
|
|
(148
|
)
|
|||||
|
Change in fair value of convertible note embedded derivative liability
|
(7,559
|
)
|
—
|
|
—
|
|
—
|
|
(7,559
|
)
|
|||||
|
Change in fair value of warrant liability
|
(3,208
|
)
|
—
|
|
—
|
|
—
|
|
(3,208
|
)
|
|||||
|
Gain / (loss) on extinguishment of debt
|
(1,787
|
)
|
2
|
|
—
|
|
—
|
|
(1,785
|
)
|
|||||
|
Other income / (expense)
|
3
|
|
(75
|
)
|
—
|
|
—
|
|
(72
|
)
|
|||||
|
Total interest and other income / (expense), net
|
(14,620
|
)
|
(228
|
)
|
9
|
|
—
|
|
(14,839
|
)
|
|||||
|
Income / (loss) from operations before income taxes
|
(26,267
|
)
|
5,935
|
|
(316
|
)
|
—
|
|
(20,648
|
)
|
|||||
|
Income tax benefit
|
(951
|
)
|
—
|
|
—
|
|
—
|
|
(951
|
)
|
|||||
|
Net income / (loss) from operations, net of taxes
|
(25,316
|
)
|
5,935
|
|
(316
|
)
|
—
|
|
(19,697
|
)
|
|||||
|
Discontinued operations, net of taxes
|
|||||||||||||||
|
Income / (loss) from operations of discontinued components
|
—
|
|
(33,168
|
)
|
8
|
|
—
|
|
(33,160
|
)
|
|||||
|
Net income / (loss) from discontinued operations, net of taxes
|
—
|
|
(33,168
|
)
|
8
|
|
—
|
|
(33,160
|
)
|
|||||
|
Net loss
|
(25,316
|
)
|
(27,233
|
)
|
(308
|
)
|
—
|
|
(52,857
|
)
|
|||||
|
Other comprehensive loss
|
|||||||||||||||
|
Foreign currency translation adjustment
|
—
|
|
(4
|
)
|
—
|
|
—
|
|
(4
|
)
|
|||||
|
Comprehensive loss
|
(25,316
|
)
|
(27,237
|
)
|
(308
|
)
|
—
|
|
(52,861
|
)
|
|||||
105
|
Consolidated Statement of Operations and Comprehensive Loss
|
|||||||||||||||
|
For the year ended March 31, 2017
|
|||||||||||||||
|
(Unaudited)
|
|||||||||||||||
|
(dollars in thousands)
|
Parent
|
Guarantor Subsidiaries
|
Non-Guarantor Subsidiaries
|
Elimination
|
Consolidated Total
|
||||||||||
|
Net revenues
|
—
|
|
70,703
|
|
1,126
|
|
(31,622
|
)
|
40,207
|
|
|||||
|
Cost of revenues
|
|||||||||||||||
|
License fees and revenue share
|
—
|
|
57,936
|
|
60
|
|
(31,622
|
)
|
26,374
|
|
|||||
|
Other direct cost of revenues
|
—
|
|
1,518
|
|
1,057
|
|
—
|
|
2,575
|
|
|||||
|
Total cost of revenues
|
—
|
|
59,454
|
|
1,117
|
|
(31,622
|
)
|
28,949
|
|
|||||
|
Gross profit
|
—
|
|
11,249
|
|
9
|
|
—
|
|
11,258
|
|
|||||
|
Operating expenses
|
|||||||||||||||
|
Product development
|
30
|
|
9,171
|
|
82
|
|
—
|
|
9,283
|
|
|||||
|
Sales and marketing
|
452
|
|
3,623
|
|
105
|
|
—
|
|
4,180
|
|
|||||
|
General and administrative
|
11,009
|
|
3,889
|
|
(132
|
)
|
—
|
|
14,766
|
|
|||||
|
Total operating expenses
|
11,491
|
|
16,683
|
|
55
|
|
—
|
|
28,229
|
|
|||||
|
Loss from operations
|
(11,491
|
)
|
(5,434
|
)
|
(46
|
)
|
—
|
|
(16,971
|
)
|
|||||
|
Interest and other income / (expense), net
|
|||||||||||||||
|
Interest expense, net
|
(1,329
|
)
|
(1,296
|
)
|
—
|
|
—
|
|
(2,625
|
)
|
|||||
|
Foreign exchange transaction loss
|
—
|
|
(22
|
)
|
(4
|
)
|
—
|
|
(26
|
)
|
|||||
|
Change in fair value of convertible note embedded derivative liability
|
475
|
|
—
|
|
—
|
|
—
|
|
475
|
|
|||||
|
Change in fair value of warrant liability
|
147
|
|
—
|
|
—
|
|
—
|
|
147
|
|
|||||
|
Loss on extinguishment of debt
|
—
|
|
(293
|
)
|
—
|
|
—
|
|
(293
|
)
|
|||||
|
Other income / (expense)
|
58
|
|
(47
|
)
|
—
|
|
—
|
|
11
|
|
|||||
|
Total interest and other income / (expense), net
|
(649
|
)
|
(1,658
|
)
|
(4
|
)
|
—
|
|
(2,311
|
)
|
|||||
|
Loss from operations before income taxes
|
(12,140
|
)
|
(7,092
|
)
|
(50
|
)
|
—
|
|
(19,282
|
)
|
|||||
|
Income tax benefit
|
(144
|
)
|
—
|
|
—
|
|
—
|
|
(144
|
)
|
|||||
|
Net loss from operations, net of taxes
|
(11,996
|
)
|
(7,092
|
)
|
(50
|
)
|
—
|
|
(19,138
|
)
|
|||||
|
Discontinued operations, net of taxes
|
|||||||||||||||
|
Income / (loss) from operations of discontinued components
|
—
|
|
(5,237
|
)
|
111
|
|
—
|
|
(5,126
|
)
|
|||||
|
Net income / (loss) from discontinued operations, net of taxes
|
—
|
|
(5,237
|
)
|
111
|
|
—
|
|
(5,126
|
)
|
|||||
|
Net income / (loss)
|
(11,996
|
)
|
(12,329
|
)
|
61
|
|
—
|
|
(24,264
|
)
|
|||||
|
Other comprehensive loss
|
|||||||||||||||
|
Foreign currency translation adjustment
|
—
|
|
(119
|
)
|
—
|
|
—
|
|
(119
|
)
|
|||||
|
Comprehensive income / (loss)
|
(11,996
|
)
|
(12,448
|
)
|
61
|
|
—
|
|
(24,383
|
)
|
|||||
106
|
Consolidated Statement of Operations and Comprehensive Loss
|
||||||||||||
|
For the year ended March 31, 2016
|
||||||||||||
|
(Unaudited)
|
||||||||||||
|
(dollars in thousands)
|
Parent
|
Guarantor Subsidiaries
|
Non-Guarantor Subsidiaries
|
Consolidated Total
|
||||||||
|
Net revenues
|
—
|
|
39,432
|
|
124
|
|
22,251
|
|
||||
|
Cost of revenues
|
||||||||||||
|
License fees and revenue share
|
—
|
|
30,619
|
|
—
|
|
13,314
|
|
||||
|
Other direct cost of revenues
|
—
|
|
9,775
|
|
(2,298
|
)
|
7,477
|
|
||||
|
Total cost of revenues
|
—
|
|
40,394
|
|
(2,298
|
)
|
20,791
|
|
||||
|
Gross profit / (loss)
|
—
|
|
(962
|
)
|
2,422
|
|
1,460
|
|
||||
|
Operating expenses
|
||||||||||||
|
Product development
|
(582
|
)
|
4,943
|
|
522
|
|
4,883
|
|
||||
|
Sales and marketing
|
46
|
|
2,718
|
|
144
|
|
2,908
|
|
||||
|
General and administrative
|
11,457
|
|
4,182
|
|
564
|
|
16,203
|
|
||||
|
Total operating expenses
|
10,921
|
|
11,843
|
|
1,230
|
|
23,994
|
|
||||
|
Income / (loss) from operations
|
(10,921
|
)
|
(12,805
|
)
|
1,192
|
|
(22,534
|
)
|
||||
|
Interest and other income / (expense), net
|
||||||||||||
|
Interest income / (expense), net
|
1
|
|
(1,717
|
)
|
—
|
|
(1,716
|
)
|
||||
|
Foreign exchange transaction loss
|
(6
|
)
|
(12
|
)
|
(6
|
)
|
(24
|
)
|
||||
|
Other income / (expense)
|
18
|
|
(22
|
)
|
—
|
|
(4
|
)
|
||||
|
Total interest and other income / (expense), net
|
13
|
|
(1,751
|
)
|
(6
|
)
|
(1,744
|
)
|
||||
|
Income / (loss) from operations before income taxes
|
(10,908
|
)
|
(14,556
|
)
|
1,186
|
|
(24,278
|
)
|
||||
|
Income tax provision
|
130
|
|
84
|
|
—
|
|
214
|
|
||||
|
Net income / (loss) from operations, net of taxes
|
(11,038
|
)
|
(14,640
|
)
|
1,186
|
|
(24,492
|
)
|
||||
|
Discontinued operations, net of taxes
|
||||||||||||
|
Loss from operations of discontinued components
|
—
|
|
(923
|
)
|
(2,617
|
)
|
(3,540
|
)
|
||||
|
Net loss from discontinued operations, net of taxes
|
—
|
|
(923
|
)
|
(2,617
|
)
|
(3,540
|
)
|
||||
|
Net loss
|
(11,038
|
)
|
(15,563
|
)
|
(1,431
|
)
|
(28,032
|
)
|
||||
|
Other comprehensive loss
|
||||||||||||
|
Foreign currency translation adjustment
|
—
|
|
(150
|
)
|
—
|
|
(150
|
)
|
||||
|
Comprehensive loss
|
(11,038
|
)
|
(15,713
|
)
|
(1,431
|
)
|
(28,182
|
)
|
||||
107
|
Consolidated Statement of Cash Flows
|
||||||||||||
|
For the year ended March 31, 2018
|
||||||||||||
|
(Unaudited)
|
||||||||||||
|
(dollars in thousands)
|
Parent
|
Guarantor Subsidiaries
|
Non-Guarantor Subsidiaries
|
Consolidated Total
|
||||||||
|
Cash flows from operating activities
|
||||||||||||
|
Net loss
|
(25,316
|
)
|
5,935
|
|
(316
|
)
|
(19,697
|
)
|
||||
|
Adjustments to reconcile net loss to net cash used in operating activities:
|
||||||||||||
|
Depreciation and amortization
|
21
|
|
2,629
|
|
10
|
|
2,660
|
|
||||
|
Change in allowance for doubtful accounts
|
—
|
|
299
|
|
—
|
|
299
|
|
||||
|
Amortization of debt discount and debt issuance costs
|
1,018
|
|
—
|
|
—
|
|
1,018
|
|
||||
|
Stock-based compensation
|
2,844
|
|
(189
|
)
|
—
|
|
2,655
|
|
||||
|
Stock-based compensation for services rendered
|
323
|
|
—
|
|
—
|
|
323
|
|
||||
|
Change in fair value of convertible note embedded derivative liability
|
7,559
|
|
—
|
|
—
|
|
7,559
|
|
||||
|
Change in fair value of warrant liability
|
3,208
|
|
—
|
|
—
|
|
3,208
|
|
||||
|
Loss on extinguishment of debt
|
1,787
|
|
(2
|
)
|
—
|
|
1,785
|
|
||||
|
(Increase) / decrease in assets:
|
||||||||||||
|
Accounts receivable
|
—
|
|
(7,094
|
)
|
23
|
|
(7,071
|
)
|
||||
|
Deposits
|
(34
|
)
|
8
|
|
(4
|
)
|
(30
|
)
|
||||
|
Deferred tax assets
|
(244
|
)
|
—
|
|
—
|
|
(244
|
)
|
||||
|
Prepaid expenses and other current assets
|
(85
|
)
|
(209
|
)
|
(12
|
)
|
(306
|
)
|
||||
|
Increase / (decrease) in liabilities:
|
||||||||||||
|
Accounts payable
|
8
|
|
8,092
|
|
8
|
|
8,108
|
|
||||
|
Accrued license fees and revenue share
|
—
|
|
5,010
|
|
211
|
|
5,221
|
|
||||
|
Accrued compensation
|
2,252
|
|
173
|
|
20
|
|
2,445
|
|
||||
|
Accrued interest
|
(26
|
)
|
—
|
|
—
|
|
(26
|
)
|
||||
|
Other current liabilities
|
6,078
|
|
(5,381
|
)
|
(619
|
)
|
78
|
|
||||
|
Other non-current liabilities
|
(679
|
)
|
(16
|
)
|
—
|
|
(695
|
)
|
||||
|
Net cash provided by / (used in) operating activities - continuing operations
|
(1,286
|
)
|
9,255
|
|
(679
|
)
|
7,290
|
|
||||
|
Net cash provided by / (used in) operating activities - discontinued operations
|
—
|
|
(873
|
)
|
549
|
|
(324
|
)
|
||||
|
Net cash used in operating activities
|
(1,286
|
)
|
8,382
|
|
(130
|
)
|
6,966
|
|
||||
|
Cash flows from investing activities
|
||||||||||||
|
Capital expenditures
|
(213
|
)
|
(1,770
|
)
|
(9
|
)
|
(1,992
|
)
|
||||
|
Net cash provided by / (used in) investing activities - continuing operations
|
(213
|
)
|
(1,770
|
)
|
(9
|
)
|
(1,992
|
)
|
||||
|
Net cash provided by / (used in) investing activities - discontinued operations
|
—
|
|
(142
|
)
|
—
|
|
(142
|
)
|
||||
|
Net cash used in investing activities
|
(213
|
)
|
(1,912
|
)
|
(9
|
)
|
(2,134
|
)
|
||||
|
Cash flows from financing activities
|
||||||||||||
|
Proceeds from short-term borrowings
|
2,500
|
|
—
|
|
—
|
|
2,500
|
|
||||
|
Repayment of debt obligations
|
(1,098
|
)
|
—
|
|
—
|
|
(1,098
|
)
|
||||
|
Payment for debt issuance costs
|
(346
|
)
|
—
|
|
—
|
|
(346
|
)
|
||||
|
Options exercised
|
337
|
|
—
|
|
—
|
|
337
|
|
||||
|
Warrant exercised
|
350
|
|
—
|
|
—
|
|
350
|
|
||||
|
Net cash provided in financing activities
|
1,743
|
|
—
|
|
—
|
|
1,743
|
|
||||
|
Effect of exchange rate changes on cash
|
—
|
|
(5
|
)
|
1
|
|
(4
|
)
|
||||
|
Net change in cash
|
244
|
|
6,465
|
|
(138
|
)
|
6,571
|
|
||||
|
Cash, beginning of period
|
257
|
|
5,335
|
|
557
|
|
6,149
|
|
||||
|
Cash, end of period
|
501
|
|
11,800
|
|
419
|
|
12,720
|
|
||||
108
|
Consolidated Statement of Cash Flows
|
||||||||||||
|
For the year ended March 31, 2017
|
||||||||||||
|
(Unaudited)
|
||||||||||||
|
(dollars in thousands)
|
Parent
|
Guarantor Subsidiaries
|
Non-Guarantor Subsidiaries
|
Consolidated Total
|
||||||||
|
Cash flows from operating activities
|
||||||||||||
|
Net loss
|
(11,996
|
)
|
(7,092
|
)
|
(50
|
)
|
(19,138
|
)
|
||||
|
Adjustments to reconcile net loss to net cash used in operating activities:
|
||||||||||||
|
Depreciation and amortization
|
14
|
|
663
|
|
1,929
|
|
2,606
|
|
||||
|
Change in allowance for doubtful accounts
|
—
|
|
33
|
|
15
|
|
48
|
|
||||
|
Amortization of debt discount and debt issuance costs
|
1,256
|
|
—
|
|
—
|
|
1,256
|
|
||||
|
Stock-based compensation
|
3,748
|
|
(386
|
)
|
—
|
|
3,362
|
|
||||
|
Stock-based compensation for services rendered
|
398
|
|
—
|
|
—
|
|
398
|
|
||||
|
Impairment of intangible assets
|
—
|
|
—
|
|
757
|
|
757
|
|
||||
|
Change in fair value of convertible note embedded derivative liability
|
(475
|
)
|
—
|
|
—
|
|
(475
|
)
|
||||
|
Change in fair value of warrant liability
|
(147
|
)
|
—
|
|
—
|
|
(147
|
)
|
||||
|
Loss on extinguishment of debt
|
—
|
|
293
|
|
—
|
|
293
|
|
||||
|
(Increase) / decrease in assets:
|
||||||||||||
|
Restricted cash transferred to / (from) operating cash
|
(156
|
)
|
(177
|
)
|
2
|
|
(331
|
)
|
||||
|
Accounts receivable
|
25
|
|
(3,076
|
)
|
(831
|
)
|
(3,882
|
)
|
||||
|
Deposits
|
—
|
|
(57
|
)
|
80
|
|
23
|
|
||||
|
Deferred tax assets
|
148
|
|
—
|
|
—
|
|
148
|
|
||||
|
Prepaid expenses and other current assets
|
(80
|
)
|
150
|
|
11
|
|
81
|
|
||||
|
Increase / (decrease) in liabilities:
|
||||||||||||
|
Accounts payable
|
(233
|
)
|
4,701
|
|
(34
|
)
|
4,434
|
|
||||
|
Accrued license fees and revenue share
|
—
|
|
(21
|
)
|
17
|
|
(4
|
)
|
||||
|
Accrued compensation
|
575
|
|
(94
|
)
|
(96
|
)
|
385
|
|
||||
|
Accrued interest
|
133
|
|
(97
|
)
|
—
|
|
36
|
|
||||
|
Other current liabilities
|
(1,091
|
)
|
270
|
|
(502
|
)
|
(1,323
|
)
|
||||
|
Other non-current liabilities
|
(31
|
)
|
(85
|
)
|
—
|
|
(116
|
)
|
||||
|
Intercompany movement of cash
|
(15,146
|
)
|
16,684
|
|
(1,538
|
)
|
—
|
|
||||
|
Net cash provided by / (used in) operating activities - continuing operations
|
(23,058
|
)
|
11,709
|
|
(240
|
)
|
(11,589
|
)
|
||||
|
Net cash provided by / (used in) operating activities - discontinued operations
|
—
|
|
4,067
|
|
527
|
|
4,594
|
|
||||
|
Net cash used in operating activities
|
(23,058
|
)
|
15,776
|
|
287
|
|
(6,995
|
)
|
||||
|
Cash flows from investing activities
|
||||||||||||
|
Capital expenditures
|
—
|
|
(1,418
|
)
|
—
|
|
(1,418
|
)
|
||||
|
Proceeds from sale of cost method investment in Sift
|
999
|
|
—
|
|
—
|
|
999
|
|
||||
|
Net cash provided by / (used in) investing activities - continuing operations
|
999
|
|
(1,418
|
)
|
—
|
|
(419
|
)
|
||||
|
Net cash provided by / (used in) investing activities - discontinued operations
|
—
|
|
(177
|
)
|
—
|
|
(177
|
)
|
||||
|
Net cash used in investing activities
|
999
|
|
(1,595
|
)
|
—
|
|
(596
|
)
|
||||
|
Cash flows from financing activities
|
||||||||||||
|
Cash received from issuance of convertible notes
|
16,000
|
|
—
|
|
—
|
|
16,000
|
|
||||
|
Repayment of debt obligations
|
—
|
|
(11,000
|
)
|
—
|
|
(11,000
|
)
|
||||
|
Payment for debt issuance costs
|
(407
|
)
|
(1,976
|
)
|
—
|
|
(2,383
|
)
|
||||
|
Options exercised
|
11
|
|
—
|
|
—
|
|
11
|
|
||||
|
Net cash provided in financing activities
|
15,604
|
|
(12,976
|
)
|
—
|
|
2,628
|
|
||||
|
Effect of exchange rate changes on cash
|
—
|
|
(336
|
)
|
217
|
|
(119
|
)
|
||||
|
Net change in cash
|
(6,455
|
)
|
869
|
|
504
|
|
(5,082
|
)
|
||||
|
Cash, beginning of period
|
6,712
|
|
4,466
|
|
53
|
|
11,231
|
|
||||
|
Cash, end of period
|
257
|
|
5,335
|
|
557
|
|
6,149
|
|
||||
109
|
Consolidated Statement of Cash Flows
|
||||||||||||
|
For the year ended March 31, 2016
|
||||||||||||
|
(Unaudited)
|
||||||||||||
|
(dollars in thousands)
|
Parent
|
Guarantor Subsidiaries
|
Non-Guarantor Subsidiaries
|
Consolidated Total
|
||||||||
|
Cash flows from operating activities
|
||||||||||||
|
Net loss
|
(11,038
|
)
|
(14,640
|
)
|
1,186
|
|
(24,492
|
)
|
||||
|
Adjustments to reconcile net loss to net cash used in operating activities:
|
||||||||||||
|
Depreciation and amortization
|
9
|
|
9,707
|
|
(1,843
|
)
|
7,873
|
|
||||
|
Change in allowance for doubtful accounts
|
—
|
|
(495
|
)
|
—
|
|
(495
|
)
|
||||
|
Amortization of debt discount and debt issuance costs
|
470
|
|
—
|
|
—
|
|
470
|
|
||||
|
Stock-based compensation
|
5,095
|
|
—
|
|
—
|
|
5,095
|
|
||||
|
Stock-based compensation for services rendered
|
867
|
|
—
|
|
—
|
|
867
|
|
||||
|
Stock issued for settlement of liability
|
283
|
|
—
|
|
—
|
|
283
|
|
||||
|
(Increase) / decrease in assets:
|
||||||||||||
|
Restricted cash transferred to / (from) operating cash
|
200
|
|
—
|
|
—
|
|
200
|
|
||||
|
Accounts receivable
|
(24
|
)
|
(4,988
|
)
|
(85
|
)
|
(5,097
|
)
|
||||
|
Deposits
|
9
|
|
74
|
|
(118
|
)
|
(35
|
)
|
||||
|
Deferred tax assets
|
(418
|
)
|
—
|
|
—
|
|
(418
|
)
|
||||
|
Prepaid expenses and other current assets
|
(171
|
)
|
111
|
|
39
|
|
(21
|
)
|
||||
|
Increase / (decrease) in liabilities:
|
||||||||||||
|
Accounts payable
|
(797
|
)
|
7,821
|
|
(3,644
|
)
|
3,380
|
|
||||
|
Accrued license fees and revenue share
|
—
|
|
2,743
|
|
(30
|
)
|
2,713
|
|
||||
|
Accrued compensation
|
(1,070
|
)
|
1,316
|
|
(1,346
|
)
|
(1,100
|
)
|
||||
|
Accrued interest
|
—
|
|
12
|
|
—
|
|
12
|
|
||||
|
Other current liabilities
|
(398
|
)
|
262
|
|
(670
|
)
|
(806
|
)
|
||||
|
Intercompany movement of cash
|
(4,014
|
)
|
(2,475
|
)
|
6,489
|
|
—
|
|
||||
|
Net cash provided by / (used in) operating activities - continuing operations
|
(10,997
|
)
|
(552
|
)
|
(22
|
)
|
(11,571
|
)
|
||||
|
Net cash provided by / (used in) operating activities - discontinued operations
|
—
|
|
4,515
|
|
(13
|
)
|
4,502
|
|
||||
|
Net cash used in operating activities
|
(10,997
|
)
|
3,963
|
|
(35
|
)
|
(7,069
|
)
|
||||
|
Cash flows from investing activities
|
||||||||||||
|
Capital expenditures
|
—
|
|
(1,549
|
)
|
—
|
|
(1,549
|
)
|
||||
|
Net cash proceeds from cost method investment in Sift
|
875
|
|
—
|
|
—
|
|
875
|
|
||||
|
Net cash provided by / (used in) investing activities - continuing operations
|
875
|
|
(1,549
|
)
|
—
|
|
(674
|
)
|
||||
|
Net cash used in investing activities
|
875
|
|
(1,549
|
)
|
—
|
|
(674
|
)
|
||||
|
Cash flows from financing activities
|
||||||||||||
|
Repayment of debt obligations
|
—
|
|
(600
|
)
|
—
|
|
(600
|
)
|
||||
|
Options exercised
|
51
|
|
—
|
|
—
|
|
51
|
|
||||
|
Stock issued for cash in stock offering, net
|
12,627
|
|
—
|
|
—
|
|
12,627
|
|
||||
|
Net cash provided in financing activities
|
12,678
|
|
(600
|
)
|
—
|
|
12,078
|
|
||||
|
Effect of exchange rate changes on cash
|
—
|
|
(173
|
)
|
—
|
|
(173
|
)
|
||||
|
Net change in cash
|
2,556
|
|
1,641
|
|
(35
|
)
|
4,162
|
|
||||
|
Cash, beginning of period
|
4,156
|
|
2,825
|
|
88
|
|
7,069
|
|
||||
|
Cash, end of period
|
6,712
|
|
4,466
|
|
53
|
|
11,231
|
|
||||
110
19. Commitments and Contingencies
Operating Lease Obligations
The Company leases office facilities and equipment under non-cancelable operating leases expiring in various years through 2024.
Following is a summary of future minimum payments under initial terms of leases as of:
|
Year ending March 31,
|
|
|||
|
2019
|
$
|
1,177
|
|
|
|
2020
|
1,217
|
|
||
|
2021
|
1,116
|
|
||
|
2022
|
868
|
|
||
|
2023
|
895
|
|
||
|
Thereafter
|
1,032
|
|
||
|
Total Minimum Lease Payments
|
$
|
6,305
|
|
|
These amounts do not reflect future escalations for real estate taxes and building operating expenses. Rental expense for continuing operations amounted to
$857
,
$669
and
$491
, for the years ended
March 31, 2018
,
2017
, and
2016
, respectively.
Other Obligations
As of
March 31, 2018
, the Company was obligated for payments under various employment contracts with initial terms greater than one year at
March 31, 2018
. Annual payments relating to these commitments at
March 31, 2018
are as follows:
|
Year ending March 31,
|
|
|||
|
2019
|
$
|
700
|
|
|
|
2020
|
500
|
|
||
|
2021
|
500
|
|
||
|
Total Minimum Payments
|
$
|
1,700
|
|
|
The Company is not obligated for payments beyond fiscal 2021.
Legal Matters
The Company may be involved in various claims, suits, assessments, investigations, and legal proceedings that arise from time to time in the ordinary course of its business, including those identified below. The Company accrues a liability when it is both probable that a liability has been incurred, and the amount of the loss can be reasonably estimated. The Company reviews these accruals at least quarterly, and adjusts them to reflect ongoing negotiations, settlements, rulings, advice of legal counsel, and other relevant information. To the extent new information is obtained and the Company's views on the probable outcomes of claims, suits, assessments, investigations, or legal proceedings change, changes in the Company's accrued liabilities would be recorded in the period in which such determination is made. For some matters, the amount of liability is not probable or the amount cannot be reasonably estimated, and therefore, accruals have not been made.
111
20. Supplemental Consolidated Financial Information
Unaudited Quarterly Results
The following tables set forth our quarterly consolidated statements of operations in dollars for each quarter of fiscal
2018
and
2017
. We have prepared the quarterly consolidated statements of operations data on a basis consistent with the audited consolidated financial statements included in Part II, Item 8 of this Annual Report on Form 10-K. In the opinion of management, the financial information in these tables reflects all adjustments, consisting only of normal recurring adjustments that management considers necessary for a fair presentation of this data. This information should be read in conjunction with the audited consolidated financial statements and related notes included in Part II, Item 8 of this Annual Report on Form 10-K. The results of historical periods are not necessarily indicative of the results for any future period.
|
|
Three Months Ended
|
|||||||||||||||||||||||||||||||
|
March 31, 2018
|
December 31, 2017
|
September 30, 2017
|
June 30, 2017
|
March 31, 2017
|
December 31, 2016
|
September 30, 2016
|
June 30, 2016
|
|||||||||||||||||||||||||
|
(in thousands, except per share amounts)
|
||||||||||||||||||||||||||||||||
|
Net revenues
|
$
|
20,961
|
|
$
|
22,732
|
|
$
|
15,905
|
|
$
|
15,153
|
|
$
|
11,599
|
|
$
|
11,774
|
|
$
|
9,874
|
|
$
|
6,960
|
|
||||||||
|
License fees and revenue share
|
13,623
|
|
14,887
|
|
9,865
|
|
9,592
|
|
7,172
|
|
8,006
|
|
6,650
|
|
4,546
|
|
||||||||||||||||
|
Other direct cost of revenues
|
453
|
|
437
|
|
430
|
|
409
|
|
1,217
|
|
451
|
|
454
|
|
453
|
|
||||||||||||||||
|
Gross profit
|
6,885
|
|
7,408
|
|
5,610
|
|
5,152
|
|
3,210
|
|
3,317
|
|
2,770
|
|
1,961
|
|
||||||||||||||||
|
Total operating expenses
|
8,224
|
|
8,895
|
|
7,076
|
|
6,669
|
|
5,977
|
|
7,027
|
|
7,509
|
|
7,716
|
|
||||||||||||||||
|
Loss from operations
|
(1,339
|
)
|
(1,487
|
)
|
(1,466
|
)
|
(1,517
|
)
|
(2,767
|
)
|
(3,710
|
)
|
(4,739
|
)
|
(5,755
|
)
|
||||||||||||||||
|
Interest income / (expense), net
|
(252
|
)
|
(446
|
)
|
(662
|
)
|
(707
|
)
|
(599
|
)
|
(721
|
)
|
(626
|
)
|
(679
|
)
|
||||||||||||||||
|
Foreign exchange transaction gain / (loss)
|
(87
|
)
|
49
|
|
(47
|
)
|
(63
|
)
|
(27
|
)
|
4
|
|
—
|
|
(3
|
)
|
||||||||||||||||
|
Change in fair value of convertible note embedded derivative liability
|
(1,249
|
)
|
(1,658
|
)
|
(3,344
|
)
|
(1,308
|
)
|
(1,948
|
)
|
2,853
|
|
(430
|
)
|
—
|
|
||||||||||||||||
|
Change in fair value of convertible note embedded derivative liability
|
(682
|
)
|
(898
|
)
|
(1,164
|
)
|
(464
|
)
|
(650
|
)
|
937
|
|
(140
|
)
|
—
|
|
||||||||||||||||
|
Loss on extinguishment of debt
|
(619
|
)
|
(284
|
)
|
(882
|
)
|
—
|
|
—
|
|
—
|
|
(293
|
)
|
—
|
|
||||||||||||||||
|
Other income / (expense)
|
2
|
|
(155
|
)
|
78
|
|
3
|
|
(92
|
)
|
69
|
|
16
|
|
18
|
|
||||||||||||||||
|
Loss from operations before income taxes
|
(4,226
|
)
|
(4,879
|
)
|
(7,487
|
)
|
(4,056
|
)
|
(6,083
|
)
|
(568
|
)
|
(6,212
|
)
|
(6,419
|
)
|
||||||||||||||||
|
Income tax provision
|
(14
|
)
|
(84
|
)
|
(884
|
)
|
31
|
|
(303
|
)
|
300
|
|
(437
|
)
|
296
|
|
||||||||||||||||
|
Net loss from operations, net of taxes
|
(4,212
|
)
|
(4,795
|
)
|
(6,603
|
)
|
(4,087
|
)
|
(5,780
|
)
|
(868
|
)
|
(5,775
|
)
|
(6,715
|
)
|
||||||||||||||||
|
Basic and diluted net loss per common share from continuing operations
|
$
|
(0.06
|
)
|
$
|
(0.06
|
)
|
$
|
(0.10
|
)
|
$
|
(0.06
|
)
|
$
|
(0.09
|
)
|
$
|
(0.01
|
)
|
$
|
(0.09
|
)
|
$
|
(0.10
|
)
|
||||||||
|
Weighted-average common shares outstanding, basic and diluted
|
75,160
|
|
72,148
|
|
66,846
|
|
66,599
|
|
66,595
|
|
66,634
|
|
66,457
|
|
66,286
|
|
||||||||||||||||
Quarterly Trends and Seasonality
Our overall operating results fluctuate from quarter to quarter as a result of a variety of factors, some of which are outside our control. We have experienced rapid growth since the acquisition of Appia, Inc. on March 6, 2015, which has resulted in a substantial increase in our revenue and a corresponding increase in our operating expenses to support our growth. We are continuously working on enhancing our technology and our operational abilities. This rapid growth has also led to uneven overall operating results due to changes in our investment in sales and marketing and research and development from quarter to quarter and increases in employee headcount. Our historical results should not be considered a reliable indicator of our future results of operations.
112
Many advertisers spend the largest portion of their advertising budgets during the third quarter, to coincide with the holiday shopping season. As a result, typically the third quarter of each calendar year historically represents the largest percentage of our revenue for the year, and the first quarter of each year represents the smallest percentage.
Valuation and Qualifying Accounts
|
Fiscal Year
|
Description
|
Balance at Beginning of Period
|
Charged to Income Statement
|
Charged to Allowance
|
Balance at End of Period
|
|||||||||||||
|
(in thousands)
|
||||||||||||||||||
|
Trade receivables
|
||||||||||||||||||
|
2018
|
Allowance for doubtful accounts
|
$
|
228
|
|
$
|
530
|
|
$
|
246
|
|
$
|
512
|
|
|||||
|
2017
|
Allowance for doubtful accounts
|
203
|
|
294
|
|
269
|
|
$
|
228
|
|
||||||||
|
2016
|
Allowance for doubtful accounts
|
698
|
|
142
|
|
637
|
|
$
|
203
|
|
||||||||
21. Subsequent Events
Pay Transaction
On April 29, 2018, Digital Turbine Asia Pacific Pty, Ltd. and Digital Turbine Singapore Pte Ltd. (together, “Pay Seller”), each wholly owned subsidiaries of the Company, entered into an Asset Purchase Pay Agreement (the “Pay Agreement”), dated as of April 23, 2018, with Chargewave Ptd Ltd (“Pay Purchaser”) to sell certain assets (the “Pay Assets”) owned by the Pay Seller related to the Company’s Direct Carrier Billing business. The Pay Purchaser is principally owned and controlled by Jon Mooney, an officer of the Pay Seller. At the closing of the asset sale, Mr. Mooney will no longer be employed by the Company or Pay Seller.
Pursuant to the Pay Agreement, the Pay Seller will sell to Pay Purchaser their rights, title and interest in Pay Agreements between the applicable Pay Seller and carriers and content providers related to the Pay Assets as well as contracts with certain service providers. In addition, on July 1, 2019 (the “Technology Transfer Date”), the Pay Seller will transfer technology and infrastructure owned by the Pay Seller for the purpose of performing the business of the Pay Assets, and prior to such time Pay Seller will license such technology to Pay Purchaser for license fees described below. The Pay Seller continues to own all assets not specifically sold, including all accounts receivable for services supplied prior to the closing date and all Ignite related assets. On and after the closing, Pay Purchaser will assume and agree to pay and perform on any and all liabilities incurred in connection with transferred assets or the transferred contracts relating to the period after the closing date.
In consideration for the assets being transferred, the Pay Seller will receive license fees, revenue share and equity equivalent rights, as follows:
(1) Pay Purchaser will pay to the Pay Seller license fees, until the Technology Transfer Date, from a range of sources of gross profits related to the contracts transferred, in an amount equal to between
zero
to
70%
of monthly gross profits, with the precise percentage of license fees varying based on the amount of such gross profits per a scale in the Pay Agreement, plus additional amounts for revenues generated from new customer introductions made by Pay Seller after the closing.
(2) For a period commencing on the Technology Transfer Date and ending on the date that is thirty-six (
36
) months from the closing, Pay Purchaser will pay Pay Seller revenue sharing payments, from a range of gross profits related to the contracts transferred, in an amount equal to between
zero
to
70%
of monthly gross profits, with the precise percentage of revenue sharing varying based on the amount of such gross profits per a scale in the Pay Agreement, plus additional amounts for revenues generated from new customer introductions made by Pay Seller after the Technology Transfer Date.
(3) Pay Seller will also receive equity equivalent rights, including to be entitled to
20%
of the net proceeds (in all forms of value) upon the closing of a wide variety of liquidity transactions involving the Pay Purchaser.
The Pay Agreement contains customary representations and warranties by each party with respect to itself and does not contain any representations or warranties by the Company with respect to the Company or its business. The Pay
113
Sellers have also agreed to various customary covenants and Pay Agreements, including, among others, a non-compete, and the Pay Purchaser has agreed to provide a security interest in the transferred assets to secure its obligations.
The transaction is expected to be completed in June 2018.
The Pay assets and operations are now qualified as discontinued operations and, as a result, have been reclassified from loss from continuing operations to discontinued operations in accordance with the provisions of “Presentation of Financial Statements” in the Accounting Standards Codification in this and all future filings for all periods presented.
The foregoing description of the Pay Agreement does not purport to be complete and is qualified in its entirety by reference to the Pay Agreement, which was filed on a Form 8-K on April 29, 2018.
A&P Transaction
On April 29, 2018, Digital Turbine Media, Inc. (the “A&P Seller”), a wholly owned subsidiary of the Company, entered into an Asset Purchase Agreement (the “A&P Agreement”), dated as of April 28, 2018, with Creative Clicks B.V. (the “A&P Purchaser”) to sell business relationships with various advertisers and publishers (the “A&P Assets”) related to the Company’s Advertising and Publishing business.
Pursuant to the A&P Agreement, the A&P Seller will sell to the A&P Purchaser its rights, title and interest in agreements between A&P Seller and specified advertisers and publishers, other than agreements or relationships, or parts thereof, relating to A&P Seller’s application (“app”) distribution services. The A&P Seller continues to own all assets not specifically sold, including integration, technology or operational assets or services, as well as contracts not transferred or assigned under the A&P Agreement. A&P Seller owns all accounts receivable for services supplied prior to the closing date, and all accounts receivable for services partially performed prior to and at the closing date will be prorated between A&P Seller and A&P Purchaser. On and after the closing, the A&P Purchaser will assume and agree to pay and perform on any and all liabilities incurred in connection with the transferred assets relating to the period after the closing date, in accordance with the terms of the respective agreements.
In consideration for the assets being transferred, the A&P Purchaser will, over a
three
year period after the closing, share revenue from transferred assets, new revenue streams from the transferred assets and new engagements with specified A&P Seller business partners. The revenue share is calculated as follows: A&P Purchaser will pay A&P Seller
27.5%
of gross profits, with a revenue share maximum of
$1,000,000
in year 1, scaling down to
15%
of gross profits, with a revenue share maximum of
$500,000
, in year 3, as further specified in the A&P Agreement. Additionally, for each customer introduction A&P Seller makes to A&P Purchaser that leads to a customer contract with A&P Purchaser or an affiliate, A&P Purchaser will pay A&P Seller a percentage of gross profit earned from the contract.
The A&P Agreement contains customary representations and warranties by each party with respect to itself and does not contain any representations or warranties by the Company to the Company or its business. The A&P Seller has also agreed to various customary covenants and agreements, including, among others, a non-compete, and the A&P Purchaser has agreed to provide a security interest in the transferred assets to secure its obligations. The A&P Seller has further represented that it will make best efforts that certain employees specified in the A&P Agreement accept employment with the A&P Purchaser on or after the closing date.
The transaction is expected to be complete in June 2018.
The A&P assets and operations are now qualified as discontinued operations and, as a result, have been reclassified from loss from continuing operations to discontinued operations in accordance with the provisions of “Presentation of Financial Statements” in the Accounting Standards Codification in this and all future filings for all periods presented.
The foregoing description of the A&P Agreement does not purport to be complete and is qualified in its entirety by reference to the A&P Agreement, which was filed on a Form 8-K on April 29, 2018.
There can be no assurance that the transactions described above will be consummated on the terms described or at all. The Pay Agreement and the A&P Agreement has been included to provide investors with information regarding its terms and is not intended to provide any financial or other factual information about the Company or its subsidiaries. In particular, the representations, warranties and covenants contained in such agreements (a) were made only for purposes of such agreements
114
and as of specific dates, (b) were solely for the benefit of the parties to such agreements, (c) may be subject to limitations agreed upon by the parties, including being qualified by confidential disclosures, (d) were made for the purposes of allocating contractual risk between the parties to such agreements instead of establishing matters subject to representations and warranties as facts, and (e) may be subject to standards of materiality applicable to the contracting parties that differ from those applicable to investors. Moreover, information concerning the subject matter of the representations, warranties and covenants may change after the date of such agreement, which subsequent information may or may not be fully reflected in public disclosures by the Company. Accordingly, investors should read the representations and warranties in such agreement not in isolation but only in conjunction with the other information about the Company that is included in reports, statements and other filings it makes with the U.S. Securities and Exchange Commission.
As previously disclosed, in 2016 the Company received an informal inquiry from the staff of the Securities and Exchange Commission’s Division of Enforcement requesting the voluntary provision of documents and information generally related to the Company’s internal controls over financial reporting and disclosure controls and procedures. On April 17, 2018, the Company received a “Wells Notice,” stating that the staff of the SEC has made a preliminary determination to recommend to the SEC that it file an enforcement action against the Company alleging violations of Sections 13(a) and 13(b)(2)(B) of the Securities and Exchange Act of 1934 and Rules 13a-1, 13a-13 and 13a-15 thereunder. Although the Company seeks to resolve this matter by settlement, there is no assurance that a settlement will be reached or as to terms and conditions. Please see the section of this filing entitled “Item 9A--Controls and Procedures” regarding the Company’s remediation efforts and results to date regarding the material weaknesses that previously rendered its internal controls ineffective. The Company believes that the resolution of this matter is unlikely to have a material impact on its operations or financial position.
|
ITEM 9.
|
CHANGES IN AND DISAGREEMENTS WITH ACCOUNTANTS ON ACCOUNTING AND FINANCIAL DISCLOSURE
|
None.
|
ITEM 9A.
|
CONTROLS AND PROCEDURES
|
Evaluation of Disclosure Controls and Procedures
Under the supervision of and with the participation of our management, including our chief executive officer, who is our principal executive officer, and our chief financial officer, who is our principal financial officer, we conducted an evaluation of the effectiveness of our disclosure controls and procedures as of March 31, 2018, the end of the period covered by this Annual Report. The term “disclosure controls and procedures,” as set forth in Rules 13a-15(e) and 15d-15(e) under the Securities Exchange Act of 1934, as amended, or the Exchange Act, means controls and other procedures of a company that are designed to provide reasonable assurance that information required to be disclosed by a company in the reports that it files or submits under the Exchange Act is recorded, processed, summarized and reported, within the time periods specified in the SEC’s rules and forms. Disclosure controls and procedures include, without limitation, controls and procedures designed to ensure that information required to be disclosed by a company in the reports that it files or submits under the Exchange Act is accumulated and communicated to the company’s management, including its principal executive and principal financial officers, as appropriate to allow timely decisions regarding required disclosure. Management recognizes that any controls and procedures, no matter how well designed and operated, can provide only reasonable assurance of achieving their objectives, and management necessarily applies its judgment in evaluating the cost-benefit relationship of possible controls and procedures. Based on the evaluation of our disclosure controls and procedures as of March 31, 2018 our chief executive officer and chief financial officer concluded that, as of such date, our disclosure controls and procedures were effective. As a result, the disclosure controls and procedures were effective to ensure that information required to be disclosed by us in the reports that we file or submit under the Securities Exchange Act of 1934 is recorded, processed, summarized and reporting within the time periods specified in the Securities and Exchange Commission’s rules and forms and is accumulated and communicated to our management, including the chief executive officer and chief financial officer, as appropriate to allow timely decisions regarding disclosure.
Changes in Internal Controls Over Financial Reporting
See "Completed Actions" subsection below which summarizes changes in internal controls over financial reporting.
115
Other than as described above, there were no changes in our internal controls over financial reporting or in other factors identified in connection with the evaluation required by Exchange Act Rules 13a-15(d) or 15d-15(d) that occurred during the fiscal period ended March 31, 2018 that have materially affected, or are reasonably likely to materially affect, our internal controls over financial reporting.
Management's Completed Actions
Due to the many completed actions taken by the Company, management has concluded that the material weakness identified as of March 31, 2017 has been eliminated as of March 31, 2018. We, along with our Audit Committee, will continue to monitor and evaluate the effectiveness of these remedial actions and make further changes as deemed appropriate. Management, with the oversight of our Audit Committee, has devoted considerable effort to remediate as of March 31, 2018 the material weakness identified as of March 31, 2017, which is evidenced through the completed actions during fiscal 2018 detailed below.
Completed Actions
|
•
|
Developed and executed a plan to fully implement and effectively operate the key controls identified through the completion of the documentation of internal control procedures over all significant accounting areas and information technology that have an impact on financial reporting.
|
|
•
|
Implemented a cyclical process for evaluating and testing the control environment to help ensure any future key control failures will be identified on a timely basis, and allow for the possibility of immediate detection and remediation.
|
|
•
|
Conducted formal training related to key accounting policies, internal controls, and SEC compliance for all key personnel who have an impact on the transactions underlying the financial statements.
|
Management's Annual Report on Internal Control over Financial Reporting
Management of the Company is responsible for establishing and maintaining adequate internal control over financial reporting. Internal control is designed to provide reasonable assurance regarding the reliability of financial reporting and the preparation of financial statements for external purposes in accordance with accounting principles generally accepted in the United States of America. Management regularly monitors its internal control over financial reporting, and actions are taken to correct deficiencies as they are identified.
Under the supervision and with the participation of management, including the principal executive officer and principal financial officer, the Company conducted an evaluation of the effectiveness of internal control over financial reporting. This assessment was based on the framework in Internal Control – Integrated Framework issued by the Committee of Sponsoring Organizations of the Treadway Commission in 1992. Based on this evaluation under the framework in Internal Control – Integrated Framework, management concluded that the Company maintained effective internal control over financial reporting as of March 31, 2018, as such term is defined in Exchange Act Rule 13a-15(f).
Because of its inherent limitations, internal control over financial reporting may not prevent or detect misstatements. Further, because of changes in conditions, internal control effectiveness may vary over time. The Company's independent registered public accounting firm, SingerLewak LLP, has audited the Company's internal control over financial reporting as of March 31, 2018, as stated in their report included herein. SingerLewak LLP also audited the Company's consolidated financial statements as of and for the year ended March 31, 2018.
The foregoing has been approved by our management, including our Chief Executive Officer and Chief Financial Officer, who have been involved with the reassessment and analysis of our internal control over financial reporting.
SingerLewak LLP, an independent registered public accounting firm, has issued an attestation report on our internal control over financial reporting. This report is included in Part II, Item 8 of this 10K.
|
ITEM 9B.
|
OTHER INFORMATION
|
None.
|
ITEM 10.
|
DIRECTORS, EXECUTIVE OFFICERS AND CORPORATE GOVERNANCE
|
116
The information required by this item is incorporated by reference to our Proxy Statement or 10K/A for the
2018
Annual Meeting of Stockholders (or Form 10-K/A).
|
ITEM 11.
|
EXECUTIVE COMPENSATION
|
The information required by this item is incorporated by reference to our Proxy Statement for the
2018
Annual Meeting of Stockholders (or Form 10-K/A).
|
ITEM 12.
|
SECURITY OWNERSHIP OF CERTAIN BENEFICIAL OWNERS AND MANAGEMENT AND RELATED STOCKHOLDER MATTERS
|
The information required by this item is incorporated by reference to our Proxy Statement for the
2018
Annual Meeting of Stockholders (or Form 10-K/A).
|
ITEM 13.
|
CERTAIN RELATIONSHIPS AND RELATED TRANSACTIONS, AND DIRECTOR INDEPENDENCE
|
The information required by this item is incorporated by reference to our Proxy Statement for the
2018
Annual Meeting of Stockholders (or Form 10-K/A).
|
ITEM 14.
|
PRINCIPAL ACCOUNTANT FEES AND SERVICES
|
The information required by this item is incorporated by reference to our Proxy Statement for the
2018
Annual Meeting of Stockholders (or Form 10-K/A).
|
ITEM 15.
|
EXHIBITS AND FINANCIAL STATEMENT SCHEDULES
|
We have filed the following documents as part of this Annual Report on Form 10-K:
1. Consolidated Financial Statements:
Our consolidated financial statements are listed in the "Index to Consolidated Financial Statements" under Part II, Item 8 of this Annual Report on Form 10-K.
|
Consolidated Financial Statements:
|
|
|
The supplementary financial information required by this Item 8 is set forth in Note 20 of the Notes to the Consolidated Financial Statements under the caption "Supplemental Consolidated Financial Information".
|
|
117
2. Financial Statement Schedules
Unaudited Quarterly Results and Valuation and Qualifying Accounts for the three fiscal years ended March 31, 2018, 2017, and 2016 is included in Note 20 of Notes to Consolidated Financial Statements included in Part II Item 8 "Supplemental Consolidated Financial Information" All other schedules called for by Form 10-K are omitted because they are inapplicable or the required information is shown in the consolidated financial statements, or notes thereto, included herein.
3. Exhibits
See the Exhibit Index immediately following the signature page of this Annual Report on Form 10-K.
118
|
ITEM 16.
|
10-K SUMMARY
|
None.
|
Exhibit
No.
|
|
Description
|
|
|
|
|
|
2.1
|
|
|
|
2.2
|
||
|
2.3
|
||
|
3.1
|
|
|
|
3.2
|
||
|
|
|
|
|
3.3
|
||
|
|
|
|
|
3.4
|
|
|
|
|
|
|
|
3.5
|
|
|
|
|
|
|
|
3.6
|
|
|
|
|
|
|
|
3.7
|
|
|
|
3.8
|
|
|
|
3.9
|
|
|
|
|
|
|
|
3.10
|
|
|
|
|
|
|
|
3.11
|
|
|
|
4.1
|
||
|
4.1.1
|
||
|
4.1.2
|
||
|
4.2
|
||
119
|
4.2.1
|
||
|
4.3
|
||
|
4.4
|
||
|
10.1
|
|
|
|
|
|
|
|
10.1.1
|
|
|
|
|
|
|
|
10.1.2
|
|
|
|
|
|
|
|
10.1.3
|
|
|
|
10.2
|
|
|
|
10.3
|
|
|
|
|
|
|
|
10.3.1
|
|
|
|
|
|
|
|
10.3.2
|
|
|
|
|
|
|
|
10.4
|
|
|
|
|
|
|
|
10.5
|
|
|
|
|
|
|
|
10.6
|
|
|
|
10.6.1
|
|
|
|
10.6.2
|
||
|
10.7
|
|
|
|
|
|
|
|
10.8
|
|
|
|
10.9
|
|
|
|
|
|
|
|
10.10
|
||
120
|
10.11
|
||
|
|
|
|
|
10.12
|
||
|
10.13
|
||
|
10.14
|
||
|
10.15
|
||
|
10.16
|
||
|
10.17
|
||
|
10.18
|
||
|
10.19
|
||
|
10.20
|
||
|
10.21
|
||
|
10.22
|
||
|
12.1
|
||
|
|
|
|
|
21.1
|
|
|
|
|
|
|
|
23.1
|
|
|
|
|
|
|
|
31.1
|
|
|
|
|
|
|
|
31.2
|
|
|
|
|
|
|
|
32.1
|
|
|
|
|
|
|
|
32.2
|
|
|
|
|
|
|
|
101
|
|
INS XBRL Instance Document. *
|
|
|
|
|
|
101
|
|
SCH XBRL Schema Document. *
|
|
|
|
|
|
101
|
|
CAL XBRL Taxonomy Extension Calculation Linkbase Document. *
|
|
|
|
|
|
101
|
|
DEF XBRL Taxonomy Extension Definition Linkbase Document. *
|
|
|
|
|
|
101
|
|
LAB XBRL Taxonomy Extension Label Linkbase Document. *
|
|
|
|
|
|
101
|
|
PRE XBRL Taxonomy Extension Presentation Linkbase Document. *
|
|
*
|
Filed herewith
|
121
|
**
|
The certifications attached as Exhibit 32.1 and 32.2 that accompany this Annual Report on Form 10-K are not deemed filed with the Securities and Exchange Commission and are not to be incorporated by reference into any filing of Digital Turbine Inc under the Securities Act of 1933, as amended, or the Securities Exchange Act of 1934, as amended, whether made before or after the date of this Form 10-K, irrespective of any general incorporation language contained in such filing.
|
|
†
|
Management contract or compensatory plan or arrangement
|
††
Confidential treatment requested and received as to certain portions
|
^
|
Schedules and Exhibits have been omitted pursuant to Item 601(b)(2) of Regulation S-K. The Company undertakes to furnish supplemental copies of any of the omitted schedules upon request by the U.S. Securities and Exchange Commission.
|
122
SIGNATURES
Pursuant to the requirements of Section 13 or 15(d) of the Exchange Act, the Registrant has duly caused this report to be signed on its behalf by the undersigned, thereunto duly authorized.
Principal Executive Officer:
|
|
|
Digital Turbine, Inc.
|
||
|
Dated: June 12, 2018
|
|
|
||
|
|
|
By:
|
|
/s/ William Stone
|
|
|
|
|
|
William Stone
|
|
|
|
|
|
Chief Executive Officer
|
|
|
|
|
|
(Principal Executive Officer)
|
Pursuant to the requirements of the Exchange Act, this Report has been signed below by the following persons on behalf of the Registrant in the capacities and on the dates indicated.
|
Signatures
|
Title
|
Date
|
||
|
/s/ Robert Deutschman
|
Chairman of the Board
|
June 12, 2018
|
||
|
Robert Deutschman
|
||||
|
/s/ William Stone
|
Chief Financial Officer
(Principal Executive Officer) |
June 12, 2018
|
||
|
William Stone
|
||||
|
/s/ Barrett Garrison
|
Chief Financial Officer
(Principal Financial Officer)
|
June 12, 2018
|
||
|
Barrett Garrison
|
||||
|
/s/ David Wesch
|
Acting Chief Accounting Officer
(Principal Accounting Officer)
|
June 12, 2018
|
||
|
David Wesch
|
||||
|
/s/ Mohan Gyani
|
Director
|
June 12, 2018
|
||
|
Mohan Gyani
|
||||
|
/s/ Christopher Rogers
|
Director
|
June 12, 2018
|
||
|
Christopher Rogers
|
||||
|
/s/ Jeffrey Karish
|
Director
|
June 12, 2018
|
||
|
Jeffrey Karish
|
||||
|
/s/ Paul Schaeffer
|
Director
|
June 12, 2018
|
||
|
Paul Schaeffer
|
||||
|
/s/ Roy Chestnut
|
Director
|
June 12, 2018
|
||
|
Roy Chestnut
|
||||
123
TABLE OF CONTENTS
Part IItem 1. BusinessItem 1A. Risk FactorsItem 1B. Unresolved Staff CommentsItem 2. PropertiesItem 3. Legal ProceedingsItem 4. Mine Safety DisclosurePart IIItem 5. Market For Registrant S Common Equity, Related Stockholder Matters and Issuer Purchases Of Equity SecuritiesItem 6. Selected Financial DataItem 7. Management S Discussion and Analysis Of Financial Condition and Results Of OperationsItem 7A. Quantitative and Qualitative Disclosures About Market RiskItem 8. Financial Statements and Supplementary DataItem 9. Changes in and Disagreements with Accountants on Accounting and Financial DisclosureItem 9A. Controls and ProceduresItem 9B. Other InformationPart IIIItem 10. Directors, Executive Officers and Corporate GovernanceItem 11. Executive CompensationItem 12. Security Ownership Of Certain Beneficial Owners and Management and Related Stockholder MattersItem 13. Certain Relationships and Related Transactions, and Director IndependenceItem 14. Principal Accountant Fees and ServicesPart IVItem 15. Exhibits and Financial Statement SchedulesItem 16. 10-k Summary