APYX MEDICAL CORP
10-Ks and 10-Qs
|
|
|
|
|
|
|
|
|
|
|
|
|
|
|
|
|
|
|
|
|
|
|
|
|
|
|
|
|
|
|
|
|
|
|
|
|
|
|
|
|
|
|
|
|
|
|
|
|
|
|
|
|
|
|
|
|
|
|
UNITED STATES
SECURITIES AND EXCHANGE COMMISSION
Washington, D.C. 20549
FORM 10-K
|
ý
ANNUAL REPORT PURSUANT TO SECTION 13 OR 15(d) OF THE SECURITIES EXCHANGE ACT OF 1934
|
|
For the fiscal year ended December 31, 2018
|
|
or
|
|
o
TRANSITION REPORT PURSUANT TO SECTION 13 OR 15(d) OF THE SECURITIES EXCHANGE ACT OF 1934
|
|
For the transition period from _____ to _____
|
|
Commission File Number: 0-12183
|

|
|
APYX MEDICAL CORPORATION
|
|
(Exact name of registrant as specified in its charter)
|
|
Delaware
|
11-2644611
|
|
|
(State or other jurisdiction of
incorporation or organization)
|
(I.R.S. Employer
Identification No.)
|
|
5115 Ulmerton Road, Clearwater, FL 33760
(Address of principal executive offices, zip code)
(727) 384-2323
(Issuer’s telephone number)
Securities registered pursuant to Section 12(b) of the Act:
|
Title of each Class
|
Name of each Exchange on which registered
|
|
|
Common Stock, $.001 Par Value
|
NASDAQ Stock Market LLC
|
|
Securities registered under Section 12(g) of the Exchange Act: None
Indicate by check mark if the registrant is a well-known seasoned issuer, as defined in Rule 405 of the Securities Act. Yes:
o
No
ý
Indicate by check mark if the registrant is not required to file reports pursuant to Section 13 or Section 15(d) of the Act. Yes:
o
No
ý
Indicate by check mark whether the registrant (1) filed all reports required to be filed by Section 13 or 15(d) of the Securities Exchange Act of 1934 during the preceding 12 months (or for such shorter period that the registrant was required to file such reports) and (2) has been subject to such filing requirements for the past 90 days. Yes:
ý
No
o
Indicate by check mark whether the registrant has submitted electronically and posted on its corporate Website, if any, every Interactive Data File required to be submitted and posted pursuant to Rule 405 of Regulation S-T (§232.405 of this chapter) during the preceding 12 months (or for such shorter period that the registrant was required to submit and post such files). Yes:
ý
No
o
Indicate by check mark if disclosure of delinquent filers pursuant to Item 405 of Regulation S-K (§229.405 of this chapter) is not contained herein and will not be contained, to the best of registrant’s knowledge, in definitive proxy or information statements incorporated by reference in Part III of this Form 10-K or any amendment to this Form 10-K.
o
Indicate by check mark whether the registrant is a large accelerated filer, an accelerated filer, a non-accelerated filer, or a smaller reporting company. See the definitions of “large accelerated filer”, “accelerated filer” and “smaller reporting company” in Rule 12b-2 of the Exchange Act (Check one):
|
Large accelerated filer
|
o
|
Accelerated filer
|
ý
|
|
|
Non-accelerated filer
|
o
|
(Do not check if a smaller reporting company)
|
Smaller reporting company
|
ý
|
|
Emerging growth company
|
o
|
|||
|
If an emerging growth company, indicate by check mark if the registrant has elected not to use the extended transition period for complying with any new or revised financial accounting standards provided pursuant to Section 13(a) of the Exchange Act.
|
o
|
|||
Indicate by check mark whether the registrant is a shell company (as defined in Rule 12b-2 of the Exchange Act). Yes:
o
No
ý
The aggregate market value of the common stock held by non-affiliates computed by reference to the price at which the stock was sold, or the average bid and asked prices of such stock on the NYSE MKT exchange, as of
June 30, 2018
, the registrant’s most recently completed third fiscal quarter, was approximately
$133.1 million
.
As of
March 11, 2019
,
34,037,819
shares of the registrant’s
$0
par value common stock were outstanding.
DOCUMENTS INCORPORATED BY REFERENCE
None.
December 31, 2018
|
Part I
|
Page
|
|||
|
Item 1
|
||||
|
Item 1A
|
||||
|
Item 1B
|
||||
|
Item 2
|
||||
|
Item 3
|
||||
|
Item 4
|
||||
|
Part II
|
||||
|
Item 5
|
||||
|
Item 6
|
||||
|
Item 7
|
||||
|
Item 7A
|
||||
|
Item 8
|
||||
|
Item 9
|
||||
|
Item 9A
|
||||
|
Item 9B
|
||||
|
Part III
|
||||
|
Item 10
|
||||
|
Item 11
|
||||
|
Item 12
|
||||
|
Item 13
|
||||
|
Item 14
|
||||
|
Part IV
|
||||
|
Item 15
|
||||
|
Signatures
|
||||
i
APYX MEDICAL CORPORATION
Cautionary Notes Regarding
“
Forward-Looking
”
Statements
We have included or incorporated by reference into this report, and from time to time may make in our public filings, press releases or other public statements, certain statements that may constitute forward-looking statements. These include without limitation those under “Business” in Part I, Item 1, “Risk Factors” in Part I, Item 1A, “Legal Proceedings” in Part I, Item 3, “Management's Discussion and Analysis of Financial Condition and Results of Operations” in Part II, Item 7, and “Quantitative and Qualitative Disclosures about Market Risk” in Part II, Item 7A. In addition, our management my make forward-looking statements to analysts, investors, representatives of the media and others. These forward-looking statements are not historical facts and represent only our beliefs regarding future events, many of which, by their nature, are inherently uncertain and beyond our control. We may, in some cases, use words such as “project”, “believe”, “anticipate”, “plan”, “expect”, “estimate”, “intend”, “should”, “would”, “could”, “potentially”, “may” or other words that convey uncertainty of future events or outcomes to identify these forward-looking statements.
In connection with the “safe harbor” provisions of the Private Securities Litigation Reform Act of 1995, we are identifying important factors that, individually or in the aggregate, could cause actual results to differ materially from those contained in any forward- looking statements made by us. Any such forward-looking statements are qualified by reference to the following cautionary statements.
Forward-looking statements in this report are subject to a number of risks and uncertainties, some of which are beyond our control, including, among other things:
|
•
|
changes in general economic, business or demographic conditions or trends in the U.S. or throughout the world or changes in the political environment, including changes in GDP, interest rates and inflation;
|
|
•
|
our ability to conclude a sufficient number of attractive growth projects, deploy growth capital in amounts consistent with our objectives in the prosecution of those and achieve targeted risk-adjusted returns on any growth project, including the commercialization of our J-Plasma technology;
|
|
•
|
the regulatory environment, including our ability to gain requisite approval from the Food and Drug Administration, and the ability to estimate compliance costs, comply with any changes thereto, rates implemented by regulators, and our relationships and rights under and contracts with governmental agencies and authorities;
|
|
•
|
disruptions or other extraordinary or force majeure events and the ability to insure against losses resulting from such events or disruptions;
|
|
•
|
sudden or extreme volatility in commodity prices and availability;
|
|
•
|
changes in competitive dynamics affecting our business and the medical device industry as a whole;
|
|
•
|
technological innovations leading to increased competition in the medical device industry;
|
|
•
|
our ability to service, comply with the terms of and refinance at maturity our indebtedness, including due to dislocation in debt markets;
|
|
•
|
changes in healthcare policy;
|
|
•
|
our ability to make alternate arrangements to account for any disruptions or shutdowns that may affect suppliers’ facilities or the operations upon which our business is dependent;
|
|
•
|
our ability to implement operating and internal growth strategies;
|
|
•
|
environmental risks, including the impact of climate change and weather conditions;
|
|
•
|
the impact of weather events, including potentially hurricanes, tornadoes and/or seasonal extremes;
|
|
•
|
unplanned outages and/or failures of technical and mechanical systems;
|
|
•
|
changes in U.S. income tax laws;
|
|
•
|
work interruptions or other labor stoppages;
|
Our actual results, performance, prospects or opportunities could differ materially from those expressed in or implied by the forward-looking statements. A description of risks that could cause our actual results to differ appears under the caption “Risk Factors” in Part I, Item 1A and elsewhere in this report. It is not possible to predict or identify all risk factors and you should not consider that description to be a complete discussion of all potential risks or uncertainties that could cause actual results to differ.
In light of these risks, uncertainties and assumptions, you should not place undue reliance on any forward-looking statements. The forward-looking events discussed in this report may not occur. These forward-looking statements are made as of the date of this report. We undertake no obligation to publicly update or revise any forward-looking statements, whether as a result of new information, future events or otherwise. You should, however, consult further disclosures we may make in future filings with the Securities and Exchange Commission (SEC). Past performance is not an indicator of future results.
ii
APYX MEDICAL CORPORATION
PART I
ITEM 1. Business
General
Apyx Medical Corporation (“Company”, “Apyx Medical”, “we”, “us”, or “our”), formerly known as Bovie Medical Corporation, was incorporated in 1982, under the laws of the State of Delaware and has its principal executive office at
5115 Ulmerton Road, Clearwater, FL 33760
.
We are a medical technology company and the developer of J-Plasma
®
(marketed and sold under the Renuvion™ Cosmetic Technology brand in the cosmetic surgery market), a patented plasma-based surgical product for cutting, coagulation and ablation of soft tissue. J-Plasma technology utilizes a helium ionization process to produce a stable, focused beam of plasma that provides surgeons with greater precision, and minimal invasiveness. The Company also leverages its expertise through original equipment manufacturing (OEM) agreements with other medical device manufacturers.
On August 30, 2018, we closed on a definitive asset purchase agreement with Specialty Surgical Instrumentation Inc., a Tennessee Corporation and wholly-owned subsidiary of Symmetry Surgical Inc. (“Symmetry”), pursuant to which we divested and sold our electrosurgical "Core" business segment and related intellectual property, including the Bovie® brand and trademarks, to Symmetry for gross proceeds of $97 million in cash. The divestiture and sale of our Core business segment to Symmetry allows us to further focus on our strategic objective of commercializing our J-Plasma technology, including the RenuvionTM brand in the cosmetic surgery market. We also entered into with Symmetry a transition services agreement, a Patent Licensing Agreement, a Disposables Supply Agreement, and a Generator Manufacturing and Supply Agreement, the latter of which will establish us as an OEM-provider of generators to Symmetry for a period of at least 10 years.
In connection with the asset purchase agreement, we also entered into an Electro Surgical Disposables and Accessories, Cauteries and Other Products Supply Agreement with Symmetry for up to a four-year term, whereby we will manufacture certain Core products and sell them to Symmetry at agreed upon prices. Any revenue, costs and expenses resulting from this agreement are netted and reported in our Consolidated Statements of Operations as Other gains or losses.
In connection with the asset purchase agreement, we also entered into a Manufacture and Supply Agreement with Symmetry for a ten-year term, whereby we will manufacture certain products and sell them to Symmetry at agreed upon prices. Revenue, costs and expenses resulting from this agreement are reported in our Consolidated Statements as income or loss from operations of our OEM reporting segment.
As of December 31, 2018, we had a direct sales force of 27 field-based selling professionals and a network of 14 independent sales agencies. We also had three sales managers. This selling organization is focused on the use of Renuvion in the cosmetic surgery market. In addition, we have invested in training programs and marketing-related activities to support accelerated adoption of Renuvion.
Our objective is to achieve profitable, sustainable growth by increasing our market share in the advanced energy category, including the commercialization of products that have the potential to be transformational with respect to the results they produce for surgeons and patients. In order to achieve this objective, we plan to leverage our long history in the industry, along with the reputation for quality and reliability that our brand enjoys within the medical community.
Significant Subsidiaries
Apyx Bulgaria, EOOD, formerly known as Bovie Bulgaria, is a wholly-owned limited liability company incorporated under Bulgarian law, located in Sofia, Bulgaria. It is engaged in the business of engineering and manufacturing our electrosurgical and OEM generators and accessories.
Industry
The cosmetic and plastic surgery market is a special segment of the medical field which is involved in the restoration, reconstruction, or alteration of the human body so as to enhance the body’s appearance. The market for cosmetic surgery includes surgical, minimally invasive and nonsurgical cosmetic procedures. This market is expected to grow year over year and this growth is driven by social and cultural factors such as influence of social media, peer pressure for appearance and beauty, and increasing disposable income are factors contributing to the growth of the market.
1
APYX MEDICAL CORPORATION
We believe that Apyx Medical has sustainable, competitive advantages in the cosmetic market for several reasons. We have a long history of developing unique energy devices to meet the needs of physicians and we are recognized for our outstanding product quality supported by strong engineering and research and development capabilities. We believe that our equipment and devices have and will continue to improve the lives of doctors and their patients.
Intellectual Property
We rely on our intellectual property that we have developed or acquired over the years including patents, trade secrets, technical innovations and various licensing agreements to provide our future growth and build our competitive position. We have been issued
37
patents in the United States and
24
foreign patents. We have
14
pending patent applications in the United States and eight pending foreign applications. We have five US registered trademarks and two pending US trademark applications. As we continue to expand our intellectual property portfolio we believe it is critical for us to continue to invest in filing patent applications to protect our technology, inventions and improvements. However, we can give no assurance that competitors will not infringe on our patent rights or otherwise create similar or non-infringing competing products that are technically patentable in their own right.
Manufacturing and Suppliers
We are committed to producing the most technically advanced and highest quality products of their kind available on the market. We manufacture the majority of our products on our premises in Clearwater, Florida and at our facility located in Sofia, Bulgaria, which are certified under the ISO international quality standards and are subject to continuing regulation and routine inspections by the FDA to ensure compliance with regulations relating to our quality system, medical device complaint reporting and adherence to FDA restrictions on promotion and advertising. In addition, we are subject to regulations under the Occupational Safety and Health Act, the Environmental Protection Act and other federal, state and local regulations.
Our wholly-owned subsidiary, Apyx Bulgaria, EOOD operates an approximately 20,000 square foot ISO13485 certified and FDA registered manufacturing facility located in the capital city of Sofia, which houses manufacturing, development and assembly operations.
We also have collaborative arrangements with three foreign suppliers under which we request the development of certain items and components, which we purchase pursuant to purchase orders. Our purchase order commitments are never more than one year in duration and are supported by our sales forecasts.
Backlog
The value of unshipped factory orders is not material.
Employees
At
December 31, 2018
, we had
222
full-time employees world-wide, of whom
4
were executive officers,
41
supervisory personnel, 27 sales personnel and 150 technical support, administrative and production employees. None of our current employees are covered by a collective bargaining agreement and we have never experienced a work stoppage.
2
APYX MEDICAL CORPORATION
Our Two Business Segments
We currently have two reportable operating segments: Advanced Energy and OEM. The Corporate and Other category includes certain unallocated corporate and administrative costs which are not specifically attributed to any reportable segment. Net assets are shared, therefore, not allocated to the reportable segments.
For the year ended
December 31, 2018
, our OEM segment contributed 21.7% of our consolidated total revenue and our Advanced Energy segment contributed 78.3% of our consolidated total revenue.
Advanced Energy Segment
Overview
Our product portfolio consists of our Helium Plasma Technology that is marketed and sold as Renuvion® in the cosmetic surgery market and J-Plasma® in the hospital surgical market. Renuvion offers plastic surgeons, facial plastic surgeons and cosmetic physicians a unique ability to provide controlled heat to the tissue to achieve their desired results. The J-Plasma system allows surgeons to operate with a high level of precision
,
virtually eliminating unintended tissue trauma. This technology has US FDA clearance, CE mark, and clearance for sale in multiple other countries and is generally indicated for the cutting, coagulation and ablation of soft tissue. The system consists of an electrosurgical generator unit (ESU), a handpiece and a supply of helium gas. The proprietary radiofrequency (RF) energy is delivered to the handpiece by the ESU and used to energize an electrode. When helium gas passes over the energized electrode, helium plasma is generated which allows for conduction of the RF energy from the electrode to the patient in the form of a precise helium plasma beam. The energy delivered to the patient via the helium plasma beam is very precise and cooler in temperature in comparison to other surgical energy modalities such as standard RF monopolar energy. This technology has been the subject of ten white papers and has been cited therein for its clinical utility in traditional surgical and cosmetic procedures.
This technology initially received FDA clearance in 2012 and a CE mark in December, 2014, which enables us to sell the product in the European Union. In 2014, we created and trained a direct sales force dedicated to sell this technology. In 2015, we continued the commercialization process for our helium plasma technology with a multi-faceted strategy designed to accelerate adoption of the product. This strategy primarily involved deployment of a dedicated sales force, extending and customizing the product line and expanding the specialties in which this technology can become the “standard of care“ for certain procedures.
During 2018, we continued our full scale commercialization efforts for Renuvion. As of December 31, 2018 we had a direct sales force of 27 field-based selling professionals and a network of 14 independent sales agencies. We also had three sales managers. This selling organization is focused on the use of Renuvion in the cosmetic surgery market. In addition, we have invested in training programs and marketing-related activities to support accelerated adoption of Renuvion.
From 2015 through 2018, we launched numerous new J-Plasma products in an effort to target new surgical procedures, users, and markets. As a result of our sales, marketing and product development initiatives, we have significantly increased the number of physicians using J-Plasma by expanding usage to include the cosmetic surgery market in the US, and the cosmetic surgery market as well as the surgical oncology market outside the US.
In 2018 specifically, we launched an updated version of the Apyx Ultimate generator, and a new J-Plasma handpiece for open surgical procedures. The updated version of the Apyx Ultimate generator and the new handpieces allow for the combination of our trademarked Cool-Coag technology and J-Plasma into one, multiple purpose handpiece. Cool-Coag combines standard monopolar coagulation waveforms with helium to provide three distinct modes to stop bleeding including a high fulguration/spray effect. During the second quarter of 2017, we refocused our U.S. sales team into the cosmetic surgery market. Since that time, we have seen a significant increase in the number of physicians using J-Plasma in the cosmetic surgery market.
In order to assist us in leveraging J-Plasma’s precision and effectiveness in multiple surgical specialties, we launched a Medical Advisory Board in 2015 which is currently comprised of surgeons who are recognized leaders in GYN, urology, cardiovascular and cardiothoracic surgery. In 2018, we added an additional surgeon to this board from the cosmetic surgical specialty and plan to add additional members in 2019.
In 2019, our J-Plasma commercial strategy in the U.S. will be primarily focused on advancing the usage of J-Plasma in the cosmetic surgery market (marketed as Renuvion in this segment). In our international markets, we will also focus on cosmetic surgery and
3
APYX MEDICAL CORPORATION
will continue to focus on the surgical oncology market. Our primary international focus will be on advancing the adoption of J-Plasma in the hospital setting. We believe the majority of our targeted procedures in international markets take place in the hospital surgical suite and believe the sales process is shorter in hospitals in international markets as compared to those in the United States. Also, in 2019, we will continue a clinical and regulatory strategy to support our market focus, once complete, we will launch a corresponding marketing campaign.
We are continuing to make substantial investments in the development and marketing of our Renuvion technology for the long-term benefit of the Company and its stakeholders and this may adversely affect our short term profitability and cash flow, particularly over the next 12 to 24 months. While we believe that these investments have the potential to generate additional revenues and profits in the future, there can be no assurance that J-Plasma will be successful or that such future revenues and profitability will be realized.
Customers
We primarily sell our Renuvion products through our direct sales force to physicians, surgical centers and cosmetic surgery offices.
Products
During 2018, Advanced Energy Products consisted of the J-Plasma/Renuvion line of products. The J-Plasma system consists of an electrosurgical generator unit (ESU), a handpiece and a supply of helium gas. Radiofrequency (RF) energy is delivered to the handpiece by the ESU and used to energize an electrode. When helium gas passes over the energized electrode, helium plasma is generated which allows for conduction of the RF energy from the electrode to the patient in the form of a precise helium plasma beam. The energy delivered to the patient via the helium plasma beam is very precise and cooler in temperature in comparison to other surgical energy modalities such as standard RF monopolar energy.
J-Plasma Generator
In June 2017, we launched the newest version of the Apyx Ultimate™ generator. The Apyx Ultimate 2.0 is a high frequency electrosurgical generator that can be used for delivery of RF energy and/or helium gas plasma to cut, coagulate and ablate soft tissue during open and laparoscopic surgical procedures. The generator offers users monopolar, bipolar and J-Plasma features in a single generator. It also powers the Cool-Coag technology that has been incorporated into the new Precise Open J-Plasma handpieces that were released in December 2017. These 2017 new product releases continue to expand the procedure base for J-Plasma by providing the surgeons with the tools they need to access additional anatomic locations and perform specific procedures.
J-Plasma Disposable Portfolio
We offer different hand pieces for open and laparoscopic procedures. The helium-based plasma generated from these devices have been shown to cause less thermal damage to tissue than CO2 laser, argon plasma and RF energy products currently available on the market. The technology has a general indication and can be used for cutting, coagulating and ablating soft tissue. The two primary specialties that are targeted in phase one of the product launch are surgical oncology and cosmetic surgery. The advantages of helium plasma continue to be studied throughout the medical and scientific communities. We believe that surgical applications are just one area of opportunity for this technology.
Competition
Currently, we are the only company with helium-based plasma and retractable blade products. However, there are RF based competitors, argon plasma competitors, and CO2 laser competitors for our target market. We believe our competitive position did not change in 2018.
4
APYX MEDICAL CORPORATION
OEM Segment
Overview
The Company leverages its expertise in the design, development and manufacturing of electrosurgical equipment by producing generators and related accessories for large, well-known medical device manufacturers through original equipment manufacturing (OEM) agreements, as well as start-up companies with the need for our energy based designs. In connection with the Asset Purchase Agreement with Symmetry Surgical we entered into a Manufacturing and Supply Agreement for a ten-year term, whereby we will manufacture certain products and sell to them at agreed upon prices. Revenue, costs and expenses resulting from this agreement are reported in our Consolidated Statements as a component of income or loss from operations of our OEM reporting segment.
5
APYX MEDICAL CORPORATION
ITEM 1A. Risk factors
In addition to risks and uncertainties in the ordinary course of business, important risk factors that may affect us are discussed below. Additional risks not presently known to us or that we currently believe are immaterial may also significantly impact or impair our business operations.
Risks Related to Our Industry
The medical device industry is highly competitive and we may be unable to compete effectively.
The medical device industry is highly competitive. Many competitors in this industry are well-established, do a substantially greater amount of business and have greater financial resources and facilities than we do.
We have invested and continue to invest, substantial resources to develop and monetize our J-Plasma technology. If we are unable to gain acceptance in the marketplace of J-Plasma/Renuvion, our business and results of operations may be materially and adversely affected.
We also compete by private labeling our products for major distributors under their label. This allows us to increase our position in the marketplace and thereby compete from two different approaches, our Apyx label and our customers’ private label. Our private label customers distribute our products under their name through their internal sales force. We believe our main competitors do not private label their products.
Lastly, at this time, we sell the majority of our products through distributors. Many of the companies we compete with sell direct, thus competing directly with distributors they sometimes use.
Our industry is highly regulated by the U.S. Food and Drug Administration and international regulatory authorities, as well as other governmental, state and federal agencies which have substantial authority to establish criteria which must be complied with in order for us to continue in operation.
United States
Our products and research and development activities are subject to regulation by the FDA and other regulatory bodies. FDA regulations govern, among other things, the following activities:
•
Product development
•
Product testing
•
Product labeling
•
Product storage
•
Pre-market clearance or approval
•
Advertising and promotion
•
Product traceability and
•
Product indications.
In the United States, medical devices are classified on the basis of control deemed necessary to reasonably ensure the safety and effectiveness of the device. Most Class I devices are subject to general controls and exempt from Pre-Market Notification (510k)). These controls include registration and listing and adherence to the Good Manufacturing Practice (GMP) requirements of the Quality System Regulation Labeling requirements. Most Class II devices are subject to the Pre-Market Notification ((510(k)) process as well as general and special controls that include performance testing (bench, animal and clinical in some cases), electrical safety testing, biocompatibility testing, sterilization and shelf-life testing, software testing, and system verification and validation testing. Class III devices are those which require a Pre-Market Approval (PMA) from the FDA to ensure their safety and effectiveness. Class III devices are those that support or sustain human life, are of substantial importance in preventing impairment of human health, or which present a potential, unreasonable risk of illness or injury. Due to the level of risk associated with Class III devices, FDA has determined that general and special controls alone are insufficient to assure the safety and effectiveness of Class III devices. PMA is the most stringent type of device marketing application required by FDA.
Currently, we only manufacture Class I and Class II devices and all of our products are exempt from the PMA process. Our Class II devices require Pre-Market Notification [510k)]. A 510(k) is a premarket submission made to FDA to demonstrate that the
6
APYX MEDICAL CORPORATION
device to be marketed is at least as safe and effective, that is, substantially equivalent, to a legally marketed device that is not subject to PMA. Submitters must compare their device to one or more similar legally marketed devices and make and support their substantial equivalence claims. Before marketing a device, each submitter must receive an order, in the form of a letter, from FDA which finds the device to be substantially equivalent (SE) and states that the device can be marketed in the U.S. This order "clears" the device for commercial distribution.
International Regulation
To market products in the European Union, our products must bear the “CE” mark. Manufacturers of medical devices bearing the CE mark have gone through a conformity assessment process that assures that products are manufactured in compliance with a recognized quality system in the areas of design, development and manufacturing requirements and that they comply with the European Medical Devices Directive (MDD).
Each device that bears a CE mark has associated technical documentation that includes a description of the following:
•
Description of the device and its components,
•
A Summary of how the device complies with the essential requirements of the medical devices directive,
•
Safety (risk assessment) and performance of the device,
•
Clinical evaluations with respect to the device,
•
Methods, facilities and quality controls used to manufacture the device and
•
Proposed labeling for the device.
Manufacturing and distribution of a device is subject to ongoing surveillance by the appropriate regulatory body to ensure continued compliance with quality system and reporting requirements.
Each member country of the European Union maintains the right to impose additional regulatory requirements.
The European Union’s (EU) Medical Device Regulation (MDR), officially passed in April 2017, represents the first major changes to the EU medical device regulatory environment in more than 20 years. The new EU MDR has significantly raised the compliance bar for the medical device industry and will cause significant changes to the regulatory obligations of legal manufacturers, importers and distributors involved in the medical device distribution chain. Enforcement of this new regulation will transition in over the next three years. The EU Medical Device Regulation (MDR) is far more complex than the existing Medical Devices Directive (MDD) and it presents new challenges for manufacturers. Classification has changed for some product categories and strict new requirements have been imposed on clinical data, risk management, post-market surveillance, and supplier management. Specifically, these new requirements are related to post-market importation and distribution activities of medical devices in the European Economic Area (EEA). Until now, different European countries have interpreted and implemented the directive in different ways. By revising the directive, EU MDR will enforce:
|
▪
|
Stricter pre-market control of high-risk devices at an EU level
|
|
▪
|
The inclusion of certain aesthetic products which present the same characteristics and risk profile as equivalent medical devices
|
|
▪
|
Improved transparency through the establishment of a comprehensive EU database of medical devices (Eudamed)
|
|
▪
|
Device traceability through the supply chain from its manufacturer through to the final user
|
|
▪
|
The reinforcement of the rules on clinical data and clinical studies on devices
|
|
▪
|
Manufacturers to collect data about the real-life use of their devices
|
|
▪
|
Improved coordination between EU Member States
|
Outside of the European Union, regulations vary significantly from country to country and are becoming increasingly stringent and country specific. Territories and countries around the world continue to develop their own unique regulatory requirements and these individual governments are passing laws that enforce these new regulations and also imposing fees to register products in their country. The time and effort required to obtain approval to market products may be longer or shorter than that required in the United States or the European Union. Certain European countries outside of the European Union and other countries in the world do not recognize the CE mark certification or FDA clearance and have their own regulatory requirements to register and sell products in these territories. We are required to meet regulatory requirements and obtain registrations for our products in all countries that have these regulatory requirements prior to selling our products in that country.
7
APYX MEDICAL CORPORATION
Environmental Regulation
The medical device industry continues to be the subject of intense scrutiny and stringent regulation and the demand for green, sustainable products is rapidly increasing. There are increasing requirements for efficient and accurate processes for hazardous substance handling, supplier disclosures and regulatory reporting in order to comply with numerous global health and environmental regulatory requirements and restrictions, such as:
|
▪
|
Restriction on Hazardous Substances (RoHS) Directive. The objective of the RoHS Directive is the restriction of the use of certain hazardous substances in electrical and electronic equipment so they are not released into the environment during the product’s life, and especially at the end of life should the product be disposed of in a landfill.
|
|
▪
|
The Packaging and Packing Waste Directive. Materials used in packaging have limited amounts of hazardous materials and are recoverable and recyclable.
|
|
▪
|
REACH Regulation. This regulation is aimed at the control of chemicals in use and their effect on human health and the environment. REACH requires that all chemicals be registered with the European Chemicals Agency. Medical device manufacturers must have a documented inventory of the chemicals/substances they are using, ensure with their suppliers that chemicals they use or supply are formally assessed, and understand their responsibilities with regard to the regulatory requirements.
|
|
▪
|
Proposition 65, officially known as the Safe Drinking Water and Toxic Enforcement Act protects the State of California’s drinking water sources from being contaminated with chemicals known to cause cancer, birth defects or other reproductive harm, and requires businesses to inform Californians about exposures to such chemicals. The new regulations impose major new requirements specific to label, sign, and shelf tag warnings for consumer products offered for sale in California, which apply to all units of the product manufactured after August 30, 2018.
|
|
▪
|
Hazardous Air Pollutants: Ethylene Oxide. Ethylene oxide is used to sterilize equipment and plastic devices that cannot be sterilized by steam or other methods, such as medical equipment. US Environmental Protection Agency (EPA) is addressing ethylene oxide based on the results of the latest National Air Toxics Assessment (NATA), which identified the chemical as a potential concern in several areas across the country. The EPA is taking steps to address emissions of ethylene oxide from some types of industrial facilities across the country. EPA will review Clean Air Act regulations for facilities that emit ethylene oxide to ensure that they protect the public from significant risk and gather additional information on industrial emissions of ethylene oxide, including where emissions occur, how those emissions can be controlled, and how current emission controls can be improved.
|
If we are unable to successfully introduce new products or fail to keep pace with competitive advances in technology, our business, financial condition and results of operations could be adversely affected. In addition, our research and development efforts rely upon investments and alliances and we cannot guarantee that any previous or future investments or alliances will be successful.
Our research and development activities are an essential component of our efforts to develop new and innovative products for introduction in the marketplace. New and improved products play a critical role in our sales growth. We continue to place emphasis on the development of proprietary products, such as our J-Plasma technology, and product improvements to complement and expand our existing product lines. We maintain close working relationships with physicians and medical personnel in hospitals and universities who assist in product research and areas of development. Our research and development activities are primarily conducted internally and are expensed as incurred. These expenses include direct expenses for wages, materials and services associated with the development of our products net of any reimbursements from customers. Research and development expenses do not include any portion of general and administrative expenses. Our research and development activities are conducted at our Clearwater, Florida and Sofia, Bulgaria facilities. We expect to continue making future investments to enable us to develop and market new technologies and products to further our strategic objectives and strengthen our existing business. However, we cannot guarantee that any of our previous or future investments in both facilities will be successful or that our new products will gain market acceptance, the failure of which would have a material adverse effect on our business and results of operations.
8
APYX MEDICAL CORPORATION
The amount expended by us on research and development of our products during the years 2018, 2017 and 2016, totaled approximately $2.5 million, $1.9 million and $1.0 million, respectively. During the past three years, we invested substantial resources in the development and marketing of our Advanced Energy product technology. We have not incurred any direct costs relating to environmental regulations or requirements. For 2019, we expect to invest approximately 10% to 15% of revenue for research and development activities.
Even if we are successful in developing and obtaining approval for our new product candidates, there are various circumstances that could prevent the successful commercialization of the products.
Our ability to successfully commercialize our products will depend on a number of factors, any of which could delay or prevent commercialization, including:
|
•
|
our product is determined to be ineffective or unsafe following approval and is removed from the market or we are required to perform additional research and development to further prove the safety and effectiveness of the product before re-entry into the market;
|
|
•
|
the regulatory approvals of our new products are delayed or we are required to conduct further research and development of our products prior to receiving regulatory approval;
|
|
•
|
we are unable to build a sales and marketing group to successfully launch and sell our new products;
|
|
•
|
we are required to allocate available funds to litigation matters;
|
|
•
|
we are unable to manufacture the quantity of product needed in accordance with current good manufacturing practices to meet market demand, or at all;
|
|
•
|
competition from other products or technologies prevents or reduces market acceptance of our products;
|
|
•
|
we do not have and cannot obtain the intellectual property rights needed to manufacture or market our products without infringing on another company’s patents; or
|
|
•
|
we are unsuccessful in defending against patent infringement or other intellectual property rights, claims that could be brought against us, our products or technologies;
|
The failure to successfully acquire or develop and commercialize new products will have a material and adverse effect on the future growth of our business, financial condition and results of operations.
9
APYX MEDICAL CORPORATION
Our international operations subject us to foreign currency fluctuations and other risks associated with operating in foreign countries
.
We operate internationally and enter into transactions denominated in foreign currencies. To date, we have not hedged our exposure to changes in foreign currency exchange rates and as a result, we are subject to foreign currency transaction and translation gains and losses. We purchase goods and services in U.S. dollars and Euros. Foreign exchange risk is managed primarily by satisfying foreign denominated expenditures with cash flows or assets denominated in the same currency therefore we are subject to some foreign currency fluctuation risk. Our currency value fluctuations were not material for
2018
. In addition, political changes or instability throughout the world could adversely affect our business internationally.
Changes in U.S. trade policies could significantly increase the cost of imported goods into the United States, which may materially reduce our sales or profitability.
The Trump administration and members of the U.S. Congress have made public statements indicating possible significant changes in U.S. trade policy and have taken certain actions that may impact U.S. trade, including imposing tariffs on certain goods imported into the United States. Any changes in U.S. trade policy could trigger retaliatory actions by affected countries, resulting in "trade wars," in increased costs for goods imported into the United States, which may reduce customer demand for these products if the parties having to pay those tariffs increase their prices, or in trading partners limiting their trade with the United States. If these consequences are realized, the volume of economic activity in the United States, may be materially reduced. Such a reduction may materially and adversely affect our sales volumes. Further, the realization of these matters may increase our cost of goods and, if those costs cannot be passed on to our customers, our business and profits may be materially and adversely affected.
Our operations may experience higher costs to produce our products as a result of changes in prices for oil, gasoline and other commodities.
We use plastics and other petroleum-based materials along with precious metals contained in electronic components as raw materials in many of our products. Prices of oil and gasoline also significantly affect our costs for freight and utilities. Oil, gasoline and precious metal prices are volatile and may increase, resulting in higher costs to produce and distribute our products. Due to the highly competitive nature of the healthcare industry and the cost-containment efforts of our customers we may be unable to pass along cost increases through higher prices. If we are unable to fully recover these costs through price increases or offset through other cost reductions, our results of operations could be materially and adversely affected.
Our manufacturing facilities are located in Clearwater, Florida and Sophia, Bulgaria and could be affected due to multiple weather risks, including risks to our Florida facility from hurricanes and similar phenomena.
Our manufacturing facilities are located in Clearwater, Florida and Sophia, Bulgaria and could be affected by multiple weather risks. Most notably hurricanes in Clearwater, Florida. Although we carry property and casualty insurance and business interruption insurance, future possible disruptions of operations or damage to property, plant and equipment due to hurricanes or other weather risks could result in impaired production and affect our ability to meet our commitments to our customers and impair important business relationships, the loss of which could adversely affect our operations and profitability. We do however maintain a backup generator at our Clearwater facility and a disaster recovery plan is in place to help mitigate this risk.
Risks Relating to Our Business
We manufacture the majority of our products at our Clearwater, Florida and Sofia, Bulgaria facilities. Components, Labor-intensive sub-assemblies, labor-intensive assemblies and sterilization services are out-sourced to third party manufacturers/services and produced to our specifications.
We are also dependent on OEM customers who have no legal obligation to purchase products from us. Should such customers fail to give us purchase orders for the product after development, our future business could be negatively affected. Furthermore, no assurance can be given that such customers will give sufficient high priority to our products. Finally, disagreements or disputes may arise between us and our customers, which could adversely affect production and sales of our products.
We rely on certain suppliers and manufacturers for raw materials and other products and are vulnerable to fluctuations in the availability and price of such products and services.
10
APYX MEDICAL CORPORATION
Fluctuations in the price, availability and quality of the raw materials we use in our manufacturing could have a negative effect on our cost of sales and our ability to meet the demands of our customers. Inability to meet the demands of our customers could result in the loss of future sales.
In addition, the costs to manufacture our products depend in part on the market prices of the raw materials used to produce them. We may not be able to pass along to our customers all or a portion of our higher costs of raw materials due to competitive and marketing pressures, which could decrease our earnings and profitability.
We also have collaborative arrangements with three key foreign suppliers under which we request the development of certain items and components and we purchase them pursuant to purchase orders. Our purchase order commitments are never more than one year in duration and are supported by our sales forecasts. The majority of our raw materials are purchased from sole-source suppliers. While we believe we could ultimately procure other sources for these components, should we experience any significant disruptions in this key supply chain, there are no assurances that we could do so in a timely manner which could render us unable to meet the demands of our customers, resulting in a material and adverse effect on our business and operating results.
If we are unable to protect our patents or other proprietary rights, or if we infringe on the patents or other proprietary rights of others, our competitiveness and business prospects may be materially damaged.
We have been issued
37
patents in the United States and
24
foreign patents. We have
14
pending patent applications in the United States and
8
pending foreign applications. Our intellectual property portfolio for our J-Plasma/Renuvion products continues to grow on an annual basis. We intend to continue to seek legal protection, primarily through patents, for our proprietary technology. Seeking patent protection is a lengthy and costly process and there can be no assurance that patents will be issued from any pending applications, or that any claims allowed from existing or pending patents will be sufficiently broad or strong to protect our proprietary technology. There is also no guarantee that any patents we hold will not be challenged, invalidated or circumvented, or that the patent rights granted will provide competitive advantages to us. Our competitors have developed and may continue to develop and obtain patents for technologies that are similar or superior to our technologies. In addition, the laws of foreign jurisdictions in which we develop, manufacture or sell our products may not protect our intellectual property rights to the same extent as do the laws of the United States.
Adverse outcomes in current or future legal disputes regarding patent and other intellectual property rights could result in the loss of our intellectual property rights, subject us to significant liabilities to third parties, require us to seek licenses from third parties on terms that may not be reasonable or favorable to us, prevent us from manufacturing, importing or selling our products, or compel us to redesign our products to avoid infringing third parties’ intellectual property. As a result, our product offerings may be delayed and we may be unable to meet customers’ requirements in a timely manner. Regardless of the merit of any related legal proceeding, we have incurred in the past and may be required to incur in the future substantial costs to prosecute, enforce or defend our intellectual property rights. Even in the absence of infringement by our products of third parties’ intellectual property rights, or litigation related to trade secrets, we have elected in the past and may in the future elect to enter into settlements to avoid the costs and risks of protracted litigation and the diversion of resources and management’s attention. However, if the terms of settlements entered into with certain of our competitors are not observed or enforced, we may suffer further costs and risks. Any of these circumstances could have a material adverse effect on our business, financial condition and resources or results of operations.
Our ability to develop intellectual property depends in large part on hiring, retaining and motivating highly qualified design and engineering staff with the knowledge and technical competence to advance our technology and productivity goals. To protect our trade secrets and proprietary information, generally we have entered into confidentiality agreements with our employees, as well as with consultants and other parties. If these agreements prove inadequate or are breached, our remedies may not be sufficient to cover our losses.
We have been and may in the future become subject to litigation proceedings that could materially and adversely affect our business.
The medical device industry is characterized by frequent claims and litigation, and we are and may become subject to various claims, lawsuits and proceedings in the ordinary course of our business, including claims by current or former employees, distributors and competitors, and with respect to our products and product liability claims, lawsuits and proceedings.
We are involved in a number of legal actions relating to the use of our J-Plasma technology. The outcomes of these legal actions are not within our complete control and may not be known for prolonged periods of time. In the opinion of management, the Company has meritorious defenses, and such claims are adequately covered by insurance, or are not expected, individually or in
11
APYX MEDICAL CORPORATION
the aggregate, to result in a material, adverse effect on our financial condition. However, in the event that damages exceed the aggregate coverage limits of our policy or if our insurance carriers disclaim coverage, we believe it is possible that costs associated with these claims could have a material adverse impact on our consolidated earnings, financial position or cash flows.
Intellectual Property Litigation or Trade Secrets
We have in the past, experienced certain allegations of infringement of intellectual property rights and use of trade secrets and may receive other such claims, with or without merit, in the future. Previously, claims of infringement of intellectual property rights have sometimes evolved into litigation against us and they may continue to do so in the future. It is inherently difficult to assess the outcome of litigation. Although we believe we have had adequate defenses to these claims and that the outcome of the litigation will not have a material adverse impact on our business, financial condition, or results of operations, there can be no assurances that we will prevail. Any such litigation could result in substantial cost to us, significantly reduce our cash resources and create a diversion of the efforts of our technical and management personnel, which could have a material and adverse effect on our business, financial condition and operating results. If we are unable to successfully defend against such claims, we could be prohibited from future sales of the allegedly infringing product or products, which could materially and adversely affect our future growth.
Our business is subject to the potential for defects or failures associated with our products which could lead to recalls or safety alerts and negative publicity.
Manufacturing flaws, component failures, design defects, off-label uses or inadequate disclosure of product-related information could result in an unsafe condition or the injury or death of a patient. These problems could lead to a recall of, or issuance of a safety alert relating to our products and result in significant costs and negative publicity. Due to the strong name recognition of our brands,
7
an adverse event involving one of our products could result in reduced market acceptance and demand for all products within that brand and could harm our reputation and our ability to market our products in the future. In some circumstances, adverse events arising from or associated with the design, manufacture or marketing of our products could result in the suspension or delay of our current regulatory reviews of our applications for new product approvals. We also may undertake voluntarily to recall products or temporarily shut down certain production lines based on internal safety and quality monitoring and testing data. Any of the foregoing problems could disrupt our business and have a material adverse effect on our business, results of operations, financial condition and cash flows.
We may, in the future, incur impairments to our long-lived assets.
We review long-lived assets for recoverability if events or changes in circumstances indicate that the assets may have been impaired. This circumstance exists when the carrying amount of the asset exceeds the sum of the undiscounted cash flows expected to result from its use and eventual disposition. In those cases an impairment loss is recognized to the extent that the assets’ carrying amount exceeds its fair value. Any impairment losses are not restored in the future if the fair value increases.
Our valuation methodology for assessing impairment requires management to make judgments and assumptions based on historical experience and to rely heavily on projections of future operating performance. We operate in highly competitive environments and projections of future operating results and cash flows may vary significantly from actual results. Additionally, if our analysis indicates potential impairment to a long-lived intangible asset, we may be required to record additional charges to earnings in our financial statements, which could negatively impact our results of operations.
We may, in the future, identify deficiencies in controls over financial reporting.
As disclosed in Part II, Item 9A, we have identified three material weaknesses. A material weakness is a deficiency, or a combination of deficiencies, in internal control over financial reporting, such that there is a reasonable possibility that a material misstatement of a company's annual or interim financial statements will not be prevented or detected on a timely basis.
While we are in the process of identifying and implementing remedial measures to address the control deficiencies that led to the material weakness, there can be no assurance that remediation will be fully completed in 2019 or that the remedial measures will prevent future control deficiencies or material weaknesses. If we are unable to remediate these material weaknesses, or we
12
APYX MEDICAL CORPORATION
identify additional material weaknesses in our internal control over financial reporting in the future, our ability to analyze, record and report financial information free of material misstatements, and to prepare our financial statements within the time periods specified by the rules and forms of the SEC will likely be adversely affected.
Risks Related to Our Stock
The market price of our stock has been and may continue to be highly volatile.
Our common stock is listed on The NASDAQ Stock Market LLC under the ticker symbol “APYX”. The market price of our stock has been and may continue to be highly volatile and announcements by us or by third parties may have a significant impact on our stock price. These announcements may include:
•
our listing status on the The NASDAQ Stock Market LLC;
•
our operating results falling below the expectations of public market analysts and investors;
•
developments in our relationships with or developments affecting our major customers;
•
negative regulatory action or regulatory non-approval with respect to our new products;
•
government regulation, governmental investigations, or audits related to us or to our products;
•
developments related to our patents or other proprietary rights or those of our competitors and
•
changes in the position of securities analysts with respect to our stock.
The stock market has from time to time experienced extreme price and volume fluctuations, which have particularly affected the market prices for the medical technology sector companies and which have often been unrelated to their operating performance. These broad market fluctuations may adversely affect the market price of our common stock.
In addition, future sales by our security holders may lower the price of our common stock, which could result in losses to our stockholders. Future sales of substantial amounts of common stock in the public market, or the possibility of such sales occurring, could adversely affect prevailing market prices for our common stock. Substantially all of our common stock is freely tradable in the public market without restriction under the Securities Act, unless these shares are held by our “affiliates”, as that term is defined in Rule 144 under the Securities Act.
We have no present intention to pay dividends on our common stock and, even if we change that policy, we may be unable to pay dividends on our common stock.
We currently do not anticipate paying any dividends on our common stock in the foreseeable future. We currently intend to retain future earnings, if any, to finance operations and invest in our business. Any declaration and payment of future dividends to holders of our common stock will be at the discretion of our board of directors and will depend on many factors, including our financial condition, earnings, capital requirements, level of indebtedness, statutory and contractual restrictions applying to the payment of dividends and other considerations that our board of directors deems relevant.
If we change that policy and commence paying dividends, we will not be obligated to continue paying those dividends and our stockholders will not be guaranteed, or have contractual or other rights, to receive dividends. If we commence paying dividends in the future, our board of directors may decide, in its discretion, at any time, to decrease the amount of dividends, otherwise modify or repeal the dividend policy or discontinue entirely the payment of dividends. Under the Delaware law, our board of directors may not authorize the payment of a dividend unless it is either paid out of our statutory surplus.
Historically the low trading volume of our common stock may adversely affect the price of our shares and their liquidity.
Although our common stock is listed on The NASDAQ Stock Market LLC, our common stock has from time to time experienced low trading volume. Limited trading volume may subject our common stock to greater price volatility and may make it difficult for investors to sell shares at a price that is attractive to them.
Exercise of options issued by us will dilute the ownership interest of existing stockholders.
13
APYX MEDICAL CORPORATION
As of December 31, 2018, our outstanding stock options to our employees, officers, directors and consultants amounted to 3,480,701 shares of our common stock, representing approximately 10.3% of our outstanding common stock.
The exercise of some or all of our stock options will dilute the ownership interests of existing stockholders. Any sales in the public market of the common stock issuable upon such conversion or exercise could adversely affect prevailing market prices of our common stock.
The market price of our stock has been and may continue to be highly volatile.
Our common stock is listed on The NASDAQ Stock Market LLC under the ticker symbol “APYX”. The market price of our stock has been and may continue to be highly volatile and announcements by us or by third parties may have a significant impact on our stock price. These announcements may include:
•
our listing status on The NASDAQ Stock Market LLC;
•
our operating results falling below the expectations of public market analysts and investors;
•
developments in our relationships with or developments affecting our major customers;
•
negative regulatory action or regulatory non-approval with respect to our new products;
•
government regulation, governmental investigations, or audits related to us or to our products;
•
developments related to our patents or other proprietary rights or those of our competitors and
•
changes in the position of securities analysts with respect to our stock.
The stock market has from time to time experienced extreme price and volume fluctuations, which have particularly affected the market prices for the medical technology sector companies and which have often been unrelated to their operating performance. These broad market fluctuations may adversely affect the market price of our common stock.
In addition, future sales by our security holders may lower the price of our common stock, which could result in losses to our stockholders. Future sales of substantial amounts of common stock in the public market, or the possibility of such sales occurring, could adversely affect prevailing market prices for our common stock. Substantially all of our common stock is freely tradable in the public market without restriction under the Securities Act, unless these shares are held by our “affiliates”, as that term is defined in Rule 144 under the Securities Act.
ITEM 1B. Unresolved Staff Comments
None
ITEM 2. Properties
Apyx currently maintains a 60,000 square foot facility which consists of office, warehousing, manufacturing and research space located at 5115 Ulmerton Rd., Clearwater, Florida.
In October, 2015, through our acquisition of Apyx Bulgaria, we acquired a lease for approximately 20,000 square feet of office, warehousing and manufacturing facilities located in Sofia, Bulgaria. The rental cost of the facility is approximately $6,000 per month.
ITEM 3. Legal Proceedings
The medical device industry is characterized by frequent claims and litigation, and we are and may become subject to various claims, lawsuits and proceedings in the ordinary course of our business, including claims by current or former employees, distributors and competitors, and with respect to our products and product liability claims, lawsuits and proceedings.
We are involved in a number of legal actions relating to the use of our J-Plasma technology. The outcomes of these legal actions are not within our complete control and may not be known for prolonged periods of time. In the opinion of management, the Company has meritorious defenses, and such claims are adequately covered by insurance, or are not expected, individually or in the aggregate, to result in a material, adverse effect on our financial condition. However, in the event that damages exceed the
14
APYX MEDICAL CORPORATION
aggregate coverage limits of our policy or if our insurance carriers disclaim coverage, we believe it is possible that costs associated with these claims could have a material adverse impact on our consolidated earnings, financial position or cash flows.
In accordance with authoritative guidance, we record a liability in our consolidated financial statements for these actions when a loss is known or considered probable and the amount can be reasonably estimated. If the reasonable estimate of a known or probable loss is a range, and no amount within the range is a better estimate than any other, the minimum amount of the range is accrued. If a loss is reasonably possible, but not known or probable, and can be reasonably estimated, the estimated loss or range of loss is disclosed in the notes to the consolidated financial statements. In most cases, significant judgment is required to estimate the amount and timing of a loss to be recorded.
ITEM 4. Mine Safety Disclosures
Not Applicable.
15
APYX MEDICAL CORPORATION
PART II
ITEM 5. Market for Registrant’s Common Equity, Related Stockholder Matters and Issuer Purchases of Equity Securities
Our common stock currently is traded on the NASDAQ Stock Market LLC. The table shows the reported high and low bid prices for the common stock during each quarter of the last eight respective quarters. These prices do not represent actual transactions and do not include retail markups, markdowns or commissions.
|
2018
|
2017
|
||||||||||||||
|
High
|
Low
|
High
|
Low
|
||||||||||||
|
4th Quarter
|
$
|
7.70
|
|
$
|
4.82
|
|
$
|
4.29
|
|
$
|
2.54
|
|
|||
|
3rd Quarter
|
7.62
|
|
4.26
|
|
3.48
|
|
2.17
|
|
|||||||
|
2nd Quarter
|
4.52
|
|
2.81
|
|
2.83
|
|
1.87
|
|
|||||||
|
1st Quarter
|
3.23
|
|
2.28
|
|
3.95
|
|
2.53
|
|
|||||||
On
March 11, 2019
, the closing bid for our common stock as reported by The NASDAQ Stock Market LLC was $7.24 per share. As of
March 11, 2019
, we had approximately 600 stockholders of record. Since many stockholders choose to hold their shares under the name of their brokerage firm, we estimate that the actual number of stockholders was over 3,500 shareholders.
Securities Authorized for Issuance Under Equity Compensation Plans
|
Number of Securities to be Issued Upon Exercise of Outstanding Options, Warrants and Rights
(a) |
Weighted Average Exercise Price of Outstanding Options, Warrants and Rights
(b) |
Number of Securities Remaining Available for Future Issuance Under Equity Compensation Plans (excluding securities reflected in column (a))
(c) |
|||||||
|
Equity compensation plans approved by security holders
|
2,129,674
|
|
$
|
2.86
|
|
2,179,000
|
|
||
|
Equity compensation plans not approved by security holders
(1)
|
1,351,027
|
|
$
|
3.48
|
|
—
|
|
||
|
Total
|
3,480,701
|
|
$
|
3.10
|
|
2,179,000
|
|
||
Dividend Policy
We have never declared or paid any cash dividends on our common stock and we currently do not anticipate paying cash dividends in the foreseeable future. We currently expect to retain any future earnings to fund the operation and expansion of our business.
16
APYX MEDICAL CORPORATION
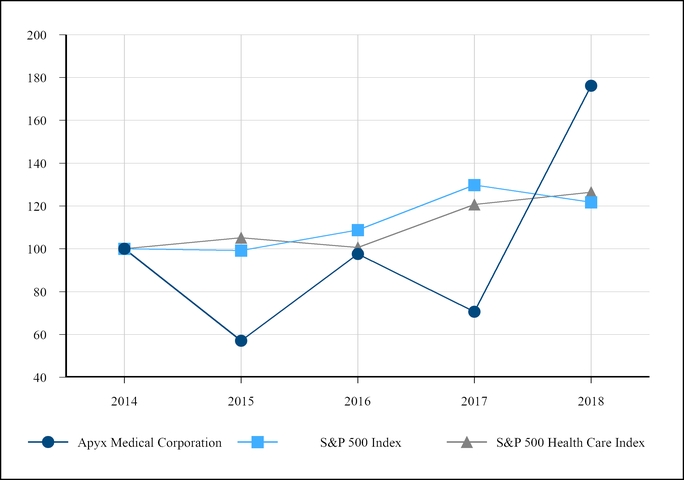
Five Year Performance Graph
The following line graph compares the cumulative total return of our common shares with the cumulative total return of the Standard & Poor’s Composite 500 Stock Index (the "S&P 500 Index") and the Standard & Poor's Composite 500 Healthcare Sector Index (the "S&P 500 Healthcare Index"). The line graph assumes, in each case, an initial investment of $100 on
December 31, 2014
, based on the market prices at the end of each fiscal year through and including
December 31, 2018
, and reinvestment of dividends.
|
December 31,
|
||||||||||||||
|
2014
|
2015
|
2016
|
2017
|
2018
|
||||||||||
|
Apyx Medical Corporation
|
100.00
|
|
57.07
|
|
97.56
|
|
70.66
|
|
176.11
|
|
||||
|
S&P 500 Index
|
100.00
|
|
99.27
|
|
108.74
|
|
129.86
|
|
121.76
|
|
||||
|
S&P 500 Health Care Index
|
100.00
|
|
105.21
|
|
100.62
|
|
120.75
|
|
126.41
|
|
||||
17
APYX MEDICAL CORPORATION
ITEM 6. Selected Financial Data
The following selected consolidated financial data (presented in thousands, except per share amounts and employee data) are derived from our consolidated financial statements. On August 30
th
, 2018, we closed on the sale of our Core business segment and discontinued those operations. All the information in this table has been restated to reflect this disposition. This data should be read in conjunction with the consolidated financial statements and notes thereto and with Item 7. Management’s Discussion and Analysis of Financial Condition and Results of Operations.
18
APYX MEDICAL CORPORATION
|
2018
|
2017
|
2016
|
|||||||||
|
Sales
|
$
|
16,686
|
|
$
|
10,234
|
|
$
|
8,819
|
|
||
|
Cost of sales
|
5,893
|
|
3,276
|
|
3,703
|
|
|||||
|
Gross profit
|
10,793
|
|
6,958
|
|
5,116
|
|
|||||
|
Other costs and expenses:
|
|||||||||||
|
Research and development
|
2,469
|
|
1,941
|
|
1,033
|
|
|||||
|
Professional services
|
3,072
|
|
1,769
|
|
1,473
|
|
|||||
|
Salaries and related costs
|
8,673
|
|
6,920
|
|
7,817
|
|
|||||
|
Selling, general and administrative
|
9,438
|
|
8,689
|
|
6,185
|
|
|||||
|
Severance and related expense
|
741
|
|
1,524
|
|
—
|
|
|||||
|
Total other costs and expenses
|
24,393
|
|
20,843
|
|
16,508
|
|
|||||
|
Loss from operations
|
(13,600
|
)
|
(13,885
|
)
|
(11,392
|
)
|
|||||
|
Interest income
|
616
|
|
—
|
|
—
|
|
|||||
|
Interest expense
|
(104
|
)
|
(136
|
)
|
(158
|
)
|
|||||
|
Other losses
|
(203
|
)
|
—
|
|
—
|
|
|||||
|
Change in fair value of derivative liabilities
|
20
|
|
183
|
|
64
|
|
|||||
|
Total other expense, net
|
329
|
|
47
|
|
(94
|
)
|
|||||
|
Loss from continuing operations before income taxes
|
(13,271
|
)
|
(13,838
|
)
|
(11,486
|
)
|
|||||
|
Income tax (benefit) expense
|
(3,777
|
)
|
(156
|
)
|
64
|
|
|||||
|
Net loss from continuing operations
|
(9,494
|
)
|
(13,682
|
)
|
(11,550
|
)
|
|||||
|
Income from discontinued operations, net of tax
|
5,099
|
|
8,620
|
|
7,600
|
|
|||||
|
Gain on sale of the Core Business, net of tax
|
68,404
|
|
—
|
|
—
|
|
|||||
|
Total income from discontinued operations, net of tax
|
73,503
|
|
$
|
8,620
|
|
$
|
7,600
|
|
|||
|
Net Income
|
$
|
64,009
|
|
$
|
(5,062
|
)
|
$
|
(3,950
|
)
|
||
|
|
|||||||||||
|
Loss per share from continuing operations
|
|
|
|
|
|
|
|||||
|
Basic and Diluted
|
$
|
(0.29
|
)
|
$
|
(0.44
|
)
|
$
|
(0.42
|
)
|
||
|
Income per share from discontinued operations
|
|||||||||||
|
Basic
|
2.21
|
|
0.27
|
|
0.28
|
|
|||||
|
Diluted
|
2.14
|
|
0.27
|
|
0.28
|
|
|||||
|
Income (loss) per share from all operations
|
|||||||||||
|
Basic
|
1.93
|
|
(0.16
|
)
|
(0.14
|
)
|
|||||
|
Diluted
|
1.86
|
|
(0.17
|
)
|
(0.15
|
)
|
|||||
|
Balance Sheet Information:
|
|||||||||||
|
Total Current Assets
|
$
|
89,517
|
|
$
|
22,547
|
|
$
|
26,539
|
|
||
|
Short term investments
|
61,678
|
|
—
|
|
—
|
|
|||||
|
Working Capital
|
81,815
|
|
16,574
|
|
21,267
|
|
|||||
|
Total assets
|
95,610
|
|
30,988
|
|
35,110
|
|
|||||
|
Long Term Liabilities
|
140
|
|
2,983
|
|
3,615
|
|
|||||
|
Total Stockholder's Equity
|
87,768
|
|
22,032
|
|
26,223
|
|
|||||
19
APYX MEDICAL CORPORATION
MANAGEMENT'S DISCUSSION AND ANAYLSIS OF
FINANCIAL CONDITION AND RESULTS OF OPERATIONS
ITEM 7
.
Management’s Discussion and Analysis of Financial Condition and Results of Operations
You should read the following discussion and analysis in conjunction with our financial statements and related notes contained elsewhere in this report. This discussion contains forward-looking statements that involve risks, uncertainties and assumptions. Our actual results may differ materially from those anticipated in these forward-looking statements as a result of a variety of factors discussed in this report and those discussed in other documents we file with the SEC. In light of these risks, uncertainties and assumptions, readers are cautioned not to place undue reliance on such forward-looking statements. These forward-looking statements represent beliefs and assumptions as of the date of this report. While we may elect to update forward-looking statements and at some point in the future, we specifically disclaim any obligation to do so, even if our estimates change. Past performance does not guarantee future results.
Executive Level Overview
We are a medical technology company and the developer of J-Plasma
®
(marketed and sold under the Renuvion™ Cosmetic Technology brand in the cosmetic surgery market), a patented plasma-based surgical product for cutting, coagulation and ablation of soft tissue. J-Plasma technology utilizes a helium ionization process to produce a stable, focused beam of plasma that provides surgeons with greater precision, and minimal invasiveness. We also leverage our expertise through original equipment manufacturing (OEM) agreements with other medical device manufacturers.
On August 30, 2018, we closed on a definitive asset purchase agreement ("the Asset Purchase Agreement") with Specialty Surgical Instrumentation Inc., a Tennessee Corporation and wholly-owned subsidiary of Symmetry Surgical Inc. (“Symmetry”), pursuant to which we divested and sold our electrosurgical "Core" business segment and related intellectual property, including the Bovie
®
brand and trademarks, to Symmetry
for gross proceeds of
$97 million
in cash. The divestiture and sale of our Core business segment to Symmetry allows us to further focus on our strategic objective of commercializing our J-Plasma technology, including the Renuvion
TM
brand in the cosmetic surgery market. We also entered into with Symmetry a transition services agreement, Patent Licensing Agreement, a Disposables Supply Agreement, and a Generator Manufacturing and Supply Agreement, the latter of which will establish us as an OEM-provider of generators to Symmetry for a period of at least 10 years.
The financial data presented in Management’s Discussion and Analysis reflect the disposition of the Core business segment.
In connection with the Asset Purchase Agreement, we entered into an Electro Surgical Disposables and Accessories, Cauteries and Other Products Supply Agreement with Symmetry for up to a four-year term, whereby we will manufacture certain Core products and sell them to Symmetry at agreed upon prices. Any revenue, costs and expenses resulting from this agreement are netted and reported in our Consolidated Statements of Operations as Other gains or losses.
In connection with the Asset Purchase Agreement, we entered into a Manufacture and Supply Agreement with Symmetry for a ten-year term, whereby we will manufacture certain products and sell them to Symmetry at agreed upon prices. Revenue, costs and expenses resulting from this agreement are reported in our Consolidated Statements as income or loss from operations of our OEM reporting segment.
During 2018, we continued our full scale commercialization efforts for Renuvion. As of December 31, 2018 we had a direct sales force of 27 field-based selling professionals and a network of 14 independent sales agencies. We also had 3 sales managers. This selling organization is focused on the use of Renuvion in the cosmetic surgery market. In addition, we have invested in training programs and marketing-related activities to support accelerated adoption of Renuvion.
International sales represented approximately 22.9% of total revenues in
2018
, 13.2% in
2017
and 3.9% in
2016
. Management estimates our products have been sold in more than 40 countries through local dealers coordinated by sales and marketing personnel at the Clearwater, Florida facility.
Operating segments are aggregated into reportable segments only if they exhibit similar economic characteristics. In addition to similar economic characteristics, we also consider the following factors in determining the reportable segments: the nature of business activities, the management structure directly accountable to our chief operating decision maker for operating and administrative activities, availability of discrete financial information and information presented to the Board of Directors and investors.
20
APYX MEDICAL CORPORATION
MANAGEMENT'S DISCUSSION AND ANAYLSIS OF
FINANCIAL CONDITION AND RESULTS OF OPERATIONS - Continued
Our reportable segments are disclosed as principally organized and managed as two operating segments: Advanced Energy and OEM. "Corporate & Other" includes certain unallocated corporate and administrative costs which are not specifically attributed to any reportable segment. Net assets are shared, therefore, not allocated to the reportable segments. The OEM segment is primarily development and manufacturing contract and product driven, all related expenses are recorded as cost of sales, therefore no segment specific operating expenses are incurred.
We strongly encourage investors to visit our website:
www.apyxmedical.com
to view the most current news and to review our filings with the Securities and Exchange Commission.
Results of Operations
Sales
|
Year Ended
December 31, |
Year Ended
December 31, |
||||||||||||||||||||
|
(In thousands)
|
2018
|
2017
|
Change
|
2017
|
2016
|
Change
|
|||||||||||||||
|
Sales by Reportable Segment
|
|||||||||||||||||||||
|
Advanced Energy
|
$
|
13,068
|
|
$
|
7,636
|
|
71.1
|
%
|
$
|
7,636
|
|
$
|
3,491
|
|
118.7
|
%
|
|||||
|
OEM
|
3,618
|
|
2,598
|
|
39.3
|
%
|
2,598
|
|
5,328
|
|
(51.2
|
)%
|
|||||||||
|
Total
|
$
|
16,686
|
|
$
|
10,234
|
|
63.0
|
%
|
$
|
10,234
|
|
$
|
8,819
|
|
16.0
|
%
|
|||||
|
Sales by Domestic and International
|
|||||||||||||||||||||
|
Domestic
|
$
|
12,858
|
|
$
|
8,887
|
|
44.7
|
%
|
$
|
8,887
|
|
$
|
8,475
|
|
4.9
|
%
|
|||||
|
International
|
3,828
|
|
1,347
|
|
184.2
|
%
|
1,347
|
|
344
|
|
291.6
|
%
|
|||||||||
|
Total
|
$
|
16,686
|
|
$
|
10,234
|
|
63.0
|
%
|
$
|
10,234
|
|
$
|
8,819
|
|
16.0
|
%
|
|||||
Overall sales from continuing operations
increased
by
63.0%
or approximately
$6.5 million
for the year ended
December 31, 2018
when compared with
2017
. Advanced Energy segment sales increased
71.1%
or approximately
$5.4 million
for the year ended
December 31, 2018
when compared with
2017
. The increase was primarily driven by a continued focus of our selling into the cosmetic surgery market and sales growth in international markets. The OEM product line consists of proprietary products designed specifically for third party equipment manufacturers; revenue for this product line increased
39.3%
or approximately
$1.0 million
when compared to
2017
.
Overall sales
increased
by
16.0%
or approximately
$1.4 million
for the year ended
December 31, 2017
when compared with
2016
. Increased sales were driven by an increase in the Advanced Energy segment of $4.1 million offset by lower OEM sales of $2.7 million.
Gross Profit
|
Year Ended
December 31, |
Year Ended
December 31, |
||||||||||||||||||||
|
(In thousands)
|
2018
|
2017
|
Change
|
2017
|
2016
|
Change
|
|||||||||||||||
|
Cost of sales
|
$
|
5,893
|
|
$
|
3,276
|
|
79.9
|
%
|
$
|
3,276
|
|
$
|
3,703
|
|
(11.5
|
)%
|
|||||
|
Percentage of sales
|
35.3
|
%
|
32.0
|
%
|
|
|
32.0
|
%
|
42.0
|
%
|
|
|
|||||||||
|
Gross profit
|
$
|
10,793
|
|
$
|
6,958
|
|
55.1
|
%
|
$
|
6,958
|
|
$
|
5,116
|
|
36.0
|
%
|
|||||
|
Percentage of sales
|
64.7
|
%
|
68.0
|
%
|
(3.3
|
)%
|
68.0
|
%
|
58.0
|
%
|
10.0
|
%
|
|||||||||
Our gross profit margin as a percentage of sales
decreased
by
3.3%
but increased by
$3.8 million
during the year ended
December 31, 2018
compared with
2017
. The decrease was driven by lower year over year margins in Advanced Energy from increased international sales offset by increased year over year margins in the OEM segment.
21
APYX MEDICAL CORPORATION
MANAGEMENT'S DISCUSSION AND ANAYLSIS OF
FINANCIAL CONDITION AND RESULTS OF OPERATIONS - Continued
In conjunction with the divestment of our Core business segment we performed a review of our standard costs, including the composition of our overhead cost pools. As a result, we reclassified certain overhead costs related to quality and regulatory to Salaries and Related Costs, in the amount of approximately $100,000 in the third quarter and approximately $400,000 for the last quarter of 2018. This change in estimate is necessary in order to better reflect the change in operations to our Advanced Energy segment.
Our gross profit margin as a percentage of sales
increased
by
10.0%
or approximately
$1.8 million
during the year ended
December 31, 2017
, compared with
2016
. The increase was driven by higher margins in Advanced Energy, partially offset by reduced sales and orders of lower margin product from OEM segment.
We do not anticipate any material impact to our gross profit, material costs, or other costs as a result of the effect of inflation or any material impact of changing prices on net sales.
Other Costs and Expenses
Research and development
|
Year Ended
December 31, |
Year Ended
December 31, |
||||||||||||||||||||
|
(In thousands)
|
2018
|
2017
|
Change
|
2017
|
2016
|
Change
|
|||||||||||||||
|
Research and Development expense
|
$
|
2,469
|
|
$
|
1,941
|
|
27.2
|
%
|
$
|
1,941
|
|
$
|
1,033
|
|
87.9
|
%
|
|||||
|
Percentage of sales
|
14.8
|
%
|
19.0
|
%
|
|
|
19.0
|
%
|
11.7
|
%
|
|
|
|||||||||
Our expenditures for R&D related activities
increased
by
27.2%
or approximately
$0.5 million
for the year ended
December 31, 2018
, compared with
2017
. This was mainly driven by continued spending on clinical studies and research projects related to the cosmetic surgery market.
Our expenditures for R&D related activities
increased
by
87.9%
or approximately
$0.9 million
for the year ended
December 31, 2017
, compared with
2016
. This was mainly driven by focused spending on clinical studies and research projects related to the cosmetic surgery market.
Professional services
|
Year Ended
December 31, |
Year Ended
December 31, |
||||||||||||||||||||
|
(In thousands)
|
2018
|
2017
|
Change
|
2017
|
2016
|
Change
|
|||||||||||||||
|
Professional services expense
|
$
|
3,072
|
|
$
|
1,769
|
|
73.7
|
%
|
$
|
1,769
|
|
$
|
1,473
|
|
20.1
|
%
|
|||||
|
Percentage of sales
|
18.4
|
%
|
17.3
|
%
|
|
|
17.3
|
%
|
16.7
|
%
|
|
|
|||||||||
Professional services expenses increased
73.7%
for the year ended
December 31, 2018
, compared with
2017
. The change was attributable to increases in legal and non-R&D consulting expenses related to the Advanced Energy segment.
Professional services costs increased
20.1%
for the year ended
December 31, 2017
, compared with
2016
.
Salaries and related costs
|
Year Ended
December 31, |
Year Ended
December 31, |
||||||||||||||||||||
|
(In thousands)
|
2018
|
2017
|
Change
|
2017
|
2016
|
Change
|
|||||||||||||||
|
Salaries and related expenses
|
$
|
8,673
|
|
$
|
6,920
|
|
25.3
|
%
|
$
|
6,920
|
|
$
|
7,817
|
|
(11.5
|
)%
|
|||||
|
Percentage of sales
|
52.0
|
%
|
67.6
|
%
|
|
|
67.6
|
%
|
88.6
|
%
|
|
|
|||||||||
During
2018
, salaries and related expenses
increased
approximately
25.3%
or approximately
$1.8 million
compared to the prior year. The increase was primarily attributable to increases in incentive compensation of $1.5 million.
22
APYX MEDICAL CORPORATION
MANAGEMENT'S DISCUSSION AND ANAYLSIS OF
FINANCIAL CONDITION AND RESULTS OF OPERATIONS - Continued
In conjunction with the divestment of our Core business segment we performed a review of our standard costs, including the composition of our overhead cost pools. As a result, we reclassified certain overhead costs related to quality and regulatory to Salaries and Related Costs, in the amount of approximately $100,000 in the third quarter and approximately $400,000 for the last quarter of 2018. This change in estimate is necessary in order to better reflect the change in operations to our Advanced Energy segment.
During
2017
, salaries and related expenses
decreased
approximately
11.5%
or approximately
$0.9 million
compared to the prior year. The decrease was attributable to reductions in $0.8 million of incentive compensation.
Selling, general and administrative expenses
|
Year Ended
December 31, |
Year Ended
December 31, |
||||||||||||||||||||
|
(In thousands)
|
2018
|
2017
|
Change
|
2017
|
2016
|
Change
|
|||||||||||||||
|
SG&A Expense
|
$
|
9,438
|
|
$
|
8,689
|
|
8.6
|
%
|
$
|
8,689
|
|
$
|
6,185
|
|
40.5
|
%
|
|||||
|
Percentage of sales
|
56.6
|
%
|
84.9
|
%
|
|
|
84.9
|
%
|
70.1
|
%
|
|
|
|||||||||
Selling, general and administrative expense
increased
by
8.6%
or approximately
$0.7 million
for the year ended
December 31, 2018
, compared with
2017
. The increase is primarily attributable to higher sales and marketing related expenses to support sales growth in the Advanced Energy segment.
Selling, general and administrative expense
increased
by
40.5%
or approximately
$2.5 million
for the year ended
December 31, 2017
, compared with
2016
. We experienced increases in sales commissions of $1.6 million and sales and marketing related expenses of $0.6 million.
Severance
Jay D. Ewers, the Chief Financial Officer, resigned from all of his positions with the Company effective December 31, 2018, although he continued as an employee through the first quarter of 2019. In connection with this departure, the Company and Mr. Ewers entered into a separation agreement, dated November 12, 2018. Severance costs incurred included salary, option expense and other benefits of approximately
$741,000
and will be operational cash outflows during 2019.
Jack McCarthy, the Chief Commercialization Officer, was terminated without cause from his position with the Company effective November 6, 2017. Severance costs incurred included salary, option expense and other benefits of approximately $582,000, of which approximately $397,000 was included in operational cash outflows during 2018.
Robert L. Gershon, the Chief Executive Officer and a director, resigned from all of his positions with the Company effective
December 15, 2017. In connection with this departure, the Company and Mr. Gershon entered into a separation agreement, dated December 15, 2017. Severance costs incurred included salary, option expense and other benefits of approximately $767,000, of which approximately $670,000 was included in operational cash outflows during 2018.
Other Income (Expense), net
|
Year Ended
December 31, |
Year Ended
December 31, |
||||||||||||||||||||
|
(In thousands)
|
2018
|
2017
|
Change
|
2017
|
2016
|
Change
|
|||||||||||||||
|
Interest income
|
$
|
616
|
|
$
|
—
|
|
—
|
%
|
$
|
—
|
|
$
|
—
|
|
—
|
%
|
|||||
|
Interest expense
|
(104
|
)
|
(136
|
)
|
(23.5
|
)%
|
(136
|
)
|
(158
|
)
|
(13.9
|
)%
|
|||||||||
|
Percentage of sales
|
3.1
|
%
|
(1.3
|
)%
|
|
|
(1.3
|
)%
|
(1.8
|
)%
|
|
|
|||||||||
23
APYX MEDICAL CORPORATION
MANAGEMENT'S DISCUSSION AND ANAYLSIS OF
FINANCIAL CONDITION AND RESULTS OF OPERATIONS - Continued
Interest income (expense)
Total net interest income was higher for the year ended
December 31, 2018
, as compared with
2017
. This increase is primarily related to short term investments in U.S. Treasury Securities which we purchased with the proceeds from the sale of the Core business.
Total interest expense was primarily flat for the year ended December 31, 2018, as compared with 2017, and for the year ended
December 31, 2017
, as compared with
2016
.
Income Taxes
Provision for income taxes was $13.56 million for the year ended December 31, 2018, an increase of $13.72 million comparing to the ($0.16) million tax benefit recorded for the year ended December 31, 2017. The combined federal, state, and foreign tax provision increased due to the increase in net income from the sale of the Core business. The increase in the tax provision is partially offset by the release of the valuation allowance which is mainly attributable to the net operating loss carryover for both federal and state as well as certain tax credits to be utilized as a result of the gain from discontinued operations.
Of the $13.56 million provision for income taxes recognized for the year ended December 31, 2018, $1.20 million is attributable to the income from discontinued operations, $16.14 million is attributable to the gain on the disposition of the Core business, and the remaining tax benefit of ($3.78) million is shown in the operating section of the income statement. $13.3 million was paid in taxes in 2018, primarily due to the sale of the Core business.
Liquidity and Capital Resources
On August 30, 2018,we sold our Core business segment
and other related assets for $97 million in cash. At December 31, 2018, we had approximately $78 million in Cash, Cash Equivalents and Short Term Investments, after making estimated Federal and State tax payments of $13.3 million. Our working capital at December 31, 2018 was approximately $81.8 million compared with $16.6 million at December 31, 2017.
For the year ended December 31, 2018, net cash used in operating activities is approximately $21.1 million compared with net cash used in operating activities of approximately $3.7 million in 2017. We incurred an expense of $16.1 million for taxes as a result of the sale of the Core business.
Net cash from investing activities is $29.3 million, primarily related to $91.1 million in net proceeds from the disposition of the Core business, offset by $87.2 million related to the purchase of marketable securities.
Cash used in financing activities of approximately $2.5 million was primarily due to repayment of the mortgage on our Clearwater, FL facility during the year ended December 31, 2018, compared to $0.2 million of cash used in financing activities during the year ended December 31, 2017.
At December 31, 2018, we had purchase commitments for inventories totaling approximately $3.0 million, substantially all of which is expected to be purchased by the end of 2019.
Critical Accounting Estimates
In preparing the consolidated financial statements in accordance with accounting principles generally accepted in the United States of America (U.S. GAAP), we have adopted various accounting policies. Our most significant accounting policies are disclosed in Note 2 to the consolidated financial statements.
24
APYX MEDICAL CORPORATION
MANAGEMENT'S DISCUSSION AND ANAYLSIS OF
FINANCIAL CONDITION AND RESULTS OF OPERATIONS - Continued
The preparation of the consolidated financial statements in conformity with U.S. GAAP requires us to make estimates and assumptions that affect the amounts reported in the consolidated financial statements and accompanying notes. Our estimates and assumptions, including those related to inventories, intangible assets, property, plant and equipment, legal proceedings, research and development, warranty obligations, product liability, fair valued liabilities, sales returns and discounts, stock based compensation and income taxes are updated as appropriate, which in most cases is at least quarterly. We base our estimates on historical experience, or various assumptions that are believed to be reasonable under the circumstances and the results form the basis for making judgments about the reported values of assets, liabilities, revenues and expenses. Actual results may materially differ from these estimates.
Estimates are considered to be critical if they meet both of the following criteria: (1) the estimate requires assumptions about material matters that are uncertain at the time the accounting estimates are made and (2) other materially different estimates could have been reasonably made or material changes in the estimates are reasonably likely to occur from period to period. Our critical accounting estimates include the following:
Inventory reserves
We maintain a reserve for excess and obsolete inventory resulting from the potential inability to sell our products at prices in excess of current carrying costs. The markets in which we operate are highly competitive, with new products and surgical procedures introduced on an ongoing basis. Such marketplace changes may cause our products to become obsolete. We make estimates regarding the future recoverability of the costs of these products and record a provision for excess and obsolete inventories based on historical experience and expected future trends. If actual product life cycles, product demand or acceptance of new product introductions are less favorable than projected by management, additional inventory write-downs may be required, which would unfavorably affect future operating results.
Long-lived assets
We review long-lived assets which are held and used, including property and equipment and intangible assets, for impairment whenever changes in circumstances indicate that the carrying amount of the assets may not be recoverable. Such evaluations compare the carrying amount of an asset to future undiscounted net cash flows expected to be generated by the asset over its expected useful life and are significantly impacted by estimates of future prices and volumes for our products, capital needs, economic trends and other factors that are inherently difficult to forecast. If the asset is considered to be impaired, we record an impairment charge equal to the amount by which the carrying value of the asset exceeds its fair value determined by either a quoted market price, if any, or a value determined by utilizing an undiscounted cash flow technique.
Derivative liabilities valued at fair value
We generally do not use derivative financial instruments to hedge exposures to cash-flow risks or market-risks. However, certain financial instruments, such as warrants, which are indexed to our common stock, are classified as liabilities when either (a) the holder possesses rights to net-cash settlement or (b) physical or net-share settlement is not within our control. In such instances, net-cash settlement is assumed for financial accounting and reporting purposes, even when the terms of the underlying contracts do not provide for net-cash settlement. Such financial instruments are initially recorded and continuously carried, at fair value.
Determining the fair value of these instruments involves judgment and the use of certain relevant assumptions including, but not limited to, interest rate risk, historical volatility and stock price, estimated life of the derivative, anti-dilution provisions and conversion/redemption privileges. The use of different assumptions or changes in those assumptions could have a material effect on the estimated fair value amounts.
Stock-based Compensation
Under our stock option plan, options to purchase common shares of the Company may be granted to key employees, officers and directors of the Company by the Board of Directors. The Company accounts for stock options in accordance with FASB ASC Topic 718-10,
Compensation-Stock Compensation
, with compensation expense amortized over the vesting period based on the trinomial lattice option-pricing model fair value on the grant date, which includes a number of estimates that affect the amount of our expense.
25
APYX MEDICAL CORPORATION
MANAGEMENT'S DISCUSSION AND ANAYLSIS OF
FINANCIAL CONDITION AND RESULTS OF OPERATIONS - Continued
Litigation Contingencies
In accordance with authoritative guidance, we record a liability in our consolidated financial statements for these actions when a loss is known or considered probable and the amount can be reasonably estimated. If the reasonable estimate of a known or probable loss is a range, and no amount within the range is a better estimate than any other, the minimum amount of the range is accrued. If a loss is reasonably possible, but not known or probable, and can be reasonably estimated, the estimated loss or range of loss is disclosed in the notes to the consolidated financial statements. In most cases, significant judgment is required to estimate the amount and timing of a loss to be recorded.
Income Taxes
The Company utilizes the liability method of accounting for income taxes as set forth in FASB ASC 740. Under the liability method, deferred taxes are determined based on temporary differences between the financial statement and tax bases of assets and liabilities using tax rates expected to be in effect during the years in which the basis difference. A valuation allowances is recorded when it is more likely than not that a tax benefit will not be realized. In determining the need for valuation allowances the Company considers projected future taxable income and the availability of tax planning strategies. As of December 31, 2017, the Company recorded a valuation allowance on the net deferred tax asset with definite lives.
For the period ended December 31, 2018, management expects that the gain from the sale of the Core business segment to Symmetry will utilize substantially all of the historical Federal net operating loss carryover of $23.8 million, state(s) net operating loss carryover of $19.1 million, and research and development credit carryover of $1.3 million. As a result, the valuation allowance on these deferred tax assets as well as other deferred tax assets was released during the year ended December 31, 2018, and the Company recorded a tax benefit of $7.3 million from the release of the valuation allowance from all operations.
As a result of historical losses, exclusive of discontinued operations, the Company recorded a valuation allowance on the net deferred tax asset and does not anticipate recording an income tax benefit related to these deferred tax assets beyond the 2018 tax year. The Company will reassess the realization of deferred tax assets each reporting period and will be able to reduce the valuation allowance to the extent the financial results of continuing operations improve and it becomes more likely than not that the deferred tax assets will be realizable. As management expects the Company to continue to generate loss in the foreseeable future after 2018, the Company will continue to record a valuation allowance on the remaining deferred tax assets balance as of December 31, 2018.
We assess the financial statement impact of an uncertain tax position taken or expected to be taken on an income tax return at the largest amount that is more-likely-than-not to be sustained upon audit by the relevant taxing authority. An uncertain income tax position will not be recognized in the financial statements unless it is more likely than not of being sustained. As of December 31, 2018, we have reserved $1.3 million of potential tax benefits.
Inflation
Inflation has not materially impacted the operations of our Company.
Off-Balance Sheet Arrangements
We have $3 million of purchase commitments that are considered off-balance sheet arrangements.
Recent Accounting Pronouncements
See Note 8 of the Notes to Consolidated Financial Statements.
ITEM 7A
.
Quantitative and Qualitative Disclosures about Market Risk
Our short-term investments consist of cash, cash equivalents and short term investments, principally US Treasury Bills. As such, we do not believe we are exposed to significant interest rate risk. The primary objective of our investment activities is to preserve principal while at the same time maximizing yields without significantly increasing risk. To achieve this objective, we invest in short term US Treasury Bills. If a 10% change in interest rates were to have occurred on
December 31, 2018
, this change would not have had a material effect on the fair value of our investment portfolio as of that date.
26
APYX MEDICAL CORPORATION
ITEM 8. Financial Statements and Supplementary Data
INDEX TO FINANCIAL INFORMATION
|
Page
|
|
27
REPORT OF INDEPENDENT REGISTERED PUBLIC ACCOUNTING FIRM
To the Board of Directors and Stockholders of
Apyx Medical Corporation
Opinion on the Consolidated Financial Statements
We have audited the accompanying consolidated balance sheets of Apyx Medical Corporation (formerly Bovie Medical Corporation) and subsidiaries (the "Company") as of December 31, 2018 and 2017, and the related consolidated statements of operations, changes in stockholders' equity and cash flows for each of the three years in the period ended December 31, 2018, and the related notes (collectively referred to as the consolidated financial statements). In our opinion, the consolidated financial statements present fairly, in all material respects, the financial position of the Company as of December 31, 2018 and 2017, and the results of their operations and cash flows for each of the three years in the period ended December 31, 2018, in conformity with accounting principles generally accepted in the United States of America.
We have also audited, in accordance with the standards of the Public Company Accounting Oversight Board (United States) (PCAOB), the Company's internal control over financial reporting as of December 31, 2018, based on criteria established in Internal Control - Integrated Framework (2013) issued by the Committee of Sponsoring Organizations of the Treadway Commission and our report dated March 13, 2019, expressed an adverse opinion on the Company's internal control over financial reporting.
Basis for Opinion
These consolidated financial statements are the responsibility of the Company's management. Our responsibility is to express an opinion on the Company’s consolidated financial statements based on our audits. We are a public accounting firm registered with the Public Company Accounting Oversight Board (United States) (“PCAOB”) and are required to be independent with respect to the Company in accordance with the U.S. federal securities laws and the applicable rules and regulations of the Securities and Exchange Commission and the PCAOB.
We conducted our audits in accordance with the standards of the PCAOB. Those standards require that we plan and perform the audit to obtain reasonable assurance about whether the consolidated financial statements are free of material misstatement, whether due to error or fraud, and performing procedures that respond to those risks. Such procedures included examining, on a test basis, evidence regarding the amounts and disclosures in the consolidated financial statements. Our audits also included evaluating the accounting principles used and significant estimates made by management, as well as evaluating the overall presentation of the consolidated financial statements. We believe that our audits provide a reasonable basis for our opinion.
/s/ Frazier & Deeter, LLC
Tampa, Florida
March 13, 2019
We have served as the Company’s auditor since 2007.
28
REPORT OF INDEPENDENT REGISTERED PUBLIC ACCOUNTING FIRM
To the Stockholders and Board of Directors of
Apyx Medical Corporation
Opinion on Internal Control over Financial Reporting
We have audited the internal control over financial reporting of Apyx Medical Corporation’s (formerly Bovie Medical Corporation) and subsidiaries (the “Company”) as of December 31, 2018, based on criteria established in
Internal Control-Integrated Framework (2013) issued by the Committee of Sponsoring Organizations of the Treadway Commission ( “COSO”). In our opinion, because of the effect of the material weaknesses identified below on the achievement of the objectives of the control criteria, the Company has not maintained effective internal control over financial reporting as of December 31, 2018, based on criteria established in Internal Control-Integrated Framework (2013) issued by COSO.
We also have audited, in accordance with the standards of the Public Company Accounting Oversight Board (United States) (the “PCAOB”), the consolidated balance sheets as of December 31, 2018 and 2017, and the related consolidated statements of operations, changes in stockholders’ equity and cash flows for each of the three years in the period ended December 31, 2018, and the related notes (collectively referred to as the consolidated financial statements) of the Company and our report dated March 13, 2019 expressed an unqualified opinion on those consolidated financial statements.
Basis for Opinion
The Company’s management is responsible for maintaining effective internal control over financial reporting and for its assessment of the effectiveness of internal control over financial reporting included in the accompanying Management’s Annual Report on Internal Control over Financial Reporting. Our responsibility is to express an opinion on the Company’s internal control over financial reporting based on our audit. We are a public accounting firm registered with the PCAOB and are required to be independent with respect to the Company in accordance with the U.S. federal securities laws and the applicable rules and regulations of the Securities and Exchange Commission and the PCAOB.
We conducted our audit in accordance with the standards of the PCAOB. Those standards require that we plan and perform the audit to obtain reasonable assurance about whether effective internal control over financial reporting was maintained in all material respects. Our audit included obtaining an understanding of internal control over financial reporting, assessing the risk that a material weakness exists, testing and evaluating the design and operating effectiveness of internal control based on the assessed risk, and performing such other procedures as we considered necessary in the circumstances. We believe that our audit provides a reasonable basis for our opinion.
Definition and Limitations of Internal Control over Financial Reporting
A company’s internal control over financial reporting is a process designed to provide reasonable assurance regarding the reliability of financial reporting and the preparation of financial statements for external purposes in accordance with U.S. generally accepted accounting principles. A company’s internal control over financial reporting includes those policies and procedures that: (1) pertain to the maintenance of records that, in reasonable detail, accurately and fairly reflect the transactions and dispositions of the assets of the Company; (2) provide reasonable assurance that transactions are recorded as necessary to permit preparation of financial statements in accordance with U.S. generally accepted accounting principles, and that receipts and expenditures of the Company are being made only in accordance with authorizations of management and directors of the Company; and (3) provide reasonable assurance regarding prevention or timely detection of unauthorized acquisition, use, or disposition of the Company’s assets that could have a material effect on the financial statements.
Because of its inherent limitations, internal control over financial reporting may not prevent or detect misstatements. Also, projections of any evaluation of effectiveness to future periods are subject to the risk that controls may become inadequate because of changes in conditions, or that the degree of compliance with the policies or procedures may deteriorate.
29
Material Weaknesses
A material weakness is a deficiency, or a combination of deficiencies, in internal control over financial reporting, such that there is a reasonable possibility that a material misstatement of the Company’s annual or interim financial statements will not be prevented or detected on a timely basis. The following material weaknesses have been identified and included in management’s assessment: (i) an ineffective control environment due to a lack of sufficient qualified accounting personnel with an appropriate level of knowledge and experience with generally accepted accounting principles, (ii) ineffective control activities due to the lack of documentation and timeliness in executing business process controls, and (iii) ineffective monitoring controls to ascertain whether the components of internal control were present and functioning. These material weaknesses were considered in determining the nature, timing, and extent of audit tests applied in our audit of the consolidated financial statements as of and for the year ended December 31, 2018, of the Company, and this report does not affect our report on such financial statements.
/s/ Frazier & Deeter, LLC
Tampa, Florida
March 13, 2019
30
(In thousands, except share and per share data)
|
December 31,
2018 |
December 31,
2017 |
||||||
|
ASSETS
|
|||||||
|
Current assets:
|
|||||||
|
Cash and cash equivalents
|
$
|
16,466
|
|
$
|
9,949
|
|
|
|
Restricted cash
|
—
|
|
719
|
|
|||
|
Short term investments
|
61,678
|
|
—
|
|
|||
|
Trade accounts receivable, net of allowance of $428 and $204
|
5,015
|
|
4,857
|
|
|||
|
Inventories, net of provision for obsolescence of $439 and $1,913
|
5,212
|
|
4,274
|
|
|||
|
Prepaid expenses and other current assets
|
1,146
|
|
433
|
|
|||
|
Current assets of discontinued operations
|
—
|
|
2,315
|
|
|||
|
Total current assets
|
89,517
|
|
22,547
|
|
|||
|
Property and equipment, net
|
5,788
|
|
6,033
|
|
|||
|
Purchased technology and license rights, net
|
6
|
|
67
|
|
|||
|
Goodwill
|
185
|
|
185
|
|
|||
|
Deposits
|
73
|
|
92
|
|
|||
|
Other assets
|
41
|
|
67
|
|
|||
|
Non-current assets of discontinued operations
|
—
|
|
1,997
|
|
|||
|
Total assets
|
$
|
95,610
|
|
$
|
30,988
|
|
|
|
LIABILITIES AND STOCKHOLDERS’ EQUITY
|
|||||||
|
Current liabilities:
|
|||||||
|
Accounts payable
|
$
|
1,423
|
|
$
|
1,583
|
|
|
|
Accrued severance and related
|
727
|
|
1,242
|
|
|||
|
Accrued payroll
|
418
|
|
447
|
|
|||
|
Current portion of mortgage note payable
|
—
|
|
239
|
|
|||
|
Accrued taxes and other liabilities
|
—
|
|
214
|
|
|||
|
Accrued bonus
|
972
|
|
80
|
|
|||
|
Accrued expenses
|
2,505
|
|
861
|
|
|||
|
Accrued warranty expense
|
348
|
|
186
|
|
|||
|
Other liabilities
|
1,309
|
|
100
|
|
|||
|
Current liabilities of discontinued operations
|
—
|
|
1,021
|
|
|||
|
Total current liabilities
|
7,702
|
|
5,973
|
|
|||
|
Mortgage note payable, net of current portion
|
—
|
|
2,455
|
|
|||
|
Note payable
|
140
|
|
140
|
|
|||
|
Deferred tax liability
|
—
|
|
368
|
|
|||
|
Derivative liabilities
|
—
|
|
20
|
|
|||
|
Total liabilities
|
$
|
7,842
|
|
$
|
8,956
|
|
|
|
Common stock, $0.001 par value; 75,000,000 shares authorized; 33,847,100 issued and 33,704,525 outstanding as of December 31, 2018 and 75,000,000 shares authorized; 33,021,170 issued and 32,878,091 outstanding as of December 31, 2017, respectively
|
34
|
|
33
|
|
|||
|
Additional paid-in capital
|
52,221
|
|
50,495
|
|
|||
|
Retained Earnings (accumulated deficit)
|
35,513
|
|
(28,496
|
)
|
|||
|
Total stockholders’ equity
|
87,768
|
|
22,032
|
|
|||
|
Total liabilities and stockholders’ equity
|
$
|
95,610
|
|
$
|
30,988
|
|
|
The accompanying notes are an integral part of the consolidated financial statements.
31
(In thousands, except per share data)
|
Year Ended December 31,
|
|||||||||||
|
2018
|
2017
|
2016
|
|||||||||
|
Sales
|
$
|
16,686
|
|
$
|
10,234
|
|
$
|
8,819
|
|
||
|
Cost of sales
|
5,893
|
|
3,276
|
|
3,703
|
|
|||||
|
Gross profit
|
10,793
|
|
6,958
|
|
5,116
|
|
|||||
|
Other costs and expenses:
|
|||||||||||
|
Research and development
|
2,469
|
|
1,941
|
|
1,033
|
|
|||||
|
Professional services
|
3,072
|
|
1,769
|
|
1,473
|
|
|||||
|
Salaries and related costs
|
8,673
|
|
6,920
|
|
7,817
|
|
|||||
|
Selling, general and administrative
|
9,438
|
|
8,689
|
|
6,185
|
|
|||||
|
Severance and related expense
|
741
|
|
1,524
|
|
—
|
|
|||||
|
Total other costs and expenses
|
24,393
|
|
20,843
|
|
16,508
|
|
|||||
|
Loss from operations
|
(13,600
|
)
|
(13,885
|
)
|
(11,392
|
)
|
|||||
|
Interest income
|
616
|
|
—
|
|
—
|
|
|||||
|
Interest expense
|
(104
|
)
|
(136
|
)
|
(158
|
)
|
|||||
|
Other losses
|
(203
|
)
|
—
|
|
—
|
|
|||||
|
Change in fair value of derivative liabilities
|
20
|
|
183
|
|
64
|
|
|||||
|
Total other income (expense), net
|
329
|
|
47
|
|
(94
|
)
|
|||||
|
Loss from continuing operations before income taxes
|
(13,271
|
)
|
(13,838
|
)
|
(11,486
|
)
|
|||||
|
Income tax (benefit) expense
|
(3,777
|
)
|
(156
|
)
|
64
|
|
|||||
|
Net loss from continuing operations
|
(9,494
|
)
|
(13,682
|
)
|
(11,550
|
)
|
|||||
|
Income from discontinued operations, net of tax
|
5,099
|
|
8,620
|
|
7,600
|
|
|||||
|
Gain on sale of the Core Business, net of tax
|
68,404
|
|
—
|
|
—
|
|
|||||
|
Total income from discontinued operations, net of tax
|
73,503
|
|
8,620
|
|
7,600
|
|
|||||
|
Net income (loss)
|
$
|
64,009
|
|
$
|
(5,062
|
)
|
$
|
(3,950
|
)
|
||
|
|
|||||||||||
|
Loss per share from continuing operations
|
|||||||||||
|
Basic and Diluted
|
$
|
(0.29
|
)
|
$
|
(0.44
|
)
|
$
|
(0.42
|
)
|
||
|
Income per share from discontinued operations
|
|||||||||||
|
Basic
|
2.21
|
|
0.27
|
|
0.28
|
|
|||||
|
Diluted
|
2.14
|
|
0.27
|
|
0.28
|
|
|||||
|
Income per share from discontinued operations
|
|||||||||||
|
Income (loss) per share all operations
|
|||||||||||
|
Diluted
|
1.93
|
|
(0.16
|
)
|
(0.14
|
)
|
|||||
|
Basic and Diluted
|
1.86
|
|
(0.17
|
)
|
(0.15
|
)
|
|||||
|
Weighted average number of shares outstanding basic
|
33,185
|
|
31,420
|
|
27,433
|
|
|||||
|
Weighted average number of shares outstanding dilutive
|
34,366
|
|
31,427
|
|
27,449
|
|
|||||
The accompanying notes are an integral part of the consolidated financial statements.
32
APYX MEDICAL CORPORATION
CONSOLIDATED STATEMENTS OF CHANGES IN STOCKHOLDERS’ EQUITY
(In thousands, except share amounts)
|
Preferred Stock
|
Common Stock
|
||||||||||||||||||||||||
|
Shares
|
Par Value
|
Shares
|
Par Value
|
Additional Paid-In Capital
|
Retained Earnings (Accumulated Deficit)
|
Total
|
|||||||||||||||||||
|
Balance
December 31, 2015 |
1,976
|
|
$
|
2
|
|
27,052
|
|
$
|
27
|
|
$
|
42,859
|
|
$
|
(19,484
|
)
|
$
|
23,404
|
|
||||||
|
Options exercised
|
—
|
|
—
|
|
36
|
|
—
|
|
130
|
|
—
|
|
130
|
|
|||||||||||
|
Warrants exercised
|
—
|
|
—
|
|
293
|
|
—
|
|
698
|
|
—
|
|
698
|
|
|||||||||||
|
Issuance of common stock
|
—
|
|
—
|
|
1,625
|
|
2
|
|
5,828
|
|
—
|
|
5,830
|
|
|||||||||||
|
Conversion of Series B convertible preferred to common stock
|
(1,000
|
)
|
(1
|
)
|
2,000
|
|
2
|
|
(1
|
)
|
—
|
|
—
|
|
|||||||||||
|
Stock based compensation
|
—
|
|
—
|
|
—
|
|
—
|
|
809
|
|
—
|
|
809
|
|
|||||||||||
|
Stock swap to acquire options and warrants
|
—
|
|
—
|
|
(146
|
)
|
—
|
|
(698
|
)
|
—
|
|
(698
|
)
|
|||||||||||
|
Net loss
|
—
|
|
—
|
|
—
|
|
—
|
|
—
|
|
(3,950
|
)
|
(3,950
|
)
|
|||||||||||
|
Balance
December 31, 2016 |
976
|
|
$
|
1
|
|
30,860
|
|
$
|
31
|
|
$
|
49,625
|
|
$
|
(23,434
|
)
|
$
|
26,223
|
|
||||||
|
Options exercised
|
—
|
|
—
|
|
177
|
|
—
|
|
427
|
|
—
|
|
427
|
|
|||||||||||
|
Warrants exercised
|
—
|
|
—
|
|
54
|
|
—
|
|
130
|
|
—
|
|
130
|
|
|||||||||||
|
Conversion of Series B convertible preferred to common stock
|
(976
|
)
|
(1
|
)
|
1,951
|
|
2
|
|
(1
|
)
|
—
|
|
—
|
|
|||||||||||
|
Stock based compensation
|
—
|
|
—
|
|
—
|
|
—
|
|
871
|
|
—
|
|
871
|
|
|||||||||||
|
Stock exercise to acquire options and warrants
|
—
|
|
—
|
|
(164
|
)
|
—
|
|
(557
|
)
|
—
|
|
(557
|
)
|
|||||||||||
|
Net loss
|
—
|
|
—
|
|
—
|
|
—
|
|
—
|
|
(5,062
|
)
|
(5,062
|
)
|
|||||||||||
|
Balance
December 31, 2017 |
—
|
|
$
|
—
|
|
32,878
|
|
$
|
33
|
|
$
|
50,495
|
|
$
|
(28,496
|
)
|
$
|
22,032
|
|
||||||
|
Options exercised
|
—
|
|
—
|
|
1,379
|
|
1
|
|
3,343
|
|
—
|
|
3,344
|
|
|||||||||||
|
Warrants exercised
|
—
|
|
—
|
|
40
|
|
—
|
|
95
|
|
—
|
|
95
|
|
|||||||||||
|
Stock based compensation
|
—
|
|
—
|
|
—
|
|
—
|
|
1,525
|
|
—
|
|
1,525
|
|
|||||||||||
|
Stock exercise to acquire options and warrants
|
—
|
|
—
|
|
(592
|
)
|
—
|
|
(3,237
|
)
|
—
|
|
(3,237
|
)
|
|||||||||||
|
Net Income
|
64,009
|
|
64,009
|
|
|||||||||||||||||||||
|
Balance
December 31, 2018 |
—
|
|
$
|
—
|
|
33,705
|
|
$
|
34
|
|
$
|
52,221
|
|
$
|
35,513
|
|
$
|
87,768
|
|
||||||
The accompanying notes are an integral part of the consolidated financial statements.
33
(In thousands)
|
Year Ended December 31,
|
|||||||||||
|
2018
|
2017
|
2016
|
|||||||||
|
Cash flows from operating activities
|
|||||||||||
|
Net income (loss)
|
$
|
64,009
|
|
$
|
(5,062
|
)
|
$
|
(3,950
|
)
|
||
|
Adjustments to reconcile net income (loss) to net cash used in operating activities:
|
|||||||||||
|
Gain on sale of the Core Business, net of tax
|
(68,404
|
)
|
—
|
|
—
|
|
|||||
|
Depreciation and amortization
|
669
|
|
696
|
|
734
|
|
|||||
|
Gain on disposal of property and equipment, net
|
—
|
|
5
|
|
21
|
|
|||||
|
Stock based compensation
|
1,525
|
|
871
|
|
809
|
|
|||||
|
Change in fair value of derivative liabilities
|
(20
|
)
|
(183
|
)
|
(64
|
)
|
|||||
|
Unrealized gain on short term investments
|
(247
|
)
|
—
|
|
—
|
|
|||||
|
Provision for allowance for doubtful accounts
|
224
|
|
179
|
|
84
|
|
|||||
|
Provision for (benefit from) deferred taxes
|
(368
|
)
|
(196
|
)
|
25
|
|
|||||
|
Changes in current assets and liabilities, net of effect of disposition:
|
|||||||||||
|
Trade receivables
|
(382
|
)
|
(303
|
)
|
(1,894
|
)
|
|||||
|
Prepaid expenses
|
(707
|
)
|
(83
|
)
|
103
|
|
|||||
|
Inventories
|
(881
|
)
|
(368
|
)
|
(201
|
)
|
|||||
|
Deposits and other assets
|
45
|
|
53
|
|
341
|
|
|||||
|
Accounts payable
|
(224
|
)
|
(23
|
)
|
392
|
|
|||||
|
Accrued severance and related
|
(307
|
)
|
1,242
|
|
—
|
|
|||||
|
Accrued and other liabilities
|
(15,943
|
)
|
(532
|
)
|
763
|
|
|||||
|
Net cash used in operating activities
|
(21,011
|
)
|
(3,704
|
)
|
(2,837
|
)
|
|||||
|
Cash flows (used in) from investing activities
|
|||||||||||
|
Purchases of property and equipment
|
(363
|
)
|
(624
|
)
|
(286
|
)
|
|||||
|
Proceeds from the disposition of Core business
|
91,095
|
|
—
|
|
—
|
|
|||||
|
Purchases of marketable securities
|
(87,189
|
)
|
—
|
|
—
|
|
|||||
|
Proceeds from marketable securities
|
25,758
|
|
—
|
|
—
|
|
|||||
|
Net cash (used in) provided by investing activities
|
29,301
|
|
(624
|
)
|
(286
|
)
|
|||||
|
Cash flows from financing activities
|
|||||||||||
|
Proceeds from stock options/warrants exercised
|
202
|
|
—
|
|
124
|
|
|||||
|
Repayment of mortgage note payable
|
(2,694
|
)
|
(239
|
)
|
(240
|
)
|
|||||
|
Proceeds from issuance of common shares, net
|
—
|
|
—
|
|
5,830
|
|
|||||
|
Net cash (used in) provided by financing activities
|
(2,492
|
)
|
(239
|
)
|
5,714
|
|
|||||
|
Net change in cash, cash equivalents and restricted cash
|
5,798
|
|
(4,567
|
)
|
2,591
|
|
|||||
|
Cash, cash equivalents and restricted cash, beginning of period
|
10,668
|
|
15,235
|
|
12,644
|
|
|||||
|
Cash, cash equivalents and restricted cash, end of period
|
$
|
16,466
|
|
$
|
10,668
|
|
$
|
15,235
|
|
||
|
Cash paid for:
|
|||||||||||
|
Interest
|
$
|
104
|
|
$
|
136
|
|
$
|
158
|
|
||
|
Income taxes
|
13,283
|
|
32
|
|
27
|
|
|||||
|
Non cash investing activities:
|
|||||||||||
|
Cashless exercise of stock options/warrants
|
$
|
3,237
|
|
$
|
557
|
|
$
|
698
|
|
||
The accompanying notes are an integral part of the consolidated financial statements.
34
NOTE 1. DESCRIPTION OF BUSINESS
Apyx Medical Corporation (“Apyx”), formerly known as Bovie Medical Corporation, was incorporated in 1982, under the laws of the State of Delaware.
We are a medical technology company and the developer of J-Plasma
®
(marketed and sold under the Renuvion™ Cosmetic Technology brand in the cosmetic surgery market), a patented plasma-based surgical product for cutting, coagulation and ablation of soft tissue. J-Plasma technology utilizes a helium ionization process to produce a stable, focused beam of plasma that provides surgeons with greater precision, and minimal invasiveness. The Company also leverages its expertise through original equipment manufacturing (OEM) agreements with other medical device manufacturers.
NOTE 2. SIGNIFICANT ACCOUNTING POLICIES
Consolidated Financial Statements
The accompanying consolidated financial statements include the accounts of Apyx and its wholly owned subsidiary, Apyx Bulgaria, EOOD, (collectively, the “Company” or “we”, “our” or “us”). All intercompany transactions and balances have been eliminated in consolidation.
The Company concluded that the divestiture of the Core business on August 30
th
, 2018 met the criteria for discontinued operations set forth in FASB ASC Topic No. 205, "
Presentation of Financial Statements.
" The Company reclassified its discontinued operations for all periods presented and has excluded the results of its discontinued operations from continuing operations and from segment results for all periods presented.
On August 30
th
, 2018, we sold our Core business and discontinued those operations. All the information in the financial statements has been restated to reflect this disposition.
Use of Estimates in the Preparation of Financial Statements
The preparation of consolidated financial statements in conformity with accounting principles generally accepted in the United States of America requires us to make certain estimates and assumptions that affect the reported amounts of assets and liabilities and disclosure of contingent assets and liabilities at the date of the consolidated financial statements. The reported amounts of revenues and expenses during the reporting period may be affected by the estimates and assumptions we are required to make.
Cash and Cash Equivalents
Holdings of highly liquid investments with original maturities of three months or less are considered to be cash equivalents.
Short-term Investments
Our short-term investments principally consist of US Treasury Bills, which are classified available-for-sale and are carried at their fair value as of the balance sheet date. The primary objective of our investment activities is to preserve principal while at the same time maximizing yields without significantly increasing risk. Short-term investments generally mature between three months and three years from the purchase date. Investments with maturities beyond one year are classified as short-term based on their highly liquid nature and because such marketable securities represent investments readily available for current operations. Marketable securities less than or equal to 3 months are identified as cash equivalents while marketable securities with a maturity duration over 3 months are considered short term investments.
The Treasury Bill investments accrue interest monthly, which is treated as interest income. Realized gains or losses are determined on the specific identification method and are reflected in other income. Net unrealized gains and losses are recorded on a quarterly basis.
Fair Values of Financial Instruments and Concentration of Credit Risk
35
The carrying amounts of our financial instruments included in current assets and liabilities approximate fair value due to their short term nature.
Financial instruments, which potentially subject us to significant concentrations of credit risk, consists primarily of short term investments and trade accounts receivable. With respect to cash, we frequently maintain cash and cash equivalent balances in excess of federally insured limits. We have not experienced any losses in such accounts.
Derivative Financial Instruments
We generally do not use derivative financial instruments to hedge exposures to cash-flow risks or market risks. However, certain financial instruments, such as warrants, which are indexed to our common stock, are classified as liabilities when either (a) the holder possesses rights to net-cash settlement or (b) physical or net-share settlement is not within our control. In such instances, net-cash settlement is assumed for financial accounting and reporting purposes, even if the terms of the underlying contracts do not always provide for net-cash settlement. Such financial instruments are initially recorded and continuously carried, at fair value.
Determining the fair value of these instruments involves judgment and the use of certain relevant assumptions including, but not limited to, interest rate risk, historical volatility and stock price, estimated life of the derivative, anti-dilution provisions and conversion/redemption privileges. The use of different assumptions or changes in those assumptions could have a material effect on the estimated fair value amounts.
Accounts Receivable and Allowance for Doubtful Accounts
Our credit terms for our billings range from net
10
days to net
90
days, depending on the customer agreement. Accounts receivable are determined to be past due if payments are not made in accordance with such agreements and an allowance is generally recorded for accounts that become three months past due, or sooner if there are other indicators that the receivables may not be recovered. Customary collection efforts are initiated, and receivables are written off when we determine they are not collectible and abandon these collection efforts.
We evaluate the allowance for doubtful accounts on a regular basis for adequacy based upon our periodic review of the collectability of the receivables in light of historical experience, adverse situations that may affect our customers’ ability to pay, estimated value of any underlying collateral and prevailing economic conditions. This evaluation is inherently subjective, as it requires estimates that are susceptible to significant revision as more information becomes available. Management believes that the allowances for doubtful accounts of approximately
$0.4 million
and
$0.2 million
at
December 31, 2018
and
2017
, respectively, are, or were, adequate to provide for possible bad debts.
Inventories and Repair Parts
Inventories are stated at the lower of cost or market. Cost is determined on a first in, first out basis. Finished goods and work-in-process inventories include material, labor and overhead costs. Factory overhead costs are allocated to inventory manufactured in-house based upon labor hours.
We monitor usage reports to determine if the carrying value of any items should be adjusted due to lack of demand for the item and adjust the inventory for estimated obsolescence or unusable inventory equal to the difference between the cost of inventory and the estimated market value based upon assumptions about future demand and market conditions. If actual market conditions are less favorable than those projected by management, additional inventory write-downs may be required.
Inventories consisted of the following:
36
|
(In thousands)
|
December 31,
2018 |
December 31,
2017 |
|||||
|
Raw materials
|
$
|
4,521
|
|
$
|
5,163
|
|
|
|
Finished goods
|
1,130
|
|
1,024
|
|
|||
|
Gross inventories
|
5,651
|
|
6,187
|
|
|||
|
Less: reserve for obsolescence
|
(439
|
)
|
(1,913
|
)
|
|||
|
Net inventories of continuing operations
|
5,212
|
|
4,274
|
|
|||
|
Finished goods of discontinued operations
|
—
|
|
2,252
|
|
|||
|
Net inventories of continuing and discontinued operations
|
$
|
5,212
|
|
$
|
6,526
|
|
|
Property and Equipment
Property and equipment are recorded at cost. Depreciation and amortization are provided for using the straight-line method over the estimated useful lives of the assets. The amortization of leasehold improvements is based on the shorter of the lease term or the life of the improvement. Betterments and large improvements, which extend the life of the asset, are capitalized, whereas maintenance and repairs and small improvements are expensed as incurred. The estimated useful lives are: machinery and equipment,
3
-
10
years; buildings,
39
years; molds,
7
-
15
years and furniture and fixtures,
5
-
10
years.
Intangible Assets
Intangible assets consist of licenses and purchased technology. The licenses and purchased technology are being amortized by the straight-line method over a
5
-
17
year period commencing with the date they were placed in service. Goodwill of
$0.2 million
resulted from our acquisition of Apyx Bulgaria, EOOD.
Valuation of Long-Lived Assets
We review long-lived assets for recoverability if events or changes in circumstances indicate that the assets may have been impaired. This circumstance exists when the carrying amount of the asset exceeds the sum of the undiscounted cash flows expected to result from its use and eventual disposition. In those cases an impairment loss is recognized to the extent that the assets’ carrying amount exceeds its fair value. Any impairment losses are not restored in the future if the fair value increases. At
December 31, 2018
, we believe the remaining carrying values of our long-lived assets are recoverable.
Revenue Recognition
Revenue is recognized when title has been transferred to the customer, which is generally at the time of shipment or receipt by customer for FOB destination terms. The following policies apply to our major categories of revenue transactions:
|
•
|
The majority of our sales to customers are evidenced by firm purchase orders. Generally, title and the risks and rewards of ownership are transferred to the customer when the product is shipped. Payment by the customer is due under fixed payment terms.
|
|
•
|
Product returns are only accepted at our discretion and in accordance with our “Returned Goods Policy”. Historically, the level of product returns has not been significant. We accrue for sales returns, rebates and allowances based upon an analysis of historical customer returns and credits, rebates, discounts and current market conditions.
|
|
•
|
Our terms of sale to customers generally do not include any obligations to perform future services. Limited warranties are generally provided for sales and provisions for warranty are provided at the time of product sale based upon an analysis of historical data.
|
|
•
|
Amounts billed to customers related to shipping and handling charges are included in sales. Shipping and handling costs included in cost of sales were approximately
$0.2 million
,
$0.2 million
and
$0.2 million
in
2018
,
2017
and
2016
, respectively.
|
ASU No. 2014-09 (ASC 606), Revenue from Contracts with Customers became effective for us beginning with the first quarter of 2018, and we adopted the new accounting standard using the modified retrospective transition approach. The modified retrospective transition approach recognized any changes from the beginning of the year of initial application through retained earnings with no restatement of comparative periods. We record revenue under ASC 606
at a single point in time, when control
37
is transferred to the customer, which is consistent with past practice. We will continue to apply our current business processes, policies, systems and controls to support recognition and disclosure under the new standard. Based on the results of the evaluation, we have determined that the adoption of the new standard presents no material impact on our consolidated financial statements. Application of the transition requirements of the new standard did not have a material impact and, as such, no entry was recorded to opening retained earnings. We have disaggregated revenue by segment and geography in Note 16 Geographic and Segment Information. Based on the current state of our business, management does not see a material reason to disaggregate further.
Advertising Costs
All advertising costs are expensed as incurred. The amounts of advertising costs were approximately
$0.4 million
,
$0.6 million
and
$0.7 million
for the years ended
December 31, 2018
,
2017
and
2016
, respectively.
Stock-Based Compensation
We account for stock-based compensation in accordance with FASB ASC Topic 718,
Compensation-Stock Compensation
. FASB ASC 718 requires recognizing compensation costs for all share-based payment awards made to employees and directors based upon the awards’ grant date fair value. The standard covers employee stock options, restricted stock and other equity awards. For stock options, we use a trinomial lattice option-pricing model to estimate the grant date fair value of stock option awards and recognize compensation cost on a straight-line basis over the awards’ vesting periods.
Litigation Contingencies
In accordance with authoritative guidance, we record a liability in our consolidated financial statements for these actions when a loss is known or considered probable and the amount can be reasonably estimated. If the reasonable estimate of a known or probable loss is a range, and no amount within the range is a better estimate than any other, the minimum amount of the range is accrued. If a loss is reasonably possible, but not known or probable, and can be reasonably estimated, the estimated loss or range of loss is disclosed in the notes to the consolidated financial statements. In most cases, significant judgment is required to estimate the amount and timing of a loss to be recorded.
Net (Loss) Earnings Per Common Share
We compute basic (loss) earnings attributable to common shareholders per share by dividing net (loss) income attributable to common shareholders by the weighted average number of common shares outstanding for the reporting period. Diluted (loss) earnings per share attributable to common shareholders gives effect to all potential dilutive shares outstanding during the period. The number of dilutive shares is calculated using the treasury method which reduces the effective number of shares by the amount of shares we could purchase with the proceeds of assumed exercises.
Research and Development Costs
With the exception of development costs that are purchased from another enterprise and have alternative future use, research and development expenses are charged to operations as incurred. We have expended approximately
$2.5 million
and
$1.9 million
and
$1.0 million
for the years ended
2018
,
2017
and
2016
respectively.
Research and Development Costs for Others
For research and development activities that are partially or completely funded by other parties and when the obligation is incurred solely to perform contractual services, expenses are charged to cost of sales and all revenues resulting from such activities are shown as sales.
Income Taxes
The Company utilizes the liability method of accounting for income taxes as set forth in FASB ASC Topic 740, "Income Taxes". Under the liability method, deferred taxes are determined based on temporary differences between the financial statement and tax bases of assets and liabilities using tax rates expected to be in effect during the years in which the basis difference. A valuation allowances is recorded when it is more likely than not that a tax benefit will not be realized. In determining the need for valuation
38
allowances the Company considers projected future taxable income and the availability of tax planning strategies. As of December 31, 2017, the Company recorded a valuation allowance on the net deferred tax asset with finite lives.
As a result of historical losses, exclusive of discontinued operations, the Company recorded a valuation allowance on the net deferred tax asset and does not anticipate recording an income tax benefit related to these deferred tax assets beyond the 2018 tax year. The Company will reassess the realization of deferred tax assets each reporting period and will be able to reduce the valuation allowance to the extent the financial results of continuing operations improve and it becomes more likely than not that the deferred tax assets will be realizable. As Management expects the Company to continue to generate losses in the foreseeable future after 2018, the Company will continue to record a valuation allowance on the remaining deferred tax assets balance as of December 31, 2018.
We assess the financial statement impact of an uncertain tax position taken or expected to be taken on an income tax return at the largest amount that is more-likely-than-not to be sustained upon audit by the relevant taxing authority. An uncertain income tax position will not be recognized in the financial statements unless it is more likely than not of being sustained. As of December 31, 2018, we have reserved
$1.3 million
of potential tax benefits in accrued expenses.
39
NOTE 3. DISPOSITION OF THE CORE BUSINESS
On August 30, 2018, we closed on a definitive asset purchase agreement (the "Asset Purchase Agreement") with Specialty Surgical Instrumentation Inc., a Tennessee Corporation and wholly-owned subsidiary of Symmetry Surgical Inc. (“Symmetry”), pursuant to which the Company divested and sold the Company's electrosurgical "Core" business segment and related intellectual property, including the Bovie
®
brand and trademarks, to Symmetry for gross proceeds of
$97 million
in cash.
In connection with the Asset Purchase Agreement, we entered into an Electro Surgical Disposables and Accessories, Cauteries and Other Products Supply Agreement with Symmetry for a
four
-year term, whereby we will manufacture certain Core products and sell them to Symmetry at agreed upon prices. Any revenue, costs and expenses resulting from this agreement are netted and reported in our Consolidated Statements of Operations as Other gains or (losses) in the amount of
$(0.2) million
for 2018. Core sales following the divestiture amounted to
$1.5 million
with cost of sales of
$1.5 million
and related operating expenses of
$0.2 million
.
Additionally, in connection with the Asset Purchase Agreement, we entered into a Manufacture and Supply Agreement with Symmetry for a
ten
-year term, whereby we will manufacture certain products and sell them to Symmetry at agreed upon prices. Revenue, costs and expenses resulting from this agreement are reported as a component in our Consolidated Statements as income or loss from operations of our OEM reporting segment.
We concluded that the divestiture of the Core business met the criteria for discontinued operations set forth in FASB ASC Topic No. 205, "
Presentation of Financial Statements"
. Gross sales of the Core business prior to the divestiture during 2018 amounted to
$19.6 million
with a cost of sales of
$10.5 million
and related operating expenses of
$2.8 million
. The table below summarizes the cash consideration and the carrying values of disposed assets at the disposition date of August 30, 2018 included as part of discontinued operations:
|
(In thousands)
|
|||
|
Gross consideration from the sale of the Core Business
|
$
|
97,000
|
|
|
Closing and transaction costs
|
5,905
|
|
|
|
Net proceeds from sale of the Core Business before taxes
|
$
|
91,095
|
|
|
Non-cash commitment to provide inventory
|
$
|
2,305
|
|
|
Book value of the Core Business
|
|||
|
Current assets:
|
|||
|
Inventories, net
|
$
|
2,195
|
|
|
Prepaid expenses and other current assets
|
57
|
|
|
|
Total current assets
|
2,252
|
|
|
|
Property and equipment, net of depreciation
|
375
|
|
|
|
Brand name and trademark
|
1,510
|
|
|
|
Purchased technology and license rights, net of depreciation
|
112
|
|
|
|
Total non-current assets
|
1,997
|
|
|
|
Total assets
|
$
|
4,249
|
|
|
Net gain on sale of the Core Business before taxes
|
84,541
|
|
|
|
Income tax expense
|
16,137
|
|
|
|
Net gain on sale of the Core Business after income taxes
|
$
|
68,404
|
|
40
Cash flows associated with discontinued operations are shown in the table below:
|
(in thousands)
|
2018
|
2017
|
2016
|
|||
|
Net Income from discontinued operations
|
73,503
|
|
8,620
|
|
7,600
|
|
|
Depreciation and amortization
|
126
|
|
529
|
|
563
|
|
|
Change in current assets from discontinued operations
|
(2,378
|
)
|
362
|
|
(139
|
)
|
|
Change in non current assets from discontinued liabilities
|
(1,997
|
)
|
(632
|
)
|
(583
|
)
|
|
Change in current liabilities from discontinued operations
|
(1,021
|
)
|
(1,451
|
)
|
1,007
|
|
|
Net cash provided by operating activities
|
68,233
|
|
7,428
|
|
8,448
|
|
41
NOTE 4. TRADE ACCOUNTS RECEIVABLE
Trade accounts receivable consisted of the following:
|
(In thousands)
|
December 31,
2018 |
December 31,
2017 |
|||||
|
Trade accounts receivable
|
$
|
5,443
|
|
$
|
5,061
|
|
|
|
Less: allowance for doubtful accounts
|
(428
|
)
|
(204
|
)
|
|||
|
Trade accounts receivable, net
|
$
|
5,015
|
|
$
|
4,857
|
|
|
NOTE 5. PROPERTY, PLANT AND EQUIPMENT
Property, plant and equipment consisted of the following:
|
(In thousands)
|
December 31,
2018 |
December 31,
2017 |
|||||
|
Land
|
$
|
1,600
|
|
$
|
1,600
|
|
|
|
Machinery and equipment
|
2,831
|
|
2,815
|
|
|||
|
Building and improvements
|
4,338
|
|
4,415
|
|
|||
|
Furniture and fixtures
|
2,252
|
|
2,085
|
|
|||
|
Leasehold improvements
|
108
|
|
181
|
|
|||
|
Molds
|
1,017
|
|
878
|
|
|||
|
Total property, plant and equipment of continuing operations
|
12,146
|
|
11,974
|
|
|||
|
Less: accumulated depreciation
|
(6,358
|
)
|
(5,941
|
)
|
|||
|
Net property, plant and equipment of continuing operations
|
5,788
|
|
6,033
|
|
|||
|
Net property, plant and equipment of discontinued operations
|
—
|
|
375
|
|
|||
|
Net property, plant and equipment of continuing and discontinued operations
|
$
|
5,788
|
|
$
|
6,408
|
|
|
Total depreciation expense from continuing operations was
$0.4 million
,
$0.6 million
and
$0.6 million
for the years ended
December 31, 2018
,
2017
and
2016
, respectively. Depreciation expense is included primarily within cost of goods sold in the consolidated statements of operations.
NOTE 6. INTANGIBLE ASSETS
Intangible assets consisted of the following:
|
(In thousands)
|
December 31,
2018 |
December 31,
2017 |
|||||
|
Brand name and trademark (life indefinite) of discontinued operations
|
$
|
—
|
|
$
|
1,510
|
|
|
|
Purchased technology (5-17 year lives)
|
$
|
1,448
|
|
$
|
1,401
|
|
|
|
Purchased technology (5-17 year lives) of discontinued operations, net
|
—
|
|
112
|
|
|||
|
Less: accumulated amortization
|
(1,442
|
)
|
(1,334
|
)
|
|||
|
Purchased technology, net
|
$
|
6
|
|
$
|
179
|
|
|
|
Goodwill
|
$
|
185
|
|
$
|
185
|
|
|
Goodwill resulted from our acquisition of Apyx Bulgaria, EOOD.
Amortization of intangible assets was
$0.1 million
for the years ended
December 31, 2018
,
2017
and
2016
. Amortization expense is classified within selling, general and administration expenses in the consolidated statements of operations.
42
NOTE 7. EARNINGS PER SHARE
We compute basic earnings per share (“basic EPS”) by dividing the net income or loss by the weighted average number of common shares outstanding for the reporting period. Diluted earnings per share (“diluted EPS”) gives effect to all dilutive potential shares outstanding. The following table provides the computation of basic and diluted earnings per share.
|
Year Ended December 31,
|
||||||||||||
|
(in thousands, except per share data)
|
2018
|
2017
|
2016
|
|||||||||
|
Numerators:
|
||||||||||||
|
Net (loss) from continuing operations
|
$
|
(9,494
|
)
|
$
|
(13,682
|
)
|
$
|
(11,550
|
)
|
|||
|
Effective of dilutive securities - Derivative liability - warrants
|
—
|
|
—
|
|
(64
|
)
|
||||||
|
Numerator for dilutive (loss) per share - continuing operations
|
(9,494
|
)
|
(13,682
|
)
|
(11,614
|
)
|
||||||
|
Net income from discontinued operations, net of tax
|
73,503
|
|
8,620
|
|
7,600
|
|
||||||
|
Effect of dilutive securities - Derivative liability warrants
|
—
|
|
—
|
|
(64
|
)
|
||||||
|
Numerator for dilutive income per share - discontinued operations
|
73,503
|
|
8,620
|
|
7,536
|
|
||||||
|
Net income (loss) from all operations
|
64,009
|
|
(5,062
|
)
|
(3,950
|
)
|
||||||
|
Derivative liability warrants
|
—
|
|
(183
|
)
|
(64
|
)
|
||||||
|
Numerator for full dilutive (loss) income per share - all
|
64,009
|
|
(5,245
|
)
|
(4,014
|
)
|
||||||
|
Denominator - continuing operations:
|
||||||||||||
|
Weighted average shares used to compute basic (loss)
|
33,185
|
|
31,420
|
|
27,433
|
|
||||||
|
Effect of dilutive securities:
|
||||||||||||
|
Derivative liability warrants
|
—
|
|
—
|
|
16
|
|
||||||
|
Denominator for dilutive income (loss) per common share - continuing operations
|
33,185
|
|
31,420
|
|
27,449
|
|
||||||
|
Denominator - discontinued operations:
|
||||||||||||
|
Weighted average shares used to compute basic (loss)
|
33,185
|
|
31,420
|
|
27,433
|
|
||||||
|
Effect of dilutive securities:
|
||||||||||||
|
Derivative liability warrants
|
—
|
|
—
|
|
—
|
|
16
|
|
||||
|
Stock options
|
1,181
|
|
—
|
|
—
|
|
||||||
|
Denominator for dilutive income (loss) per common share - discontinued operations
|
34,366
|
|
31,420
|
|
27,449
|
|
||||||
|
Denominator - all operations:
|
||||||||||||
|
Weighted average shares used to compute basic income (loss)
|
33,185
|
|
31,420
|
|
27,433
|
|
||||||
|
Effect of dilutive securities:
|
||||||||||||
|
Derivative liability warrants
|
—
|
|
7
|
|
16
|
|
||||||
|
Stock options
|
1,181
|
|
—
|
|
—
|
|
||||||
|
Denominator for dilutive income (loss) per common share
|
34,366
|
|
31,427
|
|
27,449
|
|
||||||
|
Loss per share from continuing operations
|
||||||||||||
|
Basic and diluted
|
$
|
(0.29
|
)
|
$
|
(0.44
|
)
|
$
|
(0.42
|
)
|
|||
|
Income per share from discontinued operations
|
||||||||||||
|
Basic
|
$
|
2.21
|
|
$
|
0.27
|
|
$
|
0.28
|
|
|||
|
Diluted
|
$
|
2.14
|
|
$
|
0.27
|
|
$
|
0.28
|
|
|||
|
Income (loss) per share from all operations
|
||||||||||||
|
Basic
|
$
|
1.93
|
|
$
|
(0.16
|
)
|
$
|
(0.14
|
)
|
|||
43
|
Diluted
|
$
|
1.86
|
|
$
|
(0.17
|
)
|
$
|
(0.15
|
)
|
|||
|
Anti-dilutive instruments excluded from diluted (loss) per common share - continuing operations:
|
||||||||||||
|
Warrants
|
—
|
|
7
|
|
—
|
|
||||||
|
Preferred stock
|
—
|
|
—
|
|
1,951
|
|
||||||
|
Options
|
1,181
|
|
646
|
|
580
|
|
||||||
|
Anti-dilutive instruments excluded from diluted income per common share - discontinued operations:
|
||||||||||||
|
Warrants
|
—
|
|
7
|
|
—
|
|
||||||
|
Preferred stock
|
—
|
|
—
|
|
1,951
|
|
||||||
|
Options
|
—
|
|
646
|
|
580
|
|
||||||
|
Anti-dilutive instruments excluded from diluted income (loss) per common share - all operations:
|
||||||||||||
|
Preferred stock
|
—
|
|
—
|
|
1,951
|
|
||||||
|
Options
|
—
|
|
646
|
|
580
|
|
||||||
44
NOTE 8
. RECENT ACCOUNTING PRONOUNCEMENTS
In January 2017, the Financial Accounting Standards Board (“FASB”) issued Accounting Standards Update (“ASU”) 2017-04,
Intangibles-Goodwill and Other
(Topic 350):
Simplifying the Test for Goodwill Impairment
. The purpose of this ASU is to reduce the cost and complexity of evaluating goodwill for impairment. It eliminates the need for entities to calculate the implied fair value of goodwill by assigning the fair value of a reporting unit to all of its assets and liabilities as if that reporting unit had been acquired in a business combination. Under this ASU, an entity will perform its goodwill impairment test by comparing the fair value of a reporting unit with its carrying amount. An impairment charge is recognized for the amount by which the carrying value exceeds the reporting unit’s fair value. The new standard is effective for fiscal years, and interim periods within those fiscal years, beginning after December 15, 2019. Early adoption is permitted, however we have chosen not to do so. The amendment is not expected to have a material impact on our financial condition or results of operations.
ASU No. 2016-18,
Restricted Cash Flows
provides guidance on the presentation of restricted cash and restricted cash equivalents, which are now included with cash and cash equivalents when reconciling the beginning and ending cash amounts shown on the statements of cash flows. Using the retrospective transition method required under the standard, the Company has adjusted the presentation of its Condensed Consolidated Statements of Cash Flows for all periods presented. The adoption of ASU No. 2016-18 did not have any other impact on the Company’s Consolidated Financial Statements.
The following table provides additional detail by financial statement line item of the ASU 2016-18 impact in our Consolidated Statement of Cash Flows for the
twelve months ended December 31, 2018
and
2017
:
|
(In thousands)
|
As Reported
(Pre-Adoption)
|
ASU 2016-18
Impact |
Reported
(Post Adoption)
|
||||||||
|
Twelve Months Ended December 31, 2018
|
|||||||||||
|
Net change in cash, cash equivalents and restricted cash
|
$
|
5,798
|
|
$
|
—
|
|
$
|
5,798
|
|
||
|
Cash, cash equivalents and restricted cash, beginning of period
|
9,949
|
|
719
|
|
10,668
|
|
|||||
|
Cash, cash equivalents and restricted cash, end of period
|
$
|
15,747
|
|
$
|
719
|
|
$
|
16,466
|
|
||
|
Twelve Months Ended December 31, 2017
|
|||||||||||
|
Net change in cash, cash equivalents and restricted cash
|
$
|
(4,507
|
)
|
$
|
(60
|
)
|
$
|
(4,567
|
)
|
||
|
Cash, cash equivalents and restricted cash, beginning of period
|
14,456
|
|
779
|
|
15,235
|
|
|||||
|
Cash, cash equivalents and restricted cash, end of period
|
$
|
9,949
|
|
$
|
719
|
|
$
|
10,668
|
|
||
ASU No. 2014-09 (ASC 606),
Revenue from Contracts with Customers
became effective for us beginning with the first quarter of 2018, and we adopted the new accounting standard using the modified retrospective transition approach. The modified retrospective transition approach recognized any changes from the beginning of the year of initial application through retained earnings with no restatement of comparative periods. We record revenue under ASC 606 at a single point in time, when control is transferred to the customer, which is consistent with past practice. We will continue to apply our current business processes, policies, systems and controls to support recognition and disclosure under the new standard. Based on the results of the evaluation, we have determined that the adoption of the new standard presents no material impact on our consolidated financial statements and thus no cumulative effect adjustment was recorded. We have disaggregated revenue by segment and geography in Note 13 Geographic and Segment Information. Based on the current state of our business, management does not see a material reason to disaggregate further.
In February 2016, the FASB issued Accounting Standards Update No. 2016-02 (ASU 2016-02),
Leases
(Topic 842). ASU 2016-02 requires a lessee to record a right-of-use asset and a corresponding lease liability, initially measured at the present value of the lease payments, on the balance sheet for all leases with terms longer than 12 months, as well as the disclosure of key information about leasing arrangements. ASU 2016-02 requires recognition in the statement of operations of a single lease cost, calculated so that the cost of the lease is allocated over the lease term, generally on a straight-line basis. ASU 2016-02 requires classification of all cash payments within operating activities in the statement of cash flows. Disclosures are required to provide the amount, timing and uncertainty of cash flows arising from leases. A modified retrospective transition approach is required for lessees for capital and operating leases existing at, or entered into after, the beginning of the earliest comparative period presented in the financial statements, with certain practical expedients available. ASU 2016-02 is effective for fiscal years beginning after December 15, 2018, including interim periods within those fiscal years. The Company has evaluated the impact of the adoption of ASU 2016-02 and does not believe it will have a material impact on the financial statement presentation.
45
No other new accounting pronouncement issued or effective during the fiscal year had or is expected to have a material impact on our consolidated financial statements or disclosures.
46
NOTE 9. FINANCIAL INSTRUMENTS
Cash, Cash Equivalents and Marketable Securities, as of December 31, 2018:
|
(In thousands)
|
Adjusted Cost
|
Unrealized Gains
(3)
|
Fair Value
(3)
|
Cash and Cash Equivalents
(1)
|
Short-term Marketable Securities
|
||||||||||||||
|
Cash
|
$
|
6,337
|
|
$
|
6,337
|
|
$
|
6,337
|
|
||||||||||
|
Level 1
(2)
|
|||||||||||||||||||
|
U.S. Treasury Securities, maturities less than three months
|
10,129
|
|
10,129
|
|
10,129
|
|
|||||||||||||
|
U.S. Treasury Securities, maturities greater than three months
|
61,431
|
|
247
|
|
61,678
|
|
61,678
|
|
|||||||||||
|
Total
|
$
|
77,897
|
|
$
|
247
|
|
$
|
78,144
|
|
$
|
16,466
|
|
$
|
61,678
|
|
||||
(1)
The company considers all highly liquid instruments with maturities of three months or less at the time of purchase to be cash equivalents.
(2)
The fair value of the debt securities consisting of U.S. Treasury bills is based on their quoted market prices. The fair value of these financial instruments are classified as Level 1 in the fair value hierarchy. The original purchase of U.S. Treasury bills occurred in 2018 utilizing the proceeds from the sale of our Core business.
(3)
ASC 825-10 Financial Instruments, allows entities to voluntarily choose to measure certain financial assets and liabilities at fair value (fair value option). The fair value option may be elected on an instrument-by-instrument basis and is irrevocable, unless a new election date occurs. If the fair value option is elected for an instrument, unrealized gains and losses for that instrument should be reported in earnings within interest income at each subsequent reporting date. At the date of purchase, the Company elected the fair value option for all investments with maturities of three months or greater at the time of purchase.
NOTE 10. LONG TERM DEBT
On August 30, 2018, the Company paid the remaining mortgage balance related to the Clearwater, FL, facility , releasing us from any and all obligations to the Bank of Tampa.
47
NOTE 11. INCOME TAXES
On December 22, 2017, the U.S. government enacted comprehensive tax legislation commonly referred to as the Tax Cuts and Jobs Act (the “Tax Act”). The Tax Act makes broad and complex changes to the U.S. tax code, including, but not limited to, (1) reducing the U.S. federal corporate tax rate from 35% to 21%; (2) bonus depreciation that will allow for full expensing of qualified property; (3) creating a new limitation on deductible interest expense; (4) eliminating the corporate alternative minimum tax (“AMT”) and changing how existing AMT credits can be realized; (5) changing rules related to uses and limitations of net operating loss carryforwards created in tax years beginning after December 31, 2017; and (6) limitations on the deductibility of certain executive compensation. The SEC issued guidance on accounting for the tax effects of the Tax Act. The Company must reflect the income tax effects of those aspects of the Tax Act for which the accounting is known.
As a result of the reduction act in the U.S. corporate income tax rate from
35%
to
21%
under the Tax Reform Act, the Company revalued its net deferred tax liabilities at December 31, 2017, resulting in an income tax benefits of
$0.196 million
included in the provision for income taxes for the year ended December 31, 2017. The Company has not made additional measurement window adjustments during the year ended December 31, 2018.
48
Components of the provision for income taxes from 2018 continuing operations and 2017 and 2016 all operations are as follows:
|
(In thousands)
|
December 31,
2018 |
December 31,
2017 |
December 31,
2016 |
||||||||
|
Current:
|
|||||||||||
|
Federal
|
$
|
(3,073
|
)
|
$
|
—
|
|
$
|
—
|
|
||
|
State
|
(754
|
)
|
22
|
|
38
|
|
|||||
|
Foreign
|
20
|
|
17
|
|
26
|
|
|||||
|
(3,807
|
)
|
39
|
|
64
|
|
||||||
|
Deferred:
|
|||||||||||
|
Federal
|
24
|
|
1,581
|
|
(2,505
|
)
|
|||||
|
State
|
63
|
|
(401
|
)
|
(277
|
)
|
|||||
|
Foreign
|
—
|
|
—
|
|
—
|
|
|||||
|
87
|
|
1,180
|
|
(2,782
|
)
|
||||||
|
Valuation Allowance
|
(57
|
)
|
(1,375
|
)
|
2,782
|
|
|||||
|
Total Provision for Income Tax from continuing operations
|
$
|
(3,777
|
)
|
$
|
(156
|
)
|
$
|
64
|
|
||
The Company recognized tax expense of
$1.20 million
attributable to income from discontinued operations and
$16.14 million
attributable to the gain on sales of the Core business in the Income Statement in the year ended December 31, 2018.
Below is a reconciliation of the statutory federal income tax rate to our effective tax rate:
|
Year Ended December 31,
|
||||||||
|
2018
|
2017
|
2016
|
||||||
|
Federal tax provision
|
21.0
|
%
|
34.0
|
%
|
34.0
|
%
|
||
|
State taxes (net of federal benefit)
|
5.6
|
%
|
4.8
|
%
|
3.7
|
%
|
||
|
Warrant gains
|
—
|
%
|
0.4
|
%
|
31.4
|
%
|
||
|
Valuation allowance
|
0.4
|
%
|
28.9
|
%
|
(71.8
|
)%
|
||
|
Change in federal tax rate
|
—
|
%
|
(71.2
|
)%
|
—
|
%
|
||
|
Other
|
1.9
|
%
|
6.2
|
%
|
1.5
|
%
|
||
|
Total
|
28.9
|
%
|
3.1
|
%
|
(1.2
|
)%
|
||
Major components of the Company’s deferred tax assets (liabilities) at December 31, 2018, 2017, and 2016, are as follows:
49
|
(In thousands)
|
December 31,
2018 |
December 31,
2017 |
December 31,
2016 |
||||||||
|
Deferred tax assets:
|
|||||||||||
|
Loss and credit carry-forwards
|
$
|
—
|
|
$
|
7,722
|
|
$
|
9,169
|
|
||
|
Stock-based compensation
|
636
|
|
549
|
|
519
|
|
|||||
|
Inventory Reserve
|
115
|
|
494
|
|
534
|
|
|||||
|
Intangibles
|
146
|
|
—
|
|
—
|
|
|||||
|
Other
|
744
|
|
178
|
|
263
|
|
|||||
|
Total deferred tax assets
|
1,641
|
|
8,943
|
|
10,485
|
|
|||||
|
Valuation allowance
|
(1,491
|
)
|
(8,756
|
)
|
(10,185
|
)
|
|||||
|
Total deferred tax assets, net of valuation allowance
|
150
|
|
187
|
|
300
|
|
|||||
|
Deferred tax liabilities:
|
|||||||||||
|
State taxes (capital)
|
—
|
|
(17
|
)
|
(19
|
)
|
|||||
|
Property and equipment
|
(150
|
)
|
(294
|
)
|
(459
|
)
|
|||||
|
Intangibles
|
—
|
|
(244
|
)
|
(386
|
)
|
|||||
|
Total deferred tax liabilities
|
(150
|
)
|
(555
|
)
|
(864
|
)
|
|||||
|
Net deferred tax liabilities
|
$
|
—
|
|
$
|
(368
|
)
|
$
|
(564
|
)
|
||
We consider all positive and negative evidence regarding the realization of deferred tax assets, including past operating results and future sources of taxable income.
For the period ended December 31, 2018, it is expected that the gain from the sale of the Core business segment to Symmetry will substantially utilize all of the historical Federal net operating loss carryover of
$23.8 million
and state(s) net operating loss carryover of
$19.1 million
. As a result, the valuation allowance on these deferred tax assets as well as other deferred tax assets was released during the year ended December 31, 2018 and the Company recorded a tax benefit from discontinued operations of
$7.32 million
from the release of the valuation allowance.
We assess the financial statement impact of an uncertain tax position taken or expected to be taken on an income tax return at the largest amount that is more-likely-than-not to be sustained upon audit by the relevant taxing authority.
An uncertain income tax position will not be recognized in the financial statements unless it is more likely than not of being sustained. As of December 31, 2018, we have reserved
$1.3 million
of potential tax benefits.
The following is a roll-forward of the Company's total gross unrecognized tax benefits, not including interest and penalties, for the year ended December 31, 2018.
|
(in thousands)
|
Gross Unrealized Tax Benefits
|
|||
|
Balance at January 1, 2018
|
$
|
—
|
|
|
|
Additions of tax positions related to the current year
|
—
|
|
||
|
Additions of tax positions related to the prior year
|
1,313
|
|
||
|
Decreases for tax positions related to prior year
|
—
|
|
||
|
Balance at December 31, 2018
|
$
|
1,313
|
|
|
The Company is subject to U.S. federal and state income tax examination. The Company’s 2015 through 2017 U.S. federal income tax returns are subject to examination by the Internal Revenue Service. The Company’s state income tax returns are subject to examination for the 2014 through 2017 tax years.
50
NOTE 12. RETIREMENT PLAN
The Company provides a tax-qualified profit-sharing retirement plan under section 401(k) of the Internal Revenue Code for the benefit of eligible employees with an accumulation of funds for retirement on a tax-deferred basis and provides for annual discretionary contribution to individual trust funds.
All employees are eligible to participate. The employees may make voluntary contributions to the plan up to the maximum percentage allowed by the Internal Revenue Code. Vesting in employee matching contributions is graded and depends on the years of service. After
three
years from their date of hire, the employees are
100%
vested. The Company makes matching contributions of
50%
of the employee contributions up to a total of
3%
of participant payroll. Matching contributions made by the Company totaled
$0.3 million
,
$0.3 million
and $0.3 million for the years ended
December 31, 2018
,
2017
and
2016
, respectively.
NOTE 13. RELATED PARTY TRANSACTIONS
Several relatives of Nikolay Shilev, Apyx Bulgaria’s Managing Director, are considered related parties. Teodora Shileva, Mr. Shilev’s spouse, is an employee of the Company working in the Accounting department. Antoaneta Dimitrova Shileva-Toromanova, Mr. Shilev’s sister, is the Manager of Production and Human Resources. Svetoslav Shilev, Mr. Shilev’s son, is an Engineer in the Quality Assurance department.
NOTE 14. OTHER COMMITMENTS AND CONTINGENCIES
Property and Rental Agreements
In March 2014, we signed a lease for offices located in Purchase, New York. In December 2017, we decided to consolidate operations in the Purchase, NY office with the facility in Clearwater, Florida. Based on this, we determined the office in Purchase, NY was no longer necessary and decided to cease all activity at the location. In August 2018, we negotiated a termination of the remainder of the lease, releasing us from any future obligation.
In October 2015, pursuant to our acquisition of Apyx Bulgaria, we are obligated to pay a lease of approximately
$6,000
per month, expiring in December 2021, for approximately
20,000
square feet of office, research and manufacturing space in Sofia, Bulgaria.
The following is a schedule of approximate future minimum lease payments under operating leases as of
December 31, 2018
:
|
(In thousands)
|
|||
|
2019
|
$
|
70
|
|
|
2020
|
70
|
|
|
|
2021
|
70
|
|
|
|
Total
|
$
|
210
|
|
On August 30, 2018, the Company paid the remaining mortgage balance related to the Clearwater, FL, facility, releasing us from any and all obligations to the Bank of Tampa.
Litigation
The medical device industry is characterized by frequent claims and litigation, and we are and may become subject to various claims, lawsuits and proceedings in the ordinary course of our business, including claims by current or former employees, distributors and competitors, and with respect to our products and product liability claims, lawsuits and proceedings.
We are involved in a number of legal actions relating to the use of our J-Plasma technology. The outcomes of these legal actions are not within our complete control and may not be known for prolonged periods of time. In the opinion of management, the Company has meritorious defenses, and such claims are adequately covered by insurance, or are not expected, individually or in the aggregate, to result in a material, adverse effect on our financial condition. However, in the event that damages exceed the aggregate coverage limits of our policy or if our insurance carriers disclaim coverage, we believe it is possible that costs associated with these claims could have a material adverse impact on our consolidated earnings, financial position or cash flows.
51
In accordance with authoritative guidance, we record a liability in our consolidated financial statements for these actions when a loss is known or considered probable and the amount can be reasonably estimated. If the reasonable estimate of a known or probable loss is a range, and no amount within the range is a better estimate than any other, the minimum amount of the range is accrued. If a loss is reasonably possible, but not known or probable, and can be reasonably estimated, the estimated loss or range of loss is disclosed in the notes to the consolidated financial statements. In most cases, significant judgment is required to estimate the amount and timing of a loss to be recorded.
Purchase Commitments
At
December 31, 2018
, we had purchase commitments for inventories totaling approximately
$3.0 million
, substantially all of which is expected to be purchased by the end of
2019
.
Severance
Jay D. Ewers, the Chief Financial Officer, resigned as an officer of the Company effective December 31, 2018, although he continued on as an employee during the first quarter of 2019. In connection with this departure, the Company and Mr. Ewers entered into a separation agreement, dated November 12, 2018. Severance costs incurred included salary, option expense and other benefits of approximately
$741,000
and will be included in operational cash outflows during 2019.
Jack McCarthy, the Chief Commercialization Officer, was terminated without cause from his position with the Company effective November 6, 2017. Severance costs incurred included salary, option expense and other benefits of approximately
$582,000
, of which approximately
$397,000
was included in operational cash outflows during 2018.
Robert L. Gershon, the Chief Executive Officer and a director, resigned from all of his positions with the Company effective
December 15, 2017. In connection with this departure, the Company and Mr. Gershon entered into a separation agreement, dated December 15, 2017. Severance costs incurred included salary, option expense and other benefits of approximately
$767,000
, of which approximately
$670,000
was included in operational cash outflows during 2018.
52
NOTE 15. STOCK OPTIONS
On October 30, 2007, our stockholders approved and the Board of Directors adopted an amendment to the 2003 Executive and Employee Stock Option Plan (the “Plan”) to increase the maximum aggregate number of shares of common stock reserved for issuance under the Plan from
1.2 million
shares (already reserved against outstanding options) to
1.7 million
shares. Except for the increase in the number of shares covered by the Plan, the Plan remained otherwise unchanged. In 2001, the Board of Directors adopted the 2001 Executive and Employee Stock Option Plan which reserved for issuance
1.2 million
stock options. Stock options typically have a
ten
-year life and currently vest over a
seven
year period.
In July of 2012, the stockholders approved the 2012 Share Incentive Plan covering a total of
750,000
shares of common stock issuable upon exercise of options to be granted under the plan. At
December 31, 2018
approximately
70,000
remain to be issued in this plan.
In July of 2015, the stockholders approved the 2015 Executive and Employee Stock Option Plan covering a total of
2,000,000
shares of common stock issuable upon exercise of options to be granted under the plan. At
December 31, 2018
approximately
326,000
remain to be issued in this plan.
In August of 2017, the stockholders approved the 2017 Executive and Employee Stock Option Plan covering a total of
3,000,000
shares of common stock issuable upon exercise of options to be granted under the plan. At
December 31, 2018
approximately
1,783,000
remain to be issued in this plan.
The status of our stock options and stock awards are summarized as follows:
|
Number of options
|
Weighted average exercise price
|
|||||
|
Outstanding at December 31, 2015
|
3,131,447
|
|
$
|
3.38
|
|
|
|
Granted
|
810,762
|
|
1.87
|
|
||
|
Exercised
|
(36,250
|
)
|
3.62
|
|
||
|
Canceled and forfeited
|
(153,750
|
)
|
3.69
|
|
||
|
Outstanding at December 31, 2016
|
3,752,209
|
|
$
|
3.04
|
|
|
|
Granted
|
1,728,000
|
|
3.09
|
|
||
|
Exercised
|
(176,750
|
)
|
2.41
|
|
||
|
Canceled and forfeited
|
(443,302
|
)
|
3.95
|
|
||
|
Outstanding at December 31, 2017
|
4,860,157
|
|
$
|
3.00
|
|
|
|
Granted
|
225,000
|
|
2.40
|
|
||
|
Exercised
|
(1,378,615
|
)
|
2.43
|
|
||
|
Canceled and forfeited
|
(225,841
|
)
|
2.10
|
|
||
|
Outstanding at December 31, 2018
|
3,480,701
|
|
$
|
3.10
|
|
|
|
Exercisable at December 31, 2018
|
2,129,581
|
|
$
|
3.20
|
|
|
|
Number of options
|
Weighted average grant date fair value
|
|||||
|
Non-vested at December 31, 2017
|
2,232,435
|
|
$
|
1.40
|
|
|
|
Granted
|
225,000
|
|
2.40
|
|
||
|
Vested
|
(880,474
|
)
|
1.63
|
|
||
|
Forfeited
|
(225,841
|
)
|
2.10
|
|
||
|
Non-vested at December 31, 2018
|
1,351,120
|
|
$
|
1.48
|
|
|
53
Common shares required to be issued upon the exercise of stock options and warrants would be issued from our authorized and unissued shares. We calculated the fair value of issued options utilizing a trinomial lattice with an expected life calculated via the simplified method as we do not have sufficient history to determine actual expected life.
|
2018 Grants
|
2017 Grants
|
2016 Grants
|
|||||||||
|
Option value
|
$1.46
|
-
|
$3.04
|
$1.73
|
-
|
$2.34
|
$0.80
|
-
|
$0.91
|
||
|
Risk-free rate
|
1.9%
|
-
|
2.5%
|
1.5%
|
-
|
1.9%
|
1.5%
|
1.8%
|
|||
|
Expected dividend yield
|
—%
|
—%
|
—%
|
||||||||
|
Expected volatility
|
60.9%
|
-
|
68.8%
|
62.1%
|
-
|
68.0%
|
49.5%
|
-
|
50.3%
|
||
|
Expected term (in years)
|
6
|
6
|
6
|
||||||||
As of
December 31, 2018
, the aggregate intrinsic value of all stock options outstanding and expected to vest was approximately
$11,954,354
and the aggregate intrinsic value of currently exercisable stock options was approximately
$6,976,636
. The intrinsic value of each option share is the difference between the fair market value of our common stock and the exercise price of such option share to the extent it is “in-the-money”. Aggregate intrinsic value represents the value that would have been received by the holders of in-the-money options had they exercised their options on the last trading day of the year and sold the underlying shares at the closing stock price on such day. The intrinsic value calculation is based on the
$6.48
closing stock price of our common stock on
December 31, 2018
, the last trading day of
2018
. The total number of in-the-money options outstanding and exercisable as of
December 31, 2018
,was approximately
5,310,711
.
As of
December 31, 2017
, the aggregate intrinsic value of all stock options outstanding and expected to vest was approximately
$1,306,791
and the aggregate intrinsic value of currently exercisable stock options was approximately
$768,706
. The intrinsic value calculation is based on the
$2.60
closing stock price of our common stock on
December 31, 2017
, the last trading day of
2017
. The total number of in-the-money options outstanding and exercisable as of
December 31, 2017
, was approximately
2,318,887
.
The total intrinsic value of options exercised during the years ended December 31,
2018
,
2017
and
2016
,was approximately
$4,460,842
,
$223,340
and
$119,026
, respectively. Intrinsic value of exercised shares is the total value of such shares on the date of exercise less the cash received from the option holder to exercise the options. The total cash proceeds received from the exercise of stock options was approximately
$202,575
,
$0
, and
$12,300
for the years ended December 31,
2018
,
2017
and
2016
, respectively.
The total fair value of options granted during the years ended December 31,
2018
,
2017
and
2016
, was approximately
$540,000
,
$3,144,960
and
$1,516,125
, respectively. The total fair value of option shares vested during the years ended December 31,
2018
,
2017
, and
2016
, was approximately
$1,435,173
,
$805,747
and
$612,464
, respectively.
During the year ended
December 31, 2018
, we issued
808,272
common shares in exchange for
1,378,615
non-employee stock options and
570,343
common shares (via stock swaps).
During the year ended
December 31, 2017
, we issued
47,372
common shares in exchange for
176,750
non-employee stock options and
129,378
common shares (via stock swaps).
During the year ended
December 31, 2016
, we issued
9,614
common shares in exchange for
36,250
employee and non-employee stock options and
26,636
common shares (via stock swaps).
As of
December 31, 2018
, there was approximately
$1.9 million
of total unrecognized stock-based compensation cost, related to unvested stock options granted under the Amended Plan. This cost is expected to be recognized over a weighted-average period of approximately
4
years.
54
Allocation of stock based compensation from continuing operations expense was as follows:
|
Year Ended December 31,
|
|||||||||||
|
(In thousands)
|
2018
|
2017
|
2016
|
||||||||
|
Cost of sales
|
$
|
—
|
|
$
|
—
|
|
$
|
2
|
|
||
|
Research and development
|
25
|
|
27
|
|
27
|
|
|||||
|
Salaries and related costs
|
1,500
|
|
844
|
|
780
|
|
|||||
|
Total
|
$
|
1,525
|
|
$
|
871
|
|
$
|
809
|
|
||
55
NOTE 16. GEOGRAPHIC AND SEGMENT INFORMATION
Operating segments are aggregated into reportable segments only if they exhibit similar economic characteristics. In addition to similar economic characteristics, we also consider the following factors in determining the reportable segments: the nature of business activities, the management structure directly accountable to our chief operating decision maker for operating and administrative activities, availability of discrete financial information and information presented to the Board of Directors and investors.
Our reportable segments are disclosed as principally organized and managed as
two
operating segments: Advanced Energy and OEM. "Corporate & Other" includes certain unallocated corporate and administrative costs which were not specifically attributed to any reportable segment. Net assets are shared, therefore, not allocated to the reportable segments. The OEM segment is primarily development and manufacturing contract and product driven, all related expenses are recorded as cost of sales, therefore no segment specific operating expenses are incurred.
Summarized financial information with respect to reportable segments is as follows:
|
Year ended December 31, 2018
|
||||||||||||||
|
(In thousands)
|
Advanced Energy
|
OEM
|
Corporate (Other)
|
Total
|
||||||||||
|
Sales
|
$
|
13,068
|
|
$
|
3,618
|
|
$
|
—
|
|
16,686
|
|
|||
|
Income (loss) from operations
|
(6,326
|
)
|
1,795
|
|
(9,069
|
)
|
(13,600
|
)
|
||||||
|
Severance and related expense
|
—
|
|
—
|
|
741
|
|
741
|
|
||||||
|
Interest income
|
—
|
|
—
|
|
616
|
|
616
|
|
||||||
|
Interest expense
|
—
|
|
—
|
|
(104
|
)
|
(104
|
)
|
||||||
|
Income tax benefit
|
—
|
|
—
|
|
(3,777
|
)
|
(3,777
|
)
|
||||||
|
Year ended December 31, 2017
|
|||||||||||||||
|
(In thousands)
|
Advanced Energy
|
OEM
|
Corporate (Other)
|
Total
|
|||||||||||
|
Sales
|
$
|
7,636
|
|
$
|
2,598
|
|
$
|
—
|
|
$
|
10,234
|
|
|||
|
Income (loss) from operations
|
(3,957
|
)
|
1,353
|
|
(11,281
|
)
|
(13,885
|
)
|
|||||||
|
Severance and related expense
|
—
|
|
—
|
|
1,524
|
|
1,524
|
|
|||||||
|
Interest income
|
—
|
|
—
|
|
—
|
|
—
|
|
|||||||
|
Interest expense
|
—
|
|
—
|
|
(136
|
)
|
(136
|
)
|
|||||||
|
Income tax benefit
|
—
|
|
—
|
|
(156
|
)
|
(156
|
)
|
|||||||
|
Year ended December 31, 2016
|
|||||||||||||||
|
(In thousands)
|
Advanced Energy
|
OEM
|
Corporate (Other)
|
Total
|
|||||||||||
|
Sales
|
$
|
3,491
|
|
$
|
5,328
|
|
$
|
—
|
|
$
|
8,819
|
|
|||
|
Income (loss) from operations
|
(4,812
|
)
|
3,045
|
|
(9,625
|
)
|
(11,392
|
)
|
|||||||
|
Severance and related expense
|
—
|
|
—
|
|
—
|
|
—
|
|
|||||||
|
Interest income
|
—
|
|
—
|
|
—
|
|
—
|
|
|||||||
|
Interest expense
|
—
|
|
—
|
|
(158
|
)
|
(158
|
)
|
|||||||
|
Income tax expense
|
—
|
|
—
|
|
64
|
|
64
|
|
|||||||
56
International sales in 2018,
2017
and
2016
were
22.9%
,
13.2%
and
3.9%
of sales, respectively. Substantially all of these sales are denominated in U.S. dollars. Revenue by geographic region, based on the "ship to" location on the invoice are as follows:
|
Year Ended December 31,
|
|||||||||||
|
(In thousands)
|
2018
|
2017
|
2016
|
||||||||
|
Sales by Domestic and International
|
|||||||||||
|
Domestic
|
$
|
12,858
|
|
$
|
8,887
|
|
8,475
|
|
|||
|
International
|
3,828
|
|
1,347
|
|
344
|
|
|||||
|
Total
|
$
|
16,686
|
|
$
|
10,234
|
|
$
|
8,819
|
|
||
57
NOTE 17. SUPPLEMENTAL UNAUDITED QUARTERLY FINANCIAL INFORMATION OF CONTINUING OPERATIONS
The following table sets forth certain unaudited quarterly data of continuing operations for each of the four quarters in the years ended December 31, 2018, and
2017
, respectively. The data has been derived from the Company’s unaudited consolidated financial statements that, in management’s opinion, include all adjustments (consisting of normal recurring adjustments) necessary for a fair presentation of such information when read in conjunction with the Consolidated Financial Statements and Notes thereto. The results of operations for any quarter are not necessarily indicative of the results of operations for any future period.
|
(In thousands, except per share data)
|
First
Quarter |
Second
Quarter |
Third
Quarter |
Fourth
Quarter |
|||||||||||
|
Year ended December 31, 2018
|
|||||||||||||||
|
Sales
|
$
|
3,397
|
|
$
|
3,691
|
|
$
|
3,672
|
|
$
|
5,926
|
|
|||
|
Gross profit
|
2,212
|
|
2,537
|
|
2,521
|
|
3,523
|
|
|||||||
|
Net income (loss)
|
(2,791
|
)
|
|
(2,938
|
)
|
|
(438
|
)
|
|
(3,327
|
)
|
||||
|
Basic income (loss) per common share
|
(0.08
|
)
|
(0.09
|
)
|
(0.01
|
)
|
(0.10
|
)
|
|||||||
|
Year ended December 31, 2017
|
|||||||||||||||
|
Sales
|
$
|
1,614
|
|
$
|
2,311
|
|
$
|
2,651
|
|
$
|
3,658
|
|
|||
|
Gross profit
|
777
|
|
1,572
|
|
1,913
|
|
2,696
|
|
|||||||
|
Net income (loss)
|
(3,898
|
)
|
(3,867
|
)
|
(2,944
|
)
|
(2,973
|
)
|
|||||||
|
Basic income (loss) per common share
|
(0.13
|
)
|
(0.13
|
)
|
(0.09
|
)
|
(0.09
|
)
|
|||||||
*Fourth quarter 2018 and
2017
period includes approximately
$0.7 million
and
$1.5 million
, respectively, of non-recurring severance and expenses related to former members of the Company’s executive management team and related closure of the corporate office in Purchase, New York.
58
APYX MEDICAL CORPORATION
ITEM 9. Changes in and Disagreements with Accountants on Accounting and Financial Disclosure
There were no disagreements with our current accountants on accounting and financial disclosures.
ITEM 9A. Controls and Procedures
Disclosure Controls and Procedures
Our management has established and maintains disclosure controls and procedures that are designed to ensure that the information required to be disclosed by us in reports that we file or submit under the Securities Exchange Act of 1934, as amended (the "Exchange Act"), is recorded, processed, summarized and reported within the time periods specified in the Securities and Exchange Commission's rules and forms, and that such information is accumulated and communicated to management, including the Chief Executive Officer and Chief Financial Officer, as appropriate, to allow timely decisions regarding required disclosure. Management carried out an evaluation, under the supervision and with the participation of our Chief Executive Officer and Chief Financial Officer, of the effectiveness of our disclosure controls and procedures as of the end of the period covered by this report. Based on such evaluation, our Chief Executive Officer and Chief Financial Officer have concluded that, as of December 31, 2018, the Company's disclosure controls and procedures were not effective because of the material weaknesses in our internal control over financial reporting as discussed below.
Notwithstanding such material weaknesses, which is described below in Management’s Report on Internal Control over Financial Reporting, our management has concluded that the consolidated financial statements included in this Form 10-K present fairly, in all material respects, our financial position, results of operations and cash flows for the periods presented in conformity with GAAP.
Management’s Report on Internal Control Over Financial Reporting
Our management is responsible for establishing and maintaining adequate internal control over financial reporting, as such term is defined in Exchange Act Rule 13a-15(f). The Company's internal control over financial reporting is designed to provide reasonable assurance regarding the reliability of financial reporting and the preparation of financial statements for external purposes in accordance with GAAP. Because of its inherent limitations, internal control over financial reporting may not prevent or detect misstatements. Also, projections of any evaluation of effectiveness to future periods are subject to the risk that controls may become inadequate because of changes in conditions, or that the degree of compliance with the policies or procedures may deteriorate.
Under the supervision and with the participation of our Chief Executive Officer and Chief Financial Officer, management carried out an evaluation of the effectiveness of the Company's internal control over financial reporting as of December 31, 2018, based on the framework set forth by the Committee of Sponsoring Organizations of the Treadway Commission in
Internal Control-Integrated Framework
(2013). Based on that evaluation, management concluded that, as of December 31, 2018, the Company's internal control over financial reporting was not effective as a result of the material weaknesses described below.
A material weakness is a deficiency, or a combination of deficiencies, in internal control over financial reporting, such that there is a reasonable possibility that material misstatements of the Company's annual or interim financial statements will not be prevented or detected on a timely basis.
We have identified three material weaknesses: (i) an ineffective control environment due to a lack of sufficient qualified accounting personnel with an appropriate level of knowledge and experience with generally accepted accounting principles, (ii) ineffective control activities due to the lack of documentation and timeliness in executing business process controls, and (iii) ineffective monitoring controls to ascertain whether the components of internal control were present and functioning.
As of December 31, 2018, our remediation of these deficiencies is incomplete.
The effectiveness of our internal control over financial reporting as of December 31, 2018 has been audited by Frazier & Deeter, LLC, an independent registered public accounting firm, as stated in their report included in this Annual Report on Form 10-K. This report, which appears in Part II, Item 8 of this Annual Report on Form 10-K, contains an adverse opinion on the effectiveness of our internal control over financial reporting.
Remediation Efforts to Address Material Weaknesses
Management is committed to maintaining a strong internal control environment. In response to the identified material weaknesses, management, with the oversight of the Audit Committee of the Board of Directors, has taken actions toward the remediation of the respective material weaknesses in internal control over financial reporting as outlined below.
59
APYX MEDICAL CORPORATION
In December 2018 we hired a new Chief Financial Officer and, in February 2018, a new Corporate Controller with experience in internal controls and financial reporting. Both will be actively engaged in remediation efforts to address the material weaknesses throughout fiscal year 2019. We will continue to recruit qualified professionals with appropriate levels of knowledge and experience to assist in resolving accounting issues in non-routine or complex transactions.
We will make further enhancements to our control environment by improving documentation of internal controls, guidance in the performance of those controls, communication of expectations, and emphasis on the importance of internal controls. In addition, we will make improvements to the level of detail in our risk assessment and clarity of the linkage between risks and internal controls.
We will continue to improve upon our risk assessment procedures and the timeliness of those procedures. We will make progress towards addressing the weaknesses in information and communication beginning the process to better identify, document, and assess information used when performing internal controls.
We plan to further enhance our policies, procedures, and controls for all key processes. In addition, management will train personnel to ensure consistent application of accounting principles and adherence to the Company’s policies, procedures, and controls. We will implement enhanced monitoring procedures to allow for more effective monitoring of compliance.
We plan to review current financial controls to assess if additional management review controls are necessary and work with all finance personnel to establish the appropriate documentation criteria for the existing controls including evidence of review, timeliness and variance thresholds.
We will continue to work with the third-party specialists we engaged to review, document, and (as needed) supplement our controls, with the goal of designing and implementing controls that not only better address both the accuracy and precision of management's review, but also enhance our ability to manage our business.
Management believes the steps outlined above, when fully implemented, will remediate the material weaknesses described above. The Audit Committee of the Board of Directors and management will continue to monitor the implementation of these remediation measures and the effectiveness of our internal controls over financial reporting on an ongoing basis.
Changes in Internal Control Over Financial Reporting
There were no changes in our internal control over financial reporting that occurred during the three months ended December 31, 2018 that materially affected, or that are reasonably likely to materially affect our internal control over financial reporting.
ITEM 9B. Other Information
None.
60
APYX MEDICAL CORPORATION
Part III
ITEM 10. Directors, Executive Officers and Corporate Governance
BACKGROUND AND EXPERIENCE OF DIRECTORS
When considering whether directors and nominees have the experience, qualifications, attributes or skills, taken as a whole, to enable the Board of Directors (“Board”) to satisfy its oversight responsibilities effectively in light of the Company’s business and structure, the Governance and Nominating Committee focused primarily on each person’s background and experience as reflected in the information discussed in each of the directors’ individual biographies set forth immediately below. We believe that our directors provide an appropriate mix of experience and skills relevant to the size and nature of our business. As more specifically described in such person’s individual biographies set forth below, our directors possess relevant and industry-specific experience and knowledge in the medical, engineering and business fields, as the case may be, which we believe enhances the Board’s ability to oversee, evaluate and direct our overall corporate strategy. The Governance and Nominating Committee annually reviews and makes recommendations to the Board regarding the composition and size of the Board so that the Board consists of members with the proper expertise, skills, attributes and personal and professional backgrounds needed by the Board, consistent with applicable regulatory requirements.
The Governance and Nominating Committee believes that all directors, including nominees, should possess the highest personal and professional ethics, integrity and values and be committed to representing the long-term interests of our stockholders. The Governance and Nominating Committee will consider criteria including the nominee’s current or recent experience as a senior executive officer, whether the nominee is independent, as that term is defined in existing independence requirements of The NASDAQ Stock Market LLC, the business, scientific or engineering experience currently desired on the Board, geography, the nominee’s industry experience and the nominee’s general ability to enhance the overall composition of the Board.
The Governance and Nominating Committee does not have a formal policy on diversity; however, in recommending directors, the Board and the Committee consider the specific background and experience of the Board members and other personal attributes in an effort to provide a diverse mix of capabilities, contributions and viewpoints which the Board believes enables it to function effectively as the Board of Directors of a company with our size and nature of business.
Directors serve for one-year terms and are elected at the annual stockholders’ meeting. Set forth below is information regarding the executive officers, directors and key employees of Apyx Medical Corporation as of
March 13, 2019
.
|
Name
|
Age
|
Position
|
Director Since
|
|||
|
Charles D. Goodwin
|
53
|
Chief Executive Officer and Director
|
December 2017
|
|||
|
Tara Semb
|
49
|
Chief Financial Officer, Treasurer and Secretary
|
N/A
|
|||
|
Todd Hornsby
|
43
|
Executive Vice President
|
N/A
|
|||
|
Moshe Citronowicz
|
66
|
Senior Vice President
|
N/A
|
|||
|
Andrew Makrides
|
77
|
Chairman of the Board
|
December 1982
|
|||
|
Lawrence J. Waldman
|
72
|
Director
|
March 2011
|
|||
|
Michael Geraghty
|
72
|
Director
|
March 2011
|
|||
|
John Andres
|
61
|
Vice-Chairman of the Board
|
July 2014
|
|||
|
Craig Swandal
|
58
|
Director
|
March 2018
|
|||
Andrew Makrides, Esq.
age 77, Chairman of the Board of Directors, received a Bachelor of Arts degree in Psychology from Hofstra University and a Juris Doctor Degree from Brooklyn Law School. He is a member of the Bar of the State of New York and practiced law from 1968 until joining Apyx Medical Corporation as a co-founder and Executive Vice President and director, in 1982. Mr. Makrides became President of the Company in 1985 and the CEO in December 1998 and served as such until March 18, 2011 at which point he relinquished his position as President, but remained CEO until December 2013. Mr. Makrides employment contract expired December 31, 2016. Mr. Makrides has over 30 years of executive experience in the medical industry.
61
APYX MEDICAL CORPORATION
Charles D. Goodwin
, age 53, Chief Executive Officer and a Director of Apyx Medical, is an accomplished senior executive with over 25 years of experience in the healthcare industry. Before joining Apyx Medical in December 2017, Mr. Goodwin was the Chief Executive Officer of MIS Implants Technologies, Inc., a privately held company specializing in dental implants. Prior to this position, Mr. Goodwin spent more than 11 years with Olympus/Gyrus ACMI in a variety of commercial and leadership roles of increasing responsibility. Mr. Goodwin began as a regional sales director for Gyrus in 2002 and was later promoted to Vice President of Sales, overseeing the Company’s strong commercial ramp and assisting Gyrus’ executive leadership team in the successful acquisition of American Cytoscope Makers, or “ACMI”, for $500 million in 2005. As President of Gyrus ACMI’s surgical division, Mr. Goodwin developed the company’s global distribution network and achieved average annual sales growth of 35% for three consecutive years, resulting in a promotion to President of Worldwide Sales in 2007. As President of Worldwide Sales for Gyrus ACMI, Mr. Goodwin was responsible for a global business with approximately 700 employees and was a key contributor to the successful sale of Gyrus ACMI to Olympus for $2.2 billion in 2008. Mr. Goodwin served as Group Vice President of Olympus Corporation’s global surgical energy group, where he was responsible for commercial strategy, R&D and operations for a business with more than 500 employees worldwide. Mr. Goodwin held this position for five years before joining MIS Implants Technologies, Inc. in 2014. Mr. Goodwin holds a B.A. Finance and Economics from Eastern Washington University.
Tara Semb
, age 49, Chief Financial Officer, Treasurer and Secretary. Prior to joining Apyx Medical, Ms. Semb was the Chief Financial Officer for AVAIL Vapor LLC, a manufacturer and retailer of e-liquid for use in electronic vapor devices, from 2015 until 2018. Ms. Semb previously worked for Amsted Industries, a diversified global manufacturer of industrial components, in multiple positions of increasing responsibility from 2006 until 2015, culminating in her promotion to Director of Finance for the company’s rail bearings division in 2013. Before joining Amsted Industries as Director of Internal Audit in 2006, she held financial and operational roles at Blyth Industries, a manufacturer and seller of candles and home fragrance products, and Anixter International, a global distributor of network & security solutions. She began her career in 1991 as an auditor at Price Waterhouse. Ms. Semb holds a Bachelor of Science degree in Accounting from the University of Illinois, as well as an MBA from Washington University in St. Louis. She is a Certified Public Accountant (CPA).
Todd Hornsby
, age 43, Executive Vice President, has responsibility for the Sales and Marketing efforts globally. He is an accomplished Senior Executive with more than 17 years of success in the medical device and biotech industries.
Throughout his career, Todd has held various leadership positions and has extensive experience in sales, sales management, and with building strong teams and launching new technologies. Since joining Apyx™ Medical, Todd has focused primarily on the commercialization of Apyx’s J-Plasma® advanced energy system. Prior to joining Apyx, Todd held roles of increasing seniority and responsibility at CryoLife, Inc. During his tenure, Todd directed the US Sales team, with a diversified product portfolio of biological heart valves and vascular grafts, surgical adhesives and hemostatic agents, dialysis access and CHF chronic heart failure products. Todd also directed successful integrations of three acquisitions into the US sales channel. Early in his medical device career, Todd held positions with Ethicon - Endo Surgery and Medex Medical. Todd holds a BA in Psychology from Hope College. He is also the recipient of many awards for sales achievement and growth.
Moshe Citronowicz
, age 66, Senior Vice President came to the United States in 1978 and has worked in a variety of manufacturing and high technology industries. In October 1993, Mr. Citronowicz joined the Company as Vice President of Operations and served as our Chief Operating Officer until November 2011. Currently, he is serving as the Senior Vice President. Mr. Citronowicz’s employment contract extends to December 31, 2019.
Lawrence J. Waldman
, CPA, age 72, has served as a director since March
2011 and is currently the Chair of our audit committee and Lead Independent Director of the Board. Mr. Waldman has over thirty-five years of experience in public accounting. Mr. Waldman currently serves as a senior advisor to First Long Island Investors, LLC, an investment and wealth management firm since May 2016. Prior to that Mr. Waldman served as an advisor to the accounting firm of EisnerAmper LLP, where he was previously the Partner-in-Charge of Commercial Audit Practice Development for Long Island since September 2011. Prior to joining EisnerAmper LLP, Mr. Waldman was the Partner-in-Charge of Commercial Audit Practice Development for Holtz Rubenstein Reminick, LLP from July 2006 to August 2011. Mr. Waldman was the Managing Partner of the Long Island office of KPMG LLP from 1994 through 2006, the accounting firm where he began his career in 1972. Mr. Waldman was elected to the Board of Directors of Comtech Telecommunications Corp. in August of 2015 and since December 2015, serves as Chair of its audit committee. In October 2016, Mr. Waldman was appointed and subsequently in December 2016 elected to the Board of Directors of CVD Equipment Corporation, and serves as the Chair of the audit committee and as Lead Independent Director Mr. Waldman serveed through October 2018 as a member of the Board of Directors of Northstar/RXR Metro Income Fund, a non-traded Real Estate Investment Trust and has served as a member of its audit committee since 2014. Mr. Waldman is also the Chair of the Supervisory Committee of Bethpage Federal Credit Union. Mr. Waldman also served as a member of the State University
62
APYX MEDICAL CORPORATION
of New York’s Board of Trustees and as chair of its audit committee. He previously served as the Chairman of the Board of Trustees of the Long Island Power Authority and as Chair and a member of the finance and audit committee of its Board of Trustees. Mr. Waldman meets the definition of a financial expert as defined by the SEC and The NASDAQ Stock Market LLC.
Michael Geraghty
, age 72, has served as a director since March 2011 and was previously employed as the President of Global Sales at Optos, Inc., a developer and manufacturer of retinal imaging devices for screening, detection and diagnosis of eye related conditions. From 2005 through 2008, he was the President of International Sales at Gyrus Acmi where he first started in 2000 as Senior Vice President of Sales for Gyrus Medical. Prior to this, Mr. Geraghty was the Vice President of Sales and Marketing for Everest Medical, Inc. and before that was the Director of Marketing for Advanced Products at Arthrocare Corporation. Mr. Geraghty specializes in building independent direct sales teams in the medical device industry and has extensive domestic and international sales and marketing experience. He received his bachelor’s degree from St. Mary’s University and graduate degree in Executive Sales Management from the University of Minnesota.
Craig Swandal
, age 58, has served on the Board since March 2018. Mr. Swandal has over 30 years of experience at public and privately-held medical technology and electronics manufacturing companies. He began his career in 1981 at Unisys Corporation, a manufacturer of main frame computer systems, where he held a variety of manufacturing positions of increasing responsibility. In 1995 he joined Silent Knight, a manufacturer of industrial fire and security systems, as a Manufacturing Manager and was promoted to Vice President of Operations.
In 2001, Mr. Swandal joined Gyrus, a manufacturer of surgical devices, where he was responsible for the company’s manufacturing operations as Director of Operations and later Vice President of Operations. During his tenure, he improved manufacturing efficiencies by leading his manufacturing group through the implementation of lean and Six Sigma techniques. Following Gyrus’s acquisition of ACMI in 2005, Mr. Swandal was promoted to Senior Vice President and was responsible for the global operations of the combined company, which included 12 facilities across 8 countries. He developed and executed Gyrus ACMI’s strategy to consolidate its manufacturing, distribution, customer service and service and repair operations and was a member of the leadership team that successfully sold the company to Olympus Corporation for $2.2 billion in 2008.
Following the acquisition of Gyrus ACMI, Mr. Swandal served on the executive leadership teams of several companies, including ATS Medical, ACELL and Tendyne, where he was focused on operational development. He is currently the Principal of Lead 2 Change Consulting, where he assists companies in identifying and implementing new manufacturing initiatives. Mr. Swandal serves as a member of the Board of Managers for Tiumed LLC a nontraded Medical Device start up. Mr. Swandal holds a Bachelor’s degree in Organizational Management and Communications from Concordia University, as well as a mini Master of Business Administration in Medical Technology from the University of St Thomas.
John Andres
, age 61, serves as Vice Chairman of the Board and has over thirty years of experience in the medical device industry. Since April, 2004, Mr. Andres has been a private consultant, doing business through John C. Andres, LLC, specializing in patent/business strategy development and execution. He also is a partner of Hawk Healthcare, LLC, which provides strategic transaction management to private individuals and companies.
In 2017, Mr. Andres joined the Longeviti Neuro Solutions, LLC Board of Directors which is developing cranial implant products for cranial reconstruction. In 2004, Mr. Andres helped found K2M, Inc. (KTWO) and from 2004 until 2010 served as a member of the Board of Directors of K2M, Inc. Prior to 2004, Mr. Andres held various legal and strategic business development positions at the Surgical Division of Tyco Healthcare Group, LLP, now Medtronic (NYSE: MDT) and its predecessor, United States Surgical Corporation. Before joining U.S. Surgical, Mr. Andres worked at the New York law firm of Morgan & Finnegan. He received his Associate of Applied Science degree from Rochester Institute of Technology, his Bachelor of Arts degree from Lehigh University and his Juris Doctor from Pace University School of Law.
Involvement in Certain Legal Proceedings
None
Independent Board Members
During
2018
, the Board had four independent members, John Andres, Michael Geraghty, Craig Sandal and Lawrence J. Waldman, who meet the existing independence requirements of the The NASDAQ Stock Market LLC.
63
APYX MEDICAL CORPORATION
Board Leadership
The independent directors appointed Lawrence J. Waldman as the Lead Independent Director. The Lead Independent Director is appointed by the Board and is responsible for coordinating the activities of the independent directors and coordinating with the Chief Executive Officer of the Company to set agendas for Board meetings and chair executive sessions of the independent directors. The Lead Independent Director is also responsible for meeting, from time to time, with the Company’s Compensation Committee to discuss the Chief Executive Officer’s performance.
The Company’s Corporate Governance Policies also contain several features which the company believes will ensure that the Board maintains effective and independent oversight of management, including the following:
|
•
|
Executive sessions without management and non-independent directors present are a standing Board agenda item. Executive sessions of the independent directors are held at any time requested by an independent director and, in any event, are held in connection with at least 100% of regularly scheduled Board meetings.
|
|
•
|
The Board regularly meets in executive session with the CEO without other members of management present.
|
|
•
|
All Board committee members are independent directors. The committee chairs have authority to hold executive sessions without management and non-independent directors present.
|
While our Board has no formal policy with respect to separation of the positions of Chairman and CEO or with respect to whether the Chairman should be a member of management or an independent director, our Board leadership structure currently separates the positions of the Chairman and CEO. We believe that these are matters that should be discussed and determined by the Board from time to time. The Chief Executive Officer of the Company, Charlie Goodwin, is tasked with the responsibility of implementing our corporate strategy, we believe he is best suited for leading discussions, at the Board level, regarding performance relative to our corporate strategy and this discussion accounts for a significant portion of the time devoted at our Board meetings.
Board Evaluations
The Board has adopted a policy to evaluate its performance and effectiveness as well as that of the three standing committees on an annual basis. The purpose of the evaluation is to track progress in certain areas targeted for improvement from year to year and to identify ways to enhance the Board’s effectiveness. As part of the evaluation, each Director may complete a written questionnaire developed by the Governance and Nominating Committee to provide feedback on the effectiveness of the Board, the Committees, as well as each individual Director’s own contributions. The collective ratings and comments of the Directors are compiled and then presented to the Governance and Nominating Committee and to the full Board for discussion and action as necessary.
Risk Management
The Board believes that risk management is an important component of the Company’s corporate strategy. While we assess specific risks at our committee levels, the Board, as a whole, oversees our risk management process and discusses and reviews with management major policies with respect to risk assessment and risk management. The Board is regularly informed through its interactions with management and committee reports about risks we face in the course of our business. Our Audit Committee also takes an active role in risk assessment and risk management.
Audit Committee
The Audit Committee assists the Board in its general oversight of our financial reporting, internal controls and audit functions and is directly responsible for the appointment, compensation and oversight of the work of our independent registered public accounting firm. The Audit Committee reviews and discusses with management and our independent accountants the annual audited and quarterly financial statements (including the disclosures under “Management’s Discussion and Analysis of Financial Condition and Results of Operations”), reviews the integrity of the financial reporting processes, both internal and external, reviews the qualifications, performance and independence of our independent accountants and prepares the Audit Committee Report included in this Annual Report on Form 10-K in accordance with rules and regulations of the Securities and Exchange Commission. The Audit Committee has the power to investigate any matter brought to its attention within the scope of its duties. It also has the authority to retain counsel and advisors to fulfill its responsibilities and duties. The Audit Committee also acts as a qualified legal compliance committee.
64
APYX MEDICAL CORPORATION
During 2018, our Audit Committee consisted of three (later four) independent members of the Board of Directors, Lawrence J. Waldman, John Andres and Michael Geraghty. In August 2018, Craig Swandal was added to the Audit Committee, for a total of four members. As a smaller reporting company, we are required to have at least two independent members comprising our Audit Committee in accordance with Rule 10A-3 of the Securities Exchange Act of 1934 and the rules of The NASDAQ Stock Market LLC. During 2018, Mr. Waldman served as the Audit Committee Chairman and financial expert. The Audit Committee meets as often as it determines necessary but not less frequently than once every fiscal quarter. During 2018, the Audit Committee met four times.
Governance and Nominating Committee
The Governance and Nominating Committee is responsible for matters relating to the corporate governance of our company and the nomination of members of the board and committees thereof. During
2018
, our Governance and Nominating Committee consisted of three independent members of the Board of Directors, John Andres who serves as Chairman, Lawrence J. Waldman and Michael Geraghty. The Governance and Nominating Committee meets as often as it determines necessary, but not less than once a year. During
2018
, Governance and Nominating Committee met once.
Compensation Committee
The Compensation Committee is responsible for overseeing our compensation and employee benefit plans (including those involving the issuance of our equity securities) and practices, including formulating, evaluating and approving the compensation of our executive officers and reviewing and recommending to the full Board of Directors the compensation of our Chief Executive Officer. During
2018
, our Compensation Committee consisted of four independent members of the Board of Directors, Michael Geraghty who served as Chairman, John Andres and Lawrence J. Waldman. The Compensation Committee meets as often as it determines necessary, but not less than once a year. During
2018
, the Compensation Committee met three times.
Code of Ethics
On March 30, 2004 Apyx adopted a Code of Ethics for executive employees.
A copy of the code of ethics which expressly includes the CEO and CFO, is available on our website at
http://boviemed.com/financials/Bovie_Code_of_Business_Conduct_and_Ethics_v2.pdf
ITEM 11. Executive Compensation Discussion and Analysis
General Compensation Philosophy
The primary objective of our compensation program for employees, including our compensation program for executive officers, is to attract, retain and motivate qualified individuals and reward them in a manner that is fair to all stockholders. We strive to provide incentives for every employee that rewards them for their contribution to the Company.
Our compensation program is designed to be competitive with other employment opportunities and to align the interests of all employees, including executive officers, with the long-term interests of our stockholders. Historically, for our executive officers, we link a much higher percentage of total compensation to incentive compensation such as stock based compensation than we do for other employees.
With these objectives in mind, our Board has built executive and non-executive compensation programs that consist of three principal elements - base salary, performance bonuses and grants of stock options and/or shares of restricted stock.
To understand the competitiveness of compensation arrangements provided to our executive officers, in 2014 the Compensation Committee engaged Pearl Meyer & Partners to perform a competitive assessment of base salaries, bonuses for on-target performance and grants of equity incentives. In 2016, Pearl Meyer & Partners updated the competitive frame of reference for the study to consist of the following group of pre-selected companies that were of comparable size and operated in our industry category.
65
APYX MEDICAL CORPORATION
|
Avinger, Inc.
|
Esko Bionics Holdings, Inc.
|
IRIDEX Corporation
|
|
AxoGen, Inc.
|
Fonar Corporation
|
Misonix, Inc.
|
|
BIOLASE, Inc
|
iCAD, Inc.
|
Retractable Technologies, Inc.
|
|
Cogentix Medical, Inc.
|
Invuity, Inc.
|
Utah Medical Products Inc.
|
|
Cutera, Inc.
|
IRadimed Corporation
|
|
In addition to the peer group, Pearl Meyer referenced industry-specific, size-adjusted market survey data where appropriate.
The results of the survey confirmed that, consistent with our desired philosophy, our compensation arrangements were competitive with the marketplace, with some variation by individual.
Compensation Program
Base Salary
We pay base salaries to our Executive Officers in order to provide a consistent, minimum level of pay that sustained individual performance warrants. We also believe that a competitive annual base salary is important to attract and retain an appropriate caliber of talent for each position over time.
The annual base salaries of our Executive Officers are determined by our Compensation Committee and approved by the Board of Directors. All salary decisions are based on each Executive Officer’s level of responsibility, experience and recent and past performance, as determined by the Compensation Committee. The Compensation Committee benchmarks base salaries using a major independent consulting firm and using their recommendations and other information the Committee evaluates and establishes the base compensation for our executives.
66
APYX MEDICAL CORPORATION
Performance Bonus
The second component of executive compensation is performance bonuses which are earned when defined metrics are achieved.
For
2018
, the Company established a combination of financial, operational and personal objectives as the broad criteria that would determine annual performance bonus amounts for the year.
|
(In millions)
|
Threshold
|
Target
|
Achievement
|
Overall Weight
|
Achievement
|
Calculation
|
||||||||||||
|
Advanced Energy Revenue
|
10.1
|
|
11.2
|
|
13.3
|
|
100
|
%
|
125
|
%
|
125
|
%
|
||||||
|
Total
|
100
|
%
|
125.0
|
%
|
||||||||||||||
After careful review and consideration of the measures that comprise the
2018
bonus, the Compensation Committee approved the following performance bonuses:
|
Name
|
Bonus
|
|||
|
Charles D. Goodwin
|
$
|
375,000
|
|
|
|
Jay D. Ewers
|
169,375
|
|
||
|
Moshe Citronowicz
|
141,506
|
|
||
|
Todd Hornsby
|
100,000
|
|
||
|
Tara Semb
|
—
|
|
||
|
Total
|
$
|
785,881
|
|
|
Stock Options
The third component of executive compensation is equity grants which have mainly come in the form of stock options. We believe that equity ownership in our Company is important to provide our Executive Officers with long-term incentives to better align interests of executives with the interests of stockholders and build value for our stockholders. In addition, the equity compensation is designed to attract and retain the executive management team. Stock options have value only if the stock price increases over time and, therefore, provide executives with an incentive to build Apyx’s value. This characteristic ensures that the Executive Officers have a meaningful portion of their compensation tied to future stock price increases and rewards management for long-term strategic planning through the resulting enhancement of the stock price.
Stock option awards to Executive Officers are entirely discretionary. The CEO recommends to the Compensation Committee awards for Executive Officers other than himself. The Compensation Committee considers this recommendation along with the prior contribution of these individuals and their expected future contributions to our growth. The Committee formulates and presents its recommended allocation of stock option awards to the Board of Directors for approval. The Compensation Committee then would make an independent determination on CEO stock option awards, again formulating and presenting its recommendation for the allocation of stock option awards to the Board of Directors for approval. The Board of Directors approves, rejects, or, if necessary, modifies the Committee’s recommendations.
67
APYX MEDICAL CORPORATION
Perquisites and Other Benefits
Our Executive Officers are eligible for the same health and welfare programs and benefits as the rest of our employees in their respective locations.
Our Executive Officers are entitled to participate in and receive employer contributions to Apyx's 401(k) Savings Plan. For more information on employer contributions to the 401(k) Savings Plan see the Summary Compensation Table and its footnotes.
Tax and Accounting Considerations
Section 162(m) of the Internal Revenue Code of 1986, as amended (the “Code”), places a limit of
$1.0 million
on the amount of compensation that we may deduct as a business expense in any year with respect to each of our most highly paid executives unless, among other things, such compensation is performance-based and has been approved by stockholders. The non-performance-based compensation paid to our executive officers for the
2018
fiscal year did not exceed the
$1.0 million
limit per executive officer. Accounting considerations also play an important role in the design of our executive compensation program. Accounting rules, such as FASB ASC Topic 718-10-10,
Share-Based Payment,
require us to expense the cost of our stock option grants which reduces the amount of our reported profits. Because of option expensing and the impact of dilution on our stockholders, we pay close attention to the number and value of the shares underlying stock options we grant.
68
APYX MEDICAL CORPORATION
Compensation of Executive Officers
The following table sets forth the compensation paid to each of our Executive Officers for the three years ended
December 31, 2018
,
2017
, and
2016
for services to our Company in all capacities:
|
Name and Principal Position
|
Year
|
Salary
|
Bonus
($) |
Stock Awards
($) |
Option Awards
($) (1) |
Non-Equity Incentive Plan Compensation Earnings
($) |
Change in Pension Value and Nonqualified Deferred Compensation Earnings
($) |
All Other Compensation
($) (6) |
Total
($) |
||||||||||||||||||||||||
|
Charles D. Goodwin
|
2018
|
$
|
400,000
|
|
$
|
1,075,500
|
|
$
|
—
|
|
—
|
|
$
|
—
|
|
$
|
—
|
|
$
|
14,233
|
|
$
|
1,489,733
|
|
|||||||||
|
CEO and Director
|
2017
|
$
|
15,385
|
|
$
|
—
|
|
$
|
—
|
|
1,770,000
|
|
$
|
—
|
|
$
|
—
|
|
$
|
—
|
|
$
|
1,785,385
|
|
|||||||||
|
2016
|
$
|
—
|
|
$
|
—
|
|
$
|
—
|
|
—
|
|
$
|
—
|
|
$
|
—
|
|
$
|
—
|
|
$
|
—
|
|
||||||||||
|
Jay D. Ewers*
|
2018
|
$
|
271,000
|
|
$
|
369,875
|
|
$
|
—
|
|
47,970
|
|
$
|
—
|
|
$
|
—
|
|
$
|
8,628
|
|
$
|
697,473
|
|
|||||||||
|
Former Chief Financial Officer,
|
2017
|
$
|
271,000
|
|
$
|
300
|
|
(2)
|
$
|
—
|
|
137,340
|
|
$
|
—
|
|
$
|
—
|
|
$
|
8,491
|
|
$
|
417,131
|
|
||||||||
|
Treasurer and Secretary
|
2016
|
$
|
235,000
|
|
$
|
109,892
|
|
$
|
—
|
|
—
|
|
$
|
—
|
|
$
|
—
|
|
$
|
10,608
|
|
$
|
355,500
|
|
|||||||||
|
J. Robert Saron****
|
2018
|
$
|
223,000
|
|
$
|
200,000
|
|
$
|
—
|
|
—
|
|
$
|
—
|
|
$
|
—
|
|
$
|
1,049,251
|
|
(5)
|
$
|
1,472,251
|
|
||||||||
|
President, Chief Sales &
|
2017
|
$
|
334,485
|
|
$
|
300
|
|
(3)
|
$
|
—
|
|
137,340
|
|
$
|
—
|
|
$
|
—
|
|
$
|
19,769
|
|
$
|
491,894
|
|
||||||||
|
Marketing Officer & Director
|
2016
|
$
|
318,917
|
|
$
|
148,956
|
|
$
|
—
|
|
32,375
|
|
$
|
—
|
|
$
|
—
|
|
$
|
24,383
|
|
$
|
524,631
|
|
|||||||||
|
Moshe Citronowicz
|
2018
|
$
|
226,410
|
|
$
|
342,006
|
|
$
|
—
|
|
—
|
|
$
|
—
|
|
$
|
—
|
|
$
|
19,904
|
|
$
|
588,320
|
|
|||||||||
|
Senior Vice President
|
2017
|
$
|
226,410
|
|
$
|
300
|
|
(4)
|
$
|
—
|
|
137,340
|
|
$
|
—
|
|
$
|
—
|
|
$
|
18,968
|
|
$
|
383,018
|
|
||||||||
|
2016
|
$
|
213,990
|
|
$
|
100,112
|
|
$
|
—
|
|
32,375
|
|
$
|
—
|
|
$
|
—
|
|
$
|
22,066
|
|
$
|
368,543
|
|
||||||||||
|
Todd Hornsby
|
2018
|
$
|
277,886
|
|
$
|
200,500
|
|
$
|
—
|
|
—
|
|
$
|
—
|
|
$
|
—
|
|
$
|
25,713
|
|
$
|
504,099
|
|
|||||||||
|
Executive Vice President(**)
|
2017
|
$
|
504,152
|
|
$
|
300
|
|
$
|
—
|
|
206,430
|
|
$
|
—
|
|
$
|
—
|
|
$
|
25,076
|
|
$
|
735,958
|
|
|||||||||
|
2016
|
$
|
320,963
|
|
$
|
500
|
|
$
|
—
|
|
—
|
|
$
|
—
|
|
$
|
—
|
|
$
|
17,168
|
|
$
|
338,631
|
|
||||||||||
|
Tara Semb(***)
|
2018
|
$
|
—
|
|
$
|
—
|
|
$
|
—
|
|
—
|
|
$
|
—
|
|
$
|
—
|
|
$
|
—
|
|
$
|
—
|
|
|||||||||
|
Chief Financial Officer,
|
2017
|
$
|
—
|
|
$
|
—
|
|
$
|
—
|
|
—
|
|
$
|
—
|
|
$
|
—
|
|
$
|
—
|
|
$
|
—
|
|
|||||||||
|
Treasurer and Secretary
|
2016
|
$
|
—
|
|
$
|
—
|
|
$
|
—
|
|
—
|
|
$
|
—
|
|
$
|
—
|
|
$
|
—
|
|
$
|
—
|
|
|||||||||
* Resigned as an Officer on December 31, 2018. **Assumed role as Executive Vice President on January 2, 2019. ***Assumed role as CFO, Treasurer and Secretary on January 2nd, 2019. **** Resigned as Officer and director on August 30, 2018, as part of the divestiture for the Core business segment.
|
(1)
|
These columns represent the grant date fair value of the awards as calculated in accordance with FASB ASC 718 (Stock Compensation). Pursuant to SEC rule changes effective February 28, 2010, we are required to reflect the total grant date fair values of the option grants in the year of grant, rather than the portion of this amount that was recognized for financial statement reporting purposes in a given fiscal year which was required under the prior SEC rules, resulting in a change to the amounts reported in prior Annual Reports.
|
|
(2)
|
The Company and Mr. Ewers voluntarily agreed to waive his bonus payment for 2017 of $67,344. Mr. Ewers resigned from all of his positions as an Officer with the Company effective December 31, 2018, although he continued as an employee during the first quarter of 2019. In connection with this departure, the Company and Mr. Ewers entered into a
|
69
APYX MEDICAL CORPORATION
separation agreement, dated November 12, 2018. Severance costs incurred included salary, option expense and other benefits of approximately $741,000 and will be operational cash outflows during 2019.
|
(3)
|
The Company and Mr. Saron voluntarily agreed to waive his bonus payment for 2017 of $83,119.
|
|
(4)
|
The Company and Mr. Citronowicz voluntarily agreed to waive his bonus payment for 2017 of $56,263.
|
|
(5)
|
J. Robert Saron
resigned from all positions with the Company and entered into a Separation Agreement and General Release, dated August 30, 2018. Mr. Saron shall be paid all wages, wage supplements and any and all other employment compensation and benefits due; and a lump sum payment in the gross amount of $1,033,450 (representing three (3) times Mr. Saron’s annual base salary), less applicable federal, state and local deductions and withholdings.
|
|
(6)
|
The amounts for 2018 include compensation under the following plans and programs:
|
|
C.D.
Goodwin |
J.D.
Ewers |
J.R.
Saron |
M.
Citronowicz |
T.
Hornsby |
T.
Semb |
|||||||||||||||||||
|
Life insurance premiums
|
461
|
|
503
|
|
303
|
|
464
|
|
503
|
|
—
|
|
||||||||||||
|
Health insurance premiums
|
5,522
|
|
—
|
|
8,435
|
|
12,648
|
|
18,258
|
|
—
|
|
||||||||||||
|
Employer 401(k) contribution
|
8,250
|
|
8,125
|
|
7,063
|
|
6,792
|
|
6,952
|
|
—
|
|
||||||||||||
|
Total
|
$
|
14,233
|
|
$
|
8,628
|
|
$
|
15,801
|
|
$
|
19,904
|
|
$
|
25,713
|
|
$
|
—
|
|
||||||
Amounts in the table above are pro-rated where applicable.
Employment Agreements and Potential Payments Upon Termination or Change in Control
At
December 31, 2018
, we were obligated under three employment agreements.
|
Name
|
Contract Expiration Date
|
|
|
Charles D. Goodwin
|
N/A
(1)
|
|
|
Jay D. Ewers
|
N/A
(2)
|
|
|
Moshe Citronowicz
|
December 31, 2019
|
|
|
(1)
|
Employment contracts provide for the Executives to remain employed by the Company until such time as their employment is terminated pursuant to the terms of their Employment Agreement.
|
|
(2)
|
Effective December 31, 2018, Jay Ewers resigned as an Officer of the Company.
In connection with his Resignation, the Company and Mr. Ewers entered into a Separation Agreement and General Release, effective as of November 12, 2018. Mr. Ewers shall be paid all wages, wage supplements and any and all other employment compensation and benefits due to Mr. Ewers through and including the separation date; his 2018 bonus in accordance with the terms and conditions of the Company’s 2018 Executive Compensation Plan; a lump sum severance payment in the gross amount of $271,000 (representing Mr. Ewers’ annual base salary), which shall be paid in twenty-six bi-weekly equal installments on the Company’s regular payroll dates; and (iv) monthly payments of one-twelfth of the gross amount of $135,500, which constitutes payment of Mr. Ewers’ target bonus for 2019, to be paid over the twelve month period following the separation date in accordance with the Company’s applicable Executive Compensation Plan. Provided that Mr. Ewers provides the Transition Services to the Company, Mr. Ewers shall be paid an additional gross amount of $203,250, less legally required federal, state and local and other authorized deductions, which shall be paid in twenty-six bi-weekly equal installments on the Company’s regular payroll dates, with the first such payment to be made on the first regular payroll date following the Separation Date.
|
Approximate future minimum payments under these agreements are as follows as of
December 31, 2018
:
|
(In thousands)
|
|||
|
2019
|
$
|
1,005
|
|
|
2020
|
—
|
|
|
|
Total
|
$
|
1,005
|
|
70
APYX MEDICAL CORPORATION
Employment contracts, other than for Messrs. Goodwin and Ewers, contain an automatic extension for a period of one year after the initial term unless we provide the executives with appropriate 60 days written notice pursuant to the contracts. The employment agreements provide, among other things, that the executive may be terminated as follows:
|
(a)
|
Upon the death of the executive, in which case the executive’s estate shall be paid the basic annual compensation due the employee pro-rated through the date of death.
|
|
(b)
|
By the resignation of the executive at any time upon at least thirty (30) days prior written notice to Apyx in which case Apyx shall be obligated to pay the employee the basic annual compensation due him pro-rated to the effective date of termination.
|
|
(c)
|
By Apyx, “for cause” if during the term of the employment agreement the employee violates the non-competition provisions of his employment agreement, or is found guilty in a court of law of any crime of moral turpitude in which case the contract would be terminated and provisions for future compensation forfeited.
|
|
(d)
|
By Apyx, without cause, with the majority approval of the Board of Directors, for Mr. Goodwin, Mr. Saron, Mr. Ewers and Mr. Citronowicz at any time upon at least thirty (30) days prior written notice to the executive. In this case Apyx shall be obligated to pay the executive compensation in effect at such time, including all bonuses, accrued or prorated and expenses up to the date of termination. Thereafter for Messrs. Saron and Citronowicz, Apyx shall pay the executive three times the salary in effect at the time of termination payable in one lump sum.
|
|
(e)
|
If Apyx fails to meet its obligations to the executive on a timely basis, or if there is a change in the control of Apyx, the executive may elect to terminate his employment agreement. Upon any such termination or breach of any of its obligations under the employment agreement, Apyx shall pay Mr. Saron and Mr. Citronowicz a lump sum severance equal to three times the annual salary and bonus in effect the month preceding such termination or breach as well as any other sums which may be due under the terms of the employment agreement up to the date of termination. Mr. Goodwin and Mr. Ewers shall be paid two times their annual salary and bonus in effect the month preceding such termination or breach as well as any other sums which may be due under the terms of their respective employment agreement up to the date of termination.
|
There are no other employment contracts that have non-cancelable terms in excess of one year.
Outstanding Equity Awards
The following table presents information with respect to each unexercised stock option held by our Executive Officers as of
December 31, 2018
:
|
Name
|
# of Securities
Underlying
Unexercised
Options
(# Exercisable)
|
# of Securities Underlying Unexercised Options
(# Unexercisable)
|
Weighted Average Option
Exercise Price
($/Sh)
|
Option Expiration
Range After Grant Date
|
||||||||||
|
Charles D. Goodwin
|
|
|
|
|
|
|
12/15/2027
|
|||||||
|
Jay D. Ewers (1)
|
2,000
|
|
24,000
|
|
$
|
5.07
|
|
6/30/2024
|
-
|
1/4/2028
|
||||
|
J. Robert Saron (2)
|
30,000
|
|
—
|
|
|
|
7/12/2022
|
-
|
5/1/2027
|
|||||
|
Moshe Citronowicz
|
35,000
|
|
107,000
|
|
|
|
7/12/2022
|
-
|
5/1/2027
|
|||||
|
Craig Swandal
|
||||||||||||||
71
APYX MEDICAL CORPORATION
***
These columns represent the grant date fair value of the awards as calculated in accordance with FASB ASC 718 (Stock Compensation).
|
(1)
|
Mr. Ewers resigned as an officer of the company effective December 31, 2018.
|
|
(2)
|
Mr. Saron resigned as an officer and a director of on August 30, 2018 in connection with the divestiture of our Core business segment
|
In 2018, our Board of Directors consisted of Charles D. Goodwin, J. Robert Saron, Andrew Makrides, John Andres, Lawrence J. Waldman, Michael Geraghty, and Craig Swandal. Mr. Gershon resigned from all of his positions with the Company effective December 15, 2017. Mr. Swandal became a member of the Board on March 2018.
In 2003, the Board of Directors adopted and stockholders approved Apyx’s 2003 Executive and Employee Stock Option Plan covering a total of 1,200,000 shares of common stock issuable upon exercise of options to be granted under the Plan.
On October 30, 2007, stockholders approved and the Board of Directors adopted an amendment to the 2003 Executive and Employee Stock Option Plan to increase the maximum aggregate number of shares of common stock reserved for issuance under the 2003 Plan from 1.2 million shares (already reserved against outstanding options) to 1.7 million shares, or an increase of 500,000 shares of common stock for future issuance pursuant to the terms of the plan. Except for the increase in the number of shares covered by the plan, the plan remains otherwise unchanged from its present status. In 2011, the Board of Directors granted 25,000 options to purchase a like number of shares of common stock.
In July of 2012, the stockholders approved the 2012 Executive and Employee Stock Option Plan covering a total of 750,000 shares of common stock issuable upon exercise of options to be granted under the plan. At December 31, 2018 approximately 70,000 remain to be issued in this plan.
In July of 2015, the stockholders approved the 2015 Executive and Employee Stock Option Plan covering a total of 2,000,000 shares of common stock issuable upon exercise of options to be granted under the plan. At December 31, 2018, approximately 326,000 remain to be issued in this plan.
In August of 2017, the stockholders approved the 2017 Executive and Employee Stock Option Plan covering a total of 3,000,000 shares of common stock issuable upon exercise of options to be granted under the plan. At December 31, 2018, approximately 1,783,000 remain to be issued in this plan.
There have been no changes in the pricing of any options previously or currently awarded.
Compensation Committee Interlocks and Insider Participation
The Compensation Committee of the Board of Directors is responsible for determining the compensation of executive officers of the Company, as well as compensation awarded pursuant to the Company’s equity incentive plans.
In 2018, our Compensation Committee consisted of three independent members of the Board of Directors, Michael Geraghty (Chairman), John Andres and Lawrence J. Waldman.
No member of the Compensation Committee is or has been an officer or employee of the Company or any of its subsidiaries. In addition, no member of the Compensation Committee had any relationships with the Company or any other entity that require disclosure under the proxy rules and regulations promulgated by the SEC.
COMPENSATION COMMITTEE REPORT
Our Compensation Committee has reviewed and discussed the Compensation Discussion and Analysis contained in this Annual Report on Form 10-K with management. Based on our Compensation Committee’s review of and the discussions with management with respect to the Compensation Discussion and Analysis, our Compensation Committee recommended to the Board of Directors that the Compensation Discussion and Analysis be included in our Proxy Statement and in this Annual Report on Form 10-K for
72
APYX MEDICAL CORPORATION
the fiscal year ended December 31, 2018 for filing with the SEC. During the majority of 2018, our Compensation Committee consisted of three independent members of the Board of Directors, Michael Geraghty, who served as Chairman, John Andres and Lawrence J. Waldman.
73
APYX MEDICAL CORPORATION
ITEM 12. Security Ownership of Certain Beneficial Owners and Management and Related Stockholder Matters
Equity Compensation Plan Information
See “ITEM 5. Market for Registrant’s Common Equity and Related Stockholder Matters”.
Security Ownership of Certain Beneficial Owners
The following table sets forth certain information as of
March 11, 2019
, with respect to the beneficial ownership of the Company’s common stock by its executive officers, directors, all persons known by the Company to be the beneficial owners of more than 5% of its outstanding shares and by all officers and directors as a group.
|
Number of Shares
|
|||||||||||
|
Name and Address
|
Title
|
Owned (i)
|
Nature of Ownership
|
Percentage of Ownership (i)
|
|||||||
|
William Weeks Vanderfelt
|
Common
|
2,850,000
|
|
Beneficial
|
8.4
|
%
|
|||||
|
Coralis 44, Azzuri Village 44
|
|||||||||||
|
Roches Noires, 31201 Mauritius
|
|||||||||||
|
RTW Investments
|
Common
|
2,391,898
|
|
Beneficial
|
7.0
|
%
|
|||||
|
250 West 55th St. 16th Floor
|
|||||||||||
|
New York, NY 10019
|
|||||||||||
|
Archon Capital Management, LLC
|
Common
|
1,979,710
|
|
Beneficial
|
5.8
|
%
|
|||||
|
1100 19th Avenue E
|
|||||||||||
|
Seattle, WA 98122
|
|||||||||||
|
Andrew Makrides
|
Common
|
650,972
|
|
(ii)
|
Beneficial
|
1.9
|
%
|
||||
|
5115 Ulmerton Rd.
|
|||||||||||
|
Clearwater, FL 33760
|
|||||||||||
|
Charles D. Goodwin II
|
Common
|
500,000
|
|
(iii)
|
Beneficial
|
1.4
|
%
|
||||
|
5115 Ulmerton Rd.
|
|||||||||||
|
Clearwater, FL 33760
|
|||||||||||
|
|
|||||||||||
|
Moshe Citronowicz
|
Common
|
499,254
|
|
(iv)
|
Beneficial
|
1.5
|
%
|
||||
|
5115 Ulmerton Rd.
|
|||||||||||
|
Clearwater, FL 33760
|
|||||||||||
|
|
|||||||||||
|
Lawrence Waldman
|
Common
|
125,000
|
|
(v)
|
Beneficial
|
0.4
|
%
|
||||
|
5115 Ulmerton Rd.
|
|||||||||||
|
Clearwater, FL 33760
|
|||||||||||
|
Todd Hornsby
|
Common
|
88,750
|
|
(vi)
|
Beneficial
|
0.3
|
%
|
||||
|
5115 Ulmerton Rd.
|
|||||||||||
|
Clearwater, FL 33760
|
|||||||||||
74
APYX MEDICAL CORPORATION
|
Michael E. Geraghty
|
Common
|
74,000
|
|
(vii)
|
Beneficial
|
0.2
|
%
|
||||
|
5115 Ulmerton Rd.
|
|||||||||||
|
Clearwater, FL 33760
|
|||||||||||
|
Craig Swandal
|
Common
|
20,000
|
|
(viii)
|
Beneficial
|
0.1
|
%
|
||||
|
5115 Ulmerton Rd.
|
|||||||||||
|
Clearwater, FL 33760
|
|||||||||||
|
John Andres
|
Common
|
46,500
|
|
(ix)
|
Beneficial
|
0.1
|
%
|
||||
|
5115 Ulmerton Rd.
|
|
|
|
|
|
|
|
||||
|
Clearwater, FL 33760
|
|||||||||||
|
|
|||||||||||
|
Tara Semb
|
Common
|
—
|
|
(x)
|
Beneficial
|
—
|
%
|
||||
|
5115 Ulmerton Rd.
|
|
|
|
|
|
|
|
||||
|
Clearwater, FL 33760
|
|||||||||||
|
Officers and Directors as a group (8 people)
|
2,004,476
|
|
(xi)
|
5.7
|
%
|
||||||
(i) Based on 34,037,819 outstanding shares of Common Stock and 2,129,581 exercisable outstanding options to acquire a like number of shares of Common Stock as of March 11, 2019, of which officers and directors owned a total of 971,000 vested options and 1,033,476 shares at March 11, 2019. We have calculated the percentage on the basis of the amount of outstanding securities plus, for each person or group, any securities that person or group has current or future right to acquire pursuant to options, warrants, conversion privileges or other rights based on the 13G and 13D SEC filings.
(ii) Includes 608,972 shares and 42,000 vested options out of a total of 54,000 ten year options owned by Mr. Makrides to purchase shares of Common Stock of the Company at an exercise price between $2.54 and $5.30. Options vest equally over a one year period.
(iii) Includes 0 shares and 500,000 vested options out of a total of 1,236,000 ten year options owned by Mr. Goodwin to purchase shares of Common Stock of the Company at an exercise price between $2.99 and $7.91. Options vest equally over a two or three year period.
(iv) Includes 406,504 shares and 92,750 vested options out of a total of 209,000 ten year options owned by Mr. Citronowicz to purchase shares of Common Stock of the Company at an exercise price ranging from $1.80 to $7.91. Options vest equally over a three or four year period.
(v) Includes 0 shares and 125,000 vested options out of a total of 149,000 ten year options owned by Mr. Waldman to purchase shares of Common Stock of the Company at an exercise price ranging from $1.88 to $5.30. Options vest in one year.
(vi) Includes 0 shares and 88,700 vested options out of a total of 256,000 ten year options owned by Mr. Hornsby to purchase shares of Common Stock of the Company at an exercise price ranging from $1.77 to $7.91. Options vest equally over a three to four year period.
(vii) Includes 0 shares and 74,000 vested options out of a total of 98,000 ten year options owned by Mr. Geraghty to purchase shares of Common Stock of the Company at an exercise price ranging from $1.88 to $5.30 Options vest over a one year period.
(viii) Includes 18,0000 shares and 2,000 vested options out of a total of 26,000 ten year options owned by Mr. Swandal to purchase shares of Common Stock of the Company at an exercise price of $2.37 to $5.30. Options vest equally over a three year period.
(ix) Includes 0 shares and 46,500 vested options out of a total of 70,500 ten year options owned by Mr. Andres to purchase shares of Common Stock of the Company at an exercise price ranging from $1.88 to $5.30. Options vest equally over a one year period.
(x) Includes 0 shares and 0 vested options out of a total of 65,000 ten year options owned by Ms. Semb to purchase shares of Common Stock of the Company at an exercise price of $7.91. Options vest equally over a one year period.
(xi) Includes 971,000 vested options out of a total of 2,163,500 ten year outstanding options and 1,033,476 shares owned by all Executive Officers and directors as a group. The last date the options can be exercised is January 4, 2029.
Section 16(a) Beneficial Ownership Reporting Compliance
Section 16(a) of the Securities Exchange Act of 1934 requires our officers and directors and persons who own more than ten percent of a registered class of our equity securities, to file reports of ownership and changes in ownership with the Securities and Exchange Commission. Officers, directors and greater than ten-percent shareholders (the “Reporting Persons”) are required by SEC regulation to furnish us with copies of all Section 16(a) forms they file.
75
APYX MEDICAL CORPORATION
To the Company’s knowledge, based solely on its review of the copies of such reports received or written representations from certain Reporting Persons that no other reports were required, the Company believes that during its fiscal year ended
December 31, 2018
all filing requirements applicable to the Reporting Persons were timely met, with the exception of Jay D. Ewers who failed to timely file a Form 4 showing 1 transaction, Craig A. Swandal who failed to timely file his Form 3 and a Form 4 showing 1 transaction, John C. Andres who failed to timely file a Form 4 showing 1 transaction, Michael Geraghty who failed to timely file a Form 4 showing 1 transaction, Andrew Makrides who failed to timely file a Form 4 showing 1 transaction, and Lawrence Waldman who failed to timely file a Form 4 showing 1 transaction.
76
APYX MEDICAL CORPORATION
ITEM 13. Certain Relationships and Related Transactions and Director Independence
Certain Relationships and Related Transactions
Several relatives of Nikolay Shilev, Apyx Bulgaria’s Managing Director, are considered related parties. Teodora Shileva, Mr. Shilev’s spouse, is an employee of the Company working in the Accounting department. Antoaneta Dimitrova Shileva-Toromanova, Mr. Shilev’s sister, is the Manager of Production and Human Resources. Svetoslav Shilev, Mr. Shilev’s son, is an Engineer in the Quality Assurance department.
Independent Board Members
The Board currently has four independent members, John Andres, Michael Geraghty, Lawrence J. Waldman and Craig Swandal who meet the existing independence requirements of the The NASDAQ Stock Market LLC and the Securities and Exchange Commission.
ITEM 14. Principal Accountant Fees and Services
The following table sets forth the aggregate fees billed to us by our current accountants, Frazier & Deeter, LLC:
|
Year Ended December 31,
|
|||||||
|
(In thousands)
|
2018
|
2017
|
|||||
|
Audit fees
(1)
|
$
|
443
|
|
$
|
173
|
|
|
|
Audit related fees
(2)
|
112
|
|
3
|
|
|||
|
Tax fees
(3)
|
—
|
|
—
|
|
|||
|
All other fees
(4)
|
—
|
|
—
|
|
|||
|
Total fees billed
|
$
|
555
|
|
$
|
176
|
|
|
|
(1)
|
Audit fees consist of fees billed for professional services rendered for the audit of Apyx's annual financial statements and reviews of its interim consolidated financial statements included in quarterly reports and other services related to statutory and regulatory filings or engagements.
|
|
(2)
|
Audit related fees consist of fees billed for assurance and related services that are reasonably related to the performance of the audit or reviews of Apyx's consolidated financial statements and are not reported under “Audit Fees”.
|
|
(3)
|
Tax fees consist of fees billed for professional services rendered for tax compliance and tax advice (domestic and international). These services include assistance regarding federal, state and international tax compliance, acquisitions and international tax planning.
|
|
(4)
|
All other fees consist of fees for products and services other than the services reported above.
|
77
APYX MEDICAL CORPORATION
PART IV
ITEM 15. Exhibits and Financial Statement Schedules
|
(a)(1)
|
LISTING OF FINANCIAL STATEMENTS
|
Page
|
||
|
The following consolidated financial statements of the Company are included in Item 8 of this Report:
|
||||
|
(a)(2)
|
FINANCIAL STATEMENT SCHEDULES
|
|||
|
All financial statement schedules have been omitted, since the required information is not applicable or is not present in amounts sufficient to require submission of the schedule, or because the information required is included in the consolidated financial statements and notes thereto included in this Report.
|
||||
(a)(3) EXHIBITS
78
APYX MEDICAL CORPORATION
|
2.1
|
Asset Purchase Agreement, dated as of July 9, 2018
(Incorporated by reference to the Registrant's Current Report on Form 8-K filed on July 9, 2018)
|
|
|
3.1
|
||
|
3.2
|
||
|
3.3
|
Certificate of Amendment of the Certificate of Incorporation of the Registrant
(Incorporated by reference to the Registrant's Quarterly Report on Form 10-Q filed on November 3, 2017)
|
|
|
3.3
|
Certificate of Elimination of the Series A 6% Convertible Preferred Stock and Series B Convertible Preferred Stock
(Incorporated by reference to the Registrant's Current Report on Form 8-K filed on May 3, 2018)
|
|
|
3.4
|
Certificate of Amendment of the Certificate of Incorporation of the Registrant
(Incorporated by reference to the Registrant's Current Report on Form 8-K filed on December 28, 2018)
|
|
|
4.1
|
Indenture
(Incorporated by reference to the Registrant's Registration Statement on Form S-3 filed on May 4, 2018)
|
|
|
10.1
|
||
|
10.2
|
||
|
10.3
|
||
|
10.4
|
||
|
10.5
|
||
|
10.6
|
||
|
10.7
|
Separation Agreement, dated December 15, 2017, by and between the Company and Robert L. Gershon
|
|
|
10.8
|
Charles D. Goodwin II Employment Agreement, dated December 15, 2017
|
|
|
10.9
|
J. Robert Saran Separation Agreement and General Release, dated August 30, 2018
(Incorporated by the reference to the Registrant's Current Report on Form 8-K filed on August 30, 2018)
|
|
|
10.10*
|
||
|
10.11*
|
||
|
14.1
|
||
|
21.1*
|
||
|
23.1*
|
||
|
31.1*
|
||
|
31.2*
|
||
|
32.1*
|
||
|
32.2*
|
||
|
101.INS**
|
XBRL Instance Document
|
|
|
101.SCH**
|
XBRL Taxonomy Extension Schema Document
|
|
|
101.CAL**
|
XBRL Taxonomy Extension Calculation Linkbase Document
|
|
|
101.DEF**
|
XBRL Taxonomy Extension Definition Linkbase Document
|
|
|
101.LAB**
|
XBRL Taxonomy Extension Label Linkbase Document
|
|
|
101.PRE**
|
XBRL Taxonomy Extension Label Presentation Document
|
|
* Filed herewith.
79
APYX MEDICAL CORPORATION
** XBRL (Extensible Business Reporting Language) information is furnished and not filed or a part of registration statement or prospectus for purposes of Sections 11 or 12 of the Securities Act of 1933, as amended is deemed not filed for purposes of Section 18 of the Securities Exchange Act of 1934, as amended and otherwise is not subject to liability under these sections.
80
APYX MEDICAL CORPORATION
SIGNATURES
Pursuant to the requirements of Section 13 or 15(d) of the Securities Exchange Act of 1934, the Registrant has duly caused this report to be signed on its behalf by the undersigned, thereunto duly authorized, in Clearwater, Florida on
March 13, 2019
.
|
Apyx Medical Corporation
|
|||
|
By:
|
/s/ Charles D. Goodwin II
|
||
|
Charles D. Goodwin II
|
|||
|
President, Chief Executive Officer and Director
|
|||
|
(Principal Executive Officer)
|
|||
|
By:
|
/s/ Tara Semb
|
||
|
Tara Semb
|
|||
|
Chief Financial Officer,
|
|||
|
Treasurer and Secretary
|
|||
|
(Principal Financial Officer)
|
|||
Pursuant to the requirements of the Securities Exchange Act of 1934, this report has been signed below by the following persons on behalf of the registrant and in the capacities and on the dates indicated.
|
Name
|
Title
|
Date
|
||
|
Directors:
|
||||
|
/s/ ANDREW MAKRIDES
|
Chairman of the Board
|
March 13, 2019
|
||
|
Andrew Makrides
|
||||
|
/s/ CHARLES D. GOODWIN II
|
Chief Executive Officer and Director
|
March 13, 2019
|
||
|
Charles D. Goodwin II
|
||||
|
/s/ TARA SEMB
|
Chief Financial Officer, Treasurer and Secretary
|
March 13, 2019
|
||
|
Tara Semb
|
||||
|
/s/ JOHN ANDRES
|
Vice Chairman of the Board
|
March 13, 2019
|
||
|
John Andres
|
||||
|
/s/ LAWRENCE J. WALDMAN
|
Director
|
March 13, 2019
|
||
|
Lawrence J. Waldman
|
||||
|
/s/ MICHAEL GERAGHTY
|
Director
|
March 13, 2019
|
||
|
Michael Geraghty
|
||||
|
/s/ CRAIG SWANDAL
|
Director
|
March 13, 2019
|
||
|
Craig Swandal
|
||||
81
TABLE OF CONTENTS
Part IItem 1. BusinessItem 1A. Risk FactorsItem 1B. Unresolved Staff CommentsItem 2. PropertiesItem 3. Legal ProceedingsItem 4. Mine Safety DisclosuresPart IIItem 5. Market For Registrant S Common Equity, Related Stockholder Matters and Issuer Purchases Of Equity SecuritiesItem 6. Selected Financial DataItem 7. Management S Discussion and Analysis Of Financial Condition and Results Of OperationsItem 7A. Quantitative and Qualitative Disclosures About Market RiskItem 8. Financial Statements and Supplementary DataNote 1. Description Of BusinessNote 2. Significant Accounting PoliciesNote 3. Disposition Of The Core BusinessNote 4. Trade Accounts ReceivableNote 5. Property, Plant and EquipmentNote 6. Intangible AssetsNote 7. Earnings Per ShareNote 8. Recent Accounting PronouncementsNote 9. Financial InstrumentsNote 10. Long Term DebtNote 11. Income TaxesNote 12. Retirement PlanNote 13. Related Party TransactionsNote 14. Other Commitments and ContingenciesNote 15. Stock OptionsNote 16. Geographic and Segment InformationNote 17. Supplemental Unaudited Quarterly Financial Information Of Continuing OperationsItem 9. Changes in and Disagreements with Accountants on Accounting and Financial DisclosureItem 9A. Controls and ProceduresItem 9B. Other InformationPart IIIItem 10. Directors, Executive Officers and Corporate GovernanceItem 11. Executive Compensation Discussion and AnalysisItem 12. Security Ownership Of Certain Beneficial Owners and Management and Related Stockholder MattersItem 13. Certain Relationships and Related Transactions and Director IndependenceItem 14. Principal Accountant Fees and ServicesPart IVItem 15. Exhibits and Financial Statement Schedules