ALEXANDRIA REAL ESTATE EQUITIES, INC.
10-Ks and 10-Qs
|
|
|
|
|
|
|
|
|
|
|
|
|
|
|
|
|
|
|
|
|
|
|
|
|
|
|
|
|
|
|
|
|
|
|
|
|
|
|
|
|
|
|
|
|
|
|
|
|
|
|
|
|
|
|
|
UNITED STATES
SECURITIES AND EXCHANGE COMMISSION
Washington, D.C. 20549
FORM 10-Q
(Mark One)
|
ý
|
QUARTERLY REPORT PURSUANT TO SECTION 13 OR 15(d) OF THE SECURITIES EXCHANGE ACT OF 1934
|
For the quarterly period ended
September 30, 2015
OR
|
o
|
TRANSITION REPORT PURSUANT TO SECTION 13 OR 15(d) OF THE SECURITIES EXCHANGE ACT OF 1934
|
For the transition period from ____________ to ____________
Commission file number 1-12993
ALEXANDRIA REAL ESTATE EQUITIES, INC.
(Exact name of registrant as specified in its charter)
|
Maryland
|
|
95-4502084
|
|
(State or other jurisdiction of
incorporation or organization)
|
|
(I.R.S. Employer Identification Number)
|
385 East Colorado Boulevard, Suite 299, Pasadena, California 91101
(Address of principal executive offices) (Zip code)
(626) 578-0777
(Registrant’s telephone number, including area code)
N/A
(Former name, former address and former fiscal year, if changed since last report)
Indicate by check mark whether the registrant (1) has filed all reports required to be filed by Section 13 or 15(d) of the Securities Exchange Act of 1934 during the preceding 12 months (or for such shorter period that the registrant was required to file such reports) and (2) has been subject to such filing requirements for the past 90 days. Yes
ý
No
o
Indicate by check mark whether the registrant has submitted electronically and posted on its corporate Web site, if any, every Interactive Data File required to be submitted and posted pursuant to Rule 405 of Regulation S-T during the preceding 12 months (or for such shorter period that the registrant was required to submit and post such files). Yes
ý
No
o
Indicate by check mark whether the registrant is a large accelerated filer, an accelerated filer, a non-accelerated filer, or a smaller reporting company. See the definitions of “large accelerated filer,” “accelerated filer,” and “smaller reporting company” in Rule 12b-2 of the Exchange Act.
|
Large accelerated filer
ý
|
Accelerated filer
o
|
|
Non-accelerated filer
o
(Do not check if a smaller reporting company)
|
Smaller reporting company
o
|
Indicate by check mark whether the registrant is a shell company (as defined in Rule 12b-2 of the Exchange Act). Yes
o
No
ý
As of
October 16, 2015
,
72,498,946
shares of common stock, par value $.01 per share, were outstanding.
TABLE OF CONTENTS
|
|
|
Page
|
|
|
|
|
|
FINANCIAL STATEMENTS (UNAUDITED)
|
||
|
|
||
|
|
Consolidated Balance Sheets as of September 30, 2015 and December 31, 2014
|
|
|
|
||
|
|
Consolidated Statements of Income for the Three and Nine Months Ended September 30, 2015 and 2014
|
|
|
|
||
|
|
Consolidated Statements of Comprehensive Income for the Three and Nine Months Ended
September 30, 2015 and 2014
|
|
|
|
||
|
|
Consolidated Statement of Changes in Stockholders’ Equity and Noncontrolling Interests for the Nine Months Ended September 30, 2015
|
|
|
|
||
|
|
Consolidated Statements of Cash Flows for the Nine Months Ended September 30, 2015 and 2014
|
|
|
|
||
|
|
Notes to Consolidated Financial Statements
|
|
|
|
||
|
|
|
|
|
|
|
|
|
|
|
|
|
|
|
|
|
|
|
|
|
|
|
|
i
GLOSSARY
The following abbreviations or acronyms that may be used in this document shall have the adjacent meanings set forth below:
|
ABR
|
Annualized Base Rent
|
|
AFFO
|
Adjusted Funds from Operations
|
|
CIP
|
Construction in Progress
|
|
EBITDA
|
Earnings before Interest, Taxes, Depreciation, and Amortization
|
|
EPS
|
Earnings per Share
|
|
FASB
|
Financial Accounting Standards Board
|
|
FFO
|
Funds from Operations
|
|
GAAP
|
U.S. Generally Accepted Accounting Principles
|
|
HVAC
|
Heating, Ventilation, and Air Conditioning
|
|
LEED
®
|
Leadership in Energy and Environmental Design
|
|
LIBOR
|
London Interbank Offered Rate
|
|
NAREIT
|
National Association of Real Estate Investment Trusts
|
|
NAV
|
Net Asset Value
|
|
NOI
|
Net Operating Income
|
|
NYSE
|
New York Stock Exchange
|
|
REIT
|
Real Estate Investment Trust
|
|
RSF
|
Rentable Square Feet/Foot
|
|
SEC
|
Securities and Exchange Commission
|
|
SoMa
|
South of Market (submarket of the San Francisco market)
|
|
U.S.
|
United States
|
|
VIE
|
Variable Interest Entity
|
ii
Consolidated Balance Sheets
(In thousands)
(Unaudited)
|
September 30, 2015
|
December 31, 2014
|
||||||
|
Assets
|
|||||||
|
Investments in real estate
|
$
|
7,654,209
|
|
$
|
7,226,016
|
|
|
|
Cash and cash equivalents
|
76,383
|
|
86,011
|
|
|||
|
Restricted cash
|
36,993
|
|
26,884
|
|
|||
|
Tenant receivables
|
10,124
|
|
10,548
|
|
|||
|
Deferred rent
|
267,954
|
|
234,124
|
|
|||
|
Deferred leasing and financing costs
|
222,343
|
|
201,798
|
|
|||
|
Investments
|
330,570
|
|
236,389
|
|
|||
|
Other assets
|
138,768
|
|
114,266
|
|
|||
|
Total assets
|
$
|
8,737,344
|
|
$
|
8,136,036
|
|
|
|
Liabilities, Noncontrolling Interests, and Equity
|
|||||||
|
Secured notes payable
|
$
|
773,619
|
|
$
|
652,209
|
|
|
|
Unsecured senior notes payable
|
1,747,613
|
|
1,747,370
|
|
|||
|
Unsecured senior line of credit
|
843,000
|
|
304,000
|
|
|||
|
Unsecured senior bank term loans
|
950,000
|
|
975,000
|
|
|||
|
Accounts payable, accrued expenses, and tenant security deposits
|
586,594
|
|
489,085
|
|
|||
|
Dividends payable
|
61,340
|
|
58,814
|
|
|||
|
Total liabilities
|
4,962,166
|
|
4,226,478
|
|
|||
|
Commitments and contingencies
|
|
|
|
|
|||
|
Redeemable noncontrolling interests
|
14,218
|
|
14,315
|
|
|||
|
Alexandria Real Estate Equities, Inc.’s stockholders’ equity:
|
|||||||
|
Series D cumulative convertible preferred stock
|
237,163
|
|
237,163
|
|
|||
|
Series E cumulative redeemable preferred stock
|
130,000
|
|
130,000
|
|
|||
|
Common stock
|
718
|
|
715
|
|
|||
|
Additional paid-in capital
|
3,356,043
|
|
3,461,189
|
|
|||
|
Accumulated other comprehensive income (loss)
|
35,238
|
|
(628
|
)
|
|||
|
Alexandria’s stockholders’ equity
|
3,759,162
|
|
3,828,439
|
|
|||
|
Noncontrolling interests
|
1,798
|
|
66,804
|
|
|||
|
Total equity
|
3,760,960
|
|
3,895,243
|
|
|||
|
Total liabilities, noncontrolling interests, and equity
|
$
|
8,737,344
|
|
$
|
8,136,036
|
|
|
The accompanying notes are an integral part of these consolidated financial statements.
1
Alexandria Real Estate Equities, Inc.
(In thousands, except per share amounts)
(Unaudited)
|
Three Months Ended September 30,
|
Nine Months Ended September 30,
|
||||||||||||||
|
2015
|
2014
|
2015
|
2014
|
||||||||||||
|
Revenues:
|
|||||||||||||||
|
Rental
|
$
|
155,311
|
|
$
|
137,718
|
|
$
|
450,724
|
|
$
|
403,280
|
|
|||
|
Tenant recoveries
|
56,119
|
|
45,572
|
|
154,107
|
|
128,198
|
|
|||||||
|
Other income
|
7,180
|
|
2,325
|
|
14,688
|
|
6,725
|
|
|||||||
|
Total revenues
|
218,610
|
|
185,615
|
|
619,519
|
|
538,203
|
|
|||||||
|
Expenses:
|
|||||||||||||||
|
Rental operations
|
68,846
|
|
57,423
|
|
192,319
|
|
162,283
|
|
|||||||
|
General and administrative
|
15,143
|
|
12,609
|
|
44,519
|
|
39,669
|
|
|||||||
|
Interest
|
27,679
|
|
20,555
|
|
77,583
|
|
57,111
|
|
|||||||
|
Depreciation and amortization
|
67,953
|
|
58,388
|
|
189,044
|
|
166,123
|
|
|||||||
|
Impairment of real estate
|
—
|
|
—
|
|
14,510
|
|
—
|
|
|||||||
|
Loss on early extinguishment of debt
|
—
|
|
525
|
|
189
|
|
525
|
|
|||||||
|
Total expenses
|
179,621
|
|
149,500
|
|
518,164
|
|
425,711
|
|
|||||||
|
Equity in earnings of unconsolidated joint ventures
|
710
|
|
—
|
|
1,825
|
|
—
|
|
|||||||
|
Income from continuing operations
|
39,699
|
|
36,115
|
|
103,180
|
|
112,492
|
|
|||||||
|
Loss from discontinued operations
|
—
|
|
(180
|
)
|
(43
|
)
|
(489
|
)
|
|||||||
|
Gain on sales of real estate – land parcels
|
—
|
|
8
|
|
—
|
|
805
|
|
|||||||
|
Net income
|
39,699
|
|
35,943
|
|
103,137
|
|
112,808
|
|
|||||||
|
Dividends on preferred stock
|
(6,247
|
)
|
(6,471
|
)
|
(18,740
|
)
|
(19,414
|
)
|
|||||||
|
Net income attributable to noncontrolling interests
|
(170
|
)
|
(1,340
|
)
|
(925
|
)
|
(3,842
|
)
|
|||||||
|
Net income attributable to unvested restricted stock awards
|
(623
|
)
|
(506
|
)
|
(1,736
|
)
|
(1,285
|
)
|
|||||||
|
Net income attributable to Alexandria’s common stockholders
|
$
|
32,659
|
|
$
|
27,626
|
|
$
|
81,736
|
|
$
|
88,267
|
|
|||
|
EPS attributable to Alexandria’s common stockholders – basic and diluted:
|
|||||||||||||||
|
Continuing operations
|
$
|
0.46
|
|
$
|
0.39
|
|
$
|
1.14
|
|
$
|
1.25
|
|
|||
|
Discontinued operations
|
—
|
|
—
|
|
—
|
|
(0.01
|
)
|
|||||||
|
EPS – basic and diluted
|
$
|
0.46
|
|
$
|
0.39
|
|
$
|
1.14
|
|
$
|
1.24
|
|
|||
|
Dividends declared per share of common stock
|
$
|
0.77
|
|
$
|
0.72
|
|
$
|
2.28
|
|
$
|
2.14
|
|
|||
The accompanying notes are an integral part of these consolidated financial statements.
2
Alexandria Real Estate Equities, Inc.
Consolidated Statements of Comprehensive Income
(In thousands)
(Unaudited)
|
Three Months Ended September 30,
|
Nine Months Ended September 30,
|
||||||||||||||
|
2015
|
2014
|
2015
|
2014
|
||||||||||||
|
Net income
|
$
|
39,699
|
|
$
|
35,943
|
|
$
|
103,137
|
|
$
|
112,808
|
|
|||
|
Other comprehensive (loss) income:
|
|||||||||||||||
|
Unrealized (losses) gains on marketable equity securities:
|
|||||||||||||||
|
Unrealized holding (losses) gains arising during the period
|
(29,832
|
)
|
(2,454
|
)
|
54,004
|
|
13,591
|
|
|||||||
|
Reclassification adjustment for (gains) losses included in net income
|
(4,968
|
)
|
111
|
|
(2,503
|
)
|
517
|
|
|||||||
|
Unrealized (losses) gains on marketable equity securities, net
|
(34,800
|
)
|
(2,343
|
)
|
51,501
|
|
14,108
|
|
|||||||
|
Unrealized (losses) gains on interest rate swap agreements:
|
|||||||||||||||
|
Unrealized interest rate swap (losses) gains arising during the period
|
(5,474
|
)
|
1,206
|
|
(9,712
|
)
|
(2,708
|
)
|
|||||||
|
Reclassification adjustment for amortization of losses to interest expense included in net income
|
727
|
|
1,129
|
|
1,942
|
|
5,742
|
|
|||||||
|
Unrealized (losses) gains on interest rate swap agreements, net
|
(4,747
|
)
|
2,335
|
|
(7,770
|
)
|
3,034
|
|
|||||||
|
Unrealized losses on foreign currency translation:
|
|||||||||||||||
|
Unrealized foreign currency translation losses arising during the period
|
(9,294
|
)
|
(12,259
|
)
|
(17,072
|
)
|
(9,450
|
)
|
|||||||
|
Reclassification adjustment for (gains) losses included in net income
|
—
|
|
(199
|
)
|
9,236
|
|
(199
|
)
|
|||||||
|
Unrealized losses on foreign currency translation, net
|
(9,294
|
)
|
(12,458
|
)
|
(7,836
|
)
|
(9,649
|
)
|
|||||||
|
Total other comprehensive (loss) income
|
(48,841
|
)
|
(12,466
|
)
|
35,895
|
|
7,493
|
|
|||||||
|
Comprehensive (loss) income
|
(9,142
|
)
|
23,477
|
|
139,032
|
|
120,301
|
|
|||||||
|
Less: comprehensive income attributable to noncontrolling interests
|
(71
|
)
|
(1,340
|
)
|
(954
|
)
|
(3,842
|
)
|
|||||||
|
Comprehensive (loss) income attributable to Alexandria’s common stockholders
|
$
|
(9,213
|
)
|
$
|
22,137
|
|
$
|
138,078
|
|
$
|
116,459
|
|
|||
The accompanying notes are an integral part of these consolidated financial statements.
3
Alexandria Real Estate Equities, Inc.
Consolidated Statement of Changes in Stockholders’ Equity and Noncontrolling Interests
(Dollars in thousands)
(Unaudited)
|
Alexandria Real Estate Equities, Inc.’s Stockholders’ Equity
|
|||||||||||||||||||||||||||||||||||||||
|
Series D
Cumulative
Convertible
Preferred
Stock
|
Series E
Cumulative
Redeemable
Preferred
Stock
|
Number of
Common
Shares
|
Common
Stock
|
Additional
Paid-In Capital
|
Retained
Earnings
|
Accumulated Other Comprehensive (Loss) Income
|
Noncontrolling
Interests
|
Total
Equity
|
Redeemable
Noncontrolling
Interests
|
||||||||||||||||||||||||||||||
|
Balance as of December 31, 2014
|
$
|
237,163
|
|
$
|
130,000
|
|
71,463,876
|
|
$
|
715
|
|
$
|
3,461,189
|
|
$
|
—
|
|
$
|
(628
|
)
|
$
|
66,804
|
|
$
|
3,895,243
|
|
$
|
14,315
|
|
||||||||||
|
Net income
|
—
|
|
—
|
|
—
|
|
—
|
|
—
|
|
102,212
|
|
—
|
|
129
|
|
102,341
|
|
796
|
|
|||||||||||||||||||
|
Total other comprehensive income
|
—
|
|
—
|
|
—
|
|
—
|
|
—
|
|
—
|
|
35,866
|
|
29
|
|
35,895
|
|
—
|
|
|||||||||||||||||||
|
Contributions by noncontrolling interests
|
—
|
|
—
|
|
—
|
|
—
|
|
—
|
|
—
|
|
—
|
|
340
|
|
340
|
|
—
|
|
|||||||||||||||||||
|
Distributions to noncontrolling interests
|
—
|
|
—
|
|
—
|
|
—
|
|
—
|
|
—
|
|
—
|
|
—
|
|
—
|
|
(893
|
)
|
|||||||||||||||||||
|
Issuances of common stock
|
—
|
|
—
|
|
56,874
|
|
1
|
|
5,051
|
|
—
|
|
—
|
|
—
|
|
5,052
|
|
—
|
|
|||||||||||||||||||
|
Issuances pursuant to stock plan
|
—
|
|
—
|
|
270,140
|
|
2
|
|
19,600
|
|
—
|
|
—
|
|
—
|
|
19,602
|
|
—
|
|
|||||||||||||||||||
|
Purchase of noncontrolling interest
|
—
|
|
—
|
|
—
|
|
—
|
|
(48,463
|
)
|
—
|
|
—
|
|
(65,504
|
)
|
(113,967
|
)
|
—
|
|
|||||||||||||||||||
|
Dividends declared on common stock
|
—
|
|
—
|
|
—
|
|
—
|
|
—
|
|
(164,806
|
)
|
—
|
|
—
|
|
(164,806
|
)
|
—
|
|
|||||||||||||||||||
|
Dividends declared on preferred stock
|
—
|
|
—
|
|
—
|
|
—
|
|
—
|
|
(18,740
|
)
|
—
|
|
—
|
|
(18,740
|
)
|
—
|
|
|||||||||||||||||||
|
Distributions in excess of earnings
|
—
|
|
—
|
|
—
|
|
—
|
|
(81,334
|
)
|
81,334
|
|
—
|
|
—
|
|
—
|
|
—
|
|
|||||||||||||||||||
|
Balance as of September 30, 2015
|
$
|
237,163
|
|
$
|
130,000
|
|
71,790,890
|
|
$
|
718
|
|
$
|
3,356,043
|
|
$
|
—
|
|
$
|
35,238
|
|
$
|
1,798
|
|
$
|
3,760,960
|
|
$
|
14,218
|
|
||||||||||
The accompanying notes are an integral part of these consolidated financial statements.
4
|
Alexandria Real Estate Equities, Inc.
(In thousands)
(Unaudited)
|
|||||||
|
Nine Months Ended September 30,
|
|||||||
|
2015
|
2014
|
||||||
|
Operating Activities
|
|||||||
|
Net income
|
$
|
103,137
|
|
$
|
112,808
|
|
|
|
Adjustments to reconcile net income to net cash provided by operating activities:
|
|||||||
|
Depreciation and amortization
|
189,044
|
|
166,123
|
|
|||
|
Loss on early extinguishment of debt
|
189
|
|
525
|
|
|||
|
Gain on sales of real estate – land parcels
|
—
|
|
(805
|
)
|
|||
|
Impairment of real estate
|
14,510
|
|
—
|
|
|||
|
Equity in earnings of unconsolidated joint ventures
|
(1,825
|
)
|
—
|
|
|||
|
Distributions of earnings from unconsolidated joint ventures
|
740
|
|
—
|
|
|||
|
Amortization of loan fees
|
8,348
|
|
8,090
|
|
|||
|
Amortization of debt (premiums) discounts
|
(282
|
)
|
100
|
|
|||
|
Amortization of acquired below-market leases
|
(5,121
|
)
|
(2,191
|
)
|
|||
|
Deferred rent
|
(34,421
|
)
|
(35,511
|
)
|
|||
|
Stock compensation expense
|
12,922
|
|
9,372
|
|
|||
|
Investment gains
|
(22,368
|
)
|
(9,481
|
)
|
|||
|
Investment losses
|
11,157
|
|
8,725
|
|
|||
|
Changes in operating assets and liabilities:
|
|||||||
|
Restricted cash
|
24
|
|
—
|
|
|||
|
Tenant receivables
|
380
|
|
(939
|
)
|
|||
|
Deferred leasing costs
|
(47,725
|
)
|
(25,910
|
)
|
|||
|
Other assets
|
(13,721
|
)
|
(12,228
|
)
|
|||
|
Accounts payable, accrued expenses, and tenant security deposits
|
31,423
|
|
36,446
|
|
|||
|
Net cash provided by operating activities
|
246,411
|
|
255,124
|
|
|||
|
Investing Activities
|
|||||||
|
Proceeds from sales of real estate
|
92,455
|
|
28,378
|
|
|||
|
Additions to real estate
|
(362,215
|
)
|
(345,074
|
)
|
|||
|
Purchase of real estate
|
(248,933
|
)
|
(97,785
|
)
|
|||
|
Deposits for investing activities
|
(6,707
|
)
|
(7,292
|
)
|
|||
|
Change in restricted cash related to construction projects
|
—
|
|
6,694
|
|
|||
|
Investment in unconsolidated real estate joint ventures
|
(7,979
|
)
|
(67,525
|
)
|
|||
|
Additions to investments
|
(67,965
|
)
|
(35,484
|
)
|
|||
|
Sales of investments
|
39,590
|
|
13,883
|
|
|||
|
Repayment of notes receivable
|
4,264
|
|
29,866
|
|
|||
|
Net cash used in investing activities
|
$
|
(557,490
|
)
|
$
|
(474,339
|
)
|
|
5
|
Alexandria Real Estate Equities, Inc.
Consolidated Statements of Cash Flows
(In thousands)
(Unaudited)
|
|||||||
|
Nine Months Ended September 30,
|
|||||||
|
2015
|
2014
|
||||||
|
Financing Activities
|
|||||||
|
Borrowings from secured notes payable
|
$
|
47,375
|
|
$
|
108,626
|
|
|
|
Repayments of borrowings from secured notes payable
|
(12,217
|
)
|
(228,909
|
)
|
|||
|
Proceeds from issuance of unsecured senior notes payable
|
—
|
|
698,908
|
|
|||
|
Borrowings from unsecured senior line of credit
|
1,432,000
|
|
890,000
|
|
|||
|
Repayments of borrowings from unsecured senior line of credit
|
(893,000
|
)
|
(952,000
|
)
|
|||
|
Repayments of borrowings from unsecured senior bank term loans
|
(25,000
|
)
|
(125,000
|
)
|
|||
|
Change in restricted cash related to financing activities
|
(4,737
|
)
|
375
|
|
|||
|
Payment of loan fees
|
(4,182
|
)
|
(7,989
|
)
|
|||
|
Proceeds from the issuance of common stock
|
5,052
|
|
—
|
|
|||
|
Dividends on common stock
|
(162,280
|
)
|
(150,540
|
)
|
|||
|
Dividends on preferred stock
|
(18,740
|
)
|
(19,414
|
)
|
|||
|
Contributions by noncontrolling interests
|
340
|
|
19,410
|
|
|||
|
Distributions to and purchases of noncontrolling interests
|
(62,973
|
)
|
(3,487
|
)
|
|||
|
Net cash provided by financing activities
|
301,638
|
|
229,980
|
|
|||
|
Effect of foreign exchange rate changes on cash and cash equivalents
|
(187
|
)
|
(1,438
|
)
|
|||
|
Net (decrease) increase in cash and cash equivalents
|
(9,628
|
)
|
9,327
|
|
|||
|
Cash and cash equivalents as of the beginning of period
|
86,011
|
|
57,696
|
|
|||
|
Cash and cash equivalents as of the end of period
|
$
|
76,383
|
|
$
|
67,023
|
|
|
|
Supplemental Disclosure of Cash Flow Information
|
|||||||
|
Cash paid during the period for interest, net of interest capitalized
|
$
|
64,197
|
|
$
|
33,783
|
|
|
|
Non-Cash Investing Activities
|
|||||||
|
Change in accrued construction
|
$
|
(7,305
|
)
|
$
|
36,235
|
|
|
|
Assumption of secured notes payable in connection with purchase of real estate
|
$
|
(82,000
|
)
|
$
|
(48,329
|
)
|
|
|
Non-Cash Financing Activities
|
|||||||
|
Payable for purchase of noncontrolling interest
|
$
|
(51,887
|
)
|
$
|
—
|
|
|
The accompanying notes are an integral part of these consolidated financial statements.
6
Alexandria Real Estate Equities, Inc.
Notes to Consolidated Financial Statements
(Unaudited)
|
1.
|
Background
|
As used in this quarterly report on Form 10-Q, references to the “Company,” “Alexandria,” “ARE,” “we,” “us,” and “our” refer to Alexandria Real Estate Equities Inc., and its consolidated subsidiaries.
Alexandria Real Estate Equities, Inc. (NYSE:ARE) is a fully integrated, self-administered, and self-managed urban office REIT uniquely focused on collaborative science and technology campuses in AAA innovation cluster locations with a total market capitalization of
$10.8 billion
as of
September 30, 2015
, and an asset base of
31.5 million
square feet, including
19.9 million
RSF of operating properties and development and redevelopment projects under construction, as well as an additional
11.6 million
square feet of near-term and future ground-up development projects. Alexandria pioneered this niche in 1994 and has since established a dominant market presence in key locations, including Greater Boston, San Francisco, New York City, San Diego, Seattle, Maryland, and Research Triangle Park. Alexandria is known for its high-quality and diverse client tenant base. Alexandria has a longstanding and proven track record of developing Class A assets clustered in urban science and technology campuses that provide its innovative client tenants with highly dynamic and collaborative environments that enhance their ability to successfully recruit and retain world-class talent and inspire productivity, efficiency, creativity, and success. We believe these advantages result in higher occupancy levels, longer lease terms, higher rental income, higher returns, and greater long-term asset value. For additional information on Alexandria, please visit www.are.com.
Our asset base (including unconsolidated joint ventures) consisted of the following, as of
September 30, 2015
:
|
Square Feet
|
|||
|
Operating properties
|
16,803,766
|
|
|
|
Development projects under construction
|
2,614,491
|
|
|
|
Redevelopment projects under construction
|
525,482
|
|
|
|
Total operating and development and redevelopment projects under construction
|
19,943,739
|
|
|
|
Near-term value-creation projects (CIP), all in North America
|
1,310,186
|
|
|
|
Future value-creation projects:
|
|||
|
North America
|
3,797,375
|
|
|
|
Asia
|
6,419,707
|
|
|
|
10,217,082
|
|
||
|
Near-term and future value-creation projects
|
11,527,268
|
|
|
|
Total
|
31,471,007
|
|
|
As of
September 30, 2015
:
|
•
|
Investment-grade client tenants represented approximately
53%
of our total annualized base rent;
|
|
•
|
Approximately
96%
of our leases (on an RSF basis) were triple net leases, requiring client tenants to pay substantially all real estate taxes, insurance, utilities, common area, and other operating expenses (including increases thereto) in addition to base rent;
|
|
•
|
Approximately
95%
of our leases (on an RSF basis) contained effective annual rent escalations that were either fixed (generally ranging from
3%
to
3.5%
) or indexed based on a consumer price index or other indices; and
|
|
•
|
Approximately
94%
of our leases (on an RSF basis) provided for the recapture of certain capital expenditures (such as HVAC systems maintenance and/or replacement, roof replacement, and parking lot resurfacing) that we believe would typically be borne by the landlord in traditional office leases.
|
Any references to the number of buildings, square footage, number of leases, occupancy, and any amounts derived from these values in the notes to the consolidated financial statements are unaudited and outside the scope of our independent registered public accounting firm’s review of our interim consolidated financial statements in accordance with the standards of the Public Company Accounting Oversight Board.
7
|
2.
|
Basis of presentation and summary of significant accounting policies
|
We have prepared the accompanying interim consolidated financial statements in accordance with GAAP and in conformity with the rules and regulations of the SEC. In our opinion, the interim consolidated financial statements presented herein reflect all adjustments that are necessary to fairly present the interim consolidated financial statements. The results of operations for the interim period are not necessarily indicative of the results that may be expected for the year ending
December 31, 2015
. These consolidated financial statements should be read in conjunction with the consolidated financial statements and the notes thereto included in our annual report on Form 10-K for the year ended
December 31, 2014
.
Basis of presentation and consolidation
The accompanying consolidated financial statements include the accounts of Alexandria Real Estate Equities, Inc. and its consolidated subsidiaries. All significant intercompany balances and transactions have been eliminated.
In certain circumstances, we may enter into joint venture arrangements with outside partners. On a quarterly basis, we evaluate each joint venture arrangement under the VIE model, and if the entity is determined not to be a VIE, we then evaluate the entity under the voting model to determine if the entity should be consolidated.
Under the VIE model, an entity is determined to be a VIE if it has any of the following characteristics:
|
•
|
The entity does not have sufficient equity to finance its activities without additional subordinated financial support;
|
|
•
|
The equity holders, as a group, lack the characteristics of a controlling financial interest; or
|
|
•
|
The legal entity is established with non-substantive voting rights.
|
If an entity is determined to be a VIE, we evaluate whether we are the primary beneficiary using qualitative analyses. Factors considered include, but are not limited to, the purpose and design of the VIE, risks that the VIE was designed to create and pass through, the form of our ownership interest, our representation on the entity’s governing body, the size and seniority of our investment, our ability to participate in policy-making decisions, and the rights of the other investors to participate in the decision-making process and/or liquidate the venture, if applicable. We consolidate VIEs whenever we determine that we are the primary beneficiary.
If an entity is determined not to be a VIE, we then evaluate such entity under the voting model. Under the voting model, if we are the general partner or managing member, or have a similar role that can direct the operations of the entity, we have a presumption that we control the entity and we should consolidate regardless of our ownership percentage. If we determine that the other equity holders have any one of the following rights, it is assumed that we do not control the entity and therefore should not consolidate the entity: (i) the substantive ability to dissolve the entity or remove us from the lead role of the entity or (ii) substantive rights that allow them to participate in the activities that most significantly impact the entity’s economic performance.
As of
September 30, 2015
, we had
two
real estate joint ventures that did not meet the requirements for consolidation and were accounted for under the equity method of accounting. Refer to Note 3 – “Investments in Real Estate” to our unaudited consolidated financial statements under Item 1 of this report for further information on our unconsolidated joint ventures.
Use of estimates
The preparation of consolidated financial statements in conformity with GAAP requires us to make estimates and assumptions that affect the reported amounts of assets, liabilities, and equity; the disclosure of contingent assets and liabilities as of the date of the consolidated financial statements; and the amounts of revenues and expenses during the reporting period. Actual results could materially differ from those estimates.
8
|
2.
|
Basis of presentation and summary of significant accounting policies (continued)
|
Investments in real estate and properties classified as “held for sale”
We recognize real estate acquired (including the intangible value of above- or below-market leases, acquired in-place leases, client tenant relationships, and other intangible assets or liabilities), liabilities assumed, and any noncontrolling interest in an acquired entity at their fair value as of the acquisition date. If there is a bargain fixed-rate renewal option for the period beyond the non-cancelable lease term of an in-place lease, we evaluate factors such as the business conditions in the industry in which the lessee operates, the economic conditions in the area in which the property is located, and the ability of the lessee to sublease the property during the renewal term, in order to determine the likelihood that the lessee will renew. When we determine there is reasonable assurance that such bargain purchase option will be exercised, we consider its impact in determining the intangible value of such lease and its related amortization period. The value of tangible assets acquired is based upon our estimation of value on an as-if-vacant basis. The value of acquired in-place leases includes the estimated costs during the hypothetical lease-up period and other costs that would have been incurred in the execution of similar leases, considering market conditions at the acquisition date of the acquired in-place lease. We assess the fair value of tangible and intangible assets based on numerous factors, including estimated cash flow projections that utilize appropriate discount and capitalization rates and available market information. Estimates of future cash flows are based on a number of factors, including the historical operating results, known trends, and market/economic conditions that may affect the property. We also recognize the fair values of assets acquired, the liabilities assumed, and any noncontrolling interest in acquisitions of less than a 100% interest when the acquisition constitutes a change in control of the acquired entity. Acquisition-related costs related to the acquisition of businesses, including real estate acquired with in-place leases, are expensed as incurred.
The values allocated to buildings and building improvements, land improvements, tenant improvements, and equipment are depreciated on a straight-line basis using the shorter of the term of the respective ground lease and up to
40 years
for buildings and building improvements, an estimated life of up to
20 years
for land improvements, the respective lease term for tenant improvements, and the estimated useful life for equipment. The values of acquired above- and below-market leases are amortized over the terms of the related leases and recognized as either an increase (for below-market leases) or a decrease (for above-market leases) to rental income. The values of acquired in-place leases are classified in other assets in the accompanying consolidated balance sheets and amortized over the remaining terms of the related leases.
We are required to capitalize project costs, including predevelopment costs, interest, property taxes, insurance, and other costs directly related and essential to the acquisition, development, redevelopment, predevelopment, or construction of a project. Capitalization of development, redevelopment, predevelopment, and construction costs is required while activities are ongoing to prepare an asset for its intended use. Fluctuations in our development, redevelopment, predevelopment, and construction activities could result in significant changes to total expenses and net income. Costs incurred after a project is substantially complete and ready for its intended use are expensed as incurred. Should development, redevelopment, predevelopment, or construction activity cease, interest, property taxes, insurance, and certain other costs would no longer be eligible for capitalization and would be expensed as incurred. Expenditures for repairs and maintenance are expensed as incurred.
A property is classified as “held for sale” when all of the following criteria for a plan of sale have been met: (i) management, having the authority to approve the action, commits to a plan to sell the property; (ii) the property is available for immediate sale in its present condition, subject only to terms that are usual and customary; (iii) an active program to locate a buyer and other actions required to complete the plan to sell have been initiated; (iv) the sale of the property is probable and is expected to be completed within
one year
; (v) the property is being actively marketed for sale at a price that is reasonable in relation to its current fair value; and (vi) actions necessary to complete the plan of sale indicate that it is unlikely that significant changes to the plan will be made or that the plan will be withdrawn. Depreciation of assets ceases upon designation of a property as “held for sale.” Prior to our adoption of the new discontinued operations accounting standard on October 1, 2014, the operations of properties “held for sale” were classified as discontinued operations in our consolidated statements of income.
Subsequent to the adoption of the new discontinued operations accounting standard on October 1, 2014, if the disposal of the property represents a strategic shift that has (or will have) a major effect on our operations or financial results, such as (i) a major line of business, (ii) a major geographic area, (iii) a major equity method investment, or (iv) other major parts of an entity, then the operations of the property “held for sale,” including any interest expense directly attributable to it, are classified as discontinued operations in our consolidated statements of income, and amounts for all prior periods presented are reclassified from continuing operations to discontinued operations. The disposal of an individual property generally will not represent a strategic shift and therefore will typically not meet the criteria for classification as discontinued operations.
9
|
2.
|
Basis of presentation and summary of significant accounting policies (continued)
|
Impairment of long-lived assets
Long-lived assets to be held for use, including our rental properties, CIP, land held for development, and intangibles, are individually evaluated for impairment when conditions exist that may indicate that the carrying amount of a long-lived asset may not be recoverable. The carrying amount of a long-lived asset to be held for use is not recoverable if it exceeds the sum of the undiscounted cash flows expected to result from the use and eventual disposition of the asset. Impairment indicators or triggering events for long-lived assets to be held for use, including our rental properties, CIP, land held for development, and intangibles, are assessed by project and include significant fluctuations in estimated rental revenues less rental operating expenses, occupancy changes, significant near-term lease expirations, current and historical operating and/or cash flow losses, construction costs, estimated completion dates, rental rates, and other market factors. We assess the expected undiscounted cash flows based upon numerous factors, including, but not limited to, construction costs, available market information, current and historical operating results, known trends, current market/economic conditions that may affect the property, and our assumptions about the use of the asset, including, if necessary, a probability-weighted approach if multiple outcomes are under consideration. Upon determination that an impairment has occurred, a write-down is recognized to reduce the carrying amount to its estimated fair value. If an impairment loss is not required to be recognized, the recognition of depreciation is adjusted prospectively, as necessary, to reduce the carrying amount of the real estate to its estimated disposition value over the remaining period that the real estate is expected to be held for use. We may adjust depreciation of properties that are expected to be disposed of or redeveloped prior to the end of their useful lives.
We use the “held for sale” impairment model for our properties classified as “held for sale.” The “held for sale” impairment model is different from the held for use impairment model. Under the “held for sale” impairment model, an impairment loss is recognized if the carrying amount of the long-lived asset classified as “held for sale” exceeds its fair value less cost to sell. Because of these two different models, it is possible for a long-lived asset previously classified as held for use to require the recognition of an impairment charge upon classification as “held for sale.”
On a quarterly basis, we review current activities and changes in the business conditions of all of our properties prior to and subsequent to the end of each quarter to determine the existence of any triggering events requiring an impairment analysis. If triggering events are identified, we review an estimate of the future undiscounted cash flows for the properties, including a probability-weighted approach if multiple outcomes are under consideration.
Investments
We hold equity investments in certain publicly traded companies and investments in certain privately held entities primarily involved in the science industry. All of our investments in actively traded public companies are considered “available-for-sale” and are reflected in the accompanying consolidated balance sheets at fair value. Fair value has been determined based upon the closing price as of each balance sheet date, with unrealized gains and losses shown as a separate component of comprehensive income. The classification of each investment is determined at the time each investment is made, and such determination is reevaluated at each balance sheet date. The cost of each investment sold is determined by the specific identification method, with realized gains or losses classified in other income in the accompanying consolidated statements of income. Investments in privately held entities are generally accounted for under the cost method when our interest in the entity is so minor that we have virtually no influence over the entity’s operating and financial policies. Certain investments in privately held entities are accounted for under the equity method unless our interest in the entity is deemed to be so minor that we have virtually no influence over the entity’s operating and financial policies. Under the equity method of accounting, we recognize our investment initially at cost and adjust the carrying amount of the investment to recognize our share of the earnings or losses of the investee subsequent to the date of our investment. Additionally, we limit our ownership percentage in the voting stock of each individual entity to less than
10%
. As of
September 30, 2015
, and December 31,
2014
, our ownership percentage in the voting stock of each individual entity was less than
10%
.
We monitor each of our equity investments throughout the year for new developments, including operating results, results of clinical trials, capital-raising events, and merger and acquisition activities. Individual investments are evaluated for impairment when changes in conditions may indicate an impairment exists. The factors that we consider in making these assessments include, but are not limited to, market prices, market conditions, available financing, prospects for favorable or unfavorable clinical trial results, new product initiatives, and new collaborative agreements. If there are no identified events or changes in circumstances that might have an adverse effect on our cost method investments, we do not estimate the investment’s fair value. For all of our investments, if a decline in the fair value of an investment below the carrying value is determined to be other than temporary, such investment is written down to its estimated fair value with a charge to current earnings.
10
|
2.
|
Basis of presentation and summary of significant accounting policies (continued)
|
Recognition of rental income and tenant recoveries
Rental income from leases is recognized on a straight-line basis over the respective lease terms. We classify amounts currently recognized as income, and expected to be received in later years as deferred rent in the accompanying consolidated balance sheets. Amounts received currently but recognized as income in future years are classified in accounts payable, accrued expenses, and tenant security deposits in the accompanying consolidated balance sheets. We commence recognition of rental income at the date the property is ready for its intended use and the client tenant takes possession or controls the physical use of the property.
Tenant recoveries related to reimbursement of real estate taxes, insurance, utilities, repairs and maintenance, common area expenses, and other operating expenses are recognized as revenue in the period during which the applicable expenses are incurred.
Tenant receivables consist primarily of amounts due for contractual lease payments, reimbursements of common area maintenance expenses, property taxes, and other expenses recoverable from client tenants. Tenant receivables are expected to be collected within
one year
. We may maintain an allowance for estimated losses that may result from the inability of our client tenants to make payments required under the terms of the lease and for tenant recoveries due. If a client tenant fails to make contractual payments beyond any allowance, we may recognize additional bad debt expense in future periods equal to the amount of uncollectible tenant receivables and deferred rent arising from the straight-lining of rent. As of
September 30, 2015
, and December 31,
2014
, we had
no
allowance for uncollectible tenant receivables and deferred rent.
Monitoring client tenant credit quality
During the term of each lease, we monitor the credit quality of our client tenants by (i) monitoring the credit rating of client tenants that are rated by a nationally recognized credit rating agency, (ii) reviewing financial statements of the client tenants that are publicly available or that are required to be delivered to us pursuant to the applicable lease, (iii) monitoring news reports regarding our client tenants and their respective businesses, and (iv) monitoring the timeliness of lease payments. We have a team of employees who, among them, have graduate and undergraduate degrees in biology, chemistry, and industrial biotechnology and experience in the science and technology industries, as well as in finance. Our research team is responsible for assessing and monitoring the credit quality of our client tenants and any material changes in their credit quality.
Other income
The following is a summary of the other income in the accompanying consolidated statements of income for the
three and nine months ended September 30, 2015
, and
2014
(in thousands):
|
Three Months Ended September 30,
|
Nine Months Ended September 30,
|
|||||||||||||||
|
2015
|
2014
|
2015
|
2014
|
|||||||||||||
|
Management fee income
|
$
|
530
|
|
$
|
560
|
|
$
|
1,341
|
|
$
|
2,202
|
|
||||
|
Interest and other income
|
1,272
|
|
1,994
|
|
2,136
|
|
3,767
|
|
||||||||
|
Investment income (loss)
|
5,378
|
|
(229
|
)
|
11,211
|
|
756
|
|
||||||||
|
Total other income
|
$
|
7,180
|
|
$
|
2,325
|
|
$
|
14,688
|
|
$
|
6,725
|
|
||||
Income taxes
We are organized and qualify as a REIT pursuant to the Internal Revenue Code (the “Code”). Under the Code, a REIT that distributes at least
90%
of its REIT taxable income to its shareholders annually and meets certain other conditions is not subject to federal income taxes, but could be subject to certain state and local taxes. We distribute
100%
of our taxable income annually; therefore, a provision for federal income taxes is not required. In addition to our REIT returns, we file federal, state, and local tax returns for our subsidiaries. We file with jurisdictions located in the U.S., Canada, India, China, and other international locations. Our tax returns are subject to routine examination in various jurisdictions for calendar years 2010 through 2013.
11
|
2.
|
Basis of presentation and summary of significant accounting policies (continued)
|
Recent accounting pronouncements
In February 2015, the FASB issued an Accounting Standards Update that requires reporting entities to evaluate whether they should consolidate certain legal entities. The update modifies the evaluation of whether limited partnerships and similar legal entities are variable interest entities or voting interest entities and eliminates the presumption that a general partner should consolidate a limited partnership. This update affects the consolidation analyses of reporting entities that are involved with variable interest entities, particularly those that have fee arrangements and related-party relationships. The update is effective for fiscal years, and for interim periods within those fiscal years, beginning after December 15, 2015, with early adoption permitted. A reporting entity may apply the amendments in this update by (i) using a modified retrospective approach by recording a cumulative-effect adjustment to equity as of the beginning of the fiscal year of adoption or (ii) applying the amendments retrospectively. We are currently assessing the potential impact that the adoption of the update will have on our consolidated financial statements.
In April 2015, the FASB issued an Accounting Standards Update that requires reporting entities to present debt issuance costs as a direct deduction from the face amount of the related note payable presented in the balance sheet. The update is effective for fiscal years, and for interim periods within those fiscal years, beginning after December 15, 2015, with early adoption permitted. A reporting entity is required to apply the amendments in this update retrospectively to all prior periods. We are currently assessing the potential impact that the adoption of the update will have on our consolidated financial statements.
12
|
3.
|
Investments in real estate
|
Our investments in real estate consisted of the following as of
September 30, 2015
, and December 31,
2014
(in thousands):
|
September 30, 2015
|
December 31, 2014
|
|||||||
|
Land (related to rental properties)
|
$
|
676,459
|
|
$
|
624,681
|
|
||
|
Buildings and building improvements
|
6,764,292
|
|
6,171,504
|
|
||||
|
Other improvements
|
250,364
|
|
192,128
|
|
||||
|
Rental properties
|
7,691,115
|
|
6,988,313
|
|
||||
|
Development and redevelopment projects under construction/Construction in progress (CIP):
|
||||||||
|
Development projects under construction in North America
|
644,500
|
|
500,894
|
|
||||
|
Redevelopment projects under construction in North America
|
139,931
|
|
42,482
|
|
||||
|
Development projects under construction in Asia
|
—
|
|
14,065
|
|
||||
|
784,431
|
|
557,441
|
|
|||||
|
Rental properties and development and redevelopment projects under construction
|
8,475,546
|
|
7,545,754
|
|
||||
|
Near-term value-creation projects in North America (CIP):
|
||||||||
|
Alexandria Center
®
at Kendall Square – Binney Street
|
—
|
|
321,907
|
|
||||
|
Other projects
|
47,358
|
|
107,471
|
|
||||
|
47,358
|
|
429,378
|
|
|||||
|
Future value-creation projects:
|
||||||||
|
North America
|
187,313
|
|
175,175
|
|
||||
|
Asia
|
77,261
|
|
78,548
|
|
||||
|
264,574
|
|
253,723
|
|
|||||
|
Near-term and future value-creation projects
|
311,932
|
|
683,101
|
|
||||
|
Value-creation pipeline
|
1,096,363
|
|
1,240,542
|
|
||||
|
Gross investments in real estate
|
8,787,478
|
|
8,228,855
|
|
||||
|
Equity method of accounting – unconsolidated joint ventures
|
126,471
|
|
117,406
|
|
||||
|
Gross investments in real estate – including unconsolidated joint ventures
|
8,913,949
|
|
8,346,261
|
|
||||
|
Less: accumulated depreciation
|
(1,259,740
|
)
|
(1,120,245
|
)
|
||||
|
Investments in real estate
|
$
|
7,654,209
|
|
$
|
7,226,016
|
|
||
Acquisitions
During the
nine months ended September 30, 2015
, we acquired real estate and real estate related assets with an aggregate purchase price of
$438.1 million
, including the assumption of debt, consisting of
one
operating property,
two
land parcels,
two
redevelopment projects under construction, and the outstanding noncontrolling interest related to
seven
operating properties.
13
|
3.
|
Investments in real estate (continued)
|
Sales of real estate assets and related impairment charges
In June 2015, we completed the sale of 270 Third Street, a residential development project with
91
units at our Alexandria Center
®
at Kendall Square in our Cambridge submarket in Greater Boston, for a sales price of
$43.0 million
. The net proceeds of
$25.5 million
reflect the assumption by the buyer of the cost to complete the construction of
$17.5 million
. The net proceeds from the sale approximated our carrying amount.
During the three months ended March 31, 2015, we completed the sale of our land and land improvements at 661 University Avenue in Toronto, Canada, for
$54.1 million
. In December 2014, we recognized an impairment charge of
$16.6 million
to lower the carrying costs of this property to its estimated fair value less cost to sell, including an estimated
$5.0 million
foreign currency exchange translation loss. Also, during the three months ended March 31, 2015, we sold a
21,859
RSF operating property located in Pennsylvania for
$1.9 million
. The sales price less cost to sell for this property approximated its carrying value at the time of sale and resulted in no gain or loss on sale.
During the three months ended December 31, 2014, we placed into service a
175,000
RSF building in Hyderabad, India. We completed a probability-weighted cash flow analysis for this building, inclusive of the estimated costs to complete, and determined that the estimated undiscounted cash flows exceeded the carrying amount of the building as of December 31, 2014.
During the three months ended March 31, 2015, we determined that this building in Hyderabad, India, met the criteria for classification as “held for sale,” including, among others, the following: (i) management committed to sell the real estate and executed a purchase and sale agreement on March 23, 2015, and (ii) management determined that the sale was probable within one year. Upon classification as “held for sale,” we recognized an impairment charge of
$14.5 million
to lower the carrying costs of the real estate to its estimated fair value less cost to sell, including an estimated
$4.2 million
foreign currency exchange translation loss. On March 26, 2015, we completed the sale of the building to an Indian multispecialty healthcare provider for
$12.4 million
.
As a result of our sales in Canada and India discussed above, our statement of comprehensive income reflects an aggregate
$9.2 million
of losses that we realized during the
nine months ended September 30, 2015
, related to foreign currency exchange translation losses, noted above, that were previously classified in accumulated other comprehensive income (loss) on our accompanying consolidated balance sheets.
Development and redevelopment projects under construction
As of
September 30, 2015
, we had
ten
ground-up development projects, including
two
unconsolidated joint venture development projects, under construction in North America. The projects at completion will aggregate
3.3 million
RSF, of which
713,524
RSF has been completed and placed into service.
As of
September 30, 2015
, we had
three
redevelopment projects under construction in North America aggregating
525,482
RSF.
Investments in unconsolidated joint ventures
Refer to our consolidation policy described in Note 2 – “Basis of Presentation and Summary of Significant Accounting Policies,” regarding the following
two
unconsolidated joint ventures.
360 Longwood Avenue
We are currently developing a building aggregating
413,536
RSF in our Longwood Medical Area submarket of the Greater Boston market through an unconsolidated joint venture. The cost at completion for this unconsolidated joint venture real estate project is approximately
$350.0 million
. As of
September 30, 2015
, we had
259,859
RSF, or
63%
of the project, leased and in service. The joint venture has a secured construction loan with commitments aggregating
$213.2 million
,
$175.3 million
of which was outstanding
as of September 30, 2015
. The remaining cost to complete the development is expected to be funded primarily from the remaining commitments of
$37.9 million
under the secured construction loan. The secured construction loan bears interest at LIBOR+
3.75%
, with a floor of
5.25%
. The maturity date of the loan is April 1, 2017, with
two
, one-year options to extend the stated maturity date to April 1, 2019, subject to certain conditions.
14
|
3.
|
Investments in real estate (continued)
|
We have a
27.5%
interest in this unconsolidated joint venture that we account for under the equity method of accounting. Our investment under the equity method of accounting was
$50.4 million
as of
September 30, 2015
, and is classified in investments in real estate in our accompanying consolidated balance sheets.
1455/1515 Third Street
In September 2014, Alexandria and Uber Technologies, Inc. (“Uber”), entered into a joint venture agreement and acquired two land parcels supporting the development of two buildings aggregating
422,980
RSF at 1455/1515 Third Street in the Mission Bay submarket of the San Francisco market for a total purchase price of
$125.0 million
. We have a
51%
interest and Uber has a
49%
interest in this unconsolidated joint venture. The purchase price was funded by contributions into the joint venture by Uber and us. We account for our investment in this joint venture under the equity method of accounting. Our investment under the equity method of accounting was
$76.1 million
as of
September 30, 2015
, and was classified in investments in real estate in our accompanying consolidated balance sheets. The project is expected to be funded by equity contributions from Uber and us. The project is
100%
leased to Uber for a
15
-year term.
Near-term value-creation projects in North America (CIP)
Land undergoing predevelopment activities is classified as CIP and is undergoing activities prior to commencement of construction of aboveground building improvements. We generally will not commence ground-up development of any land parcels without first securing pre-leasing for such space, except when there is solid market demand. If aboveground construction is not initiated at completion of predevelopment activities, the land parcel will be classified as future value-creation projects. Our objective with predevelopment is to reduce the time it takes to deliver projects to prospective client tenants. Additionally, during predevelopment, we focus on the design of cost-effective buildings with generic and reusable infrastructure to accommodate single-tenancy and multi-tenancy. As of
September 30, 2015
, we had
$47.4 million
of land undergoing predevelopment activities in North America aggregating
1.3 million
square feet.
Predevelopment costs generally include the following activities prior to commencement of vertical construction:
|
•
|
Traditional predevelopment costs, including entitlement, design, construction drawings, building information modeling (BIM 3-D virtual modeling), budgeting, sustainability and energy optimization reviews, permitting, and planning for all aspects of the project; and
|
|
•
|
Site and infrastructure construction costs, including belowground site work, utility connections, land grading, drainage, egress and regress access points, foundation, and other costs to prepare the site for construction of aboveground building improvements.
|
Future value-creation projects
Future value-creation projects represent land that we plan to develop in the future, but for which, as of each period presented, no construction or predevelopment activities were ongoing. As a result, interest, property taxes, insurance, and other costs are expensed as incurred. As of
September 30, 2015
, we had
$264.6 million
of land held for future development supporting an aggregate of
10.2 million
square feet of ground-up development.
15
|
4.
|
Investments
|
Our investments in privately held entities are primarily accounted for under the cost method. Our investments in publicly traded companies are principally marketable equity securities that are accounted for as “available-for-sale” marketable equity securities that are carried at their fair values. Investments in “available-for-sale” marketable equity securities with gross unrealized losses as of
September 30, 2015
, had been in a continuous unrealized loss position for less than 12 months. We have the ability and intent to hold these investments for a reasonable period of time sufficient for the recovery of our investment. We believe that these unrealized losses are temporary; accordingly, there are no other-than-temporary impairments in accumulated other comprehensive income related to “available-for-sale” marketable equity securities as of
September 30, 2015
, or December 31,
2014
.
The following table summarizes our investments as of
September 30, 2015
, and December 31, 2014 (in thousands):
|
September 30, 2015
|
December 31, 2014
|
||||||
|
“Available-for-sale” marketable equity securities, cost basis
|
$
|
31,399
|
|
$
|
21,898
|
|
|
|
Unrealized gains
|
107,518
|
|
53,625
|
|
|||
|
Unrealized losses
|
(3,650
|
)
|
(1,258
|
)
|
|||
|
“Available-for-sale” marketable equity securities, at fair value
|
135,267
|
|
74,265
|
|
|||
|
Investments accounted for under cost method
|
195,303
|
|
162,124
|
|
|||
|
Total investments
|
$
|
330,570
|
|
$
|
236,389
|
|
|
The following table outlines our
investment income (loss)
, which is classified in other income in the accompanying consolidated statements of income (in thousands):
|
Three Months Ended September 30,
|
Nine Months Ended September 30,
|
||||||||||||||
|
2015
|
2014
|
2015
|
2014
|
||||||||||||
|
Investment gains
|
$
|
8,658
|
|
$
|
3,256
|
|
$
|
22,368
|
|
$
|
9,481
|
|
|||
|
Investment losses
|
(3,280
|
)
|
(3,485
|
)
|
(11,157
|
)
|
(8,725
|
)
|
|||||||
|
Investment income (loss)
|
$
|
5,378
|
|
$
|
(229
|
)
|
$
|
11,211
|
|
$
|
756
|
|
|||
|
5.
|
Fair value measurements
|
We are required to disclose fair value information about all financial instruments, whether or not recognized in the balance sheet, for which it is practicable to estimate fair value. We measure and disclose the estimated fair value of financial assets and liabilities utilizing a fair value hierarchy that distinguishes between data obtained from sources independent of the reporting entity and the reporting entity’s own assumptions about market participant assumptions. This hierarchy consists of three broad levels, as follows: (i) quoted prices in active markets for identical assets or liabilities, (ii) “significant other observable inputs,” and (iii) “significant unobservable inputs.” “Significant other observable inputs” can include quoted prices for similar assets or liabilities in active markets, as well as inputs that are observable for the asset or liability, such as interest rates, foreign exchange rates, and yield curves that are observable at commonly quoted intervals. “Significant unobservable inputs” are typically based on an entity’s own assumptions, since there is little, if any, related market activity. In instances in which the determination of the fair value measurement is based on inputs from different levels of the fair value hierarchy, the level in the fair value hierarchy within which the entire fair value measurement falls is based on the lowest level of input that is significant to the fair value measurement in its entirety. Our assessment of the significance of a particular input to the fair value measurement in its entirety requires judgment and considers factors specific to the asset or liability. There were
no
transfers between the levels in the fair value hierarchy during the
nine months ended September 30, 2015
and
2014
.
16
|
5.
|
Fair value measurements (continued)
|
The following tables set forth the assets and liabilities that we measure at fair value on a recurring basis by level within the fair value hierarchy as of
September 30, 2015
, and
December 31, 2014
(in thousands):
|
September 30, 2015
|
||||||||||||||||
|
Description
|
Total
|
Quoted Prices in
Active Markets
for Identical
Assets
|
Significant
Other
Observable
Inputs
|
Significant
Unobservable
Inputs
|
||||||||||||
|
Assets:
|
||||||||||||||||
|
“Available-for-sale” marketable equity securities
|
$
|
135,267
|
|
$
|
135,267
|
|
$
|
—
|
|
$
|
—
|
|
||||
|
Liabilities:
|
||||||||||||||||
|
Interest rate swap agreements
|
$
|
8,679
|
|
$
|
—
|
|
$
|
8,679
|
|
$
|
—
|
|
||||
|
December 31, 2014
|
||||||||||||||||
|
Description
|
Total
|
Quoted Prices in
Active Markets
for Identical
Assets
|
Significant
Other
Observable
Inputs
|
Significant
Unobservable
Inputs
|
||||||||||||
|
Assets:
|
||||||||||||||||
|
“Available-for-sale” marketable equity securities
|
$
|
74,265
|
|
$
|
74,265
|
|
$
|
—
|
|
$
|
—
|
|
||||
|
Liabilities:
|
||||||||||||||||
|
Interest rate swap agreements
|
$
|
909
|
|
$
|
—
|
|
$
|
909
|
|
$
|
—
|
|
||||
The carrying values of cash and cash equivalents, restricted cash, tenant receivables, other assets, accounts payable, accrued expenses, and tenant security deposits approximate fair value. Our “available-for-sale” marketable equity securities and our interest rate swap agreements have been recognized at fair value. Refer to Note 4 – “Investments” and Note 7 – “Interest Rate Swap Agreements” in our unaudited consolidated financial statements under Item 1 of this report for further details. The fair values of our secured notes payable, unsecured senior notes payable, unsecured senior line of credit, and unsecured senior bank term loans were estimated using widely accepted valuation techniques, including discounted cash flow analyses of “significant other observable inputs” such as available market information on discount and borrowing rates with similar terms, maturities, and credit ratings. Because the valuations of our financial instruments are based on these types of estimates, the actual fair value of our financial instruments may differ materially if our estimates do not prove to be accurate. Additionally, the use of different market assumptions or estimation methods may have a material effect on the estimated fair value amounts.
As of
September 30, 2015
, and
December 31, 2014
, the book and estimated fair values of our “available-for-sale” marketable equity securities, interest rate swap agreements, secured notes payable, unsecured senior notes payable, unsecured senior line of credit, and unsecured senior bank term loans were as follows (in thousands):
|
|
September 30, 2015
|
December 31, 2014
|
|||||||||||||
|
|
Book Value
|
Fair Value
|
Book Value
|
Fair Value
|
|||||||||||
|
Assets:
|
|||||||||||||||
|
“Available-for-sale” marketable equity securities
|
$
|
135,267
|
|
$
|
135,267
|
|
$
|
74,265
|
|
$
|
74,265
|
|
|||
|
Liabilities:
|
|||||||||||||||
|
Interest rate swap agreements
|
$
|
8,679
|
|
$
|
8,679
|
|
$
|
909
|
|
$
|
909
|
|
|||
|
Secured notes payable
|
$
|
773,619
|
|
$
|
807,566
|
|
$
|
652,209
|
|
$
|
693,338
|
|
|||
|
Unsecured senior notes payable
|
$
|
1,747,613
|
|
$
|
1,776,375
|
|
$
|
1,747,370
|
|
$
|
1,793,255
|
|
|||
|
Unsecured senior line of credit
|
$
|
843,000
|
|
$
|
843,909
|
|
$
|
304,000
|
|
$
|
304,369
|
|
|||
|
Unsecured senior bank term loans
|
$
|
950,000
|
|
$
|
951,540
|
|
$
|
975,000
|
|
$
|
976,010
|
|
|||
Fair value measurements for other than on a non-recurring basis
Refer to Note 3 – “Investments in Real Estate” and Note 11 – “Noncontrolling Interests” to our unaudited consolidated financial statements under Item 1 of this report.
17
|
6.
|
|
The following table summarizes our secured and unsecured senior debt as of
September 30, 2015
(dollars in thousands):
|
Fixed-Rate/Hedged
Variable-Rate
|
Unhedged
Variable-Rate
|
Total
Consolidated
|
Percentage of Total Debt
|
Weighted-Average
Interest Rate at
End of Period
(1)
|
Weighted-Average
Remaining Term
(in years)
|
||||||||||||||
|
Secured notes payable
|
$
|
478,016
|
|
$
|
295,603
|
|
$
|
773,619
|
|
17.9
|
%
|
4.23
|
%
|
2.6
|
|||||
|
Unsecured senior notes payable
|
1,747,613
|
|
—
|
|
1,747,613
|
|
40.5
|
|
3.98
|
|
7.6
|
||||||||
|
$1.5 billion unsecured senior line of credit
|
100,000
|
|
743,000
|
|
843,000
|
|
19.6
|
|
1.19
|
|
3.3
|
||||||||
|
2019 Unsecured Senior Bank Term Loan
|
600,000
|
|
—
|
|
600,000
|
|
13.9
|
|
1.72
|
|
3.3
|
||||||||
|
2021 Unsecured Senior Bank Term Loan
|
350,000
|
|
—
|
|
350,000
|
|
8.1
|
|
1.52
|
|
5.3
|
||||||||
|
Total/weighted-average
|
$
|
3,275,629
|
|
$
|
1,038,603
|
|
$
|
4,314,232
|
|
100.0
|
%
|
2.97
|
%
|
5.1
|
|||||
|
Percentage of total debt
|
76
|
%
|
24
|
%
|
100
|
%
|
|||||||||||||
|
(1)
|
Represents the weighted-average interest rate as of the end of the period plus the impact of debt premiums/discounts and our interest rate swap agreements. The weighted-average interest rate excludes bank fees and amortization of loan fees.
|
18
|
6.
|
Secured and unsecured senior debt (continued)
|
The following table summarizes our outstanding indebtedness and respective principal maturities as of
September 30, 2015
(dollars in thousands):
|
|
Stated
Rate
|
Weighted- Average
Interest Rate
(1)
|
Maturity Date
(2)
|
|
Principal Payments Remaining for the Periods Ending December 31,
|
|
|
|||||||||||||||||||||||||||||
|
Debt
|
|
2015
|
2016
|
2017
|
2018
|
2019
|
Thereafter
|
Total
|
||||||||||||||||||||||||||||
|
Secured notes payable
|
|
|
|
|
|
|
|
|
|
|
|
|
||||||||||||||||||||||||
|
Greater Boston, San Francisco, and San Diego
|
5.73
|
%
|
5.73
|
%
|
(3)
|
$
|
466
|
|
$
|
75,501
|
|
$
|
—
|
|
$
|
—
|
|
$
|
—
|
|
$
|
—
|
|
$
|
75,967
|
|
||||||||||
|
Greater Boston, New York City, and San Diego,
|
5.82
|
5.82
|
4/1/16
|
|
249
|
|
29,389
|
|
—
|
|
—
|
|
—
|
|
—
|
|
29,638
|
|
||||||||||||||||||
|
San Diego
|
5.74
|
3.00
|
4/15/16
|
45
|
|
6,916
|
|
—
|
|
—
|
|
—
|
|
—
|
|
6,961
|
|
|||||||||||||||||||
|
San Francisco
|
L+1.40
|
1.59
|
6/1/16
|
(4)
|
—
|
|
20,714
|
|
—
|
|
—
|
|
—
|
|
—
|
|
20,714
|
|
||||||||||||||||||
|
San Francisco
|
L+1.50
|
1.69
|
7/1/16
|
(5)
|
—
|
|
47,385
|
|
—
|
|
—
|
|
—
|
|
—
|
|
47,385
|
|
||||||||||||||||||
|
San Francisco
|
6.35
|
6.35
|
8/1/16
|
662
|
|
126,715
|
|
—
|
|
—
|
|
—
|
|
—
|
|
127,377
|
|
|||||||||||||||||||
|
Maryland
|
2.18
|
2.18
|
1/20/17
|
—
|
|
—
|
|
76,000
|
|
—
|
|
—
|
|
—
|
|
76,000
|
|
|||||||||||||||||||
|
Greater Boston
|
L+1.35
|
1.54
|
8/23/17
|
(6)
|
—
|
|
—
|
|
151,504
|
|
—
|
|
—
|
|
—
|
|
151,504
|
|
||||||||||||||||||
|
San Diego, Seattle, and Maryland
|
7.75
|
7.75
|
4/1/20
|
404
|
|
1,696
|
|
1,832
|
|
1,979
|
|
2,138
|
|
104,352
|
|
112,401
|
|
|||||||||||||||||||
|
San Diego
|
4.66
|
4.66
|
1/1/23
|
354
|
|
1,464
|
|
1,540
|
|
1,614
|
|
1,692
|
|
31,674
|
|
38,338
|
|
|||||||||||||||||||
|
Greater Boston
|
3.93
|
3.10
|
3/10/23
|
—
|
|
—
|
|
—
|
|
1,091
|
|
1,505
|
|
79,404
|
|
82,000
|
|
|||||||||||||||||||
|
San Francisco
|
6.50
|
6.50
|
7/1/36
|
|
1
|
|
19
|
|
20
|
|
22
|
|
23
|
|
728
|
|
813
|
|
||||||||||||||||||
|
Unamortized premiums
|
184
|
|
610
|
|
573
|
|
588
|
|
595
|
|
1,971
|
|
4,521
|
|
||||||||||||||||||||||
|
Secured notes payable weighted-average/subtotal
|
4.35
|
%
|
4.23
|
|
|
2,365
|
|
310,409
|
|
231,469
|
|
5,294
|
|
5,953
|
|
218,129
|
|
773,619
|
|
|||||||||||||||||
|
2019 Unsecured Senior Bank Term Loan
|
L+1.20
|
%
|
1.72
|
1/3/19
|
—
|
|
—
|
|
—
|
|
—
|
|
600,000
|
|
—
|
|
600,000
|
|
||||||||||||||||||
|
2021 Unsecured Senior Bank Term Loan
|
L+1.10
|
%
|
1.52
|
1/15/21
|
—
|
|
—
|
|
—
|
|
—
|
|
—
|
|
350,000
|
|
350,000
|
|
||||||||||||||||||
|
$1.5 billion unsecured senior line of credit
|
L+1.10
|
%
|
(7)
|
1.19
|
1/3/19
|
|
—
|
|
—
|
|
—
|
|
—
|
|
843,000
|
|
—
|
|
843,000
|
|
||||||||||||||||
|
Unsecured senior notes payable
|
2.75
|
%
|
2.79
|
1/15/20
|
|
—
|
|
—
|
|
—
|
|
—
|
|
—
|
|
400,000
|
|
400,000
|
|
|||||||||||||||||
|
Unsecured senior notes payable
|
4.60
|
%
|
4.61
|
4/1/22
|
|
—
|
|
—
|
|
—
|
|
—
|
|
—
|
|
550,000
|
|
550,000
|
|
|||||||||||||||||
|
Unsecured senior notes payable
|
3.90
|
%
|
3.94
|
6/15/23
|
—
|
|
—
|
|
—
|
|
—
|
|
—
|
|
500,000
|
|
500,000
|
|
||||||||||||||||||
|
Unsecured senior notes payable
|
4.50
|
%
|
4.51
|
7/30/29
|
—
|
|
—
|
|
—
|
|
—
|
|
—
|
|
300,000
|
|
300,000
|
|
||||||||||||||||||
|
Unamortized discounts
|
(83
|
)
|
(337
|
)
|
(350
|
)
|
(362
|
)
|
(375
|
)
|
(880
|
)
|
(2,387
|
)
|
||||||||||||||||||||||
|
Unsecured debt weighted-average/subtotal
|
|
2.69
|
|
|
(83
|
)
|
(337
|
)
|
(350
|
)
|
(362
|
)
|
1,442,625
|
|
2,099,120
|
|
3,540,613
|
|
||||||||||||||||||
|
Weighted-average/total
|
|
2.97
|
%
|
|
|
$
|
2,282
|
|
$
|
310,072
|
|
$
|
231,119
|
|
$
|
4,932
|
|
$
|
1,448,578
|
|
$
|
2,317,249
|
|
$
|
4,314,232
|
|
||||||||||
|
Balloon payments
|
|
|
|
|
$
|
—
|
|
$
|
304,999
|
|
$
|
227,504
|
|
$
|
—
|
|
$
|
1,443,000
|
|
$
|
2,304,466
|
|
$
|
4,279,969
|
|
|||||||||||
|
Principal amortization
|
|
|
|
|
2,282
|
|
5,073
|
|
3,615
|
|
4,932
|
|
5,578
|
|
12,783
|
|
34,263
|
|
||||||||||||||||||
|
Total consolidated debt
|
|
|
|
|
$
|
2,282
|
|
$
|
310,072
|
|
$
|
231,119
|
|
$
|
4,932
|
|
$
|
1,448,578
|
|
$
|
2,317,249
|
|
$
|
4,314,232
|
|
|||||||||||
|
Fixed-rate/hedged variable-rate debt
|
|
|
|
|
$
|
2,282
|
|
$
|
241,973
|
|
$
|
3,615
|
|
$
|
4,932
|
|
$
|
705,578
|
|
$
|
2,317,249
|
|
$
|
3,275,629
|
|
|||||||||||
|
Unhedged variable-rate debt
|
|
|
|
|
—
|
|
68,099
|
|
227,504
|
|
—
|
|
743,000
|
|
—
|
|
1,038,603
|
|
||||||||||||||||||
|
Total consolidated debt
|
|
|
|
|
$
|
2,282
|
|
$
|
310,072
|
|
$
|
231,119
|
|
$
|
4,932
|
|
$
|
1,448,578
|
|
$
|
2,317,249
|
|
$
|
4,314,232
|
|
|||||||||||
|
(1)
|
Represents the weighted-average interest rate as of the end of the period plus the impact of debt premiums/discounts and our interest rate swap agreements. The weighted-average interest rate excludes bank fees and amortization of loan fees.
|
|
(2)
|
Includes any extension options that we control.
|
|
(3)
|
In October 2015, we repaid this secured note payable.
|
|
(4)
|
We have
two
,
one
-year options to extend the stated maturity date to June 1, 2018, subject to certain conditions.
|
|
(5)
|
We have a
one
-year option to extend the stated maturity date to July 1, 2017, subject to certain conditions.
|
|
(6)
|
We have a
one
-year option to extend the stated maturity date to August 23, 2018, subject to certain conditions.
|
|
(7)
|
Our unsecured senior line of credit contains a feature that allows lenders to competitively bid on the interest rate for borrowings under the facility. This may result in an interest rate that is below the stated rate of LIBOR+1.10%. In addition to the cost of borrowing, the facility is subject to an annual facility fee of
0.20%
, based on the aggregate commitments outstanding.
|
19
|
6.
|
Secured and unsecured senior debt (continued)
|
Interest expense
The following table summarizes interest expense for the three and
nine months ended September 30, 2015
and 2014 (in thousands):
|
Three Months Ended September 30,
|
Nine Months Ended September 30,
|
||||||||||||||
|
2015
|
2014
|
2015
|
2014
|
||||||||||||
|
Gross interest
|
$
|
36,115
|
|
$
|
32,680
|
|
$
|
105,427
|
|
$
|
92,551
|
|
|||
|
Capitalized interest
|
(8,436
|
)
|
(12,125
|
)
|
(27,844
|
)
|
(35,440
|
)
|
|||||||
|
Interest expense
|
$
|
27,679
|
|
$
|
20,555
|
|
$
|
77,583
|
|
$
|
57,111
|
|
|||
Amendment of unsecured senior bank term loan
In June 2015, we completed a partial principal repayment of
$25.0 million
and extended the maturity of the remaining
$350.0 million
unsecured senior bank term loan (“2021 Unsecured Senior Bank Term Loan”) from July 31, 2015, to June 30, 2019, subject to our option to extend the maturity up to
three
times upon the satisfaction of certain conditions, for an additional term of six months for the first and second extensions and for an additional term ending on January 15, 2021, for the third extension. In addition, we reduced the applicable interest rate margin with respect to borrowings outstanding under the loan to LIBOR+1.10% from LIBOR+1.20%. In conjunction with the amendment of our 2021 Unsecured Senior Bank Term Loan and the principal repayment, we recognized a loss on early extinguishment of debt aggregating
$189 thousand
related to the write-off of a portion of unamortized loan fees.
Secured construction loans
In June 2015, we exercised the first of
two
,
one
-year extensions on a
$47.4 million
secured construction loan, which extended the maturity date from July 1, 2015, to July 1, 2016.
The following table summarizes our secured construction loans as of
September 30, 2015
(dollars in thousands):
|
Market
|
Stated Rate
|
Maturity Date
|
Outstanding Balance
|
Remaining Commitments
|
Total Commitments
|
|||||||||||||||
|
San Francisco
|
L+1.40
|
%
|
6/1/16
|
(1)
|
$
|
20,714
|
|
$
|
15,286
|
|
$
|
36,000
|
|
|||||||
|
San Francisco
|
L+1.50
|
%
|
7/1/16
|
(2)
|
47,385
|
|
7,615
|
|
55,000
|
|
||||||||||
|
Greater Boston
|
L+1.35
|
%
|
8/23/17
|
(3)
|
151,504
|
|
98,896
|
|
250,400
|
|
||||||||||
|
$
|
219,603
|
|
$
|
121,797
|
|
$
|
341,400
|
|
||||||||||||
|
(1)
|
We have
two
,
one
-year options to extend the stated maturity date to June 1, 2018, subject to certain conditions.
|
|
(2)
|
We have a
one
-year option to extend the stated maturity date to July 1, 2017, subject to certain conditions.
|
|
(3)
|
We have a
one
-year option to extend the stated maturity date to August 23, 2018, subject to certain conditions.
|
During October 2015, we executed the following secured construction loan (dollars in thousands):
|
Market
|
Stated Rate
|
Maturity Date
|
Outstanding Balance
|
Remaining Commitments
|
Total Commitments
|
|||||||||||||||
|
Greater Boston
(1)
|
L+1.50%
|
1/28/19
|
$
|
—
|
|
$
|
350,000
|
|
$
|
350,000
|
|
|||||||||
|
(1)
|
In October 2015, closed a secured construction loan with aggregate commitments available for borrowing of
$350.0 million
, for our
98%
leased development project at 50/60 Binney Street in our Cambridge submarket, which bears interest at a rate of LIBOR+150 bps.
|
20
|
7.
|
Interest rate swap agreements
|
We use interest rate swap agreements to hedge the variable cash flows associated with certain of our existing LIBOR-based variable-rate debt, including our unsecured senior line of credit, unsecured senior bank term loans, and secured notes payable. The ineffective portion of the change in fair value of our interest rate swap agreements is required to be recognized directly in earnings. During the
nine months ended September 30, 2015
and
2014
, our interest rate swap agreements were
100%
effective; as a result,
no
hedge ineffectiveness was recognized in earnings. Changes in fair value, including accrued interest and adjustments for non-performance risk, on the effective portion of our interest rate swap agreements that are designated and that qualify as cash flow hedges are classified in accumulated other comprehensive income (loss). Amounts classified in accumulated other comprehensive income (loss) are subsequently reclassified into earnings in the period during which the hedged transactions affect earnings. During the next 12 months, we expect to reclassify approximately
$4.4 million
in accumulated other comprehensive income (loss) to earnings as an increase to interest expense. As of
September 30, 2015
, and
December 31, 2014
, the fair values of our interest rate swap agreements aggregating an asset balance were classified in other assets, and those aggregating a liability balance were classified in accounts payable, accrued expenses, and tenant security deposits, based upon their respective fair values, without any offsetting pursuant to master netting agreements. Refer to Note 5 – “Fair Value Measurements” to our unaudited consolidated financial statements under Item 1 of this report. Under our interest rate swap agreements, we have
no
collateral posting requirements.
The Company has agreements with certain of its derivative counterparties that contain a provision wherein (i) the Company could be declared in default on its derivative obligations if repayment of the underlying indebtedness is accelerated by the lender due to the Company’s default on the indebtedness; or (ii) if the Company defaults on any of its indebtedness, including default where repayment of the indebtedness has not been accelerated by the lender, then the Company could also be declared in default on its derivative obligations. If the Company had breached any of these provisions as of
September 30, 2015
, it could have been required to settle its obligations under the agreements at their termination value of
$8.7 million
.
We had the following outstanding interest rate swap agreements that were designated as cash flow hedges of interest rate risk as of
September 30, 2015
(dollars in thousands):
|
Number of Contracts
|
Weighted-Average Interest Pay Rate
(1)
|
Fair Value as of 9/30/15
|
Notional Amount in Effect as of
|
|||||||||||||||||||||||
|
Effective Date
|
Maturity Date
|
9/30/15
|
12/31/15
|
12/31/16
|
12/31/17
|
|||||||||||||||||||||
|
December 31, 2014
|
March 31, 2016
|
3
|
0.53%
|
$
|
(627
|
)
|
$
|
500,000
|
|
$
|
500,000
|
|
$
|
—
|
|
$
|
—
|
|
||||||||
|
March 31, 2015
|
March 31, 2016
|
7
|
0.42%
|
(331
|
)
|
450,000
|
|
450,000
|
|
—
|
|
—
|
|
|||||||||||||
|
September 1, 2015
|
March 31, 2017
|
2
|
0.57%
|
(85
|
)
|
100,000
|
|
100,000
|
|
100,000
|
|
—
|
|
|||||||||||||
|
March 31, 2016
|
March 31, 2017
|
11
|
1.15%
|
(5,149
|
)
|
—
|
|
—
|
|
1,000,000
|
|
—
|
|
|||||||||||||
|
March 31, 2017
|
March 31, 2018
|
11
|
1.51%
|
(2,487
|
)
|
—
|
|
—
|
|
—
|
|
650,000
|
|
|||||||||||||
|
Total
|
$
|
(8,679
|
)
|
$
|
1,050,000
|
|
$
|
1,050,000
|
|
$
|
1,100,000
|
|
$
|
650,000
|
|
|||||||||||
|
(1)
|
In addition to the interest pay rate for each swap agreement, interest is payable at an applicable margin for borrowings outstanding as of
September 30, 2015
. Borrowings under our 2019 unsecured senior bank term loan (“2019 Unsecured Senior Bank Term Loan”) include an applicable margin of
1.20%
, and borrowings outstanding under our unsecured senior line of credit and 2021 Unsecured Senior Bank Term Loan include an applicable margin of
1.10%
.
|
21
|
8.
|
Accounts payable, accrued expenses, and tenant security deposits
|
The following table summarizes the components of accounts payable, accrued expenses, and tenant security deposits as of
September 30, 2015
, and
December 31, 2014
(in thousands):
|
September 30, 2015
|
December 31, 2014
|
||||||
|
Accounts payable and accrued expenses
|
$
|
143,556
|
|
$
|
127,828
|
|
|
|
Accrued construction
|
83,805
|
|
91,110
|
|
|||
|
Acquired below-market leases
|
27,072
|
|
8,810
|
|
|||
|
Conditional asset retirement obligations
|
7,828
|
|
9,108
|
|
|||
|
Deferred rent liabilities
|
27,300
|
|
36,231
|
|
|||
|
Interest rate swap liabilities
|
8,679
|
|
909
|
|
|||
|
Unearned rent and tenant security deposits
|
209,584
|
|
193,699
|
|
|||
|
Other liabilities
(1)
|
78,770
|
|
21,390
|
|
|||
|
Total
|
$
|
586,594
|
|
$
|
489,085
|
|
|
|
(1)
|
Balance
as of September 30, 2015
. includes a
$54.0 million
liability related to the second installment payment for our acquisition of the remaining noncontrolling interest in our
1.2 million
RSF campus at Alexandria Technology Square
®
. For additional information, refer to Note 11 – “Noncontrolling Interests” to our unaudited consolidated financial statements under Item 1 of this report.
|
22
|
9.
|
Earnings per share
|
We use income from continuing operations attributable to Alexandria’s common stockholders as the “control number” in determining whether potential common shares are dilutive or antidilutive to EPS. Pursuant to the presentation and disclosure literature on gains or losses on sales or disposals by REITs and EPS required by the SEC and the FASB, gains or losses on sales or disposals by a REIT that do not qualify as discontinued operations are classified below income from discontinued operations in the consolidated statements of income and included in the numerator for the computation of EPS for income from continuing operations.
We account for unvested restricted stock awards that contain nonforfeitable rights to dividends as participating securities and include these securities in the computation of EPS using the two-class method. Our
7%
series D cumulative convertible preferred stock (“Series D Convertible Preferred Stock”) is not a participating security, and is not included in the computation of EPS using the two-class method. Under the two-class method, we allocate net income after preferred stock dividends, preferred stock redemption charge, and amounts attributable to noncontrolling interests to common stockholders and unvested restricted stock awards based on their respective participation rights to dividends declared (or accumulated) and undistributed earnings. Diluted EPS is computed using the weighted-average shares of common stock outstanding determined for the basic EPS computation plus the effect of any dilutive securities. We had
no
dilutive securities outstanding during the three and
nine months ended September 30, 2015
and
2014
.
The table below is a reconciliation of the numerators and denominators of the basic and diluted EPS computations for the three and
nine months ended September 30, 2015
and
2014
(in thousands, except per share amounts):
|
Three Months Ended September 30,
|
Nine Months Ended September 30,
|
||||||||||||||
|
2015
|
2014
|
2015
|
2014
|
||||||||||||
|
Income from continuing operations
|
$
|
39,699
|
|
$
|
36,115
|
|
$
|
103,180
|
|
$
|
112,492
|
|
|||
|
Gain on sales of real estate – land parcels
|
—
|
|
8
|
|
—
|
|
805
|
|
|||||||
|
Dividends on preferred stock
|
(6,247
|
)
|
(6,471
|
)
|
(18,740
|
)
|
(19,414
|
)
|
|||||||
|
Net income attributable to noncontrolling interests
|
(170
|
)
|
(1,340
|
)
|
(925
|
)
|
(3,842
|
)
|
|||||||
|
Net income attributable to unvested restricted stock awards
|
(623
|
)
|
(506
|
)
|
(1,736
|
)
|
(1,285
|
)
|
|||||||
|
Income from continuing operations attributable to Alexandria’s common stockholders – basic and diluted
|
32,659
|
|
27,806
|
|
81,779
|
|
88,756
|
|
|||||||
|
Loss from discontinued operations
|
—
|
|
(180
|
)
|
(43
|
)
|
(489
|
)
|
|||||||
|
Net income attributable to Alexandria’s common stockholders – basic and diluted
|
$
|
32,659
|
|
$
|
27,626
|
|
$
|
81,736
|
|
$
|
88,267
|
|
|||
|
Weighted-average shares of common stock
outstanding – basic and diluted
|
71,500
|
|
71,195
|
|
71,426
|
|
71,121
|
|
|||||||
|
EPS attributable to Alexandria’s common stockholders – basic and diluted:
|
|||||||||||||||
|
Continuing operations
|
$
|
0.46
|
|
$
|
0.39
|
|
$
|
1.14
|
|
$
|
1.25
|
|
|||
|
Discontinued operations
|
—
|
|
—
|
|
—
|
|
(0.01
|
)
|
|||||||
|
EPS – basic and diluted
|
$
|
0.46
|
|
$
|
0.39
|
|
$
|
1.14
|
|
$
|
1.24
|
|
|||
23
|
10.
|
Stockholders’ equity
|
“At the market” common stock offering program
During the nine months ended
September 30, 2015
, we sold an aggregate of
56,874
shares of common stock for gross proceeds of
$5.3 million
at an average stock price of
$94.02
and net proceeds of approximately
$5.1 million
, including commissions and other expenses of approximately
$295 thousand
.
Dividends
In September 2015, we declared cash dividends on our common stock for the
third quarter
of 2015, aggregating
$55.8 million
, or
$0.77
per share. Also in September 2015, we declared cash dividends on our Series D Convertible Preferred Stock for the
third quarter
of 2015, aggregating approximately
$4.2 million
, or
$0.4375
per share. Additionally, we declared cash dividends on our Series E cumulative redeemable preferred stock (“Series E Preferred Stock”) for the
third quarter
of 2015, aggregating approximately
$2.1 million
, or
$0.403125
per share. In October 2015, we paid the cash dividends on our common stock, Series D Preferred Stock, and Series E Preferred Stock for the
third quarter
of 2015.
Accumulated other comprehensive income (loss)
Accumulated other comprehensive income (loss) attributable to Alexandria consists of the following (in thousands):
|
|
Unrealized Gains on Marketable Securities
|
Unrealized Losses on Interest Rate Swap Agreements
|
Unrealized Losses on Foreign Currency Translation
|
Total
|
||||||||||||
|
Balance as of December 31, 2014
|
$
|
52,367
|
|
$
|
(909
|
)
|
$
|
(52,086
|
)
|
$
|
(628
|
)
|
||||
|
Other comprehensive income (loss) before reclassifications
|
54,004
|
|
(9,712
|
)
|
(17,072
|
)
|
27,220
|
|
||||||||
|
Amounts reclassified from other comprehensive (loss) income
|
(2,503
|
)
|
1,942
|
|
9,236
|
|
8,675
|
|
||||||||
|
51,501
|
|
(7,770
|
)
|
(7,836
|
)
|
35,895
|
|
|||||||||
|
Amounts attributable to noncontrolling interest
|
—
|
|
—
|
|
(29
|
)
|
(29
|
)
|
||||||||
|
Net other comprehensive income (loss)
|
51,501
|
|
(7,770
|
)
|
(7,865
|
)
|
35,866
|
|
||||||||
|
Balance as of September 30, 2015
|
$
|
103,868
|
|
$
|
(8,679
|
)
|
$
|
(59,951
|
)
|
$
|
35,238
|
|
||||
Preferred stock and excess stock authorizations
Our charter authorizes the issuance of up to
100.0 million
shares of preferred stock, of which
14.7 million
shares were issued and outstanding as of
September 30, 2015
. In addition,
200.0 million
shares of “excess stock” (as defined in our charter) are authorized,
none
of which were issued and outstanding as of
September 30, 2015
.
24
|
11.
|
Noncontrolling interests
|
Noncontrolling interests represent the third-party interests in certain entities in which we have a controlling interest. These entities owned
four
projects as of
September 30, 2015
, and are included in our consolidated financial statements. Noncontrolling interests are adjusted for additional contributions and distributions, the proportionate share of the net earnings or losses, and other comprehensive income or loss. Distributions, profits, and losses related to these entities are allocated in accordance with the respective operating agreements.
The following table represents income from continuing operations and discontinued operations attributable to Alexandria Real Estate Equities, Inc., for the three and
nine months ended September 30, 2015
and 2014, excluding the amounts attributable to these noncontrolling interests (in thousands):
|
Three Months Ended September 30,
|
Nine Months Ended September 30,
|
|||||||||||||||
|
2015
|
2014
|
2015
|
2014
|
|||||||||||||
|
Income from continuing operations attributable to Alexandria
|
$
|
39,529
|
|
$
|
34,775
|
|
$
|
102,255
|
|
$
|
108,650
|
|
||||
|
Loss from discontinued operations
|
$
|
—
|
|
$
|
(180
|
)
|
$
|
(43
|
)
|
$
|
(489
|
)
|
||||
Certain of our noncontrolling interests have the right to require us to redeem their ownership interests in the respective entities. We classify these ownership interests in the entities as redeemable noncontrolling interests outside of total equity in the accompanying consolidated balance sheets. Redeemable noncontrolling interests are adjusted for additional contributions and distributions, the proportionate share of the net earnings or losses, and other comprehensive income or loss. If the amount of a redeemable noncontrolling interest is less than the maximum redemption value at the balance sheet date, such amount is adjusted to the maximum redemption value. Subsequent declines in the redemption value are recognized only to the extent that previous increases have been recognized.
During the three months ended March 31, 2015, we executed an agreement to purchase the outstanding
10%
noncontrolling interest in our
1.2 million
RSF campus at Alexandria Technology Square
®
for
$108.3 million
. The first installment of
$54.3 million
was paid on April 1, 2015, and the second installment of
$54.0 million
is due on April 1, 2016. Upon execution of the purchase agreement, we recognized a liability representing the fair value of the aggregate consideration, primarily consisting of the purchase price in accounts payable, accrued expenses, and tenant security deposits on our accompanying consolidated balance sheet. We measured the fair value of the liability using significant observable inputs, including a discount rate that approximates our cost of debt capital in effect during the period the liability is outstanding. The difference between the noncontrolling interest purchase liability and the noncontrolling interest balance of
$48.5 million
was recognized as a reduction of additional paid-in capital.
25
|
12.
|
Assets classified as “held for sale”
|
On October 1, 2014, we adopted an Accounting Standards Update on the reporting of discontinued operations that raised the threshold for classification of assets “held for sale” as discontinued operations. As of
September 30, 2015
, there are no properties which meet the criteria for classification as a discontinued operation in our consolidated financial statements.
The following is a summary of net assets “held for sale” as of
September 30, 2015
, and
December 31, 2014
, (in thousands):
|
September 30, 2015
|
December 31, 2014
|
||||||
|
Investments in real estate
|
$
|
138,200
|
|
$
|
173,706
|
|
|
|
Other assets
|
6,659
|
|
10,147
|
|
|||
|
Total assets
|
144,859
|
|
183,853
|
|
|||
|
|
|
||||||
|
Total liabilities
|
—
|
|
(6,044
|
)
|
|||
|
Net assets classified as “held for sale”
(1)
|
$
|
144,859
|
|
$
|
177,809
|
|
|
|
(1)
|
As of
September 30, 2015
, net assets classified as “held for sale” were composed of
three
properties.
|
The following is a summary of the income (loss) included in our income from continuing operations for the
three and nine months ended September 30, 2015
and
2014
, from assets classified as “held for sale” (in thousands):
|
Three Months Ended September 30,
|
Nine Months Ended September 30,
|
|||||||||||||||
|
2015
|
2014
|
2015
|
2014
|
|||||||||||||
|
Total revenues
|
$
|
3,454
|
|
$
|
3,108
|
|
$
|
9,694
|
|
$
|
9,418
|
|
||||
|
Operating expenses
|
(1,163
|
)
|
(1,134
|
)
|
(3,293
|
)
|
(2,971
|
)
|
||||||||
|
Total revenues less operating expenses from assets “held for sale”
|
2,291
|
|
1,974
|
|
6,401
|
|
|
6,447
|
|
|||||||
|
Depreciation expense
|
—
|
|
(2,025
|
)
|
(503
|
)
|
(6,103
|
)
|
||||||||
|
Impairment of real estate
|
—
|
|
(295
|
)
|
(14,510
|
)
|
(295
|
)
|
||||||||
|
Income (loss) from assets “held for sale”
(1)
|
$
|
2,291
|
|
$
|
(346
|
)
|
$
|
(8,612
|
)
|
$
|
49
|
|
||||
|
(1)
|
Includes the results of operations of
three
properties with an aggregate
317,060
RSF that were classified as “held for sale” as of
September 30, 2015
, and
three
properties with an aggregate
196,859
RSF that were sold during the
nine months ended September 30, 2015
, but do not qualify for classification as discontinued operations. For additional information, refer to Note 2 – “Basis of Presentation and Summary of Significant Accounting Policies” to our unaudited consolidated financial statements under Item 1 of this report.
|
26
|
13.
|
Subsequent events
|
Repayment of Secured Note Payable
In October 2015, we repaid a
$76 million
secured note payable with an effective interest rate of
5.73%
.
Issuance of Secured Construction Loan
In October 2015, we closed a secured construction loan with aggregate commitments available for borrowing aggregating
$350.0 million
, for our development project at 50/60 Binney Street in our Cambridge submarket. This loan bears interest at a rate of LIBOR+150 bps.
Sale of partial interest in 1500 Owens
In October 2015, we executed an agreement to sell a
49.9%
interest in our
158,267
RSF, property at 1500 Owens Street in our Mission Bay submarket in San Francisco to a high-quality institutional investor for
$73.4 million
, with closing in the fourth quarter of 2015.
Sale of 75/125 Shoreway Road
In October 2015, we executed an agreement for the sale of 75/125 Shoreway Road in our Palo Alto/Stanford Research Park submarket in San Francisco, to a high-quality institutional investor for a sales price of
$38.5 million
; with closing in the fourth quarter of 2015.
27
|
14.
|
Condensed consolidating financial information
|
Alexandria Real Estate Equities, Inc. (the “Issuer”) has sold certain debt securities registered under the Securities Act of 1933, as amended, that are fully and unconditionally guaranteed by Alexandria Real Estate Equities, L.P. (the “LP” or the “Guarantor Subsidiary”), an indirectly 100% owned subsidiary of the Issuer. The Company’s other subsidiaries, including, but not limited to, the subsidiaries that own substantially all of its real estate (collectively, the “Combined Non-Guarantor Subsidiaries”), will not provide a guarantee of such securities, including the subsidiaries that are partially or 100% owned by the LP. The following condensed consolidating financial information presents the condensed consolidating balance sheets as of
September 30, 2015
, and
December 31, 2014
, the condensed consolidating statements of income and comprehensive income for the
three and nine months ended September 30, 2015
and
2014
, and the condensed consolidating statements of cash flows for the
nine months ended September 30, 2015
and
2014
, for the Issuer, the Guarantor Subsidiary, and the Combined Non-Guarantor Subsidiaries, as well as the eliminations necessary to arrive at the information for Alexandria Real Estate Equities, Inc., on a consolidated basis, and consolidated amounts. In presenting the condensed consolidating financial statements, the equity method of accounting has been applied to (i) the Issuer’s interests in the Guarantor Subsidiary and the Combined Non-Guarantor Subsidiaries, (ii) the Guarantor Subsidiary’s interests in the Combined Non-Guarantor Subsidiaries, and (iii) the Combined Non-Guarantor Subsidiaries’ interests in the Guarantor Subsidiary, where applicable, even though all such subsidiaries meet the requirements to be consolidated under GAAP. All intercompany balances and transactions between the Issuer, the Guarantor Subsidiary, and the Combined Non-Guarantor Subsidiaries have been eliminated, as shown in the column “Eliminations.” All assets and liabilities have been allocated to the Issuer, the Guarantor Subsidiary, and the Combined Non-Guarantor Subsidiaries generally based on legal entity ownership.
28
|
14.
|
Condensed consolidating financial information (continued)
|
Condensed Consolidating Balance Sheet
as of
September 30, 2015
(In thousands)
(Unaudited)
|
Alexandria Real Estate Equities, Inc.
(Issuer)
|
Alexandria
Real Estate
Equities, L.P.
(Guarantor
Subsidiary)
|
Combined
Non-
Guarantor
Subsidiaries
|
Eliminations
|
Consolidated
|
|||||||||||||||
|
Assets
|
|||||||||||||||||||
|
Investments in real estate
|
$
|
—
|
|
$
|
—
|
|
$
|
7,654,209
|
|
$
|
—
|
|
$
|
7,654,209
|
|
||||
|
Cash and cash equivalents
|
42,738
|
|
8
|
|
33,637
|
|
—
|
|
76,383
|
|
|||||||||
|
Restricted cash
|
95
|
|
—
|
|
36,898
|
|
—
|
|
36,993
|
|
|||||||||
|
Tenant receivables
|
—
|
|
—
|
|
10,124
|
|
—
|
|
10,124
|
|
|||||||||
|
Deferred rent
|
—
|
|
—
|
|
267,954
|
|
—
|
|
267,954
|
|
|||||||||
|
Deferred leasing and financing costs
|
31,708
|
|
—
|
|
190,635
|
|
—
|
|
222,343
|
|
|||||||||
|
Investments
|
—
|
|
4,711
|
|
325,859
|
|
—
|
|
330,570
|
|
|||||||||
|
Investments in and advances to affiliates
|
7,370,645
|
|
6,685,933
|
|
136,885
|
|
(14,193,463
|
)
|
—
|
|
|||||||||
|
Other assets
|
24,470
|
|
—
|
|
114,298
|
|
—
|
|
138,768
|
|
|||||||||
|
Total assets
|
$
|
7,469,656
|
|
$
|
6,690,652
|
|
$
|
8,770,499
|
|
$
|
(14,193,463
|
)
|
$
|
8,737,344
|
|
||||
|
Liabilities, Noncontrolling Interests, and Equity
|
|||||||||||||||||||
|
Secured notes payable
|
$
|
—
|
|
$
|
—
|
|
$
|
773,619
|
|
$
|
—
|
|
$
|
773,619
|
|
||||
|
Unsecured senior notes payable
|
1,747,613
|
|
—
|
|
—
|
|
—
|
|
1,747,613
|
|
|||||||||
|
Unsecured senior line of credit
|
843,000
|
|
—
|
|
—
|
|
—
|
|
843,000
|
|
|||||||||
|
Unsecured senior bank term loans
|
950,000
|
|
—
|
|
—
|
|
—
|
|
950,000
|
|
|||||||||
|
Accounts payable, accrued expenses, and tenant security deposits
|
108,828
|
|
—
|
|
477,766
|
|
—
|
|
586,594
|
|
|||||||||
|
Dividends payable
|
61,053
|
|
—
|
|
287
|
|
—
|
|
61,340
|
|
|||||||||
|
Total liabilities
|
3,710,494
|
|
—
|
|
1,251,672
|
|
—
|
|
4,962,166
|
|
|||||||||
|
Redeemable noncontrolling interests
|
—
|
|
—
|
|
14,218
|
|
—
|
|
14,218
|
|
|||||||||
|
Alexandria’s stockholders’ equity
|
3,759,162
|
|
6,690,652
|
|
7,502,811
|
|
(14,193,463
|
)
|
3,759,162
|
|
|||||||||
|
Noncontrolling interests
|
—
|
|
—
|
|
1,798
|
|
—
|
|
1,798
|
|
|||||||||
|
Total equity
|
3,759,162
|
|
6,690,652
|
|
7,504,609
|
|
(14,193,463
|
)
|
3,760,960
|
|
|||||||||
|
Total liabilities, noncontrolling interests, and equity
|
$
|
7,469,656
|
|
$
|
6,690,652
|
|
$
|
8,770,499
|
|
$
|
(14,193,463
|
)
|
$
|
8,737,344
|
|
||||
29
|
14.
|
Condensed consolidating financial information (continued)
|
Condensed Consolidating Balance Sheet
as of
December 31, 2014
(In thousands)
(Unaudited)
|
Alexandria
Real Estate
Equities, Inc.
(Issuer)
|
Alexandria
Real Estate
Equities, L.P.
(Guarantor
Subsidiary)
|
Combined
Non-
Guarantor
Subsidiaries
|
Eliminations
|
Consolidated
|
|||||||||||||||
|
Assets
|
|||||||||||||||||||
|
Investments in real estate
|
$
|
—
|
|
$
|
—
|
|
$
|
7,226,016
|
|
$
|
—
|
|
$
|
7,226,016
|
|
||||
|
Cash and cash equivalents
|
52,491
|
|
63
|
|
33,457
|
|
—
|
|
86,011
|
|
|||||||||
|
Restricted cash
|
67
|
|
—
|
|
26,817
|
|
—
|
|
26,884
|
|
|||||||||
|
Tenant receivables
|
—
|
|
—
|
|
10,548
|
|
—
|
|
10,548
|
|
|||||||||
|
Deferred rent
|
—
|
|
—
|
|
234,124
|
|
—
|
|
234,124
|
|
|||||||||
|
Deferred leasing and financing costs
|
35,462
|
|
—
|
|
166,336
|
|
—
|
|
201,798
|
|
|||||||||
|
Investments
|
—
|
|
5,235
|
|
231,154
|
|
—
|
|
236,389
|
|
|||||||||
|
Investments in and advances to affiliates
|
6,874,866
|
|
6,295,852
|
|
128,943
|
|
(13,299,661
|
)
|
—
|
|
|||||||||
|
Other assets
|
19,461
|
|
—
|
|
94,805
|
|
—
|
|
114,266
|
|
|||||||||
|
Total assets
|
$
|
6,982,347
|
|
$
|
6,301,150
|
|
$
|
8,152,200
|
|
$
|
(13,299,661
|
)
|
$
|
8,136,036
|
|
||||
|
Liabilities, Noncontrolling Interests, and Equity
|
|||||||||||||||||||
|
Secured notes payable
|
$
|
—
|
|
$
|
—
|
|
$
|
652,209
|
|
$
|
—
|
|
$
|
652,209
|
|
||||
|
Unsecured senior notes payable
|
1,747,370
|
|
—
|
|
—
|
|
—
|
|
1,747,370
|
|
|||||||||
|
Unsecured senior line of credit
|
304,000
|
|
—
|
|
—
|
|
—
|
|
304,000
|
|
|||||||||
|
Unsecured senior bank term loans
|
975,000
|
|
—
|
|
—
|
|
—
|
|
975,000
|
|
|||||||||
|
Accounts payable, accrued expenses, and tenant security deposits
|
69,013
|
|
—
|
|
420,072
|
|
—
|
|
489,085
|
|
|||||||||
|
Dividends payable
|
58,525
|
|
—
|
|
289
|
|
—
|
|
58,814
|
|
|||||||||
|
Total liabilities
|
3,153,908
|
|
—
|
|
1,072,570
|
|
—
|
|
4,226,478
|
|
|||||||||
|
Redeemable noncontrolling interests
|
—
|
|
—
|
|
14,315
|
|
—
|
|
14,315
|
|
|||||||||
|
Alexandria’s stockholders’ equity
|
3,828,439
|
|
6,301,150
|
|
6,998,511
|
|
(13,299,661
|
)
|
3,828,439
|
|
|||||||||
|
Noncontrolling interests
|
—
|
|
—
|
|
66,804
|
|
—
|
|
66,804
|
|
|||||||||
|
Total equity
|
3,828,439
|
|
6,301,150
|
|
7,065,315
|
|
(13,299,661
|
)
|
3,895,243
|
|
|||||||||
|
Total liabilities, noncontrolling interests, and equity
|
$
|
6,982,347
|
|
$
|
6,301,150
|
|
$
|
8,152,200
|
|
$
|
(13,299,661
|
)
|
$
|
8,136,036
|
|
||||
30
|
14.
|
Condensed consolidating financial information (continued)
|
Condensed Consolidating Statement of Income
for the
Three Months Ended September 30, 2015
(In thousands)
(Unaudited)
|
Alexandria
Real Estate
Equities, Inc.
(Issuer)
|
Alexandria
Real Estate
Equities, L.P.
(Guarantor
Subsidiary)
|
Combined
Non-
Guarantor
Subsidiaries
|
Eliminations
|
Consolidated
|
|||||||||||||||
|
Revenues:
|
|||||||||||||||||||
|
Rental
|
$
|
—
|
|
$
|
—
|
|
$
|
155,311
|
|
$
|
—
|
|
$
|
155,311
|
|
||||
|
Tenant recoveries
|
—
|
|
—
|
|
56,119
|
|
—
|
|
56,119
|
|
|||||||||
|
Other income
|
3,355
|
|
(87
|
)
|
8,025
|
|
(4,113
|
)
|
7,180
|
|
|||||||||
|
Total revenues
|
3,355
|
|
(87
|
)
|
219,455
|
|
(4,113
|
)
|
218,610
|
|
|||||||||
|
Expenses:
|
|||||||||||||||||||
|
Rental operations
|
—
|
|
—
|
|
68,846
|
|
—
|
|
68,846
|
|
|||||||||
|
General and administrative
|
13,511
|
|
—
|
|
5,745
|
|
(4,113
|
)
|
15,143
|
|
|||||||||
|
Interest
|
20,470
|
|
—
|
|
7,209
|
|
—
|
|
27,679
|
|
|||||||||
|
Depreciation and amortization
|
1,799
|
|
—
|
|
66,154
|
|
—
|
|
67,953
|
|
|||||||||
|
Total expenses
|
35,780
|
|
—
|
|
147,954
|
|
(4,113
|
)
|
179,621
|
|
|||||||||
|
Equity in earnings of unconsolidated joint ventures
|
—
|
|
—
|
|
710
|
|
—
|
|
710
|
|
|||||||||
|
Equity in earnings of affiliates
|
71,954
|
|
63,964
|
|
1,259
|
|
(137,177
|
)
|
—
|
|
|||||||||
|
Net income
|
39,529
|
|
63,877
|
|
73,470
|
|
(137,177
|
)
|
39,699
|
|
|||||||||
|
Dividends on preferred stock
|
(6,247
|
)
|
—
|
|
—
|
|
—
|
|
(6,247
|
)
|
|||||||||
|
Net income attributable to noncontrolling interests
|
—
|
|
—
|
|
(170
|
)
|
—
|
|
(170
|
)
|
|||||||||
|
Net income attributable to unvested restricted stock awards
|
(623
|
)
|
—
|
|
—
|
|
—
|
|
(623
|
)
|
|||||||||
|
Net income attributable to Alexandria’s common stockholders
|
$
|
32,659
|
|
$
|
63,877
|
|
$
|
73,300
|
|
$
|
(137,177
|
)
|
$
|
32,659
|
|
||||
31
|
14.
|
Condensed consolidating financial information (continued)
|
Condensed Consolidating Statement of Income
for the
Three Months Ended September 30, 2014
(In thousands)
(Unaudited)
|
Alexandria
Real Estate
Equities, Inc.
(Issuer)
|
Alexandria
Real Estate
Equities, L.P.
(Guarantor
Subsidiary)
|
Combined
Non-
Guarantor
Subsidiaries
|
Eliminations
|
Consolidated
|
|||||||||||||||
|
Revenues:
|
|||||||||||||||||||
|
Rental
|
$
|
—
|
|
$
|
—
|
|
$
|
137,718
|
|
$
|
—
|
|
$
|
137,718
|
|
||||
|
Tenant recoveries
|
—
|
|
—
|
|
45,572
|
|
—
|
|
45,572
|
|
|||||||||
|
Other income
|
2,797
|
|
(1,264
|
)
|
4,369
|
|
(3,577
|
)
|
2,325
|
|
|||||||||
|
Total revenues
|
2,797
|
|
(1,264
|
)
|
187,659
|
|
(3,577
|
)
|
185,615
|
|
|||||||||
|
Expenses:
|
|||||||||||||||||||
|
Rental operations
|
—
|
|
—
|
|
57,423
|
|
—
|
|
57,423
|
|
|||||||||
|
General and administrative
|
11,369
|
|
—
|
|
4,817
|
|
(3,577
|
)
|
12,609
|
|
|||||||||
|
Interest
|
15,307
|
|
—
|
|
5,248
|
|
—
|
|
20,555
|
|
|||||||||
|
Depreciation and amortization
|
1,408
|
|
—
|
|
56,980
|
|
—
|
|
58,388
|
|
|||||||||
|
Loss on early extinguishment of debt
|
525
|
|
—
|
|
—
|
|
—
|
|
525
|
|
|||||||||
|
Total expenses
|
28,609
|
|
—
|
|
124,468
|
|
(3,577
|
)
|
149,500
|
|
|||||||||
|
Equity in earnings of affiliates
|
60,415
|
|
58,381
|
|
1,127
|
|
(119,923
|
)
|
—
|
|
|||||||||
|
Income from continuing operations
|
34,603
|
|
57,117
|
|
64,318
|
|
(119,923
|
)
|
36,115
|
|
|||||||||
|
Loss from discontinued operations
|
—
|
|
—
|
|
(180
|
)
|
—
|
|
(180
|
)
|
|||||||||
|
Gain on sales of real estate – land parcels
|
—
|
|
—
|
|
8
|
|
—
|
|
8
|
|
|||||||||
|
Net income
|
34,603
|
|
57,117
|
|
64,146
|
|
(119,923
|
)
|
35,943
|
|
|||||||||
|
Dividends on preferred stock
|
(6,471
|
)
|
—
|
|
—
|
|
—
|
|
(6,471
|
)
|
|||||||||
|
Net income attributable to noncontrolling interests
|
—
|
|
—
|
|
(1,340
|
)
|
—
|
|
(1,340
|
)
|
|||||||||
|
Net income attributable to unvested restricted stock awards
|
(506
|
)
|
—
|
|
—
|
|
—
|
|
(506
|
)
|
|||||||||
|
Net income attributable to Alexandria’s common stockholders
|
$
|
27,626
|
|
$
|
57,117
|
|
$
|
62,806
|
|
$
|
(119,923
|
)
|
$
|
27,626
|
|
||||
32
|
14.
|
Condensed consolidating financial information (continued)
|
Condensed Consolidating Statement of Income
for the
Nine Months Ended September 30, 2015
(In thousands)
(Unaudited)
|
Alexandria
Real Estate
Equities, Inc.
(Issuer)
|
Alexandria
Real Estate
Equities, L.P.
(Guarantor
Subsidiary)
|
Combined
Non-
Guarantor
Subsidiaries
|
Eliminations
|
Consolidated
|
|||||||||||||||
|
Revenues:
|
|||||||||||||||||||
|
Rental
|
$
|
—
|
|
$
|
—
|
|
$
|
450,724
|
|
$
|
—
|
|
$
|
450,724
|
|
||||
|
Tenant recoveries
|
—
|
|
—
|
|
154,107
|
|
—
|
|
154,107
|
|
|||||||||
|
Other income
|
9,890
|
|
(128
|
)
|
17,014
|
|
(12,088
|
)
|
14,688
|
|
|||||||||
|
Total revenues
|
9,890
|
|
(128
|
)
|
621,845
|
|
(12,088
|
)
|
619,519
|
|
|||||||||
|
Expenses:
|
|||||||||||||||||||
|
Rental operations
|
—
|
|
—
|
|
192,319
|
|
—
|
|
192,319
|
|
|||||||||
|
General and administrative
|
38,960
|
|
—
|
|
17,647
|
|
(12,088
|
)
|
44,519
|
|
|||||||||
|
Interest
|
57,494
|
|
—
|
|
20,089
|
|
—
|
|
77,583
|
|
|||||||||
|
Depreciation and amortization
|
4,515
|
|
—
|
|
184,529
|
|
—
|
|
189,044
|
|
|||||||||
|
Impairment of real estate
|
—
|
|
—
|
|
14,510
|
|
—
|
|
14,510
|
|
|||||||||
|
Loss on early extinguishment of debt
|
189
|
|
—
|
|
—
|
|
—
|
|
189
|
|
|||||||||
|
Total expenses
|
101,158
|
|
—
|
|
429,094
|
|
(12,088
|
)
|
518,164
|
|
|||||||||
|
Equity in earnings of unconsolidated joint ventures
|
—
|
|
—
|
|
1,825
|
|
—
|
|
1,825
|
|
|||||||||
|
Equity in earnings of affiliates
|
193,480
|
|
174,800
|
|
3,446
|
|
(371,726
|
)
|
—
|
|
|||||||||
|
Income from continuing operations
|
102,212
|
|
174,672
|
|
198,022
|
|
(371,726
|
)
|
103,180
|
|
|||||||||
|
Loss from discontinued operations
|
—
|
|
—
|
|
(43
|
)
|
—
|
|
(43
|
)
|
|||||||||
|
Net income
|
102,212
|
|
174,672
|
|
197,979
|
|
(371,726
|
)
|
103,137
|
|
|||||||||
|
Dividends on preferred stock
|
(18,740
|
)
|
—
|
|
—
|
|
—
|
|
(18,740
|
)
|
|||||||||
|
Net income attributable to noncontrolling interests
|
—
|
|
—
|
|
(925
|
)
|
—
|
|
(925
|
)
|
|||||||||
|
Net income attributable to unvested restricted stock awards
|
(1,736
|
)
|
—
|
|
—
|
|
—
|
|
(1,736
|
)
|
|||||||||
|
Net income attributable to Alexandria’s common stockholders
|
$
|
81,736
|
|
$
|
174,672
|
|
$
|
197,054
|
|
$
|
(371,726
|
)
|
$
|
81,736
|
|
||||
33
|
14.
|
Condensed consolidating financial information (continued)
|
Condensed Consolidating Statement of Income
for the
Nine Months Ended September 30, 2014
(In thousands)
(Unaudited)
|
Alexandria
Real Estate
Equities, Inc.
(Issuer)
|
Alexandria
Real Estate
Equities, L.P.
(Guarantor
Subsidiary)
|
Combined
Non-
Guarantor
Subsidiaries
|
Eliminations
|
Consolidated
|
|||||||||||||||
|
Revenues:
|
|||||||||||||||||||
|
Rental
|
$
|
—
|
|
$
|
—
|
|
$
|
403,280
|
|
$
|
—
|
|
$
|
403,280
|
|
||||
|
Tenant recoveries
|
—
|
|
—
|
|
128,198
|
|
—
|
|
128,198
|
|
|||||||||
|
Other income
|
8,632
|
|
(2,799
|
)
|
11,534
|
|
(10,642
|
)
|
6,725
|
|
|||||||||
|
Total revenues
|
8,632
|
|
(2,799
|
)
|
543,012
|
|
(10,642
|
)
|
538,203
|
|
|||||||||
|
Expenses:
|
|||||||||||||||||||
|
Rental operations
|
—
|
|
—
|
|
162,283
|
|
—
|
|
162,283
|
|
|||||||||
|
General and administrative
|
33,735
|
|
—
|
|
16,576
|
|
(10,642
|
)
|
39,669
|
|
|||||||||
|
Interest
|
41,339
|
|
—
|
|
15,772
|
|
—
|
|
57,111
|
|
|||||||||
|
Depreciation and amortization
|
4,335
|
|
—
|
|
161,788
|
|
—
|
|
166,123
|
|
|||||||||
|
Loss on early extinguishment of debt
|
525
|
|
—
|
|
—
|
|
—
|
|
525
|
|
|||||||||
|
Total expenses
|
79,934
|
|
—
|
|
356,419
|
|
(10,642
|
)
|
425,711
|
|
|||||||||
|
Equity in earnings of affiliates
|
180,275
|
|
172,989
|
|
3,356
|
|
(356,620
|
)
|
—
|
|
|||||||||
|
Income from continuing operations
|
108,973
|
|
170,190
|
|
189,949
|
|
(356,620
|
)
|
112,492
|
|
|||||||||
|
Loss from discontinued operations
|
(7
|
)
|
—
|
|
(482
|
)
|
—
|
|
(489
|
)
|
|||||||||
|
Gain on sales of real estate – land parcels
|
—
|
|
—
|
|
805
|
|
—
|
|
805
|
|
|||||||||
|
Net income
|
108,966
|
|
170,190
|
|
190,272
|
|
(356,620
|
)
|
112,808
|
|
|||||||||
|
Dividends on preferred stock
|
(19,414
|
)
|
—
|
|
—
|
|
—
|
|
(19,414
|
)
|
|||||||||
|
Net income attributable to noncontrolling interests
|
—
|
|
—
|
|
(3,842
|
)
|
—
|
|
(3,842
|
)
|
|||||||||
|
Net income attributable to unvested restricted stock awards
|
(1,285
|
)
|
—
|
|
—
|
|
—
|
|
(1,285
|
)
|
|||||||||
|
Net income attributable to Alexandria’s common stockholders
|
$
|
88,267
|
|
$
|
170,190
|
|
$
|
186,430
|
|
$
|
(356,620
|
)
|
$
|
88,267
|
|
||||
34
|
14.
|
Condensed consolidating financial information (continued)
|
Condensed Consolidating Statement of Comprehensive Income
for the
Three Months Ended September 30, 2015
(In thousands)
(Unaudited)
|
Alexandria
Real Estate
Equities, Inc.
(Issuer)
|
Alexandria
Real Estate
Equities, L.P.
(Guarantor
Subsidiary)
|
Combined
Non-
Guarantor
Subsidiaries
|
Eliminations
|
Consolidated
|
|||||||||||||||
|
Net income
|
$
|
39,529
|
|
$
|
63,877
|
|
$
|
73,470
|
|
$
|
(137,177
|
)
|
$
|
39,699
|
|
||||
|
Other comprehensive loss:
|
|||||||||||||||||||
|
Unrealized losses on marketable equity securities:
|
|||||||||||||||||||
|
Unrealized holding losses arising during the period
|
—
|
|
(41
|
)
|
(29,791
|
)
|
—
|
|
(29,832
|
)
|
|||||||||
|
Reclassification adjustment for gains included in net income
|
—
|
|
(117
|
)
|
(4,851
|
)
|
—
|
|
(4,968
|
)
|
|||||||||
|
Unrealized losses on marketable equity securities, net
|
—
|
|
(158
|
)
|
(34,642
|
)
|
—
|
|
(34,800
|
)
|
|||||||||
|
Unrealized losses on interest rate swap agreements:
|
|||||||||||||||||||
|
Unrealized interest rate swap losses arising during the period
|
(5,474
|
)
|
—
|
|
—
|
|
—
|
|
(5,474
|
)
|
|||||||||
|
Reclassification adjustment for amortization of interest income included in net income
|
727
|
|
—
|
|
—
|
|
—
|
|
727
|
|
|||||||||
|
Unrealized losses on interest rate swap agreements, net
|
(4,747
|
)
|
—
|
|
—
|
|
—
|
|
(4,747
|
)
|
|||||||||
|
Unrealized losses on foreign currency translation:
|
|||||||||||||||||||
|
Unrealized foreign currency translation losses during the period
|
—
|
|
—
|
|
(9,294
|
)
|
—
|
|
(9,294
|
)
|
|||||||||
|
Unrealized losses on foreign currency translation, net
|
—
|
|
—
|
|
(9,294
|
)
|
—
|
|
(9,294
|
)
|
|||||||||
|
Total other comprehensive loss
|
(4,747
|
)
|
(158
|
)
|
(43,936
|
)
|
—
|
|
(48,841
|
)
|
|||||||||
|
Comprehensive income
|
34,782
|
|
63,719
|
|
29,534
|
|
(137,177
|
)
|
(9,142
|
)
|
|||||||||
|
Less: comprehensive income attributable to noncontrolling interests
|
—
|
|
—
|
|
(71
|
)
|
—
|
|
(71
|
)
|
|||||||||
|
Comprehensive income attributable to Alexandria’s common stockholders
|
$
|
34,782
|
|
$
|
63,719
|
|
$
|
29,463
|
|
$
|
(137,177
|
)
|
$
|
(9,213
|
)
|
||||
35
|
14.
|
Condensed consolidating financial information (continued)
|
Condensed Consolidating Statement of Comprehensive Income
for the
Three Months Ended September 30, 2014
(In thousands)
(Unaudited)
|
Alexandria
Real Estate
Equities, Inc.
(Issuer)
|
Alexandria
Real Estate
Equities, L.P.
(Guarantor
Subsidiary)
|
Combined
Non-
Guarantor
Subsidiaries
|
Eliminations
|
Consolidated
|
|||||||||||||||
|
Net income
|
$
|
34,603
|
|
$
|
57,117
|
|
$
|
64,146
|
|
$
|
(119,923
|
)
|
$
|
35,943
|
|
||||
|
Other comprehensive income (loss):
|
|||||||||||||||||||
|
Unrealized losses on marketable equity securities:
|
|||||||||||||||||||
|
Unrealized holding losses arising during the period
|
—
|
|
(310
|
)
|
(2,144
|
)
|
—
|
|
(2,454
|
)
|
|||||||||
|
Reclassification adjustment for losses included in net income
|
—
|
|
—
|
|
111
|
|
—
|
|
111
|
|
|||||||||
|
Unrealized losses on marketable equity securities, net
|
—
|
|
(310
|
)
|
(2,033
|
)
|
—
|
|
(2,343
|
)
|
|||||||||
|
Unrealized gains on interest rate swap agreements:
|
|||||||||||||||||||
|
Unrealized interest rate swap gains arising during the period
|
1,206
|
|
—
|
|
—
|
|
—
|
|
1,206
|
|
|||||||||
|
Reclassification adjustment for amortization of interest expense included in net income
|
1,129
|
|
—
|
|
—
|
|
—
|
|
1,129
|
|
|||||||||
|
Unrealized gains on interest rate swap agreements, net
|
2,335
|
|
—
|
|
—
|
|
—
|
|
2,335
|
|
|||||||||
|
Unrealized losses on foreign currency translation:
|
|||||||||||||||||||
|
Unrealized foreign currency translation losses during the period
|
—
|
|
—
|
|
(12,259
|
)
|
—
|
|
(12,259
|
)
|
|||||||||
|
Reclassification adjustment for gains included in net income
|
—
|
|
—
|
|
(199
|
)
|
—
|
|
(199
|
)
|
|||||||||
|
Unrealized foreign currency translation losses, net
|
—
|
|
—
|
|
(12,458
|
)
|
—
|
|
(12,458
|
)
|
|||||||||
|
Total other comprehensive income (loss)
|
2,335
|
|
(310
|
)
|
(14,491
|
)
|
—
|
|
(12,466
|
)
|
|||||||||
|
Comprehensive income
|
36,938
|
|
56,807
|
|
49,655
|
|
(119,923
|
)
|
23,477
|
|
|||||||||
|
Less: comprehensive income attributable to noncontrolling interests
|
—
|
|
—
|
|
(1,340
|
)
|
—
|
|
(1,340
|
)
|
|||||||||
|
Comprehensive income attributable to Alexandria’s common stockholders
|
$
|
36,938
|
|
$
|
56,807
|
|
$
|
48,315
|
|
$
|
(119,923
|
)
|
$
|
22,137
|
|
||||
36
|
14.
|
Condensed consolidating financial information (continued)
|
Condensed Consolidating Statement of Comprehensive Income
for the
Nine Months Ended September 30, 2015
(In thousands)
(Unaudited)
|
Alexandria
Real Estate
Equities, Inc.
(Issuer)
|
Alexandria
Real Estate
Equities, L.P.
(Guarantor
Subsidiary)
|
Combined
Non-
Guarantor
Subsidiaries
|
Eliminations
|
Consolidated
|
|||||||||||||||
|
Net income
|
$
|
102,212
|
|
$
|
174,672
|
|
$
|
197,979
|
|
$
|
(371,726
|
)
|
$
|
103,137
|
|
||||
|
Other comprehensive (loss) income:
|
|||||||||||||||||||
|
Unrealized (losses) gains on marketable equity securities:
|
|||||||||||||||||||
|
Unrealized holding (losses) gains arising during the year
|
—
|
|
(19
|
)
|
54,023
|
|
—
|
|
54,004
|
|
|||||||||
|
Reclassification adjustment for gains included in net income
|
—
|
|
(76
|
)
|
(2,427
|
)
|
—
|
|
(2,503
|
)
|
|||||||||
|
Unrealized (losses) gains on marketable equity securities, net
|
—
|
|
(95
|
)
|
51,596
|
|
—
|
|
51,501
|
|
|||||||||
|
Unrealized losses on interest rate swap agreements:
|
|||||||||||||||||||
|
Unrealized interest rate swap losses arising during the year
|
(9,712
|
)
|
—
|
|
—
|
|
—
|
|
(9,712
|
)
|
|||||||||
|
Reclassification adjustment for amortization of interest expense included in net income
|
1,942
|
|
—
|
|
—
|
|
—
|
|
1,942
|
|
|||||||||
|
Unrealized losses on interest rate swap agreements, net
|
(7,770
|
)
|
—
|
|
—
|
|
—
|
|
(7,770
|
)
|
|||||||||
|
Unrealized losses on foreign currency translation:
|
|||||||||||||||||||
|
Unrealized foreign currency translation losses arising during the year
|
—
|
|
—
|
|
(17,072
|
)
|
—
|
|
(17,072
|
)
|
|||||||||
|
Reclassification adjustment for losses included in net income
|
—
|
|
—
|
|
9,236
|
|
—
|
|
9,236
|
|
|||||||||
|
Unrealized losses on foreign currency translation, net
|
—
|
|
—
|
|
(7,836
|
)
|
—
|
|
(7,836
|
)
|
|||||||||
|
Total other comprehensive (loss) income
|
(7,770
|
)
|
(95
|
)
|
43,760
|
|
—
|
|
35,895
|
|
|||||||||
|
Comprehensive income
|
94,442
|
|
174,577
|
|
241,739
|
|
(371,726
|
)
|
139,032
|
|
|||||||||
|
Less: comprehensive income attributable to noncontrolling interests
|
—
|
|
—
|
|
(954
|
)
|
—
|
|
(954
|
)
|
|||||||||
|
Comprehensive income attributable to Alexandria's common stockholders
|
$
|
94,442
|
|
$
|
174,577
|
|
$
|
240,785
|
|
$
|
(371,726
|
)
|
$
|
138,078
|
|
||||
37
|
14.
|
Condensed consolidating financial information (continued)
|
Condensed Consolidating Statement of Comprehensive Income
for the
Nine Months Ended September 30, 2014
(In thousands)
(Unaudited)
|
Alexandria
Real Estate
Equities, Inc.
(Issuer)
|
Alexandria
Real Estate
Equities, L.P.
(Guarantor
Subsidiary)
|
Combined
Non-
Guarantor
Subsidiaries
|
Eliminations
|
Consolidated
|
|||||||||||||||
|
Net income
|
$
|
108,966
|
|
$
|
170,190
|
|
$
|
190,272
|
|
$
|
(356,620
|
)
|
$
|
112,808
|
|
||||
|
Other comprehensive income:
|
|||||||||||||||||||
|
Unrealized gains on marketable equity securities:
|
|||||||||||||||||||
|
Unrealized holding gains arising during the year
|
—
|
|
—
|
|
13,591
|
|
—
|
|
13,591
|
|
|||||||||
|
Reclassification adjustment for losses included in net income
|
—
|
|
—
|
|
517
|
|
—
|
|
517
|
|
|||||||||
|
Unrealized gains on marketable equity securities, net
|
—
|
|
—
|
|
14,108
|
|
—
|
|
14,108
|
|
|||||||||
|
Unrealized gains on interest rate swap agreements:
|
|||||||||||||||||||
|
Unrealized interest rate swap losses arising during the year
|
(2,708
|
)
|
—
|
|
—
|
|
—
|
|
(2,708
|
)
|
|||||||||
|
Reclassification adjustment for amortization of interest expense included in net income
|
5,742
|
|
—
|
|
—
|
|
—
|
|
5,742
|
|
|||||||||
|
Unrealized gains on interest rate swap agreements, net
|
3,034
|
|
—
|
|
—
|
|
—
|
|
3,034
|
|
|||||||||
|
Unrealized losses on foreign currency translation:
|
|||||||||||||||||||
|
Unrealized foreign currency translation losses
|
—
|
|
—
|
|
(9,450
|
)
|
—
|
|
(9,450
|
)
|
|||||||||
|
Reclassification adjustment for gains included in net income
|
—
|
|
—
|
|
(199
|
)
|
—
|
|
(199
|
)
|
|||||||||
|
Unrealized losses on foreign currency translation, net
|
—
|
|
—
|
|
(9,649
|
)
|
—
|
|
(9,649
|
)
|
|||||||||
|
Total other comprehensive income
|
3,034
|
|
—
|
|
4,459
|
|
—
|
|
7,493
|
|
|||||||||
|
Comprehensive income
|
112,000
|
|
170,190
|
|
194,731
|
|
(356,620
|
)
|
120,301
|
|
|||||||||
|
Less: comprehensive income attributable to noncontrolling interests
|
—
|
|
—
|
|
(3,842
|
)
|
—
|
|
(3,842
|
)
|
|||||||||
|
Comprehensive income attributable to Alexandria’s common stockholders
|
$
|
112,000
|
|
$
|
170,190
|
|
$
|
190,889
|
|
$
|
(356,620
|
)
|
$
|
116,459
|
|
||||
38
|
14.
|
Condensed consolidating financial information (continued)
|
Condensed Consolidating Statement of Cash Flows
for the
Nine Months Ended September 30, 2015
(In thousands)
(Unaudited)
|
Alexandria Real
Estate Equities,
Inc. (Issuer)
|
Alexandria Real
Estate Equities,
L.P. (Guarantor
Subsidiary)
|
Combined
Non-Guarantor
Subsidiaries
|
Eliminations
|
Consolidated
|
|||||||||||||||
|
Operating Activities
|
|||||||||||||||||||
|
Net income
|
$
|
102,212
|
|
$
|
174,672
|
|
$
|
197,979
|
|
$
|
(371,726
|
)
|
$
|
103,137
|
|
||||
|
Adjustments to reconcile net income to net cash (used in) provided by operating activities:
|
|||||||||||||||||||
|
Depreciation and amortization
|
4,515
|
|
—
|
|
184,529
|
|
—
|
|
189,044
|
|
|||||||||
|
Loss on early extinguishment of debt
|
189
|
|
—
|
|
—
|
|
—
|
|
189
|
|
|||||||||
|
Impairment of real estate
|
—
|
|
—
|
|
14,510
|
|
—
|
|
14,510
|
|
|||||||||
|
Equity in earnings of unconsolidated joint ventures
|
—
|
|
—
|
|
(1,825
|
)
|
—
|
|
(1,825
|
)
|
|||||||||
|
Distributions of earnings from unconsolidated joint ventures
|
—
|
|
—
|
|
740
|
|
—
|
|
740
|
|
|||||||||
|
Amortization of loan fees
|
5,717
|
|
—
|
|
2,631
|
|
—
|
|
8,348
|
|
|||||||||
|
Amortization of debt discounts (premiums)
|
243
|
|
—
|
|
(525
|
)
|
—
|
|
(282
|
)
|
|||||||||
|
Amortization of acquired below-market leases
|
—
|
|
—
|
|
(5,121
|
)
|
—
|
|
(5,121
|
)
|
|||||||||
|
Deferred rent
|
—
|
|
—
|
|
(34,421
|
)
|
—
|
|
(34,421
|
)
|
|||||||||
|
Stock compensation expense
|
12,922
|
|
—
|
|
—
|
|
—
|
|
12,922
|
|
|||||||||
|
Equity in earnings of affiliates
|
(193,480
|
)
|
(174,800
|
)
|
(3,446
|
)
|
371,726
|
|
—
|
|
|||||||||
|
Investment gains
|
—
|
|
—
|
|
(22,368
|
)
|
—
|
|
(22,368
|
)
|
|||||||||
|
Investment losses
|
—
|
|
269
|
|
10,888
|
|
—
|
|
11,157
|
|
|||||||||
|
Changes in operating assets and liabilities:
|
|
|
|||||||||||||||||
|
Restricted cash
|
(28
|
)
|
—
|
|
52
|
|
—
|
|
24
|
|
|||||||||
|
Tenant receivables
|
—
|
|
—
|
|
380
|
|
—
|
|
380
|
|
|||||||||
|
Deferred leasing costs
|
—
|
|
—
|
|
(47,725
|
)
|
—
|
|
(47,725
|
)
|
|||||||||
|
Other assets
|
(9,228
|
)
|
—
|
|
(4,493
|
)
|
—
|
|
(13,721
|
)
|
|||||||||
|
Accounts payable, accrued expenses, and tenant security deposits
|
31,895
|
|
—
|
|
(472
|
)
|
—
|
|
31,423
|
|
|||||||||
|
Net cash (used in) provided by operating activities
|
(45,043
|
)
|
141
|
|
291,313
|
|
—
|
|
246,411
|
|
|||||||||
|
Investing Activities
|
|||||||||||||||||||
|
Proceeds from sale of real estate
|
—
|
|
—
|
|
92,455
|
|
—
|
|
92,455
|
|
|||||||||
|
Additions to real estate
|
—
|
|
—
|
|
(362,215
|
)
|
—
|
|
(362,215
|
)
|
|||||||||
|
Purchase of real estate
|
—
|
|
—
|
|
(248,933
|
)
|
—
|
|
(248,933
|
)
|
|||||||||
|
Deposits for investing activities
|
—
|
|
—
|
|
(6,707
|
)
|
—
|
|
(6,707
|
)
|
|||||||||
|
Investment in unconsolidated real estate joint ventures
|
—
|
|
—
|
|
(7,979
|
)
|
—
|
|
(7,979
|
)
|
|||||||||
|
Investments in subsidiaries
|
(302,455
|
)
|
(215,128
|
)
|
(4,493
|
)
|
522,076
|
|
—
|
|
|||||||||
|
Additions to investments
|
—
|
|
—
|
|
(67,965
|
)
|
—
|
|
(67,965
|
)
|
|||||||||
|
Sales of investments
|
—
|
|
6
|
|
39,584
|
|
—
|
|
39,590
|
|
|||||||||
|
Repayment of notes receivable
|
—
|
|
—
|
|
4,264
|
|
—
|
|
4,264
|
|
|||||||||
|
Net cash used in investing activities
|
$
|
(302,455
|
)
|
$
|
(215,122
|
)
|
$
|
(561,989
|
)
|
$
|
522,076
|
|
$
|
(557,490
|
)
|
||||
39
|
14.
|
Condensed consolidating financial information (continued)
|
Condensed Consolidating Statement of Cash Flows (continued)
for the
Nine Months Ended September 30, 2015
(In thousands)
(Unaudited)
|
Alexandria Real
Estate Equities, Inc. (Issuer) |
Alexandria Real
Estate Equities, L.P. (Guarantor Subsidiary) |
Combined
Non-Guarantor Subsidiaries |
Eliminations
|
Consolidated
|
|||||||||||||||
|
Financing Activities
|
|||||||||||||||||||
|
Borrowings from secured notes payable
|
$
|
—
|
|
$
|
—
|
|
$
|
47,375
|
|
$
|
—
|
|
$
|
47,375
|
|
||||
|
Repayments of borrowings from secured notes payable
|
—
|
|
—
|
|
(12,217
|
)
|
—
|
|
(12,217
|
)
|
|||||||||
|
Borrowings from unsecured senior line of credit
|
1,432,000
|
|
—
|
|
—
|
|
—
|
|
1,432,000
|
|
|||||||||
|
Repayments of borrowings from unsecured senior line of credit
|
(893,000
|
)
|
—
|
|
—
|
|
—
|
|
(893,000
|
)
|
|||||||||
|
Repayments of borrowings from unsecured senior bank term loans
|
(25,000
|
)
|
—
|
|
—
|
|
—
|
|
(25,000
|
)
|
|||||||||
|
Transfer to/from parent company
|
1,853
|
|
214,926
|
|
305,297
|
|
(522,076
|
)
|
—
|
|
|||||||||
|
Change in restricted cash related to financing activities
|
—
|
|
—
|
|
(4,737
|
)
|
—
|
|
(4,737
|
)
|
|||||||||
|
Payment of loan fees
|
(2,140
|
)
|
—
|
|
(2,042
|
)
|
—
|
|
(4,182
|
)
|
|||||||||
|
Proceeds from the issuance of common stock
|
5,052
|
|
—
|
|
—
|
|
—
|
|
5,052
|
|
|||||||||
|
Dividends on common stock
|
(162,280
|
)
|
—
|
|
—
|
|
—
|
|
(162,280
|
)
|
|||||||||
|
Dividends on preferred stock
|
(18,740
|
)
|
—
|
|
—
|
|
—
|
|
(18,740
|
)
|
|||||||||
|
Contributions by noncontrolling interests
|
—
|
|
—
|
|
340
|
|
—
|
|
340
|
|
|||||||||
|
Distributions to and purchases of noncontrolling interests
|
—
|
|
—
|
|
(62,973
|
)
|
—
|
|
(62,973
|
)
|
|||||||||
|
Net cash provided by financing activities
|
337,745
|
|
214,926
|
|
271,043
|
|
(522,076
|
)
|
301,638
|
|
|||||||||
|
Effect of foreign exchange rate changes on cash and cash equivalents
|
—
|
|
—
|
|
(187
|
)
|
—
|
|
(187
|
)
|
|||||||||
|
Net (decrease) increase in cash and cash equivalents
|
(9,753
|
)
|
(55
|
)
|
180
|
|
—
|
|
(9,628
|
)
|
|||||||||
|
Cash and cash equivalents as of the beginning of period
|
52,491
|
|
63
|
|
33,457
|
|
—
|
|
86,011
|
|
|||||||||
|
Cash and cash equivalents as of the end of period
|
$
|
42,738
|
|
$
|
8
|
|
$
|
33,637
|
|
$
|
—
|
|
$
|
76,383
|
|
||||
|
Supplemental Disclosure of Cash Flow Information
|
|||||||||||||||||||
|
Cash paid during the period for interest, net of interest capitalized
|
$
|
47,193
|
|
$
|
—
|
|
$
|
17,004
|
|
$
|
—
|
|
$
|
64,197
|
|
||||
|
Non-Cash Investing Activities
|
|||||||||||||||||||
|
Change in accrued construction
|
$
|
—
|
|
$
|
—
|
|
$
|
(7,305
|
)
|
$
|
—
|
|
$
|
(7,305
|
)
|
||||
|
Assumption of secured notes payable in connection with purchase of properties
|
$
|
—
|
|
$
|
—
|
|
$
|
(82,000
|
)
|
$
|
—
|
|
$
|
(82,000
|
)
|
||||
|
Non-Cash Financing Activities
|
|||||||||||||||||||
|
Payable for purchase of noncontrolling interest
|
$
|
(51,887
|
)
|
$
|
—
|
|
$
|
—
|
|
$
|
—
|
|
$
|
(51,887
|
)
|
||||
40
|
14.
|
Condensed consolidating financial information (continued)
|
Condensed Consolidating Statement of Cash Flows
for the
Nine Months Ended September 30, 2014
(In thousands)
(Unaudited)
|
Alexandria Real
Estate Equities,
Inc. (Issuer)
|
Alexandria Real
Estate Equities,
L.P. (Guarantor
Subsidiary)
|
Combined
Non-Guarantor
Subsidiaries
|
Eliminations
|
Consolidated
|
|||||||||||||||
|
Operating Activities
|
|||||||||||||||||||
|
Net income
|
$
|
108,966
|
|
$
|
170,190
|
|
$
|
190,272
|
|
$
|
(356,620
|
)
|
$
|
112,808
|
|
||||
|
Adjustments to reconcile net income to net cash (used in) provided by operating activities:
|
|||||||||||||||||||
|
Depreciation and amortization
|
4,335
|
|
—
|
|
161,788
|
|
—
|
|
166,123
|
|
|||||||||
|
Loss on early extinguishment of debt
|
525
|
|
—
|
|
—
|
|
—
|
|
525
|
|
|||||||||
|
Gain on sale of land parcel
|
—
|
|
—
|
|
(805
|
)
|
—
|
|
(805
|
)
|
|||||||||
|
Amortization of loan fees
|
5,424
|
|
—
|
|
2,666
|
|
—
|
|
8,090
|
|
|||||||||
|
Amortization of debt discounts (premiums)
|
152
|
|
—
|
|
(52
|
)
|
—
|
|
100
|
|
|||||||||
|
Amortization of acquired below-market leases
|
—
|
|
—
|
|
(2,191
|
)
|
—
|
|
(2,191
|
)
|
|||||||||
|
Deferred rent
|
—
|
|
—
|
|
(35,511
|
)
|
—
|
|
(35,511
|
)
|
|||||||||
|
Stock compensation expense
|
9,372
|
|
—
|
|
—
|
|
—
|
|
9,372
|
|
|||||||||
|
Equity in earnings of affiliates
|
(180,275
|
)
|
(172,989
|
)
|
(3,356
|
)
|
356,620
|
|
—
|
|
|||||||||
|
Investment gains
|
—
|
|
(3
|
)
|
(9,478
|
)
|
—
|
|
(9,481
|
)
|
|||||||||
|
Investment losses
|
—
|
|
2,802
|
|
5,923
|
|
—
|
|
8,725
|
|
|||||||||
|
Changes in operating assets and liabilities:
|
|
|
|||||||||||||||||
|
Restricted cash
|
(15
|
)
|
—
|
|
15
|
|
—
|
|
—
|
|
|||||||||
|
Tenant receivables
|
—
|
|
—
|
|
(939
|
)
|
—
|
|
(939
|
)
|
|||||||||
|
Deferred leasing costs
|
(80
|
)
|
—
|
|
(25,830
|
)
|
—
|
|
(25,910
|
)
|
|||||||||
|
Other assets
|
(5,263
|
)
|
—
|
|
(6,965
|
)
|
—
|
|
(12,228
|
)
|
|||||||||
|
Accounts payable, accrued expenses, and tenant security deposits
|
50,210
|
|
—
|
|
(13,764
|
)
|
—
|
|
36,446
|
|
|||||||||
|
Net cash (used in) provided by operating activities
|
(6,649
|
)
|
—
|
|
261,773
|
|
—
|
|
255,124
|
|
|||||||||
|
Investing Activities
|
|||||||||||||||||||
|
Proceeds from sale of real estate
|
—
|
|
—
|
|
28,378
|
|
—
|
|
28,378
|
|
|||||||||
|
Additions to real estate
|
—
|
|
—
|
|
(345,074
|
)
|
—
|
|
(345,074
|
)
|
|||||||||
|
Purchase of real estate
|
—
|
|
—
|
|
(97,785
|
)
|
—
|
|
(97,785
|
)
|
|||||||||
|
Deposit for investing activities
|
—
|
|
—
|
|
(7,292
|
)
|
—
|
|
(7,292
|
)
|
|||||||||
|
Change in restricted cash related to construction projects
|
—
|
|
—
|
|
6,694
|
|
—
|
|
6,694
|
|
|||||||||
|
Investment in unconsolidated real estate joint ventures
|
—
|
|
—
|
|
(67,525
|
)
|
—
|
|
(67,525
|
)
|
|||||||||
|
Investments in subsidiaries
|
(322,228
|
)
|
(291,300
|
)
|
(12,150
|
)
|
625,678
|
|
—
|
|
|||||||||
|
Additions to investments
|
—
|
|
—
|
|
(35,484
|
)
|
—
|
|
(35,484
|
)
|
|||||||||
|
Sales of investments
|
—
|
|
—
|
|
13,883
|
|
—
|
|
13,883
|
|
|||||||||
|
Repayment of notes receivable
|
—
|
|
—
|
|
29,866
|
|
—
|
|
29,866
|
|
|||||||||
|
Net cash used in investing activities
|
$
|
(322,228
|
)
|
$
|
(291,300
|
)
|
$
|
(486,489
|
)
|
$
|
625,678
|
|
$
|
(474,339
|
)
|
||||
41
|
14.
|
Condensed consolidating financial information (continued)
|
Condensed Consolidating Statement of Cash Flows (continued)
for the
Nine Months Ended September 30, 2014
(In thousands)
(Unaudited)
|
Alexandria Real
Estate Equities,
Inc. (Issuer)
|
Alexandria Real
Estate Equities,
L.P. (Guarantor
Subsidiary)
|
Combined
Non-Guarantor
Subsidiaries
|
Eliminations
|
Consolidated
|
|||||||||||||||
|
Financing Activities
|
|||||||||||||||||||
|
Borrowings from secured notes payable
|
$
|
—
|
|
$
|
—
|
|
$
|
108,626
|
|
$
|
—
|
|
$
|
108,626
|
|
||||
|
Repayments of borrowings from secured notes payable
|
—
|
|
—
|
|
(228,909
|
)
|
—
|
|
(228,909
|
)
|
|||||||||
|
Proceeds from issuance of unsecured senior notes payable
|
698,908
|
|
—
|
|
—
|
|
—
|
|
698,908
|
|
|||||||||
|
Borrowings from unsecured senior line of credit
|
890,000
|
|
—
|
|
—
|
|
—
|
|
890,000
|
|
|||||||||
|
Repayments of borrowings from unsecured senior line of credit
|
(952,000
|
)
|
—
|
|
—
|
|
—
|
|
(952,000
|
)
|
|||||||||
|
Repayment of unsecured senior bank term loan
|
(125,000
|
)
|
—
|
|
—
|
|
—
|
|
(125,000
|
)
|
|||||||||
|
Transfer to/from parent company
|
103
|
|
291,300
|
|
334,275
|
|
(625,678
|
)
|
—
|
|
|||||||||
|
Change in restricted cash related to financing activities
|
—
|
|
—
|
|
375
|
|
—
|
|
375
|
|
|||||||||
|
Payment of loan fees
|
(6,515
|
)
|
—
|
|
(1,474
|
)
|
—
|
|
(7,989
|
)
|
|||||||||
|
Dividends on common stock
|
(150,540
|
)
|
—
|
|
—
|
|
—
|
|
(150,540
|
)
|
|||||||||
|
Dividends on preferred stock
|
(19,414
|
)
|
—
|
|
—
|
|
—
|
|
(19,414
|
)
|
|||||||||
|
Contributions by noncontrolling interests
|
—
|
|
—
|
|
19,410
|
|
—
|
|
19,410
|
|
|||||||||
|
Distributions to and purchases of noncontrolling interests
|
—
|
|
—
|
|
(3,487
|
)
|
—
|
|
(3,487
|
)
|
|||||||||
|
Net cash provided by financing activities
|
335,542
|
|
291,300
|
|
228,816
|
|
(625,678
|
)
|
229,980
|
|
|||||||||
|
Effect of foreign exchange rate changes on cash and cash equivalents
|
—
|
|
—
|
|
(1,438
|
)
|
—
|
|
(1,438
|
)
|
|||||||||
|
Net increase in cash and cash equivalents
|
6,665
|
|
—
|
|
2,662
|
|
—
|
|
9,327
|
|
|||||||||
|
Cash and cash equivalents as of the beginning of period
|
14,790
|
|
—
|
|
42,906
|
|
—
|
|
57,696
|
|
|||||||||
|
Cash and cash equivalents as of the end of period
|
$
|
21,455
|
|
$
|
—
|
|
$
|
45,568
|
|
$
|
—
|
|
$
|
67,023
|
|
||||
|
Supplemental Disclosure of Cash Flow Information
|
|||||||||||||||||||
|
Cash paid during the period for interest, net of interest capitalized
|
$
|
20,089
|
|
$
|
—
|
|
$
|
13,694
|
|
$
|
—
|
|
$
|
33,783
|
|
||||
|
Non-Cash Investing Activities
|
|||||||||||||||||||
|
Change in accrued construction
|
$
|
—
|
|
$
|
—
|
|
$
|
36,235
|
|
$
|
—
|
|
$
|
36,235
|
|
||||
|
Assumption of secured notes payable in connection with purchase of properties
|
$
|
—
|
|
$
|
—
|
|
$
|
(48,329
|
)
|
$
|
—
|
|
$
|
(48,329
|
)
|
||||
42
Certain information and statements included in this quarterly report on Form 10-Q, including, without limitation, statements containing the words “forecast,” “guidance,” “projects,” “estimates,” “anticipates,” “believes,” “expects,” “intends,” “may,” “plans,” “seeks,” “should,” or “will,” or the negative of these words or similar words, constitute “forward-looking statements” within the meaning of Section 27A of the Securities Act of 1933, as amended, and Section 21E of the Securities Exchange Act of 1934, as amended. Forward-looking statements involve inherent risks and uncertainties regarding events, conditions, and financial trends that may affect our future plans of operations, business strategy, results of operations, and financial position. A number of important factors could cause actual results to differ materially from those included within or contemplated by the forward-looking statements, including, but not limited to, the following:
|
•
|
Operating factors such as a failure to operate our business successfully in comparison to market expectations or in comparison to our competitors, our inability to obtain capital when desired or refinance debt maturities when desired, and/or a failure to maintain our status as a REIT for federal tax purposes.
|
|
•
|
Market and industry factors such as adverse developments concerning the science and technology industries and/or our client tenants.
|
|
•
|
Government factors such as any unfavorable effects resulting from federal, state, local, and/or foreign government policies, laws, and/or funding levels.
|
|
•
|
Global factors such as negative economic, political, financial, credit market, and/or banking conditions.
|
|
•
|
Other factors such as climate change, cyber intrusions, and/or changes in laws, regulations, and financial accounting standards.
|
This list of risks and uncertainties is not exhaustive. Additional information regarding risk factors that may affect us is included under “Item 1A. Risk Factors” and “Item 7. Management’s Discussion and Analysis of Financial Condition and Results of Operations” in our annual report on Form 10-K for the fiscal year ended
December 31, 2014
. Readers of this quarterly report on Form 10-Q should also read our other documents filed publicly with the SEC for further discussion regarding such factors.
43
Overview
We are a Maryland corporation formed in October 1994 that has elected to be taxed as a REIT for federal income tax purposes.
We are the largest and leading urban office REIT uniquely focused on collaborative science and technology campuses in AAA innovation cluster locations with a total market capitalization of
$10.8 billion
as of
September 30, 2015
, and an asset base of
31.5 million
square feet, including
19.9 million
RSF of operating properties and development and redevelopment projects under construction, as well as an additional
11.6 million
square feet of near-term and future ground-up development projects. Alexandria pioneered this niche in 1994 and has since established a dominant market presence in key locations, including Greater Boston, San Francisco, New York City, San Diego, Seattle, Maryland, and Research Triangle Park. Alexandria is known for its high-quality and diverse client tenant base, with approximately
53%
of total annualized base rent as of
September 30, 2015
, generated from investment-grade client tenants – a REIT industry-leading percentage. Alexandria has a longstanding and proven track record of developing Class A assets clustered in urban science and technology campuses that provide its innovative client tenants with highly dynamic and collaborative environments that enhance their ability to successfully recruit and retain world-class talent and inspire productivity, efficiency, creativity, and success. We believe these advantages result in higher occupancy levels, longer lease terms, higher rental income, higher returns, and greater long-term asset value.
Our primary business objective is to maximize stockholder value by providing our stockholders with the greatest possible total return and long-term asset value based on a multifaceted platform of internal and external growth. A key element of our strategy is our unique focus on Class A assets clustered in urban campuses. These key urban campus locations are characterized by high barriers to entry for new landlords, and a limited supply of available space. They represent highly desirable locations for tenancy by science and technology entities because of their close proximity to concentrations of specialized skills, knowledge, institutions, and related businesses. Our strategy also includes drawing upon our deep and broad real estate, science, and technology relationships in order to identify and attract new and leading client tenants and to source additional value-creation real estate opportunities.
Executive summary
Our best-in-class team delivered another strong quarter of financial and operating results, including the following key highlights:
|
•
|
Executed agreement for the sales of partial interests in Class A facilities to TIAA-CREF with closings in the fourth quarter of 2015:
|
|
•
|
4.8%
cash cap rate on sale of
49.9%
interest in 1500 Owens Street located in our Mission Bay submarket for a sale price of
$73.4 million
;
|
|
•
|
4.5%
cash cap rate on sale of
70%
interest in 225 Binney Street in our Cambridge submarket for a sale price of
$190 million
;
|
|
•
|
Highly leased development and redevelopment projects:
|
|
•
|
1.5 million
RSF,
89%
leased, targeted for completion by 4Q16 (weighted toward 4Q16), will generate
$75 to $80 million
incremental annual NOI upon stabilization;
|
|
•
|
1.8 million
RSF,
71%
leased, targeted for completion in 2017 and 2018, will generate
$105 to $110 million
of incremental annual NOI upon stabilization;
|
|
•
|
FFO per share – diluted, as adjusted, for the
three months ended September 30, 2015
, of
$1.33
, up
9.9%
, compared to
$1.21
for the
three months ended September 30, 2014
;
|
|
•
|
Same property NOI growth of
1.1%
and
4.8%
(cash basis) for the
three months ended September 30, 2015
, compared to the
three months ended September 30, 2014
;
|
|
•
|
Executed leases for
1,021,756
RSF and
3,959,804
RSF during the three and nine months ended September 30, 2015, respectively, highest nine-month leasing volume in the Company’s 20-year history;
|
|
•
|
Rental rate increases of
17.5%
and
8.8%
(cash basis) for the
three months ended September 30, 2015
lease renewals and re-leasing of space aggregating
456,602
RSF (included in the
1,021,756
RSF above); and
|
|
•
|
Common stock dividend for the
three months ended September 30, 2015
, of
$0.77
per common share, up
5 cent
s, or
7%
, over the
three months ended September 30, 2014
; continuation of strategy to share growth in cash flows from operating activities with our shareholders while also importantly retaining capital for reinvestment.
|
44
Sales of partial interest in two core real estate assets at
4.5%
and
4.8%
cash cap rates:
|
•
|
In July and October 2015, we executed agreements for the sales of partial interests in two Class A facilities to TIAA-CREF, with closings in the fourth quarter of 2015:
|
|
Property
|
Submarket
|
Interest To
Be Sold
|
RSF
|
Sales Price
|
Cash Cap Rate
|
||||||||
|
225 Binney Street
|
Cambridge
|
70%
|
305,212
|
|
$
|
190,110
|
|
4.5%
|
|||||
|
1500 Owens Street
|
Mission Bay
|
49.9%
|
158,267
|
|
73,353
|
|
4.8%
|
||||||
|
463,479
|
|
$
|
263,463
|
|
4.6%
|
||||||||
Refer to our “Dispositions and other sources of capital” for information on additional asset sales expected in the fourth quarter of 2015.
Results
|
•
|
FFO attributable to Alexandria’s common stockholders – diluted, as adjusted:
|
|
•
|
$1.33
per share for the
three months ended September 30, 2015
, up
9.9%
, compared to
|
$1.21
per share for the
three months ended September 30, 2014
|
•
|
$3.92
per share for the
nine months ended September 30, 2015
, up
9.8%
, compared to
|
$3.57
per share for the
nine months ended September 30, 2014
|
•
|
$95.0 million
for the
three months ended September 30, 2015
, up
$9.0 million
, or
10.4%
, compared to
|
$86.1 million
for the
three months ended September 30, 2014
|
•
|
$280.0 million
for the
nine months ended September 30, 2015
, up
$26.3 million
, or
10.4%
, compared to
$253.7 million
for the
nine months ended September 30, 2014
|
|
•
|
Investment income of
$5.4 million
, or
$0.08
per share, included gross investment gains of
$8.7 million
, primarily from the sale of two publicly traded securities.
|
|
•
|
Net income attributable to Alexandria’s common stockholders – diluted:
|
|
•
|
$32.7 million
, or
$0.46
per share, for the
three months ended September 30, 2015
, compared to
|
$27.6 million
, or
$0.39
per share, for the
three months ended September 30, 2014
|
•
|
$81.7 million
, or
$1.14
per share, for the
nine months ended September 30, 2015
, compared to
|
$88.3 million
, or
$1.24
per share, for the
nine months ended September 30, 2014
Core operating metrics
|
•
|
Total revenues:
|
|
•
|
$218.6 million
for the
three months ended September 30, 2015
, up
$33.0 million
, or
17.8%
, compared to
|
$185.6 million
for the
three months ended September 30, 2014
|
•
|
$619.5 million
for the
nine months ended September 30, 2015
, up
$81.3 million
, or
15.1%
, compared to
|
$538.2 million
for the
nine months ended September 30, 2014
|
•
|
NOI, including our share of unconsolidated joint ventures:
|
|
•
|
$151.2 million
for the
three months ended September 30, 2015
, up
$23.0 million
, or
17.9%
, compared to
|
$128.2 million
for the
three months ended September 30, 2014
|
•
|
$430.4 million
for the
nine months ended September 30, 2015
, up
$54.5 million
, or
14.5%
, compared to
|
$375.9 million
for the
nine months ended September 30, 2014
|
•
|
Occupancy for operating properties in North America of
96.2%
as of
September 30, 2015
|
|
•
|
53%
of our total ABR generated from investment-grade client tenants
|
|
•
|
Same property NOI growth:
|
|
•
|
1.1%
and
4.8%
(cash basis) increase for the
three months ended September 30, 2015
, compared to the
three months ended September 30, 2014
|
|
•
|
1.2%
and
5.6%
(cash basis) increase for the
nine months ended September 30, 2015
, compared to the
nine months ended September 30, 2014
|
|
•
|
Operating margins at
69%
for the
three months ended September 30, 2015
|
|
•
|
Adjusted EBITDA margins at
65%
for the
three months ended September 30, 2015
|
45
Core operating metrics (continued)
|
•
|
Executed leases for
1,021,756
RSF during the
three months ended September 30, 2015
:
|
|
•
|
253,108
RSF to bluebird bio, Inc., representing
99%
of our 60 Binney Street development project under construction in our Cambridge submarket in Greater Boston
|
|
•
|
150,000
RSF to Pinterest, Inc., representing
100%
of phase one of the recently acquired near-term development project at 505 Brannan Street in our SoMa submarket in San Francisco
|
|
•
|
78,916
RSF renewal with UMass Memorial Realty, Inc. at 306 Belmont Street in our Route 495/Worcester submarket in Greater Boston
|
|
•
|
60,917
RSF renewal with Vertex Pharmaceuticals Incorporated at 245/275 Armand Frappier Boulevard in our Canadian submarket
|
|
•
|
50,231
RSF leased and delivered to The Children’s Hospital Corporation at 360 Longwood Avenue in our Longwood Medical Area submarket in Greater Boston
|
|
•
|
17.5%
and
8.8%
(cash basis) rental rate increases on leas
e renewals and re-leasing of space aggregating
456,602
RS
F
|
|
•
|
Executed leases for
3,959,804
RSF for the
nine months ended September 30, 2015
; highest nine-month leasing volume in the Company’s 20-year history
|
|
•
|
19.6%
and
10.6%
(cash basis) rental rate increases on lease renewals and re-leasing of space aggregating
1,729,239
RSF
|
External growth: development and redevelopment projects under construction and acquisitions
Highly leased development and redevelopment projects under construction
|
•
|
Highly leased development and redevelopment projects:
|
|
•
|
1.5 million
RSF,
89%
leased, targeted for completion by fourth quarter of 2016 (weighted toward fourth quarter of 2016), will generate
$75 to $80 million
incremental annual NOI upon stabilization
|
|
•
|
1.8 million
RSF
71%
leased, targeted for completion in 2017 and 2018, will generate
$105 to $110 million
of incremental annual NOI upon stabilization
|
|
•
|
Key development projects placed into service during the
three months ended September 30, 2015
, include:
|
|
•
|
62,490
RSF, including
30,408
RSF to Eli Lilly and Company and
30,408
RSF to Galderma Laboratories, L.P. (a wholly-owned subsidiary of Nestle S.A.), at our 430 East 29th Street development in our Manhattan submarket in New York City
|
|
•
|
50,231
RSF to The Children’s Hospital Corporation at our 360 Longwood Avenue development in our Longwood Medical Area submarket in Greater Boston
|
|
•
|
Commencements of development and redevelopment projects during the
three months ended September 30, 2015
, including:
|
|
•
|
431,483
RSF development project at 100 Binney Street in our Cambridge submarket;
98%
leased/negotiating, including
58%
leased to Bristol-Myers Squibb Company
|
|
•
|
304,326
RSF redevelopment project at 10290 Campus Point Drive in our University Town Center submarket, acquired in July 2015 for
$105.0 million
;
100%
leased to Eli Lilly and Company
|
|
•
|
300,000
RSF development project at 510 Townsend Street in our SoMa submarket;
100%
leased to Stripe, Inc.
|
|
•
|
162,156
RSF redevelopment project at 9625 Towne Centre Drive in our University Town Center submarket
|
|
•
|
59,000
RSF redevelopment project at 11 Hurley Street, in our Cambridge submarket, acquired in September 2015 for
$5.9 million
;
100%
under negotiation
|
Acquisitions
|
•
|
In July and September 2015, we acquired 10290 Campus Point Drive and 11 Hurley Street, respectively. We commenced conversion of these buildings into office/laboratory space through redevelopment during the three months ended
September 30, 2015
.
|
46
Balance sheet
|
•
|
In October 2015, closed a secured construction loan with aggregate commitments available for borrowing of
$350.0 million
, for our
98%
leased development project at 50/60 Binney Street in our Cambridge submarket, which bears interest at a rate of LIBOR+1.50%
|
|
•
|
$855 million
of liquidity as of
as of September 30, 2015
; $1.2 billion of liquidity
as of September 30, 2015
on a pro forma basis for the available borrowings under the construction loan noted immediately above
|
|
•
|
$10.8 billion
total market capitalization as of
September 30, 2015
|
|
•
|
13%
of gross investments in real estate in value-creation pipeline (
74%
of pipeline undergoing construction)
as of September 30, 2015
, with a target range from 10% to 15% as of the fourth quarter of 2016
|
|
•
|
7.4 times
net debt to Adjusted EBITDA –
third quarter
of 2015 annualized, with target of less than 7.0 times by the fourth quarter of 2015
|
|
•
|
3.5 times
fixed-charge coverage ratio –
third quarter
of 2015 annualized
|
|
•
|
Limited debt maturities through 2018; well-laddered maturity profile
|
|
•
|
Executed additional interest rate swap agreements during the three months ended
September 30, 2015
, with an aggregate notional amount of
$750 million
, to increase notional hedged variable-rate debt to a minimum of
$1.1 billion
and
$650 million
during 2016 and 2017, respectively
|
|
•
|
24%
unhedged variable-rate debt as a percentage of total debt as of
September 30, 2015
, with a target of less than 15% by
December 31, 2015
|
LEED statistics
|
•
|
56%
of our total ABR will be generated from LEED
projects upon completion of our in-process projects
|
Other subsequent events
|
•
|
In October 2015, we repaid a
$76.0 million
secured note payable with an effective interest rate of
5.73%
|
|
•
|
In October 2015, we executed an agreement to sell a
49.9%
interest in our
158,267
RSF, property at 1500 Owens Street in our Mission Bay submarket in San Francisco to a high-quality institutional investor for
$73.4 million
, with closing in the fourth quarter of 2015
|
|
•
|
In October 2015, we executed an agreement for the sale of 75/125 Shoreway Road in our Palo Alto/Stanford Research Park submarket in San Francisco to a high-quality institutional investor at a sales price of
$38.5 million
and a cash capitalization rate of
5.8%
; with closing in the fourth quarter of 2015
|
47
Operating summary
Key real estate statistics
The following table presents information regarding our asset base, including unconsolidated joint ventures, as of
September 30, 2015
, and
December 31, 2014
:
|
September 30, 2015
|
December 31, 2014
|
||||||
|
(Rentable square feet)
|
|||||||
|
Operating properties
|
16,803,766
|
|
16,727,985
|
|
|||
|
Development properties
|
2,614,491
|
|
1,857,520
|
|
|||
|
Redevelopment properties
|
525,482
|
|
143,777
|
|
|||
|
Total properties
|
19,943,739
|
|
18,729,282
|
|
|||
|
Number of properties
|
198
|
|
193
|
|
|||
|
Occupancy in North America at period-end – operating
|
96.2
|
%
|
97.0
|
%
|
|||
|
Occupancy in North America at period-end – operating and redevelopment
|
93.0
|
%
|
96.1
|
%
|
|||
|
Annualized base rent per occupied RSF at period-end
|
$
|
39.44
|
|
$
|
37.23
|
|
|
Leasing
|
•
|
Executed a total of
172
leases, with a weighted-average lease term of
9.0 years
, for
3,959,804
RSF, including
2,003,746
RSF related to our development and redevelopment projects during the
nine months ended September 30, 2015
|
|
•
|
Achieved rental rate increases for renewed/re-leased space of
19.6%
and
10.6%
(cash basis) on
1,729,239
RSF during the
nine months ended September 30, 2015
|
|
•
|
Occupancy rate for operating properties in North America of
96.2%
as of September 30, 2015
|
Approximately
64%
of the
172
leases executed during the
nine months ended September 30, 2015
, did not include concessions for free rent. During the
nine months ended September 30, 2015
, we granted tenant concessions/free rent averaging
2.8
months with respect to the
3,959,804
RSF leased.
48
The following table summarizes our leasing activity at our properties:
|
Three Months Ended
September 30, 2015
|
Nine Months Ended
September 30, 2015 |
Year Ended
December 31, 2014
|
||||||||||||||||||||||
|
Including
Straight-line Rent
|
Cash Basis
|
Including
Straight-line Rent |
Cash Basis
|
Including
Straight-line Rent
|
Cash Basis
|
|||||||||||||||||||
|
(Dollars are per RSF)
|
||||||||||||||||||||||||
|
Leasing activity:
|
||||||||||||||||||||||||
|
Renewed/re-leased space
(1)
|
|
|
|
|
|
|
|
|
|
|
|
|
||||||||||||
|
Rental rate changes
|
17.5%
|
|
8.8%
|
|
19.6%
|
|
10.6%
|
|
13.3%
|
|
5.4%
|
|
||||||||||||
|
New rates
|
$
|
34.85
|
|
$
|
34.64
|
|
$
|
36.13
|
|
$
|
36.37
|
|
$
|
40.32
|
|
$
|
40.73
|
|
||||||
|
Expiring rates
|
$
|
29.66
|
|
$
|
31.83
|
|
$
|
30.21
|
|
$
|
32.87
|
|
$
|
35.60
|
|
$
|
38.63
|
|
||||||
|
Rentable square footage
|
456,602
|
|
1,729,239
|
|
1,447,516
|
|
||||||||||||||||||
|
Number of leases
|
32
|
|
117
|
|
124
|
|
||||||||||||||||||
|
Tenant improvements/leasing commissions
|
$
|
11.82
|
|
$
|
10.24
|
|
$
|
10.49
|
|
|||||||||||||||
|
Average lease terms
|
5.2 years
|
|
4.8 years
|
|
3.5 years
|
|
||||||||||||||||||
|
Developed/redeveloped/previously vacant space leased
|
||||||||||||||||||||||||
|
New rates
|
$
|
68.18
|
|
$
|
64.29
|
|
$
|
59.72
|
|
$
|
54.30
|
|
$
|
40.62
|
|
$
|
36.50
|
|
||||||
|
Rentable square footage
|
565,154
|
|
2,230,565
|
|
1,321,317
|
|
||||||||||||||||||
|
Number of leases
|
17
|
|
55
|
|
66
|
|
||||||||||||||||||
|
Tenant improvements/leasing commissions
|
$
|
17.38
|
|
$
|
19.01
|
|
$
|
14.96
|
|
|||||||||||||||
|
Average lease terms
|
11.5 years
|
|
12.2 years
|
|
11.5 years
|
|
||||||||||||||||||
|
Leasing activity summary (totals):
|
||||||||||||||||||||||||
|
New rates
|
$
|
53.29
|
|
$
|
51.04
|
|
$
|
49.42
|
|
$
|
46.47
|
|
$
|
40.46
|
|
$
|
38.71
|
|
||||||
|
Rentable square footage
|
1,021,756
|
|
3,959,804
|
|
(2)
|
2,768,833
|
|
|||||||||||||||||
|
Number of leases
|
49
|
|
172
|
|
190
|
|
||||||||||||||||||
|
Tenant improvements/leasing commissions
|
$
|
14.89
|
|
$
|
15.18
|
|
$
|
12.62
|
|
|||||||||||||||
|
Average lease terms
|
8.7 years
|
|
9.0 years
|
|
7.3 years
|
|
||||||||||||||||||
|
Lease expirations
(1)
|
||||||||||||||||||||||||
|
Expiring rates
|
$
|
26.84
|
|
$
|
28.54
|
|
$
|
28.67
|
|
$
|
30.94
|
|
$
|
33.09
|
|
$
|
35.79
|
|
||||||
|
Rentable square footage
|
635,195
|
|
2,262,674
|
|
1,733,614
|
|
||||||||||||||||||
|
Number of leases
|
45
|
|
158
|
|
151
|
|
||||||||||||||||||
|
(1)
|
Excludes
16
month-to-month leases for
37,054
RSF and
20
month-to-month leases for
43,672
RSF as of
September 30, 2015
, and December 31, 2014, respectively.
|
|
(2)
|
During the
nine months ended September 30, 2015
, we granted tenant concessions/free rent averaging
2.8
months with respect to the
3,959,804
RSF leased.
|
49
Summary of lease expirations
The following table summarizes information with respect to the lease expirations at our properties as of
September 30, 2015
:
|
Year of Lease Expiration
|
Number of Leases Expiring
|
RSF of Expiring Leases
|
Percentage of
Aggregate Total RSF
|
ABR of
Expiring Leases (per RSF) |
|||||||||||||||||
|
2015
|
20
|
|
(1)
|
232,526
|
|
(1)
|
1.4
|
%
|
$
|
37.03
|
|
||||||||||
|
2016
|
80
|
|
1,321,642
|
|
7.9
|
%
|
$
|
31.79
|
|
||||||||||||
|
2017
|
81
|
|
1,386,364
|
|
8.3
|
%
|
$
|
27.89
|
|
||||||||||||
|
2018
|
86
|
|
1,838,064
|
|
10.9
|
%
|
$
|
38.73
|
|
||||||||||||
|
2019
|
68
|
|
1,401,460
|
|
8.3
|
%
|
$
|
35.98
|
|
||||||||||||
|
2020
|
65
|
|
1,556,981
|
|
9.3
|
%
|
$
|
37.05
|
|
||||||||||||
|
2021
|
43
|
|
1,320,614
|
|
7.9
|
%
|
$
|
39.08
|
|
||||||||||||
|
2022
|
27
|
|
900,680
|
|
5.4
|
%
|
$
|
34.35
|
|
||||||||||||
|
2023
|
22
|
|
1,188,496
|
|
7.1
|
%
|
$
|
37.66
|
|
||||||||||||
|
2024
|
15
|
|
830,169
|
|
4.9
|
%
|
$
|
45.26
|
|
||||||||||||
|
Thereafter
|
50
|
|
3,704,202
|
|
22.0
|
%
|
$
|
48.00
|
|
||||||||||||
|
(1)
|
Excludes
16
month-to-month leases for
37,054
RSF.
|
The following tables present information by market with respect to our lease expirations as of
September 30, 2015
, for the remainder of 2015 and all of 2016:
|
2015 RSF of Expiring Leases
|
ABR of
Expiring Leases (per RSF) |
||||||||||||||||||
|
|
Leased
|
Negotiating/
Anticipating |
Targeted for
Redevelopment |
Remaining
Expiring Leases |
Total
(1)
|
||||||||||||||
|
Market
|
|||||||||||||||||||
|
Greater Boston
|
—
|
|
34,560
|
|
—
|
|
4,284
|
|
38,844
|
|
$
|
46.40
|
|
||||||
|
San Francisco
|
87,834
|
|
—
|
|
—
|
|
—
|
|
87,834
|
|
43.98
|
|
|||||||
|
New York City
|
—
|
|
199
|
|
—
|
|
9,528
|
|
9,727
|
|
N/A
|
|
|||||||
|
San Diego
|
—
|
|
—
|
|
48,880
|
|
(2)
|
1,000
|
|
49,880
|
|
N/A
|
|
||||||
|
Seattle
|
—
|
|
27,200
|
|
—
|
|
1,893
|
|
29,093
|
|
22.45
|
|
|||||||
|
Maryland
|
2,109
|
|
—
|
|
—
|
|
3,386
|
|
5,495
|
|
20.69
|
|
|||||||
|
Research Triangle Park
|
4,575
|
|
—
|
|
—
|
|
—
|
|
4,575
|
|
29.03
|
|
|||||||
|
Non-cluster markets
|
—
|
|
—
|
|
—
|
|
3,009
|
|
3,009
|
|
14.00
|
|
|||||||
|
Asia
|
—
|
|
—
|
|
—
|
|
4,069
|
|
4,069
|
|
N/A
|
|
|||||||
|
Total
|
94,518
|
|
61,959
|
|
48,880
|
|
27,169
|
|
232,526
|
|
$
|
37.03
|
|
||||||
|
Percentage of expiring leases
|
41
|
%
|
27
|
%
|
21
|
%
|
11
|
%
|
100
|
%
|
|||||||||
|
2016 RSF of Expiring Leases
|
ABR of
Expiring Leases (per RSF) |
||||||||||||||||||
|
Leased
|
Negotiating/
Anticipating |
Targeted for
Redevelopment |
Remaining
Expiring Leases |
Total
|
|||||||||||||||
|
Market
|
|||||||||||||||||||
|
Greater Boston
|
104,369
|
|
27,232
|
|
—
|
|
47,561
|
|
179,162
|
|
$
|
43.51
|
|
||||||
|
San Francisco
|
726
|
|
31,611
|
|
—
|
|
111,578
|
|
143,915
|
|
30.75
|
|
|||||||
|
New York City
|
—
|
|
—
|
|
—
|
|
5,447
|
|
5,447
|
|
N/A
|
|
|||||||
|
San Diego
|
46,033
|
|
158,645
|
|
(3)
|
—
|
|
367,013
|
|
(4)
|
571,691
|
|
33.90
|
|
|||||
|
Seattle
|
2,468
|
|
—
|
|
—
|
|
44,684
|
|
47,152
|
|
38.79
|
|
|||||||
|
Maryland
|
16,560
|
|
—
|
|
—
|
|
125,103
|
|
141,663
|
|
25.74
|
|
|||||||
|
Research Triangle Park
|
54,642
|
|
—
|
|
—
|
|
88,383
|
|
143,025
|
|
23.13
|
|
|||||||
|
Non-cluster markets
|
—
|
|
346
|
|
—
|
|
3,508
|
|
3,854
|
|
20.57
|
|
|||||||
|
Asia
|
45,835
|
|
35,335
|
|
—
|
|
4,563
|
|
85,733
|
|
16.29
|
|
|||||||
|
Total
|
270,633
|
|
253,169
|
|
—
|
|
797,840
|
|
1,321,642
|
|
$
|
31.79
|
|
||||||
|
Percentage of expiring leases
|
20
|
%
|
19
|
%
|
—
|
%
|
61
|
%
|
100
|
%
|
|||||||||
|
(1)
|
Excludes
16
month-to-month leases for
37,054
RSF.
|
|
(2)
|
Represents
48,880
RSF at 10151 Barnes Canyon Road. We expect to commence redevelopment of the property into tech office space upon expiration of the acquired in-place lease in the fourth quarter of 2015.
|
|
(3)
|
Represents two leases at 3115/3215 Merryfield Row with contractual expirations in January and August 2016, respectively, at an average annualized base rent of
$26.62
per square foot. We are in negotiations with a high-quality client tenant for approximately
155,000
RSF of build-to-suit space at the ARE Spectrum campus.
|
|
(4)
|
Includes 125,409 RSF leased to Eli Lilly and Company at 10300 Campus Point Drive with a contractual expiration in the fourth quarter of 2016. This client tenant will relocate and expand into
304,326
RSF at our recently acquired redevelopment project at 10290 Campus Point Drive project.
|
50
|
High-Quality Cash Flows from Innovative Client Tenants with
53% of Total ABR from Investment-Grade Client Tenants
|
||
|
High-Quality Client Tenant Base
|
Diverse Client Tenant Base
|
|

|

|
|
|
High-Quality Cash Flows from Class A Assets in AAA Locations
|
||
|
Focus in Key Locations
|
||

|
||
|
Class A Assets
in AAA Locations
|
||
|
75%
|
||
|
of ARE’s Total ABR
|
||
|
% of ARE’s Total ABR
|
||
|
Demand for Class A Assets in AAA Locations Drives Solid Occupancy
|
||
|
Occupancy Across Key Locations
as of September 30, 2015
|
||

|
||
|
Solid Occupancy
(2)
|
||
|
95%
|
||
|
Over 10 Years
|
||
|
(1) Traditional Office and Tech space comprises of 2.2% and 0.8% of ABR, respectively.
(2) Average occupancy of operating properties in North America as of December 31 for the last 10 years.
|
||
51
Location of properties
The locations of our properties are diversified among a number of science and technology cluster markets. The following table sets forth, as of
September 30, 2015
, the total RSF, number of properties, and annualized base rent of our properties in each of our existing markets (dollars in thousands):
|
RSF
|
Number of Properties
|
Annualized Base Rent
|
ABR
|
||||||||||||||||||||||||||
|
Market
|
Operating
|
Development
|
Redevelopment
|
Total
|
% Total
|
per RSF
(1)
|
|||||||||||||||||||||||
|
Greater Boston
|
4,534,155
|
|
1,115,637
|
|
59,000
|
|
5,708,792
|
|
28
|
%
|
44
|
|
$
|
218,520
|
|
35
|
%
|
$
|
50.38
|
|
|||||||||
|
San Francisco
|
2,630,791
|
|
722,980
|
|
—
|
|
3,353,771
|
|
17
|
|
27
|
|
116,017
|
|
19
|
|
44.10
|
|
|||||||||||
|
New York City
|
744,917
|
|
67,912
|
|
—
|
|
812,829
|
|
4
|
|
4
|
|
58,481
|
|
10
|
|
78.80
|
|
|||||||||||
|
San Diego
|
3,065,910
|
|
358,609
|
|
466,482
|
|
3,891,001
|
|
19
|
|
50
|
|
99,565
|
|
16
|
|
34.22
|
|
|||||||||||
|
Seattle
|
746,260
|
|
287,806
|
|
—
|
|
1,034,066
|
|
5
|
|
11
|
|
32,203
|
|
5
|
|
43.75
|
|
|||||||||||
|
Maryland
|
2,156,196
|
|
—
|
|
—
|
|
2,156,196
|
|
11
|
|
29
|
|
50,249
|
|
8
|
|
24.37
|
|
|||||||||||
|
Research Triangle Park
|
980,763
|
|
61,547
|
|
—
|
|
1,042,310
|
|
5
|
|
15
|
|
19,444
|
|
3
|
|
21.65
|
|
|||||||||||
|
Canada
|
322,967
|
|
—
|
|
—
|
|
322,967
|
|
2
|
|
4
|
|
7,768
|
|
1
|
|
24.21
|
|
|||||||||||
|
Non-cluster markets
|
105,033
|
|
—
|
|
—
|
|
105,033
|
|
1
|
|
3
|
|
1,444
|
|
—
|
|
19.12
|
|
|||||||||||
|
North America
|
15,286,992
|
|
2,614,491
|
|
525,482
|
|
18,426,965
|
|
92
|
|
187
|
|
603,691
|
|
97
|
|
41.03
|
|
|||||||||||
|
Asia
|
1,199,714
|
|
—
|
|
—
|
|
1,199,714
|
|
6
|
|
8
|
|
6,887
|
|
1
|
|
9.66
|
|
|||||||||||
|
Subtotal
|
16,486,706
|
|
2,614,491
|
|
525,482
|
|
19,626,679
|
|
98
|
|
195
|
|
610,578
|
|
98
|
|
39.58
|
|
|||||||||||
|
Properties “held for sale”
(2)
|
317,060
|
|
—
|
|
—
|
|
317,060
|
|
2
|
|
3
|
|
9,271
|
|
2
|
|
31.63
|
|
|||||||||||
|
Total
|
16,803,766
|
|
2,614,491
|
|
525,482
|
|
19,943,739
|
|
100
|
%
|
198
|
|
$
|
619,849
|
|
100
|
%
|
$
|
39.44
|
|
|||||||||
|
(1)
|
Represents ABR per occupied RSF as of
September 30, 2015
.
|
|
(2)
|
Refer to Note 12 – “Assets classified as held for sale” to our unaudited consolidated financial statements under Item 1 of this report for additional information regarding properties classified as “held for sale” as of
September 30, 2015
.
|
Summary of occupancy percentages in North America
The following table sets forth the occupancy percentages for our operating assets and our assets under redevelopment in each of our North America markets as of the following dates:
|
|
Operating Properties
|
Operating and Redevelopment Properties
|
||||||||||||||||
|
Market
|
9/30/15
|
6/30/15
|
9/30/14
|
9/30/15
|
6/30/15
|
9/30/14
|
||||||||||||
|
Greater Boston
|
95.7
|
%
|
(1)
|
96.5
|
%
|
98.6
|
%
|
94.4
|
%
|
96.5
|
%
|
95.7
|
%
|
|||||
|
San Francisco
|
100.0
|
|
100.0
|
|
99.0
|
|
100.0
|
|
100.0
|
|
99.0
|
|
||||||
|
New York City
|
99.6
|
|
99.6
|
|
98.4
|
|
99.6
|
|
99.6
|
|
98.4
|
|
||||||
|
San Diego
|
94.9
|
|
(2)
|
94.5
|
|
97.1
|
|
82.4
|
|
94.5
|
|
96.1
|
|
|||||
|
Seattle
|
98.6
|
|
96.0
|
|
94.7
|
|
98.6
|
|
96.0
|
|
94.7
|
|
||||||
|
Maryland
|
95.6
|
|
93.6
|
|
93.8
|
|
95.6
|
|
93.6
|
|
93.8
|
|
||||||
|
Research Triangle Park
|
91.6
|
|
(3)
|
91.0
|
|
96.7
|
|
91.6
|
|
91.0
|
|
96.7
|
|
|||||
|
Subtotal
|
96.3
|
|
(4)
|
96.0
|
|
97.3
|
|
93.1
|
|
96.0
|
|
96.3
|
|
|||||
|
Canada
|
99.3
|
|
99.3
|
|
97.6
|
|
99.3
|
|
99.3
|
|
97.6
|
|
||||||
|
Non-cluster markets
|
71.9
|
|
68.0
|
|
93.9
|
|
71.9
|
|
68.0
|
|
93.9
|
|
||||||
|
North America
|
96.2
|
%
|
(4)
|
95.9
|
%
|
97.3
|
%
|
93.0
|
%
|
95.9
|
%
|
96.3
|
%
|
|||||
|
(1)
|
The decline from
September 30, 2014
is primarily driven by a 128,325 RSF full-building lease that expired at 19 Presidential Way in our Route 128 submarket. We are in the process of marketing the property for multi-tenancy office/laboratory use.
|
|
(2)
|
The decline from
September 30, 2014
is primarily driven by expirations of leases at 9363 and 9373 Towne Centre Drive in our University Towne Center submarket. We re-leased approximately 66% of these buildings.
|
|
(3)
|
The decline from
September 30, 2014
is primarily driven by an 81,580 RSF full-building lease that expired at 2525 East NC Highway 54 in our Research Triangle Park submarket. We are in the process of marketing the property for multi-tenancy office/laboratory use.
|
|
(4)
|
See footnotes 1, 2, and 3 above.
|
52
Client tenants
Our properties are leased to a high-quality and diverse group of client tenants, with no individual client tenant accounting for more than
5.4%
of our annualized base rent. The following table sets forth information regarding leases with our 20 largest client tenants based upon annualized base rent as of
September 30, 2015
(dollars in thousands):
|
Remaining Lease Term in Years
(1)
|
Aggregate RSF
|
ABR
|
Percentage of Aggregate ABR
|
|||||||||||||||||||||
|
Investment-Grade Ratings
|
||||||||||||||||||||||||
|
Client Tenant
|
Fitch
|
Moody’s
|
S&P
|
|||||||||||||||||||||
|
1
|
|
Novartis AG
|
2.2
|
|
693,480
|
|
$
|
33,524
|
|
5.4
|
%
|
AA
|
Aa3
|
AA-
|
||||||||||
|
2
|
|
ARIAD Pharmaceuticals, Inc.
|
14.5
|
|
386,111
|
|
(2)
|
29,994
|
|
4.8
|
|
—
|
—
|
—
|
||||||||||
|
3
|
|
Illumina, Inc.
|
14.4
|
|
595,886
|
|
25,452
|
|
4.1
|
|
—
|
—
|
BBB
|
|||||||||||
|
4
|
|
New York University
|
15.0
|
|
209,224
|
|
19,897
|
|
3.2
|
|
—
|
Aa3
|
AA-
|
|||||||||||
|
5
|
|
Eli Lilly and Company
|
7.3
|
|
287,527
|
|
19,341
|
|
3.1
|
|
A
|
A2
|
AA-
|
|||||||||||
|
6
|
|
Roche
|
5.0
|
|
343,472
|
|
16,490
|
|
2.7
|
|
AA
|
A1
|
AA
|
|||||||||||
|
7
|
|
Dana-Farber Cancer Institute, Inc.
|
14.8
|
|
203,090
|
|
15,038
|
|
2.4
|
|
—
|
A1
|
—
|
|||||||||||
|
8
|
|
United States Government
|
9.6
|
|
263,147
|
|
14,778
|
|
2.4
|
|
AAA
|
Aaa
|
AA+
|
|||||||||||
|
9
|
|
Celgene Corporation
|
6.5
|
|
361,071
|
|
14,770
|
|
2.4
|
|
—
|
Baa2
|
BBB+
|
|||||||||||
|
10
|
|
FibroGen, Inc.
|
8.1
|
|
234,249
|
|
14,278
|
|
2.3
|
|
—
|
—
|
—
|
|||||||||||
|
11
|
|
Amgen Inc.
|
8.0
|
|
401,623
|
|
14,260
|
|
2.3
|
|
BBB
|
Baa1
|
A
|
|||||||||||
|
12
|
|
Biogen Inc.
|
12.6
|
|
313,872
|
|
13,735
|
|
2.2
|
|
—
|
Baa1
|
A-
|
|||||||||||
|
13
|
|
Massachusetts Institute of Technology
|
4.1
|
|
208,274
|
|
10,971
|
|
1.8
|
|
—
|
Aaa
|
AAA
|
|||||||||||
|
14
|
|
Bristol-Myers Squibb Company
|
3.4
|
|
251,316
|
|
10,743
|
|
1.7
|
|
A-
|
A2
|
A+
|
|||||||||||
|
15
|
|
The Regents of the University of California
|
8.0
|
|
230,633
|
|
10,354
|
|
1.7
|
|
AA
|
Aa2
|
AA
|
|||||||||||
|
16
|
|
The Scripps Research Institute
|
2.4
|
|
218,031
|
|
10,023
|
|
1.6
|
|
AA-
|
Aa3
|
—
|
|||||||||||
|
17
|
|
GlaxoSmithKline plc
|
3.8
|
|
208,394
|
|
9,510
|
|
1.5
|
|
A+
|
A2
|
A+
|
|||||||||||
|
18
|
|
Sanofi
|
5.9
|
|
179,697
|
|
8,084
|
|
1.3
|
|
AA-
|
A1
|
AA
|
|||||||||||
|
19
|
|
Alnylam Pharmaceuticals, Inc.
|
6.0
|
|
129,424
|
|
7,314
|
|
1.2
|
|
—
|
—
|
—
|
|||||||||||
|
20
|
|
Sumitomo Dainippon Pharma Co., Ltd.
|
7.5
|
|
106,232
|
|
6,501
|
|
1.0
|
|
—
|
—
|
—
|
|||||||||||
|
Total/weighted-average
|
8.6
|
|
5,824,753
|
|
$
|
305,057
|
|
49.1
|
%
|
|||||||||||||||
|
(1)
|
Based on percentage of aggregate annualized base rent in effect
as of September 30, 2015
.
|
|
(2)
|
In August 2015, ARIAD Pharmaceuticals, Inc. (“ARIAD”) entered into a sublease with IBM Watson Health, a digital health venture of the International Business Machines Corporation (“IBM”) under which IBM will sublease approximately
163,186
RSF at 75 Binney Street for an initial lease term of 10 years. IBM holds investment-grade ratings of A+ (Fitch), Aa3 (Moody’s), and AA- (S&P) and has the option to extend the sublease term through the end of the ARIAD lease, in March 2030, at 75/125 Binney Street.
|
53
Value-creation projects and external growth
Key real estate metrics as of
September 30, 2015
|
2015 Disciplined Allocation of Capital
(1)
|
13% of Gross Investments in Real Estate in Value-Creation Pipeline
|
||

|

|
||
|
Highly Leased Development and Redevelopment Projects
|
Pre-Leased
(3)
Percentage of Ground-Up Developments Since January 1, 2009
|
||
|
80%
|
Single-Tenant
100%
Pre-leased
2.3M RSF
|
Multi-Tenant
38%
Pre-leased
2.5M RSF
|
|
|
Leased
|
|||
|
(1)
|
Includes actual and projected construction and acquisitions for the year ending December 31, 2015. Refer to pages
64
and
65
for additional details.
|
|
(2)
|
Upon completion of our in-process LEED certification projects.
|
|
(3)
|
Represents average pre-leased percentage at the time development commenced.
|
54
LEED Sustainability
Focused on Excellence, Sustainability and Operational Efficiency
|
56%
|
ABR From
|
51
|
LEED
®
|
|
|
LEED
®
Projects
(1)
|
Projects
(1)
|
|||
|
||||
|
(1)
|
Upon completion of
20
in-process LEED certification projects
|
55
Investments in real estate
Our investments in real estate consisted of the following as of
September 30, 2015
(dollars in thousands, except per square foot amounts):
|
Investments in Real Estate
|
|||||||||||||||||||||||||||
|
Consolidated
|
ARE
Share of Unconsolidated Joint Ventures
|
Total
|
Square Feet
|
||||||||||||||||||||||||
|
Unconsolidated Joint Ventures
|
Per SF
(1)
|
||||||||||||||||||||||||||
|
Amount
|
%
|
Consolidated
|
Total
|
||||||||||||||||||||||||
|
Rental properties
|
$
|
7,691,115
|
|
$
|
69,685
|
|
$
|
7,760,800
|
|
87
|
%
|
16,543,907
|
|
259,859
|
|
16,803,766
|
|
$
|
471
|
|
|||||||
|
Development and redevelopment projects under construction/construction in progress (CIP):
|
|||||||||||||||||||||||||||
|
Development projects under construction
|
644,500
|
|
96,712
|
|
741,212
|
|
2,037,834
|
|
576,657
|
|
2,614,491
|
|
337
|
|
|||||||||||||
|
Redevelopment projects under construction
|
139,931
|
|
—
|
|
139,931
|
|
525,482
|
|
—
|
|
525,482
|
|
266
|
|
|||||||||||||
|
Development and redevelopment projects under construction /construction in progress (CIP)
|
784,431
|
|
96,712
|
|
881,143
|
|
10
|
|
2,563,316
|
|
576,657
|
|
3,139,973
|
|
325
|
|
|||||||||||
|
Rental properties and development and redevelopment projects under construction
|
8,475,546
|
|
166,397
|
|
8,641,943
|
|
19,107,223
|
|
836,516
|
|
19,943,739
|
|
448
|
|
|||||||||||||
|
Near-term value-creation projects (CIP)
|
47,358
|
|
—
|
|
47,358
|
|
—
|
|
1,310,186
|
|
—
|
|
1,310,186
|
|
36
|
|
|||||||||||
|
Future value-creation projects:
|
|||||||||||||||||||||||||||
|
North America
|
187,313
|
|
—
|
|
187,313
|
|
2
|
|
3,797,375
|
|
—
|
|
3,797,375
|
|
49
|
|
|||||||||||
|
Asia
|
77,261
|
|
—
|
|
77,261
|
|
1
|
|
6,419,707
|
|
—
|
|
6,419,707
|
|
12
|
|
|||||||||||
|
264,574
|
|
—
|
|
264,574
|
|
10,217,082
|
|
—
|
|
10,217,082
|
|
26
|
|
||||||||||||||
|
Near-term and future value-creation projects
|
311,932
|
|
—
|
|
311,932
|
|
11,527,268
|
|
—
|
|
11,527,268
|
|
27
|
|
|||||||||||||
|
Value-creation pipeline
|
1,096,363
|
|
96,712
|
|
1,193,075
|
|
13
|
|
14,090,584
|
|
576,657
|
|
14,667,241
|
|
91
|
|
|||||||||||
|
Gross investments in real estate
|
8,787,478
|
|
166,397
|
|
$
|
8,953,875
|
|
100
|
%
|
30,634,491
|
|
836,516
|
|
31,471,007
|
|
$
|
294
|
|
|||||||||
|
Equity method of accounting – unconsolidated joint ventures
|
126,471
|
|
N/A
|
|
|||||||||||||||||||||||
|
Gross investments in real estate – including unconsolidated joint ventures
|
8,913,949
|
|
N/A
|
|
|||||||||||||||||||||||
|
Less: accumulated depreciation
|
(1,259,740
|
)
|
(1,289
|
)
|
|||||||||||||||||||||||
|
Investments in real estate
|
$
|
7,654,209
|
|
$
|
165,108
|
|
|||||||||||||||||||||
|
(1)
|
Items that include our share of unconsolidated joint ventures are not calculated directly from amounts shown on this page. The per square foot amount represents the total cost of our rental properties and development and redevelopment projects under construction, including our partners’ share, divided by the total rentable or developable square feet of the respective property.
|
56
Development, redevelopment, and future value-creation projects
A key component of our business model is our disciplined allocation of capital to Class A development and redevelopment projects located in highly dynamic and collaborative science and technology campuses in AAA urban innovation cluster locations that inspire innovation. These projects are focused on providing high-quality, generic, and reusable space to meet the real estate requirements of, and that are reusable by, a wide range of client tenants. During the period of construction, these assets are non-income-producing assets. A significant number of our development and redevelopment projects under construction are highly leased and expected to be placed into service in the near term. Upon completion, each value-creation project is expected to generate significant increases in rental income, NOI, and cash flows. Our development and redevelopment projects are generally in locations that are highly desirable to high-quality science and technology entities, which we believe results in higher occupancy levels, longer lease terms, and higher rental income and returns.
Development projects consist of the ground-up development of generic and reusable facilities. Redevelopment projects consist of the permanent change in use of office, warehouse, and shell space into office/laboratory or tech office space. We generally will not commence new development projects for aboveground construction of Class A office/laboratory or tech office space without first securing significant pre-leasing for such space, except when there is solid market demand for high-quality Class A facilities. Predevelopment activities include entitlements, permitting, design, site work, and other activities preceding commencement of construction of aboveground building improvements. The advancement of predevelopment efforts is focused on reducing the time required to deliver projects to prospective client tenants. These critical activities add significant value for future ground-up development and are required for the vertical construction of buildings. Ultimately, these projects will provide high-quality facilities and are expected to generate significant revenue and cash flows.
Our initial stabilized yield is calculated as the quotient of the estimated amounts of NOI upon stabilization and our investment in the property and excludes the impact of leverage. Our cash rents related to our value-creation projects are expected to increase over time, and our average cash yields are expected, in general, to be greater than our initial stabilized yields (cash basis). Our estimates for initial stabilized yields, initial stabilized yields (cash basis), and total costs at completion represent our initial estimates at the commencement of the project. We expect to update this information upon completion of the project, or sooner if there are significant changes to the expected project yields or costs. Initial stabilized yield reflects rental income, including contractual rent escalations and any rent concessions over the term(s) of the lease(s), calculated on a straight-line basis. Initial stabilized yield (cash basis) reflects cash rents at the stabilization date after initial rental concessions, if any, have elapsed. Average cash yield reflects cash rents, including contractual rent escalations after initial rental concessions have elapsed, calculated on a straight-line basis. The stabilized occupancy date represents the estimated date on which the project is expected to reach occupancy of 95% or greater.
57
Overview of value-creation pipeline
A substantial portion of our value-creation pipeline is expected to be placed into service in the near term. The completion of these highly leased projects is expected to contribute additional rental income, NOI, and cash flows. The following table sets forth the expected year in which our projects under construction and near-term value-creation development projects are forecasted to contribute incremental NOI:
|
Visible Growth Pipeline: Highly Leased Projects to Be Placed into Service by December 31, 2016
|
||||
|
1.5M
|
89%
|
$75M – $80M
|
||
|
RSF
|
Leased
|
Incremental Annual NOI
(1)
|
||
|
ARE’s Ownership Interest
|
Total Project
|
|||||||||||||||||||||
|
Property
Market/Submarket |
CIP
Square Feet |
Square
Feet |
Leased
|
Negotiating
|
Leased/Negotiating
|
Stabilization Date
|
||||||||||||||||
|
Development and redevelopment projects under construction
|
||||||||||||||||||||||
|
430 East 29th Street — New York City/Manhattan
|
100
|
%
|
67,912
|
|
418,639
|
|
87
|
%
|
11
|
%
|
98
|
%
|
4Q15
|
|||||||||
|
6040 George Watts Hill Drive — Research Triangle Park/RTP
|
100
|
%
|
61,547
|
|
61,547
|
|
100
|
|
—
|
|
100
|
|
1Q16
|
|||||||||
|
5200 Illumina Way, Building 6 — San Diego/University Town Center
|
100
|
%
|
295,609
|
|
295,609
|
|
100
|
|
—
|
|
100
|
|
3Q16
|
|||||||||
|
50/60 Binney Street — Greater Boston/Cambridge
|
100
|
%
|
530,477
|
|
530,477
|
|
98
|
|
—
|
|
98
|
|
4Q16
|
|||||||||
|
3013/3033 Science Park Road — San Diego/Torrey Pines
|
100
|
%
|
63,000
|
|
165,938
|
|
81
|
|
—
|
|
81
|
|
4Q16
|
|||||||||
|
360 Longwood Avenue — Greater Boston/Longwood Medical Area
|
27.5
|
%
|
153,677
|
|
413,536
|
|
63
|
|
1
|
|
64
|
|
4Q16
|
|||||||||
|
10290 Campus Point Drive — San Diego/University Town Center
|
100
|
%
|
304,326
|
|
304,326
|
|
100
|
|
—
|
|
100
|
|
Late 4Q16
|
|||||||||
|
1,476,548
|
|
2,190,072
|
|
89
|
%
|
2
|
%
|
91
|
%
|
|||||||||||||
|
Near-term development projects
|
||||||||||||||||||||||
|
4796 Executive Drive — San Diego/University Town Center
|
100
|
%
|
61,755
|
|
61,755
|
|
100
|
|
—
|
|
100
|
%
|
4Q16
|
|||||||||
|
Total/weighted-average
|
1,538,303
|
|
2,251,827
|
|
89
|
%
|
2
|
%
|
91
|
%
|
||||||||||||
|
(1
)
|
Represents incremental annual NOI upon stabilization, including our
27.5%
share of the incremental annual NOI from our 360 Longwood Avenue project.
|
58
Overview of value-creation pipeline (continued)
|
Visible Growth Pipeline: Highly Leased Projects to Be Placed into Service in 2017 and 2018
|
||||
|
1.8M
|
71%
|
$105M to $110M
|
||
|
RSF
|
Leased
|
Incremental Annual NOI
(1)
|
||
|
ARE’s Ownership Interest
|
Total Project
|
Forecast Year of NOI Initial Contribution
|
|||||||||||||||||||
|
Property – Market/Submarket
|
Square
Feet |
Leased
|
Negotiating
|
Leased/Negotiating
|
2017
|
2018
|
2019
|
||||||||||||||
|
Development and redevelopment projects under construction
|
|||||||||||||||||||||
|
400 Dexter Avenue North — Seattle/Lake Union
|
100
|
%
|
287,806
|
|
56
|
%
|
23
|
%
|
79
|
%
|

|
||||||||||
|
510 Townsend Street — San Francisco/SoMa
|
100
|
%
|
300,000
|
|
100
|
|
—
|
|
100
|
|
|
||||||||||
|
100 Binney Street — Greater Boston/Cambridge
|
100
|
%
|
431,483
|
|
58
|
|
40
|
|
98
|
|
|
||||||||||
|
9625 Towne Centre Drive — San Diego/University Town Center
|
100
|
%
|
162,156
|
|
—
|
|
—
|
|
—
|
|

|
||||||||||
|
11 Hurley Street — Greater Boston/Cambridge
|
100
|
%
|
59,000
|
|
—
|
|
100
|
|
100
|
|
|
||||||||||
|
1,240,445
|
|
57
|
%
|
24
|
%
|
81
|
%
|
||||||||||||||
|
Near-term development projects
|
|||||||||||||||||||||
|
505 Brannan Street — San Francisco/SoMa
|
100
|
%
|
150,000
|
|
100
|
|
—
|
|
100
|
|
|
||||||||||
|
1,390,445
|
|
62
|
%
|
21
|
%
|
83
|
%
|
||||||||||||||
|
Development projects under construction
|
|||||||||||||||||||||
|
1455/1515 Third Street — San Francisco/Mission Bay
|
51
|
%
|
422,980
|
|
100
|
|
—
|
|
100
|
%
|

|
||||||||||
|
1,813,425
|
|
71
|
%
|
16
|
%
|
87
|
%
|
||||||||||||||
|
Near-term development projects
|
|||||||||||||||||||||
|
5200 Illumina Way — San Diego/University Town Center
|
100
|
%
|
386,044
|
|
—
|
|
—
|
|
—
|
|

|
||||||||||
|
10300 Campus Point Drive, Building 2 — San Diego/University Town Center
|
100
|
%
|
292,387
|
|
—
|
|
—
|
|
—
|
|
|
||||||||||
|
East 29th Street — New York City/Manhattan
|
100
|
%
|
420,000
|
|
—
|
|
—
|
|
—
|
|

|
||||||||||
|
Total/weighted-average
|
2,911,856
|
|
44
|
%
|
10
|
%
|
54
|
%
|

|
Development project
|
|||||||||||

|
Redevelopment project
|
||||||||||||||||||||
|
(1)
|
Represents incremental annual NOI upon stabilization, including our 51% share of the incremental annual NOI from our 1455/1515 Third Street project.
|
59
Development projects under construction
The following table sets forth our consolidated development projects as of
September 30, 2015
(dollars in thousands):
|
Leased Status
|
Project Start
Date |
Initial Occupancy Date
|
Stabilized Occupancy Date
|
||||||||||||||||||||||||||||||
|
Project RSF
|
Leased
|
Negotiating
|
Total Leased/Negotiating
|
||||||||||||||||||||||||||||||
|
Property – Market/Submarket
|
In Service
|
CIP
|
Total
|
RSF
|
%
|
RSF
|
%
|
RSF
|
%
|
||||||||||||||||||||||||
|
Consolidated development projects
|
|||||||||||||||||||||||||||||||||
|
430 East 29th Street – New York City/Manhattan
|
350,727
|
|
67,912
|
|
418,639
|
|
363,710
|
|
87
|
%
|
45,821
|
|
11
|
%
|
409,531
|
|
98
|
%
|
4Q12
|
4Q13
|
2015
|
||||||||||||
|
50/60 Binney Street – Greater Boston/Cambridge
|
—
|
|
530,477
|
|
530,477
|
|
520,385
|
|
(1)
|
98
|
%
|
—
|
|
—
|
%
|
520,385
|
|
98
|
%
|
1Q15
|
4Q16
|
2016
|
|||||||||||
|
3013/3033 Science Park Road – San Diego/Torrey Pines
|
102,938
|
|
63,000
|
|
165,938
|
|
135,002
|
|
81
|
%
|
—
|
|
—
|
%
|
135,002
|
|
81
|
%
|
2Q14
|
4Q14
|
2016
|
||||||||||||
|
5200 Illumina Way, Building 6 – San Diego/University Town Center
|
—
|
|
295,609
|
|
295,609
|
|
295,609
|
|
100
|
%
|
—
|
|
—
|
%
|
295,609
|
|
100
|
%
|
3Q14
|
3Q16
|
2016
|
||||||||||||
|
6040 George Watts Hill Drive – Research Triangle Park/Research Triangle Park
|
—
|
|
61,547
|
|
61,547
|
|
61,547
|
|
100
|
%
|
—
|
|
—
|
%
|
61,547
|
|
100
|
%
|
4Q14
|
1Q16
|
2016
|
||||||||||||
|
100 Binney Street – Greater Boston/Cambridge
|
—
|
|
431,483
|
|
431,483
|
|
252,022
|
|
58
|
%
|
171,853
|
|
40
|
%
|
423,875
|
|
98
|
%
|
3Q15
|
4Q17
|
2017
|
||||||||||||
|
510 Townsend Street – San Francisco/SoMa
|
—
|
|
300,000
|
|
300,000
|
|
300,000
|
|
100
|
%
|
—
|
|
—
|
%
|
300,000
|
|
100
|
%
|
3Q15
|
3Q17
|
2017
|
||||||||||||
|
400 Dexter Avenue North – Seattle/Lake Union
|
—
|
|
287,806
|
|
287,806
|
|
161,433
|
|
56
|
%
|
67,122
|
|
23
|
%
|
228,555
|
|
79
|
%
|
2Q15
|
1Q17
|
2018
|
||||||||||||
|
Consolidated development projects
|
453,665
|
|
2,037,834
|
|
2,491,499
|
|
2,089,708
|
|
84
|
%
|
284,796
|
|
11
|
%
|
2,374,504
|
|
95
|
%
|
|||||||||||||||
|
Investment
|
||||||||||||||||||||||||||||||||||||||
|
Property – Market/Submarket
|
Cost to Complete
|
Unlevered
|
||||||||||||||||||||||||||||||||||||
|
2015
|
Thereafter
|
Average Cash
Yield |
Initial Stabilized Yield
(Cash Basis) |
Initial Stabilized Yield
|
||||||||||||||||||||||||||||||||||
|
In Service
|
CIP
|
Construction Financing
|
Internal Funding
|
Construction Financing
|
Internal Funding
|
Total at Completion
|
||||||||||||||||||||||||||||||||
|
Consolidated development projects
|
||||||||||||||||||||||||||||||||||||||
|
430 East 29th Street – New York City/Manhattan
|
$
|
371,391
|
|
$
|
66,494
|
|
$
|
—
|
|
$
|
25,360
|
|
$
|
—
|
|
$
|
—
|
|
$
|
463,245
|
|
7.1%
|
6.6%
|
6.5%
|
||||||||||||||
|
50/60 Binney Street – Greater Boston/Cambridge
|
$
|
—
|
|
$
|
256,990
|
|
$
|
24,875
|
|
(2)
|
$
|
—
|
|
$
|
218,135
|
|
(2)
|
$
|
—
|
|
$
|
500,000
|
|
8.1%
|
7.3%
|
7.4%
|
||||||||||||
|
3013/3033 Science Park Road – San Diego/Torrey Pines
|
$
|
54,098
|
|
$
|
7,980
|
|
$
|
—
|
|
$
|
7,768
|
|
$
|
—
|
|
$
|
34,944
|
|
$
|
104,790
|
|
7.7%
|
7.2%
|
7.1%
|
||||||||||||||
|
5200 Illumina Way, Building 6 – San Diego/University Town Center
|
$
|
—
|
|
$
|
32,937
|
|
$
|
—
|
|
$
|
16,765
|
|
$
|
—
|
|
$
|
20,198
|
|
$
|
69,900
|
|
8.6%
|
7.0%
|
8.4%
|
||||||||||||||
|
6040 George Watts Hill Drive – Research Triangle Park/Research Triangle Park
|
$
|
—
|
|
$
|
18,537
|
|
$
|
—
|
|
$
|
5,534
|
|
$
|
—
|
|
$
|
1,729
|
|
$
|
25,800
|
|
8.1%
|
7.3%
|
8.1%
|
||||||||||||||
|
100 Binney Street – Greater Boston/Cambridge
|
$
|
—
|
|
$
|
160,605
|
|
$
|
—
|
|
$
|
12,000
|
|
$
|
—
|
|
$
|
TBD
|
|
$
|
TBD
|
|
(3)
|
(3)
|
(3)
|
||||||||||||||
|
510 Townsend Street – San Francisco/SoMa
|
$
|
—
|
|
$
|
63,542
|
|
$
|
—
|
|
$
|
6,120
|
|
$
|
—
|
|
168,338
|
|
238,000
|
|
7.9%
|
7.0%
|
7.2%
|
||||||||||||||||
|
400 Dexter Avenue North – Seattle/Lake Union
|
$
|
—
|
|
$
|
37,415
|
|
$
|
—
|
|
$
|
21,578
|
|
$
|
—
|
|
$
|
TBD
|
|
$
|
TBD
|
|
(3)
|
(3)
|
(3)
|
||||||||||||||
|
Consolidated development projects
|
$
|
425,489
|
|
$
|
644,500
|
|
$
|
24,875
|
|
$
|
95,125
|
|
$
|
218,135
|
|
$
|
TBD
|
|
$
|
TBD
|
|
|||||||||||||||||
|
(1)
|
b
luebird bio, Inc. has temporarily leased
23,195
RSF at 215 First Street, and will relocate this space to 60 Binney Street upon completion of our development project under construction. Additionally, bluebird bio, Inc. occupies
53,455
RSF at 150 Second Street through
December 2022
.
|
|
(2)
|
Funding for this project will be provided primarily by a secured construction loan that we closed in October 2015, with aggregate commitments of
$350.0 million
at a rate of LIBOR+1.50%. We have
two
, one-year options to extend the stated maturity date to
January 28, 2019
, subject to certain conditions.
|
|
(3)
|
The design and budget of this project are in process, and the estimated project costs with related yields are expected to be disclosed in the near future.
|
60
Development projects under construction – unconsolidated joint ventures
The following table sets forth our unconsolidated joint venture development projects as of
September 30, 2015
(dollars in thousands):
|
Leased Status
|
Project Start
Date
|
Initial Occupancy Date
|
Stabilized Occupancy Date
|
|||||||||||||||||||||||||||||||
|
Project RSF
|
Leased
|
Negotiating
|
Total Leased/Negotiating
|
|||||||||||||||||||||||||||||||
|
Property – Market/Submarket
|
In Service
|
CIP
|
Total
|
RSF
|
%
|
RSF
|
%
|
RSF
|
%
|
|||||||||||||||||||||||||
|
Unconsolidated joint venture development projects
|
||||||||||||||||||||||||||||||||||
|
360 Longwood Avenue –
Greater Boston/Longwood Medical Area |
259,859
|
|
153,677
|
|
413,536
|
|
259,859
|
|
63
|
%
|
3,677
|
|
1
|
%
|
263,536
|
|
64
|
%
|
2Q12
|
3Q14
|
2016
|
|||||||||||||
|
1455/1515 Third Street –
San Francisco/Mission Bay |
—
|
|
422,980
|
|
422,980
|
|
422,980
|
|
100
|
%
|
—
|
|
—
|
%
|
422,980
|
|
100
|
%
|
3Q14
|
2Q/3Q18
|
(1)
|
2018
|
(1)
|
|||||||||||
|
Unconsolidated joint venture development projects
|
259,859
|
|
576,657
|
|
836,516
|
|
682,839
|
|
82
|
%
|
3,677
|
|
—
|
%
|
686,516
|
|
82
|
%
|
||||||||||||||||
|
Investment
|
||||||||||||||||||||||||||||||||||||||
|
Cost to Complete
|
Unlevered
(2)
|
|||||||||||||||||||||||||||||||||||||
|
2015
|
Thereafter
|
Average Cash
Yield
|
Initial Stabilized Yield
(Cash Basis) |
Initial Stabilized Yield
|
||||||||||||||||||||||||||||||||||
|
Property – Market/Submarket
|
Construction
Financing |
Internal Funding
|
Construction
Financing |
Internal Funding
|
Total at Completion
|
|||||||||||||||||||||||||||||||||
|
In Service
|
CIP
|
|||||||||||||||||||||||||||||||||||||
|
Unconsolidated joint venture development projects
(3)
|
||||||||||||||||||||||||||||||||||||||
|
100% of joint venture: 360 Longwood Avenue –
Greater Boston/Longwood Medical Area |
$
|
194,617
|
|
$
|
115,486
|
|
$
|
11,996
|
|
$
|
—
|
|
$
|
27,901
|
|
$
|
—
|
|
$
|
350,000
|
|
|||||||||||||||||
|
100% of joint venture: 1455/1515 Third Street –
San Francisco/Mission Bay (3) |
$
|
21,150
|
|
$
|
114,118
|
|
$
|
—
|
|
$
|
5,243
|
|
$
|
—
|
|
$
|
TBD
|
|
$
|
TBD
|
|
|||||||||||||||||
|
ARE share of unconsolidated joint venture development projects
(3)
|
||||||||||||||||||||||||||||||||||||||
|
27.5% of joint venture: 360 Longwood Avenue –
Greater Boston/Longwood Medical Area |
$
|
58,898
|
|
$
|
35,004
|
|
$
|
3,299
|
|
$
|
249
|
|
$
|
7,673
|
|
$
|
3,842
|
|
$
|
108,965
|
|
8.2%
|
7.3%
|
7.8%
|
||||||||||||||
|
51.0% of joint venture: 1455/1515 Third Street –
San Francisco/Mission Bay |
$
|
10,787
|
|
$
|
61,708
|
|
$
|
—
|
|
$
|
3,751
|
|
$
|
—
|
|
$
|
TBD
|
|
$
|
TBD
|
|
(4)
|
(4)
|
(4)
|
||||||||||||||
|
Total ARE share of unconsolidated joint venture
development projects |
$
|
69,685
|
|
$
|
96,712
|
|
$
|
3,299
|
|
$
|
4,000
|
|
$
|
7,673
|
|
$
|
TBD
|
|
$
|
TBD
|
|
|||||||||||||||||
|
(1)
|
Pursuant to the terms of our lease with Uber Technologies, Inc. (“Uber”), contractual rental payments commence in the first quarter of 2017. Uber has redesigned the buildings and is in the process of obtaining regulatory approval of their design. As part of these modifications, Uber is expected to make a significant investment in the project. Despite rental payments commencing in in the first quarter of 2017, we do not expect to recognize rental revenue until we complete the project which is expected to occur around the second or third quarter of 2018. We expect to provide an update on our estimated cost at completion and targeted yields in the near future.
|
|
(2)
|
Our projected unlevered initial stabilized yield (cash basis) is based upon our share of the investment in real estate, including costs incurred directly by us outside of the joint venture. Development management fees earned from these development projects have been excluded from our estimate of unlevered yields.
|
|
(3)
|
Refer to
page
69
and
70
for additional information regarding our unconsolidated joint ventures.
|
|
(4)
|
The design and budget of this project are in process, and the estimated project costs with related yields are expected to be disclosed in the near future.
|
61
Redevelopment projects under construction
The following table sets forth our consolidated redevelopment projects as of
September 30, 2015
(dollars in thousands):
|
Leased Status
|
Project Start
Date
|
Initial Occupancy Date
|
Stabilized Occupancy Date
|
||||||||||||||||||||||||||||||
|
Project RSF
|
Leased
|
Negotiating
|
Total Leased/Negotiating
|
||||||||||||||||||||||||||||||
|
Property – Market/Submarket
|
In Service
|
CIP
|
Total
|
RSF
|
%
|
RSF
|
%
|
RSF
|
%
|
||||||||||||||||||||||||
|
Consolidated redevelopment projects
|
|||||||||||||||||||||||||||||||||
|
10290 Campus Point Drive – San Diego/University Town Center
|
—
|
|
304,326
|
|
304,326
|
|
304,326
|
|
100
|
%
|
—
|
|
—
|
%
|
304,326
|
|
100
|
%
|
3Q15
|
4Q16
|
2016
|
||||||||||||
|
11 Hurley Street – Greater Boston/Cambridge
|
—
|
|
59,000
|
|
59,000
|
|
—
|
|
—
|
%
|
59,000
|
|
100
|
%
|
59,000
|
|
100
|
%
|
3Q15
|
1Q17
|
2017
|
||||||||||||
|
9625 Towne Centre Drive – San Diego/University Town Center
|
—
|
|
162,156
|
|
162,156
|
|
—
|
|
—
|
%
|
—
|
|
—
|
%
|
—
|
|
—
|
%
|
3Q15
|
1Q17
|
2017
|
||||||||||||
|
Consolidated redevelopment projects
|
—
|
|
525,482
|
|
525,482
|
|
304,326
|
|
58
|
%
|
59,000
|
|
11
|
%
|
363,326
|
|
69
|
%
|
|||||||||||||||
|
Investment
|
Unlevered
|
|||||||||||||||||||||||||||||
|
Property – Market/Submarket
|
Cost to Complete
|
Average Cash
Yield |
Initial Stabilized Yield
(Cash Basis) |
Initial Stabilized Yield
|
||||||||||||||||||||||||||
|
In Service
|
CIP
|
2015
|
Thereafter
|
Total at Completion
|
||||||||||||||||||||||||||
|
Consolidated redevelopment projects
|
||||||||||||||||||||||||||||||
|
10290 Campus Point Drive – San Diego/University Town Center
|
$
|
—
|
|
$
|
110,570
|
|
$
|
7,504
|
|
$
|
122,926
|
|
$
|
241,000
|
|
7.6%
|
6.8%
|
7.0%
|
||||||||||||
|
11 Hurley Street – Greater Boston/Cambridge
|
$
|
—
|
|
$
|
6,403
|
|
$
|
2,496
|
|
$
|
TBD
|
|
$
|
TBD
|
|
(1)
|
(1)
|
(1)
|
||||||||||||
|
9625 Towne Centre Drive – San Diego/University Town Center
|
$
|
—
|
|
$
|
22,958
|
|
$
|
1,000
|
|
$
|
TBD
|
|
$
|
TBD
|
|
(1)
|
(1)
|
(1)
|
||||||||||||
|
Consolidated redevelopment projects
|
$
|
—
|
|
$
|
139,931
|
|
$
|
11,000
|
|
$
|
122,926
|
|
$
|
241,000
|
|
|||||||||||||||
|
(1)
|
The design and budget of this project are in process, and the estimated project costs with related yields are expected to be disclosed in the near future.
|
62
Near-term and future value-creation development projects in North America
The following table summarizes the components of the book value and square footage of our near-term and future value-creation development projects in North America as of
September 30, 2015
(dollars in thousands, except per square foot amounts):
|
Square Feet
|
|||||||||||||||||
|
Property – Market/Submarket
|
Book Value
|
Value-Creation Project
|
Embedded Land
(1)
|
Total
|
Cost Per
Square Foot
|
||||||||||||
|
Near-Term Value-Creation Development Projects –
Land undergoing predevelopment activities (CIP)
|
|||||||||||||||||
|
505 Brannan Street, Phase I – San Francisco/SoMa
|
$
|
24,935
|
|
150,000
|
|
—
|
|
150,000
|
|
$
|
166
|
|
|||||
|
East 29th Street – New York City/Manhattan
|
—
|
|
—
|
|
420,000
|
|
(2)
|
420,000
|
|
—
|
|
||||||
|
5200 Illumina Way – San Diego/University Town Center
|
9,926
|
|
386,044
|
|
—
|
|
386,044
|
|
26
|
|
|||||||
|
10300 Campus Point Drive, Building 2 – San Diego/University Town Center
|
6,530
|
|
292,387
|
|
—
|
|
292,387
|
|
22
|
|
|||||||
|
4796 Executive Drive – San Diego/University Town Center
|
5,967
|
|
61,755
|
|
—
|
|
61,755
|
|
97
|
|
|||||||
|
Near-term value-creation development projects
|
47,358
|
|
890,186
|
|
420,000
|
|
1,310,186
|
|
36
|
|
|||||||
|
Future Value-Creation Development Projects –
Land held for development
|
|||||||||||||||||
|
Alexandria Technology Square
®
– Greater Boston/Cambridge
|
7,790
|
|
100,000
|
|
—
|
|
100,000
|
|
78
|
|
|||||||
|
505 Brannan Street, Phase II – San Francisco/SoMa
|
12,744
|
|
165,000
|
|
—
|
|
165,000
|
|
77
|
|
|||||||
|
Grand Avenue – San Francisco/South San Francisco
(3)
|
45,056
|
|
397,132
|
|
—
|
|
397,132
|
|
113
|
|
|||||||
|
560 Eccles Avenue – San Francisco/South San Francisco
(4)
|
17,655
|
|
144,000
|
|
—
|
|
144,000
|
|
123
|
|
|||||||
|
ARE Sunrise – San Diego/Torrey Pines
|
—
|
|
—
|
|
133,000
|
|
133,000
|
|
—
|
|
|||||||
|
1150/1165/1166 Eastlake Avenue East – Seattle/Lake Union
(5)
|
34,079
|
|
266,266
|
|
—
|
|
266,266
|
|
128
|
|
|||||||
|
1818 Fairview Avenue East – Seattle/Lake Union
|
8,562
|
|
188,490
|
|
—
|
|
188,490
|
|
45
|
|
|||||||
|
Other
|
61,427
|
|
1,967,487
|
|
436,000
|
|
2,403,487
|
|
26
|
|
|||||||
|
Future value-creation development projects
|
187,313
|
|
3,228,375
|
|
569,000
|
|
3,797,375
|
|
49
|
|
|||||||
|
Total near-term and future value-creation development projects in North America
|
$
|
234,671
|
|
4,118,561
|
|
989,000
|
|
5,107,561
|
|
$
|
46
|
|
|||||
|
(1)
|
Embedded land generally represents adjacent land acquired in connection with the acquisition of operating properties. As a result, the real estate basis attributable to these land parcels is primarily classified in rental properties.
|
|
(2)
|
We hold a right to ground-lease a parcel supporting the future ground-up development of approximately 420,000 Square Feet at the Alexandria Center
®
for Life Science pursuant to an option under our ground lease. We have begun discussions regarding this option and the potential to increase the site density beyond 420,000 Square Feet.
|
|
(3)
|
Represents two additional land parcels located adjacent to/surrounding the recently developed 249/259/269 East Grand Avenue campus leased to Amgen Inc. in South San Francisco.
|
|
(4)
|
Represents an additional land parcel located nearby our 341/343 Oyster Point Boulevard properties and within walking distance of Roche’s campus in South San Francisco.
|
|
(5)
|
The cost per square foot for 1165 Eastlake Avenue East includes an existing structure that can substantially be incorporated into the development plans.
|
63
Summary of capital expenditures
The following table summarizes the total projected construction spending for the three months, and year ending
December 31, 2015
, which includes interest, property taxes, insurance, payroll, and other indirect project costs (in thousands):
|
Projected Construction Spending
|
Three Months Ending December 31, 2015
|
|||||||||||||
|
Development and redevelopment projects under construction:
|
||||||||||||||
|
Development (consolidated)
|
$
|
120,000
|
|
|||||||||||
|
Development (unconsolidated joint venture)
|
4,000
|
|
||||||||||||
|
Redevelopment
|
11,000
|
|
||||||||||||
|
Developments/redevelopments recently transferred to rental properties
|
27,500
|
|
(1)
|
|||||||||||
|
Generic laboratory infrastructure/building improvement projects
|
21,000
|
|
(2)
|
|||||||||||
|
Development and redevelopment projects under construction
|
183,500
|
|||||||||||||
|
Near-term value-creation projects
|
15,000
|
(3)
|
||||||||||||
|
Value-creation projects
|
198,500
|
|||||||||||||
|
Non-revenue-enhancing capital expenditures and tenant improvements
|
3,500
|
|||||||||||||
|
Projected construction spending for the three months ending
December 31, 2015 (midpoint)
|
$
|
202,000
|
||||||||||||
|
Full-Year Construction Spending Guidance
|
Year Ending December 31, 2015
|
|||||||||||||
|
Projected construction spending for the three months ending
December 31, 2015 (range)
|
$
|
177,000
|
|
–
|
227,000
|
|
||||||||
|
Actual construction spending for the nine months ended September 30, 2015
|
358,351
|
|||||||||||||
|
Guidance range for the year ending December 31, 2015
|
$
|
535,000
|
|
–
|
585,000
|
|
||||||||
|
(1)
|
Includes spending for projects recently placed into service, including 11055/11065/11075 Roselle Street, 4757 Nexus Center Drive, and 1616 Eastlake Avenue East, that may require additional construction prior to occupancy, generally ranging from 15,000 to 30,000 RSF of the project, plus amounts related to 75/125 Binney Street.
|
|
(2)
|
Includes, among others, 3535 General Atomics Court, 9373 Towne Centre Drive, 5810/5820/6175 Nancy Ridge Drive, 44 Hartwell Avenue, 19 Presidential Way, and 2525 East NC Highway 54.
|
|
(3)
|
See the overview of our near-term value-creation projects on pages
58, 59
and
63
.
|
64
Our construction spending for the
nine months ended September 30, 2015
, consisted of the following (in thousands):
|
Actual Construction Spending
|
Nine Months Ended September 30, 2015
|
||||
|
Development
|
$
|
228,577
|
|
||
|
Redevelopment
|
32,833
|
|
|||
|
Predevelopment
|
27,602
|
|
|||
|
Generic laboratory infrastructure/building improvement projects
(1)
|
66,061
|
|
|||
|
Asia
|
7,816
|
|
|||
|
Total construction spending
|
$
|
362,889
|
|
||
|
Total construction spending, consolidated
|
$
|
354,910
|
|
||
|
Total construction spending, unconsolidated joint ventures
|
7,979
|
|
(2)
|
||
|
Total construction spending
|
$
|
362,889
|
|
||
|
(1)
|
Includes revenue-enhancing projects and non-revenue-enhancing capital expenditures shown in the table below.
|
|
(2)
|
Construction spending for unconsolidated joint ventures is reflected as investment in unconsolidated real estate joint ventures in our consolidated statements of cash flows.
|
The table below reconciles construction spending on an accrual basis to our additions to properties on a cash basis (in thousands):
|
Actual Construction Spending
|
Nine Months Ended September 30, 2015
|
|||||
|
Construction spending, consolidated real estate (accrual basis)
|
$
|
354,910
|
|
|||
|
Change in accrued construction
|
7,305
|
|
||||
|
Additions to real estate (cash basis)
|
$
|
362,215
|
|
|||
The table below shows the average per RSF of property-related non-revenue-enhancing capital expenditures, tenant improvements, and leasing costs, excluding capital expenditures and tenant improvements that are recoverable from client tenants, revenue-enhancing, or related to properties that have undergone redevelopment (dollars in thousands, except per RSF amounts):
|
Non-Revenue-Enhancing Capital Expenditures, Tenant Improvements, and Leasing Costs
|
Nine Months Ended September 30, 2015
|
Recent Average
Per RSF
(1)
|
|||||||||||||
|
Amount
|
RSF
|
Per RSF
|
|||||||||||||
|
Non-revenue-enhancing capital expenditures
|
$
|
7,425
|
|
16,270,212
|
|
$
|
0.46
|
|
$
|
0.35
|
|
||||
|
Tenant improvements and leasing costs:
|
|||||||||||||||
|
Re-tenanted space
|
$
|
7,630
|
|
514,223
|
|
$
|
14.84
|
|
$
|
13.47
|
|
||||
|
Renewal space
|
10,073
|
|
1,215,016
|
|
8.29
|
|
6.73
|
|
|||||||
|
Total tenant improvements and leasing costs/weighted-average
|
$
|
17,703
|
|
1,729,239
|
|
$
|
10.24
|
|
$
|
8.38
|
|
||||
|
(1)
|
Represents the average of the years ended December 31, 2011, through December 31, 2014, and the
nine months ended September 30, 2015
, annualized.
|
Value-creation projects – commencement of development projects in North America
During the
nine months ended September 30, 2015
, we commenced
four
ground-up development projects in North America, consisting of our development of (i) a
530,477
RSF project at 50/60 Binney Street in our Cambridge submarket, which is
98%
leased to Sanofi and bluebird, bio, Inc., (ii) a
287,806
RSF project at 400 Dexter Avenue North in our Lake Union submarket, with
161,433
RSF, or
56%
of the project, currently leased to
Juno Therapeutics, Inc.
, excluding the expansion option it holds to lease an additional
67,122
RSF, (iii) a
431,483
RSF project at 100 Binney Street in our Cambridge submarket, which is
98%
leased or under negotiation, including
252,022
RSF, or
58%
of the project, leased to Bristol-Myers Squibb Company, and (iv) a
300,000
RSF project at 510 Townsend Street in our SoMa submarket, which is
100%
leased to Stripe, Inc. Refer to “Development Projects Under Construction” appearing elsewhere in Item 2 of this report for further information.
65
External growth – development and redevelopment projects placed into service
The following table presents key development and redevelopment projects, including our unconsolidated joint ventures, placed into service during the
nine months ended September 30, 2015
(dollars in thousands):
|
%
of Project
in Service
|
Unlevered
|
|||||||||||||||||||||||||||||||||||||||
|
RSF in Service
|
Average
Cash
Yield
|
Initial Stabilized Yield
(Cash Basis)
|
Initial Stabilized Yield
|
|||||||||||||||||||||||||||||||||||||
|
Date Placed into Service
|
Prior to 1/1/15
|
Placed into Service in 2015
|
Total
|
Total Project
|
||||||||||||||||||||||||||||||||||||
|
Property – Market/Submarket
|
First Quarter
|
Second Quarter
|
Third Quarter
|
Leased/
Negotiating
|
Investment
|
|||||||||||||||||||||||||||||||||||
|
Consolidated development projects
|
||||||||||||||||||||||||||||||||||||||||
|
75/125 Binney Street – Greater Boston/Cambridge
|
March 2015
|
—
|
|
388,270
|
|
—
|
|
—
|
|
388,270
|
|
100%
|
100%
|
$
|
361,000
|
|
(1)
|
9.3
|
%
|
(1)
|
8.4
|
%
|
(1)
|
8.3
|
%
|
(1)
|
||||||||||||||
|
430 East 29th Street – New York City/Manhattan
|
Various
|
241,417
|
|
43,209
|
|
3,611
|
|
62,490
|
|
350,727
|
|
84%
|
98%
|
$
|
463,245
|
|
7.1
|
%
|
(2)
|
6.6
|
%
|
(2)
|
6.5
|
%
|
(2)
|
|||||||||||||||
|
3013/3033 Science Park Road – San Diego/Torrey Pines
|
Various
|
42,047
|
|
60,891
|
|
—
|
|
—
|
|
102,938
|
|
62%
|
81%
|
$
|
104,790
|
|
7.7
|
%
|
(2)
|
7.2
|
%
|
(2)
|
7.1
|
%
|
(2)
|
|||||||||||||||
|
Unconsolidated joint venture development project
|
||||||||||||||||||||||||||||||||||||||||
|
360 Longwood Avenue –
Greater Boston/Longwood Medical Area |
Various
|
155,524
|
|
2,107
|
|
51,997
|
|
50,231
|
|
259,859
|
|
63%
|
64%
|
$
|
108,965
|
|
(3)
|
8.2
|
%
|
(2)
|
7.3
|
%
|
(2)
|
7.8
|
%
|
(2)
|
||||||||||||||
|
Consolidated redevelopment projects
|
||||||||||||||||||||||||||||||||||||||||
|
225 Second Avenue – Greater Boston/Route 128
|
May 2015
|
—
|
|
—
|
|
112,500
|
|
—
|
|
112,500
|
|
100%
|
100%
|
$
|
47,172
|
|
9.0
|
%
|
(2)
|
8.3
|
%
|
(2)
|
8.4
|
%
|
(4)
|
|||||||||||||||
|
11055/11065/11075 Roselle Street –
San Diego/Sorrento Valley |
Various
|
23,936
|
|
—
|
|
31,277
|
|
—
|
|
55,213
|
|
100%
|
75%
|
$
|
18,193
|
|
8.1
|
%
|
(5)
|
7.9
|
%
|
(5)
|
8.0
|
%
|
(5)
|
|||||||||||||||
|
(1)
|
Previously disclosed estimated yields were 9.1% average cash yield, 8.0% for initial stabilized yield (cash basis), and 8.2% for initial stabilized yield and cost of completion was $351.4 million.
|
|
(2)
|
Consistent with previously disclosed estimated yields.
|
|
(3)
|
Represents ARE’s investment at completion related to its 27.5% interest in this unconsolidated joint venture. See pages
61
and
70
for additional information.
|
|
(4)
|
Increased from previously disclosed estimated yield of 8.3% for initial stabilized yield. The increase in the initial stabilized yield and investment into the project reflect the final terms of our lease with the client tenant.
|
|
(5)
|
Increased from previously discl
osed estimated yields of 8.0% for average cash yield, 7.8% for initial stabilized yield (cash basis), and 7.9% for initial stabilized yield. The increase in the yields
reflects the final project costs.
|
66
External growth – acquisitions
The following table presents acquisitions completed during the
nine months ended September 30, 2015
(dollars in thousands):
|
Unlevered
|
||||||||||||||||||||||||||||||||||||
|
Property – Market/Submarket
|
Date Acquired
|
Number of Properties
|
Gross Purchase Price
|
Loan Assumption
|
Percentage
|
Average
Cash Yield |
Initial
Stabilized Yield (Cash) |
Initial
Stabilized Yield |
||||||||||||||||||||||||||||
|
Type
|
RSF
|
Leased
|
Negotiating
|
|||||||||||||||||||||||||||||||||
|
640 Memorial Drive –
Greater Boston/Cambridge |
Operating
|
1/21/15
|
1
|
$
|
176,500
|
|
$
|
82,000
|
|
(1)
|
225,504
|
|
100%
|
—%
|
6.8%
|
6.4%
|
7.5%
|
|||||||||||||||||||
|
Alexandria Technology Square
®
(10% noncontrolling interest) – Greater Boston/Cambridge |
Operating
|
1/21/15
|
N/A
|
(2)
|
108,250
|
|
(2)
|
—
|
|
1,181,635
|
|
100%
|
—%
|
6.1%
|
(3)
|
5.4%
|
(3)
|
6.1%
|
(3)
|
|||||||||||||||||
|
505 Brannan Street – San Francisco/SoMa
|
Land
|
4/30/15
|
—
|
34,000
|
|
—
|
|
315,000
|
|
100%
|
—%
|
TBD
|
TBD
|
TBD
|
||||||||||||||||||||||
|
1818 Fairview Avenue East – Seattle/Lake Union
|
Land
|
5/6/15
|
—
|
8,444
|
|
(4)
|
—
|
|
188,490
|
|
—%
|
—%
|
TBD
|
TBD
|
TBD
|
|||||||||||||||||||||
|
10290 Campus Point Drive –
San Diego/
University Town Center
|
Redevelopment
|
7/1/15
|
1
|
105,000
|
|
—
|
|
304,326
|
|
100%
|
—%
|
7.6
|
%
|
|
6.8
|
%
|
|
7.0
|
%
|
|||||||||||||||||
|
11 Hurley Street –
Greater Boston/Cambridge
|
Redevelopment
|
9/15/15
|
1
|
5,908
|
|
(5)
|
—
|
|
59,000
|
|
—%
|
100%
|
TBD
|
TBD
|
TBD
|
|||||||||||||||||||||
|
3
|
$
|
438,102
|
|
$
|
82,000
|
|
2,273,955
|
|
||||||||||||||||||||||||||||
|
(1)
|
Represents a secured note payable with a contractual rate of 3.93% and a maturity date in 2023.
|
|
(2)
|
During the three months ended March 31, 2015, we executed an agreement to purchase the outstanding
10%
noncontrolling interest in our
1.2 million
RSF campus at Alexandria Technology Square
®
for
$108.3 million
. Upon execution of the purchase agreement, we recognized a liability representing the fair value of the aggregate consideration, primarily consisting of the
$108.3 million
purchase price. The first installment of
$54.3 million
was paid on April 1, 2015, and the second installment of
$54.0 million
is due on April 1, 2016.
|
|
(3)
|
We believe there is further upside in our projected returns as we anticipate significant rent growth from 81% of the leases contractually ending in the five years following the date of acquisition. Additionally, we believe we can increase our
1.2 million
RSF campus by an additional 100,000 RSF and further increase NOI. The campus is currently 100% occupied and subject to a long-term ground lease. After considering the
$108.3 million
purchase of the outstanding
10%
noncontrolling interest in this flagship campus and the anticipated near- and medium-term upside in NOI from rental rate growth and campus expansion, we estimate that we can enhance our unlevered yields on our aggregate investment in the campus over the next five years to 8.5% and 8.1% (cash basis).
|
|
(4)
|
We acquired this site for future development and the land parcel is subject to a long-term ground lease. The land parcel is located adjacent to one of our existing campuses in the Lake Union submarket.
|
|
(5)
|
We acquired this project for redevelopment and the property is subject to a long-term ground lease.
|
67
Dispositions and other sources of capital
The following table presents real estate asset sales completed during the
nine months ended September 30, 2015
, and pending and projected remainder/asset sales for the balance of 2015 (dollars in thousands):
|
Property – Market/Submarket
|
Number of Operating Properties
|
Square Feet
|
Interest Sold/Subject to Sale
|
NOI
(1)
|
Cash NOI
(1)
|
Cash Capitalization Rate
|
Actual/Estimated Sales Price
|
|||||||||||||||||
|
Completed in the nine months ended September 30, 2015
|
||||||||||||||||||||||||
|
661 University Avenue – Canada/Toronto
|
1
|
N/A
|
|
100%
|
$
|
(1,363
|
)
|
$
|
(135
|
)
|
N/A
|
$
|
54,104
|
|||||||||||
|
270 Third Street – Greater Boston/Cambridge
|
—
|
N/A
|
|
100%
|
—
|
|
—
|
|
N/A
|
25,477
|
||||||||||||||
|
Other
|
2
|
196,859
|
|
100%
|
(595
|
)
|
(595
|
)
|
N/A
|
14,335
|
||||||||||||||
|
Completed in the nine months ended September 30, 2015
|
$
|
(1,958
|
)
|
$
|
(730
|
)
|
N/A
|
$
|
$93,916
|
|||||||||||||||
|
Under contract
|
||||||||||||||||||||||||
|
225 Binney Street – Greater Boston/Cambridge
(2)
|
1
|
305,212
|
|
70%
|
$
|
9,320
|
|
$
|
8,650
|
|
4.5%
|
190,110
|
||||||||||||
|
1500 Owens Street – San Francisco/South San Francisco
(3)
|
1
|
158,267
|
|
49.9%
|
4,169
|
|
3,524
|
|
4.8
|
73,353
|
||||||||||||||
|
75/125 Shoreway Road – San Francisco/Palo Alto/Stanford Research Park
|
1
|
82,874
|
|
100%
|
2,616
|
|
2,231
|
|
5.8
|
38,500
|
||||||||||||||
|
Under contract
|
$
|
16,105
|
|
$
|
14,405
|
|
4.8%
|
$
|
301,963
|
|||||||||||||||
|
Dispositions completed and under contract
|
$
|
395,879
|
||||||||||||||||||||||
|
Pending/targeted asset sales
(4)
|
||||||||||||||||||||||||
|
Partial interest in core property/core-like properties
(4)
|
TBD
|
TBD
|
70% to 100%
|
TBD
|
TBD
|
4.5% to 6.0%
|
305,000
(4)
|
|||||||||||||||||
|
Total dispositions completed and other sources of capital for 2015
|
$
|
650,000
|
to
|
$
|
750,000
|
|
||||||||||||||||||
|
(1)
|
Annualized NOI for the quarter ended prior to the date of sale. Cash NOI excludes straight-line rent. NOI and sales price related to sale of less than 100% of the property represents the proportional interest of the total property.
|
|
(2)
|
In July 2015, we executed an agreement to sell an interest in 225 Binney Street to a high-quality institutional investor.
|
|
(3)
|
In October 2015, we executed an agreement to sell an interest in 1500 Owens Street to a high-quality institutional investor. Due diligence is expected to be completed by the buyer on or around November 4, 2015.
|
|
(4)
|
We have several properties targeted for sale, including the sale of a partial interest in one high-value core property that by itself will meet the remainder/asset sales goal of
$305 million
. We also continue to pursue the sale of 500 Forbes Boulevard located in our South San Francisco submarket.
|
68
Investments in unconsolidated joint ventures
360 Longwood Avenue
We are currently developing a building aggregating
413,536
RSF in the Longwood Medical Area submarket of the Greater Boston market through an unconsolidated joint venture. We expect to earn unlevered yields on our share of the gross real estate in the joint venture as follows: (i) an initial stabilized yield of
7.8%
, (ii) an initial stabilized yield (cash basis) of
7.3%
, and (iii) an average cash yield during the term of the initial leases of
8.2%
. Our projected unlevered yields are based upon our share of the investment in real estate of the joint venture at completion of approximately
$109.0 million
, including costs incurred directly by us outside the joint venture. In addition to these yields, we will receive recurring monthly property management fees thereafter from this project. Construction management and other fees have been excluded from our estimate of unlevered yields. Refer to Note 3 – “Investments in Real Estate” to our unaudited consolidated financial statements under Item 1 of this report.
1455/1515 Third Street
Alexandria and Uber entered into a joint venture agreement and acquired two land parcels supporting the development of two buildings aggregating
422,980
RSF at 1455/1515 Third Street in the Mission Bay submarket in San Francisco for a total purchase price of
$125.0 million
. We are in the process of finalizing the design and construction budget with Uber, and we expect to provide the total estimated cost at completion and estimated yields in the near future. Refer to Note 3 – “Investments in Real Estate” to our unaudited consolidated financial statements under Item 1 of this report.
69
The following table sets forth the information related to our unconsolidated joint ventures as of
September 30, 2015
(dollars in thousands):
|
Three months ended September 30, 2015
|
||||||||||||||||||||
|
360 Longwood Avenue
|
1455/1515 Third Street
|
Total ARE
Share
|
||||||||||||||||||
|
100%
|
ARE’s 27.5%
Share
|
100%
|
ARE’s 51%
Share
|
|||||||||||||||||
|
Revenue
|
$
|
6,148
|
|
$
|
1,770
|
|
(1)
|
$
|
208
|
|
$
|
105
|
|
$
|
1,875
|
|
||||
|
Rental operations
|
(1,474
|
)
|
(407
|
)
|
(142
|
)
|
(71
|
)
|
(478
|
)
|
||||||||||
|
4,674
|
|
1,363
|
|
66
|
|
34
|
|
1,397
|
|
|||||||||||
|
Interest
|
(877
|
)
|
(242
|
)
|
—
|
|
—
|
|
(242
|
)
|
||||||||||
|
Depreciation and amortization
|
(1,092
|
)
|
(377
|
)
|
(133
|
)
|
(68
|
)
|
(445
|
)
|
||||||||||
|
Net income (loss)
|
$
|
2,705
|
|
$
|
744
|
|
$
|
(67
|
)
|
$
|
(34
|
)
|
$
|
710
|
|
|||||
|
Nine months ended September 30, 2015
|
||||||||||||||||||||
|
360 Longwood Avenue
|
1455/1515 Third Street
|
Total ARE
Share
|
||||||||||||||||||
|
100%
|
ARE’s 27.5%
Share
|
100%
|
ARE’s 51%
Share
|
|||||||||||||||||
|
Revenue
|
$
|
14,624
|
|
$
|
4,244
|
|
(1)
|
$
|
346
|
|
$
|
176
|
|
$
|
4,420
|
|
||||
|
Rental operations
|
(3,704
|
)
|
(1,022
|
)
|
(414
|
)
|
(210
|
)
|
(1,232
|
)
|
||||||||||
|
10,920
|
|
3,222
|
|
(68
|
)
|
(34
|
)
|
3,188
|
|
|||||||||||
|
Interest
|
(1,027
|
)
|
(284
|
)
|
—
|
|
—
|
|
(284
|
)
|
||||||||||
|
Depreciation and amortization
|
(2,502
|
)
|
(876
|
)
|
(397
|
)
|
(203
|
)
|
(1,079
|
)
|
||||||||||
|
Net income (loss)
|
$
|
7,391
|
|
$
|
2,062
|
|
$
|
(465
|
)
|
$
|
(237
|
)
|
$
|
1,825
|
|
|||||
|
As of September 30, 2015
|
||||||||||||||||||||
|
360 Longwood Avenue
|
1455/1515 Third Street
|
Total ARE
Share
(2)
|
||||||||||||||||||
|
100%
|
ARE’s 27.5%
Share
(2)
|
100%
|
ARE’s 51%
Share
(2)
|
|||||||||||||||||
|
Rental properties
|
$
|
194,617
|
|
$
|
58,898
|
|
$
|
21,150
|
|
$
|
10,787
|
|
$
|
69,685
|
|
|||||
|
Construction in progress
|
115,486
|
|
35,004
|
|
114,118
|
|
61,708
|
|
96,712
|
|
||||||||||
|
Gross investments in real estate
|
310,103
|
|
93,902
|
|
135,268
|
|
72,495
|
|
166,397
|
|
||||||||||
|
Less: accumulated depreciation
|
(2,960
|
)
|
(997
|
)
|
(573
|
)
|
(292
|
)
|
(1,289
|
)
|
||||||||||
|
Investments in real estate
|
307,143
|
|
92,905
|
|
134,695
|
|
72,203
|
|
165,108
|
|
||||||||||
|
Other assets
|
21,316
|
|
6,775
|
|
13,639
|
|
7,102
|
|
13,877
|
|
||||||||||
|
Total assets
|
$
|
328,459
|
|
$
|
99,680
|
|
$
|
148,334
|
|
$
|
79,305
|
|
$
|
178,985
|
|
|||||
|
Secured notes payable
|
$
|
175,326
|
|
(3)
|
$
|
48,215
|
|
$
|
—
|
|
$
|
—
|
|
$
|
48,215
|
|
||||
|
Other liabilities
|
3,878
|
|
1,065
|
|
6,327
|
|
3,234
|
|
4,299
|
|
||||||||||
|
Total liabilities
|
179,204
|
|
49,280
|
|
6,327
|
|
3,234
|
|
52,514
|
|
||||||||||
|
Equity
|
149,255
|
|
50,400
|
|
142,007
|
|
76,071
|
|
126,471
|
|
||||||||||
|
Total liabilities and equity
|
$
|
328,459
|
|
$
|
99,680
|
|
$
|
148,334
|
|
$
|
79,305
|
|
$
|
178,985
|
|
|||||
|
RSF
|
RSF
|
|||||||||||||||||||
|
Rental properties
|
259,859
|
|
—
|
|
||||||||||||||||
|
Active development (CIP)
(4)
|
153,677
|
|
422,980
|
|
||||||||||||||||
|
Total
|
413,536
|
|
422,980
|
|
||||||||||||||||
|
(1)
|
Included development and property management fees earned.
|
|
(2)
|
Amounts include costs incurred directly by us outside of the joint ventures. We believe the information on our share of investments in unconsolidated joint ventures is useful information for investors as it provides our proportional share of the investments in real estate from all properties, including our share of the assets and liabilities of our unconsolidated joint ventures. This information also allows investors to estimate the impact of real estate investments and debt financing at the joint venture level.
|
|
(3)
|
Secured construction loan with aggregate commitments of
$213.2 million
; borrowings outstanding bear interest at LIBOR+3.75%, with a floor of 5.25%. The maturity date of the loan is April 1, 2017, with two, one-year options to extend the stated maturity date to April 1, 2019, subject to certain conditions.
|
|
(4)
|
Refer to page
61
for further detail of our unconsolidated joint venture development projects.
|
70
Real estate investments in Asia
Our investments in real estate in Asia consisted of the following as of
September 30, 2015
(dollars in thousands):
|
Number of Properties
|
ABR
|
Occupancy Percentage
|
Book Value
(1)
|
Square Feet
|
|||||||||||
|
Rental properties in China
|
2
|
$
|
1,217
|
|
53.6
|
%
|
$
|
78,652
|
|
634,328
|
|
||||
|
Rental properties in India
|
6
|
5,670
|
|
66.0
|
|
69,167
|
|
565,386
|
|
||||||
|
Rental properties in Asia
|
8
|
$
|
6,887
|
|
59.4
|
%
|
147,819
|
|
1,199,714
|
|
|||||
|
Land held for future development in India
|
77,261
|
|
6,419,707
|
|
|||||||||||
|
Total investments in real estate in Asia
|
$
|
225,080
|
|
(1)
|
7,619,421
|
|
|||||||||
(1) Includes cumulative unrealized foreign currency translation losses of approximately
$47.4 million
as of
September 30, 2015
.
71
Results of operations
Key operating metrics
|
Occupancy of Operating Properties
North America
(1)
|
Annualized Based Rent
(1)
by Market
|
|

|
|
|
|
% of ARE’s Total ABR
|
||
|
Rental Rate Increases:
Renewed/Re-leased Space |
Same Property NOI Increase
|
|

|
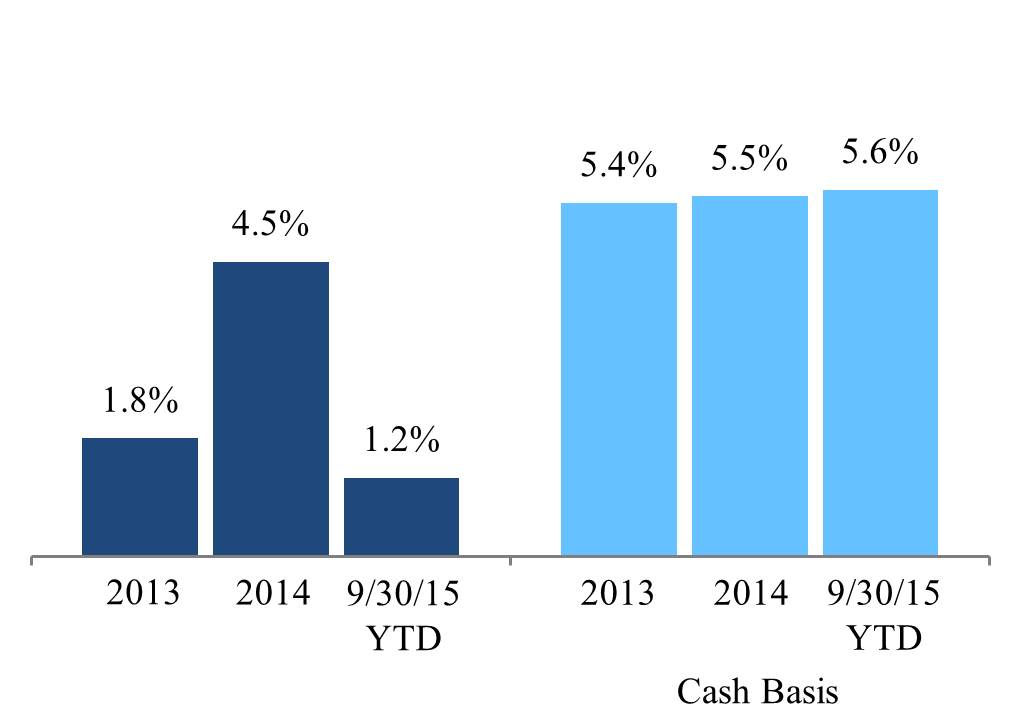
|
|
|
Favorable Lease Structure
|
Adjusted EBITDA Margin
(2)
|
||
|
65%
|
|||
|
Percentage of
triple net leases |
96%
|
||
|
Stable cash flow
|
|||
|
Percentage of leases
containing annual rent escalations |
95%
|
||
|
Increasing cash flows
|
|||
|
Percentage of leases
providing for the recapture of capital expenditures |
94%
|
||
|
Lower capex burden
|
|||
|
(1)
|
As of the end of each respective period.
|
|
(2)
|
Represents the
three months ended September 30, 2015
, annualized.
|
72
Same Properties
As a result of changes within our total property portfolio, the financial data presented in the tables in “Comparison of the
Three Months Ended September 30, 2015
, to the
Three Months Ended September 30, 2014
,” and “Comparison of the
Nine Months Ended September 30, 2015
, to the
Nine Months Ended September 30, 2014
,” show significant changes in revenue and expenses from period to period. In order to supplement an evaluation of our results of operations, we analyze the operating performance for all properties that were operating for the periods presented (“Same Properties”) separate from properties acquired subsequent to the beginning of the earliest period presented, properties currently undergoing development or redevelopment, and corporate entities (legal entities performing general and administrative functions), which are excluded from Same Properties’ results (“Non-Same Properties”). Additionally, rental revenues from lease termination fees, if any, are excluded from the results of Same Properties.
The following table presents information regarding our Same Properties for the three and
nine months ended September 30, 2015
:
|
Three Months Ended September 30, 2015
|
Nine Months Ended September 30, 2015
|
|||||
|
Percentage change in NOI over comparable period from prior year
|
1.1%
|
|
1.2%
|
|||
|
Percentage change in NOI (cash basis) over comparable period from prior year
|
4.8%
|
|
5.6%
|
|
||
|
Operating margin
|
68%
|
|
70%
|
|||
|
Number of Same Properties
|
168
|
|
163
|
|
||
|
RSF
|
14,410,625
|
|
13,917,359
|
|
||
|
Occupancy – current-period average
|
93.3%
|
95.7%
|
||||
|
Occupancy – same-period prior year average
|
94.4%
|
95.8%
|
||||
73
The following table reconciles the number of Same Properties to total properties for the
nine months ended September 30, 2015
:
|
Development – under construction
|
Properties
|
||
|
50/60 Binney Street
|
2
|
|
|
|
100 Binney Street
|
1
|
|
|
|
510 Townsend Street
|
1
|
|
|
|
430 East 29th Street
|
1
|
|
|
|
5200 Illumina Way, Building 6
|
1
|
|
|
|
3013/3033 Science Park Road
|
2
|
|
|
|
400 Dexter Avenue North
|
1
|
|
|
|
6040 George Watts Hill Drive
|
1
|
|
|
|
360 Longwood Avenue (unconsolidated joint venture)
|
1
|
|
|
|
1455/1515 Third Street (unconsolidated joint venture)
|
2
|
|
|
|
13
|
|
||
|
Development – placed into service after January 1, 2014
|
Properties
|
||
|
75/125 Binney Street
|
1
|
|
|
|
499 Illinois Street
|
1
|
|
|
|
269 East Grand Avenue
|
1
|
|
|
|
3
|
|
||
|
Redevelopment – under construction
|
Properties
|
||
|
11 Hurley Street
|
1
|
|
|
|
10290 Campus Point Drive
|
1
|
|
|
|
9625 Towne Centre Drive
|
1
|
|
|
|
3
|
|
||
|
Redevelopment – placed into service after January 1, 2014
|
Properties
|
||
|
225 Second Avenue
|
1
|
|
|
|
11055/11065/11075 Roselle Street
|
3
|
|
|
|
10121 Barnes Canyon Road
|
1
|
|
|
|
5
|
|
||
|
Summary
|
Properties
|
||
|
Projects under construction:
|
|||
|
Development
|
13
|
|
|
|
Redevelopment
|
3
|
|
|
|
Projects placed into service after
January 1, 2014:
|
|||
|
Development
|
3
|
|
|
|
Development – Asia
|
2
|
|
|
|
Redevelopment
|
5
|
|
|
|
Acquisitions after January 1, 2014:
|
|||
|
3545 Cray Court
|
1
|
|
|
|
4025/4031/4045/Sorrento Valley Boulevard
|
3
|
|
|
|
640 Memorial Drive
|
1
|
|
|
|
Properties “held for sale” in current or
preceding periods
|
4
|
|
|
|
Total properties excluded from Same Properties
|
35
|
|
|
|
Same Properties
|
163
|
|
|
|
Total properties for the
|
|||
|
nine months ended September 30, 2015
|
198
|
|
|
74
Comparison of the three months ended
September 30, 2015
, to the three months ended
September 30, 2014
The following table presents a comparison of the components of NOI for our Same Properties and Non-Same Properties for the three months ended
September 30, 2015
, compared to the three months ended
September 30, 2014
, and a reconciliation of NOI to income from continuing operations, the most directly comparable financial measure (dollars in thousands):
|
|
Three Months Ended September 30,
|
||||||||||||||
|
2015
|
2014
|
$ Change
|
% Change
|
||||||||||||
|
Revenues:
|
|||||||||||||||
|
Rental – Same Properties
|
$
|
124,947
|
|
$
|
125,795
|
|
$
|
(848
|
)
|
(0.7
|
)%
|
||||
|
Rental – Non-Same Properties
|
30,364
|
|
11,923
|
|
18,441
|
|
154.7
|
|
|||||||
|
Total rental
|
155,311
|
|
137,718
|
|
17,593
|
|
12.8
|
|
|||||||
|
Tenant recoveries – Same Properties
|
48,395
|
|
43,121
|
|
5,274
|
|
12.2
|
|
|||||||
|
Tenant recoveries – Non-Same Properties
|
7,724
|
|
2,451
|
|
5,273
|
|
215.1
|
|
|||||||
|
Total tenant recoveries
|
56,119
|
|
45,572
|
|
10,547
|
|
23.1
|
|
|||||||
|
Other income – Same Properties
|
304
|
|
18
|
|
286
|
|
1,588.9
|
|
|||||||
|
Other income – Non-Same Properties
|
6,876
|
|
2,307
|
|
4,569
|
|
198.0
|
|
|||||||
|
Total other income
|
7,180
|
|
2,325
|
|
4,855
|
|
208.8
|
|
|||||||
|
Total revenues – Same Properties
|
173,646
|
|
168,934
|
|
4,712
|
|
2.8
|
|
|||||||
|
Total revenues – Non-Same Properties
|
44,964
|
|
16,681
|
|
28,283
|
|
169.6
|
|
|||||||
|
Total revenues
|
218,610
|
|
185,615
|
|
32,995
|
|
17.8
|
|
|||||||
|
Expenses:
|
|||||||||||||||
|
Rental operations – Same Properties
|
55,278
|
|
51,846
|
|
3,432
|
|
6.6
|
|
|||||||
|
Rental operations – Non-Same Properties
|
13,568
|
|
5,577
|
|
7,991
|
|
143.3
|
|
|||||||
|
Total rental operations
|
68,846
|
|
57,423
|
|
11,423
|
|
19.9
|
|
|||||||
|
Our share of NOI from unconsolidated joint ventures:
|
|||||||||||||||
|
Joint venture NOI – Same Properties
|
—
|
|
—
|
|
—
|
|
—
|
|
|||||||
|
Joint venture NOI – Non-Same Properties
|
1,397
|
|
—
|
|
1,397
|
|
100.0
|
|
|||||||
|
Our share of NOI from unconsolidated joint ventures
|
1,397
|
|
—
|
|
1,397
|
|
100.0
|
|
|||||||
|
NOI from continuing operations:
|
|||||||||||||||
|
NOI – Same Properties
|
118,368
|
|
117,088
|
|
1,280
|
|
1.1
|
|
|||||||
|
NOI – Non-Same Properties
|
32,793
|
|
11,104
|
|
21,689
|
|
195.3
|
|
|||||||
|
Total NOI from continuing operations
|
151,161
|
|
128,192
|
|
22,969
|
|
17.9
|
|
|||||||
|
Other expenses:
|
|||||||||||||||
|
General and administrative
|
15,143
|
|
12,609
|
|
2,534
|
|
20.1
|
|
|||||||
|
Interest
|
27,679
|
|
20,555
|
|
7,124
|
|
34.7
|
|
|||||||
|
Depreciation and amortization
|
67,953
|
|
58,388
|
|
9,565
|
|
16.4
|
|
|||||||
|
Loss on early extinguishment of debt
|
—
|
|
525
|
|
(525
|
)
|
(100.0
|
)
|
|||||||
|
110,775
|
|
92,077
|
|
18,698
|
|
20.3
|
|
||||||||
|
Less: our share of NOI from unconsolidated joint ventures
|
(1,397
|
)
|
—
|
|
(1,397
|
)
|
(100.0
|
)
|
|||||||
|
Equity in earnings of unconsolidated joint ventures
|
710
|
|
—
|
|
710
|
|
100.0
|
|
|||||||
|
Income from continuing operations
|
$
|
39,699
|
|
$
|
36,115
|
|
$
|
3,584
|
|
9.9
|
%
|
||||
|
NOI – Same Properties
|
$
|
118,368
|
|
$
|
117,088
|
|
$
|
1,280
|
|
1.1
|
%
|
||||
|
Less: straight-line rent revenue
|
(2,306
|
)
|
(6,369
|
)
|
4,063
|
|
(63.8
|
)
|
|||||||
|
NOI (cash basis) – Same Properties
|
$
|
116,062
|
|
$
|
110,719
|
|
$
|
5,343
|
|
4.8
|
%
|
||||
75
Rental revenues
Total rental revenues for the
three months ended September 30, 2015
, increased by
$17.6 million
, or
12.8%
, to
$155.3 million
, compared to
$137.7 million
for the
three months ended September 30, 2014
. The increase was primarily due to rental revenues from our Non-Same Properties, including highly leased development and redevelopment projects aggregating
1,066,878
RSF that were placed into service subsequent to
July 1, 2014
, and operating properties aggregating
225,504
RSF that were acquired subsequent to
July 1, 2014
, and consisted of the following (in thousands):
|
Three Months Ended September 30,
|
||||||||||||
|
2015
|
2014
|
Change
|
||||||||||
|
Development
|
$
|
19,492
|
|
$
|
6,815
|
|
$
|
12,677
|
|
|||
|
Redevelopment
|
4,246
|
|
201
|
|
4,045
|
|
||||||
|
Acquisitions
|
3,442
|
|
—
|
|
3,442
|
|
||||||
|
“Held for sale”
|
2,906
|
|
4,655
|
|
(1,749
|
)
|
||||||
|
Other
|
278
|
|
252
|
|
26
|
|
||||||
|
Rental revenues – Non-Same Properties
|
30,364
|
|
11,923
|
|
18,441
|
|
||||||
|
Rental revenues – Same Properties
|
124,947
|
|
125,795
|
|
(848
|
)
|
||||||
|
Total rental revenues
|
$
|
155,311
|
|
$
|
137,718
|
|
$
|
17,593
|
|
|||
Rental revenues from our Same Properties for the
three months ended September 30, 2015
, decreased by
$848 thousand
, or
0.7%
, to
$124.9 million
, compared to
$125.8 million
for the
three months ended September 30, 2014
. The decrease was primarily due to the temporary decrease in occupancy for these properties to
93.3%
as of September 30, 2015
, from
94.4%
as of September 30, 2014
.
Tenant recoveries
Tenant recoveries for the
three months ended September 30, 2015
, increased by
$10.5 million
, or
23.1%
, to
$56.1 million
, compared to
$45.6 million
for the
three months ended September 30, 2014
. This increase is relatively consistent with the increase in our rental operating expenses of
$11.4 million
, or
19.9%
. Same Properties’ tenant recoveries increased by
$5.3 million
, or
12.2%
, primarily as a result of an increase in Same Properties’ rental operating expenses of
$3.4 million
, or
6.6%
, and an increase in one of our Top 20 client tenants converting from a gross lease to a triple net lease. Same Properties’ rental operating expenses increased during the
three months ended September 30, 2015
, compared to the
three months ended September 30, 2014
, primarily related to (i) higher utility costs, and (ii) higher property taxes resulting from annual property tax reassessments. Utility costs increased primarily due to higher utility rates for properties in the San Francisco, San Diego, and Greater Boston markets. Non-Same Properties’ tenant recoveries increased by
$5.3 million
as a result of a Non-Same Properties’ rental operating expense increase of
$8.0 million
, primarily related to development and redevelopment projects placed into service subsequent to
July 1, 2014
, and operating properties acquired subsequent to
July 1, 2014
, as noted above.
Other income
Other income for the three months ended
September 30, 2015
and
2014
, consisted of the following (in thousands):
|
Three Months Ended September 30,
|
||||||||||||
|
2015
|
2014
|
Change
|
||||||||||
|
Management fee income
|
$
|
530
|
|
$
|
560
|
|
$
|
(30
|
)
|
|||
|
Interest and other income
|
1,272
|
|
1,994
|
|
(722
|
)
|
||||||
|
Investment income (loss)
|
5,378
|
|
(229
|
)
|
5,607
|
|
||||||
|
Total other income
|
$
|
7,180
|
|
$
|
2,325
|
|
$
|
4,855
|
|
|||
Total investment income (loss) for the
three months ended September 30, 2015
, aggregated to a net gain of
$5.4 million
primarily due to gains from the sale of two publicly traded investments.
76
Rental operating expenses
Total rental operating expenses for the
three months ended September 30, 2015
, increased by
$11.4 million
, or
19.9%
, to
$68.8 million
, compared to
$57.4 million
for the
three months ended September 30, 2014
. Approximately
$8.0 million
of the increase was due to an increase in rental operating expenses from our Non-Same Properties, primarily related to development and redevelopment projects placed into service subsequent to
July 1, 2014
, and one operating property acquired subsequent to
July 1, 2014
, as mentioned above. The increase in Same Properties rental operating expenses of
$3.4 million
was primarily due to higher utility costs and higher property taxes as described in “Tenant Recoveries” above.
General and administrative expenses
General and administrative expenses for the
three months ended September 30, 2015
, increased by
$2.5 million
, or
20.1%
, to
$15.1 million
, compared to
$12.6 million
for the
three months ended September 30, 2014
. General and administrative expenses increased primarily due to the continued growth in both the depth and breadth of our operations in multiple markets. As a percentage of total assets, our general and administrative expenses were consistent at
0.7%
and
0.7%
for the 12 months ended
September 30, 2015
and
2014
, respectively.
Interest expense
Interest expense for the
three months ended September 30, 2015
and 2014, consisted of the following (in thousands):
|
Three Months Ended September 30,
|
||||||||||||
|
Component
|
2015
|
2014
|
Change
|
|||||||||
|
Secured notes payable
|
$
|
7,979
|
|
$
|
7,132
|
|
$
|
847
|
|
|||
|
Unsecured senior notes payable
|
17,407
|
|
16,239
|
|
1,168
|
|
||||||
|
Unsecured senior line of credit
|
3,424
|
|
1,581
|
|
1,843
|
|
||||||
|
Unsecured senior bank term loans
|
3,260
|
|
3,455
|
|
(195
|
)
|
||||||
|
Interest rate swaps
|
727
|
|
1,129
|
|
(402
|
)
|
||||||
|
Amortization of loan fees and other interest
|
3,318
|
|
3,144
|
|
174
|
|
||||||
|
Total interest incurred
|
36,115
|
|
32,680
|
|
3,435
|
|
||||||
|
Capitalized interest
|
(8,436
|
)
|
(12,125
|
)
|
3,689
|
|
||||||
|
Total interest expense
|
$
|
27,679
|
|
$
|
20,555
|
|
$
|
7,124
|
|
|||
Total interest expense increased by
$7.1 million
during the
three months ended September 30, 2015
, compared to the
three months ended September 30, 2014
, as a result of a
$3.4 million
increase in interest incurred and a
$3.7 million
decrease in the amount of interest capitalized as a result of our highly leased development and redevelopment projects placed into service subsequent to
July 1, 2014
, as noted above. The increase of
$3.4 million
in total interest incurred was primarily due to an approximate
$813.1 million
increase in outstanding debt used to partially fund our recent real estate acquisitions and the construction of our development and redevelopment projects since
September 30, 2014
.
Depreciation and amortization
Depreciation and amortization for the
three months ended September 30, 2015
, increased by
$9.6 million
, or
16.4%
, to
$68.0 million
, compared to
$58.4 million
for the
three months ended September 30, 2014
. Depreciation increased primarily due to additional depreciation from development and redevelopment projects placed into service subsequent to
July 1, 2014
, and one operating property acquired subsequent to
July 1, 2014
, as noted above.
Loss on early extinguishment of debt
During the
three months ended September 30, 2014
, we recognized a loss on early extinguishment of debt related to the write-off of a portion of unamortized loan fees totaling
$525 thousand
, upon our $125 million partial repayment of the outstanding principal balance of our 2021 Unsecured Senior Bank Term Loan.
77
Equity in earnings of unconsolidated joint ventures
Equity in earnings of unconsolidated joint ventures of
$710 thousand
for the
three months ended September 30, 2015
, primarily includes the operating results of our property at 360 Longwood Avenue in Greater Boston that was placed into service at various dates beginning in the three months ended December 31, 2014. As of
September 30, 2015
, we had
259,859
RSF, or
63%
of this property, in service at 100% occupancy, and
153,677
RSF, or
37%
of this project, under development.
78
Comparison of the
nine months ended September 30, 2015
, to the
nine months ended September 30, 2014
The following table presents a comparison of the components of NOI for our Same Properties and Non-Same Properties for the
nine months ended September 30, 2015
, compared to the
nine months ended September 30, 2014
, and a reconciliation of NOI to income from continuing operations, the most directly comparable financial measure (dollars in thousands):
|
|
Nine Months Ended September 30,
|
||||||||||||||
|
2015
|
2014
|
$ Change
|
% Change
|
||||||||||||
|
Revenues:
|
|||||||||||||||
|
Rental – Same Properties
|
$
|
369,994
|
|
$
|
369,100
|
|
$
|
894
|
|
0.2
|
%
|
||||
|
Rental – Non-Same Properties
|
80,730
|
|
34,180
|
|
46,550
|
|
136.2
|
|
|||||||
|
Total rental
|
450,724
|
|
403,280
|
|
47,444
|
|
11.8
|
|
|||||||
|
Tenant recoveries – Same Properties
|
133,114
|
|
121,860
|
|
11,254
|
|
9.2
|
|
|||||||
|
Tenant recoveries – Non-Same Properties
|
20,993
|
|
6,338
|
|
14,655
|
|
231.2
|
|
|||||||
|
Total tenant recoveries
|
154,107
|
|
128,198
|
|
25,909
|
|
20.2
|
|
|||||||
|
Other income – Same Properties
|
337
|
|
285
|
|
52
|
|
18.2
|
|
|||||||
|
Other income – Non-Same Properties
|
14,351
|
|
6,440
|
|
7,911
|
|
122.8
|
|
|||||||
|
Total other income
|
14,688
|
|
6,725
|
|
7,963
|
|
118.4
|
|
|||||||
|
Total revenues – Same Properties
|
503,445
|
|
491,245
|
|
12,200
|
|
2.5
|
|
|||||||
|
Total revenues – Non-Same Properties
|
116,074
|
|
46,958
|
|
69,116
|
|
147.2
|
|
|||||||
|
Total revenues
|
619,519
|
|
538,203
|
|
81,316
|
|
15.1
|
|
|||||||
|
Expenses:
|
|||||||||||||||
|
Rental operations – Same Properties
|
153,411
|
|
145,410
|
|
8,001
|
|
5.5
|
|
|||||||
|
Rental operations – Non-Same Properties
|
38,908
|
|
16,873
|
|
22,035
|
|
130.6
|
|
|||||||
|
Total rental operations
|
192,319
|
|
162,283
|
|
30,036
|
|
18.5
|
|
|||||||
|
Our share of NOI from unconsolidated joint ventures:
|
|||||||||||||||
|
Joint venture NOI – Same Properties
|
—
|
|
—
|
|
—
|
|
—
|
|
|||||||
|
Joint venture NOI – Non-Same Properties
|
3,188
|
|
—
|
|
3,188
|
|
100.0
|
|
|||||||
|
Our share of NOI from unconsolidated joint ventures
|
3,188
|
|
—
|
|
3,188
|
|
100.0
|
|
|||||||
|
NOI from continuing operations:
|
|||||||||||||||
|
NOI – Same Properties
|
350,034
|
|
345,835
|
|
4,199
|
|
1.2
|
|
|||||||
|
NOI – Non-Same Properties
|
80,354
|
|
30,085
|
|
50,269
|
|
167.1
|
|
|||||||
|
Total NOI from continuing operations
|
430,388
|
|
375,920
|
|
54,468
|
|
14.5
|
|
|||||||
|
Other expenses:
|
|||||||||||||||
|
General and administrative
|
44,519
|
|
39,669
|
|
4,850
|
|
12.2
|
|
|||||||
|
Interest
|
77,583
|
|
57,111
|
|
20,472
|
|
35.8
|
|
|||||||
|
Depreciation and amortization
|
189,044
|
|
166,123
|
|
22,921
|
|
13.8
|
|
|||||||
|
Impairment of real estate
|
14,510
|
|
—
|
|
14,510
|
|
100.0
|
|
|||||||
|
Loss on early extinguishment of debt
|
189
|
|
525
|
|
(336
|
)
|
(64.0
|
)
|
|||||||
|
325,845
|
|
263,428
|
|
62,417
|
|
23.7
|
|
||||||||
|
Less: our share of NOI from unconsolidated joint ventures
|
(3,188
|
)
|
—
|
|
(3,188
|
)
|
(100.0
|
)
|
|||||||
|
Equity in earnings of unconsolidated joint ventures
|
1,825
|
|
—
|
|
1,825
|
|
100.0
|
|
|||||||
|
Income from continuing operations
|
$
|
103,180
|
|
$
|
112,492
|
|
$
|
(9,312
|
)
|
(8.3
|
)%
|
||||
|
NOI – Same Properties
|
$
|
350,034
|
|
$
|
345,835
|
|
$
|
4,199
|
|
1.2
|
%
|
||||
|
Less: straight-line rent revenue
|
(8,834
|
)
|
(22,751
|
)
|
13,917
|
|
(61.2
|
)
|
|||||||
|
NOI (cash basis) – Same Properties
|
$
|
341,200
|
|
$
|
323,084
|
|
$
|
18,116
|
|
5.6
|
%
|
||||
79
Rental revenues
Total rental revenues for the
nine months ended September 30, 2015
, increased by
$47.4 million
, or
11.8%
, to
$450.7 million
, compared to
$403.3 million
for the
nine months ended September 30, 2014
. The increase was primarily due to rental revenues from our Non-Same Properties, including highly leased development and redevelopment projects aggregating
1,200,973
RSF that were placed into service subsequent to
January 1, 2014
, and operating properties aggregating
384,626
RSF that were acquired subsequent to
January 1, 2014
, and consisted of the following (in thousands):
|
Nine Months Ended September 30,
|
||||||||||||
|
2015
|
2014
|
Change
|
||||||||||
|
Development related
|
$
|
50,290
|
|
$
|
16,637
|
|
$
|
33,653
|
|
|||
|
Redevelopment related
|
7,164
|
|
253
|
|
6,911
|
|
||||||
|
Acquisitions related
|
13,886
|
|
3,748
|
|
10,138
|
|
||||||
|
“Held for sale”
|
10,569
|
|
12,714
|
|
(2,145
|
)
|
||||||
|
Other
|
(1,179
|
)
|
828
|
|
(2,007
|
)
|
||||||
|
Rental revenues – Non-Same Properties
|
80,730
|
|
34,180
|
|
46,550
|
|
||||||
|
Rental revenues – Same Properties
|
369,994
|
|
369,100
|
|
894
|
|
||||||
|
Total rental revenues
|
$
|
450,724
|
|
$
|
403,280
|
|
$
|
47,444
|
|
|||
In addition, rental revenues from our Same Properties were
$370.0 million
and
$369.1 million
for the
nine months ended September 30, 2015
and
2014
, respectively, primarily due to rental rate increases on renewed/re-leased space since
September 30, 2014
.
Tenant recoveries
Tenant recoveries for the
nine months ended September 30, 2015
, increased by
$25.9 million
, or
20.2%
, to
$154.1 million
, compared to
$128.2 million
for the
nine months ended September 30, 2014
. This increase is relatively consistent with the increase in our rental operating expenses of
$30.0 million
, or
18.5%
. Same Properties’ tenant recoveries increased by
$11.3 million
, or
9.2%
, primarily as a result of an increase in Same Properties’ rental operating expenses of
$8.0 million
, or
5.5%
, and an increase in one of our Top 20 client tenants converting from a gross lease to a triple net lease. Same Properties’ rental operating expenses increased during the
nine months ended September 30, 2015
, compared to the
nine months ended September 30, 2014
, primarily related to (i) higher utility costs, (ii) snow removal costs, and (iii) higher property taxes resulting from annual property tax reassessments. Utilities costs increased primarily due to higher utility rates for properties in the San Francisco, San Diego, and Greater Boston markets. Snow removal costs increased due to a more severe winter in 2015 compared to 2014. Non-Same Properties’ tenant recoveries increased by
$14.7 million
as a result of a Non-Same Properties’ rental operating expense increase of
$22.0 million
primarily related to development and redevelopment projects placed into service subsequent to
January 1, 2014
, and operating properties acquired subsequent to
January 1, 2014
, as noted above.
Other income
Other income for the
nine months ended September 30, 2015
and
2014
, consisted of the following (in thousands):
|
Nine Months Ended September 30,
|
||||||||||||
|
2015
|
2014
|
Change
|
||||||||||
|
Management fee income
|
$
|
1,341
|
|
$
|
2,202
|
|
$
|
(861
|
)
|
|||
|
Interest and other income
|
2,136
|
|
3,767
|
|
(1,631
|
)
|
||||||
|
Investment income
|
11,211
|
|
756
|
|
10,455
|
|
||||||
|
Total other income
|
$
|
14,688
|
|
$
|
6,725
|
|
$
|
7,963
|
|
|||
Total investment income for the
nine months ended September 30, 2015
,
increased
by
$10.5 million
to
$11.2 million
compared to
$756 thousand
for the
nine months ended September 30, 2014
. Investment income increased primarily due to gains from the sale of two publicly traded investments during the
nine months ended September 30, 2015
.
80
Rental operating expenses
Total rental operating expenses for the
nine months ended September 30, 2015
, increased by
$30.0 million
, or
18.5%
, to
$192.3 million
, compared to
$162.3 million
for the
nine months ended September 30, 2014
. Approximately
$22.0 million
of the increase was due to an increase in rental operating expenses from our Non-Same Properties, primarily related to development and redevelopment projects placed into service subsequent to
January 1, 2014
, and operating properties acquired subsequent to
January 1, 2014
, as mentioned above. The increase in Same Properties rental operating expenses of
$8.0 million
was primarily due to higher utility costs, higher snow removal costs, and higher property taxes, as described in “Tenant Recoveries” above.
General and administrative expenses
General and administrative expenses for the
nine months ended September 30, 2015
, increased by
$4.9 million
, or
12.2%
, to
$44.5 million
, compared to
$39.7 million
for the
nine months ended September 30, 2014
. General and administrative expenses increased primarily due the continued growth in both the depth and breadth of our operations in multiple markets. As a percentage of total assets, our general and administrative expenses were consistent at
0.7%
and
0.7%
for the 12 months ended
September 30, 2015
and
2014
, respectively.
Interest expense
Interest expense for the
nine months ended September 30, 2015
and 2014, consisted of the following (in thousands):
|
Nine Months Ended September 30,
|
||||||||||||
|
Component
|
2015
|
2014
|
Change
|
|||||||||
|
Secured notes payable
|
$
|
23,599
|
|
$
|
22,190
|
|
$
|
1,409
|
|
|||
|
Unsecured senior notes payable
|
52,218
|
|
38,720
|
|
13,498
|
|
||||||
|
Unsecured senior line of credit
|
8,148
|
|
6,318
|
|
1,830
|
|
||||||
|
Unsecured senior bank term loans
|
10,036
|
|
10,954
|
|
(918
|
)
|
||||||
|
Interest rate swaps
|
1,942
|
|
5,742
|
|
(3,800
|
)
|
||||||
|
Amortization of loan fees and other interest
|
9,484
|
|
8,627
|
|
857
|
|
||||||
|
Total interest incurred
|
105,427
|
|
92,551
|
|
12,876
|
|
||||||
|
Capitalized interest
|
(27,844
|
)
|
(35,440
|
)
|
7,596
|
|
||||||
|
Total interest expense
|
$
|
77,583
|
|
$
|
57,111
|
|
$
|
20,472
|
|
|||
Total interest expense increased by
$20.5 million
during the
nine months ended September 30, 2015
, compared to the
nine months ended September 30, 2014
, as a result of a
$12.9 million
increase in interest incurred and a
$7.6 million
decrease in the amount of interest capitalized as a result of our highly leased development and redevelopment projects placed into service subsequent to
January 1, 2014
, as noted above.
The increase of
$12.9 million
in total interest incurred was primarily due to an approximate
$813.1 million
increase in outstanding debt, including the offering of $700 million of unsecured senior notes payable in July 2014, used to partially fund our real estate acquisitions and the construction of our development and redevelopment projects since
September 30, 2014
. In July 2014, we completed an offering of $700 million of unsecured senior notes payable with a weighted-average interest rate of 3.50% and a maturity of 9.6 years. Proceeds from our July 2014 offering were used to repay $125 million under our unsecured senior bank term loans and to reduce amounts outstanding under our unsecured senior line of credit. Interest from our unsecured senior bank term loans and interest rate swaps decreased by an aggregate
$4.7 million
, as we continued to transition from variable-rate bank debt to long-term unsecured fixed-rate debt.
Depreciation and amortization
Depreciation and amortization for the
nine months ended September 30, 2015
, increased by
$22.9 million
, or
13.8%
, to
$189.0 million
, compared to
$166.1 million
for the
nine months ended September 30, 2014
. Depreciation increased primarily due to additional depreciation from development and redevelopment projects placed into service subsequent to
January 1, 2014
, and the one operating property acquired subsequent to
January 1, 2014
, as noted above.
81
Impairment of real estate
In March 2015, we determined that a
175,000
RSF life science building in Hyderabad, India, met the criteria for classification as “held for sale” and consequently recognized an impairment charge of
$14.5 million
to lower the carrying costs of the real estate to its estimated fair value less cost to sell, including an estimated
$4.2 million
foreign currency exchange translation loss. On March 26, 2015, we completed the sale of the vacant building for
$12.4 million
. For additional information, refer to the section titled “Sales of Real Estate Assets and Related Impairment Charges” in Note 3 – “Investments in Real Estate” to our accompanying unaudited consolidated financial statements under Item 1 of this report.
Loss on early extinguishment of debt
During the
nine months ended September 30, 2015
, we recognized a loss on early extinguishment of debt to expense a portion of unamortized loan fees aggregating
$189 thousand
upon our
$25.0 million
partial principal repayment under our Unsecured Senior Bank Term Loan.
During the
nine months ended September 30, 2014
, we recognized a loss on early extinguishment of debt related to the write-off of a portion of unamortized loan fees totaling
$525 thousand
, upon our $125 million partial repayment of the outstanding principal balance of our 2021 Unsecured Senior Bank Term Loan.
Equity in earnings of unconsolidated joint ventures
Equity in earnings of unconsolidated joint ventures of
$1.8 million
for the
nine months ended September 30, 2015
, primarily includes the operating results of our property at 360 Longwood Avenue in Greater Boston that was placed into service at various dates beginning in the three months ended December 31, 2014. As of
September 30, 2015
, we had
259,859
RSF, or
63%
of this property, in service at 100% occupancy and
153,677
RSF, or
37%
of this project, under development.
Gain on sales of real estate
–
land parcels
During the
nine months ended September 30, 2014
, we completed the sale of
four
land parcels, aggregating
412,950
RSF for an aggregate sales price of
$29.4 million
, and recognized an aggregate gain on sales of
$805 thousand
. These gains are classified in gain on sales of real estate – land parcel below income from discontinued operations in the accompanying consolidated statements of income.
The land parcels sold did not meet the criteria for classification as discontinued operations since the parcels did not have any significant operations prior to disposition. Pursuant to the presentation and disclosure literature on gains/losses on sales or disposals by REITs required by the SEC, gains or losses on sales or disposals by a REIT that do not qualify as discontinued operations are classified below income from discontinued operations in the income statement. Accordingly, we classified the gain on sales of real estate-land parcel below income from discontinued operations, in the consolidated statements of income, and included the gain in income from continuing operations attributable to Alexandria’s common stockholders in the “control number,” or numerator for the computation of EPS.
82
Projected results
Based on our current view of existing market conditions and certain current assumptions, we have updated guidance for EPS attributable to Alexandria’s common stockholders – diluted and FFO per share attributable to Alexandria’s common stockholders – diluted, each for the year ending
December 31, 2015
, as set forth in the table below. The table below provides a reconciliation of FFO per share attributable to Alexandria’s common stockholders – diluted, a non-GAAP measure, to EPS, the most directly comparable GAAP measure, and other key assumptions included in our guidance for the year ending
December 31, 2015
.
|
Summary of Key
Changes in Guidance
|
Description
|
|||||
|
FFO per share – diluted
|
+ $0.01
|
|
Ÿ
|
Midpoint of range increased by $0.01 to $5.25 and narrowed range from six cents to two cents. Projected FFO per share up $0.05 over initial 2015 guidance, representing aggregate growth of 9.4% over 2014 FFO per share.
|
||
|
(in thousands)
|
||||||
|
Sources of capital:
|
Midpoint
|
|||||
|
Incremental debt
|
$
|
(36,000
|
)
|
|||
|
Remainder/asset sales
|
(70,000
|
)
|
Ÿ
|
Reduction in projected asset sales resulting from reduction in 2015 projected construction spending, described below.
|
||
|
Net decrease in sources of capital
|
$
|
(106,000
|
)
|
|||
|
Uses of capital:
|
||||||
|
Construction
|
$
|
(90,000
|
)
|
Ÿ
|
Reduction in projected construction spending for 2015 since initial guidance in December 2014 primarily due to conservative forecasting on the timing of lease-up and commencement of construction related to over 2.3 million RSF of development and redevelopment projects.
|
|
|
Other
|
(16,000
|
)
|
||||
|
Decrease in uses of capital
|
$
|
(106,000
|
)
|
|||
|
EPS and FFO Per Share Attributable to Alexandria’s Common Stockholders – Diluted
|
||
|
Earnings per share
|
$1.46 to $1.48
|
|
|
Add: depreciation and amortization
|
3.68
|
|
|
Add: impairment of real estate
|
0.20
|
|
|
Other
|
(0.02)
|
|
|
FFO per share
|
$5.32 to $5.34
|
|
|
Less: investment income for the three months ended September 30, 2015
(1)
|
(0.08)
|
|
|
FFO per share, as adjusted
|
$5.24 to $5.26
|
|
|
(1)
|
Investment income for the three months ended
September 30, 2015
, of
$5.4 million
, or
$0.08
per share, included gross investment gains of
$8.7 million
, primarily from the sale of two publicly traded securities.
|
|
(2)
|
2015 guidance range reflects a reduction in incremental debt from asset sales.
|
|
2015 Guidance
|
||||||||
|
Key Assumptions
(Dollars in thousands)
|
Low
|
High
|
||||||
|
Occupancy percentage for operating properties in North America as of December 31, 2015
|
96.9%
|
|
97.4%
|
|
||||
|
Same Property performance:
|
||||||||
|
NOI increase
|
0.5%
|
|
2.5%
|
|
||||
|
NOI increase (cash basis)
|
5.0%
|
|
7.0%
|
|
||||
|
Lease renewals and re-leasing of space:
|
||||||||
|
Rental rate increases
|
14.0%
|
|
17.0%
|
|
||||
|
Rental rate increases (cash basis)
|
8.0%
|
|
10.0%
|
|
||||
|
Straight-line rent revenue
|
$
|
47,000
|
|
$
|
52,000
|
|
||
|
General and administrative expenses
|
$
|
55,000
|
|
$
|
59,000
|
|
||
|
Capitalization of interest
|
$
|
35,000
|
|
$
|
45,000
|
|
||
|
Interest expense
|
$
|
106,000
|
|
$
|
116,000
|
|
||
83
|
Actual
|
Guidance
|
|||
|
Key Credit Metrics
|
3Q15
|
2015
|
||
|
Net debt to Adjusted EBITDA – fourth quarter annualized
|
7.4x
|
less than 7.0x
|
||
|
Fixed-charge coverage ratio – fourth quarter annualized
|
3.5x
|
3.0x to 3.5x
|
||
|
Value-creation pipeline as a percentage of gross investments in real estate as of December 31
|
13%
|
12% to 15%
|
||
|
Net Debt to Adjusted EBITDA
(1)
|
Unencumbered NOI
(2)
|
|

|
||
|
79%
|
||
|
Fixed-Charge Coverage Ratio
(1)
|
Liquidity
(In millions)
|
|
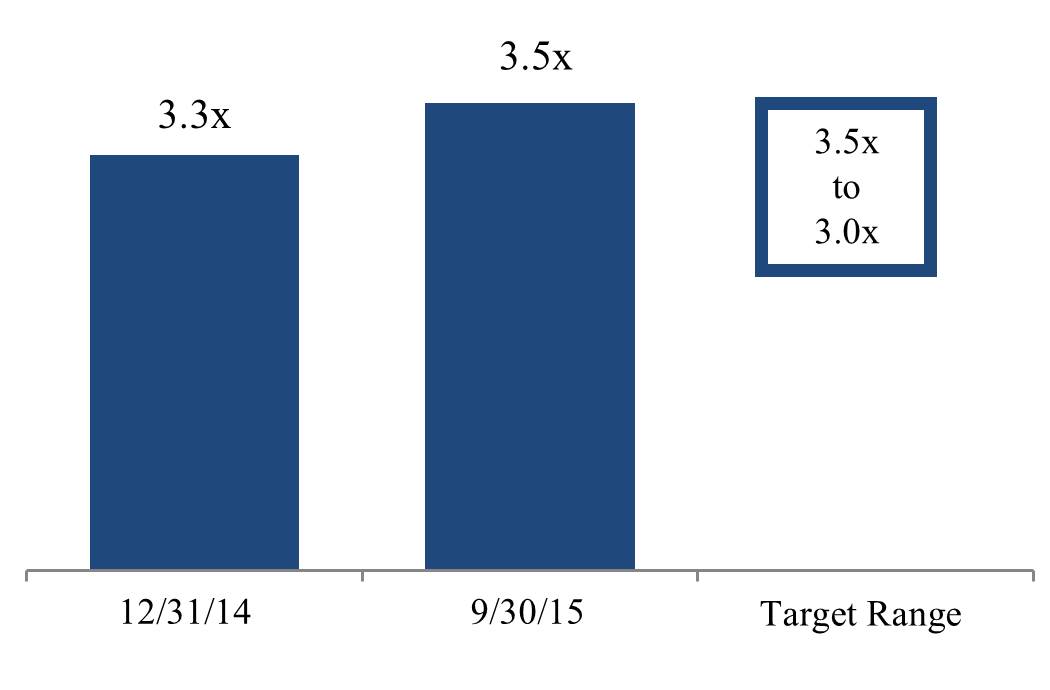
|

|
|
|
(1)
|
Quarter annualized.
|
|
(2)
|
For the
three months ended September 30, 2015
.
|
|
(3)
|
Represents pro forma liquidity as of
September 30, 2015
, aggregating $1.2 billion, including a secured construction loan with aggregate commitments available for borrowing of
$350.0 million
that we closed in October 2015.
|
|
(4)
|
Total liquidity as of
September 30, 2015
, aggregating $855 million consisted of $76 million of cash and cash equivalents, $122 million of remaining construction loan commitments and $657 million available under our $1.5 billion Unsecured Senior Line of Credit.
|
|
(5)
|
See page
87
for assumptions on remainder asset sales and issuance of unsecured senior and other notes payable, which includes the secured construction loan in footnote (3) above.
|
84
As of September 30, 2015
, we had construction in progress related to our
ten
development projects in North America. The completion of these projects, along with projects recently placed into service, certain future projects, and operations from Same Properties, is expected to contribute significant increases in rental income, NOI, and cash flows. Operating performance assumptions related to the completion of our development projects in North America, including the timing of initial occupancy, stabilization dates, and initial stabilized yield, are included in the “Value-Creation Projects and External Growth” section in Item 2 of this report. Certain key assumptions regarding our projections, including the impact of various development and redevelopment projects, are included in the “Projected Construction Spending” table in the “Summary of Capital Expenditures” subsection of the “Value-Creation Projects and External Growth” section in Item 2 of this report.
The completion of our development and redevelopment projects will result in an increase in interest expense and other project costs, because these project costs will no longer qualify for capitalization and will therefore be expensed as incurred. Our projection assumptions for occupancy, Same Properties performance, rental rate increases, straight-line rent revenue, general and administrative expenses, capitalization of interest, interest expense, and key credit metrics are included in the tables and charts above and are subject to a number of variables and uncertainties, including those discussed under the “Forward-Looking Statements” section of Part I, the “Risk Factors” section of Item 1A, and the “Management’s Discussion and Analysis of Financial Condition and Results of Operations” section under Item 7 of our annual report on Form 10-K for the year ended
December 31, 2014
. To the extent our full-year earnings guidance is updated during the year, we will provide additional disclosure supporting reasons for any significant changes to such guidance.
Liquidity and capital resources
Overview
We expect to meet certain long-term liquidity requirements, such as requirements for development, redevelopment, other construction projects, capital improvements, tenant improvements, property acquisitions, leasing costs, non-revenue-enhancing capital expenditures, and scheduled debt maturities, through net cash provided by operating activities, periodic asset sales, strategic joint venture capital, and long-term secured and unsecured indebtedness, including borrowings under our unsecured senior line of credit, unsecured senior bank term loans, and the issuance of additional debt and/or equity securities.
We expect to continue meeting our short-term liquidity and capital requirements, as further detailed in this section, generally through our working capital and net cash provided by operating activities. We believe that the net cash provided by operating activities will continue to be sufficient to enable us to make the distributions necessary to continue qualifying as a REIT.
Over the next several years, our balance sheet, capital structure, and liquidity objectives are as follows:
|
•
|
Retain positive cash flows from operating activities after payment of dividends for reinvestment in acquisitions and/or development and redevelopment projects;
|
|
•
|
Maintain adequate liquidity from net cash provided by operating activities, cash and cash equivalents, and available borrowing capacity under our unsecured senior line of credit and available commitments under our secured construction loans;
|
|
•
|
Reduce the amount of our unsecured bank debt;
|
|
•
|
Maintain diverse sources of capital, including sources from net cash provided by operating activities, unsecured debt, secured debt, selective asset sales, joint venture capital, preferred stock, and common stock;
|
|
•
|
Manage the amount of debt maturing in a single year;
|
|
•
|
Mitigate unhedged variable-rate debt through the reduction of short-term and medium-term variable-rate bank debt;
|
|
•
|
Maintain a large unencumbered asset pool to provide financial flexibility;
|
|
•
|
Fund preferred stock and common stock dividends from net cash provided by operating activities;
|
|
•
|
Manage a disciplined level of value-creation projects as a percentage of our gross investments in real estate;
|
|
•
|
Maintain high levels of pre-leasing in value-creation projects; and
|
|
•
|
Maintain solid key credit metrics, including net debt to Adjusted EBITDA and fixed-charge coverage ratio, with some variation from quarter to quarter and from year to year.
|
85
Unsecured senior line of credit and unsecured senior bank term loans
The table below reflects the outstanding balances, maturity dates, applicable rates, and facility fees for each of these facilities.
|
As of September 30, 2015
|
||||||||||
|
Facility
|
Balance
|
Maturity Date
(1)
|
Applicable Margin
|
Facility Fee
|
||||||
|
$1.5 billion unsecured senior line of credit
|
$
|
843
|
million
|
January 2019
|
L+1.10%
|
0.20%
|
||||
|
2019 Unsecured Senior Bank Term Loan
|
$
|
600
|
million
|
January 2019
|
L+1.20%
|
N/A
|
||||
|
2021 Unsecured Senior Bank Term Loan
|
$
|
350
|
million
|
January 2021
|
L+1.10%
|
N/A
|
||||
|
(1)
|
Includes any extension options that we control.
|
The maturity date of the unsecured senior line of credit is January 2019, assuming we exercise our sole right to extend the stated maturity date, twice, by an additional six months after each exercise. Borrowings under the unsecured senior line of credit bear interest at LIBOR or the base rate specified in the amended unsecured senior line of credit agreement, plus, in either case, a specified margin (“Applicable Margin”). The Applicable Margin for LIBOR borrowings under the unsecured senior line of credit is based on our existing credit rating as set by certain rating agencies. Our unsecured senior line of credit contains a feature that allows lenders to competitively bid on the interest rate for borrowings under the facility. This may result in an interest rate that is below the Applicable Margin of LIBOR+1.10%. In addition to the Applicable Margin, our unsecured senior line of credit is subject to an annual facility fee of 0.20% based upon aggregate outstanding commitments.
The requirements of, and our actual performance with respect to, the key financial covenants under our unsecured senior line of credit and unsecured senior bank term loans as of
September 30, 2015
, were as follows:
|
Covenant Ratios
(1)
|
Requirement
|
Actual
(2)
|
||
|
Leverage Ratio
|
Less than or equal to 60.0%
|
39.5%
|
||
|
Secured Debt Ratio
|
Less than or equal to 45.0%
|
7.0%
|
||
|
Fixed-Charge Coverage Ratio
|
Greater than or equal to 1.50x
|
3.21x
|
||
|
Unsecured Leverage Ratio
|
Less than or equal to 60.0%
|
45.4%
|
||
|
Unsecured Interest Coverage Ratio
|
Greater than or equal to 1.50x
|
6.56x
|
||
|
(1)
|
For definitions of the ratios, refer to the amended unsecured senior line of credit and unsecured senior bank term loan agreements, including (i) the agreement dated as of August 30, 2013, which was filed as an exhibit to our quarterly report on Form 10-Q filed with the SEC on November 7, 2013, and (ii) the agreement dated June 30, 2015, which was filed as an exhibit to our quarterly report on Form 10-Q filed with the SEC on July 29, 2015.
|
|
(2)
|
Actual covenants are calculated pursuant to the specific terms of our unsecured senior line of credit and unsecured senior bank term loan agreements.
|
Unsecured senior notes payable
The requirements of, and our actual performance with respect to, the key financial covenants under our 2.75% unsecured senior notes (“2.75% Unsecured Senior Notes”), 3.90% unsecured senior notes (“3.90% Unsecured Senior Notes”), 4.60% unsecured senior notes (“4.60% Unsecured Senior Notes”), and 4.50% unsecured senior notes (“4.50% Unsecured Senior Notes”) as of
September 30, 2015
, were as follows:
|
Covenant Ratios
(1)
|
Requirement
|
Actual
|
||
|
Total Debt to Total Assets
|
Less than or equal to 60%
|
44%
|
||
|
Secured Debt to Total Assets
|
Less than or equal to 40%
|
8%
|
||
|
Consolidated EBITDA to Interest Expense
|
Greater than or equal to 1.5x
|
5.6x
|
||
|
Unencumbered Total Asset Value to Unsecured Debt
|
Greater than or equal to 150%
|
219%
|
||
|
(1)
|
For definitions of the ratios, refer to the indenture at Exhibit 4.3 and related supplemental indentures at Exhibits 4.4, 4.7, 4.9, and 4.11, which are each listed in Item 6 of this report.
|
In addition, the terms of the indentures, among other things, limit the ability of the Company, Alexandria Real Estate Equities, L.P., and the Company’s subsidiaries to (i) consummate a merger, or consolidate or sell all or substantially all of the Company’s assets, and (ii) incur certain secured or unsecured indebtedness.
86
Sources and uses of capital
We expect that our principal liquidity needs for the year ending
December 31, 2015
, will be satisfied by the following multiple sources of capital, as shown in the table below. There can be no assurance that our sources and uses of capital will not be materially higher or lower than these expectations (in thousands).
|
Key Sources and Uses of Capital
|
Completed During the Nine Months Ended September 30, 2015
|
2015 Guidance
|
||||||||||
|
Low
|
High
|
|||||||||||
|
Sources of capital:
|
||||||||||||
|
Net cash provided by operating activities after dividends
|
$
|
95,000
|
|
$
|
115,000
|
|
$
|
135,000
|
|
|||
|
Incremental debt
(1)
|
553,000
|
|
154,000
|
|
84,000
|
|
||||||
|
Remainder/asset sales
(2)
|
94,000
|
|
650,000
|
|
750,000
|
|
||||||
|
Total sources of capital
|
$
|
742,000
|
|
$
|
919,000
|
|
$
|
969,000
|
|
|||
|
Uses of capital:
|
||||||||||||
|
Construction
|
$
|
358,000
|
|
$
|
535,000
|
|
$
|
585,000
|
|
|||
|
Acquisitions
|
384,000
|
|
384,000
|
|
384,000
|
|
||||||
|
Total uses of capital
|
$
|
742,000
|
|
$
|
919,000
|
|
$
|
969,000
|
|
|||
|
Incremental debt:
|
||||||||||||
|
Issuance of unsecured senior and other notes payable
|
$
|
82,000
|
|
$
|
370,000
|
|
$
|
450,000
|
|
|||
|
Borrowings under existing secured construction loans
|
47,000
|
|
80,000
|
|
130,000
|
|
||||||
|
Repayments of secured notes payable
|
(12,000
|
)
|
(61,000
|
)
|
(137,000
|
)
|
||||||
|
Activity on unsecured senior line of credit/other
|
436,000
|
|
(235,000
|
)
|
(359,000
|
)
|
||||||
|
Incremental debt
|
$
|
553,000
|
|
$
|
154,000
|
|
$
|
84,000
|
|
|||
|
(1)
|
2015 guidance range reflects a reduction in incremental debt from asset sales.
|
|
(2)
|
Refer to page
68
for discussion on dispositions and other sources of capital.
|
The key assumptions behind the sources and uses of capital in the table above are a favorable capital market environment, performance of our core operating properties, lease-up and completion of development and redevelopment projects under construction and future development and redevelopment projects, and leasing activity. Our expected sources and uses of capital are subject to a number of variables and uncertainties, including those discussed under the “Forward-Looking Statements” section of Part I, the “Risk Factors” section of Item 1A, and the “Management’s Discussion and Analysis of Financial Condition and Results of Operations” section under Item 7 of our annual report on Form 10-K for the year ended
December 31, 2014
. We expect to update our forecast of sources and uses of capital on a quarterly basis.
Sources of capital
Net cash provided by operating activities after dividends
We expect to retain
$115.0 million
to
$135.0 million
of net cash flows from operating activities after payment of common stock and preferred stock dividends. For the year ending
December 31, 2015
, we expect that our highly leased value-creation projects, along with projects recently placed into service, certain future projects, and operations from Same Properties, will contribute significant increases compared to the
year ended December 31, 2014
, in rental income, NOI, and cash flows. Refer to “Cash Flows” appearing elsewhere in this section of this quarterly report on Form 10-Q for a discussion of net cash provided by operating activities for the
nine months ended September 30, 2015
.
Asset sales
We expect to continue to sell land, non-core operating assets, high-value “core-like” operating properties, and joint venture interests in high-value core operating properties located in high-barrier-to-entry submarkets. The amount of asset sales necessary to meet our forecasted sources of capital will vary depending upon the amount of EBITDA associated with the assets sold.
87
For additional information, refer to the section titled “Sales of Real Estate Assets and Related Impairment Charges” in Note 3 – “Investments in Real Estate” to our unaudited consolidated financial statements under Item 1 of this report and the “Dispositions and Other Sources of Capital” subsection of the “Value-Creation Projects and External Growth” section in Item 2 of this report. The sale of partial interests in core real estate assets, non-strategic assets in our value-creation pipeline, and non-core/“core-like” operating asset provides a significant source of capital to fund our highly pre-leased value-creation development and redevelopment projects described above.
Liquidity
The following table presents the availability under our unsecured senior line of credit, secured construction loans, and cash and cash equivalents as of
September 30, 2015
(dollars in thousands):
|
Description
|
Stated
Rate
|
Total
Commitments
|
Outstanding
Balance
|
Remaining Commitments
|
||||||||||
|
$1.5 billion unsecured senior line of credit
|
LIBOR+1.10%
|
$
|
1,500,000
|
|
$
|
843,000
|
|
$
|
657,000
|
|
||||
|
Secured construction loan
|
LIBOR+1.40%
|
36,000
|
|
20,714
|
|
15,286
|
|
|||||||
|
Secured construction loan
|
LIBOR+1.50%
|
55,000
|
|
47,385
|
|
7,615
|
|
|||||||
|
Secured construction loan
|
LIBOR+1.35%
|
250,400
|
|
151,504
|
|
98,896
|
|
|||||||
|
$
|
1,841,400
|
|
$
|
1,062,603
|
|
778,797
|
|
|||||||
|
Cash and cash equivalents
|
76,383
|
|
||||||||||||
|
Total liquidity as of September 30, 2015
|
$
|
855,180
|
|
|||||||||||
|
Commitments subsequent to September 30, 2015
(1)
|
LIBOR+1.50%
|
$
|
350,000
|
|
|
$
|
—
|
|
|
$
|
350,000
|
|
||
|
$
|
1,205,180
|
|
||||||||||||
|
Target liquidity by December 31, 2015
|
$
|
1,800,000
|
|
|||||||||||
|
(1)
|
In October 2015, closed a secured construction loan with aggregate commitments available for borrowing aggregating
$350.0 million
, for our
98%
leased development project at 50/60 Binney Street in our Cambridge submarket, which bears interest at a rate of LIBOR+150 bps
|
Refer to Note 6 – “Secured and Unsecured Senior Debt” to our unaudited consolidated financial statements under Item 1 of this report for a discussion of our secured construction loans.
We use our unsecured senior line of credit to fund working capital, construction activities, and, from time to time, acquisition of properties. Borrowings under the unsecured senior line of credit will bear interest at a “Eurocurrency Rate” or a “Base Rate” specified in the amended unsecured line of credit agreement, plus, in either case, the Applicable Margin. The “Eurocurrency Rate” specified in the amended unsecured line of credit agreement is, as applicable, the rate per annum equal to (i) the LIBOR or a successor rate thereto as approved by the administrative agent for loans denominated in a LIBOR quoted currency (i.e., U.S. dollars, euro, sterling, or yen), (ii) the average annual yield rates applicable to Canadian dollar bankers’ acceptances for loans denominated in Canadian dollars, (iii) the Bank Bill Swap Reference Bid rate for loans denominated in Australian dollars, or (iv) the rate designated with respect to the applicable alternative currency for loans denominated in a non-LIBOR quoted currency (other than Canadian or Australian dollars). The Base Rate means, for any day, a fluctuating rate per annum equal to the highest of (i) the federal funds rate plus 1/2 of 1.00%, (ii) the rate of interest in effect for such day as publicly announced from time to time by Bank of America as its “prime rate,” and (iii) the Eurocurrency Rate plus 1.00%. Our unsecured senior line of credit contains a feature that allows lenders to competitively bid on the interest rate for borrowings under the facility. This may result in an interest rate that is below the applicable margin of LIBOR+
1.10%
. In addition to the cost of borrowing, the facility is subject to an annual facility fee of
0.20%
based on the aggregate commitments outstanding.
Debt
We expect to fund a significant portion of our capital needs in 2015 from the issuance of unsecured senior notes payable, borrowings available under existing secured construction loans, an unsecured senior line of credit, new secured construction loans, and acquired secured notes payable.
88
In October 2015, we completed the repayment of a
$76 million
secured note payable. The note had a weighted-average interest rates of
5.73%
and was scheduled to mature in January 2016.
In June 2015, we completed a partial principal repayment of
$25 million
and extended the maturity of the remaining $350 million 2021 Unsecured Senior Bank Term Loan from July 31, 2015, to June 30, 2019, subject to our option to extend the maturity up to three times upon the satisfaction of certain conditions, for an additional term of six months for the first and second extensions and for an additional term ending on January 15, 2021, for the third extension. In addition, we reduced the applicable margin with respect to borrowings outstanding under the loan to LIBOR+1.10% from LIBOR+1.20%. In conjunction with the amendment of our 2021 Unsecured Senior Bank Term Loan and the principal repayment, we recognized a loss on early extinguishment of debt aggregating
$189 thousand
related to the write-off of a portion of unamortized loan fees.
In July 2014, we completed public offerings of $400 million in aggregate principal amount and $300 million in aggregate principal amount of unsecured senior notes payable at stated interest rates of 2.75% and 4.50%, respectively, at a weighted-average interest rate of 3.50% and a weighted-average maturity of 9.6 years. The 2.75% Unsecured Senior Notes were priced at 99.793% of the principal amount with a yield to maturity of 2.791% and are due January 15, 2020. The 4.50% Unsecured Senior Notes were priced at 99.912% of the principal amount with a yield to maturity of 4.508% and are due July 30, 2029. All of these notes are unsecured obligations of the Company and are fully and unconditionally guaranteed by Alexandria Real Estate Equities, L.P., a 100% owned subsidiary of the Company. These notes rank equally in right of payment with all other senior unsecured indebtedness. However, these notes are subordinated to existing and future mortgages and other secured indebtedness (to the extent of the value of the collateral securing such indebtedness) and to all existing and future preferred equity and liabilities, whether secured or unsecured, of the Company’s subsidiaries, other than Alexandria Real Estate Equities, L.P. Net proceeds of $694 million from the offering were used to reduce variable-rate debt, consisting of the partial repayment of $125 million of our unsecured senior bank term loan and the reduction of $569 million of borrowings that were outstanding on our unsecured senior line of credit. In connection with the partial repayment of $125 million of our unsecured senior bank term loan, we recognized a loss on the early extinguishment of debt related to the write-off of a portion of unamortized loan fees aggregating $525 thousand.
Cash and cash equivalents
As of
September 30, 2015
, and
December 31, 2014
, we had
$76.4 million
and
$86.0 million
, respectively, of cash and cash equivalents. We expect existing cash and cash equivalents, cash flows from operating activities, proceeds from asset sales, borrowings under our unsecured senior line of credit, secured construction loan borrowings, issuances of unsecured notes payable, and issuances of common stock to continue to be sufficient to fund our operating activities and cash commitments for investing and financing activities, such as regular quarterly dividends, scheduled debt repayments, and certain capital expenditures, including expenditures
related to construction activities.
Restricted cash
Restricted cash consisted of the following as of
September 30, 2015
, and
December 31, 2014
(in thousands):
|
|
September 30, 2015
|
December 31, 2014
|
|||||
|
Funds held in trust under the terms of certain secured notes payable
|
$
|
24,485
|
|
$
|
19,350
|
|
|
|
Funds held in escrow related to construction projects and investing activities
|
9,540
|
|
4,539
|
|
|||
|
Other restricted funds
|
2,968
|
|
2,995
|
|
|||
|
Total
|
$
|
36,993
|
|
$
|
26,884
|
|
|
Other sources
We may issue and publicly offer common stock, preferred stock, debt, and other securities from time to time at our discretion, based on our needs and market conditions, including, as necessary, to balance our use of incremental debt capital.
We hold interests, together with certain third parties, in companies that we consolidate in our financial statements. These third parties may contribute equity into these entities primarily related to their share of funds for construction-related and financing-related activities.
89
We also hold interests, together with certain third parties, in joint ventures that are not consolidated in our financial statements. The following table presents information related to debt held by one of our unconsolidated joint ventures (dollars in thousands):
|
Loan Collateral
|
Total Commitments
|
Total Outstanding
|
Partners’ Share
|
ARE’s
27.5% Share
|
Maturity Date
|
Interest Rate
|
||||||||||||||||||||
|
360 Longwood Avenue
|
$
|
213,200
|
|
$
|
175,326
|
|
$
|
127,111
|
|
$
|
48,215
|
4/1/17
|
(1)
|
5.25
|
%
|
(2)
|
||||||||||
|
(1)
|
We have two, one-year options to extend the stated maturity date to April 1, 2019, subject to certain conditions.
|
|
(2)
|
Secured construction loan bears interest at LIBOR+3.75%, with a floor of 5.25%.
|
Uses of capital
Summary of capital expenditures
Our primary use of capital relates to the development, redevelopment, predevelopment, and construction of properties. In North America, we currently have development projects under construction aggregating
3.3 million
RSF, with
2.6 million
RSF of office/laboratory and tech office space,
includin
g two
unconsolidated joint venture develo
pment projects. We incur capitalized construction costs related to development, redevelopment, predevelopment, and other construction activities. We also incur additional capitalized project costs, including interest, property taxes, insurance, and other costs directly related and essential to the development or construction of a project. Refer to “Summary of Capital Expenditures” in Item 2 of this report for more information on our capital expenditures.
We capitalize interest cost as a cost of the project only during the period for which activities necessary to prepare an asset for its intended use are ongoing, provided that expenditures for the asset have been made and interest cost has been incurred. Capitalized interest for the
nine months ended September 30, 2015
and
2014
, of
$27.8 million
and
$35.4 million
, respectively, is classified in investments in real estate. Indirect project costs, including construction administration, legal fees, and office costs that clearly relate to projects under development or construction, are capitalized as incurred during the period an asset is undergoing activities to prepare it for its intended use. We capitalized payroll and other indirect project costs related to development, redevelopment, and construction projects, aggregating
$9.8 million
and
$12.7 million
for the
nine months ended September 30, 2015
and
2014
, respectively. Additionally, should we cease activities necessary to prepare an asset for its intended use, the interest, taxes, insurance, and certain other direct project costs related to this asset would be expensed as incurred. When construction activities cease, the asset is classified as rental property. Also, if vertical aboveground construction is not initiated at completion of predevelopment activities, the land parcel is classified as land held for future development. Expenditures for repairs and maintenance are expensed as incurred.
Fluctuations in our development, redevelopment, predevelopment, and construction activities could result in significant changes to total expenses and net income. For example, had we experienced a 10% reduction in development, redevelopment, and construction activities without a corresponding decrease in indirect project costs, including interest and payroll, total expenses would have increased by approximately
$4.7 million
for the
nine months ended September 30, 2015
.
We also capitalize and defer initial direct costs to originate leases with independent third parties related to evaluating a prospective lessee’s financial condition, negotiating lease terms, preparing the lease agreement, and closing the lease transaction. Costs that we capitalized and deferred relate to successful leasing transactions, result directly from and are essential to the lease transaction, and would not have been incurred had that lease transaction not occurred. The initial direct costs capitalized and deferred also include the portion of our employees’ total compensation and payroll-related benefits directly related to time spent performing activities previously described and related to the respective lease that would not have been performed but for that lease. Total initial direct leasing costs capitalized during the
nine months ended September 30, 2015
and
2014
, were
$50.5 million
and
$27.9 million
, respectively, of which
$9.7 million
and
$8.5 million
, respectively, represented capitalized and deferred payroll costs directly related and essential to our leasing activities during such periods. The increase in direct leasing costs in 2015 was driven by the highest leasing volume for a nine month period in Alexandria’s history, totaling approximately
4.0 million
RSF.
Acquisitions
Refer to “External Growth – Acquisitions” in Item 2 of this report.
90
Contractual obligations and commitments
Contractual obligations as of
September 30, 2015
, consisted of the following (in thousands):
|
Payments by Period
|
|||||||||||||||||||
|
Total
|
2015
|
2016-2017
|
2018-2019
|
Thereafter
|
|||||||||||||||
|
Secured and unsecured debt
(1) (2)
|
$
|
4,312,098
|
|
$
|
2,181
|
|
$
|
540,695
|
|
$
|
1,453,064
|
|
$
|
2,316,158
|
|
||||
|
Estimated interest payments on fixed-rate and hedged variable-rate debt
(3)
|
658,614
|
|
28,253
|
|
193,802
|
|
166,409
|
|
270,150
|
|
|||||||||
|
Estimated interest payments on variable-rate debt
(4)
|
38,124
|
|
1,279
|
|
15,547
|
|
16,770
|
|
4,528
|
|
|||||||||
|
Ground lease obligations
|
680,176
|
|
2,516
|
|
25,002
|
|
23,869
|
|
628,789
|
|
|||||||||
|
Other obligations
|
7,417
|
|
383
|
|
3,176
|
|
3,336
|
|
522
|
|
|||||||||
|
Total
|
$
|
5,696,429
|
|
$
|
34,612
|
|
$
|
778,222
|
|
$
|
1,663,448
|
|
$
|
3,220,147
|
|
||||
|
(1)
|
Amounts represent principal amounts due and exclude unamortized premiums/discounts reflected on the consolidated balance sheets.
|
|
(2)
|
Payment dates include any extension options that we control.
|
|
(3)
|
Estimated interest payments on our fixed-rate and hedged variable-rate debt are based upon contractual interest rates, including the impact of interest rate swap agreements, interest payment dates, and scheduled maturity dates.
|
|
(4)
|
The interest payments on variable-rate debt are based on the interest rates in effect as of
September 30, 2015
.
|
Secured notes payable
Secured notes payable
as of September 30, 2015
, consisted of
13
notes secured by
33
properties. Our secured notes payable typically require monthly payments of principal and interest and had a weighted-average interest rate of approximately
4.23%
as of September 30, 2015
.
As of September 30, 2015
, the total book values of rental properties, land held for future development, and CIP securing debt were approximately
$1.4 billion
.
As of September 30, 2015
, our secured notes payable, including unamortized discounts, were composed of approximately
$478.0 million
and
$295.6 million
of fixed- and variable-rate debt, respectively.
Estimated interest payments
Estimated interest payments on our fixed-rate debt and hedged variable-rate debt were calculated based upon contractual interest rates, including the impact of interest rate swap agreements, interest payment dates, and scheduled maturity dates. As of
September 30, 2015
, approximately
76%
of our debt was fixed-rate debt or variable-rate debt subject to interest rate swap agreements. Refer to Note 7 – “Interest Rate Swap Agreements” to our unaudited consolidated financial statements appearing under Item 1 of this report for further information. The remaining
24%
of our debt
as of September 30, 2015
, was unhedged variable-rate debt based primarily on LIBOR. Interest payments on our unhedged variable-rate debt have been calculated based on interest rates in effect as of
September 30, 2015
. Refer to additional information regarding our debt under Note 6 – “Secured and Unsecured Senior Debt” to our unaudited consolidated financial statements appearing under Item 1 of this report.
Interest rate swap agreements
We utilize interest rate swap agreements to hedge a portion of our exposure to variable interest rates primarily associated with our unsecured senior line of credit, unsecured senior bank term loans, and variable-rate construction loans. These agreements involve the receipt of variable-rate amounts from a counterparty in exchange for our payment of fixed-rate amounts to the counterparty over the life of the agreement without the exchange of the underlying notional amount. Interest received under all our interest rate swap agreements is based on the one-month LIBOR. The net difference between the interest paid and the interest received is reflected as an adjustment to interest expense in our consolidated statements of income.
91
We have entered into master derivative agreements with each counterparty. These master derivative agreements (all of which are adapted from the standard International Swaps and Derivatives Association, Inc. form) define certain terms between us and each of our counterparties to address and minimize certain risks associated with our interest rate swap agreements. In order to limit our risk of non-performance by an individual counterparty under our interest rate swap agreements, these agreements are spread among various counterparties. As of
September 30, 2015
, the largest aggregate notional amount in effect at any single point in time with an individual counterparty under our interest rate swap agreements was
$250 million
. If one or more of our counterparties fail to perform under our interest rate swap agreements, we may incur higher costs associated with our variable-rate LIBOR-based debt than the interest costs we originally anticipated. We have not posted any collateral related to our interest rate swap agreements.
Ground lease obligations
Ground lease obligations as of
September 30, 2015
, included leases for
28
of our properties, which accounted for approximately
14%
of our total number of properties and
four
land development parcels. Excluding one ground lease related to one operating property that expires in
2036
with a net book value of
$9.7 million
as of
September 30, 2015
, our ground lease obligations have remaining lease terms ranging from approximately
40
to
100
years, including extension options.
Commitments
As of
September 30, 2015
, remaining aggregate costs under contract for the construction of properties undergoing development, redevelopment, and improvements under the terms of leases approximated
$656.8 million
. We expect payments for these obligations to occur over
one
to
three
years, subject to capital planning adjustments from time to time. We may have the ability to cease the construction of certain properties, which would result in the reduction of our commitments. We are also committed to funding approximately
$84.9 million
for certain investments over the next several years. We have one unconsolidated joint venture with a commitment to contribute our share of equity into this joint venture to complete the project. The additional funding commitment as of
September 30, 2015
, for this joint venture was pending completion of the final design of the building. Our other unconsolidated joint venture does not have a commitment to contribute additional equity. In addition, we have letters of credit and performance obligations of
$28.4 million
.
We have minimum development requirements under project development agreements with government entities in India for some of our future value-creation projects. As of
September 30, 2015
, we had investments in real estate projects with an aggregate book value of
$43.3 million
for which we had construction commitment obligations to develop buildings aggregating approximately
300,000
RSF and
100,000
RSF by 2016 and 2017, respectively. The estimated cost to develop these projects is approximately
$125
to
$175
per square foot. If we do not meet, extend, or eliminate these commitments, we may default under our existing agreements. The government entities, in turn, have certain obligations to us under those project development agreements. We are working with these entities to fulfill or amend certain existing obligations in a mutually beneficial manner.
Exposure to environmental liabilities
In connection with the acquisition of all of our properties, we have obtained Phase I environmental assessments to ascertain the existence of any environmental liabilities or other issues. The Phase I environmental assessments of our properties have not revealed any environmental liabilities that we believe would have a material adverse effect on our financial condition or results of operations taken as a whole, nor are we aware of any material environmental liabilities that have occurred since the Phase I environmental assessments were completed. In addition, we carry a policy of pollution legal liability insurance covering exposure to certain environmental losses at substantially all of our properties.
Cash flows
We report and analyze our cash flows based on operating activities, investing activities, and financing activities. The following table summarizes changes in our cash flows (in thousands):
|
Nine Months Ended September 30,
|
|||||||||||
|
2015
|
2014
|
Change
|
|||||||||
|
Net cash provided by operating activities
|
$
|
246,411
|
|
$
|
255,124
|
|
$
|
(8,713
|
)
|
||
|
Net cash used in investing activities
|
$
|
(557,490
|
)
|
$
|
(474,339
|
)
|
$
|
(83,151
|
)
|
||
|
Net cash provided by financing activities
|
$
|
301,638
|
|
$
|
229,980
|
|
$
|
71,658
|
|
||
92
Operating activities
Cash flows provided by operating activities
for the
nine months ended September 30, 2015
and
2014
, consisted of the following amounts (in thousands):
|
Nine Months Ended September 30,
|
|||||||||||
|
2015
|
2014
|
Change
|
|||||||||
|
Net cash provided by operating activities
|
$
|
246,411
|
|
$
|
255,124
|
|
$
|
(8,713
|
)
|
||
|
Add: changes in operating assets and liabilities
|
29,619
|
|
2,631
|
|
26,988
|
|
|||||
|
Net cash provided by operating activities before changes in operating assets and liabilities
|
$
|
276,030
|
|
$
|
257,755
|
|
$
|
18,275
|
|
||
Cash flows provided by operating activities
are primarily dependent on the occupancy level of our asset base, the rental rates of our leases, the collectability of rent and recovery of operating expenses from our client tenants, the timing of completion of development projects, the timing of completion of redevelopment projects, and the timing of acquisitions of operating properties.
Net cash provided by operating activities
for the
nine months ended September 30, 2015
,
decreased
to
$246.4 million
, compared to
$255.1 million
for the
nine months ended September 30, 2014
, due to the timing of payments for operating assets and liabilities.
Net cash provided by operating activities before changes in operating assets and liabilities
for the
nine months ended September 30, 2015
,
increased
by
$18.3 million
, or
7.1%
, to
$276.0 million
, compared to
$257.8 million
for the
nine months ended September 30, 2014
. This
increase
was primarily attributable to
an increase
in our total NOI from continuing operations of
$54.5 million
, or
14.5%
, to
$430.4 million
for the
nine months ended September 30, 2015
, compared to
$375.9 million
for the
nine months ended September 30, 2014
, as a result of our highly leased development and redevelopment projects placed into service subsequent to
January 1, 2014
, partially offset by an increase in interest expense, reflecting a decrease in the amount of interest capitalized as a result of our development and redevelopment projects placed into service, as noted above.
Investing activities
Cash flows used in investing activities
for the
nine months ended September 30, 2015
and
2014
, consisted of the following (in thousands):
|
|
Nine Months Ended September 30,
|
||||||||||
|
|
2015
|
2014
|
Change
|
||||||||
|
Proceeds from sales of real estate
|
$
|
92,455
|
|
$
|
28,378
|
|
$
|
64,077
|
|
||
|
Additions to real estate
|
(362,215
|
)
|
(345,074
|
)
|
(17,141
|
)
|
|||||
|
Purchase of real estate
|
(248,933
|
)
|
(97,785
|
)
|
(151,148
|
)
|
|||||
|
Deposits for investing activities
|
(6,707
|
)
|
(7,292
|
)
|
585
|
|
|||||
|
Investment in unconsolidated real estate joint ventures
|
(7,979
|
)
|
(67,525
|
)
|
59,546
|
|
|||||
|
Additions to investments
|
(67,965
|
)
|
(35,484
|
)
|
(32,481
|
)
|
|||||
|
Sales of investments
|
39,590
|
|
13,883
|
|
25,707
|
|
|||||
|
Repayment of notes receivable
|
4,264
|
|
29,866
|
|
(25,602
|
)
|
|||||
|
Other
|
—
|
|
6,694
|
|
(6,694
|
)
|
|||||
|
Net cash used in investing activities
|
$
|
(557,490
|
)
|
$
|
(474,339
|
)
|
$
|
(83,151
|
)
|
||
The change in
net cash used in investing activities
for the
nine months ended September 30, 2015
, is primarily due to a higher use of cash for property acquisitions partially offset by a higher source of cash from asset sales.
Value-creation opportunities and external growth
For information on our key development and redevelopment projects for the
nine months ended September 30, 2015
, refer to “Development, Redevelopment, and Future Value-Creation Projects” located earlier within Item 2 of this report.
93
Financing activities
Cash flows provided by financing activities
for the
nine months ended September 30, 2015
and
2014
, consisted of the following (in thousands):
|
Nine Months Ended September 30,
|
|||||||||||
|
2015
|
2014
|
Change
|
|||||||||
|
Borrowings from secured notes payable
|
$
|
47,375
|
|
$
|
108,626
|
|
$
|
(61,251
|
)
|
||
|
Repayments of borrowings from secured notes payable
|
(12,217
|
)
|
(228,909
|
)
|
216,692
|
|
|||||
|
Proceeds from issuance of unsecured senior notes payable
|
—
|
|
698,908
|
|
(698,908
|
)
|
|||||
|
Borrowings from unsecured senior line of credit
|
1,432,000
|
|
890,000
|
|
542,000
|
|
|||||
|
Repayments of borrowings from unsecured senior line of credit
|
(893,000
|
)
|
(952,000
|
)
|
59,000
|
|
|||||
|
Repayments of borrowings from unsecured senior bank term loans
|
(25,000
|
)
|
(125,000
|
)
|
100,000
|
|
|||||
|
Total changes related to debt
|
549,158
|
|
391,625
|
|
157,533
|
|
|||||
|
Dividend payments
|
(181,020
|
)
|
(169,954
|
)
|
(11,066
|
)
|
|||||
|
Contributions by noncontrolling interests
|
340
|
|
19,410
|
|
(19,070
|
)
|
|||||
|
Distributions to and purchases of noncontrolling interests
|
(62,973
|
)
|
(3,487
|
)
|
(59,486
|
)
|
|||||
|
Other
|
(3,867
|
)
|
(7,614
|
)
|
3,747
|
|
|||||
|
Net cash provided by financing activities
|
$
|
301,638
|
|
$
|
229,980
|
|
$
|
71,658
|
|
||
Dividends
During the
nine months ended September 30, 2015
and
2014
, we paid the following dividends (in thousands):
|
Nine Months Ended September 30,
|
|||||||||||
|
2015
|
2014
|
Change
|
|||||||||
|
Common stock dividends
|
$
|
162,280
|
|
$
|
150,540
|
|
$
|
11,740
|
|
||
|
Series D preferred stock dividends
|
12,451
|
|
13,125
|
|
(674
|
)
|
|||||
|
Series E preferred stock dividends
|
6,289
|
|
6,289
|
|
—
|
|
|||||
|
|
$
|
181,020
|
|
$
|
169,954
|
|
$
|
11,066
|
|
||
The increase in dividends paid on our common stock was primarily due to an increase in the related dividends to
$2.25
per common share for the
nine months ended September 30, 2015
, from
$2.10
per common share for the
nine months ended September 30, 2014
.
Inflation
As of
September 30, 2015
, approximately
96%
of our leases (on an RSF basis) were triple net leases, requiring client tenants to pay substantially all real estate taxes, insurance, utilities, common area expenses, and other operating expenses (including increases thereto) in addition to base rent. Approximately
95%
of our leases (on an RSF basis) contained effective annual rent escalations that were either fixed (generally ranging from
3.0%
to
3.5%
) or indexed based on a consumer price index or other indices. Accordingly, we do not believe that our cash flows or earnings from real estate operations are subject to significant risks from inflation. An increase in inflation, however, could result in an increase in the cost of our variable-rate borrowings, including borrowings related to our unsecured senior line of credit and unsecured senior bank term loans.
94
Critical accounting policies
Refer to our annual report on Form 10-K for the year ended
December 31, 2014
, for a discussion of our critical accounting policies, which include rental properties; land held for future development; CIP; impairment of long-lived assets; capitalization of costs; accounting for investments; interest rate swap agreements; recognition of rental income and tenant recoveries; and monitoring of client tenant credit quality. There were no significant changes to these policies during the
nine months ended September 30, 2015
.
Non-GAAP measures
FFO and FFO, as adjusted
GAAP-basis accounting for real estate assets utilizes historical cost accounting and assumes that real estate values diminish over time. In an effort to overcome the difference between real estate values and historical cost accounting for real estate assets, the Board of Governors of the NAREIT established the measurement tool of FFO. Since its introduction, FFO has become a widely used non-GAAP financial measure among equity REITs. We believe that FFO is helpful to investors as an additional measure of the performance of an equity REIT. Moreover, we believe that FFO, as adjusted, allows investors to compare our performance to the performance of other real estate companies on a consistent basis, without having to account for differences caused by investment and disposition decisions, financing decisions, terms of securities, capital structures, and capital market transactions. We compute FFO in accordance with standards established by the Board of Governors of NAREIT in its April 2002 White Paper and related implementation guidance (“NAREIT White Paper”). The NAREIT White Paper defines FFO as net income (computed in accordance with GAAP), excluding gains (losses) from sales of depreciable real estate and land parcels and impairments of depreciable real estate (excluding land parcels), plus real estate related depreciation and amortization, and after adjustments for unconsolidated partnerships and joint ventures. Impairments of real estate relate to decreases in the fair value of real estate due to changes in general market conditions and do not necessarily reflect the operating performance of the properties during the corresponding period. Impairments of real estate represent the write-down of assets when fair value over the recoverability period is less than the carrying value. We compute FFO, as adjusted, as FFO calculated in accordance with the NAREIT White Paper less/plus significant gains/losses on the sale of investments, plus losses on early extinguishment of debt, preferred stock redemption charges, impairments of non-depreciable real estate, land parcels, impairments of investments, and the amount of such items that is allocable to our unvested restricted stock awards. Our calculations of both FFO and FFO, as adjusted, may differ from those methodologies utilized by other equity REITs for similar performance measurements and, accordingly, may not be comparable to those of other equity REITs. Neither FFO nor FFO, as adjusted, should be considered as an alternative to net income (determined in accordance with GAAP) as an indication of financial performance, or to cash flows from operating activities (determined in accordance with GAAP) as a measure of liquidity, nor are they indicative of the availability of funds for our cash needs, including funds available to make distributions.
AFFO
AFFO is a non-GAAP financial measure that we use as a supplemental measure of our performance. We compute AFFO by adding to or deducting from FFO, as adjusted: (i) non-revenue-enhancing building improvements (excluding amounts recoverable from our client tenants), non-revenue-enhancing tenant improvements and leasing commissions (excluding revenue-enhancing and development and redevelopment expenditures); (ii) effects of straight-line rent revenue and straight-line rent expense on ground leases; (iii) capitalized income from development projects; (iv) amortization of acquired above- and below-market leases, loan fees, and debt premiums/discounts; (v) stock compensation expense; and (vi) allocation of AFFO attributable to unvested restricted stock awards.
We believe that AFFO is a useful supplemental performance measure because it further adjusts FFO to (i) deduct certain expenditures that, although capitalized and classified in depreciation expense, do not enhance the revenue or cash flows of our properties; (ii) eliminate the effect of straight-lining our rental income and capitalizing income from development projects; and (iii) eliminate the effect of items that are not indicative of our core operations and that do not actually reduce the amount of cash generated by our operations. We believe that eliminating the effect of charges related to share-based compensation facilitates a comparison of our operations across periods and among other equity REITs without the variances caused by different valuation methodologies, the volatility of the expense (which depends on market forces outside our control), and the assumptions and the variety of award types that a company can use. We believe that AFFO provides useful information by excluding certain items that are not representative of our core operating results because such items are dependent upon historical costs or subject to judgmental valuation inputs and the timing of our decisions.
AFFO is not intended to represent cash flow for the period, and is intended only to provide an additional measure of performance. We believe that net income attributable to Alexandria’s common stockholders is the GAAP financial measure most
95
comparable to AFFO. We believe that AFFO is a widely recognized measure of the operations of equity REITs, and presenting AFFO will enable investors to assess our performance in comparison to other equity REITs. However, other equity REITs may use different methodologies for calculating AFFO, and accordingly, our AFFO may not be comparable to AFFO calculated by other equity REITs. AFFO should not be considered as an alternative to net income (determined in accordance with GAAP) as an indication of financial performance, or to cash flows from operating activities (determined in accordance with GAAP) as a measure of our liquidity, nor is it indicative of funds available to fund our cash needs, including our ability to make distributions.
The following table presents a reconciliation of net income attributable to Alexandria’s common stockholders – basic, the most directly comparable financial measure calculated and presented in accordance with GAAP, to FFO attributable to Alexandria’s common stockholders – basic, FFO attributable to Alexandria’s common stockholders – diluted, as adjusted, and AFFO attributable to Alexandria’s common stockholders – diluted, for the periods below. Amounts in the table below include our share of unconsolidated joint venture amounts (in thousands).
|
Three Months Ended September 30,
|
Nine Months Ended September 30,
|
|||||||||||||||
|
2015
|
2014
|
2015
|
2014
|
|||||||||||||
|
Net income attributable to Alexandria’s common stockholders
|
$
|
32,659
|
|
$
|
27,626
|
|
$
|
81,736
|
|
$
|
88,267
|
|
||||
|
Depreciation and amortization
|
68,398
|
|
58,388
|
|
190,123
|
|
166,123
|
|
||||||||
|
Impairment of real estate – rental properties
|
—
|
|
—
|
|
14,510
|
|
—
|
|
||||||||
|
Gain on sales of real estate – land parcels
|
—
|
|
(8
|
)
|
—
|
|
(805
|
)
|
||||||||
|
Amount attributable to noncontrolling interests/
unvested restricted stock awards: |
||||||||||||||||
|
Net income
|
793
|
|
1,846
|
|
2,661
|
|
5,127
|
|
||||||||
|
FFO
|
(1,491
|
)
|
(2,278
|
)
|
(3,892
|
)
|
(5,570
|
)
|
||||||||
|
FFO attributable to Alexandria’s common stockholders – basic and diluted
(1)
|
100,359
|
|
85,574
|
|
285,138
|
|
253,142
|
|
||||||||
|
Investment income
(2)
|
(5,378
|
)
|
—
|
|
(5,378
|
)
|
—
|
|
||||||||
|
Loss on early extinguishment of debt
|
—
|
|
525
|
|
189
|
|
525
|
|
||||||||
|
Allocation to unvested restricted stock awards
|
67
|
|
(4
|
)
|
53
|
|
(4
|
)
|
||||||||
|
FFO attributable to Alexandria’s common stockholders – diluted, as adjusted
|
95,048
|
|
86,095
|
|
280,002
|
|
253,663
|
|
||||||||
|
Non-revenue-enhancing capital expenditures:
|
||||||||||||||||
|
Building improvements
|
(2,404
|
)
|
(2,405
|
)
|
(7,425
|
)
|
(5,440
|
)
|
||||||||
|
Tenant improvements and leasing commissions
|
(5,499
|
)
|
(1,693
|
)
|
(17,703
|
)
|
(9,680
|
)
|
||||||||
|
Straight-line rent revenue
|
(12,006
|
)
|
(10,892
|
)
|
(36,862
|
)
|
(35,511
|
)
|
||||||||
|
Straight-line rent expense on ground leases
(3)
|
(1,245
|
)
|
723
|
|
(372
|
)
|
2,131
|
|
||||||||
|
Amortization of acquired below-market leases
(4)
|
(3,182
|
)
|
(757
|
)
|
(5,121
|
)
|
(2,191
|
)
|
||||||||
|
Amortization of loan fees
|
2,657
|
|
2,786
|
|
8,413
|
|
8,090
|
|
||||||||
|
Amortization of debt (premiums) discounts
|
(100
|
)
|
(36
|
)
|
(282
|
)
|
100
|
|
||||||||
|
Stock compensation expense
|
5,178
|
|
3,068
|
|
12,922
|
|
9,372
|
|
||||||||
|
Allocation to unvested restricted stock awards
|
207
|
|
71
|
|
476
|
|
261
|
|
||||||||
|
AFFO attributable to Alexandria’s common stockholders – diluted
|
$
|
78,654
|
|
$
|
76,960
|
|
$
|
234,048
|
|
$
|
220,795
|
|
||||
|
(1)
|
Calculated in accordance with standards established by the Board of Governors of the NAREIT in its April 2002 White Paper and related implementation guidance.
|
|
(2)
|
Investment income for the three months ended
September 30, 2015
, of
$5.4 million
, or
$0.08
per share, included gross investment gains of
$8.7 million
, primarily from the sale of two publicly traded securities.
|
|
(3)
|
Increase in the three months ended
September 30, 2015
, due to the timing of an annual cash payment for one ground lease. Straight-line rent expense related to ground leases is expected to decrease in the three months ended December 31, 2015, to a quarterly run rate generally consistent with quarters prior to the three months ended
September 30, 2015
.
|
|
(4)
|
Increase in the three months ended
September 30, 2015
, is primarily related to a below-market lease assumed with the acquisition of 10290 Campus Point Drive in our University Town Center submarket in July 2015. This acquired lease expired in September 2015. We expect amortization of acquired below-market leases to decrease in the three months ended December 31, 2015, to a quarterly run rate of approximately $1.0 million.
|
96
The following table presents a reconciliation of earnings per share attributable to Alexandria’s common stockholders – basic, to FFO per share attributable to Alexandria’s common stockholders – diluted, FFO per share attributable to Alexandria’s common stockholders – diluted, as adjusted, and AFFO per share attributable to Alexandria’s common stockholders – diluted, for the periods below. Amounts allocable to unvested restricted stock awards of approximately one cent per share are not presented separately within the table below (in thousands, except per share amounts). Per share amounts may not add due to rounding.
|
Three Months Ended September 30,
|
Nine Months Ended September 30,
|
|||||||||||||||
|
2015
|
2014
|
2015
|
2014
|
|||||||||||||
|
Earnings per share attributable to Alexandria’s common stockholders – basic and diluted
|
$
|
0.46
|
|
$
|
0.39
|
|
$
|
1.14
|
|
$
|
1.24
|
|
||||
|
Depreciation and amortization
|
0.95
|
|
0.81
|
|
2.65
|
|
2.33
|
|
||||||||
|
Impairment of real estate – rental properties
|
—
|
|
—
|
|
0.20
|
|
—
|
|
||||||||
|
Gain on sales of real estate – land parcels
|
—
|
|
—
|
|
—
|
|
(0.01
|
)
|
||||||||
|
FFO per share attributable to Alexandria’s common stockholders – basic and diluted
(1)
|
1.40
|
|
1.20
|
|
3.99
|
|
3.56
|
|
||||||||
|
Investment income
(2)
|
(0.08
|
)
|
—
|
|
(0.08
|
)
|
—
|
|
||||||||
|
Loss on early extinguishment of debt
|
—
|
|
0.01
|
|
—
|
|
0.01
|
|
||||||||
|
FFO per share attributable to Alexandria’s common stockholders – diluted, as adjusted
|
1.33
|
|
1.21
|
|
3.92
|
|
3.57
|
|
||||||||
|
Non-revenue-enhancing capital expenditures:
|
||||||||||||||||
|
Building improvements
|
(0.03
|
)
|
(0.03
|
)
|
(0.10
|
)
|
(0.08
|
)
|
||||||||
|
Tenant improvements and leasing commissions
|
(0.08
|
)
|
(0.02
|
)
|
(0.25
|
)
|
(0.14
|
)
|
||||||||
|
Straight-line rent revenue
|
(0.17
|
)
|
(0.15
|
)
|
(0.52
|
)
|
(0.50
|
)
|
||||||||
|
Straight-line rent expense on ground leases
|
(0.02
|
)
|
0.01
|
|
—
|
|
0.03
|
|
||||||||
|
Amortization of acquired below-market leases
|
(0.04
|
)
|
(0.01
|
)
|
(0.06
|
)
|
(0.02
|
)
|
||||||||
|
Amortization of loan fees
|
0.04
|
|
0.03
|
|
0.12
|
|
0.11
|
|
||||||||
|
Stock compensation expense
|
0.07
|
|
0.04
|
|
0.18
|
|
0.13
|
|
||||||||
|
AFFO per share attributable to Alexandria’s common stockholders – diluted
|
$
|
1.10
|
|
$
|
1.08
|
|
$
|
3.28
|
|
$
|
3.10
|
|
||||
|
Weighted-average shares of common stock outstanding for calculating FFO, FFO, as adjusted, and AFFO per share attributable to Alexandria’s common stockholders – basic and diluted
|
71,500
|
|
71,195
|
|
71,426
|
|
71,121
|
|
||||||||
|
(1)
|
Calculated in accordance with standards established by the Board of Governors of the NAREIT in its April 2002 White Paper and related implementation guidance.
|
|
(2)
|
Investment income for the three months ended
September 30, 2015
, of
$5.4 million
, or
$0.08
per share, included gross investment gains of
$8.7 million
, primarily from the sale of two publicly traded securities.
|
97
Adjusted EBITDA
EBITDA represents earnings before interest, taxes, depreciation, and amortization. EBITDA is a non-GAAP financial measure and is used by us and others as a supplemental measure of performance. We use Adjusted EBITDA to assess the performance of our core operations, for financial and operational decision making, and as a supplemental or additional means of evaluating period-to-period comparisons on a consistent basis. Adjusted EBITDA is calculated as EBITDA, excluding stock compensation expense, gains or losses on early extinguishment of debt, gains or losses on sales of real estate, and impairments (“Adjusted EBITDA”). We believe Adjusted EBITDA provides investors relevant and useful information because it permits investors to view income from our operations on an unleveraged basis before the effects of taxes, depreciation and amortization, stock compensation expense, gains or losses on early extinguishment of debt, gains or losses on sales of real estate, and impairments, including our share from our unconsolidated joint ventures. By excluding interest expense and gains or losses on early extinguishment of debt, EBITDA and Adjusted EBITDA allow investors to measure our performance independent of our capital structure and indebtedness and, therefore, allow for a more meaningful comparison of our performance to that of other companies, both in the real estate industry and in other industries. We believe that excluding charges related to share-based compensation facilitates a comparison of our operations across periods and among other equity REITs without the variances caused by different valuation methodologies, the volatility of the expense (which depends on market forces outside our control), and the assumptions and the variety of award types that a company can use. We believe that adjusting for the effects of gains or losses on sales of real estate and land parcels, and impairments provides useful information by excluding certain items that are not representative of our core operating results. These items are dependent upon historical costs and are subject to judgmental inputs and the timing of our decisions. EBITDA and Adjusted EBITDA have limitations as measures of our performance. EBITDA and Adjusted EBITDA do not reflect our historical cash expenditures or future cash requirements for capital expenditures or contractual commitments. While EBITDA and Adjusted EBITDA are relevant and widely used measures of performance, they do not represent net income or cash flows from operations as defined by GAAP, and they should not be considered as alternatives to those indicators in evaluating performance or liquidity. Further, our computation of EBITDA and Adjusted EBITDA may not be comparable to similar measures reported by other companies.
The following table reconciles net income, the most directly comparable financial measure calculated and presented in accordance with GAAP, to EBITDA and Adjusted EBITDA (in thousands):
|
Three Months Ended September 30,
|
Nine Months Ended September 30,
|
||||||||||||||
|
2015
|
2014
|
2015
|
2014
|
||||||||||||
|
Net income
|
$
|
39,699
|
|
$
|
35,943
|
|
$
|
103,137
|
|
$
|
112,808
|
|
|||
|
Interest expense:
|
|||||||||||||||
|
Consolidated
|
27,679
|
|
20,555
|
|
77,583
|
|
57,111
|
|
|||||||
|
Our share of unconsolidated joint ventures
|
242
|
|
—
|
|
284
|
|
—
|
|
|||||||
|
Interest expense
|
27,921
|
|
20,555
|
|
77,867
|
|
57,111
|
|
|||||||
|
Income taxes
|
1,392
|
|
—
|
|
3,838
|
|
—
|
|
|||||||
|
Depreciation and amortization:
|
|||||||||||||||
|
Consolidated
|
67,953
|
|
58,388
|
|
189,044
|
|
166,123
|
|
|||||||
|
Our share of unconsolidated joint ventures
|
445
|
|
—
|
|
1,079
|
|
—
|
|
|||||||
|
Depreciation and amortization
|
68,398
|
|
58,388
|
|
190,123
|
|
166,123
|
|
|||||||
|
EBITDA
|
137,410
|
|
114,886
|
|
374,965
|
|
336,042
|
|
|||||||
|
Stock compensation expense
|
5,178
|
|
3,068
|
|
12,922
|
|
9,372
|
|
|||||||
|
Loss on early extinguishment of debt
|
—
|
|
525
|
|
189
|
|
525
|
|
|||||||
|
Gain on sales of real estate – land parcels
|
—
|
|
(8
|
)
|
—
|
|
(805
|
)
|
|||||||
|
Impairment of real estate
|
—
|
|
—
|
|
14,510
|
|
—
|
|
|||||||
|
Adjusted EBITDA
|
$
|
142,588
|
|
$
|
118,471
|
|
$
|
402,586
|
|
$
|
345,134
|
|
|||
98
Adjusted EBITDA margins
We calculate Adjusted EBITDA margins by dividing Adjusted EBITDA by total revenues. Because our total revenues exclude revenues from discontinued operations, for the purposes of calculating the margin ratio, we exclude the Adjusted EBITDA generated by our discontinued operations for each period presented. We believe excluding Adjusted EBITDA for discontinued operations improves the consistency and comparability of the Adjusted EBITDA margins from period to period. The following table reconciles Adjusted EBITDA to Adjusted EBITDA – excluding discontinued operations (dollars in thousands):
|
Three Months Ended September 30,
|
Nine Months Ended September 30,
|
||||||||||||||
|
2015
|
2014
|
2015
|
2014
|
||||||||||||
|
Adjusted EBITDA
|
$
|
142,588
|
|
$
|
118,471
|
|
$
|
402,586
|
|
$
|
345,134
|
|
|||
|
Add back: operating loss from discontinued operations
|
—
|
|
180
|
|
43
|
|
489
|
|
|||||||
|
Adjusted EBITDA – excluding discontinued operations
|
$
|
142,588
|
|
$
|
118,651
|
|
$
|
402,629
|
|
$
|
345,623
|
|
|||
|
Revenues:
|
|||||||||||||||
|
Consolidated
|
$
|
218,610
|
|
$
|
185,615
|
|
$
|
619,519
|
|
$
|
538,203
|
|
|||
|
Our share of unconsolidated joint ventures
|
1,875
|
|
—
|
|
3,199
|
|
—
|
|
|||||||
|
Revenues
|
$
|
220,485
|
|
$
|
185,615
|
|
$
|
622,718
|
|
$
|
538,203
|
|
|||
|
Adjusted EBITDA margins
|
65%
|
|
64%
|
|
65%
|
|
64%
|
|
|||||||
99
Fixed-charge coverage ratio
The fixed-charge coverage ratio is the ratio of Adjusted EBITDA to fixed charges. This ratio is useful to investors as a supplemental measure of our ability to satisfy financing obligations and preferred stock dividends. Cash interest is equal to interest expense calculated in accordance with GAAP, plus capitalized interest and unconsolidated joint venture cash interest, less amortization of loan fees and amortization of debt premiums (discounts). The fixed-charge coverage ratio calculation below is not directly comparable to the computation of “Consolidated Ratio of Earnings to Fixed Charges and Consolidated Ratio of Earnings to Combined Fixed Charges and Preferred Stock Dividends” included in Exhibit 12.1 to this quarterly report on Form 10-Q for the
nine months ended September 30, 2015
, and on our annual report on Form 10-K for the year ended
December 31, 2014
.
The following table presents a reconciliation of interest expense, the most directly comparable GAAP financial measure to cash interest and fixed charges (dollars in thousands):
|
Three Months Ended September 30,
|
Nine Months Ended September 30,
|
|||||||||||||||
|
2015
|
2014
|
2015
|
2014
|
|||||||||||||
|
Adjusted EBITDA
|
$
|
142,588
|
|
$
|
118,471
|
|
$
|
402,586
|
|
$
|
345,134
|
|
||||
|
Interest expense
|
$
|
27,921
|
|
$
|
20,555
|
|
$
|
77,867
|
|
$
|
57,111
|
|
||||
|
Capitalized interest:
|
||||||||||||||||
|
Consolidated
|
8,436
|
|
12,125
|
|
27,844
|
|
35,440
|
|
||||||||
|
Our share of unconsolidated joint ventures
|
641
|
|
—
|
|
1,846
|
|
—
|
|
||||||||
|
Capitalized interest
|
9,077
|
|
12,125
|
|
29,690
|
|
35,440
|
|
||||||||
|
Amortization of loan fees:
|
||||||||||||||||
|
Consolidated
|
(2,625
|
)
|
(2,786
|
)
|
(8,348
|
)
|
(8,090
|
)
|
||||||||
|
Our share of unconsolidated joint ventures
|
(32
|
)
|
—
|
|
(65
|
)
|
—
|
|
||||||||
|
Amortization of loan fees
|
(2,657
|
)
|
(2,786
|
)
|
(8,413
|
)
|
(8,090
|
)
|
||||||||
|
Amortization of debt premiums (discounts)
|
100
|
|
36
|
|
282
|
|
(100
|
)
|
||||||||
|
Cash interest
|
34,441
|
|
29,930
|
|
99,426
|
|
84,361
|
|
||||||||
|
Dividends on preferred stock
|
6,247
|
|
6,471
|
|
18,740
|
|
19,414
|
|
||||||||
|
Fixed charges
|
$
|
40,688
|
|
$
|
36,401
|
|
$
|
118,166
|
|
$
|
103,775
|
|
||||
|
Fixed-charge coverage ratio:
|
||||||||||||||||
|
– period annualized
|
3.5x
|
|
3.3x
|
|
3.4x
|
|
3.3x
|
|
||||||||
|
– trailing 12 months
|
3.4x
|
|
3.3x
|
|
3.4x
|
|
3.3x
|
|
||||||||
100
Net debt to Adjusted EBITDA
Net debt to Adjusted EBITDA is a non-GAAP financial measure that we believe is useful to investors as a supplemental measure in evaluating our balance sheet leverage. Net debt is equal to the sum of total consolidated and unconsolidated debt less cash, cash equivalents, and restricted cash. See “Adjusted EBITDA” for further information on the calculation of Adjusted EBITDA.
The following table summarizes the calculation of net debt to Adjusted EBITDA as of
September 30, 2015
, and
December 31, 2014
(dollars in thousands):
|
September 30, 2015
|
December 31, 2014
|
||||||
|
Secured notes payable:
|
|||||||
|
Consolidated
|
$
|
773,619
|
|
$
|
652,209
|
|
|
|
Our share of unconsolidated joint ventures
|
48,215
|
|
—
|
|
|||
|
Secured notes payable
|
821,834
|
|
652,209
|
|
|||
|
Unsecured senior notes payable
|
1,747,613
|
|
1,747,370
|
|
|||
|
Unsecured senior line of credit
|
843,000
|
|
304,000
|
|
|||
|
Unsecured senior bank term loans
|
950,000
|
|
975,000
|
|
|||
|
Cash and cash equivalents:
|
|||||||
|
Consolidated
|
(76,383
|
)
|
(86,011
|
)
|
|||
|
Our share of unconsolidated joint ventures
|
(7,231
|
)
|
—
|
|
|||
|
Cash and cash equivalents
|
(83,614
|
)
|
(86,011
|
)
|
|||
|
Less: restricted cash
|
(36,993
|
)
|
(26,884
|
)
|
|||
|
Net debt
|
$
|
4,241,840
|
|
$
|
3,565,684
|
|
|
|
Adjusted EBITDA:
|
|||||||
|
– quarter annualized
|
$
|
570,352
|
|
$
|
493,432
|
|
|
|
– trailing 12 months
|
$
|
525,944
|
|
$
|
468,492
|
|
|
|
Net debt to Adjusted EBITDA:
|
|||||||
|
– quarter annualized
|
7.4
|
x
|
7.2
|
x
|
|||
|
– trailing 12 months
|
8.1
|
x
|
7.6
|
x
|
|||
NOI
NOI is a non-GAAP financial measure equal to income from continuing operations, the most directly comparable GAAP financial measure, excluding loss on early extinguishment of debt, impairment of real estate, depreciation and amortization, interest expense, and general and administrative expense, including our share of our unconsolidated joint ventures. We believe NOI provides useful information to investors regarding our financial condition and results of operations because it primarily reflects those income and expense items that are incurred at the property level. Therefore, we believe NOI is a useful measure for evaluating the operating performance of our real estate assets. NOI on a cash basis is NOI, adjusted to exclude the effect of straight-line rent adjustments required by GAAP. We believe that NOI on a cash basis is helpful to investors as an additional measure of operating performance because it eliminates straight-line rent adjustments to rental revenue.
101
Further, we believe NOI is useful to investors as a performance measure because when compared across periods, NOI reflects the impact on operations from trends in occupancy rates, rental rates, and operating costs, which provides perspective not immediately apparent from income from continuing operations. NOI can be used to measure the initial stabilized yields of our properties by calculating the quotient of NOI generated by a property on a straight-line basis, and our investment in the property, excluding the impact of leverage. NOI excludes certain components from income from continuing operations in order to provide results that are more closely related to the results of operations of our properties. For example, interest expense is not necessarily linked to the operating performance of a real estate asset and is often incurred at the corporate level rather than at the property level. In addition, depreciation and amortization, because of historical cost accounting and useful life estimates, may distort operating performance at the property level. Impairments of real estate have been excluded in deriving NOI because we do not consider impairments of real estate to be property-level operating expenses. Impairments of real estate relate to changes in the values of our assets and do not reflect the current operating performance with respect to related revenues or expenses. Our impairments of real estate represent the write-down in the value of the assets to the estimated fair value less cost to sell. These impairments result from investing decisions and the deterioration in market conditions that adversely impact underlying real estate values. Our calculation of NOI also excludes charges incurred from changes in certain financing decisions, such as losses on early extinguishment of debt, as these charges often relate to the timing of corporate strategy. Property operating expenses that are included in determining NOI consist of costs that are related to our operating properties, such as utilities, repairs and maintenance; rental expense related to ground leases; contracted services, such as janitorial, engineering, and landscaping; property taxes and insurance; and property-level salaries. General and administrative expenses consist primarily of accounting and corporate compensation, corporate insurance, professional fees, office rent, and office supplies that are incurred as part of corporate office management. NOI presented by us may not be comparable to NOI reported by other equity REITs that define NOI differently. We believe that in order to facilitate a clear understanding of our operating results, NOI should be examined in conjunction with income from continuing operations as presented in our consolidated statements of income. NOI should not be considered as an alternative to income from continuing operations as an indication of our performance, nor as an alternative to cash flows as a measure of liquidity or our ability to make distributions.
Same Properties’ NOI
Refer to the discussion of Same Properties and the reconciliation of NOI to income from continuing operations in the “Results of Operations” section earlier in Item 2 of this report.
Unencumbered NOI as a percentage of total NOI from continuing operations
Unencumbered NOI as a percentage of total NOI from continuing operations is a non-GAAP financial measure that we believe is useful to investors as a performance measure of the results of operations of our unencumbered real estate assets, as it primarily reflects those income and expense items that are incurred at the unencumbered property level. We use unencumbered NOI as a percentage of total NOI from continuing operations, including our share of unconsolidated joint ventures, in order to assess our compliance with our financial covenants under our debt obligations, because the measure serves as a proxy for a financial measure under such debt obligations. Unencumbered NOI is derived from assets classified in continuing operations, including our share from unconsolidated joint ventures, that are not subject to any mortgage, deed of trust, lien, or other security interest as of the period for which income is presented. Refer to the reconciliation of NOI to income from continuing operations in the “Results of Operations” section earlier in Item 2 of this report.
The following table summarizes unencumbered NOI as a percentage of total NOI for the three and
nine months ended September 30, 2015
and
2014
(dollars in thousands):
|
Three Months Ended September 30,
|
Nine Months Ended September 30,
|
||||||||||||||
|
2015
|
2014
|
2015
|
2014
|
||||||||||||
|
Unencumbered NOI
|
$
|
118,889
|
|
$
|
108,155
|
|
$
|
341,666
|
|
$
|
315,202
|
|
|||
|
Encumbered NOI
|
32,272
|
|
20,037
|
|
88,722
|
|
60,718
|
|
|||||||
|
NOI from continuing operations
|
$
|
151,161
|
|
$
|
128,192
|
|
$
|
430,388
|
|
$
|
375,920
|
|
|||
|
Unencumbered NOI as a percentage of total NOI
|
79%
|
|
84%
|
|
79%
|
|
84%
|
|
|||||||
102
Interest rate risk
The primary market risk to which we believe we are exposed is interest rate risk, which may result from many factors, including governmental monetary and tax policies, domestic and international economic and political considerations, and other factors that are beyond our control.
In order to modify and manage the interest rate characteristics of our outstanding debt and to limit the effects of interest rate risks on our operations, we may utilize a variety of financial instruments, including interest rate swap agreements, caps, floors, and other interest rate exchange contracts. The use of these types of instruments to hedge a portion of our exposure to changes in interest rates carries additional risks, such as counterparty credit risk and the legal enforceability of hedging contracts.
Our future earnings and fair values relating to financial instruments are primarily dependent upon prevalent market rates of interest, such as LIBOR. However, our interest rate swap agreements are intended to reduce the effects of interest rate changes. The following table illustrates the effect of a 1% change in interest rates, assuming a LIBOR floor of 0%, on our variable-rate debt, including our unsecured senior line of credit and unsecured senior bank term loans, after considering the effect of our interest rate swap agreements, secured debt, and unsecured senior notes payable as of
September 30, 2015
(in thousands):
|
Annualized impact to future earnings due to variable-rate debt:
|
|||
|
Rate increase of 1%
|
$
|
(7,920
|
)
|
|
Rate decrease of 1%
|
$
|
1,529
|
|
|
Effect on fair value of total consolidated debt and interest rate swap agreements:
|
|||
|
Rate increase of 1%
|
$
|
(151,947
|
)
|
|
Rate decrease of 1%
|
$
|
144,303
|
|
These amounts are determined by considering the impact of the hypothetical interest rates on our borrowing cost and our interest rate swap agreements in existence on
September 30, 2015
. These analyses do not consider the effects of the reduced level of overall economic activity that could exist in such an environment. Further, in the event of a change of such magnitude, we would consider taking actions to further mitigate our exposure to the change. However, because of the uncertainty of the specific actions that would be taken and their possible effects, the sensitivity analyses assume no changes in our capital structure.
Equity price risk
We have exposure to equity price market risk because of our equity investments in certain publicly traded companies and privately held entities. We classify investments in publicly traded companies as “available-for-sale” and consequently recognize them in the accompanying consolidated balance sheets at fair value, with unrealized gains or losses reported as a component of accumulated other comprehensive income (loss). Investments in privately held entities are generally accounted for under the cost method because we do not influence any of the operating or financial policies of the entities in which we invest. For all investments, we recognize other-than-temporary declines in value against earnings in the same period during which the decline in value was deemed to have occurred. There is no assurance that future declines in value will not have a material adverse impact on our future results of operations. The following table illustrates the effect that a 10% change in the fair value of our equity investments would have on earnings as of
September 30, 2015
(in thousands):
|
Equity price risk:
|
|||
|
Fair value increase of 10%
|
$
|
33,057
|
|
|
Fair value decrease of 10%
|
$
|
(33,057
|
)
|
103
Foreign currency exchange rate risk
We have exposure to foreign currency exchange rate risk related to our subsidiaries operating in Canada and Asia. The functional currencies of our foreign subsidiaries are the respective local currencies. Gains or losses resulting from the translation of our foreign subsidiaries’ balance sheets and statements of income are classified in accumulated other comprehensive income (loss) as a separate component of total equity. Gains or losses will be reflected in our statements of income when there is a sale or partial sale of our investment in these operations or upon a complete or substantially complete liquidation of the investment. The following table illustrates the effect that a 10% change in foreign currency rates relative to the U.S. dollar would have on our potential future earnings, and the fair value of our net investment in foreign subsidiaries based on our current operating assets outside the U.S. as of
September 30, 2015
(in thousands):
|
Impact of potential future earnings due to foreign currency exchange rate:
|
|||
|
Rate increase of 10%
|
$
|
(161
|
)
|
|
Rate decrease of 10%
|
$
|
161
|
|
|
Effect on the fair value of net investment in foreign subsidiaries due to foreign currency exchange rate:
|
|||
|
Rate increase of 10%
|
$
|
24,469
|
|
|
Rate decrease of 10%
|
$
|
(24,469
|
)
|
This sensitivity analysis assumes a parallel shift of all foreign currency exchange rates with respect to the U.S. dollar; however, foreign currency exchange rates do not typically move in such a manner and actual results may differ materially.
Our exposure to market risk elements for the
nine months ended September 30, 2015
, was consistent with the risk elements presented above, including the effects of changes in interest rates, equity prices, and foreign currency exchange rates.
Evaluation of disclosure controls and procedures
As of
September 30, 2015
, we had performed an evaluation, under the supervision of our Chief Executive Officer (“CEO”) and Chief Financial Officer (“CFO”), of the effectiveness of the design and operation of our disclosure controls and procedures. These controls and procedures have been designed to ensure that information required for disclosure is recorded, processed, summarized, and reported within the requisite time periods. Based on our evaluation, the CEO and CFO concluded that our disclosure controls and procedures were effective as of
September 30, 2015
.
Changes in internal control over financial reporting
There has not been any change in our internal control over financial reporting during the three months ended
September 30, 2015
, that has materially affected, or is reasonably likely to materially affect, our internal control over financial reporting.
104
In addition to the information set forth in this quarterly report on Form 10-Q, one should also carefully review and consider the information contained in our other reports and periodic filings that we make with the SEC, including, without limitation, the information contained under the caption “Item 1A. Risk Factors” in our annual report on Form 10-K for the year ended
December 31, 2014
. Those risk factors could materially affect our business, financial condition, and results of operations. The risks that we describe in our public filings are not the only risks that we face. Additional risks and uncertainties not currently known to us, or that we presently deem to be immaterial, also may materially adversely affect our business, financial condition, and results of operations.
105
|
Exhibit
Number
|
Exhibit Title
|
|
|
3.1*
|
Articles of Amendment and Restatement of the Company, filed as an exhibit to the Company’s quarterly report on Form 10-Q filed with the SEC on August 14, 1997.
|
|
|
3.2*
|
Certificate of Correction of the Company, filed as an exhibit to the Company’s quarterly report on Form 10-Q filed with the SEC on August 14, 1997.
|
|
|
3.3*
|
Bylaws of the Company (as amended May 7, 2015), filed as an exhibit to the Company’s current report on Form 8-K filed with the SEC on May 11, 2015.
|
|
|
3.4*
|
Articles Supplementary, dated June 9, 1999, relating to the 9.50% Series A Cumulative Redeemable Preferred Stock, filed as an exhibit to the Company’s quarterly report on Form 10-Q filed with the SEC on August 13, 1999.
|
|
|
3.5*
|
Articles Supplementary, dated February 10, 2000, relating to the election to be subject to Subtitle 8 of Title 3 of the Maryland General Corporation Law, filed as an exhibit to the Company’s current report on Form 8-K filed with the SEC on February 10, 2000.
|
|
|
3.6*
|
Articles Supplementary, dated February 10, 2000, relating to the Series A Junior Participating Preferred Stock, filed as an exhibit to the Company’s current report on Form 8-K filed with the SEC on February 10, 2000.
|
|
|
3.7*
|
Articles Supplementary, dated January 18, 2002, relating to the 9.10% Series B Cumulative Redeemable Preferred Stock, filed as an exhibit to the Company’s Form 8-A for registration of certain classes of securities filed with the SEC on January 18, 2002.
|
|
|
3.8*
|
Articles Supplementary, dated June 22, 2004, relating to the 8.375% Series C Cumulative Redeemable Preferred Stock, filed as an exhibit to the Company’s Form 8-A for registration of certain classes of securities filed with the SEC on June 28, 2004.
|
|
|
3.9*
|
Articles Supplementary, dated March 25, 2008, relating to the 7.00% Series D Cumulative Convertible Preferred Stock, filed as an exhibit to the Company’s current report on Form 8-K filed with the SEC on March 25, 2008.
|
|
|
3.10*
|
Articles Supplementary, dated March 12, 2012, relating to the 6.45% Series E Cumulative Redeemable Preferred Stock, filed as an exhibit to the Company’s current report on Form 8-K filed with the SEC on March 14, 2012.
|
|
|
4.1*
|
Specimen certificate representing shares of common stock, filed as an exhibit to the Company’s quarterly report on Form 10-Q filed with the SEC on May 5, 2011.
|
|
|
4.2*
|
Specimen certificate representing shares of 7.00% Series D Cumulative Convertible Preferred Stock, filed as an exhibit to the Company’s current report on Form 8-K filed with the SEC on March 25, 2008.
|
|
|
4.3*
|
Indenture, dated as of February 29, 2012, among the Company, as Issuer, Alexandria Real Estate Equities, L.P., as Guarantor, and the Bank of New York Mellon Trust Company, N.A., as Trustee, filed as an exhibit to the Company’s current report on Form 8-K filed with the SEC on February 29, 2012.
|
|
|
4.4*
|
Supplemental Indenture No. 1, dated as of February 29, 2012, among the Company, as Issuer, Alexandria Real Estate Equities, L.P., as Guarantor, and the Bank of New York Mellon Trust Company, N.A., as Trustee, filed as an exhibit to the Company’s current report on Form 8-K filed with the SEC on February 29, 2012.
|
|
|
4.5*
|
Form of 4.60% Senior Note due 2022 (included in Exhibit 4.4 above).
|
|
|
4.6*
|
Specimen certificate representing shares of 6.45% Series E Cumulative Redeemable Preferred Stock, filed as an exhibit to the Company’s Form 8-A for registration of certain classes of securities filed with the SEC on March 12, 2012.
|
|
|
4.7*
|
Supplemental Indenture No. 2, dated as of June 7, 2013, among the Company, as Issuer, Alexandria Real Estate Equities, L.P., as Guarantor, and the Bank of New York Mellon Trust Company, N.A., as Trustee, filed as an exhibit to the Company’s current report on Form 8-K filed with the SEC on June 7, 2013.
|
|
|
4.8*
|
Form of 3.90% Senior Note due 2023 (included in Exhibit 4.7 above).
|
|
|
4.9*
|
Supplemental Indenture No. 3, dated as of July 18, 2014, among the Company, as Issuer, Alexandria Real Estate Equities, L.P., as Guarantor, and the Bank of New York Mellon Trust Company, N.A., as Trustee, filed as an exhibit to the Company’s current report on Form 8-K filed with the SEC on July 18, 2014.
|
|
|
4.10*
|
Form of 2.750% Senior Note due 2020 (included in Exhibit 4.9 above).
|
|
|
4.11*
|
Supplemental Indenture No. 4, dated as of July 18, 2014, among the Company, as Issuer, Alexandria Real Estate Equities, L.P., as Guarantor, and the Bank of New York Mellon Trust Company, N.A., as Trustee, filed as an exhibit to the Company’s current report on Form 8-K filed with the SEC on July 18, 2014.
|
|
|
4.12*
|
Form of 4.500% Senior Note due 2029 (included in Exhibit 4.11 above).
|
|
106
|
12.1
|
Computation of Consolidated Ratios of Earnings to Fixed Charges and Combined Fixed Charges and Preferred Stock Dividends.
|
|
|
31.1
|
Certification of Chief Executive Officer Pursuant to Section 302 of the Sarbanes-Oxley Act of 2002.
|
|
|
31.2
|
Certification of Chief Financial Officer Pursuant to Section 302 of the Sarbanes-Oxley Act of 2002.
|
|
|
32.0
|
Certification of Chief Executive Officer and Chief Financial Officer Pursuant to 18 U.S.C. Section 1350, as Adopted Pursuant to Section 906 of the Sarbanes-Oxley Act of 2002.
|
|
|
101
|
The following materials from the Company’s quarterly report on Form 10-Q for the nine months ended September 30, 2015, formatted in XBRL (eXtensible Business Reporting Language): (i) Consolidated Balance Sheets as of September 30, 2015, and December 31, 2014 (unaudited), (ii) Consolidated Statements of Income for the three and nine months ended September 30, 2015 and 2014 (unaudited), (iii) Consolidated Statements of Comprehensive Income for the three and nine months ended September 30, 2015 and 2014 (unaudited), (iv) Consolidated Statement of Changes in Stockholders’ Equity and Noncontrolling Interests for the nine months ended September 30, 2015 (unaudited), (v) Consolidated Statements of Cash Flows for the nine months ended September 30, 2015 and 2014 (unaudited), and (vi) Notes to Consolidated Financial Statements (unaudited).
|
|
(*) Incorporated by reference.
107
SIGNATURES
Pursuant to the requirements of the Securities Exchange Act of 1934, the registrant has duly caused this report to be signed on its behalf by the undersigned, thereunto duly authorized, on
November 3, 2015
.
|
|
ALEXANDRIA REAL ESTATE EQUITIES, INC.
|
|
/s/ Joel S. Marcus
|
|
|
Joel S. Marcus
Chairman/Chief Executive Officer
(Principal Executive Officer)
|
|
|
/s/ Dean A. Shigenaga
|
|
|
Dean A. Shigenaga
Chief Financial Officer
(Principal Financial Officer)
|
|
108
TABLE OF CONTENTS
Part I Financial InformationItem 1. Financial Statements (unaudited)Item 2. Management S Discussion and Analysis Of Financial Condition and Results Of OperationsItem 3. Quantitative and Qualitative Disclosures About Market RiskItem 4. Controls and ProceduresPart II Other InformationItem 1A. Risk FactorsItem 6. Exhibits