ALEXANDRIA REAL ESTATE EQUITIES, INC.
10-Ks and 10-Qs
|
|
|
|
|
|
|
|
|
|
|
|
|
|
|
|
|
|
|
|
|
|
|
|
|
|
|
|
|
|
|
|
|
|
|
|
|
|
|
|
|
|
|
|
|
|
|
|
|
|
|
|
|
|
|
|
UNITED STATES
SECURITIES AND EXCHANGE COMMISSION
Washington, D.C. 20549
FORM 10-Q
(Mark One)
☒
QUARTERLY REPORT PURSUANT TO SECTION 13 OR 15(d) OF THE SECURITIES
EXCHANGE ACT OF 1934
For the quarterly period ended
September 30, 2017
OR
☐
TRANSITION REPORT PURSUANT TO SECTION 13 OR 15(d) OF THE SECURITIES
EXCHANGE ACT OF 1934
For the transition period from ____________ to ____________
Commission file number 1-12993
ALEXANDRIA REAL ESTATE EQUITIES, INC.
(Exact name of registrant as specified in its charter)
|
Maryland
|
|
95-4502084
|
|
(State or other jurisdiction of
incorporation or organization)
|
|
(I.R.S. Employer Identification Number)
|
385 East Colorado Boulevard, Suite 299, Pasadena, California 91101
(Address of principal executive offices) (Zip code)
(626) 578-0777
(Registrant’s telephone number, including area code)
N/A
(Former name, former address and former fiscal year, if changed since last report)
Indicate by check mark whether the registrant (1) has filed all reports required to be filed by Section 13 or 15(d) of the Securities Exchange Act of 1934 during the preceding 12 months (or for such shorter period that the registrant was required to file such reports) and (2) has been subject to such filing requirements for the past 90 days. Yes
☒
No
☐
Indicate by check mark whether the registrant has submitted electronically and posted on its corporate Web site, if any, every Interactive Data File required to be submitted and posted pursuant to Rule 405 of Regulation S-T during the preceding 12 months (or for such shorter period that the registrant was required to submit and post such files). Yes
☒
No
☐
Indicate by check mark whether the registrant is a large accelerated filer, an accelerated filer, a non-accelerated filer, or a smaller reporting company. See the definitions of “large accelerated filer,” “accelerated filer,” “smaller reporting company,” and “emerging growth company” in Rule 12b-2 of the Exchange Act.
|
Large accelerated filer
☒
|
Accelerated filer
☐
|
|
Non-accelerated filer
☐
(Do not check if a smaller reporting company)
|
Smaller reporting company
☐
|
|
Emerging growth company
☐
|
|
If an emerging growth company, indicate by check mark if the registrant has elected not to use the extended transition period for complying with any new or revised financial accounting standards provided pursuant to Section 13(a) of the Exchange Act. ☐
Indicate by check mark whether the registrant is a shell company (as defined in Rule 12b-2 of the Exchange Act). Yes
☐
No
☒
As of
October 16, 2017
,
95,717,826
shares of common stock, par value $0.01 per share, were outstanding.
TABLE OF CONTENTS
|
|
|
Page
|
|
|
|
|
|
|
||
|
|
Consolidated Balance Sheets as of September 30, 2017, and December 31, 2016
|
|
|
|
||
|
|
Consolidated Statements of Income for the Three and Nine Months Ended September 30, 2017 and 2016
|
|
|
|
||
|
|
Consolidated Statements of Comprehensive Income for the Three and Nine Months Ended September 30, 2017 and 2016
|
|
|
|
||
|
|
Consolidated Statement of Changes in Stockholders’ Equity and Noncontrolling Interests for the Nine Months Ended September 30, 2017
|
|
|
|
||
|
|
Consolidated Statements of Cash Flows for the Nine Months Ended September 30, 2017 and 2016
|
|
|
|
||
|
|
||
|
|
||
|
|
|
|
|
|
|
|
|
|
|
|
|
|
|
|
i
GLOSSARY
The following abbreviations or acronyms that may be used in this document shall have the adjacent meanings set forth below:
|
ASU
|
Accounting Standards Update
|
|
ATM
|
At the Market
|
|
CIP
|
Construction in Progress
|
|
EPS
|
Earnings per Share
|
|
FASB
|
Financial Accounting Standards Board
|
|
FFO
|
Funds from Operations
|
|
GAAP
|
U.S. Generally Accepted Accounting Principles
|
|
HVAC
|
Heating, Ventilation, and Air Conditioning
|
|
JV
|
Joint Venture
|
|
LEED
®
|
Leadership in Energy and Environmental Design
|
|
LIBOR
|
London Interbank Offered Rate
|
|
NAREIT
|
National Association of Real Estate Investment Trusts
|
|
NAV
|
Net Asset Value
|
|
NYSE
|
New York Stock Exchange
|
|
REIT
|
Real Estate Investment Trust
|
|
RSF
|
Rentable Square Feet/Foot
|
|
SEC
|
Securities and Exchange Commission
|
|
SF
|
Square Feet/Foot
|
|
SoMa
|
South of Market (submarket of the San Francisco market)
|
|
U.S.
|
United States
|
|
VIE
|
Variable Interest Entity
|
ii
Consolidated Balance Sheets
(In thousands)
(Unaudited)
|
September 30, 2017
|
December 31, 2016
|
||||||
|
Assets
|
|||||||
|
Investments in real estate
|
$
|
10,046,521
|
|
$
|
9,077,972
|
|
|
|
Investments in unconsolidated real estate joint ventures
|
33,692
|
|
50,221
|
|
|||
|
Cash and cash equivalents
|
118,562
|
|
125,032
|
|
|||
|
Restricted cash
|
27,713
|
|
16,334
|
|
|||
|
Tenant receivables
|
9,899
|
|
9,744
|
|
|||
|
Deferred rent
|
402,353
|
|
335,974
|
|
|||
|
Deferred leasing costs
|
208,265
|
|
195,937
|
|
|||
|
Investments
|
485,262
|
|
342,477
|
|
|||
|
Other assets
|
213,056
|
|
201,197
|
|
|||
|
Total assets
|
$
|
11,545,323
|
|
$
|
10,354,888
|
|
|
|
Liabilities, Noncontrolling Interests, and Equity
|
|||||||
|
Secured notes payable
|
$
|
1,153,890
|
|
$
|
1,011,292
|
|
|
|
Unsecured senior notes payable
|
2,801,290
|
|
2,378,262
|
|
|||
|
Unsecured senior line of credit
|
314,000
|
|
28,000
|
|
|||
|
Unsecured senior bank term loans
|
547,860
|
|
746,471
|
|
|||
|
Accounts payable, accrued expenses, and tenant security deposits
|
740,070
|
|
731,671
|
|
|||
|
Dividends payable
|
83,402
|
|
76,914
|
|
|||
|
Total liabilities
|
5,640,512
|
|
4,972,610
|
|
|||
|
Commitments and contingencies
|
|
|
|
|
|||
|
Redeemable noncontrolling interests
|
11,418
|
|
11,307
|
|
|||
|
Alexandria Real Estate Equities, Inc.’s stockholders’ equity:
|
|||||||
|
7.00% Series D cumulative convertible preferred stock
|
74,386
|
|
86,914
|
|
|||
|
6.45% Series E cumulative redeemable preferred stock
|
—
|
|
130,000
|
|
|||
|
Common stock
|
943
|
|
877
|
|
|||
|
Additional paid-in capital
|
5,287,777
|
|
4,672,650
|
|
|||
|
Accumulated other comprehensive income
|
43,864
|
|
5,355
|
|
|||
|
Alexandria Real Estate Equities, Inc.’s stockholders’ equity
|
5,406,970
|
|
4,895,796
|
|
|||
|
Noncontrolling interests
|
486,423
|
|
475,175
|
|
|||
|
Total equity
|
5,893,393
|
|
5,370,971
|
|
|||
|
Total liabilities, noncontrolling interests, and equity
|
$
|
11,545,323
|
|
$
|
10,354,888
|
|
|
The accompanying notes are an integral part of these consolidated financial statements.
1
Alexandria Real Estate Equities, Inc.
(In thousands, except per share amounts)
(Unaudited)
|
Three Months Ended September 30,
|
Nine Months Ended September 30,
|
||||||||||||||
|
2017
|
2016
|
2017
|
2016
|
||||||||||||
|
Revenues:
|
|||||||||||||||
|
Rental
|
$
|
216,021
|
|
$
|
166,591
|
|
$
|
635,156
|
|
$
|
486,505
|
|
|||
|
Tenant recoveries
|
67,058
|
|
58,681
|
|
188,874
|
|
165,385
|
|
|||||||
|
Other income
|
2,291
|
|
5,107
|
|
5,276
|
|
20,654
|
|
|||||||
|
Total revenues
|
285,370
|
|
230,379
|
|
829,306
|
|
672,544
|
|
|||||||
|
Expenses:
|
|||||||||||||||
|
Rental operations
|
83,469
|
|
72,002
|
|
237,536
|
|
205,164
|
|
|||||||
|
General and administrative
|
17,636
|
|
15,854
|
|
56,099
|
|
46,426
|
|
|||||||
|
Interest
|
31,031
|
|
25,850
|
|
92,563
|
|
75,730
|
|
|||||||
|
Depreciation and amortization
|
107,788
|
|
77,133
|
|
309,069
|
|
218,168
|
|
|||||||
|
Impairment of real estate
|
—
|
|
8,114
|
|
203
|
|
193,237
|
|
|||||||
|
Loss on early extinguishment of debt
|
—
|
|
3,230
|
|
670
|
|
3,230
|
|
|||||||
|
Total expenses
|
239,924
|
|
202,183
|
|
696,140
|
|
741,955
|
|
|||||||
|
Equity in earnings (losses) of unconsolidated real estate joint ventures
|
14,100
|
|
273
|
|
15,050
|
|
(270
|
)
|
|||||||
|
Gain on sales of real estate – rental properties
|
—
|
|
—
|
|
270
|
|
—
|
|
|||||||
|
Gain on sales of real estate – land parcels
|
—
|
|
90
|
|
111
|
|
90
|
|
|||||||
|
Net income (loss)
|
59,546
|
|
28,559
|
|
148,597
|
|
(69,591
|
)
|
|||||||
|
Net income attributable to noncontrolling interests
|
(5,773
|
)
|
|
(4,084
|
)
|
|
(18,892
|
)
|
|
(11,614
|
)
|
||||
|
Net income (loss) attributable to Alexandria Real Estate Equities, Inc.’s stockholders
|
53,773
|
|
24,475
|
|
129,705
|
|
(81,205
|
)
|
|||||||
|
Dividends on preferred stock
|
(1,302
|
)
|
(5,007
|
)
|
(6,364
|
)
|
(16,388
|
)
|
|||||||
|
Preferred stock redemption charge
|
—
|
|
(13,095
|
)
|
(11,279
|
)
|
(25,614
|
)
|
|||||||
|
Net income attributable to unvested restricted stock awards
|
(1,198
|
)
|
(921
|
)
|
(3,498
|
)
|
(2,807
|
)
|
|||||||
|
Net income (loss) attributable to Alexandria Real Estate Equities, Inc.’s common stockholders
|
$
|
51,273
|
|
$
|
5,452
|
|
$
|
108,564
|
|
$
|
(126,014
|
)
|
|||
|
Net income (loss) per share attributable to Alexandria Real Estate Equities, Inc.’s common stockholders – basic and diluted
|
$
|
0.55
|
|
$
|
0.07
|
|
$
|
1.20
|
|
$
|
(1.69
|
)
|
|||
|
Dividends declared per share of common stock
|
$
|
0.86
|
|
$
|
0.80
|
|
$
|
2.55
|
|
$
|
2.40
|
|
|||
The accompanying notes are an integral part of these consolidated financial statements.
2
Alexandria Real Estate Equities, Inc.
Consolidated Statements of Comprehensive Income
(In thousands)
(Unaudited)
|
Three Months Ended September 30,
|
Nine Months Ended September 30,
|
||||||||||||||
|
2017
|
2016
|
2017
|
2016
|
||||||||||||
|
Net income (loss)
|
$
|
59,546
|
|
$
|
28,559
|
|
$
|
148,597
|
|
$
|
(69,591
|
)
|
|||
|
Other comprehensive income (loss)
|
|||||||||||||||
|
Unrealized gains (losses) on available-for-sale equity securities:
|
|||||||||||||||
|
Unrealized holding gains (losses) arising during the period
|
17,018
|
|
(38,621
|
)
|
23,414
|
|
(70,055
|
)
|
|||||||
|
Reclassification adjustment for (gains) losses included in net income (loss)
|
—
|
|
(8,540
|
)
|
2,482
|
|
(18,627
|
)
|
|||||||
|
Unrealized gains (losses) on available-for-sale equity securities, net
|
17,018
|
|
(47,161
|
)
|
25,896
|
|
(88,682
|
)
|
|||||||
|
Unrealized gains (losses) on interest rate hedge agreements:
|
|||||||||||||||
|
Unrealized interest rate hedge gains (losses) arising during the period
|
145
|
|
2,982
|
|
812
|
|
(7,655
|
)
|
|||||||
|
Reclassification adjustment for amortization of interest expense included in net income (loss)
|
198
|
|
1,702
|
|
1,810
|
|
3,725
|
|
|||||||
|
Unrealized gains (losses) on interest rate hedge agreements, net
|
343
|
|
4,684
|
|
2,622
|
|
(3,930
|
)
|
|||||||
|
Unrealized gains on foreign currency translation:
|
|||||||||||||||
|
Unrealized foreign currency translation gains (losses) arising during the period
|
3,836
|
|
(1,322
|
)
|
7,592
|
|
842
|
|
|||||||
|
Reclassification adjustment for cumulative foreign currency translation losses included in net income (loss) upon sale or liquidation
|
—
|
|
3,779
|
|
2,421
|
|
10,807
|
|
|||||||
|
Unrealized gains on foreign currency translation, net
|
3,836
|
|
2,457
|
|
10,013
|
|
11,649
|
|
|||||||
|
Total other comprehensive income (loss)
|
21,197
|
|
(40,020
|
)
|
38,531
|
|
(80,963
|
)
|
|||||||
|
Comprehensive income (loss)
|
80,743
|
|
(11,461
|
)
|
187,128
|
|
(150,554
|
)
|
|||||||
|
Less: comprehensive income attributable to noncontrolling interests
|
(5,783
|
)
|
(4,081
|
)
|
(18,914
|
)
|
(11,587
|
)
|
|||||||
|
Comprehensive income (loss) attributable to Alexandria Real Estate Equities, Inc.’s common stockholders
|
$
|
74,960
|
|
$
|
(15,542
|
)
|
$
|
168,214
|
|
$
|
(162,141
|
)
|
|||
The accompanying notes are an integral part of these consolidated financial statements.
3
Alexandria Real Estate Equities, Inc.
Consolidated Statement of Changes in Stockholders’ Equity and Noncontrolling Interests
(Dollars in thousands)
(Unaudited)
|
Alexandria Real Estate Equities, Inc.’s Stockholders’ Equity
|
|||||||||||||||||||||||||||||||||||||||
|
7.00% Series D
Cumulative
Convertible
Preferred
Stock
|
6.45% Series E
Cumulative
Redeemable
Preferred
Stock
|
Number of
Common
Shares
|
Common
Stock
|
Additional
Paid-In Capital
|
Retained
Earnings
|
Accumulated Other Comprehensive Income
|
Noncontrolling
Interests
|
Total
Equity
|
Redeemable
Noncontrolling
Interests
|
||||||||||||||||||||||||||||||
|
Balance as of December 31, 2016
|
$
|
86,914
|
|
$
|
130,000
|
|
87,665,880
|
|
$
|
877
|
|
$
|
4,672,650
|
|
$
|
—
|
|
$
|
5,355
|
|
$
|
475,175
|
|
$
|
5,370,971
|
|
$
|
11,307
|
|
||||||||||
|
Net income
|
—
|
|
—
|
|
—
|
|
—
|
|
—
|
|
129,705
|
|
—
|
|
18,139
|
|
147,844
|
|
753
|
|
|||||||||||||||||||
|
Total other comprehensive income
|
—
|
|
—
|
|
—
|
|
—
|
|
—
|
|
—
|
|
38,509
|
|
22
|
|
38,531
|
|
—
|
|
|||||||||||||||||||
|
Distributions to noncontrolling interests
|
—
|
|
—
|
|
—
|
|
—
|
|
—
|
|
—
|
|
—
|
|
(16,790
|
)
|
(16,790
|
)
|
(642
|
)
|
|||||||||||||||||||
|
Contributions from noncontrolling interests
|
—
|
|
—
|
|
—
|
|
—
|
|
—
|
|
—
|
|
—
|
|
9,877
|
|
9,877
|
|
—
|
|
|||||||||||||||||||
|
Issuances of common stock
|
—
|
|
—
|
|
6,249,309
|
|
62
|
|
705,329
|
|
—
|
|
—
|
|
—
|
|
705,391
|
|
—
|
|
|||||||||||||||||||
|
Issuances pursuant to stock plan
|
—
|
|
—
|
|
409,360
|
|
4
|
|
30,638
|
|
—
|
|
—
|
|
—
|
|
30,642
|
|
—
|
|
|||||||||||||||||||
|
Repurchase of 7.00% Series D preferred stock
|
(12,528
|
)
|
—
|
|
—
|
|
—
|
|
391
|
|
(5,797
|
)
|
—
|
|
—
|
|
(17,934
|
)
|
—
|
|
|||||||||||||||||||
|
Redemption of 6.45% Series E preferred stock
|
—
|
|
(130,000
|
)
|
—
|
|
—
|
|
5,132
|
|
(5,482
|
)
|
—
|
|
—
|
|
(130,350
|
)
|
—
|
|
|||||||||||||||||||
|
Dividends declared on common stock
|
—
|
|
—
|
|
—
|
|
—
|
|
—
|
|
(238,425
|
)
|
—
|
|
—
|
|
(238,425
|
)
|
—
|
|
|||||||||||||||||||
|
Dividends declared on preferred stock
|
—
|
|
—
|
|
—
|
|
—
|
|
—
|
|
(6,364
|
)
|
—
|
|
—
|
|
(6,364
|
)
|
—
|
|
|||||||||||||||||||
|
Distributions in excess of earnings
|
—
|
|
—
|
|
—
|
|
—
|
|
(126,363
|
)
|
126,363
|
|
—
|
|
—
|
|
—
|
|
—
|
|
|||||||||||||||||||
|
Balance as of September 30, 2017
|
$
|
74,386
|
|
$
|
—
|
|
94,324,549
|
|
$
|
943
|
|
$
|
5,287,777
|
|
$
|
—
|
|
$
|
43,864
|
|
$
|
486,423
|
|
$
|
5,893,393
|
|
$
|
11,418
|
|
||||||||||
The accompanying notes are an integral part of these consolidated financial statements.
4
|
Alexandria Real Estate Equities, Inc.
(In thousands)
(Unaudited)
|
|||||||
|
Nine Months Ended September 30,
|
|||||||
|
2017
|
2016
|
||||||
|
Operating Activities
|
|||||||
|
Net income (loss)
|
$
|
148,597
|
|
$
|
(69,591
|
)
|
|
|
Adjustments to reconcile net income (loss) to net cash provided by operating activities:
|
|||||||
|
Depreciation and amortization
|
309,069
|
|
218,168
|
|
|||
|
Loss on early extinguishment of debt
|
670
|
|
3,230
|
|
|||
|
Gain on sales of real estate – rental properties
|
(270
|
)
|
—
|
|
|||
|
Impairment of real estate
|
203
|
|
193,237
|
|
|||
|
Gain on sales of real estate – land parcels
|
(111
|
)
|
(90
|
)
|
|||
|
Equity in (earnings) losses of unconsolidated real estate joint ventures
|
(15,050
|
)
|
270
|
|
|||
|
Distributions of earnings from unconsolidated real estate joint ventures
|
249
|
|
286
|
|
|||
|
Amortization of loan fees
|
8,578
|
|
8,792
|
|
|||
|
Amortization of debt premiums
|
(1,873
|
)
|
(117
|
)
|
|||
|
Amortization of acquired below-market leases
|
(14,908
|
)
|
(2,905
|
)
|
|||
|
Deferred rent
|
(74,362
|
)
|
(30,679
|
)
|
|||
|
Stock compensation expense
|
18,649
|
|
19,007
|
|
|||
|
Investment gains
|
(8,425
|
)
|
(28,721
|
)
|
|||
|
Investment losses
|
6,418
|
|
10,670
|
|
|||
|
Changes in operating assets and liabilities:
|
|||||||
|
Restricted cash
|
(912
|
)
|
(278
|
)
|
|||
|
Tenant receivables
|
(224
|
)
|
843
|
|
|||
|
Deferred leasing costs
|
(39,925
|
)
|
(21,621
|
)
|
|||
|
Other assets
|
(10,662
|
)
|
(14,813
|
)
|
|||
|
Accounts payable, accrued expenses, and tenant security deposits
|
30,619
|
|
6,163
|
|
|||
|
Net cash provided by operating activities
|
356,330
|
|
291,851
|
|
|||
|
Investing Activities
|
|||||||
|
Proceeds from sales of real estate
|
4,263
|
|
27,332
|
|
|||
|
Additions to real estate
|
(660,877
|
)
|
(638,568
|
)
|
|||
|
Purchases of real estate
|
(590,884
|
)
|
(18,108
|
)
|
|||
|
Deposits for investing activities
|
4,700
|
|
(54,998
|
)
|
|||
|
Investments in unconsolidated real estate joint ventures
|
(248
|
)
|
(6,924
|
)
|
|||
|
Return of capital from unconsolidated real estate joint ventures
|
38,576
|
|
—
|
|
|||
|
Additions to investments
|
(128,190
|
)
|
(68,384
|
)
|
|||
|
Sales of investments
|
18,896
|
|
35,295
|
|
|||
|
Repayment of notes receivable
|
—
|
|
9,054
|
|
|||
|
Net cash used in investing activities
|
$
|
(1,313,764
|
)
|
$
|
(715,301
|
)
|
|
5
|
Alexandria Real Estate Equities, Inc.
Consolidated Statements of Cash Flows
(In thousands)
(Unaudited)
|
|||||||
|
Nine Months Ended September 30,
|
|||||||
|
2017
|
2016
|
||||||
|
Financing Activities
|
|||||||
|
Borrowings from secured notes payable
|
$
|
145,272
|
|
$
|
215,330
|
|
|
|
Repayments of borrowings from secured notes payable
|
(2,882
|
)
|
(234,096
|
)
|
|||
|
Proceeds from issuance of unsecured senior notes payable
|
424,384
|
|
348,604
|
|
|||
|
Borrowings from unsecured senior line of credit
|
2,634,000
|
|
2,349,000
|
|
|||
|
Repayments of borrowings from unsecured senior line of credit
|
(2,348,000
|
)
|
(2,084,000
|
)
|
|||
|
Repayments of borrowings from unsecured senior bank term loans
|
(200,000
|
)
|
(200,000
|
)
|
|||
|
Change in restricted cash related to financing activities
|
(10,467
|
)
|
7,742
|
|
|||
|
Payment of loan fees
|
(4,343
|
)
|
(16,499
|
)
|
|||
|
Repurchase of 7.00% Series D cumulative convertible preferred stock
|
(17,934
|
)
|
(98,633
|
)
|
|||
|
Redemption of 6.45% Series E cumulative redeemable preferred stock
|
(130,350
|
)
|
—
|
|
|||
|
Proceeds from the issuance of common stock
|
705,391
|
|
367,802
|
|
|||
|
Dividends on common stock
|
(229,814
|
)
|
(177,966
|
)
|
|||
|
Dividends on preferred stock
|
(8,317
|
)
|
(17,487
|
)
|
|||
|
Financing costs paid for sale of noncontrolling interests
|
—
|
|
(8,093
|
)
|
|||
|
Contributions from and sale of noncontrolling interests
|
9,877
|
|
68,621
|
|
|||
|
Distributions to and purchase of noncontrolling interests
|
(17,432
|
)
|
(62,605
|
)
|
|||
|
Net cash provided by financing activities
|
949,385
|
|
457,720
|
|
|||
|
Effect of foreign exchange rate changes on cash and cash equivalents
|
1,579
|
|
(1,440
|
)
|
|||
|
Net (decrease) increase in cash and cash equivalents
|
(6,470
|
)
|
32,830
|
|
|||
|
Cash and cash equivalents as of the beginning of period
|
125,032
|
|
125,098
|
|
|||
|
Cash and cash equivalents as of the end of period
|
$
|
118,562
|
|
$
|
157,928
|
|
|
|
Supplemental Disclosure of Cash Flow Information:
|
|||||||
|
Cash paid during the period for interest, net of interest capitalized
|
$
|
86,232
|
|
$
|
58,820
|
|
|
|
Non-Cash Investing Activities:
|
|||||||
|
Change in accrued construction
|
$
|
(38,767
|
)
|
$
|
23,023
|
|
|
|
Contribution of real estate to an unconsolidated real estate joint venture
|
$
|
6,998
|
|
$
|
—
|
|
|
|
Non-Cash Financing Activities:
|
|||||||
|
Redemption of redeemable noncontrolling interests
|
$
|
—
|
|
$
|
(5,000
|
)
|
|
The accompanying notes are an integral part of these consolidated financial statements.
6
Alexandria Real Estate Equities, Inc.
Notes to Consolidated Financial Statements
(Unaudited)
|
1.
|
Organization and basis of presentation
|
Alexandria Real Estate Equities, Inc. (NYSE:ARE), an S&P 500
®
company, is an urban office REIT uniquely focused on collaborative life science and technology campuses in AAA innovation cluster locations. As used in this quarterly report on Form 10‑Q, references to the “Company,” “Alexandria,” “ARE,” “we,” “us,” and “our” refer to Alexandria Real Estate Equities, Inc. and its consolidated subsidiaries. The accompanying unaudited consolidated financial statements include the accounts of Alexandria Real Estate Equities, Inc. and its consolidated subsidiaries. All significant intercompany balances and transactions have been eliminated.
We have prepared the accompanying interim consolidated financial statements in accordance with GAAP and in conformity with the rules and regulations of the SEC. In our opinion, the interim consolidated financial statements presented herein reflect all adjustments, of a normal recurring nature, that are necessary to fairly present the interim consolidated financial statements. The results of operations for the interim period are not necessarily indicative of the results that may be expected for the year ending
December 31, 2017
. These unaudited consolidated financial statements should be read in conjunction with the consolidated financial statements and the notes thereto included in our annual report on Form 10‑K for the year ended
December 31, 2016
.
|
2.
|
Summary of significant accounting policies
|
Consolidation
On an ongoing basis, as circumstances indicate the need for reconsideration, we evaluate each legal entity that is not wholly owned by us in accordance with the consolidation guidance. Our evaluation considers all of our variable interests, including equity ownership, as well as fees paid to us for our involvement in the management of each partially owned entity. To fall within the scope of the consolidation guidance, an entity must meet both of the following criteria:
|
•
|
The entity has a legal structure that has been established to conduct business activities and to hold assets; such entity can be in the form of a partnership, limited liability company, or corporation, among others; and
|
|
•
|
We have a variable interest in the legal entity – i.e., variable interests that are contractual, such as equity ownership, or other financial interests that change with changes in the fair value of the entity’s net assets.
|
If an entity does not meet both criteria above, we apply other accounting literature, such as the cost or equity method of accounting. If an entity does meet both criteria above, we evaluate such entity for consolidation under either the variable interest model, if the legal entity meets any of the following characteristics to qualify as a VIE, or under the voting model for all other legal entities that are not VIEs.
A legal entity is determined to be a VIE if it has any of the following three characteristics:
|
1)
|
The entity does not have sufficient equity to finance its activities without additional subordinated financial support;
|
|
2)
|
The entity is established with non-substantive voting rights (i.e., where the entity deprives the majority economic interest holder(s) of voting rights); or
|
|
3)
|
The equity holders, as a group, lack the characteristics of a controlling financial interest. Equity holders meet this criterion if they lack any of the following:
|
|
•
|
The power, through voting rights or similar rights, to direct the activities of the entity that most significantly influence the entity’s economic performance, as evidenced by:
|
|
•
|
Substantive participating rights in day-to-day management of the entity’s activities; or
|
|
•
|
Substantive kick-out rights over the party responsible for significant decisions;
|
|
•
|
The obligation to absorb the entity’s expected losses; or
|
|
•
|
The right to receive the entity’s expected residual returns.
|
7
|
2.
|
Summary of significant accounting policies (continued)
|
Once we consider the sufficiency of equity and voting rights of each legal entity, we then evaluate the characteristics of the equity holders’ interests, as a group, to see if they qualify as controlling financial interests. Our real estate joint ventures consist of limited partnerships or limited liability companies. For an entity structured as a limited partnership or a limited liability company, our evaluation of whether the equity holders (equity partners other than us in each of our joint ventures) lack the characteristics of a controlling financial interest includes the evaluation of whether the limited partners or non-managing members (the noncontrolling equity holders) lack both substantive participating rights and substantive kick-out rights, defined as follows:
|
•
|
Participating rights provide the noncontrolling equity holders the ability to direct significant financial and operating decisions made in the ordinary course of business that most significantly influence the entity’s economic performance.
|
|
•
|
Kick-out rights allow the noncontrolling equity holders to remove the general partner or managing member without cause.
|
If we conclude that any of the three characteristics of a VIE are met, including that the equity holders lack the characteristics of a controlling financial interest because they lack both substantive participating rights and substantive kick-out rights, we conclude that the entity is a VIE and evaluate it for consolidation under the variable interest model.
Variable interest model
If an entity is determined to be a VIE, we evaluate whether we are the primary beneficiary. The primary beneficiary analysis is a qualitative analysis based on power and benefits. We consolidate a VIE if we have both power and benefits – that is, (i) we have the power to direct the activities of a VIE that most significantly influence the VIE’s economic performance (power), and (ii) we have the obligation to absorb losses of the VIE that could potentially be significant to the VIE, or the right to receive benefits from the VIE that potentially could be significant to the VIE (benefits). We consolidate VIEs whenever we determine that we are the primary beneficiary. Refer to Note 3 – “Investments in Real Estate” to these unaudited consolidated financial statements for information on specific joint ventures that qualify as VIEs. If we have a variable interest in a VIE but we are not the primary beneficiary, we account for our investment using the equity method of accounting.
Voting model
If a legal entity fails to meet any of the three characteristics of a VIE (due to insufficiency of equity, existence of non-substantive voting rights, or lack of a controlling financial interest), we then evaluate such entity under the voting model. Under the voting model, we consolidate the entity if we determine that we, directly or indirectly, have greater than 50% of the voting shares and that other equity holders do not have substantive participating rights. Refer to Note 4 – “Investments in Unconsolidated Real Estate Joint Ventures” to these unaudited consolidated financial statements for further information on one of our unconsolidated real estate joint ventures that qualifies for evaluation under the voting model.
Use of estimates
The preparation of consolidated financial statements in conformity with GAAP requires us to make estimates and assumptions that affect the reported amounts of assets, liabilities, and equity; the disclosure of contingent assets and liabilities as of the date of the consolidated financial statements; and the amounts of revenues and expenses during the reporting period. Actual results could materially differ from those estimates.
Investments in real estate and properties classified as held for sale
In January 2017, the FASB issued an ASU that clarifies the framework for determining whether an integrated set of assets and activities meets the definition of a business. The revised framework establishes a screen for determining whether an integrated set of assets and activities is a business and narrows the definition of a business, which is expected to result in fewer real estate transactions being accounted for as business combinations. Acquisitions of integrated sets of assets and activities that do not meet the definition of a business are accounted for as asset acquisitions. We early adopted this accounting standard effective October 1, 2016, and since then have evaluated all of our acquisitions under the new framework.
8
|
2.
|
Summary of significant accounting policies (continued)
|
Evaluation of business combination or asset acquisition
We evaluate each acquisition of real estate or in-substance real estate (including equity interests in entities that predominantly hold real estate assets) to determine whether the integrated set of assets and activities acquired meet the definition of a business and need to be accounted as a business combination. If either of the following criteria is met, the integrated set of assets and activities acquired would not qualify as a business:
|
•
|
Substantially all of the fair value of the gross assets acquired is concentrated in either a single identifiable asset or a group of similar identifiable assets; or
|
|
•
|
The integrated set of assets and activities is lacking, at a minimum, an input and a substantive process that together significantly contribute to the ability to create outputs (i.e., revenue generated before and after the transaction).
|
An acquired process is considered substantive if:
|
•
|
The process includes an organized workforce (or includes an acquired contract that provides access to an organized workforce) that is skilled, knowledgeable, and experienced in performing the process;
|
|
•
|
The process cannot be replaced without significant cost, effort, or delay; or
|
|
•
|
The process is considered unique or scarce.
|
Generally, we expect that acquisitions of real estate or in-substance real estate will not meet the revised definition of a business because substantially all of the fair value is concentrated in a single identifiable asset or group of similar identifiable assets (i.e., land, buildings, and related intangible assets) or because the acquisition does not include a substantive process in the form of an acquired workforce or an acquired contract that cannot be replaced without significant cost, effort, or delay. When evaluating acquired service or management contracts, we consider the nature of the services performed, the terms of the contract relative to similar arm’s length contracts, and the availability of comparable vendors in evaluating whether the acquired contract constitutes a substantive process.
Recognition of real estate acquired
For acquisitions of real estate or in-substance real estate that are accounted for as business combinations, we recognize the assets acquired (including the intangible value of acquired above- or below-market leases, acquired in-place leases, tenant relationships, and other intangible assets or liabilities), liabilities assumed, noncontrolling interests, and previously existing ownership interests at fair value as of the acquisition date. Any excess (deficit) of the consideration transferred relative to the fair value of the net assets acquired is accounted for as goodwill (bargain purchase gain). Acquisition costs related to business combinations are expensed as incurred.
Acquisitions of real estate and in-substance real estate that do not meet the definition of a business are accounted for as asset acquisitions. The accounting model for asset acquisitions is similar to the accounting model for business combinations except that the acquisition consideration (including acquisition costs) is allocated to the individual assets acquired and liabilities assumed on a relative fair value basis. As a result, asset acquisitions do not result in the recognition of goodwill or a bargain purchase gain. Additionally, because the accounting model for asset acquisitions is a cost accumulation model, preexisting interests in the acquired assets, if any, are not remeasured to fair value but continue to be accounted for at their historical cost.
The relative fair values used to allocate the cost of an asset acquisition are determined by the same methodologies and assumptions we utilize to determine fair value in a business combination.
If a real estate property is acquired with an in-place lease that contains a bargain fixed-rate renewal option for the period beyond the non-cancelable lease term, we evaluate factors, such as the business conditions in the industry in which the lessee operates, the economic conditions in the area in which the property is located, and the ability of the lessee to sublease its space during the renewal term, in order to determine the likelihood that the lessee will renew. When we determine there is reasonable assurance that such bargain renewal option will be exercised, we consider the option in determining the intangible value of such lease and its related amortization period. The value of tangible assets acquired is based upon our estimation of value on an “as if vacant” basis. The value of acquired in-place leases includes the estimated costs during the hypothetical lease-up period and other costs that would have been incurred in the execution of similar leases under the market conditions at the acquisition date of the acquired in-place lease. We assess the fair value of tangible and intangible assets based on numerous factors, including estimated cash flow projections that utilize appropriate discount and capitalization rates and available market information. Estimates of future cash flows are based on a number of factors, including the historical operating results, known trends, and market/economic conditions, that may affect the property.
9
|
2.
|
Summary of significant accounting policies (continued)
|
The values allocated to buildings and building improvements, land improvements, tenant improvements, and equipment are depreciated on a straight-line basis using the shorter of the term of the respective ground lease and up to
40 years
for buildings and building improvements, an estimated life of up to
20 years
for land improvements, the respective lease term for tenant improvements, and the estimated useful life for equipment. The values of acquired above- and below-market leases are amortized over the terms of the related leases and recognized as either increases (for below-market leases) or decreases (for above-market leases) to rental revenue. The values of acquired above- and below-market ground leases are amortized over the terms of the related ground leases and recognized as either increases (for below-market ground leases) or decreases (for above-market ground leases) to rental operating expense. The values of acquired in-place leases are classified in other assets in the accompanying consolidated balance sheets and amortized over the remaining terms of the related leases.
Capitalized project costs
We capitalize project costs, including pre-construction costs, interest, property taxes, insurance, and other costs directly related and essential to the development, redevelopment, pre-construction, or construction of a project. Capitalization of development, redevelopment, pre-construction, and construction costs is required while activities are ongoing to prepare an asset for its intended use. Fluctuations in our development, redevelopment, pre-construction, and construction activities could result in significant changes to total expenses and net income. Costs incurred after a project is substantially complete and ready for its intended use are expensed as incurred. Should development, redevelopment, pre-construction, or construction activity cease, interest, property taxes, insurance, and certain other costs would no longer be eligible for capitalization and would be expensed as incurred. Expenditures for repairs and maintenance are expensed as incurred.
Real estate sales
A property is classified as held for sale when all of the following criteria for a plan of sale have been met: (i) management, having the authority to approve the action, commits to a plan to sell the property; (ii) the property is available for immediate sale in its present condition, subject only to terms that are usual and customary; (iii) an active program to locate a buyer and other actions required to complete the plan to sell have been initiated; (iv) the sale of the property is probable and is expected to be completed within
one year
; (v) the property is being actively marketed for sale at a price that is reasonable in relation to its current fair value; and (vi) actions necessary to complete the plan of sale indicate that it is unlikely that significant changes to the plan will be made or that the plan will be withdrawn. Depreciation of assets ceases upon designation of a property as held for sale.
If the disposal of a property represents a strategic shift that has (or will have) a major effect on our operations or financial results, such as (i) a major line of business, (ii) a major geographic area, (iii) a major equity method investment, or (iv) other major parts of an entity, then the operations of the property, including any interest expense directly attributable to it, are classified as discontinued operations in our consolidated statements of income, and amounts for all prior periods presented are reclassified from continuing operations to discontinued operations. The disposal of an individual property generally will not represent a strategic shift and, therefore, will typically not meet the criteria for classification as a discontinued operation.
Impairment of long-lived assets
On a quarterly basis, we review current activities and changes in the business conditions of all of our properties prior to and subsequent to the end of each quarter to determine the existence of any triggering events requiring an impairment analysis. If triggering events are identified, we review an estimate of the future undiscounted cash flows for the properties, including, if necessary, a probability-weighted approach if multiple outcomes are under consideration.
10
|
2.
|
Summary of significant accounting policies (continued)
|
Long-lived assets to be held and used, including our rental properties, CIP, land held for development, and intangibles, are individually evaluated for impairment when conditions exist that may indicate that the carrying amount of a long-lived asset may not be recoverable. The carrying amount of a long-lived asset to be held and used is not recoverable if it exceeds the sum of the undiscounted cash flows expected to result from the use and eventual disposition of the asset. Impairment indicators or triggering events for long-lived assets to be held and used, including our rental properties, CIP, land held for development, and intangibles, are assessed by project and include significant fluctuations in estimated net operating income, occupancy changes, significant near-term lease expirations, current and historical operating and/or cash flow losses, construction costs, estimated completion dates, rental rates, and other market factors. We assess the expected undiscounted cash flows based upon numerous factors, including, but not limited to, construction costs, available market information, current and historical operating results, known trends, current market/economic conditions that may affect the property, and our assumptions about the use of the asset, including, if necessary, a probability-weighted approach if multiple outcomes are under consideration. Upon determination that an impairment has occurred, a write-down is recognized to reduce the carrying amount to its estimated fair value. If an impairment loss is not required to be recognized, the recognition of depreciation is adjusted prospectively, as necessary, to reduce the carrying amount of the real estate to its estimated disposition value over the remaining period that the real estate is expected to be held and used. We may adjust depreciation of properties that are expected to be disposed of or redeveloped prior to the end of their useful lives.
We use the held for sale impairment model for our properties classified as held for sale. The held for sale impairment model is different from the held and used impairment model. Under the held for sale impairment model, an impairment loss is recognized if the carrying amount of the long-lived asset classified as held for sale exceeds its fair value less cost to sell. Because of these two different models, it is possible for a long-lived asset previously classified as held and used to require the recognition of an impairment charge upon classification as held for sale.
International operations
In addition to operating properties in the U.S., we have operating properties in Canada and China. The functional currency for our subsidiaries operating in the U.S. is the U.S. dollar. The functional currencies for our foreign subsidiaries are the local currencies in each respective country. The assets and liabilities of our foreign subsidiaries are translated into U.S. dollars at the exchange rate in effect as of the financial statement date. Income statement accounts of our foreign subsidiaries are translated using the weighted-average exchange rate for the periods presented. Gains or losses resulting from the translation are classified in accumulated other comprehensive income as a separate component of total equity.
Whenever a foreign investment meets the criteria for classification as held for sale, we evaluate the recoverability of the investment under the held for sale impairment model. We may recognize an impairment charge if the carrying amount of the investment exceeds its fair value less cost to sell. In determining an investment’s carrying amount, we consider its net book value and any unrealized cumulative foreign currency translation adjustment related to the investment.
The appropriate amounts of foreign exchange rate gains or losses classified in accumulated other comprehensive income will be reclassified to net income only when realized upon the sale of our investment or upon the complete or substantially complete liquidation of our investment.
Investments
We hold equity investments in certain publicly traded companies and investments in certain privately held entities and limited partnerships primarily involved in the life science and technology industries. All of our equity investments in actively traded public companies are considered available-for-sale and are reflected in the accompanying consolidated balance sheets at fair value. Fair value has been determined based upon the closing price as of each balance sheet date, with unrealized gains and losses shown as a separate component of other comprehensive income. The classification of each investment is determined at the time each investment is made, and such determination is reevaluated at each balance sheet date. The cost of each investment sold is determined by the specific identification method, with realized gains or losses classified in other income in the accompanying consolidated statements of income. Investments in privately held entities are generally accounted for under the cost method when our interest in the entity is so minor that we have virtually no influence over the entity’s operating and financial policies. Certain investments in privately held entities require accounting under the equity method unless our interest in the entity is deemed to be so minor that we have virtually no influence over the entity’s operating and financial policies. Under the equity method of accounting, we recognize our investment initially at cost and adjust the carrying amount of the investment to recognize our share of the earnings or losses of the investee subsequent to the date of our investment. Additionally, we generally limit our ownership percentage in the voting stock of each individual entity to less than
10%
.
11
|
2.
|
Summary of significant accounting policies (continued)
|
We periodically assess our investments in available-for-sale equity securities and privately held companies accounted for under the cost method for other-than-temporary impairment. We monitor each of our investments throughout the year for new developments, including operating results, results of clinical trials, capital-raising events, and merger and acquisition activities. Individual investments are evaluated for impairment when changes in conditions may indicate an impairment exists. The factors that we consider in making these assessments include, but are not limited to, market prices, market conditions, available financing, prospects for favorable or unfavorable clinical trial results, new product initiatives, and new collaborative agreements. If an unrealized loss related to an available-for-sale equity security is determined to be other-than-temporary, such unrealized loss is reclassified from other comprehensive income into current earnings. For a cost method investment, if a decline in the fair value of an investment below its carrying value is determined to be other-than-temporary, such investment is written down to its estimated fair value with a charge to current earnings. If there are no identified events or changes in circumstances that might have an adverse effect on our cost method investments, we do not estimate the investment’s fair value. Refer to Note 5 – “Investments” to these unaudited consolidated financial statements for further information.
Recognition of rental income and tenant recoveries
Rental revenue from operating leases is recognized on a straight-line basis over the respective lease terms. We classify amounts currently recognized as rental revenue in our consolidated statements of income, and amounts expected to be received in later years as deferred rent in the accompanying consolidated balance sheets. Amounts received currently but recognized as revenue in future years are classified in accounts payable, accrued expenses, and tenant security deposits in the accompanying consolidated balance sheets. We commence recognition of rental revenue at the date the property is ready for its intended use and the tenant takes possession of or controls the physical use of the property.
Rental revenue from direct financing leases is recognized over the lease term using the effective interest rate method. At lease inception, we record an asset within other assets in our consolidated balance sheets, which represents our net investment in the direct financing lease. This initial net investment is determined by aggregating the total future minimum lease payments attributable to the direct financing lease and the estimated residual value of the property less unearned income. Over the lease term, the investment in the direct financing lease is reduced and rental income is recognized as rental revenue in our consolidated statements of income and produces a constant periodic rate of return on the net investment in the direct financing lease.
Tenant recoveries related to reimbursement of real estate taxes, insurance, utilities, repairs and maintenance, common area expenses, and other operating expenses are recognized as revenue in the period during which the applicable expenses are incurred and the tenant’s obligation to reimburse us arises.
Tenant receivables consist primarily of amounts due for contractual lease payments, reimbursements of common area maintenance expenses, property taxes, and other expenses recoverable from tenants. Tenant receivables are expected to be collected within
one year
. We may maintain an allowance for estimated losses that may result from the inability of our tenants to make payments required under the terms of the lease and for tenant recoveries due. If a tenant fails to make contractual payments beyond any allowance, we may recognize additional bad debt expense in future periods equal to the amount of uncollectible tenant receivables and deferred rent arising from the straight-lining of rent. As of
September 30, 2017
, and December 31,
2016
,
no
allowance for uncollectible tenant receivables and deferred rent was deemed necessary.
Monitoring tenant credit quality
During the term of each lease, we monitor the credit quality of our tenants by (i) monitoring the credit rating of tenants that are rated by a nationally recognized credit rating agency, (ii) reviewing financial statements of the tenants that are publicly available or that are required to be delivered to us pursuant to the applicable lease, (iii) monitoring news reports regarding our tenants and their respective businesses, and (iv) monitoring the timeliness of lease payments. We have a research team consisting of employees who, among them, have doctorate, graduate, and undergraduate degrees in biology, chemistry, industrial biotechnology, and engineering, and experience in the life science and technology industries, as well as in finance. Our research team is responsible for assessing and monitoring the credit quality of our tenants and any material changes in their credit quality.
12
|
2.
|
Summary of significant accounting policies (continued)
|
Income taxes
We are organized and operate as a REIT pursuant to the Internal Revenue Code (the “Code”). Under the Code, a REIT that distributes at least
90%
of its REIT taxable income to its shareholders annually (excluding net capital gains) and meets certain other conditions is not subject to federal income tax on its distributed taxable income, but could be subject to certain federal, foreign, state, and local taxes. We distribute
100%
of our taxable income annually; therefore, a provision for federal income taxes is not required. In addition to our REIT returns, we file federal, foreign, state, and local tax returns for our subsidiaries. We file with jurisdictions located in the U.S., Canada, India, China, and other international locations. Our tax returns are subject to routine examination in various jurisdictions for the 2011–2016 calendar years.
Recent accounting pronouncements
Definition of a business
On October 1, 2016, we adopted an ASU issued by the FASB in January 2017, which clarified the definition of a business. Refer to “Investments in Real Estate and Properties Classified as Held for Sale” above for additional information.
Employee share-based payments
On January 1, 2017, we adopted an ASU issued by the FASB in March 2016, which simplifies several aspects of employee share-based payment accounting, including the accounting for forfeitures. The ASU allows an entity to make an accounting policy election either to continue to estimate the total number of awards that are expected to vest (the method used prior to January 1, 2017) or to account for forfeitures when they occur. This entity-wide accounting policy election only applies to service conditions; for performance conditions, the entity continues to assess the probability that such conditions will be achieved. If an entity elects to account for forfeitures when they occur, all nonforfeitable dividends paid on share-based payment awards are initially charged to retained earnings and reclassified to compensation cost only when forfeitures of the underlying awards occur. We elected to account for forfeitures when they occur and applied this ASU on a modified retrospective basis resulting in a cumulative-effect adjustment aggregating approximately
$368 thousand
, which was recorded as a decrease to retained earnings and an increase to additional paid-in capital upon adoption of the ASU on January 1, 2017.
13
|
2.
|
Summary of significant accounting policies (continued)
|
Recent accounting pronouncements (continued)
Lease accounting, revenue recognition, and financial instruments
In February 2016, the FASB issued an ASU that sets out new lease accounting standards for both lessees and lessors. In May 2014, the FASB issued an ASU that will require a new model for recognition of revenue arising from contracts with customers, as well as recognizing gains and losses from the transfer of nonfinancial assets in contracts with noncustomers. In January 2016, the FASB issued an ASU that amended the accounting for equity investments. These three ASUs will update the current accounting standards for all of our revenues with the exception of revenues subject to other accounting standards as noted in the table below. Our revenues and gains on sales of real estate for the
nine months ended September 30, 2017
, and the related effective date for adoption of new ASUs, consisted of the following (in thousands):
|
Date of ASU Adoption
|
Nine Months Ended September 30, 2017
|
|||||||
|
Revenues subject to the new lease ASU:
|
||||||||
|
Rental revenues
|
1/1/19
|
$
|
604,570
|
|
||||
|
Tenant recoveries
(1)
|
1/1/19
|
188,874
|
|
|||||
|
|
$
|
793,444
|
|
|||||
|
Revenues subject to the new revenue recognition ASU:
|
||||||||
|
Parking and other revenues
|
1/1/18
|
32,323
|
|
|||||
|
Revenues not subject to the new lease or revenue recognition ASUs:
|
||||||||
|
Investment income subject to the new financial instruments ASU
|
1/1/18
|
$
|
2,007
|
|
||||
|
Interest and other income within the scope of other existing accounting standards
|
N/A
|
1,532
|
|
|||||
|
3,539
|
|
|||||||
|
Total revenues
|
$
|
829,306
|
|
|||||
|
Gains on sales of real estate subject to the new revenue recognition ASU
|
1/1/18
|
$
|
381
|
|
||||
|
(1)
|
Includes a portion of tenant recoveries that is subject to the new revenue recognition ASU upon adoption of the new lease ASU on January 1, 2019. See further discussion below.
|
14
|
2.
|
Summary of significant accounting policies (continued)
|
Recent accounting pronouncements (continued)
Lease accounting
In February 2016, the FASB issued an ASU that sets out the principles for the recognition, measurement, presentation, and disclosure of leases for both parties to a lease agreement (i.e., lessees and lessors). The ASU is effective for us no later than January 1, 2019, with early adoption permitted. The ASU requires us to identify lease and nonlease components of a lease agreement. This ASU will govern the recognition of revenue for lease components. Revenue related to nonlease components under our lease agreements will be subject to the new revenue recognition standard effective upon adoption of the new lease accounting standard. We expect to adopt the new lease accounting standard on January 1, 2019.
The lease ASU requires the use of the modified retrospective transition method and does not allow for a full retrospective approach. Under the modified retrospective method, an entity will apply the standard to all leases that exist at, or commence after, the beginning of the earliest comparative period presented in the financial statements, with a cumulative adjustment to the opening balance of retained earnings for the effect of applying the standard at the date of initial application. In addition, an entity may elect a practical expedient package, which allows the following:
|
•
|
An entity need not reassess whether any expired or existing contracts are or contain leases;
|
|
•
|
An entity need not reassess the lease classification for any expired or existing leases; and
|
|
•
|
An entity need not reassess initial direct costs for any existing leases.
|
These three practical expedients are available as a single election that must be elected as a package and must be consistently applied to all existing leases at the date of adoption. The FASB has also tentatively noted in Board meeting minutes of May 2017 that lessors that adopt this package of practical expedients are not expected to reassess expired or existing leases at the date of adoption in order to bifurcate lease and nonlease components under the new lease ASU.
Lessor accounting
We recognized revenue from our lease agreements aggregating
$793.4 million
for the
nine months ended September 30, 2017
. This revenue consisted primarily of rental revenue and tenant recoveries aggregating
$604.6 million
and
$188.9 million
, respectively.
Under current accounting standards, we recognize rental revenue from our operating leases on a straight-line basis over the respective lease terms. We commence recognition of rental revenue at the date the property is ready for its intended use and the tenant takes possession of or controls the physical use of the property. We recognize rental revenue from direct financing leases over the lease term using the effective interest rate method.
Under the new lease ASU, each lease agreement will be evaluated to identify the lease components and nonlease components within each lease agreement. The total consideration in the lease agreement will be allocated to the lease and nonlease components based on their relative standalone selling prices. Lessors will continue to recognize the lease revenue component using an approach that is substantially equivalent to existing guidance for operating leases (straight-line basis) and direct financing leases (effective interest rate method).
Under current accounting standards, tenant recoveries related to payments of real estate taxes, insurance, utilities, repairs and maintenance, common area expenses, and other operating expenses, are considered lease components. We recognize these tenant recoveries as revenue when services are rendered in an amount equal to the related operating expenses incurred that are recoverable under the terms of the applicable lease.
We have not completed our analysis of this ASU but expect that our tenant recoveries will be separated into lease and nonlease components. Tenant recoveries that qualify as lease components, which relate to the right to use the leased asset (e.g., property taxes, insurance), will be accounted for under the new lease ASU. Tenant recoveries that qualify as nonlease components, which relate to payments for goods or services that are transferred separately from the right to use the underlying asset, including tenant recoveries related to payments for maintenance activities and common area expenses, will be accounted for under the new revenue recognition ASU upon adoption of the new lease ASU on January 1, 2019.
15
|
2.
|
Summary of significant accounting policies (continued)
|
Recent accounting pronouncements (continued)
Lease accounting (continued)
Tenant recoveries that are categorized as lease components will generally be variable consideration. Tenant recoveries that are categorized as nonlease components will be recognized at a point in time or over time based on the pattern of transfer of the underlying goods or services to our tenants.
Costs to execute leases
The new ASU will require that lessors capitalize, as initial direct costs, only those costs that are incurred due to the execution of a lease. Under this ASU, allocated payroll costs and other costs such as legal costs incurred as part of the leasing process prior to the execution of a lease will no longer qualify for classification as initial direct costs but will instead be expensed as incurred. During the
nine months ended September 30, 2017
, we capitalized
$18.4 million
of such costs. Under the new ASU, these costs will be expensed as incurred.
Lessee accounting
Under the new lease ASU, lessees are required to apply a dual approach by classifying leases as either finance or operating leases based on the principle of whether the lease is effectively a financed purchase of the leased asset by the lessee. This classification will determine whether the lease expense is recognized based on an effective interest method or on a straight-line basis over the term of the lease. A lessee is also required to recognize a right-of-use asset and a lease liability for all leases with a term of greater than 12 months regardless of their classification. Leases with a term of 12 months or less will be accounted for similar to existing guidance for operating leases.
The ASU requires the recognition of a right-of-use asset and a related liability to account for our future obligations under our ground lease arrangements for which we are the lessee. For the
nine months ended September 30, 2017
, we recognized rent expense, included in rental operations expense, aggregating
$9.4 million
under these ground leases. As of
September 30, 2017
, the remaining contractual payments under our ground lease agreements for which we are the lessee aggregated
$584.0 million
. All of our existing ground leases for which we are the lessee are currently classified as operating leases, and therefore, we will have the option, under the practical expedients provided by the lease ASU, to continue to classify these leases as operating leases upon adoption of the ASU. We are still evaluating the impact to our consolidated financial statements from the initial recognition of each lease liability upon adoption and the pattern of recognition of ground lease expense subsequent to adoption.
16
|
2.
|
Summary of significant accounting policies (continued)
|
Recent accounting pronouncements (continued)
Revenue recognition
In May 2014, the FASB issued an ASU on recognition of revenue arising from contracts with customers, as well as recognizing gains and losses from the transfer of nonfinancial assets in contracts with noncustomers, and subsequently, it issued additional guidance that further clarified the ASU. The revenue recognition ASU has implications for all revenues, excluding those that are under the specific scope of other accounting standards, such as revenue associated with leases (described above) and financial instruments (described below). Our revenues and gains for the
nine months ended September 30, 2017
, which will become subject to the revenue recognition ASU upon adoption on January 1, 2018, were as follows (in thousands):
|
Nine Months Ended September 30, 2017
|
|||
|
Parking and other revenue
|
$
|
32,323
|
|
|
Gain on sales of real estate
|
$
|
381
|
|
The core principle underlying the revenue recognition ASU is that an entity will recognize revenue to represent the transfer of goods and services to customers in an amount that reflects the consideration to which the entity expects to be entitled in such exchange. This will require entities to identify contractual performance obligations and determine whether revenue should be recognized at a point in time or over time, based on when control of goods and services transfers to a customer.
A customer is distinguished from a noncustomer by the nature of the goods or services that are transferred. Customers are provided with goods or services that are generated by a company’s ordinary output activities, whereas noncustomers are provided with nonfinancial assets that are outside of a company’s ordinary output activities. This distinction may not significantly change the pattern of income recognition, but will determine whether that income is classified as revenue (contracts with customers) or other gains/losses (contracts with noncustomers) in our consolidated income statement.
The ASU will require the use of a new five-step model to recognize revenue from customer contracts. The five-step model requires that we (i) identify the contract with the customer, (ii) identify the performance obligations in the contract, (iii) determine the transaction price, including variable consideration to the extent that it is probable that a significant future reversal will not occur, (iv) allocate the transaction price to the performance obligations in the contract, and (v) recognize revenue when (or as) we satisfy the performance obligation.
An entity will also be required to determine if it controls the goods or services prior to the transfer to the customer in order to determine if it should account for the arrangement as a principal or agent. Principal arrangements, where the entity controls the goods or services provided, will result in the recognition of the gross amount of consideration expected in the exchange. Agent arrangements, where the entity simply arranges but doesn’t control the goods or services being transferred to the customer, will result in the recognition of the net amount the entity is entitled to retain in the exchange.
The ASU is effective for us on January 1, 2018. Entities can use either a full retrospective or modified retrospective method to adopt the ASU. Under the full retrospective method, all periods presented will be restated upon adoption to conform to the new standard and a cumulative adjustment for effects on periods prior to 2016 will be recorded to retained earnings as of January 1, 2016. Under the modified retrospective approach, prior periods are not restated to conform to the new standard. Instead, a cumulative adjustment for effects of applying the new standard to periods prior to 2018 is recorded to retained earnings as of January 1, 2018. Additionally, incremental disclosures are required to present the 2018 revenues under the prior standard. Under the modified retrospective method, an entity may also elect to apply the standard to either (i) all contracts as of January 1, 2018, or (ii) only to contracts that are not completed as of January 1, 2018.
We continue to review the impact that the new standard will have on our consolidated financial statements and our disclosures. We continue to implement changes to our accounting policies, business processes, and internal controls to support the new accounting and disclosure requirements. We expect to complete our assessment and implementation by December 31, 2017.
17
|
2.
|
Summary of significant accounting policies (continued)
|
Recent accounting pronouncements (continued)
Revenue recognition (continued)
Revenue within the scope of the new revenue recognition ASU
Parking
Parking and other revenue aggregated
$32.3 million
for the
nine months ended September 30, 2017
. These revenues consist primarily of short term rental revenues that are not considered lease revenue. These revenues will be accounted under the new revenue recognition ASU effective January 1, 2018. Under current accounting standards, we recognize parking when the amounts are fixed or determinable, collectability is reasonably assured, and services have been rendered. Under the new revenue recognition ASU, the recognition of such revenue will occur when the services are provided and the performance obligations are satisfied. These services are normally provided at a point in time, therefore revenue recognition under the new revenue recognition ASU is expected to be similar to the recognition pattern under existing accounting standards.
Sales of real estate
During the
nine months ended September 30, 2017
, we sold real estate for contractual sales prices aggregating
$10.9 million
, which resulted in an aggregate gain of
$381 thousand
. Our ordinary output activities consist of leasing space to our tenants in our operating properties, not the sale of real estate. Therefore, sales of real estate qualify as contracts with non-customers.
The amount and timing of recognition of gain or loss on those sales may differ significantly under the new standards. The current standards focus on whether the seller retains substantial risks or rewards of ownership as a result of its continuing involvement with the sold property.
Under the new standard, which includes guidance on recognition of gains and losses arising from the derecognition of nonfinancial assets in a transaction with noncustomers, the derecognition model is based on the transfer of control. If a real estate sale contract includes ongoing involvement by the seller with the property, the seller must evaluate each promised good or service under the contract to determine whether it represents a separate performance obligation, constitutes a guarantee, or prevents the transfer of control. If a good or service is considered a separate performance obligation, an allocated portion of the transaction price should be recognized as revenue as the entity transfers the related good or service to the buyer.
Under the current standards, a partial sale of real estate in which the seller retains a noncontrolling interest results in the recognition of a gain or loss related to the interest sold.
Under the new standards, a partial sale of real estate in which the seller retains a noncontrolling interest will result in recognition by the seller of a gain or loss as if 100% of the real estate was sold. Conversely, under the new standards, a partial sale of real estate in which the seller retains a controlling interest will result in the seller’s continuing to reflect the asset at its current book value, recording a noncontrolling interest for the book value of the partial interest sold, and recognizing additional paid-in capital for the difference between the consideration received and the partial interest at book value, consistent with the current accounting standards.
Tenant recoveries
As previously noted above in the lease accounting section, certain tenant recoveries may be subject to the new revenue recognition ASU upon our adoption of the lease ASU, no later than January 1, 2019.
Revenue within the scope of guidance other than revenue recognition or lease accounting
Interest and investment income fall outside the scope of the new revenue recognition and lease accounting standards. Investment income is subject to a recently issued accounting pronouncement on financial instruments related to the accounting for equity investments.
18
|
2.
|
Summary of significant accounting policies (continued)
|
Recent accounting pronouncements (continued)
Financial instruments
In January 2016, the FASB issued an ASU that amended the accounting for equity investments (except for debt securities and equity investments accounted for under the equity method of accounting or that result in consolidation) and the presentation and disclosure requirements for financial instruments. The core principle of the amendment involves the measurement of equity investments at fair value and the recognition of changes in fair value of those investments during each period in net income.
As of
September 30, 2017
, our consolidated balance sheet contained the following amounts related to our investments (in thousands):
|
Cost
|
Net Unrealized Gains
|
Total
|
|||||||||
|
Available-for-sale equity securities
|
$
|
55,433
|
|
$
|
45,189
|
|
$
|
100,622
|
|
||
|
Investments accounted for under cost method:
|
|||||||||||
|
Investments in limited partnerships
|
136,044
|
|
N/A
|
|
136,044
|
|
|||||
|
Investments in other privately held entities
|
248,596
|
|
N/A
|
|
248,596
|
|
|||||
|
Total investments
|
$
|
440,073
|
|
$
|
45,189
|
|
$
|
485,262
|
|
||
For the
nine months ended September 30, 2017
, our consolidated statement of income and statement of comprehensive income contained the following amounts related to our investments (in thousands):
|
Nine Months Ended September 30, 2017
|
|||
|
Investment income recognized in net income
|
$
|
2,007
|
|
|
Unrealized gain recognized in other comprehensive income (component of stockholder’s equity)
|
$
|
23,414
|
|
The ASU is effective for us on January 1, 2018. The ASU requires the use of the modified retrospective transition method, under which cumulative unrealized gains and losses related to equity investments with readily determinable fair values will be reclassified from accumulated other comprehensive income to retained earnings on January 1, 2018, upon adoption of this ASU. The guidance related to equity investments without readily determinable fair values, including our investments in limited partnerships and other privately held entities, will be applied prospectively to all investments that exist as of the date of adoption. We expect the adoption of this new ASU to increase the volatility of our earnings due to the recognition of changes in fair value of our equity investments in net income for reporting periods subsequent to December 31, 2017.
The ASU introduces significant changes to current accounting for equity investments, including elimination of (i) the classification of equity investments as trading or available-for-sale, and the related recognition of unrealized holding gains and losses on available-for-sale equity securities in other comprehensive income, (ii) the cost method of accounting for equity securities that do not have readily determinable fair values, and (iii) the consideration of impairments as other-than-temporary, and instead requires recognition of impairments under a single-step model. A readily determinable fair value exists on investments for which sales prices/quotes are available on securities exchanges, or are published and are the basis for current transactions.
Under the new ASU, equity investments in publicly traded securities are required to be measured and reported at fair value, with the changes in fair value recognized through earnings. The year-to-date change in unrealized holding gains on available-for-sale equity securities, aggregating
$23.4 million
for the
nine months ended September 30, 2017
, would have been recognized in net income under this new ASU.
19
|
2.
|
Summary of significant accounting policies (continued)
|
Recent accounting pronouncements (continued)
Financial instruments (continued)
Equity investments without readily determinable fair values, which are currently subject to the cost method of accounting, will be accounted for under two categories, as follows:
|
•
|
Equity investments that qualify for the practical expedient to be measured at net asset value (NAV) in accordance with ASC 820,
Fair Value Measurement
, such as our other privately held investments in limited partnerships, are required to be measured using the reported NAV per share or otherwise valued at fair value using other accepted valuation techniques. The aggregate NAV per share of our investments in limited partnerships exceeds our cost basis by approximately
$71.8 million
as of
September 30, 2017
. Under a proposed ASU issued recently by the FASB, the cumulative difference between NAV and cost basis for these investments is expected to be recognized as a cumulative adjustment to our retained earnings on January 1, 2018. Subsequent changes in NAV per share will be recognized in earnings each reporting period. The year-to-date change in unrealized holding gains on other privately held investments in limited partnerships, aggregating approximately
$16.2 million
for the
nine months ended September 30, 2017
, would have been recognized in net income under this new ASU.
|
|
•
|
Equity investments that do not qualify for the NAV practical expedient, such as our private investments, will be measured at cost less impairments, adjusted for observable price changes that are known or can be reasonably known. An “observable price” is a price observed in an orderly transaction for an identical or similar investment of the same issuer. Investments will be evaluated on the basis of a qualitative assessment for indicators of impairment. If such indicators are present, we are required to estimate the investment’s fair value and recognize an impairment loss equal to the amount by which the investment’s carrying value exceeds its fair value.
|
The new ASU requires additional disclosures. Equity investments that have readily determinable fair values require disclosure of the unrealized gains and losses recognized through earnings during the period that relate to equity securities still held at the reporting date. Equity investments without readily determinable fair values require disclosure of (i) the carrying amount, (ii) the amount of impairments and downward adjustments, if any, both cumulative and annual, (iii) the amount of upward adjustments, if any, both cumulative and annual, and (iv) qualitative information to facilitate an understanding of the quantitative disclosures.
We continue to review the impact that the new standard will have on our consolidated financial statements and our disclosures. We also continue to implement changes to our accounting policies, business processes, and internal controls to support the new accounting and disclosure requirements. We expect to complete our assessment and implementation by December 31, 2017.
Joint venture distributions
In August 2016, the FASB issued an ASU that provides guidance on the classification of cash distributions received from equity method investments, including unconsolidated joint ventures, in the statement of cash flows. The ASU provides two approaches to determine the classification of cash distributions received from equity method investees: (i) the “cumulative earnings” approach, under which distributions up to the amount of cumulative equity in earnings recognized will be classified as cash flows from operating activities, and those in excess of that amount will be classified as cash inflows from investing activities, and (ii) the “nature of the distribution” approach, under which distributions will be classified based on the nature of the underlying activity that generated cash distributions. An entity may elect either the “cumulative earnings” or the “nature of the distribution” approach. An entity that elects the “nature of the distribution” approach but lacks the information to apply it will apply the “cumulative earnings” approach as an accounting change on a retrospective basis. The ASU is effective for reporting periods beginning after December 15, 2017, with early adoption permitted, and will be applied retrospectively (exceptions apply). We will adopt this ASU on January 1, 2018, and expect to use the “nature of the distribution” approach. We currently present distributions from our equity method investees utilizing the “nature of the distribution” approach; therefore, the adoption of this ASU will have no impact on our consolidated financial statements. During the
nine months ended September 30, 2017
, distributions received from our equity method investees totaled
$38.8 million
, consisting of approximately
$249 thousand
classified as a return on investment (cash flows from operating activities) and approximately
$38.6 million
classified as a return of investment (cash flows from investing activities).
20
|
2.
|
Summary of significant accounting policies (continued)
|
Recent accounting pronouncements (continued)
Restricted cash
In November 2016, the FASB issued an ASU that will require companies to include restricted cash with cash and cash equivalents when reconciling the beginning-of-period and end-of-period total amounts shown in the statement of cash flows. The ASU will require disclosure of a reconciliation between the statement of financial position and the statement of cash flows when the statement of financial position includes more than one line item for cash, cash equivalents, restricted cash, and restricted cash equivalents. An entity with material restricted cash and restricted cash equivalents balances will be required to disclose the nature of the restrictions. The ASU is effective for reporting periods beginning after December 15, 2017, with early adoption permitted, and will be applied retrospectively to all periods presented. As of
September 30, 2017
, and December 31,
2016
, we had
$27.7 million
and
$16.3 million
of restricted cash, respectively, on our consolidated balance sheets. Upon adoption of this ASU, restricted cash balances will be included with cash and cash equivalents balances as of the beginning and ending of each period presented in our consolidated statements of cash flows; separate line items reconciling changes in restricted cash balances to the changes in cash and cash equivalents will no longer be presented within the operating, investing, and financing sections of our consolidated statements of cash flows.
Allowance for credit losses
In June 2016, the FASB issued an ASU that changes the impairment model for most financial instruments by requiring companies to recognize an allowance for expected losses, rather than incurred losses as required currently by the other-than-temporary impairment model. The ASU will apply to most financial assets measured at amortized cost and certain other instruments, including trade and other receivables, loans, held-to-maturity debt securities, net investments in leases, and off-balance-sheet credit exposures (e.g., loan commitments). The ASU is effective for reporting periods beginning after December 15, 2019, with early adoption permitted, and will be applied as a cumulative adjustment to retained earnings as of the effective date. We are currently assessing the potential effect the adoption of this ASU will have on our consolidated financial statements.
Hedge accounting
In August 2017, the FASB issued an ASU that simplifies hedge accounting. The purpose of this updated ASU is to better align a company’s financial reporting for hedging activities with the economic objectives of those activities. For cash flow hedges that are highly effective, the new standard requires all changes (effective and ineffective components) in the fair value of the hedging instrument to be recorded in other comprehensive income and to be reclassified into earnings only when the hedged item impacts earnings.
Under existing standards, a quantitative assessment is made on an ongoing basis to determine whether a hedge is highly effective in offsetting changes in cash flows associated with the hedged item. Currently, hedge accounting requires hedge ineffectiveness to be recognized in earnings. Under the new standard, an entity will still be required to perform an initial quantitative test. However, the new standard allows an entity to elect to subsequently perform only a qualitative assessment unless facts and circumstances change.
The ASU is effective for reporting periods beginning after December 15, 2018, with early adoption permitted. For cash flow hedges in existence at the date of adoption, an entity is required to apply a cumulative-effect adjustment for previously recognized ineffectiveness from retained earnings to accumulated other comprehensive income, as of the beginning of the fiscal year when an entity adopts the amendments in this ASU.
We utilize interest rate hedge agreements to hedge a portion of our exposure to variable interest rates primarily associated with borrowings based on LIBOR. As a result, all of our interest rate hedge agreements are designated as cash flow hedges. During the three and nine months ended
September 30, 2017
, and
September 30, 2016
, we did not have any hedge ineffectiveness related to our interest rate hedge agreements. Therefore, we do not believe this ASU would have impacted our operating results for the
nine months ended September 30, 2017
.
21
|
3.
|
Investments in real estate
|
Our consolidated investments in real estate consisted of the following as of
September 30, 2017
, and
December 31, 2016
(in thousands):
|
September 30, 2017
|
December 31, 2016
|
|||||||
|
Land (related to rental properties)
|
$
|
1,206,152
|
|
$
|
1,131,416
|
|
||
|
Buildings and building improvements
|
8,466,889
|
|
7,810,269
|
|
||||
|
Other improvements
|
714,834
|
|
584,565
|
|
||||
|
Rental properties
|
10,387,875
|
|
9,526,250
|
|
||||
|
Development and redevelopment of new Class A properties:
|
||||||||
|
Undergoing construction
|
||||||||
|
Development projects – target delivery in 2017
|
466,047
|
|
809,254
|
|
||||
|
Development projects – target delivery in 2018 and 2019
|
143,038
|
|
—
|
|
||||
|
Redevelopment projects – target delivery in 2018 and 2019
|
59,224
|
|
—
|
|
||||
|
Near-term projects undergoing marketing and pre-construction
|
114,954
|
|
—
|
|
||||
|
Intermediate-term developments projects
|
333,870
|
|
—
|
|
||||
|
Future development projects
|
289,314
|
|
253,551
|
|
||||
|
Gross investments in real estate
|
11,794,322
|
|
10,589,055
|
|
||||
|
Less: accumulated depreciation
|
(1,785,115
|
)
|
(1,546,798
|
)
|
||||
|
Net investments in real estate – North America
|
10,009,207
|
|
9,042,257
|
|
||||
|
Net investments in real estate – Asia
|
37,314
|
|
35,715
|
|
||||
|
Investments in real estate
|
$
|
10,046,521
|
|
$
|
9,077,972
|
|
||
Acquisitions
Our real estate asset acquisitions during the
nine months ended September 30, 2017
, consisted of the following (dollars in thousands):
|
Square Footage
|
|||||||||||||
|
Three Months Ended
|
Operating
|
Redevelopment
|
Future Development
|
Purchase Price
|
|||||||||
|
March 31, 2017
|
232,470
|
|
—
|
|
1,508,890
|
|
$
|
218,500
|
|
||||
|
June 30, 2017
|
272,634
|
|
175,000
|
|
1,030,000
|
|
244,009
|
|
|||||
|
September 30, 2017
|
168,424
|
|
104,212
|
|
280,000
|
|
110,700
|
|
|||||
|
673,528
|
|
279,212
|
|
2,818,890
|
|
$
|
573,209
|
|
|||||
We evaluated each of the transactions detailed below to determine whether the integrated set of assets and activities acquired met the definition of a business. Acquisitions that do not meet the definition of a business are accounted for as asset acquisitions. An integrated set of assets and activities does not qualify as a business if substantially all of the fair value of the gross assets is concentrated in either a single identifiable asset or a group of similar identifiable assets, or if the acquired assets do not include a substantive process.
We evaluated each of the completed acquisitions and determined that substantially all of the fair value related to each acquisition is concentrated in a single identifiable asset or a group of similar identifiable assets, or is a land parcel with no operations. Accordingly, each transaction did not meet the definition of a business and consequently was accounted for as an asset acquisition. In each of these transactions, we allocated the total consideration for each acquisition to the individual assets and liabilities acquired on a relative fair value basis.
22
|
3.
|
Investments in real estate (continued)
|
Cambridge, Greater Boston
325 Binney Street
In March 2017, we acquired land parcels at 325 Binney Street (formerly named 303 Binney Street) in our Cambridge submarket of Greater Boston for a purchase price of
$80.3 million
. The property is located adjacent to our Alexandria Center
®
at One Kendall Square campus and is currently entitled for the development of
163,339
RSF for office or office/laboratory space and
45,626
RSF for residential space.
Route 128, Greater Boston
266 and 275 Second Avenue
In July 2017, we acquired two properties aggregating
203,757
RSF at 266 and 275 Second Avenue in our Route 128 submarket of Greater Boston for a purchase price of
$71.0 million
. The properties consist of
144,584
RSF of office/laboratory space, which is
100%
occupied by multiple tenants. The remaining
59,173
RSF, or
29%
of the total RSF, are currently undergoing conversion from office to office/laboratory space through redevelopment.
Mission Bay/SoMa, San Francisco
1455 and 1515 Third Street
In November 2016, we acquired the remaining 49% interest in our unconsolidated real estate joint venture with Uber Technologies, Inc. (“Uber”) for
$90.1 million
, of which
$56.8 million
is payable in three equal installments upon Uber’s completion of construction milestones. The first installment of
$18.9 million
was paid during the three months ended June 30, 2017.
88 Bluxome Street
In January 2017, we acquired land parcels aggregating
2.6 acres
at 88 Bluxome Street in our Mission Bay/SoMa submarket of San Francisco for a purchase price of
$130.0 million
.
South San Francisco, San Francisco
201 Haskins Way
In September 2017, we acquired a
6.5
-acre future development site located at 201 Haskins Way, located in our South San Francisco submarket of San Francisco for a purchase price of
$33.0 million
. The existing building, aggregating
23,840
RSF, is currently
100%
leased through 2020.
Greater Stanford, San Francisco
960 Industrial Road
In May 2017, we acquired a future ground-up development site at 960 Industrial Road aggregating
11.0 acres
in our Greater Stanford submarket of San Francisco for a purchase price of
$65.0 million
.
825 and 835 Industrial Road
In June 2017, we acquired an
8
-acre future development site located at 825 and 835 Industrial Road in our Greater Stanford submarket of San Francisco for a purchase price of
$85.0 million
. The property is currently entitled for the development of two buildings aggregating
530,000
RSF and a parking structure.
23
|
3.
|
Investments in real estate (continued)
|
1450 Page Mill Road
In June 2017, we acquired a
77,634
RSF recently developed technology office building at 1450 Page Mill Road, subject to a ground lease, located in Stanford Research Park, a collaborative business community that supports innovative companies in their R&D pursuits, in our Greater Stanford submarket of San Francisco for a purchase price of
$85.3 million
. The building is 100% leased to Infosys Limited for
12
years.
Torrey Pines/Sorrento Mesa, San Diego
3050 Callan Road and Vista Wateridge
In March 2017, we acquired land parcels aggregating
13.5 acres
at 3050 Callan Road and Vista Wateridge in our Torrey Pines and Sorrento Mesa submarkets of San Diego, respectively, for an aggregate purchase price of
$8.3 million
.
Rockville, Maryland
9900 Medical Center Drive
In August 2017, we acquired a
45,039
RSF redevelopment property at 9900 Medical Center Drive in our Rockville submarket of Maryland for a purchase price of
$6.7 million
. The building is adjacent to our existing properties at 9800 and 9920 Medical Center Drive.
Research Triangle Park
5 Laboratory Drive
In May 2017, we acquired a
175,000
RSF redevelopment property at 5 Laboratory Drive in our Research Triangle Park market for a purchase price of
$8.8 million
.
Investments in consolidated real estate joint ventures
In June 2016, we completed a sale of a 45% partial interest in 10290 Campus Point Drive to an institutional investor, TIAA Global Asset Management and affiliates (“TIAA”). 10290 Campus Point Drive is a
305,006
RSF office/laboratory building in our University Town Center submarket of San Diego, 100% leased to Eli Lilly and Company. Gross proceeds received from our partner related to this real estate joint venture through
September 30, 2017
were
$92.4 million
, including
$8.1 million
received during the
nine months ended September 30, 2017
,
$15.7 million
received during the three months ended December 31, 2016, and
$68.6 million
received during the nine months ended September 30, 2016. Remaining proceeds from our partner of
$13.9 million
are expected to be received primarily in the fourth quarter of 2017.
In December 2016, we completed a separate joint venture agreement with TIAA to sell a 45% partial interest in 10300 Campus Point Drive in our University Town Center submarket of San Diego, which is a
449,759
RSF building primarily leased to Celgene Corporation and The Regents of the University of California, for a sales price of
$150.0 million
. Gross proceeds received from our partner through
September 30, 2017
, were
$137.3 million
. Remaining proceeds of
$12.7 million
are expected to be received primarily in the fourth quarter of 2017.
We retained controlling interests in each of 10290 Campus Point Drive and 10300 Campus Point Drive following each sale above and, therefore, continue to consolidate both entities. As a result, we accounted for the proceeds from each transaction as equity financings. Each transaction did not qualify as a sale of real estate and did not result in purchase price adjustments to the carrying value of the net assets sold. Accordingly, the carrying amount of our partner’s share of assets and liabilities is reported at historical cost basis.
We own partial interests in the following Class A properties through our real estate joint ventures with TIAA: (i) 30% in 225 Binney Street in our Cambridge submarket of Greater Boston, (ii) 50.1% in 1500 Owens Street in our Mission Bay/SoMa submarket of San Francisco, (iii) 60% in 409 and 499 Illinois Street in our Mission Bay/SoMa submarket of San Francisco, and (iv) 55% in 10290 and 10300 Campus Point Drive in our University Town Center submarket of San Diego.
24
|
3.
|
Investments in real estate (continued)
|
Under each of these real estate joint venture arrangements, we are the managing member and earn a fee for continuing to manage the day-to-day operations of each property.
For each of our joint ventures with TIAA, we evaluated the partially owned legal entity that owns the property under the variable interest model to determine whether each entity met any of the three characteristics of a VIE, which are as follows:
|
1)
|
The entity does not have sufficient equity to finance its activities without additional subordinated financial support.
|
|
•
|
Each joint venture has significant equity at risk to fund its activities as the ventures are primarily capitalized by contributions from the members and could obtain, if necessary, non-recourse commercial financing arrangements on customary terms.
|
|
2)
|
The entity is established with non-substantive voting rights.
|
|
•
|
The voting rights of each joint venture require both members to approve major decisions, which results in voting rights that are disproportionate to the members’ economic interest. However, the activities of each joint venture are conducted on behalf of both members, so the voting rights, while disproportionate, are substantive.
|
|
3)
|
The equity holders, as a group, lack the characteristics of a controlling financial interest, as evidenced by lack of substantive kick-out rights or substantive participating rights.
|
|
•
|
TIAA lacks substantive kick-out rights as it may not remove us as the managing member without cause.
|
|
•
|
TIAA also lacks substantive participating rights as day-to-day control is vested in us as the managing member and the major decisions that require unanimous consent are primarily protective in nature.
|
Based on the analysis detailed in Note 2 – “Summary of Significant Accounting Policies” to our unaudited consolidated financial statements, TIAA, as the non-managing member of each joint venture, lacks the characteristics of a controlling financial interest in each joint venture because it does not have substantive kick-out rights or substantive participating rights. Therefore, each joint venture meets the criteria to be considered a VIE and, accordingly, is evaluated for consolidation under the variable interest model.
After determining that these joint ventures are VIEs, we determined that we are the primary beneficiary of each real estate joint venture as, in our capacity as managing member, we have the power to make decisions that most significantly influence operations and economic performance of the joint ventures. In addition, through our investment in each joint venture, we have the right to receive benefits and participate in losses that can be significant to the VIEs. Based on this evaluation, we concluded that we are the primary beneficiary of each joint venture, and therefore, we consolidate each entity.
The following table aggregates the balance sheet information of our consolidated VIEs as of
September 30, 2017
, and
December 31, 2016
(in thousands):
|
September 30, 2017
|
December 31, 2016
|
|||||||
|
Investments in real estate
|
$
|
979,698
|
|
$
|
993,710
|
|
||
|
Cash and cash equivalents
|
29,665
|
|
27,498
|
|
||||
|
Other assets
|
62,886
|
|
57,166
|
|
||||
|
Total assets
|
$
|
1,072,249
|
|
$
|
1,078,374
|
|
||
|
Secured notes payable
|
$
|
—
|
|
$
|
—
|
|
||
|
Other liabilities
|
46,054
|
|
66,711
|
|
||||
|
Total liabilities
|
46,054
|
|
66,711
|
|
||||
|
Alexandria Real Estate Equities, Inc.’s share of equity
|
541,293
|
|
538,069
|
|
||||
|
Noncontrolling interests’ share of equity
|
484,902
|
|
473,594
|
|
||||
|
Total liabilities and equity
|
$
|
1,072,249
|
|
$
|
1,078,374
|
|
||
25
|
3.
|
Investments in real estate (continued)
|
In determining whether to aggregate the balance sheet information of our consolidated VIEs, we considered the similarity of each VIE, including the primary purpose of these entities to own, manage, operate, and lease real estate properties owned by the VIEs, and the similar nature of our involvement in each VIE as a managing member. Due to the similarity of the characteristics among these VIE’s, we present the balance sheet information of these entities on an aggregated basis.
For each of our consolidated VIEs, none of its assets have restrictions that limit their use to settle specific obligations of the VIE. There are no creditors or other partners of our consolidated VIEs that have recourse to our general credit. Our maximum exposure to all our VIEs is limited to our variable interests in each VIE.
Sale of real estate assets and impairment charges
North America
In January 2017, we completed the sale of a vacant property at 6146 Nancy Ridge Drive located in our Sorrento Mesa submarket of San Diego for a purchase price of
$3.0 million
and recognized a gain of
$270 thousand
.
In June 2017, we recognized an impairment charge of
$203 thousand
on a
20,580
RSF property located in a non-cluster market. We had previously recognized an impairment of
$1.6 million
in December 2016 when management committed to the sale of the property and evaluated this asset under the held for sale impairment model. We completed the sale of this asset in July 2017 for a gross sale price of
$800 thousand
with no gain or loss.
Asia
During the year ended December 31, 2016, we completed sales of real estate investments in Asia in multiple transactions. At the date of closing of each sale, the related cumulative unrealized foreign currency translation loss was reclassified to net income. We calculated a related gain or loss on disposal of each asset using the sales proceeds in comparison to the net book value on the date of sale, costs to sell, and any related cumulative unrealized foreign currency translation adjustments. Prior to completing the sales, upon initial classification as held for sale, we considered the net book value, cost to sell and cumulative unrealized foreign currency translation losses in determining the carrying amount for evaluating each real estate asset for impairment.
On March 31, 2016, we evaluated
two
separate potential transactions to sell land parcels in our India submarket aggregating
28
acres. We determined that these land parcels met the criteria for classification as held for sale as of March 31, 2016, including among others, the following: (i) management’s having the authority committed to sell the real estate, and (ii) the sale was probable within one year. Upon classification as held for sale, we recognized an impairment charge of
$29.0 million
to lower the carrying amount of the real estate to its estimated fair value less cost to sell of approximately
$10.2 million
. In determining the carrying amount for evaluating the real estate for impairment, we considered our net book value, cost to sell, and a
$10.6 million
unrealized cumulative foreign currency translation loss.
During the three months ended June 30, 2016, we sold one of these land parcels totaling
five
acres for a sales price of
$7.5 million
at no gain or loss. During the three months ended September 30, 2016, we sold the second of these land parcels totaling
23
acres for a sales price of
$5.3 million
at no gain or loss. In order to calculate the gain or loss on the sale, we considered our net book value, cost of the sale, and cumulative foreign currency translation loss of
$6.9 million
as of June 30, 2016, and
$3.8 million
as of September 30, 2016, which were each reclassified from accumulated other comprehensive income to net income upon the disposition of each asset.
On April 22, 2016, we decided to monetize our remaining real estate investments located in Asia in order to invest capital into our highly leased value-creation pipeline. We determined that these investments met the criteria for classification as held for sale when we achieved the following, among other criteria: (i) committed to sell all of our real estate investments in Asia, (ii) obtained approval from our Board of Directors, and (iii) determined that the sale of each property/land parcel was probable within one year. During the three months ended June 30, 2016, upon classification as held for sale, we recognized an impairment charge of
$154.1 million
related to our remaining real estate investments located in Asia to lower the carrying costs of the real estate to its estimated fair value less cost to sell. In determining the carrying amount for evaluating the real estate for impairment, we considered our net book value, cost to sell, and a
$40.2 million
cumulative foreign currency translation loss, which was reclassified to net income upon the disposition of the assets. Impairment of real estate recognized during the three months ended June 30, 2016, of
$156.1 million
primarily relates to the impairment charge of
$154.1 million
as described above, as well as an impairment charge of
$2.0 million
related to properties in North America.
26
|
3.
|
Investments in real estate (continued)
|
As of September 30, 2016, we had
eight
operating properties aggregating
1.2 million
RSF and land parcels aggregating
168
acres remaining in Asia, which continued to meet the classification as held for sale. During the three months ended September 30, 2016, we updated our assumptions of fair value for the remaining real estate investments located in Asia, and as a result, we recognized an additional impairment charge of
$7.3 million
.
During the three months ended December 31, 2016, we completed the sale of our remaining real estate investments in India consisting of
six
rental properties aggregating approximately
566,355
RSF and
four
land parcels aggregating approximately
168
acres for an aggregate sales price of
$53.4 million
with no gain or loss. In order to calculate the gain or loss on the sale, we considered our net book value, cost of the sale, and cumulative foreign currency translation loss of
$39.4 million
, which was reclassified from accumulated other comprehensive income to net income upon the disposition of each asset.
As a result of the completion of sales in India, we also liquidated legal entities through which we owned our real estate investments in India and reclassified the remaining cumulative foreign currency translation loss of
$2.4 million
related to the real estate investments in India into earnings during the three months ended March 31, 2017, upon completion of the liquidation.
As of
September 30, 2017
, our remaining real estate investments in Asia consist of
two
operating properties in China aggregating
634,328
RSF currently classified as held for sale. Cumulative unrealized foreign currency translation gains of approximately
$1.1 million
related to these real estate investments will be reclassified from accumulated other comprehensive income to net income upon completion of the sales of these two investments.
The fair value considered in our impairment of each investment was determined based on the following: (i) preliminary nonbinding letters of intent, (ii) significant other observable inputs, including the consideration of certain local government land acquisition programs, and (iii) discounted cash flow analyses.
We evaluated whether our real estate investments in Asia met the criteria for classification as discontinued operations, including, among others, (i) if the properties meet the held for sale criteria, and (ii) if the sale of these assets represents a strategic shift that has or will have a major effect on our operations and financial results. In our assessment, we considered, among other factors, that our total revenue from properties located in Asia was approximately
1.5%
of our total consolidated revenues. At the time of evaluation, we also noted total assets related to our investment in Asia were approximately
2.5%
of our total assets. Consequently, we concluded that the monetization of our real estate investments in Asia did not represent a strategic shift that will have a major effect in our operations and financial results and, therefore, did not meet the criteria for classification as discontinued operations.
Commitments to sell real estate
One of our tenants holds a fixed-price option to purchase from us the property that it currently leases. The purchase option is exercisable no later than
December 29, 2017
. The property subject to this purchase option is one of our older properties and has a net book value of
$6.8 million
as of
September 30, 2017
. The option is exercisable at a purchase price of
$20.8 million
, excluding any customary and ordinary closing costs. As of
September 30, 2017
, the purchase price option had not been exercised.
27
|
4.
|
Investments in unconsolidated real estate joint ventures
|
360 Longwood Avenue
We have a
27.5%
ownership interest in an unconsolidated real estate joint venture that, as of June 30, 2017, owned a building aggregating
413,799
RSF in our Longwood Medical Area submarket of Greater Boston. In July 2017, the unconsolidated real estate joint venture completed the sale of the condominium interest representing
203,090
RSF, or
49%
, of the property, to our anchor tenant, pursuant to a fixed-price purchase option in its original lease agreement executed in 2011. Additionally, the unconsolidated real estate joint venture repaid the existing secured construction loan. Our share of the gain recognized was
$14.1 million
, which is reflected in our equity in earnings of unconsolidated real estate joint ventures in our unaudited consolidated statement of income during the three months ended September 30, 2017.
In August 2017, the unconsolidated real estate joint venture entered into a mortgage loan agreement, secured by the remaining interest in the property, that included the following key terms and amounts outstanding as of
September 30, 2017
(amounts represent 100% at the joint venture level, dollars in thousands):
|
Maturity Date
|
Stated Rate
|
Interest Rate
(1)
|
Debt Balance
(2)
|
Outstanding Principal
|
Remaining Commitments
|
Total
|
|||||||||||||||||||
|
9/1/22
|
(3)
|
3.32
|
%
|
3.62
|
%
|
$
|
94,086
|
|
$
|
95,000
|
|
$
|
—
|
|
$
|
95,000
|
|
||||||||
|
9/1/22
|
(3)
|
L+1.85
|
%
|
N/A
|
|
$
|
—
|
|
$
|
—
|
|
$
|
17,000
|
|
$
|
17,000
|
|
||||||||
|
(1)
|
Represents interest rate including interest expense and amortization of loan fees.
|
|
(2)
|
Represents outstanding principal, net of unamortized deferred financing costs.
|
|
(3)
|
The unconsolidated real estate joint venture has
two
one
-year options to extend the stated maturity date to September 1, 2024, subject to certain conditions. Additionally, the loan commitment balance excludes an earn-out advance provision that allows for incremental borrowings up to
$48.0 million
, subject to certain conditions.
|
During the
nine months ended September 30, 2017
, we received a cash distribution of
$38.8 million
from the joint venture, primarily from the condominium sale and loan refinancing.
We evaluated our ownership interests in the 360 Longwood Avenue joint venture using the consolidation guidance, as described in Note 2 – “Summary of Significant Accounting Policies” to these unaudited consolidated financial statements, to determine whether this entity meets any of the following characteristics of a VIE:
|
1)
|
The entity does not have sufficient equity to finance its activities without additional subordinated financial support.
|
|
•
|
This entity has significant equity and non-recourse financing in place to support operations as of
September 30, 2017
.
|
|
2)
|
The entity is established with non-substantive voting rights.
|
|
•
|
Our
27.5%
ownership interest in 360 Longwood Avenue consists of an interest in a joint venture with a development partner. The joint venture with our development partner holds an interest in the property with an institutional investor. Our development partner was responsible for the day-to-day management of construction and development activities, and we are responsible for the day-to-day administrative operations of components of the property following development completion. At the property level, all major decisions (including the development plan, annual budget, leasing plan, and financing plan) require approval of all three investors. Although voting rights within the structure are disproportionate to the members’ economic interests, the activities of the ventures are conducted on behalf of all members, and therefore, the voting rights, while disproportionate, are substantive.
|
|
3)
|
The equity holders, as a group, lack the characteristics of a controlling financial interest, as evidenced by lack of substantive kick-out rights or substantive participating rights.
|
|
•
|
The non-managing members have significant participating rights, including in the day-to-day management of development activities and the participation in decisions related to the operations of the property.
|
Based on our evaluation above, our 360 Longwood Avenue joint venture does not meet the VIE criteria and does not qualify for evaluation under the variable interest model. Therefore, we evaluated this joint venture under the voting model. Under the voting model, we consolidate the entity if we determine that we, directly or indirectly, have greater than 50% of the voting shares and that noncontrolling equity holders do not have substantive participating rights. Our interest in the 360 Longwood Avenue joint venture is limited to
27.5%
, and since we do not have other contractual rights that give us control of the entity, we account for this joint venture under the equity method of accounting.
28
|
5.
|
Investments
|
We hold equity investments in certain publicly traded companies, privately held entities, and limited partnerships primarily involved in the life science and technology industries. All of our equity investments in actively traded public companies are considered available-for-sale and are reflected in the accompanying unaudited consolidated balance sheets at fair value. Our investments in privately held entities are primarily accounted for under the cost method.
Investments in available-for-sale equity securities with gross unrealized losses as of
September 30, 2017
, had been in a continuous unrealized loss position for less than 12 months. We have the ability and intent to hold these investments for a reasonable period of time sufficient for the recovery of our investment. We believe that these unrealized losses are temporary. Accordingly, there are no other-than-temporary impairments in accumulated other comprehensive income related to available-for-sale equity securities as of
September 30, 2017
, and
December 31, 2016
.
The following table summarizes our investments as of
September 30, 2017
, and
December 31, 2016
(in thousands):
|
September 30, 2017
|
December 31, 2016
|
||||||
|
Available-for-sale equity securities, cost basis
|
$
|
55,433
|
|
$
|
41,392
|
|
|
|
Unrealized gains
|
50,104
|
|
25,076
|
|
|||
|
Unrealized losses
|
(4,915
|
)
|
(5,783
|
)
|
|||
|
Available-for-sale equity securities, at fair value
|
100,622
|
|
60,685
|
|
|||
|
Investments accounted for under cost method
|
384,640
|
|
281,792
|
|
|||
|
Total investments
|
$
|
485,262
|
|
$
|
342,477
|
|
|
The table below outlines the components of our investment income classified within other income in the accompanying unaudited consolidated statements of income (in thousands):
|
Three Months Ended September 30,
|
Nine Months Ended September 30,
|
||||||||||||||
|
2017
|
2016
|
2017
|
2016
|
||||||||||||
|
Investment gains
|
$
|
2,644
|
|
$
|
8,115
|
|
$
|
8,425
|
|
$
|
28,721
|
|
|||
|
Investment losses
|
(1,599
|
)
|
(3,849
|
)
|
(6,418
|
)
|
(10,670
|
)
|
|||||||
|
Investment income
|
$
|
1,045
|
|
$
|
4,266
|
|
$
|
2,007
|
|
$
|
18,051
|
|
|||
Investment losses include impairments of approximately
$4.5 million
related to two investments for the
nine months ended September 30, 2017
and
$3.1 million
related to one investment for the three and
nine months ended September 30, 2016
. We reclassified
$0.0 million
,
$(2.5) million
,
$8.5 million
, and
$18.6 million
of previously recorded unrealized gains/(losses) from accumulated other comprehensive income to net income for the three and
nine months ended September 30, 2017
and
September 30, 2016
, respectively, in conjunction with our dispositions of and impairment losses realized from available-for-sale securities.
29
|
6.
|
Other assets
|
The following table summarizes the components of other assets as of
September 30, 2017
, and
December 31, 2016
(in thousands):
|
September 30, 2017
|
December 31, 2016
|
||||||
|
Acquired below-market ground leases
|
$
|
12,741
|
|
$
|
12,913
|
|
|
|
Acquired in-place leases
|
66,188
|
|
63,408
|
|
|||
|
Deferred compensation plan
|
14,832
|
|
11,632
|
|
|||
|
Deferred financing costs
–
$1.65 billion unsecured senior line of credit
|
11,453
|
|
14,239
|
|
|||
|
Deposits
|
3,592
|
|
3,302
|
|
|||
|
Furniture, fixtures, and equipment
|
11,443
|
|
12,839
|
|
|||
|
Interest rate hedge assets
|
3,733
|
|
4,115
|
|
|||
|
Net investment in direct financing lease
|
38,057
|
|
37,297
|
|
|||
|
Notes receivable
|
635
|
|
694
|
|
|||
|
Prepaid expenses
|
11,329
|
|
9,724
|
|
|||
|
Property, plant, and equipment
|
27,263
|
|
19,891
|
|
|||
|
Other assets
|
11,790
|
|
11,143
|
|
|||
|
Total
|
$
|
213,056
|
|
$
|
201,197
|
|
|
The components of our net investment in direct financing lease as of
September 30, 2017
, and
December 31, 2016
, are summarized in the table below (in thousands):
|
September 30, 2017
|
December 31, 2016
|
|||||||
|
Gross investment in direct financing lease
|
$
|
263,980
|
|
$
|
264,954
|
|
||
|
Less: unearned income
|
(225,923
|
)
|
(227,657
|
)
|
||||
|
Net investment in direct financing lease
|
$
|
38,057
|
|
$
|
37,297
|
|
||
Future minimum lease payments to be received under our direct financing lease as of
September 30, 2017
, were as follows (in thousands):
|
Year
|
Total
|
|||
|
2017
|
$
|
261
|
|
|
|
2018
|
1,607
|
|
||
|
2019
|
1,655
|
|
||
|
2020
|
1,705
|
|
||
|
2021
|
1,756
|
|
||
|
Thereafter
|
256,996
|
|
||
|
Total
|
$
|
263,980
|
|
|
30
|
7.
|
Fair value measurements (continued)
|
|
7.
|
Fair value measurements
|
We provide fair value information about all financial instruments, whether or not recognized in the balance sheet, for which it is practicable to estimate fair value. We measure and disclose the estimated fair value of financial assets and liabilities utilizing a fair value hierarchy that distinguishes between data obtained from sources independent of the reporting entity and the reporting entity’s own assumptions about market participant assumptions. This hierarchy consists of three broad levels, as follows: (i) quoted prices in active markets for identical assets or liabilities, (ii) significant other observable inputs, and (iii) significant unobservable inputs. Significant other observable inputs can include quoted prices for similar assets or liabilities in active markets, as well as inputs that are observable for the asset or liability, such as interest rates, foreign exchange rates, and yield curves that are observable at commonly quoted intervals. Significant unobservable inputs are typically based on an entity’s own assumptions, since there is little, if any, related market activity. In instances in which the determination of the fair value measurement is based on inputs from different levels of the fair value hierarchy, the level in the fair value hierarchy within which the entire fair value measurement falls is based on the lowest level of input that is significant to the fair value measurement in its entirety. Our assessment of the significance of a particular input to the fair value measurement in its entirety requires judgment and considers factors specific to the asset or liability. There were
no
transfers between the levels in the fair value hierarchy during the
nine months ended September 30, 2017
and
2016
.
The following tables set forth the assets and liabilities that we measure at fair value on a recurring basis by level within the fair value hierarchy as of
September 30, 2017
, and
December 31, 2016
(in thousands):
|
September 30, 2017
|
||||||||||||||||
|
Description
|
Total
|
Quoted Prices in
Active Markets
for Identical
Assets
|
Significant
Other
Observable
Inputs
|
Significant
Unobservable
Inputs
|
||||||||||||
|
Assets:
|
||||||||||||||||
|
Available-for-sale equity securities
|
$
|
100,622
|
|
$
|
100,622
|
|
$
|
—
|
|
$
|
—
|
|
||||
|
Interest rate hedge agreements
|
$
|
3,733
|
|
$
|
—
|
|
$
|
3,733
|
|
$
|
—
|
|
||||
|
Liabilities:
|
||||||||||||||||
|
Interest rate hedge agreements
|
$
|
583
|
|
$
|
—
|
|
$
|
583
|
|
$
|
—
|
|
||||
|
December 31, 2016
|
||||||||||||||||
|
Description
|
Total
|
Quoted Prices in
Active Markets
for Identical
Assets
|
Significant
Other
Observable
Inputs
|
Significant
Unobservable
Inputs
|
||||||||||||
|
Assets:
|
||||||||||||||||
|
Available-for-sale equity securities
|
$
|
60,685
|
|
$
|
60,685
|
|
$
|
—
|
|
$
|
—
|
|
||||
|
Interest rate hedge agreements
|
$
|
4,115
|
|
$
|
—
|
|
$
|
4,115
|
|
$
|
—
|
|
||||
|
Liabilities:
|
||||||||||||||||
|
Interest rate hedge agreements
|
$
|
3,587
|
|
$
|
—
|
|
$
|
3,587
|
|
$
|
—
|
|
||||
The carrying values of cash and cash equivalents, restricted cash, tenant receivables, other assets, accounts payable, accrued expenses, and tenant security deposits approximate fair value. Our available-for-sale equity securities and our interest rate hedge agreements have been recognized at fair value. Refer to Note 5 – “Investments” and Note 9 – “Interest Rate Hedge Agreements” to these unaudited consolidated financial statements for further details. The fair values of our secured notes payable, unsecured senior notes payable, $1.65 billion unsecured senior line of credit, and unsecured senior bank term loans were estimated using widely accepted valuation techniques, including discounted cash flow analyses using significant other observable inputs such as available market information on discount and borrowing rates with similar terms, maturities, and credit ratings. Because the valuations of our financial instruments are based on these types of estimates, the actual fair value of our financial instruments may differ materially if our estimates do not prove to be accurate. Additionally, the use of different market assumptions or estimation methods may have a material effect on the estimated fair value amounts.
31
|
7.
|
Fair value measurements (continued)
|
As of
September 30, 2017
, and
December 31, 2016
, the book and estimated fair values of our available-for-sale equity securities, interest rate hedge agreements, secured notes payable, unsecured senior notes payable, unsecured senior line of credit, and unsecured senior bank term loans were as follows (in thousands):
|
|
September 30, 2017
|
|
December 31, 2016
|
||||||||||||
|
|
Book Value
|
|
Fair Value
|
|
Book Value
|
|
Fair Value
|
||||||||
|
Assets:
|
|
|
|
|
|
|
|
|
|
|
|
||||
|
Available-for-sale equity securities
|
$
|
100,622
|
|
|
$
|
100,622
|
|
|
$
|
60,685
|
|
|
$
|
60,685
|
|
|
Interest rate hedge agreements
|
$
|
3,733
|
|
|
$
|
3,733
|
|
|
$
|
4,115
|
|
|
$
|
4,115
|
|
|
|
|
|
|
|
|
|
|
|
|
|
|
||||
|
Liabilities:
|
|
|
|
|
|
|
|
|
|
|
|
||||
|
Interest rate hedge agreements
|
$
|
583
|
|
|
$
|
583
|
|
|
$
|
3,587
|
|
|
$
|
3,587
|
|
|
Secured notes payable
|
$
|
1,153,890
|
|
$
|
1,156,769
|
|
$
|
1,011,292
|
|
$
|
1,016,782
|
|
|||
|
Unsecured senior notes payable
|
$
|
2,801,290
|
|
$
|
2,943,568
|
|
$
|
2,378,262
|
|
$
|
2,431,470
|
|
|||
|
Unsecured senior line of credit
|
$
|
314,000
|
|
$
|
313,993
|
|
$
|
28,000
|
|
$
|
27,998
|
|
|||
|
Unsecured senior bank term loans
|
$
|
547,860
|
|
$
|
550,371
|
|
$
|
746,471
|
|
$
|
750,422
|
|
|||
Nonrecurring fair value measurements
Refer to “Sale of Real Estate Assets and Impairment Charges” in Note 3 – “Investments in Real Estate,” Note 5 – “Investments,” and Note 14 – “Assets Classified as Held for Sale” to these unaudited consolidated financial statements for further discussion.
|
8.
|
|
The following table summarizes our secured and unsecured senior debt as of
September 30, 2017
(dollars in thousands):
|
Fixed-Rate/Hedged
Variable-Rate Debt
|
Unhedged
Variable-Rate Debt
|
Weighted-Average
|
|||||||||||||||||
|
Interest
|
Remaining Term
(in years)
|
||||||||||||||||||
|
Total
|
Percentage
|
Rate
(1)
|
|||||||||||||||||
|
Secured notes payable
|
$
|
902,207
|
|
$
|
251,683
|
|
$
|
1,153,890
|
|
24.0
|
%
|
3.80
|
%
|
2.8
|
|||||
|
Unsecured senior notes payable
|
2,801,290
|
|
—
|
|
2,801,290
|
|
58.2
|
|
4.16
|
|
7.0
|
||||||||
|
$1.65 billion unsecured senior line of credit
|
—
|
|
314,000
|
|
314,000
|
|
6.5
|
|
2.00
|
|
4.1
|
||||||||
|
2019 Unsecured Senior Bank Term Loan
|
199,543
|
|
—
|
|
199,543
|
|
4.1
|
|
2.84
|
|
1.3
|
||||||||
|
2021 Unsecured Senior Bank Term Loan
|
348,317
|
|
—
|
|
348,317
|
|
7.2
|
|
2.56
|
|
3.3
|
||||||||
|
Total/weighted average
|
$
|
4,251,357
|
|
$
|
565,683
|
|
$
|
4,817,040
|
|
100.0
|
%
|
3.76
|
%
|
5.3
|
|||||
|
Percentage of total debt
|
88
|
%
|
12
|
%
|
100
|
%
|
|||||||||||||
|
(1)
|
Represents the weighted-average interest rate as of the end of the applicable period, including expense/income related to our interest rate hedge agreements, amortization of loan fees, amortization of debt premiums (discounts), and other bank fees.
|
32
|
8.
|
Secured and unsecured senior debt (continued)
|
The following table summarizes our outstanding indebtedness as of
September 30, 2017
(dollars in thousands):
|
Stated
Rate
|
Interest Rate
(1)
|
Maturity
|
Unamortized (Deferred Financing Cost), (Discount)/Premium
|
||||||||||||||||||
|
Debt
|
Date
(2)
|
Principal
|
Total
|
||||||||||||||||||
|
Secured notes payable
|
|||||||||||||||||||||
|
Greater Boston
|
L+1.35
|
%
|
2.99
|
%
|
8/23/18
|
$
|
211,940
|
|
$
|
(660
|
)
|
$
|
211,280
|
|
|||||||
|
Greater Boston
|
L+1.50
|
%
|
3.09
|
|
1/28/19
|
(3)
|
317,979
|
|
(1,595
|
)
|
316,384
|
|
|||||||||
|
Greater Boston
|
L+2.00
|
%
|
3.89
|
|
4/20/19
|
(3)
|
179,764
|
|
(2,104
|
)
|
177,660
|
|
|||||||||
|
Greater Boston, Seattle, and Maryland
|
7.75
|
%
|
8.17
|
|
4/1/20
|
108,940
|
|
(835
|
)
|
108,105
|
|
||||||||||
|
San Diego
|
4.66
|
%
|
5.03
|
|
1/1/23
|
35,370
|
|
(345
|
)
|
35,025
|
|
||||||||||
|
Greater Boston
|
3.93
|
%
|
3.20
|
|
3/10/23
|
82,000
|
|
2,957
|
|
84,957
|
|
||||||||||
|
Greater Boston
|
4.82
|
%
|
3.40
|
|
2/6/24
|
203,000
|
|
16,706
|
|
219,706
|
|
||||||||||
|
San Francisco
|
6.50
|
%
|
6.78
|
|
7/1/36
|
773
|
|
—
|
|
773
|
|
||||||||||
|
Secured debt weighted-average interest rate/subtotal
|
3.80
|
%
|
3.80
|
|
1,139,766
|
|
14,124
|
|
1,153,890
|
|
|||||||||||
|
2019 Unsecured Senior Bank Term Loan
|
L+1.20
|
%
|
2.84
|
|
1/3/19
|
200,000
|
|
(457
|
)
|
199,543
|
|
||||||||||
|
2021 Unsecured Senior Bank Term Loan
|
L+1.10
|
%
|
2.56
|
|
1/15/21
|
350,000
|
|
(1,683
|
)
|
348,317
|
|
||||||||||
|
$1.65 billion unsecured senior line of credit
|
L+1.00
|
%
|
2.00
|
|
10/29/21
|
314,000
|
|
N/A
|
|
314,000
|
|
||||||||||
|
Unsecured senior notes payable
|
2.75
|
%
|
2.96
|
|
1/15/20
|
400,000
|
|
(1,822
|
)
|
398,178
|
|
||||||||||
|
Unsecured senior notes payable
|
4.60
|
%
|
4.75
|
|
4/1/22
|
550,000
|
|
(2,922
|
)
|
547,078
|
|
||||||||||
|
Unsecured senior notes payable
|
3.90
|
%
|
4.04
|
|
6/15/23
|
500,000
|
|
(3,381
|
)
|
496,619
|
|
||||||||||
|
Unsecured senior notes payable
|
4.30
|
%
|
4.52
|
|
1/15/26
|
300,000
|
|
(3,998
|
)
|
296,002
|
|
||||||||||
|
Unsecured senior notes payable
|
3.95
|
%
|
4.14
|
|
1/15/27
|
350,000
|
|
(4,638
|
)
|
345,362
|
|
||||||||||
|
Unsecured senior notes payable
|
3.95
|
%
|
4.09
|
|
1/15/28
|
425,000
|
|
(4,334
|
)
|
420,666
|
|
||||||||||
|
Unsecured senior notes payable
|
4.50
|
%
|
4.62
|
|
7/30/29
|
300,000
|
|
(2,615
|
)
|
297,385
|
|
||||||||||
|
Unsecured debt weighted average/subtotal
|
3.75
|
|
3,689,000
|
|
(25,850
|
)
|
3,663,150
|
|
|||||||||||||
|
Weighted-average interest rate/total
|
3.76
|
%
|
$
|
4,828,766
|
|
$
|
(11,726
|
)
|
$
|
4,817,040
|
|
||||||||||
|
(1)
|
Represents the weighted-average interest rate as of the end of the applicable period, including expense/income related to our interest rate hedge agreements, amortization of loan fees, amortization of debt premiums (discounts), and other bank fees.
|
|
(2)
|
Reflects any extension options that we control.
|
|
(3)
|
Refer to “Secured Construction Loans” below for options to extend maturity dates.
|
3.95% Unsecured senior notes payable due in 2028
In March 2017, we completed a
$425.0 million
public offering of our unsecured senior notes payable due on
January 15, 2028
, at a stated interest rate of
3.95%
. The unsecured senior notes payable were priced at
99.855%
of the principal amount with a yield to maturity of
3.967%
. The unsecured senior notes payable are unsecured obligations of the Company and are fully and unconditionally guaranteed by Alexandria Real Estate Equities, L.P., a 100% owned subsidiary of the Company. The unsecured senior notes payable rank equally in right of payment with all other unsecured senior indebtedness. However, the unsecured senior notes payable are subordinate to existing and future mortgages and other secured indebtedness (to the extent of the value of the collateral securing such indebtedness) and to all existing and future preferred equity and liabilities, whether secured or unsecured, of the Company’s subsidiaries, other than Alexandria Real Estate Equities, L.P. We used the net proceeds, after discounts and issuance costs, of
$420.5 million
to repay outstanding borrowings under our $1.65 billion unsecured senior line of credit.
Repayment of unsecured senior bank term loans
During the three months ended March 31, 2017, we completed a partial principal repayment of
$200 million
of our 2019 Unsecured Senior Bank Term Loan, reducing the total outstanding balance from
$400 million
to
$200 million
, and recognized a loss of
$670 thousand
related to the write-off of unamortized loan fees.
Amendment of unsecured senior line of credit and unsecured senior bank term loans
On July 29, 2016, we amended our unsecured senior line of credit and completed a partial principal repayment of
$200 million
of our 2019 Unsecured Senior Bank Term Loan reducing the total outstanding balance from
$600 million
to
$400 million
, and recognized an aggregate loss on early extinguishment of debt of
$3.2 million
related to the write-off of unamortized loan fees.
33
|
8.
|
Secured and unsecured senior debt (continued)
|
Secured construction loans
The following table summarizes our secured construction loans as of
September 30, 2017
(dollars in thousands):
|
Property/Market
|
Stated Rate
|
Maturity Date
|
Outstanding Principal Balance
|
Remaining Commitments
|
Aggregate Commitments
|
||||||||||||||||
|
75/125 Binney Street/Greater Boston
|
L+1.35
|
%
|
8/23/18
|
$
|
211,940
|
|
$
|
—
|
|
$
|
211,940
|
|
|||||||||
|
50 and 60 Binney Street/Greater Boston
|
L+1.50
|
%
|
1/28/19
|
(1)
|
317,979
|
|
32,021
|
|
350,000
|
|
|||||||||||
|
100 Binney Street/Greater Boston
|
L+2.00
|
%
|
(2)
|
4/20/19
|
(3)
|
179,764
|
|
124,517
|
|
304,281
|
|
||||||||||
|
$
|
709,683
|
|
$
|
156,538
|
|
$
|
866,221
|
|
|||||||||||||
|
(1)
|
We have
two
one
-year options to extend the stated maturity date to January 28, 2021, subject to certain conditions.
|
|
(2)
|
Refer to the interest rate cap agreements in Note 9 – “Interest Rate Hedge Agreements.”
|
|
(3)
|
We have
two
one
-year options to extend the stated maturity date to April 20, 2021, subject to certain conditions.
|
Interest expense
The following table summarizes interest expense for the
three and nine months ended September 30, 2017
and
2016
(in thousands):
|
Three Months Ended September 30,
|
Nine Months Ended September 30,
|
||||||||||||||
|
2017
|
2016
|
2017
|
2016
|
||||||||||||
|
Gross interest
|
$
|
48,123
|
|
$
|
40,753
|
|
$
|
137,888
|
|
$
|
116,520
|
|
|||
|
Capitalized interest
|
(17,092
|
)
|
(14,903
|
)
|
(45,325
|
)
|
(40,790
|
)
|
|||||||
|
Interest expense
|
$
|
31,031
|
|
$
|
25,850
|
|
$
|
92,563
|
|
$
|
75,730
|
|
|||
34
|
9.
|
Interest rate hedge agreements
|
We use interest rate derivatives to hedge the variable cash flows associated with certain of our existing LIBOR-based variable-rate debt, including our $1.65 billion unsecured senior line of credit, unsecured senior bank term loans, and secured notes payable, and to manage our exposure to interest rate volatility. Our derivative instruments include interest rate swaps and interest rate caps.
In our interest rate hedge agreements, the ineffective portion of the change in fair value is required to be recognized directly in earnings. During the
nine months ended September 30, 2017
and
2016
, our interest rate hedge agreements were
100%
effective; as a result,
no
hedge ineffectiveness was recognized in earnings. Changes in fair value, including accrued interest and adjustments for non-performance risk, on the effective portion of our interest rate hedge agreements that are designated and that qualify as cash flow hedges are classified in accumulated other comprehensive income. Amounts classified in accumulated other comprehensive income are subsequently reclassified into earnings in the period during which the hedged transactions affect earnings. During the next 12 months, we expect to reclassify approximately
$1.4 million
in accumulated other comprehensive income to earnings as a decrease of interest expense. As of
September 30, 2017
, and
December 31, 2016
, the fair values of our interest rate swap and cap agreements aggregating an asset balance were classified in other assets, and the fair value of our interest rate swap agreements aggregating a liability balance were classified in accounts payable, accrued expenses, and tenant security deposits, based upon their respective fair values, without any offsetting pursuant to master netting agreements. Refer to Note 7 – “Fair Value Measurements” to these unaudited consolidated financial statements for further details. Under our interest rate hedge agreements, we have
no
collateral posting requirements.
We have agreements with certain of our derivative counterparties that contain a provision wherein we could be declared in default on our derivative obligations (i) if repayment of the underlying indebtedness is accelerated by the lender due to our default on the indebtedness or (ii) if we default on any of its indebtedness, including default where repayment of the indebtedness has not been accelerated by the lender. If we had breached any of these provisions as of
September 30, 2017
, we could have been required to settle our obligations under the agreements at their termination value of
$352 thousand
.
We had the following outstanding interest rate hedge agreements that were designated as cash flow hedges of interest rate risk as of
September 30, 2017
(dollars in thousands):
|
Interest Rate Hedge Type
|
Number of Contracts
|
Weighted-Average Interest Pay/
Cap Rate
(1)
|
Fair Value
as of 9/30/17
|
Notional Amount in Effect as of
|
||||||||||||||||||||||||
|
Effective Date
|
Maturity Date
|
9/30/17
|
12/31/17
|
12/31/18
|
12/31/19
|
|||||||||||||||||||||||
|
Swap
|
March 31, 2017
|
March 31, 2018
|
4
|
0.78%
|
$
|
692
|
|
$
|
250,000
|
|
$
|
250,000
|
|
$
|
—
|
|
$
|
—
|
|
|||||||||
|
Swap
|
March 31, 2017
|
March 31, 2018
|
11
|
1.51%
|
(554
|
)
|
650,000
|
|
650,000
|
|
—
|
|
—
|
|
||||||||||||||
|
Cap
|
July 29, 2016
|
April 20, 2019
|
2
|
2.00%
|
66
|
|
108,000
|
|
126,000
|
|
150,000
|
|
—
|
|
||||||||||||||
|
Swap
|
March 29, 2018
|
March 31, 2019
|
8
|
1.16%
|
2,975
|
|
—
|
|
—
|
|
600,000
|
|
—
|
|
||||||||||||||
|
Swap
|
March 29, 2019
|
March 31, 2020
|
1
|
1.89%
|
(29
|
)
|
|
—
|
|
—
|
|
—
|
|
100,000
|
|
|||||||||||||
|
Total
|
$
|
3,150
|
|
$
|
1,008,000
|
|
$
|
1,026,000
|
|
$
|
750,000
|
|
$
|
100,000
|
|
|||||||||||||
|
(1)
|
In addition to the interest pay rate for each swap agreement, interest is payable at an applicable margin over LIBOR for borrowings outstanding as of
September 30, 2017
, as listed under the column heading “Stated Rate” in our summary table of outstanding indebtedness and respective principal payments under Note 8 – “Secured and Unsecured Senior Debt” to these unaudited consolidated financial statements.
|
35
|
10.
|
Accounts payable, accrued expenses, and tenant security deposits
|
The following table summarizes the components of accounts payable, accrued expenses, and tenant security deposits as of
September 30, 2017
, and
December 31, 2016
(in thousands):
|
September 30, 2017
|
December 31, 2016
|
||||||
|
Accounts payable and accrued expenses
|
$
|
338,296
|
|
$
|
366,174
|
|
|
|
Acquired below-market leases
|
92,388
|
|
59,509
|
|
|||
|
Conditional asset retirement obligations
|
7,457
|
|
3,095
|
|
|||
|
Deferred rent liabilities
|
27,747
|
|
34,426
|
|
|||
|
Interest rate hedge liabilities
|
583
|
|
3,587
|
|
|||
|
Unearned rent and tenant security deposits
|
240,501
|
|
231,416
|
|
|||
|
Other liabilities
|
33,098
|
|
33,464
|
|
|||
|
Total
|
$
|
740,070
|
|
$
|
731,671
|
|
|
Some of our properties may contain asbestos, which, under certain conditions, requires remediation. Although we believe that the asbestos is appropriately contained in accordance with environmental regulations, our practice is to remediate the asbestos upon the development or redevelopment of the affected property. We recognize a liability for the fair value of a conditional asset retirement obligation (including asbestos) when the fair value of the liability can be reasonably estimated. For certain properties we do not recognize an asset retirement obligation when there is an indeterminate settlement date for the obligation because the period in which we may remediate the obligation may not be estimated with any level of precision to provide for a meaningful estimate of the retirement obligation. These conditional asset retirement obligations are included in the table above.
|
11.
|
Earnings per share
|
In March 2017, we entered into agreements to sell an aggregate of
6.9 million
shares of our common stock, which consist of an initial issuance of
2.1 million
shares and the remaining
4.8 million
shares subject to forward equity sales agreements, at a public offering price of
$108.55
per share, less issuance costs and underwriters’ discount. We issued the initial
2.1 million
shares at closing in March 2017 for net proceeds, after underwriters’ discount and issuance costs, of
$217.8 million
and expect to settle the forward equity sales agreements on the remaining
4.8 million
shares of common stock no later than March 2018, for net proceeds of
$495.5 million
, after underwriters’ discount and issuance costs, with further adjustments as provided for in the sales agreements.
To account for the forward equity sales agreements, we considered the accounting guidance governing financial instruments and derivatives and concluded that our forward equity sales agreements were not liabilities as they did not embody obligations to repurchase our shares nor did they embody obligations to issue a variable number of shares for which the monetary value was predominantly fixed, varying with something other than the fair value of the shares, or varying inversely in relation to our shares. We then evaluated whether the agreements met the derivatives and hedging guidance scope exception to be accounted for as equity instruments and concluded that the agreements can be classified as equity contracts based on the following assessment: (i) none of the agreements’ exercise contingencies were based on observable markets or indices besides those related to the market for our own stock price and operations; and (ii) none of the settlement provisions precluded the agreements from being indexed to our own stock.
We also considered the potential dilution resulting from the forward equity sales agreements on the EPS calculations. We use the treasury method to determine the dilution resulting from the forward equity sales agreements during the period of time prior to settlement. The number of weighted-average shares outstanding – diluted used in the computation of EPS for the
three and nine months ended September 30, 2017
, includes the effect from the assumed issuance of
4.8 million
shares pursuant to the settlement of the forward equity sales agreements at the contractual price, less the assumed repurchase of common shares at the average market price using the net proceeds of
$495.5 million
, adjusted as provided for in the forward equity sales agreements. The impact to our weighted-average shares – diluted for the
three and nine months ended September 30, 2017
, was
698 thousand
and
430 thousand
, respectively, weighted-average incremental shares.
36
|
11.
|
Earnings per share (continued)
|
For purposes of calculating diluted EPS, we did not assume conversion of our
7.00%
Series D cumulative convertible preferred stock (“Series D Convertible Preferred Stock”) for the
three and nine months ended September 30, 2017
and
2016
, since the result was antidilutive to EPS attributable to Alexandria Real Estate Equities, Inc.’s common stockholders from continuing operations during those periods. Refer to “7.00% Series D Cumulative Convertible Preferred Stock Repurchases” in Note 12 – “Stockholders’ Equity” to these unaudited consolidated financial statements for further discussion of the partial repurchases of our Series D Convertible Preferred Stock.
We account for unvested restricted stock awards that contain nonforfeitable rights to dividends as participating securities and include these securities in the computation of EPS using the two-class method. Our Series D Convertible Preferred Stock and forward equity sales agreements are not participating securities and, therefore, are not included in the computation of EPS using the two-class method. Under the two-class method, we allocate net income after preferred stock dividends, preferred stock redemption charge, and amounts attributable to noncontrolling interests to common stock and unvested restricted stock awards based on their respective participation rights to dividends declared (or accumulated) and undistributed earnings.
The table below is a reconciliation of the numerators and denominators of the basic and diluted EPS computations for the
three and nine months ended September 30, 2017
and
2016
(in thousands, except per share amounts):
|
Three Months Ended September 30,
|
Nine Months Ended September 30,
|
||||||||||||||
|
2017
|
2016
|
2017
|
2016
|
||||||||||||
|
Net income (loss)
|
$
|
59,546
|
|
$
|
28,559
|
|
$
|
148,597
|
|
$
|
(69,591
|
)
|
|||
|
Net income attributable to noncontrolling interests
|
(5,773
|
)
|
(4,084
|
)
|
(18,892
|
)
|
(11,614
|
)
|
|||||||
|
Dividends on preferred stock
|
(1,302
|
)
|
(5,007
|
)
|
(6,364
|
)
|
(16,388
|
)
|
|||||||
|
Preferred stock redemption charge
|
—
|
|
(13,095
|
)
|
(11,279
|
)
|
(25,614
|
)
|
|||||||
|
Net income attributable to unvested restricted stock awards
|
(1,198
|
)
|
(921
|
)
|
(3,498
|
)
|
(2,807
|
)
|
|||||||
|
Numerator for basic and diluted EPS – net income (loss) attributable to Alexandria Real Estate Equities, Inc.’s common stockholders
|
$
|
51,273
|
|
$
|
5,452
|
|
$
|
108,564
|
|
$
|
(126,014
|
)
|
|||
|
Denominator for basic EPS – weighted-average shares of common stock outstanding
|
92,598
|
|
76,651
|
|
90,336
|
|
74,526
|
|
|||||||
|
Dilutive effect of forward equity sales agreements
|
698
|
|
751
|
|
430
|
|
—
|
|
|||||||
|
Denominator for diluted EPS – adjusted – weighted-average shares of common stock outstanding
|
93,296
|
|
77,402
|
|
90,766
|
|
74,526
|
|
|||||||
|
Net income (loss) per share attributable to Alexandria Real Estate Equities, Inc.’s common stockholders – basic and diluted
|
$
|
0.55
|
|
$
|
0.07
|
|
$
|
1.20
|
|
$
|
(1.69
|
)
|
|||
|
12.
|
Stockholders’ equity
|
ATM common stock offering program
In October 2016, we established an ATM common stock offering program that allowed us to sell up to an aggregate of
$600.0 million
of our common stock. During the six months ended June 30, 2017, we completed our ATM program with the sale of
2.1 million
shares of common stock for gross proceeds of
$245.8 million
, or
$118.97
per share, and net proceeds of approximately
$241.8 million
. There is no remaining availability under this ATM program.
In August 2017, we established a new ATM common stock offering program that allows us to sell up to an aggregate of
$750.0 million
of our common stock. During the
three months ended September 30, 2017
, we sold an aggregate of
2.1 million
shares of common stock for gross proceeds of
$249.9 million
, or
$119.94
per share, and received net proceeds of
$245.8 million
. As of
September 30, 2017
, the remaining aggregate amount available under our current program for future sales of common stock is
$500.1 million
.
37
|
12.
|
Stockholders’ equity (continued)
|
Forward equity sales agreements
Refer to Note 11 – “Earnings per Share” to these unaudited consolidated financial statements for a discussion related to our forward equity sales agreements executed in March 2017.
7.00% Series D cumulative convertible preferred stock repurchases
During the
nine months ended September 30, 2017
, we repurchased, in privately negotiated transactions,
501,115
outstanding shares of our Series D Convertible Preferred Stock at an aggregate price of
$17.9 million
, or
$35.79
per share, all of which were completed during the first and second quarters of 2017. As a result of these repurchases, we recognized a preferred stock redemption charge of
$5.8 million
, including the write-off of original issuance costs of approximately
$391 thousand
. During the
three months ended September 30, 2017
, we did not repurchase any additional outstanding shares of our Series D Convertible Preferred Stock.
During the
nine months ended September 30, 2016
, we repurchased
3.0 million
outstanding shares of our Series D Convertible Preferred Stock at an aggregate price of
$98.6 million
, or
$32.72
per share, including the repurchase of
1.1 million
outstanding shares of our Series D Convertible Preferred Stock during the
three months ended September 30, 2016
, at an aggregate price of
$39.3 million
, or
$36.31
per share. During the
nine months ended September 30, 2016
, we recognized a preferred stock redemption charge of
$25.6 million
, including the write-off of original issuance costs of approximately
$2.4 million
. During the
three months ended September 30, 2016
, we recognized a preferred stock redemption charge of
$13.1 million
, including the write-off of original issuance costs of approximately
$845 thousand
.
6.45% Series E cumulative redeemable preferred stock redemption
In March 2017, we announced the redemption of our 6.45% Series E cumulative redeemable preferred stock (“Series E Redeemable Preferred Stock”) and recognized a preferred stock redemption charge of
$5.5 million
related to the write-off of original issuance costs. On
April 14, 2017
, we completed the redemption of all
5.2 million
outstanding shares of our Series E Redeemable Preferred Stock at a redemption price of
$25.00
per share, or an aggregate of
$130.0 million
, plus accrued dividends, using funds primarily from the proceeds of our March 2017 common stock offering discussed in Note 11 – “Earnings per Share” to these unaudited consolidated financial statements.
Dividends
In
September 2017
, we declared cash dividends on our common stock for the
three months ended September 30, 2017
, aggregating
$82.3 million
, or
$0.86
per share. Also in
September 2017
, we declared cash dividends on our Series D Convertible Preferred Stock for the
three months ended September 30, 2017
, aggregating approximately
$1.3 million
, or
$0.4375
per share. In October 2017, we paid the cash dividends on our common stock and Series D Convertible Preferred Stock declared for the
three months ended September 30, 2017
.
For the
nine months ended September 30, 2017
, our declared cash dividends on our common stock aggregated
$238.4 million
, or
$2.55
per share, our declared cash dividends on our Series D Convertible Preferred Stock aggregated
$3.9 million
, or
$1.3125
per share, and our declared cash dividends on our Series E Redeemable Preferred Stock aggregated
$2.1 million
, or
$0.4031
per share. All outstanding shares of our Series E Redeemable Preferred Stock were redeemed on
April 14, 2017
.
38
|
12.
|
Stockholders’ equity (continued)
|
Accumulated other comprehensive income
Accumulated other comprehensive income attributable to Alexandria Real Estate Equities, Inc. consists of the following (in thousands):
|
|
|
Net Unrealized Gain (Loss) on:
|
||||||||||||||
|
|
|
Available-for- Sale Equity Securities
|
|
Interest Rate
Hedge Agreements |
|
Foreign Currency Translation
|
|
Total
|
||||||||
|
Balance as of December 31, 2016
|
|
$
|
19,293
|
|
|
$
|
405
|
|
|
$
|
(14,343
|
)
|
|
$
|
5,355
|
|
|
|
|
|
|
|
|
|
|
|
|
|
|
|
||||
|
Other comprehensive income before reclassifications
|
|
23,414
|
|
|
812
|
|
|
7,592
|
|
|
31,818
|
|
||||
|
Amounts reclassified from other comprehensive income
|
|
2,482
|
|
|
1,810
|
|
|
2,421
|
|
|
6,713
|
|
||||
|
|
|
25,896
|
|
|
2,622
|
|
|
10,013
|
|
|
38,531
|
|
||||
|
Amounts attributable to noncontrolling interests
|
|
—
|
|
|
—
|
|
|
(22
|
)
|
|
(22
|
)
|
||||
|
Net other comprehensive income
|
|
25,896
|
|
|
2,622
|
|
|
9,991
|
|
|
38,509
|
|
||||
|
|
|
|
|
|
|
|
|
|
|
|
|
|
||||
|
Balance as of September 30, 2017
|
|
$
|
45,189
|
|
|
$
|
3,027
|
|
|
$
|
(4,352
|
)
|
|
$
|
43,864
|
|
Common stock, preferred stock, and excess stock authorizations
In May 2017, our stockholders approved an amendment to our charter to increase the authorized shares of common stock from
100.0 million
to
200.0 million
shares, of which
94.3 million
shares were issued and outstanding as of
September 30, 2017
. Our charter also authorizes the issuance of up to
100.0 million
shares of preferred stock, of which
3.0 million
shares were issued and outstanding as of
September 30, 2017
. In addition,
200.0 million
shares of “excess stock” (as defined in our charter) are authorized,
none
of which were issued and outstanding as of
September 30, 2017
.
|
13.
|
Noncontrolling interests
|
Noncontrolling interests represent the third-party interests in certain entities in which we have a controlling interest. These entities owned
nine
projects as of
September 30, 2017
, and are included in our consolidated financial statements. Noncontrolling interests are adjusted for additional contributions and distributions, the proportionate share of the net earnings or losses, and other comprehensive income or loss. Distributions, profits, and losses related to these entities are allocated in accordance with the respective operating agreements.
During the
nine months ended September 30, 2017
, our consolidated joint ventures distributed
$17.4 million
to our joint venture partners. During the
nine months ended September 30, 2016
, our distributions to noncontrolling interests aggregated
$62.6 million
, which primarily consisted of the second installment of
$54.0 million
paid to acquire the previously outstanding
10%
noncontrolling interest in our
1.2 million
RSF campus at Alexandria Technology Square
®
in our Cambridge submarket of Greater Boston. The total purchase price was
$108.3 million
, and the first installment of
$54.3 million
was paid on April 1, 2015.
In 2016, we sold our partial interests in 10290 Campus Point Drive and 10300 Campus Point Drive. As described in Note 3 – “Investments in Real Estate” to these unaudited consolidated financial statements, since we retained controlling interests in both joint ventures following the sales and continued to consolidate these entities, we accounted for the proceeds received as equity financing transactions. These transactions did not qualify as sales of real estate and did not result in purchase accounting adjustments to the carrying value. Accordingly, the carrying amounts of our partner’s share of assets and liabilities are reported at historical cost basis.
Certain of our noncontrolling interests have the right to require us to redeem their ownership interests in the respective entities. We classify these ownership interests in the entities as redeemable noncontrolling interests outside of total equity in the accompanying unaudited consolidated balance sheets. Redeemable noncontrolling interests are adjusted for additional contributions and distributions, the proportionate share of the net earnings or losses, and other comprehensive income or loss. If the amount of a redeemable noncontrolling interest is less than the maximum redemption value at the balance sheet date, such amount is adjusted to the maximum redemption value. Subsequent declines in the redemption value are recognized only to the extent that previous increases have been recognized.
39
|
14.
|
Assets classified as held for sale
|
As of
September 30, 2017
,
two
operating properties aggregating
634,328
RSF located in China, which represent our remaining real estate investments in Asia, were classified as held for sale. For additional information, refer to Note 3 – “Investments in Real Estate” to these unaudited consolidated financial statements.
The following is a summary of net assets as of
September 30, 2017
, and
December 31, 2016
, for our remaining real estate investments in Asia that were classified as held for sale (in thousands):
|
|
September 30, 2017
|
December 31, 2016
|
|||||
|
Total assets
|
$
|
41,658
|
|
$
|
39,643
|
|
|
|
Total liabilities
|
(2,480
|
)
|
(2,342
|
)
|
|||
|
Total accumulated other comprehensive (income) loss
|
(1,082
|
)
|
828
|
|
|||
|
Net assets classified as held for sale – Asia
|
$
|
38,096
|
|
$
|
38,129
|
|
|
|
15.
|
Condensed consolidating financial information
|
Alexandria Real Estate Equities, Inc. (the “Issuer”) has sold certain debt securities registered under the Securities Act of 1933, as amended, that are fully and unconditionally guaranteed by Alexandria Real Estate Equities, L.P. (the “LP” or the “Guarantor Subsidiary”), an indirectly 100% owned subsidiary of the Issuer. The Issuer’s other subsidiaries, including, but not limited to, the subsidiaries that own substantially all of its real estate (collectively, the “Combined Non-Guarantor Subsidiaries”), will not provide a guarantee of such securities, including the subsidiaries that are partially or 100% owned by the LP. The following condensed consolidating financial information presents the condensed consolidating balance sheets as of
September 30, 2017
, and
December 31, 2016
, the condensed consolidating statements of income and comprehensive income for the
three and nine months ended September 30, 2017
and
2016
, and the condensed consolidating statements of cash flows for the
nine months ended September 30, 2017
and
2016
, for the Issuer, the Guarantor Subsidiary, and the Combined Non-Guarantor Subsidiaries, as well as the eliminations necessary to arrive at the information on a consolidated basis. In presenting the condensed consolidating financial statements, the equity method of accounting has been applied to (i) the Issuer’s interests in the Guarantor Subsidiary and the Combined Non-Guarantor Subsidiaries, (ii) the Guarantor Subsidiary’s interests in the Combined Non-Guarantor Subsidiaries, and (iii) the Combined Non-Guarantor Subsidiaries’ interests in the Guarantor Subsidiary, where applicable, even though all such subsidiaries meet the requirements to be consolidated under GAAP. All intercompany balances and transactions between the Issuer, the Guarantor Subsidiary, and the Combined Non-Guarantor Subsidiaries have been eliminated, as shown in the column “Eliminations.” All assets and liabilities have been allocated to the Issuer, the Guarantor Subsidiary, and the Combined Non-Guarantor Subsidiaries generally based on legal entity ownership.
40
|
15.
|
Condensed consolidating financial information (continued)
|
Condensed Consolidating Balance Sheet
as of
September 30, 2017
(In thousands)
(Unaudited)
|
Alexandria Real Estate Equities, Inc.
(Issuer)
|
Alexandria
Real Estate
Equities, L.P.
(Guarantor
Subsidiary)
|
Combined
Non-
Guarantor
Subsidiaries
|
Eliminations
|
Consolidated
|
|||||||||||||||
|
Assets
|
|||||||||||||||||||
|
Investments in real estate
|
$
|
—
|
|
$
|
—
|
|
$
|
10,046,521
|
|
$
|
—
|
|
$
|
10,046,521
|
|
||||
|
Investments in unconsolidated real estate JVs
|
—
|
|
—
|
|
33,692
|
|
—
|
|
33,692
|
|
|||||||||
|
Cash and cash equivalents
|
37,916
|
|
—
|
|
80,646
|
|
—
|
|
118,562
|
|
|||||||||
|
Restricted cash
|
138
|
|
—
|
|
27,575
|
|
—
|
|
27,713
|
|
|||||||||
|
Tenant receivables
|
—
|
|
—
|
|
9,899
|
|
—
|
|
9,899
|
|
|||||||||
|
Deferred rent
|
—
|
|
—
|
|
402,353
|
|
—
|
|
402,353
|
|
|||||||||
|
Deferred leasing costs
|
—
|
|
—
|
|
208,265
|
|
—
|
|
208,265
|
|
|||||||||
|
Investments
|
—
|
|
1,689
|
|
483,573
|
|
—
|
|
485,262
|
|
|||||||||
|
Investments in and advances to affiliates
|
9,158,536
|
|
8,276,072
|
|
168,449
|
|
(17,603,057
|
)
|
—
|
|
|||||||||
|
Other assets
|
48,095
|
|
—
|
|
164,961
|
|
—
|
|
213,056
|
|
|||||||||
|
Total assets
|
$
|
9,244,685
|
|
$
|
8,277,761
|
|
$
|
11,625,934
|
|
$
|
(17,603,057
|
)
|
$
|
11,545,323
|
|
||||
|
Liabilities, Noncontrolling Interests, and Equity
|
|||||||||||||||||||
|
Secured notes payable
|
$
|
—
|
|
$
|
—
|
|
$
|
1,153,890
|
|
$
|
—
|
|
$
|
1,153,890
|
|
||||
|
Unsecured senior notes payable
|
2,801,290
|
|
—
|
|
—
|
|
—
|
|
2,801,290
|
|
|||||||||
|
Unsecured senior line of credit
|
314,000
|
|
—
|
|
—
|
|
—
|
|
314,000
|
|
|||||||||
|
Unsecured senior bank term loans
|
547,860
|
|
—
|
|
—
|
|
—
|
|
547,860
|
|
|||||||||
|
Accounts payable, accrued expenses, and tenant security deposits
|
91,163
|
|
—
|
|
648,907
|
|
—
|
|
740,070
|
|
|||||||||
|
Dividends payable
|
83,402
|
|
—
|
|
—
|
|
—
|
|
83,402
|
|
|||||||||
|
Total liabilities
|
3,837,715
|
|
—
|
|
1,802,797
|
|
—
|
|
5,640,512
|
|
|||||||||
|
Redeemable noncontrolling interests
|
—
|
|
—
|
|
11,418
|
|
—
|
|
11,418
|
|
|||||||||
|
Alexandria Real Estate Equities, Inc.’s stockholders’ equity
|
5,406,970
|
|
8,277,761
|
|
9,325,296
|
|
(17,603,057
|
)
|
5,406,970
|
|
|||||||||
|
Noncontrolling interests
|
—
|
|
—
|
|
486,423
|
|
—
|
|
486,423
|
|
|||||||||
|
Total equity
|
5,406,970
|
|
8,277,761
|
|
9,811,719
|
|
(17,603,057
|
)
|
5,893,393
|
|
|||||||||
|
Total liabilities, noncontrolling interests, and equity
|
$
|
9,244,685
|
|
$
|
8,277,761
|
|
$
|
11,625,934
|
|
$
|
(17,603,057
|
)
|
$
|
11,545,323
|
|
||||
41
|
15.
|
Condensed consolidating financial information (continued)
|
Condensed Consolidating Balance Sheet
as of
December 31, 2016
(In thousands)
(Unaudited)
|
Alexandria
Real Estate
Equities, Inc.
(Issuer)
|
Alexandria
Real Estate
Equities, L.P.
(Guarantor
Subsidiary)
|
Combined
Non-
Guarantor
Subsidiaries
|
Eliminations
|
Consolidated
|
|||||||||||||||
|
Assets
|
|||||||||||||||||||
|
Investments in real estate
|
$
|
—
|
|
$
|
—
|
|
$
|
9,077,972
|
|
$
|
—
|
|
$
|
9,077,972
|
|
||||
|
Investments in unconsolidated real estate JVs
|
—
|
|
—
|
|
50,221
|
|
—
|
|
50,221
|
|
|||||||||
|
Cash and cash equivalents
|
30,603
|
|
—
|
|
94,429
|
|
—
|
|
125,032
|
|
|||||||||
|
Restricted cash
|
102
|
|
—
|
|
16,232
|
|
—
|
|
16,334
|
|
|||||||||
|
Tenant receivables
|
—
|
|
—
|
|
9,744
|
|
—
|
|
9,744
|
|
|||||||||
|
Deferred rent
|
—
|
|
—
|
|
335,974
|
|
—
|
|
335,974
|
|
|||||||||
|
Deferred leasing costs
|
—
|
|
—
|
|
195,937
|
|
—
|
|
195,937
|
|
|||||||||
|
Investments
|
—
|
|
4,440
|
|
338,037
|
|
—
|
|
342,477
|
|
|||||||||
|
Investments in and advances to affiliates
|
8,152,965
|
|
7,444,919
|
|
151,594
|
|
(15,749,478
|
)
|
—
|
|
|||||||||
|
Other assets
|
45,646
|
|
—
|
|
155,551
|
|
—
|
|
201,197
|
|
|||||||||
|
Total assets
|
$
|
8,229,316
|
|
$
|
7,449,359
|
|
$
|
10,425,691
|
|
$
|
(15,749,478
|
)
|
$
|
10,354,888
|
|
||||
|
Liabilities, Noncontrolling Interests, and Equity
|
|||||||||||||||||||
|
Secured notes payable
|
$
|
—
|
|
$
|
—
|
|
$
|
1,011,292
|
|
$
|
—
|
|
$
|
1,011,292
|
|
||||
|
Unsecured senior notes payable
|
2,378,262
|
|
—
|
|
—
|
|
—
|
|
2,378,262
|
|
|||||||||
|
Unsecured senior line of credit
|
28,000
|
|
—
|
|
—
|
|
—
|
|
28,000
|
|
|||||||||
|
Unsecured senior bank term loans
|
746,471
|
|
—
|
|
—
|
|
—
|
|
746,471
|
|
|||||||||
|
Accounts payable, accrued expenses, and tenant security deposits
|
104,044
|
|
—
|
|
627,627
|
|
—
|
|
731,671
|
|
|||||||||
|
Dividends payable
|
76,743
|
|
—
|
|
171
|
|
—
|
|
76,914
|
|
|||||||||
|
Total liabilities
|
3,333,520
|
|
—
|
|
1,639,090
|
|
—
|
|
4,972,610
|
|
|||||||||
|
Redeemable noncontrolling interests
|
—
|
|
—
|
|
11,307
|
|
—
|
|
11,307
|
|
|||||||||
|
Alexandria Real Estate Equities, Inc.’s stockholders’ equity
|
4,895,796
|
|
7,449,359
|
|
8,300,119
|
|
(15,749,478
|
)
|
4,895,796
|
|
|||||||||
|
Noncontrolling interests
|
—
|
|
—
|
|
475,175
|
|
—
|
|
475,175
|
|
|||||||||
|
Total equity
|
4,895,796
|
|
7,449,359
|
|
8,775,294
|
|
(15,749,478
|
)
|
5,370,971
|
|
|||||||||
|
Total liabilities, noncontrolling interests, and equity
|
$
|
8,229,316
|
|
$
|
7,449,359
|
|
$
|
10,425,691
|
|
$
|
(15,749,478
|
)
|
$
|
10,354,888
|
|
||||
42
|
15.
|
Condensed consolidating financial information (continued)
|
Condensed Consolidating Statement of Income
for the
Three Months Ended September 30, 2017
(In thousands)
(Unaudited)
|
Alexandria
Real Estate
Equities, Inc.
(Issuer)
|
Alexandria
Real Estate
Equities, L.P.
(Guarantor
Subsidiary)
|
Combined
Non-
Guarantor
Subsidiaries
|
Eliminations
|
Consolidated
|
|||||||||||||||
|
Revenues:
|
|||||||||||||||||||
|
Rental
|
$
|
—
|
|
$
|
—
|
|
$
|
216,021
|
|
$
|
—
|
|
$
|
216,021
|
|
||||
|
Tenant recoveries
|
—
|
|
—
|
|
67,058
|
|
—
|
|
67,058
|
|
|||||||||
|
Other income
|
3,230
|
|
(2,589
|
)
|
5,736
|
|
(4,086
|
)
|
2,291
|
|
|||||||||
|
Total revenues
|
3,230
|
|
(2,589
|
)
|
288,815
|
|
(4,086
|
)
|
285,370
|
|
|||||||||
|
Expenses:
|
|||||||||||||||||||
|
Rental operations
|
—
|
|
—
|
|
83,469
|
|
—
|
|
83,469
|
|
|||||||||
|
General and administrative
|
16,598
|
|
—
|
|
5,124
|
|
(4,086
|
)
|
17,636
|
|
|||||||||
|
Interest
|
23,958
|
|
—
|
|
7,073
|
|
—
|
|
31,031
|
|
|||||||||
|
Depreciation and amortization
|
1,787
|
|
—
|
|
106,001
|
|
—
|
|
107,788
|
|
|||||||||
|
Total expenses
|
42,343
|
|
—
|
|
201,667
|
|
(4,086
|
)
|
239,924
|
|
|||||||||
|
|
|
||||||||||||||||||
|
Equity in earnings of unconsolidated real estate JVs
|
—
|
|
—
|
|
14,100
|
|
—
|
|
14,100
|
|
|||||||||
|
Equity in earnings of affiliates
|
92,886
|
|
88,900
|
|
1,702
|
|
(183,488
|
)
|
—
|
|
|||||||||
|
Net income
|
53,773
|
|
86,311
|
|
102,950
|
|
(183,488
|
)
|
59,546
|
|
|||||||||
|
Net income attributable to noncontrolling interests
|
—
|
|
—
|
|
(5,773
|
)
|
—
|
|
(5,773
|
)
|
|||||||||
|
Net income attributable to Alexandria Real Estate Equities, Inc.’s stockholders
|
53,773
|
|
86,311
|
|
97,177
|
|
(183,488
|
)
|
53,773
|
|
|||||||||
|
Dividends on preferred stock
|
(1,302
|
)
|
—
|
|
—
|
|
—
|
|
(1,302
|
)
|
|||||||||
|
Net income attributable to unvested restricted stock awards
|
(1,198
|
)
|
—
|
|
—
|
|
—
|
|
(1,198
|
)
|
|||||||||
|
Net income attributable to Alexandria Real Estate Equities, Inc.’s common stockholders
|
$
|
51,273
|
|
$
|
86,311
|
|
$
|
97,177
|
|
$
|
(183,488
|
)
|
$
|
51,273
|
|
||||
43
|
15.
|
Condensed consolidating financial information (continued)
|
Condensed Consolidating Statement of Income
for the
Three Months Ended September 30, 2016
(In thousands)
(Unaudited)
|
Alexandria
Real Estate
Equities, Inc.
(Issuer)
|
Alexandria
Real Estate
Equities, L.P.
(Guarantor
Subsidiary)
|
Combined
Non-
Guarantor
Subsidiaries
|
Eliminations
|
Consolidated
|
|||||||||||||||
|
Revenues:
|
|||||||||||||||||||
|
Rental
|
$
|
—
|
|
$
|
—
|
|
$
|
166,591
|
|
$
|
—
|
|
$
|
166,591
|
|
||||
|
Tenant recoveries
|
—
|
|
—
|
|
58,681
|
|
—
|
|
58,681
|
|
|||||||||
|
Other income
|
1,077
|
|
91
|
|
7,852
|
|
(3,913
|
)
|
5,107
|
|
|||||||||
|
Total revenues
|
1,077
|
|
91
|
|
233,124
|
|
(3,913
|
)
|
230,379
|
|
|||||||||
|
Expenses:
|
|||||||||||||||||||
|
Rental operations
|
—
|
|
—
|
|
72,002
|
|
—
|
|
72,002
|
|
|||||||||
|
General and administrative
|
15,568
|
|
—
|
|
4,199
|
|
(3,913
|
)
|
15,854
|
|
|||||||||
|
Interest
|
21,318
|
|
—
|
|
4,532
|
|
—
|
|
25,850
|
|
|||||||||
|
Depreciation and amortization
|
1,722
|
|
—
|
|
75,411
|
|
—
|
|
77,133
|
|
|||||||||
|
Impairment of real estate
|
—
|
|
—
|
|
8,114
|
|
—
|
|
8,114
|
|
|||||||||
|
Loss on early extinguishment of debt
|
3,230
|
|
—
|
|
—
|
|
—
|
|
3,230
|
|
|||||||||
|
Total expenses
|
41,838
|
|
—
|
|
164,258
|
|
(3,913
|
)
|
202,183
|
|
|||||||||
|
Equity in earnings of unconsolidated real estate JVs
|
—
|
|
—
|
|
273
|
|
—
|
|
273
|
|
|||||||||
|
Equity in earnings of affiliates
|
65,236
|
|
55,532
|
|
1,100
|
|
(121,868
|
)
|
—
|
|
|||||||||
|
Gain on sale of real estate – land parcels
|
—
|
|
—
|
|
90
|
|
—
|
|
90
|
|
|||||||||
|
Net income
|
24,475
|
|
55,623
|
|
70,329
|
|
(121,868
|
)
|
28,559
|
|
|||||||||
|
Net income attributable to noncontrolling interests
|
—
|
|
—
|
|
(4,084
|
)
|
—
|
|
(4,084
|
)
|
|||||||||
|
Net income attributable to Alexandria Real Estate Equities, Inc.’s stockholders
|
24,475
|
|
55,623
|
|
66,245
|
|
(121,868
|
)
|
24,475
|
|
|||||||||
|
Dividends on preferred stock
|
(5,007
|
)
|
—
|
|
—
|
|
—
|
|
(5,007
|
)
|
|||||||||
|
Preferred stock redemption charge
|
(13,095
|
)
|
—
|
|
—
|
|
—
|
|
(13,095
|
)
|
|||||||||
|
Net income attributable to unvested restricted stock awards
|
(921
|
)
|
—
|
|
—
|
|
—
|
|
(921
|
)
|
|||||||||
|
Net income attributable to Alexandria Real Estate Equities, Inc.’s common stockholders
|
$
|
5,452
|
|
$
|
55,623
|
|
$
|
66,245
|
|
$
|
(121,868
|
)
|
$
|
5,452
|
|
||||
44
|
15.
|
Condensed consolidating financial information (continued)
|
Condensed Consolidating Statement of Income
for the
Nine Months Ended September 30, 2017
(In thousands)
(Unaudited)
|
Alexandria
Real Estate
Equities, Inc.
(Issuer)
|
Alexandria
Real Estate
Equities, L.P.
(Guarantor
Subsidiary)
|
Combined
Non-
Guarantor
Subsidiaries
|
Eliminations
|
Consolidated
|
|||||||||||||||
|
Revenues:
|
|||||||||||||||||||
|
Rental
|
$
|
—
|
|
$
|
—
|
|
$
|
635,156
|
|
$
|
—
|
|
$
|
635,156
|
|
||||
|
Tenant recoveries
|
—
|
|
—
|
|
188,874
|
|
—
|
|
188,874
|
|
|||||||||
|
Other income
|
11,337
|
|
(2,577
|
)
|
10,199
|
|
(13,683
|
)
|
5,276
|
|
|||||||||
|
Total revenues
|
11,337
|
|
(2,577
|
)
|
834,229
|
|
(13,683
|
)
|
829,306
|
|
|||||||||
|
Expenses:
|
|||||||||||||||||||
|
Rental operations
|
—
|
|
—
|
|
237,536
|
|
—
|
|
237,536
|
|
|||||||||
|
General and administrative
|
55,272
|
|
—
|
|
14,510
|
|
(13,683
|
)
|
56,099
|
|
|||||||||
|
Interest
|
72,907
|
|
—
|
|
19,656
|
|
—
|
|
92,563
|
|
|||||||||
|
Depreciation and amortization
|
5,217
|
|
—
|
|
303,852
|
|
—
|
|
309,069
|
|
|||||||||
|
Impairment of real estate
|
—
|
|
—
|
|
203
|
|
—
|
|
203
|
|
|||||||||
|
Loss on early extinguishment of debt
|
670
|
|
—
|
|
—
|
|
—
|
|
670
|
|
|||||||||
|
Total expenses
|
134,066
|
|
—
|
|
575,757
|
|
(13,683
|
)
|
696,140
|
|
|||||||||
|
Equity in earnings of unconsolidated real estate JVs
|
—
|
|
—
|
|
15,050
|
|
—
|
|
15,050
|
|
|||||||||
|
Equity in earnings of affiliates
|
252,434
|
|
242,345
|
|
4,694
|
|
(499,473
|
)
|
—
|
|
|||||||||
|
Gain on sales of real estate – rental properties
|
—
|
|
—
|
|
270
|
|
—
|
|
270
|
|
|||||||||
|
Gain on sales of real estate – land parcels
|
—
|
|
—
|
|
111
|
|
—
|
|
111
|
|
|||||||||
|
Net income
|
129,705
|
|
239,768
|
|
278,597
|
|
(499,473
|
)
|
148,597
|
|
|||||||||
|
Net income attributable to noncontrolling interests
|
—
|
|
—
|
|
(18,892
|
)
|
—
|
|
(18,892
|
)
|
|||||||||
|
Net income attributable to Alexandria Real Estate Equities, Inc.’s stockholders
|
129,705
|
|
239,768
|
|
259,705
|
|
(499,473
|
)
|
129,705
|
|
|||||||||
|
Dividends on preferred stock
|
(6,364
|
)
|
—
|
|
—
|
|
—
|
|
(6,364
|
)
|
|||||||||
|
Preferred stock redemption charge
|
(11,279
|
)
|
—
|
|
—
|
|
—
|
|
(11,279
|
)
|
|||||||||
|
Net income attributable to unvested restricted stock awards
|
(3,498
|
)
|
—
|
|
—
|
|
—
|
|
(3,498
|
)
|
|||||||||
|
Net income attributable to Alexandria Real Estate Equities, Inc.’s common stockholders
|
$
|
108,564
|
|
$
|
239,768
|
|
$
|
259,705
|
|
$
|
(499,473
|
)
|
$
|
108,564
|
|
||||
45
|
15.
|
Condensed consolidating financial information (continued)
|
Condensed Consolidating Statement of Income
for the
Nine Months Ended September 30, 2016
(In thousands)
(Unaudited)
|
Alexandria
Real Estate
Equities, Inc.
(Issuer)
|
Alexandria
Real Estate
Equities, L.P.
(Guarantor
Subsidiary)
|
Combined
Non-
Guarantor
Subsidiaries
|
Eliminations
|
Consolidated
|
|||||||||||||||
|
Revenues:
|
|||||||||||||||||||
|
Rental
|
$
|
—
|
|
$
|
—
|
|
$
|
486,505
|
|
$
|
—
|
|
$
|
486,505
|
|
||||
|
Tenant recoveries
|
—
|
|
—
|
|
165,385
|
|
—
|
|
165,385
|
|
|||||||||
|
Other income
|
7,086
|
|
115
|
|
24,091
|
|
(10,638
|
)
|
20,654
|
|
|||||||||
|
Total revenues
|
7,086
|
|
115
|
|
675,981
|
|
(10,638
|
)
|
672,544
|
|
|||||||||
|
Expenses:
|
|||||||||||||||||||
|
Rental operations
|
—
|
|
—
|
|
205,164
|
|
—
|
|
205,164
|
|
|||||||||
|
General and administrative
|
45,224
|
|
—
|
|
11,840
|
|
(10,638
|
)
|
46,426
|
|
|||||||||
|
Interest
|
60,729
|
|
—
|
|
15,001
|
|
—
|
|
75,730
|
|
|||||||||
|
Depreciation and amortization
|
4,997
|
|
—
|
|
213,171
|
|
—
|
|
218,168
|
|
|||||||||
|
Impairment of real estate
|
—
|
|
—
|
|
193,237
|
|
—
|
|
193,237
|
|
|||||||||
|
Loss of early extinguishment of debt
|
3,230
|
|
—
|
|
—
|
|
—
|
|
3,230
|
|
|||||||||
|
Total expenses
|
114,180
|
|
—
|
|
638,413
|
|
(10,638
|
)
|
741,955
|
|
|||||||||
|
Equity in losses of unconsolidated real estate JVs
|
—
|
|
—
|
|
(270
|
)
|
—
|
|
(270
|
)
|
|||||||||
|
Equity in earnings (losses) of affiliates
|
25,889
|
|
(6,282
|
)
|
(98
|
)
|
(19,509
|
)
|
—
|
|
|||||||||
|
Gain on sale of real estate – land parcels
|
—
|
|
—
|
|
90
|
|
—
|
|
90
|
|
|||||||||
|
Net (loss) income
|
(81,205
|
)
|
(6,167
|
)
|
37,290
|
|
(19,509
|
)
|
(69,591
|
)
|
|||||||||
|
Net income attributable to noncontrolling interests
|
—
|
|
—
|
|
(11,614
|
)
|
—
|
|
(11,614
|
)
|
|||||||||
|
Net (loss) income attributable to Alexandria Real Estate Equities, Inc.’s stockholders
|
(81,205
|
)
|
(6,167
|
)
|
25,676
|
|
(19,509
|
)
|
(81,205
|
)
|
|||||||||
|
Dividends on preferred stock
|
(16,388
|
)
|
—
|
|
—
|
|
—
|
|
(16,388
|
)
|
|||||||||
|
Preferred stock redemption charge
|
(25,614
|
)
|
—
|
|
—
|
|
—
|
|
(25,614
|
)
|
|||||||||
|
Net income attributable to unvested restricted stock awards
|
(2,807
|
)
|
—
|
|
—
|
|
—
|
|
(2,807
|
)
|
|||||||||
|
Net (loss) income attributable to Alexandria Real Estate Equities, Inc.’s common stockholders
|
$
|
(126,014
|
)
|
$
|
(6,167
|
)
|
$
|
25,676
|
|
$
|
(19,509
|
)
|
$
|
(126,014
|
)
|
||||
46
|
15.
|
Condensed consolidating financial information (continued)
|
Condensed Consolidating Statement of Comprehensive Income
for the
Three Months Ended September 30, 2017
(In thousands)
(Unaudited)
|
Alexandria
Real Estate
Equities, Inc.
(Issuer)
|
Alexandria
Real Estate
Equities, L.P.
(Guarantor
Subsidiary)
|
Combined
Non-
Guarantor
Subsidiaries
|
Eliminations
|
Consolidated
|
|||||||||||||||
|
Net income
|
$
|
53,773
|
|
$
|
86,311
|
|
$
|
102,950
|
|
$
|
(183,488
|
)
|
$
|
59,546
|
|
||||
|
Other comprehensive income
|
|||||||||||||||||||
|
Unrealized gains on available-for-sale equity securities:
|
|||||||||||||||||||
|
Unrealized holding gains arising during the period
|
—
|
|
65
|
|
16,953
|
|
—
|
|
17,018
|
|
|||||||||
|
Reclassification adjustment for losses included in net income
|
—
|
|
—
|
|
—
|
|
—
|
|
—
|
|
|||||||||
|
Unrealized gains on available-for-sale equity securities, net
|
—
|
|
65
|
|
16,953
|
|
—
|
|
17,018
|
|
|||||||||
|
Unrealized gains (losses) on interest rate hedge agreements:
|
|||||||||||||||||||
|
Unrealized interest rate hedge gains (losses) arising during the period
|
174
|
|
—
|
|
(29
|
)
|
—
|
|
145
|
|
|||||||||
|
Reclassification adjustment for amortization of interest expense included in net income
|
195
|
|
—
|
|
3
|
|
—
|
|
198
|
|
|||||||||
|
Unrealized gains (losses) on interest rate hedge agreements, net
|
369
|
|
—
|
|
(26
|
)
|
—
|
|
343
|
|
|||||||||
|
Unrealized gains on foreign currency translation:
|
|||||||||||||||||||
|
Unrealized foreign currency translation gains arising during the period
|
—
|
|
—
|
|
3,836
|
|
—
|
|
3,836
|
|
|||||||||
|
Reclassification adjustment for cumulative foreign currency translation losses included in net income upon sale or liquidation
|
—
|
|
—
|
|
—
|
|
—
|
|
—
|
|
|||||||||
|
Unrealized gains on foreign currency translation, net
|
—
|
|
—
|
|
3,836
|
|
—
|
|
3,836
|
|
|||||||||
|
Total other comprehensive income
|
369
|
|
65
|
|
20,763
|
|
—
|
|
21,197
|
|
|||||||||
|
Comprehensive income
|
54,142
|
|
86,376
|
|
123,713
|
|
(183,488
|
)
|
80,743
|
|
|||||||||
|
Less: comprehensive income attributable to noncontrolling interests
|
—
|
|
—
|
|
(5,783
|
)
|
—
|
|
(5,783
|
)
|
|||||||||
|
Comprehensive income attributable to Alexandria Real Estate Equities, Inc.’s common stockholders
|
$
|
54,142
|
|
$
|
86,376
|
|
$
|
117,930
|
|
$
|
(183,488
|
)
|
$
|
74,960
|
|
||||
47
|
15.
|
Condensed consolidating financial information (continued)
|
Condensed Consolidating Statement of Comprehensive Income
for the
Three Months Ended September 30, 2016
(In thousands)
(Unaudited)
|
Alexandria
Real Estate
Equities, Inc.
(Issuer)
|
Alexandria
Real Estate
Equities, L.P.
(Guarantor
Subsidiary)
|
Combined
Non-
Guarantor
Subsidiaries
|
Eliminations
|
Consolidated
|
|||||||||||||||
|
Net income
|
$
|
24,475
|
|
$
|
55,623
|
|
$
|
70,329
|
|
$
|
(121,868
|
)
|
$
|
28,559
|
|
||||
|
Other comprehensive income (loss)
|
|||||||||||||||||||
|
Unrealized losses on available-for-sale equity securities:
|
|||||||||||||||||||
|
Unrealized holding gains (losses) arising during the period
|
—
|
|
58
|
|
(38,679
|
)
|
—
|
|
(38,621
|
)
|
|||||||||
|
Reclassification adjustment for gains included in net income
|
—
|
|
(159
|
)
|
(8,381
|
)
|
—
|
|
(8,540
|
)
|
|||||||||
|
Unrealized losses on available-for-sale equity securities, net
|
—
|
|
(101
|
)
|
(47,060
|
)
|
—
|
|
(47,161
|
)
|
|||||||||
|
Unrealized gains (losses) on interest rate hedge agreements:
|
|||||||||||||||||||
|
Unrealized interest rate hedge gains arising during the period
|
2,979
|
|
—
|
|
3
|
|
—
|
|
2,982
|
|
|||||||||
|
Reclassification adjustment for amortization of interest expense (income) included in net income
|
1,714
|
|
—
|
|
(12
|
)
|
—
|
|
1,702
|
|
|||||||||
|
Unrealized gains (losses) on interest rate hedge agreements, net
|
4,693
|
|
—
|
|
(9
|
)
|
—
|
|
4,684
|
|
|||||||||
|
Unrealized gains on foreign currency translation:
|
|||||||||||||||||||
|
Unrealized foreign currency translation losses arising during the period
|
—
|
|
—
|
|
(1,322
|
)
|
—
|
|
(1,322
|
)
|
|||||||||
|
Reclassification adjustment for cumulative foreign currency translation losses included in net income upon sale or liquidation
|
—
|
|
—
|
|
3,779
|
|
—
|
|
3,779
|
|
|||||||||
|
Unrealized gains on foreign currency translation, net
|
—
|
|
—
|
|
2,457
|
|
—
|
|
2,457
|
|
|||||||||
|
Total other comprehensive income (loss)
|
4,693
|
|
(101
|
)
|
(44,612
|
)
|
—
|
|
(40,020
|
)
|
|||||||||
|
Comprehensive income (loss)
|
29,168
|
|
55,522
|
|
25,717
|
|
(121,868
|
)
|
(11,461
|
)
|
|||||||||
|
Less: comprehensive income attributable to noncontrolling interests
|
—
|
|
—
|
|
(4,081
|
)
|
—
|
|
(4,081
|
)
|
|||||||||
|
Comprehensive income (loss) attributable to Alexandria Real Estate Equities, Inc.’s common stockholders
|
$
|
29,168
|
|
$
|
55,522
|
|
$
|
21,636
|
|
$
|
(121,868
|
)
|
$
|
(15,542
|
)
|
||||
48
|
15.
|
Condensed consolidating financial information (continued)
|
Condensed Consolidating Statement of Comprehensive Income
for the
Nine Months Ended September 30, 2017
(In thousands)
(Unaudited)
|
Alexandria
Real Estate
Equities, Inc.
(Issuer)
|
Alexandria
Real Estate
Equities, L.P.
(Guarantor
Subsidiary)
|
Combined
Non-
Guarantor
Subsidiaries
|
Eliminations
|
Consolidated
|
|||||||||||||||
|
Net income
|
$
|
129,705
|
|
$
|
239,768
|
|
$
|
278,597
|
|
$
|
(499,473
|
)
|
$
|
148,597
|
|
||||
|
Other comprehensive income
|
|||||||||||||||||||
|
Unrealized gains on available-for-sale equity securities:
|
|||||||||||||||||||
|
Unrealized holding gains arising during the period
|
—
|
|
20
|
|
23,394
|
|
—
|
|
23,414
|
|
|||||||||
|
Reclassification adjustment for losses included in net income
|
—
|
|
4
|
|
2,478
|
|
—
|
|
2,482
|
|
|||||||||
|
Unrealized gains on available-for-sale equity securities, net
|
—
|
|
24
|
|
25,872
|
|
—
|
|
25,896
|
|
|||||||||
|
Unrealized gains (losses) on interest rate hedge agreements:
|
|||||||||||||||||||
|
Unrealized interest rate hedge gains (losses) arising during the period
|
1,062
|
|
—
|
|
(250
|
)
|
—
|
|
812
|
|
|||||||||
|
Reclassification adjustment for amortization of interest expense included in net income
|
1,804
|
|
—
|
|
6
|
|
—
|
|
1,810
|
|
|||||||||
|
Unrealized gains (losses) on interest rate hedge agreements, net
|
2,866
|
|
—
|
|
(244
|
)
|
—
|
|
2,622
|
|
|||||||||
|
Unrealized gains on foreign currency translation:
|
|||||||||||||||||||
|
Unrealized foreign currency translation gains arising during the period
|
—
|
|
—
|
|
7,592
|
|
—
|
|
7,592
|
|
|||||||||
|
Reclassification adjustment for cumulative foreign currency translation losses included in net income upon sale or liquidation
|
—
|
|
—
|
|
2,421
|
|
—
|
|
2,421
|
|
|||||||||
|
Unrealized gains on foreign currency translation, net
|
—
|
|
—
|
|
10,013
|
|
—
|
|
10,013
|
|
|||||||||
|
Total other comprehensive income
|
2,866
|
|
24
|
|
35,641
|
|
—
|
|
38,531
|
|
|||||||||
|
Comprehensive income
|
132,571
|
|
239,792
|
|
314,238
|
|
(499,473
|
)
|
187,128
|
|
|||||||||
|
Less: comprehensive income attributable to noncontrolling interests
|
—
|
|
—
|
|
(18,914
|
)
|
—
|
|
(18,914
|
)
|
|||||||||
|
Comprehensive income attributable to Alexandria Real Estate Equities, Inc.’s common stockholders
|
$
|
132,571
|
|
$
|
239,792
|
|
$
|
295,324
|
|
$
|
(499,473
|
)
|
$
|
168,214
|
|
||||
49
|
15.
|
Condensed consolidating financial information (continued)
|
Condensed Consolidating Statement of Comprehensive Income
for the
Nine Months Ended September 30, 2016
(In thousands)
(Unaudited)
|
Alexandria
Real Estate
Equities, Inc.
(Issuer)
|
Alexandria
Real Estate
Equities, L.P.
(Guarantor
Subsidiary)
|
Combined
Non-
Guarantor
Subsidiaries
|
Eliminations
|
Consolidated
|
|||||||||||||||
|
Net (loss) income
|
$
|
(81,205
|
)
|
$
|
(6,167
|
)
|
$
|
37,290
|
|
$
|
(19,509
|
)
|
$
|
(69,591
|
)
|
||||
|
Other comprehensive loss
|
|||||||||||||||||||
|
Unrealized losses on available-for-sale equity securities:
|
|||||||||||||||||||
|
Unrealized holding gains (losses) arising during the period
|
—
|
|
136
|
|
(70,191
|
)
|
—
|
|
(70,055
|
)
|
|||||||||
|
Reclassification adjustment for losses (gains) included in net income
|
—
|
|
(148
|
)
|
(18,479
|
)
|
—
|
|
(18,627
|
)
|
|||||||||
|
Unrealized losses on available-for-sale equity securities, net
|
—
|
|
(12
|
)
|
(88,670
|
)
|
—
|
|
(88,682
|
)
|
|||||||||
|
Unrealized losses on interest rate hedge agreements:
|
|||||||||||||||||||
|
Unrealized interest rate hedge (losses) gains arising during the period
|
(7,658
|
)
|
—
|
|
3
|
|
—
|
|
(7,655
|
)
|
|||||||||
|
Reclassification adjustment for amortization of interest expense (income) included in net income
|
3,737
|
|
—
|
|
(12
|
)
|
—
|
|
3,725
|
|
|||||||||
|
Unrealized losses on interest rate hedge agreements, net
|
(3,921
|
)
|
—
|
|
(9
|
)
|
—
|
|
(3,930
|
)
|
|||||||||
|
Unrealized gains on foreign currency translation:
|
|||||||||||||||||||
|
Unrealized foreign currency translation gains arising during the period
|
—
|
|
—
|
|
842
|
|
—
|
|
842
|
|
|||||||||
|
Reclassification adjustment for cumulative foreign currency translation losses included in net (loss) income upon sale or liquidation
|
—
|
|
—
|
|
10,807
|
|
—
|
|
10,807
|
|
|||||||||
|
Unrealized gains on foreign currency translation, net
|
—
|
|
—
|
|
11,649
|
|
—
|
|
11,649
|
|
|||||||||
|
Total other comprehensive loss
|
(3,921
|
)
|
(12
|
)
|
(77,030
|
)
|
—
|
|
(80,963
|
)
|
|||||||||
|
Comprehensive loss
|
(85,126
|
)
|
(6,179
|
)
|
(39,740
|
)
|
(19,509
|
)
|
(150,554
|
)
|
|||||||||
|
Less: comprehensive income attributable to noncontrolling interests
|
—
|
|
—
|
|
(11,587
|
)
|
—
|
|
(11,587
|
)
|
|||||||||
|
Comprehensive loss attributable to Alexandria Real Estate Equities, Inc.’s common stockholders
|
$
|
(85,126
|
)
|
$
|
(6,179
|
)
|
$
|
(51,327
|
)
|
$
|
(19,509
|
)
|
$
|
(162,141
|
)
|
||||
50
|
15.
|
Condensed consolidating financial information (continued)
|
Condensed Consolidating Statement of Cash Flows
for the
Nine Months Ended September 30, 2017
(In thousands)
(Unaudited)
|
Alexandria Real
Estate Equities,
Inc. (Issuer)
|
Alexandria Real
Estate Equities,
L.P. (Guarantor
Subsidiary)
|
Combined
Non-Guarantor
Subsidiaries
|
Eliminations
|
Consolidated
|
|||||||||||||||
|
Operating Activities
|
|||||||||||||||||||
|
Net income
|
$
|
129,705
|
|
$
|
239,768
|
|
$
|
278,597
|
|
$
|
(499,473
|
)
|
$
|
148,597
|
|
||||
|
Adjustments to reconcile net income to net cash (used in) provided by operating activities:
|
|||||||||||||||||||
|
Depreciation and amortization
|
5,217
|
|
—
|
|
303,852
|
|
—
|
|
309,069
|
|
|||||||||
|
Loss on early extinguishment of debt
|
670
|
|
—
|
|
—
|
|
—
|
|
670
|
|
|||||||||
|
Gain on sales of real estate – rental properties
|
—
|
|
—
|
|
(270
|
)
|
—
|
|
(270
|
)
|
|||||||||
|
Impairment of real estate
|
—
|
|
—
|
|
203
|
|
—
|
|
203
|
|
|||||||||
|
Gain on sales of real estate – land parcels
|
—
|
|
—
|
|
(111
|
)
|
—
|
|
(111
|
)
|
|||||||||
|
Equity in earnings of unconsolidated real estate JVs
|
—
|
|
—
|
|
(15,050
|
)
|
—
|
|
(15,050
|
)
|
|||||||||
|
Distributions of earnings from unconsolidated real estate JVs
|
—
|
|
—
|
|
249
|
|
—
|
|
249
|
|
|||||||||
|
Amortization of loan fees
|
5,665
|
|
—
|
|
2,913
|
|
—
|
|
8,578
|
|
|||||||||
|
Amortization of debt discounts (premiums)
|
441
|
|
—
|
|
(2,314
|
)
|
—
|
|
(1,873
|
)
|
|||||||||
|
Amortization of acquired below-market leases
|
—
|
|
—
|
|
(14,908
|
)
|
—
|
|
(14,908
|
)
|
|||||||||
|
Deferred rent
|
—
|
|
—
|
|
(74,362
|
)
|
—
|
|
(74,362
|
)
|
|||||||||
|
Stock compensation expense
|
18,649
|
|
—
|
|
—
|
|
—
|
|
18,649
|
|
|||||||||
|
Equity in earnings of affiliates
|
(252,434
|
)
|
(242,345
|
)
|
(4,694
|
)
|
499,473
|
|
—
|
|
|||||||||
|
Investment gains
|
—
|
|
(17
|
)
|
(8,408
|
)
|
—
|
|
(8,425
|
)
|
|||||||||
|
Investment losses
|
—
|
|
2,599
|
|
3,819
|
|
—
|
|
6,418
|
|
|||||||||
|
Changes in operating assets and liabilities:
|
|
|
|||||||||||||||||
|
Restricted cash
|
(36
|
)
|
—
|
|
(876
|
)
|
—
|
|
(912
|
)
|
|||||||||
|
Tenant receivables
|
—
|
|
—
|
|
(224
|
)
|
—
|
|
(224
|
)
|
|||||||||
|
Deferred leasing costs
|
—
|
|
—
|
|
(39,925
|
)
|
—
|
|
(39,925
|
)
|
|||||||||
|
Other assets
|
(10,576
|
)
|
—
|
|
(86
|
)
|
—
|
|
(10,662
|
)
|
|||||||||
|
Accounts payable, accrued expenses, and tenant security deposits
|
(9,813
|
)
|
(9
|
)
|
40,441
|
|
—
|
|
30,619
|
|
|||||||||
|
Net cash (used in) provided by operating activities
|
(112,512
|
)
|
(4
|
)
|
468,846
|
|
—
|
|
356,330
|
|
|||||||||
|
Investing Activities
|
|||||||||||||||||||
|
Proceeds from sales of real estate
|
—
|
|
—
|
|
4,263
|
|
—
|
|
4,263
|
|
|||||||||
|
Additions to real estate
|
—
|
|
—
|
|
(660,877
|
)
|
—
|
|
(660,877
|
)
|
|||||||||
|
Purchases of real estate
|
—
|
|
—
|
|
(590,884
|
)
|
—
|
|
(590,884
|
)
|
|||||||||
|
Deposits for investing activities
|
—
|
|
—
|
|
4,700
|
|
—
|
|
4,700
|
|
|||||||||
|
Investments in subsidiaries
|
(753,137
|
)
|
(588,808
|
)
|
(12,160
|
)
|
1,354,105
|
|
—
|
|
|||||||||
|
Investments in unconsolidated real estate JVs
|
—
|
|
—
|
|
(248
|
)
|
—
|
|
(248
|
)
|
|||||||||
|
Return of capital from unconsolidated real estate JVs
|
—
|
|
—
|
|
38,576
|
|
—
|
|
38,576
|
|
|||||||||
|
Additions to investments
|
—
|
|
—
|
|
(128,190
|
)
|
—
|
|
(128,190
|
)
|
|||||||||
|
Sales of investments
|
—
|
|
204
|
|
18,692
|
|
—
|
|
18,896
|
|
|||||||||
|
Net cash used in investing activities
|
$
|
(753,137
|
)
|
$
|
(588,604
|
)
|
$
|
(1,326,128
|
)
|
$
|
1,354,105
|
|
$
|
(1,313,764
|
)
|
||||
51
|
15.
|
Condensed consolidating financial information (continued)
|
Condensed Consolidating Statement of Cash Flows (continued)
for the
Nine Months Ended September 30, 2017
(In thousands)
(Unaudited)
|
Alexandria Real
Estate Equities, Inc. (Issuer) |
Alexandria Real
Estate Equities, L.P. (Guarantor Subsidiary) |
Combined
Non-Guarantor Subsidiaries |
Eliminations
|
Consolidated
|
|||||||||||||||
|
Financing Activities
|
|||||||||||||||||||
|
Borrowings from secured notes payable
|
$
|
—
|
|
$
|
—
|
|
$
|
145,272
|
|
$
|
—
|
|
$
|
145,272
|
|
||||
|
Repayments of borrowings from secured notes payable
|
—
|
|
—
|
|
(2,882
|
)
|
—
|
|
(2,882
|
)
|
|||||||||
|
Proceeds from issuance of unsecured senior notes payable
|
424,384
|
|
—
|
|
—
|
|
—
|
|
424,384
|
|
|||||||||
|
Borrowings from unsecured senior line of credit
|
2,634,000
|
|
—
|
|
—
|
|
—
|
|
2,634,000
|
|
|||||||||
|
Repayments of borrowings from unsecured senior line of credit
|
(2,348,000
|
)
|
—
|
|
—
|
|
—
|
|
(2,348,000
|
)
|
|||||||||
|
Repayments of borrowings from unsecured senior bank term loans
|
(200,000
|
)
|
—
|
|
—
|
|
—
|
|
(200,000
|
)
|
|||||||||
|
Transfer to/from parent company
|
47,558
|
|
588,608
|
|
717,939
|
|
(1,354,105
|
)
|
—
|
|
|||||||||
|
Change in restricted cash related to financing activities
|
—
|
|
—
|
|
(10,467
|
)
|
—
|
|
(10,467
|
)
|
|||||||||
|
Payment of loan fees
|
(3,956
|
)
|
—
|
|
(387
|
)
|
—
|
|
(4,343
|
)
|
|||||||||
|
Repurchase of 7.00% Series D cumulative convertible preferred stock
|
(17,934
|
)
|
—
|
|
—
|
|
—
|
|
(17,934
|
)
|
|||||||||
|
Redemption of 6.45% Series E cumulative redeemable preferred stock
|
(130,350
|
)
|
—
|
|
—
|
|
—
|
|
(130,350
|
)
|
|||||||||
|
Proceeds from the issuance of common stock
|
705,391
|
|
—
|
|
—
|
|
—
|
|
705,391
|
|
|||||||||
|
Dividends on common stock
|
(229,814
|
)
|
—
|
|
—
|
|
—
|
|
(229,814
|
)
|
|||||||||
|
Dividends on preferred stock
|
(8,317
|
)
|
—
|
|
—
|
|
—
|
|
(8,317
|
)
|
|||||||||
|
Contributions from noncontrolling interests
|
—
|
|
—
|
|
9,877
|
|
—
|
|
9,877
|
|
|||||||||
|
Distributions to noncontrolling interests
|
—
|
|
—
|
|
(17,432
|
)
|
—
|
|
(17,432
|
)
|
|||||||||
|
Net cash provided by financing activities
|
872,962
|
|
588,608
|
|
841,920
|
|
(1,354,105
|
)
|
949,385
|
|
|||||||||
|
Effect of foreign exchange rate changes on cash and cash equivalents
|
—
|
|
—
|
|
1,579
|
|
—
|
|
1,579
|
|
|||||||||
|
Net increase (decrease) in cash and cash equivalents
|
7,313
|
|
—
|
|
(13,783
|
)
|
—
|
|
(6,470
|
)
|
|||||||||
|
Cash and cash equivalents as of the beginning of period
|
30,603
|
|
—
|
|
94,429
|
|
—
|
|
125,032
|
|
|||||||||
|
Cash and cash equivalents as of the end of period
|
$
|
37,916
|
|
$
|
—
|
|
$
|
80,646
|
|
$
|
—
|
|
$
|
118,562
|
|
||||
|
Supplemental Disclosure of Cash Flow Information:
|
|||||||||||||||||||
|
Cash paid during the period for interest, net of interest capitalized
|
$
|
67,091
|
|
$
|
—
|
|
$
|
19,141
|
|
$
|
—
|
|
$
|
86,232
|
|
||||
|
Non-Cash Investing Activities:
|
|||||||||||||||||||
|
Change in accrued construction
|
$
|
—
|
|
$
|
—
|
|
$
|
(38,767
|
)
|
$
|
—
|
|
$
|
(38,767
|
)
|
||||
|
Contribution of real estate to an unconsolidated real estate JV
|
$
|
—
|
|
$
|
—
|
|
$
|
6,998
|
|
$
|
—
|
|
$
|
6,998
|
|
||||
52
|
15.
|
Condensed consolidating financial information (continued)
|
Condensed Consolidating Statement of Cash Flows
for the
Nine Months Ended September 30, 2016
(In thousands)
(Unaudited)
|
Alexandria Real
Estate Equities,
Inc. (Issuer)
|
Alexandria Real
Estate Equities,
L.P. (Guarantor
Subsidiary)
|
Combined
Non-Guarantor
Subsidiaries
|
Eliminations
|
Consolidated
|
|||||||||||||||
|
Operating Activities
|
|||||||||||||||||||
|
Net (loss) income
|
$
|
(81,205
|
)
|
$
|
(6,167
|
)
|
$
|
37,290
|
|
$
|
(19,509
|
)
|
$
|
(69,591
|
)
|
||||
|
Adjustments to reconcile net (loss) income to net cash (used in) provided by operating activities:
|
|||||||||||||||||||
|
Depreciation and amortization
|
4,997
|
|
—
|
|
213,171
|
|
—
|
|
218,168
|
|
|||||||||
|
Loss on early extinguishment of debt
|
3,230
|
|
—
|
|
—
|
|
—
|
|
3,230
|
|
|||||||||
|
Impairment of real estate
|
—
|
|
—
|
|
193,237
|
|
—
|
|
193,237
|
|
|||||||||
|
Gain on sale of real estate – land parcels
|
—
|
|
—
|
|
(90
|
)
|
—
|
|
(90
|
)
|
|||||||||
|
Equity in losses of unconsolidated real estate JVs
|
—
|
|
—
|
|
270
|
|
—
|
|
270
|
|
|||||||||
|
Distributions of earnings from unconsolidated real estate JVs
|
—
|
|
—
|
|
286
|
|
—
|
|
286
|
|
|||||||||
|
Amortization of loan fees
|
5,826
|
|
—
|
|
2,966
|
|
—
|
|
8,792
|
|
|||||||||
|
Amortization of debt discounts (premiums)
|
353
|
|
—
|
|
(470
|
)
|
—
|
|
(117
|
)
|
|||||||||
|
Amortization of acquired below-market leases
|
—
|
|
—
|
|
(2,905
|
)
|
—
|
|
(2,905
|
)
|
|||||||||
|
Deferred rent
|
—
|
|
—
|
|
(30,679
|
)
|
—
|
|
(30,679
|
)
|
|||||||||
|
Stock compensation expense
|
19,007
|
|
—
|
|
—
|
|
—
|
|
19,007
|
|
|||||||||
|
Equity in earnings of affiliates
|
(25,889
|
)
|
6,282
|
|
98
|
|
19,509
|
|
—
|
|
|||||||||
|
Investment gains
|
—
|
|
(566
|
)
|
(28,155
|
)
|
—
|
|
(28,721
|
)
|
|||||||||
|
Investment losses
|
—
|
|
188
|
|
10,482
|
|
—
|
|
10,670
|
|
|||||||||
|
Changes in operating assets and liabilities:
|
|
|
|
|
|||||||||||||||
|
Restricted cash
|
(16
|
)
|
—
|
|
(262
|
)
|
—
|
|
(278
|
)
|
|||||||||
|
Tenant receivables
|
—
|
|
—
|
|
843
|
|
—
|
|
843
|
|
|||||||||
|
Deferred leasing costs
|
—
|
|
—
|
|
(21,621
|
)
|
—
|
|
(21,621
|
)
|
|||||||||
|
Other assets
|
(8,332
|
)
|
—
|
|
(6,481
|
)
|
—
|
|
(14,813
|
)
|
|||||||||
|
Accounts payable, accrued expenses, and tenant security deposits
|
(35,351
|
)
|
(592
|
)
|
42,106
|
|
—
|
|
6,163
|
|
|||||||||
|
Net cash (used in) provided by operating activities
|
(117,380
|
)
|
(855
|
)
|
410,086
|
|
—
|
|
291,851
|
|
|||||||||
|
Investing Activities
|
|||||||||||||||||||
|
Proceeds from sales of real estate
|
—
|
|
—
|
|
27,332
|
|
—
|
|
27,332
|
|
|||||||||
|
Additions to real estate
|
—
|
|
—
|
|
(638,568
|
)
|
—
|
|
(638,568
|
)
|
|||||||||
|
Purchase of real estate
|
—
|
|
—
|
|
(18,108
|
)
|
—
|
|
(18,108
|
)
|
|||||||||
|
Deposits for investing activities
|
—
|
|
—
|
|
(54,998
|
)
|
—
|
|
(54,998
|
)
|
|||||||||
|
Investments in subsidiaries
|
(301,852
|
)
|
(365,132
|
)
|
(7,405
|
)
|
674,389
|
|
—
|
|
|||||||||
|
Investments in unconsolidated real estate JVs
|
—
|
|
—
|
|
(6,924
|
)
|
—
|
|
(6,924
|
)
|
|||||||||
|
Additions to investments
|
—
|
|
—
|
|
(68,384
|
)
|
—
|
|
(68,384
|
)
|
|||||||||
|
Sales of investments
|
—
|
|
1,174
|
|
34,121
|
|
—
|
|
35,295
|
|
|||||||||
|
Repayment of notes receivable
|
—
|
|
—
|
|
9,054
|
|
—
|
|
9,054
|
|
|||||||||
|
Net cash used in investing activities
|
$
|
(301,852
|
)
|
$
|
(363,958
|
)
|
$
|
(723,880
|
)
|
$
|
674,389
|
|
$
|
(715,301
|
)
|
||||
53
|
15.
|
Condensed consolidating financial information (continued)
|
Condensed Consolidating Statement of Cash Flows (continued)
for the
Nine Months Ended September 30, 2016
(In thousands)
(Unaudited)
|
Alexandria Real
Estate Equities,
Inc. (Issuer)
|
Alexandria Real
Estate Equities,
L.P. (Guarantor
Subsidiary)
|
Combined
Non-Guarantor
Subsidiaries
|
Eliminations
|
Consolidated
|
|||||||||||||||
|
Financing Activities
|
|||||||||||||||||||
|
Borrowings from secured notes payable
|
$
|
—
|
|
$
|
—
|
|
$
|
215,330
|
|
$
|
—
|
|
$
|
215,330
|
|
||||
|
Repayments of borrowings from secured notes payable
|
—
|
|
—
|
|
(234,096
|
)
|
—
|
|
(234,096
|
)
|
|||||||||
|
Proceeds from issuance of unsecured senior notes payable
|
348,604
|
|
—
|
|
—
|
|
—
|
|
348,604
|
|
|||||||||
|
Borrowings from unsecured senior line of credit
|
2,349,000
|
|
—
|
|
—
|
|
—
|
|
2,349,000
|
|
|||||||||
|
Repayments of borrowings from unsecured senior line of credit
|
(2,084,000
|
)
|
—
|
|
—
|
|
—
|
|
(2,084,000
|
)
|
|||||||||
|
Repayment of borrowings from unsecured bank term loans
|
(200,000
|
)
|
—
|
|
—
|
|
—
|
|
(200,000
|
)
|
|||||||||
|
Transfer to/from parent company
|
(69,139
|
)
|
364,813
|
|
378,715
|
|
(674,389
|
)
|
—
|
|
|||||||||
|
Change in restricted cash related to financing activities
|
—
|
|
—
|
|
7,742
|
|
—
|
|
7,742
|
|
|||||||||
|
Payment of loan fees
|
(12,401
|
)
|
—
|
|
(4,098
|
)
|
—
|
|
(16,499
|
)
|
|||||||||
|
Repurchase of 7.00% Series D cumulative convertible preferred stock
|
(98,633
|
)
|
—
|
|
—
|
|
—
|
|
(98,633
|
)
|
|||||||||
|
Proceeds from the issuance of common stock
|
367,802
|
|
—
|
|
—
|
|
—
|
|
367,802
|
|
|||||||||
|
Dividends on common stock
|
(177,966
|
)
|
—
|
|
—
|
|
—
|
|
(177,966
|
)
|
|||||||||
|
Dividends on preferred stock
|
(17,487
|
)
|
—
|
|
—
|
|
—
|
|
(17,487
|
)
|
|||||||||
|
Financing costs paid for sale of noncontrolling interests
|
—
|
|
—
|
|
(8,093
|
)
|
—
|
|
(8,093
|
)
|
|||||||||
|
Contributions from and sale of noncontrolling interests
|
—
|
|
—
|
|
68,621
|
|
—
|
|
68,621
|
|
|||||||||
|
Distributions to and purchase of noncontrolling interests
|
—
|
|
—
|
|
(62,605
|
)
|
—
|
|
(62,605
|
)
|
|||||||||
|
Net cash provided by financing activities
|
405,780
|
|
364,813
|
|
361,516
|
|
(674,389
|
)
|
457,720
|
|
|||||||||
|
Effect of foreign exchange rate changes on cash and cash equivalents
|
—
|
|
—
|
|
(1,440
|
)
|
—
|
|
(1,440
|
)
|
|||||||||
|
Net (decrease) increase in cash and cash equivalents
|
(13,452
|
)
|
—
|
|
46,282
|
|
—
|
|
32,830
|
|
|||||||||
|
Cash and cash equivalents as of the beginning of period
|
31,982
|
|
—
|
|
93,116
|
|
—
|
|
125,098
|
|
|||||||||
|
Cash and cash equivalents as of the end of period
|
$
|
18,530
|
|
$
|
—
|
|
$
|
139,398
|
|
$
|
—
|
|
$
|
157,928
|
|
||||
|
Supplemental Disclosure of Cash Flow Information:
|
|||||||||||||||||||
|
Cash paid during the period for interest, net of interest capitalized
|
$
|
58,062
|
|
$
|
—
|
|
$
|
758
|
|
$
|
—
|
|
$
|
58,820
|
|
||||
|
Non-Cash Investing Activities:
|
|||||||||||||||||||
|
Change in accrued construction
|
$
|
—
|
|
$
|
—
|
|
$
|
23,023
|
|
$
|
—
|
|
$
|
23,023
|
|
||||
|
Non-Cash Financing Activities:
|
|||||||||||||||||||
|
Redemption of redeemable noncontrolling interests
|
$
|
—
|
|
$
|
—
|
|
$
|
(5,000
|
)
|
$
|
—
|
|
$
|
(5,000
|
)
|
||||
54
Certain information and statements included in this quarterly report on Form 10‑Q, including, without limitation, statements containing the words “forecast,” “guidance,” “projects,” “estimates,” “anticipates,” “believes,” “expects,” “intends,” “may,” “plans,” “seeks,” “should,” or “will,” or the negative of these words or similar words, constitute “forward-looking statements” within the meaning of Section 27A of the Securities Act of 1933, as amended, and Section 21E of the Securities Exchange Act of 1934, as amended. Forward-looking statements involve inherent risks and uncertainties regarding events, conditions, and financial trends that may affect our future plans of operations, business strategy, results of operations, and financial position. A number of important factors could cause actual results to differ materially from those included within or contemplated by the forward-looking statements, including, but not limited to, the following:
|
•
|
Operating factors such as a failure to operate our business successfully in comparison to market expectations or in comparison to our competitors, our inability to obtain capital when desired or refinance debt maturities when desired, and/or a failure to maintain our status as a REIT for federal tax purposes.
|
|
•
|
Market and industry factors such as adverse developments concerning the life science and technology industries and/or our tenants.
|
|
•
|
Government factors such as any unfavorable effects resulting from federal, state, local, and/or foreign government policies, laws, and/or funding levels.
|
|
•
|
Global factors such as negative economic, political, financial, credit market, and/or banking conditions.
|
|
•
|
Other factors such as climate change, cyber intrusions, and/or changes in laws, regulations, and financial accounting standards.
|
This list of risks and uncertainties is not exhaustive. Additional information regarding risk factors that may affect us is included under “Item 1A. Risk Factors” and “Item 7. Management’s Discussion and Analysis of Financial Condition and Results of Operations” in our annual report on Form 10‑K for the fiscal year ended
December 31, 2016
. Readers of this quarterly report on Form 10‑Q should also read our other documents filed publicly with the SEC for further discussion regarding such factors.
55
Overview
We are a Maryland corporation formed in October 1994 that has elected to be taxed as a REIT for federal income tax purposes. W
e are an
S&P 500
®
urban office REIT uniquely focused on collaborative life science and technology campuses in AAA innovation cluster locations with a total market capitalization of
$16.1 billion
and an asset base in North America of
28.6 million
SF as of
September 30, 2017
. The asset base in North America includes
20.6 million
RSF of operating properties, including
1.5 million
RSF of development and redevelopment of new Class A properties currently undergoing construction. Additionally, the asset base in North America includes
8.0 million
SF of future development projects, including
1.1 million
SF of near-term projects undergoing marketing for lease and pre-construction activities and
3.3 million
SF of intermediate-term development projects. Founded in 1994, we pioneered this niche and have since established a significant market presence in key locations, including Greater Boston, San Francisco, New York City, San Diego, Seattle, Maryland, and Research Triangle Park. We have a longstanding and proven track record of developing Class A properties clustered in urban life science and technology campuses that provide our innovative tenants with highly dynamic and collaborative environments that enhance their ability to successfully recruit and retain world-class talent and inspire productivity, efficiency, creativity, and success. We believe these advantages result in higher occupancy levels, longer lease terms, higher rental income, higher returns, and greater long-term asset value.
As of
September 30, 2017
:
|
•
|
Investment-grade tenants represented
50%
of our total annual rental revenue;
|
|
•
|
Approximately
97%
of our leases (on an RSF basis) were triple net leases, which require tenants to pay substantially all real estate taxes, insurance, utilities, common area expenses, and other operating expenses (including increases thereto) in addition to base rent;
|
|
•
|
Approximately
95%
of our leases (on an RSF basis) contained effective annual rent escalations that were either fixed (generally ranging from
3%
to
3.5%
)
or indexed based on a consumer price index or other index; and
|
|
•
|
Approximately
94%
of our leases (on an RSF basis)
provided for the recapture of capital expenditures (such as HVAC systems maintenance and/or replacement, roof replacement, and parking lot resurfacing) that we believe would typically be borne by the landlord in traditional office leases.
|
Our primary business objective is to maximize stockholder value by providing our stockholders with the greatest possible total return and long-term asset value based on a multifaceted platform of internal and external growth. A key element of our strategy is our unique focus on Class A properties clustered in urban campuses. These key urban campus locations are characterized by high barriers to entry for new landlords, high barriers to exit for tenants, and a limited supply of available space. They represent highly desirable locations for tenancy by life science and technology entities because of their close proximity to concentrations of specialized skills, knowledge, institutions, and related businesses. Our strategy also includes drawing upon our deep and broad real estate, life science, and technology relationships in order to identify and attract new and leading tenants and to source additional value-creation real estate.
Executive summary
“Green Star” designation from the Global Real Estate Sustainability Benchmark (“GRESB”)
During the
three months ended September 30, 2017
, we were awarded a “Green Star” designation by GRESB and recognized as the top-ranked company in the U.S. in the GRESB Health & Well-being Module for our practices promoting the health, safety, and well-being of our tenants, employees, and partners.
Increased common stock dividend
Common stock dividend for the
three months ended September 30, 2017
, of
$0.86
per common share, up
6 cents
, or
8%
, over the
three months ended September 30, 2016
; continuation of our strategy to share growth in cash flows from operating activities with our stockholders while also retaining a significant portion for reinvestment.
56
Strong internal growth
|
•
|
Total revenues:
|
|
•
|
$285.4 million
, up
23.9%
, for the
three months ended September 30, 2017
, compared to
$230.4 million
for the
three months ended September 30, 2016
|
|
•
|
$829.3 million
, up
23.3%
, for the
nine months ended September 30, 2017
, compared to
$672.5 million
for the
nine months ended September 30, 2016
|
|
•
|
Executed key leases during the three months ended
September 30, 2017
:
|
|
•
|
199,846
RSF at our development project at 100 Binney Street in our Cambridge submarket, including
130,803
RSF leased to Facebook, Inc.
|
|
•
|
153,203
RSF renewal and expansion at 455 Mission Bay Boulevard South with Nektar Therapeutics in our Mission Bay/SoMa submarket
|
|
•
|
84,550
RSF at 10300 Campus Point Drive, in our University Town Center submarket
|
•
Continued substantial leasing activity and strong rental rate growth, in light of minimal contractual lease expirations for 2017, and a highly leased value-creation pipeline:
|
Three Months Ended September 30, 2017
|
Nine Months Ended September 30, 2017
|
|||||
|
Total leasing activity – RSF
|
786,925
|
|
3,189,483
|
|
||
|
Lease renewals and re-leasing of space:
|
||||||
|
Rental rate increases
|
24.2%
|
|
25.2%
|
|
||
|
Rental rate increases (cash basis)
|
10.0%
|
|
13.3%
|
|
||
|
RSF (included in total leasing activity above)
|
448,472
|
|
1,931,477
|
|
||
|
•
|
Same property net operating income growth:
|
|
•
|
2.2%
and
7.8%
(cash basis) for the
three months ended September 30, 2017
, compared to the
three months ended September 30, 2016
|
|
•
|
2.3%
and
6.2%
(cash basis) for the
nine months ended September 30, 2017
, compared to the
nine months ended September 30, 2016
|
Strong external growth; disciplined allocation of capital to visible, multiyear, highly leased value-creation pipeline
|
•
|
Key development projects placed into service during the three months ended
September 30, 2017
, weighted toward the end of the quarter:
|
|
•
|
341,776
RSF, 100% leased to Bristol-Myers Squibb Company and Facebook, Inc. at 100 Binney Street in our Cambridge submarket; expect delivery of the remaining
91,155
RSF, 100% leased in the first quarter of 2018; improvements in initial stabilized yield and initial stabilized yield (cash basis) of
50
and
40
bps to
8.2%
and
7.4%
, respectively, primarily driven by 18% cost savings from (i) redesign of space, (ii) competitive bidding and project management, and (iii) lower amount of office/laboratory space and higher office space; and
|
|
•
|
17,620
RSF leased to ClubCorp Holdings, Inc. at 400 Dexter Avenue North in our Lake Union submarket.
|
|
•
|
81%
leased on
1.5 million
RSF development and redevelopment projects undergoing construction.
|
|
•
|
Deliveries of new Class A properties drive significant growth in net operating income:
|
|
Delivery Date
|
RSF
|
Percentage Leased
|
Incremental Annual Net Operating Income
|
||||||
|
YTD 3Q17
|
663,672
|
100%
|
$51 million
|
||||||
|
4Q17
|
651,738
|
95%
|
$38 million to $42 million
|
||||||
|
•
|
Development and redevelopment projects recently placed into service will drive contractual growth in cash rents aggregating
$70 million
, of which
$60 million
will commence through the third quarter of 2018 (
$10 million
in the fourth quarter of 2017,
$23 million
in first quarter of 2018,
$14 million
in the second quarter of 2018, and
$13 million
in the third quarter of 2018).
|
|
•
|
Completed strategic acquisitions of four development and redevelopment properties during the three months ended
September 30, 2017
, for an aggregate purchase price of
$110.7 million
, consisting of: (i) a future development project aggregating
280,000
RSF in our South San Francisco submarket, (ii) two properties aggregating
203,757
RSF, including
59,173
RSF of space undergoing redevelopment in our Route 128 submarket, and (iii) a redevelopment project consisting of
45,039
RSF in our Rockville submarket.
|
57
Operating results
|
Three Months Ended September 30,
|
Nine Months Ended September 30,
|
||||||||||||||||||||||||||||
|
2017
|
2016
|
Change
|
2017
|
2016
|
Change
|
||||||||||||||||||||||||
|
Net income (loss) attributable to Alexandria’s common stockholders – diluted:
|
|||||||||||||||||||||||||||||
|
In millions
|
$
|
51.3
|
|
$
|
5.5
|
|
$
|
45.8
|
|
N/A
|
|
$
|
108.6
|
|
$
|
(126.0
|
)
|
$
|
234.6
|
|
N/A
|
|
|||||||
|
Per share
|
$
|
0.55
|
|
$
|
0.07
|
|
$
|
0.48
|
|
N/A
|
|
$
|
1.20
|
|
$
|
(1.69
|
)
|
$
|
2.89
|
|
N/A
|
|
|||||||
|
Funds from operations attributable to Alexandria’s common stockholders – diluted, as adjusted:
|
|||||||||||||||||||||||||||||
|
In millions
|
$
|
140.8
|
|
$
|
107.6
|
|
$
|
33.1
|
|
30.8
|
%
|
$
|
407.5
|
|
$
|
305.8
|
|
$
|
101.7
|
|
33.3
|
%
|
|||||||
|
Per share
|
$
|
1.51
|
|
$
|
1.39
|
|
$
|
0.12
|
|
8.6
|
%
|
$
|
4.49
|
|
$
|
4.09
|
|
$
|
0.40
|
|
9.8
|
%
|
|||||||
The operating results shown above include certain items related to corporate-level investing and financing decisions. Refer to the tabular presentation of these items at the beginning of the “Results of Operations” section within this Item 2 for additional information.
Core operating metrics and internal growth as of and for the three months ended
September 30, 2017
|
•
|
Percentage of annual rental revenue in effect from:
|
|
•
|
Investment-grade tenants:
50%
|
|
•
|
Class A properties in AAA locations:
78%
|
|
•
|
Occupancy in North America:
96.1%
|
|
•
|
Operating margin:
71%
|
|
•
|
Adjusted EBITDA margin:
68%
|
|
•
|
Weighted-average remaining lease term of Top 20 tenants:
13.2
years
|
Balance sheet management
Key metrics
|
As of
|
|||||
|
September 30, 2017
|
|||||
|
Total market capitalization
|
$
|
16.1
|
billion
|
||
|
Liquidity
|
$
|
1.7
|
billion
|
||
|
Net debt to Adjusted EBITDA:
|
|||||
|
Quarter annualized
|
6.1x
|
|
|||
|
Trailing 12 months
|
6.4x
|
|
|||
|
Fixed-charge coverage ratio:
|
|||||
|
Quarter annualized
|
4.1x
|
|
|||
|
Trailing 12 months
|
4.0x
|
|
|||
|
Unhedged variable-rate debt as a percentage of total debt
|
12%
|
|
|||
|
Current and future value-creation pipeline as a percentage of gross investments in real estate in North America
|
12%
|
|
|||
Key capital events
|
•
|
In August 2017, we entered into an ATM common stock program that allows us to sell up to an aggregate of
$750.0 million
of our common stock. During the
three months ended September 30, 2017
, we sold an aggregate of
2.1 million
shares of common stock for gross proceeds of
$249.9 million
, or
$119.94
per share, and received net proceeds of
$245.8 million
. As of
September 30, 2017
, we had
$500.1 million
available for future sales of common stock under the ATM program.
|
58
Corporate social responsibility and industry leadership
|
•
|
48%
of total annual rental revenue is expected from LEED
®
certified projects upon completion of
13
in-process projects.
|
|
•
|
During the
three months ended September 30, 2017
, we were awarded a “Green Star” designation by GRESB and recognized as the top-ranked company in the U.S. in the GRESB Health & Well-being Module for our practices promoting the health, safety, and well-being of our tenants, employees, and partners. Our GRESB score exceeded that of both the U.S. listed average REIT and the global GRESB average.
|
|
•
|
During
three months ended September 30, 2017
, we expanded our support of the U.S. military with the kickoff of the future headquarters of The Honor Foundation in San Diego, in partnership with the Navy SEAL Foundation. We will provide 8,000 RSF of collaborative and innovative space at 11055 Roselle Street located in our Sorrento Valley submarket, where the organization will offer programs and events to help transition Navy SEALs and other U.S. Special Operations personnel back into private-sector jobs and careers.
|
59
Incremental annual net operating income from development and redevelopment of new Class A properties
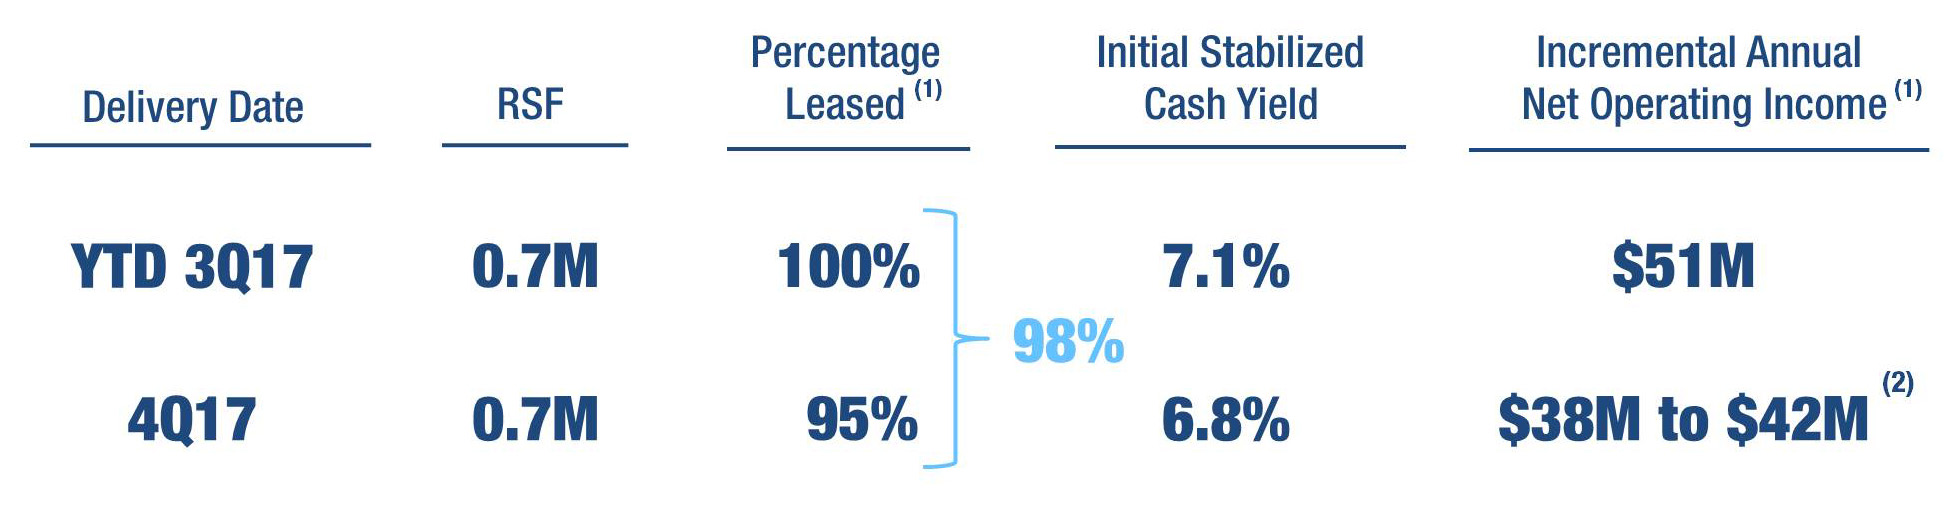
|
(1)
|
RSF and percentage leased represent 100% of each property. Incremental annual net operating income represents incremental annual net operating income upon stabilization of our development and redevelopment of new Class A properties, including only our share of real estate joint venture projects. Deliveries of space with multi-tenant development projects are included in each respective period of delivery.
|
|
(2)
|
Expected deliveries of projects are weighted toward the middle of the quarter.
91,155
RSF at 100 Binney Street in our Cambridge submarket will be placed in service in the first quarter of 2018.
|
60
Operating summary
|
Favorable Lease Structure
(1)
|
Same Property Net Operating Income Growth
|
|||||||||

|
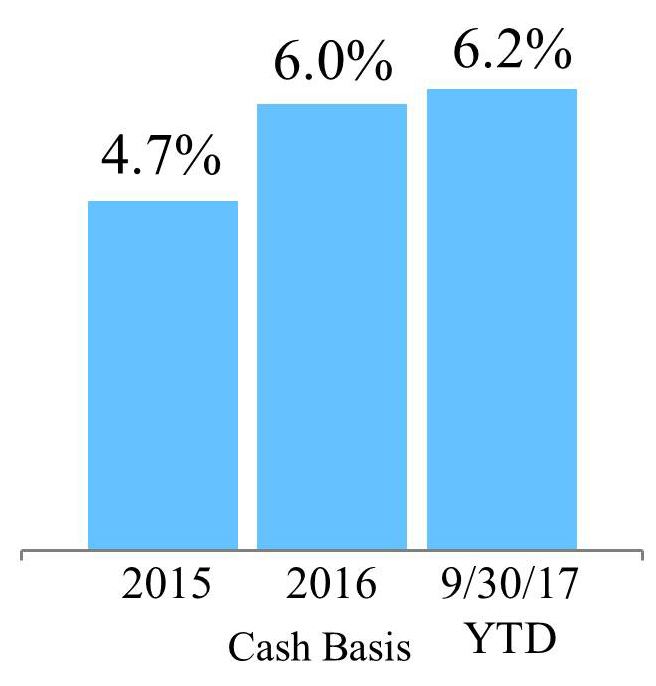
|
|||||||||
|
Stable cash flows
|
||||||||||
|
Percentage of triple
net leases
|
97%
|
|||||||||
|
Increasing cash flows
|
||||||||||
|
Percentage of leases containing annual rent escalations
|
95%
|
|||||||||
|
Lower capex burden
|
||||||||||
|
Percentage of leases providing for the recapture of capital expenditures
|
94%
|
|||||||||
|
Margins
(2)
|
Rental Rate Growth:
Renewed/Re-Leased Space |
|||||||||
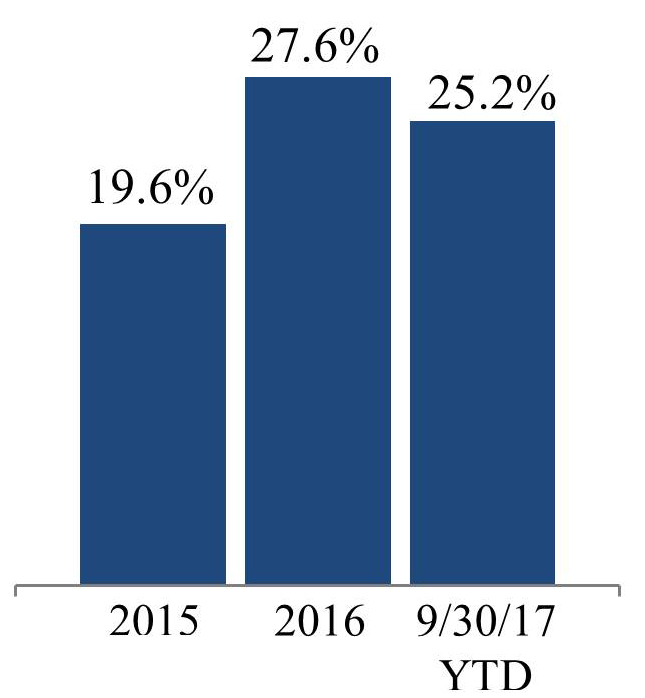
|
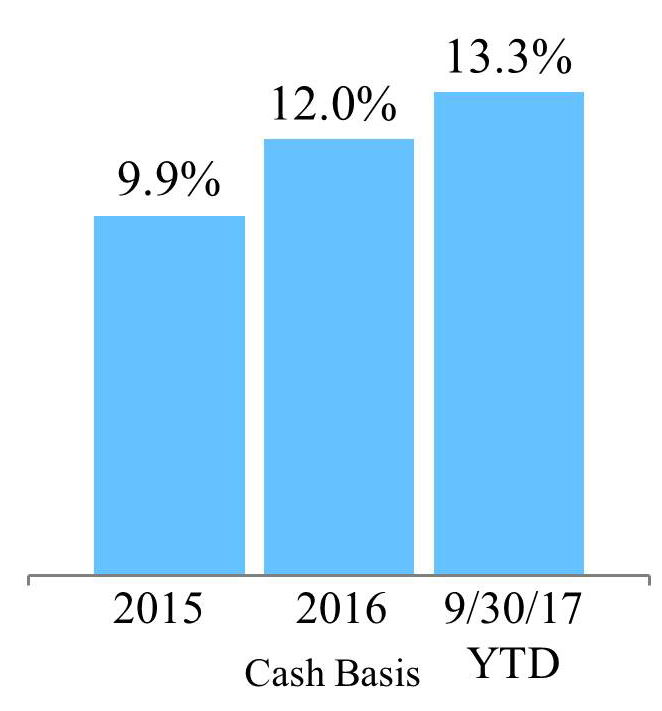
|
|||||||||
|
Adjusted EBITDA
|
Operating
|
|||||||||
|
68%
|
71%
|
|||||||||
|
(1)
|
Percentages calculated based on RSF
as of September 30, 2017
.
|
|
(2)
|
Represents the
three months ended September 30, 2017
.
|
61
|
Cash Flows from High-Quality, Diverse, and Innovative Tenants
|
||||
|
Annual Rental Revenue from Investment-Grade Tenants
(1)
A REIT Industry-Leading Tenant Roster
|
||||
|
50
|
%
|
|||
|
Tenant Mix
|
||||
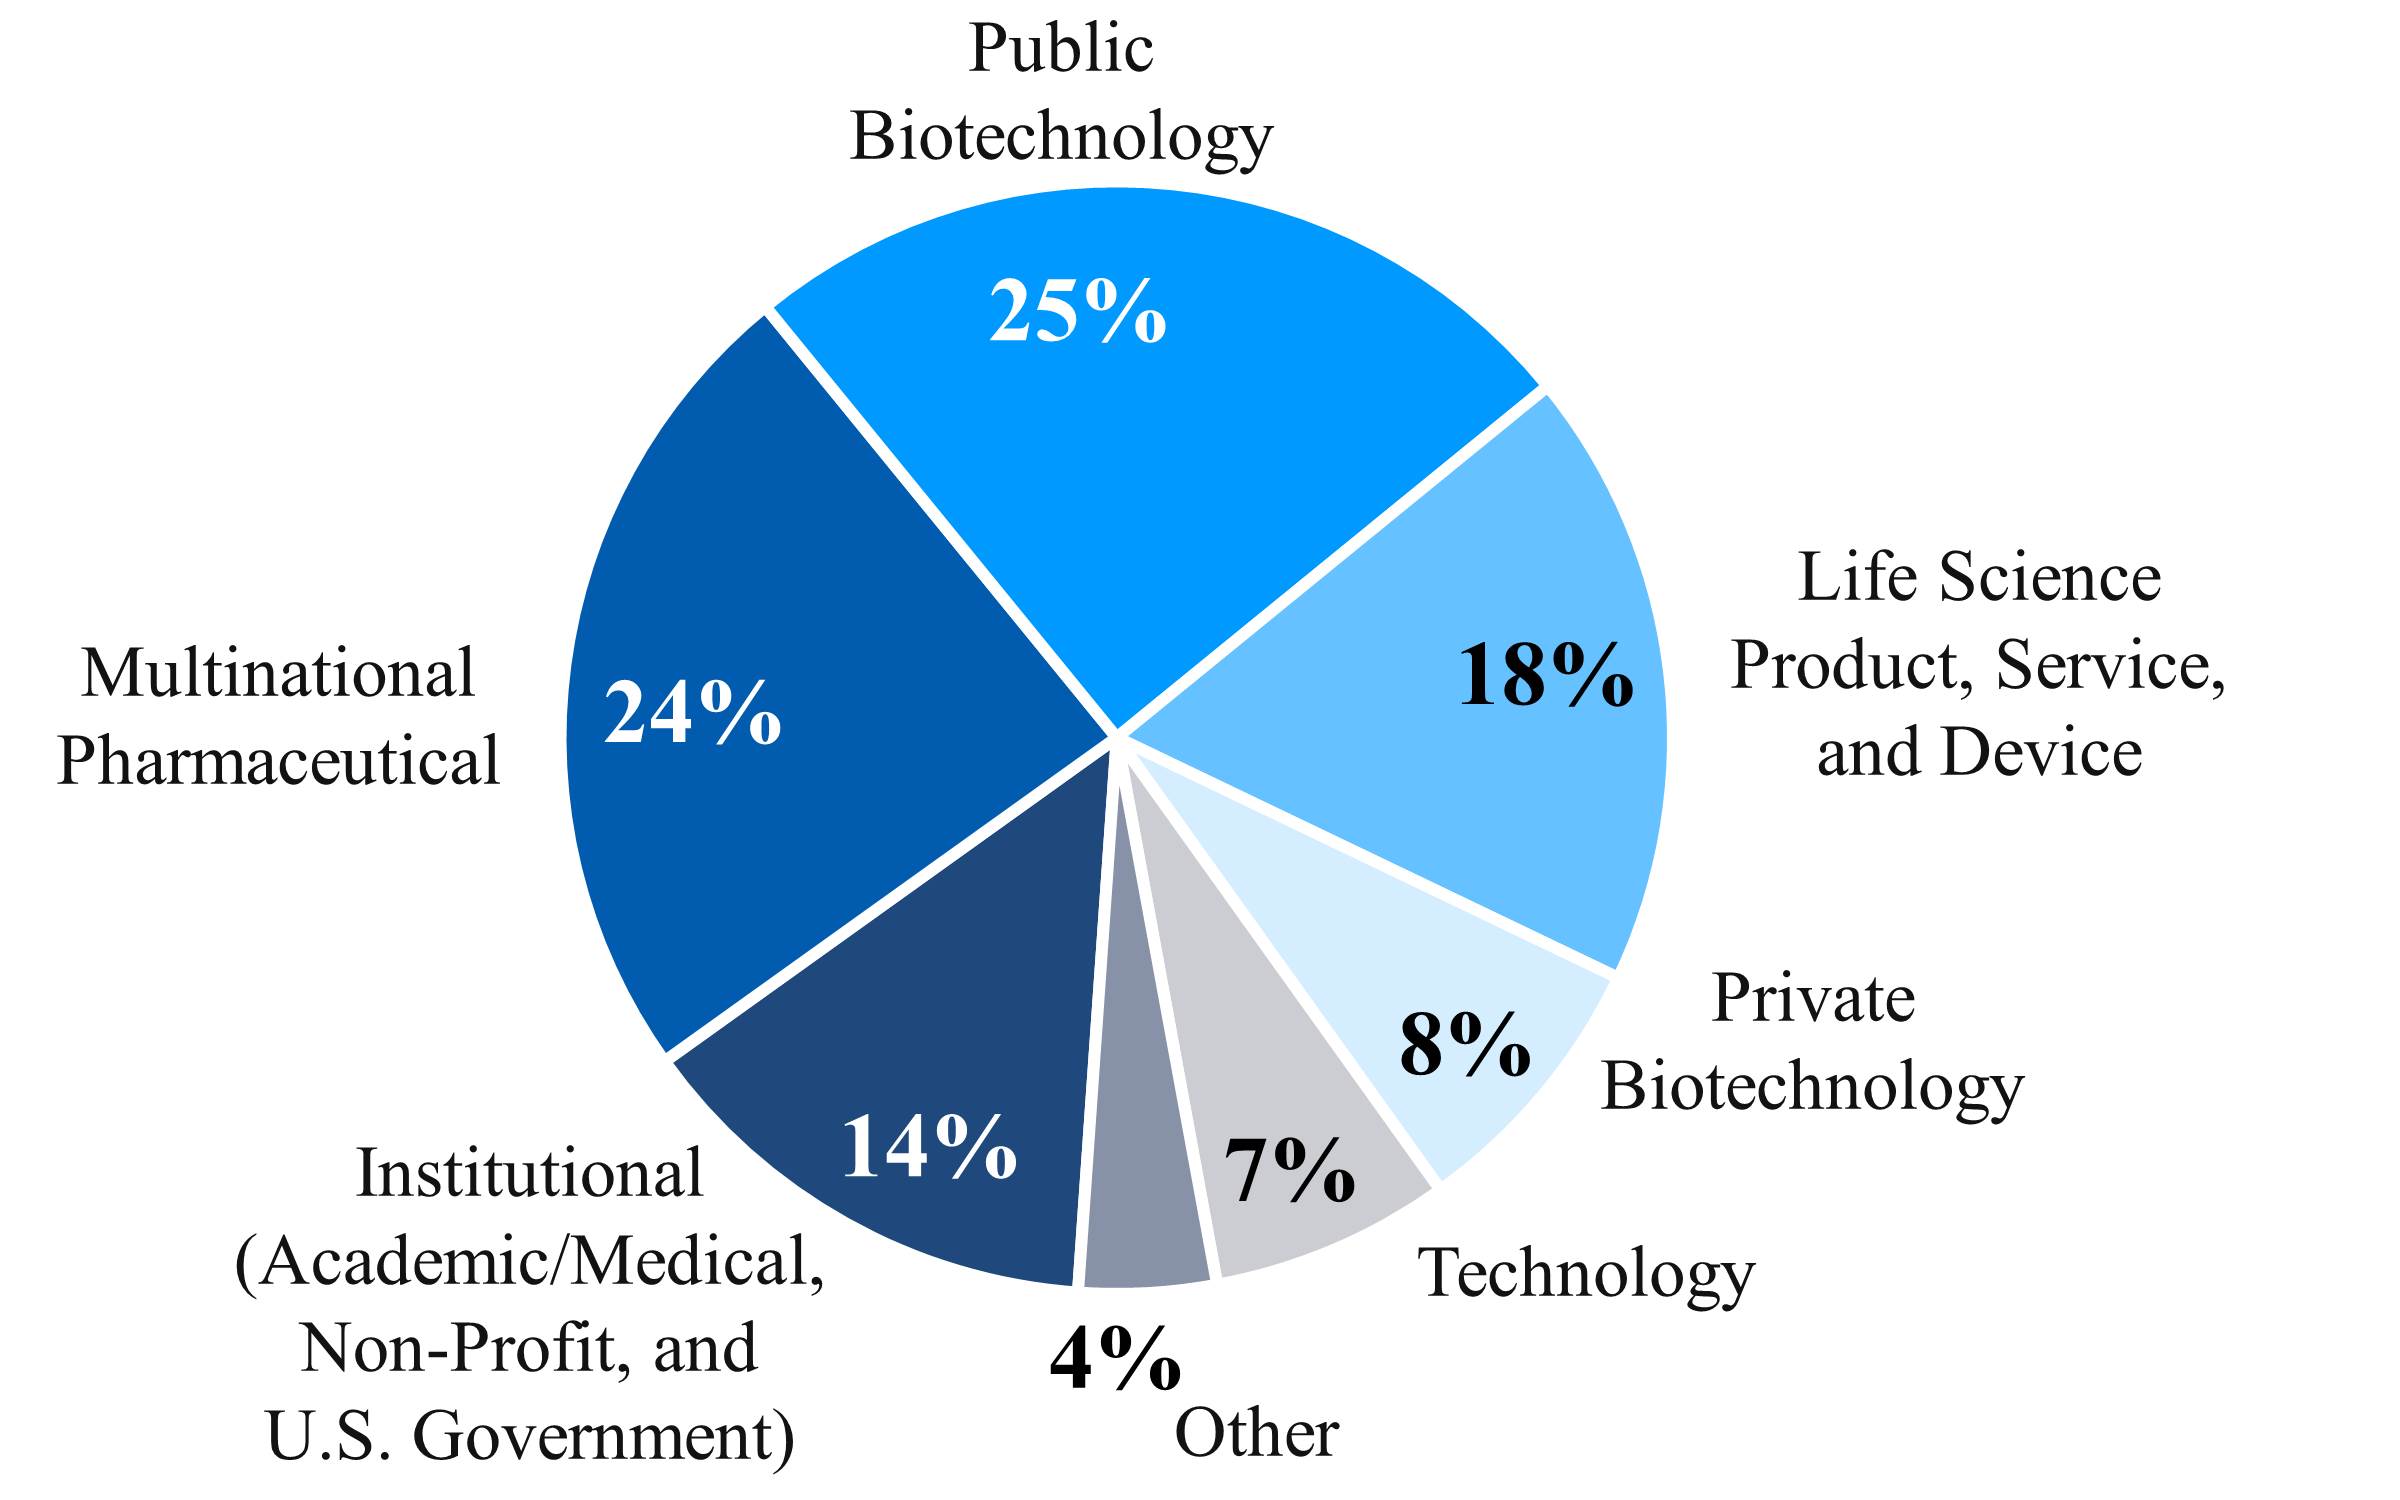
|
||||
|
Percentage of ARE’s Annual Rental Revenue
(1)
|
||||
|
(1)
|
Represents annual rental revenue in effect as of
September 30, 2017
.
|
62
|
High-Quality Cash Flows from Class A Properties in AAA Locations
|
|
|
Class A Properties in
AAA Locations
|
AAA Locations
|

|
|
|
78%
|
|
|
of ARE’s
Annual Rental Revenue (1) |
|
|
Percentage of ARE’s Annual Rental Revenue
(1)
|
|
|
Solid Demand for Class A Properties
in AAA Locations Drives Solid Occupancy
|
|
|
Solid Historical
Occupancy (2) |
Occupancy across Key Locations
|
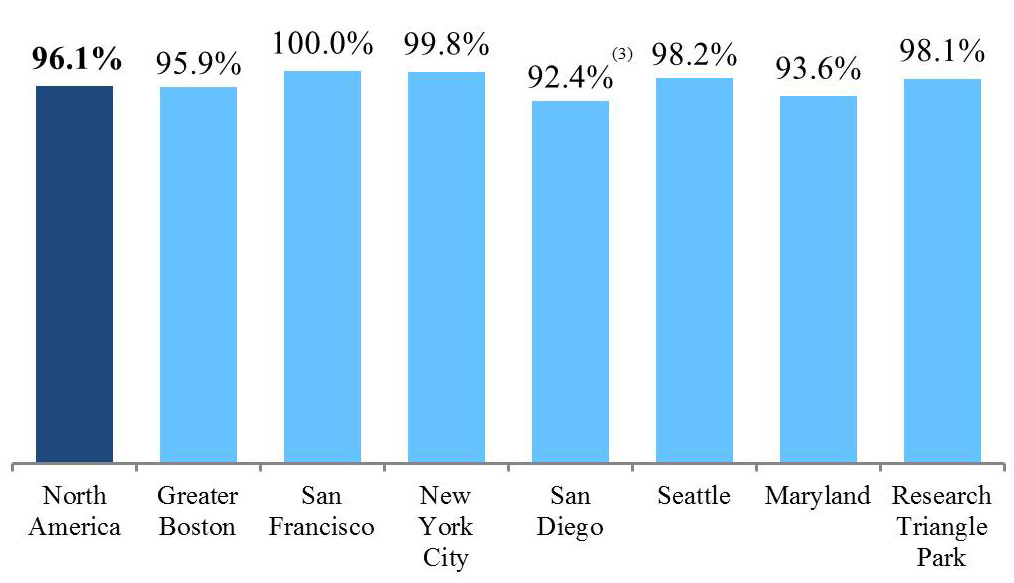
|
|
|
95%
|
|
|
Over 10 Years
|
|
|
Occupancy of Operating Properties as of
September 30, 2017
|
|
|
(1)
|
Represents annual rental revenue in effect as of
September 30, 2017
.
|
|
(2)
|
Average occupancy of operating properties in North America as of each December 31 for the last 10 years and as of
September 30, 2017
.
|
|
(3)
|
In December 2016, Eli Lilly and Company vacated
125,409
RSF, or 3% of RSF in San Diego, at 10300 Campus Point Drive in our University Town Center submarket and relocated and expanded into
305,006
RSF at 10290 Campus Point Drive.
|
63
Leasing
The following table summarizes our leasing activity at our properties:
|
Three Months Ended
|
Nine Months Ended
|
Year Ended
|
||||||||||||||||||||||
|
September 30, 2017
|
September 30, 2017
|
December 31, 2016
|
||||||||||||||||||||||
|
Including
Straight-Line Rent
|
Cash Basis
|
Including
Straight-Line Rent |
Cash Basis
|
Including
Straight-Line Rent
|
Cash Basis
|
|||||||||||||||||||
|
(Dollars per RSF)
|
||||||||||||||||||||||||
|
Leasing activity:
|
||||||||||||||||||||||||
|
Renewed/re-leased space
(1)
|
|
|
|
|
|
|
|
|
|
|
|
|
||||||||||||
|
Rental rate changes
|
24.2%
|
|
10.0%
|
|
25.2%
|
|
13.3%
|
|
27.6%
|
|
12.0%
|
|
||||||||||||
|
New rates
|
$
|
59.84
|
|
$
|
57.59
|
|
$
|
51.30
|
|
$
|
48.24
|
|
$
|
48.60
|
|
$
|
45.83
|
|
||||||
|
Expiring rates
|
$
|
48.19
|
|
$
|
52.37
|
|
$
|
40.97
|
|
$
|
42.56
|
|
$
|
38.09
|
|
$
|
40.92
|
|
||||||
|
Rentable square footage
|
448,472
|
|
1,931,477
|
|
2,129,608
|
|
||||||||||||||||||
|
Tenant improvements/leasing commissions
|
$
|
18.52
|
|
$
|
19.54
|
|
(2)
|
$
|
15.69
|
|
||||||||||||||
|
Weighted-average lease term
|
6.4 years
|
|
6.2 years
|
|
5.5 years
|
|
||||||||||||||||||
|
Developed/redeveloped/previously vacant space leased
|
||||||||||||||||||||||||
|
New rates
|
$
|
57.81
|
|
$
|
56.65
|
|
$
|
36.19
|
|
$
|
32.92
|
|
$
|
50.24
|
|
$
|
38.72
|
|
||||||
|
Rentable square footage
|
338,453
|
|
1,258,006
|
|
1,260,459
|
|
||||||||||||||||||
|
Tenant improvements/leasing commissions
|
$
|
11.95
|
|
$
|
8.57
|
|
$
|
12.42
|
|
|||||||||||||||
|
Weighted-average lease term
|
8.0 years
|
|
9.5 years
|
|
32.6 years
|
|
(3)
|
|||||||||||||||||
|
Leasing activity summary (totals):
|
||||||||||||||||||||||||
|
New rates
|
$
|
58.97
|
|
$
|
57.19
|
|
$
|
45.34
|
|
$
|
42.20
|
|
$
|
49.21
|
|
$
|
43.19
|
|
||||||
|
Rentable square footage
|
786,925
|
|
3,189,483
|
|
(4)
|
3,390,067
|
|
|||||||||||||||||
|
Tenant improvements/leasing commissions
|
$
|
15.70
|
|
$
|
15.21
|
|
$
|
14.48
|
|
|||||||||||||||
|
Weighted-average lease term
|
7.1 years
|
|
7.5 years
|
|
15.6 years
|
|
||||||||||||||||||
|
Lease expirations:
(1)
|
||||||||||||||||||||||||
|
Expiring rates
|
$
|
49.19
|
|
$
|
53.16
|
|
$
|
40.27
|
|
$
|
41.75
|
|
$
|
36.70
|
|
$
|
39.32
|
|
||||||
|
Rentable square footage
|
470,165
|
|
2,228,871
|
|
2,484,169
|
|
||||||||||||||||||
Leasing activity includes 100% of results for properties managed by us. Refer to the “Non-GAAP Measures and Definitions” section within this Item 2 for a description of the basis used to compute the measures above.
|
(1)
|
Excludes
29
month-to-month leases for
51,968
RSF and
20
month-to-month leases for
31,207
RSF as of
September 30, 2017
, and December 31,
2016
, respectively.
|
|
(2)
|
Includes approximately
$9.7 million
, or
$17.40
per RSF, of leasing commissions related to lease renewals and re-leasing space for five leases in our Greater Boston and San Francisco markets with a weighted average lease term of
10
years and rental rate increases of
28.1%
and
20.5%
(cash basis).
|
|
(3)
|
2016 information includes the 75-year ground lease with Uber at 1455 and 1515 Third Street. The average lease term excluding this ground lease was 10.7 years.
|
|
(4)
|
During the
nine months ended September 30, 2017
, we granted tenant concessions/free rent averaging
2.1
months with respect to the
3,189,483
RSF leased. Approximately
70%
of the leases executed during the
nine months ended September 30, 2017
, did not include concessions for free rent.
|
64
Summary of contractual lease expirations
The following table summarizes information with respect to the contractual lease expirations at our properties as of
September 30, 2017
:
|
Year
|
Number of Leases
|
RSF
|
Percentage of
Occupied RSF |
Annual Rental Revenue
(per RSF) |
Percentage of Total
Annual Rental Revenue |
|||||||||||||||||||||||
|
2017
|
(1)
|
12
|
|
160,013
|
|
0.9
|
%
|
$
|
49.71
|
|
0.9
|
%
|
||||||||||||||||
|
2018
|
105
|
|
1,349,740
|
|
7.4
|
%
|
$
|
38.46
|
|
6.1
|
%
|
|||||||||||||||||
|
2019
|
84
|
|
1,419,777
|
|
7.7
|
%
|
$
|
41.06
|
|
6.9
|
%
|
|||||||||||||||||
|
2020
|
104
|
|
1,861,344
|
|
10.1
|
%
|
$
|
38.48
|
|
8.4
|
%
|
|||||||||||||||||
|
2021
|
85
|
|
1,665,047
|
|
9.1
|
%
|
$
|
42.01
|
|
8.2
|
%
|
|||||||||||||||||
|
2022
|
72
|
|
1,325,010
|
|
7.2
|
%
|
$
|
44.54
|
|
6.9
|
%
|
|||||||||||||||||
|
2023
|
40
|
|
1,703,829
|
|
9.3
|
%
|
$
|
42.50
|
|
8.5
|
%
|
|||||||||||||||||
|
2024
|
29
|
|
1,349,860
|
|
7.4
|
%
|
$
|
48.49
|
|
7.7
|
%
|
|||||||||||||||||
|
2025
|
18
|
|
545,918
|
|
3.0
|
%
|
$
|
50.38
|
|
3.2
|
%
|
|||||||||||||||||
|
2026
|
16
|
|
699,825
|
|
3.8
|
%
|
$
|
45.68
|
|
3.8
|
%
|
|||||||||||||||||
|
Thereafter
|
61
|
|
6,267,531
|
|
34.1
|
%
|
$
|
53.27
|
|
39.4
|
%
|
|||||||||||||||||
|
Lease expirations include 100% of the RSF for each property managed by us in North America.
|
||||||||||||||||||||||||||||
|
(1)
|
Excludes
29
month-to-month leases for
51,968
RSF as of
September 30, 2017
.
|
The following tables present information by market with respect to our lease expirations in North America as of
September 30, 2017
, for the remainder of 2017 and all of 2018:
|
2017 Contractual Lease Expirations
|
Annual Rental Revenue
(per RSF) |
||||||||||||||||||
|
|
Leased
|
Negotiating/
Anticipating |
Targeted for
Development/Redevelopment |
Remaining
Expiring Leases |
Total
(1)
|
||||||||||||||
|
Market
|
|||||||||||||||||||
|
Greater Boston
|
33,291
|
|
11,894
|
|
—
|
|
36,506
|
|
81,691
|
|
$
|
46.78
|
|
||||||
|
San Francisco
|
—
|
|
—
|
|
—
|
|
—
|
|
—
|
|
—
|
|
|||||||
|
New York City
|
9,131
|
|
—
|
|
—
|
|
—
|
|
9,131
|
|
N/A
|
|
|||||||
|
San Diego
|
3,514
|
|
—
|
|
—
|
|
24,581
|
|
28,095
|
|
37.79
|
|
|||||||
|
Seattle
|
—
|
|
—
|
|
—
|
|
6,180
|
|
6,180
|
|
52.89
|
|
|||||||
|
Maryland
|
14,141
|
|
—
|
|
—
|
|
—
|
|
14,141
|
|
22.27
|
|
|||||||
|
Research Triangle Park
|
—
|
|
—
|
|
—
|
|
—
|
|
—
|
|
—
|
|
|||||||
|
Canada
|
—
|
|
—
|
|
—
|
|
—
|
|
—
|
|
—
|
|
|||||||
|
Non-cluster markets
|
—
|
|
—
|
|
—
|
|
20,775
|
|
20,775
|
|
24.45
|
|
|||||||
|
Total
|
60,077
|
|
11,894
|
|
—
|
|
88,042
|
|
160,013
|
|
$
|
49.71
|
|
||||||
|
Percentage of expiring leases
|
38
|
%
|
7
|
%
|
—
|
%
|
55
|
%
|
100
|
%
|
|||||||||
|
2018 Contractual Lease Expirations
|
Annual Rental Revenue
(per RSF) |
||||||||||||||||||
|
Leased
|
Negotiating/
Anticipating |
Targeted for
Development/Redevelopment |
Remaining
Expiring Leases |
Total
|
|||||||||||||||
|
Market
|
|||||||||||||||||||
|
Greater Boston
|
23,419
|
|
57,160
|
|
—
|
|
209,405
|
|
(2)
|
289,984
|
|
$
|
58.15
|
|
|||||
|
San Francisco
|
35,562
|
|
54,569
|
|
321,971
|
|
(3)
|
73,502
|
|
485,604
|
|
35.26
|
|
||||||
|
New York City
|
—
|
|
—
|
|
—
|
|
6,821
|
|
6,821
|
|
N/A
|
|
|||||||
|
San Diego
|
15,741
|
|
20,220
|
|
—
|
|
274,570
|
|
(4)
|
310,531
|
|
34.04
|
|
||||||
|
Seattle
|
—
|
|
15,264
|
|
—
|
|
—
|
|
15,264
|
|
43.66
|
|
|||||||
|
Maryland
|
5,104
|
|
49,852
|
|
—
|
|
31,986
|
|
86,942
|
|
20.45
|
|
|||||||
|
Research Triangle Park
|
—
|
|
—
|
|
—
|
|
62,760
|
|
62,760
|
|
25.94
|
|
|||||||
|
Canada
|
—
|
|
19,992
|
|
—
|
|
60,697
|
|
80,689
|
|
21.00
|
|
|||||||
|
Non-cluster markets
|
—
|
|
—
|
|
—
|
|
11,145
|
|
11,145
|
|
26.02
|
|
|||||||
|
Total
|
79,826
|
|
217,057
|
|
321,971
|
|
730,886
|
|
1,349,740
|
|
$
|
38.46
|
|
||||||
|
Percentage of expiring leases
|
6
|
%
|
16
|
%
|
24
|
%
|
54
|
%
|
100
|
%
|
|||||||||
|
Lease expirations include 100% of the RSF for each property managed by us in North America. Annual rental revenue (per RSF) represents amounts in effect as of September 30, 2017.
|
|||||||||||||||||||
|
(1)
|
Excludes
29
month-to-month leases for
51,968
RSF as of
September 30, 2017
.
|
|
(2)
|
Includes
186,769
RSF located in our Cambridge submarket for the remaining expiring leases in 2018, of which no single expiring lease is greater than 30,000 RSF. Lease expirations aggregating
46,356
RSF at 161 First Street will remain unoccupied until the completion of the adjacent 50 Rogers Street residential development project.
|
|
(3)
|
Includes
195,000
RSF expiring during the three months ended March 31, 2018, at 960 Industrial Road, a recently acquired property located in our Greater Stanford submarket. We are pursuing entitlements aggregating
500,000
RSF for a multi-building development. Also includes
126,971
RSF of office space targeted for redevelopment into office/laboratory space upon expiration of the existing lease in the three months ended September 30, 2018, at 681 Gateway Boulevard in our South San Francisco submarket. Concurrent with our redevelopment, we anticipate expanding the building by an additional 15,000 to 30,000 RSF and expect the project to be delivered in 2019.
|
|
(4)
|
The two largest expiring leases in 2018 are
71,510
RSF in January 2018 at 9880 Campus Point Drive in our University Town Center submarket, which is under evaluation for options to renovate the building to create a Class A office/laboratory property, and
56,698
RSF at 6138/6150 Nancy Ridge Drive in our Sorrento Mesa submarket, which we are currently marketing.
|
65
Top 20 tenants
77%
of Top 20 Annual Rental Revenue from Investment-Grade Tenants
Our properties are leased to a high-quality and diverse group of tenants, with no individual tenant accounting for more than
4.0%
of our annual rental revenue in effect as of
September 30, 2017
. The following table sets forth information regarding leases with our 20 largest tenants in North America based upon annual rental revenue in effect as of
September 30, 2017
(dollars in thousands):
|
Remaining Lease Term in Years
(1)
|
Aggregate RSF
|
Annual Rental Revenue
(1)
|
Percentage of Aggregate Annual Rental Revenue
(1)
|
Investment-Grade Ratings
|
||||||||||||||||||
|
Tenant
|
Moody’s
|
S&P
|
||||||||||||||||||||
|
1
|
|
Illumina, Inc.
|
12.8
|
|
891,495
|
|
$
|
34,484
|
|
4.0%
|
—
|
BBB
|
||||||||||
|
2
|
|
Takeda Pharmaceutical Company Ltd.
|
12.5
|
|
386,111
|
|
30,610
|
|
3.5
|
A1
|
A-
|
|||||||||||
|
3
|
|
Eli Lilly and Company
|
12.1
|
|
469,266
|
|
29,334
|
|
3.4
|
A2
|
AA-
|
|||||||||||
|
4
|
|
Bristol-Myers Squibb Company
|
10.2
|
|
460,050
|
|
28,758
|
|
3.3
|
A2
|
A+
|
|||||||||||
|
5
|
|
Novartis AG
|
9.1
|
|
377,831
|
|
28,627
|
|
3.3
|
Aa3
|
AA-
|
|||||||||||
|
6
|
|
Sanofi
|
10.5
|
|
446,975
|
|
25,205
|
|
2.9
|
A1
|
AA
|
|||||||||||
|
7
|
|
Uber Technologies, Inc.
|
75.2
|
|
(2)
|
422,980
|
|
22,130
|
|
2.5
|
—
|
—
|
||||||||||
|
8
|
|
New York University
|
12.9
|
|
209,224
|
|
20,651
|
|
2.4
|
Aa2
|
AA-
|
|||||||||||
|
9
|
|
bluebird bio, Inc.
|
9.3
|
|
262,261
|
|
20,101
|
|
2.3
|
—
|
—
|
|||||||||||
|
10
|
|
Roche
|
4.4
|
|
343,861
|
|
17,597
|
|
2.0
|
A1
|
AA
|
|||||||||||
|
11
|
|
Amgen Inc.
|
6.5
|
|
407,369
|
|
16,838
|
|
1.9
|
Baa1
|
A
|
|||||||||||
|
12
|
|
Massachusetts Institute of Technology
|
7.7
|
|
256,126
|
|
16,729
|
|
1.9
|
Aaa
|
AAA
|
|||||||||||
|
13
|
|
Celgene Corporation
|
5.9
|
|
360,014
|
|
15,276
|
|
1.8
|
Baa2
|
BBB+
|
|||||||||||
|
14
|
|
United States Government
|
7.8
|
|
264,358
|
|
15,007
|
|
1.7
|
Aaa
|
AA+
|
|||||||||||
|
15
|
|
FibroGen, Inc.
|
6.1
|
|
234,249
|
|
14,198
|
|
1.6
|
—
|
—
|
|||||||||||
|
16
|
|
Biogen Inc.
|
11.0
|
|
305,212
|
|
13,278
|
|
1.5
|
Baa1
|
A-
|
|||||||||||
|
17
|
|
Juno Therapeutics, Inc.
|
11.5
|
|
241,276
|
|
12,619
|
|
1.5
|
—
|
—
|
|||||||||||
|
18
|
|
The Regents of the University of California
|
5.9
|
|
233,527
|
|
10,733
|
|
1.2
|
Aa2
|
AA
|
|||||||||||
|
19
|
|
Merrimack Pharmaceuticals, Inc.
|
1.5
|
|
(3)
|
141,432
|
|
9,998
|
|
1.2
|
—
|
—
|
||||||||||
|
20
|
|
Foundation Medicine, Inc.
(4)
|
6.4
|
|
171,446
|
|
9,910
|
|
1.1
|
—
|
(4)
|
—
|
(4)
|
|||||||||
|
Total/weighted average
|
13.2
|
|
(5)
|
6,885,063
|
|
$
|
392,083
|
|
45.0%
|
|||||||||||||
Annual rental revenue and RSF include 100% of each property managed by us in North America.
|
(1)
|
Based on percentage of aggregate annual rental revenue in effect as of
September 30, 2017
.
|
|
(2)
|
Represents a ground lease with Uber Technologies, Inc. at 1455 and 1515 Third Street.
|
|
(3)
|
Tenant added through the acquisition of a nine-building campus at Alexandria Center
®
at One Kendall Square, located in our Cambridge submarket.
|
|
(4)
|
As of June 30, 2017, Roche (A1/AA) owned approximately 59% of the outstanding stock of Foundation Medicine, Inc.
|
|
(5)
|
Excluding the ground lease to Uber Technologies, Inc., the weighted-average remaining lease term for our top 20 tenants was
9.4
years as of
September 30, 2017
.
|
66
Locations of properties
The locations of our properties are diversified among a number of life science and technology cluster markets. The following table sets forth the total RSF, number of properties, and annual rental revenue in effect as of
September 30, 2017
, in North America of our properties by market (dollars in thousands, except per RSF amounts):
|
RSF
|
Number of Properties
|
Annual Rental Revenue
|
|||||||||||||||||||||||||||
|
Market
|
Operating
|
Development
|
Redevelopment
|
Total
|
% of Total
|
Total
|
% of Total
|
Per RSF
|
|||||||||||||||||||||
|
Greater Boston
|
6,135,551
|
|
91,155
|
|
59,173
|
|
6,285,879
|
|
30
|
%
|
53
|
|
$
|
360,005
|
|
41
|
%
|
$
|
61.19
|
|
|||||||||
|
San Francisco
|
3,738,400
|
|
750,930
|
|
—
|
|
4,489,330
|
|
22
|
|
34
|
|
171,661
|
|
20
|
|
45.92
|
|
|||||||||||
|
New York City
|
727,674
|
|
—
|
|
—
|
|
727,674
|
|
4
|
|
2
|
|
63,128
|
|
7
|
|
86.93
|
|
|||||||||||
|
San Diego
|
3,892,451
|
|
170,523
|
|
163,648
|
|
4,226,622
|
|
21
|
|
52
|
|
137,174
|
|
16
|
|
38.16
|
|
|||||||||||
|
Seattle
|
1,006,705
|
|
31,215
|
|
—
|
|
1,037,920
|
|
5
|
|
11
|
|
47,671
|
|
5
|
|
48.21
|
|
|||||||||||
|
Maryland
|
2,085,196
|
|
—
|
|
45,039
|
|
2,130,235
|
|
10
|
|
29
|
|
50,706
|
|
6
|
|
25.99
|
|
|||||||||||
|
Research Triangle Park
|
1,043,726
|
|
—
|
|
175,000
|
|
1,218,726
|
|
6
|
|
16
|
|
25,371
|
|
3
|
|
24.77
|
|
|||||||||||
|
Canada
|
256,967
|
|
—
|
|
—
|
|
256,967
|
|
1
|
|
3
|
|
6,562
|
|
1
|
|
25.75
|
|
|||||||||||
|
Non-cluster markets
|
268,689
|
|
—
|
|
—
|
|
268,689
|
|
1
|
|
6
|
|
6,060
|
|
1
|
|
25.46
|
|
|||||||||||
|
North America
|
19,155,359
|
|
1,043,823
|
|
442,860
|
|
20,642,042
|
|
100
|
%
|
206
|
|
$
|
868,338
|
|
100
|
%
|
$
|
47.19
|
|
|||||||||
RSF, number of properties, and annual rental revenue include 100% of each property managed by us in North America.
Summary of occupancy percentages in North America
The following table sets forth the occupancy percentages for our operating assets and our assets under redevelopment in each of our North America markets as of the following dates:
|
|
Operating Properties
|
Operating and Redevelopment Properties
|
||||||||||||||||
|
Market
|
9/30/17
|
6/30/17
|
9/30/16
|
9/30/17
|
6/30/17
|
9/30/16
|
||||||||||||
|
Greater Boston
|
95.9
|
%
|
96.2
|
%
|
98.3
|
%
|
95.0
|
%
|
96.2
|
%
|
98.3
|
%
|
||||||
|
San Francisco
|
100.0
|
|
99.6
|
|
99.8
|
|
100.0
|
|
99.6
|
|
99.8
|
|
||||||
|
New York City
|
99.8
|
|
99.3
|
|
95.0
|
|
99.8
|
|
99.3
|
|
95.0
|
|
||||||
|
San Diego
|
92.4
|
|
(1)
|
91.7
|
|
93.0
|
|
88.6
|
|
88.0
|
|
81.1
|
|
|||||
|
Seattle
|
98.2
|
|
97.2
|
|
98.4
|
|
98.2
|
|
97.2
|
|
98.4
|
|
||||||
|
Maryland
|
93.6
|
|
93.0
|
|
97.4
|
|
91.6
|
|
93.0
|
|
97.4
|
|
||||||
|
Research Triangle Park
|
98.1
|
|
|
95.9
|
|
98.7
|
|
84.0
|
|
82.1
|
|
98.7
|
|
|||||
|
Subtotal
|
96.1
|
|
95.7
|
|
97.3
|
|
93.9
|
|
94.0
|
|
94.4
|
|
||||||
|
Canada
|
99.2
|
|
99.2
|
|
99.3
|
|
99.2
|
|
99.2
|
|
99.3
|
|
||||||
|
Non-cluster markets
|
88.6
|
|
88.4
|
|
88.2
|
|
88.6
|
|
88.4
|
|
88.2
|
|
||||||
|
North America
|
96.1
|
%
|
95.7
|
%
|
97.1
|
%
|
93.9
|
%
|
94.0
|
%
|
94.4
|
%
|
||||||
Occupancy includes 100% of each property managed by us in North America.
|
(1)
|
In December 2016, Eli Lilly and Company vacated
125,409
RSF or 3% of RSF in San Diego, at 10300 Campus Point Drive in our University Town Center submarket and relocated and expanded into
305,006
RSF at 10290 Campus Point Drive.
|
67
Investments in real estate
A key component of our business model is our disciplined allocation of capital to the development and redevelopment of new Class A properties located in world-class collaborative life science and technology campuses in AAA urban innovation clusters. These projects are focused on providing high-quality, generic, and reusable spaces that meet the real estate requirements of, and are reusable by, a wide range of tenants. Upon completion, each value-creation project is expected to generate a significant increase in rental income, net operating income, and cash flows. Our development and redevelopment projects are generally in locations that are highly desirable to high-quality entities, which we believe results in higher occupancy levels, longer lease terms, higher rental income, higher returns, and greater long-term asset values. Our pre-construction activities are undertaken in order to get the property ready for its intended use, and include such activities as developing plans or obtaining permits. Our investments in real estate consisted of the following as of
September 30, 2017
(dollars in thousands):
|
Investments in Real Estate
|
Square Feet
|
|||||||||||
|
Consolidated
|
Unconsolidated
(1)
|
Total
|
||||||||||
|
Investments in real estate:
|
||||||||||||
|
Rental properties
|
$
|
10,387,875
|
|
18,944,650
|
|
210,709
|
|
19,155,359
|
|
|||
|
Development and redevelopment of new Class A properties:
|
||||||||||||
|
Undergoing construction
|
||||||||||||
|
Development projects – target delivery in 2017
|
466,047
|
|
651,738
|
|
—
|
|
651,738
|
|
||||
|
Development projects – target delivery in 2018 and 2019
|
143,038
|
|
392,085
|
|
—
|
|
392,085
|
|
||||
|
1,043,823
|
|
—
|
|
1,043,823
|
|
|||||||
|
Redevelopment projects – target delivery in 2018 and 2019
|
59,224
|
|
442,860
|
|
—
|
|
442,860
|
|
||||
|
20,431,333
|
|
210,709
|
|
20,642,042
|
|
|||||||
|
Near-term projects undergoing marketing and pre-construction: target delivery in 2018 and 2019
|
114,954
|
|
1,148,000
|
|
—
|
|
1,148,000
|
|
||||
|
Intermediate-term development projects
|
333,870
|
|
3,263,653
|
|
—
|
|
3,263,653
|
|
||||
|
Future development projects
|
289,314
|
|
3,981,362
|
|
—
|
|
3,981,362
|
|
||||
|
Portion of developable square feet that will replace existing RSF included in rental properties
(2)
|
N/A
|
|
(451,310
|
)
|
—
|
|
(451,310
|
)
|
||||
|
7,941,705
|
|
—
|
|
7,941,705
|
|
|||||||
|
Gross investments in real estate
|
11,794,322
|
|
28,373,038
|
|
210,709
|
|
28,583,747
|
|
||||
|
Less: accumulated depreciation
|
(1,785,115
|
)
|
||||||||||
|
Net investments in real estate – North America
|
10,009,207
|
|
||||||||||
|
Net investments in real estate – Asia
|
37,314
|
|
||||||||||
|
Investments in real estate
|
$
|
10,046,521
|
|
|||||||||
|
(1)
|
Our share of the cost basis associated with unconsolidated square feet is classified in investments in unconsolidated real estate joint ventures in our unaudited consolidated balance sheets.
|
|
(2)
|
Refer to footnotes 2 through 4 on the “Summary of Pipeline” section within this Item 2.
|
68
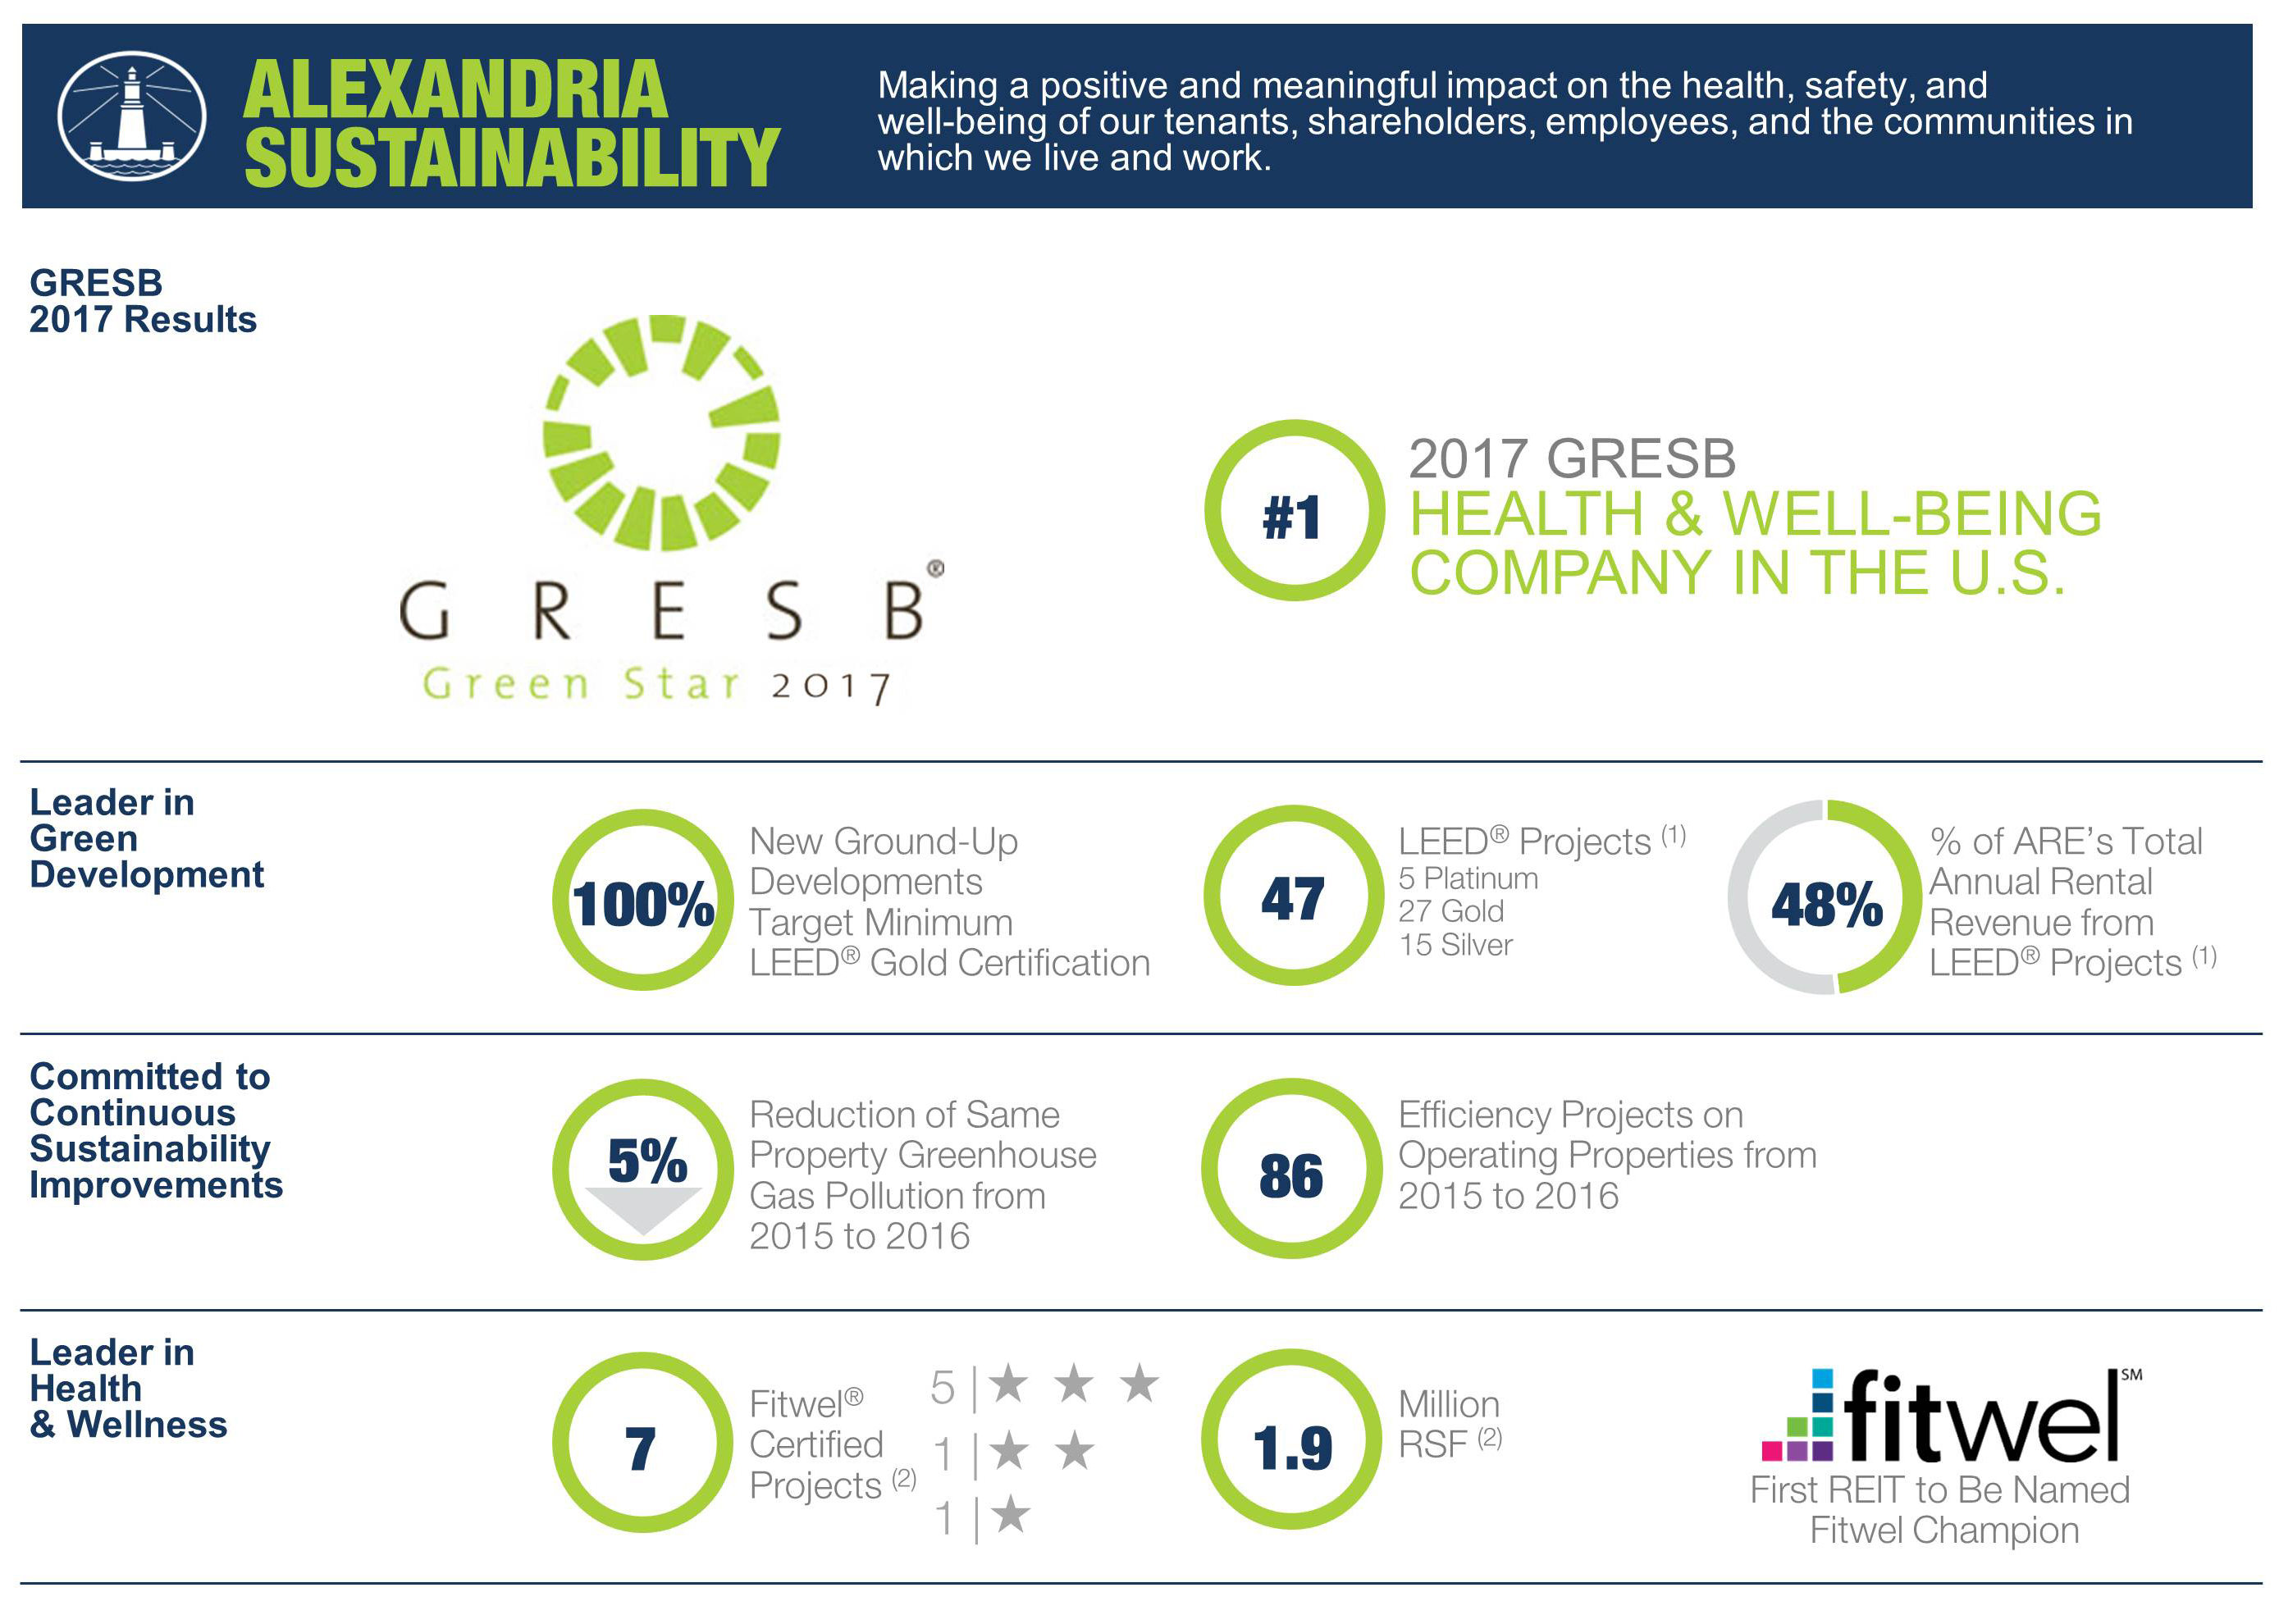
(1) Upon completion of
13
projects pursuing LEED
®
certification.
(2) Upon completion of
one
project pursuing Fitwel certification.
69
Acquisitions
Our real estate asset acquisitions during the
nine months ended September 30, 2017
, consisted of the following (dollars in thousands):
|
Property
|
Submarket/Market
|
Date of Purchase
|
Number of Properties
|
Anticipated Use
|
Occupancy
|
Square Footage
|
Purchase Price
|
|||||||||||||||||||
|
Operating
|
Redevelopment
|
Future Development
|
||||||||||||||||||||||||
|
First half of 2017 acquisitions:
|
||||||||||||||||||||||||||
|
325 Binney Street
|
Cambridge/Greater Boston
|
3/29/17
|
—
|
Office/lab, residential
|
N/A
|
—
|
|
—
|
|
208,965
|
|
$
|
80,250
|
|
||||||||||||
|
88 Bluxome Street
|
Mission Bay/SoMa/San Francisco
|
1/10/17
|
1
|
Office/lab
|
100%
|
232,470
|
|
—
|
|
1,070,925
|
|
130,000
|
|
|||||||||||||
|
960 Industrial Road
|
Greater Stanford/San Francisco
|
5/17/17
|
1
|
Office/lab
|
100%
|
195,000
|
|
—
|
|
500,000
|
|
64,959
|
|
|||||||||||||
|
825 and 835 Industrial Road
|
Greater Stanford/San Francisco
|
6/1/17
|
—
|
Office/lab
|
N/A
|
—
|
|
—
|
|
530,000
|
|
85,000
|
|
|||||||||||||
|
1450 Page Mill Road
(1)
|
Greater Stanford/San Francisco
|
6/1/17
|
1
|
Office
|
100%
|
77,634
|
|
—
|
|
—
|
|
85,300
|
|
|||||||||||||
|
3050 Callan Road and Vista Wateridge
|
Torrey Pines/Sorrento Mesa/
San Diego
|
3/24/17
|
—
|
Office/lab
|
N/A
|
—
|
|
—
|
|
229,000
|
|
8,250
|
|
|||||||||||||
|
5 Laboratory Drive
|
Research Triangle Park/RTP
|
5/25/17
|
1
|
Office/lab
|
N/A
|
—
|
|
175,000
|
|
—
|
|
8,750
|
|
|||||||||||||
|
4
|
505,104
|
|
175,000
|
|
2,538,890
|
|
462,509
|
|
||||||||||||||||||
|
Third quarter of 2017 acquisitions:
|
||||||||||||||||||||||||||
|
266 and 275 Second Avenue
|
Route 128/Greater Boston
|
7/11/17
|
2
|
Office/lab
|
100%
|
144,584
|
|
59,173
|
|
—
|
|
71,000
|
|
|||||||||||||
|
201 Haskins Way
|
South San Francisco/
San Francisco
|
9/11/17
|
1
|
Office/lab
|
100%
|
23,840
|
|
—
|
|
280,000
|
|
33,000
|
|
|||||||||||||
|
9900 Medical Center Drive
|
Rockville/Maryland
|
8/4/17
|
1
|
Office/lab
|
N/A
|
—
|
|
45,039
|
|
—
|
|
6,700
|
|
|||||||||||||
|
4
|
168,424
|
|
104,212
|
|
280,000
|
|
110,700
|
|
||||||||||||||||||
|
Pending:
|
||||||||||||||||||||||||||
|
1455 and 1515 Third Street
(acquisition of remaining 49% interest)
|
Mission Bay/SoMa/San Francisco
|
11/10/16
|
2
|
Ground lease
|
100%
|
422,980
|
|
—
|
|
—
|
|
37,800
|
|
(2)
|
||||||||||||
|
Other
|
60,000
|
|
||||||||||||||||||||||||
|
279,212
|
|
2,818,890
|
|
$
|
671,009
|
|
||||||||||||||||||||
We expect to provide total estimated costs at completion and related yields of development and redevelopment projects in the future.
|
(1)
|
Technology office building, subject to a 51-year ground lease, located in Stanford Research Park, a collaborative business community that supports innovative companies in their research and development pursuits. This recently constructed building is 100% leased to Infosys Limited for
12
years, and we expect initial stabilized yields of
7.3%
and
5.8%
(cash basis).
|
|
(2)
|
Acquisition of the remaining 49% interest in our unconsolidated real estate joint venture with Uber Technologies, Inc. (“Uber”) was completed in November 2016. A portion of the consideration is payable in three equal installments upon Uber’s completion of construction milestones. The first installment of
$18.9 million
was paid during the three months ended June 30, 2017. We expect the second and third installments to be paid during the three months ending December 31, 2017, and March 31, 2018, respectively.
|
70
Real estate asset sales
Our real estate asset sales completed during the
nine months ended September 30, 2017
, consisted of the following (dollars in thousands):
|
Net Operating
Income
(1)
|
Net Operating Income
(Cash Basis)
(1)
|
Contractual Sales Price
|
Gain
|
|||||||||||||||||||
|
Property/Market/Submarket
|
Date of Sale
|
RSF
|
||||||||||||||||||||
|
6146 Nancy Ridge Drive/San Diego/Sorrento Mesa
|
1/6/17
|
21,940
|
|
N/A
|
N/A
|
$
|
3,000
|
|
$
|
270
|
|
|||||||||||
|
1401/1413 Research Boulevard/Maryland/Rockville
(2)
|
5/17/17
|
90,000
|
|
N/A
|
N/A
|
7,937
|
|
111
|
|
|||||||||||||
|
360 Longwood Avenue/Greater Boston/Longwood Medical Area
(3)
|
7/6/17
|
203,090
|
|
$
|
4,313
|
|
$
|
4,168
|
|
65,701
|
|
14,106
|
|
|||||||||
|
$
|
76,638
|
|
$
|
14,487
|
|
|||||||||||||||||
|
(1)
|
Represents annualized amounts for the quarter ended prior to the date of sale. Net operating income (cash basis) excludes straight-line rent and amortization of acquired below-market leases.
|
|
(2)
|
In May 2017, we completed the sale of a partial interest in our land parcels at 1401/1413 Research Boulevard, located in our Rockville submarket. The sale was executed with a distinguished retail real estate developer for the development of a
90,000
RSF retail shopping center. We contributed the land parcels at a fair value of
$7.9 million
into a new entity, our partner contributed
$3.9 million
, and we received a distribution of
$0.7 million
. In addition, the real estate joint venture obtained a non-recourse secured construction loan with aggregate commitments of
$25.0 million
, which is expected to fund the remaining construction costs to complete the project, and we do not expect to make additional equity contributions to the real estate joint venture.
|
|
(3)
|
Represents the sale of a condominium interest for 49% of the building RSF, or
203,090
RSF, in our unconsolidated real estate joint venture property. Net operating income, net operating income (cash basis), contractual sales price, and gain represent our 27.5% share related to the sale of the condominium interest. In August 2017, the unconsolidated real estate joint venture entered into a mortgage loan agreement, secured by the remaining interest in the property. During the nine months ended September 30, 2017, we received a cash distribution of
$38.8 million
from the joint venture, primarily from the condominium sale and loan refinancing.
|
71
Disciplined management of ground-up development
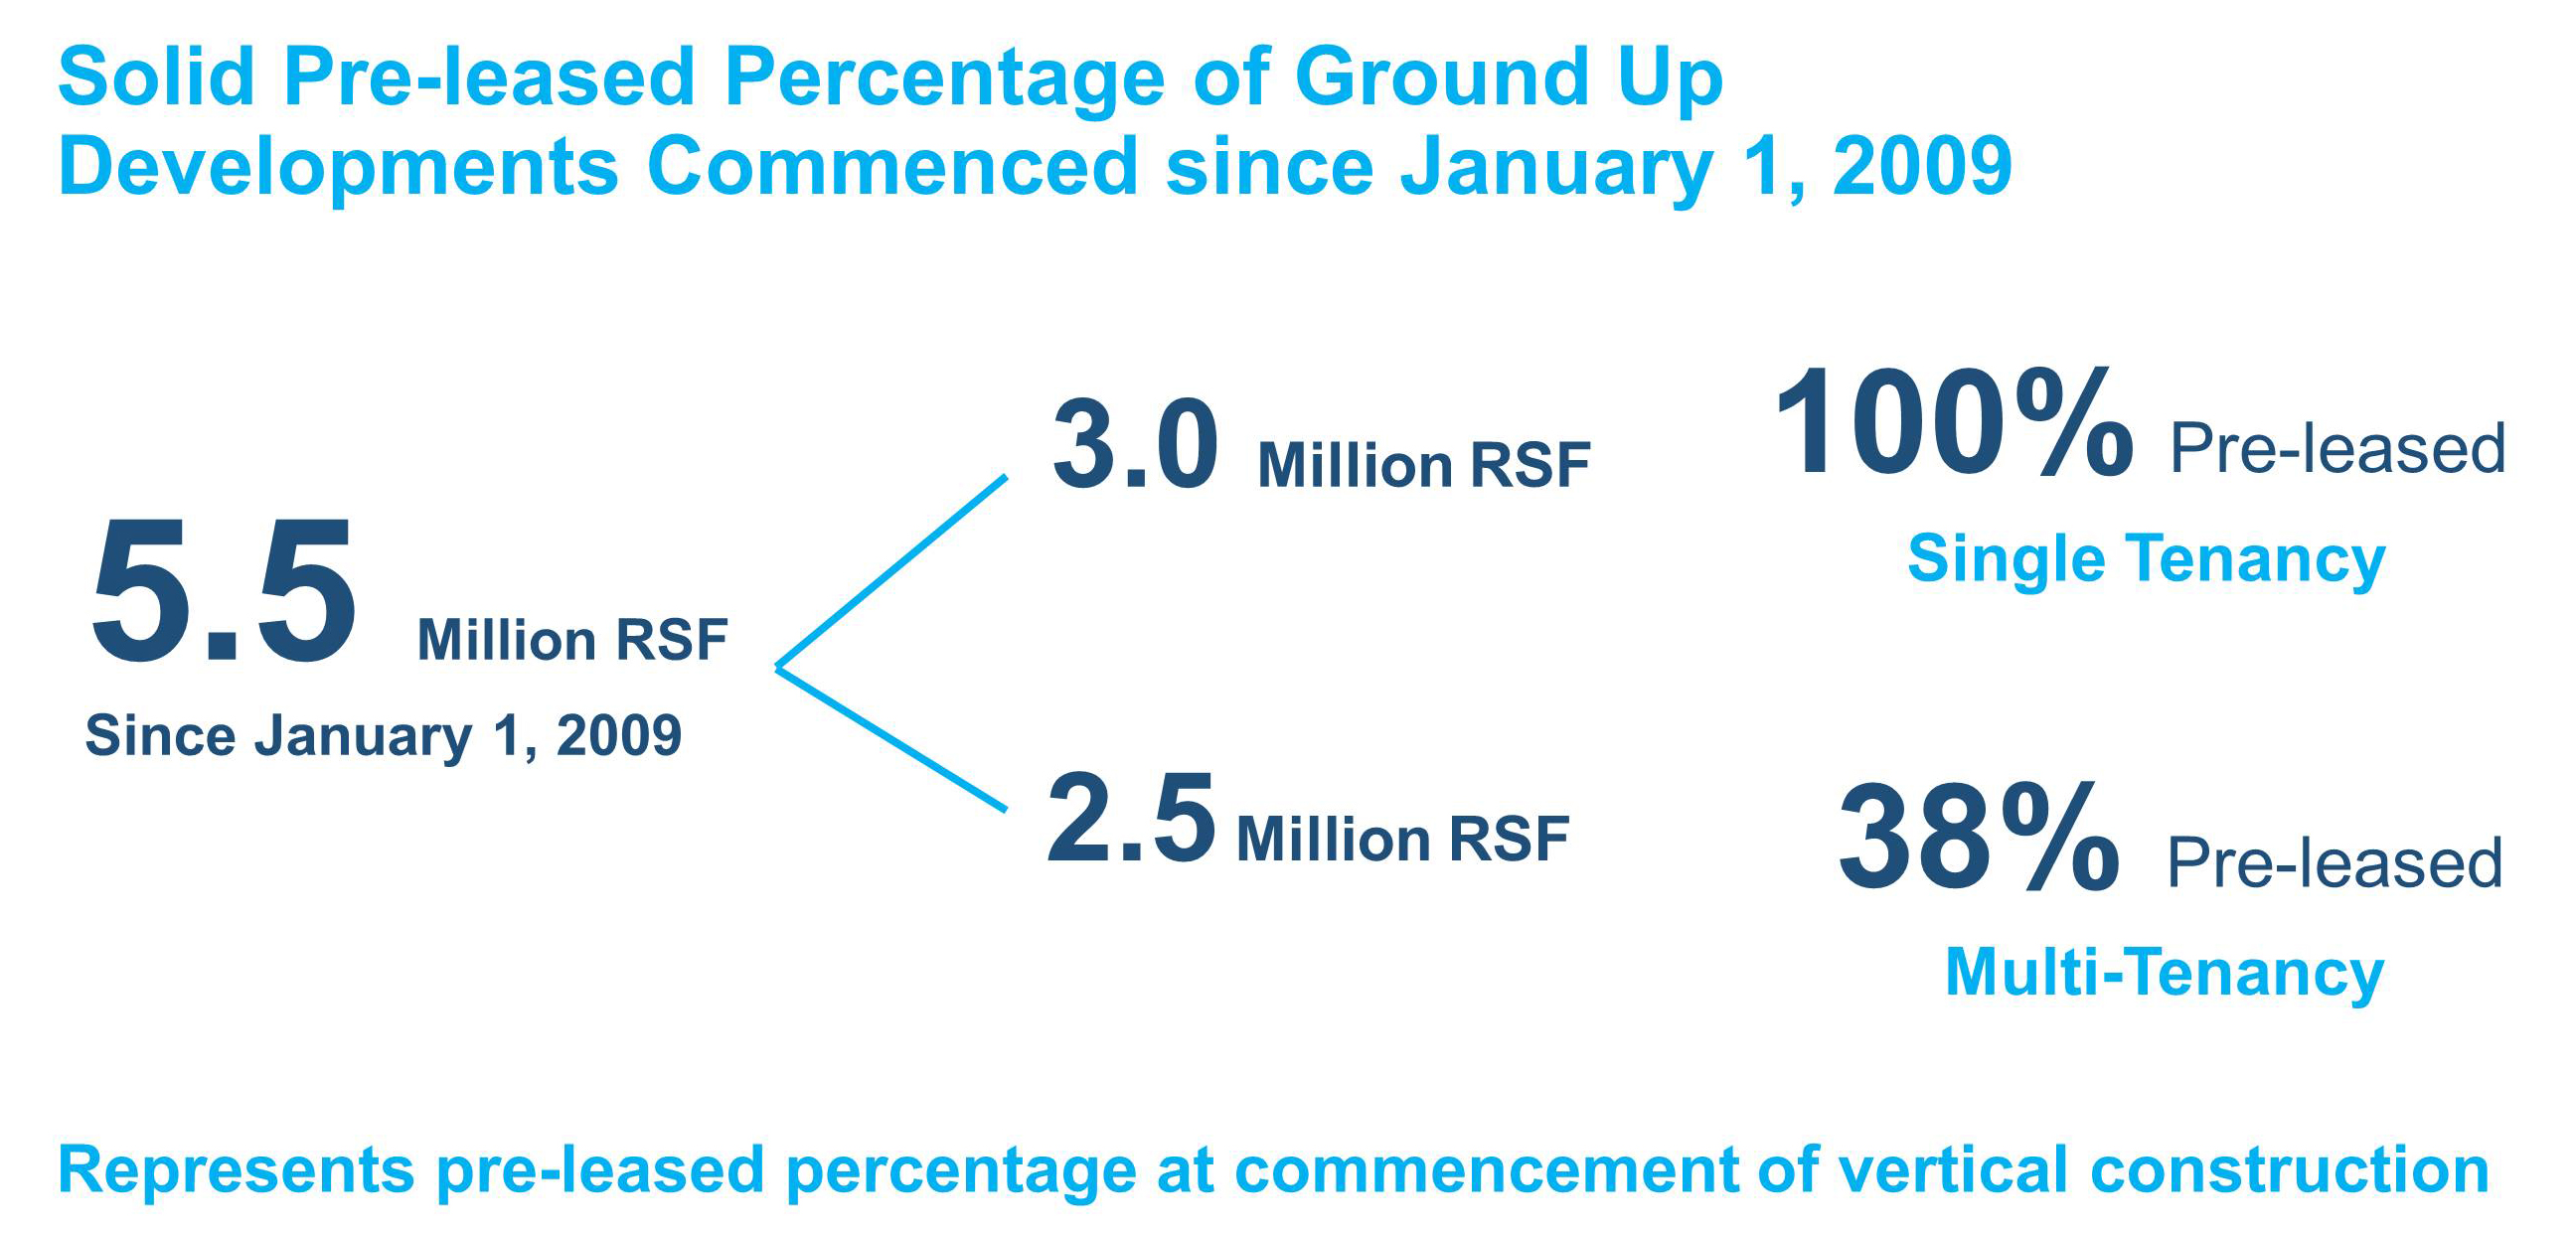
72
External growth – value-creation development and redevelopment of new Class A properties placed into service in the last 12 months
|
100 Binney Street
|
360 Longwood Avenue
|
1455 and 1515 Third Street
|
ARE Spectrum
|
|||
|
Greater Boston/Cambridge
|
Greater Boston/Longwood Medical Area
|
San Francisco/Mission Bay/SoMa
|
San Diego/Torrey Pines
|
|||
|
341,776 RSF
|
413,799 RSF
|
422,980 RSF
|
165,938 RSF
|
|||
|
Bristol-Myers Squibb Company
Facebook, Inc.
|
Dana-Farber Cancer Institute, Inc.
The Children’s Hospital Corporation
Brigham and Women’s Hospital
|
Uber Technologies, Inc.
|
The Medicines Company
Celgene Corporation Wellspring Biosciences LLC |
|||

|

|

|

|
|||
|
10290 Campus Point Drive
|
5200 Illumina Way, Parking Structure
|
4796 Executive Drive
|
400 Dexter Avenue North
|
|||
|
San Diego/University Town Center
|
San Diego/University Town Center
|
San Diego/University Town Center
|
Seattle/Lake Union
|
|||
|
305,006 RSF
|
N/A
|
61,755 RSF
|
258,896 RSF
|
|||
|
Eli Lilly and Company
|
Illumina, Inc.
|
Otonomy, Inc.
|
Juno Therapeutics, Inc.
ClubCorp Holdings, Inc.
|
|||

|

|

|

|
|||
RSF represents the cumulative RSF that have been placed into service.
73
External growth – value-creation development and redevelopment of new Class A properties placed into service in the last 12 months (continued)
The following table presents value-creation development and redevelopment of new Class A properties placed into service during the 12 months ended
September 30, 2017
(dollars in thousands):
|
Property/Market/Submarket
|
Our Ownership Interest
|
Date Delivered
|
RSF in Service
|
Total Project
|
Unlevered Yields
(1)
|
||||||||||||||||||||||||||||||||||||||||
|
Prior to 10/1/16
|
Placed into Service
|
Total
|
Average Cash
|
Initial Stabilized Cash Basis
|
Initial Stabilized
|
||||||||||||||||||||||||||||||||||||||||
|
4Q16
|
1Q17
|
2Q17
|
3Q17
|
Leased
|
RSF
|
Investment
|
|||||||||||||||||||||||||||||||||||||||
|
Consolidated development projects
|
|||||||||||||||||||||||||||||||||||||||||||||
|
100 Binney Street/Greater Boston/Cambridge
|
100%
|
9/21/17
|
—
|
|
—
|
|
—
|
|
—
|
|
341,776
|
|
341,776
|
|
100%
|
432,931
|
$
|
439,000
|
|
(2)
|
8.5
|
%
|
(2)
|
7.4
|
%
|
(2)
|
8.2
|
%
|
(2)
|
||||||||||||||||
|
1455 and 1515 Third Street/
San Francisco/Mission Bay/SoMa
|
100%
|
11/10/16
|
—
|
|
422,980
|
|
—
|
|
—
|
|
—
|
|
422,980
|
|
100%
|
422,980
|
$
|
155,000
|
|
14.5
|
%
|
7.0
|
%
|
14.4
|
%
|
||||||||||||||||||||
|
ARE Spectrum/San Diego/
Torrey Pines
|
100%
|
Various
|
102,938
|
|
—
|
|
31,336
|
|
31,664
|
|
—
|
|
165,938
|
|
98%
|
336,461
|
$
|
278,000
|
|
6.9
|
%
|
6.1
|
%
|
6.4
|
%
|
||||||||||||||||||||
|
5200 Illumina Way, Parking Structure/San Diego/
University Town Center
|
100%
|
5/15/17
|
—
|
|
—
|
|
—
|
|
N/A
|
|
—
|
|
N/A
|
|
100%
|
N/A
|
$
|
60,000
|
|
7.0
|
%
|
7.0
|
%
|
7.0
|
%
|
||||||||||||||||||||
|
4796 Executive Drive/
San Diego/
University Town Center
|
100%
|
12/1/16
|
—
|
|
61,755
|
|
—
|
|
—
|
|
—
|
|
61,755
|
|
100%
|
61,755
|
$
|
41,000
|
|
8.0
|
%
|
7.0
|
%
|
7.4
|
%
|
||||||||||||||||||||
|
400 Dexter Avenue North/Seattle/
Lake Union
|
100%
|
Various
|
—
|
|
—
|
|
241,276
|
|
—
|
|
17,620
|
|
258,896
|
|
89%
|
290,111
|
$
|
232,000
|
|
7.3
|
%
|
6.9
|
%
|
7.2
|
%
|
||||||||||||||||||||
|
Consolidated redevelopment projects
|
|||||||||||||||||||||||||||||||||||||||||||||
|
10290 Campus Point Drive/
San Diego/
University Town Center
|
55%
|
12/2/16
|
—
|
|
305,006
|
|
—
|
|
—
|
|
—
|
|
305,006
|
|
100%
|
305,006
|
$
|
231,000
|
|
7.7
|
%
|
6.8
|
%
|
7.1
|
%
|
||||||||||||||||||||
|
Unconsolidated joint venture development project
|
|||||||||||||||||||||||||||||||||||||||||||||
|
360 Longwood Avenue/
Greater Boston/
Longwood Medical Area
(3)
|
27.5%
|
Various
|
313,407
|
|
100,392
|
|
—
|
|
—
|
|
—
|
|
413,799
|
|
80%
|
413,799
|
(3)
|
$
|
108,965
|
|
8.2
|
%
|
7.3
|
%
|
7.8
|
%
|
|||||||||||||||||||
|
Total
|
416,345
|
|
890,133
|
|
272,612
|
|
31,664
|
|
359,396
|
|
1,970,150
|
|
|||||||||||||||||||||||||||||||||
Development and redevelopment projects recently placed into service will drive contractual growth in cash rents aggregating
$70 million
, of which
$60 million
will commence through the third quarter of 2018 (
$10 million
in the fourth quarter of 2017,
$23 million
in first quarter of 2018,
$14 million
in the second quarter of 2018, and
$13 million
in the third quarter of 2018).
|
(1)
|
Upon stabilization of the property.
|
|
(2)
|
Improvement of our initial yields is due to 18% overall cost savings. Cost savings were driven primarily by: (i) the redesign of space for Bristol-Myers Squibb Company drove 61% of the cost savings, (ii) competitive bidding and project management drove 25% of the cost savings, and (iii) a slightly lower amount of office/laboratory space and higher office space drove 14% of the cost savings. Adjacent is our originally disclosed total project investment and unlevered yields:
|
|
(3)
|
Refer to the “Real Estate Asset Sales” section within this Item 2 for additional information.
|
|
Unlevered Yields
|
||||||||||||||
|
Investment
|
Average Cash
|
Initial Stabilized Cash Basis
|
Initial Stabilized
|
|||||||||||
|
Final
|
$
|
439,000
|
|
8.5
|
%
|
7.4
|
%
|
8.2
|
%
|
|||||
|
Original
|
$
|
535,000
|
|
7.9
|
%
|
7.0
|
%
|
7.7
|
%
|
|||||
74
Development of new Class A properties: 2017 deliveries (projects undergoing construction)
|
510 Townsend Street
|
505 Brannan Street, Phase I
|
ARE Spectrum
|
400 Dexter Avenue North
|
|||
|
San Francisco/Mission Bay/SoMa
|
San Francisco/Mission Bay/SoMa
|
San Diego/Torrey Pines
|
Seattle/Lake Union
|
|||
|
300,000 RSF
|
150,000 RSF
|
170,523 RSF
|
31,215 RSF
|
|||
|
Stripe, Inc.
|
Pinterest, Inc.
|
Vertex Pharmaceuticals Incorporated
|
Negotiating/Juno Therapeutics, Inc.
|
|||

|

|

|
|
|||
The following table sets forth a summary of our development of new Class A properties anticipated to be delivered in 2017, as of
September 30, 2017
(dollars in thousands):
|
Project RSF
|
Percentage
|
Occupancy
|
|||||||||||||||||||
|
Property/Market/Submarket
|
In Service
|
CIP
|
Total
|
Leased
|
Negotiating
|
Total
|
Initial
|
Stabilized
|
|||||||||||||
|
ARE Spectrum/San Diego/Torrey Pines
|
165,938
|
|
170,523
|
336,461
|
98
|
%
|
—
|
%
|
98
|
%
|
1Q17
|
4Q17
|
|||||||||
|
400 Dexter Avenue North/Seattle/Lake Union
|
258,896
|
|
31,215
|
290,111
|
89
|
%
|
11
|
%
|
100
|
%
|
1Q17
|
4Q17
|
|||||||||
|
510 Townsend Street/San Francisco/Mission Bay/SoMa
|
—
|
|
300,000
|
300,000
|
100
|
%
|
—
|
%
|
100
|
%
|
4Q17
|
4Q17
|
|||||||||
|
505 Brannan Street, Phase I/San Francisco/Mission Bay/SoMa
|
—
|
|
150,000
|
150,000
|
100
|
%
|
—
|
%
|
100
|
%
|
4Q17
|
4Q17
|
|||||||||
|
Total
|
424,834
|
|
651,738
|
1,076,572
|
97
|
%
|
2
|
%
|
99
|
%
|
|||||||||||
|
Unlevered Yields
|
|||||||||||||||||||||||||||||||
|
Property/Market/Submarket
|
Our Ownership Interest
|
Cost to Complete
|
Total at Completion
|
Average
Cash
|
Initial Stabilized Cash Basis
|
Initial Stabilized
|
|||||||||||||||||||||||||
|
In Service
|
CIP
|
||||||||||||||||||||||||||||||
|
ARE Spectrum/San Diego/Torrey Pines
|
100%
|
$
|
103,170
|
|
$
|
143,149
|
|
$
|
31,681
|
|
$
|
278,000
|
|
6.9
|
%
|
6.1
|
%
|
6.4
|
%
|
||||||||||||
|
400 Dexter Avenue North/Seattle/Lake Union
|
100%
|
188,919
|
|
19,243
|
|
23,838
|
|
232,000
|
|
7.3
|
%
|
6.9
|
%
|
7.2
|
%
|
||||||||||||||||
|
510 Townsend Street/San Francisco/Mission Bay/SoMa
|
100%
|
—
|
|
187,133
|
|
50,867
|
|
238,000
|
|
7.9
|
%
|
7.0
|
%
|
7.2
|
%
|
||||||||||||||||
|
505 Brannan Street, Phase I/San Francisco/Mission Bay/SoMa
|
99.7%
|
—
|
|
116,522
|
|
24,478
|
|
141,000
|
|
8.6
|
%
|
7.0
|
%
|
8.2
|
%
|
||||||||||||||||
|
Total
|
$
|
292,089
|
|
$
|
466,047
|
|
$
|
130,864
|
|
$
|
889,000
|
|
|||||||||||||||||||
75
Development and redevelopment of new Class A properties: 2018 and 2019 deliveries (projects undergoing construction, and near-term projects undergoing marketing and pre-construction)
|
399 Binney Street
|
266 and 275 Second Avenue
|
1655 and 1715 Third Street
|
213 East Grand Avenue
|
279 East Grand Avenue
|
||||
|
Greater Boston/Cambridge
|
Greater Boston/Route 128
|
San Francisco/Mission Bay/SoMa
|
San Francisco/South San Francisco
|
San Francisco/South San Francisco
|
||||
|
164,000 SF
|
59,173 RSF
|
580,000 SF
|
300,930 RSF
|
199,000 SF
|
||||
|
Multi-Tenant
|
Multi-Tenant
|
Uber Technologies, Inc.
|
Merck & Co., Inc.
|
Multi-Tenant
|
||||

|

|

|

|
|
||||
|
681 Gateway Boulevard
|
9625 Towne Centre Drive
|
1818 Fairview Avenue East
|
9900 Medical Center Drive
|
5 Laboratory Drive
|
||||
|
San Francisco/South San Francisco
|
San Diego/University Town Center
|
Seattle/Lake Union
|
Maryland/Rockville
|
Research Triangle Park/RTP
|
||||
|
126,971 RSF
|
163,648 RSF
|
205,000 RSF
|
45,039 RSF
|
175,000 RSF
|
||||
|
Marketing
|
Takeda Pharmaceuticals
Company Ltd. |
Multi-Tenant
|
Multi-Tenant
|
Multi-Tenant
|
||||

|

|

|

|

|
||||
76
Development and redevelopment of new Class A properties: 2018 and 2019 deliveries (projects undergoing construction, and near-term projects undergoing marketing and pre-construction) (continued)
The following table sets forth a summary of our development and redevelopment and anticipated near-term commencements of new Class A properties projected to be delivered in 2018 and 2019, as of
September 30, 2017
(dollars in thousands):
|
Property/Market/Submarket
|
Dev/Redev
|
Project RSF
|
Percentage
|
Project
Start
(1)
|
Occupancy
(1)
|
|||||||||||||||||||||||
|
In Service
|
CIP
|
Total
|
Leased
|
Negotiating
|
Total
|
Initial
|
Stabilized
|
|||||||||||||||||||||
|
Developments under construction
|
||||||||||||||||||||||||||||
|
100 Binney Street/Greater Boston/Cambridge
|
Dev
|
341,776
|
|
91,155
|
|
432,931
|
|
100
|
%
|
—
|
%
|
100
|
%
|
3Q15
|
3Q17
|
1Q18
|
||||||||||||
|
213 East Grand Avenue/San Francisco/South San Francisco
|
Dev
|
—
|
|
300,930
|
|
300,930
|
|
100
|
%
|
—
|
%
|
100
|
%
|
2Q17
|
1Q19
|
2019
|
||||||||||||
|
341,776
|
|
392,085
|
|
733,861
|
|
100
|
%
|
—
|
%
|
100
|
%
|
|||||||||||||||||
|
Redevelopments under construction
|
||||||||||||||||||||||||||||
|
266 and 275 Second Avenue/Greater Boston/Route 128
|
Redev
|
144,584
|
|
59,173
|
|
203,757
|
|
84
|
%
|
—
|
%
|
84
|
%
|
3Q17
|
2Q18
|
2018
|
||||||||||||
|
5 Laboratory Drive/Research Triangle Park/RTP
|
Redev
|
—
|
|
175,000
|
|
175,000
|
|
—
|
%
|
39
|
%
|
39
|
%
|
2Q17
|
3Q18
|
2019
|
||||||||||||
|
9625 Towne Centre Drive/San Diego/University Town Center
|
Redev
|
—
|
|
163,648
|
|
163,648
|
|
100
|
%
|
—
|
%
|
100
|
%
|
3Q15
|
4Q18
|
2018
|
||||||||||||
|
9900 Medical Center Drive/Maryland/Rockville
|
Redev
|
—
|
|
45,039
|
|
45,039
|
|
—
|
%
|
—
|
%
|
—
|
%
|
3Q17
|
2Q18
|
2018
|
||||||||||||
|
144,584
|
|
442,860
|
|
587,444
|
|
57
|
%
|
12
|
%
|
69
|
%
|
|||||||||||||||||
|
Near-term projects undergoing marketing and pre-construction
|
||||||||||||||||||||||||||||
|
399 Binney Street/Greater Boston/Cambridge
|
Dev
|
—
|
|
164,000
|
|
164,000
|
|
—
|
%
|
73
|
%
|
(2)
|
73
|
%
|
4Q17
|
4Q18
|
2019
|
|||||||||||
|
1655 and 1715 Third Street/San Francisco/Mission Bay/SoMa
(3)
|
Dev
|
—
|
|
580,000
|
|
580,000
|
|
100
|
%
|
(3)
|
—
|
%
|
100
|
%
|
2Q18
|
2019
|
2019
|
|||||||||||
|
279 East Grand Avenue/San Francisco/South San Francisco
|
Dev
|
—
|
|
199,000
|
|
199,000
|
|
TBD
|
TBD
|
2019
|
TBD
|
|||||||||||||||||
|
1818 Fairview Avenue East/Seattle/Lake Union
|
Dev
|
—
|
|
205,000
|
|
205,000
|
|
TBD
|
2019
|
TBD
|
||||||||||||||||||
|
681 Gateway Boulevard/San Francisco/South San Francisco
(4)
|
Redev
|
126,971
|
|
—
|
|
126,971
|
|
4Q18
|
2019
|
TBD
|
||||||||||||||||||
|
126,971
|
|
1,148,000
|
|
1,274,971
|
|
|||||||||||||||||||||||
|
Our Ownership Interest
|
Unlevered Yields
|
|||||||||||||||||||||||||||||||||||
|
Property/Market/Submarket
|
In Service
|
CIP
|
Cost to
Complete
|
Total at
Completion
|
Average Cash
|
Initial Stabilized Cash Basis
|
Initial Stabilized
|
|||||||||||||||||||||||||||||
|
Developments under construction
|
||||||||||||||||||||||||||||||||||||
|
100 Binney Street/Greater Boston/Cambridge
|
100%
|
$
|
280,163
|
|
$
|
70,143
|
|
$
|
88,694
|
|
$
|
439,000
|
|
(5)
|
8.5
|
%
|
(5)
|
7.4
|
%
|
(5)
|
8.2
|
%
|
(5)
|
|||||||||||||
|
213 East Grand Avenue/San Francisco/South San Francisco
|
100%
|
—
|
|
72,895
|
|
187,105
|
|
260,000
|
|
7.8
|
%
|
6.4
|
%
|
7.2
|
%
|
|||||||||||||||||||||
|
$
|
280,163
|
|
$
|
143,038
|
|
$
|
275,799
|
|
$
|
699,000
|
|
8.2
|
%
|
7.0
|
%
|
7.8
|
%
|
|||||||||||||||||||
|
Redevelopments under construction
|
||||||||||||||||||||||||||||||||||||
|
266 and 275 Second Avenue/Greater Boston/Route 128
|
$
|
60,596
|
|
$
|
9,646
|
|
TBD
|
|||||||||||||||||||||||||||||
|
5 Laboratory Drive/Research Triangle Park/RTP
|
100%
|
—
|
|
10,461
|
|
|||||||||||||||||||||||||||||||
|
9625 Towne Centre Drive/San Diego/University Town Center
|
100%
|
—
|
|
31,880
|
|
$
|
61,120
|
|
$
|
93,000
|
|
7.9
|
%
|
7.0
|
%
|
7.0
|
%
|
|||||||||||||||||||
|
9900 Medical Center Drive/Maryland/Rockville
|
100%
|
—
|
|
7,237
|
|
TBD
|
TBD
|
TBD
|
|
TBD
|
|
TBD
|
|
|||||||||||||||||||||||
|
100%
|
$
|
60,596
|
|
$
|
59,224
|
|
||||||||||||||||||||||||||||||
|
Near-term projects undergoing marketing and pre-construction
(6)
|
Various
|
$
|
—
|
|
$
|
114,954
|
|
|||||||||||||||||||||||||||||
|
(1)
|
Anticipated project start dates and initial occupancy dates are subject to leasing and/or market conditions. Stabilized occupancy may vary depending on single tenancy versus multi-tenancy.
|
|
(2)
|
Represents executed letters of intent for three leases under negotiation aggregating
119,389
RSF.
|
|
(3)
|
Executed an agreement to purchase a 10% interest in a joint venture with Uber and the Golden State Warriors. Our initial cash contribution is expected to be in the range from
$35 million
to
$40 million
, to be funded at closing of the joint venture in 2018. The joint venture will acquire land with completed below-grade improvements to the building foundation and parking garage and will construct two buildings aggregating
580,000
RSF, which will be 100% leased to Uber upon completion.
|
|
(4)
|
The building is 100% occupied through September 2018, after which we expect to redevelop the building from office to office/laboratory space and expand by an additional 15,000 to 30,000 RSF. We expect the project to be delivered in 2019.
|
|
(5)
|
Refer to “External Growth – Value-Creation Development and Redevelopment of New Class A Properties Placed into Service in the Last 12 Months” within this Item 2 for additional information.
|
|
(6)
|
The design and budget of these projects are in process, and the estimated project costs with related yields will be disclosed at a later date as they become available.
|
77
Development of new Class A properties: intermediate-term development projects
|
325 Binney Street
|
201 Haskins Way
|
960 Industrial Road
|
825 and 835 Industrial Road
|
Alexandria Center
®
for Life Science
|
||||
|
Greater Boston/Cambridge
|
San Francisco/South San Francisco
|
San Francisco/Greater Stanford
|
San Francisco/Greater Stanford
|
New York City/Manhattan
|
||||
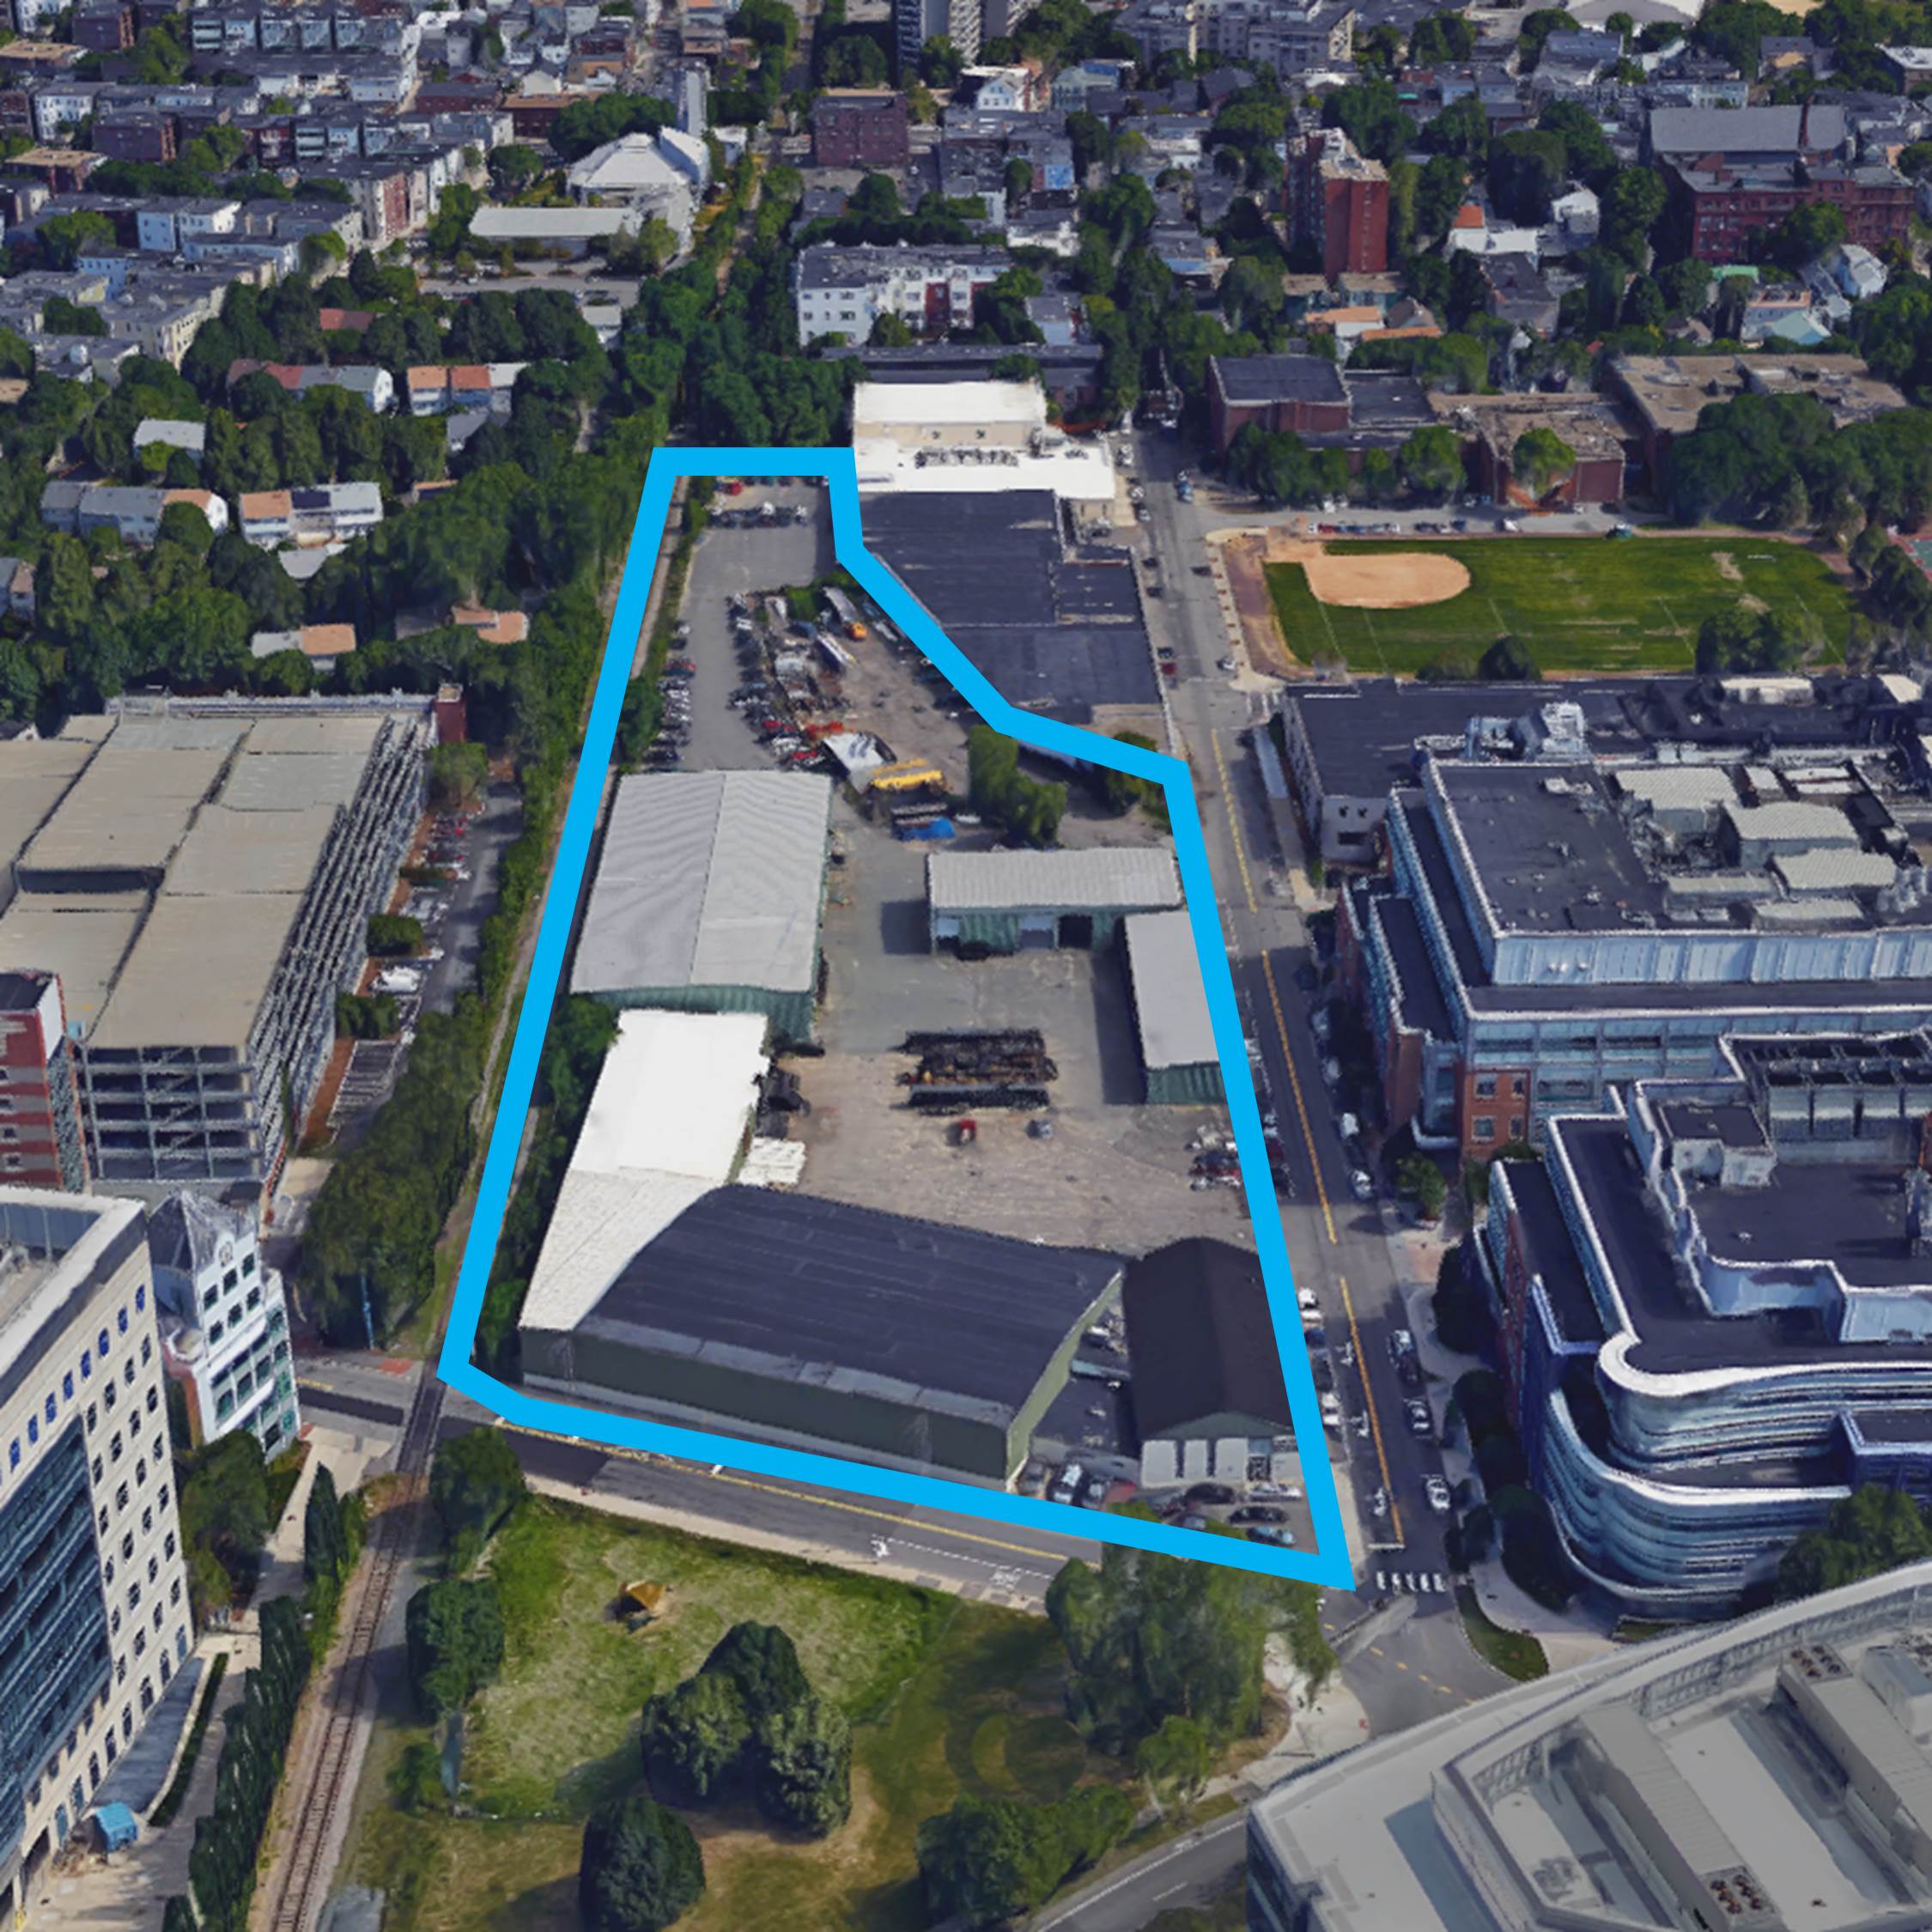
|

|

|

|

|
||||
|
5200 Illumina Way
|
Campus Point Drive
|
1150 Eastlake Avenue East
|
9800 Medical Center Drive
|
|||
|
San Diego/University Town Center
|
San Diego/University Town Center
|
Seattle/Lake Union
|
Maryland/Rockville
|
|||

|

|

|
|
|||
The following table summarizes the key information for our near-term development projects in North America as of
September 30, 2017
(dollars in thousands, except per SF amounts):
|
Market
|
Property/Submarket
|
Book Value
|
Project SF
|
Per SF
|
||||||||||||
|
Greater Boston
|
325 Binney Street/Cambridge
(1)
|
$
|
85,518
|
|
208,965
|
|
$
|
409
|
|
|||||||
|
50 Rogers Street/Cambridge
|
6,426
|
|
183,644
|
|
(2)
|
35
|
|
|||||||||
|
San Francisco
|
960 Industrial Road/Greater Stanford
|
67,902
|
|
500,000
|
|
(3)
|
136
|
|
||||||||
|
825 and 835 Industrial Road/Greater Stanford
|
90,018
|
|
530,000
|
|
170
|
|
||||||||||
|
201 Haskins Way/South San Francisco
|
33,950
|
|
280,000
|
|
(4)
|
121
|
|
|||||||||
|
New York City
|
Alexandria Center
®
for Life Science/Manhattan
|
—
|
|
420,000
|
|
—
|
|
|||||||||
|
San Diego
|
5200 Illumina Way/University Town Center
|
11,239
|
|
386,044
|
|
29
|
|
|||||||||
|
Campus Point Drive/University Town Center
|
13,395
|
|
315,000
|
|
43
|
|
||||||||||
|
Seattle
|
1150 Eastlake Avenue East/Lake Union
|
18,922
|
|
260,000
|
|
73
|
|
|||||||||
|
Maryland
|
9800 Medical Center Drive/Rockville
|
6,500
|
|
180,000
|
|
36
|
|
|||||||||
|
Total
|
$
|
333,870
|
|
3,263,653
|
|
$
|
102
|
|
||||||||
|
(1)
|
We acquired 325 Binney Street (formerly named 303 Binney Street), a land parcel that is currently entitled for the development of 163,339 RSF for office or office/laboratory space and 45,626 RSF for residential space.
|
|
(2)
|
Represents a multifamily residential development with approximately 130-140 units (adjacent to 161 First Street). As part of our successful efforts to increase the entitlements on our Alexandria Center
®
at Kendall Square development, we were required to develop two multifamily residential projects, one of which was previously completed and sold. We may market this project for sale.
|
|
(3)
|
The intermediate-term development project undergoing entitlements for
500,000
RSF will replace the existing
195,000
RSF of operating property.
|
|
(4)
|
The intermediate-term development project undergoing entitlements for
280,000
RSF will replace the existing
23,840
RSF of operating property.
|
78
Summary of pipeline
The following table summarizes the key information for all our development projects in North America as of
September 30, 2017
(dollars in thousands):
|
Property/Submarket
|
Our
Ownership
Interest
|
Book Value
|
Square Footage
|
||||||||||||||||||||||||||
|
Undergoing
Construction |
Near-Term Projects Undergoing Marketing and Pre-Construction
|
Intermediate-Term Development
|
Future Development
|
Total
(1)
|
|||||||||||||||||||||||||
|
Greater Boston
|
|||||||||||||||||||||||||||||
|
Undergoing construction
|
|||||||||||||||||||||||||||||
|
100 Binney Street/Cambridge
|
100%
|
$
|
70,143
|
|
91,155
|
|
—
|
|
—
|
|
—
|
|
91,155
|
|
|||||||||||||||
|
266 and 275 Second Avenue/Route 128
|
100%
|
9,646
|
|
59,173
|
|
—
|
|
—
|
|
—
|
|
59,173
|
|
||||||||||||||||
|
Near-term projects undergoing marketing and pre-construction
|
|||||||||||||||||||||||||||||
|
399 Binney (Alexandria Center
®
at One Kendall Square)
|
100%
|
76,263
|
|
—
|
|
164,000
|
|
—
|
|
—
|
|
164,000
|
|
||||||||||||||||
|
Intermediate-term development
|
|||||||||||||||||||||||||||||
|
325 Binney Street/Cambridge
|
100%
|
85,518
|
|
—
|
|
—
|
|
208,965
|
|
—
|
|
208,965
|
|
||||||||||||||||
|
50 Rogers Street/Cambridge
|
100%
|
6,426
|
|
—
|
|
—
|
|
183,644
|
|
—
|
|
183,644
|
|
||||||||||||||||
|
Future development projects
|
|
|
|
|
|
|
|
|
|
|
|
||||||||||||||||||
|
Alexandria Technology Square
®
/Cambridge
|
100%
|
7,787
|
|
—
|
|
—
|
|
—
|
|
100,000
|
|
100,000
|
|
||||||||||||||||
|
Other future projects
|
100%
|
7,315
|
|
—
|
|
—
|
|
—
|
|
221,955
|
|
221,955
|
|
||||||||||||||||
|
$
|
263,098
|
|
150,328
|
|
164,000
|
|
392,609
|
|
321,955
|
|
1,028,892
|
|
|||||||||||||||||
|
San Francisco
|
|||||||||||||||||||||||||||||
|
Undergoing construction
|
|||||||||||||||||||||||||||||
|
510 Townsend Street/Mission Bay/SoMa
|
100%
|
$
|
187,133
|
|
300,000
|
|
—
|
|
—
|
|
—
|
|
300,000
|
|
|||||||||||||||
|
505 Brannan Street, Phase I/Mission Bay/SoMa
|
99.7%
|
116,522
|
|
150,000
|
|
—
|
|
—
|
|
—
|
|
150,000
|
|
||||||||||||||||
|
213 East Grand Avenue/South San Francisco
|
100%
|
72,895
|
|
300,930
|
|
—
|
|
—
|
|
—
|
|
300,930
|
|
||||||||||||||||
|
Near-term projects undergoing marketing and pre-construction
|
|||||||||||||||||||||||||||||
|
1655 and 1715 Third Street/Mission Bay/SoMa
|
10%
|
—
|
|
—
|
|
580,000
|
|
—
|
|
—
|
|
580,000
|
|
||||||||||||||||
|
279 East Grand Avenue/South San Francisco
|
100%
|
17,998
|
|
—
|
|
199,000
|
|
—
|
|
—
|
|
199,000
|
|
||||||||||||||||
|
Intermediate-term development
|
|||||||||||||||||||||||||||||
|
960 Industrial Road/Greater Stanford
|
100%
|
67,902
|
|
—
|
|
—
|
|
500,000
|
|
(2)
|
—
|
|
500,000
|
|
|||||||||||||||
|
825 and 835 Industrial Road/Greater Stanford
|
100%
|
90,018
|
|
—
|
|
—
|
|
530,000
|
|
—
|
|
530,000
|
|
||||||||||||||||
|
201 Haskins Way/South San Francisco
|
100%
|
33,950
|
|
—
|
|
—
|
|
280,000
|
|
(3)
|
—
|
|
280,000
|
|
|||||||||||||||
|
Future development projects
|
|
|
|
|
|
|
|
||||||||||||||||||||||
|
88 Bluxome Street/Mission Bay/SoMa
|
100%
|
160,901
|
|
—
|
|
—
|
|
—
|
|
1,070,925
|
|
(4)
|
1,070,925
|
|
|||||||||||||||
|
505 Brannan Street, Phase II/Mission Bay/SoMa
|
99.7%
|
14,988
|
|
—
|
|
—
|
|
—
|
|
165,000
|
|
165,000
|
|
||||||||||||||||
|
East Grand Avenue/South San Francisco
|
100%
|
5,988
|
|
—
|
|
—
|
|
—
|
|
90,000
|
|
90,000
|
|
||||||||||||||||
|
Other future projects
|
100%
|
—
|
|
—
|
|
—
|
|
—
|
|
95,620
|
|
95,620
|
|
||||||||||||||||
|
$
|
768,295
|
|
750,930
|
|
779,000
|
|
1,310,000
|
|
1,421,545
|
|
4,261,475
|
|
|||||||||||||||||
|
New York City
|
|||||||||||||||||||||||||||||
|
Alexandria Center
®
for Life Science/Manhattan
|
100%
|
$
|
—
|
|
—
|
|
—
|
|
420,000
|
|
—
|
|
420,000
|
|
|||||||||||||||
|
$
|
—
|
|
—
|
|
—
|
|
420,000
|
|
—
|
|
420,000
|
|
|||||||||||||||||
|
(1) Total pipeline SF represents operating RSF plus incremental SF targeted for intermediate-term and future development.
(2) The intermediate-term development project undergoing entitlements for 500,000 RSF will replace the existing 195,000 RSF of operating property.
(3) The intermediate-term development project undergoing entitlements for 280,000 RSF will replace the existing 23,840 RSF of operating property.
(4) The future development project undergoing entitlements for 1,070,925 developable square feet will replace the existing 232,470 RSF operating property.
|
|||||||||||||||||||||||||||||
79
Summary of pipeline (continued)
|
Property/Submarket
|
Our
Ownership
Interest
|
Book Value
|
Square Footage
|
||||||||||||||||||||||||||
|
Undergoing
Construction |
Near-Term Projects Undergoing Marketing and Pre-Construction
|
Intermediate-Term Development
|
Future Development
|
Total
(1)
|
|||||||||||||||||||||||||
|
San Diego
|
|||||||||||||||||||||||||||||
|
Undergoing construction
|
|||||||||||||||||||||||||||||
|
ARE Spectrum/Torrey Pines
|
100%
|
$
|
143,149
|
|
170,523
|
|
—
|
|
—
|
|
—
|
|
170,523
|
|
|||||||||||||||
|
9625 Towne Centre Drive/University Town Center
|
100%
|
31,880
|
|
163,648
|
|
—
|
|
—
|
|
—
|
|
163,648
|
|
||||||||||||||||
|
Intermediate-term development
|
|||||||||||||||||||||||||||||
|
5200 Illumina Way/University Town Center
|
100%
|
11,239
|
|
—
|
|
—
|
|
386,044
|
|
—
|
|
386,044
|
|
||||||||||||||||
|
Campus Point Drive/University Town Center
|
100%
|
13,395
|
|
—
|
|
—
|
|
315,000
|
|
—
|
|
315,000
|
|
||||||||||||||||
|
Future development projects
|
|
|
|
|
|
|
|
||||||||||||||||||||||
|
Vista Wateridge/Sorrento Mesa
|
100%
|
3,909
|
|
—
|
|
—
|
|
—
|
|
163,000
|
|
163,000
|
|
||||||||||||||||
|
Other future projects
|
100%
|
33,147
|
|
—
|
|
—
|
|
—
|
|
259,895
|
|
259,895
|
|
||||||||||||||||
|
$
|
236,719
|
|
334,171
|
|
—
|
|
701,044
|
|
422,895
|
|
1,458,110
|
|
|||||||||||||||||
|
Seattle
|
|||||||||||||||||||||||||||||
|
Undergoing construction
|
|||||||||||||||||||||||||||||
|
400 Dexter Avenue North/Lake Union
|
100%
|
$
|
19,243
|
|
31,215
|
|
—
|
|
—
|
|
—
|
|
31,215
|
|
|||||||||||||||
|
Near-term projects undergoing marketing and pre-construction
|
|||||||||||||||||||||||||||||
|
1818 Fairview Avenue East/Lake Union
|
100%
|
20,693
|
|
—
|
|
205,000
|
|
—
|
|
—
|
|
205,000
|
|
||||||||||||||||
|
Intermediate-term development
|
|||||||||||||||||||||||||||||
|
1150 Eastlake Avenue East/Lake Union
|
100%
|
18,922
|
|
—
|
|
—
|
|
260,000
|
|
—
|
|
260,000
|
|
||||||||||||||||
|
Future development projects
|
|
|
|
|
|
|
|
||||||||||||||||||||||
|
1165/1166 Eastlake Avenue East/Lake Union
|
100%
|
18,631
|
|
—
|
|
—
|
|
—
|
|
—
|
|
106,000
|
|
106,000
|
|
||||||||||||||
|
$
|
77,489
|
|
31,215
|
|
205,000
|
|
260,000
|
|
106,000
|
|
602,215
|
|
|||||||||||||||||
|
Maryland
|
|||||||||||||||||||||||||||||
|
Undergoing construction
|
|||||||||||||||||||||||||||||
|
9900 Medical Center Drive/Rockville
|
100%
|
$
|
7,237
|
|
45,039
|
|
—
|
|
—
|
|
—
|
|
45,039
|
|
|||||||||||||||
|
Intermediate-term development
|
|||||||||||||||||||||||||||||
|
9800 Medical Center Drive/Rockville
|
100%
|
6,500
|
|
—
|
|
—
|
|
180,000
|
|
—
|
|
180,000
|
|
||||||||||||||||
|
Future development projects
|
|
|
|
|
|
|
|
||||||||||||||||||||||
|
Other future projects
|
100%
|
4,035
|
|
—
|
|
—
|
|
—
|
|
61,000
|
|
61,000
|
|
||||||||||||||||
|
$
|
17,772
|
|
45,039
|
|
—
|
|
180,000
|
|
61,000
|
|
286,039
|
|
|||||||||||||||||
|
Research Triangle Park
|
|||||||||||||||||||||||||||||
|
Undergoing construction
|
|||||||||||||||||||||||||||||
|
5 Laboratory Drive/Research Triangle Park
|
100%
|
$
|
10,461
|
|
175,000
|
|
—
|
|
—
|
|
—
|
|
175,000
|
|
|||||||||||||||
|
Future development projects
|
|
|
|
|
|
|
|
||||||||||||||||||||||
|
6 Davis Drive/Research Triangle Park
|
100%
|
16,673
|
|
—
|
|
—
|
|
—
|
|
1,000,000
|
|
1,000,000
|
|
||||||||||||||||
|
Other future projects
|
100%
|
4,149
|
|
—
|
|
—
|
|
—
|
|
76,262
|
|
76,262
|
|
||||||||||||||||
|
$
|
31,283
|
|
175,000
|
|
—
|
|
—
|
|
1,076,262
|
|
1,251,262
|
|
|||||||||||||||||
|
Non-cluster markets – other future projects
|
100%
|
11,791
|
|
—
|
|
—
|
|
—
|
|
571,705
|
|
571,705
|
|
||||||||||||||||
|
$
|
1,406,447
|
|
1,486,683
|
|
1,148,000
|
|
3,263,653
|
|
3,981,362
|
|
9,879,698
|
|
|||||||||||||||||
|
(1)
|
Total pipeline SF represents operating RSF plus incremental SF targeted for intermediate-term and future development.
|
80
Summary of capital expenditures
Our construction spending for the
nine months ended September 30, 2017
, consisted of the following (in thousands):
|
Nine Months Ended
|
|||||
|
Construction Spending
|
September 30, 2017
|
||||
|
Additions to real estate –
consolidated projects
|
$
|
660,877
|
|
||
|
Investments in unconsolidated real estate joint ventures
|
248
|
|
|||
|
Construction spending (cash basis)
(1)
|
661,125
|
|
|||
|
Decrease in accrued construction
|
(38,767
|
)
|
|||
|
Construction spending
|
$
|
622,358
|
|
||
The following table summarizes the total projected construction spending for the year ending
December 31, 2017
, which includes interest, property taxes, insurance, payroll, and other indirect project costs (in thousands):
|
Projected Construction Spending
|
Year Ending
December 31, 2017 |
|||||||||
|
Development and redevelopment projects
|
$
|
203,000
|
||||||||
|
Contributions from noncontrolling interests (consolidated joint ventures)
|
(7,000
|
)
|
||||||||
|
Generic laboratory infrastructure/building improvement projects
|
41,000
|
|||||||||
|
Non-revenue-enhancing capital expenditures and tenant improvements
|
6,000
|
|||||||||
|
Projected construction spending for three months ending December 31, 2017
|
243,000
|
|||||||||
|
Actual construction spending for the nine months ended September 30, 2017
|
622,358
|
|||||||||
|
Guidance range
|
$
|
815,000
|
|
–
|
915,000
|
|
||||
|
2017 Disciplined Allocation of Capital
(2)
|
|
88% to Urban Innovation Submarkets
|
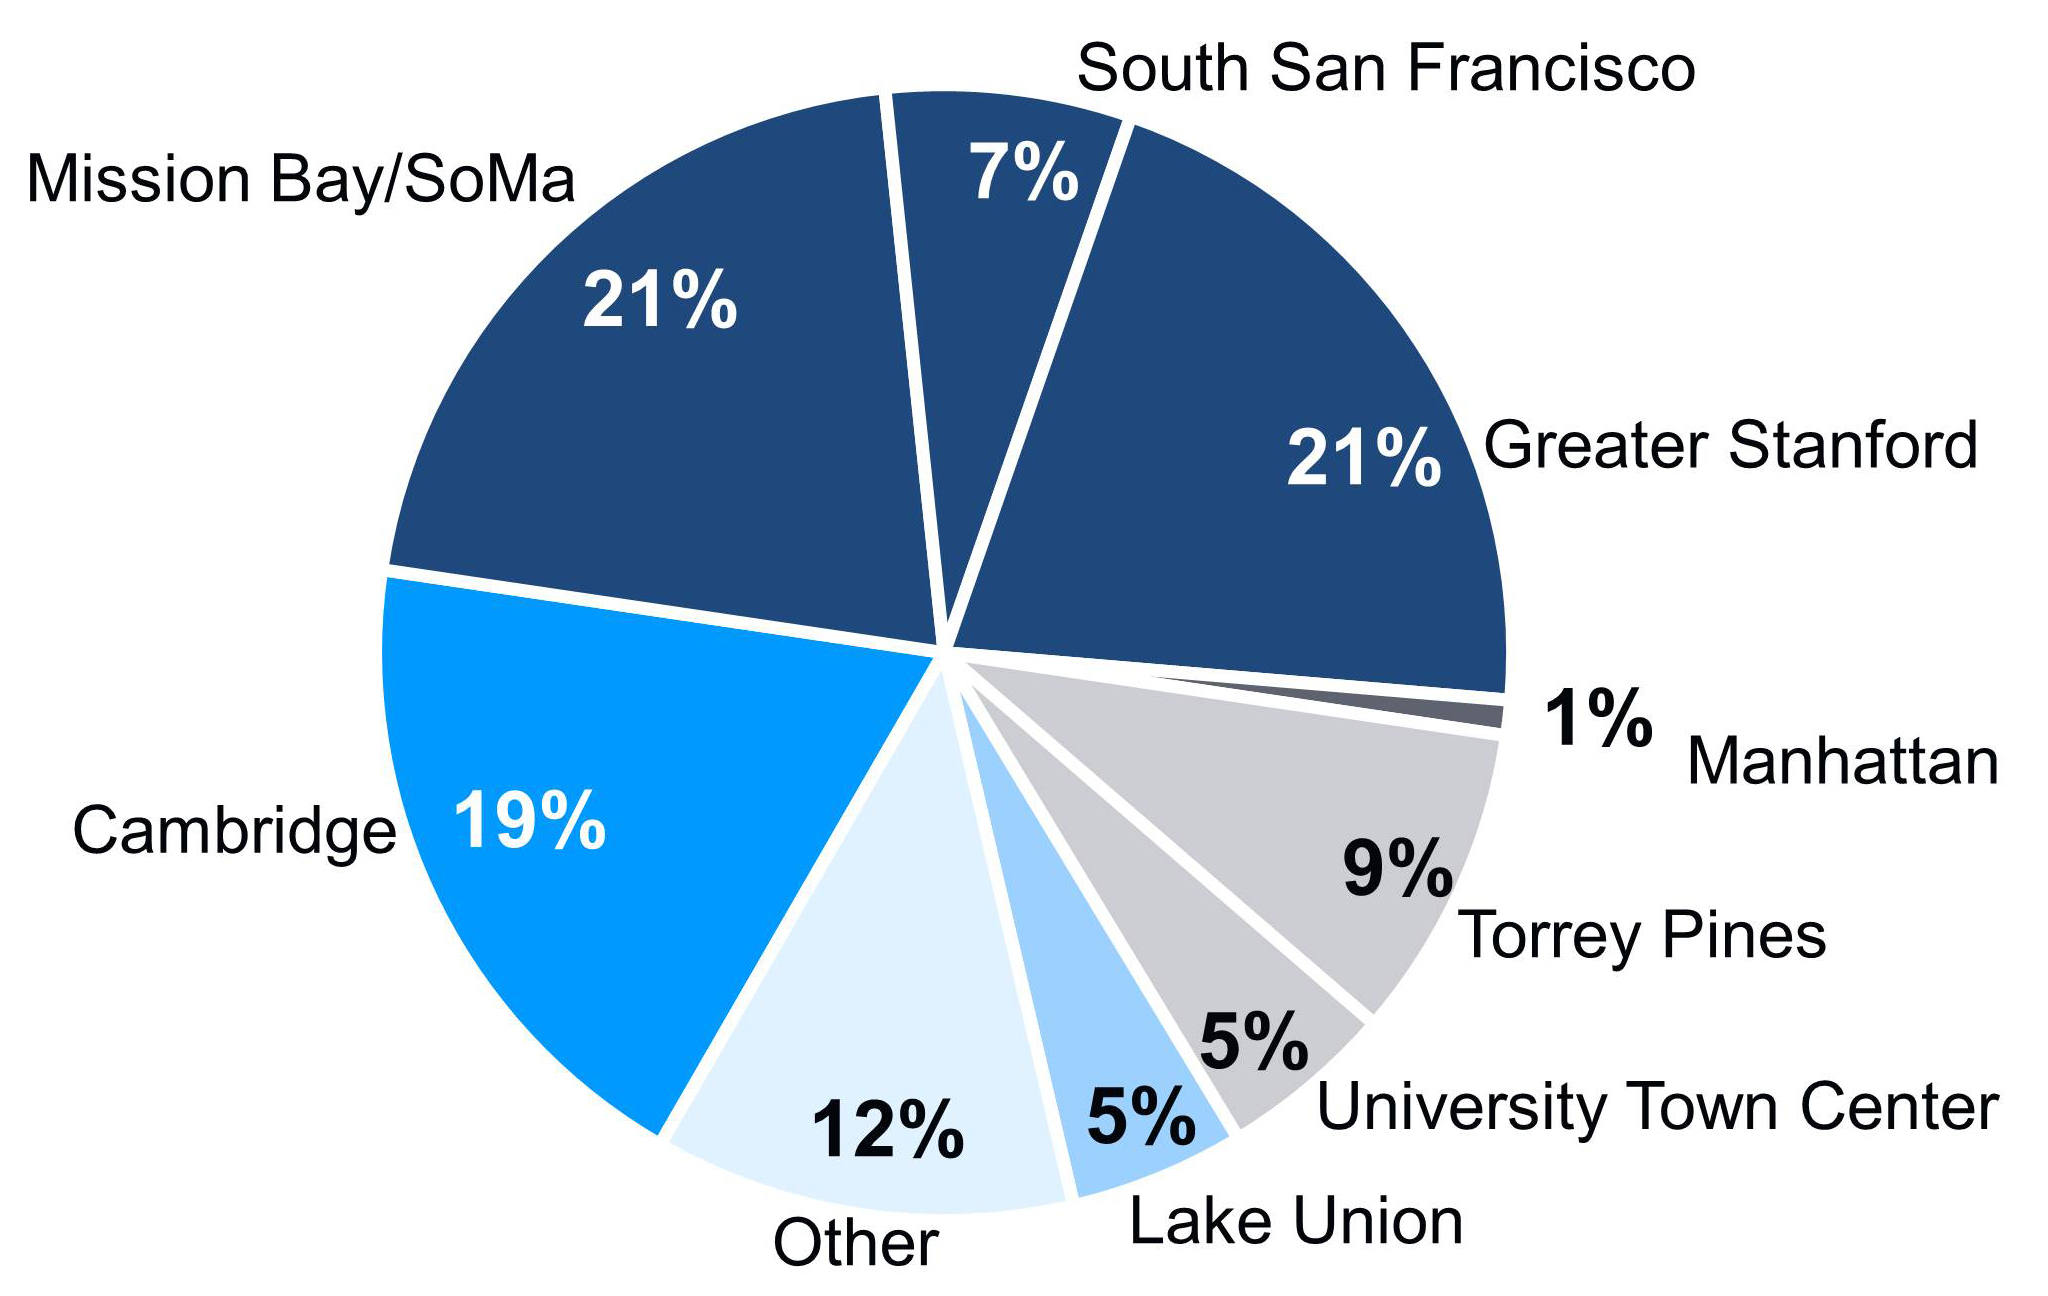
|
|
(1)
|
Includes revenue-enhancing projects and non-revenue-enhancing capital expenditures.
|
|
(2)
|
Represents the percentage of projected spending by submarket, including completed and projected acquisitions in our sources and uses of capital guidance ranging from
$620 million
to
$720 million
, for the year ending December 31, 2017.
|
81
Non-revenue-enhancing capital expenditures, tenant improvements, and leasing costs
The table below presents the average per RSF of property-related non-revenue-enhancing capital expenditures, tenant improvements, and leasing costs, excluding capital expenditures and tenant improvements that are recoverable from tenants, revenue enhancing, or related to properties that have undergone redevelopment (dollars in thousands, except per RSF amounts):
|
Non-Revenue-Enhancing Capital Expenditures
(1)
|
Nine Months Ended September 30, 2017
|
Recent Average
per RSF (2) |
|||||||||||||
|
Amount
|
RSF
|
Per RSF
|
|||||||||||||
|
Non-revenue-enhancing capital expenditures
|
$
|
5,431
|
|
18,576,742
|
|
$
|
0.29
|
|
$
|
0.41
|
|
||||
|
Tenant improvements and leasing costs:
|
|||||||||||||||
|
Re-tenanted space
|
$
|
15,542
|
|
596,653
|
|
$
|
26.05
|
|
$
|
18.11
|
|
||||
|
Renewal space
|
22,200
|
|
1,334,824
|
|
16.63
|
|
10.14
|
|
|||||||
|
Total tenant improvements and leasing costs/weighted average
|
$
|
37,742
|
|
1,931,477
|
|
$
|
19.54
|
|
(3)
|
$
|
12.52
|
|
|||
|
(1)
|
Excludes amounts that are recoverable from tenants, revenue-enhancing, or related to properties that have undergone redevelopment.
|
|
(2)
|
Represents the average of the five years ended December 31, 2016, and the
nine months ended September 30, 2017
.
|
|
(3)
|
Includes approximately
$9.7 million
, or
$17.40
per RSF, of leasing commissions related to lease renewals and re-leasing space for five leases in our Greater Boston and San Francisco markets with a weighted average lease term of
10
years and rental rate increases of
28.1%
and
20.5%
(cash basis).
|
82
Results of operations
We present a tabular comparison of items, whether gain or loss, that may facilitate a high-level understanding of our results and provide context for the disclosures included in our most recent annual report on Form 10-K and our subsequent quarterly reports on Form 10-Q. We believe this tabular presentation promotes a better understanding of corporate-level decisions and activities that significantly impact comparison of our operating results from period to period. We also believe this tabular presentation will supplement an understanding of our disclosures and real estate operating results. Gains or losses on sales of real estate and impairments for held for sale assets are related to corporate-level decisions to dispose of real estate. Gains or losses on early extinguishment of debt and preferred stock redemption charges are related to corporate-level financing decisions focused on our capital structure strategy. Significant gains or losses for non-real estate investments are not related to the operating performance of our real estate as they result from strategic, corporate-level non-real estate investment decisions and market conditions. Impairments of non-real estate investments are not related to the operating performance of our real estate as they represent the write-down of a non-real estate investment when its fair value declines below its carrying value due to changes in general market or other conditions. Significant items, whether a gain or loss, included in the tabular disclosure for current periods are described in further detail within this Item 2
.
Items included in net income (loss) attributable to Alexandria’s common stockholders (amounts are shown after deducting any amounts attributable to noncontrolling interests) are as follows:
|
Three Months Ended September 30,
|
Nine Months Ended September 30,
|
||||||||||||||||||||||||||||||
|
2017
|
2016
|
2017
|
2016
|
2017
|
2016
|
2017
|
2016
|
||||||||||||||||||||||||
|
(In millions, except per share amounts)
|
Amount
|
Per Share – Diluted
|
Amount
|
Per Share – Diluted
|
|||||||||||||||||||||||||||
|
Gain on sales of real estate
(1)
|
$
|
14.1
|
|
$
|
0.1
|
|
$
|
0.15
|
|
$
|
—
|
|
$
|
14.5
|
|
$
|
0.1
|
|
$
|
0.15
|
|
$
|
—
|
|
|||||||
|
Gain on sales of non-real estate investments
|
—
|
|
—
|
|
—
|
|
—
|
|
—
|
|
4.4
|
|
—
|
|
0.06
|
|
|||||||||||||||
|
Impairment of:
|
|||||||||||||||||||||||||||||||
|
Rental properties
(2)
|
—
|
|
(6.3
|
)
|
—
|
|
(0.08
|
)
|
(0.2
|
)
|
(94.7
|
)
|
—
|
|
(1.27
|
)
|
|||||||||||||||
|
Land parcels
(2)
|
—
|
|
(1.8
|
)
|
—
|
|
(0.02
|
)
|
—
|
|
(98.0
|
)
|
—
|
|
(1.32
|
)
|
|||||||||||||||
|
Non-real estate investments
(3)
|
—
|
|
(3.1
|
)
|
—
|
|
(0.04
|
)
|
(4.5
|
)
|
(3.1
|
)
|
(0.05
|
)
|
(0.04
|
)
|
|||||||||||||||
|
Loss on early extinguishment of debt
|
—
|
|
(3.2
|
)
|
—
|
|
(0.04
|
)
|
(0.7
|
)
|
(3.2
|
)
|
(0.01
|
)
|
(0.04
|
)
|
|||||||||||||||
|
Preferred stock redemption charge
(4)
|
—
|
|
(13.1
|
)
|
—
|
|
(0.17
|
)
|
(11.3
|
)
|
(25.6
|
)
|
(0.12
|
)
|
(0.34
|
)
|
|||||||||||||||
|
$
|
14.1
|
|
$
|
(27.4
|
)
|
$
|
0.15
|
|
$
|
(0.35
|
)
|
$
|
(2.2
|
)
|
$
|
(220.1
|
)
|
$
|
(0.03
|
)
|
$
|
(2.95
|
)
|
||||||||
|
Weighted-average shares of common stock outstanding – diluted
|
93.3
|
|
77.4
|
|
90.8
|
|
74.5
|
|
|||||||||||||||||||||||
|
(1)
|
Refer to Note 4 – “Investments in Unconsolidated Real Estate Joint Ventures” to our unaudited consolidated financial statements under Item 1 of this report for more information.
|
|
(2)
|
Refer to Note 3 – “Investments in Real Estate” to our unaudited consolidated financial statements under Item 1 of this report for more information.
|
|
(3)
|
Refer to Note 5 – “Investments” to our unaudited consolidated financial statements under Item 1 of this report for more information.
|
|
(4)
|
Refer to Note 12 – “Stockholders’ Equity” to our unaudited consolidated financial statements under Item 1 of this report for more information.
|
83
Same Properties
We supplement an evaluation of our results of operations with an evaluation of operating performance of certain of our properties, referred to as Same Properties. For more information on the determination of our Same Properties portfolio, refer to “Same Property Comparisons” in the “Non-GAAP Measures and Definitions” section within this Item 2. The following table presents information regarding our Same Properties for the three and
nine months ended September 30, 2017
:
|
September 30, 2017
|
|||||||
|
Three Months Ended
|
Nine Months Ended
|
||||||
|
Percentage change in net operating income over comparable period from prior year
|
2.2%
|
|
2.3%
|
||||
|
Percentage change in net operating income (cash basis) over comparable period from prior year
|
7.8%
|
|
6.2%
|
|
|||
|
Operating margin
|
69%
|
|
70%
|
||||
|
Number of Same Properties
|
169
|
|
166
|
|
|||
|
RSF
|
15,182,829
|
|
14,419,701
|
|
|||
|
Occupancy – current-period average
|
95.9%
|
96.0%
|
|||||
|
Occupancy – same-period prior-year average
|
96.9%
|
97.2%
|
|||||
The following table reconciles the number of Same Properties to total properties for the
nine months ended September 30, 2017
:
|
Development – under construction
|
Properties
|
|||
|
505 Brannan Street
|
1
|
|
||
|
510 Townsend Street
|
1
|
|
||
|
ARE Spectrum
|
3
|
|
||
|
213 East Grand Avenue
|
1
|
|
||
|
100 Binney Street
|
1
|
|
||
|
400 Dexter Avenue North
|
1
|
|
||
|
8
|
|
|||
|
Development – placed into service after January 1, 2016
|
Properties
|
|||
|
50 and 60 Binney Street
|
2
|
|
||
|
430 East 29th Street
|
1
|
|
||
|
5200 Illumina Way, Building 6
|
1
|
|
||
|
4796 Executive Drive
|
1
|
|
||
|
360 Longwood Avenue (unconsolidated real estate joint venture)
|
1
|
|
||
|
1455 and 1515 Third Street
|
2
|
|
||
|
8
|
|
|||
|
Redevelopment – under construction
|
Properties
|
|||
|
9625 Towne Centre Drive
|
1
|
|
||
|
5 Laboratory Drive
|
1
|
|
||
|
9900 Medical Center Drive
|
1
|
|
||
|
266 and 275 Second Avenue
|
2
|
|
||
|
5
|
|
|||
|
Redevelopment – placed into service after January 1, 2016
|
Properties
|
||
|
10151 Barnes Canyon Road
|
1
|
|
|
|
11 Hurley Street
|
1
|
|
|
|
10290 Campus Point Drive
|
1
|
|
|
|
3
|
|
||
|
Acquisitions after January 1, 2016
|
Properties
|
||
|
Torrey Ridge Science Center
|
3
|
|
|
|
Alexandria Center
®
at One Kendall Square
|
9
|
|
|
|
88 Bluxome Street
|
1
|
|
|
|
960 Industrial Road
|
1
|
|
|
|
1450 Page Mill Road
|
1
|
|
|
|
201 Haskins Way
|
1
|
|
|
|
16
|
|
||
|
Total properties excluded from Same Properties
|
40
|
|
|
|
Same Properties
|
166
|
|
|
|
Total properties in North America as of
September 30, 2017
|
206
|
|
|
84
Comparison of results for the three months ended
September 30, 2017
, to the three months ended
September 30, 2016
The following table presents a comparison of the components of net operating income for our Same Properties and Non-Same Properties for the three months ended
September 30, 2017
, compared to the three months ended
September 30, 2016
. For a reconciliation of net operating income from net income, the most directly comparable financial measure presented in accordance with GAAP, refer to the “Non-GAAP Measures and Definitions” section within this Item 2.
|
Three Months Ended September 30,
|
||||||||||||||||
|
(Dollars in thousands)
|
2017
|
2016
|
$ Change
|
% Change
|
||||||||||||
|
Same Properties
|
$
|
163,817
|
|
$
|
159,424
|
|
$
|
4,393
|
|
2.8
|
%
|
|||||
|
Non-Same Properties
|
52,204
|
|
7,167
|
|
45,037
|
|
628.4
|
|
||||||||
|
Total rental
|
216,021
|
|
166,591
|
|
49,430
|
|
29.7
|
|
||||||||
|
Same Properties
|
58,117
|
|
56,858
|
|
1,259
|
|
2.2
|
|
||||||||
|
Non-Same Properties
|
8,941
|
|
1,823
|
|
7,118
|
|
390.5
|
|
||||||||
|
Total tenant recoveries
|
67,058
|
|
58,681
|
|
8,377
|
|
14.3
|
|
||||||||
|
Same Properties
|
120
|
|
16
|
|
104
|
|
650.0
|
|
||||||||
|
Non-Same Properties
|
2,171
|
|
5,091
|
|
(2,920
|
)
|
(57.4
|
)
|
||||||||
|
Total other income
|
2,291
|
|
5,107
|
|
(2,816
|
)
|
(55.1
|
)
|
||||||||
|
Same Properties
|
222,054
|
|
216,298
|
|
5,756
|
|
2.7
|
|
||||||||
|
Non-Same Properties
|
63,316
|
|
14,081
|
|
49,235
|
|
349.7
|
|
||||||||
|
Total revenues
|
285,370
|
|
230,379
|
|
54,991
|
|
23.9
|
|
||||||||
|
Same Properties
|
68,107
|
|
65,674
|
|
2,433
|
|
3.7
|
|
||||||||
|
Non-Same Properties
|
15,362
|
|
6,328
|
|
9,034
|
|
142.8
|
|
||||||||
|
Total rental operations
|
83,469
|
|
72,002
|
|
11,467
|
|
15.9
|
|
||||||||
|
Same Properties
|
153,947
|
|
150,624
|
|
3,323
|
|
2.2
|
|
||||||||
|
Non-Same Properties
|
47,954
|
|
7,753
|
|
40,201
|
|
518.5
|
|
||||||||
|
Net operating income
|
$
|
201,901
|
|
$
|
158,377
|
|
$
|
43,524
|
|
27.5
|
%
|
|||||
|
Net operating income – Same Properties
|
$
|
153,947
|
|
$
|
150,624
|
|
$
|
3,323
|
|
2.2
|
%
|
|||||
|
Straight-line rent revenue and amortization of acquired below-market leases
|
(5,744
|
)
|
(13,105
|
)
|
7,361
|
|
(56.2
|
)
|
||||||||
|
Net operating income – Same Properties (cash basis)
|
$
|
148,203
|
|
$
|
137,519
|
|
$
|
10,684
|
|
7.8
|
%
|
|||||
Rental revenues
Total rental revenues for the
three months ended September 30, 2017
, increased by
$49.4 million
, or
29.7%
, to
$216.0 million
, compared to
$166.6 million
for the
three months ended September 30, 2016
. The increase was primarily due to an increase in rental revenues from our Non-Same Properties totaling
$45.0 million
primarily related to
1,592,628
RSF of development and redevelopment projects placed into service subsequent to
July 1, 2016
, and
16
operating properties totaling
1,468,708
RSF acquired.
Rental revenues from our Same Properties for the
three months ended September 30, 2017
, increased by
$4.4 million
, or
2.8%
, to
$163.8 million
, compared to
$159.4 million
for the
three months ended September 30, 2016
. The increase was primarily due to significant rental rate increases on lease renewals and re-leasing of space since
July 1, 2016
. Refer to “Leasing” within the “Operating Summary” section of this Item 2 for additional information on our leasing activity. The increase was partially offset by a decrease in rental revenue as a result of a decrease in Same Properties’ occupancy to
95.9%
for the
three months ended September 30, 2017
, from
96.9%
for the
three months ended September 30, 2016
. Refer to “Same Properties” in the section above within this Item 2 for additional information on the change in our Same Properties’ occupancy rates.
85
Tenant recoveries
Tenant recoveries for the
three months ended September 30, 2017
, increased by
$8.4 million
, or
14.3%
, to
$67.1 million
, compared to
$58.7 million
for the
three months ended September 30, 2016
. Non-Same Properties’ tenant recoveries increased by
$7.1 million
primarily due to the increase in recoverable operating expenses for the
three months ended September 30, 2017
, as discussed under “Rental Operating Expenses” below. As of
September 30, 2017
,
97%
of our leases (on an RSF basis) were triple net leases, which require tenants to pay substantially all real estate taxes, insurance, utilities, common area expenses, and other operating expenses (including increases thereto) in addition to base rent.
Same Properties’ tenant recoveries remained relatively consistent during the
three months ended September 30, 2017
, and
2016
.
Other income
Other income for the three months ended
September 30, 2017
and
2016
, consisted of the following (in thousands):
|
Three Months Ended September 30,
|
||||||||||||
|
2017
|
2016
|
Change
|
||||||||||
|
Management fee income
|
$
|
658
|
|
$
|
46
|
|
$
|
612
|
|
|||
|
Interest and other income
|
588
|
|
795
|
|
(207
|
)
|
||||||
|
Investment income
|
1,045
|
|
4,266
|
|
(3,221
|
)
|
||||||
|
Total other income
|
$
|
2,291
|
|
$
|
5,107
|
|
$
|
(2,816
|
)
|
|||
Refer to Note 5 – “Investments” to our unaudited consolidated financial statements under Item 1 of this report for more information on investment income.
Rental operating expenses
Total rental operating expenses for the
three months ended September 30, 2017
, increased by
$11.5 million
, or
15.9%
, to
$83.5 million
, compared to
$72.0 million
for the
three months ended September 30, 2016
. Approximately
$9.0 million
of the increase was due to an increase in rental operating expenses from our Non-Same Properties primarily related to
1,592,628
RSF of development and redevelopment projects placed into service subsequent to
July 1, 2016
, and
16
operating properties totaling
1,468,708
RSF acquired.
Same Properties’ rental operating expenses
increased by
$2.4 million
, or
3.7%
, during the
three months ended September 30, 2017
, compared to the
three months ended September 30, 2016
, primarily due to higher repairs and maintenance expenses. The increase in Same Properties’ rental operating expenses was partially offset by property tax refunds during the
three months ended September 30, 2017
.
General and administrative expenses
General and administrative expenses for the
three months ended September 30, 2017
, increased by
$1.8 million
, or
11.2%
, to
$17.6 million
, compared to
$15.9 million
for the
three months ended September 30, 2016
. General and administrative expenses increased primarily due to the continued growth in the depth and breadth of our operations in multiple markets, including a
29.7%
increase in total rental revenue to
$216.0 million
for the
three months ended September 30, 2017
, compared to
$166.6 million
for the same period in
2016
, and including a
4.1 million
RSF, or
16.7%
, increase in our North America asset base subsequent to October 1, 2016. As a percentage of total assets, our general and administrative expenses for the
three months ended September 30, 2017
and
2016
, quarter annualized, declined to
0.6%
from
0.7%
, respectively.
86
Interest expense
Interest expense for the
three months ended September 30, 2017
and
2016
, consisted of the following (dollars in thousands):
|
Three Months Ended September 30,
|
||||||||||||
|
Component
|
2017
|
2016
|
Change
|
|||||||||
|
Interest incurred
|
$
|
48,123
|
|
$
|
40,753
|
|
$
|
7,370
|
|
|||
|
Capitalized interest
|
(17,092
|
)
|
(14,903
|
)
|
(2,189
|
)
|
||||||
|
Interest expense
|
$
|
31,031
|
|
$
|
25,850
|
|
$
|
5,181
|
|
|||
|
Average debt balance outstanding
(1)
|
$
|
4,887,491
|
|
$
|
4,244,247
|
|
$
|
643,244
|
|
|||
|
Weighted-average annual interest rate
(2)
|
3.9
|
%
|
3.8
|
%
|
0.1
|
%
|
||||||
|
(1)
|
Represents the average debt balance outstanding during the three months ended
September 30, 2017
and
2016
.
|
|
(2)
|
Represents annualized total interest incurred divided by the average debt balance outstanding in the respective periods.
|
The net change in interest expense during the
three months ended September 30, 2017
, compared to the
three months ended September 30, 2016
, resulted from the following (dollars in thousands):
|
Component
|
Interest Rate
(1)
|
Effective Date
|
Change
|
|||||||
|
Increases in interest incurred due to:
|
||||||||||
|
Issuance of $425 million unsecured senior note payable
|
4.09%
|
March 2017
|
$
|
4,210
|
|
|||||
|
Assumption of $203 million secured note payable
|
3.40%
|
November 2016
|
1,840
|
|
||||||
|
Higher average balance and interest rate on secured construction loans
|
Various
|
Various
|
2,640
|
|
||||||
|
Higher average interest rate on unsecured senior line of credit and term loans
|
1,880
|
|
||||||||
|
Total increases
|
10,570
|
|
||||||||
|
Decreases in interest incurred due to:
|
||||||||||
|
Repayments of debt:
|
||||||||||
|
Variable-rate unsecured senior bank term loan
|
Various
|
February 2017
|
(750
|
)
|
||||||
|
$76 million secured note payable
|
2.81%
|
December 2016
|
(460
|
)
|
||||||
|
Lower average notional amounts of interest rate hedge agreements in effect
|
(1,500
|
)
|
||||||||
|
Amortization of loan fees
|
(240
|
)
|
||||||||
|
Other decrease in interest
|
(250
|
)
|
||||||||
|
Total decreases
|
(3,200
|
)
|
||||||||
|
Change in interest incurred
|
7,370
|
|
||||||||
|
Increase in capitalized interest
(2)
|
(2,189
|
)
|
||||||||
|
Total change in interest expense
|
$
|
5,181
|
|
|||||||
|
(1)
|
Represents the interest rate as of the end of the applicable period, plus the impact of debt premiums/discounts, interest rate hedge agreements, and deferred financing costs.
|
|
(2)
|
Increase in capitalized interest is primarily due to an increase in our highly leased development and redevelopment projects undergoing construction in our value-creation pipeline during the
three months ended September 30, 2017
, compared to the
three months ended September 30, 2016
.
|
Depreciation and amortization
Depreciation and amortization expense for the
three months ended September 30, 2017
increased by
$30.7 million
, or
39.7%
, to
$107.8 million
, compared to
$77.1 million
for the
three months ended September 30, 2016
. The increase is primarily due to additional depreciation from
1,592,628
RSF of development and redevelopment projects placed into service subsequent to
July 1, 2016
, and
16
operating properties totaling
1,468,708
RSF acquired subsequent to
July 1, 2016
.
87
Sale of real estate assets, impairment charges, and gain on sales of real estate
During the
three months ended September 30, 2017
, we recognized a gain of
$14.1 million
upon the completion of the sale of a condominium interest in our unconsolidated real estate joint venture property at 360 Longwood Avenue in our Longwood Medical Area submarket. This gain is reflected in our equity in earnings of unconsolidated real estate joint ventures in our consolidated statements of income. Refer to Note 4 – “Investments in Unconsolidated Real Estate Joint Ventures” to our unaudited consolidated financial statements under Item 1 of this report for more information.
Impairment of real estate recognized during the
three months ended September 30, 2016
, of
$8.1 million
primarily relates to our decision to sell our real estate investments in Asia. Refer to “Sale of Real Estate Assets and Impairment Charges” in Note 3 – “Investments in Real Estate” to our unaudited consolidated financial statements under Item 1 of this report for more information.
Loss on early extinguishment of debt
During the three months ended September 30, 2016, we recognized a loss on early extinguishment of debt related to the write-off of a portion of unamortized loan fees aggregating
$2.4 million
upon the amendment of our unsecured senior line of credit in July 2016. Additionally, we completed a partial principal repayment of
$200 million
of our 2019 Unsecured Senior Bank Term Loan and recognized a loss on early extinguishment of debt of
$869 thousand
related to the write-off of unamortized loan fees. No such losses were recognized during the
three months ended September 30, 2017
.
Preferred stock redemption charge
During the
three months ended September 30, 2016
, we repurchased
1.1 million
outstanding shares of our Series D Convertible Preferred Stock and recognized a preferred stock redemption charge of
$13.1 million
. We did not repurchase any shares of our Series D Convertible Preferred Stock during the
three months ended September 30, 2017
.
88
Comparison of results for the
nine months ended September 30, 2017
, to the
nine months ended September 30, 2016
The following table presents a comparison of the components of net operating income for our Same Properties and Non-Same Properties for the
nine months ended September 30, 2017
, compared to the
nine months ended September 30, 2016
. For a reconciliation of net operating income from net income, the most directly comparable financial measure presented in accordance with GAAP, refer to the “Non-GAAP Measures and Definitions” section within this Item 2.
|
Nine Months Ended September 30,
|
||||||||||||||||
|
(Dollars in thousands)
|
2017
|
2016
|
$ Change
|
% Change
|
||||||||||||
|
Same Properties
|
$
|
457,237
|
|
$
|
445,740
|
|
$
|
11,497
|
|
2.6
|
%
|
|||||
|
Non-Same Properties
|
177,919
|
|
40,765
|
|
137,154
|
|
336.5
|
|
||||||||
|
Total rental
|
635,156
|
|
486,505
|
|
148,651
|
|
30.6
|
|
||||||||
|
Same Properties
|
155,017
|
|
151,588
|
|
3,429
|
|
2.3
|
|
||||||||
|
Non-Same Properties
|
33,857
|
|
13,797
|
|
20,060
|
|
145.4
|
|
||||||||
|
Total tenant recoveries
|
188,874
|
|
165,385
|
|
23,489
|
|
14.2
|
|
||||||||
|
Same Properties
|
341
|
|
77
|
|
264
|
|
342.9
|
|
||||||||
|
Non-Same Properties
|
4,935
|
|
20,577
|
|
(15,642
|
)
|
(76.0
|
)
|
||||||||
|
Total other income
|
5,276
|
|
20,654
|
|
(15,378
|
)
|
(74.5
|
)
|
||||||||
|
Same Properties
|
612,595
|
|
597,405
|
|
15,190
|
|
2.5
|
|
||||||||
|
Non-Same Properties
|
216,711
|
|
75,139
|
|
141,572
|
|
188.4
|
|
||||||||
|
Total revenues
|
829,306
|
|
672,544
|
|
156,762
|
|
23.3
|
|
||||||||
|
Same Properties
|
182,281
|
|
176,967
|
|
5,314
|
|
3.0
|
|
||||||||
|
Non-Same Properties
|
55,255
|
|
28,197
|
|
27,058
|
|
96.0
|
|
||||||||
|
Total rental operations
|
237,536
|
|
205,164
|
|
32,372
|
|
15.8
|
|
||||||||
|
Same Properties
|
430,314
|
|
420,438
|
|
9,876
|
|
2.3
|
|
||||||||
|
Non-Same Properties
|
161,456
|
|
46,942
|
|
114,514
|
|
243.9
|
|
||||||||
|
Net operating income
|
$
|
591,770
|
|
$
|
467,380
|
|
$
|
124,390
|
|
26.6
|
%
|
|||||
|
Net operating income – Same Properties
|
$
|
430,314
|
|
$
|
420,438
|
|
$
|
9,876
|
|
2.3
|
%
|
|||||
|
Straight-line rent revenue and amortization of acquired below-market leases
|
(13,439
|
)
|
(28,024
|
)
|
14,585
|
|
(52.0
|
)
|
||||||||
|
Net operating income – Same Properties (cash basis)
|
$
|
416,875
|
|
$
|
392,414
|
|
$
|
24,461
|
|
6.2
|
%
|
|||||
Rental revenues
Total rental revenues for the
nine months ended September 30, 2017
, increased by
$148.7 million
, or
30.6%
, to
$635.2 million
, compared to
$486.5 million
for the
nine months ended September 30, 2016
. The increase was primarily due to an increase in rental revenues from our Non-Same Properties totaling
$137.2 million
related to
2,355,756
RSF of development and redevelopment projects placed into service subsequent to
January 1, 2016
, and
16
operating properties totaling
1,468,708
RSF acquired subsequent to
January 1, 2016
.
Rental revenues from our Same Properties for the
nine months ended September 30, 2017
, increased by
$11.5 million
, or
2.6%
, to
$457.2 million
, compared to
$445.7 million
for the
nine months ended September 30, 2016
. The increase was primarily due to significant rental rate increases on lease renewals and re-leasing of space since
January 1, 2016
. Refer to “Leasing” within the “Operating Summary” section of this Item 2 for additional information on our leasing activity. The increase was slightly offset by a decrease in rental revenue as a result of a decrease in Same Properties’ occupancy to
96.0%
for the
nine months ended September 30, 2017
, from
97.2%
for the
nine months ended September 30, 2016
. Refer to “Same Properties” in the section above within this Item 2 for additional information on the change in our Same Properties’ occupancy rates.
89
Tenant recoveries
Tenant recoveries for the
nine months ended September 30, 2017
, increased by
$23.5 million
, or
14.2%
, to
$188.9 million
, compared to
$165.4 million
for the
nine months ended September 30, 2016
. This increase is relatively consistent with the increase in our rental operating expenses of
$32.4 million
, or
15.8%
, as discussed under “Rental Operating Expenses” below. Same Properties’ tenant recoveries increased by
$3.4 million
, or
2.3%
, primarily due to the increase in recoverable operating expenses for the
nine months ended September 30, 2017
, as discussed below. As of
September 30, 2017
,
97%
of our leases (on an RSF basis) were triple net leases, which require tenants to pay substantially all real estate taxes, insurance, utilities, common area expenses, and other operating expenses (including increases thereto) in addition to base rent.
Other income
Other income for the
nine months ended September 30, 2017
and
2016
, consisted of the following (in thousands):
|
Nine Months Ended September 30,
|
||||||||||||
|
2017
|
2016
|
Change
|
||||||||||
|
Management fee income
|
$
|
1,643
|
|
$
|
380
|
|
$
|
1,263
|
|
|||
|
Interest and other income
|
1,626
|
|
2,223
|
|
(597
|
)
|
||||||
|
Investment income
|
2,007
|
|
18,051
|
|
(16,044
|
)
|
||||||
|
Total other income
|
$
|
5,276
|
|
$
|
20,654
|
|
$
|
(15,378
|
)
|
|||
Refer to Note 5 – “Investments” to our unaudited consolidated financial statements under Item 1 of this report for more information on investment income.
Rental operating expenses
Total rental operating expenses for the
nine months ended September 30, 2017
, increased by
$32.4 million
, or
15.8%
, to
$237.5 million
, compared to
$205.2 million
for the
nine months ended September 30, 2016
. Approximately
$27.1 million
of the increase was due to an increase in rental operating expenses from our Non-Same Properties primarily related to
2,355,756
RSF of development and redevelopment projects placed into service subsequent to
January 1, 2016
, and
16
operating properties totaling
1,468,708
RSF acquired subsequent to
January 1, 2016
.
Same Properties’ rental operating expenses increased by
$5.3 million
, or
3.0%
, to
$182.3 million
during the
nine months ended September 30, 2017
, compared to
$177.0 million
for the
nine months ended September 30, 2016
, primarily due to higher utility expenses, higher snow removal services, and higher repair and maintenance expenses resulting from a comparably colder winter. The increase in Same Properties’ rental operating expenses was partially offset by property tax refunds during the
nine months ended September 30, 2017
.
General and administrative expenses
General and administrative expenses for the
nine months ended September 30, 2017
, increased by
$9.7 million
, or
20.8%
, to
$56.1 million
, compared to
$46.4 million
for the
nine months ended September 30, 2016
. General and administrative expenses increased primarily due to the continued growth in the depth and breadth of our operations in multiple markets, including a
30.6%
increase in total rental revenue to
$635.2 million
for the
nine months ended September 30, 2017
, compared to
$486.5 million
for the same period in
2016
, and including a
4.1 million
RSF, or
16.7%
, increase in our North America asset base subsequent to October 1, 2016. As a percentage of total assets, our general and administrative expenses for the
nine months ended September 30, 2017
and
2016
, year-to-date annualized, declined to
0.6%
from
0.7%
, respectively.
90
Interest expense
Interest expense for the
nine months ended September 30, 2017
and
2016
, consisted of the following (dollars in thousands):
|
Nine Months Ended September 30,
|
||||||||||||
|
Component
|
2017
|
2016
|
Change
|
|||||||||
|
Interest incurred
|
$
|
137,888
|
|
$
|
116,520
|
|
$
|
21,368
|
|
|||
|
Capitalized interest
|
(45,325
|
)
|
(40,790
|
)
|
(4,535
|
)
|
||||||
|
Interest expense
|
$
|
92,563
|
|
$
|
75,730
|
|
$
|
16,833
|
|
|||
|
Average debt balance outstanding
(1)
|
$
|
4,675,967
|
|
$
|
4,150,540
|
|
$
|
525,427
|
|
|||
|
Weighted-average annual interest rate
(2)
|
3.9
|
%
|
3.7
|
%
|
0.2
|
%
|
||||||
|
(1)
|
Represents the average total debt balance outstanding during the
nine months ended September 30, 2017
and
2016
.
|
|
(2)
|
Represents annualized total interest incurred divided by the average debt balance outstanding in the respective periods.
|
The net change in interest expense during the
nine months ended September 30, 2017
, compared to the
nine months ended September 30, 2016
, resulted from the following (dollars in thousands):
|
Component
|
Interest Rate
(1)
|
Effective Date
|
Change
|
|||||||
|
Increases in interest incurred due to:
|
||||||||||
|
Issuance of debt:
|
||||||||||
|
$425 million unsecured senior note payable
|
4.09%
|
March 2017
|
$
|
9,730
|
|
|||||
|
$350 million unsecured senior note payable
|
4.14%
|
June 2016
|
6,160
|
|
||||||
|
Secured construction loan
|
3.89%
|
April 2016
|
2,770
|
|
||||||
|
Assumption of $203 million secured note payable
|
3.40%
|
November 2016
|
5,520
|
|
||||||
|
Higher average balance and interest rate on secured construction loans
|
Various
|
Various
|
4,460
|
|
||||||
|
Higher average interest rate on unsecured senior line of credit and term loans
|
2,790
|
|
||||||||
|
Total increases
|
31,430
|
|
||||||||
|
Decreases in interest incurred due to:
|
||||||||||
|
Repayments of debt:
|
||||||||||
|
Secured notes payable
(2)
|
Various
|
Various
|
(4,550
|
)
|
||||||
|
Unsecured senior bank term loan
|
Various
|
February 2017
|
(2,960
|
)
|
||||||
|
Lower average notional amounts of interest rate hedge agreements in effect
|
(1,910
|
)
|
||||||||
|
Amortization of loan fees
|
(220
|
)
|
||||||||
|
Other decrease in interest
|
(422
|
)
|
||||||||
|
Total decreases
|
(10,062
|
)
|
||||||||
|
Change in interest incurred
|
21,368
|
|
||||||||
|
Increase in capitalized interest
(3)
|
(4,535
|
)
|
||||||||
|
Total change in interest expense
|
$
|
16,833
|
|
|||||||
|
(1)
|
Represents the interest rate as of the end of the applicable period, plus the impact of debt premiums/discounts, interest rate hedge agreements, and deferred financing costs.
|
|
(2)
|
Decrease is primarily due to the repayment of
four
secured notes payable aggregating
$270.6 million
, subsequent to January 1, 2016.
|
|
(3)
|
Increase in capitalized interest is primarily due to an increase in our highly leased development and redevelopment projects undergoing construction in our value-creation pipeline during the
nine months ended September 30, 2017
, compared to the
nine months ended September 30, 2016
. The increase was also partially due to the increase in the weighted-average interest rate required for capitalization of interest to
3.96%
effective during the
nine months ended September 30, 2017
, from
3.70%
effective during the
nine months ended September 30, 2016
, as a result of the increase in rates applicable to borrowings outstanding during each respective period.
|
Depreciation and amortization
Depreciation and amortization expense for the
nine months ended September 30, 2017
, increased by
$90.9 million
, or
41.7%
, to
$309.1 million
, compared to
$218.2 million
for the
nine months ended September 30, 2016
. The increase is primarily due to additional depreciation from
2,355,756
RSF of development and redevelopment projects placed into service subsequent to
January 1, 2016
, and
16
operating properties totaling
1,468,708
RSF acquired subsequent to
January 1, 2016
.
91
Sale of real estate assets, impairment charges, and gain on sales of real estate
Impairment of real estate recognized during the
nine months ended September 30, 2017
, of
$203 thousand
related to our
20,580
RSF property located in a non-cluster market that was classified as held for sale as of June 30, 2017, and was sold in July 2017 with no gain or loss.
Impairment of real estate recognized during the
nine months ended September 30, 2016
, of
$193.2 million
primarily related to our decision to monetize our real estate investments in Asia. Refer to “Sale of Real Estate Assets and Impairment Charges” in Note 3 – “Investments in Real Estate” to our unaudited consolidated financial statements under Item 1 of this report for more information.
In January 2017, we completed the sale of a vacant property at 6146 Nancy Ridge Drive located in our Sorrento Mesa submarket of San Diego for a purchase price of
$3.0 million
and recognized a gain of
$270 thousand
. In May 2017, we recognized a gain of
$111 thousand
upon the sale of a partial interest in our land parcels at 1401/1413 Research Boulevard, located in the Rockville submarket of Maryland.
In July 2017, we recognized a gain of
$14.1 million
upon the completion of the sale of a condominium interest in our unconsolidated real estate joint venture property at 360 Longwood Avenue in our Longwood Medical Area submarket. This gain is reflected in our equity in earnings of unconsolidated real estate joint ventures in our consolidated statement of income. Refer to Note 4 – “Investment in Unconsolidated Real Estate Joint Ventures” to our unaudited consolidated financial statement under Item 1 of this report for more information.
Loss on early extinguishment of debt
During the
nine months ended September 30, 2017
, we repaid
$200 million
of our 2019 Unsecured Senior Bank Term Loan to reduce the total outstanding balance from
$400 million
to
$200 million
and recognized a loss of
$670 thousand
related to the write-off of unamortized loan fees. During the
nine months ended September 30, 2016
, we recognized a loss on early extinguishment of debt related to the write-off of a portion of unamortized loan fees aggregating
$2.4 million
, upon the amendment of our unsecured senior line of credit in July 2016. Additionally, during the
nine months ended September 30, 2016
, we completed a partial principal repayment of
$200 million
of our 2019 Unsecured Senior Bank Term Loan to reduce the total outstanding balance from
$600 million
to
$400 million
, and recognized a loss on early extinguishment of debt of
$869 thousand
related to the write-off of unamortized loan fees.
Preferred stock redemption charge
During the
nine months ended September 30, 2017
and 2016, we repurchased, in privately negotiated transactions,
501,115
and
3.0 million
outstanding shares, respectively, of our Series D Convertible Preferred Stock and recognized a preferred stock redemption charge of
$5.8 million
and
$25.6 million
, respectively.
In March 2017, we announced the redemption of our Series E Redeemable Preferred Stock and recognized a preferred stock redemption charge of
$5.5 million
. Refer to Note 12 – “Stockholders’ Equity” to our unaudited consolidated financial statements under Item 1 of this report for more information.
92
Projected results
We present updated guidance for EPS attributable to Alexandria’s common stockholders – diluted, and funds from operations per share attributable to Alexandria’s common stockholders – diluted, based on our current view of existing market conditions and other assumptions for the year ending
December 31, 2017
, as set forth, and as adjusted, in the table below. The tables below also provide a reconciliation of EPS per share attributable to Alexandria’s common stockholders – diluted, the most directly comparable GAAP measure, to funds from operations, a non-GAAP measure, and other key assumptions included in our updated guidance for the year ending
December 31, 2017
. There can be no assurance that actual amounts will be materially higher or lower than these expectations. Refer to our discussion of “Forward-Looking Statements” within this Item 2.
|
Summary of Key Changes in Guidance
|
As of 10/30/17
|
As of 7/31/17
|
|||
|
EPS, FFO per share, and FFO per share, as adjusted
|
See below
|
See below
|
|||
|
Rental rate increase up 1%
|
20.5% to 23.5%
|
19.5% to 22.5%
|
|||
|
Rental rate increase (cash basis) up 3%
|
10.5% to 13.5%
|
7.5% to 10.5%
|
|||
|
Earnings per Share and Funds From Operations per Share Attributable to Alexandria’s Common Stockholders – Diluted
|
|||||||
|
As of 10/30/17
|
As of 7/31/17
|
||||||
|
Earnings per share
|
$1.57 to $1.59
|
$1.40 to $1.46
|
|||||
|
Depreciation and amortization
|
4.45
|
4.45
|
|||||
|
Less: our share of gain on sale of real estate from unconsolidated JVs
|
(0.15)
|
—
|
|||||
|
Allocation of unvested restricted stock awards
|
(0.04)
|
(0.04)
|
|||||
|
Funds from operations per share
|
$5.83 to $5.85
|
$5.81 to $5.87
|
|||||
|
Add: impairment of non-real estate investments
(1)
|
0.05
|
0.05
|
|||||
|
Add: loss on early extinguishment of debt
|
0.01
|
0.01
|
|||||
|
Add: preferred stock redemption charge
(2)
|
0.12
|
0.12
|
|||||
|
Funds from operations per share, as adjusted
|
$6.01 to $6.03
|
$5.99 to $6.05
|
|||||
|
Key Assumptions
(3)
(Dollars in millions)
|
2017 Guidance
|
|||||||
|
Low
|
High
|
|||||||
|
Occupancy percentage for operating properties in North America as of December 31, 2017
|
96.6%
|
|
97.2%
|
|
||||
|
Lease renewals and re-leasing of space:
|
||||||||
|
Rental rate increases
|
20.5%
|
|
23.5%
|
|
||||
|
Rental rate increases (cash basis)
|
10.5%
|
|
13.5%
|
|
||||
|
Same property performance:
|
||||||||
|
Net operating income increase
|
2.0%
|
|
4.0%
|
|
||||
|
Net operating income increase (cash basis)
|
5.5%
|
|
7.5%
|
|
||||
|
Straight-line rent revenue
|
$
|
107
|
|
$
|
112
|
|
||
|
General and administrative expenses
(4)
|
$
|
68
|
|
$
|
73
|
|
||
|
Capitalization of interest
(4)
|
$
|
48
|
|
$
|
58
|
|
||
|
Interest expense
(4)
|
$
|
131
|
|
$
|
141
|
|
||
|
Key Credit Metrics
|
As of 10/30/17
|
||
|
Net debt to Adjusted EBITDA – fourth quarter of 2017, annualized
|
5.3x to 5.8x
|
||
|
Net debt and preferred stock to Adjusted EBITDA – fourth quarter of 2017, annualized
|
5.3x to 5.8x
|
||
|
Fixed-charge coverage ratio – fourth quarter of 2017, annualized
|
Greater than 4.0x
|
||
|
Value-creation pipeline as a percentage of gross investments in real estate as of December 31, 2017
|
Less than 10%
|
||
|
(1)
|
Primarily related to two non-real estate investments during the three months ended June 30, 2017.
|
|
(2)
|
Includes charges aggregating
$5.8 million
related to the repurchases of
501,115
outstanding shares of our Series D Convertible Preferred Stock during the three months ended March 31, 2017. Additionally, in March 2017, we announced the redemption of our Series E Redeemable Preferred Stock and recognized a
$5.5 million
preferred stock redemption charge. We completed the redemption in April 2017. Excludes any charges related to future repurchases of our Series D Convertible Preferred Stock.
|
|
(3)
|
The completion of our development and redevelopment projects will result in an increase in interest expense and other project costs because these project costs will no longer qualify for capitalization and will, therefore, be expensed as incurred. Our assumptions for Same Properties net operating income growth, rental rate growth, straight-line rent revenue, general and administrative expenses, capitalization of interest, and interest expense are included in the tables above and are subject to a number of variables and uncertainties, including those discussed as “Forward-Looking Statements” under Part I; “Item 1A. Risk Factors”; and “Item 7. Management’s Discussion and Analysis of Financial Condition and Results of Operations” of our annual report on Form 10‑K for the year ended
December 31, 2016
. To the extent our full-year earnings guidance is updated during the year, we will provide additional disclosure supporting reasons for any significant changes to such guidance.
|
|
(4)
|
We expect to be at the top end of our guidance ranges for general and administrative expenses and capitalization of interest, and the low end of our guidance range for interest expense.
|
93
Consolidated and unconsolidated real estate joint ventures
We present components of balance sheet and operating results information for the noncontrolling interests’ share of our consolidated real estate joint ventures and for our share of investments in unconsolidated real estate joint ventures to help investors estimate balance sheet and operating results information related to our partially owned entities. These amounts are estimated by computing, for each joint venture that we consolidate in our financial statements, the noncontrolling interest percentage of each financial item to arrive at the cumulative noncontrolling interest share of each component presented. In addition, for our real estate joint ventures that we do not control and do not consolidate, we apply our economic ownership percentage to the unconsolidated real estate joint ventures to arrive at our proportionate share of each component presented.
|
Consolidated Real Estate Joint Ventures
|
|||||
|
Property/Market/Submarket
|
Noncontrolling
(1)
Interest Share
|
||||
|
225 Binney Street/Greater Boston/Cambridge
|
70.0%
|
||||
|
1500 Owens Street/San Francisco/Mission Bay/SoMa
|
49.9%
|
||||
|
409 and 499 Illinois Street/San Francisco/Mission Bay/SoMa
|
40.0%
|
||||
|
10290 and 10300 Campus Point Drive/San Diego/University Town Center
|
45.0%
|
||||
|
Unconsolidated Real Estate Joint Ventures
|
|||||
|
Property/Market/Submarket
|
Our Share
|
||||
|
360 Longwood Avenue/Greater Boston/Longwood Medical Area
|
27.5%
|
||||
|
1401/1413 Research Boulevard/Maryland/Rockville
|
65.0%
|
(2)
|
|||
|
(1)
|
In addition to the consolidated real estate joint ventures listed, various partners hold insignificant noncontrolling interests in three other properties in North America.
|
|
(2)
|
The joint venture is expected to fund the remaining construction costs of the project with funds from its construction loan shown below, and we expect our ownership interest percentage to remain at
65%
at completion of the project. Refer to “Real Estate Asset Sales” within this Item 2 for additional information on the contribution of land parcels to the real estate joint venture.
|
As of
September 30, 2017
, our unconsolidated real estate joint ventures have the following non-recourse secured loans that include the following key terms (amounts represent 100% of the loan amounts at the joint venture level, dollars in thousands):
360 Longwood Avenue
|
Maturity Date
|
Stated Rate
|
Interest Rate
(1)
|
Debt Balance
(2)
|
Outstanding Principal
|
Remaining Commitments
|
Total
|
|||||||||||||||||||
|
9/1/22
|
(3)
|
3.32
|
%
|
3.62
|
%
|
$
|
94,086
|
|
$
|
95,000
|
|
$
|
—
|
|
$
|
95,000
|
|
||||||||
|
9/1/22
|
(3)
|
L+1.85
|
%
|
N/A
|
|
$
|
—
|
|
$
|
—
|
|
$
|
17,000
|
|
$
|
17,000
|
|
||||||||
1401/1413 Research Boulevard
|
Maturity Date
|
Stated Rate
|
Interest Rate
(1)
|
Debt Balance
(2)
|
Outstanding Principal
|
Remaining Commitments
|
Total
|
|||||||||||||||||||
|
5/17/20
|
(4)
|
L+2.50
|
%
|
(5)
|
5.07
|
%
|
$
|
3,699
|
|
$
|
3,829
|
|
$
|
21,171
|
|
$
|
25,000
|
|
|||||||
|
(1)
|
Represents interest rate including interest expense and amortization of loan fees.
|
|
(2)
|
Represents outstanding principal, net of unamortized deferred financing costs.
|
|
(3)
|
The unconsolidated real estate joint venture has
two
one
-year options to extend the stated maturity date to September 1, 2024, subject to certain conditions. Additionally, the loan commitment balance excludes an earn-out advance provision that allows for incremental borrowings up to
$48.0 million
, subject to certain conditions.
|
|
(4)
|
The unconsolidated real estate joint venture has an option to extend the stated maturity date to July 1, 2020. In addition, there are
two
one
-year options to convert the construction loan to a permanent loan and extend the stated maturity date to May 17, 2022.
|
|
(5)
|
The outstanding borrowing bears interest at a floating rate with an interest rate floor equal to
3.15%
.
|
94
The following tables present information related to the operating results and financial positions of our consolidated and unconsolidated real estate joint ventures (in thousands):
|
Noncontrolling Interest Share of Consolidated Real Estate JVs
|
Our Share of Unconsolidated
Real Estate JVs |
||||||||||||||
|
September 30, 2017
|
September 30, 2017
|
||||||||||||||
|
Three Months Ended
|
Nine Months Ended
|
Three Months Ended
|
Nine Months Ended
|
||||||||||||
|
Total revenues
|
$
|
13,400
|
|
$
|
41,022
|
|
$
|
1,044
|
|
$
|
5,849
|
|
|||
|
Rental operations
|
(4,189
|
)
|
(11,772
|
)
|
(489
|
)
|
(2,194
|
)
|
|||||||
|
9,211
|
|
29,250
|
|
555
|
|
3,655
|
|
||||||||
|
General and administrative
|
(52
|
)
|
(126
|
)
|
(10
|
)
|
(40
|
)
|
|||||||
|
Interest
|
—
|
|
—
|
|
(168
|
)
|
(1,552
|
)
|
|||||||
|
Depreciation and amortization
|
(3,608
|
)
|
(10,985
|
)
|
(383
|
)
|
(1,119
|
)
|
|||||||
|
Gain on sale of real estate
|
—
|
|
—
|
|
14,106
|
|
14,106
|
|
|||||||
|
$
|
5,551
|
|
(1)
|
$
|
18,139
|
|
(1)
|
$
|
14,100
|
|
$
|
15,050
|
|
||
|
September 30, 2017
|
||||||||
|
Noncontrolling Interest Share of Consolidated Real Estate JVs
|
Our Share of Unconsolidated
Real Estate JVs
|
|||||||
|
Investments in real estate
|
$
|
476,339
|
|
$
|
57,340
|
|
||
|
Cash and cash equivalents
|
13,957
|
|
4,317
|
|
||||
|
Other assets
|
29,534
|
|
3,707
|
|
||||
|
Secured notes payable
|
—
|
|
(28,278
|
)
|
||||
|
Other liabilities
|
(21,989
|
)
|
(3,394
|
)
|
||||
|
Redeemable noncontrolling interests
|
(11,418
|
)
|
(1)
|
—
|
|
|||
|
$
|
486,423
|
|
$
|
33,692
|
|
|||
|
(1)
|
Redeemable noncontrolling interests in our consolidated real estate project at 213 East Grand Avenue since August 2005, located in our South San Francisco submarket, aggregating
300,930
RSF, which earns a fixed preferred return of
8.4%
rather than a variable return based upon their ownership percentage of the joint venture. Operating results information presented above excludes an allocation of results attributable to noncontrolling interests since they earn a fixed preferred return.
|
For the
nine months ended September 30, 2017
and
2016
, we distributed
$17.4 million
and
$10.9 million
, respectively, to our consolidated real estate joint venture partners. The increase is primarily related to the distributions to real estate joint ventures formed with TIAA in December 2015 and December 2016 at 10300 Campus Point Drive in our University Town Center submarket of San Diego. Refer to our consolidated statements of cash flows and Note 3 – “Investments in Real Estate” to our unaudited consolidated financial statements under Item 1 of this report for additional information.
95
Investments
We hold equity investments in certain publicly traded companies, privately held entities, and limited partnerships primarily involved in the life science and technology industries.
As of
September 30, 2017
, our investments aggregated
$485.3 million
, or approximately
4.2%
of our total assets. The charts and table below present selected investment statistics as of
September 30, 2017
(dollars in thousands, unless stated otherwise):
|
Public/Private Investment Mix
(Cost) |
Tenant/Non-Tenant Mix
(Cost)
|
|||||||||||||
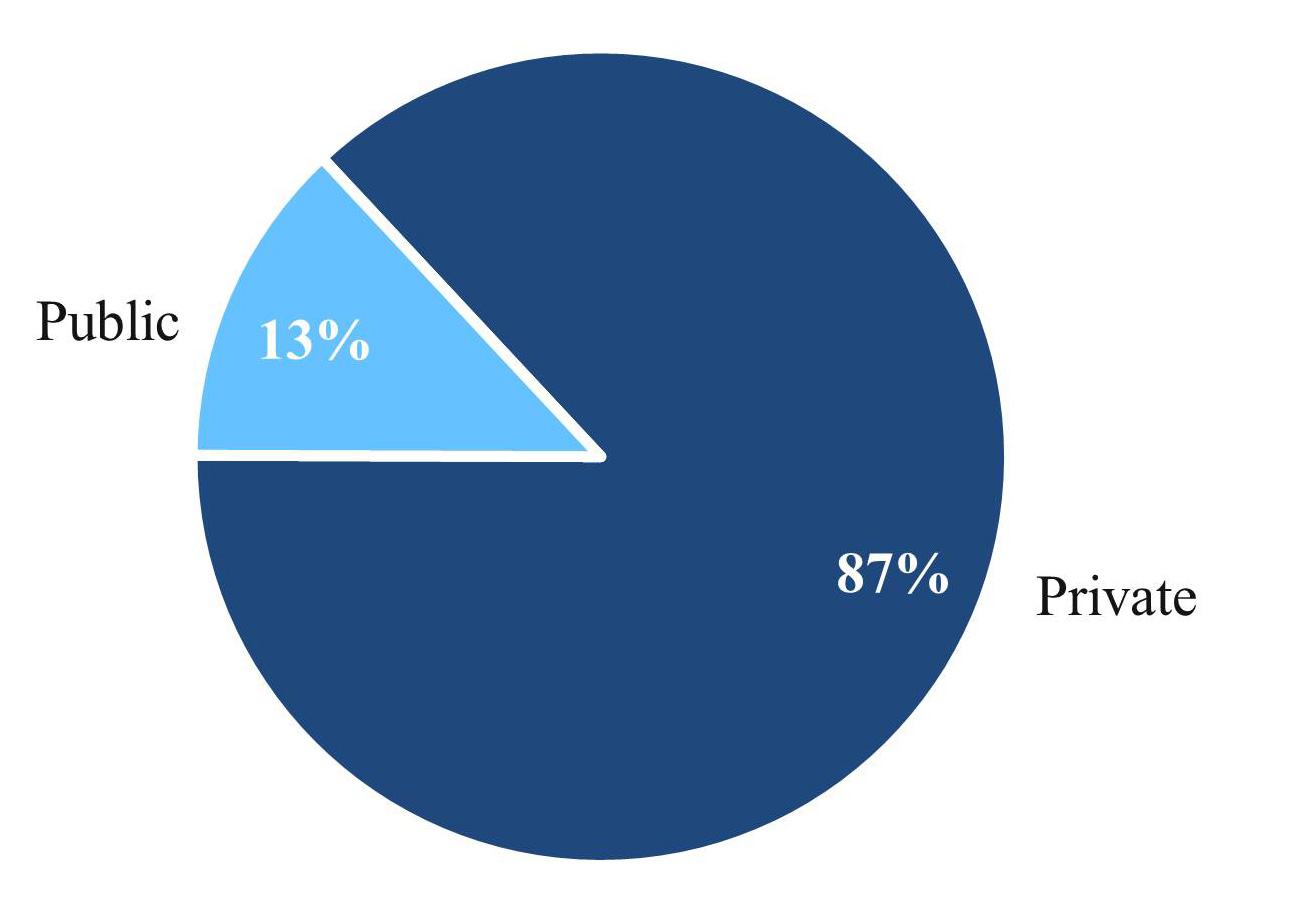
|
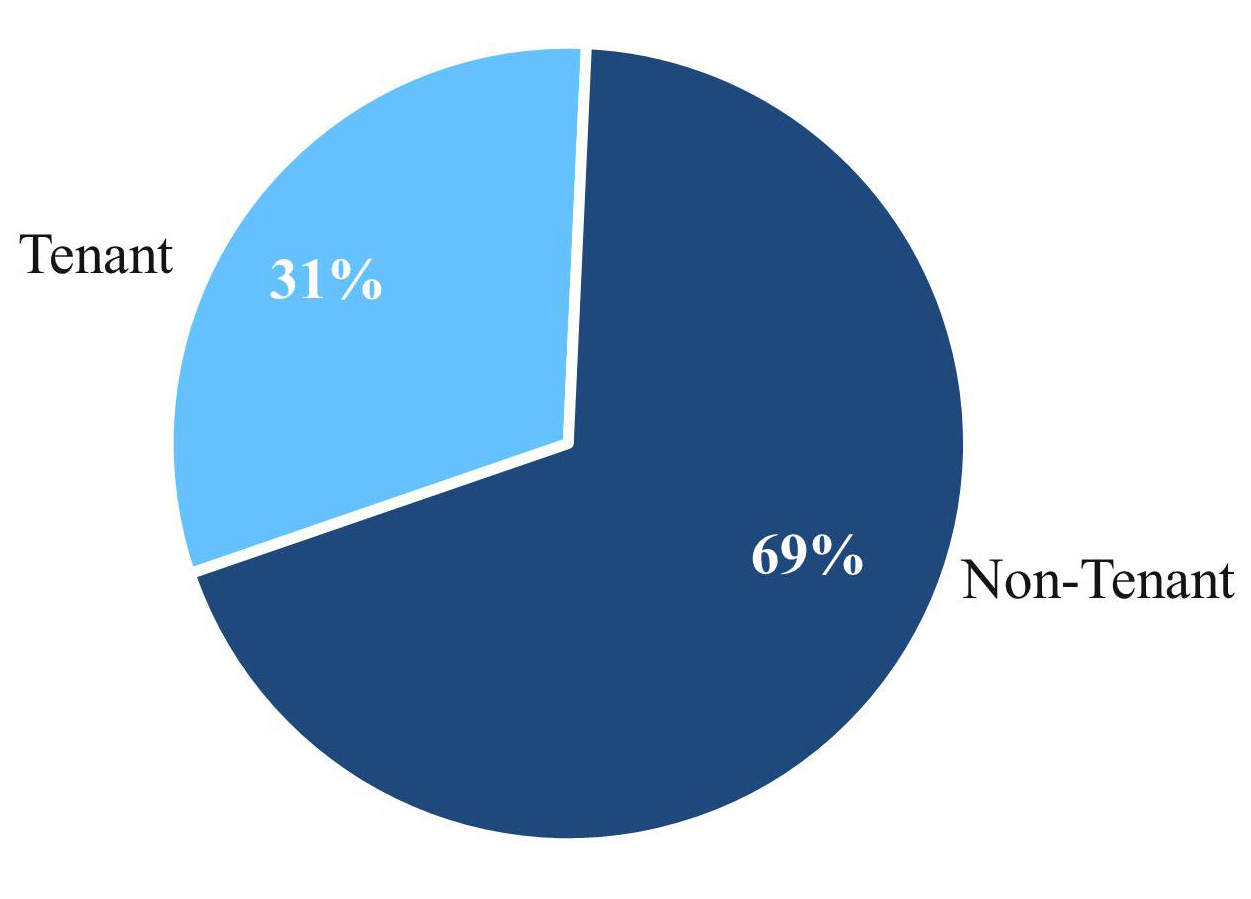
|
|||||||||||||
|
Investment
Type
|
Cost
|
Net Unrealized Gains
|
Total
|
Number of Investments
|
||||||||||
|
Public
|
$
|
55,433
|
|
$
|
45,189
|
|
$
|
100,622
|
|
259
|
||||
|
Private
|
384,640
|
|
—
|
|
384,640
|
|
Average Cost
|
|||||||
|
Total
|
$
|
440,073
|
|
$
|
45,189
|
|
$
|
485,262
|
|
$1.7M
|
||||
96
Liquidity
|
Net Debt to Adjusted EBITDA
(1)
|
Net Debt and Preferred Stock to Adjusted EBITDA
(1)
|
||||
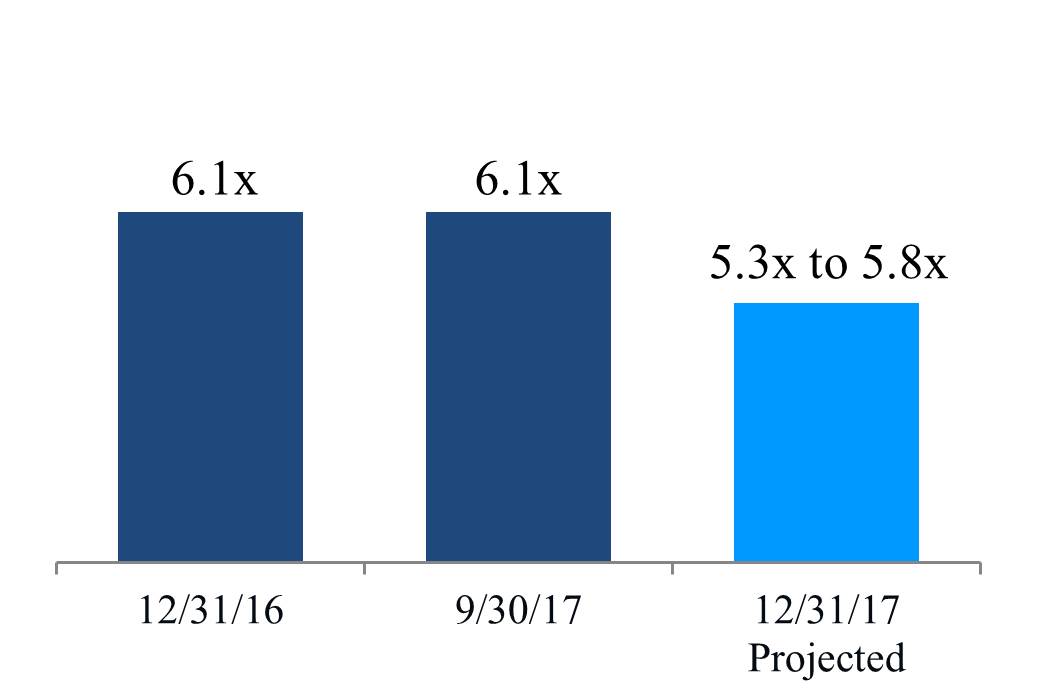
|
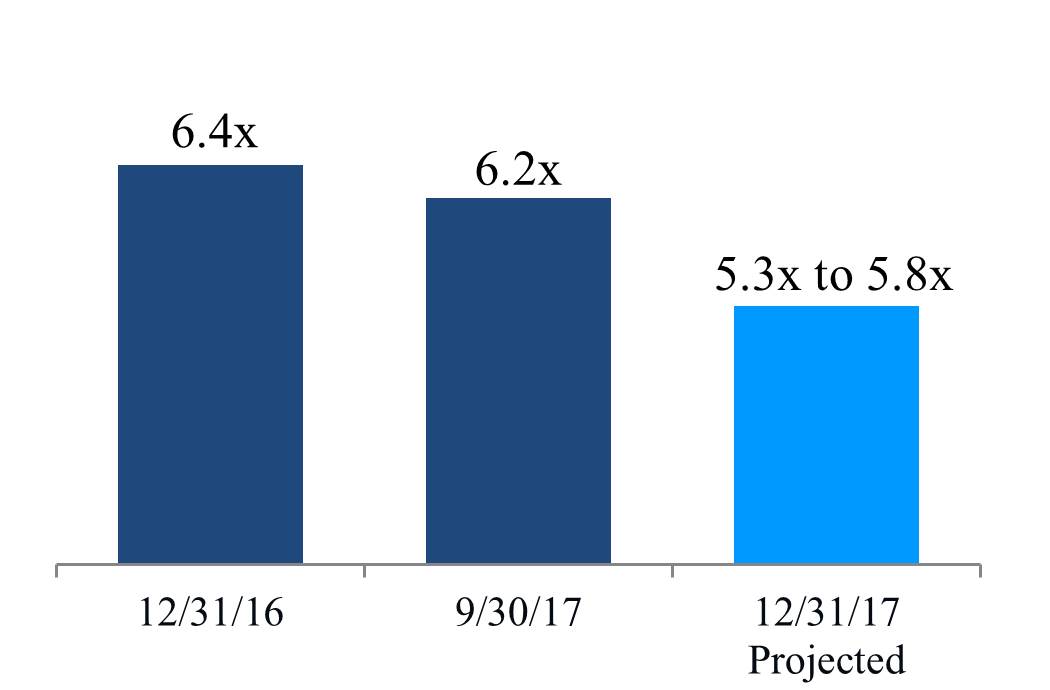
|
||||
|
Fixed-Charge Coverage Ratio
(1)
|
Liquidity
(2)
|
||||
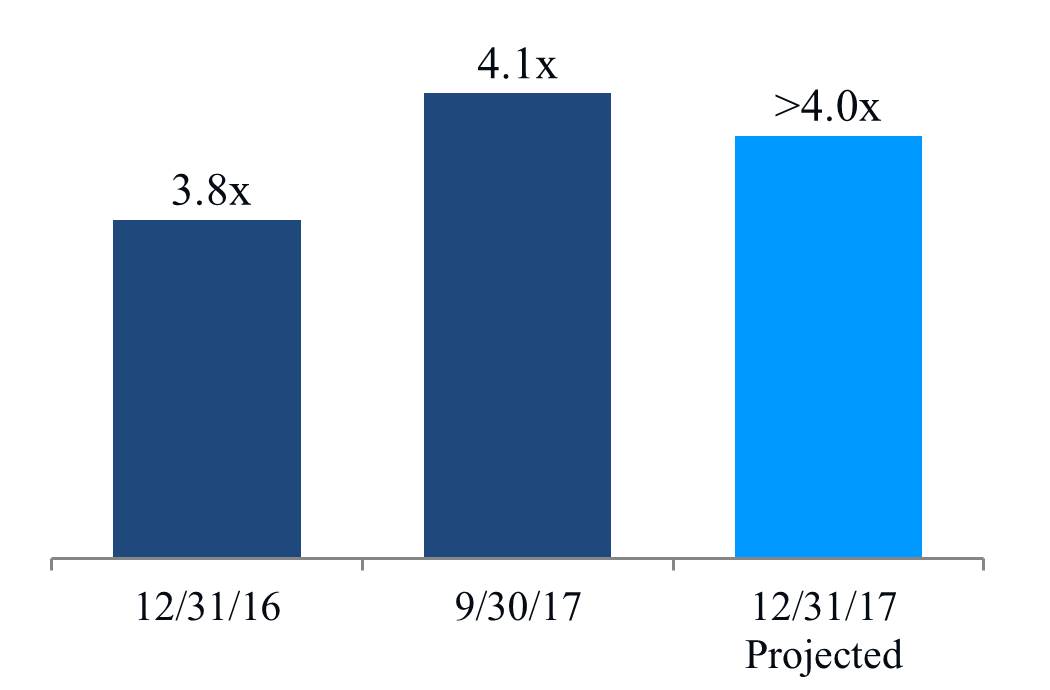
|
$1.7B
|
||||
|
(In millions)
|
|||||
|
Availability under our $1.65 billion unsecured senior line of credit
|
$
|
1,336
|
|
||
|
Remaining construction loan commitments
|
156
|
|
|||
|
Available-for-sale equity securities, at fair value
|
101
|
|
|||
|
Cash, cash equivalents, and restricted cash
|
146
|
|
|||
|
$
|
1,739
|
|
|||
|
(1)
|
Quarter annualized.
|
|
(2)
|
As of
September 30, 2017
.
|
We expect to meet certain long-term liquidity requirements, such as requirements for development, redevelopment, other construction projects, capital improvements, tenant improvements, property acquisitions, leasing costs, non-revenue-enhancing capital expenditures, scheduled debt maturities, distributions to noncontrolling interests, repurchase/redemption of preferred stock, and dividends through net cash provided by operating activities, periodic asset sales, strategic real estate joint venture capital, and long-term secured and unsecured indebtedness, including borrowings under our $1.65 billion unsecured senior line of credit, unsecured senior bank term loans, and the issuance of additional debt and/or equity securities.
We expect to continue meeting our short-term liquidity and capital requirements, as further detailed in this section, generally through our working capital and net cash provided by operating activities. We believe that the net cash provided by operating activities will continue to be sufficient to enable us to make the distributions necessary to continue qualifying as a REIT.
97
Over the next several years, our balance sheet, capital structure, and liquidity objectives are as follows:
|
•
|
Retain positive cash flows from operating activities after payment of dividends and distributions to noncontrolling interests for investment in development and redevelopment projects and/or acquisitions;
|
|
•
|
Maintain significant liquidity from net cash provided by operating activities, cash, cash equivalents, and restricted cash, available-for-sale equity securities, available borrowing capacity under our $1.65 billion unsecured senior line of credit, and available commitments under our secured construction loans;
|
|
•
|
Reduce the aggregate amount outstanding under our unsecured senior bank term loans;
|
|
•
|
Maintain a well-laddered debt maturity profile;
|
|
•
|
Decrease the ratio of net debt to Adjusted EBITDA and net debt and preferred stock to Adjusted EBITDA, allowing for some variation from quarter to quarter and year to year;
|
|
•
|
Maintain diverse sources of capital, including sources from net cash provided by operating activities, unsecured debt, secured debt, selective asset sales, joint venture capital, preferred stock, and common stock;
|
|
•
|
Mitigate unhedged variable-rate debt exposure through the reduction of short-term and medium-term variable-rate bank debt;
|
|
•
|
Maintain a large unencumbered asset pool to provide financial flexibility;
|
|
•
|
Fund preferred stock and common stock dividends and distributions to noncontrolling interests from net cash provided by operating activities;
|
|
•
|
Manage a disciplined level of value-creation projects as a percentage of our gross investments in real estate; and
|
|
•
|
Maintain high levels of pre-leasing and percentage leased in value-creation projects.
|
The following table presents the availability under our $1.65 billion unsecured senior line of credit, available commitments under our secured construction loans, available-for-sale equity securities, cash, cash equivalents, and restricted cash as of
September 30, 2017
(dollars in thousands):
|
Description
|
Aggregate
Commitments
|
Outstanding
Balance
|
Remaining Commitments/Liquidity
|
|||||||||
|
$1.65 billion unsecured senior line of credit
|
$
|
1,650,000
|
|
$
|
314,000
|
|
$
|
1,336,000
|
|
|||
|
Secured construction loans:
|
||||||||||||
|
50 and 60 Binney Street/Greater Boston
|
350,000
|
|
317,979
|
|
32,021
|
|
||||||
|
100 Binney Street/Greater Boston
|
304,281
|
|
179,764
|
|
124,517
|
|
||||||
|
$
|
2,304,281
|
|
$
|
811,743
|
|
1,492,538
|
|
|||||
|
Available-for-sale equity securities, at fair value
|
100,622
|
|
||||||||||
|
Cash, cash equivalents, and restricted cash
|
146,275
|
|
||||||||||
|
Total liquidity
|
$
|
1,739,435
|
|
|||||||||
Refer to Note 8 – “Secured and Unsecured Senior Debt” to our unaudited consolidated financial statements under Item 1 of this report for a discussion of our secured construction loans.
Cash and cash equivalents
As of
September 30, 2017
, and
December 31, 2016
, we had
$118.6 million
and
$125.0 million
, respectively, of cash and cash equivalents. We expect existing cash and cash equivalents, cash flows from operating activities, proceeds from asset sales, borrowings under our $1.65 billion unsecured senior line of credit, secured construction loan borrowings, issuances of unsecured notes payable, and issuances of common stock to continue to be sufficient to fund our operating activities and cash commitments for investing and financing activities, such as regular quarterly dividends, distribution to noncontrolling interests, scheduled debt repayments, acquisitions, and certain capital expenditures, including expenditures related to construction activities.
98
Restricted cash
Restricted cash consisted of the following as of
September 30, 2017
, and
December 31, 2016
(in thousands):
|
|
September 30, 2017
|
December 31, 2016
|
|||||
|
Funds held in trust under the terms of certain secured notes payable
|
$
|
17,853
|
|
$
|
7,387
|
|
|
|
Funds held in escrow related to construction projects and investing activities
|
4,544
|
|
4,541
|
|
|||
|
Other
|
5,316
|
|
4,406
|
|
|||
|
Total
|
$
|
27,713
|
|
$
|
16,334
|
|
|
Cash flows
We report and analyze our cash flows based on operating activities, investing activities, and financing activities. The following table summarizes changes in our cash flows (in thousands):
|
Nine Months Ended September 30,
|
|||||||||||
|
2017
|
2016
|
Change
|
|||||||||
|
Net cash provided by operating activities
|
$
|
356,330
|
|
$
|
291,851
|
|
$
|
64,479
|
|
||
|
Net cash used in investing activities
|
$
|
(1,313,764
|
)
|
$
|
(715,301
|
)
|
$
|
(598,463
|
)
|
||
|
Net cash provided by financing activities
|
$
|
949,385
|
|
$
|
457,720
|
|
$
|
491,665
|
|
||
Operating activities
Cash flows provided by operating activities
are primarily dependent upon the occupancy level of our asset base, the rental rates of our leases, the collectability of rent and recovery of operating expenses from our tenants, the timing of completion of development and redevelopment projects, and the timing of acquisitions and dispositions of operating properties.
Net cash provided by operating activities
for the
nine months ended September 30, 2017
,
increased
to
$356.3 million
, compared to
$291.9 million
for the
nine months ended September 30, 2016
. This
increase
was primarily attributable to (i) cash flows generated by our highly leased development and redevelopment projects recently placed into service, (ii) income-producing acquisitions since
January 1, 2016
, and (iii) increases in rental rates on lease renewals and re-leasing of space since
January 1, 2016
.
Investing activities
Cash flows used in investing activities
for the
nine months ended September 30, 2017
and
2016
, consisted of the following (in thousands):
|
|
Nine Months Ended September 30,
|
||||||||||
|
|
2017
|
2016
|
Change
|
||||||||
|
Proceeds from sales of real estate
|
$
|
4,263
|
|
$
|
27,332
|
|
$
|
(23,069
|
)
|
||
|
Additions to real estate
|
(660,877
|
)
|
(638,568
|
)
|
(22,309
|
)
|
|||||
|
Purchases of real estate
|
(590,884
|
)
|
(18,108
|
)
|
(572,776
|
)
|
|||||
|
Deposits for investing activities
|
4,700
|
|
(54,998
|
)
|
59,698
|
|
|||||
|
Additions to investments
|
(128,190
|
)
|
(68,384
|
)
|
(59,806
|
)
|
|||||
|
Sales of investments
|
18,896
|
|
35,295
|
|
(16,399
|
)
|
|||||
|
Repayment of notes receivable
|
—
|
|
9,054
|
|
(9,054
|
)
|
|||||
|
Other
|
38,328
|
|
(6,924
|
)
|
45,252
|
|
|||||
|
Net cash used in investing activities
|
$
|
(1,313,764
|
)
|
$
|
(715,301
|
)
|
$
|
(598,463
|
)
|
||
The change in net cash used in investing activities for the
nine months ended September 30, 2017
, is primarily due to an increased use of cash for property acquisitions and construction related to our highly leased pipeline. Refer to Note 3 – “Investments in Real Estate” and Note 5 – “Investments” to our unaudited consolidated financial statements under Item 1 of this report for further information.
99
Financing activities
Cash flows provided by financing activities
for the
nine months ended September 30, 2017
and
2016
, consisted of the following (in thousands):
|
Nine Months Ended September 30,
|
|||||||||||
|
2017
|
2016
|
Change
|
|||||||||
|
Borrowings from secured notes payable
|
$
|
145,272
|
|
$
|
215,330
|
|
$
|
(70,058
|
)
|
||
|
Repayments of borrowings from secured notes payable
|
(2,882
|
)
|
(234,096
|
)
|
231,214
|
|
|||||
|
Proceeds from issuance of unsecured senior notes payable
|
424,384
|
|
348,604
|
|
75,780
|
|
|||||
|
Borrowings from unsecured senior line of credit
|
2,634,000
|
|
2,349,000
|
|
285,000
|
|
|||||
|
Repayments of borrowings from unsecured senior line of credit
|
(2,348,000
|
)
|
(2,084,000
|
)
|
(264,000
|
)
|
|||||
|
Repayments of borrowings from unsecured senior bank term loans
|
(200,000
|
)
|
(200,000
|
)
|
—
|
|
|||||
|
Changes related to debt
|
652,774
|
|
394,838
|
|
257,936
|
|
|||||
|
Repurchase of 7.00% Series D cumulative convertible preferred stock
|
(17,934
|
)
|
(98,633
|
)
|
80,699
|
|
|||||
|
Redemption of 6.45% Series E cumulative redeemable preferred stock
|
(130,350
|
)
|
—
|
|
(130,350
|
)
|
|||||
|
Proceeds from the issuance of common stock
|
705,391
|
|
367,802
|
|
337,589
|
|
|||||
|
Dividend payments
|
(238,131
|
)
|
(195,453
|
)
|
(42,678
|
)
|
|||||
|
Contributions from noncontrolling interests
|
9,877
|
|
68,621
|
|
(58,744
|
)
|
|||||
|
Distributions to and purchase of noncontrolling interests
|
(17,432
|
)
|
(62,605
|
)
|
45,173
|
|
|||||
|
Other
|
(14,810
|
)
|
(16,850
|
)
|
2,040
|
|
|||||
|
Net cash provided by financing activities
|
$
|
949,385
|
|
$
|
457,720
|
|
$
|
491,665
|
|
||
100
Capital resources
We expect that our principal liquidity needs for the year ending
December 31, 2017
, will be satisfied by the following multiple sources of capital, as shown in the table below. There can be no assurance that our sources and uses of capital will not be materially higher or lower than these expectations.
|
Key Sources and Uses of Capital
(In millions)
|
2017 Guidance
|
Key Items Remaining after 9/30/17
|
|||||||||||||||
|
Range
|
Midpoint
|
||||||||||||||||
|
Sources of capital:
|
|||||||||||||||||
|
Net cash provided by operating activities after dividends
|
$
|
115
|
|
$
|
135
|
|
$
|
125
|
|
||||||||
|
Incremental debt
|
388
|
|
298
|
|
343
|
|
|||||||||||
|
Real estate dispositions and common equity
|
1,080
|
|
1,350
|
|
1,215
|
|
(1)
|
|
|||||||||
|
Total sources of capital
|
$
|
1,583
|
|
$
|
1,783
|
|
$
|
1,683
|
|
||||||||
|
Uses of capital:
|
|||||||||||||||||
|
Construction
|
$
|
815
|
|
$
|
915
|
|
$
|
865
|
|
$
|
243
|
|
|||||
|
Acquisitions
|
620
|
|
720
|
|
670
|
|
(2)
|
$
|
79
|
|
(3)
|
||||||
|
7.00% Series D convertible preferred stock repurchases
|
18
|
|
18
|
|
18
|
|
(4)
|
|
|
||||||||
|
6.45% Series E redeemable preferred stock redemption
|
130
|
|
130
|
|
130
|
|
|||||||||||
|
Total uses of capital
|
$
|
1,583
|
|
$
|
1,783
|
|
$
|
1,683
|
|
||||||||
|
Incremental debt (included above):
|
|||||||||||||||||
|
Issuance of unsecured senior notes payable
|
$
|
425
|
|
$
|
425
|
|
$
|
425
|
|
||||||||
|
Borrowings – secured construction loans
|
200
|
|
250
|
|
225
|
|
|||||||||||
|
Repayments of secured notes payable
|
(5
|
)
|
(10
|
)
|
(8
|
)
|
|||||||||||
|
Repayment of unsecured senior bank term loan
|
(200
|
)
|
(200
|
)
|
(200
|
)
|
|||||||||||
|
$1.65 billion unsecured senior line of credit/other
|
(32
|
)
|
(167
|
)
|
(99
|
)
|
|||||||||||
|
Incremental debt
|
$
|
388
|
|
$
|
298
|
|
$
|
343
|
|
||||||||
|
(1)
|
Includes
6.2 million
shares of our common stock issued during the nine months ended September 30, 2017, for net proceeds of $
705.4 million
, and
4.8 million
shares of our common stock subject to forward equity sales agreements, with anticipated aggregate net proceeds of
$495.5 million
to be settled in the three months ended December 31, 2017, subject to adjustments as provided in the forward equity sales agreements. Also includes dispositions completed during the nine months ended September 30, 2017. Refer to the “Real Estate Asset Sales” section within this Item 2 for additional information.
|
|
(2)
|
Acquisitions guidance increased by
$80.0 million
from
$590.0 million
in our July 31, 2017, forecast primarily for the completed acquisition of 201 Haskins Way in September 2017 and one pending acquisition. Refer to the “Acquisitions” section within this Item 2 for additional information.
|
|
(3)
|
Includes the second construction milestone installment payment for the 2016 acquisition of the remaining 49% interest in our unconsolidated real estate joint venture with Uber at 1455 and 1515 Third Street in our Mission Bay/SoMa submarket and one pending acquisition.
|
|
(4)
|
Guidance for repurchases of our 7.00% Series D preferred stock decreased by $77.0 million to reflect actual redemptions through the third quarter 2017.
|
The key assumptions behind the sources and uses of capital in the table above include a favorable capital market environment, performance of our core operating properties, lease-up and delivery of current and future development and redevelopment projects, completion of pending and projected acquisitions, and continued substantial leasing activity of our operating properties. Our expected sources and uses of capital are subject to a number of variables and uncertainties, including those discussed as “Forward-Looking Statements” under Part I; “Item 1A. Risk Factors”; and “Item 7. Management’s Discussion and Analysis of Financial Condition and Results of Operations” of our annual report on Form 10‑K for the year ended
December 31, 2016
. We expect to update our forecast of sources and uses of capital on a quarterly basis.
101
Sources of capital
Net cash provided by operating activities after dividends
We expect to retain
$115 million
to
$135 million
of net cash flows from operating activities after payment of common stock and preferred stock dividends, and after deduction for distributions to noncontrolling interests. Changes in operating assets and liabilities are excluded from this calculation as they represent timing differences. Net cash provided by operating activities after dividends in
2017
is expected to be driven by the completion of our highly pre-leased value-creation projects, along with recently delivered projects, certain future projects, recently acquired properties, and contributions from Same Properties, which will contribute significant increases in rental revenue, net operating income, and cash flows.
Debt
The table below reflects the outstanding balances, maturity dates, applicable rates, and facility fees for each of these facilities as of
September 30, 2017
(dollars in thousands):
|
September 30, 2017
|
||||||||||
|
Facility
|
Balance
|
Maturity Date
(1)
|
Applicable Margin
|
Facility Fee
|
||||||
|
$1.65 billion unsecured senior line of credit
|
$
|
314,000
|
|
October 2021
|
L+1.00%
|
0.20%
|
||||
|
2019 Unsecured Senior Bank Term Loan
|
$
|
199,543
|
|
January 2019
|
L+1.20%
|
N/A
|
||||
|
2021 Unsecured Senior Bank Term Loan
|
$
|
348,317
|
|
January 2021
|
L+1.10%
|
N/A
|
||||
|
(1)
|
Includes any extension options that we control.
|
Borrowings under the $1.65 billion unsecured senior line of credit bear interest at LIBOR or the base rate specified in the amended $1.65 billion unsecured senior line of credit agreement plus, in either case, a specified margin (the “Applicable Margin”). The Applicable Margin for LIBOR borrowings under the $1.65 billion unsecured senior line of credit is based on our existing credit ratings as set by certain rating agencies.
We use our $1.65 billion unsecured senior line of credit to fund working capital, construction activities, and, from time to time, acquisition of properties. Borrowings under the $1.65 billion unsecured senior line of credit will bear interest at a “Eurocurrency Rate” or a “Base Rate” specified in the amended $1.65 billion unsecured line of credit agreement plus, in either case, the Applicable Margin. The Eurocurrency Rate specified in the amended $1.65 billion unsecured line of credit agreement is, as applicable, the rate per annum equal to (i) the LIBOR or a successor rate thereto as approved by the administrative agent for loans denominated in a LIBOR quoted currency (i.e., U.S. dollars, euro, sterling, or yen), (ii) the average annual yield rates applicable to Canadian dollar bankers’ acceptances for loans denominated in Canadian dollars, (iii) the Bank Bill Swap Reference Bid rate for loans denominated in Australian dollars, or (iv) the rate designated with respect to the applicable alternative currency for loans denominated in a non-LIBOR quoted currency (other than Canadian or Australian dollars). The Base Rate means, for any day, a fluctuating rate per annum, equal to the highest of (i) the federal funds rate plus 1/2 of 1.00%, (ii) the rate of interest in effect for such day as publicly announced, from time to time, by Bank of America as its “prime rate,” and (iii) the Eurocurrency Rate plus 1.00%. Our $1.65 billion unsecured senior line of credit contains a feature that allows lenders to competitively bid on the interest rate for borrowings under the facility. This may result in an interest rate that is below the stated rate. In addition to the cost of borrowing, the facility is subject to an annual facility fee of
0.20%
based on the aggregate commitments outstanding.
We expect to fund a significant portion of our capital needs in
2017
from the issuance of unsecured senior notes payable, borrowings available under existing secured construction loans, and our $1.65 billion unsecured senior line of credit.
In March 2017, we completed an offering of
$425.0 million
of unsecured senior notes, due in
2028
, at an interest rate of
3.95%
. Net proceeds of
$420.5 million
were used initially to reduce outstanding borrowings on our $1.65 billion unsecured senior line of credit. Refer to “3.95% Unsecured Senior Notes Payable Due in 2028” in Note 8 – “Secured and Unsecured Senior Debt” to our unaudited consolidated financial statements under Item 1 of this report for additional information regarding our unsecured senior notes payable.
During the
nine months ended September 30, 2017
, we completed a partial repayment of
$200 million
of our 2019 Unsecured Senior Bank Term Loan, reducing the total outstanding balance from
$400 million
to
$200 million
, and recognized a loss on early extinguishment of debt of
$670 thousand
related to the write-off of unamortized loan fees.
102
Real estate dispositions and common equity
We expect to continue the disciplined execution of select sales of non-strategic land and non-core/“core-like” operating assets. The sale of non-strategic land and non-core/“core-like” operating assets provides an important source of capital to fund a portion of our highly leased value-creation development and redevelopment projects. We may also consider additional sales of partial interests in core Class A properties and/or development projects. For
2017
, we expect real estate dispositions and issuances of common equity ranging from
$1.1 billion
to
$1.4 billion
. Refer to “Forward Equity Sales Agreements” below within this Item 2 for additional information related to our forward equity sales agreements executed in March 2017. The amount of asset sales necessary to meet our forecasted sources of capital will vary depending upon the amount of EBITDA associated with the assets sold. In addition, the amount of common equity issued will be subject to market conditions.
For additional information, refer to “Sale of Real Estate Assets and Impairment Charges” in Note 3 – “Investments in Real Estate” and Note 4 – “Investments in Unconsolidated Real Estate Joint Ventures” to our unaudited consolidated financial statements under Item 1 of this report and “Real Estate Asset Sales” under the “Investments in Real Estate” section within this Item 2.
ATM common stock offering program
In October 2016, we established an ATM common stock offering program that allowed us to sell up to an aggregate of
$600.0 million
of our common stock. During the six months ended June 30, 2017, we completed our ATM program with the sale of
2.1 million
shares of common stock for gross proceeds of
$245.8 million
, or
$118.97
per share, and net proceeds of approximately
$241.8 million
.
In August 2017, we established a new ATM common stock offering program that allows us to sell up to an aggregate of
$750.0 million
of our common stock. During the
three months ended September 30, 2017
, we sold an aggregate of
2.1 million
shares of common stock for gross proceeds of
$249.9 million
, or
$119.94
per share, and received net proceeds of approximately
$245.8 million
. As of
September 30, 2017
, the remaining aggregate amount available under our current program for future sales of common stock is
$500.1 million
.
Forward equity sales agreements
In March 2017, we executed an offering to sell an aggregate
6.9 million
shares of our common stock, including a forward equity component, at a public offering price of
$108.55
per share. Approximately 60% of the proceeds was initially targeted to fund value-creation acquisitions and construction, with approximately 40% targeted to fund balance sheet improvements, including reduction in our projected net debt to Adjusted EBITDA – fourth quarter of 2017, annualized by 0.2x, and redemption of our Series E Redeemable Preferred Stock. Aggregate net proceeds from the sale, after underwriters’ discount and issuance costs, of
$713.3 million
consisted of the following:
|
•
|
2.1 million
shares issued at closing with net proceeds of
$217.8 million
; and
|
|
•
|
4.8 million
shares subject to forward equity sales agreements expiring no later than March 2018 with net proceeds of
$495.5 million
, which will be further adjusted as provided in the sales agreements. As of
September 30, 2017
, these forward equity sales agreements have not been settled. We expect to settle these contracts with shares by December 31, 2017.
|
Other sources
Under our current shelf registration statement filed with the SEC, we may offer common stock, preferred stock, debt, and other securities. These securities may be issued, from time to time, at our discretion based on our needs and market conditions, including, as necessary, the balancing of our use of incremental debt capital.
We hold interests, together with certain third parties, in companies that we consolidate in our financial statements. These third parties may contribute equity into these entities primarily related to their share of funds for construction and financing-related activities. During the
nine months ended September 30, 2017
, we received contributions from noncontrolling interests of
$9.9 million
.
103
Uses of capital
Summary of capital expenditures
Our primary use of capital relates to the development, redevelopment, pre-construction, and construction of properties. We currently have projects in our visible growth pipeline aggregating
1.5 million
RSF of new Class A office/laboratory and tech office space, and future value-creation projects supporting an aggregate of
8.0 million
SF of ground-up development in North America. We incur capitalized construction costs related to development, redevelopment, pre-construction, and other construction activities. We also incur additional capitalized project costs, including interest, property taxes, insurance, and other costs directly related and essential to the development or construction of a project, during periods when activities necessary to prepare an asset for its intended use are in progress. Refer to “Development of New Class A Properties: 2017 Deliveries,” “Development and Redevelopment of New Class A Properties: 2018 and 2019 Deliveries”, and “Summary of Capital Expenditures,” within this Item 2 for more information on our capital expenditures.
We capitalize interest cost as a cost of the project only during the period for which activities necessary to prepare an asset for its intended use are ongoing, provided that expenditures for the asset have been made and interest cost has been incurred. Capitalized interest for the
nine months ended September 30, 2017
and
2016
, of
$45.3 million
and
$40.8 million
, respectively, is classified in investments in real estate. Indirect project costs, including construction administration, legal fees, and office costs that clearly relate to projects under development or construction, are capitalized as incurred during the period an asset is undergoing activities to prepare it for its intended use. We capitalized payroll and other indirect project costs related to development, redevelopment, and construction projects, which aggregated
$18.3 million
and
$10.5 million
for the
nine months ended September 30, 2017
and
2016
, respectively.
The increase in capitalized payroll and other indirect project costs for the
nine months ended September 30, 2017
, compared to the same period in
2016
, was primarily due to
10
new projects with approximately
3.3 million
developable SF that increased pre-construction activities in 2017. Pre-construction activities include entitlements, permitting, design, site work, and other activities preceding commencement of construction of aboveground building improvements. The advancement of pre-construction efforts is focused on reducing the time required to deliver projects to prospective tenants. These critical activities add significant value for future ground-up development and are required for the vertical construction of buildings. Additionally, should we cease activities necessary to prepare an asset for its intended use, the interest, taxes, insurance, and certain other direct project costs related to this asset would be expensed as incurred. Expenditures for repairs and maintenance are expensed as incurred.
Fluctuations in our development, redevelopment, and construction activities could result in significant changes to total expenses and net income. For example, had we experienced a 10% reduction in development, redevelopment, and construction activities without a corresponding decrease in indirect project costs, including interest and payroll, total expenses would have increased by approximately
$6.4 million
for the
nine months ended September 30, 2017
.
We also capitalize and defer initial direct costs to originate leases with independent third parties related to evaluating a prospective lessee’s financial condition, negotiating lease terms, preparing the lease agreement, and closing the lease transaction. Costs that we capitalized and deferred relate to successful leasing transactions, result directly from and are essential to the lease transaction, and would not have been incurred had that lease transaction not occurred. The initial direct costs capitalized and deferred also include the portion of our employees’ total compensation and payroll-related benefits directly related to time spent performing activities previously described and related to the respective lease that would not have been performed but for that lease. Total initial direct leasing costs capitalized during the
nine months ended September 30, 2017
and
2016
, were
$44.4 million
and
$23.9 million
, respectively, of which
$10.3 million
and
$9.4 million
, respectively, represented capitalized and deferred payroll costs directly related and essential to our leasing activities during each respective period. The increase in direct leasing costs capitalized during the
nine months ended September 30, 2017
, compared to
nine months ended September 30, 2016
, was due to the increase in leasing activity in 2017. For the
nine months ended September 30, 2017
, we completed
3.2 million
RSF of new, renewed, and re-leased space with a weighted-average lease term of
7.5 years
compared to 1.9 million RSF of leasing activity with a weighted-average lease term of 5.7 years during the
nine months ended September 30, 2016
.
Acquisitions
Refer to “Acquisitions” in Note 3 – “Investments in Real Estate” to our unaudited consolidated financial statements under Item 1 and “Acquisitions” under the “Investments in Real Estate” section within this Item 2 of this report for more information on our acquisitions.
104
7.00% Series D cumulative convertible preferred stock repurchases
During the
nine months ended September 30, 2017
, we repurchased, in privately negotiated transactions,
501,115
shares of our Series D Convertible Preferred Stock at an aggregate price of
$17.9 million
, or
$35.79
per share. We recognized a preferred stock redemption charge of
$5.8 million
during the
nine months ended September 30, 2017
, including the write-off of original issuance costs of approximately
$391 thousand
. During the remainder of 2017, we may seek to repurchase additional shares of our Series D Convertible Preferred Stock, subject to market conditions. To the extent that we repurchase additional shares of our Series D Convertible Preferred Stock, we expect to fund such amounts with the proceeds from issuances of our common stock, subject to market conditions.
6.45% Series E cumulative redeemable preferred stock redemption
In March 2017, we announced the redemption of our Series E Redeemable Preferred Stock. On
April 14, 2017
, we completed the redemption of all
5.2 million
outstanding shares of our Series E Redeemable Preferred Stock at a redemption price of
$25.00
per share, or an aggregate
$130.0 million
, plus accrued dividends.
Dividends
During the
nine months ended September 30, 2017
and
2016
, we paid the following dividends (in thousands):
|
Nine Months Ended September 30,
|
|||||||||||
|
2017
|
2016
|
Change
|
|||||||||
|
Common stock dividends
|
$
|
229,814
|
|
$
|
177,966
|
|
$
|
51,848
|
|
||
|
7.00% Series D cumulative convertible preferred stock dividends
|
4,125
|
|
11,198
|
|
(7,073
|
)
|
|||||
|
6.45% Series E cumulative redeemable preferred stock dividends
|
4,192
|
|
6,289
|
|
(2,097
|
)
|
|||||
|
|
$
|
238,131
|
|
$
|
195,453
|
|
$
|
42,678
|
|
||
The increase in dividends paid on our common stock for the
nine months ended September 30, 2017
, compared to the
nine months ended September 30, 2016
, was primarily due to an increase in number of common shares outstanding at each record date of
December 31, 2016
, and
December 31, 2015
, as a result of common stock issuances under our ATM program, settlement of forward equity sales agreements, and partially due to the increase in the related dividends to
$2.52
per common share paid during the
nine months ended September 30, 2017
, from
$2.37
per common share paid during the
nine months ended September 30, 2016
. The decrease in dividends paid on our Series D Convertible Preferred Stock was primarily due to the decrease in number of shares outstanding to
3.0 million
shares as of
September 30, 2017
, from
6.5 million
shares as of
September 30, 2016
, due to the repurchases of shares since October 1, 2016.
Contractual obligations and commitments
Contractual obligations as of
September 30, 2017
, consisted of the following (in thousands):
|
Payments by Period
|
|||||||||||||||||||
|
Total
|
2017
|
2018-2019
|
2020-2021
|
Thereafter
|
|||||||||||||||
|
Secured and unsecured debt
(1) (2)
|
$
|
4,828,766
|
|
$
|
732
|
|
$
|
925,546
|
|
$
|
1,181,834
|
|
$
|
2,720,654
|
|
||||
|
Estimated interest payments on fixed-rate and hedged variable-rate debt
(3)
|
1,006,863
|
|
35,059
|
|
306,472
|
|
247,533
|
|
417,799
|
|
|||||||||
|
Estimated interest payments on variable-rate debt
(4)
|
8,735
|
|
1,765
|
|
6,970
|
|
—
|
|
—
|
|
|||||||||
|
Ground lease obligations
|
584,022
|
|
4,037
|
|
24,346
|
|
23,724
|
|
531,915
|
|
|||||||||
|
Other obligations
|
3,607
|
|
399
|
|
3,107
|
|
101
|
|
—
|
|
|||||||||
|
Total
|
$
|
6,431,993
|
|
$
|
41,992
|
|
$
|
1,266,441
|
|
$
|
1,453,192
|
|
$
|
3,670,368
|
|
||||
|
(1)
|
Amounts represent principal amounts due and exclude unamortized debt premiums/discounts and deferred financing costs reflected on the consolidated balance sheets.
|
|
(2)
|
Payment dates reflect any extension options that we control.
|
|
(3)
|
Estimated interest payments on our fixed-rate and hedged variable-rate debt are based upon contractual interest rates, including the impact of interest rate hedge agreements, interest payment dates, and scheduled maturity dates.
|
|
(4)
|
The interest payments on variable-rate debt are based on the interest rates in effect as of
September 30, 2017
.
|
105
Secured notes payable
Secured notes payable as of
September 30, 2017
, consisted of
nine
notes secured by
20
properties. Our secured notes payable typically require monthly payments of principal and interest and had a weighted-average interest rate of approximately
3.80%
. As of
September 30, 2017
, the total book values of our investment in real estate securing debt were approximately
$2.3 billion
. As of
September 30, 2017
, our secured notes payable, including unamortized discounts and deferred financing cost, were composed of approximately
$902.2 million
and
$251.7 million
of fixed-rate/hedged variable-rate debt and variable-rate debt, respectively.
Unsecured senior notes payable, unsecured senior bank term loans, and $1.65 billion unsecured senior line of credit
The requirements of, and our actual performance with respect to, the key financial covenants under our 2.75% unsecured senior notes payable (“2.75% Unsecured Senior Notes”), 4.60% unsecured senior notes payable (“4.60% Unsecured Senior Notes”), 3.90% unsecured senior notes payable (“3.90% Unsecured Senior Notes”), 4.30% unsecured senior notes payable (“4.30% Unsecured Senior Notes”), 3.95% unsecured senior notes payable due in 2027 (“3.95% Unsecured Senior Notes Due in 2027”), 4.50% unsecured senior notes payable (“4.50% Unsecured Senior Notes”), and 3.95% unsecured senior notes payable due in 2028 (“3.95% Unsecured Senior Notes Due in 2028) as of
September 30, 2017
, were as follows:
|
Covenant Ratios
(1)
|
Requirement
|
Actual
|
||
|
Total Debt to Total Assets
|
Less than or equal to 60%
|
37%
|
||
|
Secured Debt to Total Assets
|
Less than or equal to 40%
|
9%
|
||
|
Consolidated EBITDA
(2)
to Interest Expense
|
Greater than or equal to 1.5x
|
6.4x
|
||
|
Unencumbered Total Asset Value to Unsecured Debt
|
Greater than or equal to 150%
|
272%
|
||
|
(1)
|
For definitions of the ratios, refer to the indenture at Exhibits 4.3, 4.13, and 4.18 hereto and the related supplemental indentures at Exhibits 4.4, 4.7, 4.9, 4.11, 4.14, 4.16, and 4.19 hereto, which are each listed under Item 6 of this report.
|
|
(2)
|
The calculation of consolidated EBITDA is based on the definitions contained in our loan agreements and is not directly comparable to the computation of EBITDA as described in Exchange Act Release No. 47226.
|
The requirements of, and our actual performance with respect to, the key financial covenants under our $1.65 billion unsecured senior line of credit and unsecured senior bank term loans as of
September 30, 2017
, were as follows:
|
Covenant Ratios
(1)
|
Requirement
|
Actual
|
||
|
Leverage Ratio
|
Less than or equal to 60.0%
|
30.9%
|
||
|
Secured Debt Ratio
|
Less than or equal to 45.0%
|
7.3%
|
||
|
Fixed-Charge Coverage Ratio
|
Greater than or equal to 1.50x
|
3.83x
|
||
|
Unsecured Leverage Ratio
|
Less than or equal to 60.0%
|
32.6%
|
||
|
Unsecured Interest Coverage Ratio
|
Greater than or equal to 1.50x
|
6.49x
|
||
|
(1)
|
For definitions of the ratios, refer to the amended unsecured senior line of credit and unsecured senior bank term loan agreements at Exhibits 10.1, 10.2, and 10.3 hereto, which are each listed under Item 6 of this report.
|
In addition, the terms of the indentures, among other things, limit the ability of the Company, Alexandria Real Estate Equities, L.P., and the Company’s subsidiaries to (i) consummate a merger, consolidate, or sell all or substantially all of the Company’s assets, and (ii) incur certain secured or unsecured indebtedness.
Estimated interest payments
Estimated interest payments on our fixed-rate and hedged variable-rate debt were calculated based upon contractual interest rates, including estimated interest expense related to interest rate hedge agreements, interest payment dates, and scheduled maturity dates. As of
September 30, 2017
, approximately
88%
of our debt was fixed-rate debt or variable-rate debt subject to interest rate hedge agreements. Refer to Note 9 – “Interest Rate Hedge Agreements” to our unaudited consolidated financial statements under Item 1 of this report for further information. The remaining
12%
of our debt as of
September 30, 2017
, was unhedged variable-rate debt based primarily on LIBOR. Interest payments on our unhedged variable-rate debt have been calculated based on interest rates in effect as of
September 30, 2017
. Refer to Note 8 – “Secured and Unsecured Senior Debt” to our unaudited consolidated financial statements under Item 1 of this report for additional information regarding our debt.
106
Interest rate hedge agreements
We utilize interest rate derivatives to hedge a portion of our exposure to volatility in variable interest rates primarily associated with our $1.65 billion unsecured senior line of credit, unsecured senior bank term loans, and variable-rate secured construction loans. Our derivative instruments include interest rate swaps and interest rate caps.
Our interest rate swap agreements involve the receipt of variable-rate amounts from a counterparty in exchange for our payment of fixed-rate amounts to the counterparty over the life of the agreement without the exchange of the underlying notional amount. Interest received under all of our interest rate swap agreements is based on one-month LIBOR. The net difference between the interest paid and the interest received is reflected as an adjustment to interest expense in our consolidated statements of income.
We have entered into master derivative agreements with our counterparties. These master derivative agreements (all of which are adapted from the standard International Swaps and Derivatives Association, Inc. form) define certain terms between us and each of our respective counterparties to address and minimize certain risks associated with our interest rate hedge agreements. In order to limit our risk of non-performance by an individual counterparty under our interest rate hedge agreements, these agreements are spread among various counterparties. The largest aggregate notional amount in effect at any single point in time with an individual counterparty in our interest rate hedge agreements existing as of
September 30, 2017
, was
$250 million
. If one or more of our counterparties fail to perform under our interest rate hedge agreements, we may incur higher costs associated with our variable-rate LIBOR-based debt than the interest costs we originally anticipated. We have not posted any collateral related to our interest rate hedge agreements.
Ground lease obligations
Ground lease obligations as of
September 30, 2017
, included leases for
27
of our properties, which accounted for approximately
13%
of our total number of properties, and
one
land development parcel. Excluding one ground lease related to one operating property that expires in
2036
with a net book value of
$9.4 million
as of
September 30, 2017
, our ground lease obligations have remaining lease terms ranging from approximately
36
to
97
years, including extension options.
Commitments
As of
September 30, 2017
, remaining aggregate costs under contract for the construction of properties undergoing development, redevelopment, and improvements under the terms of leases approximated
$571.6 million
. We expect payments for these obligations to occur over
one
to
three
years, subject to capital planning adjustments from time to time. We may have the ability to cease the construction of certain properties, which would result in the reduction of our commitments. We are also committed to funding approximately
$173.6 million
for certain non-real estate investments over the next several years.
We executed an agreement to purchase a 10% interest in a joint venture with Uber and the Golden State Warriors. The Golden State Warriors organization owns two land parcels at 1655 and 1715 Third Street in our Mission Bay/SoMa submarket of San Francisco and is expected to contribute the land to this joint venture. Our initial cash contribution is expected to be in a range from
$35 million
to
$40 million
and will be funded at closing of the joint venture in 2018. The joint venture will acquire the land parcels after completion of below-grade improvements to the building foundation and parking garage and will complete vertical construction of two buildings aggregating
580,000
RSF, which will be leased to Uber.
We have existing office space aggregating
46,356
RSF at 161 First Street/50 Rogers Street in our Alexandria Center
®
at Kendall Square (“ACKS”) campus that we are required to partially convert to multifamily residential space, pursuant to our entitlements for our ACKS campus. Pursuant to these requirements, we expect to begin construction of the conversion to multifamily residential in the first half of 2018.
In addition, we have letters of credit and performance obligations aggregating
$39.5 million
primarily related to our agreement to purchase a 10% interest in a joint venture with Uber and the Golden State Warriors.
107
Exposure to environmental liabilities
In connection with the acquisition of all of our properties, we have obtained Phase I environmental assessments to ascertain the existence of any environmental liabilities or other issues. The Phase I environmental assessments of our properties have not revealed any environmental liabilities that we believe would have a material adverse effect on our financial condition or results of operations taken as a whole, nor are we aware of any material environmental liabilities that have occurred since the Phase I environmental assessments were completed. In addition, we carry a policy of pollution legal liability insurance covering exposure to certain environmental losses at substantially all of our properties.
Accumulated other comprehensive income
Accumulated other comprehensive income attributable to Alexandria Real Estate Equities, Inc. consists of the following (in thousands):
|
Net Unrealized Gain (Loss) on:
|
||||||||||||||||
|
|
Available-for- Sale Equity Securities
|
Interest Rate
Hedge Agreements |
Foreign Currency Translation
|
Total
|
||||||||||||
|
Balance as of December 31, 2016
|
$
|
19,293
|
|
$
|
405
|
|
$
|
(14,343
|
)
|
$
|
5,355
|
|
||||
|
Other comprehensive income before reclassifications
|
23,414
|
|
812
|
|
7,592
|
|
31,818
|
|
||||||||
|
Amounts reclassified from other comprehensive income
|
2,482
|
|
1,810
|
|
2,421
|
|
6,713
|
|
||||||||
|
25,896
|
|
2,622
|
|
10,013
|
|
38,531
|
|
|||||||||
|
Amounts attributable to noncontrolling interests
|
—
|
|
—
|
|
(22
|
)
|
(22
|
)
|
||||||||
|
Net other comprehensive income
|
25,896
|
|
2,622
|
|
9,991
|
|
38,509
|
|
||||||||
|
Balance as of September 30, 2017
|
$
|
45,189
|
|
$
|
3,027
|
|
$
|
(4,352
|
)
|
$
|
43,864
|
|
||||
Available-for-sale equity securities
Changes in our accumulated other comprehensive income balance relate to the increase in fair value of our investments in certain publicly held entities. We reclassify amounts from accumulated other comprehensive income upon recognition of gains and losses on sales and impairment write-downs of investments in these publicly held entities.
Interest rate hedge agreements
Changes in our accumulated other comprehensive income balance relate to the change in fair value of our interest rate hedge agreements. We reclassify amounts from accumulated other comprehensive income as we recognize interest expense related to the hedged variable-rate debt instrument.
Foreign currency translation
Changes in our accumulated other comprehensive income balance relate to changes in the foreign exchange rates for our real estate investments in Canada and Asia. Additionally, we reclassify unrealized foreign currency translation gains and losses into net income as we dispose of these holdings.
Critical accounting policies
Refer to our annual report on Form 10‑K for the year ended
December 31, 2016
, for a discussion of our critical accounting policies, which include investments in real estate and properties classified as held for sale, impairment of long-lived assets, capitalization of costs, accounting for investments, interest rate hedge agreements, recognition of rental revenue and tenant recoveries, and monitoring of tenant credit quality. There were no significant changes to these policies during the
nine months ended September 30, 2017
.
108
Non-GAAP measures and definitions
This section contains additional information of certain non-GAAP financial measures and the reasons why we use these supplemental measures of performance and believe they provide useful information to investors, as well as the definitions of other terms used in this report.
Funds from operations and funds from operations, as adjusted, attributable to Alexandria Real Estate Equities, Inc.’s common stockholders
GAAP-basis accounting for real estate assets utilizes historical cost accounting and assumes that real estate values diminish over time. In an effort to overcome the difference between real estate values and historical cost accounting for real estate assets, the NAREIT Board of Governors established funds from operations as an improved measurement tool. Since its introduction, funds from operations has become a widely used non-GAAP financial measure among equity REITs. We believe that funds from operations is helpful to investors as an additional measure of the performance of an equity REIT. Moreover, we believe that funds from operations, as adjusted, allows investors to compare our performance to the performance of other real estate companies on a consistent basis, without having to account for differences recognized because of investment and disposition decisions, financing decisions, capital structures, and capital market transactions. We compute funds from operations in accordance with standards established by the NAREIT Board of Governors in its April 2002 White Paper and related implementation guidance (the “NAREIT White Paper”). The NAREIT White Paper defines funds from operations as net income (computed in accordance with GAAP), excluding gains (losses) from sales of depreciable real estate and land parcels and impairments of depreciable real estate (excluding land parcels), plus real estate-related depreciation and amortization, and after adjustments for our share of consolidated and unconsolidated partnerships and real estate joint ventures. Impairments represent the write-down of assets when fair value over the recoverability period is less than the carrying value due to changes in general market conditions and do not necessarily reflect the operating performance of the properties during the corresponding period.
We compute funds from operations, as adjusted, as funds from operations calculated in accordance with the NAREIT White Paper less/plus significant gains/losses on the sale of investments, plus losses on early extinguishment of debt, preferred stock redemption charges, impairments of non-depreciable real estate, impairments of non-real estate investments, and deal costs, and the amount of such items that is allocable to our unvested restricted stock awards. Neither funds from operations nor funds from operations, as adjusted, should be considered as alternatives to net income (determined in accordance with GAAP) as indications of financial performance, or to cash flows from operating activities (determined in accordance with GAAP) as measures of liquidity, nor are they indicative of the availability of funds for our cash needs, including our ability to make distributions.
109
The following tables present a reconciliation of net income (loss) attributable to Alexandria Real Estate Equities, Inc.’s common stockholders, the most directly comparable financial measure calculated and presented in accordance with GAAP, including our share of amounts from consolidated and unconsolidated real estate joint ventures, to funds from operations attributable to Alexandria Real Estate Equities, Inc.’s common stockholders – diluted, and funds from operations attributable to Alexandria Real Estate Equities, Inc.’s common stockholders – diluted, as adjusted, and the related per share amounts. Per share amounts allocable to unvested restricted stock awards are not material and are not presented separately within the per share table below. Per share amounts may not add due to rounding.
|
Three Months Ended September 30,
|
Nine Months Ended September 30,
|
|||||||||||||||
|
(In thousands)
|
2017
|
2016
|
2017
|
2016
|
||||||||||||
|
Net income (loss) attributable to Alexandria Real Estate Equities, Inc.’s common stockholders
|
$
|
51,273
|
|
$
|
5,452
|
|
$
|
108,564
|
|
$
|
(126,014
|
)
|
||||
|
Depreciation and amortization
|
107,788
|
|
77,133
|
|
309,069
|
|
218,168
|
|
||||||||
|
Noncontrolling share of depreciation and amortization from consolidated real estate JVs
|
(3,608
|
)
|
(2,224
|
)
|
(10,985
|
)
|
(6,751
|
)
|
||||||||
|
Our share of depreciation and amortization from unconsolidated real estate JVs
|
383
|
|
658
|
|
1,119
|
|
2,052
|
|
||||||||
|
Gain on sales of real estate – rental properties
|
—
|
|
—
|
|
(270
|
)
|
—
|
|
||||||||
|
Our share of gain on sales of real estate from unconsolidated real estate JVs
|
(14,106
|
)
|
—
|
|
(14,106
|
)
|
—
|
|
||||||||
|
Gain on sales of real estate – land parcels
|
—
|
|
(90
|
)
|
(111
|
)
|
(90
|
)
|
||||||||
|
Impairment of real estate – rental properties
|
—
|
|
6,293
|
|
203
|
|
94,688
|
|
||||||||
|
Allocation to unvested restricted stock awards
|
(957
|
)
|
(438
|
)
|
(2,185
|
)
|
(14
|
)
|
||||||||
|
Funds from operations attributable to Alexandria Real Estate Equities, Inc.’s common stockholders – diluted
(1)
|
140,773
|
|
86,784
|
|
391,298
|
|
182,039
|
|
||||||||
|
Non-real estate investment income
|
—
|
|
—
|
|
—
|
|
(4,361
|
)
|
||||||||
|
Impairment of land parcels and non-real estate investments
|
—
|
|
4,886
|
|
4,491
|
|
101,028
|
|
||||||||
|
Loss on early extinguishment of debt
|
—
|
|
3,230
|
|
670
|
|
3,230
|
|
||||||||
|
Preferred stock redemption charge
|
—
|
|
13,095
|
|
11,279
|
|
25,614
|
|
||||||||
|
Allocation to unvested restricted stock awards
|
—
|
|
(359
|
)
|
(227
|
)
|
(1,736
|
)
|
||||||||
|
Funds from operations attributable to Alexandria Real Estate Equities, Inc.’s common stockholders – diluted, as adjusted
|
$
|
140,773
|
|
$
|
107,636
|
|
$
|
407,511
|
|
$
|
305,814
|
|
||||
110
|
Three Months Ended September 30,
|
Nine Months Ended September 30,
|
|||||||||||||||
|
(Per share)
|
2017
|
2016
|
2017
|
2016
|
||||||||||||
|
Net income (loss) per share attributable to Alexandria Real Estate Equities, Inc.’s common stockholders
|
$
|
0.55
|
|
$
|
0.07
|
|
$
|
1.20
|
|
$
|
(1.69
|
)
|
||||
|
Depreciation and amortization
|
1.11
|
|
0.97
|
|
3.26
|
|
2.85
|
|
||||||||
|
Our share of gain on sales of real estate from unconsolidated real estate JVs
|
(0.15
|
)
|
—
|
|
(0.15
|
)
|
—
|
|
||||||||
|
Impairment of real estate – rental properties
|
—
|
|
0.08
|
|
—
|
|
1.27
|
|
||||||||
|
Funds from operations per share attributable to Alexandria Real Estate Equities, Inc.’s common stockholders – diluted
(1)
|
1.51
|
|
1.12
|
|
4.31
|
|
2.43
|
|
||||||||
|
Non-real estate investment income
|
—
|
|
—
|
|
—
|
|
(0.06
|
)
|
||||||||
|
Impairment of land parcels and non-real estate investments
|
—
|
|
0.06
|
|
0.05
|
|
1.34
|
|
||||||||
|
Loss on early extinguishment of debt
|
—
|
|
0.04
|
|
0.01
|
|
0.04
|
|
||||||||
|
Preferred stock redemption charge
|
—
|
|
0.17
|
|
0.12
|
|
0.34
|
|
||||||||
|
Funds from operations per share attributable to Alexandria Real Estate Equities, Inc.’s common stockholders – diluted, as adjusted
|
$
|
1.51
|
|
$
|
1.39
|
|
$
|
4.49
|
|
$
|
4.09
|
|
||||
|
Weighted-average shares of common stock outstanding for calculating funds from operations per share and funds from operations, as adjusted, per share – diluted
|
93,296
|
|
77,402
|
|
90,766
|
|
74,778
|
|
||||||||
|
(1)
|
Calculated in accordance with standards established by the NAREIT Board of Governors in its April 2002 White Paper and related implementation guidance.
|
Adjusted EBITDA and Adjusted EBITDA margins
We use Adjusted EBITDA as a supplemental performance measure of real estate rental operations, for financial and operational decision making, and as a supplemental or additional means of evaluating period-to-period comparisons on a consistent basis. Adjusted EBITDA is calculated as earnings before interest, taxes, depreciation, and amortization (“EBITDA”), excluding stock compensation expense, gains or losses on early extinguishment of debt, gains or losses on sales of real estate, and impairments. We believe Adjusted EBITDA provides investors relevant and useful information because it allows investors to view income from real estate rental operations on an unleveraged basis before the effects of interest, taxes, depreciation and amortization, stock compensation expense, gains or losses on early extinguishment of debt, gains or losses on sales of real estate, and impairments.
By excluding interest expense and gains or losses on early extinguishment of debt, Adjusted EBITDA allows investors to measure our performance independent of our capital structure and indebtedness. We believe that excluding charges related to share-based compensation facilitates a comparison of our operations across periods without the variances caused by the volatility of the expense (which depends on market forces outside our control). We believe that adjusting for the effects of impairments and gains or losses on sales of real estate allows investors to evaluate performance from period to period on a consistent basis without having to account for differences recognized because of investment and disposition decisions. Adjusted EBITDA has limitations as a measure of our performance. Adjusted EBITDA does not reflect our historical cash expenditures or future cash requirements for capital expenditures or contractual commitments. While Adjusted EBITDA is a relevant measure of performance, it does not represent net income or cash flows from operations calculated and presented in accordance with GAAP, and it should not be considered as an alternative to those indicators in evaluating performance or liquidity.
111
The following table reconciles net income, the most directly comparable financial measure calculated and presented in accordance with GAAP, to Adjusted EBITDA (dollars in thousands):
|
Three Months Ended September 30,
|
Nine Months Ended September 30,
|
||||||||||||||
|
2017
|
2016
|
2017
|
2016
|
||||||||||||
|
Net income (loss)
|
$
|
59,546
|
|
$
|
28,559
|
|
$
|
148,597
|
|
$
|
(69,591
|
)
|
|||
|
Interest expense
|
31,031
|
|
25,850
|
|
92,563
|
|
75,730
|
|
|||||||
|
Income taxes
|
1,305
|
|
355
|
|
3,405
|
|
2,374
|
|
|||||||
|
Depreciation and amortization
|
107,788
|
|
77,133
|
|
309,069
|
|
218,168
|
|
|||||||
|
Stock compensation expense
|
7,893
|
|
7,451
|
|
18,649
|
|
19,007
|
|
|||||||
|
Loss on early extinguishment of debt
|
—
|
|
3,230
|
|
670
|
|
3,230
|
|
|||||||
|
Gain on sales of real estate – rental properties
|
—
|
|
—
|
|
(270
|
)
|
—
|
|
|||||||
|
Our share of gain on sales of real estate from unconsolidated real estate JVs
|
(14,106
|
)
|
—
|
|
(14,106
|
)
|
—
|
|
|||||||
|
Gain on sales of real estate – land parcels
|
—
|
|
(90
|
)
|
(111
|
)
|
(90
|
)
|
|||||||
|
Impairment of real estate and non-real estate investments
|
—
|
|
11,179
|
|
4,694
|
|
196,302
|
|
|||||||
|
Adjusted EBITDA
|
$
|
193,457
|
|
$
|
153,667
|
|
$
|
563,160
|
|
$
|
445,130
|
|
|||
|
Revenues
|
$
|
285,370
|
|
$
|
230,379
|
|
$
|
833,797
|
|
(1)
|
$
|
672,544
|
|
||
|
Adjusted EBITDA Margins
|
68
|
%
|
67
|
%
|
68
|
%
|
66
|
%
|
|||||||
|
(1)
|
Excludes impairment charges aggregating
$4.5 million
, primarily related to two non-real estate investments. We believe excluding impairment of non-real estate investments improves the consistency and comparability of the Adjusted EBITDA margins from period to period.
|
Annual rental revenue
Annual rental revenue represents the annualized fixed base rental amount in effect as of the end of the period, related to our operating RSF. Annual rental revenue and measures computed using annual rental revenue are presented at 100% for all properties under our management, including properties held by our consolidated and unconsolidated real estate joint ventures. As of
September 30, 2017
, approximately
97%
of our leases (on an RSF basis) were triple net leases, which require tenants to pay substantially all real estate taxes, insurance, utilities, common area expenses, and other operating expenses (including increases thereto) in addition to base rent. Annual rental revenue excludes these operating expenses recovered from our tenants. Amounts recovered from our tenants related to these operating expenses are classified in tenant recoveries in our consolidated statements of income.
Average cash yield
See definition of initial stabilized yield (unlevered).
Cash interest
Cash interest is equal to interest expense calculated in accordance with GAAP, plus capitalized interest, less amortization of loan fees and debt premiums/discounts. See definition of fixed-charge coverage ratio for a reconciliation of interest expense, the most directly comparable financial measure calculated and presented in accordance with GAAP, to cash interest.
112
Class A properties and AAA locations
Class A properties are properties clustered in AAA locations that provide innovative tenants with highly dynamic and collaborative environments that enhance their ability to successfully recruit and retain world-class talent and inspire productivity, efficiency, creativity, and success. Class A properties generally command higher annual rental rates than other classes of similar properties.
AAA locations are in close proximity to concentrations of specialized skills, knowledge, institutions, and related businesses. Such locations are generally characterized by high barriers to entry for new landlords, high barriers to exit for tenants, and a limited supply of available space.
Fixed-charge coverage ratio
Fixed-charge coverage ratio is a non-GAAP financial measure representing the ratio of Adjusted EBITDA to fixed charges. We believe this ratio is useful to investors as a supplemental measure of our ability to satisfy fixed financing obligations and preferred stock dividends. Cash interest is equal to interest expense calculated in accordance with GAAP, plus capitalized interest, less amortization of loan fees and amortization of debt premiums (discounts). The fixed-charge coverage ratio calculation below is not directly comparable to the computation of ratio of earnings to fixed charges as defined in Item 503(d) of Regulation S-K and to the computation of “Consolidated Ratio of Earnings to Fixed Charges and Consolidated Ratio of Earnings to Combined Fixed Charges and Preferred Stock Dividends” included in Exhibit 12.1 to this quarterly report on Form 10‑Q.
The following table reconciles interest expense, the most directly comparable financial measure calculated and presented in accordance with GAAP, to cash interest and fixed charges (dollars in thousands):
|
Three Months Ended September 30,
|
Nine Months Ended September 30,
|
|||||||||||||||
|
2017
|
2016
|
2017
|
2016
|
|||||||||||||
|
Adjusted EBITDA
|
$
|
193,457
|
|
$
|
153,667
|
|
$
|
563,160
|
|
$
|
445,130
|
|
||||
|
Interest expense
|
$
|
31,031
|
|
$
|
25,850
|
|
92,563
|
|
75,730
|
|
||||||
|
Capitalized interest
|
17,092
|
|
14,903
|
|
45,325
|
|
40,790
|
|
||||||||
|
Amortization of loan fees
|
(2,840
|
)
|
(3,080
|
)
|
(8,578
|
)
|
(8,792
|
)
|
||||||||
|
Amortization of debt premiums
|
652
|
|
5
|
|
1,873
|
|
117
|
|
||||||||
|
Cash interest
|
45,935
|
|
37,678
|
|
131,183
|
|
107,845
|
|
||||||||
|
Dividends on preferred stock
|
1,302
|
|
5,007
|
|
6,364
|
|
16,388
|
|
||||||||
|
Fixed charges
|
$
|
47,237
|
|
$
|
42,685
|
|
$
|
137,547
|
|
$
|
124,233
|
|
||||
|
Fixed-charge coverage ratio:
|
||||||||||||||||
|
– period annualized
|
4.1x
|
|
3.6x
|
|
4.1x
|
|
3.6x
|
|
||||||||
|
– trailing 12 months
|
4.0x
|
|
3.6x
|
|
4.0x
|
|
3.6x
|
|
||||||||
113
Development, redevelopment, and pre-construction
A key component of our business model is our disciplined allocation of capital to the development and redevelopment of new Class A properties located in world-class collaborative life science and technology campuses in AAA urban innovation clusters. These projects are focused on providing high-quality, generic, and reusable spaces that meet the real estate requirements of, and are reusable by, a wide range of tenants. Upon completion, each value-creation project is expected to generate a significant increase in rental income, net operating income, and cash flows. Our development and redevelopment projects are generally in locations that are highly desirable to high-quality entities, which we believe results in higher occupancy levels, longer lease terms, higher rental income, higher returns, and greater long-term asset value.
Development projects consist of the ground-up development of generic and reusable facilities. Redevelopment projects consist of the permanent change in use of office, warehouse, and shell space into office/laboratory or tech office space. We generally will not commence new development projects for aboveground construction of new Class A office/laboratory and tech office space without first securing significant pre-leasing for such space, except when there is solid market demand for high-quality Class A properties.
Pre-construction activities include entitlements, permitting, design, site work, and other activities preceding commencement of construction of aboveground building improvements. The advancement of pre-construction efforts is focused on reducing the time required to deliver projects to prospective tenants. These critical activities add significant value for future ground-up development and are required for the vertical construction of buildings. Ultimately, these projects will provide high-quality facilities and are expected to generate significant revenue and cash flows.
Initial stabilized yield (unlevered)
Initial stabilized yield is calculated as the quotient of the estimated amounts of net operating income at stabilization and our investment in the property. Our initial stabilized yield excludes the benefit of leverage. Our cash rents related to our value-creation projects are expected to increase over time due to contractual annual rent escalations, and our average cash yields are generally expected to be greater than our initial stabilized yields (cash basis). Our estimates for initial stabilized yields, initial stabilized yields (cash basis), and total costs at completion represent our initial estimates at the commencement of the project. We expect to update this information upon completion of the project, or sooner if there are significant changes to the expected project yields or costs.
|
•
|
Initial stabilized yield reflects rental income, including contractual rent escalations and any rent concessions over the term(s) of the lease(s), calculated on a straight-line basis.
|
|
•
|
Initial stabilized yield (cash basis) reflects cash rents at the stabilization date after initial rental concessions, if any, have elapsed and our total cash investment in the property.
|
Average cash yield reflects cash rents, including contractual rent escalations after initial rental concessions have elapsed, calculated on a straight-line basis, and our total cash investment in the property.
Joint venture financial information
We present components of balance sheet and operating results information related to our joint ventures, which are not in accordance with or intended to be presentations in accordance with, GAAP. We present the proportionate share of certain financial line items as follows: (i) for each real estate joint venture that we consolidate in our financial statements, but of which we own less than 100%, we apply the noncontrolling interest economic ownership percentage to each financial item to arrive at the amount of such cumulative noncontrolling interest share of each component presented; and (ii) for each real estate joint venture that we do not control, and do not consolidate, we apply our economic ownership percentage to each financial item to arrive at our proportionate share of each component presented.
The components of balance sheet and operating results information related to joint ventures do not represent our legal claim to those items. The joint venture agreement for each entity that we do not wholly own generally determines what equity holders can receive upon capital events, such as sales or refinancing, or in the event of a liquidation. Equity holders are normally entitled to their respective legal ownership of any residual cash from a joint venture only after all liabilities, priority distributions, and claims have been repaid or satisfied.
114
We believe this information can help investors estimate balance sheet and operating results information related to our partially owned entities. Presenting this information provides a perspective not immediately available from consolidated financial statements and one that can supplement an understanding of joint venture assets, liabilities, revenues, and expenses included in our consolidated results.
The components of balance sheet and operating results information related to joint ventures are limited as an analytical tool, as the overall economic ownership interest does not represent our legal claim to each of our joint ventures’ assets, liabilities, or results of operations. In addition, joint venture financial information may include financial information related to the unconsolidated real estate joint ventures that we do not control. We believe that in order to facilitate a clear understanding of our operating results and our total assets and liabilities, joint venture financial information should be examined in conjunction with our consolidated statements of income and balance sheets. Joint venture financial information should not be considered an alternative to our consolidated financial statements, which are prepared in accordance with GAAP.
Net cash provided by operating activities after dividends
Net cash provided by operating activities after dividends includes the deduction for distributions to noncontrolling interests. For purposes of this calculation, changes in operating assets and liabilities are excluded as they represent timing differences.
115
Net debt to Adjusted EBITDA and net debt and preferred stock to Adjusted EBITDA
Net debt to Adjusted EBITDA is a non-GAAP financial measure that we believe is useful to investors as a supplemental measure in evaluating our balance sheet leverage. Net debt is equal to the sum of total consolidated debt less cash, cash equivalents, and restricted cash. Net debt and preferred stock is equal to the sum of net debt, as discussed above, plus preferred stock outstanding as of period end. Refer to “Adjusted EBITDA” within this section of this Item 2 for further information on the calculation of Adjusted EBITDA.
The following table reconciles debt to net debt, and to net debt and preferred stock, and computes the ratio of each to Adjusted EBITDA as of
September 30, 2017
, and
December 31, 2016
(dollars in thousands):
|
September 30, 2017
|
December 31, 2016
|
||||||
|
Secured notes payable
|
$
|
1,153,890
|
|
$
|
1,011,292
|
|
|
|
Unsecured senior notes payable
|
2,801,290
|
|
2,378,262
|
|
|||
|
Unsecured senior line of credit
|
314,000
|
|
28,000
|
|
|||
|
Unsecured senior bank term loans
|
547,860
|
|
746,471
|
|
|||
|
Unamortized deferred financing costs
|
27,803
|
|
29,917
|
|
|||
|
Cash and cash equivalents
|
(118,562
|
)
|
(125,032
|
)
|
|||
|
Restricted cash
|
(27,713
|
)
|
(16,334
|
)
|
|||
|
Net debt
|
$
|
4,698,568
|
|
$
|
4,052,576
|
|
|
|
Net debt
|
$
|
4,698,568
|
|
$
|
4,052,576
|
|
|
|
7.00% Series D cumulative convertible preferred stock
|
74,386
|
|
86,914
|
|
|||
|
6.45% Series E cumulative redeemable preferred stock
|
—
|
|
130,000
|
|
|||
|
Net debt and preferred stock
|
$
|
4,772,954
|
|
$
|
4,269,490
|
|
|
|
Adjusted EBITDA:
|
|||||||
|
– quarter annualized
|
$
|
773,828
|
|
$
|
662,836
|
|
|
|
– trailing 12 months
|
$
|
728,869
|
|
$
|
610,839
|
|
|
|
Net debt to Adjusted EBITDA:
|
|||||||
|
– quarter annualized
|
6.1
|
x
|
6.1
|
x
|
|||
|
– trailing 12 months
|
6.4
|
x
|
6.6
|
x
|
|||
|
Net debt and preferred stock to Adjusted EBITDA:
|
|||||||
|
– quarter annualized
|
6.2
|
x
|
6.4
|
x
|
|||
|
– trailing 12 months
|
6.5
|
x
|
7.0
|
x
|
|||
116
Net operating income and operating margin
The following table reconciles net income to total net operating income (in thousands):
|
Three Months Ended September 30,
|
Nine Months Ended September 30,
|
|||||||||||||||
|
2017
|
2016
|
2017
|
2016
|
|||||||||||||
|
Net income (loss)
|
$
|
59,546
|
|
$
|
28,559
|
|
$
|
148,597
|
|
$
|
(69,591
|
)
|
||||
|
Equity in (earnings) losses of unconsolidated real estate joint ventures
|
(14,100
|
)
|
(273
|
)
|
(15,050
|
)
|
270
|
|
||||||||
|
General and administrative expenses
|
17,636
|
|
15,854
|
|
56,099
|
|
46,426
|
|
||||||||
|
Interest expense
|
31,031
|
|
25,850
|
|
92,563
|
|
75,730
|
|
||||||||
|
Depreciation and amortization
|
107,788
|
|
77,133
|
|
309,069
|
|
218,168
|
|
||||||||
|
Impairment of real estate
|
—
|
|
8,114
|
|
203
|
|
193,237
|
|
||||||||
|
Loss on early extinguishment of debt
|
—
|
|
3,230
|
|
670
|
|
3,230
|
|
||||||||
|
Gain on sales of real estate – rental properties
|
—
|
|
—
|
|
(270
|
)
|
—
|
|
||||||||
|
Gain on sales of real estate – land parcels
|
—
|
|
(90
|
)
|
(111
|
)
|
(90
|
)
|
||||||||
|
Net operating income
|
$
|
201,901
|
|
$
|
158,377
|
|
$
|
591,770
|
|
$
|
467,380
|
|
||||
|
Revenues
|
$
|
285,370
|
|
$
|
230,379
|
|
$
|
829,306
|
|
$
|
672,544
|
|
||||
|
Operating margin
|
71%
|
69%
|
71%
|
69%
|
||||||||||||
Net operating income is a non-GAAP financial measure calculated as net income, the most directly comparable financial measure calculated and presented in accordance with GAAP, excluding equity in the earnings (losses) of our unconsolidated real estate joint ventures, general and administrative expenses, interest expense, depreciation and amortization, impairment of real estate, gain or loss on early extinguishment of debt, and gain or loss on sales of real estate. We believe net operating income provides useful information to investors regarding our financial condition and results of operations because it primarily reflects those income and expense items that are incurred at the property level. Therefore, we believe net operating income is a useful measure for evaluating the operating performance of our real estate assets. Net operating income on a cash basis is net operating income adjusted to exclude the effect of straight-line rent and amortization of acquired above- and below-market lease revenue adjustments required by GAAP. We believe that net operating income on a cash basis is helpful to investors as an additional measure of operating performance because it eliminates the timing differences between the recognition of revenue in accordance with GAAP and the receipt of payments reflected in our consolidated results.
Further, we believe net operating income is useful to investors as a performance measure because, when compared across periods, net operating income reflects trends in occupancy rates, rental rates, and operating costs, which provide a perspective not immediately apparent from net income. Net operating income can be used to measure the initial stabilized yields of our properties by calculating the quotient of net operating income generated by a property on a straight-line basis and our investment in the property. Net operating income excludes certain components from net income in order to provide results that are more closely related to the results of operations of our properties. For example, interest expense is not necessarily linked to the operating performance of a real estate asset and is often incurred at the corporate level rather than at the property level. In addition, depreciation and amortization, because of historical cost accounting and useful life estimates, may distort comparability of operating performance at the property level. Impairments of real estate have been excluded in deriving net operating income because we do not consider impairments of real estate to be property-level operating expenses. Impairments of real estate relate to changes in the values of our assets and do not reflect the current operating performance with respect to related revenues or expenses. Our impairments of real estate represent the write-down in the value of the assets to the estimated fair value less cost to sell. These impairments result from investing decisions and deterioration in market conditions. Our calculation of net operating income also excludes charges incurred from changes in certain financing decisions, such as loss on early extinguishment of debt, as these charges often relate to corporate strategy. Property operating expenses that are included in determining net operating income primarily consist of costs that are related to our operating properties, such as utilities, repairs, and maintenance; rental expense related to ground leases; contracted services, such as janitorial, engineering, and landscaping; property taxes and insurance; and property-level salaries. General and administrative expenses consist
117
primarily of accounting and corporate compensation, corporate insurance, professional fees, office rent, and office supplies that are incurred as part of corporate office management. We believe that in order to facilitate a clear understanding of our operating results, net operating income should be examined in conjunction with net income as presented in our consolidated statements of income. Net operating income should not be considered as an alternative to net income as an indication of our performance, nor as an alternative to cash flows as a measure either of liquidity or our ability to make distributions.
Operating statistics
We present certain operating statistics related to our properties, including number of properties, RSF, annual rental revenue, annual rental revenue per occupied RSF, occupancy percentage, leasing activity, rental rates, and contractual lease expirations as of the end of the period. We believe these measures are useful to investors because they facilitate an understanding of certain trends for our properties. We compute operating statistics at 100% for all properties managed by us, including properties owned by our consolidated and unconsolidated real estate joint ventures.
Same property comparisons
As a result of changes within our total property portfolio during the comparative periods presented, including changes from assets acquired or sold, properties placed into development or redevelopment, and development or redevelopment properties recently placed into service, the consolidated total rental revenues, tenant recoveries, and rental operating expenses in our operating results can show significant changes from period to period. In order to supplement an evaluation of our results of operations over a given period, we analyze the operating performance for all properties that were fully operating for the entirety of the comparative periods presented, referred to as same properties. These properties are analyzed separately from properties acquired subsequent to the first day in the earliest comparable period presented, properties that underwent development or redevelopment at any time during the comparative periods, and corporate entities (legal entities performing general and administrative functions), which are excluded from same property results. Additionally, rental revenues from lease termination fees, if any, are excluded from the results of same properties.
Stabilized occupancy date
The stabilized occupancy date represents the estimated date on which the project is expected to reach occupancy of 95% or greater.
Total market capitalization
Total market capitalization is equal to the sum of total equity market capitalization and total debt. Total equity market capitalization is equal to the sum of outstanding shares of 7.00% Series D cumulative convertible preferred stock, 6.45% Series E cumulative redeemable preferred stock, and common stock multiplied by the related closing price of each class of security at the end of each period presented.
Unencumbered net operating income as a percentage of total net operating income
Unencumbered net operating income as a percentage of total net operating income is a non-GAAP financial measure that we believe is useful to investors as a performance measure of the results of operations of our unencumbered real estate assets as it reflects those income and expense items that are incurred at the unencumbered property level. Unencumbered net operating income is derived from assets classified in continuing operations, which are not subject to any mortgage, deed of trust, lien, or other security interest, as of the period for which income is presented.
The following table summarizes unencumbered net operating income as a percentage of total net operating income for the
three and nine months ended September 30, 2017
and
2016
(dollars in thousands):
|
Three Months Ended September 30,
|
Nine Months Ended September 30,
|
||||||||||||||
|
2017
|
2016
|
2017
|
2016
|
||||||||||||
|
Unencumbered net operating income
|
$
|
164,291
|
|
$
|
137,943
|
|
$
|
479,754
|
|
$
|
400,027
|
|
|||
|
Encumbered net operating income
|
37,610
|
|
20,434
|
|
112,016
|
|
67,353
|
|
|||||||
|
Total net operating income
|
$
|
201,901
|
|
$
|
158,377
|
|
$
|
591,770
|
|
$
|
467,380
|
|
|||
|
Unencumbered net operating income as a percentage of total net operating income
|
81%
|
|
87%
|
|
81%
|
|
86%
|
|
|||||||
118
Interest rate risk
The primary market risk to which we believe we are exposed is interest rate risk, which may result from many factors, including government monetary and tax policies, domestic and international economic and political considerations, and other factors that are beyond our control.
In order to modify and manage the interest rate characteristics of our outstanding debt and to limit the effects of interest rate risks on our operations, we may utilize a variety of financial instruments, including interest rate swap agreements, caps, floors, and other interest rate exchange contracts. The use of these types of instruments to hedge a portion of our exposure to changes in interest rates carries additional risks, such as counterparty credit risk and the legal enforceability of hedging contracts.
Our future earnings and fair values relating to financial instruments are primarily dependent upon prevalent market rates of interest, such as LIBOR. However, our interest rate hedge agreements are intended to reduce the effects of interest rate fluctuations. The following table illustrates the effect of a 1% change in interest rates, assuming a LIBOR floor of 0%, on our variable-rate debt, including our $1.65 billion unsecured senior line of credit, unsecured senior bank term loans, and secured construction loans, after considering the effect of our interest rate hedge agreements, secured debt, and unsecured senior notes payable as of
September 30, 2017
(in thousands):
|
Annualized effect on future earnings due to variable-rate debt:
|
|||
|
Rate increase of 1%
|
$
|
(4,509
|
)
|
|
Rate decrease of 1%
|
$
|
4,509
|
|
|
Effect on fair value of total consolidated debt and interest rate hedge agreements:
|
|||
|
Rate increase of 1%
|
$
|
(201,681
|
)
|
|
Rate decrease of 1%
|
$
|
216,680
|
|
These amounts are determined by considering the impact of the hypothetical interest rates on our borrowing cost and our interest rate hedge agreements in existence on
September 30, 2017
. These analyses do not consider the effects of the reduced level of overall economic activity that could exist in such an environment. Further, in the event of a change of such magnitude, we would consider taking actions to further mitigate our exposure to the change. Because of the uncertainty of the specific actions that would be taken and their possible effects, the sensitivity analyses assume no changes in our capital structure.
Equity price risk
We have exposure to equity price market risk because of our equity investments in certain publicly traded companies and privately held entities. We classify investments in publicly traded companies as available-for-sale and consequently recognize them in the consolidated balance sheets at fair value, with unrealized gains or losses reported as a component of accumulated other comprehensive income. Investments in privately held entities are generally accounted for under the cost method because we do not influence any of the operating or financial policies of the entities in which we invest. For all investments, we recognize other-than-temporary declines in value against earnings in the same period during which the decline in value was deemed to have occurred. There is no assurance that future declines in value will not have a material adverse impact on our future results of operations. The following table illustrates the effect that a 10% change in the fair value of our equity investments would have on earnings as of
September 30, 2017
(in thousands):
|
Equity price risk:
|
|||
|
Fair value increase of 10%
|
$
|
48,526
|
|
|
Fair value decrease of 10%
|
$
|
(48,526
|
)
|
119
Foreign currency exchange rate risk
We have exposure to foreign currency exchange rate risk related to our subsidiaries operating in Canada and Asia. The functional currencies of our foreign subsidiaries are the respective local currencies. Gains or losses resulting from the translation of our foreign subsidiaries’ balance sheets and statements of income are classified in accumulated other comprehensive income as a separate component of total equity. Gains or losses will be reflected in our consolidated statements of income when there is a sale or partial sale of our investment in these operations or upon a complete or substantially complete liquidation of the investment. The following table illustrates the effect that a 10% change in foreign currency rates relative to the U.S. dollar would have on our potential future earnings and on the fair value of our net investment in foreign subsidiaries based on our current operating assets outside the U.S. as of
September 30, 2017
(in thousands):
|
Effect of potential future earnings due to foreign currency exchange rate:
|
|||
|
Rate increase of 10%
|
$
|
70
|
|
|
Rate decrease of 10%
|
$
|
(70
|
)
|
|
Effect on the fair value of net investment in foreign subsidiaries due to foreign currency exchange rate:
|
|||
|
Rate increase of 10%
|
$
|
12,184
|
|
|
Rate decrease of 10%
|
$
|
(12,184
|
)
|
This sensitivity analysis assumes a parallel shift of all foreign currency exchange rates with respect to the U.S. dollar; however, foreign currency exchange rates do not typically move in such a manner, and actual results may differ materially.
Our exposure to market risk elements for the
nine months ended September 30, 2017
, was consistent with the risk elements presented above, including the effects of changes in interest rates, equity prices, and foreign currency exchange rates.
Evaluation of disclosure controls and procedures
As of
September 30, 2017
, we had performed an evaluation, under the supervision of our Chief Executive Officer (“CEO”) and Chief Financial Officer (“CFO”), of the effectiveness of the design and operation of our disclosure controls and procedures. These controls and procedures have been designed to ensure that information required for disclosure is recorded, processed, summarized, and reported within the requisite time periods. Based on our evaluation, the CEO and the CFO concluded that our disclosure controls and procedures were effective as of
September 30, 2017
.
Changes in internal control over financial reporting
There has not been any change in our internal control over financial reporting during the three months ended
September 30, 2017
, that has materially affected, or is reasonably likely to materially affect, our internal control over financial reporting.
120
Changes in the method of determining LIBOR, or the replacement of LIBOR with an alternative reference rate, may
adversely affect interest expense related to outstanding debt.
We hold certain instruments in our debt profile in which interest rates move in direct relation to LIBOR, depending on our
selection of borrowing options. Beginning in 2008, concerns have been raised that some of the member banks surveyed by the BBA in connection with the calculation of daily LIBOR across a range of maturities and currencies may have underreported, overreported, or otherwise manipulated the interbank lending rate applicable to them in order to profit on their derivatives positions or to avoid an appearance of capital insufficiency or adverse reputational or other consequences that might have resulted from reporting interbank lending rates higher than those they actually submitted. A number of BBA member banks have entered into settlements with a number of their regulators and law enforcement agencies with respect to alleged manipulation of LIBOR, and investigations have been instigated by regulators and government authorities in various jurisdictions. Other member banks may also enter into such settlements with, or have proceedings brought by, their regulators or law enforcement agencies in the future. If manipulation of LIBOR occurred, it may have resulted in LIBOR having been artificially lower (or higher) than it would otherwise have been. Any such manipulation could have occurred over a substantial period of time.
On September 28, 2012, British regulators published a report on the review of LIBOR. The report concluded that LIBOR
should be retained as a benchmark but recommended a comprehensive reform of LIBOR, including replacing the BBA with a new
independent administrator of LIBOR. Based on this report, final rules for the regulation and supervision of LIBOR by the Financial Conduct Authority (“FCA”) were published and came into effect on April 2, 2013 (the “FCA Rules”). In particular, the FCA Rules include requirements that (i) an independent LIBOR administrator monitor and survey LIBOR submissions to identify breaches of practice standards and/or potentially manipulative behavior, and (ii) firms submitting data to LIBOR establish and maintain a clear conflict-of-interest policy and appropriate systems and controls. In response, ICE Benchmark Administration Limited (“IBA”) was appointed as the independent LIBOR administrator, effective in early 2014. It is not possible to predict the effect of the FCA Rules, any changes in the methods pursuant to which LIBOR is determined, the administration of LIBOR by IBA, and any other reforms to LIBOR that will be enacted in the United Kingdom and elsewhere. In addition, any changes announced by the FCA, the BBA, IBA, or any other successor governance or oversight body, or future changes adopted by such body, in the method pursuant to which LIBOR is determined, as well as manipulative practices or the cessation thereof, may result in a sudden or prolonged increase or decrease in reported LIBOR, which could have an adverse impact on the level of the index. Fluctuation or discontinuation of LIBOR would affect our interest expense and earnings and the fair value of certain of our financial instruments. We rely on interest rate hedge agreements to mitigate our exposure to such interest rate risk on a portion of our debt obligations. However, there is no assurance these arrangements will be effective in reducing our exposure to changes in interest rates.
In addition, in November 2014, the U.S. Federal Reserve established a working group composed of large U.S. financial institutions, the Alternative Reference Rates Committee (“ARRC”), to identify a set of alternative interest reference rates to LIBOR. In a May 2016 interim report, the ARRC narrowed its choice to two LIBOR alternatives. The first choice is the Overnight Bank Funding Rate (“OBFR”), which consists of domestic and foreign unsecured borrowing in U.S. dollars. The U.S. Federal Reserve has been calculating the OBFR and publishing it since March 2016. The second alternative rate to LIBOR is the Treasury General Collateral rate, which is composed of repo transactions secured by treasuries or other assets accepted as collateral by the majority of intermediaries in the repo market.
On July 27, 2017, the FCA announced that it would phase out LIBOR as a benchmark by the end of 2021. It is unclear whether new methods of calculating LIBOR will be established such that it continues to exist after 2021. The U.S. Federal Reserve, in conjunction with the ARRC, is considering replacing U.S. dollar LIBOR with a newly created index called the Broad Treasury Financing Rate, calculated with a broad set of short-term repurchase agreements backed by treasury securities. If LIBOR ceases to exist, we may need to negotiate the credit agreements with our lenders that utilize LIBOR as a factor in determining the interest rate based on a new standard that is established, if any. The transition to the alternative rate will require careful and deliberate consideration and implementation so as to not disrupt the stability of financial markets. There is no guarantee that a transition from LIBOR to an alternative will not result in financial market disruptions, significant increases in benchmark rates, or borrowing costs to borrowers.
121
Security breaches through cyber-attacks, cyber-intrusions, or other methods could disrupt our information technology networks and related systems.
Risks associated with security breaches, whether through cyber-attacks or cyber-intrusions over the Internet, malware, computer viruses, attachments to e-mails, or other methods, against persons inside our organization, persons with access to systems inside our organization, the U.S. government, financial markets or institutions, or major businesses, including tenants, could disrupt or disable networks and related systems, other critical infrastructures, and the normal operation of business. The risk of a security breach or disruption, particularly through cyber-attack or cyber-intrusion, including by computer hackers, foreign governments, and cyber-terrorists, has generally increased as the number, intensity, and sophistication of attempted attacks and intrusions from around the world have increased. Due to the fast pace and unpredictability of cyber threats, long-term implementation plans designed to address cybersecurity risks become obsolete quickly. The SEC has recently shared its concern over the rise in cases of cyber-attacks where information was stolen by hackers to gain market advantage. As a consequence, it is critical that entities not only meet SEC expectations in the cybersecurity arena, but also invest in a program to become secure, vigilant, and resilient in the face of emerging cybersecurity risks.
Even though we may not be specifically targeted, cyber-attacks on the U.S. government, financial markets, financial institutions, or other major businesses, including tenants, could disrupt our normal business operations and networks, which may in turn have a material adverse impact on our financial condition and results of operations.
Information technology networks and related systems are essential to the operation of our business and our ability to perform day-to-day operations, including managing our building systems. They also may be critical to the operations of certain of our tenants and our service providers. Although we make efforts to maintain the security and integrity of these types of networks and related systems, and we have implemented various measures to manage the risk of a security breach or disruption, there can be no assurance that our security efforts and measures will be effective or that attempted security breaches or disruptions would not be successful or damaging. Even the most well-protected information, networks, systems, and facilities remain potentially vulnerable because the techniques used in such attempted security breaches evolve and generally are not recognized until launched against a target, and in some cases are designed not to be detected and in fact may not be detected. While to date we have not experienced a cyber-attack or cyber-intrusion, we may be unable to anticipate or to implement adequate security barriers or other preventive measures. A security breach or other significant disruption involving our information technology networks and related systems could:
|
•
|
Disrupt the proper functioning of our networks and systems and therefore our operations and/or those of certain of our tenants;
|
|
•
|
Result in misstated financial reports, violations of loan covenants, missed reporting deadlines, and/or missed permitting deadlines;
|
|
•
|
Result in our inability to properly monitor our compliance with the rules and regulations regarding our qualification as a REIT;
|
|
•
|
Result in the unauthorized access to, and destruction, loss, theft, misappropriation, or release of, proprietary, confidential, sensitive, or otherwise valuable information of ours or others, which others could use to compete against us or for disruptive, destructive, or otherwise harmful purposes and outcomes;
|
|
•
|
Result in our inability to maintain the building systems relied upon by our tenants for the efficient use of their leased space;
|
|
•
|
Require significant management attention and resources to remedy any damages that result;
|
|
•
|
Subject us to claims for breach of contract, damages, credits, penalties, or termination of leases or other agreements; or
|
|
•
|
Damage our reputation among our tenants and investors generally.
|
Any or all of the foregoing could have a material adverse effect on our financial condition, results of operations, and cash flows.
In addition to the information set forth in this quarterly report on Form 10‑Q, one should also carefully review and consider the information contained in our other reports and periodic filings that we make with the SEC, including, without limitation, the information contained under the caption “Item 1A. Risk Factors” in our annual report on Form 10‑K for the year ended
December 31, 2016
. Those risk factors could materially affect our business, financial condition, and results of operations. The risks that we describe in our public filings are not the only risks that we face. Additional risks and uncertainties not currently known to us, or that we presently deem to be immaterial, also may materially adversely affect our business, financial condition, and results of operations.
122
|
Exhibit
Number
|
Exhibit Title
|
Incorporated by Reference to:
|
Date Filed
|
|||
|
3.1*
|
Form 10-Q
|
August 14, 1997
|
||||
|
3.2*
|
Form 10-Q
|
August 14, 1997
|
||||
|
3.3*
|
Form 8-K
|
May 12, 2017
|
||||
|
3.4*
|
Form 8-K
|
May 11, 2015
|
||||
|
3.5*
|
Form 10-Q
|
August 13, 1999
|
||||
|
3.6*
|
Form 8-K
|
February 10, 2000
|
||||
|
3.7*
|
Form 8-K
|
February 10, 2000
|
||||
|
3.8*
|
Form 8-A
|
January 18, 2002
|
||||
|
3.9*
|
Form 8-A
|
June 28, 2004
|
||||
|
3.10*
|
Form 8-K
|
March 25, 2008
|
||||
|
3.11*
|
Form 8-K
|
March 14, 2012
|
||||
|
3.12*
|
Form 8-K
|
May 12, 2017
|
||||
|
4.1*
|
Form 10-Q
|
May 5, 2011
|
||||
|
4.2*
|
Form 8-K
|
March 25, 2008
|
||||
|
4.3*
|
Form 8-K
|
February 29, 2012
|
||||
|
4.4*
|
Form 8-K
|
February 29, 2012
|
||||
|
4.5*
|
Form 8-K
|
February 29, 2012
|
||||
|
4.6*
|
Form 8-A
|
March 12, 2012
|
||||
|
4.7*
|
Form 8-K
|
June 7, 2013
|
||||
|
4.8*
|
Form 8-K
|
June 7, 2013
|
||||
|
4.9*
|
Form 8-K
|
July 18, 2014
|
||||
|
4.10*
|
Form 8-K
|
July 18, 2014
|
||||
|
4.11*
|
Form 8-K
|
July 18, 2014
|
||||
|
4.12*
|
Form 8-K
|
July 18, 2014
|
||||
|
4.13*
|
Form 8-K
|
November 17, 2015
|
||||
123
|
Exhibit
Number
|
Exhibit Title
|
Incorporated by Reference to:
|
Date Filed
|
|||
|
4.14*
|
Form 8-K
|
November 17, 2015
|
||||
|
4.15*
|
Form 8-K
|
November 17, 2015
|
||||
|
4.16*
|
Form 8-K
|
June 10, 2016
|
||||
|
4.17*
|
Form 8-K
|
June 10, 2016
|
||||
|
4.18*
|
Form 8-K
|
March 3, 2017
|
||||
|
4.19*
|
Form 8-K
|
March 3, 2017
|
||||
|
4.20*
|
Form 8-K
|
March 3, 2017
|
||||
|
10.1*
|
Form 10-Q
|
November 2, 2016
|
||||
|
10.2*
|
Form 10-Q
|
November 2, 2016
|
||||
|
10.3*
|
Form 10-Q
|
November 2, 2016
|
||||
|
10.4*
|
Form 8-K
|
July 3, 2017
|
||||
|
12.1
|
N/A
|
Filed herewith
|
||||
|
31.1
|
N/A
|
Filed herewith
|
||||
|
31.2
|
N/A
|
Filed herewith
|
||||
|
32.0
|
N/A
|
Filed herewith
|
||||
124
|
Exhibit
Number
|
Exhibit Title
|
Incorporated by Reference to:
|
Date Filed
|
|||
|
101
|
The following materials from the Company’s quarterly report on Form 10-Q for the three months ended September 30, 2017 formatted in XBRL (eXtensible Business Reporting Language): (i) Consolidated Balance Sheets as of September 30, 2017 and December 31, 2016 (unaudited), (ii) Consolidated Statements of Income for the three and nine months ended September 30, 2017 and 2016 (unaudited), (iii) Consolidated Statements of Comprehensive Income for the three and nine months ended September 30, 2017 and 2016 (unaudited), (iv) Consolidated Statement of Changes in Stockholders’ Equity and Noncontrolling Interests for the nine months ended September 30, 2017 (unaudited), (v) Consolidated Statements of Cash Flows for the nine months ended September 30, 2017 and 2016 (unaudited), and (vi) Notes to Consolidated Financial Statements (unaudited)
|
N/A
|
Filed herewith
|
|||
(*) Incorporated by reference.
125
SIGNATURES
Pursuant to the requirements of the Securities Exchange Act of 1934, the registrant has duly caused this report to be signed on its behalf by the undersigned, thereunto duly authorized, on
October 31, 2017
.
|
|
ALEXANDRIA REAL ESTATE EQUITIES, INC.
|
|
/s/ Joel S. Marcus
|
|
|
Joel S. Marcus
Chairman/Chief Executive Officer
(Principal Executive Officer)
|
|
|
/s/ Dean A. Shigenaga
|
|
|
Dean A. Shigenaga
Chief Financial Officer
(Principal Financial Officer)
|
|
126
TABLE OF CONTENTS
Part I Financial InformationItem 1. Financial Statements (unaudited)Item 2. Management S Discussion and Analysis Of Financial Condition and Results Of OperationsItem 3. Quantitative and Qualitative Disclosures About Market RiskItem 4. Controls and ProceduresPart II Other InformationItem 1A. Risk FactorsItem 6. Exhibits