ALEXANDRIA REAL ESTATE EQUITIES, INC.
10-Ks and 10-Qs
|
|
|
|
|
|
|
|
|
|
|
|
|
|
|
|
|
|
|
|
|
|
|
|
|
|
|
|
|
|
|
|
|
|
|
|
|
|
|
|
|
|
|
|
|
|
|
|
|
|
|
|
|
|
|
|
UNITED STATES
SECURITIES AND EXCHANGE COMMISSION
Washington, D.C. 20549
FORM 10-Q
(Mark One)
x
QUARTERLY REPORT PURSUANT TO SECTION 13 OR 15(d) OF THE SECURITIES
EXCHANGE ACT OF 1934
For the quarterly period ended
March 31, 2019
OR
o
TRANSITION REPORT PURSUANT TO SECTION 13 OR 15(d) OF THE SECURITIES
EXCHANGE ACT OF 1934
For the transition period from ____________ to ____________
Commission file number 1-12993
ALEXANDRIA REAL ESTATE EQUITIES, INC.
(Exact name of registrant as specified in its charter)
|
Maryland
|
|
95-4502084
|
|
(State or other jurisdiction of
incorporation or organization)
|
|
(I.R.S. Employer Identification Number)
|
385 East Colorado Boulevard, Suite 299, Pasadena, California 91101
(Address of principal executive offices) (Zip code)
(626) 578-0777
(Registrant’s telephone number, including area code)
N/A
(Former name, former address and former fiscal year, if changed since last report)
Indicate by check mark whether the registrant (1) has filed all reports required to be filed by Section 13 or 15(d) of the Securities Exchange Act of 1934 during the preceding 12 months (or for such shorter period that the registrant was required to file such reports) and (2) has been subject to such filing requirements for the past 90 days. Yes
x
No
o
Indicate by check mark whether the registrant has submitted electronically every Interactive Data File required to be submitted and posted pursuant to Rule 405 of Regulation S-T during the preceding 12 months (or for such shorter period that the registrant was required to submit and post such files).
Yes
x
No
o
Indicate by check mark whether the registrant is a large accelerated filer, an accelerated filer, a non-accelerated filer, or a smaller reporting company. See the definitions of “large accelerated filer,” “accelerated filer,” “smaller reporting company,” and “emerging growth company” in Rule 12b-2 of the Exchange Act.
|
Large accelerated filer
x
|
Accelerated filer
o
|
|
Non-accelerated filer
o
|
Smaller reporting company
o
|
|
Emerging growth company
o
|
|
If an emerging growth company, indicate by check mark if the registrant has elected not to use the extended transition period for complying with any new or revised financial accounting standards provided pursuant to Section 13(a) of the Exchange Act.
o
Indicate by check mark whether the registrant is a shell company (as defined in Rule 12b-2 of the Exchange Act). Yes
o
No
x
As of
April 15, 2019
,
112,935,703
shares of common stock, par value $0.01 per share, were outstanding.
TABLE OF CONTENTS
|
|
|
Page
|
|
|
|
|
|
|
||
|
|
Consolidated Balance Sheets as of March 31, 2019, and December 31, 2018
|
|
|
|
||
|
|
Consolidated Statements of Income for the Three Months Ended March 31, 2019 and 2018
|
|
|
|
||
|
|
Consolidated Statements of Comprehensive Income for the Three Months Ended March 31, 2019 and 2018
|
|
|
|
||
|
|
Consolidated Statements of Changes in Stockholders’ Equity and Noncontrolling Interests for the Three Months Ended March 31, 2019 and 2018
|
|
|
|
||
|
|
Consolidated Statements of Cash Flows for the Three Months Ended March 31, 2019 and 2018
|
|
|
|
||
|
|
||
|
|
||
|
|
|
|
|
|
|
|
|
|
|
|
|
|
|
|
i
GLOSSARY
The following abbreviations or acronyms that may be used in this document shall have the adjacent meanings set forth below:
|
ASU
|
Accounting Standards Update
|
|
ATM
|
At the Market
|
|
BPS
|
Basis Points
|
|
CIP
|
Construction in Progress
|
|
EPS
|
Earnings per Share
|
|
FASB
|
Financial Accounting Standards Board
|
|
FFO
|
Funds From Operations
|
|
GAAP
|
U.S. Generally Accepted Accounting Principles
|
|
HVAC
|
Heating, Ventilation, and Air Conditioning
|
|
JV
|
Joint Venture
|
|
LEED
®
|
Leadership in Energy and Environmental Design
|
|
LIBOR
|
London Interbank Offered Rate
|
|
Nareit
|
National Association of Real Estate Investment Trusts
|
|
NAV
|
Net Asset Value
|
|
REIT
|
Real Estate Investment Trust
|
|
RSF
|
Rentable Square Feet/Foot
|
|
SEC
|
Securities and Exchange Commission
|
|
SF
|
Square Feet/Foot
|
|
SoMa
|
South of Market (submarket of the San Francisco market)
|
|
U.S.
|
United States
|
|
VIE
|
Variable Interest Entity
|
ii
PART I – FINANCIAL INFORMATION
ITEM 1. FINANCIAL STATEMENTS (UNAUDITED)
Alexandria Real Estate Equities, Inc.
Consolidated Balance Sheets
Consolidated Balance Sheets
(In thousands)
(Unaudited)
|
March 31, 2019
|
December 31, 2018
|
||||||
|
Assets
|
|||||||
|
Investments in real estate
|
$
|
12,410,350
|
|
$
|
11,913,693
|
|
|
|
Investments in unconsolidated real estate joint ventures
|
290,405
|
|
237,507
|
|
|||
|
Cash and cash equivalents
|
261,372
|
|
234,181
|
|
|||
|
Restricted cash
|
54,433
|
|
37,949
|
|
|||
|
Tenant receivables
|
9,645
|
|
9,798
|
|
|||
|
Deferred rent
|
558,103
|
|
530,237
|
|
|||
|
Deferred leasing costs
|
241,268
|
|
239,070
|
|
|||
|
Investments
|
1,000,904
|
|
892,264
|
|
|||
|
Other assets
|
653,726
|
|
370,257
|
|
|||
|
Total assets
|
$
|
15,480,206
|
|
$
|
14,464,956
|
|
|
|
Liabilities, Noncontrolling Interests, and Equity
|
|||||||
|
Secured notes payable
|
$
|
356,461
|
|
$
|
630,547
|
|
|
|
Unsecured senior notes payable
|
5,139,500
|
|
4,292,293
|
|
|||
|
Unsecured senior line of credit
|
—
|
|
208,000
|
|
|||
|
Unsecured senior bank term loan
|
347,542
|
|
347,415
|
|
|||
|
Accounts payable, accrued expenses, and tenant security deposits
|
1,171,377
|
|
981,707
|
|
|||
|
Dividends payable
|
110,412
|
|
110,280
|
|
|||
|
Total liabilities
|
7,125,292
|
|
6,570,242
|
|
|||
|
Commitments and contingencies
|
|
|
|
|
|||
|
Redeemable noncontrolling interests
|
10,889
|
|
10,786
|
|
|||
|
Alexandria Real Estate Equities, Inc.’s stockholders’ equity:
|
|||||||
|
7.00% Series D cumulative convertible preferred stock
|
57,461
|
|
64,336
|
|
|||
|
Common stock
|
1,112
|
|
1,110
|
|
|||
|
Additional paid-in capital
|
7,518,716
|
|
7,286,954
|
|
|||
|
Accumulated other comprehensive loss
|
(10,712
|
)
|
(10,435
|
)
|
|||
|
Alexandria Real Estate Equities, Inc.’s stockholders’ equity
|
7,566,577
|
|
7,341,965
|
|
|||
|
Noncontrolling interests
|
777,448
|
|
541,963
|
|
|||
|
Total equity
|
8,344,025
|
|
7,883,928
|
|
|||
|
Total liabilities, noncontrolling interests, and equity
|
$
|
15,480,206
|
|
$
|
14,464,956
|
|
|
The accompanying notes are an integral part of these consolidated financial statements.
1
Alexandria Real Estate Equities, Inc.
Consolidated Statements of Income
(In thousands, except per share amounts)
(Unaudited)
|
Three Months Ended March 31,
|
|||||||
|
2019
|
2018
|
||||||
|
Revenues:
|
|||||||
|
Income from rentals
|
$
|
354,749
|
|
$
|
317,655
|
|
|
|
Other income
|
4,093
|
|
|
2,484
|
|
||
|
Total revenues
|
358,842
|
|
320,139
|
|
|||
|
Expenses:
|
|||||||
|
Rental operations
|
101,501
|
|
91,771
|
|
|||
|
General and administrative
|
24,677
|
|
22,421
|
|
|||
|
Interest
|
39,100
|
|
36,915
|
|
|||
|
Depreciation and amortization
|
134,087
|
|
114,219
|
|
|||
|
Loss on early extinguishment of debt
|
7,361
|
|
—
|
|
|||
|
Total expenses
|
306,726
|
|
265,326
|
|
|||
|
Equity in earnings of unconsolidated real estate joint ventures
|
1,146
|
|
1,144
|
|
|||
|
Investment income
|
83,556
|
|
85,561
|
|
|||
|
Net income
|
136,818
|
|
141,518
|
|
|||
|
Net income attributable to noncontrolling interests
|
(7,659
|
)
|
|
(5,888
|
)
|
||
|
Net income attributable to Alexandria Real Estate Equities, Inc.’s stockholders
|
129,159
|
|
135,630
|
|
|||
|
Dividends on preferred stock
|
(1,026
|
)
|
(1,302
|
)
|
|||
|
Preferred stock redemption charge
|
(2,580
|
)
|
—
|
|
|||
|
Net income attributable to unvested restricted stock awards
|
(1,955
|
)
|
(1,941
|
)
|
|||
|
Net income attributable to Alexandria Real Estate Equities, Inc.’s common stockholders
|
$
|
123,598
|
|
$
|
132,387
|
|
|
|
Net income per share attributable to Alexandria Real Estate Equities, Inc.’s common stockholders:
|
|||||||
|
Basic
|
$
|
1.11
|
|
$
|
1.33
|
|
|
|
Diluted
|
$
|
1.11
|
|
$
|
1.32
|
|
|
The accompanying notes are an integral part of these consolidated financial statements.
2
Alexandria Real Estate Equities, Inc.
Consolidated Statements of Comprehensive Income
(In thousands)
(Unaudited)
|
Three Months Ended March 31,
|
|||||||
|
2019
|
2018
|
||||||
|
Net income
|
$
|
136,818
|
|
$
|
141,518
|
|
|
|
Other comprehensive (loss) income
|
|||||||
|
Unrealized (losses) gains on interest rate hedge agreements:
|
|||||||
|
Unrealized interest rate hedge (losses) gains arising during the period
|
(558
|
)
|
1,982
|
|
|||
|
Reclassification adjustment for amortization of interest income included in net income
|
(1,929
|
)
|
(678
|
)
|
|||
|
Unrealized (losses) gains on interest rate hedge agreements, net
|
(2,487
|
)
|
1,304
|
|
|||
|
Unrealized gains (losses) on foreign currency translation:
|
|||||||
|
Unrealized foreign currency translation gains (losses) arising during the period
|
2,210
|
|
(329
|
)
|
|||
|
Unrealized gains (losses) on foreign currency translation, net
|
2,210
|
|
(329
|
)
|
|||
|
Total other comprehensive (loss) income
|
(277
|
)
|
975
|
|
|||
|
Comprehensive income
|
136,541
|
|
142,493
|
|
|||
|
Less: comprehensive income attributable to noncontrolling interests
|
(7,659
|
)
|
(5,888
|
)
|
|||
|
Comprehensive income attributable to Alexandria Real Estate Equities, Inc.’s stockholders
|
$
|
128,882
|
|
$
|
136,605
|
|
|
The accompanying notes are an integral part of these consolidated financial statements.
3
Alexandria Real Estate Equities, Inc.
Consolidated Statement of Changes in Stockholders’ Equity and Noncontrolling Interests
(Dollars in thousands)
(Unaudited)
|
Alexandria Real Estate Equities, Inc.’s Stockholders’ Equity
|
|||||||||||||||||||||||||||||||||||
|
7.00% Series D
Cumulative
Convertible
Preferred
Stock
|
Number of
Common
Shares
|
Common
Stock
|
Additional
Paid-In Capital
|
Retained
Earnings
|
Accumulated Other Comprehensive Income
|
Noncontrolling
Interests
|
Total
Equity
|
Redeemable
Noncontrolling
Interests
|
|||||||||||||||||||||||||||
|
Balance as of December 31, 2017
|
$
|
74,386
|
|
99,783,686
|
|
$
|
998
|
|
$
|
5,824,258
|
|
$
|
—
|
|
$
|
50,024
|
|
$
|
521,994
|
|
$
|
6,471,660
|
|
$
|
11,509
|
|
|||||||||
|
Net income
|
—
|
|
—
|
|
—
|
|
—
|
|
135,630
|
|
—
|
|
5,674
|
|
141,304
|
|
214
|
|
|||||||||||||||||
|
Total other comprehensive income
|
—
|
|
—
|
|
—
|
|
—
|
|
—
|
|
975
|
|
—
|
|
975
|
|
—
|
|
|||||||||||||||||
|
Reclassification of cumulative net unrealized gains on non-real estate investments upon adoption of new ASU on financial instruments
|
—
|
|
—
|
|
—
|
|
—
|
|
140,521
|
|
(49,771
|
)
|
—
|
|
90,750
|
|
—
|
|
|||||||||||||||||
|
Redemption of noncontrolling interests
|
—
|
|
—
|
|
—
|
|
—
|
|
—
|
|
—
|
|
—
|
|
—
|
|
(1,297
|
)
|
|||||||||||||||||
|
Distributions to noncontrolling interests
|
—
|
|
—
|
|
—
|
|
—
|
|
—
|
|
—
|
|
(5,709
|
)
|
(5,709
|
)
|
(214
|
)
|
|||||||||||||||||
|
Contributions from noncontrolling interests
|
—
|
|
—
|
|
—
|
|
—
|
|
—
|
|
—
|
|
6,579
|
|
6,579
|
|
—
|
|
|||||||||||||||||
|
Issuance of common stock
|
—
|
|
843,600
|
|
8
|
|
99,361
|
|
—
|
|
—
|
|
—
|
|
99,369
|
|
—
|
|
|||||||||||||||||
|
Issuance pursuant to stock plan
|
—
|
|
69,075
|
|
1
|
|
11,488
|
|
—
|
|
—
|
|
—
|
|
11,489
|
|
—
|
|
|||||||||||||||||
|
Dividends declared on common stock ($0.90 per share)
|
—
|
|
—
|
|
—
|
|
—
|
|
(91,980
|
)
|
—
|
|
—
|
|
(91,980
|
)
|
—
|
|
|||||||||||||||||
|
Dividends declared on preferred stock ($0.4375 per share)
|
—
|
|
—
|
|
—
|
|
—
|
|
(1,302
|
)
|
—
|
|
—
|
|
(1,302
|
)
|
—
|
|
|||||||||||||||||
|
Reclassification for cumulative distributions in excess of earnings
|
—
|
|
—
|
|
—
|
|
182,869
|
|
(182,869
|
)
|
—
|
|
—
|
|
—
|
|
—
|
|
|||||||||||||||||
|
Balance as of March 31, 2018
|
$
|
74,386
|
|
100,696,361
|
|
$
|
1,007
|
|
$
|
6,117,976
|
|
$
|
—
|
|
$
|
1,228
|
|
$
|
528,538
|
|
$
|
6,723,135
|
|
$
|
10,212
|
|
|||||||||
4
Alexandria Real Estate Equities, Inc.
Consolidated Statement of Changes in Stockholders’ Equity and Noncontrolling Interests
(Dollars in thousands)
(Unaudited)
|
Alexandria Real Estate Equities, Inc.’s Stockholders’ Equity
|
|||||||||||||||||||||||||||||||||||
|
7.00% Series D
Cumulative
Convertible
Preferred
Stock
|
Number of
Common
Shares
|
Common
Stock
|
Additional
Paid-In Capital
|
Retained
Earnings
|
Accumulated Other Comprehensive Loss
|
Noncontrolling
Interests
|
Total
Equity
|
Redeemable
Noncontrolling
Interests
|
|||||||||||||||||||||||||||
|
Balance as of December 31, 2018
|
$
|
64,336
|
|
111,011,816
|
|
$
|
1,110
|
|
$
|
7,286,954
|
|
$
|
—
|
|
$
|
(10,435
|
)
|
$
|
541,963
|
|
$
|
7,883,928
|
|
$
|
10,786
|
|
|||||||||
|
Net income
|
—
|
|
—
|
|
—
|
|
—
|
|
129,159
|
|
—
|
|
7,442
|
|
136,601
|
|
217
|
|
|||||||||||||||||
|
Total other comprehensive loss
|
—
|
|
—
|
|
—
|
|
—
|
|
—
|
|
(277
|
)
|
—
|
|
(277
|
)
|
—
|
|
|||||||||||||||||
|
Distributions to noncontrolling interests
|
—
|
|
—
|
|
—
|
|
—
|
|
—
|
|
—
|
|
(9,501
|
)
|
(9,501
|
)
|
(208
|
)
|
|||||||||||||||||
|
Contributions from and sales of noncontrolling interests
|
—
|
|
—
|
|
—
|
|
202,246
|
|
—
|
|
—
|
|
237,544
|
|
439,790
|
|
94
|
|
|||||||||||||||||
|
Issuance pursuant to stock plan
|
—
|
|
195,992
|
|
2
|
|
16,936
|
|
—
|
|
—
|
|
—
|
|
16,938
|
|
—
|
|
|||||||||||||||||
|
Taxes paid related to net settlement of equity awards
|
—
|
|
(27,149
|
)
|
—
|
|
(89
|
)
|
—
|
|
—
|
|
—
|
|
(89
|
)
|
—
|
|
|||||||||||||||||
|
Repurchases of 7.00% Series D preferred stock
|
(6,875
|
)
|
—
|
|
—
|
|
215
|
|
(2,580
|
)
|
—
|
|
—
|
|
(9,240
|
)
|
—
|
|
|||||||||||||||||
|
Dividends declared on common stock ($0.97 per share)
|
—
|
|
—
|
|
—
|
|
—
|
|
(109,574
|
)
|
—
|
|
—
|
|
(109,574
|
)
|
—
|
|
|||||||||||||||||
|
Dividends declared on preferred stock ($0.4375 per share)
|
—
|
|
—
|
|
—
|
|
—
|
|
(1,026
|
)
|
—
|
|
—
|
|
(1,026
|
)
|
—
|
|
|||||||||||||||||
|
Cumulative effect of adjustment upon adoption of new ASU on lease accounting on January 1, 2019
|
—
|
|
—
|
|
—
|
|
—
|
|
(3,525
|
)
|
—
|
|
—
|
|
(3,525
|
)
|
—
|
|
|||||||||||||||||
|
Reclassification of distributions in excess of earnings
|
—
|
|
—
|
|
—
|
|
12,454
|
|
(12,454
|
)
|
—
|
|
—
|
|
—
|
|
—
|
|
|||||||||||||||||
|
Balance as of March 31, 2019
|
$
|
57,461
|
|
111,180,659
|
|
$
|
1,112
|
|
$
|
7,518,716
|
|
$
|
—
|
|
$
|
(10,712
|
)
|
$
|
777,448
|
|
$
|
8,344,025
|
|
$
|
10,889
|
|
|||||||||
The accompanying notes are an integral part of these consolidated financial statements.
5
|
Alexandria Real Estate Equities, Inc.
Consolidated Statements of Cash Flows
(In thousands)
(Unaudited)
|
|||||||
|
Three Months Ended March 31,
|
|||||||
|
2019
|
2018
|
||||||
|
Operating Activities
|
|||||||
|
Net income
|
$
|
136,818
|
|
$
|
141,518
|
|
|
|
Adjustments to reconcile net income to net cash provided by operating activities:
|
|||||||
|
Depreciation and amortization
|
134,087
|
|
114,219
|
|
|||
|
Loss on early extinguishment of debt
|
7,361
|
|
—
|
|
|||
|
Equity in earnings of unconsolidated real estate joint ventures
|
(1,146
|
)
|
(1,144
|
)
|
|||
|
Distributions of earnings from unconsolidated real estate joint ventures
|
858
|
|
144
|
|
|||
|
Amortization of loan fees
|
2,233
|
|
2,543
|
|
|||
|
Amortization of debt premiums
|
(801
|
)
|
(575
|
)
|
|||
|
Amortization of acquired below-market leases
|
(7,148
|
)
|
(6,170
|
)
|
|||
|
Deferred rent
|
(26,965
|
)
|
(32,631
|
)
|
|||
|
Stock compensation expense
|
11,029
|
|
7,248
|
|
|||
|
Investment income
|
(83,556
|
)
|
(85,561
|
)
|
|||
|
Changes in operating assets and liabilities:
|
|||||||
|
Tenant receivables
|
167
|
|
(988
|
)
|
|||
|
Deferred leasing costs
|
(11,279
|
)
|
(13,819
|
)
|
|||
|
Other assets
|
(8,684
|
)
|
(14,279
|
)
|
|||
|
Accounts payable, accrued expenses, and tenant security deposits
|
(16,244
|
)
|
18,416
|
|
|||
|
Net cash provided by operating activities
|
136,730
|
|
128,921
|
|
|||
|
Investing Activities
|
|||||||
|
Additions to real estate
|
(241,049
|
)
|
(206,404
|
)
|
|||
|
Purchases of real estate
|
(418,358
|
)
|
(303,156
|
)
|
|||
|
Returns of deposits/(deposits) for investing activities
|
500
|
|
(7,786
|
)
|
|||
|
Acquisitions of interests in unconsolidated real estate joint ventures
|
—
|
|
(35,922
|
)
|
|||
|
Investments in unconsolidated real estate joint ventures
|
(52,634
|
)
|
(22,325
|
)
|
|||
|
Additions to investments
|
(48,992
|
)
|
(50,287
|
)
|
|||
|
Sales of investments
|
26,200
|
|
27,842
|
|
|||
|
Net cash used in investing activities
|
$
|
(734,333
|
)
|
$
|
(598,038
|
)
|
|
6
|
Alexandria Real Estate Equities, Inc.
Consolidated Statements of Cash Flows
(In thousands)
(Unaudited)
|
|||||||
|
Three Months Ended March 31,
|
|||||||
|
2019
|
2018
|
||||||
|
Financing Activities
|
|||||||
|
Borrowings from secured notes payable
|
$
|
—
|
|
$
|
6,142
|
|
|
|
Repayments of borrowings from secured notes payable
|
(301,343
|
)
|
(1,189
|
)
|
|||
|
Proceeds from issuance of unsecured senior notes payable
|
854,209
|
|
—
|
|
|||
|
Borrowings from unsecured senior line of credit
|
1,405,000
|
|
1,035,000
|
|
|||
|
Repayments of borrowings from unsecured senior line of credit
|
(1,613,000
|
)
|
(595,000
|
)
|
|||
|
Payment of loan fees
|
(15,225
|
)
|
—
|
|
|||
|
Taxes paid related to net settlement of equity awards
|
(89
|
)
|
—
|
|
|||
|
Repurchase of 7.00% Series D cumulative convertible preferred stock
|
(9,240
|
)
|
—
|
|
|||
|
Proceeds from issuance of common stock
|
—
|
|
99,369
|
|
|||
|
Dividends on common stock
|
(109,342
|
)
|
(91,060
|
)
|
|||
|
Dividends on preferred stock
|
(1,126
|
)
|
(1,302
|
)
|
|||
|
Contributions from and sales of noncontrolling interests
|
440,671
|
|
6,579
|
|
|||
|
Distributions to noncontrolling interests
|
(9,709
|
)
|
(7,220
|
)
|
|||
|
Net cash provided by financing activities
|
640,806
|
|
451,319
|
|
|||
|
Effect of foreign exchange rate changes on cash and cash equivalents
|
472
|
|
(406
|
)
|
|||
|
Net increase (decrease) in cash, cash equivalents, and restricted cash
|
43,675
|
|
(18,204
|
)
|
|||
|
Cash, cash equivalents, and restricted cash as of the beginning of period
|
272,130
|
|
277,186
|
|
|||
|
Cash, cash equivalents, and restricted cash as of the end of period
|
$
|
315,805
|
|
$
|
258,982
|
|
|
|
Supplemental Disclosures and Non-Cash Investing and Financing Activities:
|
|||||||
|
Cash paid during the period for interest, net of interest capitalized
|
$
|
49,600
|
|
$
|
35,493
|
|
|
|
Change in accrued construction
|
$
|
9,939
|
|
$
|
19,565
|
|
|
|
Accrued construction for current period additions to real estate
|
$
|
133,502
|
|
$
|
130,761
|
|
|
|
Assumption of secured notes payable in connection with purchase of properties
|
$
|
(28,200
|
)
|
$
|
—
|
|
|
|
Right-of-use asset
|
$
|
239,653
|
|
$
|
—
|
|
|
|
Lease liability
|
$
|
(245,638
|
)
|
$
|
—
|
|
|
The accompanying notes are an integral part of these consolidated financial statements.
7
Alexandria Real Estate Equities, Inc.
Notes to Consolidated Financial Statements
(Unaudited)
|
1.
|
Organization and basis of presentation
|
Alexandria Real Estate Equities, Inc. (NYSE:ARE), an S&P 500
®
company, is an urban office REIT uniquely focused on collaborative life science and technology campuses in AAA innovation cluster locations. As used in this
quarterly report
on Form 10‑Q, references to the “Company,” “Alexandria,” “ARE,” “we,” “us,” and “our” refer to Alexandria Real Estate Equities, Inc. and its consolidated subsidiaries. The accompanying unaudited consolidated financial statements include the accounts of Alexandria Real Estate Equities, Inc. and its consolidated subsidiaries. All significant intercompany balances and transactions have been eliminated.
We have prepared the accompanying interim consolidated financial statements in accordance with GAAP and in conformity with the rules and regulations of the SEC. In our opinion, the interim consolidated financial statements presented herein reflect all adjustments, of a normal recurring nature, that are necessary to fairly present the interim consolidated financial statements. The results of operations for the interim period are not necessarily indicative of the results that may be expected for the year ending
December 31, 2019
. These unaudited consolidated financial statements should be read in conjunction with the audited consolidated financial statements and the notes thereto included in our annual report on Form 10‑K for the year ended
December 31, 2018
. Any references to our market capitalization, number or quality of buildings or tenants, quality of location, square footage, number of leases, or occupancy percentage, and any amounts derived from these values in these notes to consolidated financial statements, are outside the scope of our independent registered public accounting firm’s review.
|
2.
|
Summary of significant accounting policies
|
Reclassifications
Certain prior period amounts have been reclassified to conform to current period presentation. Refer to the “Lease Accounting” section within this Note 2 – “Summary of Significant Accounting Policies.”
Consolidation
On an ongoing basis, as circumstances indicate the need for reconsideration, we evaluate each legal entity that is not wholly owned by us in accordance with the consolidation guidance. Our evaluation considers all of our variable interests, including equity ownership, as well as fees paid to us for our involvement in the management of each partially owned entity. To fall within the scope of the consolidation guidance, an entity must meet both of the following criteria:
|
•
|
The entity has a legal structure that has been established to conduct business activities and to hold assets; such entity can be in the form of a partnership, limited liability company, or corporation, among others; and
|
|
•
|
We have a variable interest in the legal entity – i.e., variable interests that are contractual, such as equity ownership, or other financial interests that change with changes in the fair value of the entity’s net assets.
|
If an entity does not meet both criteria above, we apply other accounting literature, such as the cost or equity method of accounting. If an entity does meet both criteria above, we evaluate such entity for consolidation under either the variable interest model if the legal entity meets any of the following characteristics to qualify as a VIE, or under the voting model for all other legal entities that are not VIEs.
A legal entity is determined to be a VIE if it has any of the following three characteristics:
|
1)
|
The entity does not have sufficient equity to finance its activities without additional subordinated financial support;
|
|
2)
|
The entity is established with non-substantive voting rights (i.e., where the entity deprives the majority economic interest holder(s) of voting rights); or
|
|
3)
|
The equity holders, as a group, lack the characteristics of a controlling financial interest. Equity holders meet this criterion if they lack any of the following:
|
|
•
|
The power, through voting rights or similar rights, to direct the activities of the entity that most significantly influence the entity’s economic performance, as evidenced by:
|
|
•
|
Substantive participating rights in day-to-day management of the entity’s activities; or
|
|
•
|
Substantive kick-out rights over the party responsible for significant decisions;
|
|
•
|
The obligation to absorb the entity’s expected losses; or
|
|
•
|
The right to receive the entity’s expected residual returns.
|
8
|
2.
|
Summary of significant accounting policies (continued)
|
Once we consider the sufficiency of equity and voting rights of each legal entity, we then evaluate the characteristics of the equity holders’ interests, as a group, to see if they qualify as controlling financial interests. Our real estate joint ventures consist of limited partnerships or limited liability companies. For an entity structured as a limited partnership or a limited liability company, our evaluation of whether the equity holders (equity partners other than us in each of our joint ventures) lack the characteristics of a controlling financial interest includes the evaluation of whether the limited partners or non-managing members (the noncontrolling equity holders) lack both substantive participating rights and substantive kick-out rights, defined as follows:
|
•
|
Participating rights provide the noncontrolling equity holders the ability to direct significant financial and operating decisions made in the ordinary course of business that most significantly influence the entity’s economic performance.
|
|
•
|
Kick-out rights allow the noncontrolling equity holders to remove the general partner or managing member without cause.
|
If we conclude that any of the three characteristics of a VIE are met, including that the equity holders lack the characteristics of a controlling financial interest because they lack both substantive participating rights and substantive kick-out rights, we conclude that the entity is a VIE and evaluate it for consolidation under the variable interest model.
Variable interest model
If an entity is determined to be a VIE, we evaluate whether we are the primary beneficiary. The primary beneficiary analysis is a qualitative analysis based on power and benefits. We consolidate a VIE if we have both power and benefits – that is, (i) we have the power to direct the activities of a VIE that most significantly influence the VIE’s economic performance (power), and (ii) we have the obligation to absorb losses of or the right to receive benefits from the VIE that could potentially be significant to the VIE (benefits). We consolidate VIEs whenever we determine that we are the primary beneficiary. Refer to Note 4 – “Consolidated and Unconsolidated Real Estate Joint Ventures” to these unaudited consolidated financial statements for information on specific joint ventures that qualify as VIEs. If we have a variable interest in a VIE but are not the primary beneficiary, we account for our investment using the equity method of accounting.
Voting model
If a legal entity fails to meet any of the three characteristics of a VIE (due to insufficiency of equity, existence of non-substantive voting rights, or lack of a controlling financial interest), we then evaluate such entity under the voting model. Under the voting model, we consolidate the entity if we determine that we, directly or indirectly, have greater than 50% of the voting shares and that other equity holders do not have substantive participating rights. Refer to Note 4 – “Consolidated and Unconsolidated Real Estate Joint Ventures” to these unaudited consolidated financial statements for further information on one of our unconsolidated real estate joint ventures that qualify for evaluation under the voting model.
Use of estimates
The preparation of consolidated financial statements in conformity with GAAP requires us to make estimates and assumptions that affect the reported amounts of assets, liabilities, and equity; the disclosure of contingent assets and liabilities as of the date of the consolidated financial statements; and the amounts of revenues and expenses during the reporting period. Actual results could materially differ from those estimates.
Investments in real estate
Evaluation of business combination or asset acquisition
We evaluate each acquisition of real estate or in-substance real estate (including equity interests in entities that predominantly hold real estate assets) to determine whether the integrated set of assets and activities acquired meets the definition of a business and needs to be accounted for as a business combination. An acquisition of an integrated set of assets and activities that does not meet the definition of a business is accounted for as an asset acquisition. If either of the following criteria is met, the integrated set of assets and activities acquired would not qualify as a business:
|
•
|
Substantially all of the fair value of the gross assets acquired is concentrated in either a single identifiable asset or a group of similar identifiable assets; or
|
|
•
|
The integrated set of assets and activities is lacking, at a minimum, an input and a substantive process that together significantly contribute to the ability to create outputs (i.e., revenue generated before and after the transaction).
|
An acquired process is considered substantive if:
|
•
|
The process includes an organized workforce (or includes an acquired contract that provides access to an organized workforce) that is skilled, knowledgeable, and experienced in performing the process;
|
|
•
|
The process cannot be replaced without significant cost, effort, or delay; or
|
|
•
|
The process is considered unique or scarce.
|
9
|
2.
|
Summary of significant accounting policies (continued)
|
Generally, we expect that acquisitions of real estate or in-substance real estate will not meet the definition of a business because substantially all of the fair value is concentrated in a single identifiable asset or group of similar identifiable assets (i.e., land, buildings, and related intangible assets) or because the acquisition does not include a substantive process in the form of an acquired workforce or an acquired contract that cannot be replaced without significant cost, effort, or delay. When evaluating acquired service or management contracts, we consider the nature of the services performed, the terms of the contract relative to similar arm’s-length contracts, and the availability of comparable vendors in evaluating whether the acquired contract constitutes a substantive process.
Recognition of real estate acquired
We evaluate each acquisition of real estate or in-substance real estate (including equity interests in entities that predominantly hold real estate assets) to determine whether the integrated set of assets and activities acquired meets the definition of a business and needs to be accounted for as a business combination. An acquisition of an integrated set of assets and activities that does not meet the definition of a business is accounted for as an asset acquisition.
For acquisitions of real estate or in-substance real estate that are accounted for as business combinations, we allocate the acquisition consideration (excluding acquisition costs) to the assets acquired, liabilities assumed, noncontrolling interests, and previously existing ownership interests at fair value as of the acquisition date. Assets include intangible assets such as tenant relationships, acquired in-place leases, and favorable intangibles associated with in-place leases for which we are the lessor. Liabilities include unfavorable intangibles associated with in-place leases for which we are the lessor. In addition, for acquired in-place operating leases for which we are the lessee, acquisition consideration is allocated to lease liabilities and related right-of-use assets, adjusted to reflect favorable or unfavorable terms of the lease when compared with market terms. Any excess (deficit) of the consideration transferred relative to the fair value of the net assets acquired is accounted for as goodwill (bargain purchase gain). Acquisition costs related to business combinations are expensed as incurred.
Generally, we expect that acquisitions of real estate or in-substance real estate will not meet the definition of a business because substantially all of the fair value is concentrated in a single identifiable asset or group of similar identifiable assets (i.e., land, buildings, and related intangible assets). The accounting model for asset acquisitions is similar to the accounting model for business combinations, except that the acquisition consideration (including acquisition costs) is allocated to the individual assets acquired and liabilities assumed on a relative fair value basis. Any excess (deficit) of the consideration transferred relative to the sum of the fair value of the assets acquired and liabilities assumed is allocated to the individual assets and liabilities based on their relative fair values. As a result, asset acquisitions do not result in the recognition of goodwill or a bargain purchase gain. Incremental and external direct acquisition costs (such as legal and third-party expenses) are capitalized.
We exercise judgment to determine the key assumptions used to allocate the purchase price of real estate acquired among its components. The allocation of the consideration to the various components of properties acquired during the year can have an effect on our net income due to the differing depreciable and amortizable lives of each component and the recognition of the related depreciation and amortization expense in our consolidated statements of income. We apply judgment in utilizing available comparable market information to assess relative fair value. We assess the relative fair values of tangible and intangible assets based on numerous factors, including estimated cash flow projections that utilize appropriate discount and capitalization rates and available comparable market information. Estimates of future cash flows are based on a number of factors, including the historical operating results, known and anticipated trends, and market/economic conditions that may affect the property.
The value of tangible assets acquired is based upon our estimation of fair value on an “as if vacant” basis. The value of acquired in-place leases includes the estimated costs during the hypothetical lease-up period and other costs that would have been incurred in the execution of similar leases under the market conditions at the acquisition date of the acquired in-place lease. If there is a bargain fixed-rate renewal option for the period beyond the non-cancelable lease term of an in-place lease, we evaluate intangible factors such as the business conditions in the industry in which the lessee operates, the economic conditions in the area in which the property is located, and the ability of the lessee to sublease the property during the renewal term, in order to determine the likelihood that the lessee will renew. When we determine there is reasonable assurance that such bargain purchase option will be exercised, we consider the option in determining the intangible value of such lease and its related amortization period. We also recognize the relative fair values of assets acquired, the liabilities assumed, and any noncontrolling interest in acquisitions of less than a 100% interest when the acquisition constitutes a change in control of the acquired entity.
The values allocated to buildings and building improvements, land improvements, tenant improvements, and equipment are depreciated on a straight-line basis using the shorter of the respective ground lease term, estimated useful life, or up to
40 years
, for buildings and building improvements, estimated life, or up to
20 years
, for land improvements, the respective lease term or estimated useful life for tenant improvements, and the shorter of the lease term or estimated useful life for equipment. The values of acquired in-place leases are classified in other assets in the accompanying consolidated balance sheets and amortized over the remaining terms of the related leases.
10
|
2.
|
Summary of significant accounting policies (continued)
|
Capitalized project costs
We capitalize project costs, including pre-construction costs, interest, property taxes, insurance, and other costs directly related and essential to the development, redevelopment, pre-construction, or construction of a project. Capitalization of development, redevelopment, pre-construction, and construction costs is required while activities are ongoing to prepare an asset for its intended use. Fluctuations in our development, redevelopment, pre-construction, and construction activities could result in significant changes to total expenses and net income. Costs incurred after a project is substantially complete and ready for its intended use are expensed as incurred. Should development, redevelopment, pre-construction, or construction activity cease, interest, property taxes, insurance, and certain other costs would no longer be eligible for capitalization and would be expensed as incurred. Expenditures for repairs and maintenance are expensed as incurred.
Real estate sales
A property is classified as held for sale when all of the following criteria for a plan of sale have been met: (i) management, having the authority to approve the action, commits to a plan to sell the property; (ii) the property is available for immediate sale in its present condition, subject only to terms that are usual and customary; (iii) an active program to locate a buyer and other actions required to complete the plan to sell have been initiated; (iv) the sale of the property is probable and is expected to be completed within
one year
; (v) the property is being actively marketed for sale at a price that is reasonable in relation to its current fair value; and (vi) actions necessary to complete the plan of sale indicate that it is unlikely that significant changes to the plan will be made or that the plan will be withdrawn. Depreciation of assets ceases upon designation of a property as held for sale.
If the disposal of a property represents a strategic shift that has (or will have) a major effect on our operations or financial results, such as (i) a major line of business, (ii) a major geographic area, (iii) a major equity method investment, or (iv) other major parts of an entity, then the operations of the property, including any interest expense directly attributable to it, are classified as discontinued operations in our consolidated statements of income, and amounts for all prior periods presented are reclassified from continuing operations to discontinued operations. The disposal of an individual property generally will not represent a strategic shift and therefore will typically not meet the criteria for classification as a discontinued operation.
We recognize gains/losses on real estate sales in accordance with the accounting standard on the derecognition of nonfinancial assets arising from contracts with noncustomers. Our ordinary output activities consist of the leasing of space to our tenants in our operating properties, not the sales of real estate. Therefore, sales of real estate (in which we are the seller) qualify as contracts with noncustomers. In our transactions with noncustomers, we apply certain recognition and measurement principles consistent with our method of recognizing revenue arising from contracts with customers. Derecognition of the asset is based on the transfer of control. If a real estate sales contract includes our ongoing involvement with the property, then we evaluate each promised good or service under the contract to determine whether it represents a separate performance obligation, constitutes a guarantee, or prevents the transfer of control. If a good or service is considered a separate performance obligation, an allocated portion of the transaction price is recognized as revenue as we transfer the related good or service to the buyer.
The recognition of gain or loss on the sale of a partial interest also depends on whether we retain a controlling or noncontrolling interest. If we retain a controlling interest upon completion of the sale, we continue to reflect the asset at its book value, record a noncontrolling interest for the book value of the partial interest sold, and recognize additional paid-in capital for the difference between the consideration received and the partial interest at book value. Conversely, if we retain a noncontrolling interest upon completion of the partial sale of real estate, we would recognize a gain or loss as if 100% of the real estate were sold.
Impairment of long-lived assets
Prior to and subsequent to the end of each quarter, we review current activities and changes in the business conditions of all of our long-lived assets to determine the existence of any triggering events or impairment indicators requiring an impairment analysis. If triggering events or impairment indicators are identified, we review an estimate of the future undiscounted cash flows, including, if necessary, a probability-weighted approach if multiple outcomes are under consideration.
Long-lived assets to be held and used, including our rental properties, CIP, land held for development, right-of-use assets related to our operating leases in which we are a lessee, and intangibles, are individually evaluated for impairment when conditions exist that may indicate that the carrying amount of a long-lived asset may not be recoverable. The carrying amount of a long-lived asset to be held and used is not recoverable if it exceeds the sum of the undiscounted cash flows expected to result from the use and eventual disposition of the asset. Triggering events or impairment indicators for long-lived assets to be held and used are assessed by project and include significant fluctuations in estimated net operating income, occupancy changes, significant near-term lease expirations, current and historical operating and/or cash flow losses, construction costs, estimated completion dates, rental rates, and other market factors. We assess the expected undiscounted cash flows based upon numerous factors, including, but not limited to, construction costs, available market information, current and historical operating results, known trends, current market/economic conditions that may affect the asset, and our assumptions about the use of the asset, including, if necessary, a probability-weighted approach if multiple outcomes are under consideration.
11
|
2.
|
Summary of significant accounting policies (continued)
|
Upon determination that an impairment has occurred, a write-down is recognized to reduce the carrying amount to its estimated fair value. If an impairment loss is not required to be recognized, the recognition of depreciation or amortization is adjusted prospectively, as necessary, to reduce the carrying amount of the real estate to its estimated disposition value over the remaining period that the asset is expected to be held and used. We may adjust depreciation of properties that are expected to be disposed of or redeveloped prior to the end of their useful lives.
We use the held for sale impairment model for our properties classified as held for sale. The held for sale impairment model is different from the held and used impairment model. Under the held for sale impairment model, an impairment loss is recognized if the carrying amount of the long-lived asset classified as held for sale exceeds its fair value less cost to sell. Because of these two different models, it is possible for a long-lived asset previously classified as held and used to require the recognition of an impairment charge upon classification as held for sale.
International operations
In addition to operating properties in the U.S., we have
three
operating properties in Canada and
one
operating property in China. The functional currency for our subsidiaries operating in the U.S. is the U.S. dollar. The functional currencies for our foreign subsidiaries are the local currencies in each respective country. The assets and liabilities of our foreign subsidiaries are translated into U.S. dollars at the exchange rate in effect as of the financial statement date. Income statement accounts of our foreign subsidiaries are translated using the weighted-average exchange rate for the periods presented. Gains or losses resulting from the translation are classified in accumulated other comprehensive income as a separate component of total equity and are excluded from net income.
Whenever a foreign investment meets the criteria for classification as held for sale, we evaluate the recoverability of the investment under the held for sale impairment model. We may recognize an impairment charge if the carrying amount of the investment exceeds its fair value less cost to sell. In determining an investment’s carrying amount, we consider its net book value and any cumulative unrealized foreign currency translation adjustment related to the investment.
The appropriate amounts of foreign exchange rate gains or losses classified in accumulated other comprehensive income are reclassified to net income when realized upon the sale of our investment or upon the complete or substantially complete liquidation of our investment.
Investments
We hold investments in publicly traded companies and privately held entities primarily involved in the life science and technology industries. As a REIT, we generally limit our ownership percentage in the voting stock of each individual entity to less than
10%
.
Our equity investments (except those accounted for under the equity method and those that result in consolidation of the investee) are measured as follows:
|
•
|
Investments in publicly traded companies are classified as investments with readily determinable fair values. These investments are carried at fair value, with changes in fair value recognized in net income. The fair values for our investments in publicly traded companies are determined based on sales prices/quotes available on securities exchanges.
|
|
•
|
Investments in privately held entities without readily determinable fair values fall into two categories:
|
|
•
|
Investments in privately held entities that report NAV per share, such as our privately held investments in limited partnerships, are carried at fair value using NAV as a practical expedient with changes in fair value recognized in net income. We use NAV per share reported by limited partnerships without adjustment, unless we are aware of information indicating that the NAV per share reported by a limited partnership does not accurately reflect the fair value of the investment at our reporting date. We disclose the timing of liquidation of an investee’s assets and the date when redemption restrictions will lapse (or indicate if this timing is unknown) if the investee has communicated this information to us or has announced it publicly.
|
|
•
|
Investments in privately held entities that do not report NAV per share are accounted for using a measurement alternative that measures these investments at cost, adjusted for observable price changes and impairments, with changes recognized in net income.
|
For investments in privately held entities that do not report NAV per share, an observable price is a price observed in an orderly transaction for an identical or similar investment of the same issuer. Observable price changes result from, among other things, equity transactions for the same issuer executed during the reporting period, including subsequent equity offerings or other reported equity transactions related to the same issuer. For these transactions to be considered observable price changes of the same issuer, we evaluate whether these transactions have similar rights and obligations, including voting rights, distribution preferences, conversion rights, and other factors, to the investments we hold.
12
|
2.
|
Summary of significant accounting policies (continued)
|
We monitor investments in privately held entities that do not report NAV per share throughout the year for new developments, including operating results, prospects and results of clinical trials, new product initiatives, new collaborative agreements, capital-raising events, and merger and acquisition activities. These investments are evaluated on the basis of a qualitative assessment for indicators of impairment by monitoring the presence of the following triggering events or impairment indicators: (i) a significant deterioration in the earnings performance, asset quality, or business prospects of the investee; (ii) a significant adverse change in the regulatory, economic, or technological environment of the investee, (iii) a significant adverse change in the general market condition, including the research and development of technology and products that the investee is bringing or attempting to bring to the market, or (iv) significant concerns about the investee’s ability to continue as a going concern. If such indicators are present, we are required to estimate the investment’s fair value and immediately recognize an impairment loss in an amount equal to the investment’s carrying value in excess of its estimated fair value.
Investments in privately held entities are accounted for under the equity method unless our interest in the entity is deemed to be so minor that we have virtually no influence over the entity’s operating and financial policies. Under the equity method of accounting, we initially recognize our investment at cost and adjust the carrying amount of the investment to recognize our share of the earnings or losses of the investee subsequent to the date of our investment. We had no investments accounted for under the equity method
as of March 31, 2019
.
We recognize both realized and unrealized gains and losses in our consolidated statements of income, classified within investment income. Unrealized gains and losses represent changes in fair value for investments in publicly traded companies, changes in NAV, as a practical expedient to estimate fair value, for investments in privately held entities that report NAV per share, and observable price changes on our investments in privately held entities that do not report NAV per share. Impairments are realized losses, which result in an adjusted cost, and represent charges to reduce the carrying values of investments in privately held entities that do not report NAV per share to their estimated fair value. Realized gains and losses represent the difference between proceeds received upon disposition of investments and their historical or adjusted cost.
Revenues
The table below provides detail of our consolidated total revenues for the
three months ended March 31, 2019
(in thousands):
|
Three Months Ended March 31, 2019
|
||||
|
Income from rentals:
|
||||
|
Revenues subject to the new lease accounting standard:
|
||||
|
Operating leases
|
$
|
343,339
|
|
|
|
Direct financing leases
|
601
|
|
||
|
Revenues subject to the new lease accounting standard
|
343,940
|
|
||
|
Revenues subject to the revenue recognition accounting standard
|
10,809
|
|
||
|
Income from rentals
|
354,749
|
|
||
|
Other income
|
4,093
|
|
||
|
Total revenues
|
$
|
358,842
|
|
|
During the
three months ended March 31, 2019
, revenues that were subject to the new lease accounting standard aggregated
$343.9 million
and represented
95.8%
of our total revenues. Our total revenues also included
$14.9 million
, or
4.2%
, subject to other accounting guidance. For a detailed discussion related to our revenue streams, refer to the “Lease Accounting” and “Recognition of Revenue Arising From Contracts With Customers” sections within this Note 2 – “Summary of Significant Accounting Policies.”
13
|
2.
|
Summary of significant accounting policies (continued)
|
Lease accounting
On January 1, 2019, we adopted a new lease accounting standard that sets out the principles for the recognition, measurement, presentation, and disclosure of leases for both parties to a lease agreement (i.e., lessees and lessors). Upon adoption of the new lease accounting standard, we elected the following practical expedients provided by this lease standard and discussed in greater detail within this “Lease Accounting” section of Note 2. The summary of the practical expedients we elected is provided below:
|
•
|
Package of practical expedients – requires us to not reevaluate our existing or expired leases as of January 1, 2019, under the new lease accounting standard.
|
|
•
|
Optional transition method practical expedient – requires us to apply the new lease accounting standard prospectively from the adoption date of January 1, 2019.
|
|
•
|
Land easements practical expedient – requires us to continue to account for land easements existing as of January 1, 2019, under the accounting standards applied to them prior to January 1, 2019.
|
|
•
|
Single component practical expedient – requires us to account for lease and nonlease components associated with that lease under the new lease accounting standard if certain criteria are met.
|
|
•
|
Short-term lease practical expedient – requires us to not record the related lease liabilities and right-of-use assets for our operating leases with a term of 12 months or less in which we are the lessee.
|
Overview related to both lessee and lessor accounting
Upon adoption of the new lease accounting standard, we elected the package of practical expedients, which requires us to not assess whether our expired or existing contracts as of January 1, 2019, are or contain leases. When we enter into a contract or amend an existing contract subsequent to adoption, we evaluate whether the contract meets the definition of a lease. To meet the definition of a lease, the contract must meet three criteria: (i) there must be an identified asset held by one party to the contract (the lessor), (ii) the counterparty (the lessee) has the right to obtain substantially all of the economic benefits from the use of the asset throughout the period of the contract, and (iii) the counterparty has the right to direct the use of the identified asset throughout the period of the contract. We have determined which of our contracts meet these three criteria and are considered leases, including rental property leases where we are the lessor and operating leases where we are the lessee. Our leases generally contain contractual fixed and variable rental payments. Fixed payments represent our scheduled rental amounts due under our leases. Variable payments relate primarily to the reimbursements of rental operating expenses under our triple net lease structure.
The new lease accounting standard also sets new criteria for determining the classification of finance leases for lessees and sales-type leases for lessors. The criteria to determine whether a lease should be accounted for as a finance (sales-type) lease include any of the following: (i) ownership is transferred from lessor to lessee by the end of the lease term, (ii) an option to purchase is reasonably certain to be exercised, (iii) the lease term is for the major part of the underlying asset’s remaining economic life, (iv) the present value of lease payments equals or exceeds substantially all of the fair value of the underlying asset, or (v) the underlying asset is specialized and is expected to have no alternative use at the end of the lease term. If any of these criteria is met, a lease is classified as a finance lease by the lessee and as a sales-type lease by the lessor. If none of the criteria are met, a lease is classified as an operating lease by the lessee, but may still qualify as a direct financing lease or an operating lease for the lessor. The existence of a residual value guarantee from an unrelated third party other than the lessee may qualify the lease as a direct financing lease by the lessor. Otherwise, the lease is classified as an operating lease by the lessor.
Initial adoption method, package of practical expedients, and optional transition method
The new lease accounting standard requires the use of the modified retrospective transition method. On January 1, 2019, we adopted the new lease accounting standard and elected the package of practical expedients and the optional transition method, which permitted January 1, 2019 to be our initial application date. Our election of the package of practical expedients and the optional transition method allowed us to not reassess:
|
•
|
Whether any expired or existing contracts as of January 1, 2019, are leases or contain leases.
This practical expedient is primarily applicable to entities that have contracts containing embedded leases. As of December 31, 2018, we had no such contracts; therefore, this practical expedient had no effect on us.
|
|
•
|
The lease classification for any leases expired or existing as of January 1, 2019.
Our election of the package of practical expedients requires us to not revisit the classification of our leases existing as of January 1, 2019. For example, all of our leases that were classified as operating leases in accordance with the lease accounting standards in effect prior to January 1, 2019, continue to be classified as operating leases after adoption of the new lease accounting standard.
|
|
•
|
Previously capitalized initial direct costs for any leases existing as of January 1, 2019.
Our election of the package of practical expedients and the optional transition method requires us to not reassess whether initial direct leasing costs capitalized prior to the adoption of the new lease accounting standard in connection with the leases that commenced prior to January 1, 2019, qualify for capitalization under the new lease accounting standard. We continue to amortize these costs over the lease term, consistent with the lease accounting guidance in effect prior to January 1, 2019.
|
14
|
2.
|
Summary of significant accounting policies (continued)
|
We applied the package of practical expedients consistently to all leases (i.e., in which we are a lessee or a lessor) that commenced before January 1, 2019. The election of this package permits us to “run off” our leases that commenced before January 1, 2019, for the remainder of their lease terms, unless our existing leases are modified, and to apply the new lease accounting standard to leases commencing or modified after January 1, 2019.
On January 1, 2019, we recognized a lease liability aggregating
$218.7 million
for all operating leases in which we are a lessee based on the present value of the lease payments remaining as of the initial application date of January 1, 2019. On January 1, 2019, we also recognized a right-of-use asset corresponding to the lease liability, adjusted for initial direct leasing cost and other consideration exchanges with the landlord prior to the commencement of the lease. Refer to our discussion in the “Lessee Accounting” subsection below for additional information.
In addition, we had certain land easement contracts in effect as of January 1, 2019. Pursuant to our election of the package of practical expedients described above, no reassessment of these contracts was required. Consequently, the adoption of the new lease accounting standard had no effect on our accounting for land easements existing on January 1, 2019.
Costs to execute leases
The new lease accounting standard requires that lessors and lessees capitalize, as initial direct costs, only incremental costs of a lease that would not have been incurred if the lease had not been obtained. Effective January 1, 2019, costs that we incur to negotiate or arrange a lease regardless of its outcome, such as fixed employee compensation, tax, or legal advice to negotiate lease terms, and other costs are expensed as incurred.
Under the package of practical expedients and optional transition method that we elected on January 1, 2019, we were not required to reassess whether initial direct leasing costs capitalized prior to the adoption of the new lease accounting standard in connection with the leases that commenced prior to January 1, 2019, qualify for capitalization under the new lease accounting standard. Therefore, we continue to amortize these initial direct leasing costs over their respective lease terms.
On January 1, 2019, we recognized a cumulative adjustment, as required by the new lease accounting standard, to retained earnings aggregating
$3.5 million
to write off lease origination costs that were capitalized in connection with leases that were executed but had not commenced before January 1, 2019. These costs were capitalized in accordance with the lease accounting standards existing prior to January 1, 2019, and would not qualify for capitalization under the new lease accounting standard.
Lessor accounting
Under the new lease accounting standard, each lease agreement is evaluated to identify the lease and nonlease components at lease inception. Lease components consist primarily of fixed rental payments, and nonlease components consist primarily of specific tenant recoveries, including recoveries for utilities, repairs and maintenance, and common area expenses. The total consideration in each lease agreement is allocated to the lease and nonlease components based on their relative stand-alone selling prices. If an entity does not elect the single component practical expedient discussed below, revenue related to nonlease components is subject to the revenue recognition accounting standard.
On January 1, 2019, we elected the single component practical expedient, which requires us, by class of underlying asset, to not allocate the total consideration to the lease and nonlease components based on their relative stand-alone selling prices. This single component practical expedient requires us to account for the lease component and nonlease component(s) associated with each lease as a single component if: (i) the timing and pattern of transfer of the lease component and the nonlease component(s) associated with it are the same and (ii) the lease component would be classified as an operating lease if it were accounted for separately. This expedient is applicable to any lease not subject to the aforementioned package of practical expedients and optional transition method.
Under the single component practical expedient, if we determine that the lease component is the predominant component, we are required to account for all of the revenues under such lease as a single component in accordance with the new lease accounting standard. Conversely, if we determine that the nonlease component is the predominant component, we are required to account for all of the revenues under such lease as a single component in accordance with the revenue recognition accounting standard. Our operating leases for which we are the lessor qualified for the single component practical expedient accounting under the new lease accounting standard because the lease components in each of our leases were predominant. Upon adoption of the new lease standard, we classified all revenues recognized under the new lease accounting standard as income from rentals in our consolidated statements of income.
Income from rentals related to fixed rental payments under operating leases is recognized on a straight-line basis over the respective operating lease terms. Income from rentals related to variable payments includes contingent rental payments and tenant recoveries. Tenant recoveries, including reimbursements of utilities, repairs and maintenance, common area expenses, real estate taxes and insurance, and other operating expenses, are recognized as revenue in the period during which the applicable expenses are incurred and the tenant’s obligation to reimburse us arises. Income from rentals related to other variable payments is recognized when associated contingencies are removed.
15
|
2.
|
Summary of significant accounting policies (continued)
|
Income from rentals related to direct financing leases is recognized over the respective lease terms using the effective interest rate method. At lease commencement, we record an asset within other assets in our consolidated balance sheets, which represents our net investment in the direct financing lease. This initial net investment is determined by aggregating the total future lease payments attributable to the direct financing lease and the estimated residual value of the property less unearned income. Over the lease term, the investment in the direct financing lease is reduced and rental income is recognized as income from rentals in our consolidated statements of income and produces a constant periodic rate of return on the net investment in the direct financing lease.
We classify amounts expected to be received in later years as deferred rent in our consolidated balance sheets. Amounts received currently but recognized as revenue in future years are classified in accounts payable, accrued expenses, and tenant security deposits in our consolidated balance sheets. We commence recognition of income from rentals related to the operating leases at the date the property is ready for its intended use by the tenant and the tenant takes possession, or controls the physical use, of the leased asset.
Subsequent to lease commencement, for each of our leases, we assess collectibility from our tenants of future lease payments. If we determine that collectibility is probable, we recognize income from rentals based on the methodology described above. For our operating leases, if we determine that collectibility is not probable, we recognize an adjustment to lower our income from rentals rather than a bad debt expense. For our direct financing lease, if we determine that collectibility is not probable, we evaluate our net investment in the lease for impairment. Upon determination that an impairment has occurred, an impairment charge is recognized to reduce the carrying balance in the net investment in the lease to its estimated fair value. As of
March 31, 2019
, we assessed the collectibility of future lease payments under all our leases in which we are a lessor, and determined that collectibility was probable.
Reclassification of the prior year presentation of rental revenues and tenant recoveries
As described above, rental revenues and tenant recoveries related to our operating leases for which we are the lessor qualified for the single component practical expedient and were classified as income from rentals in our consolidated statements of income. Prior to the adoption of the new lease accounting standard, we classified rental revenues and tenant recoveries separately in our consolidated statements of income, in accordance with the guidance in effect prior to January 1, 2019. Upon adoption of the new lease accounting standard, our comparative income statements of prior years have been reclassified to conform to the new single component presentation of rental revenues and tenant recoveries, classified within income from rentals in our consolidated statements of income.
The table below provides a reconciliation of the prior period presentation of the income statement line items that were reclassified in our consolidated statements of income to conform to the current period presentation, pursuant to the adoption of the new lease accounting standard and election of the single component practical expedient (in thousands):
|
Three Months Ended March 31, 2018
|
||||
|
Rental revenues (presentation prior to January 1, 2019)
|
$
|
244,485
|
|
|
|
Tenant recoveries (presentation prior to January 1, 2019)
|
73,170
|
|
||
|
Income from rentals (presentation effective January 1, 2019)
|
$
|
317,655
|
|
|
Lessee accounting
Under the new lease accounting standard, lessees are required to apply a dual approach by classifying leases as either finance or operating leases based on the principle of whether the lease is effectively a financed purchase of the leased asset by the lessee. This classification will determine whether the lease expense is recognized based on an effective interest method or on a straight-line basis over the term of the lease, which corresponds to a similar evaluation performed by lessors. In addition to this classification, a lessee is also required to recognize a right-of-use asset and a lease liability for all leases regardless of their classification, whereas a lessor is not required to recognize a right-of-use asset and a lease liability for any operating leases.
Under the package of practical expedients that we elected upon adoption of the new lease accounting standard, all of our operating leases existing as of January 1, 2019, for which we are the lessee, continue to be classified as operating leases subsequent to the adoption of the new lease accounting standard. On January 1, 2019, we recognized a lease liability aggregating
$218.7 million
and a corresponding right-of-use asset, which represents our obligation for remaining future rental payments related to our operating leases existing as of January 1, 2019, for which we are the lessee. The right-of-use asset was classified in other assets, and the lease liability was classified in accounts payable, accrued expenses, and tenant security deposits in our consolidated balance sheets. The lease liability was calculated as the present value of the lease payments, aggregating
$590.3 million
, remaining as of the initial application date of January 1, 2019, under our ground and office lease agreements for which we are the lessee. The present value of the remaining lease payments was calculated for each operating lease using each respective remaining lease term and a corresponding estimated incremental borrowing rate, which is the interest rate that we estimate we would have to pay to borrow on a collateralized basis over a similar term for an amount equal to the lease payments.
16
|
2.
|
Summary of significant accounting policies (continued)
|
Recognition of revenue arising from contracts with customers
We recognize revenues associated with transactions arising from contracts with customers, excluding revenues subject to the new lease accounting standard discussed in the “Lease Accounting” section above, in accordance with the revenue recognition accounting standard. A customer is distinguished from a noncustomer by the nature of the goods or services that are transferred. Customers are provided with goods or services that are generated by a company’s ordinary output activities, whereas noncustomers are provided with nonfinancial assets that are outside of a company’s ordinary output activities.
We generally recognize revenue representing the transfer of goods and services to customers in an amount that reflects the consideration to which we expect to be entitled in the exchange. In order to determine the recognition of revenue from customer contracts, we use a five-step model to (i) identify the contract with the customer, (ii) identify the performance obligations in the contract, (iii) determine the transaction price, including variable consideration to the extent that it is probable that a significant future reversal will not occur, (iv) allocate the transaction price to the performance obligations in the contract, and (v) recognize revenue when (or as) we satisfy the performance obligation.
We identify contractual performance obligations and determine whether revenue should be recognized at a point in time or over time, based on when control of goods and services transfers to a customer. We consider whether we control the goods or services prior to the transfer to the customer in order to determine whether we should account for the arrangement as a principal or agent. If we determine that we control the goods or services provided to the customer, then we are the principal to the transaction, and we recognize the gross amount of consideration expected in the exchange. If we simply arrange but do not control the goods or services being transferred to the customer, then we are considered to be an agent to the transaction, and we recognize the net amount of consideration we are entitled to retain in the exchange.
Total revenues subject to the revenue recognition accounting standard for the
three months ended March 31, 2019
, include
$10.8 million
primarily related to short term parking revenues associated with long term lease agreements. These revenues are classified within income from rentals in our consolidated income statements. Short-term parking revenues do not qualify for the single lease component practical expedient, discussed in the “Lessor Accounting” subsection of the “Lease Accounting” section within this Note 2, due to the difference in the timing and pattern of transfer of our parking service obligations and associated lease components within the same lease agreement. We recognize short-term parking revenues in accordance with the revenue recognition accounting standard when the services are provided and the performance obligations are satisfied, which normally occurs at a point in time.
Monitoring of tenant credit quality
During the term of each lease, we monitor the credit quality and any related material changes of our tenants by (i) monitoring the credit rating of tenants that are rated by a nationally recognized credit rating agency, (ii) reviewing financial statements of the tenants that are publicly available or that are required to be delivered to us pursuant to the applicable lease, (iii) monitoring news reports regarding our tenants and their respective businesses, and (iv) monitoring the timeliness of lease payments.
Income taxes
We are organized and operate as a REIT pursuant to the Internal Revenue Code (the “Code”). Under the Code, a REIT that distributes at least
90%
of its REIT taxable income to its stockholders annually (excluding net capital gains) and meets certain other conditions is not subject to federal income tax on its distributed taxable income, but could be subject to certain federal, foreign, state, and local taxes. We distribute
100%
of our taxable income annually; therefore, a provision for federal income taxes is not required. In addition to our REIT returns, we file federal, foreign, state, and local tax returns for our subsidiaries. We file with jurisdictions located in the U.S., Canada, India, China, and other international locations. Our tax returns are subject to routine examination in various jurisdictions for the 2013 through 2017 calendar years.
Employee and non-employee share-based payments
We have implemented an entity-wide accounting policy to account for forfeitures of share-based awards granted to employees and non-employees when they occur. As a result of this policy, we recognize expense on share-based awards with time-based vesting conditions without reductions for an estimate of forfeitures. This accounting policy only applies to service condition awards. For performance condition awards, we continue to assess the probability that such conditions will be achieved. Expenses related to forfeited awards are reversed as forfeitures occur. In addition, all nonforfeitable dividends paid on share-based payment awards are initially classified in retained earnings and reclassified to compensation cost only if forfeitures of the underlying awards occur. Our employee and non-employee share-based awards are measured on the grant date and recognized over the required service period of the recipient.
17
|
2.
|
Summary of significant accounting policies (continued)
|
Hedge accounting
We utilize interest rate hedge agreements to manage a portion of our exposure to variable interest rates primarily associated with borrowings based on LIBOR. As a result, all of our interest rate hedge agreements are designated as cash flow hedges. At inception of a hedge agreement, we are required to perform an initial quantitative assessment to determine whether a hedge is highly effective in offsetting changes in cash flows associated with the hedged item. Subsequently, we may perform only a qualitative assessment, unless facts and circumstances change.
We determined that each our cash flow hedges were highly effective at inception and continue to be highly effective. Therefore, we record all changes (effective and ineffective components) in fair value of our hedges in accumulated other comprehensive income within total equity and reclassify them into earnings when the hedged item affects earnings.
In October 2018, the FASB issued an accounting standard that expands the list of U.S. benchmark interest rates permitted in the application of hedge accounting to include the overnight index swap rate based on the Secured Overnight Financing Rate (“SOFR”). The accounting standard became effective for us and was adopted on January 1, 2019. We have no hedges based on SOFR; therefore, the adoption of this accounting standard had no effect on our consolidated financial statements.
Joint venture distributions
We use the “nature of the distribution” approach to determine the classification within our statement of cash flows of cash distributions received from equity method investments, including unconsolidated joint ventures. Under this approach, distributions are classified based on the nature of the underlying activity that generated the cash distributions. If we lack the information necessary to apply this approach in the future, we will be required to apply the “cumulative earnings” approach as an accounting change on a retrospective basis. Under the cumulative earnings approach, distributions up to the amount of cumulative equity in earnings recognized are classified as cash inflows from operating activities, and those in excess of that amount are classified as cash inflows from investing activities.
Restricted cash
We present cash and cash equivalents separately from restricted cash within our consolidated balance sheets. We include restricted cash with cash and cash equivalents when reconciling the beginning of period and end of period total amounts shown in the consolidated statements of cash flows. We provide a reconciliation between the balance sheet and statement of cash flows, as required when the balance includes more than one line item for cash, cash equivalents, restricted cash, and restricted cash equivalents. We also provide a disclosure of the nature of the restrictions related to material restricted cash and restricted cash equivalents balances.
Recent accounting pronouncements
Allowance for credit losses
In June 2016, the FASB issued an accounting standard (further clarified with subsequently issued updates) that changes the impairment model for most financial instruments by requiring companies to recognize an allowance for expected losses, rather than incurred losses as required currently by the other-than-temporary impairment model. The accounting standard will apply to most financial assets measured at amortized cost and certain other instruments, including trade and other receivables, loans, held-to-maturity debt securities, net investments in leases arising from sales-type and direct financing leases, and off-balance-sheet credit exposures (i.e., loan commitments). This standard applies to net investments in leases resulting from sales-type or direct financing leases recognized by a lessor and does not apply to the receivables arising from operating leases, which are accounted for under the new lease accounting standard discussed in “Lease Accounting” section within Note 2 - Summary of Significant Accounting Policies.” The accounting standard is effective for reporting periods beginning after December 15, 2019, with early adoption permitted, and will be applied as a cumulative adjustment to retained earnings as of the effective date. As of
March 31, 2019
, we had one lease classified as a direct financing lease with a net investment balance aggregating
$39.3 million
which will be subject to this new guidance. We are currently assessing the potential effect the adoption of this accounting standard will have on our consolidated financial statements.
18
|
3.
|
Investments in real estate
|
Our consolidated investments in real estate, including real estate assets held for sale as described in Note 16, consisted of the following as of
March 31, 2019
, and
December 31, 2018
(in thousands):
|
March 31, 2019
|
December 31, 2018
|
|||||||
|
Rental properties:
|
||||||||
|
Land (related to rental properties)
|
$
|
1,737,610
|
|
$
|
1,625,349
|
|
||
|
Buildings and building improvements
|
10,473,469
|
|
9,986,635
|
|
||||
|
Other improvements
|
1,061,034
|
|
976,627
|
|
||||
|
Rental properties
|
13,272,113
|
|
12,588,611
|
|
||||
|
Development and redevelopment of new Class A properties:
|
||||||||
|
Development and redevelopment projects (under construction, marketing, or pre‑construction)
|
1,296,913
|
|
1,460,814
|
|
||||
|
Future development projects
|
181,859
|
|
98,802
|
|
||||
|
Gross investments in real estate
|
14,750,885
|
|
14,148,227
|
|
||||
|
Less: accumulated depreciation
|
(2,371,088
|
)
|
(2,263,797
|
)
|
||||
|
Net investments in real estate – North America
|
12,379,797
|
|
11,884,430
|
|
||||
|
Net investments in real estate – Asia
|
30,553
|
|
29,263
|
|
||||
|
Investments in real estate
|
$
|
12,410,350
|
|
$
|
11,913,693
|
|
||
Acquisitions
Our real estate asset acquisitions during the
three months ended March 31, 2019
, consisted of the following (dollars in thousands):
|
Square Footage
|
||||||||||||||||
|
Market
|
Number of Properties
|
Future Development
|
Operating With Future Development/Redevelopment
|
Operating
|
Purchase Price
|
|||||||||||
|
Greater Boston
|
—
|
175,000
|
|
—
|
|
—
|
|
$
|
81,100
|
|
||||||
|
San Francisco
|
4
|
—
|
|
—
|
|
247,770
|
|
239,450
|
|
|||||||
|
San Diego
|
2
|
—
|
|
53,220
|
|
—
|
|
23,250
|
|
|||||||
|
Other
|
4
|
—
|
|
75,864
|
|
—
|
|
39,150
|
|
|||||||
|
Three months ended March 31, 2019
|
10
|
175,000
|
|
129,084
|
|
247,770
|
|
$
|
382,950
|
|
(1)
|
|||||
|
(1)
|
Excludes
$65.0 million
paid in January 2019 for two properties at 10260 Campus Point Drive and 4161 Campus Point Court that we acquired in December 2018. Total purchase price was
$80.0 million
, of which
$15.0 million
was paid in December 2018.
|
We evaluated each acquisition to determine whether the integrated set of assets and activities acquired met the definition of a business. Acquisitions that do not meet the definition of a business are accounted for as asset acquisitions. An integrated set of assets and activities does not qualify as a business if substantially all of the fair value of the gross assets is concentrated in either a single identifiable asset or a group of similar identifiable assets, or if the acquired assets do not include a substantive process.
Based upon our evaluation of each acquisition, we determined that substantially all of the fair value related to each acquisition is concentrated in a single identifiable asset or a group of similar identifiable assets, or is associated with a land parcel with no operations. Accordingly, each transaction did not meet the definition of a business and consequently was accounted for as an asset acquisition. In each of these transactions, we allocated the total consideration for each acquisition to the individual assets and liabilities acquired on a relative fair value basis.
Sale of real estate asset
In February 2019, we completed a partial sale of a
60%
interest in 75/125 Binney Street, a Class A property in our Cambridge submarket aggregating
388,270
RSF, for a sales price of
$438 million
, or
$1,880
per RSF. We retained control over, and continue to consolidate, the new joint venture. We accounted for the
$202.2 million
difference between the consideration received and the book value of the 60% interest sold as an equity transaction with no gain recognized in earnings. Refer to Note 4 – “Consolidated and Unconsolidated Real Estate Joint Ventures” to these unaudited consolidated financial statements for additional information.
19
|
4.
|
Consolidated and unconsolidated real estate joint ventures
|
From time to time, we enter into joint venture agreements through which we own a partial interest in real estate entities that own, develop, and operate real estate properties. As of
March 31, 2019
, we had the following properties that were held by our real estate joint ventures:
|
Property
|
Market
|
Submarket
|
Our Ownership Interest
|
RSF
|
||||||||||
|
Consolidated joint ventures
(1)
:
|
||||||||||||||
|
75/125 Binney Street
|
Greater Boston
|
Cambridge
|
40.0
|
%
|
388,270
|
|
||||||||
|
225 Binney Street
|
Greater Boston
|
Cambridge
|
30.0
|
%
|
305,212
|
|
||||||||
|
409 and 499 Illinois Street
|
San Francisco
|
Mission Bay/SoMa
|
60.0
|
%
|
455,069
|
|
||||||||
|
1500 Owens Street
|
San Francisco
|
Mission Bay/SoMa
|
50.1
|
%
|
158,267
|
|
||||||||
|
Campus Pointe by Alexandria
(2)
|
San Diego
|
University Town Center
|
55.0
|
%
|
798,799
|
|
||||||||
|
9625 Towne Centre Drive
|
San Diego
|
University Town Center
|
50.1
|
%
|
163,648
|
|
||||||||
|
Unconsolidated joint ventures
(1)
:
|
||||||||||||||
|
Menlo Gateway
|
San Francisco
|
Greater Stanford
|
44.5
|
%
|
(3)
|
772,983
|
|
|||||||
|
1401/1413 Research Boulevard
|
Maryland
|
Rockville
|
65.0
|
%
|
(4)
|
(5
|
)
|
|||||||
|
704 Quince Orchard Road
|
Maryland
|
Gaithersburg
|
56.8
|
%
|
(4)
|
79,931
|
|
|||||||
|
1655 and 1725 Third Street
|
San Francisco
|
Mission Bay/SoMa
|
10.0
|
%
|
593,765
|
|
||||||||
|
(1)
|
In addition to the consolidated real estate joint ventures listed, various partners hold insignificant noncontrolling interests in
four
other joint ventures in North America, and we hold an insignificant noncontrolling interest in
one
unconsolidated real estate joint venture in North America.
|
|
(2)
|
Includes only 10290 and 10300 Campus Point Drive and 4110 Campus Point Court in our University Town Center submarket.
|
|
(3)
|
As of March 31, 2019
, we have a
44.5%
ownership interest in Menlo Gateway and expect our ownership to increase to
49%
through future funding of construction costs in 2019.
|
|
(4)
|
Represents our ownership interest; our voting interest is limited to 50%.
|
|
(5)
|
Joint venture with a distinguished retail real estate developer for the development of an approximate
90,000
RSF retail shopping center.
|
Our consolidation policy is fully described under the “Consolidation” section of Note 2 – “Summary of Significant Accounting Policies” to these unaudited consolidated financial statements. Consolidation accounting is highly technical, but its framework is primarily based on the controlling financial interests and benefits of the joint ventures. We generally consolidate a joint venture that is a legal entity that we control (i.e., we have the power to direct the activities of the joint venture that most significantly affect its economic performance) through contractual rights, regardless of our ownership interest, and where we determine that we have benefits through the allocation of earnings or losses and fees paid to us that could be significant to the joint venture (the “VIE model”). We also generally consolidate joint ventures when we have a controlling financial interest through voting rights and where our voting interest is greater than 50% (the “voting model”). Voting interest differs from ownership interest for some joint ventures. We account for joint ventures that do not meet the consolidation criteria under the equity method of accounting by recognizing our share of income and losses. The table below shows the categorization of our existing significant joint ventures under the consolidation framework:
|
Property
|
Consolidation Model
|
Voting Interest
|
Consolidation Analysis
|
Conclusion
|
||||
|
75/125 Binney Street
|
VIE model
|
Not applicable under VIE model
|
We have control and benefits that can be significant to the joint venture; therefore, we are the primary beneficiary of each VIE
|
Consolidated
|
||||
|
225 Binney Street
|
||||||||
|
409 and 499 Illinois Street
|
||||||||
|
1500 Owens Street
|
||||||||
|
Campus Pointe by Alexandria
|
||||||||
|
9625 Towne Centre Drive
|
||||||||
|
Menlo Gateway
|
We do not control the joint venture and are therefore not the primary beneficiary
|
Equity method of accounting
|
||||||
|
1401/1413 Research Boulevard
|
||||||||
|
704 Quince Orchard Road
|
Voting model
|
Does not exceed 50%
|
Our voting interest is 50% or less
|
|||||
|
1655 and 1725 Third Street
|
||||||||
20
4. Consolidated and unconsolidated real estate joint ventures (continued)
Consolidated VIEs’ balance sheet information
The table below aggregates the balance sheet information of our consolidated VIEs as of
March 31, 2019
, and
December 31, 2018
(in thousands):
|
March 31, 2019
|
December 31, 2018
|
|||||||
|
Investments in real estate
|
$
|
1,431,694
|
|
$
|
1,108,385
|
|
||
|
Cash and cash equivalents
|
50,291
|
|
42,178
|
|
||||
|
Other assets
|
133,148
|
|
74,901
|
|
||||
|
Total assets
|
$
|
1,615,133
|
|
$
|
1,225,464
|
|
||
|
Secured notes payable
|
$
|
—
|
|
$
|
—
|
|
||
|
Other liabilities
|
55,582
|
|
59,336
|
|
||||
|
Total liabilities
|
55,582
|
|
59,336
|
|
||||
|
Redeemable noncontrolling interests
|
977
|
|
874
|
|
||||
|
Alexandria Real Estate Equities, Inc.’s share of equity
|
782,417
|
|
624,349
|
|
||||
|
Noncontrolling interests’ share of equity
|
776,157
|
|
540,905
|
|
||||
|
Total liabilities and equity
|
$
|
1,615,133
|
|
$
|
1,225,464
|
|
||
In determining whether to aggregate the balance sheet information of our consolidated VIEs, we considered the similarity of each VIE, including the primary purpose of these entities to own, manage, operate, and lease real estate properties owned by the VIEs, and the similar nature of our involvement in each VIE as a managing member. Due to the similarity of the characteristics, we present the balance sheet information of these entities on an aggregated basis. For each of our consolidated VIEs, none of its assets have restrictions that limit their use to settle specific obligations of the VIE. There are no creditors or other partners of our consolidated VIEs that have recourse to our general credit. Our maximum exposure to our consolidated VIEs is limited to our variable interests in each VIE.
Unconsolidated real estate joint ventures
As of
March 31, 2019
, and
December 31, 2018
, our investments in unconsolidated real estate joint ventures accounted for under the equity method of accounting presented in our consolidated balance sheets consist of the following (in thousands):
|
Property
|
March 31, 2019
|
December 31, 2018
|
||||||
|
Menlo Gateway
|
$
|
239,000
|
|
$
|
186,504
|
|
||
|
1401/1413 Research Boulevard
|
7,936
|
|
8,197
|
|
||||
|
704 Quince Orchard Road
|
4,511
|
|
4,547
|
|
||||
|
1655 and 1725 Third Street
|
35,414
|
|
34,917
|
|
||||
|
Other
|
3,544
|
|
3,342
|
|
||||
|
$
|
290,405
|
|
$
|
237,507
|
|
|||
Our maximum exposure to our unconsolidated VIEs is limited to our investment in each VIE.
21
4. Consolidated and unconsolidated real estate joint ventures (continued)
As of
March 31, 2019
, our unconsolidated real estate joint ventures have the following non-recourse secured loans that include the following key terms (dollars in thousands):
|
Maturity Date
|
Stated Interest Rate
|
Interest Rate
(1)
|
100% at Joint Venture Level
|
||||||||||||||||
|
Unconsolidated Joint Venture
|
Our Share
|
Debt Balance
(2)
|
Remaining Commitments
|
||||||||||||||||
|
1401/1413 Research Boulevard
|
65.0%
|
5/17/20
|
L+2.50%
|
5.97%
|
$
|
22,364
|
|
$
|
6,315
|
|
|||||||||
|
1655 and 1725 Third Street
|
10.0%
|
6/29/21
|
L+3.70%
|
6.19%
|
204,830
|
|
170,170
|
|
|||||||||||
|
704 Quince Orchard Road
|
56.8%
|
3/16/23
|
L+1.95%
|
4.68%
|
6,020
|
|
8,833
|
|
|||||||||||
|
Menlo Gateway, Phase II
|
44.5%
|
5/1/35
|
4.53%
|
N/A
|
—
|
|
157,270
|
|
|||||||||||
|
Menlo Gateway, Phase I
|
44.5%
|
8/10/35
|
4.15%
|
4.18%
|
143,940
|
|
408
|
|
|||||||||||
|
$
|
377,154
|
|
$
|
342,996
|
|
||||||||||||||
|
(1)
|
Includes interest expense and amortization of loan fees for the
three months ended March 31, 2019
.
|
|
(2)
|
Represents outstanding principal, net of unamortized deferred financing costs,
as of March 31, 2019
.
|
|
5.
|
Leases
|
On January 1, 2019, we adopted a new lease accounting standard that sets out the principles for the recognition, measurement, presentation, and disclosure of leases for both parties to a lease agreement (i.e., lessees and lessors).
As a lessor, we are required to disclose, among other things, the following:
|
•
|
A description of the nature of leases, including terms for any variable payments, options to extend or terminate, and options to purchase the underlying asset;
|
|
•
|
Tabular presentation of undiscounted cash flows to be received over the next five years and thereafter separately for operating leases and direct financing leases;
|
|
•
|
The amount of lease income and its location on the statements of income;
|
|
•
|
Income classified separately for operating leases and direct financing leases; and
|
|
•
|
Our risk management strategy to mitigate declines in residual value of the leased assets.
|
As a lessee, we are required to disclose, among other things, the following:
|
•
|
A description of the nature of leases, including terms for any variable payments, options to extend or terminate, and options to purchase the underlying asset;
|
|
•
|
The amounts of lease liabilities and corresponding right-of-use assets and their respective locations in the balance sheet;
|
|
•
|
The weighted-average remaining lease term and weighted-average discount rate of leases;
|
|
•
|
Tabular presentation of undiscounted cash flows of our remaining lease payment obligations over the next five years and thereafter; and
|
|
•
|
Total lease costs, including cash paid, amounts expensed, and amounts capitalized.
|
Refer to the “Lease Accounting” section of Note 2 – “Summary of Significant Accounting Policies” for additional information.
Leases in which we are a lessor
As of
March 31, 2019
, we had
250
properties aggregating
23.2 million
operating RSF locate
d in key locations, including Greater Boston, San Francisco, New York City, San Diego, Seattle, Maryland, and Research Triangle. We focus on developing Class A properties in AAA innovation cluster locations, which we consider to be highly desirable for tenancy by life science and technology entities. Such locations are generally characterized by high barriers to entry for new landlords, high barriers to exit for tenants, and a limited supply of available space.
As of
March 31, 2019
, a
ll our leases in which we are a lessor were classified as operating leases with one exception of a direct financing lease. Our operating leases and direct financing lease are described below.
22
5. Leases (continued)
Operating leases
As of
March 31, 2019
, our
250
properties were subject to operating lease agreements.
Two
of these properties, representing
two
land parcels, are subject to lease agreements that each contain an option for the lessee to purchase the underlying asset from us at fair market value during each of the 30-day periods commencing on the dates that are
15 years
,
30 years
, and
74.5 years
after the rent commencement date of
October 1, 2017
. The remaining lease term related to each of the
two
land parcels is
73.7 years
. Our leases generally contain options to extend lease terms at prevailing market rates at the time of expiration and do not have options to early terminate. Lease payments to be received under the terms of our operating lease agreements, excluding expense reimbursements, in effect as of
March 31, 2019
, are outlined in the table below (in thousands):
|
Year
|
Amount
|
|||
|
2019
|
$
|
689,769
|
|
|
|
2020
|
947,419
|
|
||
|
2021
|
930,216
|
|
||
|
2022
|
891,279
|
|
||
|
2023
|
831,843
|
|
||
|
Thereafter
|
5,968,778
|
|
||
|
Total
|
$
|
10,259,304
|
|
|
Refer to Note 3 – “Investments in Real Estate” to these unaudited consolidated financial statements for additional information on our owned real estate assets, which are the underlying assets under our operating leases.
Direct financing lease
As of
March 31, 2019
, we have
one
direct financing lease agreement for a parking structure with a remaining lease term of
73.7 years
. The lessee has an option to purchase the underlying asset at fair market value during each of the 30-day periods commencing on the dates that are
15 years
,
30 years
, and
74.5 years
after the rent commencement date of
October 1, 2017
. The components of our net investment in our direct financing lease as of
March 31, 2019
and
December 31, 2018
, are summarized in the table below (in thousands):
|
March 31, 2019
|
December 31, 2018
|
||||||
|
Gross investment in direct financing lease
|
$
|
261,702
|
|
$
|
262,111
|
|
|
|
Less: unearned income
|
(222,361
|
)
|
(222,962
|
)
|
|||
|
Net investment in direct financing lease
|
$
|
39,341
|
|
$
|
39,149
|
|
|
Future lease payments to be received under our direct financing lease as of
March 31, 2019
, were as follows (in thousands):
|
Year
|
Total
|
|||
|
2019
|
$
|
1,246
|
|
|
|
2020
|
1,705
|
|
||
|
2021
|
1,756
|
|
||
|
2022
|
1,809
|
|
||
|
2023
|
1,863
|
|
||
|
Thereafter
|
253,323
|
|
||
|
Total
|
$
|
261,702
|
|
|
23
5. Leases (continued)
Income from rentals
Our total income from rentals includes revenue related to agreements for rental of our investments in real estate, which primarily includes revenues subject to the guidance of the new lease accounting standard, as well as revenues subject to the revenue recognition accounting standard as summarized below (in thousands):
|
Three Months Ended March 31, 2019
|
||||
|
Income from rentals:
|
||||
|
Revenues subject to the new lease accounting standard:
|
||||
|
Operating leases
|
$
|
343,339
|
|
|
|
Direct financing leases
|
601
|
|
||
|
Revenues subject to the new lease accounting standard
|
343,940
|
|
||
|
Revenues subject to the revenue recognition accounting standard
|
10,809
|
|
||
|
Income from rentals
|
$
|
354,749
|
|
|
Our revenues that are subject to the revenue recognition accounting standard relate primarily to parking revenues, which consist of short-term rental revenues that are not considered lease revenue under the new lease accounting standard. Refer to the “Revenue” and “Recognition of revenue arising from contracts with customers” sections of Note 2 for additional information.
Residual value risk management strategy
Our leases do not have guarantees of residual value on the underlying assets. We manage risk associated with the residual value of our leased assets by (i) evaluating each potential acquisition of real estate to determine whether it meets our business objective to primarily invest in high-demand markets with limited supply of available space, (ii) directly managing our leased properties, and (iii) carefully selecting our tenants and monitoring their credit quality throughout their respective lease terms. Upon the expiration or termination of a lease, we often have the ability to renew the space with an existing tenant or re-lease to a new tenant within a reasonable amount of time.
Leases in which we are a lessee
We have operating lease agreements for which we are the lessee consisting of ground and office leases. Certain of these leases have options to extend or terminate the contract terms upon meeting certain criteria. There are no notable restrictions or covenants imposed by the leases, nor guarantees of residual value.
Under the new lease accounting standard, we are required to recognize a right-of-use asset and a related liability to account for our future obligations under our ground and office lease arrangements for which we are the lessee. At the lease commencement date or at the acquisition date, if lease is acquired as part of our real estate acquisition, the lease liability is measured based on the present value of the future lease payments and the right-of-use asset is measured based on the corresponding lease liability, adjusted for the initial direct leasing cost and any other consideration exchanged with the landlord prior to the commencement of the lease, as well as, adjustments to reflect favorable or unfavorable terms of the lease when compared with market terms. Subsequently, the lease liability is accreted by applying a discount rate established at the lease commencement date to the lease liability balance as of the beginning of the period, and is reduced by the payments made during the period. The right-of-use asset is amortized on a straight-line basis during the lease term.
As of January 1, 2019, the present value of the remaining contractual payments, aggregating
$590.3 million
, under our operating lease agreements, including our extension options that we are reasonably certain to exercise, was
$218.7 million
. The present value of the remaining lease payments was calculated for each operating lease using each respective remaining lease term and a corresponding estimated incremental borrowing rate as of January 1, 2019, which is the interest rate that we estimate we would have to pay to borrow on a collateralized basis over a similar term for an amount equal to the lease payments. On January 1, 2019, we recognized a lease liability along with a corresponding right-of-use asset.
As of
March 31, 2019
, the present value of the remaining contractual payments, aggregating
$657.0 million
, under our operating lease agreements, including our extension options that we are reasonably certain to exercise, was
$244.6 million
. Our corresponding operating lease right-of-use assets, adjusted for initial direct leasing costs and other consideration exchanged with the landlord prior to the commencement of the lease, aggregated
$238.4 million
. As of
March 31, 2019
, the weighted-average remaining lease term of our operating leases for which we are a lessee was approximately
45 years
, and the weighted-average discount rate was
5.37%
.
24
5. Leases (continued)
Ground lease obligations as of
March 31, 2019
, included leases for
30
of our properties, which accounted for approximately
12%
of our total number of properties. Excluding
one
ground lease that expires in
2036
related to
one
operating property with a net book value of
$8.2 million
as of
March 31, 2019
, our ground lease obligations have remaining lease terms ranging from approximately
35 years
to
96 years
, including extension options which we are reasonably certain to exercise.
The reconciliation of future lease payments, under non-cancelable operating ground and office leases for which we are a lessee, to the operating lease liability reflected in our consolidated balance sheet as of
March 31, 2019
, is presented in the table below (in thousands):
|
Year
|
Total
|
|||
|
2019
|
$
|
11,859
|
|
|
|
2020
|
14,208
|
|
||
|
2021
|
14,257
|
|
||
|
2022
|
14,390
|
|
||
|
2023
|
14,508
|
|
||
|
Thereafter
|
587,787
|
|
||
|
Total future payments under our operating leases for which we are a lessee
|
657,009
|
|
||
|
Effect of discounting
|
(412,408
|
)
|
||
|
Operating lease liability
|
$
|
244,601
|
|
|
Lessee operating costs
Operating lease costs represent amounts recognized, either expensed or capitalized, related to ground leases and leases for corporate office space in which we are the lessee. For the
three months ended March 31, 2019
and
2018
, our costs for operating leases in which we are the lessee were as follows (in thousands):
|
Three Months Ended March 31,
|
||||||||
|
2019
|
2018
|
|||||||
|
Gross operating lease costs
|
$
|
4,554
|
|
$
|
3,868
|
|
||
|
Capitalized lease costs
|
(62
|
)
|
(36
|
)
|
||||
|
Expenses for operating leases in which we are the lessee
|
$
|
4,492
|
|
$
|
3,832
|
|
||
For the three months ended
March 31, 2019
and
2018
, amounts paid and classified as operating activities in our consolidated statements of cash flows for leases in which we are the lessee, were
$4.4 million
and
$3.6 million
, respectively.
|
6.
|
Cash, cash equivalents, and restricted cash
|
Cash, cash equivalents, and restricted cash consisted of the following as of
March 31, 2019
, and
December 31, 2018
(in thousands):
|
|
March 31, 2019
|
December 31, 2018
|
|||||
|
Cash and cash equivalents
|
$
|
261,372
|
|
$
|
234,181
|
|
|
|
Restricted cash:
|
|||||||
|
Funds held in trust under the terms of certain secured notes payable
|
25,378
|
|
22,681
|
|
|||
|
Funds held in escrow related to construction projects and investing activities
|
25,142
|
|
10,558
|
|
|||
|
Other
|
3,913
|
|
4,710
|
|
|||
|
54,433
|
|
37,949
|
|
||||
|
Total
|
$
|
315,805
|
|
$
|
272,130
|
|
|
25
|
7.
|
Investments
|
We hold investments in publicly traded companies and privately held entities primarily involved in the life science and technology industries. Investments in publicly traded companies are classified as investments with readily determinable fair values, and are carried at fair value, with changes in fair value classified in net income. Our investments in privately held entities consist of (i) investments that report NAV, such as our privately held investments in limited partnerships, which are carried at fair value using NAV as a practical expedient with changes in fair value classified in net income, and (ii) investments in privately held entities that do not report NAV, which are measured at cost, adjusted for observable price changes and impairments, with changes recognized in net income.
Effective January 1, 2018:
|
•
|
Investments in publicly traded companies are presented at fair value in our consolidated balance sheet, with changes in fair value recognized in net income.
|
|
•
|
Investments in privately held entities without readily determinable fair values previously accounted for under the cost method are accounted for as follows:
|
|
•
|
Investments in privately held entities that report NAV are presented at fair value using NAV as a practical expedient, with changes in fair value recognized in net income. We use NAV reported by limited partnerships without adjustment, unless we are aware of information indicating that the NAV reported by a limited partnership does not accurately reflect the fair value of the investment at our reporting date.
|
|
•
|
Investments in privately held entities that do not report NAV are carried at cost, adjusted for observable price changes and impairments, with changes recognized in net income. These investments continue to be evaluated on the basis of a qualitative assessment for indicators of impairment by utilizing the same monitoring criteria described above and monitoring the presence of the following impairment indicators: (i) a significant deterioration in the earnings performance, credit rating, asset quality, or business prospects of the investee; (ii) a significant adverse change in the regulatory, economic, or technological environment of the investee, (iii) a significant adverse change in the general market condition of either the geographical area or the industry in which the investee operates, (iv) significant concerns about the investee’s ability to continue as a going concern. If such indicators are present, we are required to estimate the investment’s fair value and immediately recognize an impairment loss, without consideration as to whether the impairment is other-than-temporary, in an amount equal to the investment’s carrying value in excess of its estimated fair value.
|
|
•
|
Investments in privately held entities continue to require accounting under the equity method unless our interest in the entity is deemed to be so minor that we have virtually no influence over the entity’s operating and financial policies. Under the equity method of accounting, we initially recognize our investment at cost and adjust the carrying amount of the investment to recognize our share of the earnings or losses of the investee subsequent to the date of our investment. We had no investments accounted for under the equity method
as of March 31, 2019
.
|
We classify unrealized and realized gains and losses on our equity investments within investment income in our consolidated statements of income.
Unrealized gains and losses represent (i) changes in fair value for investments in publicly traded companies, (ii) changes in NAV, as a practical expedient to estimate fair value, for investments in privately held entities that report NAV, and (iii) observable price changes on our investments in privately held entities that do not report NAV. An observable price is a price observed in an orderly transaction for an identical or similar investment of the same issuer. Observable price changes result from, among other things, equity transactions for the same issuer executed during the reporting period, including subsequent equity offerings or other reported equity transactions related to the same issuer. For these transactions to be considered observable price changes, we evaluate whether these transactions have similar rights and obligations, including voting rights, distribution preferences, conversion rights, and other factors, to the investments we hold.
Realized gains and losses represent the difference between proceeds received upon disposition of investments and their historical or adjusted cost. Impairments are realized losses, which result in an adjusted cost, and represent charges to reduce the carrying values of investments in privately held entities that do not report NAV to their estimated fair value.
26
|
7.
|
Investments (continued)
|
The following tables summarize our investments as of
March 31, 2019
, and
December 31, 2018
(in thousands):
|
March 31, 2019
|
|||||||||||
|
Cost
|
Adjustments
|
Carrying Amount
|
|||||||||
|
Investments:
|
|||||||||||
|
Publicly traded companies
|
$
|
127,760
|
|
$
|
97,194
|
|
$
|
224,954
|
|
||
|
Entities that report NAV
|
223,986
|
|
145,616
|
|
369,602
|
|
|||||
|
Entities that do not report NAV:
|
|||||||||||
|
Entities with observable price changes
|
42,865
|
|
69,551
|
|
112,416
|
|
|||||
|
Entities without observable price changes
|
293,932
|
|
—
|
|
293,932
|
|
|||||
|
Total investments
|
$
|
688,543
|
|
$
|
312,361
|
|
$
|
1,000,904
|
|
||
|
December 31, 2018
|
|||||||||||
|
Cost
|
Adjustments
|
Carrying Amount
|
|||||||||
|
Investments:
|
|||||||||||
|
Publicly traded companies
|
$
|
121,121
|
|
$
|
62,884
|
|
$
|
184,005
|
|
||
|
Entities that report NAV
|
204,646
|
|
113,159
|
|
317,805
|
|
|||||
|
Entities that do not report NAV:
|
|||||||||||
|
Entities with observable price changes
|
39,421
|
|
64,112
|
|
103,533
|
|
|||||
|
Entities without observable price changes
|
286,921
|
|
—
|
|
286,921
|
|
|||||
|
Total investments
|
$
|
652,109
|
|
$
|
240,155
|
|
$
|
892,264
|
|
||
Cumulative adjustments recognized on investments in privately held entities that do not report NAV held
as of March 31, 2019
, aggregated
$69.6 million
, which consisted of upward adjustments representing unrealized gains of
$69.8 million
and downward adjustments representing unrealized losses of
$247 thousand
.
Adjustments recognized on investments in privately held entities that do not report NAV aggregated
$5.4 million
during the
three months ended March 31, 2019
, which consisted of upward adjustments representing unrealized gains of
$5.5 million
and downward adjustments representing unrealized losses of
$47 thousand
.
Our income from investments during the
three months ended March 31, 2019
, consisted of the following (in thousands):
|
Three Months Ended March 31, 2019
|
||||||||||||
|
Unrealized Gains
|
Realized Gains
|
Total
|
||||||||||
|
Investments held at March 31, 2019:
|
||||||||||||
|
Publicly traded companies
|
$
|
43,654
|
|
$
|
—
|
|
$
|
43,654
|
|
|||
|
Entities that report NAV
|
32,429
|
|
—
|
|
32,429
|
|
||||||
|
Entities that do not report NAV, held at period end
|
5,440
|
|
—
|
|
5,440
|
|
||||||
|
Total investments held at March 31, 2019
|
81,523
|
|
—
|
|
81,523
|
|
||||||
|
Investment dispositions during the three months ended March 31, 2019:
|
||||||||||||
|
Recognized in the current period
|
—
|
|
2,033
|
|
2,033
|
|
||||||
|
Previously recognized gains
|
(9,317
|
)
|
9,317
|
|
—
|
|
||||||
|
Total investment dispositions during the three months ended March 31, 2019
|
(9,317
|
)
|
11,350
|
|
2,033
|
|
||||||
|
Investment income
|
$
|
72,206
|
|
$
|
11,350
|
|
$
|
83,556
|
|
|||
27
|
7.
|
Investments (continued)
|
Our investment income for the
three months ended March 31, 2018
, consisted of the following (in thousands):
|
Three Months Ended March 31, 2018
|
||||||||||||
|
Unrealized Gains
|
Realized Gains
|
Total
|
||||||||||
|
Investments held at March 31, 2018:
|
||||||||||||
|
Publicly traded companies
|
$
|
50,888
|
|
$
|
—
|
|
$
|
50,888
|
|
|||
|
Entities that report NAV
|
15,087
|
|
—
|
|
15,087
|
|
||||||
|
Entities that do not report NAV, held at period end
|
11,043
|
|
—
|
|
11,043
|
|
||||||
|
Total investments held at March 31, 2018
|
77,018
|
|
—
|
|
77,018
|
|
||||||
|
Investment dispositions during the three months ended March 31, 2018:
|
||||||||||||
|
Recognized in the current period
|
—
|
|
8,543
|
|
8,543
|
|
||||||
|
Previously recognized gains
|
(4,789
|
)
|
4,789
|
|
—
|
|
||||||
|
Total investment dispositions during the three months ended March 31, 2018
|
(4,789
|
)
|
13,332
|
|
8,543
|
|
||||||
|
Investment income
|
$
|
72,229
|
|
$
|
13,332
|
|
$
|
85,561
|
|
|||
Investments in privately held entities that report NAV
Investments in privately held entities that report NAV consist primarily of investments in limited partnerships. We are committed to funding approximately
$233.8 million
for all investments, primarily consisting of
$233.3 million
related to investments in limited partnerships. Our funding commitments expire at various dates over the next
11 years
, with a weighted-average expiration of
8.7 years
.
These investments are not redeemable by us, but we normally receive distributions from these investments throughout their term. Our investments in privately held entities that report NAV generally have expected initial terms in excess of
10
years. The weighted-average remaining term during which these investments are expected to be liquidated was
8.6 years
as of March 31, 2019
.
28
|
8.
|
Other assets
|
The following table summarizes the components of other assets as of
March 31, 2019
, and
December 31, 2018
(in thousands):
|
March 31, 2019
|
December 31, 2018
|
||||||
|
Acquired below-market ground leases
|
$
|
—
|
|
(1)
|
$
|
17,434
|
|
|
Acquired in-place leases
|
157,194
|
|
132,906
|
|
|||
|
Deferred compensation plan
|
19,124
|
|
19,238
|
|
|||
|
Deferred financing costs – $2.2 billion unsecured senior line of credit
|
15,271
|
|
16,060
|
|
|||
|
Deposits
|
12,524
|
|
12,974
|
|
|||
|
Furniture, fixtures, and equipment
|
15,893
|
|
14,787
|
|
|||
|
Interest rate hedge assets
|
494
|
|
2,606
|
|
|||
|
Net investment in direct financing lease
|
39,341
|
|
39,149
|
|
|||
|
Notes receivable
|
506
|
|
528
|
|
|||
|
Operating lease right-of-use asset
(2)
|
238,433
|
|
—
|
|
|||
|
Other assets
|
19,735
|
|
19,861
|
|
|||
|
Prepaid expenses
|
23,012
|
|
13,690
|
|
|||
|
Property, plant, and equipment
|
112,199
|
|
81,024
|
|
|||
|
Total
|
$
|
653,726
|
|
$
|
370,257
|
|
|
|
(1)
|
Upon the adoption of new lease accounting standards on January 1, 2019, this amount has been included in the calculation of our operating lease right-of-use asset.
|
|
(2)
|
Refer to Note 2 – “Summary of Significant Accounting Policies” and Note 5 – “Leases” to these unaudited consolidated financial statements for additional information.
|
29
|
9.
|
Fair value measurements
|
We provide fair value information about all financial instruments for which it is practicable to estimate fair value. We measure and disclose the estimated fair value of financial assets and liabilities by utilizing a fair value hierarchy that distinguishes between data obtained from sources independent of the reporting entity and the reporting entity’s own assumptions about market participant assumptions. This hierarchy consists of three broad levels, as follows: (i) quoted prices in active markets for identical assets or liabilities (Level 1), (ii) significant other observable inputs (Level 2), and (iii) significant unobservable inputs (Level 3). Significant other observable inputs can include quoted prices for similar assets or liabilities in active markets, as well as inputs that are observable for the asset or liability, such as interest rates, foreign exchange rates, and yield curves. Significant unobservable inputs are typically based on an entity’s own assumptions, since there is little, if any, related market activity. In instances in which the determination of the fair value measurement is based on inputs from different levels of the fair value hierarchy, the level in the fair value hierarchy within which the entire fair value measurement falls is based on the lowest level of input that is significant to the fair value measurement in its entirety. Our assessment of the significance of a particular input to the fair value measurement in its entirety requires judgment and considers factors specific to the asset or liability. There were
no
transfers between the levels in the fair value hierarchy during the
three months ended March 31, 2019
.
The following tables set forth the assets and liabilities that we measure at fair value on a recurring basis by level within the fair value hierarchy as of
March 31, 2019
, and
December 31, 2018
(in thousands):
|
March 31, 2019
|
||||||||||||||||
|
Description
|
Total
|
Quoted Prices in
Active Markets
for Identical
Assets
(Level 1)
|
Significant
Other
Observable
Inputs
(Level 2)
|
Significant
Unobservable
Inputs
(Level 3)
|
||||||||||||
|
Assets:
|
||||||||||||||||
|
Investments in publicly traded companies
|
$
|
224,954
|
|
$
|
224,954
|
|
$
|
—
|
|
$
|
—
|
|
||||
|
Interest rate hedge agreements
|
$
|
494
|
|
$
|
—
|
|
$
|
494
|
|
$
|
—
|
|
||||
|
Liabilities:
|
||||||||||||||||
|
Interest rate hedge agreements
|
$
|
1,143
|
|
$
|
—
|
|
$
|
1,143
|
|
$
|
—
|
|
||||
|
December 31, 2018
|
||||||||||||||||
|
Description
|
Total
|
Quoted Prices in
Active Markets for Identical Assets (Level 1) |
Significant
Other Observable Inputs (Level 2) |
Significant
Unobservable Inputs (Level 3) |
||||||||||||
|
Assets:
|
||||||||||||||||
|
Investments in publicly traded companies
|
$
|
184,005
|
|
$
|
184,005
|
|
$
|
—
|
|
$
|
—
|
|
||||
|
Interest rate hedge agreements
|
$
|
2,606
|
|
$
|
—
|
|
$
|
2,606
|
|
$
|
—
|
|
||||
|
Liabilities:
|
||||||||||||||||
|
Interest rate hedge agreements
|
$
|
768
|
|
$
|
—
|
|
$
|
768
|
|
$
|
—
|
|
||||
Our investments in publicly traded companies have been recognized at fair value. Investments in privately held entities are excluded from the fair value hierarchy above as required by the fair value standards. Refer to Note 7 – “Investments” to these unaudited consolidated financial statements for further details.
Our interest rate hedge agreements have been recognized at fair value. Refer to Note 11 – “Interest Rate Hedge Agreements” to these unaudited consolidated financial statements for further details. The carrying values of cash and cash equivalents, restricted cash, tenant receivables, other assets, accounts payable, accrued expenses, and tenant security deposits approximate fair value.
The fair values of our secured notes payable, unsecured senior notes payable, $2.2 billion unsecured senior line of credit, and unsecured senior bank term loan were estimated using widely accepted valuation techniques, including discounted cash flow analyses using significant other observable inputs such as available market information on discount and borrowing rates with similar terms, maturities, and credit ratings. Because the valuations of our financial instruments are based on these types of estimates, the actual fair value of our financial instruments may differ materially if our estimates do not prove to be accurate. Additionally, the use of different market assumptions or estimation methods may have a material effect on the estimated fair value amounts.
30
|
9.
|
Fair value measurements (continued)
|
As of
March 31, 2019
, and
December 31, 2018
, the book and estimated fair values of our investments in privately held entities that report NAV, secured notes payable, unsecured senior notes payable, $2.2 billion unsecured senior line of credit, and unsecured senior bank term loan were as follows (in thousands):
|
|
March 31, 2019
|
|
December 31, 2018
|
||||||||||||
|
|
Book Value
|
|
Fair Value
|
|
Book Value
|
|
Fair Value
|
||||||||
|
Assets:
|
|
|
|
|
|
|
|
|
|
|
|
||||
|
Investments in privately held entities that report NAV
|
$
|
369,602
|
|
$
|
369,602
|
|
$
|
317,805
|
|
$
|
317,805
|
|
|||
|
|
|
|
|
|
|
|
|
|
|
|
|
||||
|
Liabilities:
|
|
|
|
|
|
|
|
|
|
|
|
||||
|
Secured notes payable
|
$
|
356,461
|
|
$
|
360,808
|
|
$
|
630,547
|
|
$
|
638,860
|
|
|||
|
Unsecured senior notes payable
|
$
|
5,139,500
|
|
$
|
5,331,153
|
|
$
|
4,292,293
|
|
$
|
4,288,335
|
|
|||
|
$2.2 billion unsecured senior line of credit
|
$
|
—
|
|
$
|
—
|
|
$
|
208,000
|
|
$
|
208,106
|
|
|||
|
Unsecured senior bank term loan
|
$
|
347,542
|
|
$
|
349,983
|
|
$
|
347,415
|
|
$
|
350,240
|
|
|||
Nonrecurring fair value measurements
Refer to Note 7 – “Investments” and Note 16 – “Assets Classified as Held for Sale” to these unaudited consolidated financial statements for further discussion.
|
10.
|
Secured and unsecured senior debt
|
The following table summarizes our secured and unsecured senior debt as of
March 31, 2019
(dollars in thousands):
|
Fixed-Rate/Hedged
Variable-Rate Debt
|
Unhedged
Variable-Rate Debt
|
Weighted-Average
|
|||||||||||||||||
|
Interest
|
Remaining Term
(in years)
|
||||||||||||||||||
|
Total
|
Percentage
|
Rate
(1)
|
|||||||||||||||||
|
Secured notes payable
|
$
|
356,461
|
|
$
|
—
|
|
$
|
356,461
|
|
6.1
|
%
|
3.58
|
%
|
4.8
|
|||||
|
Unsecured senior notes payable
|
5,139,500
|
|
—
|
|
5,139,500
|
|
88.0
|
|
4.16
|
|
7.5
|
||||||||
|
$2.2 billion unsecured senior line of credit
|
—
|
|
—
|
|
—
|
|
—
|
|
N/A
|
|
4.8
|
||||||||
|
Unsecured senior bank term loan
|
347,542
|
|
—
|
|
347,542
|
|
5.9
|
|
3.62
|
|
4.8
|
||||||||
|
Total/weighted average
|
$
|
5,843,503
|
|
$
|
—
|
|
$
|
5,843,503
|
|
100.0
|
%
|
4.09
|
%
|
7.2
|
|||||
|
Percentage of total debt
|
100
|
%
|
—
|
|
100
|
%
|
|||||||||||||
|
(1)
|
Represents the weighted-average interest rate as of the end of the applicable period, including expense/income related to our interest rate hedge agreements, amortization of loan fees, amortization of debt premiums (discounts), and other bank fees.
|
31
|
10.
|
Secured and unsecured senior debt (continued)
|
The following table summarizes our outstanding indebtedness and respective principal payments as of
March 31, 2019
(dollars in thousands):
|
Stated
Rate
|
Interest Rate
(1)
|
Maturity Date
(2)
|
Principal Payments Remaining for the Periods Ending December 31,
|
Unamortized (Deferred Financing Cost), (Discount) Premium
|
|||||||||||||||||||||||||||||||||||||||||
|
Debt
|
2019
|
2020
|
2021
|
2022
|
2023
|
Thereafter
|
Principal
|
Total
|
|||||||||||||||||||||||||||||||||||||
|
Secured notes payable
|
|||||||||||||||||||||||||||||||||||||||||||||
|
San Diego
|
4.66
|
%
|
4.90
|
%
|
1/1/23
|
$
|
1,266
|
|
$
|
1,763
|
|
$
|
1,852
|
|
$
|
1,942
|
|
$
|
26,259
|
|
$
|
—
|
|
$
|
33,082
|
|
$
|
(247
|
)
|
$
|
32,835
|
|
|||||||||||||
|
Greater Boston
|
3.93
|
%
|
3.19
|
|
3/10/23
|
1,135
|
|
1,566
|
|
1,628
|
|
1,693
|
|
74,517
|
|
—
|
|
80,539
|
|
2,170
|
|
82,709
|
|
||||||||||||||||||||||
|
Greater Boston
|
4.82
|
%
|
3.40
|
|
2/6/24
|
2,291
|
|
3,206
|
|
3,395
|
|
3,564
|
|
3,742
|
|
183,527
|
|
199,725
|
|
12,939
|
|
212,664
|
|
||||||||||||||||||||||
|
San Francisco
|
4.14
|
%
|
4.42
|
|
7/1/26
|
—
|
|
—
|
|
—
|
|
—
|
|
—
|
|
28,200
|
|
28,200
|
|
(698
|
)
|
27,502
|
|
||||||||||||||||||||||
|
San Francisco
|
6.50
|
%
|
6.50
|
|
7/1/36
|
23
|
|
25
|
|
26
|
|
28
|
|
30
|
|
619
|
|
751
|
|
—
|
|
751
|
|
||||||||||||||||||||||
|
Secured debt weighted-average interest rate/subtotal
|
4.55
|
%
|
3.58
|
|
4,715
|
|
6,560
|
|
6,901
|
|
7,227
|
|
104,548
|
|
212,346
|
|
342,297
|
|
14,164
|
|
356,461
|
|
|||||||||||||||||||||||
|
$2.2 billion unsecured senior line of credit
|
L+0.825
|
%
|
N/A
|
|
1/28/24
|
—
|
|
—
|
|
—
|
|
—
|
|
—
|
|
—
|
|
—
|
|
—
|
|
—
|
|
||||||||||||||||||||||
|
Unsecured senior bank term loan
|
L+0.90
|
%
|
3.62
|
|
1/28/24
|
—
|
|
—
|
|
—
|
|
—
|
|
—
|
|
350,000
|
|
350,000
|
|
(2,458
|
)
|
347,542
|
|
||||||||||||||||||||||
|
Unsecured senior notes payable
|
2.75
|
%
|
2.96
|
|
1/15/20
|
—
|
|
400,000
|
|
—
|
|
—
|
|
—
|
|
—
|
|
400,000
|
|
(649
|
)
|
399,351
|
|
||||||||||||||||||||||
|
Unsecured senior notes payable
|
4.60
|
%
|
4.75
|
|
4/1/22
|
—
|
|
—
|
|
—
|
|
550,000
|
|
—
|
|
—
|
|
550,000
|
|
(1,953
|
)
|
548,047
|
|
||||||||||||||||||||||
|
Unsecured senior notes payable
|
3.90
|
%
|
4.04
|
|
6/15/23
|
—
|
|
—
|
|
—
|
|
—
|
|
500,000
|
|
—
|
|
500,000
|
|
(2,507
|
)
|
497,493
|
|
||||||||||||||||||||||
|
Unsecured senior notes payable – green bonds
|
4.00
|
%
|
4.03
|
|
1/15/24
|
—
|
|
—
|
|
—
|
|
—
|
|
—
|
|
650,000
|
|
650,000
|
|
(711
|
)
|
649,289
|
|
||||||||||||||||||||||
|
Unsecured senior notes payable
|
3.45
|
%
|
3.62
|
|
4/30/25
|
—
|
|
—
|
|
—
|
|
—
|
|
—
|
|
600,000
|
|
600,000
|
|
(5,312
|
)
|
594,688
|
|
||||||||||||||||||||||
|
Unsecured senior notes payable
|
4.30
|
%
|
4.50
|
|
1/15/26
|
—
|
|
—
|
|
—
|
|
—
|
|
—
|
|
300,000
|
|
300,000
|
|
(3,296
|
)
|
296,704
|
|
||||||||||||||||||||||
|
Unsecured senior notes payable – green bonds
|
3.80
|
%
|
3.96
|
|
4/15/26
|
—
|
|
—
|
|
—
|
|
—
|
|
—
|
|
350,000
|
|
350,000
|
|
(3,441
|
)
|
346,559
|
|
||||||||||||||||||||||
|
Unsecured senior notes payable
|
3.95
|
%
|
4.13
|
|
1/15/27
|
—
|
|
—
|
|
—
|
|
—
|
|
—
|
|
350,000
|
|
350,000
|
|
(3,917
|
)
|
346,083
|
|
||||||||||||||||||||||
|
Unsecured senior notes payable
|
3.95
|
%
|
4.07
|
|
1/15/28
|
—
|
|
—
|
|
—
|
|
—
|
|
—
|
|
425,000
|
|
425,000
|
|
(3,714
|
)
|
421,286
|
|
||||||||||||||||||||||
|
Unsecured senior notes payable
|
4.50
|
%
|
4.60
|
|
7/30/29
|
—
|
|
—
|
|
—
|
|
—
|
|
—
|
|
300,000
|
|
300,000
|
|
(2,290
|
)
|
297,710
|
|
||||||||||||||||||||||
|
Unsecured senior notes payable
|
4.70
|
%
|
4.81
|
|
7/1/30
|
—
|
|
—
|
|
—
|
|
—
|
|
—
|
|
450,000
|
|
450,000
|
|
(4,178
|
)
|
445,822
|
|
||||||||||||||||||||||
|
Unsecured senior notes payable
|
4.85
|
%
|
4.93
|
|
4/15/49
|
—
|
|
—
|
|
—
|
|
—
|
|
—
|
|
300,000
|
|
300,000
|
|
(3,532
|
)
|
296,468
|
|
||||||||||||||||||||||
|
Unsecured debt weighted average/subtotal
|
4.13
|
|
—
|
|
400,000
|
|
—
|
|
550,000
|
|
500,000
|
|
4,075,000
|
|
5,525,000
|
|
(37,958
|
)
|
5,487,042
|
|
|||||||||||||||||||||||||
|
Weighted-average interest rate/total
|
4.09
|
%
|
$
|
4,715
|
|
$
|
406,560
|
|
$
|
6,901
|
|
$
|
557,227
|
|
$
|
604,548
|
|
$
|
4,287,346
|
|
$
|
5,867,297
|
|
$
|
(23,794
|
)
|
$
|
5,843,503
|
|
||||||||||||||||
|
(1)
|
Represents the weighted-average interest rate as of the end of the applicable period, including expense/income related to our interest rate hedge agreements, amortization of loan fees, amortization of debt premiums (discounts), and other bank fees.
|
|
(2)
|
Reflects any extension options that we control.
|
32
|
10.
|
Secured and unsecured senior debt (continued)
|
4.85%, 3.80%, and 4.00% Unsecured senior notes payables
In March 2019, we completed an offering of
$850.0 million
of unsecured senior notes for net proceeds of
$846.1 million
. The unsecured senior notes consisted of
$300.0 million
of
4.85%
unsecured senior notes payable on
April 15, 2049
(“4.85% Unsecured Senior Notes”);
$350.0 million
of
3.80%
unsecured senior notes payable on
April 15, 2026
(“3.80% Unsecured Senior Note”), which will be allocated to fund certain eligible green development and redevelopment projects and the repayment of a secured note payable related to 50/60 Binney Street, a recently completed Class A property, which was awarded LEED
®
Gold certification; and
$200.0 million
added to our outstanding
4.00%
unsecured senior notes payable due on
January 15, 2024
, issued at a yield to maturity of
3.453%
, which are part of the same series that was originally issued in 2018. The net proceeds will also be used to fund recently completed and future eligible green projects.
Repayment of secured notes payable
In January 2019, we repaid early one secured note payable aggregating
$106.7 million
, which was originally due in 2020 and bore interest at
7.75%
, and recognized a loss on early extinguishment of debt of
$7.1 million
, including the write-off of unamortized loan fees.
In March 2019, we repaid early the remaining
$193.1 million
balance of our secured construction loan related to 50/60 Binney Street,
which was due in 2020 and bore interest at
LIBOR+1.5%
, and recognized a loss on early extinguishment of debt of
$269 thousand
.
Interest expense
The following table summarizes interest expense for the
three months ended March 31, 2019
and
2018
(in thousands):
|
Three Months Ended March 31,
|
|||||||
|
2019
|
2018
|
||||||
|
Gross interest
|
$
|
57,609
|
|
$
|
50,275
|
|
|
|
Capitalized interest
|
(18,509
|
)
|
(13,360
|
)
|
|||
|
Interest expense
|
$
|
39,100
|
|
$
|
36,915
|
|
|
33
|
11.
|
Interest rate hedge agreements
|
We use interest rate derivatives to hedge the variable cash flows associated with certain of our existing LIBOR-based variable-rate debt, including our $2.2 billion unsecured senior line of credit and unsecured senior bank term loan, and to manage our exposure to interest rate volatility.
The fair value of each interest rate hedge agreement is determined using widely accepted valuation techniques, including discounted cash flow analyses on the expected cash flows of each derivative. These analyses reflect the contractual terms of the derivatives, including the period to maturity, and use observable market-based inputs, including interest rate curves and implied volatilities. The fair values of our interest rate hedge agreements are determined using the market-standard methodology of netting the discounted future fixed-cash payments and the discounted expected variable-cash receipts. The variable-cash receipts are based on an expectation of future interest rates (forward curves) derived from observable market interest rate curves. The fair value calculation also includes an amount for risk of non-performance of our counterparties using “significant unobservable inputs,” such as estimates of current credit spreads to evaluate the likelihood of default, which we have determined to be insignificant to the overall fair value of our interest rate hedge agreements.
Changes in fair value, including accrued interest and adjustments for non-performance risk, of our interest rate hedge agreements that are designated and that qualify as cash flow hedges are classified in accumulated other comprehensive income. Amounts classified in accumulated other comprehensive income are subsequently reclassified into earnings in the period during which the hedged transactions affect earnings. During the next 12 months, we expect to reclassify approximately
$649 thousand
from accumulated other comprehensive income to earnings as an increase of interest expense. As of
March 31, 2019
, and
December 31, 2018
, the fair values of our interest rate hedge agreements aggregating an asset balance were classified in other assets, and the fair values of our interest rate hedge agreements aggregating a liability balance were classified in accounts payable, accrued expenses, and tenant security deposits, based upon their respective fair values, without any offsetting pursuant to master netting agreements. Refer to Note 9 – “Fair Value Measurements” to these unaudited consolidated financial statements for further details. Under our interest rate hedge agreements, we have
no
collateral posting requirements.
We have agreements with certain of our derivative counterparties that contain a provision wherein we could be declared in default on our derivative obligations if (i) repayment of the underlying indebtedness is accelerated by the lender due to our default on the indebtedness or (ii) we default on any of its indebtedness, including default where repayment of the indebtedness has not been accelerated by the lender. If we had breached any of these provisions
as of March 31, 2019
, we could have been required to settle our obligations under the agreements at their termination value of
$1.2 million
.
We had the following outstanding interest rate hedge agreements that were designated as cash flow hedges of interest rate risk as of
March 31, 2019
(dollars in thousands):
|
Number of Contracts
|
Weighted-Average Interest Pay Rate
(1)
|
Fair Value as of
|
Notional Amount in Effect as of
|
|||||||||||||||
|
Effective Date
|
Maturity Date
|
3/31/19
|
3/31/19
|
12/31/19
|
||||||||||||||
|
March 29, 2019
|
March 31, 2020
|
1
|
1.89%
|
$
|
494
|
|
$
|
100,000
|
|
$
|
100,000
|
|
||||||
|
March 29, 2019
|
March 31, 2020
|
3
|
2.84%
|
(1,143
|
)
|
|
250,000
|
|
250,000
|
|
||||||||
|
Total
|
$
|
(649
|
)
|
$
|
350,000
|
|
$
|
350,000
|
|
|||||||||
|
(1)
|
In addition to the interest pay rate for each hedge agreement, interest is payable at an applicable margin over LIBOR for borrowings outstanding as of
March 31, 2019
, as listed under the column heading “Stated Rate” in our summary table of outstanding indebtedness and respective principal payments under Note 10 – “Secured and Unsecured Senior Debt” to these unaudited consolidated financial statements.
|
34
|
12.
|
Accounts payable, accrued expenses, and tenant security deposits
|
The following table summarizes the components of accounts payable, accrued expenses, and tenant security deposits as of
March 31, 2019
, and
December 31, 2018
(in thousands):
|
March 31, 2019
|
December 31, 2018
|
||||||
|
Accounts payable and accrued expenses
|
$
|
167,350
|
|
$
|
215,539
|
|
|
|
Accrued construction
|
285,821
|
|
275,882
|
|
|||
|
Acquired below-market leases
|
162,177
|
|
134,808
|
|
|||
|
Conditional asset retirement obligations
|
9,878
|
|
10,343
|
|
|||
|
Deferred rent liabilities
|
2,100
|
|
29,547
|
|
|||
|
Interest rate hedge liabilities
|
1,143
|
|
768
|
|
|||
|
Operating lease liability
(1)
|
244,601
|
|
—
|
|
|||
|
Unearned rent and tenant security deposits
|
246,342
|
|
250,923
|
|
|||
|
Other liabilities
|
51,965
|
|
63,897
|
|
|||
|
Total
|
$
|
1,171,377
|
|
$
|
981,707
|
|
|
|
(1)
|
Refer to Note 2 – “Summary of Significant Accounting Policies” and Note 5 – “Leases” to these unaudited consolidated financial statements for additional information.
|
Some of our properties may contain asbestos, which, under certain conditions, requires remediation. Although we believe that the asbestos is appropriately contained in accordance with environmental regulations, our practice is to remediate the asbestos upon the development or redevelopment of the affected property. We recognize a liability for the fair value of a conditional asset retirement obligation (including asbestos) when the fair value of the liability can be reasonably estimated. For certain properties we do not recognize an asset retirement obligation when there is an indeterminate settlement date for the obligation because the period in which we may remediate the obligation may not be estimated with any level of precision to provide for a meaningful estimate of the retirement obligation.
|
13.
|
Earnings per share
|
In January 2018, we entered into forward equity sales agreements to sell an aggregate of
6.9 million
shares of our common stock (including the exercise of underwriters’ option) at a public offering price of
$123.50
per share, before underwriting discounts and further adjustments as provided for in the sales agreement. We settled all
6.9 million
shares of common stock during the year ended December 31, 2018, of which
5.2 million
shares were settled during the three months ended December 31, 2018.
To account for the forward equity sales agreements, we considered the accounting guidance governing financial instruments and derivatives and concluded that our forward equity sales agreements were not liabilities as they did not embody obligations to repurchase our shares, nor did they embody obligations to issue a variable number of shares for which the monetary value was predominantly fixed, varied with something other than the fair value of our shares, or varied inversely in relation to our shares. We then evaluated whether the agreements met the derivatives and hedging guidance scope exception to be accounted for as equity instruments and concluded that the agreements can be classified as equity contracts based on the following assessment: (i) none of the agreements’ exercise contingencies were based on observable markets or indices besides those related to the market for our own stock price and operations; and (ii) none of the settlement provisions precluded the agreements from being indexed to our own stock.
We also considered the potential dilution resulting from the forward equity sales agreements on the EPS calculations. At inception, the agreements do not have an effect on the computation of basic EPS as no shares are delivered until settlement. The common shares issued upon the settlement of the forward equity sales agreements, weighted for the period these common shares were outstanding, are included in the denominator of basic EPS. To determine the dilution resulting from the forward equity sales agreements during the period of time prior to settlement, we calculate the number of weighted-average shares outstanding – diluted using the treasury stock method. There were no forward equity sales agreements outstanding during the
three months ended March 31, 2019
. For the
three months ended March 31, 2018
, the effect on our weighted-average shares – diluted from the forward equity sales agreements entered into in January 2018 was
270 thousand
weighted-average incremental shares.
For purposes of calculating diluted EPS, we did not assume conversion of our
7.00%
Series D cumulative convertible preferred stock (“Series D Convertible Preferred Stock”) for the
three months ended March 31, 2019
and
2018
, since the result was antidilutive to EPS attributable to Alexandria Real Estate Equities, Inc.’s common stockholders from continuing operations during each period. Refer to Note 14 – “Stockholders’ Equity” to these unaudited consolidated financial statements for further discussion of the partial repurchases of our Series D Convertible Preferred Stock.
35
|
13.
|
Earnings per share (continued)
|
We account for unvested restricted stock awards that contain nonforfeitable rights to dividends as participating securities and include these securities in the computation of EPS using the two-class method. Our Series D Convertible Preferred Stock and forward equity sales agreements are not participating securities and are therefore not included in the computation of EPS using the two-class method. Under the two-class method, we allocate net income (after amounts attributable to noncontrolling interests, dividends on preferred stock, and preferred stock redemption charge) to common stockholders and unvested restricted stock awards by using the weighted-average shares of each class outstanding for quarter-to-date and year-to-date periods independently, based on their respective participation rights to dividends declared (or accumulated) and undistributed earnings.
The table below is a reconciliation of the numerators and denominators of the basic and diluted EPS computations for the
three months ended March 31, 2019
and
2018
(in thousands, except per share amounts):
|
Three Months Ended March 31,
|
|||||||
|
2019
|
2018
|
||||||
|
Net income
|
$
|
136,818
|
|
$
|
141,518
|
|
|
|
Net income attributable to noncontrolling interests
|
(7,659
|
)
|
(5,888
|
)
|
|||
|
Dividends on preferred stock
|
(1,026
|
)
|
(1,302
|
)
|
|||
|
Preferred stock redemption charge
|
(2,580
|
)
|
—
|
|
|||
|
Net income attributable to unvested restricted stock awards
|
(1,955
|
)
|
(1,941
|
)
|
|||
|
Numerator for basic and diluted EPS – net income attributable to Alexandria Real Estate Equities, Inc.’s common stockholders
|
$
|
123,598
|
|
$
|
132,387
|
|
|
|
Denominator for basic EPS – weighted-average shares of common stock outstanding
|
111,054
|
|
99,855
|
|
|||
|
Dilutive effect of forward equity sales agreements
|
—
|
|
270
|
|
|||
|
Denominator for diluted EPS – weighted-average shares of common stock outstanding
|
111,054
|
|
100,125
|
|
|||
|
Net income per share attributable to Alexandria Real Estate Equities, Inc.’s common stockholders:
|
|||||||
|
Basic
|
$
|
1.11
|
|
$
|
1.33
|
|
|
|
Diluted
|
$
|
1.11
|
|
$
|
1.32
|
|
|
36
|
14.
|
Stockholders’ equity
|
ATM common stock offering program
In August 2018, we established an ATM common stock offering program that allows us to sell up to an aggregate of
$750.0 million
of our common stock. The following table presents a detail of shares of common stock sold and the remaining aggregate amount available for future sales of common stock under this ATM program (dollars in thousands, except per share amounts):
|
Shares
Issued
|
Average Issue Price per Share
|
Gross Proceeds
|
Net Proceeds
|
||||||||||||
|
Cumulative activity through December 31, 2018
|
855,458
|
|
$
|
127.45
|
|
$
|
109,031
|
|
$
|
106,956
|
|
||||
|
Three months ended March 31, 2019
|
—
|
|
$
|
—
|
|
—
|
|
—
|
|
||||||
|
Cumulative activity through March 31, 2019
|
855,458
|
|
109,031
|
|
$
|
106,956
|
|
||||||||
|
Remaining availability as of March 31, 2019
|
640,969
|
|
|
|
|||||||||||
|
Total August 2018 ATM common stock offering program
|
$
|
750,000
|
|
||||||||||||
7.00% Series D cumulative convertible preferred stock repurchases
As of March 31, 2019
and
December 31, 2018
,
2.3 million
and
2.6 million
shares of our Series D Convertible Preferred Stock were outstanding, respectively. During the
three months ended March 31, 2019
, we repurchased, in privately negotiated transactions,
275,000
outstanding shares of our Series D Convertible Preferred Stock at an aggregate price of
$9.2 million
, or
$33.60
per share. We recognized a preferred stock redemption charge of
$2.6 million
during the
three months ended March 31, 2019
, including the write-off of original issuance costs of approximately
$215 thousand
.
The dividends on our Series D Convertible Preferred Stock are cumulative and accrue from the date of original issuance. We pay dividends quarterly in arrears at an annual rate of
$1.75
per share. Our Series D Convertible Preferred Stock has no stated maturity and is not subject to any sinking fund or mandatory redemption provisions. We are not allowed to redeem our Series D Convertible Preferred Stock, except to preserve our status as a REIT. Investors in our Series D Convertible Preferred Stock generally have no voting rights. We may, at our option, be able to cause some or all of our Series D Convertible Preferred Stock to be automatically converted if the closing sale price per share of our common stock equals or exceeds
150%
of the then-applicable conversion price of the Series D Convertible Preferred Stock for at least
20
trading days in a period of
30
consecutive trading days ending on the trading day immediately prior to our issuance of a press release announcing the exercise of our conversion option. Holders of our Series D Convertible Preferred Stock, at their option, may, at any time and from time to time, convert some or all of their outstanding shares initially at a conversion rate of
0.2477
shares of common stock per
$25.00
liquidation preference, which was equivalent to an initial conversion price of approximately
$100.93
per share of common stock. The conversion rate for the Series D Convertible Preferred Stock is subject to adjustments for certain events, including, but not limited to, certain dividends on our common stock in excess of
$0.78
per share per quarter and dividends on our common stock payable in shares of our common stock.
As of March 31, 2019
, the Series D Convertible Preferred Stock had a conversion rate of approximately
0.2505
shares of common stock per
$25.00
liquidation preference, which is equivalent to a conversion price of approximately
$99.80
per share of common stock.
Dividends
In
March 2019
, we declared cash dividends on our common stock for the
three months ended March 31, 2019
, aggregating
$109.6 million
, or
$0.97
per share. Also in
March 2019
, we declared cash dividends on our Series D Convertible Preferred Stock for the
three months ended March 31, 2019
, aggregating approximately
$1.0 million
, or
$0.4375
per share. In
April 2019
, we paid the cash dividends on our common stock and Series D Convertible Preferred Stock declared for the
three months ended March 31, 2019
.
37
|
14.
|
Stockholders’ equity (continued)
|
Accumulated other comprehensive loss
Accumulated other comprehensive loss attributable to Alexandria Real Estate Equities, Inc.’s stockholders consists of the following (in thousands):
|
|
|
Net Unrealized Gain (Loss) on:
|
||||||||||
|
|
|
Interest Rate
Hedge Agreements |
|
Foreign Currency Translation
|
|
Total
|
||||||
|
Balance as of December 31, 2018
|
|
$
|
1,838
|
|
|
$
|
(12,273
|
)
|
|
$
|
(10,435
|
)
|
|
|
|
|
|
|
|
|
|
|||||
|
Other comprehensive (loss) income before reclassifications
|
|
(558
|
)
|
|
2,210
|
|
|
1,652
|
|
|||
|
Amounts reclassified from other comprehensive income to net income
|
|
(1,929
|
)
|
|
—
|
|
|
(1,929
|
)
|
|||
|
Net other comprehensive (loss) income
|
|
(2,487
|
)
|
|
2,210
|
|
|
(277
|
)
|
|||
|
|
|
|
|
|
|
|
|
|
|
|||
|
Balance as of March 31, 2019
|
|
$
|
(649
|
)
|
|
$
|
(10,063
|
)
|
|
$
|
(10,712
|
)
|
Common stock, preferred stock, and excess stock authorizations
Our charter authorizes the issuance of
200.0 million
shares of common stock, of which
111.2 million
shares were issued and outstanding as of
March 31, 2019
. Our charter also authorizes the issuance of up to
100.0 million
shares of preferred stock, of which
2.3 million
shares were issued and outstanding as of
March 31, 2019
. In addition,
200.0 million
shares of “excess stock” (as defined in our charter) are authorized,
none
of which were issued and outstanding as of
March 31, 2019
.
|
15.
|
Noncontrolling interests
|
Noncontrolling interests represent the third-party interests in certain entities in which we have a controlling interest. These entities owned
12
properties as of
March 31, 2019
, and are included in our unaudited consolidated financial statements. Noncontrolling interests are adjusted for additional contributions and distributions, the proportionate share of the net earnings or losses, and other comprehensive income or loss. Distributions, profits, and losses related to these entities are allocated in accordance with the respective operating agreements. During the
three months ended March 31, 2019
and
2018
, we distributed
$9.7 million
and
$7.2 million
, respectively, to our consolidated real estate joint venture partners.
Certain of our noncontrolling interests have the right to require us to redeem their ownership interests in the respective entities. We classify these ownership interests in the entities as redeemable noncontrolling interests outside of total equity in our consolidated balance sheets. Redeemable noncontrolling interests are adjusted for additional contributions and distributions, the proportionate share of the net earnings or losses, and other comprehensive income or loss. If the amount of a redeemable noncontrolling interest is less than the maximum redemption value at the balance sheet date, such amount is adjusted to the maximum redemption value. Subsequent declines in the redemption value are recognized only to the extent that previous increases have been recognized.
|
16.
|
Assets classified as held for sale
|
As of
March 31, 2019
,
two
properties aggregating
402,144
RSF were classified as held for sale and did not meet the criteria for classification as discontinued operations in our consolidated financial statements.
The following is a summary of net assets as of
March 31, 2019
, and
December 31, 2018
, for our real estate investments that were classified as held for sale as of each respective date (in thousands):
|
|
March 31, 2019
|
December 31, 2018
|
|||||
|
Total assets
|
$
|
47,044
|
|
$
|
31,260
|
|
|
|
Total liabilities
|
(1,946
|
)
|
(2,476
|
)
|
|||
|
Total accumulated other comprehensive income
|
4
|
|
768
|
|
|||
|
Net assets classified as held for sale
|
$
|
45,102
|
|
$
|
29,552
|
|
|
38
|
17.
|
Subsequent events
|
Unsecured senior bank term loan extension
In April 2019, we entered into an agreement to extend our unsecured senior bank term loan maturity date to
January 2, 2025
. We expect that the extension will become effective in June 2019 upon the satisfaction of certain conditions.
|
18.
|
Condensed consolidating financial information
|
Alexandria Real Estate Equities, Inc. (the “Issuer”) has sold certain debt securities registered under the Securities Act of 1933, as amended, that are fully and unconditionally guaranteed by Alexandria Real Estate Equities, L.P. (the “LP” or the “Guarantor Subsidiary”), an indirectly 100% owned subsidiary of the Issuer. The Issuer’s other subsidiaries, including, but not limited to, the subsidiaries that own substantially all of its real estate (collectively, the “Combined Non-Guarantor Subsidiaries”), will not provide a guarantee of such securities, including the subsidiaries that are partially or 100% owned by the LP. The following condensed consolidating financial information presents the condensed consolidating balance sheets as of
March 31, 2019
, and
December 31, 2018
, the condensed consolidating statements of income and comprehensive income for the
three months ended March 31, 2019
and
2018
, and the condensed consolidating statements of cash flows for the
three months ended March 31, 2019
and
2018
, for the Issuer, the Guarantor Subsidiary, and the Combined Non-Guarantor Subsidiaries, as well as the eliminations necessary to arrive at the information on a consolidated basis. In presenting the condensed consolidating financial statements, the equity method of accounting has been applied to (i) the Issuer’s interests in the Guarantor Subsidiary and the Combined Non-Guarantor Subsidiaries, (ii) the Guarantor Subsidiary’s interests in the Combined Non-Guarantor Subsidiaries, and (iii) the Combined Non-Guarantor Subsidiaries’ interests in the Guarantor Subsidiary, where applicable, even though all such subsidiaries meet the requirements to be consolidated under GAAP. All intercompany balances and transactions between the Issuer, the Guarantor Subsidiary, and the Combined Non-Guarantor Subsidiaries have been eliminated, as shown in the column “Eliminations.” All assets and liabilities have been allocated to the Issuer, the Guarantor Subsidiary, and the Combined Non-Guarantor Subsidiaries generally based on legal entity ownership.
39
|
18.
|
Condensed consolidating financial information (continued)
|
Condensed Consolidating Balance Sheet
as of
March 31, 2019
(In thousands)
(Unaudited)
|
Alexandria Real Estate Equities, Inc.
(Issuer)
|
Alexandria
Real Estate
Equities, L.P.
(Guarantor
Subsidiary)
|
Combined
Non-
Guarantor
Subsidiaries
|
Eliminations
|
Consolidated
|
|||||||||||||||
|
Assets
|
|||||||||||||||||||
|
Investments in real estate
|
$
|
—
|
|
$
|
—
|
|
$
|
12,410,350
|
|
$
|
—
|
|
$
|
12,410,350
|
|
||||
|
Investments in unconsolidated real estate JVs
|
—
|
|
—
|
|
290,405
|
|
—
|
|
290,405
|
|
|||||||||
|
Cash and cash equivalents
|
124,562
|
|
—
|
|
136,810
|
|
—
|
|
261,372
|
|
|||||||||
|
Restricted cash
|
143
|
|
—
|
|
54,290
|
|
—
|
|
54,433
|
|
|||||||||
|
Tenant receivables
|
—
|
|
—
|
|
9,645
|
|
—
|
|
9,645
|
|
|||||||||
|
Deferred rent
|
—
|
|
—
|
|
558,103
|
|
—
|
|
558,103
|
|
|||||||||
|
Deferred leasing costs
|
—
|
|
—
|
|
241,268
|
|
—
|
|
241,268
|
|
|||||||||
|
Investments
|
—
|
|
1,232
|
|
999,672
|
|
—
|
|
1,000,904
|
|
|||||||||
|
Investments in and advances to affiliates
|
13,091,955
|
|
11,679,065
|
|
237,842
|
|
(25,008,862
|
)
|
—
|
|
|||||||||
|
Other assets
|
57,817
|
|
—
|
|
595,909
|
|
—
|
|
653,726
|
|
|||||||||
|
Total assets
|
$
|
13,274,477
|
|
$
|
11,680,297
|
|
$
|
15,534,294
|
|
$
|
(25,008,862
|
)
|
$
|
15,480,206
|
|
||||
|
Liabilities, Noncontrolling Interests, and Equity
|
|||||||||||||||||||
|
Secured notes payable
|
$
|
—
|
|
$
|
—
|
|
$
|
356,461
|
|
$
|
—
|
|
$
|
356,461
|
|
||||
|
Unsecured senior notes payable
|
5,139,500
|
|
—
|
|
—
|
|
—
|
|
5,139,500
|
|
|||||||||
|
Unsecured senior line of credit
|
—
|
|
—
|
|
—
|
|
—
|
|
—
|
|
|||||||||
|
Unsecured senior bank term loan
|
347,542
|
|
—
|
|
—
|
|
—
|
|
347,542
|
|
|||||||||
|
Accounts payable, accrued expenses, and tenant security deposits
|
110,446
|
|
—
|
|
1,060,931
|
|
—
|
|
1,171,377
|
|
|||||||||
|
Dividends payable
|
110,412
|
|
—
|
|
—
|
|
—
|
|
110,412
|
|
|||||||||
|
Total liabilities
|
5,707,900
|
|
—
|
|
1,417,392
|
|
—
|
|
7,125,292
|
|
|||||||||
|
Redeemable noncontrolling interests
|
—
|
|
—
|
|
10,889
|
|
—
|
|
10,889
|
|
|||||||||
|
Alexandria Real Estate Equities, Inc.’s stockholders’ equity
|
7,566,577
|
|
11,680,297
|
|
13,328,565
|
|
(25,008,862
|
)
|
7,566,577
|
|
|||||||||
|
Noncontrolling interests
|
—
|
|
—
|
|
777,448
|
|
—
|
|
777,448
|
|
|||||||||
|
Total equity
|
7,566,577
|
|
11,680,297
|
|
14,106,013
|
|
(25,008,862
|
)
|
8,344,025
|
|
|||||||||
|
Total liabilities, noncontrolling interests, and equity
|
$
|
13,274,477
|
|
$
|
11,680,297
|
|
$
|
15,534,294
|
|
$
|
(25,008,862
|
)
|
$
|
15,480,206
|
|
||||
40
|
18.
|
Condensed consolidating financial information (continued)
|
Condensed Consolidating Balance Sheet
as of
December 31, 2018
(In thousands)
(Unaudited)
|
Alexandria
Real Estate
Equities, Inc.
(Issuer)
|
Alexandria
Real Estate
Equities, L.P.
(Guarantor
Subsidiary)
|
Combined
Non-
Guarantor
Subsidiaries
|
Eliminations
|
Consolidated
|
|||||||||||||||
|
Assets
|
|||||||||||||||||||
|
Investments in real estate
|
$
|
—
|
|
$
|
—
|
|
$
|
11,913,693
|
|
$
|
—
|
|
$
|
11,913,693
|
|
||||
|
Investments in unconsolidated real estate JVs
|
—
|
|
—
|
|
237,507
|
|
—
|
|
237,507
|
|
|||||||||
|
Cash and cash equivalents
|
119,112
|
|
—
|
|
115,069
|
|
—
|
|
234,181
|
|
|||||||||
|
Restricted cash
|
193
|
|
—
|
|
37,756
|
|
—
|
|
37,949
|
|
|||||||||
|
Tenant receivables
|
—
|
|
—
|
|
9,798
|
|
—
|
|
9,798
|
|
|||||||||
|
Deferred rent
|
—
|
|
—
|
|
530,237
|
|
—
|
|
530,237
|
|
|||||||||
|
Deferred leasing costs
|
—
|
|
—
|
|
239,070
|
|
—
|
|
239,070
|
|
|||||||||
|
Investments
|
—
|
|
1,262
|
|
891,002
|
|
—
|
|
892,264
|
|
|||||||||
|
Investments in and advances to affiliates
|
12,235,577
|
|
10,949,631
|
|
222,983
|
|
(23,408,191
|
)
|
—
|
|
|||||||||
|
Other assets
|
56,353
|
|
—
|
|
313,904
|
|
—
|
|
370,257
|
|
|||||||||
|
Total assets
|
$
|
12,411,235
|
|
$
|
10,950,893
|
|
$
|
14,511,019
|
|
$
|
(23,408,191
|
)
|
$
|
14,464,956
|
|
||||
|
Liabilities, Noncontrolling Interests, and Equity
|
|||||||||||||||||||
|
Secured notes payable
|
$
|
—
|
|
$
|
—
|
|
$
|
630,547
|
|
$
|
—
|
|
$
|
630,547
|
|
||||
|
Unsecured senior notes payable
|
4,292,293
|
|
—
|
|
—
|
|
—
|
|
4,292,293
|
|
|||||||||
|
Unsecured senior line of credit
|
208,000
|
|
—
|
|
—
|
|
—
|
|
208,000
|
|
|||||||||
|
Unsecured senior bank term loan
|
347,415
|
|
—
|
|
—
|
|
—
|
|
347,415
|
|
|||||||||
|
Accounts payable, accrued expenses, and tenant security deposits
|
111,282
|
|
—
|
|
870,425
|
|
—
|
|
981,707
|
|
|||||||||
|
Dividends payable
|
110,280
|
|
—
|
|
—
|
|
—
|
|
110,280
|
|
|||||||||
|
Total liabilities
|
5,069,270
|
|
—
|
|
1,500,972
|
|
—
|
|
6,570,242
|
|
|||||||||
|
Redeemable noncontrolling interests
|
—
|
|
—
|
|
10,786
|
|
—
|
|
10,786
|
|
|||||||||
|
Alexandria Real Estate Equities, Inc.’s stockholders’ equity
|
7,341,965
|
|
10,950,893
|
|
12,457,298
|
|
(23,408,191
|
)
|
7,341,965
|
|
|||||||||
|
Noncontrolling interests
|
—
|
|
—
|
|
541,963
|
|
—
|
|
541,963
|
|
|||||||||
|
Total equity
|
7,341,965
|
|
10,950,893
|
|
12,999,261
|
|
(23,408,191
|
)
|
7,883,928
|
|
|||||||||
|
Total liabilities, noncontrolling interests, and equity
|
$
|
12,411,235
|
|
$
|
10,950,893
|
|
$
|
14,511,019
|
|
$
|
(23,408,191
|
)
|
$
|
14,464,956
|
|
||||
41
|
18.
|
Condensed consolidating financial information (continued)
|
Condensed Consolidating Statement of Income
for the
Three Months Ended March 31, 2019
(In thousands)
(Unaudited)
|
Alexandria
Real Estate
Equities, Inc.
(Issuer)
|
Alexandria
Real Estate
Equities, L.P.
(Guarantor
Subsidiary)
|
Combined
Non-
Guarantor
Subsidiaries
|
Eliminations
|
Consolidated
|
|||||||||||||||
|
Revenues:
|
|||||||||||||||||||
|
Income from rentals
|
$
|
—
|
|
$
|
—
|
|
$
|
354,749
|
|
$
|
—
|
|
$
|
354,749
|
|
||||
|
Other income
|
5,034
|
|
—
|
|
4,415
|
|
(5,356
|
)
|
4,093
|
|
|||||||||
|
Total revenues
|
5,034
|
|
—
|
|
359,164
|
|
(5,356
|
)
|
358,842
|
|
|||||||||
|
Expenses:
|
|||||||||||||||||||
|
Rental operations
|
—
|
|
—
|
|
101,501
|
|
—
|
|
101,501
|
|
|||||||||
|
General and administrative
|
24,350
|
|
—
|
|
5,683
|
|
(5,356
|
)
|
24,677
|
|
|||||||||
|
Interest
|
35,829
|
|
—
|
|
3,271
|
|
—
|
|
39,100
|
|
|||||||||
|
Depreciation and amortization
|
1,663
|
|
—
|
|
132,424
|
|
—
|
|
134,087
|
|
|||||||||
|
Loss on early extinguishment of debt
|
—
|
|
—
|
|
7,361
|
|
—
|
|
7,361
|
|
|||||||||
|
Total expenses
|
61,842
|
|
—
|
|
250,240
|
|
(5,356
|
)
|
306,726
|
|
|||||||||
|
|
|
||||||||||||||||||
|
Equity in earnings of unconsolidated real estate JVs
|
—
|
|
—
|
|
1,146
|
|
—
|
|
1,146
|
|
|||||||||
|
Equity in earnings of affiliates
|
185,967
|
|
100,971
|
|
1,985
|
|
(288,923
|
)
|
—
|
|
|||||||||
|
Investment income
|
—
|
|
142
|
|
83,414
|
|
—
|
|
83,556
|
|
|||||||||
|
Net income
|
129,159
|
|
101,113
|
|
195,469
|
|
(288,923
|
)
|
136,818
|
|
|||||||||
|
Net income attributable to noncontrolling interests
|
—
|
|
—
|
|
(7,659
|
)
|
—
|
|
(7,659
|
)
|
|||||||||
|
Net income attributable to Alexandria Real Estate Equities, Inc.’s stockholders
|
129,159
|
|
101,113
|
|
187,810
|
|
(288,923
|
)
|
129,159
|
|
|||||||||
|
Dividends on preferred stock
|
(1,026
|
)
|
—
|
|
—
|
|
—
|
|
(1,026
|
)
|
|||||||||
|
Preferred stock redemption charge
|
(2,580
|
)
|
—
|
|
—
|
|
—
|
|
(2,580
|
)
|
|||||||||
|
Net income attributable to unvested restricted stock awards
|
(1,955
|
)
|
—
|
|
—
|
|
—
|
|
(1,955
|
)
|
|||||||||
|
Net income attributable to Alexandria Real Estate Equities, Inc.’s common stockholders
|
$
|
123,598
|
|
$
|
101,113
|
|
$
|
187,810
|
|
$
|
(288,923
|
)
|
$
|
123,598
|
|
||||
42
|
18.
|
Condensed consolidating financial information (continued)
|
Condensed Consolidating Statement of Income
for the
Three Months Ended March 31, 2018
(In thousands)
(Unaudited)
|
Alexandria
Real Estate
Equities, Inc.
(Issuer)
|
Alexandria
Real Estate
Equities, L.P.
(Guarantor
Subsidiary)
|
Combined
Non-
Guarantor
Subsidiaries
|
Eliminations
|
Consolidated
|
|||||||||||||||
|
Revenues:
|
|||||||||||||||||||
|
Income from rentals
|
$
|
—
|
|
$
|
—
|
|
$
|
317,655
|
|
$
|
—
|
|
$
|
317,655
|
|
||||
|
Other income
|
4,124
|
|
—
|
|
2,925
|
|
(4,565
|
)
|
2,484
|
|
|||||||||
|
Total revenues
|
4,124
|
|
—
|
|
320,580
|
|
(4,565
|
)
|
320,139
|
|
|||||||||
|
Expenses:
|
|||||||||||||||||||
|
Rental operations
|
—
|
|
—
|
|
91,771
|
|
—
|
|
91,771
|
|
|||||||||
|
General and administrative
|
21,890
|
|
—
|
|
5,096
|
|
(4,565
|
)
|
22,421
|
|
|||||||||
|
Interest
|
31,095
|
|
—
|
|
5,820
|
|
—
|
|
36,915
|
|
|||||||||
|
Depreciation and amortization
|
1,677
|
|
—
|
|
112,542
|
|
—
|
|
114,219
|
|
|||||||||
|
Total expenses
|
54,662
|
|
—
|
|
215,229
|
|
(4,565
|
)
|
265,326
|
|
|||||||||
|
Equity in earnings of unconsolidated real estate JVs
|
—
|
|
—
|
|
1,144
|
|
—
|
|
1,144
|
|
|||||||||
|
Equity in earnings of affiliates
|
186,168
|
|
98,882
|
|
1,954
|
|
(287,004
|
)
|
—
|
|
|||||||||
|
Investment income
|
—
|
|
473
|
|
85,088
|
|
—
|
|
85,561
|
|
|||||||||
|
Net income
|
135,630
|
|
99,355
|
|
193,537
|
|
(287,004
|
)
|
141,518
|
|
|||||||||
|
Net income attributable to noncontrolling interests
|
—
|
|
—
|
|
(5,888
|
)
|
—
|
|
(5,888
|
)
|
|||||||||
|
Net income attributable to Alexandria Real Estate Equities, Inc.’s stockholders
|
135,630
|
|
99,355
|
|
187,649
|
|
(287,004
|
)
|
135,630
|
|
|||||||||
|
Dividends on preferred stock
|
(1,302
|
)
|
—
|
|
—
|
|
—
|
|
(1,302
|
)
|
|||||||||
|
Net income attributable to unvested restricted stock awards
|
(1,941
|
)
|
—
|
|
—
|
|
—
|
|
(1,941
|
)
|
|||||||||
|
Net income attributable to Alexandria Real Estate Equities, Inc.’s common stockholders
|
$
|
132,387
|
|
$
|
99,355
|
|
$
|
187,649
|
|
$
|
(287,004
|
)
|
$
|
132,387
|
|
||||
43
|
18.
|
Condensed consolidating financial information (continued)
|
Condensed Consolidating Statement of Comprehensive Income
for the
Three Months Ended March 31, 2019
(In thousands)
(Unaudited)
|
Alexandria
Real Estate
Equities, Inc.
(Issuer)
|
Alexandria
Real Estate
Equities, L.P.
(Guarantor
Subsidiary)
|
Combined
Non-
Guarantor
Subsidiaries
|
Eliminations
|
Consolidated
|
|||||||||||||||
|
Net income
|
$
|
129,159
|
|
$
|
101,113
|
|
$
|
195,469
|
|
$
|
(288,923
|
)
|
$
|
136,818
|
|
||||
|
Other comprehensive (loss) income:
|
|||||||||||||||||||
|
Unrealized losses on interest rate hedge agreements:
|
|||||||||||||||||||
|
Unrealized interest rate hedge losses arising during the period
|
(558
|
)
|
—
|
|
—
|
|
—
|
|
(558
|
)
|
|||||||||
|
Reclassification adjustment for amortization of interest income included in net income
|
(1,929
|
)
|
—
|
|
—
|
|
—
|
|
(1,929
|
)
|
|||||||||
|
Unrealized losses on interest rate hedge agreements, net
|
(2,487
|
)
|
—
|
|
—
|
|
—
|
|
(2,487
|
)
|
|||||||||
|
Unrealized gains on foreign currency translation:
|
|||||||||||||||||||
|
Unrealized foreign currency translation gains arising during the period
|
—
|
|
—
|
|
2,210
|
|
—
|
|
2,210
|
|
|||||||||
|
Unrealized gains on foreign currency translation, net
|
—
|
|
—
|
|
2,210
|
|
—
|
|
2,210
|
|
|||||||||
|
Total other comprehensive (loss) income
|
(2,487
|
)
|
—
|
|
2,210
|
|
—
|
|
(277
|
)
|
|||||||||
|
Comprehensive income
|
126,672
|
|
101,113
|
|
197,679
|
|
(288,923
|
)
|
136,541
|
|
|||||||||
|
Less: comprehensive income attributable to noncontrolling interests
|
—
|
|
—
|
|
(7,659
|
)
|
—
|
|
(7,659
|
)
|
|||||||||
|
Comprehensive income attributable to Alexandria Real Estate Equities, Inc.’s stockholders
|
$
|
126,672
|
|
$
|
101,113
|
|
$
|
190,020
|
|
$
|
(288,923
|
)
|
$
|
128,882
|
|
||||
44
|
18.
|
Condensed consolidating financial information (continued)
|
Condensed Consolidating Statement of Comprehensive Income
for the
Three Months Ended March 31, 2018
(In thousands)
(Unaudited)
|
Alexandria
Real Estate
Equities, Inc.
(Issuer)
|
Alexandria
Real Estate
Equities, L.P.
(Guarantor
Subsidiary)
|
Combined
Non-
Guarantor
Subsidiaries
|
Eliminations
|
Consolidated
|
|||||||||||||||
|
Net income
|
$
|
135,630
|
|
$
|
99,355
|
|
$
|
193,537
|
|
$
|
(287,004
|
)
|
$
|
141,518
|
|
||||
|
Other comprehensive income (loss):
|
|||||||||||||||||||
|
Unrealized gains on interest rate hedge agreements:
|
|||||||||||||||||||
|
Unrealized interest rate hedge gains arising during the period
|
1,982
|
|
—
|
|
—
|
|
—
|
|
1,982
|
|
|||||||||
|
Reclassification adjustment for amortization of interest income included in net income
|
(678
|
)
|
—
|
|
—
|
|
—
|
|
(678
|
)
|
|||||||||
|
Unrealized gains on interest rate hedge agreements, net
|
1,304
|
|
—
|
|
—
|
|
—
|
|
1,304
|
|
|||||||||
|
Unrealized losses on foreign currency translation:
|
|||||||||||||||||||
|
Unrealized foreign currency translation losses arising during the period
|
—
|
|
—
|
|
(329
|
)
|
—
|
|
(329
|
)
|
|||||||||
|
Unrealized losses on foreign currency translation, net
|
—
|
|
—
|
|
(329
|
)
|
—
|
|
(329
|
)
|
|||||||||
|
Total other comprehensive income (loss)
|
1,304
|
|
—
|
|
(329
|
)
|
—
|
|
975
|
|
|||||||||
|
Comprehensive income
|
136,934
|
|
99,355
|
|
193,208
|
|
(287,004
|
)
|
142,493
|
|
|||||||||
|
Less: comprehensive income attributable to noncontrolling interests
|
—
|
|
—
|
|
(5,888
|
)
|
—
|
|
(5,888
|
)
|
|||||||||
|
Comprehensive income attributable to Alexandria Real Estate Equities, Inc.’s stockholders
|
$
|
136,934
|
|
$
|
99,355
|
|
$
|
187,320
|
|
$
|
(287,004
|
)
|
$
|
136,605
|
|
||||
45
|
18.
|
Condensed consolidating financial information (continued)
|
Condensed Consolidating Statement of Cash Flows
for the
Three Months Ended March 31, 2019
(In thousands)
(Unaudited)
|
Alexandria
Real Estate Equities, Inc. (Issuer) |
Alexandria
Real Estate Equities, L.P. (Guarantor Subsidiary) |
Combined
Non-Guarantor
Subsidiaries
|
Eliminations
|
Consolidated
|
|||||||||||||||
|
Operating Activities
|
|||||||||||||||||||
|
Net income
|
$
|
129,159
|
|
$
|
101,113
|
|
$
|
195,469
|
|
$
|
(288,923
|
)
|
$
|
136,818
|
|
||||
|
Adjustments to reconcile net income to net cash (used in) provided by operating activities:
|
|||||||||||||||||||
|
Depreciation and amortization
|
1,663
|
|
—
|
|
132,424
|
|
—
|
|
134,087
|
|
|||||||||
|
Loss on early extinguishment of debt
|
—
|
|
—
|
|
7,361
|
|
—
|
|
7,361
|
|
|||||||||
|
Equity in earnings of unconsolidated real estate JVs
|
—
|
|
—
|
|
(1,146
|
)
|
—
|
|
(1,146
|
)
|
|||||||||
|
Distributions of earnings from unconsolidated real estate JVs
|
—
|
|
—
|
|
858
|
|
—
|
|
858
|
|
|||||||||
|
Amortization of loan fees
|
2,094
|
|
—
|
|
139
|
|
—
|
|
2,233
|
|
|||||||||
|
Amortization of debt premiums
|
(29
|
)
|
—
|
|
(772
|
)
|
—
|
|
(801
|
)
|
|||||||||
|
Amortization of acquired below-market leases
|
—
|
|
—
|
|
(7,148
|
)
|
—
|
|
(7,148
|
)
|
|||||||||
|
Deferred rent
|
—
|
|
—
|
|
(26,965
|
)
|
—
|
|
(26,965
|
)
|
|||||||||
|
Stock compensation expense
|
11,029
|
|
—
|
|
—
|
|
—
|
|
11,029
|
|
|||||||||
|
Equity in earnings of affiliates
|
(185,967
|
)
|
(100,971
|
)
|
(1,985
|
)
|
288,923
|
|
—
|
|
|||||||||
|
Investment income
|
—
|
|
(142
|
)
|
(83,414
|
)
|
—
|
|
(83,556
|
)
|
|||||||||
|
Changes in operating assets and liabilities:
|
|
|
|||||||||||||||||
|
Tenant receivables
|
—
|
|
—
|
|
167
|
|
—
|
|
167
|
|
|||||||||
|
Deferred leasing costs
|
—
|
|
—
|
|
(11,279
|
)
|
—
|
|
(11,279
|
)
|
|||||||||
|
Other assets
|
1,200
|
|
—
|
|
(9,884
|
)
|
—
|
|
(8,684
|
)
|
|||||||||
|
Accounts payable, accrued expenses, and tenant security deposits
|
(8,530
|
)
|
—
|
|
(7,714
|
)
|
—
|
|
(16,244
|
)
|
|||||||||
|
Net cash (used in) provided by operating activities
|
(49,381
|
)
|
—
|
|
186,111
|
|
—
|
|
136,730
|
|
|||||||||
|
Investing Activities
|
|||||||||||||||||||
|
Additions to real estate
|
—
|
|
—
|
|
(241,049
|
)
|
—
|
|
(241,049
|
)
|
|||||||||
|
Purchases of real estate
|
—
|
|
—
|
|
(418,358
|
)
|
—
|
|
(418,358
|
)
|
|||||||||
|
Returns of deposits for investing activities
|
—
|
|
—
|
|
500
|
|
—
|
|
500
|
|
|||||||||
|
Investments in subsidiaries
|
(670,411
|
)
|
(628,463
|
)
|
(12,874
|
)
|
1,311,748
|
|
—
|
|
|||||||||
|
Investments in unconsolidated real estate JVs
|
—
|
|
—
|
|
(52,634
|
)
|
—
|
|
(52,634
|
)
|
|||||||||
|
Additions to investments
|
—
|
|
—
|
|
(48,992
|
)
|
—
|
|
(48,992
|
)
|
|||||||||
|
Sales of investments
|
—
|
|
172
|
|
26,028
|
|
—
|
|
26,200
|
|
|||||||||
|
Net cash used in investing activities
|
$
|
(670,411
|
)
|
$
|
(628,291
|
)
|
$
|
(747,379
|
)
|
$
|
1,311,748
|
|
$
|
(734,333
|
)
|
||||
46
|
18.
|
Condensed consolidating financial information (continued)
|
Condensed Consolidating Statement of Cash Flows (continued)
for the
Three Months Ended March 31, 2019
(In thousands)
(Unaudited)
|
Alexandria
Real Estate Equities, Inc. (Issuer) |
Alexandria
Real Estate Equities, L.P. (Guarantor Subsidiary) |
Combined
Non-Guarantor Subsidiaries |
Eliminations
|
Consolidated
|
|||||||||||||||
|
Financing Activities
|
|||||||||||||||||||
|
Repayments of borrowings from secured notes payable
|
$
|
—
|
|
$
|
—
|
|
$
|
(301,343
|
)
|
$
|
—
|
|
$
|
(301,343
|
)
|
||||
|
Proceeds from issuance of unsecured senior notes payable
|
854,209
|
|
—
|
|
—
|
|
—
|
|
854,209
|
|
|||||||||
|
Borrowings from unsecured senior line of credit
|
1,405,000
|
|
—
|
|
—
|
|
—
|
|
1,405,000
|
|
|||||||||
|
Repayments of borrowings from unsecured senior line of credit
|
(1,613,000
|
)
|
—
|
|
—
|
|
—
|
|
(1,613,000
|
)
|
|||||||||
|
Transfers to/from parent company
|
206,930
|
|
628,291
|
|
476,527
|
|
(1,311,748
|
)
|
—
|
|
|||||||||
|
Payment of loan fees
|
(8,150
|
)
|
—
|
|
(7,075
|
)
|
—
|
|
(15,225
|
)
|
|||||||||
|
Taxes paid related to net settlement of equity awards
|
(89
|
)
|
—
|
|
—
|
|
—
|
|
(89
|
)
|
|||||||||
|
Repurchase of 7.00% Series D cumulative convertible preferred stock
|
(9,240
|
)
|
—
|
|
—
|
|
—
|
|
(9,240
|
)
|
|||||||||
|
Dividends on common stock
|
(109,342
|
)
|
—
|
|
—
|
|
—
|
|
(109,342
|
)
|
|||||||||
|
Dividends on preferred stock
|
(1,126
|
)
|
—
|
|
—
|
|
—
|
|
(1,126
|
)
|
|||||||||
|
Contributions from and sales of noncontrolling interests
|
—
|
|
—
|
|
440,671
|
|
—
|
|
440,671
|
|
|||||||||
|
Distributions to and purchases of noncontrolling interests
|
—
|
|
—
|
|
(9,709
|
)
|
—
|
|
(9,709
|
)
|
|||||||||
|
Net cash provided by financing activities
|
725,192
|
|
628,291
|
|
599,071
|
|
(1,311,748
|
)
|
640,806
|
|
|||||||||
|
Effect of foreign exchange rate changes on cash and cash equivalents
|
—
|
|
—
|
|
472
|
|
—
|
|
472
|
|
|||||||||
|
Net increase in cash, cash equivalents, and restricted cash
|
5,400
|
|
—
|
|
38,275
|
|
—
|
|
43,675
|
|
|||||||||
|
Cash, cash equivalents, and restricted cash as of the beginning of period
|
119,305
|
|
—
|
|
152,825
|
|
—
|
|
272,130
|
|
|||||||||
|
Cash, cash equivalents, and restricted cash as of the end of period
|
$
|
124,705
|
|
$
|
—
|
|
$
|
191,100
|
|
$
|
—
|
|
$
|
315,805
|
|
||||
|
Supplemental Disclosures and Non-Cash Investing and Financing Activities:
|
|||||||||||||||||||
|
Cash paid during the period for interest, net of interest capitalized
|
$
|
45,150
|
|
$
|
—
|
|
$
|
4,450
|
|
$
|
—
|
|
$
|
49,600
|
|
||||
|
Change in accrued construction
|
$
|
—
|
|
$
|
—
|
|
$
|
9,939
|
|
$
|
—
|
|
$
|
9,939
|
|
||||
|
Accrued construction for current period additions to real estate
|
$
|
—
|
|
$
|
—
|
|
$
|
133,502
|
|
$
|
—
|
|
$
|
133,502
|
|
||||
|
Assumption of secured notes payable in connection with purchase of properties
|
$
|
—
|
|
$
|
—
|
|
$
|
(28,200
|
)
|
$
|
—
|
|
$
|
(28,200
|
)
|
||||
|
Right-of-use asset
|
$
|
—
|
|
$
|
—
|
|
$
|
239,653
|
|
$
|
—
|
|
$
|
239,653
|
|
||||
|
Lease liability
|
$
|
—
|
|
$
|
—
|
|
$
|
(245,638
|
)
|
$
|
—
|
|
$
|
(245,638
|
)
|
||||
47
|
18.
|
Condensed consolidating financial information (continued)
|
Condensed Consolidating Statement of Cash Flows
for the
Three Months Ended March 31, 2018
(In thousands)
(Unaudited)
|
Alexandria
Real Estate Equities, Inc. (Issuer) |
Alexandria
Real Estate Equities, L.P. (Guarantor Subsidiary) |
Combined
Non-Guarantor Subsidiaries |
Eliminations
|
Consolidated
|
|||||||||||||||
|
Operating Activities
|
|||||||||||||||||||
|
Net income
|
$
|
135,630
|
|
$
|
99,355
|
|
$
|
193,537
|
|
$
|
(287,004
|
)
|
$
|
141,518
|
|
||||
|
Adjustments to reconcile net income to net cash (used in) provided by operating activities:
|
|||||||||||||||||||
|
Depreciation and amortization
|
1,677
|
|
—
|
|
112,542
|
|
—
|
|
114,219
|
|
|||||||||
|
Equity in earnings of unconsolidated real estate JVs
|
—
|
|
—
|
|
(1,144
|
)
|
—
|
|
(1,144
|
)
|
|||||||||
|
Distributions of earnings from unconsolidated real estate JVs
|
—
|
|
—
|
|
144
|
|
—
|
|
144
|
|
|||||||||
|
Amortization of loan fees
|
2,105
|
|
—
|
|
438
|
|
—
|
|
2,543
|
|
|||||||||
|
Amortization of debt discounts (premiums)
|
187
|
|
—
|
|
(762
|
)
|
—
|
|
(575
|
)
|
|||||||||
|
Amortization of acquired below-market leases
|
—
|
|
—
|
|
(6,170
|
)
|
—
|
|
(6,170
|
)
|
|||||||||
|
Deferred rent
|
—
|
|
—
|
|
(32,631
|
)
|
—
|
|
(32,631
|
)
|
|||||||||
|
Stock compensation expense
|
7,248
|
|
—
|
|
—
|
|
—
|
|
7,248
|
|
|||||||||
|
Equity in earnings of affiliates
|
(186,168
|
)
|
(98,882
|
)
|
(1,954
|
)
|
287,004
|
|
—
|
|
|||||||||
|
Investment income
|
—
|
|
(473
|
)
|
(85,088
|
)
|
—
|
|
(85,561
|
)
|
|||||||||
|
Changes in operating assets and liabilities:
|
|
|
|
|
|||||||||||||||
|
Tenant receivables
|
—
|
|
—
|
|
(988
|
)
|
—
|
|
(988
|
)
|
|||||||||
|
Deferred leasing costs
|
—
|
|
—
|
|
(13,819
|
)
|
—
|
|
(13,819
|
)
|
|||||||||
|
Other assets
|
(6,398
|
)
|
—
|
|
(7,881
|
)
|
—
|
|
(14,279
|
)
|
|||||||||
|
Accounts payable, accrued expenses, and tenant security deposits
|
(3,125
|
)
|
—
|
|
21,541
|
|
—
|
|
18,416
|
|
|||||||||
|
Net cash (used in) provided by operating activities
|
(48,844
|
)
|
—
|
|
177,765
|
|
—
|
|
128,921
|
|
|||||||||
|
Investing Activities
|
|||||||||||||||||||
|
Additions to real estate
|
—
|
|
—
|
|
(206,404
|
)
|
—
|
|
(206,404
|
)
|
|||||||||
|
Purchases of real estate
|
—
|
|
—
|
|
(303,156
|
)
|
—
|
|
(303,156
|
)
|
|||||||||
|
Deposits for investing activities
|
—
|
|
—
|
|
(7,786
|
)
|
—
|
|
(7,786
|
)
|
|||||||||
|
Investments in subsidiaries
|
(507,351
|
)
|
(399,482
|
)
|
(8,256
|
)
|
915,089
|
|
—
|
|
|||||||||
|
Acquisitions of interests in unconsolidated real estate joint ventures
|
—
|
|
—
|
|
(35,922
|
)
|
—
|
|
(35,922
|
)
|
|||||||||
|
Investments in unconsolidated real estate JVs
|
—
|
|
—
|
|
(22,325
|
)
|
—
|
|
(22,325
|
)
|
|||||||||
|
Additions to investments
|
—
|
|
—
|
|
(50,287
|
)
|
—
|
|
(50,287
|
)
|
|||||||||
|
Sales of investments
|
—
|
|
364
|
|
27,478
|
|
—
|
|
27,842
|
|
|||||||||
|
Net cash used in investing activities
|
$
|
(507,351
|
)
|
$
|
(399,118
|
)
|
$
|
(606,658
|
)
|
$
|
915,089
|
|
$
|
(598,038
|
)
|
||||
48
|
18.
|
Condensed consolidating financial information (continued)
|
Condensed Consolidating Statement of Cash Flows (continued)
for the
Three Months Ended March 31, 2018
(In thousands)
(Unaudited)
|
Alexandria
Real Estate Equities, Inc. (Issuer) |
Alexandria
Real Estate Equities, L.P. (Guarantor Subsidiary) |
Combined
Non-Guarantor Subsidiaries |
Eliminations
|
Consolidated
|
|||||||||||||||
|
Financing Activities
|
|||||||||||||||||||
|
Borrowings from secured notes payable
|
$
|
—
|
|
$
|
—
|
|
$
|
6,142
|
|
$
|
—
|
|
$
|
6,142
|
|
||||
|
Repayments of borrowings from secured notes payable
|
—
|
|
—
|
|
(1,189
|
)
|
—
|
|
(1,189
|
)
|
|||||||||
|
Borrowings from unsecured senior line of credit
|
1,035,000
|
|
—
|
|
—
|
|
—
|
|
1,035,000
|
|
|||||||||
|
Repayments of borrowings from unsecured senior line of credit
|
(595,000
|
)
|
—
|
|
—
|
|
—
|
|
(595,000
|
)
|
|||||||||
|
Transfers to/from parent company
|
94,702
|
|
399,109
|
|
421,278
|
|
(915,089
|
)
|
—
|
|
|||||||||
|
Proceeds from issuance of common stock
|
99,369
|
|
—
|
|
—
|
|
—
|
|
99,369
|
|
|||||||||
|
Dividends on common stock
|
(91,060
|
)
|
—
|
|
—
|
|
—
|
|
(91,060
|
)
|
|||||||||
|
Dividends on preferred stock
|
(1,302
|
)
|
—
|
|
—
|
|
—
|
|
(1,302
|
)
|
|||||||||
|
Contributions from noncontrolling interests
|
—
|
|
—
|
|
6,579
|
|
—
|
|
6,579
|
|
|||||||||
|
Distributions to noncontrolling interests
|
—
|
|
—
|
|
(7,220
|
)
|
—
|
|
(7,220
|
)
|
|||||||||
|
Net cash provided by financing activities
|
541,709
|
|
399,109
|
|
425,590
|
|
(915,089
|
)
|
451,319
|
|
|||||||||
|
Effect of foreign exchange rate changes on cash and cash equivalents
|
—
|
|
—
|
|
(406
|
)
|
—
|
|
(406
|
)
|
|||||||||
|
Net decrease in cash, cash equivalents, and restricted cash
|
(14,486
|
)
|
(9
|
)
|
(3,709
|
)
|
—
|
|
(18,204
|
)
|
|||||||||
|
Cash, cash equivalents, and restricted cash as of the beginning of period
|
130,516
|
|
9
|
|
146,661
|
|
—
|
|
277,186
|
|
|||||||||
|
Cash, cash equivalents, and restricted cash as of the end of period
|
$
|
116,030
|
|
$
|
—
|
|
$
|
142,952
|
|
$
|
—
|
|
$
|
258,982
|
|
||||
|
Supplemental Disclosures and Non-Cash Investing and Financing Activities:
|
|||||||||||||||||||
|
Cash paid during the period for interest, net of interest capitalized
|
$
|
29,348
|
|
$
|
—
|
|
$
|
6,145
|
|
$
|
—
|
|
$
|
35,493
|
|
||||
|
Change in accrued construction
|
$
|
—
|
|
$
|
—
|
|
$
|
19,565
|
|
$
|
—
|
|
$
|
19,565
|
|
||||
|
Accrued construction for current period additions to real estate
|
$
|
—
|
|
$
|
—
|
|
$
|
130,761
|
|
$
|
—
|
|
$
|
130,761
|
|
||||
49
ITEM 2. MANAGEMENT’S DISCUSSION AND ANALYSIS OF FINANCIAL CONDITION AND RESULTS OF OPERATIONS
Certain information and statements included in this quarterly report on Form 10‑Q, including, without limitation, statements containing the words “forecast,” “guidance,” “projects,” “estimates,” “anticipates,” “goals,” “believes,” “expects,” “intends,” “may,” “plans,” “seeks,” “should,” or “will,” or the negative of those words or similar words, constitute “forward-looking statements” within the meaning of Section 27A of the Securities Act of 1933, as amended, and Section 21E of the Securities Exchange Act of 1934, as amended. Forward-looking statements involve inherent risks and uncertainties regarding events, conditions, and financial trends that may affect our future plans of operations, business strategy, results of operations, and financial position. A number of important factors could cause actual results to differ materially from those included within or contemplated by the forward-looking statements, including, but not limited to, the following:
|
•
|
Operating factors such as a failure to operate our business successfully in comparison to market expectations or in comparison to our competitors, our inability to obtain capital when desired or refinance debt maturities when desired, and/or a failure to maintain our status as a REIT for federal tax purposes.
|
|
•
|
Market and industry factors such as adverse developments concerning the life science and technology industries and/or our tenants.
|
|
•
|
Government factors such as any unfavorable effects resulting from federal, state, local, and/or foreign government policies, laws, and/or funding levels.
|
|
•
|
Global factors such as negative economic, political, financial, credit market, and/or banking conditions.
|
|
•
|
Other factors such as climate change, cyber intrusions, and/or changes in laws, regulations, and financial accounting standards.
|
This list of risks and uncertainties is not exhaustive. Additional information regarding risk factors that may affect us is included under “Item 1A. Risk Factors” and “Item 7. Management’s Discussion and Analysis of Financial Condition and Results of Operations” of our annual report on Form 10‑K for the year ended
December 31, 2018
. Readers of this quarterly report on Form 10‑Q should also read our other documents filed publicly with the SEC for further discussion regarding such factors.
50
Overview
We are a Maryland corporation formed in October 1994 that has elected to be taxed as a REIT for federal income tax purposes. W
e are an
S&P 500
®
urban office REIT uniquely focused on collaborative life science and technology campuses in AAA innovation cluster locations with a total market capitalization of
$21.8 billion
and an asset base in North America of
33.7 million
SF as of
March 31, 2019
. The asset base in North America includes
23.2 million
RSF of operating properties and
4.4 million
RSF of new Class A properties currently undergoing construction or pre-construction, consisting of
2.1 million
RSF of development and redevelopment projects under construction, and
2.3 million
RSF undergoing pre-construction activities. Additionally, the asset base in North America includes
6.1 million
SF of intermediate-term and future development projects. Founded in 1994, we pioneered this niche and have since established a significant market presence in key locations, including Greater Boston, San Francisco, New York City, San Diego, Seattle, Maryland, and Research Triangle. We have a longstanding and proven track record of developing Class A properties clustered in urban life science and technology campuses that provide our innovative tenants with highly dynamic and collaborative environments that enhance their ability to successfully recruit and retain world-class talent and inspire productivity, efficiency, creativity, and success. Alexandria also provides strategic capital to transformative life science and technology companies through our venture capital arm. We believe these advantages result in higher occupancy levels, longer lease terms, higher rental income, higher returns, and greater long-term asset value.
As of
March 31, 2019
:
|
•
|
Investment-grade or publicly traded large cap tenants represented
50%
of our total annual rental revenue;
|
|
•
|
Approximately
97%
of our leases (on an RSF basis) were triple net leases, which require tenants to pay substantially all real estate taxes, insurance, utilities, repairs and maintenance, common area expenses, and other operating expenses (including increases thereto) in addition to base rent;
|
|
•
|
Approximately
95%
of our leases (on an RSF basis) contained effective annual rent escalations that were either fixed (generally ranging from approximately
3%
to
3.5%
)
or indexed based on a consumer price index or other index; and
|
|
•
|
Approximately
96%
of our leases (on an RSF basis)
provided for the recapture of capital expenditures (such as HVAC systems maintenance and/or replacement, roof replacement, and parking lot resurfacing) that we believe would typically be borne by the landlord in traditional office leases.
|
Our primary business objective is to maximize stockholder value by providing our stockholders with the greatest possible total return and long-term asset value based on a multifaceted platform of internal and external growth. A key element of our strategy is our unique focus on Class A properties clustered in urban campuses. These key urban campus locations are characterized by high barriers to entry for new landlords, high barriers to exit for tenants, and a limited supply of available space. They generally represent highly desirable locations for tenancy by life science and technology entities because of their close proximity to concentrations of specialized skills, knowledge, institutions, and related businesses. Our strategy also includes drawing upon our deep and broad real estate, life science, and technology relationships in order to identify and attract new and leading tenants and to source additional value-creation real estate.
Executive summary
Operating results
|
Three Months Ended March 31,
|
|||||||
|
2019
|
2018
|
||||||
|
Net income attributable to Alexandria’s common stockholders – diluted:
|
|||||||
|
In millions
|
$
|
123.6
|
|
$
|
132.4
|
|
|
|
Per share
|
$
|
1.11
|
|
$
|
1.32
|
|
|
|
Funds from operations attributable to Alexandria’s common stockholders – diluted, as adjusted:
|
|||||||
|
In millions
|
$
|
189.8
|
|
$
|
162.5
|
|
|
|
Per share
|
$
|
1.71
|
|
$
|
1.62
|
|
|
The operating results shown above include certain items related to corporate-level investing and financing decisions. Refer to the tabular presentation of these items at the beginning of the “Results of Operations” section within this Item 2 for additional information.
51
25th anniversary: an important milestone in company history
In January 2019, we celebrated the 25th anniversary of our founding. Since our initial launch in January 1994 as a garage startup with a unique, strategic business plan, $19 million in Series A capital, and a vision to create a new kind of real estate company focused on serving the life science industry, we have grown into an investment-grade rated S&P 500
®
company with a total market capitalization of
$21.8 billion
. From our initial public offering in May 1997 through the
three months ended March 31, 2019
we have generated a total shareholder return of
1,542%
, assuming the reinvestment of dividends.
A REIT industry-leading, high-quality tenant roster
50%
of annual rental revenue from investment-grade or publicly traded large cap tenants.
Continuation of strong rental rate growth
Strong rental rate increases (cash basis) of
24.3%
for the
three months ended March 31, 2019
represents our highest quarterly cash rental rate increase over the past 10 years.
Credit rating improvement
In February 2019, S&P Global Ratings raised our corporate issuer credit rating to BBB+/Stable from BBB/Positive. The rating upgrade reflects our consistently strong operating performance and continued successful delivery of our value-creation pipeline.
Sale of partial interest in core Class A property
In February 2019, we sold a
60%
interest in 75/125 Binney Street, a Class A property in our Cambridge submarket, for a sales price of
$438 million
, or
$1,880
per RSF, representing a
4.3%
capitalization rate on net operating income (cash basis) for the three months ended December 31, 2018, annualized. We retained control over, and continue to consolidate, the new joint venture. We accounted for the $202.2 million difference between the consideration received and the book value of the 60% interest sold as an equity transaction with no gain recognized in earnings.
Anchor lease with Pinterest, Inc. at 88 Bluxome Street
In March 2019, we leased
488,899
RSF to Pinterest, Inc. at 88 Bluxome Street in our Mission Bay/SoMa submarket. The lease with Pinterest, Inc. brings pre-leasing of the
1.1 million
SF future development project to
58%
.
Increased common stock dividend
Common stock dividend declared for the
three months ended March 31, 2019
, of
$0.97
per common share, up
seven cents
, or
7.8%
, over the
three months ended March 31, 2018
; continuation of our strategy to share growth in cash flows from operating activities with our stockholders while also retaining a significant portion for reinvestment.
Strong internal growth
|
•
|
Total revenues of
$358.8 million
, up
12.1%
, for the
three months ended March 31, 2019
, compared to
$320.1 million
for the
three months ended March 31, 2018
.
|
|
•
|
Net operating income (cash basis) of
$892.9 million
for the
three months ended March 31, 2019
, annualized, up
$134.6 million
, or
17.8%
, compared to the three months ended March 31, 2018, annualized.
|
|
•
|
Same property net operating income growth of
2.3%
and
10.2%
(cash basis) for the
three months ended March 31, 2019
, compared to the
three months ended March 31, 2018
.
|
|
•
|
Continued strong leasing activity and rental rate growth in light of modest contractual lease expirations at the beginning of 2019 and a highly leased value-creation pipeline:
|
|
Three Months Ended March 31, 2019
|
||||
|
Total leasing activity – RSF
|
1,248,972
|
|
||
|
Lease renewals and re-leasing of space:
|
||||
|
RSF (included in total leasing activity above)
|
509,415
|
|
||
|
Rental rate increases
|
32.9%
|
|
||
|
Rental rate increases (cash basis)
|
24.3%
|
|
||
52
Future growth in net operating income (cash basis) driven by recently delivered projects
Significant near-term growth of net operating income (cash basis) of
$65 million
upon the burn-off of initial free rent on recently delivered projects.
Strong external growth; disciplined allocation of capital to visible, highly leased value-creation pipeline
Since the beginning of the fourth quarter 2018, we have placed into service
1.0 million
RSF of development and redevelopment projects, including the following projects during the first quarter of 2019:
|
Property
|
Submarket
|
RSF
|
Leased
|
Tenant
|
|||||
|
279 East Grand Avenue
|
South San Francisco
|
139,810
|
|
100%
|
Verily Life Sciences, LLC; insitro, Inc.
|
||||
|
399 Binney Street
|
Cambridge
|
123,403
|
|
100%
|
Three life science entities
|
||||
|
188 East Blaine Street
|
Lake Union
|
90,615
|
|
100%
|
bluebird bio, Inc.;
Seattle Cancer Care Alliance;
Sana Biotechnology, Inc.
|
||||
|
681 Gateway Boulevard
|
South San Francisco
|
66,000
|
|
100%
|
Eli Lilly and Company
|
||||
|
Alexandria PARC
|
Greater Stanford
|
48,547
|
|
100%
|
Workday, Inc.
|
||||
|
•
|
Commencements of development projects aggregating
356,904
RSF during the
three months ended March 31, 2019
, including:
|
|
•
|
174,640
RSF at 9800 Medical Center Drive in our Rockville submarket, which is
79%
leased to REGENXBIO, Inc.;
|
|
•
|
98,000
RSF at 9880 Campus Point Drive in our University Town Center submarket; and
|
|
•
|
84,264
RSF at 9950 Medical Center Drive in our Rockville submarket, which is
100%
leased to Autolus Therapeutics PLC.
|
Completed acquisitions
Refer to the “Acquisitions” subsection of the “Investments in Real Estate” section within Item 2 of this report for information on our opportunistic acquisitions.
Core operating metrics as of or for the
three months ended March 31, 2019
|
Percentage of annual rental revenue in effect from:
|
|||||
|
Investment-grade or publicly traded large cap tenants
|
50
|
%
|
|||
|
Class A properties in AAA locations
|
77
|
%
|
|||
|
Occupancy of operating properties in North America
|
97.2
|
%
|
|||
|
Operating margin
|
72
|
%
|
|||
|
Adjusted EBITDA margin
|
70
|
%
|
|||
|
Weighted-average remaining lease term:
|
|||||
|
All tenants
|
8.4
|
years
|
|||
|
Top 20 tenants
|
12.1
|
years
|
|||
Refer to the “Strong Internal Growth” subsection on the previous page for information on our total revenues, net operating income, same property net operating income growth, leasing activity, and rental rate growth.
53
Balance sheet management
Key metrics as of
March 31, 2019
|
•
|
$15.9 billion
of total equity capitalization
|
|
•
|
$21.8 billion
of total market capitalization
|
|
•
|
$2.7 billion
of liquidity
|
|
•
|
No
unhedged variable-rate debt
|
|
•
|
95%
of unencumbered net operating income as a percentage of total net operating income
|
|
As of March 31, 2019
|
Goal for Fourth Quarter of 2019
|
||||||
|
Quarter Annualized
|
Trailing 12 Months
|
||||||
|
Net debt to Adjusted EBITDA
|
5.4x
|
5.8x
|
Less than or equal to 5.3x
|
(1)
|
|||
|
Fixed-charge coverage ratio
|
4.5x
|
4.2x
|
Greater than 4.0x
|
(1)
|
|||
|
Total value-creation pipeline as a percentage of gross investments in real estate in North America
|
10%
|
N/A
|
8% to 12%
|
||||
|
(1)
|
Quarter annualized.
|
Key capital events
|
•
|
During the
three months ended March 31, 2019
, we successfully increased our weighted-average remaining term of debt outstanding to over
seven
years, as a result of the following:
|
|
•
|
In March 2019, we completed an offering of
$850.0 million
of unsecured senior notes for net proceeds of
$846.1 million
. The unsecured senior notes consisted of:
|
|
•
|
$300.0 million
of
4.85%
unsecured senior notes due
2049
.
|
|
•
|
$350.0 million
of
3.80%
unsecured senior notes due
2026
. The net proceeds were used to repay a secured note payable related to 50/60 Binney Street, a recently completed Class A property, which was awarded LEED
®
Gold certification, and the remaining proceeds will be allocated to fund recently completed and future eligible green projects.
|
|
•
|
$200.0 million
of our
4.00%
unsecured senior notes payable due
2024
, issued at a yield to maturity of
3.453%
, and are part of the same series that was originally issued in 2018. The net proceeds will also be used to fund recently completed and future eligible green projects.
|
|
•
|
In March 2019, we repaid the remaining
$193.1 million
balance of our secured construction loan related to 50/60 Binney Street and recognized a loss on early extinguishment of debt of
$269 thousand
.
|
|
•
|
In January 2019, we repaid early one secured note payable aggregating
$106.7 million
, which was due in 2020 and bore interest at
7.75%
, and recognized a loss on early extinguishment of debt of
$7.1 million
, including the write-off of unamortized loan fees.
|
|
•
|
During the
three months ended March 31, 2019
, we repurchased, in privately negotiated transactions,
275,000
shares of our 7.00% Series D cumulative convertible preferred stock for
$9.2 million
, or
$33.60
per share, and recognized a preferred stock redemption charge of
$2.6 million
. As of
March 31, 2019
,
2.3 million
shares of our 7.00% Series D cumulative convertible preferred stock were outstanding at a book value aggregating
$57.5 million
.
|
|
•
|
During the first quarter of 2019 and through the date of this report, there was no sale activity under our ATM common stock offering program. Refer to Note 14 – “Stockholders’ Equity” to our unaudited consolidated financial statements under Item 1 of this report for more information related to our ATM common stock offering program.
|
Investments
We carry our investments in publicly traded companies and certain privately held entities at fair value. As of
March 31, 2019
, cumulative unrealized gains related to changes in fair value aggregated
$312.4 million
and our adjusted cost basis aggregated
$688.5 million
. Investment income recognized during the
three months ended March 31, 2019
included the following:
|
•
|
Unrealized gains of
$72.2 million
; and
|
|
•
|
Realized gains of
$11.4 million
.
|
54
Corporate responsibility and industry leadership
|
•
|
In February 2019, it was announced that we are working with Verily Life Sciences, LLC, Alphabet’s life science division, to build a tech-focused rehabilitation campus in Dayton, Ohio, for the full and sustained recovery of people living with opioid addiction. The campus will provide a comprehensive model of care that will include a behavioral health treatment center, rehabilitation housing, and wrap-around services, and will act as a state of the art model for opioid addiction treatment nationwide.
|
|
•
|
In February 2019, we were recognized by the Center for Active Design, which operates Fitwel
®
, as the inaugural Industry Leading Company in Fitwel’s 2018 Best in Building Health. We were selected based on our 3-Star Fitwel certification (the highest rating possible); our leadership in promoting and educating the real estate industry on the opportunities for and benefits of building design, construction, and operational practices that support high levels of occupant health and wellness; and our #1 global ranking in the 2018 GRESB Health & Well-Being Module.
|
|
•
|
In March 2019, Alexandria LaunchLabs
®
– Cambridge, located at the Alexandria Center
®
at One Kendall Square in Greater Boston, achieved LEED gold certification and a Fitwel 3-Star certification
.
|
Subsequent events
|
•
|
In April 2019, we entered into an agreement to extend the maturity date of our unsecured senior bank term loan to
January 2, 2025
. We expect that the extension will become effective in June 2019 upon the satisfaction of certain conditions.
|
|
•
|
In April 2019, we announced the launch of a new strategic agricultural technology (agtech) business initiative with the opening of the Alexandria Center
®
for AgTech – Research Triangle, the first state of the art, fully integrated, multi-tenant, amenity rich agtech R&D and greenhouse campus. The campus opens with a 97% leased first phase, a 175,000 RSF redevelopment, at 5 Laboratory Drive, in the heart of Research Triangle, the most important, dense, and diverse agtech cluster in the United States.
|
55
Operating summary
|
Favorable Lease Structure
(1)
|
Same Property Net Operating Income Growth
|
|||||||||
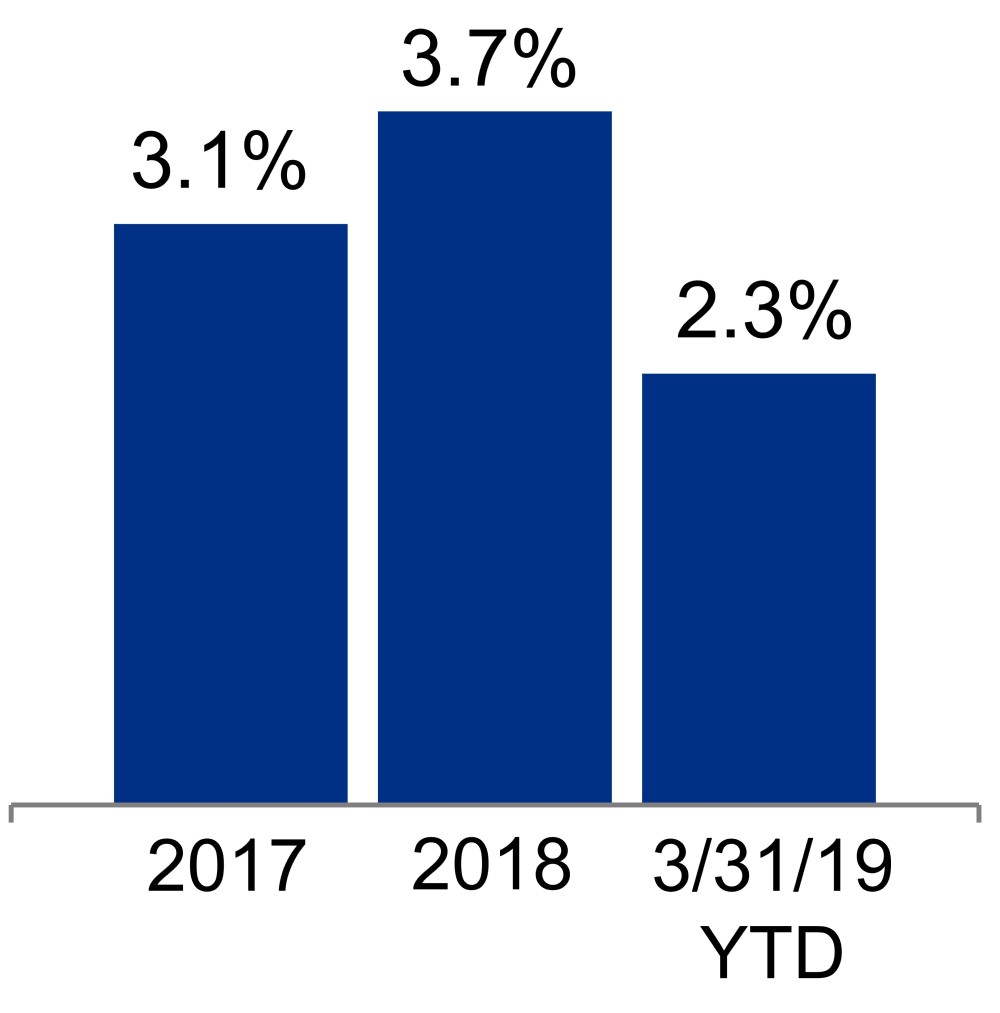
|
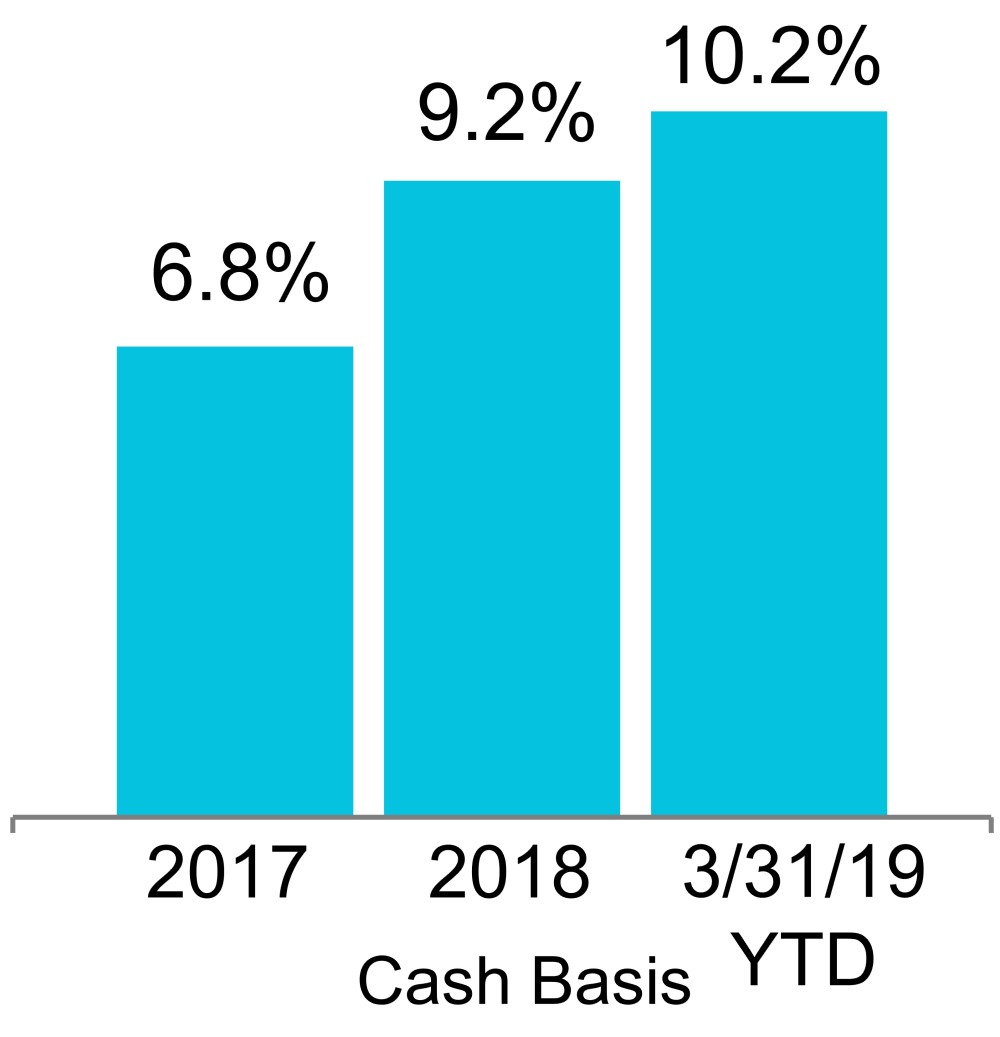
|
|||||||||
|
Stable cash flows
|
||||||||||
|
Percentage of triple
net leases
|
97%
|
|||||||||
|
Increasing cash flows
|
||||||||||
|
Percentage of leases containing annual rent escalations
|
95%
|
|||||||||
|
Lower capex burden
|
||||||||||
|
Percentage of leases providing for the recapture of capital expenditures
|
96%
|
|||||||||
|
Margins
(2)
|
Rental Rate Growth:
Renewed/Re-Leased Space |
|||||||||
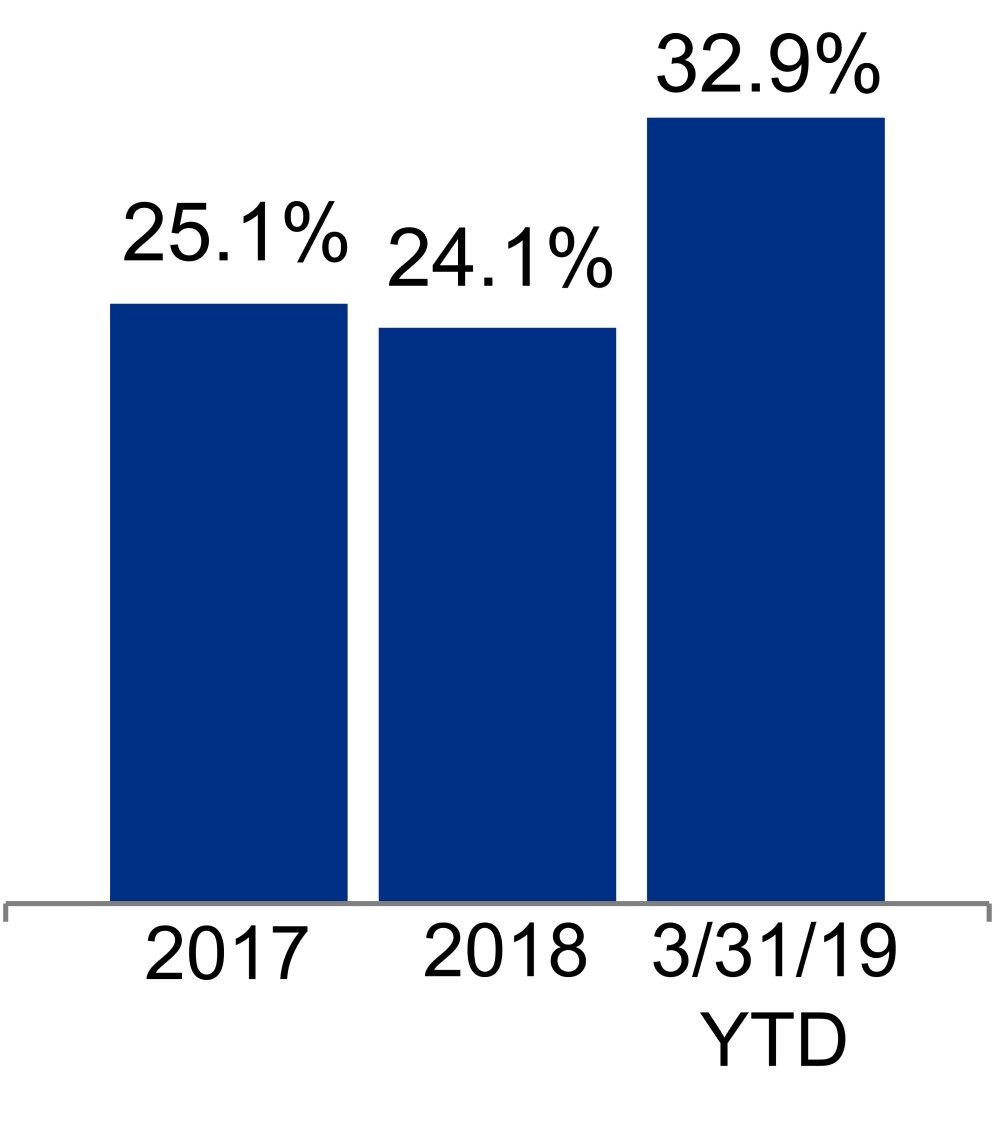
|
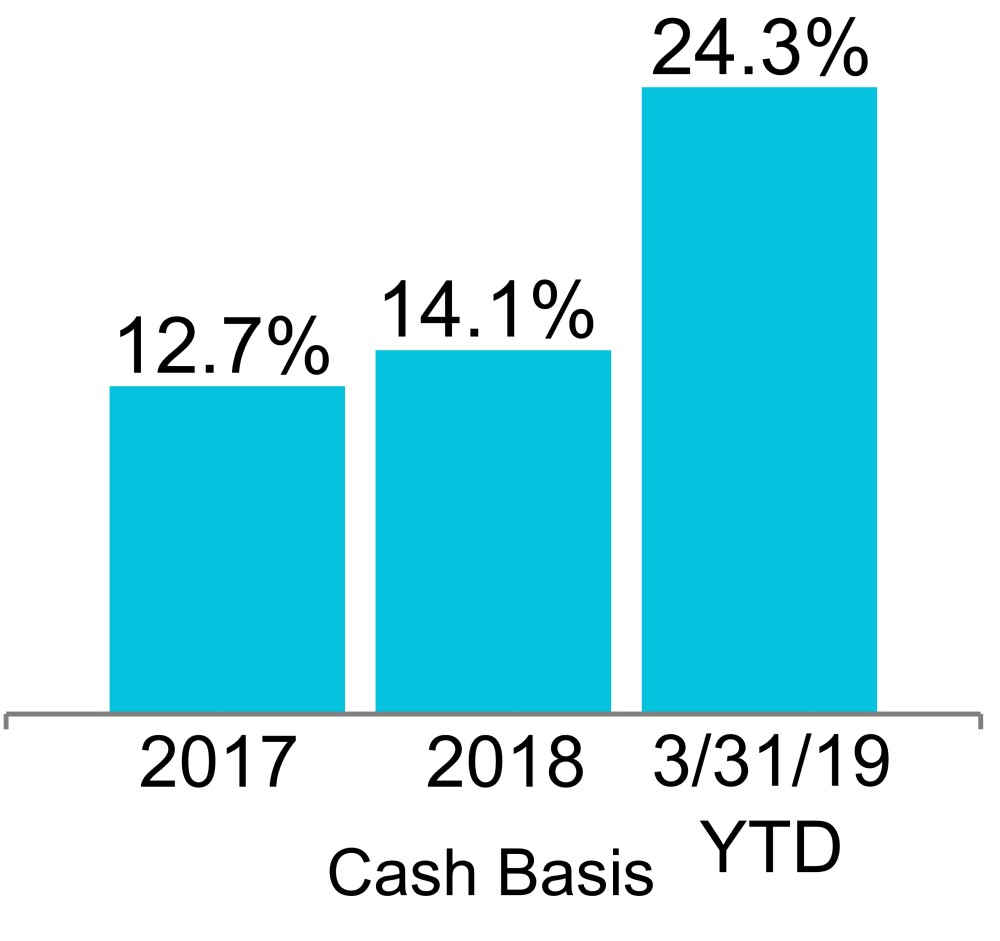
|
|||||||||
|
Operating
|
Adjusted EBITDA
|
|||||||||
|
72%
|
70%
|
|||||||||
|
(1)
|
Percentages calculated based on RSF
as of March 31, 2019
.
|
|
(2)
|
Represents percentages for the
three months ended March 31, 2019
.
|
56
|
Cash Flows From High-Quality, Diverse, and Innovative Tenants
|
|||
|
Annual Rental Revenue
(1)
From Investment-Grade
or Publicly Traded Large Cap Tenants
A REIT Industry-Leading Tenant Roster
|
|||
|
50%
|
|||
|
Tenant Mix
|
|||
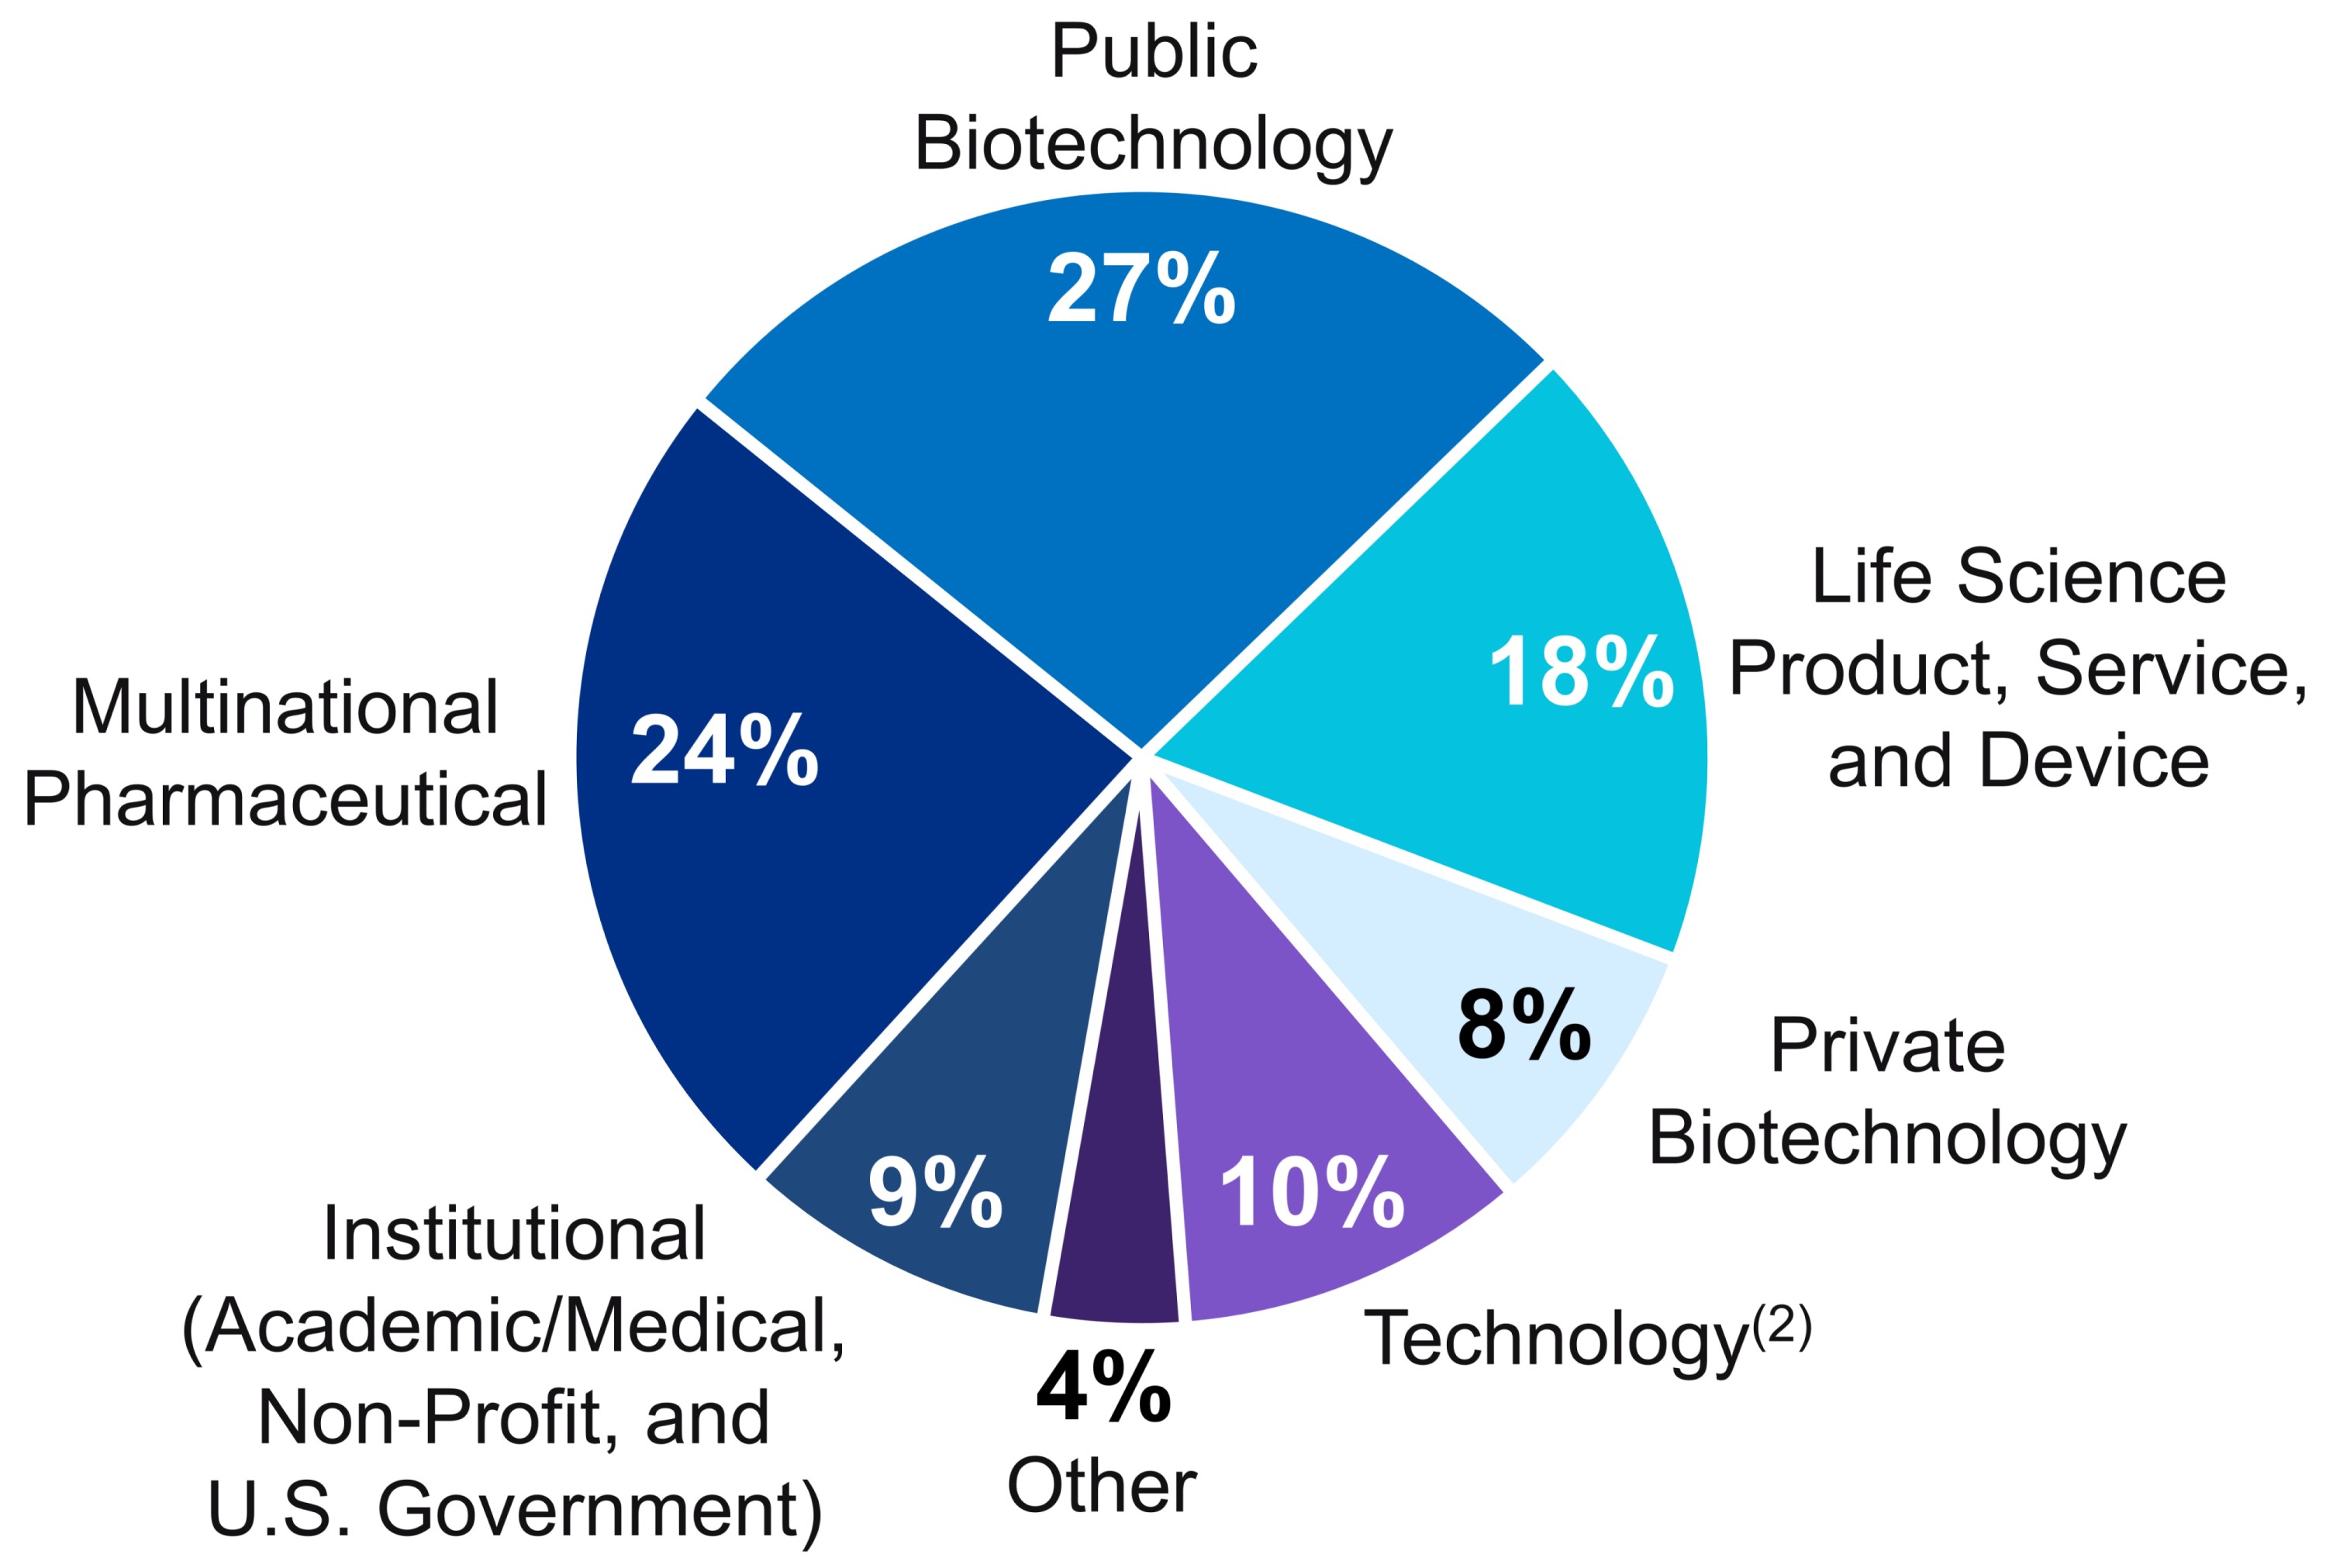
|
|||
|
Percentage of ARE’s Annual Rental Revenue
(1)
|
|||
|
(1)
|
Represents annual rental revenue in effect as of
March 31, 2019
. Refer to the “Non-GAAP Measures and Definitions” section within this Item 2 for additional information.
|
|
(2)
|
Our annual rental revenue from technology tenants consists of:
|
|
•
|
38%
from investment-grade credit rated or publicly traded large cap tenants
|
|
•
|
47%
from Uber Technologies, Inc., Stripe, Inc., and Pinterest, Inc.
|
|
•
|
15%
from all other technology tenants
|
57
|
High-Quality Cash Flows From Class A Properties in AAA Locations
|
|
|
Class A Properties in
AAA Locations
|
AAA Locations
|
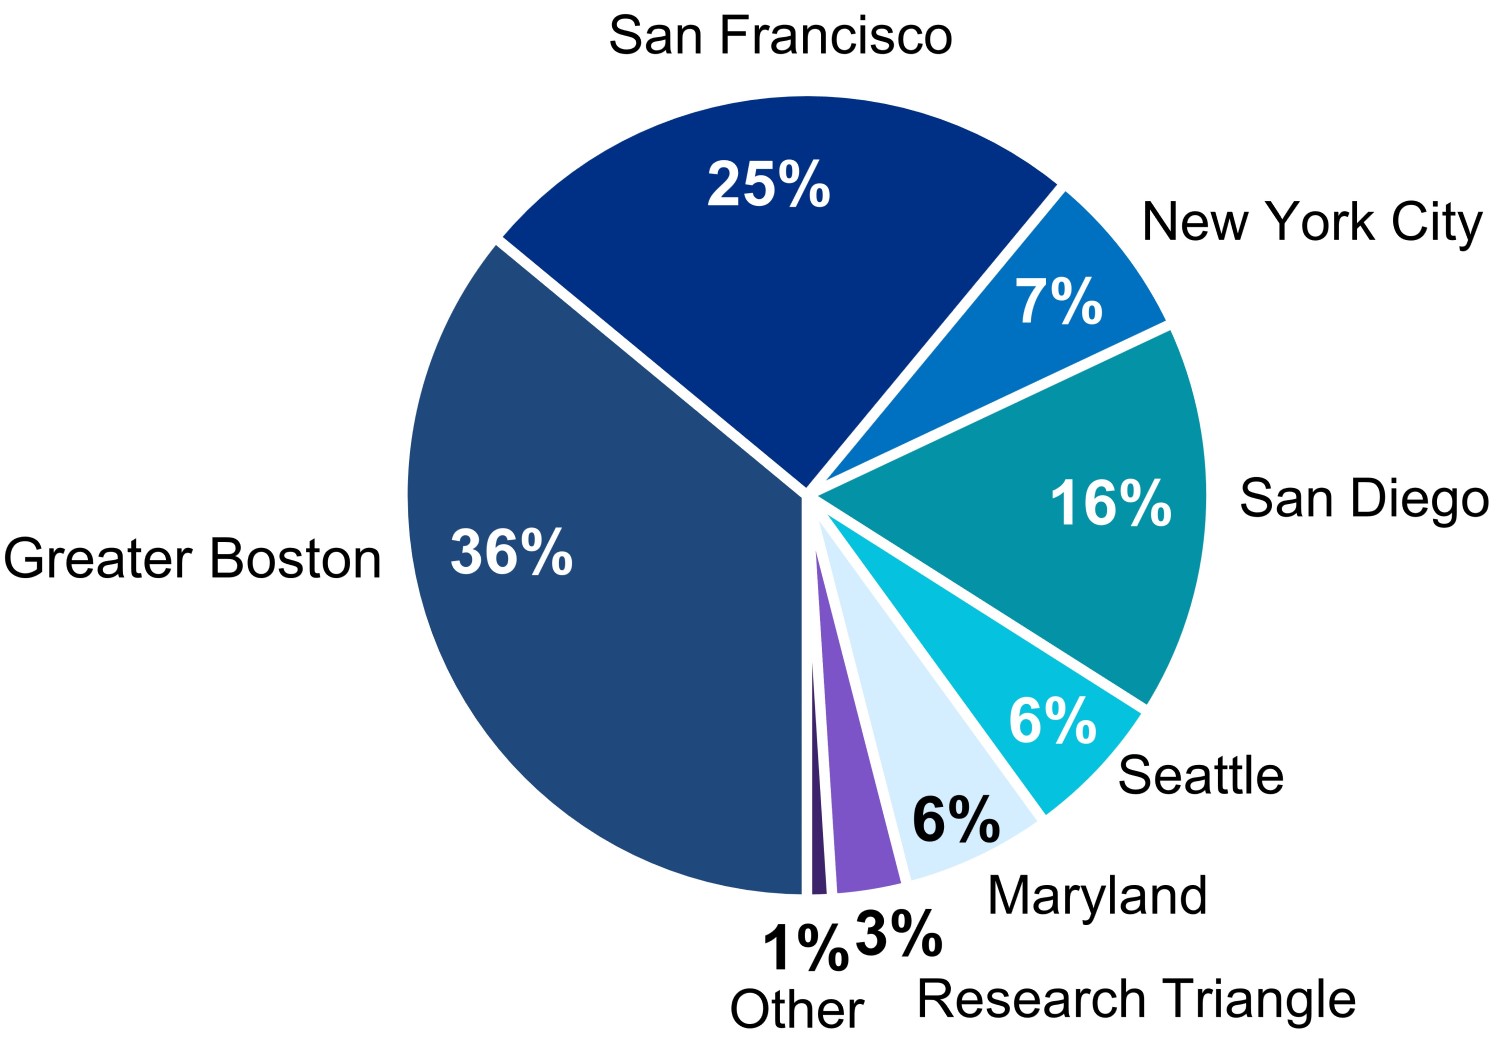
|
|
|
77%
|
|
|
of ARE’s
Annual Rental Revenue (1) |
|
|
Percentage of ARE’s Annual Rental Revenue
(1)
|
|
|
Solid Demand for Class A Properties
in AAA Locations Drives Solid Occupancy
|
|
|
Solid Historical
Occupancy (2) |
Occupancy Across Key Locations
|
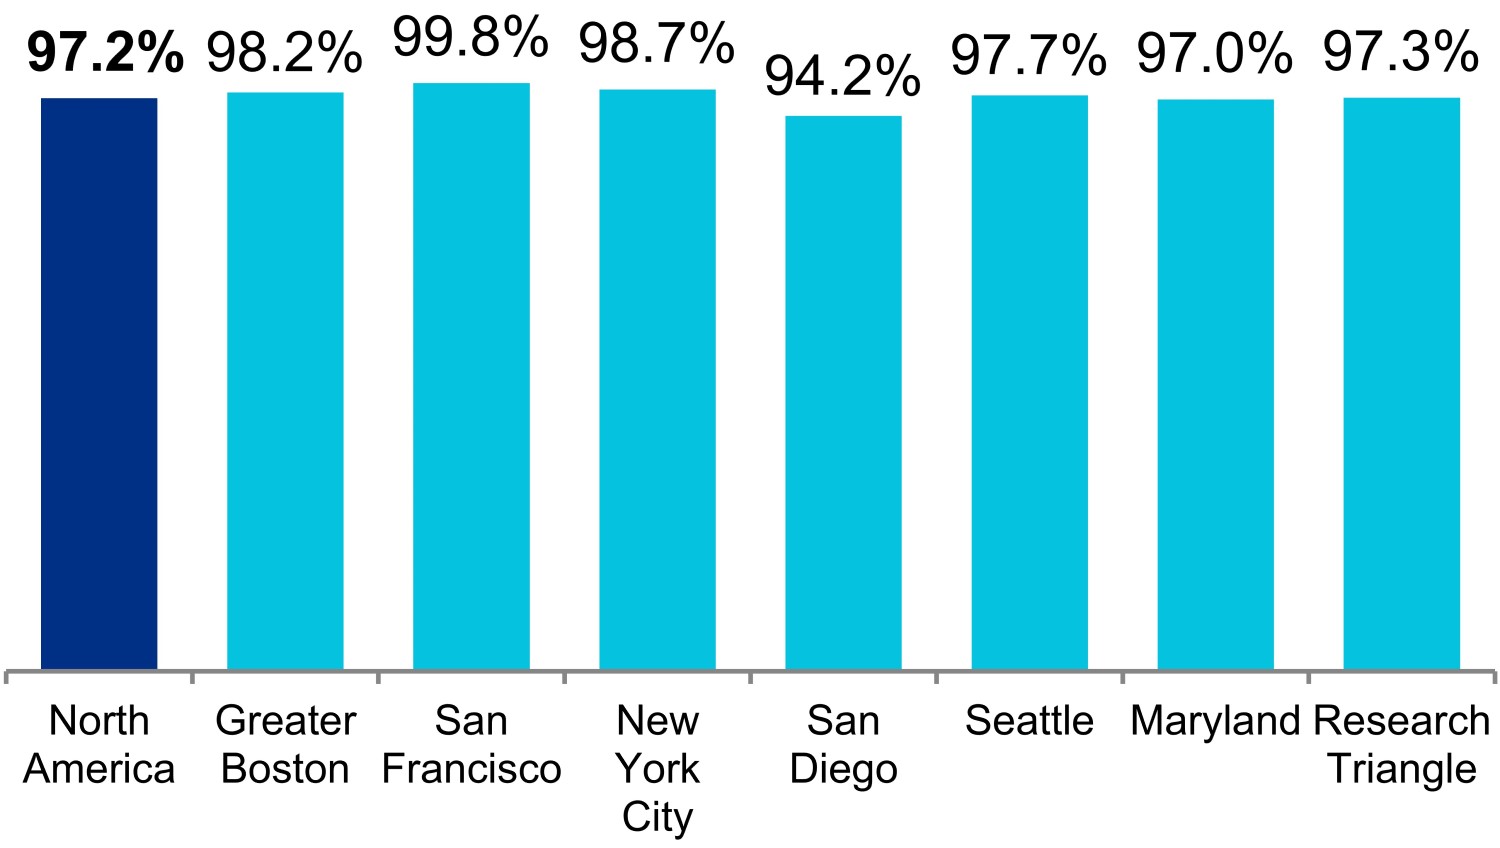
|
|
|
96%
|
|
|
Over 10 Years
|
|
|
(1)
|
Represents annual rental revenue in effect as of
March 31, 2019
. Refer to the “Non-GAAP Measures and Definitions” section within this Item 2 for additional information.
|
|
(2)
|
Average occupancy of operating properties in North America as of each December 31 for the last 10 years and as of
March 31, 2019
.
|
58
Leasing
The following table summarizes our leasing activity at our properties:
|
Three Months Ended
|
Year Ended
|
|||||||||||||||
|
March 31, 2019
|
December 31, 2018
|
|||||||||||||||
|
Including
Straight-Line Rent
|
Cash Basis
|
Including
Straight-Line Rent
|
Cash Basis
|
|||||||||||||
|
(Dollars per RSF)
|
||||||||||||||||
|
Leasing activity:
|
||||||||||||||||
|
Renewed/re-leased space
(1)
|
|
|
|
|
|
|
|
|
||||||||
|
Rental rate changes
|
32.9%
|
|
24.3%
|
|
24.1%
|
|
14.1%
|
|
||||||||
|
New rates
|
$
|
43.86
|
|
$
|
41.20
|
|
$
|
55.05
|
|
$
|
52.79
|
|
||||
|
Expiring rates
|
$
|
33.00
|
|
$
|
33.15
|
|
$
|
44.35
|
|
$
|
46.25
|
|
||||
|
Rentable square footage
|
509,415
|
|
2,088,216
|
|
||||||||||||
|
Tenant improvements/leasing commissions
|
$
|
17.10
|
|
$
|
20.61
|
|
||||||||||
|
Weighted-average lease term
|
6.5 years
|
|
6.1 years
|
|
||||||||||||
|
Developed/redeveloped/previously vacant space leased
|
||||||||||||||||
|
New rates
|
$
|
64.90
|
|
$
|
64.25
|
|
$
|
58.45
|
|
$
|
48.73
|
|
||||
|
Rentable square footage
|
739,557
|
|
2,633,476
|
|
||||||||||||
|
Tenant improvements/leasing commissions
|
$
|
21.32
|
|
$
|
12.57
|
|
||||||||||
|
Weighted-average lease term
|
11.3 years
|
|
11.5 years
|
|
||||||||||||
|
Leasing activity summary (totals):
|
||||||||||||||||
|
New rates
|
$
|
56.32
|
|
$
|
54.85
|
|
$
|
56.94
|
|
$
|
50.52
|
|
||||
|
Rentable square footage
|
1,248,972
|
|
(2)
|
4,721,692
|
|
|||||||||||
|
Tenant improvements/leasing commissions
|
$
|
19.60
|
|
$
|
16.13
|
|
||||||||||
|
Weighted-average lease term
|
9.3 years
|
|
9.1 years
|
|
||||||||||||
|
Lease expirations
(1)
|
||||||||||||||||
|
Expiring rates
|
$
|
32.96
|
|
$
|
33.56
|
|
$
|
42.98
|
|
$
|
45.33
|
|
||||
|
Rentable square footage
|
647,750
|
|
2,811,021
|
|
||||||||||||
Leasing activity includes 100% of results for properties in which we have an investment in North America and excludes properties classified as held for sale.
|
(1)
|
Excludes month-to-month leases aggregating
40,581
RSF and
50,548
RSF as of
March 31, 2019
, and
December 31, 2018
, respectively.
|
|
(2)
|
During the
three months ended March 31, 2019
, we granted tenant concessions/free rent averaging
2.6
months with respect to the
1,248,972
RSF leased. Approximately
66%
of the leases executed during the
three months ended March 31, 2019
, did not include concessions for free rent.
|
59
Summary of contractual lease expirations
The following table summarizes information with respect to the contractual lease expirations at our properties as of
March 31, 2019
:
|
Year
|
RSF
|
Percentage of
Occupied RSF |
Annual Rental Revenue
(per RSF) (1) |
Percentage of Total
Annual Rental Revenue |
|||||||||||||||||||
|
2019
|
(2)
|
859,904
|
|
3.8
|
%
|
$
|
41.57
|
|
3.3
|
%
|
|||||||||||||
|
2020
|
1,754,330
|
|
7.8
|
%
|
$
|
36.68
|
|
5.9
|
%
|
||||||||||||||
|
2021
|
1,538,636
|
|
6.8
|
%
|
$
|
39.76
|
|
5.6
|
%
|
||||||||||||||
|
2022
|
1,865,851
|
|
8.3
|
%
|
$
|
42.69
|
|
7.3
|
%
|
||||||||||||||
|
2023
|
2,341,908
|
|
10.4
|
%
|
$
|
43.64
|
|
9.4
|
%
|
||||||||||||||
|
2024
|
1,940,738
|
|
8.6
|
%
|
$
|
47.59
|
|
8.5
|
%
|
||||||||||||||
|
2025
|
1,593,735
|
|
7.1
|
%
|
$
|
47.56
|
|
6.9
|
%
|
||||||||||||||
|
2026
|
1,194,379
|
|
5.3
|
%
|
$
|
46.56
|
|
5.1
|
%
|
||||||||||||||
|
2027
|
2,209,690
|
|
9.8
|
%
|
$
|
46.97
|
|
9.5
|
%
|
||||||||||||||
|
2028
|
1,514,469
|
|
6.7
|
%
|
$
|
59.36
|
|
8.2
|
%
|
||||||||||||||
|
Thereafter
|
5,726,767
|
|
25.4
|
%
|
$
|
57.73
|
|
30.3
|
%
|
||||||||||||||
|
(1)
|
Represents amounts in effect as of
March 31, 2019
.
|
|
(2)
|
Excludes month-to-month leases for
40,581
RSF as of
March 31, 2019
.
|
The following tables present information by market with respect to our lease expirations in North America as of
March 31, 2019
, for the remainder of
2019
and all of
2020
:
|
2019 Contractual Lease Expirations (in RSF)
|
Annual Rental Revenue
(per RSF) (3) |
||||||||||||||||||
|
Market
|
Leased
|
Negotiating/
Anticipating |
Targeted for
Redevelopment |
Remaining
Expiring Leases (1) |
Total
(2)
|
||||||||||||||
|
Greater Boston
|
88,138
|
|
127,909
|
|
—
|
|
20,616
|
|
236,663
|
|
$
|
55.88
|
|
||||||
|
San Francisco
|
22,207
|
|
17,086
|
|
—
|
|
87,812
|
|
127,105
|
|
40.03
|
|
|||||||
|
New York City
|
—
|
|
6,350
|
|
—
|
|
2,581
|
|
8,931
|
|
N/A
|
|
|||||||
|
San Diego
|
89,469
|
|
—
|
|
—
|
|
134,752
|
|
224,221
|
|
33.29
|
|
|||||||
|
Seattle
|
106,003
|
|
—
|
|
—
|
|
58,841
|
|
164,844
|
|
45.38
|
|
|||||||
|
Maryland
|
17,630
|
|
—
|
|
—
|
|
8,022
|
|
25,652
|
|
22.75
|
|
|||||||
|
Research Triangle
|
—
|
|
—
|
|
—
|
|
25,889
|
|
25,889
|
|
18.75
|
|
|||||||
|
Canada
|
—
|
|
—
|
|
—
|
|
—
|
|
—
|
|
—
|
|
|||||||
|
Non-cluster markets
|
—
|
|
7,465
|
|
—
|
|
39,134
|
|
46,599
|
|
22.50
|
|
|||||||
|
Total
|
323,447
|
|
158,810
|
|
—
|
|
377,647
|
|
859,904
|
|
$
|
41.57
|
|
||||||
|
Percentage of expiring leases
|
38
|
%
|
18
|
%
|
—
|
%
|
44
|
%
|
100
|
%
|
|||||||||
|
2020 Contractual Lease Expirations (in RSF)
|
Annual Rental Revenue
(per RSF) (3) |
||||||||||||||||||
|
Market
|
Leased
|
Negotiating/
Anticipating |
Targeted for
Redevelopment |
Remaining
Expiring Leases (4) |
Total
|
||||||||||||||
|
Greater Boston
|
69,673
|
|
36,973
|
|
—
|
|
408,497
|
|
515,143
|
|
$
|
46.46
|
|
||||||
|
San Francisco
|
21,699
|
|
—
|
|
—
|
|
260,261
|
|
281,960
|
|
43.42
|
|
|||||||
|
New York City
|
—
|
|
13,482
|
|
—
|
|
37,580
|
|
51,062
|
|
N/A
|
|
|||||||
|
San Diego
|
679
|
|
—
|
|
—
|
|
285,236
|
|
285,915
|
|
28.45
|
|
|||||||
|
Seattle
|
109,969
|
|
—
|
|
—
|
|
33,099
|
|
143,068
|
|
50.47
|
|
|||||||
|
Maryland
|
—
|
|
10,950
|
|
—
|
|
244,862
|
|
255,812
|
|
22.23
|
|
|||||||
|
Research Triangle
|
—
|
|
22,555
|
|
—
|
|
69,992
|
|
92,547
|
|
16.38
|
|
|||||||
|
Canada
|
56,847
|
|
—
|
|
—
|
|
42,070
|
|
98,917
|
|
28.04
|
|
|||||||
|
Non-cluster markets
|
—
|
|
—
|
|
—
|
|
29,906
|
|
29,906
|
|
30.73
|
|
|||||||
|
Total
|
258,867
|
|
83,960
|
|
—
|
|
1,411,503
|
|
1,754,330
|
|
$
|
36.68
|
|
||||||
|
Percentage of expiring leases
|
15
|
%
|
5
|
%
|
—
|
%
|
80
|
%
|
100
|
%
|
|||||||||
|
(1)
|
Includes
116,556
RSF expiring in June 2019 at 3545 Cray Court in our Torrey Pines submarket, which is under evaluation for options to renovate as a Class A office/laboratory building. Any renovation we may undertake at this property will not be classified as a redevelopment, and as such the property will remain in our same properties. The next largest contractual lease expiration in 2019 is
50,400
RSF in our South San Francisco submarket.
|
|
(2)
|
Excludes month-to-month leases aggregating
40,581
RSF as of
March 31, 2019
.
|
|
(3)
|
Represents amounts in effect as of
March 31, 2019
.
|
|
(4)
|
The largest remaining contractual lease expiration in 2020 is
74,137
RSF in our South San Francisco submarket.
|
60
Top 20 tenants
79%
of Top 20 Annual Rental Revenue from Investment-Grade
or Publicly Traded Large Cap Tenants
(1)
Our properties are leased to a high-quality and diverse group of tenants, with no individual tenant accounting for more than
3.5%
of our annual rental revenue in effect as of
March 31, 2019
. The following table sets forth information regarding leases with our 20 largest tenants in North America based upon annual rental revenue in effect as of
March 31, 2019
(dollars in thousands, except average market cap amounts):
|
Remaining Lease Term in Years
(1)
|
Aggregate
RSF
|
Annual
Rental
Revenue
(1)
|
Percentage of Aggregate Annual Rental Revenue
(1)
|
Investment-Grade Credit Ratings
|
Average Market Cap
(2)
(in billions)
|
||||||||||||||||||||||||
|
Tenant
|
Moody’s
|
S&P
|
|||||||||||||||||||||||||||
|
1
|
|
Takeda Pharmaceutical Company Ltd.
|
10.4
|
|
606,248
|
|
$
|
39,159
|
|
3.5%
|
Baa2
|
BBB+
|
$
|
39.1
|
|
||||||||||||||
|
2
|
|
Illumina, Inc.
|
11.4
|
|
891,495
|
|
34,830
|
|
3.1
|
—
|
BBB
|
$
|
44.6
|
|
|||||||||||||||
|
3
|
|
Eli Lilly and Company
|
10.1
|
|
554,089
|
|
34,096
|
|
3.1
|
A2
|
A+
|
$
|
110.8
|
|
|||||||||||||||
|
4
|
|
Sanofi
|
8.9
|
|
494,693
|
|
30,347
|
|
2.7
|
A1
|
AA
|
$
|
105.8
|
|
|||||||||||||||
|
5
|
|
Celgene Corporation
(3)
|
7.1
|
|
614,082
|
|
28,855
|
|
2.6
|
Baa2
|
BBB+
|
$
|
59.0
|
|
|||||||||||||||
|
6
|
|
Novartis AG
|
8.3
|
|
336,794
|
|
26,343
|
|
2.4
|
A1
|
AA-
|
$
|
214.8
|
|
|||||||||||||||
|
7
|
|
Merck & Co., Inc.
|
11.9
|
|
454,752
|
|
25,439
|
|
2.3
|
A1
|
AA
|
$
|
183.6
|
|
|||||||||||||||
|
8
|
|
Bristol-Myers Squibb Company
(3)
|
11.1
|
|
330,185
|
|
24,760
|
|
2.2
|
A2
|
A+
|
$
|
88.5
|
|
|||||||||||||||
|
9
|
|
Uber Technologies, Inc.
|
73.7
|
|
(4)
|
422,980
|
|
22,205
|
|
2.0
|
—
|
—
|
$
|
—
|
|
||||||||||||||
|
10
|
|
bluebird bio, Inc.
|
7.8
|
|
298,387
|
|
22,106
|
|
2.0
|
—
|
—
|
$
|
7.8
|
|
|||||||||||||||
|
11
|
|
Moderna, Inc.
|
9.6
|
|
356,975
|
|
19,857
|
|
1.8
|
—
|
—
|
$
|
5.9
|
|
|||||||||||||||
|
12
|
|
Roche
|
4.6
|
|
372,943
|
|
19,718
|
|
1.8
|
Aa3
|
AA
|
$
|
210.3
|
|
|||||||||||||||
|
13
|
|
New York University
|
12.1
|
|
203,666
|
|
19,544
|
|
1.8
|
Aa2
|
AA-
|
$
|
—
|
|
|||||||||||||||
|
14
|
|
Stripe, Inc.
|
8.5
|
|
295,333
|
|
17,736
|
|
1.6
|
—
|
—
|
$
|
—
|
|
|||||||||||||||
|
15
|
|
Facebook, Inc.
|
11.4
|
|
382,798
|
|
17,482
|
|
1.6
|
—
|
—
|
$
|
479.0
|
|
|||||||||||||||
|
16
|
|
Pfizer Inc.
|
5.6
|
|
416,226
|
|
17,437
|
|
1.6
|
A1
|
AA
|
$
|
236.2
|
|
|||||||||||||||
|
17
|
|
Amgen Inc.
|
5.0
|
|
407,369
|
|
16,838
|
|
1.5
|
Baa1
|
A
|
$
|
122.9
|
|
|||||||||||||||
|
18
|
|
Massachusetts Institute of Technology
|
6.2
|
|
256,126
|
|
16,729
|
|
1.5
|
Aaa
|
AAA
|
$
|
—
|
|
|||||||||||||||
|
19
|
|
United States Government
|
8.9
|
|
264,358
|
|
15,434
|
|
1.4
|
Aaa
|
AA+
|
$
|
—
|
|
|||||||||||||||
|
20
|
|
FibroGen, Inc.
|
4.6
|
|
234,249
|
|
14,198
|
|
1.3
|
—
|
—
|
$
|
4.5
|
|
|||||||||||||||
|
Total/weighted average
|
12.1
|
|
(4)
|
8,193,748
|
|
$
|
463,113
|
|
41.8%
|
||||||||||||||||||||
Annual rental revenue and RSF include 100% of each property managed by us in North America.
|
(1)
|
Based on aggregate annual rental revenue in effect as of
March 31, 2019
. Refer to “Annual Rental Revenue” in the “Non-GAAP Measures and Definitions” section within this Item 2 for our methodologies on annual rental revenue from unconsolidated real estate joint ventures.
|
|
(2)
|
Average daily market capitalization for the 12 months ended
March 31, 2019
. Refer to “Total Market Capitalization” in the “Non-GAAP Measures and Definitions” section within this Item 2 for additional information.
|
|
(3)
|
In April 2019, Bristol-Myers Squibb Company’s stockholders approved the acquisition of Celgene Corporation with an expected transaction close during the third quarter of 2019. Bristol-Myers Squibb Company currently leases
106,003
RSF at 1201 Eastlake Avenue East in our Lake Union submarket that expires during the first half of 2019, and we have re-leased
100%
of this RSF to an investment-grade institutional research center. Subsequent to the expected close of the transaction during the third quarter of 2019, our annual rental revenue from Bristol-Myers Squibb Company is expected to be approximately
4.4%
based on leases in effect as of
March 31, 2019
.
|
|
(4)
|
Represents a ground lease with Uber Technologies, Inc. at 1455 and 1515 Third Street in our Mission Bay/SoMa submarket. Excluding the ground lease, the weighted-average remaining lease term for our top 20 tenants was
9.0
years
as of March 31, 2019
.
|
61
Locations of properties
The locations of our properties are diversified among a number of life science and technology cluster markets. The following table sets forth the total RSF, number of properties, and annual rental revenue in effect as of
March 31, 2019
, in North America of our properties by market (dollars in thousands, except per RSF amounts):
|
RSF
|
Number of Properties
|
Annual Rental Revenue
|
|||||||||||||||||||||||||||
|
Market
|
Operating
|
Development
|
Redevelopment
|
Total
|
% of Total
|
Total
|
% of Total
|
Per RSF
|
|||||||||||||||||||||
|
Greater Boston
|
6,359,439
|
|
40,597
|
|
31,858
|
|
6,431,894
|
|
25
|
%
|
55
|
|
$
|
397,596
|
|
36
|
%
|
$
|
63.64
|
|
|||||||||
|
San Francisco
|
5,320,933
|
|
1,186,348
|
|
76,400
|
|
6,583,681
|
|
26
|
|
48
|
|
281,135
|
|
25
|
|
54.38
|
|
|||||||||||
|
New York City
|
1,114,282
|
|
—
|
|
140,098
|
|
1,254,380
|
|
5
|
|
4
|
|
79,093
|
|
7
|
|
71.88
|
|
|||||||||||
|
San Diego
|
4,829,402
|
|
98,000
|
|
—
|
|
4,927,402
|
|
19
|
|
61
|
|
172,948
|
|
16
|
|
38.00
|
|
|||||||||||
|
Seattle
|
1,328,332
|
|
107,385
|
|
—
|
|
1,435,717
|
|
6
|
|
13
|
|
65,511
|
|
6
|
|
50.50
|
|
|||||||||||
|
Maryland
|
2,520,352
|
|
258,904
|
|
45,097
|
|
2,824,353
|
|
11
|
|
39
|
|
68,446
|
|
6
|
|
28.18
|
|
|||||||||||
|
Research Triangle
|
1,099,863
|
|
—
|
|
118,863
|
|
1,218,726
|
|
5
|
|
16
|
|
28,535
|
|
3
|
|
26.67
|
|
|||||||||||
|
Canada
|
188,967
|
|
—
|
|
—
|
|
188,967
|
|
1
|
|
2
|
|
4,713
|
|
—
|
|
26.68
|
|
|||||||||||
|
Non-cluster markets
|
390,179
|
|
—
|
|
—
|
|
390,179
|
|
2
|
|
11
|
|
10,183
|
|
1
|
|
32.17
|
|
|||||||||||
|
Properties held for sale
|
68,000
|
|
—
|
|
—
|
|
68,000
|
|
—
|
|
1
|
|
2,385
|
|
—
|
|
N/A
|
|
|||||||||||
|
North America
|
23,219,749
|
|
1,691,234
|
|
412,316
|
|
25,323,299
|
|
100
|
%
|
250
|
|
$
|
1,110,545
|
|
100
|
%
|
$
|
49.56
|
|
|||||||||
|
2,103,550
|
|||||||||||||||||||||||||||||
Summary of occupancy percentages in North America
The following table sets forth the occupancy percentages for our operating properties and our operating and redevelopment properties in each of our North America markets, excluding properties held for sale, as of the following dates:
|
|
Operating Properties
|
Operating and Redevelopment Properties
|
||||||||||||||||
|
Market
|
3/31/19
|
12/31/18
|
3/31/18
|
3/31/19
|
12/31/18
|
3/31/18
|
||||||||||||
|
Greater Boston
|
98.2
|
%
|
98.7
|
%
|
95.7
|
%
|
97.7
|
%
|
98.2
|
%
|
95.2
|
%
|
||||||
|
San Francisco
|
99.8
|
|
100.0
|
|
99.9
|
|
98.4
|
|
96.2
|
|
98.9
|
|
||||||
|
New York City
|
98.7
|
|
98.3
|
|
100.0
|
|
87.7
|
|
87.3
|
|
100.0
|
|
||||||
|
San Diego
|
94.2
|
|
94.7
|
|
95.2
|
|
94.2
|
|
94.7
|
|
91.7
|
|
||||||
|
Seattle
|
97.7
|
|
97.7
|
|
96.6
|
|
97.7
|
|
97.7
|
|
96.6
|
|
||||||
|
Maryland
|
97.0
|
|
96.8
|
|
95.7
|
|
95.3
|
|
94.7
|
|
91.2
|
|
||||||
|
Research Triangle
|
97.3
|
|
|
95.4
|
|
96.8
|
|
87.8
|
|
85.9
|
|
82.9
|
|
|||||
|
Subtotal
|
97.6
|
|
97.6
|
|
96.8
|
|
95.8
|
|
95.3
|
|
94.4
|
|
||||||
|
Canada
|
93.5
|
|
95.2
|
|
99.6
|
|
93.5
|
|
95.2
|
|
99.6
|
|
||||||
|
Non-cluster markets
|
81.1
|
|
79.0
|
|
78.9
|
|
81.1
|
|
79.0
|
|
78.9
|
|
||||||
|
North America
|
97.2
|
%
|
97.3
|
%
|
96.6
|
%
|
95.5
|
%
|
95.1
|
%
|
94.3
|
%
|
||||||
Refer to the “Non-GAAP Measures and Definitions” section within this Item 2 for additional information.
62
Investments in real estate
A key component of our business model is our disciplined allocation of capital to the development and redevelopment of new Class A properties located in collaborative life science and technology campuses in AAA urban innovation clusters. These projects are focused on providing high-quality, generic, and reusable spaces that meet the real estate requirements of, and are reusable by, a wide range of tenants. Upon completion, each value-creation project is expected to generate a significant increase in rental income, net operating income, and cash flows. Our development and redevelopment projects are generally in locations that are highly desirable to high-quality entities, which we believe results in higher occupancy levels, longer lease terms, higher rental income, higher returns, and greater long-term asset values. Our pre-construction activities are undertaken in order to get the property ready for its intended use and include entitlements, permitting, design, site work, and other activities preceding commencement of construction of aboveground building improvements.
63
Investments in real estate (continued)
Our investments in real estate consisted of the following as of
March 31, 2019
(dollars in thousands):
|
Investments in
Real Estate
|
Square Footage
|
|||||||||||||||||||||
|
Operating
|
Construction
|
Pre-Construction
|
Intermediate-Term
|
Future
|
Total
|
|||||||||||||||||
|
Investments in real estate:
|
||||||||||||||||||||||
|
Rental properties – consolidated
|
$
|
13,272,113
|
|
22,248,395
|
|
—
|
|
—
|
|
—
|
|
—
|
|
22,248,395
|
|
|||||||
|
New Class A development and redevelopment properties:
|
||||||||||||||||||||||
|
2019 deliveries
|
||||||||||||||||||||||
|
Consolidated
|
289,182
|
|
684,525
|
|
586,796
|
|
—
|
|
—
|
|
—
|
|
1,271,321
|
|
||||||||
|
Unconsolidated
(1)
|
N/A
|
|
286,829
|
|
1,159,850
|
|
—
|
|
—
|
|
—
|
|
1,446,679
|
|
||||||||
|
2019 deliveries
|
289,182
|
|
971,354
|
|
1,746,646
|
|
—
|
|
—
|
|
—
|
|
2,718,000
|
|
||||||||
|
2020 deliveries
|
415,077
|
|
—
|
|
356,904
|
|
1,539,455
|
|
—
|
|
—
|
|
1,896,359
|
|
||||||||
|
2021-2022 deliveries
|
592,654
|
|
—
|
|
—
|
|
1,070,925
|
|
3,490,009
|
|
—
|
|
4,560,934
|
|
||||||||
|
Future
|
181,859
|
|
—
|
|
—
|
|
—
|
|
—
|
|
3,234,786
|
|
3,234,786
|
|
||||||||
|
New Class A development and redevelopment properties
|
1,478,772
|
|
971,354
|
|
2,103,550
|
|
2,610,380
|
|
3,490,009
|
|
3,234,786
|
|
12,410,079
|
|
||||||||
|
Value-creation square feet currently included in rental properties
(2)
|
N/A
|
|
—
|
|
—
|
|
(341,634
|
)
|
(118,715
|
)
|
(509,831
|
)
|
(970,180
|
)
|
||||||||
|
Gross investments in real estate
|
14,750,885
|
|
23,219,749
|
|
2,103,550
|
|
2,268,746
|
|
3,371,294
|
|
2,724,955
|
|
33,688,294
|
|
||||||||
|
|
4,372,296
|
6,096,249
|
||||||||||||||||||||
|
Less: accumulated depreciation
|
(2,371,088
|
)
|
||||||||||||||||||||
|
Net investments in real estate – North America
|
12,379,797
|
|
||||||||||||||||||||
|
Net investments in real estate – Asia
|
30,553
|
|
||||||||||||||||||||
|
Investments in real estate
|
$
|
12,410,350
|
|
|||||||||||||||||||
|
(1)
|
Our share of the cost basis associated with square footage of our unconsolidated properties is classified in investments in unconsolidated real estate joint ventures in our consolidated balance sheets.
|
||||||||||||
|
(2)
|
Represents RSF of buildings currently in operation that will be redeveloped or replaced with new development RSF upon commencement of construction as follows:
|
||||||||||||
|
Property/Submarket
|
RSF
|
||||||||||||
|
Pre-construction:
|
|||||||||||||
|
88 Bluxome Street/Mission Bay/SoMa
|
232,470
|
|
|||||||||||
|
10260 Campus Point Drive/University Town Center
|
109,164
|
|
|||||||||||
|
341,634
|
|
||||||||||||
|
Intermediate-term:
|
|||||||||||||
|
99 A Street/Seaport Innovation District
|
8,715
|
|
|||||||||||
|
960 Industrial Road/Greater Stanford
|
110,000
|
|
|||||||||||
|
118,715
|
|
||||||||||||
|
Future:
|
|||||||||||||
|
219 East 42nd Street/New York City
|
349,947
|
|
|||||||||||
|
4161 Campus Point Court/University Town Center
|
159,884
|
|
|||||||||||
|
509,831
|
|
||||||||||||
64
Acquisitions
Our real estate asset acquisitions during the
three months ended March 31, 2019
, consisted of the following (dollars in thousands):
|
Property
|
Submarket/Market
|
Date of Purchase
|
Number of Properties
|
Operating
Occupancy
|
Square Footage
|
Unlevered Yields
|
Purchase Price
|
|||||||||||||||||||||||
|
Future Development
|
Operating With Future Development/ Redevelopment
|
Operating
|
Initial Stabilized
|
Initial Stabilized (Cash)
|
||||||||||||||||||||||||||
|
Value-creation
|
||||||||||||||||||||||||||||||
|
10 Necco Street
|
Seaport Innovation District/Greater Boston
|
3/26/19
|
—
|
N/A
|
175,000
|
|
—
|
|
—
|
|
(1
|
)
|
(1
|
)
|
$
|
81,100
|
|
|||||||||||||
|
|
|
|
|
|
|
|
||||||||||||||||||||||||
|
Operating with value-creation
|
||||||||||||||||||||||||||||||
|
3911 and 3931 Sorrento Valley Boulevard
|
Sorrento Mesa/San Diego
|
1/9/19
|
2
|
100%
|
—
|
|
53,220
|
|
—
|
|
7.2
|
%
|
6.6
|
%
|
23,250
|
|
||||||||||||||
|
Other
|
4
|
—
|
|
75,864
|
|
—
|
|
39,150
|
|
|||||||||||||||||||||
|
6
|
—
|
|
129,084
|
|
—
|
|
62,400
|
|
||||||||||||||||||||||
|
Operating
|
||||||||||||||||||||||||||||||
|
3170 Porter Drive
|
Greater Stanford/
San Francisco |
1/10/19
|
1
|
100%
|
—
|
|
—
|
|
98,626
|
|
7.5
|
%
|
5.1
|
%
|
100,250
|
|
||||||||||||||
|
Shoreway Science Center
|
Greater Stanford/
San Francisco |
1/10/19
|
2
|
100%
|
—
|
|
—
|
|
82,462
|
|
7.2
|
%
|
5.5
|
%
|
73,200
|
|
||||||||||||||
|
260 Townsend Street
|
Mission Bay/SoMa/
San Francisco |
3/14/19
|
1
|
100%
|
—
|
|
—
|
|
66,682
|
|
7.4
|
%
|
5.8
|
%
|
66,000
|
|
(2)
|
|||||||||||||
|
4
|
—
|
|
—
|
|
247,770
|
|
239,450
|
|
||||||||||||||||||||||
|
Total acquisitions
|
10
|
175,000
|
|
129,084
|
|
247,770
|
|
382,950
|
|
|||||||||||||||||||||
|
10260 Campus Point Drive and
4161 Campus Point Court
|
University Town Center/San Diego
|
1/2/19
|
2
|
100%
|
N/A
|
|
N/A
|
|
N/A
|
|
(3
|
)
|
(3
|
)
|
65,000
|
|
(4)
|
|||||||||||||
|
Pending
|
Various
|
182,050
|
|
|||||||||||||||||||||||||||
|
2019 guidance range midpoint
|
$
|
630,000
|
|
|||||||||||||||||||||||||||
|
(1)
|
We expect to provide total estimated costs and related yields in the future upon the commencement of development.
|
|
(2)
|
Purchase price includes the assumption of a
$28.2 million
secured loan with a stated interest rate of
4.14%
.
|
|
(3)
|
Refer to the “New Class A Development and Redevelopment Properties: Summary of Pipeline” section within this Item 2 for additional information.
|
|
(4)
|
In December 2018, we acquired two buildings adjacent to our Campus Pointe by Alexandria campus aggregating
269,048
RSF, comprising
109,164
RSF at 10260 Campus Point Drive and
159,884
RSF at 4161 Campus Point Court which are 100% leased through 2022. At lease expiration, 10260 Campus Point Drive will be redeveloped and expanded into a
176,455
RSF Class A building, which is 100% pre-leased for 15 years with the target delivery in 2021. 4161 Campus Point Court will support future development aggregating
201,900
RSF through one or more Class A buildings at our Campus Pointe by Alexandria campus. The total purchase price of
$80.0 million
was paid in two installments,
$15.0 million
in December 2018 and
$65.0 million
in January 2019.
|
65
Real estate asset sales
Our real estate asset sale completed during the
three months ended March 31, 2019
, consisted of the following (dollars in thousands):
|
Property
|
Submarket/Market
|
Date of Sale
|
RSF
|
Sales Price
|
Sales Price per RSF
|
Gain
|
|||||||||||
|
Sale of partial interest in core Class A property:
|
|||||||||||||||||
|
75/125 Binney Street (sale of 60% noncontrolling interest)
(1)
|
Cambridge/Greater Boston
|
2/13/19
|
388,270
|
$
|
438,000
|
|
$
|
1,880
|
|
(1)
|
|||||||
|
|
|
||||||||||||||||
|
2019 guidance range midpoint
|
$
|
750,000
|
|
||||||||||||||
|
(1)
|
In February 2019, we sold a
60%
interest in 75/125 Binney Street, a Class A property in our Cambridge submarket, for a sales price of
$438 million
, or
$1,880
per RSF, representing a
4.3%
capitalization rate on net operating income (cash basis), annualized, for the three months ended December 31, 2018. We retained control over, and continue to consolidate, the new joint venture. We accounted for the $202.2 million difference between the consideration received and the book value of the 60% interest sold as an equity transaction with no gain recognized in earnings.
|
66
Disciplined management of ground-up developments
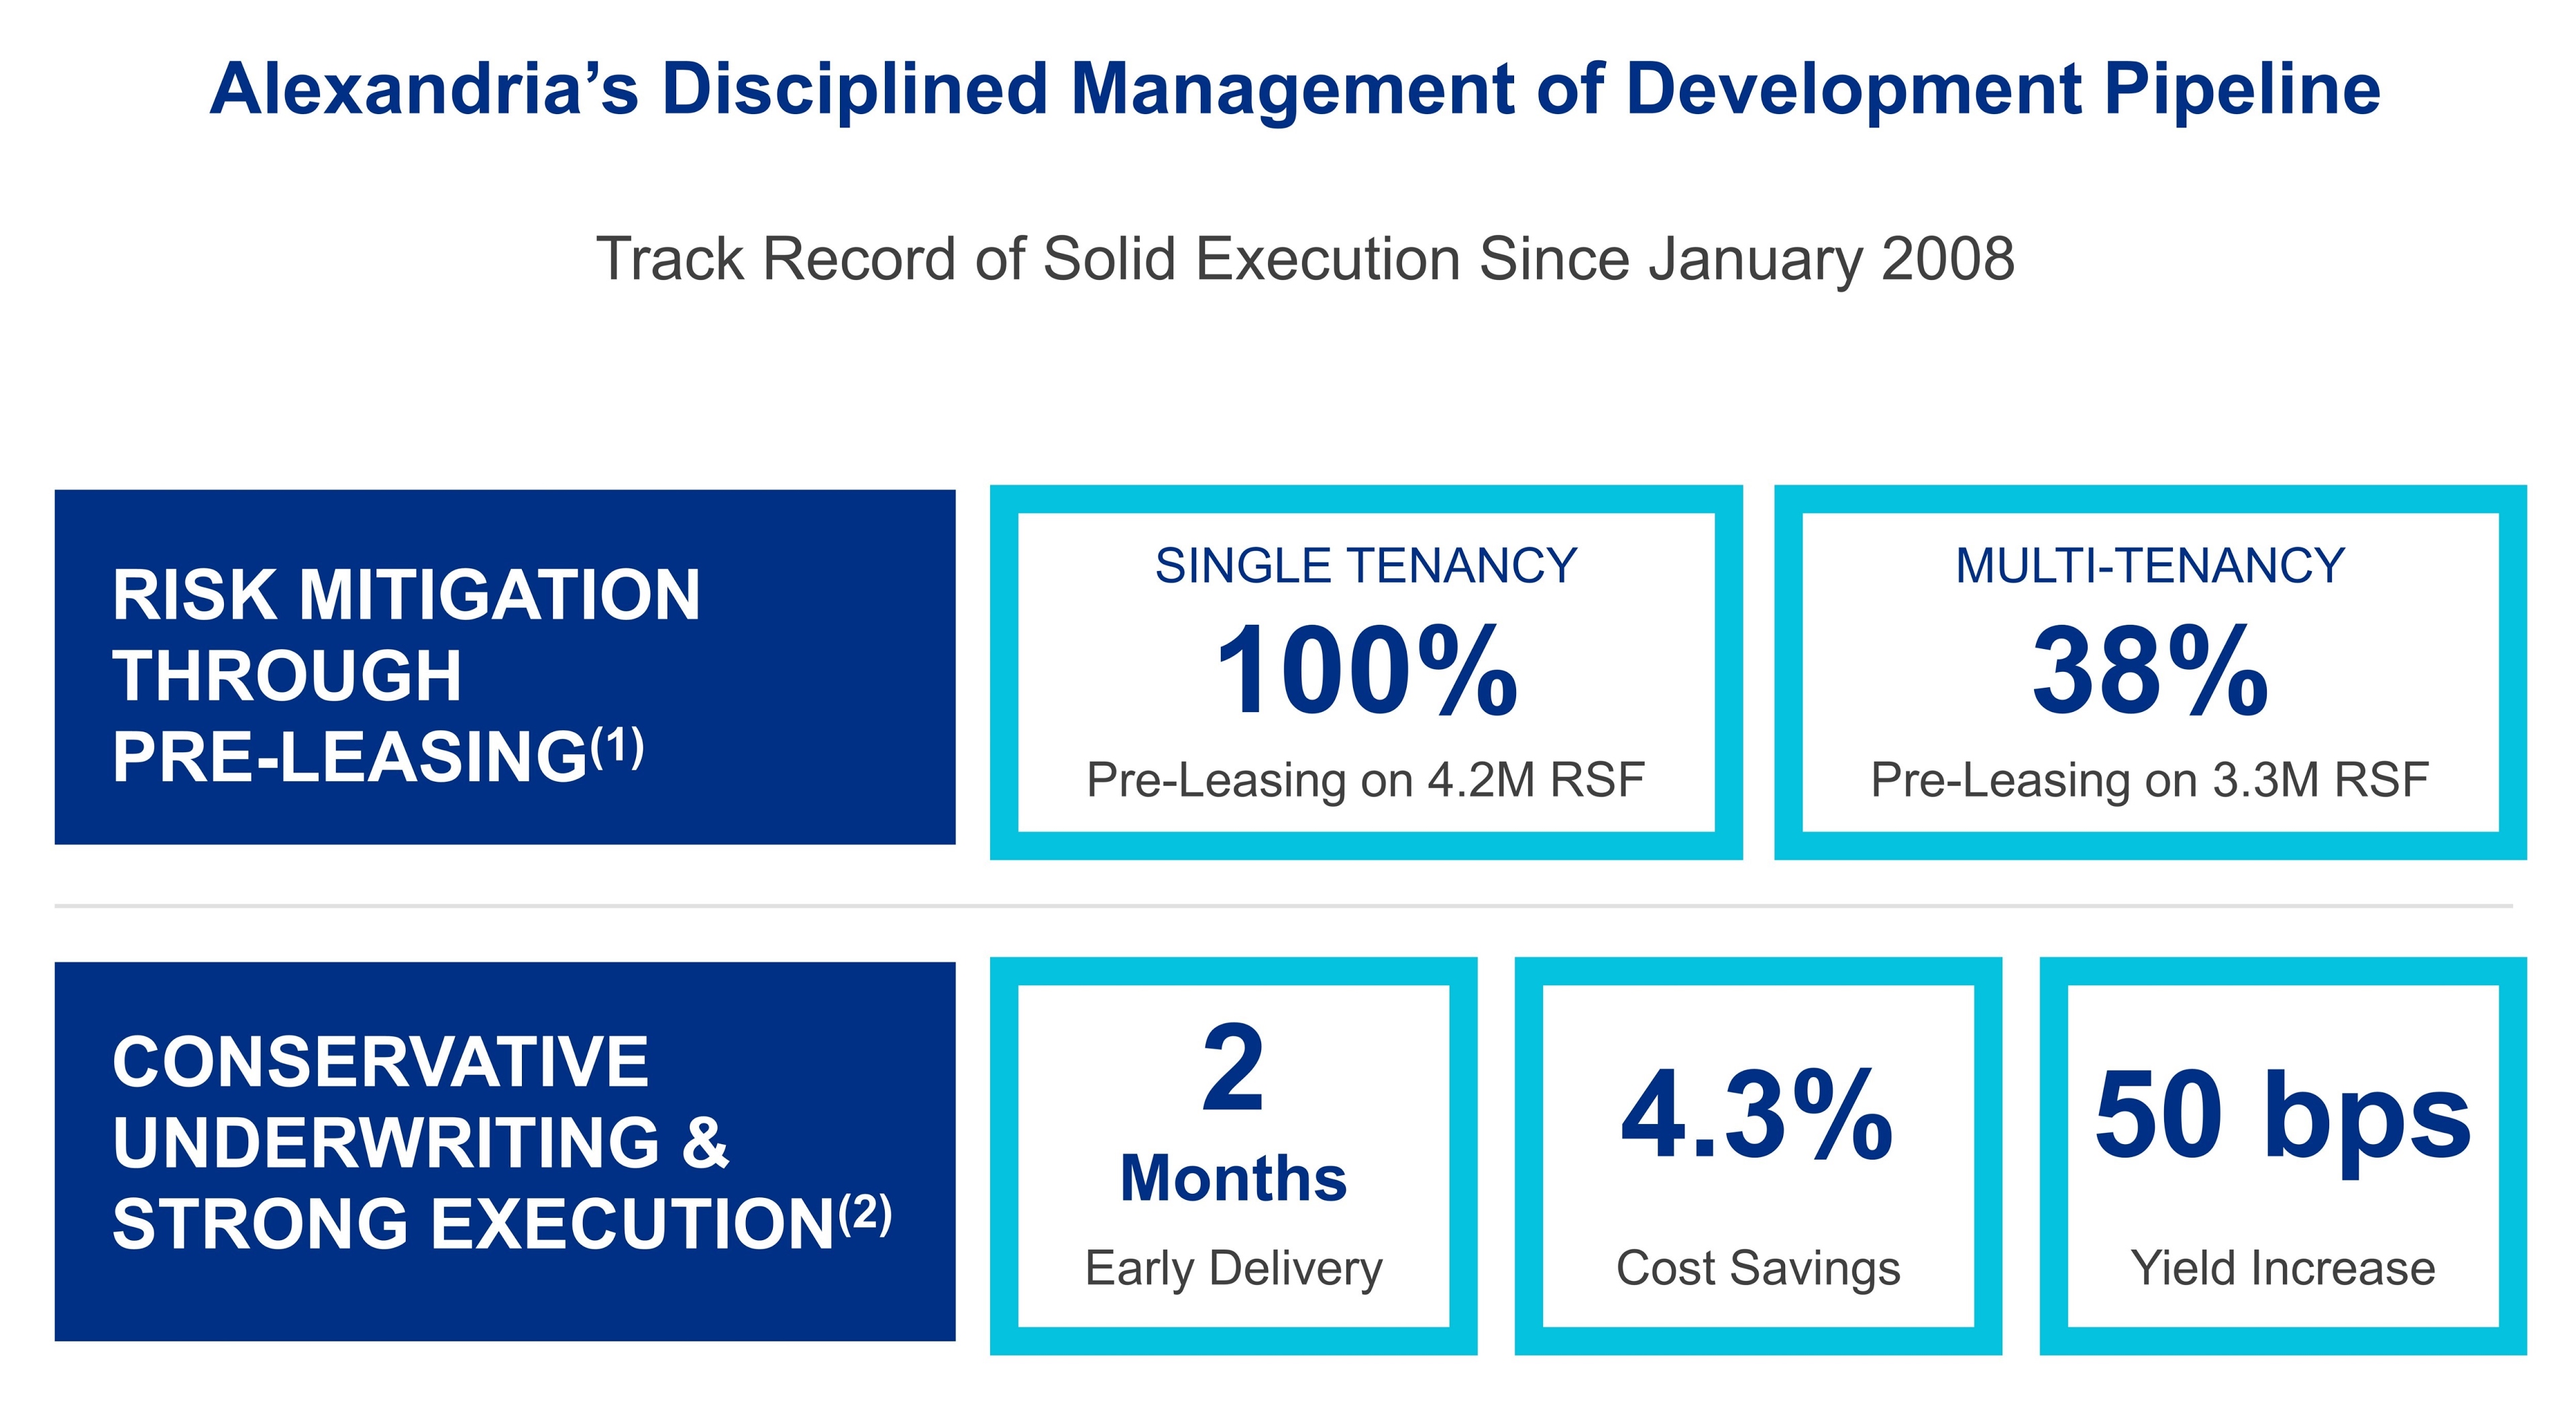
|
(1)
|
Represents developments commenced since January 1, 2008, comprising
31
projects aggregating
7.5 million
RSF.
|
|
(2)
|
Represents developments commenced and delivered since January 1, 2008, comprising
23
projects aggregating
5.5 million
RSF.
|
67
Sustainability
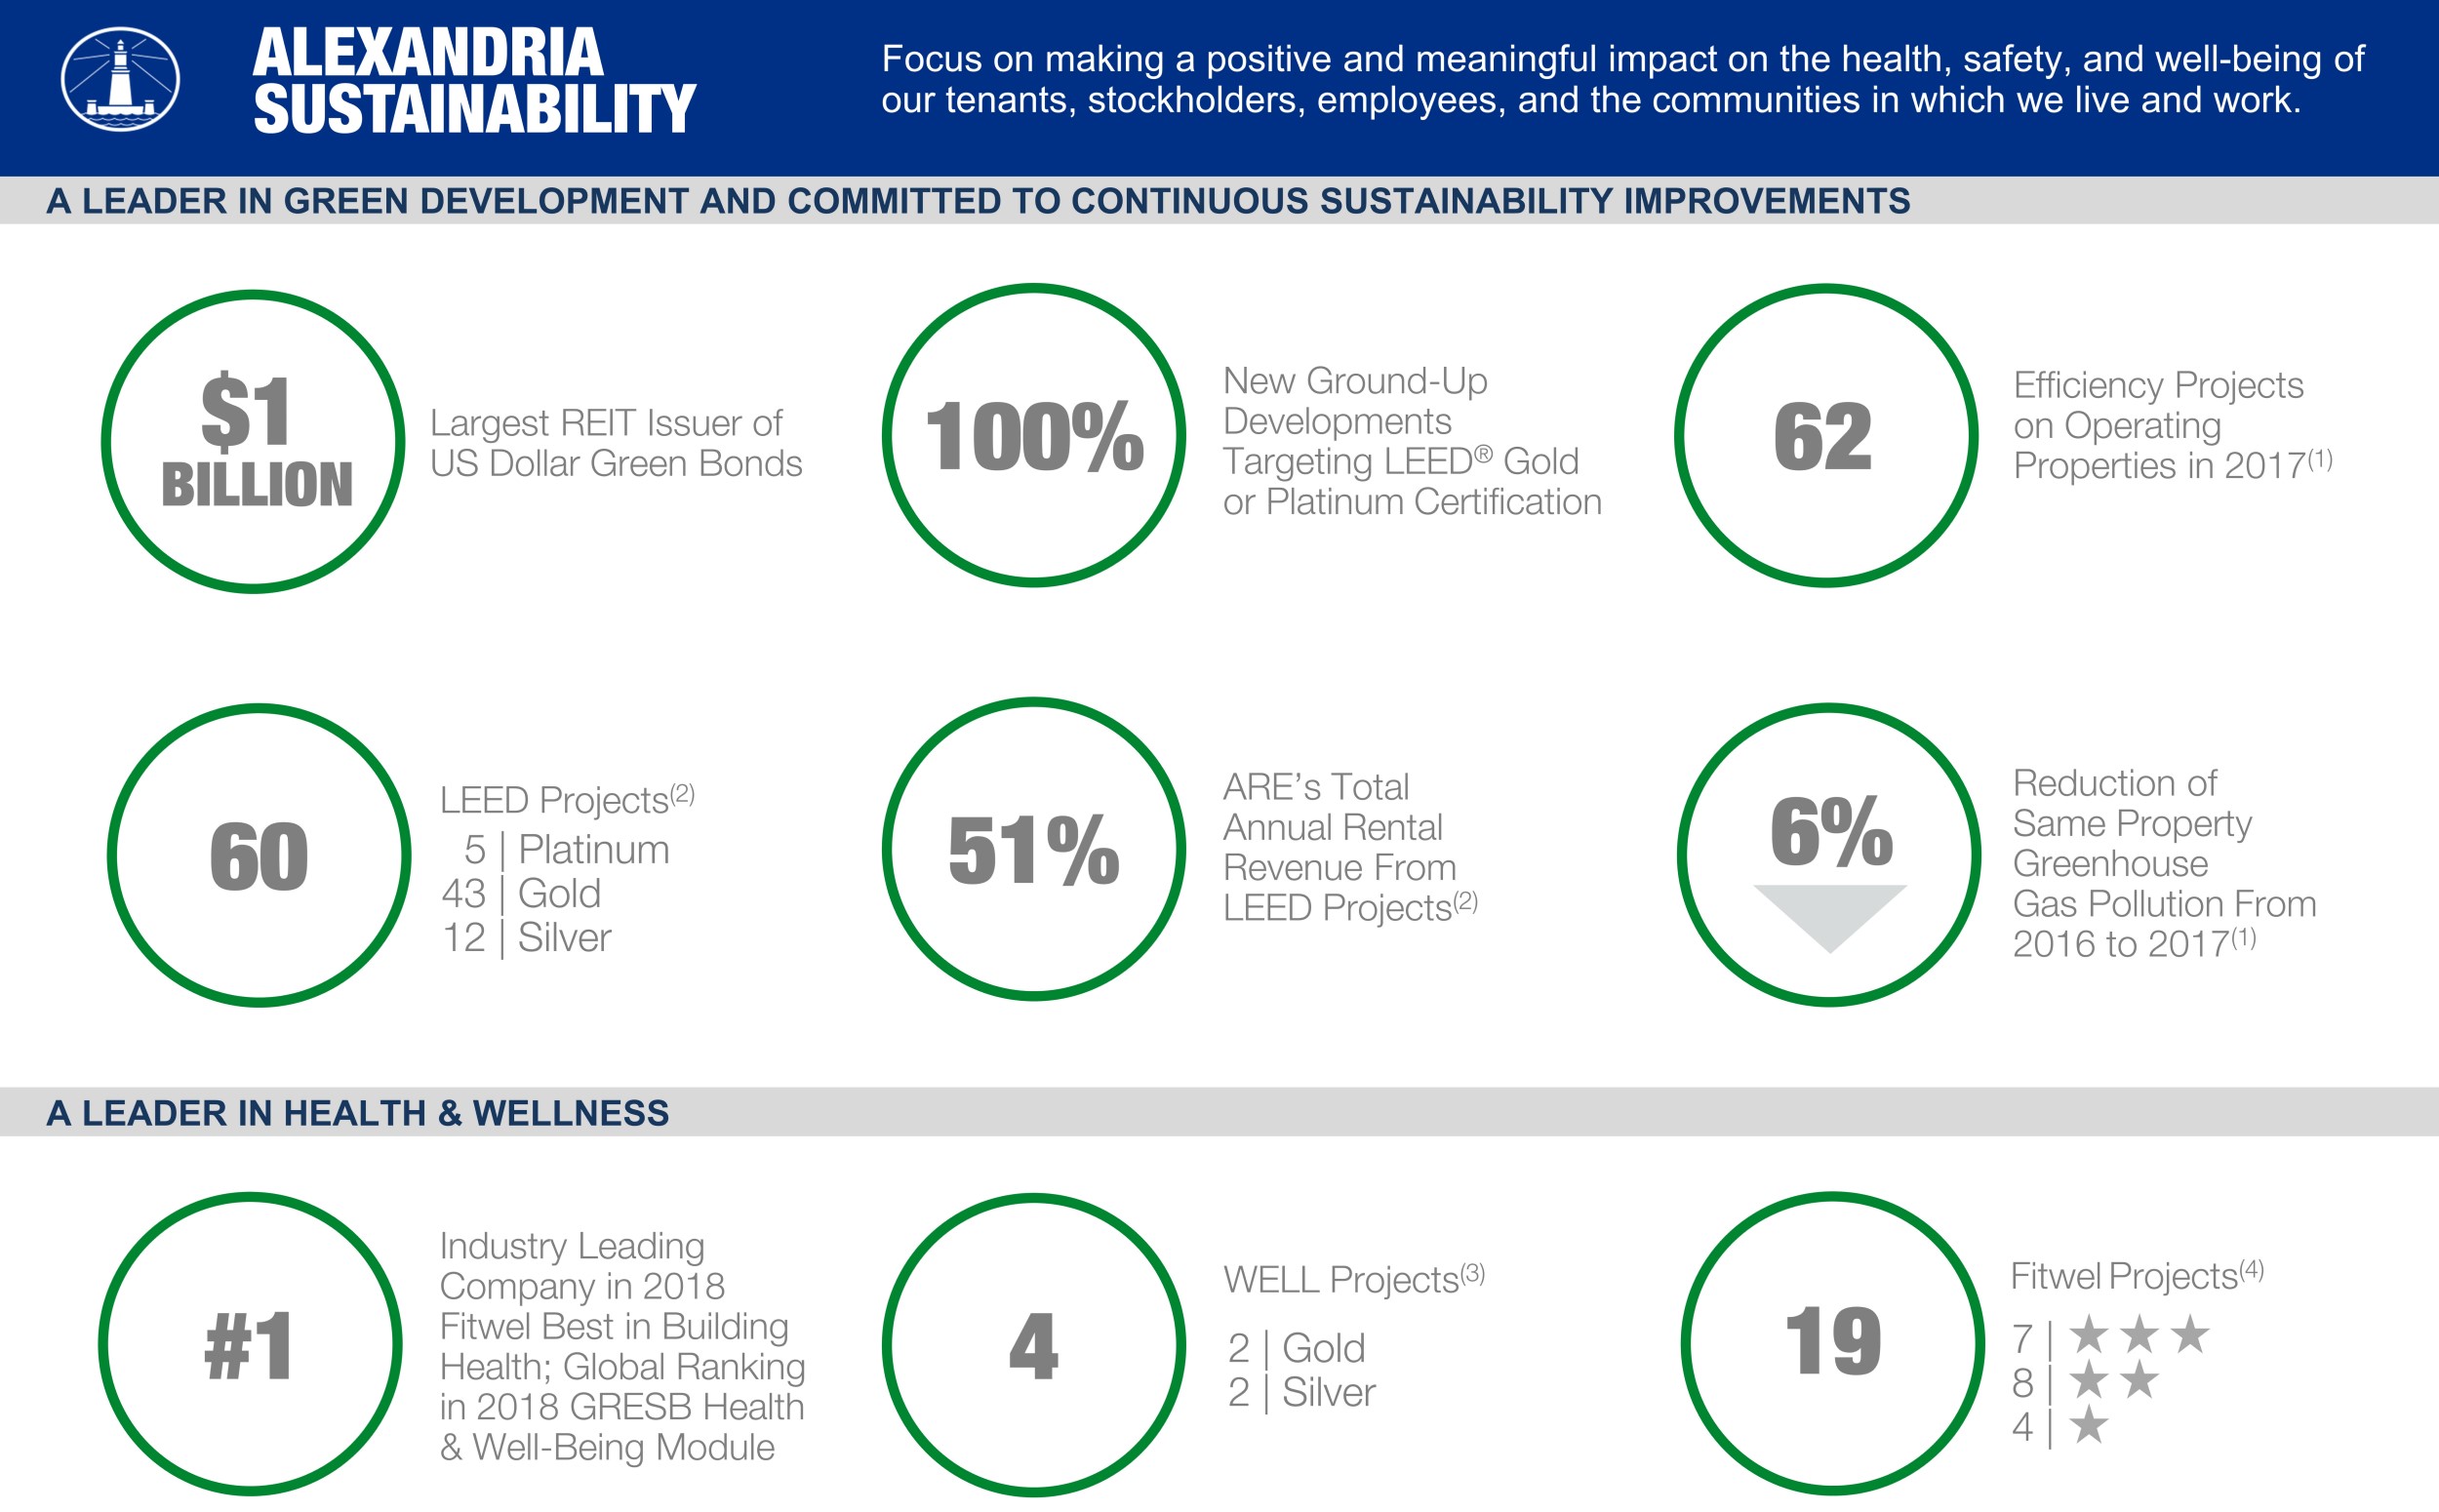
|
(1)
|
For the years ended December 31, 2016 and 2017. We expect to disclose data for the year ended December 31, 2018 in 2019.
|
|
(2)
|
Upon completion of
15
projects in process targeting LEED certification.
|
|
(3)
|
Upon completion of
three
projects in process targeting WELL certification.
|
|
(4)
|
Upon completion of
11
projects in process targeting Fitwel certification.
|
68
New Class A development and redevelopment properties: recent deliveries
|
399 Binney Street
|
279 East Grand Avenue
|
681 Gateway Boulevard
|
||
|
Greater Boston/Cambridge
|
San Francisco/South San Francisco
|
San Francisco/South San Francisco
|
||
|
123,403 RSF
|
139,810 RSF
|
66,000 RSF
|
||
|
Rubius Therapeutics, Inc.
Relay Therapeutics, Inc. Celsius Therapeutics, Inc. |
Verily Life Sciences, LLC
insitro, Inc. |
Eli Lilly and Company
|
||

|

|

|
||
|
Alexandria PARC
|
188 East Blaine Street
|
|
|
San Francisco/Greater Stanford
|
Seattle/Lake Union
|
|
|
48,547 RSF
|
90,615 RSF
|
|
|
Workday, Inc.
|
bluebird bio, Inc.
Seattle Cancer Care Alliance Sana Biotechnology, Inc. |
|

|

|
|
69
New Class A development and redevelopment properties: recent deliveries (continued)
The following table presents value-creation development and redevelopment of new Class A properties placed into service (dollars in thousands):
|
Property/Market/Submarket
|
Our Ownership Interest
|
Date Delivered
|
RSF Placed Into Service
|
Operating Property Leased Percentage
|
Total Project
|
Unlevered Yields
|
||||||||||||||||||||||||||||||
|
Initial Stabilized
|
Initial Stabilized (Cash)
|
|||||||||||||||||||||||||||||||||||
|
Prior to 10/1/18
|
4Q18
|
1Q19
|
Total
|
RSF
|
Investment
|
|||||||||||||||||||||||||||||||
|
Consolidated development projects
|
||||||||||||||||||||||||||||||||||||
|
213 East Grand Avenue/San Francisco/South San Francisco
|
100%
|
12/31/18
|
—
|
|
300,930
|
|
—
|
|
300,930
|
|
100%
|
300,930
|
|
$
|
256,600
|
|
7.4
|
%
|
6.5
|
%
|
||||||||||||||||
|
399 Binney Street/Greater Boston/Cambridge
|
100%
|
1/25/19
|
—
|
|
—
|
|
123,403
|
|
123,403
|
|
100%
|
164,000
|
|
$
|
182,000
|
|
7.7
|
%
|
(1)
|
7.2
|
%
|
(1)
|
||||||||||||||
|
279 East Grand Avenue/San Francisco/South San Francisco
|
100%
|
Various
|
—
|
|
—
|
|
139,810
|
|
139,810
|
|
100%
|
211,405
|
|
$
|
151,000
|
|
7.8
|
%
|
8.1
|
%
|
||||||||||||||||
|
188 East Blaine Street/Seattle/Lake Union
|
100%
|
3/27/19
|
—
|
|
—
|
|
90,615
|
|
90,615
|
|
100%
|
198,000
|
|
$
|
190,000
|
|
6.7
|
%
|
6.7
|
%
|
||||||||||||||||
|
Consolidated redevelopment projects
|
||||||||||||||||||||||||||||||||||||
|
Alexandria Center
®
for AgTech, Phase I/Research Triangle/Research Triangle
|
100%
|
Various
|
45,143
|
|
8,380
|
|
2,614
|
|
56,137
|
|
100%
|
175,000
|
|
$
|
77,100
|
|
7.6
|
%
|
7.5
|
%
|
||||||||||||||||
|
9625 Towne Centre Drive/San Diego/University Town Center
|
50.1%
|
11/1/18
|
—
|
|
163,648
|
|
—
|
|
163,648
|
|
100%
|
163,648
|
|
$
|
89,000
|
|
7.3
|
%
|
7.3
|
%
|
||||||||||||||||
|
9900 Medical Center Drive/Maryland/Rockville
|
100%
|
11/19/18
|
—
|
|
45,039
|
|
—
|
|
45,039
|
|
58%
|
45,039
|
|
$
|
16,800
|
|
8.6
|
%
|
8.4
|
%
|
||||||||||||||||
|
681 Gateway Boulevard/San Francisco/South San Francisco
|
100%
|
3/1/19
|
—
|
|
—
|
|
66,000
|
|
66,000
|
|
100%
|
142,400
|
|
$
|
108,000
|
|
8.5
|
%
|
7.9
|
%
|
||||||||||||||||
|
Alexandria PARC/San Francisco/Greater Stanford
|
100%
|
3/29/19
|
—
|
|
—
|
|
48,547
|
|
48,547
|
|
100%
|
197,498
|
|
$
|
152,600
|
|
7.3
|
%
|
6.2
|
%
|
||||||||||||||||
|
Unconsolidated joint venture redevelopment project
(RSF represents 100%; dollars and yields represent our share) |
||||||||||||||||||||||||||||||||||||
|
704 Quince Orchard Road/Maryland/Gaithersburg
|
56.8%
|
Various
|
—
|
|
4,762
|
|
10,250
|
|
15,012
|
|
100%
|
79,931
|
|
$
|
13,300
|
|
8.9
|
%
|
8.8
|
%
|
||||||||||||||||
|
Total
|
45,143
|
|
522,759
|
|
481,239
|
|
1,049,141
|
|
7.5
|
%
|
7.1
|
%
|
||||||||||||||||||||||||
|
(1)
|
Improvements in initial stabilized yield and initial stabilized yield (cash) of
40
bps and
50
bps, respectively, were driven by the leasing of space at higher rental rates than those underwritten at acquisition.
|
70
New Class A development and redevelopment properties: 2019 deliveries
|
399 Binney Street
|
266 and 275 Second Avenue
|
1655 and 1725 Third Street
|
279 East Grand Avenue
|
681 Gateway Boulevard
|
||||
|
Greater Boston/Cambridge
|
Greater Boston/Route 128
|
San Francisco/Mission Bay/SoMa
|
San Francisco/South San Francisco
|
San Francisco/South San Francisco
|
||||
|
40,597 RSF
|
31,858 RSF
|
593,765 RSF
|
71,595 RSF
|
76,400 RSF
|
||||
|
Rubius Therapeutics, Inc.
|
Blossom Innovations, LLC
Multi-Tenant/Marketing
|
Uber Technologies, Inc.
|
Verily Life Sciences, LLC
insitro, Inc. |
Twist Bioscience Corporation
Multi-Tenant/Marketing |
||||
|
|

|

|
|
|
||||
|
Menlo Gateway
|
Alexandria Life Science Factory
|
188 East Blaine Street
|
704 Quince Orchard Road
|
Alexandria Center
®
for AgTech, Phase I
|
||||
|
San Francisco/Greater Stanford
|
New York City/New York City
|
Seattle/Lake Union
|
Maryland/Gaithersburg
|
Research Triangle/
Research Triangle
|
||||
|
520,988 RSF
|
140,098 RSF
|
107,385 RSF
|
45,097 RSF
|
118,863 RSF
|
||||
|
Facebook, Inc.
|
Multi-Tenant/Marketing
|
Alpine Immune Sciences Inc.
Multi-Tenant/Marketing
|
Multi-Tenant/Marketing
|
Arysta LifeScience Inc.
StrideBio, Inc. GreenLight Biosciences, Inc. |
||||

|

|
|
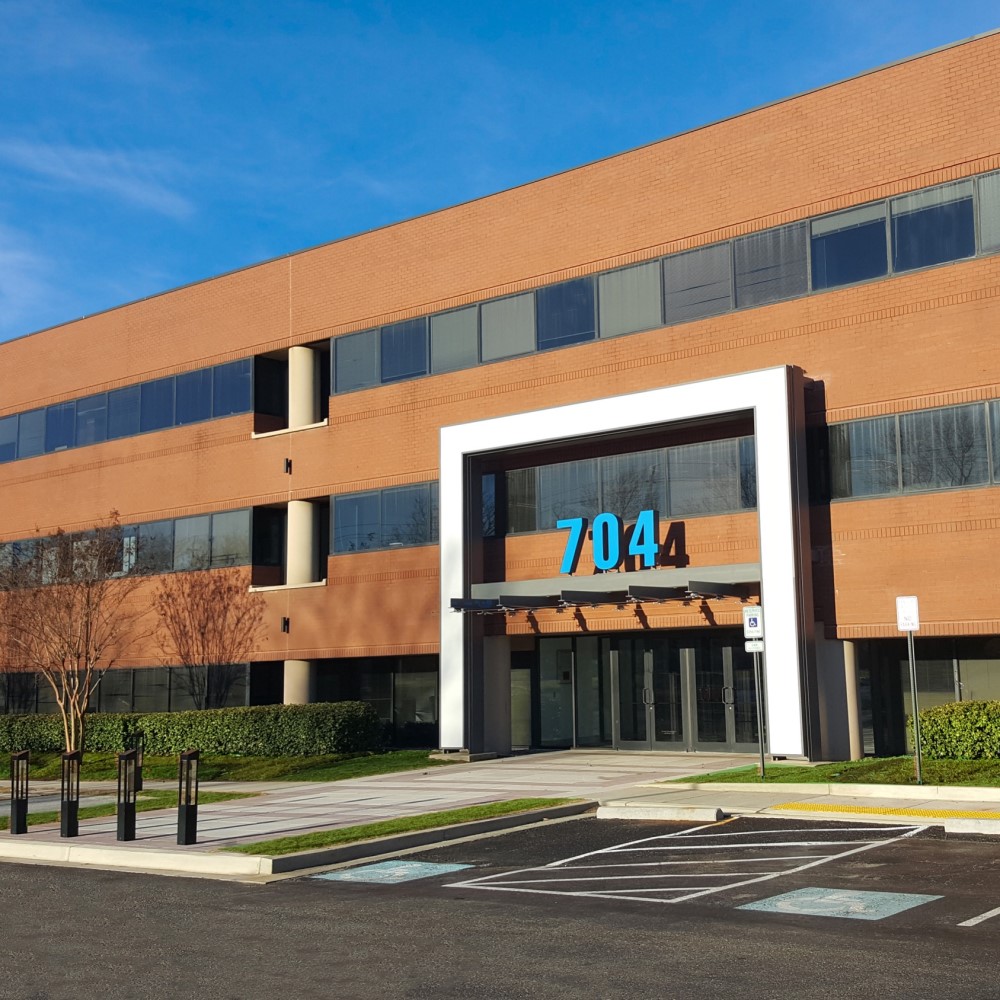
|

|
||||
71
New Class A development and redevelopment properties: 2019 deliveries (continued)
The following table sets forth a summary of our new Class A development and redevelopment properties projected to be delivered in 2019, as of
March 31, 2019
(dollars in thousands):
|
Property/Market/Submarket
|
Dev/Redev
|
Square Footage
|
Percentage
|
Project Start
|
Occupancy
(1)
|
|||||||||||||||||||||
|
In Service
|
CIP
|
Total
|
Leased
|
Leased/Negotiating
|
Initial
|
Stabilized
|
||||||||||||||||||||
|
Consolidated projects
|
||||||||||||||||||||||||||
|
266 and 275 Second Avenue/Greater Boston/Route 128
|
Redev
|
171,899
|
|
31,858
|
|
203,757
|
|
91
|
%
|
100
|
%
|
3Q17
|
1Q18
|
2019
|
||||||||||||
|
Alexandria Center
®
for AgTech, Phase I/Research Triangle/Research Triangle
(2)
|
Redev
|
56,137
|
|
118,863
|
|
175,000
|
|
97
|
|
100
|
|
2Q17
|
2Q18
|
2019
|
||||||||||||
|
399 Binney Street/Greater Boston/Cambridge
|
Dev
|
123,403
|
|
40,597
|
|
164,000
|
|
98
|
|
98
|
|
4Q17
|
1Q19
|
2019
|
||||||||||||
|
279 East Grand Avenue/San Francisco/South San Francisco
|
Dev
|
139,810
|
|
71,595
|
|
211,405
|
|
100
|
|
100
|
|
4Q17
|
1Q19
|
2020
|
||||||||||||
|
188 East Blaine Street/Seattle/Lake Union
|
Dev
|
90,615
|
|
107,385
|
|
198,000
|
|
67
|
|
68
|
|
2Q18
|
1Q19
|
2020
|
||||||||||||
|
681 Gateway Boulevard/San Francisco/South San Francisco
|
Redev
|
66,000
|
|
76,400
|
|
142,400
|
|
89
|
|
100
|
|
3Q18
|
1Q19
|
2019
|
||||||||||||
|
Alexandria Life Science Factory/New York City/New York City
|
Redev
|
36,661
|
|
140,098
|
|
176,759
|
|
21
|
|
21
|
|
4Q18
|
4Q19
|
2020
|
||||||||||||
|
684,525
|
|
586,796
|
|
1,271,321
|
|
|||||||||||||||||||||
|
Unconsolidated joint venture projects
(3)
|
||||||||||||||||||||||||||
|
(amounts represent 100%)
|
||||||||||||||||||||||||||
|
704 Quince Orchard Road/Maryland/Gaithersburg
|
Redev
|
34,834
|
|
45,097
|
|
79,931
|
|
48
|
|
48
|
|
1Q18
|
4Q18
|
2019
|
||||||||||||
|
Menlo Gateway/San Francisco/Greater Stanford
|
Dev
|
251,995
|
|
520,988
|
|
772,983
|
|
100
|
|
100
|
|
4Q17
|
4Q19
|
4Q19
|
||||||||||||
|
1655 and 1725 Third Street/San Francisco/Mission Bay/SoMa
|
Dev
|
—
|
|
593,765
|
|
593,765
|
|
100
|
|
100
|
|
1Q18
|
4Q19
|
4Q19
|
||||||||||||
|
286,829
|
|
1,159,850
|
|
1,446,679
|
|
|||||||||||||||||||||
|
2019 deliveries
|
971,354
|
|
1,746,646
|
|
2,718,000
|
|
89
|
%
|
91
|
%
|
||||||||||||||||
|
Our Ownership Interest
|
Cost to Complete
|
Unlevered Yields
|
|||||||||||||||||||||||||||||||||||
|
Property/Market/Submarket
|
In Service
|
CIP
|
Construction Loan
|
ARE
Funding
|
Total at
Completion
|
Initial Stabilized
|
Initial Stabilized (Cash)
|
||||||||||||||||||||||||||||||
|
Consolidated projects
|
|||||||||||||||||||||||||||||||||||||
|
266 and 275 Second Avenue/Greater Boston/Route 128
|
100
|
%
|
$
|
72,988
|
|
$
|
12,227
|
|
$
|
—
|
|
$
|
3,785
|
|
$
|
89,000
|
|
8.4
|
%
|
7.1
|
%
|
||||||||||||||||
|
Alexandria Center
®
for AgTech, Phase I/Research Triangle/Research Triangle
(2)
|
100
|
%
|
19,671
|
|
39,128
|
|
—
|
|
18,301
|
|
77,100
|
|
7.6
|
|
7.5
|
|
|||||||||||||||||||||
|
399 Binney Street/Greater Boston/Cambridge
|
100
|
%
|
134,890
|
|
35,467
|
|
—
|
|
11,643
|
|
182,000
|
|
7.7
|
|
(4)
|
7.2
|
|
(4)
|
|||||||||||||||||||
|
279 East Grand Avenue/San Francisco/South San Francisco
|
100
|
%
|
74,251
|
|
36,730
|
|
—
|
|
40,019
|
|
151,000
|
|
7.8
|
|
8.1
|
|
|||||||||||||||||||||
|
188 East Blaine Street/Seattle/Lake Union
|
100
|
%
|
58,868
|
|
61,699
|
|
—
|
|
69,433
|
|
190,000
|
|
6.7
|
|
6.7
|
|
|||||||||||||||||||||
|
681 Gateway Boulevard/San Francisco/South San Francisco
|
100
|
%
|
26,391
|
|
40,115
|
|
—
|
|
41,494
|
|
108,000
|
|
8.5
|
|
7.9
|
|
|||||||||||||||||||||
|
Alexandria Life Science Factory/New York City/New York City
|
16,031
|
|
63,816
|
|
104,453
|
|
184,300
|
|
5.5
|
|
5.6
|
|
|||||||||||||||||||||||||
|
403,090
|
|
289,182
|
|
—
|
|
|
289,128
|
|
981,400
|
|
|||||||||||||||||||||||||||
|
Unconsolidated joint venture projects
(3)
|
|||||||||||||||||||||||||||||||||||||
|
(amounts represent our share)
|
|||||||||||||||||||||||||||||||||||||
|
704 Quince Orchard Road/Maryland/Gaithersburg
|
56.8
|
%
|
3,718
|
|
4,353
|
|
4,407
|
|
822
|
|
13,300
|
|
8.9
|
|
8.8
|
|
|||||||||||||||||||||
|
Menlo Gateway/San Francisco/Greater Stanford
|
44.5
|
%
|
115,991
|
|
184,977
|
|
83,707
|
|
45,325
|
|
430,000
|
|
6.9
|
|
6.3
|
|
|||||||||||||||||||||
|
1655 and 1725 Third Street/San Francisco/Mission Bay/SoMa
|
10.0
|
%
|
—
|
|
60,488
|
|
15,648
|
|
1,864
|
|
78,000
|
|
7.8
|
|
6.0
|
|
|||||||||||||||||||||
|
119,709
|
|
249,818
|
|
103,762
|
|
48,011
|
|
521,300
|
|
||||||||||||||||||||||||||||
|
2019 deliveries
|
$
|
522,799
|
|
539,000
|
|
$
|
103,762
|
|
$
|
337,139
|
|
$
|
1,502,700
|
|
7.2
|
%
|
6.8
|
%
|
|||||||||||||||||||
|
(1)
|
Initial occupancy dates are subject to leasing and/or market conditions. Stabilized occupancy may vary depending on single tenancy versus multi-tenancy.
|
|
(2)
|
New strategic collaborative campus, Alexandria Center
®
for AgTech – Research Triangle consists of Phase I at 5 Laboratory Drive, including campus amenities, and Phase II at 9 Laboratory Drive. 5 Laboratory Drive includes the high-quality LaunchLabs and amenities to create a dynamic ecosystem to accelerate discovery and commercialization.
|
|
(3)
|
Refer to the “Consolidated and Unconsolidated Real Estate Joint Ventures” section within this Item 2 for additional information.
|
|
(4)
|
Improvements in initial stabilized yield and initial stabilized yield (cash) of
40
bps and
50
bps, respectively, were driven by the leasing of space at higher rental rates than those underwritten at acquisition.
|
72
New Class A development and redevelopment properties: projected 2020 deliveries and pre-construction projects
|
88 Bluxome Street
|
201 Haskins Way
|
Alexandria District for Science and Technology
(1)
|
3115 Merryfield Row
|
9880 and 10260 Campus Point Drive
|
||||
|
San Francisco/Mission Bay/SoMa
|
San Francisco/South San Francisco
|
San Francisco/Greater Stanford
|
San Diego/Torrey Pines
|
San Diego/University Town Center
|
||||
|
1,070,925 RSF
|
280,000 RSF
|
530,000 RSF
|
87,000 RSF
|
274,455 RSF
|
||||

|
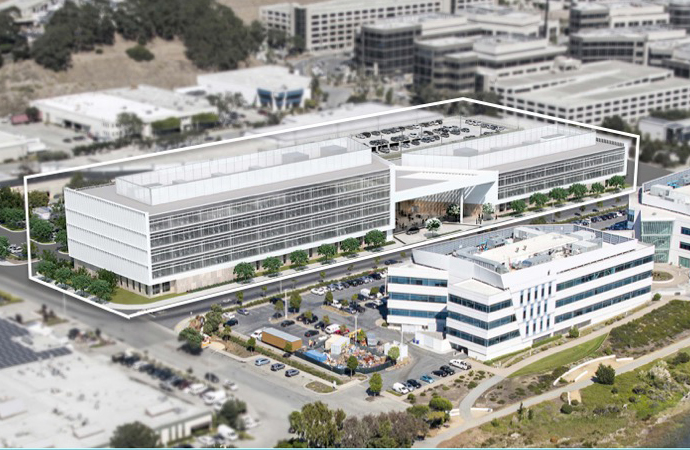
|

|

|

|
||||
|
1165 Eastlake Avenue East
|
9800 Medical Center Drive
|
9950 Medical Center Drive
|
8 Davis Drive
|
Alexandria Center
®
for AgTech, Phase II
|
||||
|
Seattle/Lake Union
|
Maryland/Rockville
|
Maryland/Rockville
|
Research Triangle/Research Triangle
|
Research Triangle/Research Triangle
|
||||
|
106,000 RSF
|
174,640 RSF
|
84,264 RSF
|
200,000 RSF
|
160,000 RSF
|
||||

|

|

|

|

|
||||
|
(1)
|
Campus includes 825 and 835 Industrial Road.
|
73
New Class A development and redevelopment properties: projected 2020 deliveries and pre-construction projects (continued)
The following table sets forth a summary of our new Class A development and redevelopment properties projected to be delivered in 2020 and pre-construction projects, as of
March 31, 2019
(dollars in thousands):
|
Square Footage
|
||||||||||||||||||||||||||
|
Property/Market/Submarket
|
Dev/
Redev
|
CIP
|
Percentage
|
Occupancy
|
||||||||||||||||||||||
|
Construction
|
Pre-Construction
|
Total
|
Leased
|
Leased/Negotiating
|
Project Start
|
Initial
|
Stabilized
|
|||||||||||||||||||
|
Active construction projects
|
||||||||||||||||||||||||||
|
9880 and 10260 Campus Point Drive/San Diego/University Town Center
(1)
|
Dev/Redev
|
98,000
|
|
176,455
|
|
274,455
|
67
|
%
|
(2)
|
67
|
%
|
(2)
|
1Q19
|
2020
|
2022
|
|||||||||||
|
9800 Medical Center Drive/Maryland/Rockville
|
Dev
|
174,640
|
|
—
|
|
174,640
|
82
|
|
82
|
|
1Q19
|
2020
|
2020
|
|||||||||||||
|
9950 Medical Center Drive/Maryland/Rockville
|
Dev
|
84,264
|
|
—
|
|
84,264
|
100
|
|
100
|
|
1Q19
|
2020
|
2020
|
|||||||||||||
|
356,904
|
|
176,455
|
|
533,359
|
77
|
%
|
77
|
%
|
||||||||||||||||||
|
Marketing and pre-construction projects
|
||||||||||||||||||||||||||
|
201 Haskins Way/San Francisco/South San Francisco
|
Dev
|
—
|
|
280,000
|
|
280,000
|
||||||||||||||||||||
|
Alexandria District for Science and Technology/San Francisco/Greater Stanford
|
Dev
|
—
|
|
530,000
|
|
530,000
|
||||||||||||||||||||
|
3115 Merryfield Row/San Diego/Torrey Pines
|
Dev
|
—
|
|
87,000
|
|
87,000
|
||||||||||||||||||||
|
1165 Eastlake Avenue East/Seattle/Lake Union
|
Dev
|
—
|
|
106,000
|
|
106,000
|
||||||||||||||||||||
|
8 Davis Drive/Research Triangle/Research Triangle
|
Dev
|
—
|
|
200,000
|
|
200,000
|
||||||||||||||||||||
|
Alexandria Center
®
for AgTech, Phase II/Research Triangle/Research Triangle
(3)
|
Dev
|
—
|
|
160,000
|
|
160,000
|
||||||||||||||||||||
|
—
|
|
1,363,000
|
|
1,363,000
|
||||||||||||||||||||||
|
2020 deliveries
|
356,904
|
|
1,539,455
|
|
1,896,359
|
|||||||||||||||||||||
|
Key pre-leased pre-construction project
|
||||||||||||||||||||||||||
|
88 Bluxome Street/San Francisco/Mission Bay/SoMa
|
Dev
|
—
|
|
1,070,925
|
1,070,925
|
58
|
%
|
58
|
%
|
(4)
|
TBD
|
(4)
|
TBD
|
(4)
|
||||||||||||
|
356,904
|
|
2,610,380
|
2,967,284
|
|||||||||||||||||||||||
|
Our Ownership Interest
|
Cost to Complete
|
Unlevered Yields
|
||||||||||||||||||||||||
|
Property/Market/Submarket
|
CIP
|
ARE Funding
|
Total at
Completion
|
Initial Stabilized
|
Initial Stabilized (Cash)
|
|||||||||||||||||||||
|
Active construction projects
|
||||||||||||||||||||||||||
|
9880 and 10260 Campus Point Drive/San Diego/University Town Center
(1)
|
100
|
%
|
$
|
116,539
|
|
$
|
138,461
|
|
$
|
255,000
|
|
6.3
|
%
|
(5)
|
6.4
|
%
|
(5)
|
|||||||||
|
9800 Medical Center Drive/Maryland/Rockville
|
100
|
%
|
18,311
|
|
77,089
|
|
95,400
|
|
7.7
|
%
|
7.2
|
%
|
||||||||||||||
|
9950 Medical Center Drive/Maryland/Rockville
|
100
|
%
|
6,513
|
|
47,787
|
|
54,300
|
|
7.3
|
%
|
6.8
|
%
|
||||||||||||||
|
141,363
|
|
$
|
263,337
|
|
$
|
404,700
|
|
|||||||||||||||||||
|
Marketing and pre-construction projects
|
||||||||||||||||||||||||||
|
201 Haskins Way/San Francisco/South San Francisco
|
100
|
%
|
59,691
|
|
||||||||||||||||||||||
|
Alexandria District for Science and Technology/San Francisco/Greater Stanford
|
100
|
%
|
156,424
|
|
||||||||||||||||||||||
|
3115 Merryfield Row/San Diego/Torrey Pines
|
100
|
%
|
30,294
|
|
||||||||||||||||||||||
|
1165 Eastlake Avenue East/Seattle/Lake Union
|
100
|
%
|
22,166
|
|
||||||||||||||||||||||
|
8 Davis Drive/Research Triangle/Research Triangle
|
100
|
%
|
2,955
|
|
||||||||||||||||||||||
|
Alexandria Center
®
for AgTech, Phase II/Research Triangle/Research Triangle
(3)
|
2,184
|
|
||||||||||||||||||||||||
|
273,714
|
|
|||||||||||||||||||||||||
|
2020 deliveries
|
$
|
415,077
|
|
|||||||||||||||||||||||
|
(1)
|
9880 Campus Point Drive previous R&D building was demolished for the development of GradLabs™, a highly flexible, first-of-its-kind life science platform designed to provide post-seed-stage life science companies with turnkey, fully furnished office/laboratory suites and an accelerated, scalable path for growth. As of March 31, 2019, the property continues to be included in our same property performance results. Refer to the “Same Properties” section within this Item 2 for additional information.
|
|
(2)
|
9880 Campus Point Drive, aggregating
98,000
RSF, is
7%
leased and 10260 Campus Point Drive, aggregating
176,455
RSF, is
100%
pre-leased, resulting in
67%
total leased.
|
|
(3)
|
New strategic collaborative campus, Alexandria Center
®
for AgTech – Research Triangle consists of Phase I at 5 Laboratory Drive and campus amenities, and Phase II at 9 Laboratory Drive.
|
|
(4)
|
Pinterest has signed a lease for
488,899
RSF at 88 Bluxome Street, an approximately
1.1 million
RSF mixed-used campus development project in the heart of the Central SoMa neighborhood. We are currently seeking entitlements to bring a transformative, community-focused development that represents a meaningful opportunity to create a new destination that will revitalize the neighborhood and stimulate innovation and job growth in SoMa.
|
|
(5)
|
Represents Campus Pointe by Alexandria campus yields excluding 4161 and 4110 Campus Point Court, which are expected to be taken out of service over the next few years and undergo future value-creation development and redevelopment activities.
|
74
New Class A development and redevelopment properties: summary of pipeline
The following table summarizes the key information for all our development and redevelopment projects in North America as of
March 31, 2019
(dollars in thousands):
|
Property/Submarket
|
Our Ownership Interest
|
Book Value
|
Square Footage
|
|||||||||||||||||||||||||||
|
Projected Deliveries
|
Future
|
Total
|
||||||||||||||||||||||||||||
|
2019
|
2020
|
2021–2022
|
||||||||||||||||||||||||||||
|
Construction
|
Construction
|
Pre-Construction
|
Pre-Construction
|
Intermediate-Term
|
||||||||||||||||||||||||||
|
Greater Boston
|
||||||||||||||||||||||||||||||
|
Undergoing construction or pre-construction
|
||||||||||||||||||||||||||||||
|
399 Binney (Alexandria Center
®
at One Kendall Square)/Cambridge
|
100
|
%
|
$
|
35,467
|
|
40,597
|
|
—
|
|
—
|
|
—
|
|
—
|
|
—
|
|
40,597
|
|
|||||||||||
|
266 and 275 Second Avenue/Route 128
|
100
|
%
|
12,227
|
|
31,858
|
|
—
|
|
—
|
|
—
|
|
—
|
|
—
|
|
31,858
|
|
||||||||||||
|
325 Binney Street/Cambridge
|
100
|
%
|
102,230
|
|
—
|
|
—
|
|
—
|
|
—
|
|
208,965
|
|
(1)
|
—
|
|
208,965
|
|
|||||||||||
|
99 A Street/Seaport Innovation District
|
97.2
|
%
|
36,655
|
|
—
|
|
—
|
|
—
|
|
—
|
|
235,000
|
|
(2)
|
—
|
|
235,000
|
|
|||||||||||
|
215 Presidential Way/Route 128
|
100
|
%
|
5,455
|
|
—
|
|
—
|
|
—
|
|
—
|
|
130,000
|
|
—
|
|
130,000
|
|
||||||||||||
|
231 Second Avenue/Route 128
|
100
|
%
|
1,251
|
|
—
|
|
—
|
|
—
|
|
—
|
|
32,000
|
|
—
|
|
32,000
|
|
||||||||||||
|
Future development
|
|
|
|
|
|
|
|
|
|
|
|
|||||||||||||||||||
|
Alexandria Technology Square
®
/Cambridge
|
100
|
%
|
7,787
|
|
—
|
|
—
|
|
—
|
|
—
|
|
—
|
|
100,000
|
|
100,000
|
|
||||||||||||
|
100 Tech Drive/Route 128
|
100
|
%
|
—
|
|
—
|
|
—
|
|
—
|
|
—
|
|
—
|
|
300,000
|
|
300,000
|
|
||||||||||||
|
10 Necco Street/Seaport Innovation District
|
100
|
%
|
82,033
|
|
—
|
|
—
|
|
—
|
|
—
|
|
—
|
|
175,000
|
|
175,000
|
|
||||||||||||
|
Other value-creation projects
|
100
|
%
|
7,618
|
|
—
|
|
—
|
|
—
|
|
—
|
|
—
|
|
225,599
|
|
225,599
|
|
||||||||||||
|
290,723
|
|
72,455
|
|
—
|
|
—
|
|
—
|
|
605,965
|
|
800,599
|
|
1,479,019
|
|
|||||||||||||||
|
San Francisco
|
||||||||||||||||||||||||||||||
|
Undergoing construction or pre-construction
|
||||||||||||||||||||||||||||||
|
1655 and 1725 Third Street/Mission Bay/SoMa
|
10.0
|
%
|
(3)
|
|
593,765
|
|
—
|
|
—
|
|
—
|
|
—
|
|
593,765
|
|
||||||||||||||
|
279 East Grand Avenue/South San Francisco
|
100
|
%
|
36,730
|
|
71,595
|
|
—
|
|
—
|
|
—
|
|
—
|
|
71,595
|
|
||||||||||||||
|
681 Gateway Boulevard/South San Francisco
|
100
|
%
|
40,115
|
|
76,400
|
|
—
|
|
—
|
|
—
|
|
—
|
|
76,400
|
|
||||||||||||||
|
Menlo Gateway/Greater Stanford
|
44.5
|
%
|
(3)
|
|
520,988
|
|
—
|
|
—
|
|
—
|
|
—
|
|
520,988
|
|
|
|||||||||||||
|
201 Haskins Way/South San Francisco
|
100
|
%
|
59,691
|
|
—
|
|
—
|
|
280,000
|
|
—
|
|
—
|
|
280,000
|
|
||||||||||||||
|
Alexandria District for Science and Technology/
Greater Stanford
|
100
|
%
|
156,424
|
|
—
|
|
—
|
|
530,000
|
|
—
|
|
—
|
|
530,000
|
|
||||||||||||||
|
88 Bluxome Street/Mission Bay/SoMa
|
100
|
%
|
182,132
|
|
—
|
|
—
|
|
—
|
|
1,070,925
|
|
(2)
|
—
|
|
—
|
|
1,070,925
|
|
|
||||||||||
|
505 Brannan Street, Phase II/Mission Bay/SoMa
|
99.7
|
%
|
16,925
|
|
—
|
|
—
|
|
—
|
|
165,000
|
|
—
|
|
165,000
|
|
||||||||||||||
|
960 Industrial Road/Greater Stanford
|
100
|
%
|
84,843
|
|
—
|
|
—
|
|
—
|
|
533,000
|
|
(2)
|
—
|
|
533,000
|
|
|||||||||||||
|
Future development
|
|
|
|
|
|
|
|
|||||||||||||||||||||||
|
East Grand Avenue/South San Francisco
|
100
|
%
|
5,988
|
|
—
|
|
—
|
|
—
|
|
—
|
|
90,000
|
|
90,000
|
|
||||||||||||||
|
Other value-creation projects
|
100
|
%
|
39,561
|
|
—
|
|
—
|
|
—
|
|
418,000
|
|
25,000
|
|
443,000
|
|
||||||||||||||
|
622,409
|
|
1,262,748
|
|
—
|
|
810,000
|
|
1,070,925
|
|
1,116,000
|
|
115,000
|
|
4,374,673
|
|
|||||||||||||||
|
New York City
|
||||||||||||||||||||||||||||||
|
Undergoing construction or pre-construction
|
||||||||||||||||||||||||||||||
|
Alexandria Life Science Factory/New York City
|
100
|
%
|
63,816
|
|
140,098
|
|
—
|
|
—
|
|
—
|
|
—
|
|
—
|
|
140,098
|
|
||||||||||||
|
Alexandria Center
®
for Life Science – New York City/New York City
|
100
|
%
|
17,587
|
|
—
|
|
—
|
|
—
|
|
—
|
|
550,000
|
|
—
|
|
550,000
|
|
||||||||||||
|
Future redevelopment
|
||||||||||||||||||||||||||||||
|
219 East 42nd Street/New York City
|
100
|
%
|
—
|
|
—
|
|
—
|
|
—
|
|
—
|
|
—
|
|
579,947
|
|
(4)
|
579,947
|
|
|||||||||||
|
$
|
81,403
|
|
140,098
|
|
—
|
|
—
|
|
—
|
|
550,000
|
|
579,947
|
|
1,270,045
|
|
||||||||||||||
|
(1) We are seeking additional entitlements to increase the density of the site from its current 208,965 RSF.
(2) Represents total square footage upon completion of development of a new Class A property. RSF presented includes RSF of buildings currently in operation that will be demolished upon commencement of construction.
(3) This property is held by an unconsolidated real estate joint venture. Refer to the “Consolidated and Unconsolidated Real Estate Joint Ventures” section within this Item 2 for additional information on our ownership interest.
(4) Includes 349,947 RSF in operation with an opportunity to either convert the existing office space into office/laboratory space through future redevelopment or to expand the building by an additional 230,000 RSF through ground-up development. The building is currently occupied by Pfizer Inc. with a remaining lease term of six years.
|
||||||||||||||||||||||||||||||
75
New Class A development and redevelopment properties: summary of pipeline (continued)
|
Property/Submarket
|
Our Ownership Interest
|
Book Value
|
Square Footage
|
|||||||||||||||||||||||||||
|
Projected Deliveries
|
Future
|
Total
|
||||||||||||||||||||||||||||
|
2019
|
2020
|
2021–2022
|
||||||||||||||||||||||||||||
|
Construction
|
Construction
|
Pre-Construction
|
Pre-Construction
|
Intermediate-Term
|
||||||||||||||||||||||||||
|
San Diego
|
||||||||||||||||||||||||||||||
|
Undergoing construction or pre-construction
|
||||||||||||||||||||||||||||||
|
Campus Pointe by Alexandria/University Town Center
|
(1
|
)
|
$
|
129,270
|
|
—
|
|
98,000
|
|
176,455
|
|
(2)
|
—
|
|
230,000
|
|
—
|
|
504,455
|
|
||||||||||
|
3115 Merryfield Row/Torrey Pines
|
100
|
%
|
30,294
|
|
—
|
|
—
|
|
87,000
|
|
—
|
|
—
|
|
—
|
|
87,000
|
|
||||||||||||
|
5200 Illumina Way/University Town Center
|
100
|
%
|
11,718
|
|
—
|
|
—
|
|
—
|
|
—
|
|
386,044
|
|
—
|
|
386,044
|
|
||||||||||||
|
Townsgate by Alexandria/Del Mar Heights
|
100
|
%
|
18,282
|
|
—
|
|
—
|
|
—
|
|
—
|
|
125,000
|
|
—
|
|
125,000
|
|
||||||||||||
|
Future development
|
|
|
|
|
|
|||||||||||||||||||||||||
|
Campus Pointe by Alexandria/University Town Center
|
(1
|
)
|
43,934
|
|
—
|
|
—
|
|
—
|
|
—
|
|
—
|
|
290,283
|
|
(3)
|
290,283
|
|
|||||||||||
|
Vista Wateridge/Sorrento Mesa
|
100
|
%
|
4,022
|
|
—
|
|
—
|
|
—
|
|
—
|
|
—
|
|
163,000
|
|
163,000
|
|
||||||||||||
|
Other value-creation projects
|
100
|
%
|
5,931
|
|
—
|
|
—
|
|
—
|
|
—
|
|
—
|
|
222,895
|
|
222,895
|
|
||||||||||||
|
243,451
|
|
—
|
|
98,000
|
|
263,455
|
|
—
|
|
741,044
|
|
676,178
|
|
1,778,677
|
|
|||||||||||||||
|
Seattle
|
||||||||||||||||||||||||||||||
|
Undergoing construction or pre-construction
|
||||||||||||||||||||||||||||||
|
188 East Blaine Street/Lake Union
|
100
|
%
|
61,699
|
|
107,385
|
|
—
|
|
—
|
|
—
|
|
—
|
|
—
|
|
107,385
|
|
||||||||||||
|
1165 Eastlake Avenue East/Lake Union
|
100
|
%
|
22,166
|
|
—
|
|
—
|
|
106,000
|
|
—
|
|
—
|
|
—
|
|
106,000
|
|
||||||||||||
|
1150 Eastlake Avenue East/Lake Union
|
100
|
%
|
24,995
|
|
—
|
|
—
|
|
—
|
|
—
|
|
260,000
|
|
—
|
|
260,000
|
|
||||||||||||
|
701 Dexter Avenue North/Lake Union
|
100
|
%
|
38,289
|
|
—
|
|
—
|
|
—
|
|
—
|
|
217,000
|
|
—
|
|
217,000
|
|
||||||||||||
|
147,149
|
|
107,385
|
|
—
|
|
106,000
|
|
—
|
|
477,000
|
|
—
|
|
690,385
|
|
|||||||||||||||
|
Maryland
|
||||||||||||||||||||||||||||||
|
Undergoing construction or pre-construction
|
||||||||||||||||||||||||||||||
|
704 Quince Orchard Road/Gaithersburg
|
56.8
|
%
|
(4)
|
|
45,097
|
|
—
|
|
—
|
|
—
|
|
—
|
|
—
|
|
45,097
|
|
||||||||||||
|
9800 Medical Center Drive/Rockville
|
100
|
%
|
18,311
|
|
—
|
|
174,640
|
|
—
|
|
—
|
|
—
|
|
—
|
|
174,640
|
|
||||||||||||
|
9950 Medical Center Drive/Rockville
|
100
|
%
|
6,513
|
|
—
|
|
84,264
|
|
—
|
|
—
|
|
—
|
|
—
|
|
84,264
|
|
||||||||||||
|
Future development
|
||||||||||||||||||||||||||||||
|
9800 Medical Center Drive/Rockville
|
100
|
%
|
1,215
|
|
—
|
|
—
|
|
—
|
|
—
|
|
—
|
|
64,000
|
|
64,000
|
|
||||||||||||
|
26,039
|
|
45,097
|
|
258,904
|
|
—
|
|
—
|
|
—
|
|
64,000
|
|
368,001
|
|
|||||||||||||||
|
Research Triangle
|
||||||||||||||||||||||||||||||
|
Undergoing construction or pre-construction
|
||||||||||||||||||||||||||||||
|
Alexandria Center® for AgTech, Phase I/
Research Triangle |
100
|
%
|
39,128
|
|
118,863
|
|
—
|
|
—
|
|
—
|
|
—
|
|
—
|
|
118,863
|
|
||||||||||||
|
Alexandria Center® for AgTech, Phase II/
Research Triangle |
100
|
%
|
2,184
|
|
—
|
|
—
|
|
160,000
|
|
—
|
|
—
|
|
—
|
|
160,000
|
|
||||||||||||
|
8 Davis Drive/Research Triangle
|
100
|
%
|
2,955
|
|
—
|
|
—
|
|
200,000
|
|
—
|
|
—
|
|
—
|
|
200,000
|
|
||||||||||||
|
Future development
|
||||||||||||||||||||||||||||||
|
6 Davis Drive/Research Triangle
|
100
|
%
|
15,394
|
|
—
|
|
—
|
|
—
|
|
—
|
|
—
|
|
800,000
|
|
800,000
|
|
||||||||||||
|
Other value-creation projects
|
100
|
%
|
4,149
|
|
—
|
|
—
|
|
—
|
|
—
|
|
—
|
|
76,262
|
|
76,262
|
|
||||||||||||
|
63,810
|
|
118,863
|
|
—
|
|
360,000
|
|
—
|
|
—
|
|
876,262
|
|
1,355,125
|
|
|||||||||||||||
|
Other value-creation projects
|
100
|
%
|
3,788
|
|
—
|
|
—
|
|
—
|
|
—
|
|
—
|
|
122,800
|
|
122,800
|
|
||||||||||||
|
$
|
1,478,772
|
|
1,746,646
|
|
356,904
|
|
1,539,455
|
|
1,070,925
|
|
3,490,009
|
|
3,234,786
|
|
11,438,725
|
|
(5)
|
|||||||||||||
|
(1)
|
Refer to the “Consolidated and Unconsolidated Real Estate Joint Ventures” section within this Item 2 for additional information on our ownership interest.
|
|
(2)
|
RSF represent our future redevelopment and expansion opportunities at 10260 Campus Point Drive property, which includes
109,164
RSF of the building currently in operation that will be redeveloped and expanded into a
176,455
RSF Class A building.
|
|
(3)
|
Includes RSF of our building at 4161 Campus Point Court. Upon expiration of the existing lease, 4161 Campus Point Court will be demolished to support future development aggregating
201,900
RSF through one or more Class A buildings at our Campus Pointe by Alexandria campus.
|
|
(4)
|
This property is held by an unconsolidated real estate joint venture. Refer to the “Consolidated and Unconsolidated Real Estate Joint Ventures” section within this Item 2 for additional information on our ownership interest.
|
|
(5)
|
Total RSF includes
970,180
RSF of buildings currently in operation that will be redeveloped or replaced with new development RSF upon commencement of future construction. Refer to footnote 2 in the “Investments in Real Estate” section within this Item 2 for additional information.
|
76
Summary of capital expenditures
Our construction spending for the
three months ended March 31, 2019
, consisted of the following (in thousands):
|
Three Months Ended
|
|||||
|
Construction Spending
|
March 31, 2019
|
||||
|
Additions to real estate –
consolidated projects
|
$
|
241,049
|
|
||
|
Investments in unconsolidated real estate joint ventures
|
52,634
|
|
|||
|
Contributions from noncontrolling interests
|
(5,025
|
)
|
|||
|
Construction spending (cash basis)
(1)
|
288,658
|
|
|||
|
Change in accrued construction
|
9,939
|
|
|||
|
Construction spending for the three months ended March 31, 2019
|
298,597
|
|
|||
|
Projected construction spending for the nine months ending December 31, 2019
|
1,001,403
|
|
|||
|
Guidance mid-point
|
$
|
1,300,000
|
|
||
|
(1)
|
Includes revenue-enhancing projects and non-revenue-enhancing capital expenditures.
|
The following table summarizes the total projected construction spending for the year ending
December 31, 2019
, which includes interest, property taxes, insurance, payroll, and other indirect project costs (in thousands):
|
Projected Construction Spending
|
Year Ending
December 31, 2019 |
||||||
|
Development, redevelopment, and pre-construction projects
|
$
|
1,041,000
|
|||||
|
Investments in unconsolidated real estate joint ventures
|
102,000
|
||||||
|
Contributions from noncontrolling interests (consolidated real estate joint ventures)
|
(22,000
|
)
|
|||||
|
Generic laboratory infrastructure/building improvement projects
|
150,000
|
||||||
|
Non-revenue-enhancing capital expenditures and tenant improvements
|
29,000
|
||||||
|
Guidance mid-point
|
$
|
1,300,000
|
|||||
Non-revenue-enhancing capital expenditures, tenant improvements, and leasing costs
The table below presents the average per RSF of property-related non-revenue-enhancing capital expenditures, tenant improvements, and leasing costs, excluding capital expenditures and tenant improvements that are recoverable from tenants, revenue‑enhancing, or related to properties that have undergone redevelopment (dollars in thousands, except per RSF amounts):
|
Non-Revenue-Enhancing Capital Expenditures
(1)
|
Three Months Ended March 31, 2019
|
Recent Average
per RSF (2) |
|||||||||||
|
Amount
|
Per RSF
|
||||||||||||
|
Non-revenue-enhancing capital expenditures
|
$
|
2,381
|
|
$
|
0.11
|
|
$
|
0.49
|
|
||||
|
Tenant improvements and leasing costs:
|
|||||||||||||
|
Re-tenanted space
|
$
|
7,910
|
|
$
|
22.96
|
|
$
|
21.47
|
|
||||
|
Renewal space
|
799
|
|
4.85
|
|
12.62
|
|
|||||||
|
Total tenant improvements and leasing costs/weighted average
|
$
|
8,709
|
|
$
|
17.10
|
|
$
|
16.45
|
|
||||
|
(1)
|
Excludes amounts that are recoverable from tenants, related to revenue-enhancing capital expenditures, or related to properties that have undergone redevelopment.
|
|
(2)
|
Represents the average of 2015 to 2018 and the
three months ended March 31, 2019
, annualized.
|
77
Results of operations
We present a tabular comparison of items, whether gain or loss, that may facilitate a high-level understanding of our results and provide context for the disclosures included in our most recent annual report on Form 10-K for the year ended
December 31, 2018
, and our subsequent quarterly reports on Form 10-Q. We believe such tabular presentation promotes a better understanding for investors of the corporate-level decisions made and activities performed that significantly affect comparison of our operating results from period to period. We also believe this tabular presentation will supplement for investors an understanding of our disclosures and real estate operating results. Gains or losses on sales of real estate and impairments of held for sale assets are related to corporate-level decisions to dispose of real estate. Gains or losses on early extinguishment of debt and preferred stock redemption charges are related to corporate-level financing decisions focused on our capital structure strategy. Significant realized and unrealized gains or losses on non-real estate investments and impairments of real estate and non-real estate investments are not related to the operating performance of our real estate assets as they result from strategic, corporate-level non-real estate investment decisions and external market conditions. Impairments of non-real estate investments are not related to the operating performance of our real estate as they represent the write-down of a non-real estate investment when its fair value declines below its carrying value due to changes in general market or other conditions outside of our control. Significant items, whether a gain or loss, included in the tabular disclosure for current periods are described in further detail within this Item 2. Key items included in net income attributable to Alexandria’s common stockholders are as follows:
|
Amount
|
Per Share – Diluted
|
||||||||||||||
|
Three Months Ended March 31,
|
|||||||||||||||
|
(In millions, except per share amounts)
|
2019
|
2018
|
2019
|
2018
|
|||||||||||
|
Unrealized gains on non-real estate investments
(1)
|
$
|
72.2
|
|
$
|
72.2
|
|
$
|
0.65
|
|
$
|
0.70
|
|
|||
|
Realized gain on non-real estate investment
|
—
|
|
8.3
|
|
—
|
|
0.08
|
|
|||||||
|
Loss on early extinguishment of debt
(2)
|
(7.4
|
)
|
—
|
|
(0.07
|
)
|
—
|
|
|||||||
|
Preferred stock redemption charge
(3)
|
(2.6
|
)
|
—
|
|
(0.02
|
)
|
—
|
|
|||||||
|
Total
|
$
|
62.2
|
|
$
|
80.5
|
|
$
|
0.56
|
|
$
|
0.78
|
|
|||
|
Weighted-average shares of common stock outstanding for calculation of EPS – diluted
|
111.1
|
|
100.1
|
|
|||||||||||
|
(1)
|
Refer to Note 7 – “Investments” to our unaudited consolidated financial statements under Item 1 of this report for more information.
|
|
(2)
|
Refer to Note 10 – “Secured and Unsecured Senior Debt” to our unaudited consolidated financial statements under Item 1 of this report for more information.
|
|
(3)
|
Refer to Note 14 – “Stockholders’ Equity” to our unaudited consolidated financial statements under Item 1 of this report for more information.
|
78
Same Properties
We supplement an evaluation of our results of operations with an evaluation of operating performance of certain of our properties, referred to as Same Properties. For more information on the determination of our Same Properties portfolio, refer to the definition of “Same Property Comparisons” in the “Non-GAAP Measures and Definitions” section within this Item 2. The following table presents information regarding our Same Properties for the
three months ended March 31, 2019
:
|
Three Months Ended March 31, 2019
|
|||
|
Percentage change in net operating income over comparable period from prior year
|
2.3%
|
|
|
|
Percentage change in net operating income (cash basis) over comparable period from prior year
|
10.2%
|
|
|
|
Operating margin
|
72%
|
|
|
|
Number of Same Properties
|
196
|
|
|
|
RSF
|
18,960,703
|
|
|
|
Occupancy – current-period average
|
96.2%
|
||
|
Occupancy – same-period prior-year average
|
96.4%
|
||
The following table reconciles the number of Same Properties to total properties for the
three months ended March 31, 2019
:
|
Development – under construction
|
Properties
|
|||
|
399 Binney Street
|
1
|
|
||
|
279 East Grand Avenue
|
1
|
|
||
|
188 East Blaine Street
|
1
|
|
||
|
9800 Medical Center Drive
|
1
|
|
||
|
9950 Medical Center Drive
|
1
|
|
||
|
5
|
|
|||
|
Development – placed into service after January 1, 2018
|
Properties
|
|||
|
100 Binney Street
|
1
|
|
||
|
213 East Grand Avenue
|
1
|
|
||
|
2
|
|
|||
|
Redevelopment – under construction
|
Properties
|
|||
|
Alexandria Center
®
for AgTech, Phase I
|
1
|
|
||
|
266 and 275 Second Avenue
|
2
|
|
||
|
681 Gateway Boulevard
|
1
|
|
||
|
Alexandria Life Science Factory
|
1
|
|
||
|
5
|
|
|||
|
Redevelopment – placed into service after January 1, 2018
|
Properties
|
|||
|
9625 Towne Centre Drive
|
1
|
|
||
|
Alexandria PARC
|
4
|
|
||
|
9900 Medical Center Drive
|
1
|
|
||
|
6
|
|
|||
|
Acquisitions after January 1, 2018
|
Properties
|
|||
|
100 Tech Drive
|
1
|
|
||
|
219 East 42nd Street
|
1
|
|
||
|
Summers Ridge Science Park
|
4
|
|
||
|
2301 5th Avenue
|
1
|
|
||
|
9704, 9708, 9712, and 9714 Medical Center Drive
|
4
|
|
||
|
9920 Belward Campus Drive
|
1
|
|
||
|
21 Firstfield Road
|
1
|
|
||
|
50 and 55 West Watkins Mill Road
|
2
|
|
||
|
10260 Campus Point Drive and 4161 Campus Point Court
|
2
|
|
||
|
99 A Street
|
1
|
|
||
|
3170 Porter Drive
|
1
|
|
||
|
Shoreway Science Center
|
2
|
|
||
|
3911 and 3931 Sorrento Valley Boulevard
|
2
|
|
||
|
260 Townsend Street
|
1
|
|
||
|
Other
|
5
|
|
||
|
29
|
|
|||
|
Unconsolidated real estate JV
|
6
|
|
||
|
Properties held for sale
|
1
|
|
||
|
Total properties excluded from Same Properties
|
54
|
|
||
|
Same Properties
|
196
|
|
(1)
|
|
|
Total properties in North America as of
March 31, 2019 |
250
|
|
||
|
(1)
|
Includes 9880 Campus Point Drive, a building we acquired in 2001. The building was occupied through January 2018 and subsequently demolished. The 98,000 RSF project is currently in active development.
|
79
Comparison of results for the three months ended
March 31, 2019
, to the three months ended
March 31, 2018
On January 1, 2019, we adopted a new lease accounting standard and, among other practical expedients, elected the single component practical expedient. As a result of our election of the single component practical expedient, we account for rental revenues and tenant recoveries generated through the leasing of real estate assets that qualify for this expedient as a single component, and classify associated revenue in income from rentals in our consolidated statements of income. Prior to the adoption of the new lease accounting standard, we presented rental revenues and tenant recoveries separately in our consolidated statements of income. Refer to the “Lease Accounting” section of Note 2 – “Summary of Significant Accounting Policies” for additional information. In the table below, we continue to provide investors with a separate presentation of rental revenues and tenant recoveries because we believe it is useful to investors as a better way of understanding of the changes in our operating results. In the table below, we also reconcile rental revenues and tenant recoveries to income from rentals, pursuant to the new lease accounting guidance, and provide a variance analysis of its balance. We believe that tenant recoveries is useful to investors as a supplemental measure of our ability to recover operating expenses under our triple net leases, including recoveries of utilities, repairs and maintenance, insurance, property taxes, common area expenses, and other operating expenses, and of our ability to mitigate the effect to net income for any significant increases to components of our operating expenses.
The following table presents a comparison of the components of net operating income for our Same Properties and Non-Same Properties for the three months ended
March 31, 2019
, compared to the three months ended
March 31, 2018
. For a reconciliation of net operating income from net income, the most directly comparable financial measure presented in accordance with GAAP, refer to the “Non-GAAP Measures and Definitions” section within this Item 2.
|
Three Months Ended March 31,
|
||||||||||||||||
|
(Dollars in thousands)
|
2019
|
2018
|
$ Change
|
% Change
|
||||||||||||
|
Income from rentals:
|
||||||||||||||||
|
Same Properties
|
$
|
230,275
|
|
$
|
224,187
|
|
$
|
6,088
|
|
2.7
|
%
|
|||||
|
Non-Same Properties
|
44,288
|
|
20,298
|
|
23,990
|
|
118.2
|
|
||||||||
|
Rental revenues
|
274,563
|
|
244,485
|
|
30,078
|
|
12.3
|
|
||||||||
|
Same Properties
|
72,360
|
|
69,627
|
|
2,733
|
|
3.9
|
|
||||||||
|
Non-Same Properties
|
7,826
|
|
3,543
|
|
4,283
|
|
120.9
|
|
||||||||
|
Tenant recoveries
|
80,186
|
|
73,170
|
|
7,016
|
|
9.6
|
|
||||||||
|
Income from rentals
|
354,749
|
|
317,655
|
|
37,094
|
|
11.7
|
|
||||||||
|
Same Properties
|
196
|
|
62
|
|
134
|
|
216.1
|
|
||||||||
|
Non-Same Properties
|
3,897
|
|
2,422
|
|
1,475
|
|
60.9
|
|
||||||||
|
Other income
|
4,093
|
|
2,484
|
|
1,609
|
|
64.8
|
|
||||||||
|
Same Properties
|
302,831
|
|
293,876
|
|
8,955
|
|
3.0
|
|
||||||||
|
Non-Same Properties
|
56,011
|
|
26,263
|
|
29,748
|
|
113.3
|
|
||||||||
|
Total revenues
|
358,842
|
|
320,139
|
|
38,703
|
|
12.1
|
|
||||||||
|
Same Properties
|
85,810
|
|
81,801
|
|
4,009
|
|
4.9
|
|
||||||||
|
Non-Same Properties
|
15,691
|
|
9,970
|
|
5,721
|
|
57.4
|
|
||||||||
|
Rental operations
|
101,501
|
|
91,771
|
|
9,730
|
|
10.6
|
|
||||||||
|
Same Properties
|
217,021
|
|
212,075
|
|
4,946
|
|
2.3
|
|
||||||||
|
Non-Same Properties
|
40,320
|
|
16,293
|
|
24,027
|
|
147.5
|
|
||||||||
|
Net operating income
|
$
|
257,341
|
|
$
|
228,368
|
|
$
|
28,973
|
|
12.7
|
%
|
|||||
|
Net operating income – Same Properties
|
$
|
217,021
|
|
$
|
212,075
|
|
$
|
4,946
|
|
2.3
|
%
|
|||||
|
Straight-line rent revenue
|
(15,328
|
)
|
(28,178
|
)
|
12,850
|
|
(45.6
|
)
|
||||||||
|
Amortization of acquired below-market leases
|
(3,099
|
)
|
(3,614
|
)
|
515
|
|
(14.3
|
)
|
||||||||
|
Net operating income – Same Properties (cash basis)
|
$
|
198,594
|
|
$
|
180,283
|
|
$
|
18,311
|
|
10.2
|
%
|
|||||
80
Income from rentals
Total income from rentals for the
three months ended March 31, 2019
, increased by
$37.1 million
, or
11.7
%, to
$354.7 million
, compared to
$317.7 million
for the
three months ended March 31, 2018
, as a result of increases in rental revenues and tenant recoveries, as discussed below.
Income from rentals
–
rental revenues
Total rental revenues for the
three months ended March 31, 2019
, increased by
$30.1 million
, or
12.3%
, to
$274.6 million
, compared to
$244.5 million
for the
three months ended March 31, 2018
. The increase was primarily due to an increase in rental revenues from our Non-Same Properties aggregating
$24.0 million
primarily related to
1.2 million
RSF of development and redevelopment projects placed into service subsequent to
January 1, 2018
, and
29
operating properties aggregating
2.2 million
RSF acquired subsequent to
January 1, 2018
.
Rental revenues from our Same Properties for the
three months ended March 31, 2019
, increased by
$6.1 million
, or
2.7%
, to
$230.3 million
, compared to
$224.2 million
for the
three months ended March 31, 2018
. The increase was primarily due to the rental rate increases on lease renewals and re-leasing of space since
January 1, 2018
.
Income from rentals
–
tenant recoveries
Tenant recoveries for the
three months ended March 31, 2019
, increased by
$7.0 million
, or
9.6%
, to
$80.2 million
, compared to
$73.2 million
for the
three months ended March 31, 2018
. This increase is primarily due to an increase from our Non-Same Properties described above. Same Properties’ tenant recoveries for the
three months ended March 31, 2019
, increased by
$2.7 million
, or
3.9%
, primarily due to the increase in recoverable operating expenses for the
three months ended March 31, 2019
, as discussed under “Rental Operations” below. As of
March 31, 2019
,
97%
of our leases (on an RSF basis) were triple net leases, which require tenants to pay substantially all real estate taxes, insurance, utilities, repairs and maintenance, common area expenses, and other operating expenses (including increases thereto) in addition to base rent.
Other income
Other income for the
three months ended March 31, 2019
and
2018
, was
$4.1 million
and
$2.5 million
, respectively, primarily consisting of construction management fees earned during each respective year.
Rental operations
Total rental operating expenses for the
three months ended March 31, 2019
, increased by
$9.7 million
, or
10.6%
, to
$101.5 million
, compared to
$91.8 million
for the
three months ended March 31, 2018
. Approximately
$5.7 million
of the increase was due to an increase in rental operating expenses from our Non-Same Properties primarily related to development and redevelopment projects and acquired properties as discussed above under “Income from Rentals.”
Same Properties’ rental operating expenses
increased by
$4.0 million
, or
4.9%
, to
$85.8 million
during the
three months ended March 31, 2019
, compared to
$81.8 million
for the
three months ended March 31, 2018
. Approximately
$1.3 million
of the increase was due to higher tax expense stemming from a new 3.5% gross receipts tax on rental revenues in the city of San Francisco that went into effect on January 1, 2019. The remaining
$2.7 million
increase was mainly a result of higher payroll and repairs and maintenance.
General and administrative expenses
General and administrative expenses for the
three months ended March 31, 2019
, increased by
$2.3 million
, or
10.1%
, to
$24.7 million
, compared to
$22.4 million
for the
three months ended March 31, 2018
. Approximately
$1 million
of the increase reflects incremental leasing costs recognized in expense in the current period, resulting from our adoption of a new accounting standard on leases on January 1, 2019. For a detailed discussion related to this new standard, refer to the “Lease Accounting” section of Note 2 – “Summary of Significant Accounting Policies” to our unaudited consolidated financial statements under Item 1 of this report.
The remaining increase of approximately
$1.3 million
of general and administrative expenses was due to a
24.5%
increase in our employee headcount since
January 1, 2018
, to accommodate the continued growth in the depth and breadth of our operations in multiple markets, including development and redevelopment projects placed into service and properties acquired subsequent to
January 1, 2018
, as discussed under “Income from Rentals” above. As a percentage of net operating income, our general and administrative expenses for the
three months ended March 31, 2019
and
2018
, were
9.5%
and
9.3%
, respectively.
81
Interest expense
Interest expense for the
three months ended March 31, 2019
and
2018
, consisted of the following (dollars in thousands):
|
Three Months Ended March 31,
|
||||||||||||
|
Component
|
2019
|
2018
|
Change
|
|||||||||
|
Interest incurred
|
$
|
57,609
|
|
$
|
50,275
|
|
$
|
7,334
|
|
|||
|
Capitalized interest
|
(18,509
|
)
|
(13,360
|
)
|
(5,149
|
)
|
||||||
|
Interest expense
|
$
|
39,100
|
|
$
|
36,915
|
|
$
|
2,185
|
|
|||
|
Average debt balance outstanding
(1)
|
$
|
5,758,660
|
|
$
|
5,193,666
|
|
$
|
564,994
|
|
|||
|
Weighted-average annual interest rate
(2)
|
4.0
|
%
|
3.9
|
%
|
0.1
|
%
|
||||||
|
(1)
|
Represents the average debt balance outstanding during the respective periods.
|
|
(2)
|
Represents annualized total interest incurred divided by the average debt balance outstanding in the respective periods.
|
The net change in interest expense during the
three months ended March 31, 2019
, compared to the
three months ended March 31, 2018
, resulted from the following (dollars in thousands):
|
Component
|
Interest Rate
(1)
|
Effective Date
|
Change
|
||||||||
|
Increases in interest incurred due to:
|
|||||||||||
|
Issuances of debt:
|
|||||||||||
|
$450 million unsecured senior notes payable
|
4.81
|
%
|
June 2018
|
$
|
5,295
|
|
|||||
|
$650 million unsecured senior notes payable – green bonds
|
4.03
|
%
|
June 2018/
March 2019 |
4,494
|
|
||||||
|
$300 million unsecured senior notes payable
|
4.93
|
%
|
March 2019
|
404
|
|
||||||
|
$350 million unsecured senior notes payable – green bonds
|
3.96
|
%
|
March 2019
|
371
|
|
||||||
|
Fluctuations in interest rate and average balance:
|
|||||||||||
|
$2.2 billion unsecured senior line of credit and senior bank term loan
|
2,565
|
|
|||||||||
|
Total increases
|
13,129
|
|
|||||||||
|
Decreases in interest incurred due to:
|
|||||||||||
|
Repayments of debt:
|
|||||||||||
|
Secured notes payable
|
8.15
|
%
|
January 2019
|
(2,099
|
)
|
||||||
|
2019 Unsecured senior bank term loan
|
2.75
|
%
|
September 2018
|
(1,406
|
)
|
||||||
|
Secured construction loan
|
3.29
|
%
|
March 2019
|
(706
|
)
|
||||||
|
Lower average notional amounts of and rates for interest rate hedge agreements in effect
|
(1,251
|
)
|
|||||||||
|
Other decrease in interest
|
(333
|
)
|
|||||||||
|
Total decreases
|
(5,795
|
)
|
|||||||||
|
Change in interest incurred
|
7,334
|
|
|||||||||
|
Increase in capitalized interest
|
(5,149
|
)
|
|||||||||
|
Total change in interest expense
|
$
|
2,185
|
|
||||||||
|
(1)
|
Represents the weighted-average interest rate as of the end of the applicable period, including expense/income related to our interest rate hedge agreements, amortization of loan fees, amortization of debt premiums (discounts), and other bank fees.
|
Depreciation and amortization
Depreciation and amortization expense for the
three months ended March 31, 2019
, increased by
$19.9 million
, or
17.4%
, to
$134.1 million
, compared to
$114.2 million
for the
three months ended March 31, 2018
. The increase is primarily due to additional depreciation from
1.2 million
RSF of development and redevelopment projects placed into service subsequent to
January 1, 2018
, and
29
operating properties aggregating
2.2 million
RSF acquired subsequent to
January 1, 2018
.
82
Investment income
During the
three months ended March 31, 2019
, we recognized
$83.6 million
of investment income, which included
$11.4 million
of realized gains and
$72.2 million
of unrealized gains. Realized gains of
$11.4 million
for the
three months ended March 31, 2019
, relate primarily to the sales of our investments in publicly traded companies. Unrealized gains during the
three months ended March 31, 2019
, primarily consisted of increases in fair values of our investments in publicly traded companies aggregating
$34.3 million
and increases in the fair values of our equity investments in privately held entities that report NAV aggregating
$32.5 million
.
Loss on early extinguishment of debt
During the
three months ended March 31, 2019
, we repaid early one secured note payable aggregating
$106.7 million
, which was originally due in 2020 and bore interest at
7.75%
, and recognized a loss on early extinguishment of debt of
$7.1 million
, including the write-off of unamortized loan fees. Additionally, we repaid early the remaining
$193.1 million
balance of our secured construction loan related to 50/60 Binney Street and recognized a loss on early extinguishment of debt of
$269 thousand
.
Preferred stock redemption charge
During the
three months ended March 31, 2019
, we repurchased, in privately negotiated transactions,
275,000
outstanding shares of our Series D Convertible Preferred Stock and recognized a preferred stock redemption charge of
$2.6 million
.
83
Projected results
We present updated guidance for EPS attributable to Alexandria’s common stockholders – diluted, and funds from operations per share attributable to Alexandria’s common stockholders – diluted, as adjusted, based on our current view of existing market conditions and other assumptions for the year ending
December 31, 2019
, as set forth, and as adjusted, in the table below. The tables below also provide a reconciliation of EPS attributable to Alexandria’s common stockholders – diluted, the most directly comparable GAAP measure, to funds from operations per share and funds from operations per share, as adjusted, non-GAAP measures, and other key assumptions included in our updated guidance for the year ending
December 31, 2019
. There can be no assurance that actual amounts will not be materially higher or lower than these expectations. Refer to our discussion of “Forward-Looking Statements” in this Item 2.
|
Summary of Key Changes in Guidance
|
Guidance
|
|||
|
As of 4/29/19
|
As of 2/4/19
|
|||
|
EPS, FFO per share, and FFO per share, as Adjusted
|
See updates below
|
|||
|
Rental rate increases
|
26.0% to 29.0%
|
25.0% to 28.0%
|
||
|
Rental rate increases (cash basis)
|
13.0% to 16.0%
|
11.0% to 14.0%
|
||
|
Projected Earnings per Share and Funds From Operations per Share Attributable
to Alexandria’s Common Stockholders – Diluted, as Adjusted
|
As of 4/29/19
|
As of 2/4/19
|
||||||
|
Earnings per share
(1)
|
$2.65 to $2.75
|
$1.95 to $2.15
|
||||||
|
Depreciation and amortization
|
4.85
|
4.85
|
||||||
|
Allocation of unvested restricted stock awards
|
(0.05)
|
(0.03)
|
||||||
|
Funds from operations per share
(2)
|
$7.45 to $7.55
|
$6.77 to $6.97
|
||||||
|
Unrealized gains on non-real estate investment
(1)
|
(0.65)
|
—
|
||||||
|
Loss on early extinguishment of debt
|
0.07
|
0.06
|
||||||
|
Preferred stock redemption charge
|
0.02
|
0.02
|
||||||
|
Allocation to unvested restricted stock awards
|
0.01
|
—
|
||||||
|
Funds from operations per share, as adjusted
|
$6.90 to $7.00
|
$6.85 to $7.05
|
||||||
|
Midpoint
|
$6.95
|
$6.95
|
||||||
|
(1)
|
Excludes future unrealized gains or losses from changes in fair value of equity investments after
March 31, 2019
, that are required to be recognized in earnings.
|
|
(2)
|
Calculated in accordance with standards established by the Advisory Board of Governors of Nareit (the “Nareit Board of Governors”). Refer to the definition of “Funds From Operations and Funds From Operations, As Adjusted, Attributable to Alexandria’s Common Stockholders” in the “Non-GAAP Measures and Definitions” section within this Item 2 for additional information.
|
|
Key Assumptions
(1)
(Dollars in millions)
|
2019 Guidance
|
||||||||
|
Low
|
High
|
||||||||
|
Occupancy percentage for operating properties in North America as of December 31, 2019
|
97.7%
|
|
98.3%
|
|
|||||
|
Lease renewals and re-leasing of space:
|
|||||||||
|
Rental rate increases
|
26.0%
|
|
29.0%
|
|
|||||
|
Rental rate increases (cash basis)
|
13.0%
|
|
16.0%
|
|
|||||
|
Same property performance:
|
|||||||||
|
Net operating income increase
|
1.0%
|
|
3.0%
|
|
|||||
|
Net operating income increase (cash basis)
|
6.0%
|
|
8.0%
|
|
|||||
|
Straight-line rent revenue
|
$
|
95
|
|
$
|
105
|
|
(2)
|
||
|
General and administrative expenses
|
$
|
108
|
|
$
|
113
|
|
|||
|
Capitalization of interest
|
$
|
72
|
|
$
|
82
|
|
|||
|
Interest expense
|
$
|
172
|
|
$
|
182
|
|
|||
|
(1)
|
The completion of our development and redevelopment projects will result in an increase in interest expense and other project costs because these project costs will no longer qualify for capitalization and will therefore be expensed as incurred. Our assumptions for occupancy, rental rate growth, same property net operating income growth, straight-line rent revenue, general and administrative expenses, capitalization of interest, and interest expense are included in the tables above and are subject to a number of variables and uncertainties, including those discussed as “Forward-Looking Statements” under Part I; “Item 1A. Risk Factors”; and “Item 7. Management’s Discussion and Analysis of Financial Condition and Results of Operations” of our annual report on Form 10‑K for the year ended
December 31, 2018
. To the extent our full-year earnings guidance is updated during the year, we will provide disclosure supporting reasons for any significant changes to such guidance.
|
|
(2)
|
Approximately 45% of straight-line rent revenue represents initial free rent on recently delivered and expected 2019 deliveries of new Class A properties from our development and redevelopment pipeline.
|
|
Key Credit Metrics
|
2019 Guidance
|
||
|
Net debt to Adjusted EBITDA – fourth quarter of 2019, annualized
|
Less than or equal to 5.3x
|
||
|
Net debt and preferred stock to Adjusted EBITDA – fourth quarter of 2019, annualized
|
Less than or equal to 5.4x
|
||
|
Fixed-charge coverage ratio – fourth quarter of 2019, annualized
|
Greater than 4.0x
|
||
|
Value-creation pipeline as a percentage of gross investments in real estate as of December 31, 2019
|
8% to 12%
|
||
84
Consolidated and unconsolidated real estate joint ventures
We present components of balance sheet and operating results information for the noncontrolling interests’ share of our consolidated real estate joint ventures and for our share of investments in unconsolidated real estate joint ventures to help investors estimate balance sheet and operating results information related to our partially owned entities. These amounts are estimated by computing, for each joint venture that we consolidate in our financial statements, the noncontrolling interest percentage of each financial item to arrive at the cumulative noncontrolling interest share of each component presented. In addition, for our real estate joint ventures that we do not control and do not consolidate, we apply our economic ownership percentage to the unconsolidated real estate joint ventures to arrive at our proportionate share of each component presented. Refer to Note 4 – “Consolidated and Unconsolidated Real Estate Joint Ventures” to our unaudited consolidated financial statements under Item 1 of this report for further discussion.
|
Consolidated Real Estate Joint Ventures
(controlled by us through contractual rights or majority voting rights)
|
||||||
|
Property/Market/Submarket
|
Noncontrolling
(1)
Interest Share
|
|||||
|
75/125 Binney Street/Greater Boston/Cambridge
|
60.0
|
%
|
||||
|
225 Binney Street/Greater Boston/Cambridge
|
70.0
|
%
|
||||
|
409 and 499 Illinois Street/San Francisco/Mission Bay/SoMa
|
40.0
|
%
|
||||
|
1500 Owens Street/San Francisco/Mission Bay/SoMa
|
49.9
|
%
|
||||
|
Campus Pointe by Alexandria/San Diego/University Town Center
(2)
|
45.0
|
%
|
||||
|
9625 Towne Centre Drive/San Diego/University Town Center
|
49.9
|
%
|
||||
|
Unconsolidated Real Estate Joint Ventures
(controlled jointly or by our JV partners through contractual rights or majority voting rights)
|
||||||
|
Property/Market/Submarket
|
Our Ownership Share
(3)
|
|||||
|
1655 and 1725 Third Street/San Francisco/Mission Bay/SoMa
|
10.0
|
%
|
||||
|
Menlo Gateway/San Francisco/Greater Stanford
|
44.5
|
%
|
(4)
|
|||
|
1401/1413 Research Boulevard/Maryland/Rockville
|
65.0
|
%
|
(5)
|
|||
|
704 Quince Orchard Road/Maryland/Gaithersburg
|
56.8
|
%
|
(5)
|
|||
|
(1)
|
In addition to the consolidated real estate joint ventures listed, various partners hold insignificant noncontrolling interests in
four
other joint ventures in North America.
|
|
(2)
|
Includes only 10290 and 10300 Campus Point Drive and 4110 Campus Point Court in our University Town Center submarket.
|
|
(3)
|
In addition to the unconsolidated real estate joint ventures listed, we hold
one
other insignificant unconsolidated real estate joint venture in North America.
|
|
(4)
|
As of
March 31, 2019
, we have a
44.5%
ownership interest in Menlo Gateway and expect our ownership to increase to
49%
through future funding of construction costs in 2019.
|
|
(5)
|
Represents our ownership interest; our voting interest is limited to 50%.
|
As of
March 31, 2019
, our unconsolidated real estate joint ventures have the following non-recourse secured loans that include the following key terms (dollars in thousands):
|
Maturity Date
|
Stated Interest Rate
|
Interest Rate
(1)
|
100% at Joint Venture Level
|
||||||||||||||||
|
Unconsolidated Joint Venture
|
Our Share
|
Debt Balance
(2)
|
Remaining Commitments
|
||||||||||||||||
|
1401/1413 Research Boulevard
|
65.0%
|
5/17/20
|
L+2.50%
|
5.97%
|
$
|
22,364
|
|
$
|
6,315
|
|
|||||||||
|
1655 and 1725 Third Street
|
10.0%
|
6/29/21
|
L+3.70%
|
6.19%
|
204,830
|
|
170,170
|
|
|||||||||||
|
704 Quince Orchard Road
|
56.8%
|
3/16/23
|
L+1.95%
|
4.68%
|
6,020
|
|
8,833
|
|
|||||||||||
|
Menlo Gateway, Phase II
|
44.5%
|
5/1/35
|
4.53%
|
N/A
|
—
|
|
157,270
|
|
|||||||||||
|
Menlo Gateway, Phase I
|
44.5%
|
8/10/35
|
4.15%
|
4.18%
|
143,940
|
|
408
|
|
|||||||||||
|
$
|
377,154
|
|
$
|
342,996
|
|
||||||||||||||
|
(1)
|
Includes interest expense and amortization of loan fees for the
three months ended March 31, 2019
.
|
|
(2)
|
Represents outstanding principal, net of unamortized deferred financing costs,
as of March 31, 2019
.
|
85
The following tables present information related to the operating results and financial positions of our consolidated and unconsolidated real estate joint ventures (in thousands):
|
Three Months Ended March 31, 2019
|
|||||||
|
Noncontrolling Interest Share of Consolidated Real Estate Joint Ventures
|
Our Share of Unconsolidated
Real Estate Joint Ventures |
||||||
|
Total revenues
|
$
|
17,805
|
|
$
|
2,821
|
|
|
|
Rental operations
|
(4,910
|
)
|
(567
|
)
|
|||
|
12,895
|
|
2,254
|
|
||||
|
General and administrative
|
(34
|
)
|
(32
|
)
|
|||
|
Interest
|
—
|
|
(230
|
)
|
|||
|
Depreciation and amortization
|
(5,419
|
)
|
(846
|
)
|
|||
|
Fixed returns allocated to redeemable noncontrolling interests
(1)
|
217
|
|
—
|
|
|||
|
$
|
7,659
|
|
$
|
1,146
|
|
||
|
Straight-line rent and below-market lease revenue
|
$
|
(1,022
|
)
|
$
|
453
|
|
|
|
Funds from operations
|
$
|
13,078
|
|
$
|
1,992
|
|
|
|
(1)
|
Represents an allocation of joint venture earnings to redeemable noncontrolling interests primarily in one property in our South San Francisco submarket. These redeemable noncontrolling interests earn a fixed return on their investment rather than participate in the operating results of the property.
|
|
As of March 31, 2019
|
|||||||
|
Noncontrolling Interest Share of Consolidated
Real Estate Joint Ventures
|
Our Share of Unconsolidated
Real Estate Joint Ventures |
||||||
|
Investments in real estate
|
$
|
719,546
|
|
$
|
390,774
|
|
|
|
Cash and cash equivalents
|
24,686
|
|
5,128
|
|
|||
|
Restricted cash
|
—
|
|
99
|
|
|||
|
Other assets
|
69,616
|
|
28,727
|
|
|||
|
Secured notes payable
|
—
|
|
(102,421
|
)
|
|||
|
Other liabilities
|
(25,511
|
)
|
(31,902
|
)
|
|||
|
Redeemable noncontrolling interests
|
(10,889
|
)
|
—
|
|
|||
|
$
|
777,448
|
|
$
|
290,405
|
|
||
During the
three months ended March 31, 2019
and
2018
, our consolidated real estate joint ventures distributed an aggregate of
$9.7 million
and
$7.2 million
, respectively, to our joint venture partners. Refer to our consolidated statements of cash flows and Note 4 – “Consolidated and Unconsolidated Real Estate Joint Ventures” to our unaudited consolidated financial statements under Item 1 of this report for additional information.
86
Investments
We present our equity investments at fair value whenever fair value or NAV is readily available. Adjustments for our limited partnership investments represent changes in reported NAV as a practical expedient to estimate fair value. For investments without readily available fair values, we adjust the carrying amount whenever such investments have an observable price change and further adjustments are not made until another price change, if any, is observed. Refer to Note 7 – “Investments” to our unaudited consolidated financial statements under Item 1 of this report for additional information.
|
Three Months Ended March 31, 2019
|
Year Ended December 31, 2018
|
|||||||||
|
Realized gains
|
$
|
11,350
|
|
$
|
37,129
|
|
(1)
|
|||
|
Unrealized gains
|
72,206
|
|
99,634
|
|
||||||
|
Investment income
|
$
|
83,556
|
|
$
|
136,763
|
|
||||
|
Investments
|
Cost
|
Adjustments
|
Carrying Amount
|
||||||||||||
|
Fair value:
|
|||||||||||||||
|
Publicly traded companies
|
$
|
127,760
|
|
$
|
97,194
|
|
$
|
224,954
|
|
||||||
|
Entities that report NAV
|
223,986
|
|
145,616
|
|
369,602
|
|
|||||||||
|
Entities that do not report NAV:
|
|||||||||||||||
|
Entities with observable price changes
|
42,865
|
|
69,551
|
|
112,416
|
|
|||||||||
|
Entities without observable price changes
|
293,932
|
|
—
|
|
293,932
|
|
|||||||||
|
March 31, 2019
|
$
|
688,543
|
|
$
|
312,361
|
|
$
|
1,000,904
|
|
||||||
|
December 31, 2018
|
$
|
652,109
|
|
$
|
240,155
|
|
$
|
892,264
|
|
||||||
|
(1)
|
Includes realized gains of
$14.7 million
related to two publicly traded non-real estate investments and impairment of
$5.5 million
primarily related to one privately held non-real estate investment. Excluding these gains and impairment, our realized gains on non-real estate investments were
$27.9 million
for the
year ended December 31, 2018
.
|
|
Public/Private
Mix (Cost) |
Tenant/Non-Tenant
Mix (Cost) |
|

|

|
|
|
315
|
$1.0B
|
|
|
Holdings
|
Total Carrying Amount
|
|
|
$2.2M
|
$688.5M
|
|
|
Average Cost
|
Total Cost
|
|
87
Liquidity
|
Net Debt to Adjusted EBITDA
(1)
|
Net Debt and Preferred Stock to
Adjusted EBITDA
(1)
|
||||
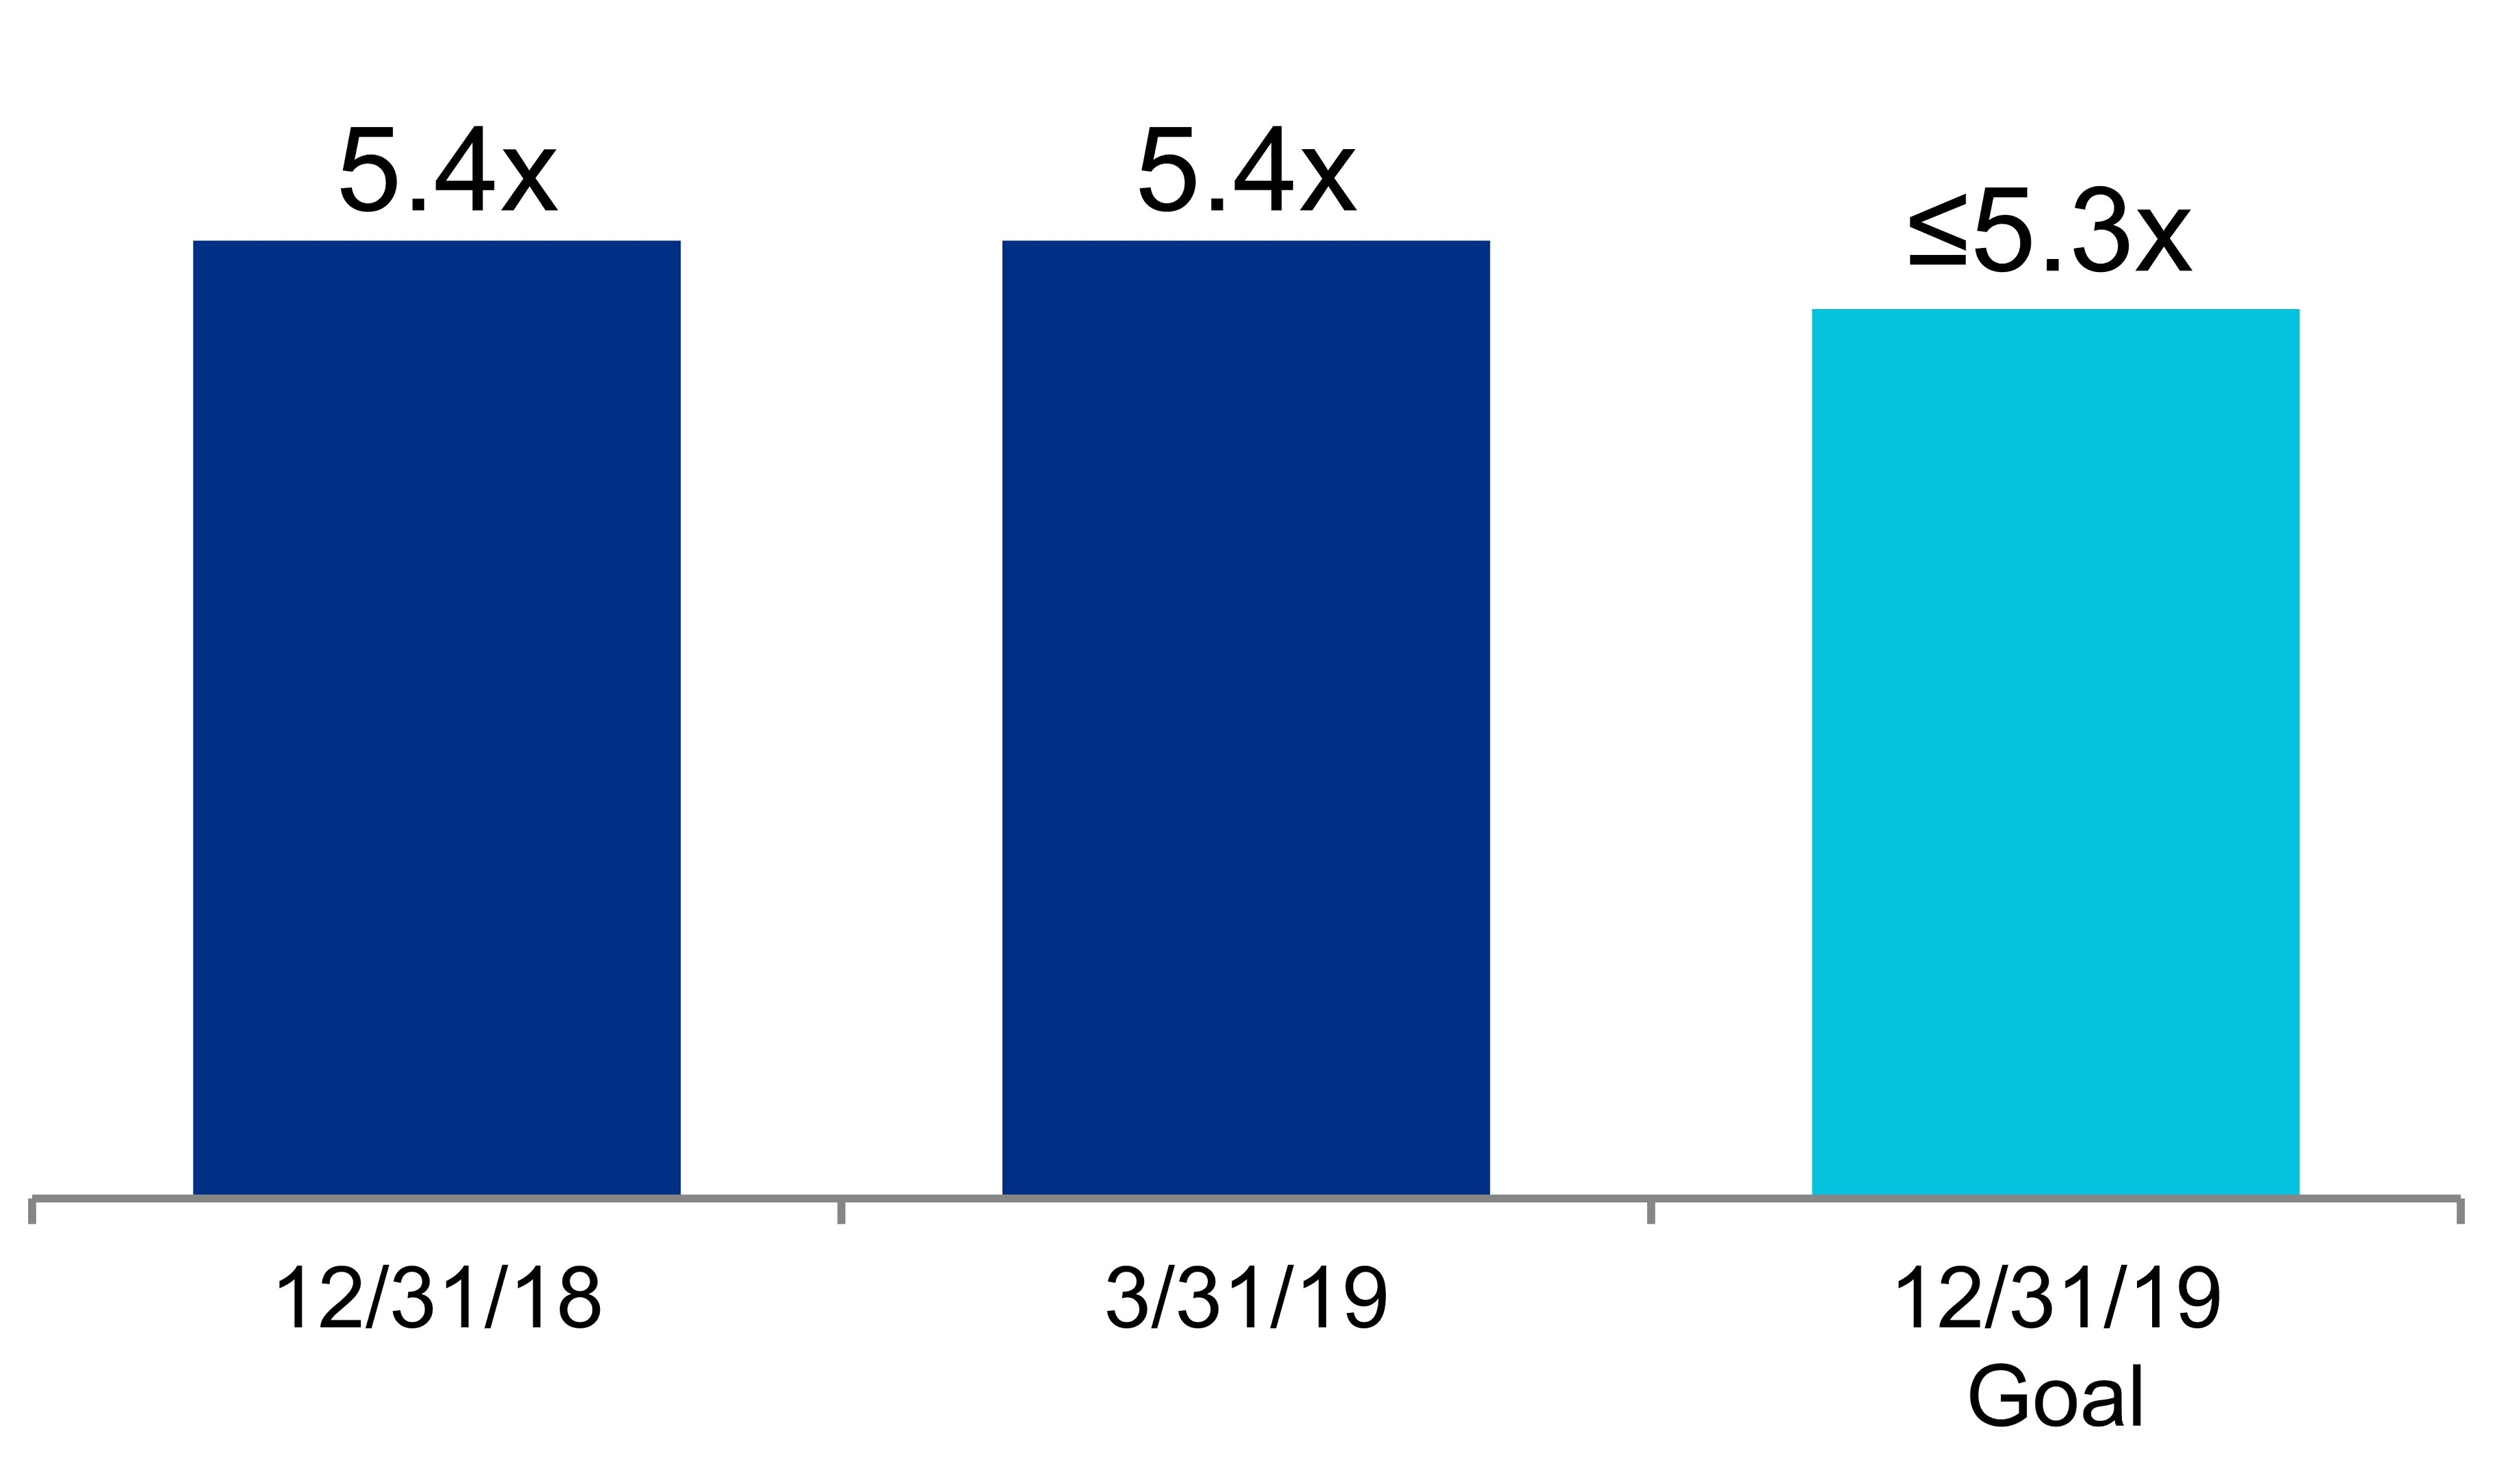
|
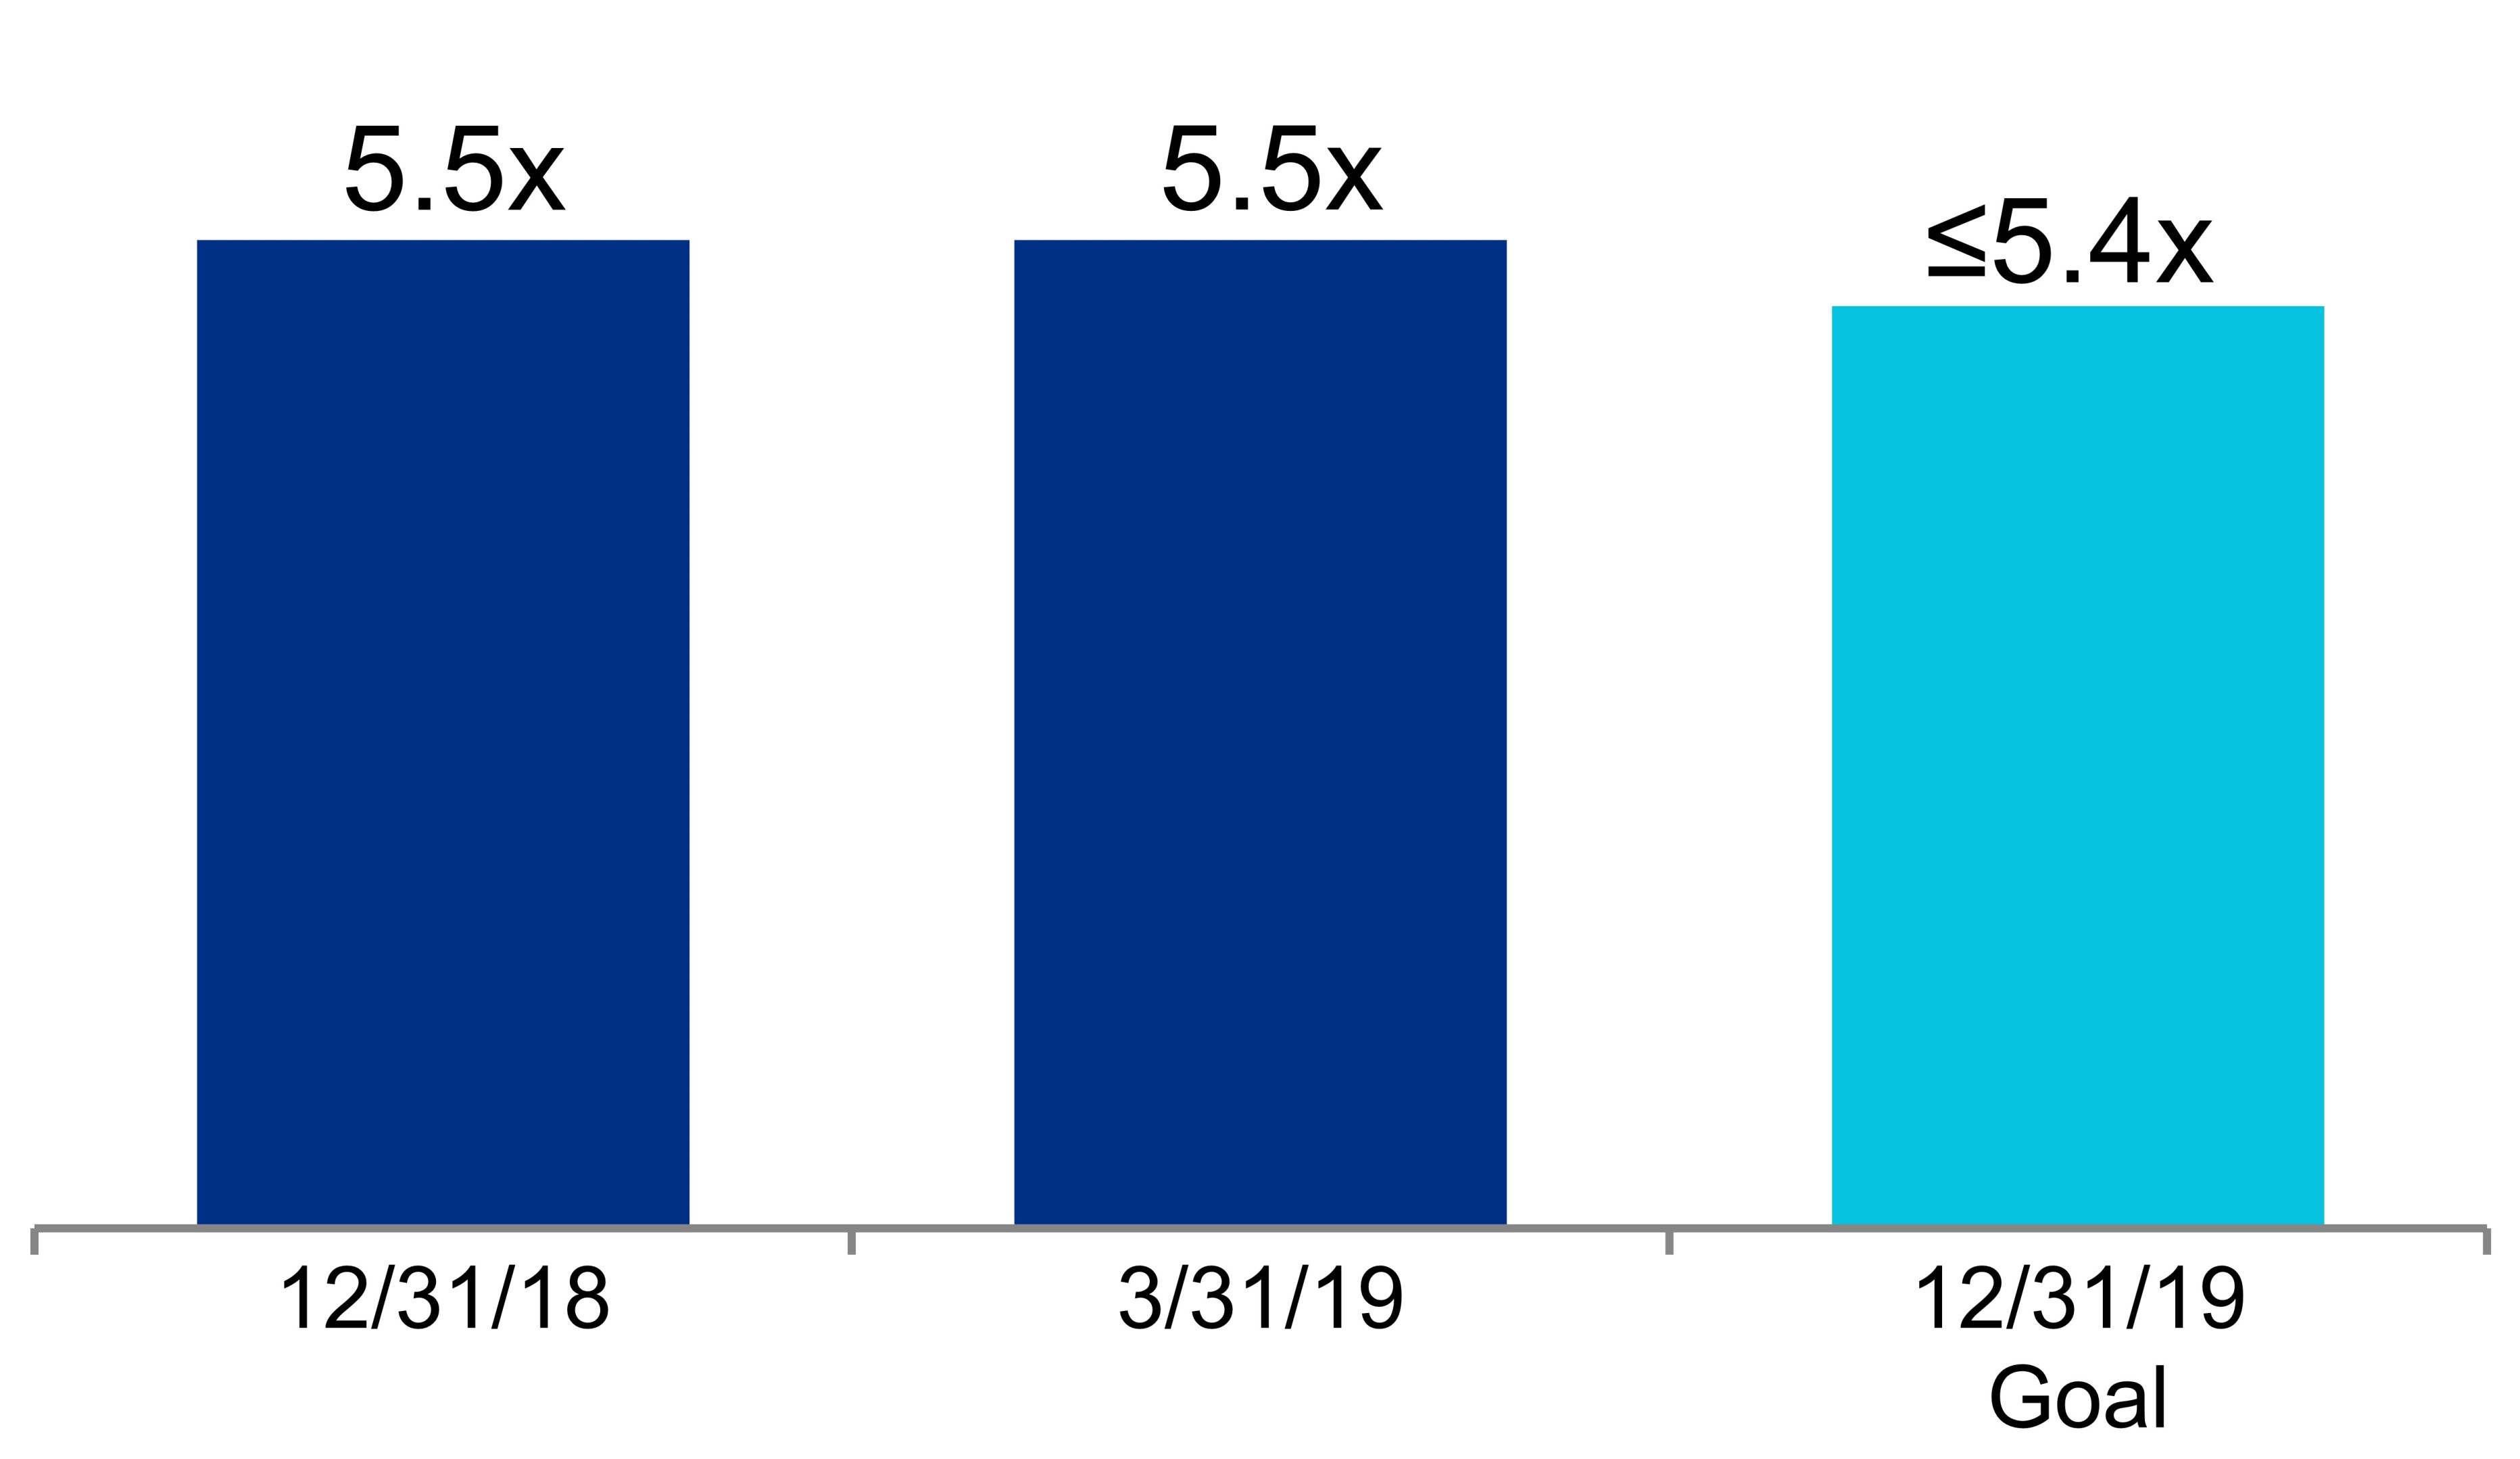
|
||||
|
Fixed-Charge Coverage Ratio
(1)
|
Liquidity
(2)
|
||||

|
$2.7B
|
||||
|
(In millions)
|
|||||
|
Availability under our $2.2 billion unsecured senior line of credit
|
$
|
2,200
|
|
||
|
Cash, cash equivalents, and restricted cash
|
316
|
|
|||
|
Investments in publicly traded companies
|
225
|
|
|||
|
$
|
2,741
|
|
|||
|
(1)
|
Quarter annualized.
|
|
(2)
|
As of
March 31, 2019
.
|
We expect to meet certain long-term liquidity requirements, such as requirements for development, redevelopment, other construction projects, capital improvements, tenant improvements, property acquisitions, leasing costs, non-revenue-enhancing capital expenditures, scheduled debt maturities, distributions to noncontrolling interests, repurchases/redemptions of preferred stock, and payment of dividends through net cash provided by operating activities, periodic asset sales, strategic real estate joint venture capital, and long-term secured and unsecured indebtedness, including borrowings under our $2.2 billion unsecured senior line of credit, unsecured senior bank term loan, and issuance of additional debt and/or equity securities.
We expect to continue meeting our short-term liquidity and capital requirements, as further detailed in this section, generally through our working capital and net cash provided by operating activities. We believe that the net cash provided by operating activities will continue to be sufficient to enable us to make the distributions necessary to continue qualifying as a REIT.
88
Over the next several years, our balance sheet, capital structure, and liquidity objectives are as follows:
|
•
|
Retain positive cash flows from operating activities after payment of dividends and distributions to noncontrolling interests for investment in development and redevelopment projects and/or acquisitions;
|
|
•
|
Improve credit profile and relative long-term cost of capital;
|
|
•
|
Maintain diverse sources of capital, including sources from net cash provided by operating activities, unsecured debt, secured debt, selective real estate asset sales, partial interest sales, non-real estate investment sales, preferred stock, and common stock;
|
|
•
|
Maintain commitment to long-term capital to fund growth;
|
|
•
|
Maintain prudent laddering of debt maturities;
|
|
•
|
Maintain solid credit metrics;
|
|
•
|
Maintain significant balance sheet liquidity;
|
|
•
|
Mitigate unhedged variable-rate debt exposure through the reduction of short-term and medium-term variable-rate bank debt;
|
|
•
|
Maintain a large unencumbered asset pool to provide financial flexibility;
|
|
•
|
Fund preferred stock and common stock dividends and distributions to noncontrolling interests from net cash provided by operating activities;
|
|
•
|
Manage a disciplined level of value-creation projects as a percentage of our gross investments in real estate; and
|
|
•
|
Maintain high levels of pre-leasing and percentage leased in value-creation projects.
|
The following table presents the availability under our $2.2 billion unsecured senior line of credit; cash, cash equivalents, and restricted cash; and investments in publicly traded companies as of
March 31, 2019
(dollars in thousands):
|
Description
|
Stated Rate
|
Aggregate
Commitments
|
Outstanding
Balance
|
Remaining Commitments/Liquidity
|
|||||||||||
|
$2.2 billion unsecured senior line of credit
|
L+0.825
|
%
|
$
|
2,200,000
|
|
$
|
—
|
|
$
|
2,200,000
|
|
||||
|
Cash, cash equivalents, and restricted cash
|
315,805
|
|
|||||||||||||
|
Investments in publicly traded companies
|
224,954
|
|
|||||||||||||
|
Total liquidity
|
$
|
2,740,759
|
|
||||||||||||
Cash, cash equivalents, and restricted cash
As of
March 31, 2019
, and
December 31, 2018
, we had
$315.8 million
and
$272.1 million
, respectively, of cash, cash equivalents, and restricted cash. We expect existing cash, cash equivalents, and restricted cash; cash flows from operating activities; proceeds from real estate asset sales; non-real estate investment sales; borrowings under our $2.2 billion unsecured senior line of credit; issuances of unsecured notes payable; and issuances of common stock to continue to be sufficient to fund our operating activities and cash commitments for investing and financing activities, such as regular quarterly dividends, distributions to noncontrolling interests, scheduled debt repayments, acquisitions, and certain capital expenditures, including expenditures related to construction activities.
Cash flows
We report and analyze our cash flows based on operating activities, investing activities, and financing activities. The following table summarizes changes in our cash flows (in thousands):
|
Three Months Ended March 31,
|
|||||||||||
|
2019
|
2018
|
Change
|
|||||||||
|
Net cash provided by operating activities
|
$
|
136,730
|
|
$
|
128,921
|
|
$
|
7,809
|
|
||
|
Net cash used in investing activities
|
$
|
(734,333
|
)
|
$
|
(598,038
|
)
|
$
|
(136,295
|
)
|
||
|
Net cash provided by financing activities
|
$
|
640,806
|
|
$
|
451,319
|
|
$
|
189,487
|
|
||
89
Operating activities
Cash flows provided by operating activities
are primarily dependent upon the occupancy level of our asset base, the rental rates of our leases, the collectibility of rent and recovery of operating expenses from our tenants, the timing of completion of development and redevelopment projects, and the timing of acquisitions and dispositions of operating properties.
Net cash provided by operating activities
for the
three months ended March 31, 2019
,
increased
to
$136.7 million
, compared to
$128.9 million
for the
three months ended March 31, 2018
. This
increase
was primarily attributable to (i) cash flows generated from our highly leased development and redevelopment projects recently placed into service, (ii) income-producing acquisitions since
January 1, 2018
, and (iii) increases in rental rates on lease renewals and re-leasing of space since
January 1, 2018
.
Investing activities
Cash used in investing activities
for the
three months ended March 31, 2019
and
2018
, consisted of the following (in thousands):
|
|
Three Months Ended March 31,
|
Increase (Decrease)
|
|||||||||
|
|
2019
|
2018
|
|||||||||
|
Sources of cash from investing activities:
|
|||||||||||
|
Sales of investments
|
$
|
26,200
|
|
$
|
27,842
|
|
$
|
(1,642
|
)
|
||
|
Uses of cash for investing activities:
|
|||||||||||
|
Purchases of real estate
|
418,358
|
|
303,156
|
|
115,202
|
|
|||||
|
Additions to real estate
|
241,049
|
|
206,404
|
|
34,645
|
|
|||||
|
Investments in unconsolidated real estate joint ventures
|
52,634
|
|
22,325
|
|
30,309
|
|
|||||
|
Additions to investments
|
48,992
|
|
50,287
|
|
(1,295
|
)
|
|||||
|
Acquisitions of interests in unconsolidated real estate joint ventures
|
—
|
|
35,922
|
|
(35,922
|
)
|
|||||
|
Deposits for investing activities
|
(500
|
)
|
7,786
|
|
(8,286
|
)
|
|||||
|
760,533
|
|
625,880
|
|
134,653
|
|
||||||
|
Net cash used in investing activities
|
$
|
734,333
|
|
$
|
598,038
|
|
$
|
136,295
|
|
||
The change in net cash used in investing activities for the
three months ended March 31, 2019
, is primarily due to an increased use of cash for property acquisitions, additions to real estate, and for investments in unconsolidated real estate joint ventures, partially offset by lower acquisitions of interests in unconsolidated real estate joint ventures. Refer to Note 3 – “Investments in Real Estate” to our unaudited consolidated financial statements under Item 1 of this report for further information.
90
Financing activities
Cash flows provided by financing activities
for the
three months ended March 31, 2019
and
2018
, consisted of the following (in thousands):
|
Three Months Ended March 31,
|
|||||||||||
|
2019
|
2018
|
Change
|
|||||||||
|
Borrowings from secured notes payable
|
$
|
—
|
|
$
|
6,142
|
|
$
|
(6,142
|
)
|
||
|
Repayments of borrowings from secured notes payable
|
(301,343
|
)
|
(1,189
|
)
|
(300,154
|
)
|
|||||
|
Proceeds from issuance of unsecured senior notes payable
|
854,209
|
|
—
|
|
854,209
|
|
|||||
|
Borrowings from unsecured senior line of credit
|
1,405,000
|
|
1,035,000
|
|
370,000
|
|
|||||
|
Repayments of borrowings from unsecured senior line of credit
|
(1,613,000
|
)
|
(595,000
|
)
|
(1,018,000
|
)
|
|||||
|
Payments of loan fees
|
(15,225
|
)
|
—
|
|
(15,225
|
)
|
|||||
|
Changes related to debt
|
329,641
|
|
444,953
|
|
(115,312
|
)
|
|||||
|
Repurchase of 7.00% Series D cumulative convertible preferred stock
|
(9,240
|
)
|
—
|
|
(9,240
|
)
|
|||||
|
Proceeds from issuance of common stock
|
—
|
|
99,369
|
|
(99,369
|
)
|
|||||
|
Dividend payments
|
(110,468
|
)
|
(92,362
|
)
|
(18,106
|
)
|
|||||
|
Contributions from and sales of noncontrolling interests
|
440,671
|
|
6,579
|
|
434,092
|
|
|||||
|
Distributions to and purchases of noncontrolling interests
|
(9,709
|
)
|
(7,220
|
)
|
(2,489
|
)
|
|||||
|
Other
|
(89
|
)
|
—
|
|
(89
|
)
|
|||||
|
Net cash provided by financing activities
|
$
|
640,806
|
|
$
|
451,319
|
|
$
|
189,487
|
|
||
91
Capital resources
We expect that our principal liquidity needs for the year ending
December 31, 2019
, will be satisfied by the following multiple sources of capital, as shown in the table below. There can be no assurance that our sources and uses of capital will not be materially higher or lower than these expectations.
|
Summary of Key Changes in Key Sources and Uses of Capital Guidance
(In millions)
|
Guidance Midpoint
|
|||||||
|
As of 4/29/19
|
As of 2/4/19
|
|||||||
|
Issuance of unsecured senior notes payable
|
$
|
850
|
|
$
|
650
|
|
||
|
Repayment of secured notes payable
|
$
|
(315
|
)
|
$
|
(125
|
)
|
||
|
Key Sources and Uses of Capital
(In millions)
|
2019 Guidance
|
Certain Completed Items
|
|||||||||||||||
|
Range
|
Midpoint
|
||||||||||||||||
|
Sources of capital:
|
|||||||||||||||||
|
Net cash provided by operating activities after dividends
|
$
|
170
|
|
$
|
210
|
|
$
|
190
|
|
||||||||
|
Incremental debt
|
485
|
|
445
|
|
465
|
|
|||||||||||
|
Real estate dispositions and partial interest sales:
|
|||||||||||||||||
|
Sale of partial interest in core Class A property
|
438
|
|
438
|
|
438
|
|
$
|
438
|
|
(1)
|
|||||||
|
Other
|
262
|
|
362
|
|
312
|
|
|||||||||||
|
Common equity
|
475
|
|
575
|
|
525
|
|
|||||||||||
|
Total sources of capital
|
$
|
1,830
|
|
$
|
2,030
|
|
$
|
1,930
|
|
||||||||
|
Uses of capital:
|
|||||||||||||||||
|
Construction
|
$
|
1,250
|
|
$
|
1,350
|
|
$
|
1,300
|
|
||||||||
|
Acquisitions
|
580
|
|
680
|
|
630
|
|
(2)
|
||||||||||
|
Total uses of capital
|
$
|
1,830
|
|
$
|
2,030
|
|
$
|
1,930
|
|
||||||||
|
Incremental debt (included above):
|
|||||||||||||||||
|
Issuance of unsecured senior notes payable
|
$
|
850
|
|
$
|
850
|
|
$
|
850
|
|
$
|
850
|
|
|||||
|
Assumption of secured note payable
|
28
|
|
28
|
|
28
|
|
$
|
28
|
|
||||||||
|
Repayments of secured notes payable
|
(310
|
)
|
(320
|
)
|
(315
|
)
|
$
|
(300
|
)
|
||||||||
|
$2.2 billion unsecured senior line of credit/other
|
(83
|
)
|
(113
|
)
|
(98
|
)
|
|||||||||||
|
Incremental debt
|
$
|
485
|
|
$
|
445
|
|
$
|
465
|
|
||||||||
|
(1)
|
Refer to the “Real Estate Asset Sales” subsection of the “Investments in Real Estate” section within this Item 2 for additional information.
|
|
(2)
|
Refer to the “Acquisitions” subsection of the “Investments in Real Estate” section within this Item 2 for additional information.
|
The key assumptions behind the sources and uses of capital in the table above include a favorable capital market environment, performance of our core operating properties, lease-up and delivery of current and future development and redevelopment projects, and leasing activity. Our expected sources and uses of capital are subject to a number of variables and uncertainties, including those discussed as “Forward-Looking Statements” under Part I; “Item 1A. Risk Factors”; and “Item 7. Management’s Discussion and Analysis of Financial Condition and Results of Operations” of our annual report on Form 10‑K for the year ended
December 31, 2018
. We expect to update our forecast of sources and uses of capital on a quarterly basis.
92
Sources of capital
Net cash provided by operating activities after dividends
We expect to retain
$170.0 million
to
$210.0 million
of net cash flows from operating activities after payment of common stock and preferred stock dividends, and distributions to noncontrolling interests for the year ending
December 31, 2019
. For purposes of this calculation, changes in operating assets and liabilities are excluded as they represent timing differences. For the year ending
December 31, 2019
, we expect our recently delivered projects, our highly pre-leased value-creation projects expected to be completed, along with contributions from Same Properties and recently acquired properties, to contribute significant increases in income from rentals, net operating income, and cash flows. We anticipate significant contractual near-term growth in annual cash rents of
$65 million
related to the commencement of contractual rents on the projects recently placed into service that are near the end of their initial free rent period. Refer to the “Cash Flows” subsection of the “Liquidity” section within this Item 2 of this report for a discussion of net cash provided by operating activities for the
three months ended March 31, 2019
.
Debt
In February 2019, S&P Global Ratings raised our corporate issuer credit rating to BBB+/Stable from BBB/Positive. The rating upgrade reflects our consistently strong operating performance and continued successful delivery of our value-creation pipeline.
The table below reflects the total commitments, outstanding balances, applicable margins, maturity dates, and facility fees for each of the following facilities
as of March 31, 2019
:
|
Commitment
|
Balance
(1)
|
Applicable Rate
|
Maturity Date
|
Facility Fee
|
||||||
|
Unsecured senior line of credit
|
$2.2 billion
|
$—
|
L+0.825%
|
January 2024
(2)
|
0.15%
|
|||||
|
Unsecured senior bank term loan
|
$350 million
|
$350 million
|
L+0.90%
|
January 2024
|
N/A
|
|||||
|
(1)
|
Excludes amortization of loan fees and amortization of premiums (discounts)
as of March 31, 2019
.
|
|
(2)
|
Includes two six-month extension options that we control.
|
As of March 31, 2019
, we have
no
outstanding balance on our $2.2 billion unsecured senior line of credit and
$347.5 million
outstanding balance on our unsecured senior bank term loan. Borrowings under the $2.2 billion unsecured senior line of credit and our unsecured senior bank term loan bear interest at LIBOR or the base rate specified in the agreement plus, in either case, a specified margin (the “Applicable Margin”) based on our existing credit ratings as set by certain rating agencies.
We use our $2.2 billion unsecured senior line of credit to fund working capital, construction activities, and, from time to time, acquisition of properties. Borrowings under the $2.2 billion unsecured senior line of credit will bear interest at a “Eurocurrency Rate,” a “LIBOR Floating Rate,” or a “Base Rate” specified in the $2.2 billion unsecured senior line of credit agreement plus, in any case, the Applicable Margin. The Eurocurrency Rate specified in the $2.2 billion unsecured senior line of credit agreement is, as applicable, the rate per annum equal to either (i) the LIBOR or a successor rate thereto as agreed to by the administrative agent and the Company for loans denominated in a LIBOR quoted currency (i.e., U.S. dollars, euro, sterling, or yen), (ii) the average annual yield rates applicable to Canadian dollar bankers’ acceptances for loans denominated in Canadian dollars, (iii) the Bank Bill Swap Reference Bid rate for loans denominated in Australian dollars, or (iv) the rate designated with respect to the applicable alternative currency for loans denominated in a non-LIBOR quoted currency (other than Canadian or Australian dollars). The LIBOR Floating Rate means, for any day, one month LIBOR, or a successor rate thereto as agreed to by the administrative agent and the Company for loans denominated in U.S. dollars. The Base Rate means, for any day, a fluctuating rate per annum equal to the highest of (i) the federal funds rate plus 1/2 of 1.00%, (ii) the rate of interest in effect for such day as publicly announced from time to time by Bank of America as its “prime rate,” and (iii) the Eurocurrency Rate plus 1.00%. Our $2.2 billion unsecured senior line of credit contains a feature that allows lenders to competitively bid on the interest rate for borrowings under the facility. This may result in an interest rate that is below the stated rate. In addition to the cost of borrowing, the $2.2 billion unsecured senior line of credit is subject to an annual facility fee of
0.15%
based on the aggregate commitments outstanding.
We expect to fund a portion of our capital needs in
2019
from the issuance of unsecured senior notes payable, and from borrowings under our $2.2 billion unsecured senior line of credit.
In March 2019, we completed an offering of
$850.0 million
of unsecured senior notes for net proceeds of
$846.1 million
. The unsecured senior notes consisted of
$300.0 million
of
4.85%
unsecured senior notes;
$350.0 million
of
3.80%
unsecured senior notes, which will be allocated to fund recently completed and future eligible green projects and the repayment of a secured note payable related to 50/60 Binney Street, a recently completed Class A property, which was awarded LEED
®
Gold certification; and
$200.0 million
added to our outstanding
4.00%
unsecured senior notes payable due on
January 15, 2024
, issued at a yield to maturity of
3.453%
, which are part of the same series that was originally issued in 2018. The net proceeds also be used to fund recently completed and future eligible green projects.
93
During the
three months ended March 31, 2019
, we repaid early one secured note payable aggregating
$106.7 million
, which was originally due in 2020 and bore interest at
7.75%
, and recognized a loss on early extinguishment of debt of
$7.1 million
, including the write-off of unamortized loan fees. Additionally, we repaid early the remaining
$193.1 million
balance of our secured construction loan related to 50/60 Binney Street and recognized a loss on early extinguishment of debt of
$269 thousand
.
Real estate dispositions and common equity
We expect to continue the disciplined execution of select sales of operating assets. Future sales will provide an important source of capital to fund a portion of our highly leased value-creation development and redevelopment projects. We may also consider additional sales of partial interests in core Class A properties and/or development projects. For
2019
, we expect real estate dispositions and issuances of common equity ranging from
$1.2 billion
to
$1.4 billion
, which includes the sale of a
60%
interest in 75/125 Binney Street, a Class A property located in our Cambridge submarket for a sales price of
$438.0 million
. We completed this partial interest sale during the three months ended March 31, 2019. The amount of asset sales necessary to meet our forecasted sources of capital will vary depending upon the amount of EBITDA associated with the assets sold. In addition, the amount of common equity issued will be subject to market conditions.
For additional information, refer to the “Sale of Real Estate Asset” section in Note 3 – “Investments in Real Estate” to our unaudited consolidated financial statements under Item 1 of this report.
ATM common stock offering program
In August 2018, we established an ATM common stock offering program that allows us to sell up to an aggregate of
$750.0 million
of our common stock.
As of March 31, 2019
, the remaining amount available under this ATM program is
$641.0 million
.
Other sources
Under our current shelf registration statement filed with the SEC, we may offer common stock, preferred stock, debt, and other securities. These securities may be issued, from time to time, at our discretion based on our needs and market conditions, including, as necessary, to balance our use of incremental debt capital.
Additionally, we hold interests, together with joint venture partners, in joint ventures that we consolidate in our financial statements. These joint venture partners may contribute equity into these entities primarily related to their share of funds for construction and financing-related activities. During the
three months ended March 31, 2019
, we received
$440.7 million
of contributions from and sales of noncontrolling interests.
94
Uses of capital
Summary of capital expenditures
Our primary use of capital relates to the development, redevelopment, pre-construction, and construction of properties. We currently have projects in our growth pipeline aggregating
4.4 million
RSF of new Class A office/laboratory and tech office space undergoing construction and pre-construction, and intermediate-term and future value-creation projects supporting an aggregate of
6.1 million
SF of ground-up development in North America. We incur capitalized construction costs related to development, redevelopment, pre-construction, and other construction activities. We also incur additional capitalized project costs, including interest, property taxes, insurance, and other costs directly related and essential to the development, redevelopment, pre-construction, or construction of a project, during periods when activities necessary to prepare an asset for its intended use are in progress. Refer to the “New Class A Development and Redevelopment Properties: 2019 Deliveries” and “Summary of Capital Expenditures” subsection of the “Investments in Real Estate” section within this Item 2 for more information on our capital expenditures.
We capitalize interest cost as a cost of the project only during the period for which activities necessary to prepare an asset for its intended use are ongoing, provided that expenditures for the asset have been made and interest cost has been incurred. Capitalized interest for the
three months ended March 31, 2019
and
2018
, of
$18.5 million
and
$13.4 million
, respectively, is classified in investments in real estate. Indirect project costs, including construction administration, legal fees, and office costs that clearly relate to projects under development or construction, are capitalized as incurred during the period an asset is undergoing activities to prepare it for its intended use. We capitalized payroll and other indirect project costs related to development, redevelopment, pre-construction, and construction projects, which aggregated
$9.8 million
and
$5.6 million
for the
three months ended March 31, 2019
and
2018
, respectively.
The increase in capitalized payroll and other indirect project costs for the
three months ended March 31, 2019
, compared to the same period in
2018
was primarily due to an increase in our value-creation pipeline projects undergoing construction and pre-construction activities aggregating
17
projects with
3.6 million
RSF in 2019 over 2018. Pre-construction activities include entitlements, permitting, design, site work, and other activities preceding commencement of construction of aboveground building improvements. The advancement of pre-construction efforts is focused on reducing the time required to deliver projects to prospective tenants. These critical activities add significant value for future ground-up development and are required for the vertical construction of buildings. Should we cease activities necessary to prepare an asset for its intended use, the interest, taxes, insurance, and certain other direct project costs related to this asset would be expensed as incurred. Expenditures for repairs and maintenance are expensed as incurred.
Fluctuations in our development, redevelopment, and construction activities could result in significant changes to total expenses and net income. For example, had we experienced a 10% reduction in development, redevelopment, and construction activities without a corresponding decrease in indirect project costs, including interest and payroll, total expenses would have increased by approximately
$2.8 million
for the
three months ended March 31, 2019
.
We use third-party brokers to assist in our leasing activity, whom are paid on a contingent basis upon successful leasing. We are required to capitalize initial direct costs related to successful leasing transactions, which result directly from and are essential to the lease transaction, and would not have been incurred had that lease transaction not been successfully executed. During the
three months ended March 31, 2019
, we capitalized total initial direct leasing costs of
$14.6 million
. Effective January 1, 2019, costs that we incur to negotiate or arrange a lease regardless of its outcome, such as fixed employee compensation, tax, or legal advice to negotiate lease terms, and other costs are expensed as incurred.
Acquisitions
Refer to the “Acquisitions” section of Note 3 – “Investments in Real Estate” and Note 4 – “ Consolidated and Unconsolidated Real Estate Joint Ventures” to our unaudited consolidated financial statements under Item 1, and the “Acquisitions” subsection of the “Investments in Real Estate” section under Item 2 of this report for information on our acquisitions.
95
7.00% Series D cumulative convertible preferred stock repurchases
As of March 31, 2019
, we had
2.3 million
shares of our Series D Convertible Preferred Stock outstanding. During the
three months ended March 31, 2019
, we repurchased, in privately negotiated transactions,
275,000
shares of our Series D Convertible Preferred Stock at an aggregate price of
$9.2 million
, or
$33.60
per share, and recognized a preferred stock redemption charge of
$2.6 million
.
We may seek to repurchase additional shares of our Series D Convertible Preferred Stock in the future, subject to market conditions. To the extent that we repurchase shares of our Series D Convertible Preferred Stock, we expect to fund such amounts with the proceeds from issuances, if any, of our common stock, subject to market conditions.
Dividends
During the
three months ended March 31, 2019
and
2018
, we paid the following dividends (in thousands):
|
Three Months Ended March 31,
|
|||||||||||
|
2019
|
2018
|
Change
|
|||||||||
|
Common stock
|
$
|
109,342
|
|
$
|
91,060
|
|
$
|
18,282
|
|
||
|
Series D Cumulative Convertible Preferred Stock
|
1,126
|
|
1,302
|
|
(176
|
)
|
|||||
|
|
$
|
110,468
|
|
$
|
92,362
|
|
$
|
18,106
|
|
||
The increase in dividends paid on our common stock during the
three months ended March 31, 2019
, compared to the
three months ended March 31, 2018
, was primarily due to an increase in number of common shares outstanding subsequent to
January 1, 2018
, as a result of issuances of common stock under our ATM program and settlement of forward equity sales agreements, and partially due to the increase in the related dividends to
$0.97
per common share paid during the
three months ended March 31, 2019
, from
$0.90
per common share paid during the
three months ended March 31, 2018
.
Dividends paid on our Series D Convertible Preferred Stock during the
three months ended March 31, 2019
, decreased slightly from the dividends paid during the
three months ended March 31, 2018
, due to a decrease in number of shares outstanding as a result of the repurchase of
402,000
outstanding shares of our Series D Convertible Preferred Stock during 2018.
Contractual obligations and commitments
Contractual obligations as of
March 31, 2019
, consisted of the following (in thousands):
|
Payments by Period
|
|||||||||||||||||||
|
Total
|
2019
|
2020-2021
|
2022-2023
|
Thereafter
|
|||||||||||||||
|
Secured and unsecured debt
(1)(2)
|
$
|
5,867,297
|
|
$
|
4,715
|
|
$
|
413,461
|
|
$
|
1,161,775
|
|
$
|
4,287,346
|
|
||||
|
Estimated interest payments on fixed-rate and hedged variable-rate debt
(3)
|
1,829,712
|
|
157,234
|
|
452,748
|
|
394,718
|
|
825,012
|
|
|||||||||
|
Ground lease obligations
|
648,170
|
|
10,544
|
|
27,330
|
|
27,222
|
|
583,074
|
|
|||||||||
|
Other obligations
|
8,839
|
|
1,315
|
|
1,135
|
|
1,676
|
|
4,713
|
|
|||||||||
|
Total
|
$
|
8,354,018
|
|
$
|
173,808
|
|
$
|
894,674
|
|
$
|
1,585,391
|
|
$
|
5,700,145
|
|
||||
|
(1)
|
Amounts represent principal amounts due and exclude unamortized premiums (discounts) and deferred financing costs reflected on the consolidated balance sheets under Item 1 of this report.
|
|
(2)
|
Payment dates reflect any extension options that we control.
|
|
(3)
|
Amounts are based upon contractual interest rates, including expenses related to our interest rate hedge agreements, interest payment dates, and scheduled maturity dates.
|
Secured notes payable
Secured notes payable as of
March 31, 2019
, consisted of
six
notes secured by
11
properties. Our secured notes payable typically require monthly payments of principal and interest and had a weighted-average interest rate of approximately
3.58%
. As of
March 31, 2019
, the total book value of our investments in real estate securing debt was approximately
$1.1 billion
. As of
March 31, 2019
, our entire secured notes payable balance of
$356.5 million
, including unamortized discounts and deferred financing costs, was fixed-rate debt.
96
Unsecured senior notes payable, $2.2 billion unsecured senior line of credit, and unsecured senior bank term loan
The requirements of, and our actual performance with respect to, the key financial covenants under our unsecured senior notes payable as of
March 31, 2019
, were as follows:
|
Covenant Ratios
(1)
|
Requirement
|
March 31, 2019
|
||
|
Total Debt to Total Assets
|
Less than or equal to 60%
|
34%
|
||
|
Secured Debt to Total Assets
|
Less than or equal to 40%
|
2%
|
||
|
Consolidated EBITDA
(2)
to Interest Expense
|
Greater than or equal to 1.5x
|
5.9x
|
||
|
Unencumbered Total Asset Value to Unsecured Debt
|
Greater than or equal to 150%
|
272%
|
||
|
(1)
|
All covenant ratio titles utilize terms as defined in the respective debt agreements.
|
|
(2)
|
The calculation of consolidated EBITDA is based on the definitions contained in our loan agreements and is not directly comparable to the computation of EBITDA as described in Exchange Act Release No. 47226.
|
In addition, the terms of the indentures, among other things, limit the ability of the Company, Alexandria Real Estate Equities, L.P., and the Company’s subsidiaries to (i) consummate a merger, or consolidate or sell all or substantially all of the Company’s assets, and (ii) incur certain secured or unsecured indebtedness.
The requirements of, and our actual performance with respect to, the key financial covenants under our $2.2 billion unsecured senior line of credit and unsecured senior bank term loan as of
March 31, 2019
, were as follows:
|
Covenant Ratios
(1)
|
Requirement
|
March 31, 2019
|
|||
|
Leverage Ratio
|
Less than or equal to 60.0%
|
28.4%
|
|||
|
Secured Debt Ratio
|
Less than or equal to 45.0%
|
1.7%
|
|||
|
Fixed-Charge Coverage Ratio
|
Greater than or equal to 1.50x
|
3.97x
|
|||
|
Unsecured Interest Coverage Ratio
|
Greater than or equal to 1.75x
|
6.43x
|
|||
|
(1)
|
All covenant ratio titles utilize terms as defined in the respective debt agreements.
|
Estimated interest payments
Estimated interest payments on our fixed-rate and hedged variable-rate debt were calculated based upon contractual interest rates, including estimated interest expense related to interest rate hedge agreements, interest payment dates, and scheduled maturity dates. As of
March 31, 2019
,
100%
of our debt was fixed-rate debt or variable-rate debt subject to interest rate hedge agreements. Refer to our interest rate hedge agreements in the “Contractual Obligations and Commitments” and the “Interest Rate Hedge Agreements” subsections of the “Capital Resources” section within this Item 2 for additional information. As of
March 31, 2019
, we had
no
unhedged variable-rate debt outstanding. For additional information regarding our debt, refer to Note 10 – “Secured and Unsecured Senior Debt” to our unaudited consolidated financial statements under Item 1 of this report.
Interest rate hedge agreements
We utilize interest rate derivatives to hedge a portion of our exposure to volatility in variable interest rates primarily associated with our $2.2 billion unsecured senior line of credit and unsecured senior bank term loan. Our derivative instruments consisted of interest rate hedge agreements.
Our interest rate hedge agreements involve the receipt of variable-rate amounts from a counterparty in exchange for our payment of fixed-rate amounts to the counterparty over the life of the agreement without the exchange of the underlying notional amount. Interest received under all of our interest rate hedge agreements is based on one-month LIBOR. The net difference between the interest paid and the interest received is reflected as an adjustment to interest expense in our consolidated statements of income.
We have entered into master derivative agreements with our counterparties. These master derivative agreements (all of which are adapted from the standard International Swaps and Derivatives Association, Inc. form) define certain terms between us and each of our respective counterparties to address and minimize certain risks associated with our interest rate hedge agreements. In order to limit our risk of non-performance by an individual counterparty under our interest rate hedge agreements, these agreements are spread among various counterparties. The largest aggregate notional amount in effect at any single point in time with an individual counterparty in our interest rate hedge agreements existing as of
March 31, 2019
, was
$100.0 million
. If one or more of our counterparties fail to perform under our interest rate hedge agreements, we may incur higher costs associated with our variable-rate LIBOR-based debt than the interest costs we originally anticipated. We have not posted any collateral related to our interest rate hedge agreements.
97
Ground lease obligations
Ground lease obligations as of
March 31, 2019
, included leases for
30
of our properties, which accounted for approximately
12%
of our total number of properties. Excluding one ground lease that expires in
2036
related to one operating property with a net book value of
$8.2 million
as of
March 31, 2019
, our ground lease obligations have remaining lease terms ranging from approximately
35
to
96
years, including available extension options which we are reasonably certain to exercise.
As of
March 31, 2019
, the remaining contractual payments under our ground and office lease agreements for which we are the lessee aggregated
$648.2 million
and
$8.8 million
, respectively. Under the new lease accounting standard effective on January 1, 2019, described in detail under the “Lease Accounting” section of Note 2 – “Summary of Significant Accounting Policies” to our unaudited consolidated financial statements under Item 1 of this report, we are required to recognize a right-of-use asset and a related liability to account for our future obligations under our ground and office lease arrangements for which we are the lessee. The lease liability is measured based on the present value of the remaining lease payments. The right-of-use asset is equal to the corresponding lease liability, adjusted for the initial direct leasing cost and any other consideration exchanged with the landlord prior to the commencement of the lease. As of
March 31, 2019
, the present value of the remaining contractual payments, aggregating
$657.0 million
, under our operating lease agreements, including our extension options that we are reasonably certain to exercise, was
$244.6 million
, which is classified in accounts payable, accrued expenses, and tenant security deposits in our consolidated balance sheet. As of
March 31, 2019
, the weighted-average remaining lease term of our operating leases for which we are a lessee was approximately
45 years
, and the weighted-average discount rate was
5.37%
.
Commitments
As of
March 31, 2019
, remaining aggregate costs under contract for the construction of properties undergoing development, redevelopment, and improvements under the terms of leases approximated
$1.1 billion
. We expect payments for these obligations to occur over
one
to
three
years, subject to capital planning adjustments from time to time. We may have the ability to cease the construction of certain properties, which would result in the reduction of our commitments. We have existing office space at 161 First Street/50 Rogers Street in our Alexandria Center
®
at Kendall Square (“ACKS”) campus that we are required to partially convert to multifamily residential space, pursuant to our entitlements for our ACKS campus. Pursuant to these requirements, we expect to begin construction of the conversion to multifamily residential in 2019. In addition, we have letters of credit and performance obligations aggregating
$9.2 million
primarily related to construction projects.
In November 2017, we entered into an agreement with a real estate developer in the San Francisco Bay Area to own a
49%
interest in a real estate joint venture at Menlo Gateway in our Greater Stanford submarket of San Francisco. Our total equity contribution commitment is
$269.0 million
, of which we have contributed
$228.8 million
through
March 31, 2019
.
We are committed to funding approximately
$233.8 million
for non-real estate investments, which primarily consists of
$233.3 million
related to investments in limited partnerships. Our funding commitments expire at various dates over the next
11 years
, with a weighted-average remaining period of
8.7 years
.
Exposure to environmental liabilities
In connection with the acquisition of all of our properties, we have obtained Phase I environmental assessments to ascertain the existence of any environmental liabilities or other issues. The Phase I environmental assessments of our properties have not revealed any environmental liabilities that we believe would have a material adverse effect on our financial condition or results of operations taken as a whole, nor are we aware of any material environmental liabilities that have occurred since the Phase I environmental assessments were completed. In addition, we carry a policy of pollution legal liability insurance covering exposure to certain environmental losses at substantially all of our properties.
98
Accumulated other comprehensive income (loss)
Accumulated other comprehensive income (loss) attributable to Alexandria Real Estate Equities, Inc.’s common stockholders consists of the following (in thousands):
|
Net Unrealized Gain (Loss) on:
|
||||||||||||
|
|
Interest Rate
Hedge Agreements |
Foreign Currency Translation
|
Total
|
|||||||||
|
Balance as of December 31, 2018
|
$
|
1,838
|
|
$
|
(12,273
|
)
|
$
|
(10,435
|
)
|
|||
|
Other comprehensive (loss) income before reclassifications
|
(558
|
)
|
2,210
|
|
1,652
|
|
||||||
|
Amounts reclassified from other comprehensive income to net income
|
(1,929
|
)
|
—
|
|
(1,929
|
)
|
||||||
|
Net other comprehensive (loss) income
|
(2,487
|
)
|
2,210
|
|
(277
|
)
|
||||||
|
Balance as of March 31, 2019
|
$
|
(649
|
)
|
$
|
(10,063
|
)
|
$
|
(10,712
|
)
|
|||
Interest rate hedge agreements
Changes in our accumulated other comprehensive income (loss) balance include the change in fair value of our interest rate hedge agreements. We reclassify amounts from accumulated other comprehensive income (loss) as we recognize interest expense related to the hedged variable-rate debt instrument.
Foreign currency translation
Changes in our accumulated other comprehensive income (loss) balance include the changes in the foreign exchange rates for our real estate investments in Canada and Asia. Additionally, we reclassify unrealized foreign currency translation gains and losses into net income as we dispose of these holdings.
99
Critical accounting policies
Refer to our annual report on Form 10‑K for the year ended
December 31, 2018
, for a discussion of our critical accounting policies related to investments in real estate, impairment of long-lived assets, equity investments, interest rate hedge agreements, recognition of rental revenues and tenant recoveries, and monitoring of tenant credit quality. Except for the changes that resulted from the adoption on January 1, 2019 of the new lease guidance discussed in detail in the “Lease Accounting” section of Note 2 – “Summary of Significant Accounting Policies” and Note 5 – “Leases” to these unaudited consolidated financial statements under Item 1 of this report, there were no significant changes to these policies during the
three months ended March 31, 2019
.
Non-GAAP measures and definitions
This section contains additional information of certain non-GAAP financial measures and the reasons why we use these supplemental measures of performance and believe they provide useful information to investors, as well as the definitions of other terms used in this report.
Funds from operations and funds from operations, as adjusted, attributable to Alexandria Real Estate Equities, Inc.’s common stockholders
GAAP-basis accounting for real estate assets utilizes historical cost accounting and assumes that real estate values diminish over time. In an effort to overcome the difference between real estate values and historical cost accounting for real estate assets, the Nareit Board of Governors established funds from operations as an improved measurement tool. Since its introduction, funds from operations has become a widely used non-GAAP financial measure among equity REITs. We believe that funds from operations is helpful to investors as an additional measure of the performance of an equity REIT. Moreover, we believe that funds from operations, as adjusted, allows investors to compare our performance to the performance of other real estate companies on a consistent basis, without having to account for differences recognized because of real estate investment and disposition decisions, financing decisions, capital structure, capital market transactions, and variances resulting from the volatility of market conditions outside of our control. On January 1, 2019, we adopted standards established by the Nareit Board of Governors in its November 2018 White Paper (the “Nareit White Paper”) on a prospective basis. The Nareit White Paper defines funds from operations as net income (computed in accordance with GAAP), excluding gains or losses on sales of real estate, and impairments of real estate, plus real estate-related depreciation and amortization, and after adjustments for our share of consolidated and unconsolidated partnerships and real estate joint ventures. Impairments represent the write-down of assets when fair value over the recoverability period is less than the carrying value due to changes in general market conditions and do not necessarily reflect the operating performance of the properties during the corresponding period.
We compute funds from operations, as adjusted, as funds from operations calculated in accordance with the Nareit White Paper, excluding significant gains, losses, and impairments realized on non-real estate investments, unrealized gains or losses on non-real estate investments, gains or losses on early extinguishment of debt, preferred stock redemption charges, deal costs, and the amount of such items that is allocable to our unvested restricted stock awards. Neither funds from operations nor funds from operations, as adjusted, should be considered as alternatives to net income (determined in accordance with GAAP) as indications of financial performance, or to cash flows from operating activities (determined in accordance with GAAP) as measures of liquidity, nor are they indicative of the availability of funds for our cash needs, including our ability to make distributions.
The following table reconciles net income to funds from operations for the share of consolidated real estate joint ventures attributable to noncontrolling interests and our share of unconsolidated real estate joint ventures:
|
Three Months Ended March 31, 2019
|
|||||||
|
Noncontrolling Interest Share of Consolidated Real Estate Joint Ventures
|
Our Share of Unconsolidated
Real Estate Joint Ventures |
||||||
|
Net income
|
$
|
7,659
|
|
$
|
1,146
|
|
|
|
Depreciation and amortization
|
5,419
|
|
846
|
|
|||
|
Funds from operations
|
$
|
13,078
|
|
$
|
1,992
|
|
|
100
The following tables present a reconciliation of net income attributable to Alexandria Real Estate Equities, Inc.’s common stockholders, the most directly comparable financial measure presented in accordance with GAAP, including our share of amounts from consolidated and unconsolidated real estate joint ventures, to funds from operations attributable to Alexandria Real Estate Equities, Inc.’s common stockholders – diluted, and funds from operations attributable to Alexandria Real Estate Equities, Inc.’s common stockholders – diluted, as adjusted, and the related per share amounts. Per share amounts may not add due to rounding.
|
Three Months Ended March 31,
|
||||||||
|
(In thousands)
|
2019
|
2018
|
||||||
|
Net income attributable to Alexandria Real Estate Equities, Inc.’s common stockholders – basic and diluted
|
$
|
123,598
|
|
$
|
132,387
|
|
||
|
Depreciation and amortization
|
134,087
|
|
114,219
|
|
||||
|
Noncontrolling share of depreciation and amortization from consolidated real estate JVs
|
(5,419
|
)
|
(3,867
|
)
|
||||
|
Our share of depreciation and amortization from unconsolidated real estate JVs
|
846
|
|
644
|
|
||||
|
Assumed conversion of 7.00% Series D cumulative convertible preferred stock
(1)
|
1,026
|
|
1,302
|
|
||||
|
Allocation to unvested restricted stock awards
|
(2,054
|
)
|
(1,548
|
)
|
||||
|
Funds from operations attributable to Alexandria Real Estate Equities, Inc.’s common stockholders – diluted
(2)
|
252,084
|
|
243,137
|
|
||||
|
Unrealized gains on non-real estate investments
|
(72,206
|
)
|
(72,229
|
)
|
||||
|
Realized gain on non-real estate investment
|
—
|
|
(8,252
|
)
|
||||
|
Loss on early extinguishment of debt
|
7,361
|
|
—
|
|
||||
|
Preferred stock redemption charge
|
2,580
|
|
—
|
|
||||
|
Removal of assumed conversion of 7.00% Series D cumulative convertible preferred stock
(1)
|
(1,026
|
)
|
(1,302
|
)
|
||||
|
Allocation to unvested restricted stock awards
|
990
|
|
1,125
|
|
||||
|
Funds from operations attributable to Alexandria Real Estate Equities, Inc.’s common stockholders – diluted, as adjusted
|
$
|
189,783
|
|
$
|
162,479
|
|
||
|
(1)
|
The assumed conversion requires the add back of preferred dividends paid on our 7.00% Series D cumulative convertible preferred stock, as shown here. However, there is no corresponding per share impact for the
three months ended March 31, 2019
, visible on the next page, as the corresponding change in the denominator to reflect the assumed issuance of common shares results in a per share dilution of less than one half cent. Refer to “Weighted-Average Shares of Common Stock Outstanding – Diluted” within this section of this Item 2 for additional information.
|
|
(2)
|
Calculated in accordance with standards established by the Nareit Board of Governors.
|
101
|
Three Months Ended March 31,
|
||||||||
|
(Per share)
|
2019
|
2018
|
||||||
|
Net income per share attributable to Alexandria Real Estate Equities, Inc.’s common stockholders – diluted
|
$
|
1.11
|
|
$
|
1.32
|
|
||
|
Depreciation and amortization
|
1.17
|
|
1.08
|
|
||||
|
Assumed conversion of 7.00% Series D cumulative convertible preferred stock
(1)
|
—
|
|
0.01
|
|
||||
|
Allocation to unvested restricted stock awards
|
(0.02
|
)
|
—
|
|
||||
|
Funds from operations per share attributable to Alexandria Real Estate Equities, Inc.’s common stockholders – diluted
(2)
|
2.26
|
|
2.41
|
|
||||
|
Unrealized gains on non-real estate investments
|
(0.65
|
)
|
(0.70
|
)
|
||||
|
Realized gain on non-real estate investment
|
—
|
|
(0.08
|
)
|
||||
|
Loss on early extinguishment of debt
|
0.07
|
|
—
|
|
||||
|
Preferred stock redemption charge
|
0.02
|
|
—
|
|
||||
|
Removal of assumed conversion of 7.00% Series D cumulative convertible preferred stock
(1)
|
—
|
|
(0.01
|
)
|
||||
|
Allocation to unvested restricted stock awards
|
0.01
|
|
—
|
|
||||
|
Funds from operations per share attributable to Alexandria Real Estate Equities, Inc.’s common stockholders – diluted, as adjusted
|
$
|
1.71
|
|
$
|
1.62
|
|
||
|
Weighted-average shares of common stock outstanding
(1)
for calculations
of:
|
||||||||
|
EPS – diluted
|
111,054
|
|
100,125
|
|
||||
|
Funds from operations – diluted, per share
|
111,635
|
|
100,866
|
|
||||
|
Funds from operations – diluted, as adjusted, per share
|
111,054
|
|
100,125
|
|
||||
|
(1)
|
Refer to “Weighted-Average Shares of Common Stock Outstanding – Diluted” within this section of this Item 2 for additional information.
|
|
(2)
|
Calculated in accordance with standards established by the Nareit Board of Governors.
|
Adjusted EBITDA and Adjusted EBITDA margin
We use Adjusted EBITDA as a supplemental performance measure of our operations, for financial and operational decision-making, and as a supplemental means of evaluating period-to-period comparisons on a consistent basis. Adjusted EBITDA is calculated as earnings before interest, taxes, depreciation, and amortization (“EBITDA”), excluding stock compensation expense, gains or losses on early extinguishment of debt, gains or losses on sales of real estate, and impairments of real estate. Adjusted EBITDA also excludes unrealized gains or losses, and significant realized gains and impairments, which result from our non-real estate investments. These non-real estate investment amounts are classified in our statements of income outside of revenues.
We believe Adjusted EBITDA provides investors with relevant and useful information as it allows investors to evaluate the operating performance of our business activities without having to account for differences recognized because of real estate and non-real estate investment and disposition decisions, financing decisions, capital structure, capital market transactions, and variances resulting from the volatility of market conditions outside of our control. For example, we exclude gains or losses on the early extinguishment of debt to allow investors to measure our performance independent of our indebtedness and capital structure. We believe that adjusting for the effects of impairments and gains or losses on sales of real estate, and significant impairments and significant gains on the sale of non-real estate investments allows investors to evaluate performance from period to period on a consistent basis without having to account for differences recognized because of real estate and non-real estate investment and disposition decisions. We believe that excluding charges related to stock compensation and unrealized gains or losses facilitates for investors a comparison of our business activities across periods without the volatility resulting from market forces outside of our control. Adjusted EBITDA has limitations as a measure of our performance. Adjusted EBITDA does not reflect our historical expenditures or future requirements for capital expenditures or contractual commitments. While Adjusted EBITDA is a relevant measure of performance, it does not represent net income or cash flows from operations calculated and presented in accordance with GAAP, and it should not be considered as an alternative to those indicators in evaluating performance or liquidity.
Our calculation of Adjusted EBITDA margin divides Adjusted EBITDA by our revenues, as adjusted. We believe that revenues, as adjusted, provides a denominator for Adjusted EBITDA margin that is calculated on a basis more consistent with that of the Adjusted EBITDA numerator. Specifically, revenues, as adjusted, includes the same realized gains on, and impairments of, non-real estate investments that are included in the reconciliation of Adjusted EBITDA. We believe that the consistent application of results from our non-real estate investments to both the numerator and denominator of Adjusted EBITDA margin provides a more useful calculation for the comparison across periods.
102
The following table reconciles net income and revenues, the most directly comparable financial measures calculated and presented in accordance with GAAP, to Adjusted EBITDA and revenues, as adjusted, respectively (dollars in thousands):
|
Three Months Ended March 31,
|
|||||||
|
2019
|
2018
|
||||||
|
Net income
|
$
|
136,818
|
|
$
|
141,518
|
|
|
|
Interest expense
|
39,100
|
|
36,915
|
|
|||
|
Income taxes
|
1,297
|
|
940
|
|
|||
|
Depreciation and amortization
|
134,087
|
|
114,219
|
|
|||
|
Stock compensation expense
|
11,029
|
|
7,248
|
|
|||
|
Loss on early extinguishment of debt
|
7,361
|
|
—
|
|
|||
|
Unrealized gains on non-real estate investments
|
(72,206
|
)
|
(72,229
|
)
|
|||
|
Adjusted EBITDA
|
$
|
257,486
|
|
$
|
228,611
|
|
|
|
Revenues
|
$
|
358,842
|
|
$
|
320,139
|
|
|
|
Non-real estate investments – total realized gains
|
11,350
|
|
13,332
|
|
|||
|
Revenues, as adjusted
|
$
|
370,192
|
|
$
|
333,471
|
|
|
|
Adjusted EBITDA margin
|
70%
|
|
69%
|
|
|||
Annual rental revenue
Annual rental revenue represents the annualized fixed base rental amount, in effect as of the end of the period, related to our operating RSF. Annual rental revenue is presented using 100% of the annual rental revenue of our consolidated properties and our share of annual rental revenue for our unconsolidated real estate joint ventures. Annual rental revenue per RSF is computed by dividing annual rental revenue by the sum of 100% of the RSF of our consolidated properties and our share of the RSF of properties held in unconsolidated real estate joint ventures. As of
March 31, 2019
, approximately
97%
of our leases (on an RSF basis) were triple net leases, which require tenants to pay substantially all real estate taxes, insurance, utilities, repairs and maintenance, common area expenses, and other operating expenses (including increases thereto) in addition to base rent. Annual rental revenue excludes these operating expenses recovered from our tenants. Amounts recovered from our tenants related to these operating expenses, along with base rent, are classified in income from rentals in our consolidated statements of income.
Cash interest
Cash interest is equal to interest expense calculated in accordance with GAAP plus capitalized interest, less amortization of loan fees and debt premiums (discounts). Refer to the definition of “Fixed-Charge Coverage Ratio” below in this section of this Item 2 for a reconciliation of interest expense, the most directly comparable financial measure calculated and presented in accordance with GAAP, to cash interest.
Class A properties and AAA locations
Class A properties are properties clustered in AAA locations that provide innovative tenants with highly dynamic and collaborative environments that enhance their ability to successfully recruit and retain world-class talent and inspire productivity, efficiency, creativity, and success. Class A properties generally command higher annual rental rates than other classes of similar properties.
AAA locations are in close proximity to concentrations of specialized skills, knowledge, institutions, and related businesses. Such locations are generally characterized by high barriers to entry for new landlords, high barriers to exit for tenants, and a limited supply of available space.
103
Development, redevelopment, and pre-construction
A key component of our business model is our disciplined allocation of capital to the development and redevelopment of new Class A properties and property enhancements identified during the underwriting of certain acquired properties, located in collaborative life science and technology campuses in AAA urban innovation clusters. These projects are generally focused on providing high-quality, generic, and reusable spaces that meet the real estate requirements of, and are reusable by, a wide range of tenants. Upon completion, each value-creation project is expected to generate a significant increase in rental income, net operating income, and cash flows. Our development and redevelopment projects are generally in locations that are highly desirable to high-quality entities, which we believe results in higher occupancy levels, longer lease terms, higher rental income, higher returns, and greater long-term asset value.
Development projects generally consist of the ground-up development of generic and reusable facilities. Redevelopment projects consist of the permanent change in use of office, warehouse, and shell space into office/laboratory or tech office space. We generally will not commence new development projects for aboveground construction of new Class A office/laboratory and tech office space without first securing significant pre-leasing for such space, except when there is solid market demand for high-quality Class A properties.
Pre-construction activities include entitlements, permitting, design, site work, and other activities preceding commencement of construction of aboveground building improvements. The advancement of pre-construction efforts is focused on reducing the time required to deliver projects to prospective tenants. These critical activities add significant value for future ground-up development and are required for the vertical construction of buildings. Ultimately, these projects will provide high-quality facilities and are expected to generate significant revenue and cash flows.
Fixed-charge coverage ratio
Fixed-charge coverage ratio is a non-GAAP financial measure representing the ratio of Adjusted EBITDA to fixed charges. We believe this ratio is useful to investors as a supplemental measure of our ability to satisfy fixed financing obligations and preferred stock dividends. Cash interest is equal to interest expense calculated in accordance with GAAP plus capitalized interest, less amortization of loan fees and debt premiums (discounts).
The following table reconciles interest expense, the most directly comparable financial measure calculated and presented in accordance with GAAP, to cash interest and fixed charges (dollars in thousands):
|
Three Months Ended March 31,
|
||||||||
|
2019
|
2018
|
|||||||
|
Adjusted EBITDA
|
$
|
257,486
|
|
$
|
228,611
|
|
||
|
Interest expense
|
$
|
39,100
|
|
$
|
36,915
|
|
||
|
Capitalized interest
|
18,509
|
|
13,360
|
|
||||
|
Amortization of loan fees
|
(2,233
|
)
|
(2,543
|
)
|
||||
|
Amortization of debt premiums
|
801
|
|
575
|
|
||||
|
Cash interest
|
56,177
|
|
48,307
|
|
||||
|
Dividends on preferred stock
|
1,026
|
|
1,302
|
|
||||
|
Fixed charges
|
$
|
57,203
|
|
$
|
49,609
|
|
||
|
Fixed-charge coverage ratio:
|
||||||||
|
– quarter annualized
|
4.5x
|
|
4.6x
|
|
||||
|
– trailing 12 months
|
4.2x
|
|
4.3x
|
|
||||
104
Initial stabilized yield (unlevered)
Initial stabilized yield is calculated as the quotient of the estimated amounts of net operating income at stabilization and our investment in the property. Our initial stabilized yield excludes the benefit of leverage. Our cash rents related to our value-creation projects are generally expected to increase over time due to contractual annual rent escalations. Our estimates for initial stabilized yields, initial stabilized yields (cash basis), and total costs at completion represent our initial estimates at the commencement of the project. We expect to update this information upon completion of the project, or sooner if there are significant changes to the expected project yields or costs.
|
•
|
Initial stabilized yield reflects rental income, including contractual rent escalations and any rent concessions over the term(s) of the lease(s), calculated on a straight-line basis.
|
|
•
|
Initial stabilized yield (cash basis) reflects cash rents at the stabilization date after initial rental concessions, if any, have elapsed and our total cash investment in the property.
|
Investment-grade or publicly traded large cap tenants
Investment-grade or publicly traded large cap tenants represent tenants that are investment-grade rated or publicly traded companies with an average daily market capitalization greater than $10 billion for the 12 months ended
March 31, 2019
, as reported by Bloomberg Professional Services. In addition, we monitor the credit quality and related material changes of our tenants. Material changes that cause a tenant’s market capitalization to decline below $10 billion, which are not immediately reflected in the 12-month average, may result in their exclusion from this measure.
Joint venture financial information
We present components of balance sheet and operating results information related to our joint ventures, which are not presented in accordance with, or intended to be presented in accordance with, GAAP. We present the proportionate share of certain financial line items as follows: (i) for each real estate joint venture that we consolidate in our financial statements, but of which we own less than 100%, we apply the noncontrolling interest economic ownership percentage to each financial item to arrive at the amount of such cumulative noncontrolling interest share of each component presented; and (ii) for each real estate joint venture that we do not control, and do not consolidate, we apply our economic ownership percentage to each financial item to arrive at our proportionate share of each component presented.
The components of balance sheet and operating results information related to joint ventures do not represent our legal claim to those items. For each entity that we do not wholly own, the joint venture agreement generally determines what equity holders can receive upon capital events, such as sales or refinancing, or in the event of a liquidation. Equity holders are normally entitled to their respective legal ownership of any residual cash from a joint venture only after all liabilities, priority distributions, and claims have been repaid or satisfied.
We believe this information can help investors estimate the balance sheet and operating results information related to our partially owned entities. Presenting this information provides a perspective not immediately available from consolidated financial statements and one that can supplement an understanding of the joint venture assets, liabilities, revenues, and expenses included in our consolidated results.
The components of balance sheet and operating results information related to joint ventures are limited as an analytical tool as the overall economic ownership interest does not represent our legal claim to each of our joint ventures’ assets, liabilities, or results of operations. In addition, joint venture financial information may include financial information related to the unconsolidated real estate joint ventures that we do not control. Refer to Note 4 – “Consolidated and Unconsolidated Real Estate Joint Ventures” to our unaudited consolidated financial statements under Item 1 of this report for more information on our unconsolidated real estate joint ventures. We believe that in order to facilitate for investors a clear understanding of our operating results and our total assets and liabilities, joint venture financial information should be examined in conjunction with our consolidated statements of income and balance sheets. Joint venture financial information should not be considered an alternative to our consolidated financial statements, which are prepared in accordance with GAAP.
Net cash provided by operating activities after dividends
Net cash provided by operating activities after dividends includes the deduction for distributions to noncontrolling interests. For purposes of this calculation, changes in operating assets and liabilities are excluded as they represent timing differences.
105
Net debt to Adjusted EBITDA and net debt and preferred stock to Adjusted EBITDA
Net debt to Adjusted EBITDA and net debt and preferred stock to Adjusted EBITDA are non-GAAP financial measures that we believe are useful to investors as supplemental measures in evaluating our balance sheet leverage. Net debt is equal to the sum of total consolidated debt less cash, cash equivalents, and restricted cash. Net debt and preferred stock is equal to the sum of net debt, as discussed above, plus preferred stock outstanding as of the end of the period. Refer to “Adjusted EBITDA and Adjusted EBITDA Margin” within this section of this Item 2 for further information on the calculation of Adjusted EBITDA.
The following table reconciles debt to net debt, and to net debt and preferred stock, and computes the ratio of each to Adjusted EBITDA as of
March 31, 2019
, and
December 31, 2018
(dollars in thousands):
|
March 31, 2019
|
December 31, 2018
|
||||||
|
Secured notes payable
|
$
|
356,461
|
|
$
|
630,547
|
|
|
|
Unsecured senior notes payable
|
5,139,500
|
|
4,292,293
|
|
|||
|
Unsecured senior line of credit
|
—
|
|
208,000
|
|
|||
|
Unsecured senior bank term loan
|
347,542
|
|
347,415
|
|
|||
|
Unamortized deferred financing costs
|
37,925
|
|
31,413
|
|
|||
|
Cash and cash equivalents
|
(261,372
|
)
|
(234,181
|
)
|
|||
|
Restricted cash
|
(54,433
|
)
|
(37,949
|
)
|
|||
|
Net debt
|
$
|
5,565,623
|
|
$
|
5,237,538
|
|
|
|
Net debt
|
$
|
5,565,623
|
|
$
|
5,237,538
|
|
|
|
7.00% Series D cumulative convertible preferred stock
|
57,461
|
|
64,336
|
|
|||
|
Net debt and preferred stock
|
$
|
5,623,084
|
|
$
|
5,301,874
|
|
|
|
Adjusted EBITDA:
|
|||||||
|
– quarter annualized
|
$
|
1,029,944
|
|
$
|
968,888
|
|
|
|
– trailing 12 months
|
$
|
966,781
|
|
$
|
937,906
|
|
|
|
Net debt to Adjusted EBITDA:
|
|||||||
|
– quarter annualized
|
5.4
|
x
|
5.4
|
x
|
|||
|
– trailing 12 months
|
5.8
|
x
|
5.6
|
x
|
|||
|
Net debt and preferred stock to Adjusted EBITDA:
|
|||||||
|
– quarter annualized
|
5.5
|
x
|
5.5
|
x
|
|||
|
– trailing 12 months
|
5.8
|
x
|
5.7
|
x
|
|||
106
Net operating income, net operating income (cash basis), and operating margin
The following table reconciles net income to net operating income and net operating income (cash basis):
|
Three Months Ended March 31,
|
||||||||
|
(In thousands)
|
2019
|
2018
|
||||||
|
Net income
|
$
|
136,818
|
|
$
|
141,518
|
|
||
|
Equity in earnings of unconsolidated real estate joint ventures
|
(1,146
|
)
|
(1,144
|
)
|
||||
|
General and administrative expenses
|
24,677
|
|
22,421
|
|
||||
|
Interest expense
|
39,100
|
|
36,915
|
|
||||
|
Depreciation and amortization
|
134,087
|
|
114,219
|
|
||||
|
Loss on early extinguishment of debt
|
7,361
|
|
—
|
|
||||
|
Investment income
|
(83,556
|
)
|
(85,561
|
)
|
||||
|
Net operating income
|
257,341
|
|
228,368
|
|
||||
|
Straight-line rent revenue
|
(26,965
|
)
|
(32,631
|
)
|
||||
|
Amortization of acquired below-market leases
|
(7,148
|
)
|
(6,170
|
)
|
||||
|
Net operating income (cash basis)
|
$
|
223,228
|
|
$
|
189,567
|
|
||
|
Net operating income (cash basis) – annualized
|
$
|
892,912
|
|
$
|
758,268
|
|
||
|
Net operating income (from above)
|
$
|
257,341
|
|
$
|
228,368
|
|
||
|
Total revenues
|
$
|
358,842
|
|
$
|
320,139
|
|
||
|
Operating margin
|
72%
|
71%
|
||||||
Net operating income is a non-GAAP financial measure calculated as net income, the most directly comparable financial measure calculated and presented in accordance with GAAP, excluding equity in the earnings of our unconsolidated real estate joint ventures, general and administrative expenses, interest expense, depreciation and amortization, impairment of real estate, gains or losses on early extinguishment of debt, gains or losses on sales of real estate, and investment income or loss. We believe net operating income provides useful information to investors regarding our financial condition and results of operations because it primarily reflects those income and expense items that are incurred at the property level. Therefore, we believe net operating income is a useful measure for investors to evaluate the operating performance of our consolidated real estate assets. Net operating income on a cash basis is net operating income adjusted to exclude the effect of straight-line rent and amortization of acquired above- and below-market lease revenue adjustments required by GAAP. We believe that net operating income on a cash basis is helpful to investors as an additional measure of operating performance because it eliminates straight-line rent revenue and the amortization of acquired above- and below-market leases.
Furthermore, we believe net operating income is useful to investors as a performance measure for our consolidated properties because, when compared across periods, net operating income reflects trends in occupancy rates, rental rates, and operating costs, which provide a perspective not immediately apparent from net income or loss. Net operating income can be used to measure the initial stabilized yields of our properties by calculating the quotient of net operating income generated by a property and our investment in the property. Net operating income excludes certain components from net income in order to provide results that are more closely related to the results of operations of our properties. For example, interest expense is not necessarily linked to the operating performance of a real estate asset and is often incurred at the corporate level rather than at the property level. In addition, depreciation and amortization, because of historical cost accounting and useful life estimates, may distort comparability of operating performance at the property level. Impairments of real estate have been excluded in deriving net operating income because we do not consider impairments of real estate to be property-level operating expenses. Impairments of real estate relate to changes in the values of our assets and do not reflect the current operating performance with respect to related revenues or expenses. Our impairments of real estate represent the write-down in the value of the assets to the estimated fair value less cost to sell. These impairments result from investing decisions or a deterioration in market conditions. We also exclude realized and unrealized investment income or loss calculated under a new ASU effective January 1, 2018, which results from investment decisions that occur at the corporate level related to non-real estate investments in publicly traded companies and certain privately held entities. Therefore, we do not consider these activities to be an indication of operating performance of our real estate assets at the property level. Our calculation of net operating income also excludes charges incurred from changes in certain financing decisions, such as losses on early extinguishment of debt, as these charges often relate to corporate strategy. Property operating expenses included in determining net operating income primarily consist of costs that are related to our operating properties, such as utilities, repairs, and maintenance; rental expense related to ground leases; contracted services, such as janitorial, engineering, and landscaping; property taxes and insurance; and property-level salaries. General and administrative
107
expenses consist primarily of accounting and corporate compensation, corporate insurance, professional fees, office rent, and office supplies that are incurred as part of corporate office management. We calculate operating margin as net operating income divided by total revenues.
We believe that in order to facilitate for investors a clear understanding of our operating results, net operating income should be examined in conjunction with net income or loss as presented in our consolidated statements of income. Net operating income should not be considered as an alternative to net income or loss as an indication of our performance, nor as an alternative to cash flows as a measure of our liquidity or our ability to make distributions.
Operating statistics
We present certain operating statistics related to our properties, including number of properties, RSF, occupancy percentage, leasing activity, and contractual lease expirations as of the end of the period. We believe these measures are useful to investors because they facilitate an understanding of certain trends for our properties. We compute the number of properties, RSF, occupancy percentage, leasing activity, and contractual lease expirations at 100% for all properties in which we have an investment, including properties owned by our consolidated and unconsolidated real estate joint ventures. For operating metrics based on annual rental revenue, refer to the definition of “Annual Rental Revenue” herein.
Same property comparisons
As a result of changes within our total property portfolio during the comparative periods presented, including changes from assets acquired or sold, properties placed into development or redevelopment, and development or redevelopment properties recently placed into service, the consolidated total income from rentals, and rental operating expenses in our operating results can show significant changes from period to period. In order to supplement an evaluation of our results of operations over a given quarterly or annual period, we analyze the operating performance for all consolidated properties that were fully operating for the entirety of the comparative periods presented, referred to as same properties. We separately present quarterly and year-to-date same property results to align with the interim financial information required by the SEC in our management’s discussion and analysis of our financial condition and results of operations. These same properties are analyzed separately from properties acquired subsequent to the first day in the earliest comparable quarterly or year-to-date period presented, properties that underwent development or redevelopment at any time during the comparative periods, unconsolidated real estate joint ventures, properties classified as held for sale, and corporate entities (legal entities performing general and administrative functions), which are excluded from same property results. Additionally, lease termination fees, if any, are excluded from the results of same properties.
Stabilized occupancy date
The stabilized occupancy date represents the estimated date on which the project is expected to reach occupancy of 95% or greater.
Total equity market capitalization
Total equity market capitalization is equal to the sum of outstanding shares of Series D Convertible Preferred Stock and common stock multiplied by the related closing price of each class of security at the end of each period presented.
Total market capitalization
Total market capitalization is equal to the sum of total equity market capitalization and total debt.
Unencumbered net operating income as a percentage of total net operating income
Unencumbered net operating income as a percentage of total net operating income is a non-GAAP financial measure that we believe is useful to investors as a performance measure of the results of operations of our unencumbered real estate assets as it reflects those income and expense items that are incurred at the unencumbered property level. Unencumbered net operating income is derived from assets classified in continuing operations, which are not subject to any mortgage, deed of trust, lien, or other security interest, as of the period for which income is presented.
108
The following table summarizes unencumbered net operating income as a percentage of total net operating income for the
three months ended March 31, 2019
and
2018
(dollars in thousands):
|
Three Months Ended March 31,
|
|||||||
|
2019
|
2018
|
||||||
|
Unencumbered net operating income
|
$
|
243,191
|
|
$
|
198,599
|
|
|
|
Encumbered net operating income
|
14,150
|
|
29,769
|
|
|||
|
Total net operating income
|
$
|
257,341
|
|
$
|
228,368
|
|
|
|
Unencumbered net operating income as a percentage of total net operating income
|
95%
|
|
87%
|
|
|||
Weighted-average shares of common stock outstanding – diluted
We enter into capital market transactions from time to time to fund acquisitions, fund construction of our highly leased development and redevelopment projects, and for general working capital purposes. In March 2017 and January 2018, we entered into forward equity sales agreements to sell shares of our common stock. We are required to consider the potential dilutive effect of our forward equity sales agreements under the treasury stock method while the forward equity sales agreements are outstanding. As of
March 31, 2019
, we had no forward equity sales agreements outstanding. We also consider the effect of assumed conversion of our outstanding Series D Convertible Preferred Stock when determining potentially dilutive incremental shares to our common stock. When calculating the assumed conversion, we add back to net income or loss the dividends paid on our Series D Convertible Preferred Stock to the numerator and then include additional common shares assumed to have been issued (as displayed in the table below) to the denominator of the per share calculation. The effect of the assumed conversion is considered separately for our per share calculations of net income or loss; funds from operations, computed in accordance with the definition in the Nareit White Paper; and funds from operations, as adjusted. Our Series D Convertible Preferred Stock is dilutive and assumed to be converted when quarterly and annual basic EPS, funds from operations, or funds from operations, as adjusted exceeds approximately
$1.75
and
$7.00
per share, respectively, subject to conversion ratio adjustments and the impact of repurchases of our Series D Preferred Stock. The effect of the assumed conversion is included when it is dilutive on a per share basis. The dilutive effect to both numerator and denominator may result in a per share effect of less than a half cent, which would appear as zero in our per share calculation, even when the dilutive effect to the numerator alone appears in our reconciliation. Refer to Note 13 – “Earnings per Share” and Note 14 – “Stockholders’ Equity” to our unaudited consolidated financial statements under Item 1 of this report for more information related to our forward equity sales agreements and our Series D Convertible Preferred Stock.
The weighted-average shares of common stock outstanding used in calculating EPS – diluted, funds from operations per share – diluted, and funds from operations per share – diluted, as adjusted, during each period is calculated as follows (in thousands):
|
Three Months Ended March 31,
|
|||||
|
2019
|
2018
|
||||
|
Weighted-average shares of common stock outstanding:
|
|||||
|
Basic shares for EPS
|
111,054
|
|
99,855
|
|
|
|
Outstanding forward equity sales agreements
|
—
|
|
270
|
|
|
|
Series D Convertible Preferred Stock
|
—
|
|
—
|
|
|
|
Diluted shares for EPS
|
111,054
|
|
100,125
|
|
|
|
Basic shares for EPS
|
111,054
|
|
99,855
|
|
|
|
Outstanding forward equity sales agreements
|
—
|
|
270
|
|
|
|
Series D Convertible Preferred Stock
|
581
|
|
741
|
|
|
|
Diluted shares for FFO
|
111,635
|
|
100,866
|
|
|
|
Basic shares for EPS
|
111,054
|
|
99,855
|
|
|
|
Outstanding forward equity sales agreements
|
—
|
|
270
|
|
|
|
Series D Convertible Preferred Stock
|
—
|
|
—
|
|
|
|
Diluted shares for FFO, as adjusted
|
111,054
|
|
100,125
|
|
|
109
ITEM 3. QUANTITATIVE AND QUALITATIVE DISCLOSURES ABOUT MARKET RISK
Interest rate risk
The primary market risk to which we believe we are exposed is interest rate risk, which may result from many factors, including government monetary and tax policies, domestic and international economic and political considerations, and other factors that are beyond our control.
In order to modify and manage the interest rate characteristics of our outstanding debt and to limit the effects of interest rate risks on our operations, we may utilize a variety of financial instruments, including interest rate hedge agreements, caps, floors, and other interest rate exchange contracts. The use of these types of instruments to hedge a portion of our exposure to changes in interest rates carries additional risks, such as counterparty credit risk and the legal enforceability of hedging contracts.
Our future earnings and fair values relating to financial instruments are primarily dependent upon prevalent market rates of interest, such as LIBOR. However, our interest rate hedge agreements are intended to reduce the effects of interest rate fluctuations. The following table illustrates the effect of a 1% change in interest rates on our variable-rate debt, including our $2.2 billion unsecured senior line of credit and unsecured senior bank term loan, after considering the effect of our interest rate hedge agreements, secured debt, and unsecured senior notes payable as of
March 31, 2019
(in thousands):
|
Annualized effect on future earnings due to variable-rate debt:
|
|||
|
Rate increase of 1%
|
$
|
—
|
|
|
Rate decrease of 1%
|
$
|
—
|
|
|
Effect on fair value of total consolidated debt and interest rate hedge agreements:
|
|||
|
Rate increase of 1%
|
$
|
(320,406
|
)
|
|
Rate decrease of 1%
|
$
|
352,368
|
|
These amounts are determined by considering the effect of the hypothetical interest rates on our borrowing cost and our interest rate hedge agreements in existence on
March 31, 2019
. These analyses do not consider the effects of the reduced level of overall economic activity that could exist in such an environment. Furthermore, in the event of a change of such magnitude, we would consider taking actions to further mitigate our exposure to the change. Because of the uncertainty of the specific actions that would be taken and their possible effects, the sensitivity analyses assume no changes in our capital structure.
Equity price risk
We have exposure to equity price market risk because of our equity investments in publicly traded companies and privately held entities. All of our investments in actively traded public companies are reflected in the consolidated balance sheets at fair value. Our investments in privately held entities that report NAV per share are measured at fair value using NAV as a practical expedient to fair value. Our equity investments in privately held entities that do not report NAV per share are measured at cost less impairments, adjusted for observable price changes during the period. Changes in fair value of public investments, changes in NAV per share reported by privately held entities, and observable price changes of privately held entities that do not report NAV per share are classified as investment income in our consolidated statements of income. There is no assurance that future declines in value will not have a material adverse effect on our future results of operations. The following table illustrates the effect that a 10% change in the value of our equity investments would have on earnings as of
March 31, 2019
(in thousands):
|
Equity price risk:
|
|||
|
Fair value increase of 10%
|
$
|
100,090
|
|
|
Fair value decrease of 10%
|
$
|
(100,090
|
)
|
110
Foreign currency exchange rate risk
We have exposure to foreign currency exchange rate risk related to our subsidiaries operating in Canada and Asia. The functional currencies of our foreign subsidiaries are the local currencies in each respective country. Gains or losses resulting from the translation of our foreign subsidiaries’ balance sheets and statements of income are classified in accumulated other comprehensive income (loss) as a separate component of total equity and are excluded from net income (loss). Gains or losses will be reflected in our consolidated statements of income when there is a sale or partial sale of our investment in these operations or upon a complete or substantially complete liquidation of the investment. The following table illustrates the effect that a 10% change in foreign currency rates relative to the U.S. dollar would have on our potential future earnings and on the fair value of our net investment in foreign subsidiaries based on our current operating assets outside the U.S. as of
March 31, 2019
(in thousands):
|
Effect on potential future earnings due to foreign currency exchange rate:
|
|||
|
Rate increase of 10%
|
$
|
107
|
|
|
Rate decrease of 10%
|
$
|
(107
|
)
|
|
Effect on the fair value of net investment in foreign subsidiaries due to foreign currency exchange rate:
|
|||
|
Rate increase of 10%
|
$
|
9,983
|
|
|
Rate decrease of 10%
|
$
|
(9,983
|
)
|
This sensitivity analysis assumes a parallel shift of all foreign currency exchange rates with respect to the U.S. dollar; however, foreign currency exchange rates do not typically move in such a manner, and actual results may differ materially.
Our exposure to market risk elements for the
three months ended March 31, 2019
, was consistent with the risk elements presented above, including the effects of changes in interest rates, equity prices, and foreign currency exchange rates.
ITEM 4. CONTROLS AND PROCEDURES
Evaluation of disclosure controls and procedures
As of
March 31, 2019
, we had performed an evaluation, under the supervision of our principal executive officers and principal financial officer, of the effectiveness of the design and operation of our disclosure controls and procedures. These controls and procedures have been designed to ensure that information required for disclosure is recorded, processed, summarized, and reported within the requisite time periods. Based on our evaluation, the principal executive officers and principal financial officer concluded that our disclosure controls and procedures were effective as of
March 31, 2019
.
Changes in internal control over financial reporting
There has not been any change in our internal control over financial reporting during the three months ended
March 31, 2019
, that has materially affected, or is reasonably likely to materially affect, our internal control over financial reporting.
111
PART II – OTHER INFORMATION
ITEM 1A. RISK FACTORS
In addition to the information set forth in this
quarterly report
on Form
10‑Q
, one should also carefully review and consider the information contained in our other reports and periodic filings that we make with the SEC, including, without limitation, the information contained under the caption “Item 1A. Risk Factors” in our annual report on Form 10‑K for the year ended
December 31, 2018
. Those risk factors could materially affect our business, financial condition, and results of operations. The risks that we describe in our public filings are not the only risks that we face. Additional risks and uncertainties not currently known to us, or that we presently deem to be immaterial, also may materially adversely affect our business, financial condition, and results of operations.
ITEM 6. EXHIBITS
|
Exhibit
Number
|
Exhibit Title
|
Incorporated by Reference to:
|
Date Filed
|
|||
|
3.1*
|
Form 10-Q
|
August 14, 1997
|
||||
|
3.2*
|
Form 10-Q
|
August 14, 1997
|
||||
|
3.3*
|
Form 8-K
|
May 12, 2017
|
||||
|
3.4*
|
Form 8-K
|
August 2, 2018
|
||||
|
3.5*
|
Form 10-Q
|
August 13, 1999
|
||||
|
3.6*
|
Form 8-K
|
February 10, 2000
|
||||
|
3.7*
|
Form 8-K
|
February 10, 2000
|
||||
|
3.8*
|
Form 8-A
|
January 18, 2002
|
||||
|
3.9*
|
Form 8-A
|
June 28, 2004
|
||||
|
3.10*
|
Form 8-K
|
March 25, 2008
|
||||
|
3.11*
|
Form 8-K
|
March 14, 2012
|
||||
|
3.12*
|
Form 8-K
|
May 12, 2017
|
||||
|
4.1*
|
Form 10-Q
|
May 5, 2011
|
||||
|
4.2*
|
Form 8-K
|
March 25, 2008
|
||||
|
4.3*
|
Form 8-K
|
March 3, 2017
|
||||
|
4.4*
|
Form 8-K
|
June 21, 2018
|
||||
|
4.5*
|
Form 8-K
|
June 21, 2018
|
||||
|
4.6*
|
Form 8-K
|
March 21, 2019
|
||||
|
4.7*
|
Form 8-K
|
March 21, 2019
|
||||
|
4.8*
|
Form 8-K
|
March 21, 2019
|
||||
|
4.9*
|
Form 8-K
|
March 21, 2019
|
||||
|
4.10*
|
Form 8-K
|
March 21, 2019
|
||||
|
10.1*
|
(1)
|
Form 8-K
|
January 18, 2019
|
|||
112
|
Exhibit
Number
|
Exhibit Title
|
Incorporated by Reference to:
|
Date Filed
|
|||
|
31.1
|
N/A
|
Filed herewith
|
||||
|
31.2
|
N/A
|
Filed herewith
|
||||
|
31.3
|
N/A
|
Filed herewith
|
||||
|
31.4
|
N/A
|
Filed herewith
|
||||
|
32.0
|
N/A
|
Filed herewith
|
||||
|
101
|
The following materials from the Company’s quarterly report on Form 10-Q for the quarterly period ended March 31, 2019, formatted in XBRL (eXtensible Business Reporting Language): (i) Consolidated Balance Sheets as of March 31, 2019 and December 31, 2018 (unaudited), (ii) Consolidated Statements of Income for the three months ended March 31, 2019 and 2018 (unaudited), (iii) Consolidated Statements of Comprehensive Income for the three months ended March 31, 2019 and 2018 (unaudited), (iv) Consolidated Statements of Changes in Stockholders’ Equity and Noncontrolling Interests for the three months ended March 31, 2019 and 2018 (unaudited), (v) Consolidated Statements of Cash Flows for the three months ended March 31, 2019 and 2018 (unaudited), and (vi) Notes to Consolidated Financial Statements (unaudited)
|
N/A
|
Filed herewith
|
|||
(*) Incorporated by reference.
(1) Management contract or compensatory agreement.
113
SIGNATURES
Pursuant to the requirements of the Securities Exchange Act of 1934, the registrant has duly caused this report to be signed on its behalf by the undersigned, thereunto duly authorized, on
April 30, 2019
.
|
|
ALEXANDRIA REAL ESTATE EQUITIES, INC.
|
|
/s/ Joel S. Marcus
|
|
|
Joel S. Marcus
Executive Chairman
(Principal Executive Officer) |
|
|
/s/ Stephen A. Richardson
|
|
|
Stephen A. Richardson
Co-Chief Executive Officer
(Principal Executive Officer)
|
|
|
/s/ Peter M. Moglia
|
|
|
Peter M. Moglia
Co-Chief Executive Officer and Co-Chief Investment Officer
(Principal Executive Officer)
|
|
|
/s/ Dean A. Shigenaga
|
|
|
Dean A. Shigenaga
Co-President and Chief Financial Officer
(Principal Financial Officer)
|
|
114
TABLE OF CONTENTS
Part I Financial InformationItem 1. Financial Statements (unaudited)Item 2. Management S Discussion and Analysis Of Financial Condition and Results Of OperationsItem 3. Quantitative and Qualitative Disclosures About Market RiskItem 4. Controls and ProceduresPart II Other InformationItem 1A. Risk FactorsItem 6. Exhibits