ARES MANAGEMENT CORP
10-Ks and 10-Qs
|
|
|
|
|
|
|
|
|
|
|
|
|
|
|
|
|
|
|
|
|
|
|
|
|
|
|
|
|
UNITED STATES
SECURITIES AND EXCHANGE COMMISSION
Washington, D.C. 20549
FORM
10-Q
|
|
QUARTERLY REPORT PURSUANT TO SECTION 13 OR 15(d) OF THE SECURITIES EXCHANGE ACT OF 1934 | ||||
For the quarterly period ended
September 30, 2021
OR
|
|
TRANSITION REPORT PURSUANT TO SECTION 13 OR 15(d) OF THE SECURITIES EXCHANGE ACT OF 1934 | ||||
For the transition period from to
Commission File No.
001-36429

(Exact name of Registrant as specified in its charter)
|
|
|
||||
|
(State or other jurisdiction of
incorporation or organization) |
(I.R.S. Employer
Identification Number) |
||||
(Address of principal executive office) (Zip Code)
(
310
)
201-4100
(Registrant’s telephone number, including area code)
N/A
(Former name, former address and former fiscal year, if changed since last report)
Securities registered pursuant to Section 12(b) of the Act:
| Title of each class | Trading Symbol(s) | Name of each exchange on which registered | ||||||
|
|
|
|
||||||
Indicate by check mark whether the registrant (1) has filed all reports required to be filed by Section 13 or 15(d) of the Securities Exchange Act of 1934 during the preceding 12 months (or for such shorter period that the registrant was required to file such reports), and (2) has been subject to such filing requirements for the past 90 days:
Yes
x
No
¨
Indicate by check mark whether the registrant has submitted electronically every Interactive Data File required to be submitted pursuant to Rule 405 of Regulation S-T (§232.405 of this chapter) during the preceding 12 months (or for such shorter period that the registrant was required to submit such files).
Yes
x
No
¨
Indicate by check mark whether the registrant is a large accelerated filer, an accelerated filer, a non-accelerated filer, a smaller reporting company, or an emerging growth company. See definitions of “large accelerated filer,” “accelerated filer,” “smaller reporting company.” and “emerging growth company” in Rule 12b-2 of the Exchange Act.
|
|
x
|
Accelerated Filer | ☐ | Non-Accelerated Filer | ☐ | Smaller Reporting Company |
|
Emerging Growth Company |
|
||||||||||||||||||||
If an emerging growth company, indicate by check mark if the registrant has elected not to use the extended transition period for complying with any new or revised financial accounting standards provided pursuant to Section 13(a) of the Exchange Act.
¨
Indicate by check mark whether the registrant is a shell company (as defined in Rule 12b-2 of the Exchange Act). Yes
☐
No
x
As of October 29, 2021 there were
167,613,551
of the registrant’s shares of Class A common stock outstanding,
3,489,911
of the registrant’s shares of non-voting common stock outstanding,
1,000
shares of the registrant's Class B common stock outstanding, and
118,803,257
of the registrant's Class C common stock outstanding.
TABLE
OF
CONTENTS
| Page | ||||||||
2
Cautionary Note Regarding Forward-Looking Statements
This report contains forward-looking statements within the meaning of Section 27A of the Securities Act of 1933, as amended (the “Securities Act”), and Section 21E of the Securities Exchange Act of 1934, as amended (the “Exchange Act”), which reflect our current views with respect to, among other things, future events, operations and financial performance. You can identify these forward-looking statements by the use of forward-looking words such as “outlook,” “believes,” “expects,” “potential,” “continues,” “may,” “will,” “should,” “seeks,” “predicts,” “intends,” “plans,” “estimates,” “anticipates” or the negative version of those words, other comparable words or other statements that do not relate to historical or factual matters. The forward-looking statements are based on our beliefs, assumptions and expectations of our future performance, taking into account all information currently available to us. Such forward-looking statements are subject to various risks and uncertainties and assumptions relating to our operations, financial results, financial condition, business prospects, growth strategy and liquidity. Some of these factors are described in this report and in our Annual Report on Form 10-K for the year ended December 31, 2020, under the headings “Item 7. Management’s Discussion and Analysis of Financial Condition and Results of Operations” and “Item 1A. Risk Factors.” These factors should not be construed as exhaustive and should be read in conjunction with the risk factors and other cautionary statements that are included in this report and in our other periodic filings. If one or more of these or other risks or uncertainties materialize, or if our underlying assumptions prove to be incorrect, our actual results may vary materially from those indicated in these forward-looking statements. New risks and uncertainties arise over time, and it is not possible for us to predict those events or how they may affect us. Therefore, you should not place undue reliance on these forward-looking statements. Any forward-looking statement speaks only as of the date on which it is made. We do not undertake any obligation to publicly update or review any forward-looking statement, whether as a result of new information, future developments or otherwise, except as required by law. For a discussion of risks resulting from the coronavirus (“COVID-19”) pandemic and the impact on the U.S. and global economy, see “Item 1A. Risk Factors” in this Quarterly Report on Form 10-Q.
References in this Quarterly Report on Form 10-Q to the “Ares Operating Group” refer to, collectively, Ares Holdings L.P. (“Ares Holdings”), Ares Offshore Holdings L.P. (“Ares Offshore”) and Ares Investments L.P. (“Ares Investments”). References in this Quarterly Report on Form 10-Q to an “Ares Operating Group Unit” or an “AOG Unit” refer to, collectively, a partnership unit in each of the Ares Operating Group entities. On April 1, 2021, Ares completed an internal reorganization (the “Reorganization”) that simplified the organizational structure and merged Ares Offshore and Ares Investments with Ares Holdings. As a result of the Reorganization, Ares Holdings became the sole entity in the Ares Operating Group.
The use of any defined term in this report to mean more than one entities, persons, securities or other items collectively is solely for convenience of reference and in no way implies that such entities, persons, securities or other items are one indistinguishable group. For example, notwithstanding the use of the defined terms “Ares,” “we” and “our” in this report to refer to Ares Management Corporation and its subsidiaries, each subsidiary of Ares Management Corporation is a standalone legal entity that is separate and distinct from Ares Management Corporation and any of its other subsidiaries.
Under generally accepted accounting principles in the United States (“GAAP”), we are required to consolidate (a) entities other than limited partnerships and entities similar to limited partnerships in which we hold a majority voting interest or have majority ownership and control over the operational, financial and investing decisions of that entity, including Ares-affiliates and affiliated funds and co-investment entities, for which we are presumed to have controlling financial interests, and (b) entities that we concluded are variable interest entities (“VIEs”), including limited partnerships and collateralized loan obligations, for which we are deemed to be the primary beneficiary. When an entity is consolidated, we reflect the assets, liabilities, revenues, expenses and cash flows of the entity in our consolidated financial statements on a gross basis, subject to eliminations from consolidation, including the elimination of the management fees, performance income and other fees that we earn from the entity. However, the presentation of performance related compensation and other expenses associated with generating such revenues is not affected by the consolidation process. In addition, as a result of the consolidation process, the net income attributable to third-party investors in consolidated entities is presented as net income attributable to non-controlling interests in Consolidated Funds in our Condensed Consolidated Statements of Operations. We also consolidate joint ventures that we have established with third-party investors for strategic distribution and expansion purposes. The results of these entities are reflected on a gross basis in the consolidated financial statements, subject to eliminations from consolidation, and net income attributable to third-party investors in the consolidated joint ventures is included in net income attributable to redeemable interest and non-controlling interests in Ares Operating Group entities.
In this Quarterly Report on Form 10-Q, in addition to presenting our results on a consolidated basis in accordance with GAAP, we present revenues, expenses and other results on a (i) “segment basis,” which deconsolidates the consolidated funds and removes the proportional results attributable to third-party investors in the consolidated joint ventures, and therefore shows the results of our reportable segments without giving effect to the consolidation of these entities and (ii) “unconsolidated reporting basis,” which shows the results of our reportable segments on a combined segment basis together with our Operations
3
Management Group. In addition to our reportable segments, we have an Operations Management Group (the “OMG”). The OMG consists of shared resource groups to support our reportable segments by providing infrastructure and administrative support in the areas of accounting/finance, operations, information technology, strategy and relationship management, legal, compliance and human resources. The OMG’s expenses are not allocated to our reportable segments but we consider the cost structure of the OMG when evaluating our financial performance. This information constitutes non-GAAP financial information within the meaning of Regulation G, as promulgated by the SEC. Our management uses this information to assess the performance of our reportable segments and the OMG, and we believe that this information enhances the ability of shareholders to analyze our performance. For more information, see “Note 15. Segment Reporting,” to our unaudited condensed consolidated financial statements included in this Quarterly Report on Form 10-Q.
4
Glossary
When used in this report, unless the context otherwise requires:
•
“American-style waterfall” generally refers to carried interest that the general partner is entitled to receive after a fund investment is realized and the investors in the fund have received distributions in excess of the capital contributed for that investment and all prior realized investments (including allocable expenses) plus a preferred return;
•
“ARCC Part II Fees” refers to fees that are paid in arrears as of the end of each calendar year when the cumulative aggregate realized capital gains exceed the cumulative aggregate realized capital losses and aggregate unrealized capital depreciation, less the aggregate amount of ARCC Part II Fees paid in all prior years since inception;
•
“Ares”, the “Company”, “we”, “us” and “our” refer to Ares Management Corporation and its subsidiaries;
•
“Ares Operating Group Unit” or an “AOG Unit” refers to, collectively, a partnership unit in the Ares Operating Group entities including Ares Holdings and any future entity designated by our board of directors in its sole discretion as an Ares Operating Group entity;
•
“assets under management” or “AUM” generally refers to the assets we manage. For our funds other than CLOs, our AUM represents the sum of the net asset value (“NAV”) of such funds, the drawn and undrawn debt (at the fund-level including amounts subject to restrictions) and uncalled committed capital (including commitments to funds that have yet to commence their investment periods). NAV refers to the fair value of the assets of a fund less the fair value of the liabilities of the fund. For the CLOs we manage, our AUM is equal to initial principal amounts adjusted for paydowns. AUM also includes the proceeds raised in the initial public offering of a special purpose acquisition company (“SPAC”) sponsored by us;
•
“AUM not yet paying fees” (also referred to as “shadow AUM”) refers to AUM that is not currently paying fees and is eligible to earn management fees upon deployment;
•
“available capital” (also referred to as “dry powder”) is comprised of uncalled committed capital and undrawn amounts under credit facilities and may include AUM that may be canceled or not otherwise available to invest;
•
“catch-up fees” refers to management fees that are one-time in nature and represents management fees charged to fund investors in subsequent closings of a fund that apply to the time period between the fee initiation date and the subsequent closing date;
•
“Class B membership interests” refers to the interests that were retained by the former owners of Crestline Denali Capital LLC and represent the financial interests in the subordinated notes of the related CLOs;
•
“CLOs” refers to “our funds” that are structured as collateralized loan obligations;
•
“Consolidated Funds” refers collectively to certain Ares funds, co-investment entities, CLOs and SPACs that are required under GAAP to be consolidated in our consolidated financial statements;
•
“Credit Facility” refers to the revolving credit facility of the Ares Operating Group;
•
“effective management fee rate” represents the annualized fees divided by the average fee paying AUM for the period, excluding the impact of one-time catch-up fees;
•
“European-style waterfall” generally refers to carried interest that the general partner is entitled to receive after the investors in a fund have received distributions in an amount equal to all prior capital contributions plus a preferred return;
5
•
“fee paying AUM” or “FPAUM” refers to the AUM from which we directly earn management fees. FPAUM is equal to the sum of all the individual fee bases of our funds that directly contribute to our management fees. For our funds other than CLOs, our FPAUM represents the amount of limited partner capital commitments for certain closed-end funds within the reinvestment period, the amount of limited partner invested capital for the aforementioned closed-end funds beyond the reinvestment period and the portfolio value, gross asset value or NAV. For the CLOs we manage, our FPAUM is equal to the gross amount of aggregate collateral balance, at par, adjusted for defaulted or discounted collateral;
•
“fee related earnings” or “FRE”, a non-GAAP measure, is used to assess core operating performance by determining whether recurring revenue, primarily consisting of management fees, is sufficient to cover operating expenses and to generate profits. FRE differs from income before taxes computed in accordance with GAAP as it excludes performance income, performance related compensation, investment income from our Consolidated Funds and non-consolidated funds and certain other items that we believe are not indicative of our core operating performance;
•
“GAAP” refers to accounting principles generally accepted in the United States of America;
•
“Holdco Members” refers to Michael Arougheti, David Kaplan, Antony Ressler, Bennett Rosenthal, Ryan Berry and R. Kipp deVeer;
•
“Incentive eligible AUM” or “IEAUM” generally refers to the AUM of our funds and other entities from which performance income may be generated, regardless of whether or not they are currently generating performance income. It generally represents the NAV plus uncalled equity or total assets plus uncalled debt, as applicable, of our funds for which we are entitled to receive performance income, excluding capital committed by us and our professionals (from which we generally do not earn performance income), as well as proceeds raised in the initial public offering of a SPAC sponsored by us. With respect to ARCC's AUM, only ARCC Part II Fees may be generated from IEAUM;
•
“Incentive generating AUM” or “IGAUM” refers to the AUM of our funds and other entities that are currently generating performance income on a realized or unrealized basis. It generally represents the NAV or total assets of our funds, as applicable, for which we are entitled to receive performance income, excluding capital committed by us and our professionals (from which we generally do not earn performance income). ARCC is only included in IGAUM when ARCC Part II Fees are being generated;
•
“management fees” refers to fees we earn for advisory services provided to our funds, which are generally based on a defined percentage of fair value of assets, total commitments, invested capital, net asset value, net investment income, total assets or par value of the investment portfolios managed by us. Management fees include Part I Fees, a quarterly fee based on the net investment income of certain funds, among others;
•
“net inflows of capital” refers to net new commitments during the period, including equity and debt commitments and gross inflows into our open-ended managed accounts and sub-advised accounts, as well as new debt and equity issuances by our publicly traded vehicles minus redemptions from our open-ended funds, managed accounts and sub-advised accounts;
•
“net performance income” refers to performance income net of performance related compensation. Performance related compensation is the portion of performance income that is typically payable to our professionals;
•
“our funds” refers to the funds, alternative asset companies, co-investment vehicles and other entities and accounts that are managed or co-managed by the Ares Operating Group, and which are structured to pay fees. It also includes funds managed by Ivy Hill Asset Management, L.P., a wholly owned portfolio company of ARCC and an SEC-registered investment adviser;
•
“Part I Fees” refers to a quarterly performance income on the net investment income of Ares Capital Corporation (NASDAQ: ARCC) (“ARCC”) and CION Ares Diversified Credit Fund (“CADC”). Such fees are classified as
6
management fees as they are predictable and recurring in nature, not subject to contingent repayment and generally cash-settled each quarter, unless subject to a payment deferral;
•
“performance income” refers to income we earn based on the performance of a fund that is generally based on certain specific hurdle rates as defined in the fund’s investment management or partnership agreements and may be either an incentive fee or carried interest;
•
“perpetual capital” refers to the AUM of (i) ARCC, Ares Commercial Real Estate Corporation (NYSE: ACRE) ("ACRE"), Ares Dynamic Credit Allocation Fund, Inc. (NYSE: ARDC) ("ARDC") and CADC, (ii) our non-traded REITs, (iii) Aspida Holdings Ltd. (together with its subsidiaries, "Aspida") and (iv) certain other commingled funds and managed accounts that have an indefinite term, are not in liquidation, and for which there is no immediate requirement to return invested capital to investors upon the realization of investments. Perpetual Capital - Commingled Funds refers to commingled funds that meet the Perpetual Capital criteria. Perpetual Capital - Managed Accounts refers to managed accounts for single investors primarily in illiquid strategies that meet the Perpetual Capital criteria. Perpetual Capital may be withdrawn by investors under certain conditions, including through an election to redeem an investor’s fund investment or to terminate the investment management agreement, which in certain cases may be terminated on 30 days’ prior written notice. In addition, the investment management or advisory agreements of certain of our publicly-traded and non-traded vehicles have one year terms, which are subject to annual renewal by such vehicles;
•
“realized income” or “RI”, a non-GAAP measure, is an operating metric used by management to evaluate performance of the business based on operating performance and the contribution of each of the business segments to that performance, while removing the fluctuations of unrealized income and losses, which may or may not be eventually realized at the levels presented and whose realizations depend more on future outcomes than current business operations. RI differs from income before taxes by excluding (a) operating results of our Consolidated Funds, (b) depreciation and amortization expense, (c) the effects of changes arising from corporate actions, (d) unrealized gains and losses related to performance income and investment performance and (e) certain other items that we believe are not indicative of our operating performance. Changes arising from corporate actions include equity-based compensation expenses, the amortization of intangible assets, transaction costs associated with mergers, acquisitions and capital activities, underwriting costs and expenses incurred in connection with corporate reorganization;
•
“SEC” refers to the Securities and Exchange Commission;
•
“Series A Preferred Stock” refers to the preferred stock, $0.01 par value per share, of the Company designated as 7.00% Series A Preferred Stock;
•
“2024 Senior Notes” refers to senior notes issued by a wholly owned subsidiary of Ares Holdings in October 2014 with a maturity in October 2024;
•
“2030 Senior Notes” refers to senior notes issued by a wholly owned subsidiary of Ares Holdings in June 2020 with a maturity in June 2030; and
•
“2051 Subordinated Notes” refers to subordinated notes issued by a wholly owned subsidiary of Ares Holdings in June 2021 with a maturity in June 2051.
Many of the terms used in this report, including AUM, FPAUM, FRE and RI, may not be comparable to similarly titled measures used by other companies. In addition, our definitions of AUM and FPAUM are not based on any definition of AUM or FPAUM that is set forth in the agreements governing the investment funds that we manage and may differ from definitions of AUM or FPAUM set forth in other agreements to which we are a party or definitions used by the SEC or other regulatory bodies. Further, FRE and RI are not measures of performance calculated in accordance with GAAP. We use FRE and RI as measures of operating performance, not as measures of liquidity. FRE and RI should not be considered in isolation or as substitutes for operating income, net income, operating cash flows, or other income or cash flow statement data prepared in accordance with GAAP. The use of FRE and RI without consideration of related GAAP measures is not adequate due to the adjustments described above. Our management compensates for these limitations by using FRE and RI as supplemental
7
measures to our GAAP results. We present these measures to provide a more complete understanding of our performance as our management measures it. Amounts and percentages throughout this report may reflect rounding adjustments and consequently totals may not appear to sum.
8
PART I—FINANCIAL INFORMATION
Item 1. Financial Statements
Ares Management Corporation
Condensed Consolidated Statements of Financial Condition
(Amounts in Thousands, Except
Share
Data)
| As of September 30, | As of December 31, | ||||||||||
| 2021 | 2020 | ||||||||||
| (unaudited) | |||||||||||
| Assets | |||||||||||
| Cash and cash equivalents | $ |
|
$ |
|
|||||||
|
Investments (includes accrued carried interest of $
|
|
|
|||||||||
| Due from affiliates |
|
|
|||||||||
| Other assets |
|
|
|||||||||
| Intangible assets, net |
|
|
|||||||||
| Right-of-use operating lease assets |
|
|
|||||||||
| Assets of Consolidated Funds: | |||||||||||
| Cash and cash equivalents |
|
|
|||||||||
| U.S. Treasury securities, at fair value |
|
|
|||||||||
| Investments, at fair value |
|
|
|||||||||
| Due from affiliates |
|
|
|||||||||
| Receivable for securities sold |
|
|
|||||||||
| Other assets |
|
|
|||||||||
| Total assets | $ |
|
$ |
|
|||||||
| Liabilities | |||||||||||
| $ |
|
$ |
|
||||||||
| Accrued compensation |
|
|
|||||||||
| Due to affiliates |
|
|
|||||||||
| Performance related compensation payable |
|
|
|||||||||
| Debt obligations |
|
|
|||||||||
| Operating lease liabilities |
|
|
|||||||||
| Liabilities of Consolidated Funds: | |||||||||||
| Accounts payable, accrued expenses and other liabilities |
|
|
|||||||||
| Payable for securities purchased |
|
|
|||||||||
| CLO loan obligations, at fair value |
|
|
|||||||||
| Fund borrowings |
|
|
|||||||||
| Total liabilities |
|
|
|||||||||
| Commitments and contingencies |
|
|
|||||||||
| Redeemable interest in Consolidated Funds |
|
|
|||||||||
| Redeemable interest in Ares Operating Group entities |
|
|
|||||||||
| Non-controlling interests in Consolidated Funds |
|
|
|||||||||
| Non-controlling interests in Ares Operating Group entities |
|
|
|||||||||
| Stockholders' Equity | |||||||||||
|
Series A Preferred Stock, $
|
|
|
|||||||||
|
Class A common stock, $
|
|
|
|||||||||
|
Non-voting common stock, $
|
|
|
|||||||||
|
Class B common stock, $
|
|
|
|||||||||
|
Class C common stock, $
|
|
|
|||||||||
| Additional paid-in-capital |
|
|
|||||||||
| Retained earnings |
(
|
(
|
|||||||||
| Accumulated other comprehensive income (loss), net of tax |
(
|
|
|||||||||
| Total stockholders' equity |
|
|
|||||||||
| Total equity |
|
|
|||||||||
| Total liabilities, redeemable interest, non-controlling interests and equity | $ |
|
$ |
|
|||||||
See accompanying notes to the condensed consolidated financial statements.
9
Ares Management Corporation
Condensed Consolidated Statements of Operations
(Amounts in Thousands, Except Share Data)
(unaudited)
| Three months ended September 30, | Nine months ended September 30, | ||||||||||||||||||||||
| 2021 | 2020 | 2021 | 2020 | ||||||||||||||||||||
| Revenues | |||||||||||||||||||||||
| Management fees | $ |
|
$ |
|
$ |
|
$ |
|
|||||||||||||||
| Carried interest allocation |
|
|
|
|
|||||||||||||||||||
| Incentive fees |
|
|
|
|
|||||||||||||||||||
| Principal investment income |
|
|
|
|
|||||||||||||||||||
| Administrative, transaction and other fees |
|
|
|
|
|||||||||||||||||||
| Total revenues |
|
|
|
|
|||||||||||||||||||
| Expenses | |||||||||||||||||||||||
| Compensation and benefits |
|
|
|
|
|||||||||||||||||||
| Performance related compensation |
|
|
|
|
|||||||||||||||||||
| General, administrative and other expenses |
|
|
|
|
|||||||||||||||||||
| Expenses of Consolidated Funds |
|
|
|
|
|||||||||||||||||||
| Total expenses |
|
|
|
|
|||||||||||||||||||
| Other income (expense) | |||||||||||||||||||||||
| Net realized and unrealized gains (losses) on investments |
|
(
|
|
(
|
|||||||||||||||||||
| Interest and dividend income |
|
|
|
|
|||||||||||||||||||
| Interest expense |
(
|
(
|
(
|
(
|
|||||||||||||||||||
| Other income, net |
|
|
|
|
|||||||||||||||||||
| Net realized and unrealized gains (losses) on investments of Consolidated Funds |
|
|
|
(
|
|||||||||||||||||||
| Interest and other income of Consolidated Funds |
|
|
|
|
|||||||||||||||||||
| Interest expense of Consolidated Funds |
(
|
(
|
(
|
(
|
|||||||||||||||||||
| Total other income (expense) |
|
|
|
(
|
|||||||||||||||||||
| Income before taxes |
|
|
|
|
|||||||||||||||||||
| Income tax expense |
|
|
|
|
|||||||||||||||||||
| Net income |
|
|
|
|
|||||||||||||||||||
| Less: Net income (loss) attributable to non-controlling interests in Consolidated Funds |
|
|
|
(
|
|||||||||||||||||||
| Net income attributable to Ares Operating Group entities |
|
|
|
|
|||||||||||||||||||
| Less: Net income (loss) attributable to redeemable interest in Ares Operating Group entities |
|
(
|
|
(
|
|||||||||||||||||||
| Less: Net income attributable to non-controlling interests in Ares Operating Group entities |
|
|
|
|
|||||||||||||||||||
| Net income attributable to Ares Management Corporation |
|
|
|
|
|||||||||||||||||||
| Less: Series A Preferred Stock dividends paid |
|
|
|
|
|||||||||||||||||||
| Less: Series A Preferred Stock redemption premium |
|
|
|
|
|||||||||||||||||||
| Net income attributable to Ares Management Corporation Class A and non-voting common stockholders | $ |
|
$ |
|
$ |
|
$ |
|
|||||||||||||||
| Net income per share of Class A and non-voting common stock: | |||||||||||||||||||||||
| Basic | $ |
|
$ |
|
$ |
|
$ |
|
|||||||||||||||
| Diluted | $ |
|
$ |
|
$ |
|
$ |
|
|||||||||||||||
| Weighted-average shares of Class A and non-voting common stock: | |||||||||||||||||||||||
| Basic |
|
|
|
|
|||||||||||||||||||
| Diluted |
|
|
|
|
|||||||||||||||||||
Substantially all revenue is earned from affiliated funds of the Company. See accompanying notes to the condensed consolidated financial statements.
10
Ares Management Corporation
Condensed Consolidated Statements of Comprehensive Income
(Amounts in Thousands)
(unaudited)
| Three months ended September 30, | Nine months ended September 30, | |||||||||||||||||||||||||
| 2021 | 2020 | 2021 | 2020 | |||||||||||||||||||||||
| Net income | $ |
|
$ |
|
$ |
|
$ |
|
||||||||||||||||||
| Other comprehensive income: | ||||||||||||||||||||||||||
| Foreign currency translation adjustments, net of tax |
(
|
|
(
|
|
||||||||||||||||||||||
| Total comprehensive income |
|
|
|
|
||||||||||||||||||||||
| Less: Comprehensive income (loss) attributable to non-controlling interests in Consolidated Funds |
|
|
|
(
|
||||||||||||||||||||||
| Less: Comprehensive loss attributable to redeemable interest in Ares Operating Group entities |
(
|
(
|
(
|
(
|
||||||||||||||||||||||
| Less: Comprehensive income attributable to non-controlling interests in Ares Operating Group entities |
|
|
|
|
||||||||||||||||||||||
| Comprehensive income attributable to Ares Management Corporation | $ |
|
$ |
|
$ |
|
$ |
|
||||||||||||||||||
See accompanying notes to the condensed consolidated financial statements.
11
Ares Management Corporation
Condensed Consolidated Statements of Changes in Equity
(Amounts in Thousands)
| Series A Preferred Stock | Class A Common Stock | Non- voting Common Stock | Class C Common Stock | Additional Paid-in-Capital | Retained Earnings | Accumulated Other Comprehensive Income (loss) | Non-Controlling Interest in Ares Operating Group Entities | Non-Controlling Interest in Consolidated Funds | Total Equity | ||||||||||||||||||||||||||||||||||||||||||||||||||
| Balance at December 31, 2020 | $ |
|
$ |
|
$ |
|
$ |
|
$ |
|
$ |
(
|
$ |
|
$ |
|
$ |
|
$ |
|
|||||||||||||||||||||||||||||||||||||||
| Changes in ownership interests and related tax benefits | — |
|
— |
(
|
(
|
— | — |
(
|
— |
(
|
|||||||||||||||||||||||||||||||||||||||||||||||||
| Capital contributions | — | — | — | — | — | — | — | — |
|
|
|||||||||||||||||||||||||||||||||||||||||||||||||
| Dividends/Distributions |
(
|
— | — | — | — |
(
|
— |
(
|
(
|
(
|
|||||||||||||||||||||||||||||||||||||||||||||||||
| Net income |
|
— | — | — | — |
|
— |
|
|
|
|||||||||||||||||||||||||||||||||||||||||||||||||
| Currency translation adjustment, net of tax | — | — | — | — | — | — |
(
|
(
|
(
|
(
|
|||||||||||||||||||||||||||||||||||||||||||||||||
| Equity compensation | — | — | — | — |
|
— | — |
|
— |
|
|||||||||||||||||||||||||||||||||||||||||||||||||
| Balance at March 31, 2021 |
|
|
|
|
|
(
|
(
|
|
|
|
|||||||||||||||||||||||||||||||||||||||||||||||||
| Changes in ownership interests and related tax benefits | — |
|
— |
|
(
|
— | — |
|
— |
(
|
|||||||||||||||||||||||||||||||||||||||||||||||||
| Issuances of common stock | — |
|
|
— |
|
— | — | — | — |
|
|||||||||||||||||||||||||||||||||||||||||||||||||
| Capital contributions | — | — | — |
|
— | — | — |
|
|
|
|||||||||||||||||||||||||||||||||||||||||||||||||
| Redemption of preferred stock |
(
|
— | — | — | — | — | — | — | — |
(
|
|||||||||||||||||||||||||||||||||||||||||||||||||
| Dividends/Distributions |
(
|
— | — | — | — |
(
|
— |
(
|
(
|
(
|
|||||||||||||||||||||||||||||||||||||||||||||||||
| Net income |
|
— | — | — | — |
|
— |
|
|
|
|||||||||||||||||||||||||||||||||||||||||||||||||
| Currency translation adjustment, net of tax | — | — | — | — | — | — |
|
|
|
|
|||||||||||||||||||||||||||||||||||||||||||||||||
| Equity compensation | — | — | — | — |
|
— | — |
|
— |
|
|||||||||||||||||||||||||||||||||||||||||||||||||
| Stock option exercises | — |
|
— | — |
|
— | — | — | — |
|
|||||||||||||||||||||||||||||||||||||||||||||||||
| Balance at June 30, 2021 |
|
|
|
|
|
(
|
|
|
|
|
|||||||||||||||||||||||||||||||||||||||||||||||||
| Changes in ownership interests and related tax benefits | — |
|
— |
(
|
|
— | — |
(
|
— |
(
|
|||||||||||||||||||||||||||||||||||||||||||||||||
| Capital contributions | — | — | — |
|
— | — | — |
|
(
|
|
|||||||||||||||||||||||||||||||||||||||||||||||||
| Dividends/Distributions | — | — | — | — | — |
(
|
— |
(
|
(
|
(
|
|||||||||||||||||||||||||||||||||||||||||||||||||
| Net income | — | — | — | — | — |
|
— |
|
|
|
|||||||||||||||||||||||||||||||||||||||||||||||||
| Currency translation adjustment, net of tax | — | — | — | — | — | — |
(
|
(
|
(
|
(
|
|||||||||||||||||||||||||||||||||||||||||||||||||
| Equity compensation | — | — | — | — |
|
— | — |
|
— |
|
|||||||||||||||||||||||||||||||||||||||||||||||||
| Stock option exercises | — |
|
— | — |
|
— | — | — | — |
|
|||||||||||||||||||||||||||||||||||||||||||||||||
| Balance at September 30, 2021 | $ |
|
$ |
|
$ |
|
$ |
|
$ |
|
$ |
(
|
$ |
(
|
$ |
|
$ |
|
$ |
|
|||||||||||||||||||||||||||||||||||||||
See accompanying notes to the condensed consolidated financial statements.
12
Ares Management Corporation
Condensed Consolidated Statements of Changes in Equity
(Amounts in Thousands)
(unaudited)
| Series A Preferred Stock | Class A Common Stock | Class C Common Stock | Additional Paid-in-Capital | Retained Earnings | Accumulated Other Comprehensive Income (loss) | Non-Controlling Interest in Ares Operating Group Entities | Non-Controlling Interest in Consolidated Funds | Total Equity | ||||||||||||||||||||||||||||||||||||||||||||||||
| Balance at December 31, 2019 | $ |
|
$ |
|
$ |
|
$ |
|
$ |
(
|
$ |
(
|
$ |
|
$ |
|
$ |
|
||||||||||||||||||||||||||||||||||||||
| Consolidation and deconsolidation of funds, net | — | — | — | — | — | — | — |
(
|
(
|
|||||||||||||||||||||||||||||||||||||||||||||||
| Changes in ownership interests and related tax benefits | — |
|
— |
(
|
— | — |
|
— |
(
|
|||||||||||||||||||||||||||||||||||||||||||||||
| Issuances of common stock | — |
|
|
|
— | — | — | — |
|
|||||||||||||||||||||||||||||||||||||||||||||||
| Capital contributions | — | — | — | — | — | — |
|
|
|
|||||||||||||||||||||||||||||||||||||||||||||||
| Dividends/Distributions |
(
|
— | — | — |
(
|
— |
(
|
(
|
(
|
|||||||||||||||||||||||||||||||||||||||||||||||
| Net loss |
|
— | — | — |
(
|
— |
(
|
(
|
(
|
|||||||||||||||||||||||||||||||||||||||||||||||
| Currency translation adjustment, net of tax | — | — | — | — | — |
(
|
(
|
(
|
(
|
|||||||||||||||||||||||||||||||||||||||||||||||
| Equity compensation | — | — | — |
|
— | — |
|
— |
|
|||||||||||||||||||||||||||||||||||||||||||||||
| Stock option exercises | — |
|
— |
|
— | — | — | — |
|
|||||||||||||||||||||||||||||||||||||||||||||||
| Balance at March 31, 2020 |
|
|
|
|
(
|
(
|
|
|
|
|||||||||||||||||||||||||||||||||||||||||||||||
| Consolidation and deconsolidation of funds, net | — | — | — | — | — | — | — |
|
|
|||||||||||||||||||||||||||||||||||||||||||||||
| Changes in ownership interests and related tax benefits | — |
|
(
|
(
|
— | — |
|
— |
|
|||||||||||||||||||||||||||||||||||||||||||||||
| Expenses incurred upon issuance of common stock | — | — | — |
(
|
— | — | — | — |
(
|
|||||||||||||||||||||||||||||||||||||||||||||||
| Capital contributions | — | — | — | — | — | — |
|
(
|
(
|
|||||||||||||||||||||||||||||||||||||||||||||||
| Dividends/Distributions |
(
|
— | — | — |
(
|
— |
(
|
(
|
(
|
|||||||||||||||||||||||||||||||||||||||||||||||
| Net income |
|
— | — | — |
|
— |
|
|
|
|||||||||||||||||||||||||||||||||||||||||||||||
| Currency translation adjustment, net of tax | — | — | — | — | — |
(
|
(
|
|
|
|||||||||||||||||||||||||||||||||||||||||||||||
| Equity compensation | — | — | — |
|
— | — |
|
— |
|
|||||||||||||||||||||||||||||||||||||||||||||||
| Stock option exercises | — |
|
— |
|
— | — | — | — |
|
|||||||||||||||||||||||||||||||||||||||||||||||
| Balance at June 30, 2020 |
|
|
|
|
(
|
(
|
|
|
|
|||||||||||||||||||||||||||||||||||||||||||||||
| Changes in ownership interests and related tax benefits | — |
|
(
|
(
|
— | — |
|
— |
(
|
|||||||||||||||||||||||||||||||||||||||||||||||
| Issuances of common stock | — |
|
— |
|
— | — | — | — |
|
|||||||||||||||||||||||||||||||||||||||||||||||
| Capital contributions | — | — | — |
|
— | — | — |
|
|
|||||||||||||||||||||||||||||||||||||||||||||||
| Dividends/Distributions |
(
|
— | — | — |
(
|
— |
(
|
(
|
(
|
|||||||||||||||||||||||||||||||||||||||||||||||
| Net income |
|
— | — | — |
|
— |
|
|
|
|||||||||||||||||||||||||||||||||||||||||||||||
| Currency translation adjustment, net of tax | — | — | — | — | — |
|
|
|
|
|||||||||||||||||||||||||||||||||||||||||||||||
| Equity compensation | — | — | — |
|
— | — |
|
— |
|
|||||||||||||||||||||||||||||||||||||||||||||||
| Stock option exercises | — |
|
— |
|
— | — | — | — |
|
|||||||||||||||||||||||||||||||||||||||||||||||
| Balance at September 30, 2020 |
|
|
|
|
(
|
(
|
|
|
|
|||||||||||||||||||||||||||||||||||||||||||||||
| Changes in ownership interests and related tax benefits | — |
|
(
|
|
— | — |
(
|
— |
(
|
|||||||||||||||||||||||||||||||||||||||||||||||
| Issuances of common stock | — | — | — |
|
— | — | — | — |
|
|||||||||||||||||||||||||||||||||||||||||||||||
| Capital contributions | — | — | — | — | — | — |
|
|
|
|||||||||||||||||||||||||||||||||||||||||||||||
| Dividends/Distributions |
(
|
— | — | — |
(
|
— |
(
|
(
|
(
|
|||||||||||||||||||||||||||||||||||||||||||||||
| Net income |
|
— | — | — |
|
— |
|
|
|
|||||||||||||||||||||||||||||||||||||||||||||||
| Currency translation adjustment, net of tax | — | — | — | — | — |
|
|
|
|
|||||||||||||||||||||||||||||||||||||||||||||||
| Equity compensation | — | — | — |
|
— | — |
|
— |
|
|||||||||||||||||||||||||||||||||||||||||||||||
| Stock option exercises | — |
|
— |
|
— | — | — | — |
|
|||||||||||||||||||||||||||||||||||||||||||||||
| Balance at December 31, 2020 | $ |
|
$ |
|
$ |
|
$ |
|
$ |
(
|
$ |
|
$ |
|
$ |
|
$ |
|
||||||||||||||||||||||||||||||||||||||
See accompanying notes to the condensed consolidated financial statements.
13
Ares Management Corporation
Condensed Consolidated Statements of Cash Flows
(Amounts in Thousands)
(unaudited)
| Nine months ended September 30, | |||||||||||
| 2021 | 2020 | ||||||||||
| Cash flows from operating activities: | |||||||||||
| Net income | $ |
|
$ |
|
|||||||
| Adjustments to reconcile net income to net cash provided by operating activities |
|
|
|||||||||
| Adjustments to reconcile net income to net cash used in operating activities allocable to non-controlling interests in Consolidated Funds |
(
|
(
|
|||||||||
| Cash flows due to changes in operating assets and liabilities |
(
|
|
|||||||||
| Cash flows due to changes in operating assets and liabilities allocable to redeemable and non-controlling interest in Consolidated Funds |
(
|
|
|||||||||
| Net cash provided by (used in) operating activities |
(
|
|
|||||||||
| Cash flows from investing activities: | |||||||||||
| Purchase of furniture, equipment and leasehold improvements, net of disposals |
(
|
(
|
|||||||||
| Acquisitions, net of cash acquired |
(
|
(
|
|||||||||
| Net cash used in investing activities |
(
|
(
|
|||||||||
| Cash flows from financing activities: | |||||||||||
| Net proceeds from issuance of Class A and non-voting common stock |
|
|
|||||||||
| Proceeds from Credit Facility |
|
|
|||||||||
| Proceeds from issuance of senior and subordinated notes |
|
|
|||||||||
| Repayments of Credit Facility |
(
|
(
|
|||||||||
| Dividends and distributions |
(
|
(
|
|||||||||
| Series A Preferred Stock dividends |
(
|
(
|
|||||||||
| Redemption of Series A Preferred Stock |
(
|
|
|||||||||
| Stock option exercises |
|
|
|||||||||
| Taxes paid related to net share settlement of equity awards |
(
|
(
|
|||||||||
| Other financing activities |
|
(
|
|||||||||
| Allocable to redeemable and non-controlling interests in Consolidated Funds: | |||||||||||
| Contributions from redeemable and non-controlling interests in Consolidated Funds |
|
|
|||||||||
| Distributions to non-controlling interests in Consolidated Funds |
(
|
(
|
|||||||||
| Borrowings under loan obligations by Consolidated Funds |
|
|
|||||||||
| Repayments under loan obligations by Consolidated Funds |
(
|
(
|
|||||||||
| Net cash provided by financing activities |
|
|
|||||||||
| Effect of exchange rate changes |
(
|
|
|||||||||
| Net change in cash and cash equivalents |
(
|
|
|||||||||
| Cash and cash equivalents, beginning of period |
|
|
|||||||||
| Cash and cash equivalents, end of period | $ |
|
$ |
|
|||||||
| Supplemental disclosure of non-cash financing activities: | |||||||||||
| Issuance of AOG Units in connection with acquisitions | $ |
|
$ |
|
|||||||
See accompanying notes to the condensed consolidated financial statements.
14
Ares Management Corporation
Notes to the Unaudited Condensed Consolidated Financial Statements
(Dollars in Thousands, Except Share Data and As Otherwise Noted)
1. ORGANIZATION
Ares Management Corporation (the “Company”), a Delaware corporation, together with its subsidiaries, is a leading global alternative investment manager operating integrated groups across Credit, Private Equity, Real Estate,
Secondary Solutions
and Strategic Initiatives. Information about segments should be read together with “Note 15. Segment Reporting.” Subsidiaries of the Company serve as the general partners and/or investment managers to various investment funds and managed accounts within each investment group (the “Ares Funds”). These subsidiaries provide investment advisory services to the Ares Funds in exchange for management fees.
The accompanying unaudited financial statements include the condensed consolidated results of the Company and its subsidiaries. The Company is a holding company, and the Company's assets include equity interests in Ares Holdings Inc., Ares Offshore Holdings, Ltd., and Ares AI Holdings L.P. In this quarterly report, the following of the Company’s subsidiaries are collectively referred to as the “Ares Operating Group” or “AOG”: Ares Offshore Holdings L.P. (“Ares Offshore”), Ares Holdings L.P. (“Ares Holdings”), and Ares Investments L.P. (“Ares Investments”). The Company, indirectly through its wholly owned subsidiaries, is the general partner of each of the Ares Operating Group entities. The Company operates and controls all of the businesses and affairs of and conducts all of its material business activities through the Ares Operating Group.
On April 1, 2021, the Company completed an internal reorganization (the “Reorganization”) that simplified the organizational structure and merged Ares Offshore and Ares Investments with Ares Holdings. As a result of the Reorganization, Ares Holdings became the sole entity in the Ares Operating Group.
The Company and its wholly owned subsidiaries manages or controls certain entities that have been consolidated in the accompanying financials statements as described in “Note 2. Summary of Significant Accounting Policies.” These entities include Ares funds, co-investment entities, collateralized loan obligations or funds (collectively “CLOs”) and a special purpose acquisition company (“SPAC”) (collectively, the “Consolidated Funds”). In February 2021, the Company’s first sponsored SPAC, Ares Acquisition Corporation (NYSE: AAC) (“AAC”), consummated its initial public offering that raised capital of $
1.0
billion. Prior to the completion of a business combination, the sponsor, a wholly owned subsidiary of the Company, owns the majority of the Class B ordinary shares outstanding of AAC, and consolidates AAC under the voting interest model.
Including the results of the Consolidated Funds significantly increases the reported amounts of the assets, liabilities, revenues, expenses and cash flows in the accompanying consolidated financial statements; however, the Consolidated Funds results included herein have no direct effect on the net income attributable to Ares Management Corporation or to Stockholders' Equity. Instead, economic ownership interests of the investors in the Consolidated Funds are reflected as redeemable and non-controlling interests in Consolidated Funds. Further, cash flows allocable to redeemable and non-controlling interest in Consolidated Funds are specifically identifiable in the Consolidated Statements of Cash Flows.
Redeemable Interest and Non-Controlling Interests in Ares Operating Group Entities
The non-controlling interests in AOG entities represent a component of equity and net income attributable to the owners of the Ares Operating Group Units (“AOG Units”) that are not held directly or indirectly by the Company. These owners consist predominantly of Ares Owners Holdings L.P. but also include other strategic distribution partnerships with whom the Company has established joint ventures. Non-controlling interests in AOG entities are adjusted for contributions to and distributions from AOG during the reporting period and are allocated income from the AOG entities based on their historical ownership percentage for the proportional number of days in the reporting period.
On February 21, 2020, the Company completed its acquisition (“Crestline Acquisition”) of the Class A membership interests (the “Class A membership interests”) in Crestline Denali Capital LLC (“Crestline Denali”). The Class A membership interests entitle the Company to the fees associated with managing
seven
collateral management contracts. The Class B membership interests of Crestline Denali (the “Class B membership interests”) were retained by the former owners of Crestline Denali and represent the financial interests in the subordinated notes of the collateralized loan obligations. In connection with the Company's control over Crestline Denali, the Company also consolidates investments and financial results that are attributable to the Class B membership interests to which the Company has no economic rights or obligations. Equity and income (loss) attributable to the Class B membership interests is included within non-controlling interests in AOG entities.
15
Ares Management Corporation
Notes to the Unaudited Condensed Consolidated Financial Statements (Continued)
(Dollars in Thousands, Except Share Data and As Otherwise Noted)
2. SUMMARY OF SIGNIFICANT ACCOUNTING POLICIES
Basis of Presentation
The accompanying condensed consolidated financial statements are prepared in accordance with the generally accepted accounting principles in the United States (“GAAP”) for interim financial information and instructions to the Quarterly Report on Form 10-Q. The condensed consolidated financial statements, including these notes, are unaudited and exclude some of the disclosures required in annual financial statements. Management believes it has made all necessary adjustments so that the condensed consolidated financial statements are presented fairly and that estimates made in preparing its condensed consolidated financial statements are reasonable and prudent, and that all such adjustments are of a normal recurring nature. The operating results presented for interim periods are not necessarily indicative of the results that may be expected for any other interim period or for the entire year. These condensed consolidated financial statements should be read in conjunction with the audited consolidated financial statements included in the Annual Report on Form 10-K for the year ended December 31, 2020 filed with the Securities and Exchange Commission (“SEC”).
As of September 30, 2021, the impact of the outbreak of the novel coronavirus (“COVID-19”) pandemic continues to unfold. As a result, management's estimates and assumptions may be subject to a higher degree of variability and volatility that may result in material differences from the current period.
The condensed consolidated financial statements include the accounts and activities of the AOG entities, their consolidated subsidiaries and certain Consolidated Funds. All intercompany balances and transactions have been eliminated upon consolidation.
Business Combinations
The Company accounts for business combinations using the acquisition method of accounting, under which the purchase price of the acquisition, including the fair value of certain elements of contingent consideration, is allocated to the assets acquired and liabilities assumed using the fair values determined by management as of the acquisition date. Contingent consideration obligations are recognized as of the acquisition date at fair value based on the probability that contingency will be realized. Any fair value of purchase consideration in excess of the fair value of the assets acquired less liabilities assumed is recorded as goodwill. Conversely, any excess of the fair value of the net assets acquired over the purchase consideration is recognized as a bargain purchase gain. Acquisition-related costs incurred in connection with a business combination are expensed as incurred.
U.S. Treasury Securities, at Fair Value
U.S. Treasury securities, at fair value represents U.S. Treasury bills that were purchased with funds raised through the initial public offering of AAC, a consolidated SPAC that is presented within Consolidated Funds. The funds raised are held in a trust account that is restricted for use and may only be used for purposes of completing an initial business combination or redemption of public shares as set forth in the trust agreement. The U.S. Treasury bills have original maturities greater than three months when purchased and therefore are recorded at fair value. Interest income received on such securities is separately presented from the overall change in fair value and is recognized within interest and other income of Consolidated Funds in the
16
Ares Management Corporation
Notes to the Unaudited Condensed Consolidated Financial Statements
(Dollars in Thousands, Except Share Data and As Otherwise Noted)
Recent Accounting Pronouncements
The Company considers the applicability and impact of all accounting standard updates (“ASU”) issued by the Financial Accounting Standards Board (“FASB”). ASUs not listed below were assessed and either determined to be not applicable or expected to have minimal impact on its condensed consolidated financial statements.
In March 2020, the FASB issued ASU 2020-04,
Reference Rate Reform (Topic 848).
The amendments in this update provide optional expedients and exceptions for applying generally accepted accounting principles to contracts, hedging relationships, and other transactions affected by reference rate reform if certain criteria are met. The amendments in this update apply only to contracts, hedging relationships, and other transactions that reference the London Interbank Offered Rate ("LIBOR") or another reference rate expected to be discontinued because of reference rate reform. In January 2021, the FASB issued ASU No. 2021-01,
Reference Rate Reform (Topic 848)
, to clarify that certain optional expedients and exceptions in Topic 848 for contract modifications and hedge accounting apply to derivative instruments that use an interest rate for margining, discounting, or contract price alignment that is modified as a result of reference rate reform. An entity may elect to adopt the amendments in ASU 2020-04 and ASU 2021-01 at any time after March 12, 2020 but no later than December 31, 2022. The expedients and exceptions provided by the amendments do not apply to contract modifications and hedging relationships entered into or evaluated after December 31, 2022, except for hedging transactions as of December 31, 2022, that an entity has elected certain optional expedients for and that are retained through the end of the hedging relationship. The Company is currently evaluating the impact of this guidance on its condensed consolidated financial statements.
3. BUSINESS COMBINATIONS
Acquisition of Landmark Partners, LLC (collectively with its subsidiaries, “Landmark”)
On June 2, 2021, a subsidiary of the Company completed the acquisition of
100
% of the equity interests of Landmark, a subsidiary of BrightSphere Investment Group Inc. (NYSE: BSIG) and Landmark Investment Holdings L.P., in accordance with the purchase agreement entered into on March 30, 2021 (the “Landmark Acquisition”). As a result of the Landmark Acquisition, the Company expanded into the secondaries market with Landmark’s focus of managing private equity, real estate and infrastructure secondaries funds. Following the completion of the Landmark Acquisition, the results of Landmark are included in a newly created Secondary Solutions Group segment.
The acquisition date fair value of the consideration transferred totaled $
1.1
billion, which consisted of the following:
| Cash | $ |
|
|||
|
Equity
(1)
|
|
||||
| Total | $ |
|
|||
(1)
5,419,413
AOG Units were issued in connection with the Landmark Acquisition and increased Ares Owners Holdings L.P.’s ownership interest in the AOG entities.
17
Ares Management Corporation
Notes to the Unaudited Condensed Consolidated Financial Statements
(Dollars in Thousands, Except Share Data and As Otherwise Noted)
The following is a summary of the fair values of assets acquired and liabilities assumed for the Landmark Acquisition as of June 2, 2021, based upon third party valuations of certain intangible assets.
The fair value of assets acquired and liabilities assumed are estimated to be:
| Cash | $ |
|
|||
| Other tangible assets |
|
||||
| Intangible assets: | |||||
| Management contracts |
|
||||
| Client relationships |
|
||||
| Trade name |
|
||||
| Total intangible assets |
|
||||
| Total identifiable assets acquired |
|
||||
| Accounts payable, accrued expenses and other liabilities |
|
||||
| Net identifiable assets acquired |
|
||||
| Goodwill |
|
||||
| Net assets acquired | $ |
|
|||
The Company incurred $
4.9
million of acquisition related costs that were expensed and reported within general, administrative and other expenses within the Condensed Consolidated Statements of Operations.
The carrying value of goodwill associated with Landmark was $
417.7
million as of the acquisition date and is entirely allocated to the Secondary Solutions Group segment. The goodwill is attributable primarily to expected synergies and the assembled workforce of Landmark.
In connection with the Landmark Acquisition, the Company allocated $
425.9
million, $
197.2
million and $
86.2
million of the purchase price to the fair value of the management contracts, client relationships and trade name, respectively. The acquired management contracts and client relationships had a weighted average amortization period as of the acquisition date of
7.4
years and
11.8
years, respectively. The trade name was determined to have an indefinite useful life at the time of the Landmark Acquisition and is not subject to amortization as the Company intends Landmark to continue to operate under its brand name into perpetuity.
Landmark’s revenues and net income of $
54.0
million and $
26.8
million, respectively, are included in the Company’s Consolidated Statements of Operations for the period from June 2, 2021 through September 30, 2021.
Supplemental information of the Company’s consolidated results on an unaudited pro forma basis, as if the Landmark Acquisition had been consummated as of January 1, 2020, is as follows:
| Three months ended September 30, | Nine months ended September 30, | ||||||||||||||||||||||
| 2021 | 2020 | 2021 | 2020 | ||||||||||||||||||||
| Total revenues | $ |
|
$ |
|
$ |
|
$ |
|
|||||||||||||||
| Net income attributable to Ares Management Corporation Class A and non-voting common stockholders | $ |
|
$ |
|
$ |
|
$ |
|
|||||||||||||||
The unaudited pro forma supplemental information is based on estimates and assumptions, which the Company believes are reasonable. These results are not necessarily indicative of the Company’s consolidated financial condition or statements of operations in future periods or the results that actually would have been realized had the Company and Landmark been a combined entity during the periods presented. These pro forma amounts have been calculated after applying the following adjustments that were directly attributable to the Landmark Acquisition:
•
adjustments to include the impact of the additional amortization that would have been charged assuming the fair value adjustments to intangible assets had been applied on January 1, 2020, together with the consequential tax effects;
•
adjustments to include the AOG Units issued as consideration for the Landmark Acquisition, as if they were issued on January 1, 2020, and the resulting change in ownership attributable to Ares Management Corporation;
18
Ares Management Corporation
Notes to the Unaudited Condensed Consolidated Financial Statements
(Dollars in Thousands, Except Share Data and As Otherwise Noted)
•
adjustments to reflect the pro-rata economic ownership attributable to Ares Management Corporation;
•
adjustments to reflect the tax effects of the Landmark Acquisition and the related adjustments as if Landmark had been included in the Company’s results as of January 1, 2020; and
•
adjustments to include Landmark Acquisition related transaction costs in earnings for the nine months ended September 30, 2020.
Purchase of Landmark GP Interests
The Company acquired an ownership interest in Landmark Partners XVI - GP, L.P. and Landmark Real Estate Fund VIII – GP, L.P. (collectively referred to as the “Landmark GP Entities”). The ownership interest entitles the Company to
60
% of the capital interests and a portion of the carried interest in Landmark Equity Partners XVI L.P., Landmark Real Estate Partners VIII L.P. and certain related co-investment vehicles. The Company’s control over Landmark GP Entities also results in the Company consolidating investments and financial results that are attributable to ownership interests that were retained by former Landmark owners. The economic rights retained by the former Landmark owners attributable to these interests are reflected as non-controlling interests in the AOG entities.
Acquisition of Black Creek Group
On July 1, 2021, a subsidiary of the Company completed the acquisition of
100
% of the equity interests of Black Creek Group’s U.S. real estate investment advisory and distribution business (“Black Creek”) in accordance with the purchase agreement entered into on May 20, 2021 (the “Black Creek Acquisition”). Black Creek is a leading real estate investment management firm that operates in core and core-plus real estate strategies across two non-traded Real Estate Investment Trusts (“REITs”) and various institutional fund vehicles. Following the completion of the Black Creek Acquisition, the results of Black Creek are included within the Real Estate Group segment.
In connection with the Black Creek Acquisition, the Company recorded a bargain purchase gain of $
42.3
million that has been presented within other income (expense), net in the Condensed Consolidated Statements of Operations. The bargain purchase gain resulted from the fair value of the identifiable tangible and intangible assets acquired exceeding the purchase consideration. The purchase agreement with Black Creek contains provisions obligating the Company to make a payment upon the achievement of certain revenue targets to certain senior professionals and advisors that is excluded from purchase consideration as it is subject to continued and future service. See “Note 9. Commitments and Contingencies” for a further description of this contingency.
19
Ares Management Corporation
Notes to the Unaudited Condensed Consolidated Financial Statements
(Dollars in Thousands, Except Share Data and As Otherwise Noted)
4. GOODWILL AND INTANGIBLE ASSETS
Intangible Assets, Net
The following table summarizes the carrying value, net of accumulated amortization, of the Company's intangible assets:
| Weighted Average Amortization Period as of September 30, 2021 | As of September 30, | As of December 31, | |||||||||||||||
| 2021 | 2020 | ||||||||||||||||
| Management contracts |
|
$ |
|
$ |
|
||||||||||||
| Client relationships |
|
|
|
||||||||||||||
| Trade name |
|
|
|
||||||||||||||
| Finite-lived intangible assets |
|
|
|||||||||||||||
| Foreign currency translation |
|
|
|||||||||||||||
| Total finite-lived intangible assets |
|
|
|||||||||||||||
| Less: accumulated amortization |
(
|
(
|
|||||||||||||||
| Finite-lived intangible assets, net |
|
|
|||||||||||||||
| Management contracts |
|
|
|||||||||||||||
| Trade name |
|
|
|||||||||||||||
| Indefinite-lived intangible assets |
|
|
|||||||||||||||
| Intangible assets, net | $ |
|
$ |
|
|||||||||||||
In connection with the Black Creek Acquisition, the Company allocated $
576.2
million and $
7.2
million of the purchase consideration to the fair value of management contracts and client relationships, respectively. Certain management contracts were determined to have indefinite useful lives at the time of the Black Creek Acquisition and are not subject to amortization. The remaining management contracts and client relationships had a weighted average amortization period as of the acquisition date of
6.1
years and
12.0
years, respectively.
Amortization expense associated with intangible assets was $
32.8
million and $
11.1
million for the three months ended September 30, 2021 and 2020, respectively, and $
60.7
million and $
13.7
million for the nine months ended September 30, 2021 and 2020 and is presented within general, administrative and other expenses within the Condensed Consolidated Statements of Operations. During the third quarter of 2021, the Company accelerated the amortization of a collateral management contract due to the redemption of that CLO and removed $
3.4
million of intangible assets that were fully amortized.
Goodwill
The following table summarizes the carrying value of goodwill that is included within other assets in the Condensed Consolidated Statements of Financial Condition:
| Credit Group |
Private
Equity Group |
Real
Estate Group |
Secondary Solutions Group |
Strategic Initiatives
|
Total | ||||||||||||||||||||||||||||||
| Balance as of December 31, 2020 | $ |
|
$ |
|
$ |
|
$ |
|
$ |
|
$ |
|
|||||||||||||||||||||||
| Acquisitions |
|
|
|
|
|
|
|||||||||||||||||||||||||||||
| Foreign currency translation |
|
|
|
(
|
(
|
(
|
|||||||||||||||||||||||||||||
| Balance as of September 30, 2021 | $ |
|
$ |
|
$ |
|
$ |
|
$ |
|
$ |
|
|||||||||||||||||||||||
There was
no
impairment of goodwill recorded during the nine months ended September 30, 2021 and 2020. The impact of foreign currency translation is reflected within other comprehensive income.
20
Ares Management Corporation
Notes to the Unaudited Condensed Consolidated Financial Statements
(Dollars in Thousands, Except Share Data and As Otherwise Noted)
5. INVESTMENTS
The Company’s investments are comprised of the following:
| Percentage of total investments | |||||||||||||||||||||||
| September 30, | December 31, | September 30, | December 31, | ||||||||||||||||||||
| 2021 | 2020 | 2021 | 2020 | ||||||||||||||||||||
| Equity method investments: | |||||||||||||||||||||||
|
Equity method private investment partnership interests - principal
(1)
|
$ |
|
$ |
|
|
% |
|
% | |||||||||||||||
|
Equity method - carried interest
(1)
|
|
|
|
|
|||||||||||||||||||
|
Equity method private investment partnership interests and other (held at fair value)
(1)
|
|
|
|
|
|||||||||||||||||||
|
Equity method private investment partnership interests and other
(1)
|
|
|
|
|
|||||||||||||||||||
| Total equity method investments |
|
|
|
|
|||||||||||||||||||
|
Collateralized loan obligations
(2)
|
|
|
|
|
|||||||||||||||||||
| Other fixed income |
|
|
|
|
|||||||||||||||||||
| Collateralized loan obligations and other fixed income, at fair value |
|
|
|
|
|||||||||||||||||||
| Common stock, at fair value |
|
|
|
|
|||||||||||||||||||
| Total investments | $ |
|
$ |
|
|||||||||||||||||||
(1)
Investment or portion of the investment is denominated in foreign currency and is translated into U.S. dollars at each reporting date.
(2)
As of September 30, 2021 and December 31, 2020, includes $
3.2
million and $
3.4
million, respectively, of collateralized loan obligations that are attributable to the Class B Membership Interests.
Equity Method Investments
The Company’s equity method investments include investments that are not consolidated but over which the Company exerts significant influence. The Company evaluates each of its equity method investments to determine if any were significant as defined by guidance from the SEC. As of and for the three and nine months ended September 30, 2021 and 2020, no individual equity method investment held by the Company met the significance criteria.
The Company recognized net gains related to its equity method investments of $
18.9
million and $
8.9
million for the three months ended September 30, 2021 and 2020, respectively, and net gains of $
99.3
million and $
1.8
million for the nine months ended September 30, 2021 and 2020, respectively. The net gains were included within principal investment income, net realized and unrealized gains (losses) on investments, and interest and dividend income within the Condensed Consolidated Statements of Operations.
With respect to the Company's equity method investments, the material assets are expected to generate either long-term capital appreciation and/or interest income, the material liabilities are debt instruments collateralized by, or related to, the financing of the assets and net income is materially comprised of the changes in fair value of these net assets.
21
Ares Management Corporation
Notes to the Unaudited Condensed Consolidated Financial Statements
(Dollars in Thousands, Except Share Data and As Otherwise Noted)
Investments of the Consolidated Funds
Investments held in the Consolidated Funds are summarized below:
| Fair Value at | Percentage of total investments as of | ||||||||||||||||||||||
| September 30, | December 31, | September 30, | December 31, | ||||||||||||||||||||
| 2021 | 2020 | 2021 | 2020 | ||||||||||||||||||||
| Fixed income investments: | |||||||||||||||||||||||
| Bonds | $ |
|
$ |
|
|
% |
|
||||||||||||||||
| Loans |
|
|
|
|
|||||||||||||||||||
| U.S. Treasury securities |
|
|
|
|
|||||||||||||||||||
| Investments in CLO warehouse |
|
|
|
|
|||||||||||||||||||
| Total fixed income investments |
|
|
|
|
|||||||||||||||||||
| Equity securities |
|
|
|
|
|||||||||||||||||||
| Partnership interests |
|
|
|
|
|||||||||||||||||||
| Total investments, at fair value | $ |
|
$ |
|
|||||||||||||||||||
As of
September 30, 2021, the SPAC’s investment in U.S. Treasury bills exceeded
5.0
%
of the Company’s total assets. The U.S. Treasury bills mature in November 2021 and have an interest yield of approximately
0.06
%. At
December 31, 2020,
no
single issuer or investment, including derivative instruments and underlying portfolio investments of the Consolidated Funds, had a fair value that exceeded
5.0
% of the Company’s total assets.
6. FAIR VALUE
Fair Value Measurements
GAAP establishes a hierarchical disclosure framework that prioritizes the inputs used in measuring financial instruments at fair value into three levels based on their market price observability. Market price observability is affected by a number of factors, including the type of instrument and the characteristics specific to the instrument. Financial instruments with readily available quoted prices from an active market or for which fair value can be measured based on actively quoted prices generally have a higher degree of market price observability and a lesser degree of judgment inherent in measuring fair value.
Financial assets and liabilities measured and reported at fair value are classified as follows:
•
Level I
—Quoted prices in active markets for identical instruments.
•
Level II
—Quoted prices for similar instruments in active markets; quoted prices for identical or similar instruments in inactive markets; and model-derived valuations with directly or indirectly observable significant inputs. Level II inputs include prices in markets with few transactions, non-current prices, prices for which little public information exists or prices that vary substantially over time or among brokered market makers. Other inputs include interest rates, yield curves, volatilities, prepayment risks, loss severities, credit risks and default rates.
•
Level III
—Valuations that rely on one or more significant unobservable inputs. These inputs reflect the Company’s assessment of the assumptions that market participants would use to value the instrument based on the best information available.
In some instances, an instrument may fall into more than one level of the fair value hierarchy. In such instances, the instrument’s level within the fair value hierarchy is based on the lowest of the three levels (with Level III being the lowest) that is significant to the fair value measurement. The Company’s assessment of the significance of an input requires judgment and considers factors specific to the instrument. The Company accounts for the transfer of assets into or out of each fair value hierarchy level as of the beginning of the reporting period.
Contingent consideration:
The Company generally determines the fair value of its contingent consideration liabilities by using a Monte Carlo simulation model. The model considers a range of assumptions including historical experience, prior period performance, current progress towards targets, probability-weighted scenarios, and management's own assumptions. The discount rate used is determined based on the weighted average cost of capital for the Company. The fair value of the
22
Ares Management Corporation
Notes to the Unaudited Condensed Consolidated Financial Statements
(Dollars in Thousands, Except Share Data and As Otherwise Noted)
Fair Value of Financial Instruments Held by the Company and Consolidated Funds
The following tables summarize the financial assets and financial liabilities measured at fair value for the Company and the Consolidated Funds as of September 30, 2021:
| Financial Instruments of the Company | Level I | Level II | Level III |
Investments
Measured at NAV |
Total | |||||||||||||||||||||||||||
|
Assets, at fair value
|
||||||||||||||||||||||||||||||||
|
Investments:
|
||||||||||||||||||||||||||||||||
|
Collateralized loan obligations and other fixed income
|
$ |
|
$ |
|
$ |
|
$ |
|
$ |
|
||||||||||||||||||||||
| Common stock and other equity securities |
|
|
|
|
|
|||||||||||||||||||||||||||
| Partnership interests |
|
|
|
|
|
|||||||||||||||||||||||||||
| Total investments, at fair value |
|
|
|
|
|
|||||||||||||||||||||||||||
| Derivatives-foreign exchange contracts and interest rate contracts |
|
|
|
|
|
|||||||||||||||||||||||||||
| Total assets, at fair value | $ |
|
$ |
|
$ |
|
$ |
|
$ |
|
||||||||||||||||||||||
| Liabilities, at fair value | ||||||||||||||||||||||||||||||||
| Derivatives-foreign exchange contracts |
|
(
|
|
|
(
|
|||||||||||||||||||||||||||
| Contingent consideration |
|
|
(
|
|
(
|
|||||||||||||||||||||||||||
| Total liabilities, at fair value | $ |
|
$ |
(
|
$ |
(
|
$ |
|
$ |
(
|
||||||||||||||||||||||
| Financial Instruments of the Consolidated Funds | Level I | Level II | Level III |
Investments
Measured at NAV |
Total | |||||||||||||||||||||||||||
| Assets, at fair value | ||||||||||||||||||||||||||||||||
| Investments: | ||||||||||||||||||||||||||||||||
| Fixed income investments: | ||||||||||||||||||||||||||||||||
| Bonds | $ |
|
$ |
|
$ |
|
$ |
|
$ |
|
||||||||||||||||||||||
| Loans |
|
|
|
|
|
|||||||||||||||||||||||||||
| U.S. Treasury securities |
|
|
|
|
|
|||||||||||||||||||||||||||
| Investments in CLO warehouse |
|
|
|
|
|
|||||||||||||||||||||||||||
| Total fixed income investments |
|
|
|
|
|
|||||||||||||||||||||||||||
| Equity securities |
|
|
|
|
|
|||||||||||||||||||||||||||
| Partnership interests |
|
|
|
|
|
|||||||||||||||||||||||||||
| Total investments, at fair value | $ |
|
$ |
|
$ |
|
$ |
|
$ |
|
||||||||||||||||||||||
| Derivatives: | ||||||||||||||||||||||||||||||||
| Asset swaps-other |
|
|
|
|
|
|||||||||||||||||||||||||||
| Total derivative assets, at fair value |
|
|
|
|
|
|||||||||||||||||||||||||||
| Total assets, at fair value | $ |
|
$ |
|
$ |
|
$ |
|
$ |
|
||||||||||||||||||||||
| Liabilities, at fair value | ||||||||||||||||||||||||||||||||
| Derivatives: | ||||||||||||||||||||||||||||||||
| Warrants | $ |
(
|
$ |
|
$ |
|
$ |
|
$ |
(
|
||||||||||||||||||||||
| Asset swaps-other |
|
|
(
|
|
(
|
|||||||||||||||||||||||||||
| Total derivative liabilities, at fair value |
(
|
|
(
|
|
(
|
|||||||||||||||||||||||||||
| Loan obligations of CLOs |
|
(
|
|
|
(
|
|||||||||||||||||||||||||||
| Total liabilities, at fair value | $ |
(
|
$ |
(
|
$ |
(
|
$ |
|
$ |
(
|
||||||||||||||||||||||
23
Ares Management Corporation
Notes to the Unaudited Condensed Consolidated Financial Statements
(Dollars in Thousands, Except Share Data and As Otherwise Noted)
The following tables summarize the financial assets and financial liabilities measured at fair value for the Company and the Consolidated Funds as of December 31,2020:
| Financial Instruments of the Company | Level I | Level II | Level III |
Investments
Measured at NAV |
Total | |||||||||||||||||||||||||||
|
Assets, at fair value
|
||||||||||||||||||||||||||||||||
|
Investments:
|
||||||||||||||||||||||||||||||||
|
Collateralized loan obligations and other fixed income
|
$ |
|
$ |
|
$ |
|
$ |
|
$ |
|
||||||||||||||||||||||
| Common stock and other equity securities |
|
|
|
|
|
|||||||||||||||||||||||||||
| Partnership interests |
|
|
|
|
|
|||||||||||||||||||||||||||
| Total investments, at fair value |
|
|
|
|
|
|||||||||||||||||||||||||||
| Derivatives-foreign exchange contracts |
|
|
|
|
|
|||||||||||||||||||||||||||
| Total assets, at fair value | $ |
|
$ |
|
$ |
|
$ |
|
$ |
|
||||||||||||||||||||||
| Liabilities, at fair value | ||||||||||||||||||||||||||||||||
| Derivatives-foreign exchange contracts | $ |
|
$ |
(
|
$ |
|
$ |
|
$ |
(
|
||||||||||||||||||||||
| Total liabilities, at fair value | $ |
|
$ |
(
|
$ |
|
$ |
|
$ |
(
|
||||||||||||||||||||||
| Financial Instruments of the Consolidated Funds | Level I | Level II | Level III |
Investments Measured
at NAV |
Total | |||||||||||||||||||||||||||
| Assets, at fair value | ||||||||||||||||||||||||||||||||
| Investments: | ||||||||||||||||||||||||||||||||
| Fixed income investments: | ||||||||||||||||||||||||||||||||
| Bonds | $ |
|
$ |
|
$ |
|
$ |
|
$ |
|
||||||||||||||||||||||
| Loans |
|
|
|
|
|
|||||||||||||||||||||||||||
| Total fixed income investments |
|
|
|
|
|
|||||||||||||||||||||||||||
| Equity securities |
|
|
|
|
|
|||||||||||||||||||||||||||
| Partnership interests |
|
|
|
|
|
|||||||||||||||||||||||||||
| Total investments, at fair value |
|
|
|
|
|
|||||||||||||||||||||||||||
| Derivatives: | ||||||||||||||||||||||||||||||||
| Asset swaps-other |
|
|
|
|
|
|||||||||||||||||||||||||||
| Total assets, at fair value | $ |
|
$ |
|
$ |
|
$ |
|
$ |
|
||||||||||||||||||||||
| Liabilities, at fair value | ||||||||||||||||||||||||||||||||
| Derivatives: | ||||||||||||||||||||||||||||||||
| Asset swaps-other | $ |
|
$ |
|
$ |
(
|
$ |
|
$ |
(
|
||||||||||||||||||||||
| Loan obligations of CLOs |
|
(
|
|
|
(
|
|||||||||||||||||||||||||||
| Total liabilities, at fair value | $ |
|
$ |
(
|
$ |
(
|
$ |
|
$ |
(
|
||||||||||||||||||||||
24
Ares Management Corporation
Notes to the Unaudited Condensed Consolidated Financial Statements
(Dollars in Thousands, Except Share Data and As Otherwise Noted)
The following tables set forth a summary of changes in the fair value of the Level III measurements for the three months ended September 30, 2021:
| Level III Assets and Liabilities of the Company |
Equity
Securities
|
Fixed Income | Partnership Interests | Contingent Consideration | Total | |||||||||||||||||||||||||||
| Balance, beginning of period | $ |
|
$ |
|
$ |
|
$ |
|
$ |
|
||||||||||||||||||||||
| Established in connection with acquisition |
|
|
|
(
|
(
|
|||||||||||||||||||||||||||
|
Purchases
(1)
|
|
|
|
|
|
|||||||||||||||||||||||||||
|
Sales/settlements
(2)
|
|
(
|
|
|
(
|
|||||||||||||||||||||||||||
| Realized and unrealized appreciation (depreciation), net |
|
|
|
(
|
(
|
|||||||||||||||||||||||||||
| Balance, end of period | $ |
|
$ |
|
$ |
|
$ |
(
|
$ |
|
||||||||||||||||||||||
| Change in net unrealized appreciation/depreciation included in earnings related to financial assets and liabilities still held at the reporting date | $ |
|
$ |
|
$ |
|
$ |
(
|
$ |
(
|
||||||||||||||||||||||
| Level III Net Assets of Consolidated Funds |
Equity
Securities
|
Fixed
Income
|
Partnership
Interests |
Derivatives, Net | Total | |||||||||||||||||||||||||||
| Balance, beginning of period | $ |
|
$ |
|
$ |
|
$ |
(
|
$ |
|
||||||||||||||||||||||
| Transfer in |
|
|
|
|
|
|||||||||||||||||||||||||||
| Transfer out |
|
(
|
|
|
(
|
|||||||||||||||||||||||||||
|
Purchases
(1)
|
|
|
|
|
|
|||||||||||||||||||||||||||
|
Sales/settlements
(2)
|
(
|
(
|
(
|
|
(
|
|||||||||||||||||||||||||||
| Amortized discounts/premiums |
|
|
|
|
|
|||||||||||||||||||||||||||
| Realized and unrealized appreciation (depreciation), net |
|
|
|
(
|
|
|||||||||||||||||||||||||||
| Balance, end of period | $ |
|
$ |
|
$ |
|
$ |
(
|
$ |
|
||||||||||||||||||||||
| Change in net unrealized appreciation/depreciation included in earnings related to financial assets still held at the reporting date | $ |
|
$ |
|
$ |
|
$ |
(
|
$ |
|
||||||||||||||||||||||
(1)
Purchases include paid-in-kind interest and securities received in connection with restructuring.
(2)
Sales/settlements include distributions, principal redemptions and securities disposed of in connection with restructurings.
25
Ares Management Corporation
Notes to the Unaudited Condensed Consolidated Financial Statements
(Dollars in Thousands, Except Share Data and As Otherwise Noted)
The following tables set forth a summary of changes in the fair value of the Level III measurements for the three months ended September 30, 2020:
| Level III Assets of the Company |
Equity
Securities
|
Fixed Income | Partnership Interests | Total | ||||||||||||||||||||||
| Balance, beginning of period | $ |
|
$ |
|
$ |
|
$ |
|
||||||||||||||||||
| Transfer in due to changes in consolidation |
|
|
|
|
||||||||||||||||||||||
|
Purchases
(1)
|
|
|
|
|
||||||||||||||||||||||
|
Sales/settlements
(2)
|
|
(
|
|
(
|
||||||||||||||||||||||
| Realized and unrealized appreciation (depreciation), net |
(
|
|
|
|
||||||||||||||||||||||
| Balance, end of period | $ |
|
$ |
|
$ |
|
$ |
|
||||||||||||||||||
| Change in net unrealized appreciation/depreciation included in earnings related to financial assets still held at the reporting date | $ |
(
|
$ |
|
$ |
|
$ |
|
||||||||||||||||||
| Level III Net Assets of Consolidated Funds |
Equity
Securities
|
Fixed
Income
|
Partnership Interests | Derivatives, Net | Total | |||||||||||||||||||||||||||
| Balance, beginning of period | $ |
|
$ |
|
$ |
|
$ |
|
$ |
|
||||||||||||||||||||||
| Transfer in |
|
|
|
|
|
|||||||||||||||||||||||||||
| Transfer out |
|
(
|
|
|
(
|
|||||||||||||||||||||||||||
|
Purchases
(1)
|
|
|
|
|
|
|||||||||||||||||||||||||||
|
Sales/settlements
(2)
|
(
|
(
|
(
|
|
(
|
|||||||||||||||||||||||||||
| Amortized discounts/premiums |
|
(
|
|
|
|
|||||||||||||||||||||||||||
| Realized and unrealized appreciation (depreciation), net |
|
|
(
|
(
|
|
|||||||||||||||||||||||||||
| Balance, end of period | $ |
|
$ |
|
$ |
|
$ |
|
$ |
|
||||||||||||||||||||||
| Change in net unrealized appreciation/depreciation included in earnings related to financial assets still held at the reporting date | $ |
|
$ |
|
$ |
(
|
$ |
(
|
$ |
|
||||||||||||||||||||||
(1)
Purchases include paid-in-kind interest and securities received in connection with restructurings.
(2)
Sales/settlements include distributions, principal redemptions and securities disposed of in connection with restructurings.
26
Ares Management Corporation
Notes to the Unaudited Condensed Consolidated Financial Statements
(Dollars in Thousands, Except Share Data and As Otherwise Noted)
The following tables set forth a summary of changes in the fair value of the Level III measurements for the nine months ended September 30, 2021:
| Level III Assets and Liabilities of the Company |
Equity
Securities |
Fixed Income | Partnership Interests | Contingent Consideration | Total | |||||||||||||||||||||||||||
| Balance, beginning of period | $ |
|
$ |
|
$ |
|
$ |
|
$ |
|
||||||||||||||||||||||
| Transfer in due to changes in consolidation |
|
|
|
|
|
|||||||||||||||||||||||||||
|
Established in connection with acquisition
|
|
|
|
(
|
(
|
|||||||||||||||||||||||||||
|
Purchases
(1)
|
|
|
|
|
|
|||||||||||||||||||||||||||
|
Sales/settlements
(2)
|
|
(
|
|
|
(
|
|||||||||||||||||||||||||||
| Realized and unrealized appreciation (depreciation), net |
|
|
|
(
|
(
|
|||||||||||||||||||||||||||
| Balance, end of period | $ |
|
$ |
|
$ |
|
$ |
(
|
$ |
|
||||||||||||||||||||||
| Change in net unrealized appreciation/depreciation included in earnings related to financial assets and liabilities still held at the reporting date | $ |
|
$ |
|
$ |
|
$ |
(
|
$ |
(
|
||||||||||||||||||||||
| Level III Net Assets of Consolidated Funds |
Equity
Securities |
Fixed
Income |
Partnership
Interests |
Derivatives, Net | Total | |||||||||||||||||||||||||||
| Balance, beginning of period | $ |
|
$ |
|
$ |
|
$ |
|
$ |
|
||||||||||||||||||||||
| Transfer out due to changes in consolidation |
(
|
(
|
|
|
(
|
|||||||||||||||||||||||||||
| Transfer in |
|
|
|
|
|
|||||||||||||||||||||||||||
| Transfer out |
(
|
(
|
|
|
(
|
|||||||||||||||||||||||||||
|
Purchases
(1)
|
|
|
|
|
|
|||||||||||||||||||||||||||
|
Sales/settlements
(2)
|
(
|
(
|
(
|
|
(
|
|||||||||||||||||||||||||||
| Amortized discounts/premiums |
|
|
|
|
|
|||||||||||||||||||||||||||
| Realized and unrealized appreciation (depreciation), net |
|
|
|
(
|
|
|||||||||||||||||||||||||||
| Balance, end of period | $ |
|
$ |
|
$ |
|
$ |
(
|
$ |
|
||||||||||||||||||||||
| Change in net unrealized appreciation/depreciation included in earnings related to financial assets still held at the reporting date | $ |
|
$ |
|
$ |
|
$ |
(
|
$ |
|
||||||||||||||||||||||
(1)
Purchases include paid-in-kind interest and securities received in connection with restructuring.
(2)
Sales/settlements include distributions, principal redemptions and securities disposed of in connection with restructurings.
27
Ares Management Corporation
Notes to the Unaudited Condensed Consolidated Financial Statements
(Dollars in Thousands, Except Share Data and As Otherwise Noted)
The following tables set forth a summary of changes in the fair value of the Level III measurements for the nine months ended September 30, 2020:
| Level III Assets and Liabilities of the Company |
Equity
Securities |
Fixed Income | Partnership Interests | Total | ||||||||||||||||||||||
| Balance, beginning of period | $ |
|
$ |
|
$ |
|
$ |
|
||||||||||||||||||
| Transfer in due to changes in consolidation |
|
|
|
|
||||||||||||||||||||||
|
Purchases
(1)
|
|
|
|
|
||||||||||||||||||||||
|
Sales/settlements
(2)
|
|
(
|
(
|
(
|
||||||||||||||||||||||
| Realized and unrealized depreciation, net |
(
|
(
|
(
|
(
|
||||||||||||||||||||||
| Balance, end of period | $ |
|
$ |
|
$ |
|
$ |
|
||||||||||||||||||
| Change in net unrealized appreciation/depreciation included in earnings related to financial assets still held at the reporting date | $ |
(
|
$ |
(
|
$ |
|
$ |
|
||||||||||||||||||
| Level III Net Assets of Consolidated Funds |
Equity
Securities |
Fixed
Income |
Partnership Interests | Derivatives, Net | Total | |||||||||||||||||||||||||||
| Balance, beginning of period | $ |
|
$ |
|
$ |
|
$ |
(
|
$ |
|
||||||||||||||||||||||
| Transfer in (out) due to changes in consolidation |
(
|
|
|
|
|
|||||||||||||||||||||||||||
| Transfer in |
|
|
|
|
|
|||||||||||||||||||||||||||
| Transfer out |
|
(
|
|
|
(
|
|||||||||||||||||||||||||||
|
Purchases
(1)
|
|
|
|
|
|
|||||||||||||||||||||||||||
|
Sales/settlements
(2)
|
(
|
(
|
(
|
|
(
|
|||||||||||||||||||||||||||
| Amortized discounts/premiums |
|
|
|
|
|
|||||||||||||||||||||||||||
| Realized and unrealized appreciation (depreciation), net |
(
|
(
|
|
|
(
|
|||||||||||||||||||||||||||
| Balance, end of period | $ |
|
$ |
|
$ |
|
$ |
|
$ |
|
||||||||||||||||||||||
| Change in net unrealized appreciation/depreciation included in earnings related to financial assets still held at the reporting date | $ |
(
|
$ |
(
|
$ |
|
$ |
|
$ |
(
|
||||||||||||||||||||||
(1)
Purchases include paid-in-kind interest and securities received in connection with restructurings.
(2)
Sales/settlements include distributions, principal redemptions and securities disposed of in connection with restructurings.
Transfers out of Level III were generally attributable to certain investments that experienced a more significant level of market activity during the period and thus were valued using observable inputs either from independent pricing services or multiple brokers. Transfers into Level III were generally attributable to certain investments that experienced a less significant level of market activity during the period and thus were only able to obtain one or fewer quotes from a broker or independent pricing service.
28
Ares Management Corporation
Notes to the Unaudited Condensed Consolidated Financial Statements
(Dollars in Thousands, Except Share Data and As Otherwise Noted)
The following tables summarize the quantitative inputs and assumptions used for the Company’s and the Consolidated Funds' Level III measurements as of
September 30, 2021
:
| Level III Measurements of the Company | Fair Value | Valuation Technique(s) | Significant Unobservable Input(s) | Range | Weighted Average | |||||||||||||||||||||||||||
| Assets | ||||||||||||||||||||||||||||||||
| Equity securities | $ |
|
Transaction price
(1)
|
N/A | N/A | N/A | ||||||||||||||||||||||||||
|
|
Discounted cash flow | Discount Rates |
|
|
||||||||||||||||||||||||||||
|
|
Market approach | Multiple of Book Value |
|
N/A | ||||||||||||||||||||||||||||
| Partnership interests |
|
Other | N/A | N/A | N/A | |||||||||||||||||||||||||||
| Collateralized loan obligations |
|
Broker quotes and/or 3rd party pricing services | N/A | N/A | N/A | |||||||||||||||||||||||||||
| Other fixed income |
|
Other | N/A | N/A | N/A | |||||||||||||||||||||||||||
| Total assets | $ |
|
||||||||||||||||||||||||||||||
| Liabilities | ||||||||||||||||||||||||||||||||
| Contingent consideration | $ |
(
|
Monte Carlo simulation | Discount Rates |
|
N/A | ||||||||||||||||||||||||||
| Volatility |
|
N/A | ||||||||||||||||||||||||||||||
| $ |
(
|
Other | N/A | N/A | N/A | |||||||||||||||||||||||||||
| Total liabilities | $ |
(
|
||||||||||||||||||||||||||||||
| Level III Measurements of the Consolidated Funds | Fair Value | Valuation Technique(s) | Significant Unobservable Input(s) | Range | Weighted Average | |||||||||||||||||||||||||||
| Assets | ||||||||||||||||||||||||||||||||
| Equity securities | ||||||||||||||||||||||||||||||||
| $ |
|
Market approach |
EBITDA multiple
(2)
|
|
|
|||||||||||||||||||||||||||
|
|
Broker quotes and/or 3rd party pricing services | N/A | N/A | N/A | ||||||||||||||||||||||||||||
|
|
Transaction price
(1)
|
N/A | N/A | N/A | ||||||||||||||||||||||||||||
| Partnership interest |
|
Discounted cash flow | Discount rate |
|
|
|||||||||||||||||||||||||||
| Fixed income securities | ||||||||||||||||||||||||||||||||
|
|
Broker quotes and/or 3rd party pricing services | N/A | N/A | N/A | ||||||||||||||||||||||||||||
|
|
Income approach |
Yield
|
|
|
||||||||||||||||||||||||||||
|
|
Transaction price | N/A | N/A | N/A | ||||||||||||||||||||||||||||
|
|
Other
|
N/A | N/A | N/A | ||||||||||||||||||||||||||||
| Derivative instruments |
|
Broker quotes and/or 3rd party pricing services | N/A | N/A | N/A | |||||||||||||||||||||||||||
| Total assets | $ |
|
||||||||||||||||||||||||||||||
| Liabilities | ||||||||||||||||||||||||||||||||
| Derivative instruments | $ |
(
|
Broker quotes and/or 3rd party pricing services | N/A | N/A | N/A | ||||||||||||||||||||||||||
| Total liabilities | $ |
(
|
||||||||||||||||||||||||||||||
(1)
Transaction price consists of securities purchased or restructured. The Company determined that there was no change to the valuation based on the underlying assumptions used at the closing of such transactions.
(2)
“EBITDA” in the table above is a non-GAAP financial measure and refers to earnings before interest, tax, depreciation and amortization.
29
Ares Management Corporation
Notes to the Unaudited Condensed Consolidated Financial Statements
(Dollars in Thousands, Except Share Data and As Otherwise Noted)
The following tables summarize the quantitative inputs and assumptions used for the Company’s and the Consolidated Funds' Level III measurements as of December 31, 2020:
| Level III Measurements of the Company | Fair Value | Valuation Technique(s) | Significant Unobservable Input(s) | Range | ||||||||||||||||||||||
| Assets | ||||||||||||||||||||||||||
| Equity securities | $ |
|
Transaction price
(1)
|
N/A | N/A | |||||||||||||||||||||
|
|
Discounted Cash Flow | Discount Rates |
|
|||||||||||||||||||||||
|
|
Market Approach | Multiple of Book Value |
|
|||||||||||||||||||||||
| Partnership interests |
|
Other | N/A | N/A | ||||||||||||||||||||||
| Collateralized loan obligations |
|
Broker quotes and/or 3rd party pricing services | N/A | N/A | ||||||||||||||||||||||
| Other fixed income |
|
Other | N/A | N/A | ||||||||||||||||||||||
| Total | $ |
|
||||||||||||||||||||||||
| Level III Measurements of the Consolidated Funds | Fair Value | Valuation Technique(s) | Significant Unobservable Input(s) | Range | Weighted Average | |||||||||||||||||||||||||||
| Assets | ||||||||||||||||||||||||||||||||
| Equity securities | ||||||||||||||||||||||||||||||||
| $ |
|
Market approach |
EBITDA multiple
(2)
|
|
|
|||||||||||||||||||||||||||
|
|
Other | Net income multiple |
|
|
||||||||||||||||||||||||||||
| Illiquidity discount |
|
|
||||||||||||||||||||||||||||||
|
|
Broker quotes and/or 3rd party pricing services | N/A | N/A | N/A | ||||||||||||||||||||||||||||
|
|
Transaction price
(1)
|
N/A | N/A | N/A | ||||||||||||||||||||||||||||
| Partnership interests |
|
Discounted cash flow | Discount rate |
|
|
|||||||||||||||||||||||||||
| Fixed income securities | ||||||||||||||||||||||||||||||||
|
|
Broker quotes and/or 3rd party pricing services | N/A | N/A | N/A | ||||||||||||||||||||||||||||
|
|
Market approach |
EBITDA multiple
(2)
|
|
|
||||||||||||||||||||||||||||
|
|
Income approach | Yield |
|
|
||||||||||||||||||||||||||||
|
|
Other | N/A | N/A | N/A | ||||||||||||||||||||||||||||
| Derivative instruments |
|
Broker quotes and/or 3rd party pricing services | N/A | N/A | N/A | |||||||||||||||||||||||||||
| Total assets | $ |
|
||||||||||||||||||||||||||||||
| Liabilities | ||||||||||||||||||||||||||||||||
| Derivative instruments | $ |
(
|
Broker quotes and/or 3rd party pricing services | N/A | N/A | N/A | ||||||||||||||||||||||||||
| Total liabilities | $ |
(
|
||||||||||||||||||||||||||||||
(1)
Transaction price consists of securities purchased or restructured. The Company determined that there has been no change to the valuation based on the underlying assumptions used at the closing of such transactions.
(2)
“EBITDA” in the table above is a non-GAAP financial measure and refers to earnings before interest, tax, depreciation and amortization.
30
Ares Management Corporation
Notes to the Unaudited Condensed Consolidated Financial Statements
(Dollars in Thousands, Except Share Data and As Otherwise Noted)
7. DERIVATIVE FINANCIAL INSTRUMENTS
In the normal course of business, the Company and the Consolidated Funds are exposed to certain risks relating to their ongoing operations and use various types of derivative instruments primarily to mitigate against credit and foreign exchange risk. The derivative instruments are not designated as hedging instruments under the accounting standards for derivatives and hedging. The Company recognizes all of its derivative instruments at fair value as either assets or liabilities in the Condensed Consolidated Statements of Financial Condition within other assets or accounts payable, accrued expenses and other liabilities, respectively. These amounts may be offset to the extent that there is a legal right to offset and if elected by management.
The following tables identify the fair value and notional amounts of derivative contracts by major product type on a gross basis for the Company and the Consolidated Funds:
| As of September 30, 2021 | As of December 31, 2020 | |||||||||||||||||||||||||||||||||||||||||||||||||
| Assets | Liabilities | Assets | Liabilities | |||||||||||||||||||||||||||||||||||||||||||||||
| The Company |
Notional
(1)
|
Fair Value |
Notional
(1)
|
Fair Value |
Notional
(1)
|
Fair Value |
Notional
(1)
|
Fair Value | ||||||||||||||||||||||||||||||||||||||||||
| Foreign exchange contracts | $ |
|
$ |
|
$ |
|
$ |
|
$ |
|
$ |
|
$ |
|
$ |
|
||||||||||||||||||||||||||||||||||
| Interest rate contracts |
|
|
|
|
|
|
|
|
||||||||||||||||||||||||||||||||||||||||||
|
Total derivatives, at fair value
(2)
|
$ |
|
$ |
|
$ |
|
$ |
|
$ |
|
$ |
|
$ |
|
$ |
|
||||||||||||||||||||||||||||||||||
| As of September 30, 2021 | As of December 31, 2020 | |||||||||||||||||||||||||||||||||||||||||||||||||
| Assets | Liabilities | Assets | Liabilities | |||||||||||||||||||||||||||||||||||||||||||||||
| Consolidated Funds |
Notional
(1)
|
Fair Value |
Notional
(1)
|
Fair Value |
Notional
(1)
|
Fair Value |
Notional
(1)
|
Fair Value | ||||||||||||||||||||||||||||||||||||||||||
| Warrants | $ |
|
$ |
|
$ |
|
$ |
|
$ |
|
$ |
|
$ |
|
$ |
|
||||||||||||||||||||||||||||||||||
| Asset swap - other |
|
|
|
|
|
|
|
|
||||||||||||||||||||||||||||||||||||||||||
|
Total derivatives, at fair value
(3)
|
$ |
|
$ |
|
$ |
|
$ |
|
$ |
|
$ |
|
$ |
|
$ |
|
||||||||||||||||||||||||||||||||||
(1)
Represents the total contractual amount of derivative assets and liabilities outstanding.
(2)
As of September 30, 2021 and December 31, 2020, the Company had the right to, but elected not to, offset $
0.3
million and $
1.6
million of its derivative liabilities.
(3)
As of September 30, 2021 and December 31, 2020, the Consolidated Funds offset $
0.3
million and $
0.4
million of their derivative assets and liabilities, respectively.
31
Ares Management Corporation
Notes to the Unaudited Condensed Consolidated Financial Statements
(Dollars in Thousands, Except Share Data and As Otherwise Noted)
8. DEBT
The following table summarizes the Company’s and its subsidiaries’ debt obligations:
| As of September 30, 2021 | As of December 31, 2020 | ||||||||||||||||||||||||||||||||||||||||
| Debt Origination Date | Maturity | Original Borrowing Amount |
Carrying
Value |
Interest Rate |
Carrying
Value |
Interest Rate | |||||||||||||||||||||||||||||||||||
|
Credit Facility
(1)
|
Revolver | 3/31/2026 | N/A | $ |
|
|
$ |
|
|
||||||||||||||||||||||||||||||||
|
2024 Senior Notes
(2)
|
10/8/2014 | 10/8/2024 | $ |
|
|
|
|
|
|||||||||||||||||||||||||||||||||
|
2030 Senior Notes
(3)
|
6/15/2020 | 6/15/2030 |
|
|
|
|
|
||||||||||||||||||||||||||||||||||
|
2051 Subordinated Notes
(4)
|
6/30/2021 | 6/30/2051 |
|
|
|
|
|
||||||||||||||||||||||||||||||||||
| Total debt obligations | $ |
|
$ |
|
|||||||||||||||||||||||||||||||||||||
(1)
The AOG entities are borrowers under the Credit Facility, which provides a $
1.090
billion revolving line of credit. It has a variable interest rate based on LIBOR or a base rate plus an applicable margin with an unused commitment fee paid quarterly, which is subject to change with the Company’s underlying credit agency rating. On March 31, 2021, the Company amended the Credit Facility to, among other things, extend the maturity date from March 2025 to March 2026. As of September 30, 2021, base rate loans bear interest calculated based on the base rate plus
0.125
% and the LIBOR rate loans bear interest calculated based on LIBOR plus
1.125
%. The unused commitment fee is
0.10
% per annum. There is a base rate and LIBOR floor of
zero
.
(2)
The 2024 Senior Notes were issued in October 2014 by Ares Finance Co. LLC, an indirect subsidiary of the Company, at
98.27
% of the face amount with interest paid semi-annually. The Company may redeem the 2024 Senior Notes prior to maturity, subject to the terms of the indenture governing the 2024 Notes.
(3)
The 2030 Senior Notes were issued in June 2020 by Ares Finance Co. II LLC, an indirect subsidiary of the Company, at
99.77
% of the face amount with interest paid semi-annually. The Company may redeem the 2030 Senior Notes prior to maturity, subject to the terms of the indenture governing the 2030 Notes.
(4)
The 2051 Subordinated Notes were issued in June 2021 by Ares Finance Co. III LLC, an indirect subsidiary of the Company, at
100.00
% of par with interest paid semi-annually at a fixed-rate of
4.125
%. Beginning June 30, 2026, the interest rate will reset on every fifth year based on the five-year U.S. Treasury Rate plus
3.237
%. The Company may redeem the 2051 Subordinated Notes prior to maturity or defer interest payments up to
consecutive years, subject to the terms of the indenture governing the 2051 Subordinated Notes.
As of September 30, 2021, the Company and its subsidiaries were in compliance with all covenants under the debt obligations.
The Company typically incurs and pays debt issuance costs when entering into a new debt obligation or when amending an existing debt agreement. Debt issuance costs related to the 2024 and 2030 Senior Notes (the “Senior Notes”) and 2051 Subordinated Notes are recorded as a reduction of the corresponding debt obligation, and debt issuance costs related to the Credit Facility are included in other assets in the Condensed Consolidated Statements of Financial Condition. All debt issuance costs are amortized over the remaining term of the related obligation into interest expense in the Condensed Consolidated Statements of Operations.
The following table presents the activity of the Company's debt issuance costs:
| Credit Facility |
Senior
Notes |
Subordinated Notes | |||||||||||||||
| Unamortized debt issuance costs as of December 31, 2020 | $ |
|
$ |
|
$ |
|
|||||||||||
| Debt issuance costs incurred |
|
|
|
||||||||||||||
| Amortization of debt issuance costs |
(
|
(
|
(
|
||||||||||||||
| Unamortized debt issuance costs as of September 30, 2021 | $ |
|
$ |
|
$ |
|
|||||||||||
Loan Obligations of the Consolidated CLOs
Loan obligations of the Consolidated Funds that are CLOs (“Consolidated CLOs”) represent amounts due to holders of debt securities issued by the Consolidated CLOs. The Company measures the loan obligations of the Consolidated CLOs using the fair value of the financial assets of its Consolidated CLOs.
32
Ares Management Corporation
Notes to the Unaudited Condensed Consolidated Financial Statements
(Dollars in Thousands, Except Share Data and As Otherwise Noted)
The following loan obligations were outstanding and classified as liabilities of the Consolidated CLOs:
| As of September 30, 2021 | As of December 31, 2020 | ||||||||||||||||||||||||||||||||||
|
Loan
Obligations |
Fair Value of
Loan Obligations |
Weighted
Average Remaining Maturity In Years |
Loan
Obligations |
Fair Value of Loan Obligations |
Weighted
Average Remaining Maturity In Years |
||||||||||||||||||||||||||||||
|
Senior secured notes
(1)
|
$ |
|
$ |
|
|
$ |
|
$ |
|
|
|||||||||||||||||||||||||
|
Subordinated notes
(2)
|
|
|
|
|
|
|
|||||||||||||||||||||||||||||
| Total loan obligations of Consolidated CLOs | $ |
|
$ |
|
$ |
|
$ |
|
|||||||||||||||||||||||||||
(1)
Original borrowings under the senior secured notes totaled $
9.6
billion, with various maturity dates ranging from September 2026 to July 2034. The weighted average interest rate as of September 30, 2021 was
1.96
%.
(2)
Original borrowings under the subordinated notes totaled $
723.6
million, with various maturity dates ranging from September 2026 to July 2034. The notes do not have contractual interest rates; instead, holders of the notes receive distributions from the excess cash flows generated by each Consolidated CLO.
Loan obligations of the Consolidated CLOs are collateralized by the assets held by the Consolidated CLOs, consisting of cash and cash equivalents, corporate loans, corporate bonds and other securities. The assets of one Consolidated CLO may not be used to satisfy the liabilities of another Consolidated CLO. Loan obligations of the Consolidated CLOs include floating rate notes, deferrable floating rate notes, revolving lines of credit and subordinated notes. Amounts borrowed under the notes are repaid based on available cash flows subject to priority of payments under each Consolidated CLO’s governing documents. Based on the terms of these facilities, the creditors of the facilities have no recourse to the Company.
Credit Facilities of the Consolidated Funds
Certain Consolidated Funds maintain credit facilities to fund investments between capital drawdowns. These facilities generally are collateralized by the unfunded capital commitments of the Consolidated Funds’ limited partners, bear an annual commitment fee based on unfunded commitments and contain various affirmative and negative covenants and reporting obligations, including restrictions on additional indebtedness, liens, margin stock, affiliate transactions, dividends and distributions, release of capital commitments and portfolio asset dispositions. The creditors of these facilities have no recourse to the Company and only have recourse to a subsidiary of the Company to the extent the debt is guaranteed by such subsidiary. As of September 30, 2021 and December 31, 2020, the Consolidated Funds were in compliance with all covenants under such credit facilities.
The Consolidated Funds had the following revolving bank credit facilities and term loan outstanding:
| As of September 30, 2021 | As of December 31, 2020 | ||||||||||||||||||||||||||||||||||||||||
| Consolidated Funds' Debt Facilities | Maturity Date | Total Capacity |
Outstanding
Loan
(1)
|
Effective Rate |
Outstanding Loan
(1)
|
Effective Rate | |||||||||||||||||||||||||||||||||||
| Credit Facilities: | |||||||||||||||||||||||||||||||||||||||||
| 3/4/2022 | $ |
|
$ |
|
|
$ |
|
|
|||||||||||||||||||||||||||||||||
| 7/1/2023 |
|
|
|
|
|
||||||||||||||||||||||||||||||||||||
|
1/15/2022
(2)
|
|
|
|
|
|
||||||||||||||||||||||||||||||||||||
| 7/23/2024 |
|
|
|
N/A | N/A | ||||||||||||||||||||||||||||||||||||
| 9/24/2026 |
|
|
N/A | N/A | N/A | ||||||||||||||||||||||||||||||||||||
| Total borrowings of Consolidated Funds | $ |
|
$ |
|
|||||||||||||||||||||||||||||||||||||
(1)
The fair values of the borrowings approximate the carrying value as the interest rate on the borrowings is a floating rate.
(2)
On July 23, 2021, the credit facility was terminated at the Consolidated Fund’s discretion.
33
Ares Management Corporation
Notes to the Unaudited Condensed Consolidated Financial Statements
(Dollars in Thousands, Except Share Data and As Otherwise Noted)
9. COMMITMENTS AND CONTINGENCIES
Indemnification Arrangements
Consistent with standard business practices in the normal course of business, the Company enters into contracts that contain indemnities for affiliates of the Company, persons acting on behalf of the Company or such affiliates and third parties. The terms of the indemnities vary from contract to contract and the Company’s maximum exposure under these arrangements cannot be determined and has not been recorded in the Condensed Consolidated Statements of Financial Condition. As of September 30, 2021, the Company has not had prior claims or losses pursuant to these contracts and expects the risk of loss to be remote.
Commitments
As of September 30, 2021 and December 31, 2020, the Company had aggregate unfunded commitments to invest in funds it manages or to support certain strategic initiatives of $
732.8
million and $
784.2
million, respectively.
Contingent Liabilities
In connection with the Landmark Acquisition, the Company established a management incentive program (the “Landmark MIP”) with certain professionals of Landmark. The Landmark MIP represents a contingent liability not to exceed $
300.0
million and is based on the achievement of fundraising targets for certain Landmark funds during a measurement period.
The Company expects to settle this liability with a combination of
15
% cash and
85
% equity awards. Expense associated with the cash component is recognized ratably over the measurement period, which will end on the earlier of the final fundraising date or December 31, 2022. Expense associated with the equity component is recognized ratably over the service period, which will continue for four years beyond the measurement period end date. The Landmark MIP is remeasured each period with incremental changes in fair value included within compensation and benefits expense within the Condensed Consolidated Statements of Operations. At the measurement period end date, the cash component will be paid and restricted units for the balance of the Landmark MIP will be granted at fair value. The unpaid liability at the measurement period end date will be reclassified from liability to additional paid-in-capital and any difference between the fair value of the Landmark MIP at the measurement period end date and the previously recorded compensation expense will be recognized over the remaining
four year
service period as equity-based compensation expense. As of September 30, 2021, the fair value of the contingent liability was estimated to be $
236.0
million. Compensation expense of $
14.7
million and $
19.3
million for the three months ended September 30, 2021 and for the period from June 2, 2021 through September 30, 2021, respectively, was recorded in the Condensed Consolidated Statements of Operations.
The purchase agreement with Black Creek contains provisions obligating the Company to make payments in an aggregate amount not to exceed $
275.0
million to certain senior professionals and advisors upon the achievement of certain revenue targets through a measurement period no later than December 31, 2024. Because these future payments require continued service through the measurement period, this consideration is accounted for as compensation expense instead of as purchase consideration. The fair value of this contingent liability is remeasured at each reporting date with compensation expense recorded ratably over the service period, which is the Black Creek Acquisition date through the measurement period end date. As of September 30, 2021, the fair value of the contingent liability was $
206.7
million and the Company recorded a contingent liability of $
13.5
million
within accrued compensation in the Consolidated Statements of Financial Condition. For the three months ended September 30 2021, compensation expense of $
13.5
million was recorded within compensation and benefits expense within the Condensed Consolidated Statements of Operations.
The purchase agreement with Black Creek also contains a provision obligating the Company to make a payment to the sellers equal to
50
% of the performance income realized for certain Black Creek funds for the year ended December 31, 2021. The fair value of this contingent obligation as of the acquisition date was $
28.6
million. The contingent obligation is subject to remeasurement until settlement and changes in fair value from the acquisition date are recorded within other income (expense), net within the Condensed Consolidated Statements of Operations. As of September 30, 2021, the fair value of the contingent obligation was $
32.8
million and recorded within due to affiliates within the Consolidated Statements of Financial Condition.
34
Ares Management Corporation
Notes to the Unaudited Condensed Consolidated Financial Statements
(Dollars in Thousands, Except Share Data and As Otherwise Noted)
Performance Income
Performance income is affected by changes in the fair values of the underlying investments in the funds that are advised by the Company. Valuations, on an unrealized basis, can be significantly affected by a variety of external factors including, but not limited to, public equity market volatility, industry trading multiples and interest rates. Generally, if at the termination of a fund (and increasingly at interim points in the life of a fund), the fund has not achieved investment returns that (in most cases) exceed the preferred return threshold or (in all cases) the general partner receives net profits over the life of the fund in excess of its allocable share under the applicable partnership agreement, the Company will be obligated to repay carried interest that was received by the Company in excess of the amounts to which the Company is entitled. This contingent obligation is normally reduced by income taxes paid by the Company related to its carried interest.
Senior professionals of the Company who have received carried interest distributions are responsible for funding their proportionate share of any contingent repayment obligations. However, the governing agreements of certain of the Company's funds provide that if a current or former professional does not fund his or her respective share for such fund, then the Company may have to fund additional amounts beyond what was received in carried interest, although the Company will generally retain the right to pursue any remedies under such governing agreements against those carried interest recipients who fail to fund their obligations.
Additionally, at the end of the life of the funds there could be a payment due to a fund by the Company if the Company has recognized more performance income than was ultimately earned. The general partner obligation amount, if any, will depend on final realized values of investments at the end of the life of the fund.
At September 30, 2021 and December 31, 2020, if the Company assumed all existing investments were worthless, the amount of performance income subject to potential repayment, net of tax distributions, which may differ from the recognition of revenue, would have been approximately $
202.3
million and $
326.4
million, respectively, of which approximately $
158.0
million and $
252.4
million, respectively, is reimbursable to the Company by certain professionals who are the recipients of such performance income. Management believes the possibility of all of the investments becoming worthless is remote. As of September 30, 2021 and December 31, 2020, if the funds were liquidated at their fair values, there would be
no
contingent repayment obligation or liability.
Litigation
From time to time, the Company is named as a defendant in legal actions relating to transactions conducted in the ordinary course of business. Although there can be no assurance of the outcome of such legal actions, in the opinion of management, the Company does not have a potential liability related to any current legal proceeding or claim that would individually or in the aggregate materially affect its results of operations, financial condition or cash flows.
Leases
The Company leases office space and certain office equipment. The Company's leases have remaining lease terms of
to
twelve years
.
The tables below present certain supplemental quantitative disclosures regarding the Company's leases:
| As of September 30, | As of December 31, | |||||||||||||||||||
| Classification | 2021 | 2020 | ||||||||||||||||||
| Operating lease assets | Right-of-use operating lease assets | $ |
|
$ |
|
|||||||||||||||
| Finance lease assets |
|
|
|
|||||||||||||||||
| Total lease assets | $ |
|
$ |
|
||||||||||||||||
| Operating lease liabilities | Operating lease liabilities | $ |
|
$ |
|
|||||||||||||||
| Finance lease obligations |
|
|
||||||||||||||||||
| Total lease liabilities | $ |
|
$ |
|
||||||||||||||||
(1) Finance lease assets are recorded net of accumulated amortization of $
1.4
million and $
1.0
million as of September 30, 2021 and December 31, 2020, respectively.
35
Ares Management Corporation
Notes to the Unaudited Condensed Consolidated Financial Statements
(Dollars in Thousands, Except Share Data and As Otherwise Noted)
| Maturity of lease liabilities | Operating Leases | Finance Leases | ||||||||||||
| 2021 | $ |
|
$ |
|
||||||||||
| 2022 |
|
|
||||||||||||
| 2023 |
|
|
||||||||||||
| 2024 |
|
|
||||||||||||
| 2025 |
|
|
||||||||||||
| After 2025 |
|
|
||||||||||||
| Total future payments |
|
|
||||||||||||
| Less: interest |
|
|
||||||||||||
| Total lease liabilities | $ |
|
$ |
|
||||||||||
| Three months ended September 30, | Nine months ended September 30, | |||||||||||||||||||||||||||||||
| Classification | 2021 | 2020 | 2021 | 2020 | ||||||||||||||||||||||||||||
| Operating lease expense | General, administrative and other expenses | $ |
|
$ |
|
$ |
|
$ |
|
|||||||||||||||||||||||
| Finance lease expense: | ||||||||||||||||||||||||||||||||
| Amortization of finance lease assets | General, administrative and other expenses |
|
|
|
|
|||||||||||||||||||||||||||
| Interest on finance lease liabilities | Interest expense |
|
|
|
|
|||||||||||||||||||||||||||
| Total lease expense | $ |
|
$ |
|
$ |
|
$ |
|
||||||||||||||||||||||||
| Nine months ended September 30, | ||||||||||||||
| Other information | 2021 | 2020 | ||||||||||||
| Cash paid for amounts included in the measurement of lease liabilities: | ||||||||||||||
| Operating cash flows for operating leases | $ |
|
$ |
|
||||||||||
| Operating cash flows for finance leases |
|
|
||||||||||||
| Financing cash flows for finance leases |
|
|
||||||||||||
| Leased assets obtained in exchange for new finance lease liabilities |
|
|
||||||||||||
| Leased assets obtained in exchange for new operating lease liabilities |
|
|
||||||||||||
| As of September 30, | As of December 31, | |||||||||||||
| Lease term and discount rate | 2021 | 2020 | ||||||||||||
| Weighted-average remaining lease terms (in years): | ||||||||||||||
| Operating leases |
|
|
||||||||||||
| Finance leases |
|
|
||||||||||||
| Weighted-average discount rate: | ||||||||||||||
| Operating leases |
|
% |
|
% | ||||||||||
| Finance leases |
|
% |
|
% | ||||||||||
10. RELATED PARTY TRANSACTIONS
Substantially all of the Company’s revenue is earned from its affiliates, including management fees, carried interest allocation, incentive fees, principal investment income and administrative expense reimbursements. The related accounts receivable are included within due from affiliates within the Condensed Consolidated Statements of Financial Condition, except that accrued carried interest allocations, which is predominantly due from affiliated funds, is presented separately within investments in the Condensed Consolidated Statements of Financial Condition.
The Company has investment management agreements with the Ares Funds that it manages. In accordance with these agreements, these Ares Funds may bear certain operating costs and expenses which are initially paid by the Company and subsequently reimbursed by the Ares Funds.
The Company also has entered into agreements to be reimbursed for its expenses incurred for providing administrative services to certain related parties, including ARCC, ACRE, ARDC, Ivy Hill Asset Management, L.P., ACF FinCo I L.P. and
36
Ares Management Corporation
Notes to the Unaudited Condensed Consolidated Financial Statements
(Dollars in Thousands, Except Share Data and As Otherwise Noted)
CION Ares Diversified Credit Fund. As a result of the Black Creek Acquisition, the Company is party to agreements with each Black Creek fund to provide various services, such as administration, acquisition, development and property management, among others.
Employees and other related parties may be permitted to participate in co-investment vehicles that generally invest in Ares funds alongside fund investors. Participation is limited by law to individuals who qualify under applicable securities laws. These co-investment vehicles generally do not require these individuals to pay management fees or performance income.
Performance income from the funds can be distributed to professionals or their related entities on a current basis, subject, in the case of carried interest programs, to repayment by the subsidiary of the Company that acts as general partner of the relevant fund in the event that certain specified return thresholds are not ultimately achieved. The professionals have personally guaranteed, subject to certain limitations, the obligations of these subsidiaries in respect of this general partner obligation. Such guarantees are several, and not joint, and are limited to distributions received by the relevant recipient.
The Company considers its professionals and non-consolidated funds to be affiliates. Amounts due from and to affiliates were composed of the following:
| As of September 30, | As of December 31, | ||||||||||
| 2021 | 2020 | ||||||||||
| Due from affiliates: | |||||||||||
| Management fees receivable from non-consolidated funds | $ |
|
$ |
|
|||||||
| Incentive fee receivable from non-consolidated funds |
|
|
|||||||||
| Payments made on behalf of and amounts due from non-consolidated funds and employees |
|
|
|||||||||
| Due from affiliates—Company | $ |
|
$ |
|
|||||||
| Amounts due from portfolio companies and non-consolidated funds | $ |
|
$ |
|
|||||||
| Due from affiliates—Consolidated Funds | $ |
|
$ |
|
|||||||
| Due to affiliates: | |||||||||||
| Management fee received in advance and rebates payable to non-consolidated funds | $ |
|
$ |
|
|||||||
| Tax receivable agreement liability |
|
|
|||||||||
| Undistributed carried interest and incentive fees |
|
|
|||||||||
| Payments made by non-consolidated funds on behalf of and payable by the Company |
|
|
|||||||||
| Due to affiliates—Company | $ |
|
$ |
|
|||||||
Due from Ares Funds and Portfolio Companies
In the normal course of business, the Company pays certain expenses on behalf of Consolidated Funds and non-consolidated funds for which it is reimbursed. Amounts advanced on behalf of Consolidated Funds are eliminated in consolidation. Certain expenses initially paid by the Company, primarily professional services, travel and other costs associated with particular portfolio company holdings, are subject to reimbursement by the portfolio companies.
11. INCOME TAXES
The Company’s income tax provision includes corporate income taxes and other entity level income taxes, as well as income taxes incurred by certain affiliated funds that are consolidated in these financial statements. For the three and nine months ended September 30, 2021, the Company recorded income tax expense of $
30.3
million and $
104.5
million. For the three and nine months ended September 30, 2020, the Company recorded income tax expense of $
18.3
million and $
22.1
million, respectively.
The Company’s effective income tax rate is dependent on many factors, including the estimated nature and amounts of income and expenses allocated to the non-controlling interests without being subject to federal, state and local income taxes at the corporate level. Additionally, the Company’s effective tax rate is influenced by the amount of income tax provision recorded for any affiliated funds and co-investment entities that are consolidated in the Company's condensed consolidated financial statements. For the three and nine months ended September 30, 2021 and 2020, the Company recorded its interim income tax provision utilizing the estimated annual effective tax rate.
37
Ares Management Corporation
Notes to the Unaudited Condensed Consolidated Financial Statements
(Dollars in Thousands, Except Share Data and As Otherwise Noted)
The income tax effects of temporary differences give rise to significant portions of deferred tax assets and liabilities, which are presented on a net basis. As of September 30, 2021 and December 31, 2020, the Company recorded a net deferred tax asset of $
29.9
million and $
70.0
million, respectively, within other assets in the Condensed Consolidated Statements of Financial Condition.
The Company files its tax returns as prescribed by the tax laws of the jurisdictions in which it operates. In the normal course of business, the Company is subject to examination by U.S. federal, state, local and foreign tax authorities. With limited exceptions, the Company is no longer subject to income tax audits by taxing authorities for any years prior to 2017. Although the outcome of tax audits is always uncertain, the Company does not believe the outcome of any future audit will have a material adverse effect on the Company’s condensed consolidated financial statements.
12. EARNINGS PER SHARE
For the three and nine months ended September 30, 2021, the Company had Class A and non-voting common stock outstanding. The non-voting common stock has the same economic rights as the Class A common stock; therefore, earnings per share is presented on a combined basis. Income of the Company has been allocated on a proportionate basis to the two common stock classes. Additional information on the issuance of the non-voting common stock is discussed in “Note 14. Equity and Redeemable Interests.”
Basic earnings per share of Class A and non-voting common stock is computed by using the two-class method. Diluted earnings per share of Class A and non-voting common stock is computed using the more dilutive method of either the two-class method or the treasury stock method.
For the three and nine months ended September 30, 2021 and the three months ended September 30, 2020, the treasury stock method was the more dilutive method. For the nine months ended September 30, 2020, the two-class method was the more dilutive method.
The computation of diluted earnings per share for the three and nine months ended September 30, 2021 and 2020 excludes the following restricted units and AOG units, as their effect would have been anti-dilutive:
| Three months ended September 30, | Nine months ended September 30, | ||||||||||||||||||||||
| 2021 | 2020 | 2021 | 2020 | ||||||||||||||||||||
| Restricted units |
|
|
|
|
|||||||||||||||||||
| AOG Units |
|
|
|
|
|||||||||||||||||||
38
Ares Management Corporation
Notes to the Unaudited Condensed Consolidated Financial Statements
(Dollars in Thousands, Except Share Data and As Otherwise Noted)
The following table presents the computation of basic and diluted earnings per common share:
| Three months ended September 30, | Nine months ended September 30, | ||||||||||||||||||||||
| 2021 | 2020 | 2021 | 2020 | ||||||||||||||||||||
| Basic earnings per share of Class A and non-voting common stock: | |||||||||||||||||||||||
| Net income attributable to Ares Management Corporation Class A and non-voting common stockholders | $ |
|
$ |
|
$ |
|
$ |
|
|||||||||||||||
| Distributions on unvested restricted units |
(
|
(
|
(
|
(
|
|||||||||||||||||||
| Undistributed earnings allocable to participating unvested restricted units |
(
|
|
(
|
|
|||||||||||||||||||
| Net income available to Class A and non-voting common stockholders | $ |
|
$ |
|
$ |
|
$ |
|
|||||||||||||||
| Basic weighted-average shares of Class A and non-voting common stock |
|
|
|
|
|||||||||||||||||||
| Basic earnings per share of Class A and non-voting common stock | $ |
|
$ |
|
$ |
|
$ |
|
|||||||||||||||
| Diluted earnings per share of Class A and non-voting common stock: | |||||||||||||||||||||||
| Net income available to Class A and non-voting common stockholders | $ |
|
$ |
|
$ |
|
$ |
|
|||||||||||||||
| Distributions on unvested restricted units |
|
|
|
(
|
|||||||||||||||||||
| Net income attributable to Ares Management Corporation Class A and non-voting common stockholders | $ |
|
$ |
|
$ |
|
$ |
|
|||||||||||||||
| Effect of dilutive shares: | |||||||||||||||||||||||
| Restricted units |
|
|
|
|
|||||||||||||||||||
| Options |
|
|
|
|
|||||||||||||||||||
| Diluted weighted-average shares of Class A and non-voting common stock |
|
|
|
|
|||||||||||||||||||
| Diluted earnings per share of Class A and non-voting common stock | $ |
|
$ |
|
$ |
|
$ |
|
|||||||||||||||
| Dividend declared and paid per Class A and non-voting common stock | $ |
|
$ |
|
$ |
|
$ |
|
|||||||||||||||
13. EQUITY COMPENSATION
Equity Incentive Plan
Equity-based compensation is granted under the Company's 2014 Equity Incentive Plan (as amended, the "Equity Incentive Plan"). The total number of shares available to be issued under the Equity Incentive Plan resets based on a formula defined in the Equity Incentive Plan and may increase on January 1 of each year. On January 1, 2021, the total number of shares available for issuance under the Equity Incentive Plan reset to
44,510,451
shares and as of September 30, 2021,
38,972,964
shares remain available for issuance.
Generally, unvested restricted units are forfeited upon termination of employment in accordance with the Equity Incentive Plan. The Company recognizes forfeitures as a reversal of previously recognized compensation expense in the period the forfeiture occurs.
Equity-based compensation expense, net of forfeitures, recorded by the Company is included in the following table:
| Three months ended September 30, | Nine months ended September 30, | |||||||||||||||||||||||||
| 2021 | 2020 | 2021 | 2020 | |||||||||||||||||||||||
| Restricted units | $ |
|
$ |
|
$ |
|
$ |
|
||||||||||||||||||
| Restricted units with a market condition |
|
|
|
|
||||||||||||||||||||||
| Options |
|
|
|
|
||||||||||||||||||||||
| Equity-based compensation expense | $ |
|
$ |
|
$ |
|
$ |
|
||||||||||||||||||
39
Ares Management Corporation
Notes to the Unaudited Condensed Consolidated Financial Statements
(Dollars in Thousands, Except Share Data and As Otherwise Noted)
Restricted Units
Each restricted unit represents an unfunded, unsecured right of the holder to receive a share of the Company's Class A common stock on a specific date. The restricted units generally vest and are settled in shares of Class A common stock either (i) at a rate of one-third per year, beginning on the third anniversary of the grant date, (ii) in their entirety on the fifth anniversary of the grant date, (iii) at a rate of one quarter per year, beginning on the second anniversary of the grant date or the holder's employment commencement date, or (iv) at a rate of one third per year, beginning on the first anniversary of the grant date in each case generally subject to the holder’s continued employment as of the applicable vesting date (subject to accelerated vesting upon certain qualifying terminations of employment or retirement eligibility provisions). Compensation expense associated with restricted units is recognized on a straight-line basis over the requisite service period of the award.
Restricted units are delivered net of the holder's payroll related taxes upon vesting. For the nine months ended September 30, 2021,
8.2
million restricted units vested and
4.4
million shares of Class A common stock were delivered to the holders. For the nine months ended September 30, 2020,
4.7
million restricted units vested and
2.6
million shares of Class A common stock were delivered to the holders.
The holders of restricted units, other than awards that have not yet been issued as described in the subsequent sections, generally have the right to receive as current compensation an amount in cash equal to (i) the amount of any dividend paid with respect to a share of Class A common stock multiplied by (ii) the number of restricted units held at the time such dividends are declared (“Dividend Equivalent”). During the nine months ended September 30, 2021, the Company declared dividends of $
0.47
per share to Class A common stockholders at the close of business on March 17, 2021, June 16, 2021 and September 16, 2021. For the three and nine months ended September 30, 2021, Dividend Equivalents were made to the holders of restricted units in the aggregate amount of $
6.4
million and $
21.7
million, respectively, which are presented as dividends within the Condensed Consolidated Statements of Changes in Equity. When units are forfeited, the cumulative amount of Dividend Equivalents previously paid is reclassified to compensation and benefits expense in the Condensed Consolidated Statements of Operations.
During the first quarter of 2021, in addition to grants awarded in 2021, the Company approved the future grant of restricted units to certain senior executives in each of 2022, 2023 and 2024, subject to the holder’s continued employment and acceleration in certain instances. The vesting period of these awards are at a rate of
25
% per year, beginning on the second anniversary of the grant date. Given that these future restricted units have been communicated to the recipient, the Company accounts for these awards as if they have been granted and recognizes the compensation expense on a straight-line basis over the service period. The restricted units that have been approved and communicated but not yet granted are not eligible to receive a Dividend Equivalent until the grant date.
The following table presents unvested restricted units' activity:
| Restricted Units |
Weighted Average
Grant Date Fair Value Per Unit |
||||||||||
| Balance - January 1, 2021 |
|
$ |
|
||||||||
| Granted |
|
|
|||||||||
| Vested |
(
|
|
|||||||||
| Forfeited |
(
|
|
|||||||||
| Balance - September 30, 2021 |
|
$ |
|
||||||||
The total compensation expense expected to be recognized in all future periods associated with the restricted units is approximately $
504.8
million as of September 30, 2021 and is expected to be recognized over the remaining weighted average period of
3.5
years.
40
Ares Management Corporation
Notes to the Unaudited Condensed Consolidated Financial Statements
(Dollars in Thousands, Except Share Data and As Otherwise Noted)
Performance-Based Restricted Unit Awards with a Market Condition
During the first quarter of 2021, the Company granted certain restricted units with a vesting condition contingent upon the volume-weighted, average closing price of the Company’s Class A common stock meeting or exceeding a stated price for
30
consecutive calendar days on or prior to January 22, 2029, referred to as the market condition.
537,500
restricted units with a market condition of $
55.00
per share (“Tranche I”),
537,500
restricted units with a market condition of $
60.00
per share (“Tranche II”),
537,500
restricted units with a market condition of $
65.00
per share (“Tranche III”) and
537,500
restricted units with a market condition of $
75.00
per share (“Tranche IV”) were granted. Vesting is also generally subject to continued employment at the time such market condition is achieved, subject to certain exceptions upon certain qualifying terminations of employment. Under the terms of the awards, if the target price of the applicable market condition is not achieved by the close of business on January 22, 2029, the unvested market condition awards will be automatically canceled and forfeited for no consideration. Restricted units subject to a market condition are not eligible to receive a Dividend Equivalent.
The grant date fair values for Tranche I, Tranche II, Tranche III and Tranche IV awards were $
37.28
, $
34.47
, $
31.92
and $
27.75
per unit, respectively, based on a probability distributed Monte-Carlo simulation. Due to the existence of the market condition, the vesting period for the awards is not explicit, and as such, compensation expense is recognized on a straight-line basis over the median vesting period derived from the positive iterations of the Monte Carlo simulation where the market condition was achieved. The median vesting period is
0.7
years,
1.2
years,
1.6
years and
2.3
years for Tranche I, Tranche II, Tranche III and Tranche IV, respectively.
Below is a summary of the significant assumptions used to estimate the grant date fair value of market condition awards:
| Closing price of the Company's common shares as of valuation date |
$
|
|||||||
| Risk-free interest rate |
|
|||||||
| Volatility |
|
|||||||
| Dividend yield |
|
|||||||
| Cost of equity |
|
|||||||
The following table presents the market condition awards' activity:
| Market Condition Awards Units |
Weighted Average
Grant Date Fair Value Per Unit |
||||||||||
| Balance - January 1, 2021 |
|
$ |
|
||||||||
| Granted |
|
|
|||||||||
| Vested |
(
|
|
|||||||||
| Forfeited |
(
|
|
|||||||||
| Balance - September 30, 2021 |
|
$ |
|
||||||||
During the nine months ended September 30, 2021, the market-priced vesting condition was met for all four tranches of the market condition awards and resulted in the acceleration of $
43.4
million of compensation expense. Tranche I was met during the second quarter of 2021 and Tranche II, III and IV were met during the third quarter of 2021, and the compensation expense was accelerated during each of the quarters of $
14.0
million and $
29.4
million, respectively.
41
Ares Management Corporation
Notes to the Unaudited Condensed Consolidated Financial Statements
(Dollars in Thousands, Except Share Data and As Otherwise Noted)
Options
A summary of options activity during the nine months ended September 30, 2021 is presented below:
| Options | Weighted Average Exercise Price |
Weighted Average
Remaining Life (in years) |
Aggregate Intrinsic Value | ||||||||||||||||||||
| Balance - January 1, 2021 |
|
$ |
|
|
$ |
|
|||||||||||||||||
| Granted |
|
|
— | — | |||||||||||||||||||
| Exercised |
(
|
|
— | — | |||||||||||||||||||
| Expired |
|
|
— | — | |||||||||||||||||||
| Forfeited |
|
|
— | — | |||||||||||||||||||
| Balance - September 30, 2021 |
|
$ |
|
|
$ |
|
|||||||||||||||||
| Exercisable at September 30, 2021 |
|
$ |
|
|
$ |
|
|||||||||||||||||
14. EQUITY AND REDEEMABLE INTEREST
Common Stock
The Company's common stock consists of Class A, Class B, Class C and non-voting common stock, each $
0.01
par value per share. The non-voting common stock has the same economic rights as the Class A common stock. Sumitomo Mitsui Banking Corporation (“SMBC”) is the sole holder of the non-voting common stock. The Class B common stock and Class C common stock are non-economic and holders are not entitled to dividends from the Company or to receive any assets of the Company in the event of any dissolution, liquidation or winding up of the Company. Ares Management GP LLC is the sole holder of the Class B common stock and Ares Voting LLC (“Ares Voting”) is the sole holder of the Class C common stock.
In February 2021, the Company's board of directors authorized the renewal of the stock repurchase program that allows for the repurchase of up to $
150
million of shares of Class A common stock. Under the program, shares may be repurchased from time to time in open market purchases, privately negotiated transactions or otherwise, including in reliance on Rule 10b5-1 of the Securities Act. The program is scheduled to expire in February 2022. Repurchases under the program, if any, will depend on the prevailing market conditions and other factors. During the nine months ended September 30, 2021 and 2020, the Company did not repurchase any shares as part of the stock repurchase program.
On April 5, 2021, the Company entered into a Share Purchase Agreement (the “Purchase Agreement”) with SMBC. Pursuant to the Purchase Agreement, the Company agreed to issue and sell to SMBC approximately $
250.0
million of the Company’s common stock (consisting of
3,489,911
shares of non-voting common stock and
1,234,200
shares of Class A common stock) at a price per share equal to the public offering price of Class A common stock being offered pursuant to the Offering (as defined below), less underwriting discounts and commissions (the “Private Placement”). The Private Placement closed on April 8, 2021 and resulted in gross proceeds to the Company of approximately $
250.0
million before deducting offering expenses.
On April 6, 2021, the Company entered into an underwriting agreement pursuant to which the Company agreed to issue and sell
10,925,000
shares of the Class A common stock (including
1,425,000
shares of Class A common stock sold pursuant to the exercise of the underwriters' option to purchase additional shares of Class A common stock) (collectively, the “Offering”). The Offering closed on April 8, 2021 and resulted in gross proceeds to the Company of approximately $
578.2
million before deducting offering expenses.
Offering expenses for the Private Placement and Offering amounted to approximately $
0.7
million. The expenses have been recorded as a reduction in the proceeds received and are presented on a net basis together with issuances of common stock in additional paid-in-capital within the Condensed Consolidated Statements of Changes in Equity.
42
Ares Management Corporation
Notes to the Unaudited Condensed Consolidated Financial Statements
(Dollars in Thousands, Except Share Data and As Otherwise Noted)
The following table presents the changes in each class of common stock:
| Class A Common Stock | Non-Voting Common Stock | Class B Common Stock | Class C Common Stock | Total | |||||||||||||||||||||||||
| Balance - January 1, 2021 |
|
|
|
|
|
||||||||||||||||||||||||
|
Issuance of stock
(1)
|
|
|
|
|
|
||||||||||||||||||||||||
| Exchanges of AOG Units |
|
|
|
(
|
|
||||||||||||||||||||||||
| Redemptions of AOG Units |
|
|
|
(
|
(
|
||||||||||||||||||||||||
| Stock option exercises, net of shares withheld for tax |
|
|
|
|
|
||||||||||||||||||||||||
| Vesting of restricted stock awards, net of shares withheld for tax |
|
|
|
|
|
||||||||||||||||||||||||
| Balance - September 30, 2021 |
|
|
|
|
|
||||||||||||||||||||||||
(1) Issuances of Class C Common stock corresponds with increases in Ares Owners Holdings L.P.’s ownership interest in the AOG entities.
The following table presents each partner's AOG Units and corresponding ownership interest in each of the Ares Operating Group entities, as well as its daily average ownership of AOG Units in each of the Ares Operating Group entities:
| Daily Average Ownership | ||||||||||||||||||||||||||||||||||||||||||||||||||
| As of September 30, 2021 | As of December 31, 2020 | Three months ended September 30, | Nine months ended September 30, | |||||||||||||||||||||||||||||||||||||||||||||||
| AOG Units | Direct Ownership Interest | AOG Units | Direct Ownership Interest | 2021 | 2020 | 2021 | 2020 | |||||||||||||||||||||||||||||||||||||||||||
| Ares Management Corporation |
|
|
% |
|
|
% |
|
% |
|
% |
|
% |
|
% | ||||||||||||||||||||||||||||||||||||
| Ares Owners Holdings, L.P. |
|
|
|
|
|
|
|
|
||||||||||||||||||||||||||||||||||||||||||
| Total |
|
|
% |
|
|
% | ||||||||||||||||||||||||||||||||||||||||||||
Preferred Stock
As of December 31, 2020, the Company had
12,400,000
shares of the Series A Preferred Stock outstanding. As and if declared by the Company’s board of directors, dividends on the Series A Preferred Stock are payable quarterly at a rate per annum equal to
7.00
%. The Series A Preferred Stock could be redeemed at the Company’s option, in whole or in part, at any time on or after June 30, 2021, at a price per share of $
25.00
.
On June 30, 2021 (the “Redemption Date”), the Company redeemed all shares of the Series A Preferred Stock outstanding at a redemption price per share of $
25.00
. The redemption price did not include any accrued dividends as the Redemption Date occurred on the dividend payment date. On the Redemption Date, the Company paid $
310.0
million for the redemption of the Series A Preferred Stock and $
5.4
million for the previously announced dividend of $
0.4375
per share. The excess of the redemption price over the carrying value of the Series A Preferred Stock of approximately $
11.2
million relates to the original issuance costs and is presented as a reduction to net income available to common stockholders and to non-controlling interests in AOG entities within the Condensed Consolidated Statements of Operations.
43
Ares Management Corporation
Notes to the Unaudited Condensed Consolidated Financial Statements
(Dollars in Thousands, Except Share Data and As Otherwise Noted)
Redeemable Interest
The following table summarizes the activities associated with the redeemable interest in Ares Operating Group entities:
| Total | |||||
| Balance - January 1, 2021 | $ |
|
|||
| Net income |
|
||||
| Currency translation adjustment, net of tax |
(
|
||||
| Balance- March 31, 2021 | $ |
|
|||
| Net income | $ |
|
|||
| Currency translation adjustment, net of tax |
|
||||
| Distribution |
(
|
||||
|
Balance- June 30, 2021
|
$ |
|
|||
| Net income | $ |
|
|||
| Currency translation adjustment, net of tax |
(
|
||||
| Distribution |
(
|
||||
|
Balance- September 30, 2021
|
$ |
|
|||
The following table summarizes the activities associated with the redeemable interest in Consolidated Funds:
| Total | |||||
| Balance - January 1, 2021 | $ |
|
|||
| Redemption value |
|
||||
| Balance- March 31, 2021 | $ |
|
|||
| Change in redemption value |
(
|
||||
|
Balance- June 30, 2021
|
$ |
|
|||
| Change in redemption value |
|
||||
|
Balance- September 30, 2021
|
$ |
|
|||
15. SEGMENT REPORTING
The Company operates through its distinct operating segments that are summarized below:
Credit Group:
The Credit Group manages credit strategies across the liquid and illiquid spectrum, including syndicated loans, high yield bonds, multi-asset credit, alternative credit investments and direct lending. The syndicated loans strategy focuses on evaluating individual credit opportunities related primarily to non-investment grade senior secured loans and primarily targets first lien secured debt, with a secondary focus on second lien secured loans and subordinated and other unsecured loans. The high yield bond strategy seeks to deliver a diversified portfolio of liquid, traded non-investment grade corporate bonds, including secured, unsecured and subordinated debt instruments. Multi-asset credit is a “go anywhere” strategy designed to offer investors a flexible solution to global credit investing by allowing us to tactically allocate between multiple asset classes in various market conditions. The alternative credit strategy seeks to capitalize on asset-focused investment opportunities that fall outside of traditional, well-defined markets such as corporate debt, real estate and private equity. The alternative credit strategy emphasizes downside protection and capital preservation through a focus on investments that tend to share the following key attributes: asset security, covenants, structural protections and cash flow velocity. The direct lending strategy is one of the largest self-originating direct lenders to the U.S. and European markets and has a multi-channel origination strategy designed to address a broad set of investment opportunities in the middle market. The direct lending team maintains a flexible investment strategy with the capability to invest in first lien senior secured loans (including “unitranche” loans which are loans that combine senior and
subordinated
debt, generally in a first lien position), second lien senior secured loans, subordinated debt, preferred equity and non-control equity co-investments in private middle market companies. U.S. direct lending activities are managed through a publicly traded business development company, ARCC, as well as through private commingled funds and separately managed accounts (“SMAs”).
44
Ares Management Corporation
Notes to the Unaudited Condensed Consolidated Financial Statements
(Dollars in Thousands, Except Share Data and As Otherwise Noted)
Private Equity Group:
The Private Equity Group manages investment strategies broadly categorizes its investment activities into three strategies: Corporate Private Equity, Special Opportunities and Infrastructure and Power. In the Corporate Private Equity strategy, the Company targets four principal transactions types: prudently leveraged control buyouts, growth equity, rescue/deleveraging capital and distressed buyouts/discounted debt accumulation together with the broad resources of potential investment opportunities. This flexible capital approach, together with the broad resources of the Ares platform, widens our universe of potential investment opportunities and allows us to remain active in different markets and to be highly selective in making investments across various market environments. In the Special Opportunities strategy, the Company employs a flexible capital strategy to target non-control positions across a broad spectrum of stressed, distressed and opportunistic situations. The Infrastructure and Power strategy targets value-added approach that seeks to source and structure essential infrastructure assets with strong downside protection and potential for capital appreciation throughout the climate infrastructure, natural gas generation, and energy transportation sectors.
Real Estate Group
: The Real Estate Group manages comprehensive real estate equity and debt strategies, focusing on activities categorized as core, value-add, and opportunistic. Real Estate equity strategies involve high-quality properties and locations and de-risked developments with an opportunity to create value through repositioning, lease-up, re-tenanting, redevelopment, and/or complex recapitalizations. The group targets assets located in liquid markets with diversified economies in order to deliver compelling, risk-adjusted returns through a combination of asset selectivity and disciplined portfolio management. The U.S. core investment activities focus on the acquisition of assets secured by long-term cash flows and durable tenancy diversified across geographies and end-user industries. The core strategy encompasses industrial, multifamily, office, necessity-based retail, and other property types across major metropolitan economies. The value-add investment activities focus on acquiring underperforming, income-producing, institutional-quality assets that can be improved through select value-creation initiatives across the U.S. and Europe. The opportunistic activities focus on capitalizing on distressed and special situations, repositioning underperforming assets and undertaking select development and redevelopment projects across the U.S. and Europe. Additionally, the Ares Real Estate Group has specialized operating and investment capabilities specifically in the industrial sector through its vertically integrated operating platform. The Company’s debt strategies leverage the Real Estate Group’s diverse sources of capital to directly originate and invest in a wide range of financing opportunities in the U.S. In addition to managing private commingled funds and SMAs investing in equity and debt strategies, the Real Estate Group also makes investments through Black Creek Diversified Property Fund, Inc. (“DPF”) and Black Creek Industrial REIT IV, Inc. (“BCI IV”), its non-traded REITs, and ACRE, a publicly traded commercial mortgage REIT.
Secondary Solutions
Group
: The Secondary Solutions Group was formed during the second quarter of 2021 in connection with the Landmark Acquisition. The Secondary Solutions Group invests in secondary markets across a range of alternative asset class strategies, including private equity, real estate and infrastructure. The Company acquires interests across a range of partnership vehicles, including funds, multi-asset portfolios and single asset joint ventures. Each strategy focuses on recapitalizing and restructuring the funds, including transactions that can address pending fund maturity, strategy change or the need for additional equity capital. The private equity secondaries strategy targets opportunities in non-competitive channels and makes investments in durable, performing assets with attractive capital structures. In the real estate secondaries strategy, the Company seeks broad diversification by property sector and geography and to drive investment results through underwriting, transaction structuring and portfolio construction. In the infrastructure secondaries strategy, the Company focuses on achieving diversification through a portfolio that provides inflation protection and exposure to uncorrelated assets.
Strategic Initiatives:
The Company began reflecting the Strategic Initiatives category beginning in the third quarter of 2020. It represents an all other category that includes operating segments and strategic investments that seek to expand the Company’s reach and its scale in new and existing global markets including Ares SSG, Ares Insurance Solutions (“AIS”) and AAC.
The OMG consists of shared resource groups to support the Company’s operating segments by providing infrastructure and administrative support in the areas of accounting/finance, operations, information technology, legal, compliance, human resources, strategy, relationship management and distribution. The OMG includes Ares Wealth Management Solutions (“WMS”) that facilitates the product development, distribution, marketing and client management activities for investment offerings in the global wealth management channel. Additionally, the OMG provides services to certain of the Company’s investment companies and partnerships, which reimburse the OMG for expenses equal to the costs of services provided. The OMG’s revenues and expenses are not allocated to the Company’s reportable segments but the Company does consider the cost structure of the OMG when evaluating its financial performance.
Segment Profit Measures:
These measures supplement and should be considered in addition to, and not in lieu of, the Condensed Consolidated Statements of Operations prepared in accordance with GAAP.
45
Ares Management Corporation
Notes to the Unaudited Condensed Consolidated Financial Statements
(Dollars in Thousands, Except Share Data and As Otherwise Noted)
Fee related earnings (“FRE”) is used to assess core operating performance by determining whether recurring revenue, primarily consisting of management fees, is sufficient to cover operating expenses and to generate profits. FRE differs from income before taxes computed in accordance with GAAP as it excludes performance income, performance related compensation, investment income from the Consolidated Funds and non-consolidated funds and certain other items that the Company believes are not indicative of its core operating performance.
Realized income (“RI”) is an operating metric used by management to evaluate performance of the business based on operating performance and the contribution of each of the business segments to that performance, while removing the fluctuations of unrealized income and expenses, which may or may not be eventually realized at the levels presented and whose realizations depend more on future outcomes than current business operations. RI differs from income before taxes by excluding (a) operating results of the Consolidated Funds, (b) depreciation and amortization expense, (c) the effects of changes arising from corporate actions, (d) unrealized gains and losses related to performance income and investment performance and (e) certain other items that the Company believes are not indicative of operating performance. Changes arising from corporate actions include equity-based compensation expenses, the amortization of intangible assets, transaction costs associated with mergers, acquisitions and capital activities, underwriting costs and expenses incurred in connection with corporate reorganization. Management believes RI is a more appropriate metric to evaluate the Company's current business operations.
Management makes operating decisions and assesses the performance of each of the Company’s business segments based on financial and operating metrics and other data that is presented before giving effect to the consolidation of any of the Consolidated Funds. Consequently, all segment data excludes the assets, liabilities and operating results related to the Consolidated Funds and non-consolidated funds.
46
Ares Management Corporation
Notes to the Unaudited Condensed Consolidated Financial Statements
(Dollars in Thousands, Except Share Data and As Otherwise Noted)
The following tables present the financial results for the Company’s operating segments, as well as the OMG:
| Three months ended September 30, 2021 | |||||||||||||||||||||||||||||||||||||||||||||||
| Credit Group | Private Equity Group |
Real
Estate Group |
Secondary Solutions Group
|
Strategic Initiatives
|
Total
Segments |
OMG | Total | ||||||||||||||||||||||||||||||||||||||||
| Management fees | $ |
|
$ |
|
$ |
|
$ |
|
|
$ |
|
$ |
|
$ |
|
||||||||||||||||||||||||||||||||
| Other fees |
|
|
|
|
|
|
|
|
|||||||||||||||||||||||||||||||||||||||
| Compensation and benefits |
(
|
(
|
(
|
(
|
(
|
(
|
(
|
(
|
|||||||||||||||||||||||||||||||||||||||
| General, administrative and other expenses |
(
|
(
|
(
|
(
|
(
|
(
|
(
|
(
|
|||||||||||||||||||||||||||||||||||||||
| Fee related earnings |
|
|
|
|
|
|
(
|
|
|||||||||||||||||||||||||||||||||||||||
| Performance income—realized |
|
|
|
|
|
|
|
|
|||||||||||||||||||||||||||||||||||||||
| Performance related compensation—realized |
(
|
(
|
(
|
|
|
(
|
|
(
|
|||||||||||||||||||||||||||||||||||||||
| Realized net performance income |
|
|
|
|
|
|
|
|
|||||||||||||||||||||||||||||||||||||||
| Investment income—realized |
|
|
|
|
|
|
|
|
|||||||||||||||||||||||||||||||||||||||
| Interest and other investment income (expense)—realized |
|
|
|
|
|
|
(
|
|
|||||||||||||||||||||||||||||||||||||||
| Interest expense |
(
|
(
|
(
|
(
|
(
|
(
|
(
|
(
|
|||||||||||||||||||||||||||||||||||||||
| Realized net investment income (loss) |
|
|
|
|
(
|
|
(
|
|
|||||||||||||||||||||||||||||||||||||||
| Realized income | $ |
|
$ |
|
$ |
|
$ |
|
$ |
|
$ |
|
$ |
(
|
$ |
|
|||||||||||||||||||||||||||||||
| Three months ended September 30, 2020 | |||||||||||||||||||||||||||||||||||||||||||||||
| Credit Group | Private Equity Group |
Real
Estate Group |
Secondary Solutions Group |
Strategic Initiatives
|
Total
Segments |
OMG | Total | ||||||||||||||||||||||||||||||||||||||||
| Management fees | $ |
|
$ |
|
$ |
|
$ |
|
$ |
|
$ |
|
$ |
|
$ |
|
|||||||||||||||||||||||||||||||
| Other fees |
|
|
|
|
|
|
|
|
|||||||||||||||||||||||||||||||||||||||
|
Compensation and benefits
|
(
|
(
|
(
|
|
(
|
(
|
(
|
(
|
|||||||||||||||||||||||||||||||||||||||
| General, administrative and other expenses |
(
|
(
|
(
|
|
(
|
(
|
(
|
(
|
|||||||||||||||||||||||||||||||||||||||
| Fee related earnings |
|
|
|
|
|
|
(
|
|
|||||||||||||||||||||||||||||||||||||||
| Performance income—realized |
|
|
|
|
|
|
|
|
|||||||||||||||||||||||||||||||||||||||
| Performance related compensation—realized |
(
|
(
|
(
|
|
|
(
|
|
(
|
|||||||||||||||||||||||||||||||||||||||
| Realized net performance income |
|
|
|
|
|
|
|
|
|||||||||||||||||||||||||||||||||||||||
| Investment income—realized |
|
|
|
|
|
|
|
|
|||||||||||||||||||||||||||||||||||||||
| Interest and other investment income (expense)—realized |
|
|
|
|
(
|
|
(
|
|
|||||||||||||||||||||||||||||||||||||||
| Interest expense |
(
|
(
|
(
|
|
(
|
(
|
(
|
(
|
|||||||||||||||||||||||||||||||||||||||
| Realized net investment income (loss) |
(
|
|
|
|
(
|
|
(
|
|
|||||||||||||||||||||||||||||||||||||||
| Realized income | $ |
|
$ |
|
$ |
|
$ |
|
$ |
|
$ |
|
$ |
(
|
$ |
|
|||||||||||||||||||||||||||||||
47
Ares Management Corporation
Notes to the Unaudited Condensed Consolidated Financial Statements
(Dollars in Thousands, Except Share Data and As Otherwise Noted)
| Nine months ended September 30, 2021 | |||||||||||||||||||||||||||||||||||||||||||||||
| Credit Group | Private Equity Group |
Real
Estate Group |
Secondary Solutions Group
|
Strategic Initiatives
|
Total
Segments |
OMG | Total | ||||||||||||||||||||||||||||||||||||||||
| Management fees | $ |
|
$ |
|
$ |
|
$ |
|
$ |
|
$ |
|
$ |
|
$ |
|
|||||||||||||||||||||||||||||||
| Other fees |
|
|
|
|
|
|
|
|
|||||||||||||||||||||||||||||||||||||||
| Compensation and benefits |
(
|
(
|
(
|
(
|
(
|
(
|
(
|
(
|
|||||||||||||||||||||||||||||||||||||||
| General, administrative and other expenses |
(
|
(
|
(
|
(
|
(
|
(
|
(
|
(
|
|||||||||||||||||||||||||||||||||||||||
| Fee related earnings |
|
|
|
|
|
|
(
|
|
|||||||||||||||||||||||||||||||||||||||
| Performance income—realized |
|
|
|
|
|
|
|
|
|||||||||||||||||||||||||||||||||||||||
| Performance related compensation—realized |
(
|
(
|
(
|
|
|
(
|
|
(
|
|||||||||||||||||||||||||||||||||||||||
| Realized net performance income |
|
|
|
|
|
|
|
|
|||||||||||||||||||||||||||||||||||||||
| Investment income—realized |
|
|
|
|
|
|
|
|
|||||||||||||||||||||||||||||||||||||||
| Interest and other investment income—realized |
|
|
|
|
|
|
|
|
|||||||||||||||||||||||||||||||||||||||
| Interest expense |
(
|
(
|
(
|
(
|
(
|
(
|
(
|
(
|
|||||||||||||||||||||||||||||||||||||||
| Realized net investment income (loss) |
|
|
|
|
(
|
|
(
|
|
|||||||||||||||||||||||||||||||||||||||
| Realized income | $ |
|
$ |
|
$ |
|
$ |
|
$ |
|
$ |
|
$ |
(
|
$ |
|
|||||||||||||||||||||||||||||||
| Nine months ended September 30, 2020 | |||||||||||||||||||||||||||||||||||||||||||||||
| Credit Group | Private Equity Group | Real Estate Group |
Secondary Solutions Group
|
Strategic Initiatives
|
Total
Segments |
OMG | Total | ||||||||||||||||||||||||||||||||||||||||
| Management fees | $ |
|
$ |
|
$ |
|
$ |
|
$ |
|
$ |
|
$ |
|
$ |
|
|||||||||||||||||||||||||||||||
| Other fees |
|
|
|
|
|
|
|
|
|||||||||||||||||||||||||||||||||||||||
|
Compensation and benefits
|
(
|
(
|
(
|
|
(
|
(
|
(
|
(
|
|||||||||||||||||||||||||||||||||||||||
| General, administrative and other expenses |
(
|
(
|
(
|
|
(
|
(
|
(
|
(
|
|||||||||||||||||||||||||||||||||||||||
| Fee related earnings |
|
|
|
|
|
|
(
|
|
|||||||||||||||||||||||||||||||||||||||
| Performance income—realized |
|
|
|
|
|
|
|
|
|||||||||||||||||||||||||||||||||||||||
| Performance related compensation—realized |
(
|
(
|
(
|
|
|
(
|
|
(
|
|||||||||||||||||||||||||||||||||||||||
| Realized net performance income |
|
|
|
|
|
|
|
|
|||||||||||||||||||||||||||||||||||||||
| Investment income (loss)—realized |
(
|
|
|
|
|
|
(
|
|
|||||||||||||||||||||||||||||||||||||||
| Interest and other investment income (expense)—realized |
|
|
|
|
(
|
|
(
|
|
|||||||||||||||||||||||||||||||||||||||
| Interest expense |
(
|
(
|
(
|
|
(
|
(
|
(
|
(
|
|||||||||||||||||||||||||||||||||||||||
| Realized net investment income (loss) |
|
|
|
|
(
|
|
(
|
|
|||||||||||||||||||||||||||||||||||||||
| Realized income | $ |
|
$ |
|
$ |
|
$ |
|
$ |
|
$ |
|
$ |
(
|
$ |
|
|||||||||||||||||||||||||||||||
48
Ares Management Corporation
Notes to the Unaudited Condensed Consolidated Financial Statements
(Dollars in Thousands, Except Share Data and As Otherwise Noted)
| Three months ended September 30, | Nine months ended September 30, | ||||||||||||||||||||||
| 2021 | 2020 | 2021 | 2020 | ||||||||||||||||||||
| Segment revenues | |||||||||||||||||||||||
| Management fees | $ |
|
$ |
|
$ |
|
$ |
|
|||||||||||||||
| Other fees |
|
|
|
|
|||||||||||||||||||
| Performance income—realized |
|
|
|
|
|||||||||||||||||||
| Total segment revenues | $ |
|
$ |
|
$ |
|
$ |
|
|||||||||||||||
| Segment expenses | |||||||||||||||||||||||
| Compensation and benefits | $ |
|
$ |
|
$ |
|
$ |
|
|||||||||||||||
| General, administrative and other expenses |
|
|
|
|
|||||||||||||||||||
| Performance related compensation—realized |
|
|
|
|
|||||||||||||||||||
| Total segment expenses | $ |
|
$ |
|
$ |
|
$ |
|
|||||||||||||||
| Segment realized net investment income | |||||||||||||||||||||||
| Investment income—realized | $ |
|
$ |
|
$ |
|
$ |
|
|||||||||||||||
| Interest and other investment income —realized |
|
|
|
|
|||||||||||||||||||
| Interest expense |
(
|
(
|
(
|
(
|
|||||||||||||||||||
| Total segment realized net investment income | $ |
|
$ |
|
$ |
|
$ |
|
|||||||||||||||
The following table reconciles the Company's consolidated revenues to segment revenue:
| Three months ended September 30, | Nine months ended September 30, | ||||||||||||||||||||||
| 2021 | 2020 | 2021 | 2020 | ||||||||||||||||||||
| Total consolidated revenue | $ |
|
$ |
|
$ |
|
$ |
|
|||||||||||||||
| Performance (income) loss—unrealized |
(
|
(
|
(
|
|
|||||||||||||||||||
| Management fees of Consolidated Funds eliminated in consolidation |
|
|
|
|
|||||||||||||||||||
| Incentive fees of Consolidated Funds eliminated in consolidation |
|
|
|
(
|
|||||||||||||||||||
| Administrative, transaction and other fees of Consolidated Funds eliminated in consolidation |
|
|
|
|
|||||||||||||||||||
|
Administrative fees
(1)
|
(
|
(
|
(
|
(
|
|||||||||||||||||||
| OMG revenue |
(
|
|
(
|
|
|||||||||||||||||||
|
Performance income (loss) reclass
(2)
|
|
(
|
|
(
|
|||||||||||||||||||
| Principal investment income, net of eliminations |
(
|
(
|
(
|
(
|
|||||||||||||||||||
| Net income of non-controlling interests in consolidated subsidiaries |
(
|
(
|
(
|
(
|
|||||||||||||||||||
| Total consolidation adjustments and reconciling items |
(
|
(
|
(
|
|
|||||||||||||||||||
| Total segment revenue | $ |
|
$ |
|
$ |
|
$ |
|
|||||||||||||||
(1)
Represents administrative fees that are presented in administrative, transaction and other fees in the Company’s Condensed Consolidated Statements of Operations and are netted against the respective expenses for segment reporting.
(2)
Related to performance income for AREA Sponsor Holdings LLC, an investment pool. Changes in value of this investment are reflected within net realized and unrealized gains (losses) on investments in the Company’s Condensed Consolidated Statements of Operations.
49
Ares Management Corporation
Notes to the Unaudited Condensed Consolidated Financial Statements
(Dollars in Thousands, Except Share Data and As Otherwise Noted)
The following table reconciles the Company's consolidated expenses to segment expenses:
| Three months ended September 30, | Nine months ended September 30, | ||||||||||||||||||||||
| 2021 | 2020 | 2021 | 2020 | ||||||||||||||||||||
| Total consolidated expenses | $ |
|
$ |
|
$ |
|
$ |
|
|||||||||||||||
| Performance related compensation-unrealized |
(
|
(
|
(
|
|
|||||||||||||||||||
| Expenses of Consolidated Funds added in consolidation |
(
|
(
|
(
|
(
|
|||||||||||||||||||
| Expenses of Consolidated Funds eliminated in consolidation |
|
|
|
|
|||||||||||||||||||
|
Administrative fees
(1)
|
(
|
(
|
(
|
(
|
|||||||||||||||||||
| OMG expenses |
(
|
(
|
(
|
(
|
|||||||||||||||||||
| Acquisition and merger-related expense |
(
|
(
|
(
|
(
|
|||||||||||||||||||
| Equity compensation expense |
(
|
(
|
(
|
(
|
|||||||||||||||||||
|
Acquisition-related compensation expense
(2)
|
(
|
|
(
|
|
|||||||||||||||||||
| Deferred placement fees |
(
|
(
|
(
|
(
|
|||||||||||||||||||
| Depreciation and amortization expense |
(
|
(
|
(
|
(
|
|||||||||||||||||||
|
Expense of non-controlling interests in consolidated subsidiaries
|
(
|
(
|
(
|
(
|
|||||||||||||||||||
| Total consolidation adjustments and reconciling items |
(
|
(
|
(
|
(
|
|||||||||||||||||||
| Total segment expenses | $ |
|
$ |
|
$ |
|
$ |
|
|||||||||||||||
(1)
Represents administrative fees that are presented in administrative, transaction and other fees in the Company’s Condensed Consolidated Statements of Operations and are netted against the respective expenses for segment reporting.
(2)
Represents compensation expense associated with contingent obligations recorded in connection with the Landmark Acquisition and the Black Creek Acquisition and is presented in compensation and benefits in the Company’s Condensed Consolidated Statements of Operations.
The following table reconciles the Company's consolidated other income to segment realized net investment income:
| Three months ended September 30, | Nine months ended September 30, | ||||||||||||||||||||||
| 2021 | 2020 | 2021 | 2020 | ||||||||||||||||||||
| Total consolidated other income (expense) | $ |
|
$ |
|
$ |
|
$ |
(
|
|||||||||||||||
| Investment (income) loss—unrealized |
(
|
|
(
|
|
|||||||||||||||||||
| Interest and other investment (income) loss—unrealized |
(
|
(
|
|
(
|
|||||||||||||||||||
| Other (income) loss from Consolidated Funds added in consolidation, net |
(
|
(
|
(
|
|
|||||||||||||||||||
| Other expense from Consolidated Funds eliminated in consolidation, net |
(
|
(
|
(
|
(
|
|||||||||||||||||||
| OMG other (income) expense |
|
(
|
|
(
|
|||||||||||||||||||
|
Performance (income) loss reclass
(1)
|
(
|
|
(
|
|
|||||||||||||||||||
| Principal investment income (loss) |
|
|
|
(
|
|||||||||||||||||||
|
Other (income) expense, net
|
(
|
|
(
|
|
|||||||||||||||||||
| Other (income) loss of non-controlling interests in consolidated subsidiaries |
(
|
(
|
(
|
|
|||||||||||||||||||
| Total consolidation adjustments and reconciling items |
(
|
(
|
(
|
|
|||||||||||||||||||
| Total segment realized net investment income | $ |
|
$ |
|
$ |
|
$ |
|
|||||||||||||||
(1)
Related to performance income for AREA Sponsor Holdings LLC. Changes in value of this investment are reflected within net realized and unrealized gains (losses) on investments in the Company’s Condensed Consolidated Statements of Operations.
50
Ares Management Corporation
Notes to the Unaudited Condensed Consolidated Financial Statements
(Dollars in Thousands, Except Share Data and As Otherwise Noted)
The following table presents the reconciliation of income before taxes as reported in the Condensed Consolidated Statements of Operations to segment results of RI and FRE:
| Three months ended September 30, | Nine months ended September 30, | ||||||||||||||||||||||
| 2021 | 2020 | 2021 | 2020 | ||||||||||||||||||||
| Income before taxes | $ |
|
$ |
|
$ |
|
$ |
|
|||||||||||||||
| Adjustments: | |||||||||||||||||||||||
| Depreciation and amortization expense |
|
|
|
|
|||||||||||||||||||
| Equity compensation expense |
|
|
|
|
|||||||||||||||||||
|
Acquisition-related compensation expense
(1)
|
|
|
|
|
|||||||||||||||||||
| Acquisition and merger-related expense |
|
|
|
|
|||||||||||||||||||
| Deferred placement fees |
|
|
|
|
|||||||||||||||||||
| OMG expense, net |
|
|
|
|
|||||||||||||||||||
|
Other (income) expense, net
|
(
|
|
(
|
|
|||||||||||||||||||
| Net (income) expense of non-controlling interests in consolidated subsidiaries |
(
|
(
|
(
|
|
|||||||||||||||||||
| (Income) loss before taxes of non-controlling interests in Consolidated Funds, net of eliminations |
(
|
(
|
(
|
|
|||||||||||||||||||
| Total performance (income) loss—unrealized |
(
|
(
|
(
|
|
|||||||||||||||||||
| Total performance related compensation—unrealized |
|
|
|
(
|
|||||||||||||||||||
| Total investment (income) loss—unrealized |
(
|
|
(
|
|
|||||||||||||||||||
| Realized income |
|
|
|
|
|||||||||||||||||||
| Total performance income—realized |
(
|
(
|
(
|
(
|
|||||||||||||||||||
| Total performance related compensation—realized |
|
|
|
|
|||||||||||||||||||
| Total investment income—realized |
(
|
(
|
(
|
(
|
|||||||||||||||||||
| Fee related earnings | $ |
|
$ |
|
$ |
|
$ |
|
|||||||||||||||
(1)
Represents compensation expense associated with contingent obligations recorded in connection with the Landmark Acquisition and the Black Creek Acquisition and is presented in compensation and benefits in the Company’s Condensed Consolidated Statements of Operations.
51
Ares Management Corporation
Notes to the Unaudited Condensed Consolidated Financial Statements
(Dollars in Thousands, Except Share Data and As Otherwise Noted)
16. CONSOLIDATION
Investments in Consolidated Variable Interest Entities
The Company consolidates entities in which the Company has a variable interest and as the general partner or investment manager, has both the power to direct the most significant activities and a potentially significant economic interest. Investments in the consolidated VIEs are reported at fair value and represent the Company’s maximum exposure to loss.
Investments in Non-Consolidated Variable Interest Entities
The Company holds interests in certain VIEs that are not consolidated as the Company is not the primary beneficiary. The Company's interest in such entities generally is in the form of direct equity interests, fixed fee arrangements or both. The maximum exposure to loss represents the potential loss of assets by the Company relating to these non-consolidated entities. Investments in the non-consolidated VIEs are carried at fair value.
The Company's interests in consolidated and non-consolidated VIEs, as presented in the Condensed Consolidated Statements of Financial Condition, and its respective maximum exposure to loss relating to non-consolidated VIEs are as follows:
| As of September 30, | As of December 31, | ||||||||||
| 2021 | 2020 | ||||||||||
|
Maximum exposure to loss attributable to the Company's investment in non-consolidated VIEs
(1)
|
$ |
|
$ |
|
|||||||
|
Maximum exposure to loss attributable to the Company's investment in consolidated VIEs
(1)
|
|
|
|||||||||
|
Assets of consolidated VIEs
|
|
|
|||||||||
|
Liabilities of consolidated VIEs
|
|
|
|||||||||
(1)
As of September 30, 2021 and December 31, 2020, the Company's maximum exposure of loss for CLO securities was equal to the cumulative fair value of our capital interest in CLOs that are managed and totaled $
104.4
million and $
107.7
million, respectively.
| Three months ended September 30, | Nine months ended September 30, | ||||||||||||||||||||||
| 2021 | 2020 | 2021 | 2020 | ||||||||||||||||||||
| Net income (loss) attributable to non-controlling interests related to consolidated VIEs | $ |
|
$ |
|
$ |
|
$ |
(
|
|||||||||||||||
52
Ares Management Corporation
Notes to the Unaudited Condensed Consolidated Financial Statements
(Dollars in Thousands, Except Share Data and As Otherwise Noted)
Consolidating Schedules
The following supplemental financial information illustrates the consolidating effects of the Consolidated Funds on the Company's financial condition, results from operations and cash flows:
| As of September 30, 2021 | |||||||||||||||||||||||
|
Consolidated
Company Entities |
Consolidated
Funds |
Eliminations | Consolidated | ||||||||||||||||||||
| Assets | |||||||||||||||||||||||
| Cash and cash equivalents | $ |
|
$ | — | $ | — | $ |
|
|||||||||||||||
|
Investments (includes $
|
|
— |
(
|
|
|||||||||||||||||||
| Due from affiliates |
|
— |
(
|
|
|||||||||||||||||||
| Other assets |
|
— | — |
|
|||||||||||||||||||
| Intangible assets, net |
|
— | — |
|
|||||||||||||||||||
| Right-of-use operating lease assets |
|
— | — |
|
|||||||||||||||||||
| Assets of Consolidated Funds | |||||||||||||||||||||||
| Cash and cash equivalents | — |
|
— |
|
|||||||||||||||||||
| U.S. Treasury securities, at fair value | — |
|
— |
|
|||||||||||||||||||
| Investments, at fair value | — |
|
|
|
|||||||||||||||||||
| Due from affiliates | — |
|
(
|
|
|||||||||||||||||||
| Receivable for securities sold | — |
|
— |
|
|||||||||||||||||||
| Other assets | — |
|
— |
|
|||||||||||||||||||
| Total assets | $ |
|
$ |
|
$ |
(
|
$ |
|
|||||||||||||||
| Liabilities | |||||||||||||||||||||||
| Accounts payable, accrued expenses and other liabilities | $ |
|
$ | — | $ |
(
|
$ |
|
|||||||||||||||
| Accrued compensation |
|
— | — |
|
|||||||||||||||||||
| Due to affiliates |
|
— | — |
|
|||||||||||||||||||
| Performance related compensation payable |
|
— | — |
|
|||||||||||||||||||
| Debt obligations |
|
— | — |
|
|||||||||||||||||||
| Operating lease liabilities |
|
— | — |
|
|||||||||||||||||||
| Liabilities of Consolidated Funds | |||||||||||||||||||||||
| Accounts payable, accrued expenses and other liabilities | — |
|
(
|
|
|||||||||||||||||||
| Due to affiliates | — |
|
(
|
|
|||||||||||||||||||
| Payable for securities purchased | — |
|
— |
|
|||||||||||||||||||
| CLO loan obligations, at fair value | — |
|
(
|
|
|||||||||||||||||||
| Fund borrowings | — |
|
— |
|
|||||||||||||||||||
| Total liabilities |
|
|
(
|
|
|||||||||||||||||||
| Commitments and contingencies |
|
|
|
|
|||||||||||||||||||
| Redeemable interest in Consolidated Funds | — |
|
— |
|
|||||||||||||||||||
| Redeemable interest in Ares Operating Group entities |
|
— | — |
|
|||||||||||||||||||
| Non-controlling interest in Consolidated Funds | — |
|
(
|
|
|||||||||||||||||||
| Non-controlling interest in Ares Operating Group entities |
|
— | — |
|
|||||||||||||||||||
| Stockholders' Equity | |||||||||||||||||||||||
|
Series A Preferred Stock, $
|
|
— | — |
|
|||||||||||||||||||
|
Class A common stock, $
|
|
— | — |
|
|||||||||||||||||||
|
Non-voting common stock, $
|
|
— | — |
|
|||||||||||||||||||
|
Class B common stock, $
|
|
— | — |
|
|||||||||||||||||||
|
Class C common stock, $
|
|
— | — |
|
|||||||||||||||||||
| Additional paid-in-capital |
|
— | — |
|
|||||||||||||||||||
| Retained earnings |
(
|
— | — |
(
|
|||||||||||||||||||
| Accumulated other comprehensive loss, net of tax |
(
|
— | — |
(
|
|||||||||||||||||||
| Total stockholders' equity |
|
— | — |
|
|||||||||||||||||||
| Total equity |
|
|
(
|
|
|||||||||||||||||||
| Total liabilities, redeemable interest, non-controlling interests and equity | $ |
|
$ |
|
$ |
(
|
$ |
|
|||||||||||||||
53
Ares Management Corporation
Notes to the Unaudited Condensed Consolidated Financial Statements
(Dollars in Thousands, Except Share Data and As Otherwise Noted)
| As of December 31, 2020 | |||||||||||||||||||||||
|
Consolidated
Company Entities |
Consolidated
Funds |
Eliminations | Consolidated | ||||||||||||||||||||
| Assets | |||||||||||||||||||||||
| Cash and cash equivalents | $ |
|
$ | — | $ | — | $ |
|
|||||||||||||||
|
Investments (includes $
|
|
— |
(
|
|
|||||||||||||||||||
| Due from affiliates |
|
— |
(
|
|
|||||||||||||||||||
| Other assets |
|
— |
(
|
|
|||||||||||||||||||
| Intangible assets, net |
|
— | — |
|
|||||||||||||||||||
| Right-of-use operating lease assets |
|
— | — |
|
|||||||||||||||||||
| Assets of Consolidated Funds | |||||||||||||||||||||||
| Cash and cash equivalents | — |
|
— |
|
|||||||||||||||||||
| Investments, at fair value | — |
|
|
|
|||||||||||||||||||
| Due from affiliates | — |
|
(
|
|
|||||||||||||||||||
| Receivable for securities sold | — |
|
— |
|
|||||||||||||||||||
| Other assets | — |
|
— |
|
|||||||||||||||||||
| Total assets | $ |
|
$ |
|
$ |
(
|
$ |
|
|||||||||||||||
| Liabilities | |||||||||||||||||||||||
| Accounts payable, accrued expenses and other liabilities | $ |
|
$ | — | $ |
(
|
$ |
|
|||||||||||||||
| Accrued compensation |
|
— | — |
|
|||||||||||||||||||
| Due to affiliates |
|
— | — |
|
|||||||||||||||||||
| Performance related compensation payable |
|
— | — |
|
|||||||||||||||||||
| Debt obligations |
|
— | — |
|
|||||||||||||||||||
| Operating lease liabilities |
|
— | — |
|
|||||||||||||||||||
| Liabilities of Consolidated Funds | |||||||||||||||||||||||
| Accounts payable, accrued expenses and other liabilities | — |
|
— |
|
|||||||||||||||||||
| Due to affiliates | — |
|
(
|
|
|||||||||||||||||||
| Payable for securities purchased | — |
|
— |
|
|||||||||||||||||||
| CLO loan obligations | — |
|
(
|
|
|||||||||||||||||||
| Fund borrowings | — |
|
— |
|
|||||||||||||||||||
| Total liabilities |
|
|
(
|
|
|||||||||||||||||||
| Commitments and contingencies |
|
|
|
|
|||||||||||||||||||
| Redeemable interest in Ares Operating Group entities |
|
— | — |
|
|||||||||||||||||||
| Non-controlling interest in Consolidated Funds | — |
|
(
|
|
|||||||||||||||||||
| Non-controlling interest in Ares Operating Group entities |
|
— | — |
|
|||||||||||||||||||
| Stockholders' Equity | |||||||||||||||||||||||
|
Series A Preferred Stock, $
|
|
— | — |
|
|||||||||||||||||||
|
Class A common stock, $
|
|
— | — |
|
|||||||||||||||||||
|
Class B common stock, $
|
— | — | — |
|
|||||||||||||||||||
|
Class C common stock, $
|
|
— | — |
|
|||||||||||||||||||
| Additional paid-in-capital |
|
— | — |
|
|||||||||||||||||||
| Retained earnings |
(
|
— | — |
(
|
|||||||||||||||||||
| Accumulated other comprehensive income, net of tax |
|
— | — |
|
|||||||||||||||||||
| Total stockholders' equity |
|
— | — |
|
|||||||||||||||||||
| Total equity |
|
|
(
|
|
|||||||||||||||||||
| Total liabilities, redeemable interest, non-controlling interests and equity | $ |
|
$ |
|
$ |
(
|
$ |
|
|||||||||||||||
54
Ares Management Corporation
Notes to the Unaudited Condensed Consolidated Financial Statements
(Dollars in Thousands, Except Share Data and As Otherwise Noted)
| Three months ended September 30, 2021 | |||||||||||||||||||||||
|
Consolidated
Company Entities |
Consolidated
Funds |
Eliminations | Consolidated | ||||||||||||||||||||
| Revenues | |||||||||||||||||||||||
| Management fees | $ |
|
$ | — | $ |
(
|
$ |
|
|||||||||||||||
| Carried interest allocation |
|
— |
|
|
|||||||||||||||||||
| Incentive fees |
|
— |
|
|
|||||||||||||||||||
| Principal investment income |
|
— |
(
|
|
|||||||||||||||||||
| Administrative, transaction and other fees |
|
— |
(
|
|
|||||||||||||||||||
| Total revenues |
|
|
(
|
|
|||||||||||||||||||
| Expenses | |||||||||||||||||||||||
| Compensation and benefits |
|
— |
|
|
|||||||||||||||||||
| Performance related compensation |
|
— |
|
|
|||||||||||||||||||
| General, administrative and other expense |
|
— |
|
|
|||||||||||||||||||
| Expenses of the Consolidated Funds | — |
|
(
|
|
|||||||||||||||||||
| Total expenses |
|
|
(
|
|
|||||||||||||||||||
| Other income (expense) | |||||||||||||||||||||||
| Net realized and unrealized gains on investments |
|
— |
|
|
|||||||||||||||||||
| Interest and dividend income |
|
— |
(
|
|
|||||||||||||||||||
| Interest expense |
(
|
— | — |
(
|
|||||||||||||||||||
| Other income, net |
|
— |
|
|
|||||||||||||||||||
| Net realized and unrealized gains on investments of the Consolidated Funds | — |
|
(
|
|
|||||||||||||||||||
| Interest and other income of the Consolidated Funds | — |
|
(
|
|
|||||||||||||||||||
| Interest expense of the Consolidated Funds | — |
(
|
|
(
|
|||||||||||||||||||
| Total other income |
|
|
|
|
|||||||||||||||||||
| Income before taxes |
|
|
(
|
|
|||||||||||||||||||
| Income tax expense |
|
|
|
|
|||||||||||||||||||
| Net income |
|
|
(
|
|
|||||||||||||||||||
| Less: Net income attributable to non-controlling interests in Consolidated Funds | — |
|
(
|
|
|||||||||||||||||||
| Net income attributable to Ares Operating Group entities |
|
— |
|
|
|||||||||||||||||||
| Less: Net income attributable to redeemable interest in Ares Operating Group entities |
|
— | — |
|
|||||||||||||||||||
| Less: Net income attributable to non-controlling interests in Ares Operating Group entities |
|
— | — |
|
|||||||||||||||||||
| Net income attributable to Ares Management Corporation Class A and non-voting common stockholders | $ |
|
$ | — | $ |
|
$ |
|
|||||||||||||||
55
Ares Management Corporation
Notes to the Unaudited Condensed Consolidated Financial Statements
(Dollars in Thousands, Except Share Data and As Otherwise Noted)
| Three months ended September 30, 2020 | |||||||||||||||||||||||
|
Consolidated
Company Entities |
Consolidated
Funds |
Eliminations | Consolidated | ||||||||||||||||||||
| Revenues | |||||||||||||||||||||||
| Management fees | $ |
|
$ | — | $ |
(
|
$ |
|
|||||||||||||||
| Carried interest allocation |
|
— |
|
|
|||||||||||||||||||
| Incentive fees |
|
— |
|
|
|||||||||||||||||||
| Principal investment income |
|
— |
(
|
|
|||||||||||||||||||
| Administrative, transaction and other fees |
|
— |
(
|
|
|||||||||||||||||||
| Total revenues |
|
|
(
|
|
|||||||||||||||||||
| Expenses | |||||||||||||||||||||||
| Compensation and benefits |
|
— |
|
|
|||||||||||||||||||
| Performance related compensation |
|
— |
|
|
|||||||||||||||||||
| General, administrative and other expense |
|
— |
|
|
|||||||||||||||||||
| Expenses of the Consolidated Funds | — |
|
(
|
|
|||||||||||||||||||
| Total expenses |
|
|
(
|
|
|||||||||||||||||||
| Other income (expense) | |||||||||||||||||||||||
| Net realized and unrealized gains (losses) on investments |
|
— |
(
|
(
|
|||||||||||||||||||
| Interest and dividend income |
|
— |
(
|
|
|||||||||||||||||||
| Interest expense |
(
|
— | — |
(
|
|||||||||||||||||||
| Other income (expense), net |
(
|
— |
|
|
|||||||||||||||||||
| Net realized and unrealized gains on investments of the Consolidated Funds | — |
|
|
|
|||||||||||||||||||
| Interest and other income of the Consolidated Funds | — |
|
(
|
|
|||||||||||||||||||
| Interest expense of the Consolidated Funds | — |
(
|
|
(
|
|||||||||||||||||||
| Total other income (expense) |
(
|
|
|
|
|||||||||||||||||||
| Income before taxes |
|
|
(
|
|
|||||||||||||||||||
| Income tax expense |
|
|
|
|
|||||||||||||||||||
| Net income |
|
|
(
|
|
|||||||||||||||||||
| Less: Net income attributable to non-controlling interests in Consolidated Funds | — |
|
(
|
|
|||||||||||||||||||
| Net income attributable to Ares Operating Group entities |
|
— | — |
|
|||||||||||||||||||
| Less: Net loss attributable to redeemable interest in Ares Operating Group entities |
(
|
— | — |
(
|
|||||||||||||||||||
| Less: Net income attributable to non-controlling interests in Ares Operating Group entities |
|
— |
|
|
|||||||||||||||||||
| Net income attributable to Ares Management Corporation |
|
— | — |
|
|||||||||||||||||||
| Less: Series A Preferred Stock dividends paid |
|
— |
|
|
|||||||||||||||||||
| Net income attributable to Ares Management Corporation Class A common stockholders | $ |
|
$ | — | $ |
|
$ |
|
|||||||||||||||
56
Ares Management Corporation
Notes to the Unaudited Condensed Consolidated Financial Statements
(Dollars in Thousands, Except Share Data and As Otherwise Noted)
|
Nine months ended September 30, 2021
|
|||||||||||||||||||||||
|
Consolidated
Company Entities |
Consolidated
Funds |
Eliminations | Consolidated | ||||||||||||||||||||
| Revenues | |||||||||||||||||||||||
| Management fees | $ |
|
$ | — | $ |
(
|
$ |
|
|||||||||||||||
| Carried interest allocation |
|
— | — |
|
|||||||||||||||||||
| Incentive fees |
|
— |
(
|
|
|||||||||||||||||||
| Principal investment income |
|
— |
(
|
|
|||||||||||||||||||
| Administrative, transaction and other fees |
|
— |
(
|
|
|||||||||||||||||||
| Total revenues |
|
|
(
|
|
|||||||||||||||||||
| Expenses | |||||||||||||||||||||||
| Compensation and benefits |
|
— | — |
|
|||||||||||||||||||
| Performance related compensation |
|
— | — |
|
|||||||||||||||||||
| General, administrative and other expense |
|
— | — |
|
|||||||||||||||||||
| Expenses of the Consolidated Funds | — |
|
(
|
|
|||||||||||||||||||
| Total expenses |
|
|
(
|
|
|||||||||||||||||||
| Other income (expense) | |||||||||||||||||||||||
| Net realized and unrealized gains on investments |
|
— |
|
|
|||||||||||||||||||
| Interest and dividend income |
|
— |
(
|
|
|||||||||||||||||||
| Interest expense |
(
|
— | — |
(
|
|||||||||||||||||||
| Other income, net |
|
— |
(
|
|
|||||||||||||||||||
| Net realized and unrealized gains on investments of the Consolidated Funds | — |
|
(
|
|
|||||||||||||||||||
| Interest and other income of the Consolidated Funds | — |
|
|
|
|||||||||||||||||||
| Interest expense of the Consolidated Funds | — |
(
|
|
(
|
|||||||||||||||||||
| Total other income |
|
|
|
|
|||||||||||||||||||
| Income before taxes |
|
|
(
|
|
|||||||||||||||||||
| Income tax expense |
|
|
— |
|
|||||||||||||||||||
| Net income |
|
|
(
|
|
|||||||||||||||||||
| Less: Net income attributable to non-controlling interests in Consolidated Funds | — |
|
(
|
|
|||||||||||||||||||
| Net income attributable to Ares Operating Group entities |
|
— | — |
|
|||||||||||||||||||
| Less: Net income attributable to redeemable interest in Ares Operating Group entities |
|
— | — |
|
|||||||||||||||||||
| Less: Net income attributable to non-controlling interests in Ares Operating Group entities |
|
— | — |
|
|||||||||||||||||||
| Net income attributable to Ares Management Corporation |
|
— | — |
|
|||||||||||||||||||
| Less: Series A Preferred Stock dividends paid |
|
— | — |
|
|||||||||||||||||||
| Less: Series A Preferred Stock redemption premium |
|
— | — |
|
|||||||||||||||||||
| Net income attributable to Ares Management Corporation Class A and non-voting common stockholders | $ |
|
$ | — | $ |
|
$ |
|
|||||||||||||||
57
Ares Management Corporation
Notes to the Unaudited Condensed Consolidated Financial Statements
(Dollars in Thousands, Except Share Data and As Otherwise Noted)
| Nine months ended September 30, 2020 | |||||||||||||||||||||||
|
Consolidated
Company Entities |
Consolidated
Funds |
Eliminations | Consolidated | ||||||||||||||||||||
| Revenues | |||||||||||||||||||||||
| Management fees | $ |
|
$ | — | $ |
(
|
$ |
|
|||||||||||||||
| Carried interest allocation |
|
— | — |
|
|||||||||||||||||||
| Incentive fees |
|
— |
|
|
|||||||||||||||||||
| Principal investment income (loss) |
(
|
— |
|
|
|||||||||||||||||||
| Administrative, transaction and other fees |
|
— |
(
|
|
|||||||||||||||||||
| Total revenues |
|
|
(
|
|
|||||||||||||||||||
| Expenses | |||||||||||||||||||||||
| Compensation and benefits |
|
— | — |
|
|||||||||||||||||||
| Performance related compensation |
|
— | — |
|
|||||||||||||||||||
| General, administrative and other expense |
|
— | — |
|
|||||||||||||||||||
| Expenses of the Consolidated Funds | — |
|
(
|
|
|||||||||||||||||||
| Total expenses |
|
|
(
|
|
|||||||||||||||||||
| Other income (expense) | |||||||||||||||||||||||
| Net realized and unrealized losses on investments |
(
|
— |
|
(
|
|||||||||||||||||||
| Interest and dividend income |
|
— |
(
|
|
|||||||||||||||||||
| Interest expense |
(
|
— | — |
(
|
|||||||||||||||||||
| Other income, net |
|
— |
|
|
|||||||||||||||||||
| Net realized and unrealized losses on investments of the Consolidated Funds | — |
(
|
(
|
(
|
|||||||||||||||||||
| Interest and other income of the Consolidated Funds | — |
|
(
|
|
|||||||||||||||||||
| Interest expense of the Consolidated Funds | — |
(
|
|
(
|
|||||||||||||||||||
| Total other expense |
(
|
(
|
|
(
|
|||||||||||||||||||
| Income (loss) before taxes |
|
(
|
|
|
|||||||||||||||||||
| Income tax expense |
|
|
— |
|
|||||||||||||||||||
| Net income (loss) |
|
(
|
|
|
|||||||||||||||||||
| Less: Net loss attributable to non-controlling interests in Consolidated Funds |
|
(
|
|
(
|
|||||||||||||||||||
| Net income attributable to Ares Operating Group entities |
|
— | — |
|
|||||||||||||||||||
| Less: Net loss attributable to redeemable interest in Ares Operating Group entities |
(
|
— | — |
(
|
|||||||||||||||||||
| Less: Net income attributable to non-controlling interests in Ares Operating Group entities |
|
— | — |
|
|||||||||||||||||||
| Net income attributable to Ares Management Corporation |
|
— | — |
|
|||||||||||||||||||
| Less: Series A Preferred Stock dividends paid |
|
— | — |
|
|||||||||||||||||||
| Net income attributable to Ares Management Corporation Class A common stockholders | $ |
|
$ | — | $ | — | $ |
|
|||||||||||||||
58
Ares Management Corporation
Notes to the Unaudited Condensed Consolidated Financial Statements
(Dollars in Thousands, Except Share Data and As Otherwise Noted)
|
Nine months ended September 30, 2021
|
|||||||||||||||||||||||
|
Consolidated
Company Entities |
Consolidated
Funds |
Eliminations | Consolidated | ||||||||||||||||||||
| Cash flows from operating activities: | |||||||||||||||||||||||
| Net income | $ |
|
$ |
|
$ |
(
|
$ |
|
|||||||||||||||
| Adjustments to reconcile net income to net cash provided by (used in) operating activities |
(
|
— |
|
|
|||||||||||||||||||
| Adjustments to reconcile net income to net cash used in operating activities allocable to non-controlling interests in Consolidated Funds | — |
(
|
|
(
|
|||||||||||||||||||
| Cash flows due to changes in operating assets and liabilities |
(
|
— |
|
(
|
|||||||||||||||||||
| Cash flows due to changes in operating assets and liabilities allocable to redeemable and non-controlling interest in Consolidated Funds | — |
|
(
|
(
|
|||||||||||||||||||
| Net cash provided by (used in) operating activities |
|
(
|
(
|
(
|
|||||||||||||||||||
| Cash flows from investing activities: | |||||||||||||||||||||||
| Purchase of furniture, equipment and leasehold improvements, net of disposals |
(
|
— | — |
(
|
|||||||||||||||||||
| Acquisitions, net of cash acquired |
(
|
— | — |
(
|
|||||||||||||||||||
| Net cash used in investing activities |
(
|
— | — |
(
|
|||||||||||||||||||
| Cash flows from financing activities: | |||||||||||||||||||||||
| Net proceeds from issuance of Class A and non-voting common stock |
|
— | — |
|
|||||||||||||||||||
| Proceeds from Credit Facility |
|
— | — |
|
|||||||||||||||||||
| Proceeds from subordinated notes |
|
— | — |
|
|||||||||||||||||||
| Repayments of Credit Facility |
(
|
— | — |
(
|
|||||||||||||||||||
| Dividends and distributions |
(
|
— | — |
(
|
|||||||||||||||||||
| Series A Preferred Stock dividends |
(
|
— | — |
(
|
|||||||||||||||||||
| Redemption of Series A Preferred Stock |
(
|
— | — |
(
|
|||||||||||||||||||
| Stock option exercises |
|
— | — |
|
|||||||||||||||||||
| Taxes paid related to net share settlement of equity awards |
(
|
— | — |
(
|
|||||||||||||||||||
| Other financing activities |
|
— | — |
|
|||||||||||||||||||
| Allocable to redeemable and non-controlling interests in Consolidated Funds: | |||||||||||||||||||||||
| Contributions from redeemable and non-controlling interests in Consolidated Funds | — |
|
(
|
|
|||||||||||||||||||
| Distributions to non-controlling interests in Consolidated Funds | — |
(
|
|
(
|
|||||||||||||||||||
| Borrowings under loan obligations by Consolidated Funds | — |
|
— |
|
|||||||||||||||||||
| Repayments under loan obligations by Consolidated Funds | — |
(
|
— |
(
|
|||||||||||||||||||
| Net cash provided by financing activities |
|
|
(
|
|
|||||||||||||||||||
| Effect of exchange rate changes |
(
|
(
|
|
(
|
|||||||||||||||||||
| Net change in cash and cash equivalents |
(
|
|
(
|
(
|
|||||||||||||||||||
| Cash and cash equivalents, beginning of period |
|
|
(
|
|
|||||||||||||||||||
| Cash and cash equivalents, end of period | $ |
|
$ |
|
$ |
(
|
$ |
|
|||||||||||||||
| Supplemental disclosure of non-cash financing activities: | |||||||||||||||||||||||
| Issuance of AOG Units in connection with acquisitions | $ |
|
$ | — | $ | — | $ |
|
|||||||||||||||
59
Ares Management Corporation
Notes to the Unaudited Condensed Consolidated Financial Statements
(Dollars in Thousands, Except Share Data and As Otherwise Noted)
| Nine months ended September 30, 2020 | |||||||||||||||||||||||
|
Consolidated
Company Entities |
Consolidated
Funds |
Eliminations | Consolidated | ||||||||||||||||||||
| Cash flows from operating activities: | |||||||||||||||||||||||
| Net income (loss) | $ |
|
$ |
(
|
$ |
|
$ |
|
|||||||||||||||
| Adjustments to reconcile net income to net cash provided by operating activities |
|
— |
(
|
|
|||||||||||||||||||
| Adjustments to reconcile net income to net cash used in operating activities allocable to non-controlling interests in Consolidated Funds | — |
(
|
(
|
(
|
|||||||||||||||||||
| Cash flows due to changes in operating assets and liabilities |
|
— |
(
|
|
|||||||||||||||||||
| Cash flows due to changes in operating assets and liabilities allocable to non-controlling interest in Consolidated Funds | — |
|
|
|
|||||||||||||||||||
| Net cash provided by (used in) operating activities |
|
(
|
|
|
|||||||||||||||||||
| Cash flows from investing activities: | |||||||||||||||||||||||
| Purchase of furniture, equipment and leasehold improvements, net of disposals |
(
|
— | — |
(
|
|||||||||||||||||||
| Cash paid for asset acquisition |
(
|
— | — |
(
|
|||||||||||||||||||
| Net cash used in investing activities |
(
|
— | — |
(
|
|||||||||||||||||||
| Cash flows from financing activities: | |||||||||||||||||||||||
| Proceeds from issuance of Class A common stock |
|
— | — |
|
|||||||||||||||||||
| Proceeds from Credit Facility |
|
— | — |
|
|||||||||||||||||||
| Proceeds from Senior Notes |
|
— | — |
|
|||||||||||||||||||
| Repayments of Credit Facility |
(
|
— | — |
(
|
|||||||||||||||||||
| Dividends and distributions |
(
|
— | — |
(
|
|||||||||||||||||||
| Series A Preferred Stock dividends |
(
|
— | — |
(
|
|||||||||||||||||||
| Stock option exercises |
|
— | — |
|
|||||||||||||||||||
| Taxes paid related to net share settlement of equity awards |
(
|
— | — |
(
|
|||||||||||||||||||
| Other financing activities |
(
|
— | — |
(
|
|||||||||||||||||||
| Allocable to non-controlling interests in Consolidated Funds: | |||||||||||||||||||||||
| Contributions from non-controlling interests in Consolidated Funds | — |
|
(
|
|
|||||||||||||||||||
| Distributions to non-controlling interests in Consolidated Funds | — |
(
|
|
(
|
|||||||||||||||||||
| Borrowings under loan obligations by Consolidated Funds | — |
|
|
|
|||||||||||||||||||
| Repayments under loan obligations by Consolidated Funds | — |
(
|
|
(
|
|||||||||||||||||||
| Net cash provided by financing activities |
|
|
|
|
|||||||||||||||||||
| Effect of exchange rate changes |
|
|
|
|
|||||||||||||||||||
| Net change in cash and cash equivalents |
|
(
|
|
|
|||||||||||||||||||
| Cash and cash equivalents, beginning of period |
|
|
(
|
|
|||||||||||||||||||
| Cash and cash equivalents, end of period | $ |
|
$ |
|
$ |
(
|
$ |
|
|||||||||||||||
| Supplemental disclosure of non-cash financing activities | |||||||||||||||||||||||
| Issuance of Class A common stock in connection with acquisitions | $ |
|
$ | — | $ | — | $ |
|
|||||||||||||||
60
Ares Management Corporation
Notes to the Unaudited Condensed Consolidated Financial Statements
(Dollars in Thousands, Except Share Data and As Otherwise Noted)
17. SUBSEQUENT EVENTS
The Company evaluated all events or transactions that occurred after September 30, 2021 through the date the condensed consolidated financial statements were issued. During this period, the Company had the following material subsequent events that require disclosure:
61
Item 2. Management’s Discussion and Analysis
o
f Financial Condition and Results of Operations
Ares Management Corporation is a Delaware corporation. Unless the context otherwise requires, references to “Ares,” “we,” “us,” “our,” and the “Company” are intended to mean the business and operations of Ares Management Corporation and its consolidated subsidiaries. The following discussion analyzes the financial condition and results of operations of the Company. “Consolidated Funds” refers collectively to certain Ares funds, co-investment entities, CLOs and special purpose acquisition companies that are required under generally accepted accounting principles in the United States (“GAAP”) to be consolidated in our condensed consolidated financial statements included in this Quarterly Report on Form 10-Q. Additional terms used by the Company are defined in the Glossary and throughout the Management's Discussion and Analysis in this Quarterly Report on Form 10-Q.
The following discussion and analysis should be read in conjunction with the unaudited condensed consolidated financial statements of Ares Management Corporation and the related notes included in this Quarterly Report on Form 10-Q and the audited financial statements and the related notes included in the 2020 Annual Report on Form 10-K of Ares Management Corporation and the related notes.
Amounts and percentages presented throughout our discussion and analysis of financial condition and results of operations may reflect rounded results in thousands (unless otherwise indicated) and consequently, totals may not appear to sum. In addition, illustrative charts may not be presented at scale.
Trends Affecting Our Business
We believe that our disciplined investment philosophy across our distinct but complementary investment groups contributes to the stability of our performance throughout market cycles. As of September 30, 2021, approximately 94% of our management fees were derived from perpetual capital vehicles and other long-dated funds. Our funds have a stable base of committed capital enabling us to invest in assets with a long-term focus over different points in a market cycle and to take advantage of market volatility. However, our results of operations, including the fair value of our AUM, are affected by a variety of factors, particularly in the United States and Western Europe, including conditions in the global financial markets and the economic and political environments.
Performance across global capital markets continued its positive trajectory as inflationary concerns and the spread of the COVID-19 Delta variant were overshadowed by improving corporate credit fundamentals and strengthening market demand.
Despite bouts of volatility throughout the quarter, U.S. high yield bonds had positive returns as strong company earnings, declining default rates and moderating primary market activity provided a supportive tailwind in the asset class. Specifically, the ICE BAML High Yield Master II Index, a high yield bond index, returned 0.9% in the quarter and 4.7% in the year-to-date period. Meanwhile, the Credit Suisse Leveraged Loan Index (“CSLLI”), a leveraged loan index, returned 1.1% in the quarter and 4.7% in the year-to-date period. The CSLLI resumed its rally amid ongoing retail inflows, strong CLO origination and lighter issuance. With rising interest rate risk, robust demand for lower quality, lower duration assets continued to provide a supportive technical backdrop in the asset class.
European high yield and leveraged loan markets rallied alongside its U.S. counterparts amid modest corporate earnings, strong economic data prints and a supportive technical backdrop as issuance meaningfully moderated during the quarter. The ICE BAML European Currency High Yield Index returned 0.7% in the quarter and 3.7% in the year-to-date period, while the Credit Suisse Western European Leveraged Loan Index returned 1.0% in the quarter and 3.9% in the year-to-date period.
Global equity markets were relatively flat in performance as supply chain issues, labor shortages, and complications with the COVID-19 Delta variant were prevalent during the quarter. The S&P 500 Index had positive returns of 0.6% in the quarter and 15.9% in the year-to-date period. Whereas the MSCI All Country World ex USA Index returned a negative 3.0% for the quarter and a positive 5.9% for the year-to-date period. Private equity market activity remained robust throughout the quarter as the recovery from the COVID-19 pandemic continued. This activity has extended to the secondaries markets, which continue to be robust across the private equity, real estate and infrastructure strategies during the quarter. The significant level of dry powder and availability of low-rate, competitive debt financing also helped fuel the private equity markets.
With the European and U.S. economies continuing to recover over the quarter, real estate values have continued to increase following declines from the onset of the global pandemic. Certain property types are recovering at an accelerated rate, led by the industrial subsector. Signs of stabilization are beginning to appear for the office subsector as employees return back
62
to the office, particularly in the U.S., though the sector has not fully recovered to pre-pandemic levels. The FTSE EPRA/NAREIT Developed Europe and the FTSE NAREIT All Equity REITs indices returned a negative 0.4% and a negative 0.5%, respectively, for the quarter and returned 6.9% and 19.0%, respectively, for the year-to-date period.
Managing Business Performance
Operating Metrics
We measure our business performance using certain operating metrics that are common to the alternative asset management industry, which are discussed below.
Assets Under Management
AUM refers to the assets we manage and is viewed as a metric to measure our investment and fundraising performance as it reflects assets generally at fair value plus available uncalled capital.
63
The tables below present rollforwards of our total AUM by segment:
| ($ in millions) |
Credit
Group |
Private Equity Group |
Real Estate
Group |
Secondary Solutions Group
|
Strategic Initiatives
|
Total AUM | ||||||||||||||||||||||||||||||||
|
Balance at 6/30/2021
|
$ | 167,587 | $ | 30,732 | $ | 19,725 | $ | 19,476 | $ | 10,366 | $ | 247,886 | ||||||||||||||||||||||||||
| Acquisitions | — | — | 13,719 | — | — | 13,719 | ||||||||||||||||||||||||||||||||
| Net new par/equity commitments | 9,050 | 1,977 | 2,077 | 1,130 | 213 | 14,447 | ||||||||||||||||||||||||||||||||
| Net new debt commitments | 5,533 | 200 | 250 | — | — | 5,983 | ||||||||||||||||||||||||||||||||
| Capital reductions | (381) | (2) | (41) | — | (29) | (453) | ||||||||||||||||||||||||||||||||
| Distributions | (944) | (1,491) | (707) | (535) | 202 | (3,475) | ||||||||||||||||||||||||||||||||
| Redemptions | (267) | — | (28) | — | — | (295) | ||||||||||||||||||||||||||||||||
| Change in fund value | 655 | 1,280 | 1,506 | 672 | 84 | 4,197 | ||||||||||||||||||||||||||||||||
|
Balance at 9/30/2021
|
$ | 181,233 | $ | 32,696 | $ | 36,501 | $ | 20,743 | $ | 10,836 | $ | 282,009 | ||||||||||||||||||||||||||
|
Average AUM
(1)
|
$ | 174,412 | $ | 31,715 | $ | 28,114 | $ | 20,110 | $ | 10,601 | $ | 264,952 | ||||||||||||||||||||||||||
|
Credit
Group |
Private Equity Group |
Real Estate
Group |
Secondary Solutions Group |
Strategic Initiatives
|
Total AUM | |||||||||||||||||||||||||||||||||
|
Balance at 6/30/2020
|
$ | 117,413 | $ | 26,602 | $ | 14,395 | $ | — | $ | — | $ | 158,410 | ||||||||||||||||||||||||||
| Acquisitions | — | — | — | — | 6,871 | 6,871 | ||||||||||||||||||||||||||||||||
| Net new par/equity commitments | 10,111 | 475 | 26 | — | 190 | 10,802 | ||||||||||||||||||||||||||||||||
| Net new debt commitments | 1,701 | — | 23 | — | — | 1,724 | ||||||||||||||||||||||||||||||||
| Capital reductions | (206) | (18) | (186) | — | — | (410) | ||||||||||||||||||||||||||||||||
| Distributions | (568) | (1,066) | (161) | — | (122) | (1,917) | ||||||||||||||||||||||||||||||||
| Redemptions | (301) | (5) | — | — | — | (306) | ||||||||||||||||||||||||||||||||
| Change in fund value | 3,078 | 702 | 282 | — | 1 | 4,063 | ||||||||||||||||||||||||||||||||
|
Balance at 9/30/2020
|
$ | 131,228 | $ | 26,690 | $ | 14,379 | $ | — | 6,940 | $ | 179,237 | |||||||||||||||||||||||||||
|
Average AUM
(2)
|
$ | 124,323 | $ | 26,647 | $ | 14,388 | $ | — | $ | 6,906 | $ | 172,264 | ||||||||||||||||||||||||||
| (1) Represents a two-point average of quarter-end balances for each period. | ||||||||||||||||||||||||||||||||||||||
| (2) Represents a two-point average of quarter-end balances for each period; except for Strategic Initiatives, which represents the average calculated using AUM on the date of the SSG Acquisition and the subsequent quarter-end. | ||||||||||||||||||||||||||||||||||||||
|
Credit
Group |
Private Equity Group |
Real Estate
Group |
Secondary Solutions Group |
Strategic Initiatives
|
Total AUM | |||||||||||||||||||||||||||||||||
|
Balance at 12/31/2020
|
$ | 145,472 | $ | 27,439 | $ | 14,808 | $ | — | $ | 9,261 | $ | 196,980 | ||||||||||||||||||||||||||
| Acquisitions | — | — | 13,719 | 19,513 | — | 33,232 | ||||||||||||||||||||||||||||||||
| Net new par/equity commitments | 24,999 | 2,296 | 4,745 | 1,231 | 1,393 | 34,664 | ||||||||||||||||||||||||||||||||
| Net new debt commitments | 13,496 | 200 | 2,655 | — | 29 | 16,380 | ||||||||||||||||||||||||||||||||
| Capital reductions | (2,491) | (7) | (273) | — | (29) | (2,800) | ||||||||||||||||||||||||||||||||
| Distributions | (2,504) | (3,519) | (1,370) | (659) | (178) | (8,230) | ||||||||||||||||||||||||||||||||
| Redemptions | (1,242) | — | (35) | — | — | (1,277) | ||||||||||||||||||||||||||||||||
| Change in fund value | 3,503 | 6,287 | 2,252 | 658 | 360 | 13,060 | ||||||||||||||||||||||||||||||||
|
Balance at 9/30/2021
|
$ | 181,233 | $ | 32,696 | $ | 36,501 | $ | 20,743 | $ | 10,836 | $ | 282,009 | ||||||||||||||||||||||||||
|
Average AUM
(1)
|
$ | 161,353 | $ | 29,972 | $ | 22,042 | $ | 19,911 | $ | 10,089 | $ | 243,367 | ||||||||||||||||||||||||||
|
Credit
Group |
Private Equity Group |
Real Estate
Group |
Secondary Solutions Group |
Strategic Initiatives
|
Total AUM | |||||||||||||||||||||||||||||||||
|
Balance at 12/31/2019
|
$ | 110,543 | $ | 25,166 | $ | 13,207 | $ | — | $ | — | $ | 148,916 | ||||||||||||||||||||||||||
| Acquisitions | 2,693 | — | — | — | 6,871 | 9,564 | ||||||||||||||||||||||||||||||||
| Net new par/equity commitments | 14,257 | 5,593 | 1,992 | — | 190 | 22,032 | ||||||||||||||||||||||||||||||||
| Net new debt commitments | 5,704 | — | 287 | — | — | 5,991 | ||||||||||||||||||||||||||||||||
| Capital reductions | (350) | (133) | (222) | — | — | (705) | ||||||||||||||||||||||||||||||||
| Distributions | (1,905) | (3,293) | (993) | — | (122) | (6,313) | ||||||||||||||||||||||||||||||||
| Redemptions | (1,592) | (5) | — | — | — | (1,597) | ||||||||||||||||||||||||||||||||
| Change in fund value | 1,878 | (638) | 108 | — | 1 | 1,349 | ||||||||||||||||||||||||||||||||
|
Balance at 9/30/2020
|
$ | 131,228 | $ | 26,690 | $ | 14,379 | $ | — | $ | 6,940 | $ | 179,237 | ||||||||||||||||||||||||||
|
Average AUM
(2)
|
$ | 117,924 | $ | 25,119 | $ | 14,024 | $ | — | $ | 6,906 | $ | 163,973 | ||||||||||||||||||||||||||
| (1) Represents a four-point average of quarter-end balances for each period, except for Secondary Solutions, which represents the average calculated using AUM on the date of the Landmark Acquisition and on each subsequent quarter-end. | ||||||||||||||||||||||||||||||||||||||
| (2) Represents a four-point average of quarter-end balances for each period, except for Strategic Initiatives, which represents the average calculated using AUM on the date of the SSG Acquisition and the subsequent quarter-end. | ||||||||||||||||||||||||||||||||||||||
64
The components of our AUM are presented below as of ($ in billions):
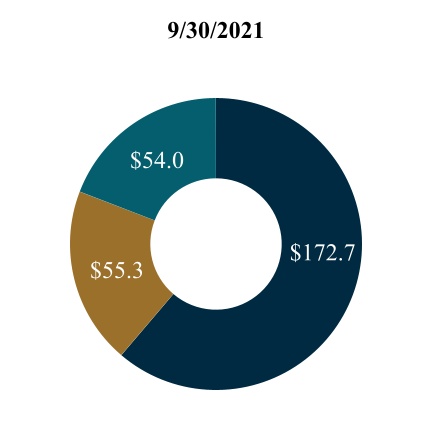
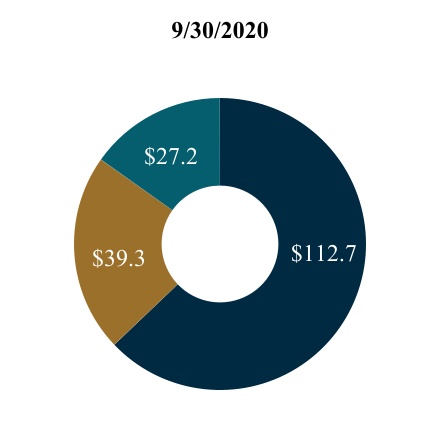
| AUM: $282.0 | AUM: $179.2 | |||||||||||||
| FPAUM | AUM not yet paying fees |
Non-fee paying
(1)(2)
|
|||||||||||||||
(1) Includes $8.5 billion of AUM of funds from which we indirectly earn management fees as of September 30, 2021 and 2020.
(2) Includes $3.1 billion and $2.2 billion of non-fee paying AUM based on our general partner commitment as of September 30, 2021 and 2020, respectively.
Please refer to “— Results of Operations by Segment” for a more detailed presentation of AUM by segment for each of the periods presented
Fee Paying Assets Under Management
FPAUM refers to AUM from which we directly earn management fees and is equal to the sum of all the individual fee bases of our funds that directly contribute to our management fees.
65
The tables below present rollforwards of our total FPAUM by segment:
| ($ in millions) |
Credit
Group |
Private Equity Group |
Real Estate
Group |
Secondary Solutions Group
|
Strategic Initiatives
|
Total | ||||||||||||||||||||||||||||||||
|
Balance at 6/30/2021
|
$ | 99,588 | $ | 18,732 | $ | 11,817 | $ | 16,927 | $ | 6,621 | $ | 153,685 | ||||||||||||||||||||||||||
| Acquisitions | — | — | 7,155 | — | — | 7,155 | ||||||||||||||||||||||||||||||||
| Commitments | 2,864 | 1,751 | 1,323 | 278 | 233 | 6,449 | ||||||||||||||||||||||||||||||||
| Subscriptions/deployment/increase in leverage | 6,095 | 576 | 1,464 | 7 | 379 | 8,521 | ||||||||||||||||||||||||||||||||
| Capital reductions | (335) | — | — | — | (121) | (456) | ||||||||||||||||||||||||||||||||
| Distributions | (1,468) | (809) | (375) | (73) | (273) | (2,998) | ||||||||||||||||||||||||||||||||
| Redemptions | (296) | — | (28) | — | — | (324) | ||||||||||||||||||||||||||||||||
| Change in fund value | (46) | 5 | 588 | 83 | 53 | 683 | ||||||||||||||||||||||||||||||||
| Change in fee basis | — | (6) | (5) | (37) | — | (48) | ||||||||||||||||||||||||||||||||
|
Balance at 9/30/2021
|
$ | 106,402 | $ | 20,249 | $ | 21,939 | $ | 17,185 | $ | 6,892 | $ | 172,667 | ||||||||||||||||||||||||||
|
Average FPAUM
(1)
|
$ | 102,997 | $ | 19,491 | $ | 16,879 | $ | 17,057 | $ | 6,757 | $ | 163,181 | ||||||||||||||||||||||||||
|
Credit
Group |
Private Equity Group |
Real Estate
Group |
Secondary Solutions Group |
Strategic Initiatives
|
Total | |||||||||||||||||||||||||||||||||
|
Balance at 6/30/2020
|
$ | 78,744 | $ | 17,473 | $ | 9,331 | $ | — | $ | — | $ | 105,548 | ||||||||||||||||||||||||||
| Acquisitions | — | — | — | — | 4,183 | 4,183 | ||||||||||||||||||||||||||||||||
| Commitments | 323 | 210 | 43 | — | — | 576 | ||||||||||||||||||||||||||||||||
| Subscriptions/deployment/increase in leverage | 2,152 | 310 | 76 | — | 278 | 2,816 | ||||||||||||||||||||||||||||||||
| Capital reductions | (547) | — | (2) | — | (22) | (571) | ||||||||||||||||||||||||||||||||
| Distributions | (686) | (219) | (85) | — | (174) | (1,164) | ||||||||||||||||||||||||||||||||
| Redemptions | (281) | — | — | — | — | (281) | ||||||||||||||||||||||||||||||||
| Change in fund value | 1,600 | (33) | 156 | — | — | 1,723 | ||||||||||||||||||||||||||||||||
| Change in fee basis | — | (22) | (86) | — | 24 | (84) | ||||||||||||||||||||||||||||||||
|
Balance at 9/30/2020
|
$ | 81,305 | $ | 17,719 | $ | 9,433 | $ | — | $ | 4,289 | $ | 112,746 | ||||||||||||||||||||||||||
|
Average FPAUM
(2)
|
$ | 80,027 | $ | 17,596 | $ | 9,383 | $ | — | $ | 4,236 | $ | 111,242 | ||||||||||||||||||||||||||
| (1) Represents a two-point average of quarter-end balances for each period. | ||||||||||||||||||||||||||||||||||||||
| (2) Represents a two-point average of quarter-end balances for each period; except for Strategic Initiatives, which represents the average calculated using FPAUM on the date of the SSG Acquisition and the subsequent quarter-end. | ||||||||||||||||||||||||||||||||||||||
|
Credit
Group |
Private Equity Group |
Real Estate
Group |
Secondary Solutions Group |
Strategic Initiatives
|
Total | |||||||||||||||||||||||||||||||||
|
Balance at 12/31/2020
|
$ | 88,017 | $ | 21,172 | $ | 10,252 | $ | — | $ | 6,596 | $ | 126,037 | ||||||||||||||||||||||||||
| Acquisitions | — | — | 7,155 | 16,839 | — | 23,994 | ||||||||||||||||||||||||||||||||
| Commitments | 6,705 | 2,171 | 2,885 | 378 | (66) | 12,073 | ||||||||||||||||||||||||||||||||
| Subscriptions/deployment/increase in leverage | 17,178 | 1,843 | 2,187 | 9 | 1,504 | 22,721 | ||||||||||||||||||||||||||||||||
| Capital reductions | (1,618) | — | (32) | — | (302) | (1,952) | ||||||||||||||||||||||||||||||||
| Distributions | (3,783) | (2,002) | (903) | (73) | (952) | (7,713) | ||||||||||||||||||||||||||||||||
| Redemptions | (1,298) | — | (35) | — | — | (1,333) | ||||||||||||||||||||||||||||||||
| Change in fund value | 1,201 | 5 | 567 | 81 | 112 | 1,966 | ||||||||||||||||||||||||||||||||
| Change in fee basis | — | (2,940) | (137) | (49) | — | (3,126) | ||||||||||||||||||||||||||||||||
|
Balance at 9/30/2021
|
$ | 106,402 | $ | 20,249 | $ | 21,939 | $ | 17,185 | $ | 6,892 | $ | 172,667 | ||||||||||||||||||||||||||
|
Average FPAUM
(1)
|
$ | 96,407 | $ | 19,670 | $ | 13,708 | $ | 16,984 | $ | 6,684 | $ | 153,453 | ||||||||||||||||||||||||||
|
Credit
Group |
Private Equity Group |
Real Estate
Group |
Secondary Solutions Group |
Strategic Initiatives
|
Total | |||||||||||||||||||||||||||||||||
|
Balance at 12/31/2019
|
$ | 71,880 | $ | 17,040 | $ | 7,963 | $ | — | $ | — | $ | 96,883 | ||||||||||||||||||||||||||
| Acquisitions | 2,596 | — | — | — | 4,183 | 6,779 | ||||||||||||||||||||||||||||||||
| Commitments | 2,844 | 210 | 1,541 | — | — | 4,595 | ||||||||||||||||||||||||||||||||
| Subscriptions/deployment/increase in leverage | 9,691 | 1,330 | 608 | — | 278 | 11,907 | ||||||||||||||||||||||||||||||||
| Capital reductions | (1,519) | — | (49) | — | (22) | (1,590) | ||||||||||||||||||||||||||||||||
| Distributions | (2,866) | (801) | (394) | — | (174) | (4,235) | ||||||||||||||||||||||||||||||||
| Redemptions | (1,605) | — | — | — | — | (1,605) | ||||||||||||||||||||||||||||||||
| Change in fund value | 324 | (39) | 161 | — | — | 446 | ||||||||||||||||||||||||||||||||
| Change in fee basis | (40) | (21) | (397) | — | 24 | (434) | ||||||||||||||||||||||||||||||||
|
Balance at 9/30/2020
|
$ | 81,305 | $ | 17,719 | $ | 9,433 | $ | — | $ | 4,289 | $ | 112,746 | ||||||||||||||||||||||||||
|
Average FPAUM
(2)
|
$ | 76,922 | $ | 17,313 | $ | 8,987 | $ | — | $ | 4,236 | $ | 107,458 | ||||||||||||||||||||||||||
| (1) Represents a four-point average of quarter-end balances for each period, except for Secondary Solutions, which represents the average calculated using FPAUM on the date of the Landmark Acquisition and on each subsequent quarter-end. | ||||||||||||||||||||||||||||||||||||||
| (2) Represents a four-point average of quarter-end balances for each period, except for Strategic Initiatives, which represents the average calculated using FPAUM on the date of the SSG Acquisition and on the subsequent quarter-end. | ||||||||||||||||||||||||||||||||||||||
66
The charts below present FPAUM by its fee basis ($ in billions):

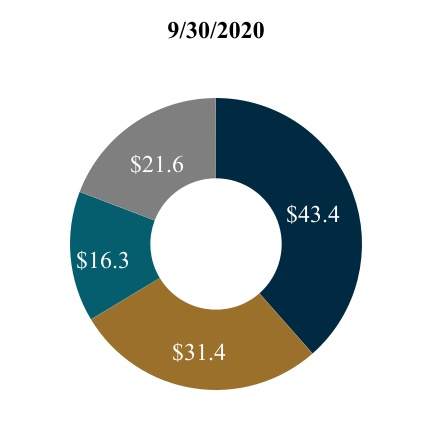
| FPAUM: $172.7 | FPAUM: $112.7 | |||||||||||||
|
Invested capital/other
(1)
|
Market value
(2)
|
Capital commitments | Collateral balances (at par) | ||||||||||||||||||||
(1)
Other consists of ACRE's FPAUM, which is based on ACRE’s stockholders’ equity.
(2)
Includes $38.3 billion and $20.3 billion from funds that primarily invest in illiquid strategies as of September 30, 2021 and 2020, respectively. The underlying investments held in these funds are generally subject to less market volatility than investments held in liquid strategies.
Please refer to “— Results of Operations by Segment” for detailed information by segment of the activity affecting total FPAUM for each of the periods presented.
Incentive Eligible Assets Under Management, Incentive Generating Assets Under Management and Available Capital
IEAUM generally represents the NAV plus uncalled equity or total assets plus uncalled debt, as applicable, of our funds from which we are entitled to receive performance income, excluding capital committed by us and our professionals (from which we do not earn performance income). With respect to ARCC's AUM, only ARCC Part II Fees may be generated from IEAUM.
IGAUM generally represents the AUM of our funds that are currently generating performance income on a realized or unrealized basis. It represents the basis on which we are entitled to receive performance income. The basis is typically the NAV or total assets of the fund, excluding amounts on which we do not earn performance income, such as capital committed by us and our professionals. ARCC is only included in IGAUM when ARCC Part II Fees are being generated.
67
The charts below present our IEAUM and IGAUM by segment ($ in billions):
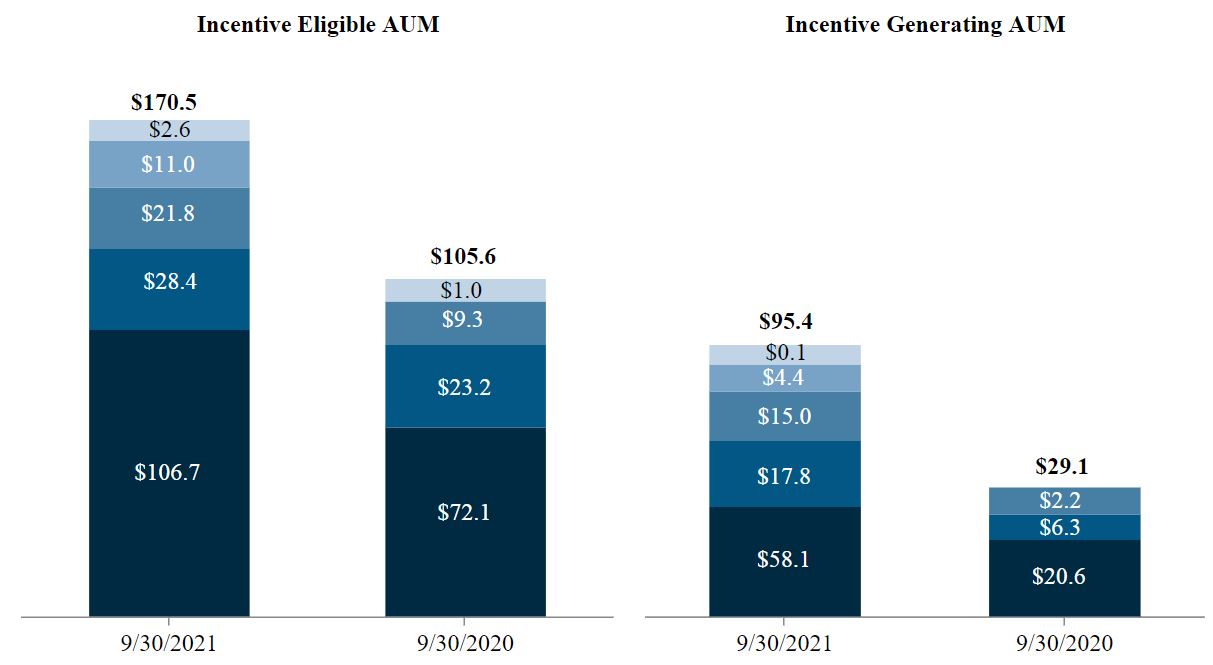
| Credit | Private Equity | Real Estate |
Secondary Solutions
|
Strategic Initiatives
|
|||||||||||||||||||||||||
The charts below present our available capital and AUM not yet paying fees by segment ($ in billions):
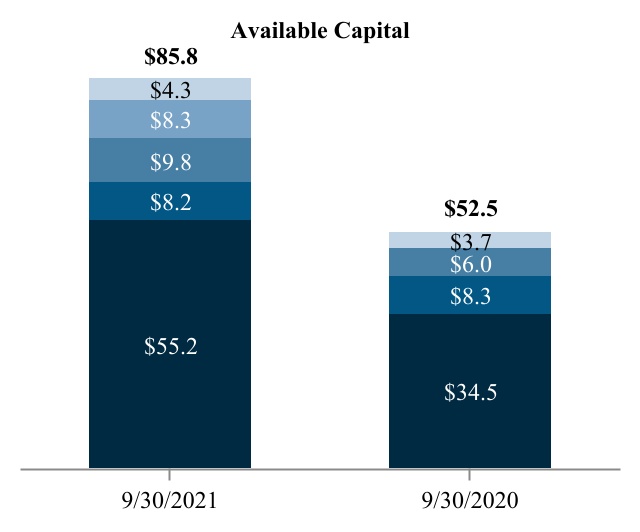
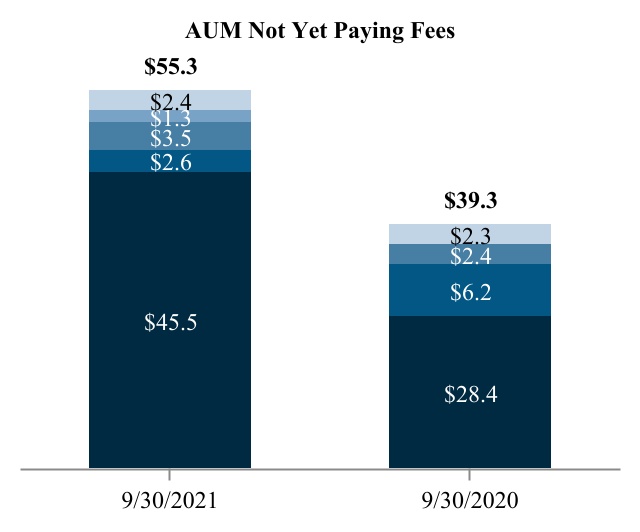
| Credit | Private Equity | Real Estate |
Secondary Solutions
|
Strategic Initiatives
|
|||||||||||||||||||||||||
As of September 30, 2021, AUM not yet paying fees of $55.3 billion could generate approximately $539.4 million in potential incremental annual management fees, of which $488.7 million relates to $50.3 billion of AUM that is available for future deployment. As of September 30, 2020, AUM not yet paying fees of $39.3 billion could have generated approximately $413.3 million in potential incremental annual management fees, of which $386.1 million relates to $36.3 billion of AUM that was available for future deployment.
68
Management Fees By Type
We view the duration of funds we manage as a metric to measure the stability of our future management fees. For both the three months ended September 30, 2021 and 2020, 94% of management fees were earned from perpetual capital or long-dated funds. The charts below present the composition of our segment management fees by the initial fund duration:
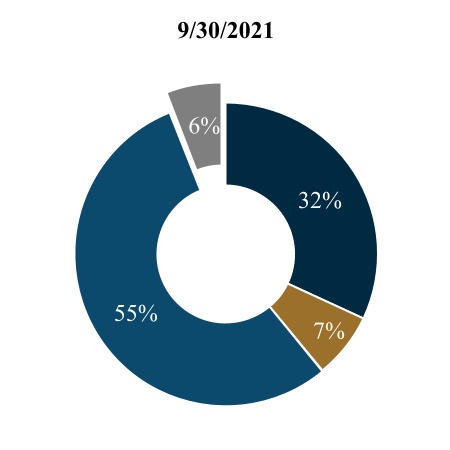
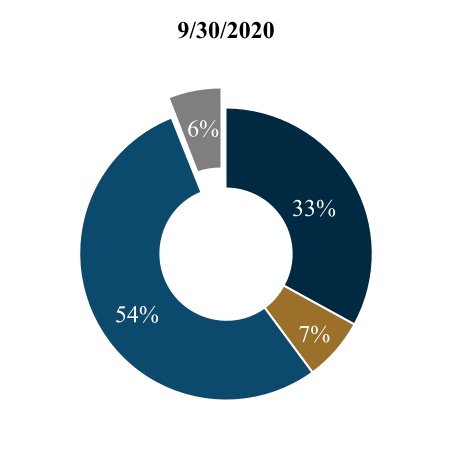
|
Perpetual Capital - Commingled Funds
|
Perpetual Capital - Managed Accounts |
Long-Dated Funds
(1)
|
Other
(2)
|
||||||||||||||||||||
(1) Long-dated funds generally have a contractual life of five years or more at inception.
(2) Other primarily represents managed accounts or co-investment vehicles that (i) are not considered long-dated and (ii) do not meet the criteria of perpetual capital.
Fund Performance Metrics
Fund performance information for our investment funds considered to be “significant funds” is included throughout this discussion with analysis to facilitate an understanding of our results of operations for the periods presented. Our significant funds are commingled funds that contributed at least 1% of our total management fees or represented at least 1% of the Company’s total FPAUM for the past two consecutive quarterly periods. In addition to management fees, each of our significant funds may generate performance income upon the achievement of performance hurdles. The fund performance information reflected in this discussion and analysis is not indicative of our overall performance. An investment in Ares is not an investment in any of our funds. Past performance is not indicative of future results. As with any investment, there is always the potential for gains as well as the possibility of losses. There can be no assurance that any of these funds or our other existing and future funds will achieve similar returns.
We do not present fund performance metrics for significant funds with less than two years of investment performance from the date of the fund's first investment, except for those significant funds that pay management fees on invested capital, in which case investment performance will be presented on the earlier of (i) the one-year anniversary of the fund's first investment or (ii) such time that the fund has invested at least 50% of its capital.
To further facilitate an understanding of the impact a significant fund may have on our results, we present our drawdown funds as either harvesting investments or deploying capital to indicate the fund's stage in its life cycle. A fund harvesting investments is generally not seeking to deploy capital into new investment opportunities, while a fund deploying capital is generally seeking new investment opportunities.
69
Consolidation and Deconsolidation of Ares Funds
In February 2021, our first sponsored SPAC, Ares Acquisition Corporation (“AAC”), consummated its initial public offering that raised capital of $1.0 billion. Prior to the completion of a business combination, the sponsor, a wholly owned subsidiary, owns the majority of the Class B ordinary shares outstanding of AAC. We consolidate AAC under the voting interest model and reflect the results of the SPAC as a Consolidated Fund.
Consolidated Funds represented approximately 5% of our AUM as of September 30, 2021, 3% of our management fees and less than 1% of our carried interest and incentive fees for the nine months ended September 30, 2021. As of September 30, 2021, we consolidated 22 CLOs, 10 private funds and one SPAC, and as of September 30, 2020, we consolidated 21 CLOs and seven private funds.
The activity of the Consolidated Funds is reflected within the condensed consolidated financial statement line items indicated by reference thereto. The impact of the Consolidated Funds also typically will decrease management fees, carried interest allocation and incentive fees reported under GAAP to the extent these are eliminated upon consolidation.
The assets and liabilities of our Consolidated Funds are held within separate legal entities and, as a result, the liabilities of our Consolidated Funds are typically non-recourse to us. Generally, the consolidation of our Consolidated Funds has a significant gross-up effect on our assets, liabilities and cash flows but has no net effect on the net income attributable to us or our stockholders' equity. The net economic ownership interests of our Consolidated Funds, to which we have no economic rights, are reflected as redeemable and non-controlling interests in the Consolidated Funds in our condensed consolidated financial statements. Redeemable interest in Consolidated Funds represent the shares issued by AAC that are redeemable for cash by the public shareholders in connection with AAC’s failure to complete a business combination or tender offer associated with stockholder approval provisions.
We generally deconsolidate funds and CLOs when we are no longer deemed to have a controlling interest in the entity. During the nine months ended September 30, 2021, we deconsolidated one CLO as a result of significant change in ownership and during the nine months ended September 30, 2020, we deconsolidated one private fund as a result of liquidation/dissolution.
The performance of our Consolidated Funds is not necessarily consistent with, or representative of, the combined performance trends of all of our funds.
For the actual impact that consolidation had on our results and further discussion on consolidation and deconsolidation of funds, see “Note 16. Consolidation” to our condensed consolidated financial statements included herein.
70
Results of Operations
Consolidated Results of Operations
We consolidate funds and entities where we are deemed to hold a controlling financial interest. The Consolidated Funds are not necessarily the same entities in each year presented due to changes in ownership, changes in limited partners' or investor rights, and the creation and termination of funds and entities. The consolidation of these funds and entities had no effect on net income attributable to us for the periods presented. As such, we separate the analysis of the Consolidated Funds and evaluate that activity in total. The following table and discussion sets forth information regarding our consolidated results of operations:
| Three months ended September 30, | Favorable (Unfavorable) | Nine months ended September 30, | Favorable (Unfavorable) | ||||||||||||||||||||||||||||||||||||||||||||
| ($ in thousands) | 2021 | 2020 | $ Change | % Change | 2021 | 2020 | $ Change | % Change | |||||||||||||||||||||||||||||||||||||||
| Revenues | |||||||||||||||||||||||||||||||||||||||||||||||
| Management fees | $ | 448,262 | $ | 292,434 | $ | 155,828 | 53% | $ | 1,135,821 | $ | 823,150 | $ | 312,671 | 38 | % | ||||||||||||||||||||||||||||||||
| Carried interest allocation | 460,651 | 168,978 | 291,673 | 173 | 1,610,707 | 241,380 | 1,369,327 | NM | |||||||||||||||||||||||||||||||||||||||
| Incentive fees | 696 | 7,194 | (6,498) | (90) | 19,420 | 4,276 | 15,144 | NM | |||||||||||||||||||||||||||||||||||||||
| Principal investment income | 14,250 | 11,408 | 2,842 | 25 | 86,477 | 8,330 | 78,147 | NM | |||||||||||||||||||||||||||||||||||||||
| Administrative, transaction and other fees | 24,860 | 9,852 | 15,008 | 152 | 49,501 | 28,897 | 20,604 | 71 | |||||||||||||||||||||||||||||||||||||||
| Total revenues | 948,719 | 489,866 | 458,853 | 94 | 2,901,926 | 1,106,033 | 1,795,893 | 162 | |||||||||||||||||||||||||||||||||||||||
| Expenses | |||||||||||||||||||||||||||||||||||||||||||||||
| Compensation and benefits | 335,569 | 194,267 | (141,302) | (73) | 837,108 | 559,482 | (277,626) | (50) | |||||||||||||||||||||||||||||||||||||||
| Performance related compensation | 331,141 | 122,356 | (208,785) | (171) | 1,208,954 | 191,565 | (1,017,389) | NM | |||||||||||||||||||||||||||||||||||||||
| General, administrative and other expenses | 134,453 | 69,938 | (64,515) | (92) | 285,471 | 190,353 | (95,118) | (50) | |||||||||||||||||||||||||||||||||||||||
| Expenses of Consolidated Funds | 12,104 | 6,019 | (6,085) | (101) | 31,575 | 16,706 | (14,869) | (89) | |||||||||||||||||||||||||||||||||||||||
| Total expenses | 813,267 | 392,580 | (420,687) | (107) | 2,363,108 | 958,106 | (1,405,002) | (147) | |||||||||||||||||||||||||||||||||||||||
| Other income (expense) | |||||||||||||||||||||||||||||||||||||||||||||||
| Net realized and unrealized gains (losses) on investments | 8,334 | (2,607) | 10,941 | NM | 18,744 | (10,351) | 29,095 | NM | |||||||||||||||||||||||||||||||||||||||
| Interest and dividend income | 1,376 | 1,344 | 32 | 2 | 6,818 | 5,112 | 1,706 | 33 | |||||||||||||||||||||||||||||||||||||||
| Interest expense | (11,523) | (6,815) | (4,708) | (69) | (25,125) | (18,203) | (6,922) | (38) | |||||||||||||||||||||||||||||||||||||||
| Other income, net | 36,654 | 2,203 | 34,451 | NM | 30,686 | 9,848 | 20,838 | 212 | |||||||||||||||||||||||||||||||||||||||
| Net realized and unrealized gains (losses) on investments of Consolidated Funds | 34,245 | 17,971 | 16,274 | 91 | 44,720 | (153,268) | 197,988 | NM | |||||||||||||||||||||||||||||||||||||||
| Interest and other income of Consolidated Funds | 104,028 | 116,581 | (12,553) | (11) | 333,745 | 346,120 | (12,375) | (4) | |||||||||||||||||||||||||||||||||||||||
| Interest expense of Consolidated Funds | (61,578) | (66,322) | 4,744 | 7 | (191,577) | (222,860) | 31,283 | 14 | |||||||||||||||||||||||||||||||||||||||
| Total other income (expense) | 111,536 | 62,355 | 49,181 | 79 | 218,011 | (43,602) | 261,613 | NM | |||||||||||||||||||||||||||||||||||||||
| Income before taxes | 246,988 | 159,641 | 87,347 | 55 | 756,829 | 104,325 | 652,504 | NM | |||||||||||||||||||||||||||||||||||||||
| Income tax expense | 30,275 | 18,314 | (11,961) | (65) | 104,487 | 22,119 | (82,368) | NM | |||||||||||||||||||||||||||||||||||||||
| Net income | 216,713 | 141,327 | 75,386 | 53 | 652,342 | 82,206 | 570,136 | NM | |||||||||||||||||||||||||||||||||||||||
| Less: Net income (loss) attributable to non-controlling interests in Consolidated Funds | 47,370 | 42,627 | 4,743 | 11 | 102,255 | (38,593) | 140,848 | NM | |||||||||||||||||||||||||||||||||||||||
| Net income attributable to Ares Operating Group entities | 169,343 | 98,700 | 70,643 | 72 | 550,087 | 120,799 | 429,288 | NM | |||||||||||||||||||||||||||||||||||||||
| Less: Net income (loss) attributable to redeemable interest in Ares Operating Group entities | 324 | (1,007) | 1,331 | NM | 693 | (1,007) | 1,700 | NM | |||||||||||||||||||||||||||||||||||||||
| Less: Net income attributable to non-controlling interests in Ares Operating Group entities | 84,293 | 52,162 | 32,131 | 62 | 264,646 | 48,926 | 215,720 | NM | |||||||||||||||||||||||||||||||||||||||
| Net income attributable to Ares Management Corporation | 84,726 | 47,545 | 37,181 | 78 | 284,748 | 72,880 | 211,868 | 291 | |||||||||||||||||||||||||||||||||||||||
| Less: Series A Preferred Stock dividends paid | — | 5,425 | (5,425) | (100) | 10,850 | 16,275 | (5,425) | (33) | |||||||||||||||||||||||||||||||||||||||
| Less: Series A Preferred Stock redemption premium | — | — | — | — | 11,239 | — | (11,239) | NM | |||||||||||||||||||||||||||||||||||||||
| Net income attributable to Ares Management Corporation Class A and non-voting common stockholders | $ | 84,726 | $ | 42,120 | 42,606 | 101 | $ | 262,659 | $ | 56,605 | 206,054 | NM | |||||||||||||||||||||||||||||||||||
NM - Not Meaningful
71
Three and Nine Months Ended September 30, 2021
Compared to Three and Nine Months Ended September 30, 2020
Consolidated Results of Operations of the Company
Management Fees.
Management fees increased by $155.8 million, or 53%, for the three months ended September 30, 2021 compared to the three months ended September 30, 2020 and by $312.7 million, or 38%, for the nine months ended September 30, 2021 compared to the nine months ended September 30, 2020.
The increase was primarily driven by higher FPAUM from capital deployment in direct lending funds.
Management fees also increased by $17.9 million for the three and nine month periods in connection with the Black Creek Acquisition that was completed on July 1, 2021. In addition, the Landmark Acquisition was completed on June 2, 2021 and contributed $41.1 million and $54.0 million for the three and nine months ended
September 30, 2021, respectively
. For detail regarding the fluctuations of management fees within each of our segments see “—Results of Operations by Segment.”
Carried Interest Allocation.
Carried interest allocation increased by $291.7 million, or 173%, for the three months ended September 30, 2021 compared to the three months ended September 30, 2020 and by $1,369.3 million for the nine months ended September 30, 2021 compared to the nine months ended September 30, 2020. The activity was principally composed of the following:
| ($ in millions) | Three months ended September 30, 2021 | Primary Drivers | Three months ended September 30, 2020 | Primary Drivers | |||||||||||||
| Credit funds | $ | 92.6 |
Primarily from four direct lending funds and one alternative credit fund with $16.1 billion of IGAUM generating returns in excess of their hurdle rates. Ares Private Credit Solutions, L.P. (“PCS”) and Ares Capital Europe IV L.P. (“ACE IV”) generated carried interest allocation of $11.7 million and $27.5 million, respectively. Ares Capital Europe V L.P. (“ACE V”) also generated $18.0 million of carried interest allocation. The carried interest allocation generated by these funds was driven by net investment income on an increasing invested capital base. Ares Capital Europe III, L.P. (“ACE III”) generated carried interest allocation of $10.5 million driven by net investment income during the period. Ares Pathfinder Fund, L.P. (“Pathfinder”) generated carried interest allocation of $16.0 million that was driven by market appreciation of various investments.
|
$ | 62.9 |
Primarily from three direct lending funds and one alternative credit fund with $10.5 billion of IGAUM generating returns in excess of their hurdle rates. PCS and ACE IV generated carried interest allocation of $19.4 million and $17.6 million, respectively, that was driven by net investment income on an increasing invested capital base. Pathfinder generated carried interest allocation of $9.7 million primarily driven by net investment income during the period. ACE III generated carried interest allocation of $9.4 million primarily due to a partial recovery of unrealized losses related to market volatility driven by the COVID-19 pandemic.
|
|||||||||||
| Private equity funds | 227.2 |
Market appreciation across several portfolio company investments, primarily operating in the services and technology, retail and healthcare industries, generated carried interest allocation of $141.5 million from Ares Corporate Opportunities V, L.P. (“ACOF V”), $72.5 million from Ares Special Opportunities Fund, L.P. (“ASOF”) and $16.9 million from Ares Corporate Opportunities VI, L.P. (“ACOF VI”). Market depreciation across several investments led to a reversal of carried interest allocation for Ares Corporate Opportunities Fund IV, L.P. (“ACOF IV”) of $6.9 million, primarily due to a lower stock price for The AZEK Company (“AZEK”), and Ares Energy Investors Fund V, L.P. (“EIF V”) of $7.1 million primarily due to a decrease in value of certain energy investments.
|
82.0 |
ACOF IV generated carried interest allocation of $43.7 million primarily driven by market appreciation of its investment in AZEK following its initial public offering. In addition, market appreciation across several investments generated carried interest allocation of $24.2 million for ASOF. The market appreciation was driven by the recovery of investment valuations from the market lows from the COVID-19 pandemic.
|
|||||||||||||
| Real estate funds | 103.5 |
Market appreciation from properties within real estate equity funds, primarily driven by gains generated across several industrial and multi-family assets, generated carried interest allocation of $11.5 million from US Real Estate Fund VIII, L.P. (“US VIII”), $35.8 million from US Real Estate Fund IX, L.P. ("US IX"), $12.7 million from Ares U.S. Real Estate Opportunity Fund III, L.P. (“AREOF III”), $11.0 million from Ares European Real Estate Fund IV, L.P. ("EF IV") and $13.8 million from Ares European Real Estate Fund V SCSp. ("EF V").
|
24.1 | Market appreciation from properties within real estate equity funds that was driven by the recovery of valuations from the market lows from the COVID-19 pandemic, primarily from two of our U.S. real estate equity funds and EF IV in the amount of $9.1 million and $11.2 million, respectively. | |||||||||||||
| Secondary solutions funds | 37.7 |
Market appreciation of certain investments held in Landmark Equity Partners XVI, L.P. (“LEP XVI”) and Landmark Real Estate Partners VIII, L.P. (“LREP VIII”) that generated carried interest allocation of $14.1 million and $17.3 million, respectively.
|
— | N/A | |||||||||||||
| Strategic initiatives funds | (0.4) | Reversal driven by the market influence of residential housing lending in Asia on certain investments held in Ares SSG Secured Lending Opportunities III, L.P. ("SLO III"). | — | N/A | |||||||||||||
| Carried interest allocation | $ | 460.6 | $ | 169.0 | |||||||||||||
72
| ($ in millions) | Nine months ended September 30, 2021 | Primary Drivers | Nine months ended September 30, 2020 | Primary Drivers | |||||||||||||
| Credit funds | $ | 292.8 |
Primarily from four direct lending funds and one alternative credit fund with $16.1 billion of IGAUM generating returns in excess of their hurdle rates. PCS and ACE IV generated carried interest allocation of $45.3 million and $84.7 million, respectively. ACE V also generated carried interest allocation of $32.5 million. The carried interest allocation generated by these funds was driven by net investment income on an increasing invested capital base. ACE III generated carried interest allocation of $36.4 million primarily driven by net investment income during the period. In addition, Pathfinder generated carried interest allocation of $43.3 million that was driven by market appreciation of various investments.
|
$ | 77.9 | Primarily from two direct lending funds and one alternative credit fund with $8.0 billion of IGAUM generating returns in excess of their hurdle rates. PCS and ACE IV generated carried interest allocation of $25.7 million and $34.1 million, respectively, driven by net investment income on an increasing invested capital base that was partially offset by net unrealized losses on investments that were primarily incurred during the first quarter of 2020 due to the market volatility driven by the COVID-19 pandemic. Pathfinder generated carried interest allocation of $10.1 million primarily driven by net investment income during the period. | |||||||||||
| Private equity funds | 992.0 |
ACOF IV generated carried interest allocation of $171.1 million primarily due to market appreciation of its investment in AZEK driven by its higher stock price. In addition, market appreciation across several portfolio company investments, primarily operating in the services and technology, retail and healthcare industries, generated carried interest allocation of $532.2 million from ACOF V, $192.4 million from ASOF and $63.9 million from ACOF VI.
|
152.6 | ACOF IV generated carried interest allocation of $199.7 million primarily due to market appreciation of its investment in AZEK following its initial public offering. In addition, market appreciation across several investments generated carried interest allocation of $53.1 million for ASOF. Market depreciation across several investments led to the reversal of unrealized carried interest allocation of $75.1 million for ACOF V and $27.4 million for Ares Energy Opportunities Fund, L.P. ("AEOF"). The market depreciation for investments of these funds was driven by depressed prices in the energy market. | |||||||||||||
| Real estate funds | 226.9 |
Market appreciation from properties within real estate equity funds, primarily driven by gains generated across several industrial and multi-family assets, generated carried interest allocation of $33.1 million from US VIII, $61.6 million from US IX, $17.5 million from AREOF III, $10.9 million from EF IV and $61.3 million from EF V.
|
10.9 | Market appreciation from properties within real estate equity funds that was driven by the recovery of valuations from the market lows from the COVID-19 pandemic. In addition, there were gains generated in multiple funds resulting from the sale of a pan-European logistics portfolio at a higher price than the December 31, 2019 price. This activity was offset by net market depreciation that led to the reversal of unrealized carried interest allocation, primarily from US IX and EF IV in the amount of $6.8 million and $4.6 million, respectively. | |||||||||||||
| Secondary solutions funds | 98.9 |
Market appreciation of certain investments held in LEP XVI and LREP VIII that generated carried interest allocation of $54.6 million and $26.1 million, respectively.
|
— | N/A | |||||||||||||
| Strategic initiatives funds | 0.1 | Market appreciation of certain investments held in SLO III. | — | N/A | |||||||||||||
| Carried interest allocation | $ | 1,610.7 | $ | 241.4 | |||||||||||||
73
Incentive Fees.
Incentive fees decreased by $6.5 million, or 90%, for the three months ended September 30, 2021 compared to the three months ended September 30, 2020 and increased by $15.1 million for the nine months ended September 30, 2021 compared to the nine months ended September 30, 2020. The activity was principally composed of the following:
| ($ in millions) | Three months ended September 30, 2021 | Primary Drivers | Three months ended September 30, 2020 | Primary Drivers | |||||||||||||
| Credit funds | $ | 0.1 | Incentive fees that crystallized during the period from one alternative credit fund. | $ | 7.2 | Incentive fees that crystallized during the period from one alternative credit fund. | |||||||||||
| Real estate funds | 0.6 | Incentive fees generated from ACRE. | — | No activity. | |||||||||||||
| Incentive fees | $ | 0.7 | $ | 7.2 | |||||||||||||
| ($ in millions) | Nine months ended September 30, 2021 | Primary Drivers | Nine months ended September 30, 2020 | Primary Drivers | |||||||||||||
| Credit funds | $ | 17.5 | Incentive fees that crystallized during the period from one alternative credit fund and from one CLO as a result of restructuring activity. | $ | 4.0 | Incentive fees that crystallized during the period from one alternative credit fund, partially offset by a one-time reversal of incentive fees following management's decision to extend the measurement period after the fees were crystallized. | |||||||||||
| Real estate funds | 1.9 | Incentive fees generated from ACRE. | 0.3 | Incentive fees generated from ACRE. | |||||||||||||
| Incentive fees | $ | 19.4 | $ | 4.3 | |||||||||||||
Principal Investment Income.
Principal investment income increased by $2.8 million, or 25%, for the three months ended September 30, 2021 compared to the three months ended September 30, 2020 and by $78.1 million for the nine months ended September 30, 2021 compared to the nine months ended September 30, 2020. The activity for the three months ended September 30, 2021 was driven by market appreciation of several investments in funds within our private equity secondaries, real estate secondaries and special opportunities strategies. The activity for the nine months ended September 30, 2021 was primarily driven by market appreciation of various investments within our corporate private equity extended value fund, ACOF VI and within our private equity secondaries, real estate secondaries and special opportunities strategies. The COVID-19 pandemic caused extreme volatility during 2020. The global equity and credit markets experienced significant downturns in the first quarter of 2020 that were followed by a recovery in the second and third quarters of 2020.
Administrative, Transaction and Other Fees.
Administrative, transaction and other fees increased by $15.0 million, or 152%, for the three months ended September 30, 2021 compared to the three months ended September 30, 2020 and by $20.6 million, or 71%, for the nine months ended September 30, 2021 compared to the nine months ended September 30, 2020. The increase was primarily due to new fee streams following the completion of the Black Creek Acquisition. Black Creek serves as an integrated property development and real estate investment management specialist, generating various property-related fees, such as acquisition, development and property management, and the distribution of shares in our non-traded REITs. These fees collectively contributed $6.0 million for the three and nine months ended September 30, 2021. We also earn fees from the Black Creek funds that we manage for administrative and other services, which contributed $5.3 million for the three and nine months ended September 30, 2021. Separately, administrative fees from private funds increased by $1.2 million and $3.0 million for the three and nine months ended September 30, 2021 compared to the three and nine months ended September 30, 2020, respectively. Certain private credit funds pay administrative fees on invested capital and an increase in deployment resulted in an increase to this fee base. The increase for the nine months ended September 30, 2021 compared to the nine months ended September 30, 2020 was also driven by higher transaction fees for certain funds as a result of increased originations.
Compensation and Benefits.
Compensation and benefits increased by $141.3 million, or 73%, for the three months ended September 30, 2021 compared to the three months ended September 30, 2020 and by $277.6 million, or 50%, for the nine months ended September 30, 2021 compared to the nine months ended September 30, 2020. The increase was primarily driven by headcount growth to support the expansion of our business, other strategic initiatives and acquisitions, and by higher incentive compensation and equity compensation attributable to improved operating performance and margin expansion from scaling our business. Average headcount for the year-to-date period increased by 25% to 1,674 professionals for the 2021 period from 1,336 professionals for the same period in 2020. Headcount growth attributable to the Landmark Acquisition and Black Creek Acquisition contributed $39.4 million and $45.0 million in recurring employment related costs to the three and nine months ended September 30, 2021, respectively. The performance-based, acquisition-related compensation arrangements
74
that were established in connection with the Landmark Acquisition and Black Creek Acquisition also contributed $28.2 million and $32.8 million to the three and nine months ended September 30, 2021, respectively. Compensation and benefits are further driven by an increase in Part I Fees compensation of $7.8 million and $19.6 million for the three and nine months ended September 30, 2021, respectively, when compared to the same periods in 2020. Part I Fees compensation is driven by Part I Fees revenue earned during the respective periods.
The following table presents equity compensation expense based on the different types of restricted unit awards. Amounts presented include recurring expense, accelerated expense recognized in connection with the achievement of a performance condition and reversal of previously recognized expense resulting from forfeitures.
| Three months ended September 30, | Favorable (Unfavorable) | Nine months ended September 30, | Favorable (Unfavorable) | |||||||||||||||||||||||||||||||||||||||||||||||||||||
| ($ in thousands) | 2021 | 2020 | $ Change | % Change | 2021 | 2020 | $ Change | % Change | ||||||||||||||||||||||||||||||||||||||||||||||||
| Non-recurring awards: | ||||||||||||||||||||||||||||||||||||||||||||||||||||||||
| Multi-year future grants | $ | 8,588 | $ | — | $ | (8,588) | —% | $ | 25,966 | $ | — | $ | (25,966) | —% | ||||||||||||||||||||||||||||||||||||||||||
| Performance-based awards | 186 | 300 | 114 | 38 | 20,499 | 980 | (19,519) | NM | ||||||||||||||||||||||||||||||||||||||||||||||||
| Performance-based awards - accelerated | 29,415 | — | (29,415) | — | 43,426 | 3,749 | (39,677) | NM | ||||||||||||||||||||||||||||||||||||||||||||||||
| Other non-recurring awards | 4,397 | 7,664 | 3,267 | 43 | 16,887 | 20,236 | 3,349 | 17 | ||||||||||||||||||||||||||||||||||||||||||||||||
| Total non-recurring awards | 42,586 | 7,964 | (34,622) | NM | 106,778 | 24,965 | (81,813) | NM | ||||||||||||||||||||||||||||||||||||||||||||||||
| Recurring annual awards: | ||||||||||||||||||||||||||||||||||||||||||||||||||||||||
| Discretionary awards | 11,986 | 13,274 | 1,288 | 10 | 47,938 | 36,709 | (11,229) | (31) | ||||||||||||||||||||||||||||||||||||||||||||||||
| Bonus awards | 11,419 | 9,098 | (2,321) | (26) | 36,428 | 29,902 | (6,526) | (22) | ||||||||||||||||||||||||||||||||||||||||||||||||
| Total recurring annual awards | 23,405 | 22,372 | (1,033) | (5) | 84,366 | 66,611 | (17,755) | (27) | ||||||||||||||||||||||||||||||||||||||||||||||||
| Equity compensation expense, net | $ | 65,991 | $ | 30,336 | (35,655) | (118) | $ | 191,144 | $ | 91,576 | (99,568) | (109) | ||||||||||||||||||||||||||||||||||||||||||||
Equity compensation expense increased by $35.7 million and by $99.6 million for the three and nine months ended September 30, 2021 compared to the three and nine months ended September 30, 2020, respectively, primarily due to performance-based restricted units granted to certain executive officers in the first quarter of 2021 and to the approval of multi-year future grant awards to these executive officers, as well as to certain other senior leaders, that will be granted during the first quarter of 2022, 2023 and 2024. The 2021 periods included accelerated expense from the performance-based restricted awards from the vesting of Tranche II, III and IV of the performance-based restricted units as a result of meeting the applicable performance condition of $60.00, $65.00 and $75.00 per share, respectively, during the third quarter of 2021 and the vesting of Tranche I as a result of meeting the applicable performance condition of $55.00 per share during the second quarter of 2021. The nine months ended September 30, 2020 also included accelerated expense from the vesting of restricted units granted to our Chief Executive Officer as a result of achieving the applicable performance conditions of $35.00 per share. Additional equity compensation expense was incurred for the three and nine months ended September 30, 2021 from an increase in units awarded as part of the recurring annual award programs.
For detail regarding the fluctuations of compensation and benefits within each of our segments see “—Results of Operations by Segment."
Performance Related Compensation.
Performance related compensation increased by $208.8 million, or 171%, for the three months ended September 30, 2021 compared to the three months ended September 30, 2020 and by $1,017.4 million for the nine months ended September 30, 2021 compared to the nine months ended September 30, 2020. Changes in performance related compensation are directly associated with the changes in carried interest allocation and incentive fees described above and may include performance allocations to charitable organizations as part of our philanthropic initiatives.
General, Administrative and Other Expenses.
General, administrative and other expenses increased by $64.5 million, or 92%, for the three months ended September 30, 2021 compared to the three months ended September 30, 2020 and by $95.1 million, or 50%, for the nine months ended September 30, 2021 compared to the nine months ended September 30, 2020. The Landmark Acquisition and Black Creek Acquisition have contributed $31.1 million and $37.9 million in general, administrative and other expenses to the three and nine months ended September 30, 2021, respectively. These expenses were primarily driven by amortization expense of $20.1 million and $26.8 million for the three and nine months ended September 30, 2021, respectively, related to the intangible assets recorded in connection with the Landmark Acquisition during the second quarter of 2021 and the Black Creek Acquisition during the third quarter of 2021. In addition, the SSG Acquisition during the second half of 2020 resulted in an increase in amortization expense of $17.8 million for the nine months ended September 30, 2021 when compared to the same period in 2020.
75
Placement fees for the three and nine months ended September 30, 2021 increased by $33.3 million and $22.4 million, respectively, primarily due to new commitments to Ares Private Credit Solutions II, L.P. (“PCS II”) and our second U.S. senior direct lending fund. Certain expenses have also increased during the current period, including occupancy costs to support our growing headcount and information services and information technology to support the expansion of our business. Collectively, these expenses increased by $5.2 million and $10.6 million for the three and nine months ended September 30, 2021, respectively, when compared to the same periods in 2020. The increase was also driven by higher professional service fees of $4.0 million and $7.4 million, respectively, for the three and nine months ended September 30, 2021, largely as a result of due diligence and legal expenses related to our recent acquisitions and higher recruiting fees to support the expanding platform.
There continue to be positive developments in the recovery from the COVID-19 pandemic that have reduced restrictions on travel and gathering. Those operating expenses that were impacted by the pandemic, particularly marketing sponsorships and events, increased during the third quarter of 2021.For the three months ended September 30, 2021, our travel, entertainment and marketing sponsorships expenses increased by $2.3 million when compared to the same period in 2020. We, however,
recognized cost savings when comparing the nine months ended September 30, 2021 and 2020. For the three months ended March 31, 2020, our expenses reflected a pre-pandemic cost structure and are not comparable to the lower expenses incurred in our modified work environment during the three months ended March 31, 2021.
Our operating expenses, most notably travel, entertainment and marketing sponsorships, and certain office services and fringe benefits from the modified remote working environment, decreased by $5.8 million for the nine months ended September 30, 2021, when compared to the same period in 2020. These expenses were $18.2 million lower for the nine months ended September 30, 2021 when compared to the pre-pandemic period in 2019, primarily driven by $12.2 million of travel expenses and $2.9 million of marketing expenses.
During the third quarter of 2020, we also recorded $3.8 million in one-time expenses related to expense concessions made to a limited number of funds.
Net Realized and Unrealized Gains (Losses) on Investments.
Net realized and unrealized gains (losses) on investments increased from a loss of $2.6 million for the three months ended September 30, 2020 to a gain of $8.3 million for the three months ended September 30, 2021 and from a loss of $10.4 million for the nine months ended September 30, 2020 to a gain of $18.7 million for the nine months ended September 30, 2021. The activity for the three and nine months ended September 30, 2021 was primarily attributable to unrealized gains on certain strategic initiative related investments and on our U.S. CLO investments. The activity for the three months ended September 30, 2020 was primarily attributable to unrealized losses of certain strategic initiative related investments. The unrealized loss was partially offset by unrealized gains from CLO securities due to prices rebounding from the market lows that were driven by the COVID-19 pandemic. The activity for the nine months ended September 30, 2020 was primarily attributable to an unrealized loss from market depreciation of properties held by an investment vehicle in our U.S. real estate equity strategy, to net unrealized losses from CLO securities driven by the COVID-19 pandemic and unrealized losses of certain strategic initiative related investments.
Interest Expense
. Interest expense increased by $4.7 million, or 69%, for the three months ended September 30, 2021 compared to the three months ended September 30, 2020 and by $6.9 million, or 38%, for the nine months ended September 30, 2021 compared to the nine months ended September 30, 2020. The issuance of the 2051 Subordinated Notes on the last day of the second quarter increased interest expense by $4.7 million for both the three and nine months ended September 30, 2021. The issuance of the 2030 Senior Notes late in the second quarter of 2020 increased interest expense by $6.1 million for the nine months ended September 30, 2021. The increase for the nine months ended September 30, 2020 was partially offset by a lower average outstanding balance of the Credit Facility in the current year period compared to the prior year period.
Other Income, Net.
Other income, net increased by $34.5 million for the three months ended September 30, 2021 compared to the three months ended September 30, 2020 and by $20.8 million, or 212%, for the nine months ended September 30, 2021 compared to the nine months ended September 30, 2020. Other income, net for the three and nine months ended September 30, 2021 included a $42.3 million bargain purchase gain from the Black Creek Acquisition. The bargain purchase gain resulted from the fair value of the identifiable tangible and intangible assets that we acquired exceeding the purchase consideration. The purchase agreement with Black Creek contains provisions that required us to record a contingent liability that is excluded from purchase consideration as its payment is subject to the continued and future services of senior professionals and advisors. Other income, net also includes the changes in fair value of contingent obligations recognized in connection with the Black Creek Acquisition. For the three and nine months ended September 30, 2021, we recorded $7.2 million in expense for the revaluation of contingent obligations. See “Note 9. Commitments and Contingencies” for a further description of the contingencies.
Other income, net also includes transaction gains (losses) associated with currency fluctuations impacting the revaluation of non-functional currency balances and is based on the fluctuations in currency exchange rates. Transaction gains
76
(losses) fluctuated during the nine months ended September 30, 2021 primarily attributable to the British pound strengthening against Euro and creating transaction losses, and the fluctuation during the nine months ended September 30, 2020 was primarily attributable to the British pound weakening against the U.S. dollar and creating transaction gains.
Income Tax Expense
Income tax expense increased by $12.0 million, or 65%, for the three months ended September 30, 2021 compared to the three months ended September 30, 2020 and by $82.4 million for the nine months ended September 30, 2021 compared to the nine months ended September 30, 2020.
The changes in the comparative periods are primarily a result of increases in taxable income and weighted average daily ownership. The weighted average daily ownership for Ares Management Corporation (“AMC”) common stockholders increased from 55.6% and 53.3% for the three and nine months ended September 30, 2020, respectively, to 58.5% and 58.3% for the three and nine months ended September 30, 2021, respectively. The changes in ownership were primarily driven by the issuance of Class A common stock in connection with stock option exercises, vesting of restricted stock awards and private and public offerings of Class A and non-voting common stock. The increase in the weighted average daily ownership for the AMC common stockholders was partially offset by the issuance of AOG Units in connection with the Landmark Acquisition and the Black Creek Acquisition that increased the ownership of AOG Units not held by AMC.
Redeemable and Non-Controlling Interests.
Net income (loss) attributable to redeemable and non-controlling interests in AOG entities represents results attributable to the holders of AOG Units and other ownership interests that are not held by AMC. In connection with the SSG Acquisition, the former owners of SSG retained an ownership interest in a subsidiary of an AOG entity that is reflected as redeemable interest in AOG entities. Net income attributable to redeemable interest in AOG entities is allocated based on the ownership percentage for periods presented.
Net income (loss) attributable to non-controlling interests in AOG entities is generally allocated based on the weighted average daily ownership of the other AOG unitholders, except for income (loss) generated from certain joint venture partnerships. Net income (loss) is allocated to other strategic distribution partners with whom we have established joint ventures based on the respective ownership percentages and to Crestline Denali Class B membership interests based on the activity of those financial interests. For the three and nine months ended September 30, 2021 and 2020, net income of $1.7 million, $3.4 million, $2.9 million, and net loss of $12.3 million, respectively, was also allocated to the Crestline Denali Class B membership interests related to the gains and losses from those CLO securities held.
Net income attributable to non-controlling interests in AOG entities increased by $32.1 million, or 62%, for the three months ended September 30, 2021 compared to the three months ended September 30, 2020 and by $215.7 million for the nine months ended September 30, 2021 compared to the nine months ended September 30, 2020. The changes in the comparative periods are a result of the respective changes in income before taxes and weighted average daily ownership. While income before taxes increased, the weighted average daily ownership for the non-controlling AOG unitholders decreased from 44.4% and 46.7% for the three and nine months ended September 30, 2020, respectively to 41.5% and 41.7% for the three and nine months ended September 30, 2021, respectively.
77
Consolidated Results of Operations of the Consolidated Funds
The following table presents the results of operations of the Consolidated Funds:
| Three months ended September 30, | Favorable (Unfavorable) | Nine months ended September 30, | Favorable (Unfavorable) | |||||||||||||||||||||||||||||||||||||||||||||||
| ($ in thousands) | 2021 | 2020 | $ Change | % Change | 2021 | 2020 | $ Change | % Change | ||||||||||||||||||||||||||||||||||||||||||
| Expenses of the Consolidated Funds | $ | (12,104) | $ | (6,019) | $ | (6,085) | (101)% | $ | (31,575) | $ | (16,706) | $ | (14,869) | (89)% | ||||||||||||||||||||||||||||||||||||
| Net realized and unrealized gains (losses) on investments of Consolidated Funds | 34,245 | 17,971 | 16,274 | 91 | 44,720 | (153,268) | 197,988 | NM | ||||||||||||||||||||||||||||||||||||||||||
| Interest and other income of Consolidated Funds | 104,028 | 116,581 | (12,553) | (11) | 333,745 | 346,120 | (12,375) | (4) | ||||||||||||||||||||||||||||||||||||||||||
| Interest expense of Consolidated Funds | (61,578) | (66,322) | 4,744 | 7 | (191,577) | (222,860) | 31,283 | 14 | ||||||||||||||||||||||||||||||||||||||||||
| Income (loss) before taxes | 64,591 | 62,211 | 2,380 | 4 | 155,313 | (46,714) | 202,027 | NM | ||||||||||||||||||||||||||||||||||||||||||
| Income tax expense of Consolidated Funds | (2) | (117) | 115 | 98 | (76) | (147) | 71 | 48 | ||||||||||||||||||||||||||||||||||||||||||
| Net income (loss) | 64,589 | 62,094 | 2,495 | 4 | 155,237 | (46,861) | 202,098 | NM | ||||||||||||||||||||||||||||||||||||||||||
| Less: Revenues attributable to Ares Management Corporation eliminated upon consolidation | 21,784 | 22,839 | (1,055) | (5) | 58,072 | 12,499 | 45,573 | NM | ||||||||||||||||||||||||||||||||||||||||||
| Less: Other expense, net attributable to Ares Management Corporation eliminated upon consolidation | (4,565) | (3,372) | (1,193) | (35) | (5,090) | (20,767) | 15,677 | 75 | ||||||||||||||||||||||||||||||||||||||||||
| Net income (loss) attributable to non-controlling interests in Consolidated Funds | $ | 47,370 | $ | 42,627 | 4,743 | 11 | $ | 102,255 | $ | (38,593) | 140,848 | NM | ||||||||||||||||||||||||||||||||||||||
NM - Not Meaningful
The results of operations of the Consolidated Funds primarily represents activity from certain CLOs that we are deemed to control. Expenses primarily reflect professional fees that were incurred as a result of debt issuance costs related to the issuance of new, refinanced or restructured CLOs. These fees were expensed in the period incurred, as CLO debt is recorded at fair value on our Consolidated Statements of Financial Condition. For the three and nine months ended September 30, 2021, expenses were driven by professional fees incurred from the issuance of a new U.S. CLO. The nine months ended September 30, 2021 also included the issuance of another new U.S. CLO and the restructure of our European CLO legal entities. For the three and nine months ended September 30, 2020, expenses were primarily driven by the issuance of one European CLO. Net realized and unrealized gains fluctuated for the comparative periods, primarily due to a significant change in the value of loans held by the CLOs. The CSLLI returned 1.1% and 4.7% for the quarter and year-to-date period of 2021 when compared to a 4.1% and negative 0.8% for the quarter and year-to-date period of 2020. The decrease in interest expense was attributable to the lower interest rates from newly issued and refinanced CLOs since the third quarter of 2020.
Revenues and other income (expense) attributable to AMC represents management fees, incentive fees, principal investment income and administrative, transaction and other fees that are attributable to AMC’s proportional share in the activity of the Consolidated Funds and is eliminated from the respective components of AMC's results upon consolidation. The activity for other income (expense) and principal investment income was primarily due to the price fluctuations associated with the COVID-19 pandemic previously mentioned, resulting in a decrease for the three months ended September 30, 2021 compared to the three months ended September 30, 2020 and an increase for the nine months ended September 30, 2021 compared to the nine months ended September 30, 2020.
Segment Analysis
For segment reporting purposes, revenues and expenses are presented before giving effect to the results of our Consolidated Funds and the results attributable to non-controlling interests of joint ventures that we consolidate. As a result, segment revenues from management fees, performance income and investment income are different than those presented on a consolidated basis in accordance with GAAP. Revenues recognized from Consolidated Funds are eliminated in consolidation and results attributable to the non-controlling interests of joint ventures have been excluded by us. Furthermore, expenses and the effects of other income (expense) are different than related amounts presented on a consolidated basis in accordance with GAAP due to the exclusion of the results of Consolidated Funds and the non-controlling interests of joint ventures.
78
Non-GAAP Financial Measures
We use the following non-GAAP measures to make operating decisions, assess performance and allocate resources:
•
Fee Related Earnings (“FRE”)
•
Realized Income (“RI”)
These non-GAAP financial measures supplement and should be considered in addition to and not in lieu of, the results of operations, which are discussed further under “—Components of Consolidated Results of Operations” and are prepared in accordance with GAAP.
The following table sets forth FRE and RI by reportable segment and OMG:
| Three months ended September 30, | Favorable (Unfavorable) | Nine months ended September 30, | Favorable (Unfavorable) | ||||||||||||||||||||||||||||||||||||||||||||
| ($ in thousands) | 2021 | 2020 | $ Change | % Change | 2021 | 2020 | $ Change | % Change | |||||||||||||||||||||||||||||||||||||||
| Fee Related Earnings: | |||||||||||||||||||||||||||||||||||||||||||||||
| Credit Group | $ | 175,957 | $ | 125,107 | $ | 50,850 | 41% | $ | 492,697 | $ | 354,964 | $ | 137,733 | 39% | |||||||||||||||||||||||||||||||||
| Private Equity Group | 36,950 | 27,429 | 9,521 | 35 | 80,712 | 81,319 | (607) | (1) | |||||||||||||||||||||||||||||||||||||||
| Real Estate Group | 24,261 | 7,794 | 16,467 | 211 | 47,375 | 24,831 | 22,544 | 91 | |||||||||||||||||||||||||||||||||||||||
|
Secondary Solutions Group
|
26,516 | — | 26,516 | NM | 34,266 | — | 34,266 | NM | |||||||||||||||||||||||||||||||||||||||
|
Strategic Initiatives
|
9,456 | 7,571 | 1,885 | 25 | 28,025 | 7,571 | 20,454 | 270 | |||||||||||||||||||||||||||||||||||||||
| Operations Management Group | (90,803) | (61,070) | (29,733) | (49) | (225,369) | (171,793) | (53,576) | (31) | |||||||||||||||||||||||||||||||||||||||
| Fee Related Earnings | $ | 182,337 | $ | 106,831 | 75,506 | 71 | $ | 457,706 | $ | 296,892 | 160,814 | 54 | |||||||||||||||||||||||||||||||||||
| Realized Income: | |||||||||||||||||||||||||||||||||||||||||||||||
| Credit Group | $ | 182,152 | $ | 127,667 | $ | 54,485 | 43% | $ | 532,359 | $ | 364,839 | $ | 167,520 | 46% | |||||||||||||||||||||||||||||||||
| Private Equity Group | 47,938 | 65,342 | (17,404) | (27) | 122,477 | 166,963 | (44,486) | (27) | |||||||||||||||||||||||||||||||||||||||
| Real Estate Group | 26,722 | 8,275 | 18,447 | 223 | 55,607 | 36,502 | 19,105 | 52 | |||||||||||||||||||||||||||||||||||||||
| Secondary Solutions Group | 26,788 | — | 26,788 | NM | 34,535 | — | 34,535 | NM | |||||||||||||||||||||||||||||||||||||||
|
Strategic Initiatives
|
6,509 | 6,838 | (329) | (5) | 23,234 | 6,838 | 16,396 | 240 | |||||||||||||||||||||||||||||||||||||||
| Operations Management Group | (91,233) | (61,714) | (29,519) | (48) | (225,596) | (179,341) | (46,255) | (26) | |||||||||||||||||||||||||||||||||||||||
| Realized Income | $ | 198,876 | $ | 146,408 | 52,468 | 36 | $ | 542,616 | $ | 395,801 | 146,815 | 37 | |||||||||||||||||||||||||||||||||||
NM - Not Meaningful
79
Income before provision for income taxes is the GAAP financial measure most comparable to RI and FRE. The following table presents the reconciliation of income before taxes as reported in the Condensed Consolidated Statements of Operations to RI and FRE of the reportable segments and OMG:
| Three months ended September 30, | Nine months ended September 30, | ||||||||||||||||||||||
| ($ in thousands) | 2021 | 2020 | 2021 | 2020 | |||||||||||||||||||
| Income before taxes | $ | 246,988 | $ | 159,641 | $ | 756,829 | $ | 104,325 | |||||||||||||||
| Adjustments: | |||||||||||||||||||||||
| Depreciation and amortization expense | 36,668 | 14,336 | 71,742 | 26,197 | |||||||||||||||||||
| Equity compensation expense | 65,991 | 30,336 | 191,144 | 91,576 | |||||||||||||||||||
|
Acquisition-related compensation expense
(1)
|
28,194 | — | 32,824 | — | |||||||||||||||||||
| Acquisition and merger-related expense | 7,967 | 3,490 | 26,188 | 9,815 | |||||||||||||||||||
| Deferred placement fees | 32,413 | 2,942 | 33,740 | 18,677 | |||||||||||||||||||
| Other (income) expense, net | (42,025) | 9,518 | (42,490) | 9,518 | |||||||||||||||||||
| Net (income) expense of non-controlling interests in consolidated subsidiaries | (5,268) | (1,066) | (8,614) | 15,681 | |||||||||||||||||||
| (Income) loss before taxes of non-controlling interests in Consolidated Funds, net of eliminations | (47,372) | (42,744) | (102,331) | 38,446 | |||||||||||||||||||
| Total performance (income) loss—unrealized | (415,317) | (52,488) | (1,381,697) | 77,866 | |||||||||||||||||||
| Total performance related compensation—unrealized | 296,044 | 24,818 | 1,022,393 | (61,010) | |||||||||||||||||||
| Total net investment (income) loss—unrealized | (5,407) | (2,375) | (57,112) | 64,710 | |||||||||||||||||||
| Realized Income | 198,876 | 146,408 | 542,616 | 395,801 | |||||||||||||||||||
| Total performance income—realized | (45,341) | (123,265) | (249,989) | (319,660) | |||||||||||||||||||
| Total performance related compensation—realized | 33,728 | 97,538 | 185,306 | 252,575 | |||||||||||||||||||
| Total investment income—realized | (4,926) | (13,850) | (20,227) | (31,824) | |||||||||||||||||||
| Fee Related Earnings | $ | 182,337 | $ | 106,831 | $ | 457,706 | $ | 296,892 | |||||||||||||||
(1)
Represents compensation expense associated with contingent obligations recorded in connection with the Landmark Acquisition and the Black Creek Acquisition and is presented in compensation and benefits in the Company’s Condensed Consolidated Statements of Operations.
For the specific components and calculations of these non-GAAP measures, as well as a reconciliation of the reportable segments to the most comparable measures in accordance with GAAP, see “Note 15. Segment Reporting”, to our unaudited condensed consolidated financial statements included in this Quarterly Report on Form 10-Q. Discussed below are our results of operations for our reportable segments and OMG.
80
Results of Operations by Segment
Credit Group—Three and Nine Months Ended September 30, 2021
Compared to Three and Nine Months Ended September 30, 2020
Fee Related Earnings:
The following table presents the components of the Credit Group's FRE:
| Three months ended September 30, | Favorable (Unfavorable) | Nine months ended September 30, | Favorable (Unfavorable) | ||||||||||||||||||||||||||||||||||||||||||||
| ($ in thousands) | 2021 | 2020 | $ Change | % Change | 2021 | 2020 | $ Change | % Change | |||||||||||||||||||||||||||||||||||||||
| Management fees | $ | 271,591 | $ | 208,371 | $ | 63,220 | 30% | $ | 764,702 | $ | 606,596 | $ | 158,106 | 26% | |||||||||||||||||||||||||||||||||
| Other fees | 5,798 | 4,898 | 900 | 18 | 18,494 | 12,057 | 6,437 | 53 | |||||||||||||||||||||||||||||||||||||||
| Compensation and benefits | (86,502) | (74,373) | (12,129) | (16) | (252,783) | (222,063) | (30,720) | (14) | |||||||||||||||||||||||||||||||||||||||
| General, administrative and other expenses | (14,930) | (13,789) | (1,141) | (8) | (37,716) | (41,626) | 3,910 | 9 | |||||||||||||||||||||||||||||||||||||||
| Fee Related Earnings | $ | 175,957 | $ | 125,107 | 50,850 | 41 | $ | 492,697 | $ | 354,964 | 137,733 | 39 | |||||||||||||||||||||||||||||||||||
Management Fees.
The chart below presents Credit Group management fees and effective management fee rates:

Management fees on existing direct lending funds increased primarily from deployment of capital with Pathfinder, ACE IV, ACE V and Ares Senior Direct Lending Fund L.P. (“SDL”), collectively generating additional fees of $17.0 million and $43.0 million for the three and nine months ended September 30, 2021 compared to the three and nine months ended September 30, 2020, respectively. Management fees from ARCC, excluding Part I Fees described below, increased by $12.2 million and $22.8 million over the respective periods primarily due to an increase in the average size of ARCC's portfolio. The remaining increases in management fees from funds in existence in both periods was primarily driven by deployment of capital in other direct lending funds and SMAs. Part I Fees increased primarily due to an increase in pre-incentive fee net investment income generated by ARCC and CADC, driven by an increase in originations and in the average size of their portfolios. Management fees from CLOs also increased primarily due to the net addition of six CLOs for the three months ended
81
September 30, 2021 compared to the three months ended September 30, 2020 and seven CLOs for the nine months ended September 30, 2021 compared to the nine months ended September 30, 2020. The launch of PCS II and our second U.S. senior direct lending fund also contributed to the increase in management fees, generating fees of $4.0 million and $5.8 million for the three and nine months ended September 30, 2021, respectively.
Other Fees.
Other fees increased by $0.9 million, or 18%, for the three months ended September 30, 2021 compared to the three months ended September 30, 2020 and increased by $6.4 million, or 53%, for the nine months ended September 30, 2021 compared to the nine months ended September 30, 2020. The increases were primarily driven by administrative fees from private funds. Certain private credit funds pay administrative fees on invested capital and an increase in deployment resulted in an increase to the fee basis. The increase for the nine months ended September 30, 2021 compared to the nine months ended September 30, 2020 was also driven by higher transaction fees for certain funds as a result of increased originations.
Compensation and Benefits.
Compensation and benefits increased by $12.1 million, or 16%, for the three months ended September 30, 2021 compared to the three months ended September 30, 2020 and by $30.7 million, or 14%, for the nine months ended September 30, 2021 compared to the nine months ended September 30, 2020. The increase was primarily driven by an increase in Part I Fees compensation of $7.8 million and $19.6 million, by higher incentive compensation attributable to improved operating performance and margin expansion from scaling our business and by headcount growth and merit increases for the three and nine months ended September 30, 2021, respectively, when compared to the same periods in 2020.
The increases in compensation and benefits were further driven by increases in payroll related taxes
of $4.2 million and $5.4 million for the three and nine months ended September 30, 2021 compared to the three and nine months ended September 30, 2020, respectively, primarily attributable to the vesting of non-recurring equity compensation awards. The increase in salaries and benefits is partially offset by lower discretionary payments made during the nine months ended September 30, 2021 when compared to the same period in 2020.
Average headcount for the year-to-date period increased by 6% to 429 investment and investment support professionals for the 2021 period from 406 professionals for the same period in 2020 as we added additional investment professionals to support our growing U.S. and European direct lending platforms.
General, Administrative and Other Expenses.
General, administrative and other expenses increased by $1.1 million, or 8%, for the three months ended September 30, 2021 compared to the three months ended September 30, 2020 and decreased by $3.9 million, or 9%, for the nine months ended September 30, 2021 compared to the nine months ended September 30, 2020. In connection with our fundraising efforts, placement fees have increased by $1.8 million and $2.5 million for the three and nine months ended September 30, 2021, respectively, when compared to the same periods in 2020. The increases were primarily associated with new commitments to PCS II and our second U.S. senior direct lending fund. Certain expenses have also increased during the current period, including information services and information technology to support the expansion of our business. Collectively, these expenses increased by $0.9 million and $1.6 million for the three and nine months ended September 30, 2021, respectively, when compared to the same periods in 2020.
There continue to be positive developments in the recovery from the COVID-19 pandemic that have reduced restrictions on travel and gathering. Those operating expenses that were impacted by the pandemic, particularly marketing sponsorships and events, increased during the third quarter of 2021. For the three months ended September 30, 2021, our travel, entertainment and marketing sponsorships expenses increased by $0.9 million when compared to the same period in 2020. We, however,
recognized cost savings when comparing the nine months ended September 30, 2021 and 2020. For the three months ended March 31, 2020, our expenses reflected a pre-pandemic cost structure and are not comparable to the lower expenses incurred in our modified work environment during the three months ended March 31, 2021.
Our operating expenses, most notably travel, entertainment and marketing sponsorships, and certain office services and fringe benefits from the modified remote working environment, decreased by $3.6 million for the nine months ended September 30, 2021, when compared to the same period in 2020.
During the third quarter of 2020, we also recorded $3.2 million in one-time expenses related to expense concessions made to a limited number of funds.
82
Realized Income:
The following table presents the components of the Credit Group's RI:
| Three months ended September 30, | Favorable (Unfavorable) | Nine months ended September 30, | Favorable (Unfavorable) | ||||||||||||||||||||||||||||||||||||||||||||
| ($ in thousands) | 2021 | 2020 | $ Change | % Change | 2021 | 2020 | $ Change | % Change | |||||||||||||||||||||||||||||||||||||||
| Fee Related Earnings | $ | 175,957 | $ | 125,107 | $ | 50,850 | 41 | % | $ | 492,697 | $ | 354,964 | $ | 137,733 | 39 | % | |||||||||||||||||||||||||||||||
| Performance income—realized | 6,332 | 7,069 | (737) | (10) | 78,255 | 16,085 | 62,170 | NM | |||||||||||||||||||||||||||||||||||||||
| Performance related compensation—realized | (3,079) | (4,131) | 1,052 | 25 | (49,433) | (12,142) | (37,291) | NM | |||||||||||||||||||||||||||||||||||||||
| Realized net performance income | 3,253 | 2,938 | 315 | 11 | 28,822 | 3,943 | 24,879 | NM | |||||||||||||||||||||||||||||||||||||||
| Investment income (loss)—realized | 618 | — | 618 | NM | 1,858 | (843) | 2,701 | NM | |||||||||||||||||||||||||||||||||||||||
| Interest and other investment income—realized | 4,716 | 1,962 | 2,754 | 140 | 14,354 | 13,166 | 1,188 | 9 | |||||||||||||||||||||||||||||||||||||||
| Interest expense | (2,392) | (2,340) | (52) | (2) | (5,372) | (6,391) | 1,019 | 16 | |||||||||||||||||||||||||||||||||||||||
| Realized net investment income (loss) | 2,942 | (378) | 3,320 | NM | 10,840 | 5,932 | 4,908 | 83 | |||||||||||||||||||||||||||||||||||||||
| Realized Income | $ | 182,152 | $ | 127,667 | 54,485 | 43 | $ | 532,359 | $ | 364,839 | 167,520 | 46 | |||||||||||||||||||||||||||||||||||
NM - Not Meaningful
Realized net performance income for the three and nine months ended September 30, 2021 and 2020 was primarily attributable to tax distributions on direct lending funds with European-style waterfalls, driven by net investment income on an increasing invested capital base of those funds. The tax distributions were made to provide cash sufficient to pay tax liabilities attributable to the funds’ taxable income that is allocated to its carry participants prior to the funds making carried interest distributions. Realized net performance income for the three months ended September 30, 2020 was also attributable to incentive fees for an alternative credit fund that crystallized during the period.
Realized net investment income for the three and nine months ended September 30, 2021 and 2020 was primarily attributable to interest income generated from our CLO investments as well as income recognized in connection with distributions from an alternative credit fund. Realized net investment income for the nine months ended September 30, 2021 also included income recognized in connection with distributions from a commercial finance fund, while the three and nine months ended September 30, 2020 included a term loan investment that generated interest income.
83
Credit Group— Carried Interest and Incentive Fees
The following table presents the accrued carried interest and incentive fees receivable, also referred to as accrued performance income, and related performance compensation for the Credit Group:
| As of September 30, 2021 |
As of December 31, 2020
|
||||||||||||||||||||||||||||||||||
| ($ in thousands) | Accrued Performance Income | Accrued Performance Compensation | Accrued Net Performance Income | Accrued Performance Income | Accrued Performance Compensation | Accrued Net Performance Income | |||||||||||||||||||||||||||||
| Accrued Carried Interest | |||||||||||||||||||||||||||||||||||
| ACE III | $ | 105,850 | $ | 63,510 | $ | 42,340 | $ | 77,959 | $ | 46,776 | $ | 31,183 | |||||||||||||||||||||||
| ACE IV | 151,198 | 93,743 | 57,455 | 93,462 | 57,946 | 35,516 | |||||||||||||||||||||||||||||
| ACE V | 34,929 | 20,958 | 13,971 | 2,435 | 1,461 | 974 | |||||||||||||||||||||||||||||
| PCS | 130,163 | 76,768 | 53,395 | 101,656 | 60,084 | 41,572 | |||||||||||||||||||||||||||||
| Other credit funds | 188,874 | 123,892 | 64,982 | 97,803 | 60,437 | 37,366 | |||||||||||||||||||||||||||||
| Total accrued carried interest | 611,014 | 378,871 | 232,143 | 373,315 | 226,704 | 146,611 | |||||||||||||||||||||||||||||
| Incentive fees | 1,333 | 805 | 528 | 31,653 | 18,601 | 13,052 | |||||||||||||||||||||||||||||
| Total Credit Group | $ | 612,347 | $ | 379,676 | $ | 232,671 | $ | 404,968 | $ | 245,305 | $ | 159,663 | |||||||||||||||||||||||
The following table presents the change in accrued carried interest during the period for the Credit Group:
| As of December 31, 2020 | Activity during the period | As of September 30, 2021 | ||||||||||||||||||||||||||||||||||||
| ($ in thousands) | Waterfall Type | Accrued Carried Interest | Change in Unrealized | Realized | Other Adjustments | Accrued Carried Interest | ||||||||||||||||||||||||||||||||
| ACE III | European | $ | 77,959 | $ | 36,443 | $ | (8,646) | $ | 94 | $ | 105,850 | |||||||||||||||||||||||||||
| ACE IV | European | 93,462 | 84,720 | (26,984) | — | 151,198 | ||||||||||||||||||||||||||||||||
| ACE V | European | 2,435 | 32,494 | — | — | 34,929 | ||||||||||||||||||||||||||||||||
| PCS | European | 101,656 | 45,332 | (17,525) | 700 | 130,163 | ||||||||||||||||||||||||||||||||
| Other credit funds | European | 97,545 | 93,641 | (6,089) | 3,522 | 188,619 | ||||||||||||||||||||||||||||||||
| Other credit funds | American | 258 | (3) | — | — | 255 | ||||||||||||||||||||||||||||||||
| Total Credit Group | $ | 373,315 | $ | 292,627 | $ | (59,244) | $ | 4,316 | $ | 611,014 | ||||||||||||||||||||||||||||
84
Credit Group—Assets Under Management
The tables below present rollforwards of AUM for the Credit Group:
| ($ in millions) | Syndicated Loans |
High
Yield |
Multi-Asset Credit | Alternative Credit | U.S. Direct Lending | European Direct Lending | Total Credit Group | ||||||||||||||||||||||||||||||||||||||||
| Balance at 6/30/2021 | $ | 29,306 | $ | 3,152 | $ | 3,929 | $ | 14,493 | $ | 68,586 | $ | 48,121 | $ | 167,587 | |||||||||||||||||||||||||||||||||
| Net new par/equity commitments | 151 | 284 | 427 | 3,173 | 3,795 | 1,220 | 9,050 | ||||||||||||||||||||||||||||||||||||||||
| Net new debt commitments | 1,010 | — | 100 | — | 3,670 | 753 | 5,533 | ||||||||||||||||||||||||||||||||||||||||
| Capital reductions | (339) | — | — | — | (43) | 1 | (381) | ||||||||||||||||||||||||||||||||||||||||
| Distributions | (21) | — | 14 | (273) | (392) | (272) | (944) | ||||||||||||||||||||||||||||||||||||||||
| Redemptions | (82) | (81) | (65) | — | (39) | — | (267) | ||||||||||||||||||||||||||||||||||||||||
| Change in fund value | (90) | 36 | 56 | 123 | 776 | (246) | 655 | ||||||||||||||||||||||||||||||||||||||||
| Balance at 9/30/2021 | $ | 29,935 | $ | 3,391 | $ | 4,461 | $ | 17,516 | $ | 76,353 | $ | 49,577 | $ | 181,233 | |||||||||||||||||||||||||||||||||
|
Average AUM
(1)
|
$ | 29,621 | $ | 3,272 | $ | 4,195 | $ | 16,005 | $ | 72,470 | $ | 48,849 | $ | 174,412 | |||||||||||||||||||||||||||||||||
| Syndicated Loans |
High
Yield |
Multi-Asset Credit | Alternative Credit | U.S. Direct Lending | European Direct Lending | Total Credit Group | |||||||||||||||||||||||||||||||||||||||||
| Balance at 6/30/2020 | $ | 25,451 | $ | 2,660 | $ | 2,812 | $ | 8,821 | $ | 50,784 | $ | 26,885 | $ | 117,413 | |||||||||||||||||||||||||||||||||
| Net new par/equity commitments | 19 | 139 | 1 | 1,017 | 139 | 8,796 | 10,111 | ||||||||||||||||||||||||||||||||||||||||
| Net new debt commitments | 501 | — | — | — | 1,200 | — | 1,701 | ||||||||||||||||||||||||||||||||||||||||
| Capital reductions | (38) | — | — | — | (46) | (122) | (206) | ||||||||||||||||||||||||||||||||||||||||
| Distributions | (19) | — | (7) | (115) | (239) | (188) | (568) | ||||||||||||||||||||||||||||||||||||||||
| Redemptions | (64) | (213) | (4) | — | (20) | — | (301) | ||||||||||||||||||||||||||||||||||||||||
| Change in fund value | 304 | 117 | 111 | 381 | 953 | 1,212 | 3,078 | ||||||||||||||||||||||||||||||||||||||||
| Balance at 9/30/2020 | $ | 26,154 | $ | 2,703 | $ | 2,913 | $ | 10,104 | $ | 52,771 | $ | 36,583 | $ | 131,228 | |||||||||||||||||||||||||||||||||
|
Average AUM
(1)
|
$ | 25,803 | $ | 2,682 | $ | 2,863 | $ | 9,463 | $ | 51,778 | $ | 31,734 | $ | 124,323 | |||||||||||||||||||||||||||||||||
| (1) Represents the quarterly average of beginning and ending balances. | |||||||||||||||||||||||||||||||||||||||||||||||
| Syndicated Loans |
High
Yield |
Multi-Asset Credit | Alternative Credit | U.S. Direct Lending | European Direct Lending | Total Credit Group | |||||||||||||||||||||||||||||||||||||||||
| Balance at 12/31/2020 | $ | 27,967 | $ | 2,863 | $ | 2,953 | $ | 12,897 | $ | 56,516 | $ | 42,276 | $ | 145,472 | |||||||||||||||||||||||||||||||||
| Net new par/equity commitments | 754 | 609 | 1,388 | 4,968 | 12,395 | 4,885 | 24,999 | ||||||||||||||||||||||||||||||||||||||||
| Net new debt commitments | 2,306 | — | 100 | — | 7,966 | 3,124 | 13,496 | ||||||||||||||||||||||||||||||||||||||||
| Capital reductions | (603) | — | — | — | (1,801) | (87) | (2,491) | ||||||||||||||||||||||||||||||||||||||||
| Distributions | (81) | — | 8 | (467) | (1,129) | (835) | (2,504) | ||||||||||||||||||||||||||||||||||||||||
| Redemptions | (249) | (237) | (206) | (415) | (124) | (11) | (1,242) | ||||||||||||||||||||||||||||||||||||||||
| Change in fund value | (159) | 156 | 218 | 533 | 2,530 | 225 | 3,503 | ||||||||||||||||||||||||||||||||||||||||
| Balance at 9/30/2021 | $ | 29,935 | $ | 3,391 | $ | 4,461 | $ | 17,516 | $ | 76,353 | $ | 49,577 | $ | 181,233 | |||||||||||||||||||||||||||||||||
|
Average AUM
(1)
|
$ | 28,913 | $ | 3,083 | $ | 3,669 | $ | 14,712 | $ | 65,202 | $ | 45,774 | $ | 161,353 | |||||||||||||||||||||||||||||||||
| Syndicated Loans |
High
Yield |
Multi-Asset Credit | Alternative Credit | U.S. Direct Lending | European Direct Lending | Total Credit Group | |||||||||||||||||||||||||||||||||||||||||
| Balance at 12/31/2019 | $ | 22,320 | $ | 3,492 | $ | 2,611 | $ | 7,571 | $ | 48,431 | $ | 26,118 | $ | 110,543 | |||||||||||||||||||||||||||||||||
| Acquisitions | 2,693 | — | — | — | — | — | 2,693 | ||||||||||||||||||||||||||||||||||||||||
| Net new par/equity commitments | 140 | 367 | 431 | 2,874 | 1,553 | 8,892 | 14,257 | ||||||||||||||||||||||||||||||||||||||||
| Net new debt commitments | 1,236 | — | — | — | 3,349 | 1,119 | 5,704 | ||||||||||||||||||||||||||||||||||||||||
| Capital reductions | (70) | — | — | — | (128) | (152) | (350) | ||||||||||||||||||||||||||||||||||||||||
| Distributions | (52) | — | (15) | (299) | (899) | (640) | (1,905) | ||||||||||||||||||||||||||||||||||||||||
| Redemptions | (241) | (1,093) | (96) | (96) | (66) | — | (1,592) | ||||||||||||||||||||||||||||||||||||||||
| Change in fund value | 128 | (63) | (18) | 54 | 531 | 1,246 | 1,878 | ||||||||||||||||||||||||||||||||||||||||
| Balance at 9/30/2020 | $ | 26,154 | $ | 2,703 | $ | 2,913 | $ | 10,104 | $ | 52,771 | $ | 36,583 | $ | 131,228 | |||||||||||||||||||||||||||||||||
|
Average AUM
(1)
|
$ | 24,649 | $ | 2,922 | $ | 2,640 | $ | 8,495 | $ | 50,306 | $ | 28,912 | $ | 117,924 | |||||||||||||||||||||||||||||||||
| (1) Represents a four-point average of quarter-end balances for each period. | |||||||||||||||||||||||||||||||||||||||||||||||
85
The components of our AUM for the Credit Group are presented below ($ in billions):
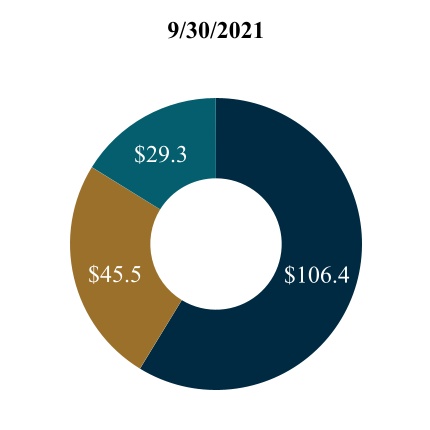
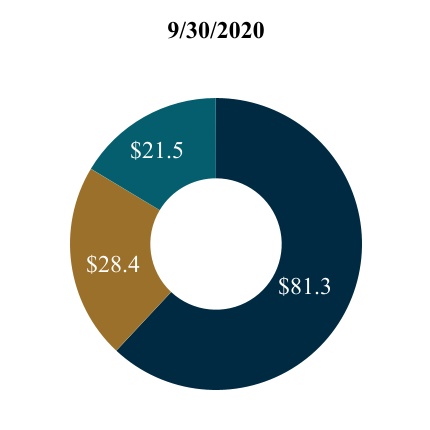
| AUM: $181.2 | AUM: $131.2 | |||||||||||||
| FPAUM | AUM not yet paying fees |
Non-fee paying
(1)(2)
|
||||||||||||||||||
(1) Includes $8.5 billion of AUM of funds from which we indirectly earn management fees as of September 30, 2021 and 2020.
(2) Includes $1.0 billion and $0.6 billion of non-fee paying AUM based on our general partner commitment as of September 30, 2021 and 2020, respectively.
86
Credit Group—Fee Paying AUM
The tables below present rollforwards of fee paying AUM for the Credit Group:
| ($ in millions) | Syndicated Loans |
High
Yield |
Multi-Asset Credit | Alternative Credit | U.S. Direct Lending | European Direct Lending | Total Credit Group | |||||||||||||||||||||||||||||||||||||
| Balance at 6/30/2021 | $ | 28,211 | $ | 3,149 | $ | 3,423 | $ | 7,916 | $ | 36,101 | $ | 20,788 | $ | 99,588 | ||||||||||||||||||||||||||||||
| Commitments | 1,099 | 284 | 514 | 303 | 664 | — | 2,864 | |||||||||||||||||||||||||||||||||||||
| Subscriptions/deployment/increase in leverage | 19 | — | 41 | 391 | 3,153 | 2,491 | 6,095 | |||||||||||||||||||||||||||||||||||||
| Capital reductions | (290) | — | — | — | (36) | (9) | (335) | |||||||||||||||||||||||||||||||||||||
| Distributions | (15) | — | (34) | (201) | (1,108) | (110) | (1,468) | |||||||||||||||||||||||||||||||||||||
| Redemptions | (82) | (77) | (61) | — | (40) | (36) | (296) | |||||||||||||||||||||||||||||||||||||
| Change in fund value | (128) | 35 | 53 | (90) | 390 | (306) | (46) | |||||||||||||||||||||||||||||||||||||
| Balance at 9/30/2021 | $ | 28,814 | $ | 3,391 | $ | 3,936 | $ | 8,319 | $ | 39,124 | $ | 22,818 | $ | 106,402 | ||||||||||||||||||||||||||||||
|
Average FPAUM
(1)
|
$ | 28,513 | $ | 3,270 | $ | 3,680 | $ | 8,118 | $ | 37,613 | $ | 21,803 | $ | 102,997 | ||||||||||||||||||||||||||||||
| Syndicated Loans |
High
Yield |
Multi-Asset Credit | Alternative Credit | U.S. Direct Lending | European Direct Lending | Total Credit Group | ||||||||||||||||||||||||||||||||||||||
| Balance at 6/30/2020 | $ | 24,832 | $ | 2,621 | $ | 2,278 | $ | 5,352 | $ | 28,679 | $ | 14,982 | $ | 78,744 | ||||||||||||||||||||||||||||||
| Commitments | 9 | 126 | 1 | 48 | 139 | — | 323 | |||||||||||||||||||||||||||||||||||||
| Subscriptions/deployment/increase in leverage | 15 | 13 | 7 | 152 | 1,699 | 266 | 2,152 | |||||||||||||||||||||||||||||||||||||
| Capital reductions | (38) | — | — | (227) | (27) | (255) | (547) | |||||||||||||||||||||||||||||||||||||
| Distributions | (13) | — | (10) | (161) | (373) | (129) | (686) | |||||||||||||||||||||||||||||||||||||
| Redemptions | (64) | (185) | (11) | — | (20) | (1) | (281) | |||||||||||||||||||||||||||||||||||||
| Change in fund value | 226 | 116 | 108 | 194 | 468 | 488 | 1,600 | |||||||||||||||||||||||||||||||||||||
| Balance at 9/30/2020 | $ | 24,967 | $ | 2,691 | $ | 2,373 | $ | 5,358 | $ | 30,565 | $ | 15,351 | $ | 81,305 | ||||||||||||||||||||||||||||||
|
Average FPAUM
(1)
|
$ | 24,900 | $ | 2,657 | $ | 2,326 | $ | 5,355 | $ | 29,622 | $ | 15,167 | $ | 80,027 | ||||||||||||||||||||||||||||||
| (1) Represents the quarterly average of beginning and ending balances. | ||||||||||||||||||||||||||||||||||||||||||||
| Syndicated Loans |
High
Yield |
Multi-Asset Credit | Alternative Credit | U.S. Direct Lending | European Direct Lending | Total Credit Group | ||||||||||||||||||||||||||||||||||||||
| Balance at 12/31/2020 | $ | 27,171 | $ | 2,861 | $ | 2,457 | $ | 6,331 | $ | 32,337 | $ | 16,860 | $ | 88,017 | ||||||||||||||||||||||||||||||
| Commitments | 2,265 | 609 | 1,194 | 1,119 | 1,518 | — | 6,705 | |||||||||||||||||||||||||||||||||||||
| Subscriptions/deployment/increase in leverage | 714 | — | 356 | 1,694 | 7,463 | 6,951 | 17,178 | |||||||||||||||||||||||||||||||||||||
| Capital reductions | (554) | — | (18) | — | (790) | (256) | (1,618) | |||||||||||||||||||||||||||||||||||||
| Distributions | (37) | — | (68) | (441) | (2,656) | (581) | (3,783) | |||||||||||||||||||||||||||||||||||||
| Redemptions | (249) | (234) | (189) | (294) | (99) | (233) | (1,298) | |||||||||||||||||||||||||||||||||||||
| Change in fund value | (496) | 155 | 204 | (90) | 1,351 | 77 | 1,201 | |||||||||||||||||||||||||||||||||||||
| Balance at 9/30/2021 | $ | 28,814 | $ | 3,391 | $ | 3,936 | $ | 8,319 | $ | 39,124 | $ | 22,818 | $ | 106,402 | ||||||||||||||||||||||||||||||
|
Average FPAUM
(1)
|
$ | 27,749 | $ | 3,082 | $ | 3,162 | $ | 7,403 | $ | 34,966 | $ | 20,045 | $ | 96,407 | ||||||||||||||||||||||||||||||
| Syndicated Loans |
High
Yield |
Multi-Asset Credit | Alternative Credit | U.S. Direct Lending | European Direct Lending | Total Credit Group | ||||||||||||||||||||||||||||||||||||||
| Balance at 12/31/2019 | $ | 21,458 | $ | 3,495 | $ | 2,144 | $ | 4,340 | $ | 27,876 | $ | 12,567 | $ | 71,880 | ||||||||||||||||||||||||||||||
| Acquisitions | 2,596 | — | — | — | — | — | 2,596 | |||||||||||||||||||||||||||||||||||||
| Commitments | 1,309 | 354 | 379 | 527 | 275 | — | 2,844 | |||||||||||||||||||||||||||||||||||||
| Subscriptions/deployment/increase in leverage | 15 | 13 | 57 | 1,184 | 5,220 | 3,202 | 9,691 | |||||||||||||||||||||||||||||||||||||
| Capital reductions | (89) | — | (59) | (227) | (857) | (287) | (1,519) | |||||||||||||||||||||||||||||||||||||
| Distributions | (39) | — | (31) | (370) | (1,905) | (521) | (2,866) | |||||||||||||||||||||||||||||||||||||
| Redemptions | (241) | (1,065) | (99) | (96) | (65) | (39) | (1,605) | |||||||||||||||||||||||||||||||||||||
| Change in fund value | (42) | (66) | (18) | — | 21 | 429 | 324 | |||||||||||||||||||||||||||||||||||||
| Change in fee basis | — | (40) | — | — | — | — | (40) | |||||||||||||||||||||||||||||||||||||
| Balance at 9/30/2020 | $ | 24,967 | $ | 2,691 | $ | 2,373 | $ | 5,358 | $ | 30,565 | $ | 15,351 | $ | 81,305 | ||||||||||||||||||||||||||||||
|
Average FPAUM
(1)
|
$ | 23,845 | $ | 2,912 | $ | 2,127 | $ | 4,805 | $ | 28,982 | $ | 14,251 | $ | 76,922 | ||||||||||||||||||||||||||||||
| (1) Represents a four-point average of quarter-end balances for each period. | ||||||||||||||||||||||||||||||||||||||||||||
87
The charts below present FPAUM for the Credit Group by its fee basis ($ in billions):

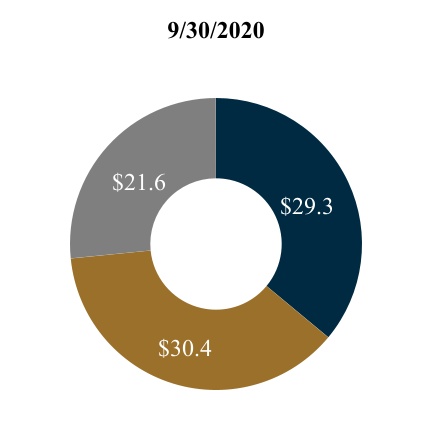
| FPAUM: $106.4 | FPAUM: $81.3 | |||||||||||||
| Invested capital |
Market value
(1)
|
Collateral balances (at par) | |||||||||||||||
(1)
Includes $24.6 billion and $19.3 billion from funds that primarily invest in illiquid strategies as of September 30, 2021 and 2020, respectively. The underlying investments held in these funds are generally subject to less market volatility than investments held in liquid strategies.
Credit Group—Fund Performance Metrics as of September 30, 2021
ARCC contributed approximately 45% of the Credit Group’s total management fees for the nine months ended September 30, 2021. In addition, seven other significant funds, ACE III, ACE IV, ACE V, CADC, PCS, SDL and an open-ended secured finance fund, collectively contributed approximately 22% of the Credit Group’s management fees for the nine months ended September 30, 2021.
The following table presents the performance data for our significant funds that are not drawdown funds in the Credit Group as of September 30, 2021:
|
Returns(%)
(1)
|
|||||||||||||||||||||||||||||||||||||||||||||||||||||
| ($ in millions) | Year of Inception | AUM | Current Quarter | Year-To-Date |
Since Inception
(2)
|
Primary
Investment Strategy
|
|||||||||||||||||||||||||||||||||||||||||||||||
| Fund | Gross | Net | Gross | Net | Gross | Net | |||||||||||||||||||||||||||||||||||||||||||||||
|
ARCC
(3)
|
2004 | $ | 23,683 | N/A | 4.2 | N/A | 16.6 | N/A | 12.0 | U.S. Direct Lending | |||||||||||||||||||||||||||||||||||||||||||
|
CADC
(4)
|
2017 | 2,488 | N/A | 2.2 | N/A | 7.1 | N/A | 6.7 | U.S. Direct Lending | ||||||||||||||||||||||||||||||||||||||||||||
|
Open-ended secured finance fund
(5)
|
2018 | 1,893 | 0.8 | 0.7 | 3.0 | 2.6 | 3.3 | 2.6 | Alternative Credit | ||||||||||||||||||||||||||||||||||||||||||||
(1)
Returns are time-weighted rates of return and include the reinvestment of income and other earnings from securities or other investments and reflect the deduction of all trading expenses.
(2)
Since inception returns are annualized.
(3)
Net returns are calculated using the fund's NAV and assume dividends are reinvested at the closest quarter-end NAV to the relevant quarterly ex-dividend dates. Additional information related to ARCC can be found in its financial statements filed with the SEC, which are not part of this report.
(4)
Returns are shown for institutional share class. Net returns are calculated using the fund’s NAV and assume distributions are reinvested at the NAV on the date of distribution. Additional information related to CADC can be found in its financial statements filed with the SEC, which are not part of this report.
(5)
Gross returns do not reflect the deduction of management fees or other expenses. Net returns are calculated by subtracting the applicable management fees and other expenses from the gross returns on a monthly basis. This fund is a master/feeder structure and its AUM and returns include activity from its' investment in an affiliated Ares fund. Returns presented in the table are expressed in U.S. Dollars and are for the master fund, excluding the share class hedges. The current quarter, year-to-date, and since inception returns (gross / net) for the pound sterling hedged Cayman feeder, the fund's sole feeder, are as follows: 0.8% / 0.6%, 2.5% / 2.1% and 1.8% / 1.2%.
88
The following table presents the performance data of our significant drawdown funds as of September 30, 2021:
| ($ in millions) | Year of Inception | AUM | Original Capital Commitments | Capital Invested to Date |
Realized Value
(1)
|
Unrealized Value
(2)
|
Total Value | MoIC | IRR(%) | Primary Investment Strategy | |||||||||||||||||||||||||||||||||||||||||||||||||||||||||||||
| Fund |
Gross
(3)
|
Net
(4)
|
Gross
(5)
|
Net
(6)
|
|||||||||||||||||||||||||||||||||||||||||||||||||||||||||||||||||||
| Funds Harvesting Investments | |||||||||||||||||||||||||||||||||||||||||||||||||||||||||||||||||||||||
|
ACE III
(7)
|
2015 | $ | 5,250 | $ | 2,822 | $ | 2,539 | $ | 836 | $ | 2,676 | $ | 3,512 | 1.5x | 1.4x | 11.9 | 8.6 | European Direct Lending | |||||||||||||||||||||||||||||||||||||||||||||||||||||
| PCS | 2017 | 4,053 | 3,365 | 2,649 | 932 | 2,435 | 3,367 | 1.3x | 1.2x | 13.5 | 9.7 | U.S. Direct Lending | |||||||||||||||||||||||||||||||||||||||||||||||||||||||||||
| Funds Deploying Capital | |||||||||||||||||||||||||||||||||||||||||||||||||||||||||||||||||||||||
|
ACE IV Unlevered
(8)
|
2018 | 10,800 | 2,851 | 2,429 | 225 | 2,519 | 2,744 | 1.2x | 1.1x | 9.2 | 6.6 | European Direct Lending | |||||||||||||||||||||||||||||||||||||||||||||||||||||||||||
|
ACE IV Levered
(8)
|
4,819 | 4,056 | 523 | 4,356 | 4,879 | 1.3x | 1.2x | 13.7 | 10.1 | ||||||||||||||||||||||||||||||||||||||||||||||||||||||||||||||
| SDL Unlevered | 2018 | 5,267 | 922 | 681 | 120 | 630 | 750 | 1.1x | 1.1x | 9.8 | 7.3 | U.S. Direct Lending | |||||||||||||||||||||||||||||||||||||||||||||||||||||||||||
| SDL Levered | 2,045 | 1,510 | 398 | 1,395 | 1,793 | 1.3x | 1.2x | 19.1 | 14.1 | ||||||||||||||||||||||||||||||||||||||||||||||||||||||||||||||
|
ACE V Unlevered
(9)
|
2020 | 15,540 | 7,026 | 1,367 | 1 | 1,446 | 1,447 | 1.1x | 1.1x | N/A | N/A | European Direct Lending | |||||||||||||||||||||||||||||||||||||||||||||||||||||||||||
|
ACE V Levered
(9)
|
6,376 | 1,273 | 3 | 1,388 | 1,391 | 1.1x | 1.1x | N/A | N/A | ||||||||||||||||||||||||||||||||||||||||||||||||||||||||||||||
(1)
Realized value represents the sum of all cash distributions to all partners and if applicable, exclude tax and incentive distributions made to the general partner.
(2)
Unrealized value represents the fund's NAV reduced by the accrued incentive allocation, if applicable. There can be no assurance that unrealized values will be realized at the valuations indicated.
(3)
The gross multiple of invested capital (“MoIC”) is calculated at the fund-level and is based on the interests of the fee-paying limited partners and if applicable, excludes interests attributable to the non-fee paying limited partners and/or the general partner which does not pay management fees or carried interest. The gross MoIC is before giving effect to management fees, carried interest and other expenses, as applicable, but after giving effect to credit facility interest expenses, as applicable. The funds may utilize a credit facility during the investment period and for general cash management purposes. Early in the life of a fund, the gross fund-level MoICs would generally have been lower had such fund called capital from its limited partners instead of utilizing the credit facility.
(4)
The net MoIC is calculated at the fund-level and is based on the interests of the fee-paying limited partners and if applicable, excludes those interests attributable to the non-fee paying limited partners and/or the general partner which does not pay management fees or carried interest. The net MoIC is after giving effect to management fees and carried interest, other expenses and credit facility interest expenses, as applicable. The funds may utilize a credit facility during the investment period and for general cash management purposes. Early in the life of a fund, the net fund-level MoICs would generally have been lower had such fund called capital from its limited partners instead of utilizing the credit facility.
(5)
The gross IRR is an annualized since inception gross internal rate of return of cash flows to and from the fund and the fund’s residual value at the end of the measurement period. Gross IRR reflects returns to the fee-paying limited partners and, if applicable, excludes interests attributable to the non-fee paying limited partners and/or the general partner which does not pay management fees or carried interest. The cash flow dates used in the gross IRR calculation are based on the actual dates of the cash flows. The gross IRRs are calculated before giving effect to management fees, carried interest and other expenses, as applicable, but after giving effect to credit facility interest expenses, as applicable. The funds may utilize a credit facility during the investment period and for general cash management purposes. Gross fund-level IRRs would generally have been lower had such fund called capital from its limited partners instead of utilizing the credit facility.
(6)
The net IRR is an annualized since inception net internal rate of return of cash flows to and from the fund and the fund’s residual value at the end of the measurement period. Net IRRs reflect returns to the fee-paying limited partners and, if applicable, exclude interests attributable to the non-fee paying limited partners and/or the general partner which does not pay management fees or carried interest. The cash flow dates used in the net IRR calculations are based on the actual dates of the cash flows. The net IRRs are calculated after giving effect to management fees and carried interest, other expenses and credit facility interest expenses, as applicable. The funds may utilize a credit facility during the investment period and for general cash management purposes. Net fund-level IRRs would generally have been lower had such fund called capital from its limited partners instead of utilizing the credit facility.
(7)
ACE III is made up of two feeder funds, one denominated in U.S. dollars and one denominated in Euros. The gross and net IRR and MoIC presented in the table are for the Euro denominated feeder fund. The gross and net IRR for the U.S. dollar denominated feeder fund are 13.1% and 9.6%, respectively. The gross and net MoIC for the U.S. dollar denominated feeder fund are 1.6x and 1.4x, respectively. Original capital commitments are converted to U.S. dollars at the prevailing exchange rate at the time of the fund's closing. All other values for ACE III are for the combined fund and are converted to U.S. dollars at the prevailing quarter-end exchange rate.
(8)
ACE IV is made up of four parallel funds, two denominated in Euros and two denominated in pound sterling: ACE IV (E) Unlevered, ACE IV (G) Unlevered, ACE IV (E) Levered and ACE IV (G) Levered. The gross and net IRR and MoIC presented in the table are for ACE IV (E) Unlevered and ACE IV (E) Levered. Metrics for ACE IV (E) Levered are inclusive of a U.S. dollar denominated feeder fund, which has not been presented separately The gross and net IRR for ACE IV (G) Unlevered are 10.9% and 7.8%, respectively. The gross and net MoIC for ACE IV (G) Unlevered are 1.2x and 1.1x, respectively. The gross and net IRR for ACE IV (G) Levered are 15.1% and 11.0%, respectively. The gross and net MoIC for ACE IV (G) Levered are 1.3x and 1.2x, respectively. Original capital commitments are converted to U.S. dollars at the prevailing exchange rate at the time of the fund's closing. All other values for ACE IV Unlevered and ACE IV Levered are for the combined levered and unlevered parallel funds and are converted to U.S. dollars at the prevailing quarter-end exchange rate.
(9)
ACE V is made up of four parallel funds, two denominated in Euros and two denominated in pound sterling: ACE V (E) Unlevered, ACE V (G) Unlevered, ACE V (E) Levered, and ACE V (G) Levered. The gross and net MoIC presented in the chart are for ACE V (E) Unlevered and ACE V (E) Levered. Metrics for ACE V (E) Unlevered are inclusive of a Japanese yen denominated feeder fund, which has not been presented separately. Metrics for ACE V (E) Levered are inclusive of a U.S. dollar denominated feeder fund, which has not been presented separately. The gross and net MoIC for ACE V (G) Unlevered are 1.1x and 1.1x, respectively. The gross and net MoIC for ACE V (G) Levered are 1.1x and 1.1x, respectively. Original capital commitments are converted to U.S. dollars at the prevailing exchange rate at the time of the fund's closing. All other values for ACE V Unlevered and ACE V Levered are for the combined levered and unlevered parallel funds and are converted to U.S. dollars at the prevailing quarter-end exchange rate.
89
Private Equity Group—Three and Nine Months Ended September 30, 2021
Compared to Three and Nine Months Ended September 30, 2020
Fee
Related Earnings:
The following table presents the components of the Private Equity Group's FRE:
| Three months ended September 30, | Favorable (Unfavorable) | Nine months ended September 30, | Favorable (Unfavorable) | ||||||||||||||||||||||||||||||||||||||||||||
| ($ in thousands) | 2021 | 2020 | $ Change | % Change | 2021 | 2020 | $ Change | % Change | |||||||||||||||||||||||||||||||||||||||
| Management fees | $ | 69,591 | $ | 54,653 | $ | 14,938 | 27% | $ | 171,019 | $ | 160,206 | $ | 10,813 | 7% | |||||||||||||||||||||||||||||||||
| Other fees | 370 | 2 | 368 | NM | 726 | 142 | 584 | NM | |||||||||||||||||||||||||||||||||||||||
| Compensation and benefits | (26,773) | (21,224) | (5,549) | (26) | (73,534) | (62,946) | (10,588) | (17) | |||||||||||||||||||||||||||||||||||||||
| General, administrative and other expenses | (6,238) | (6,002) | (236) | (4) | (17,499) | (16,083) | (1,416) | (9) | |||||||||||||||||||||||||||||||||||||||
| Fee Related Earnings | $ | 36,950 | $ | 27,429 | 9,521 | 35 | $ | 80,712 | $ | 81,319 | (607) | (1) | |||||||||||||||||||||||||||||||||||
NM - Not Meaningful
Management Fees.
The chart below presents Private Equity Group management fees and effective management fee rates:
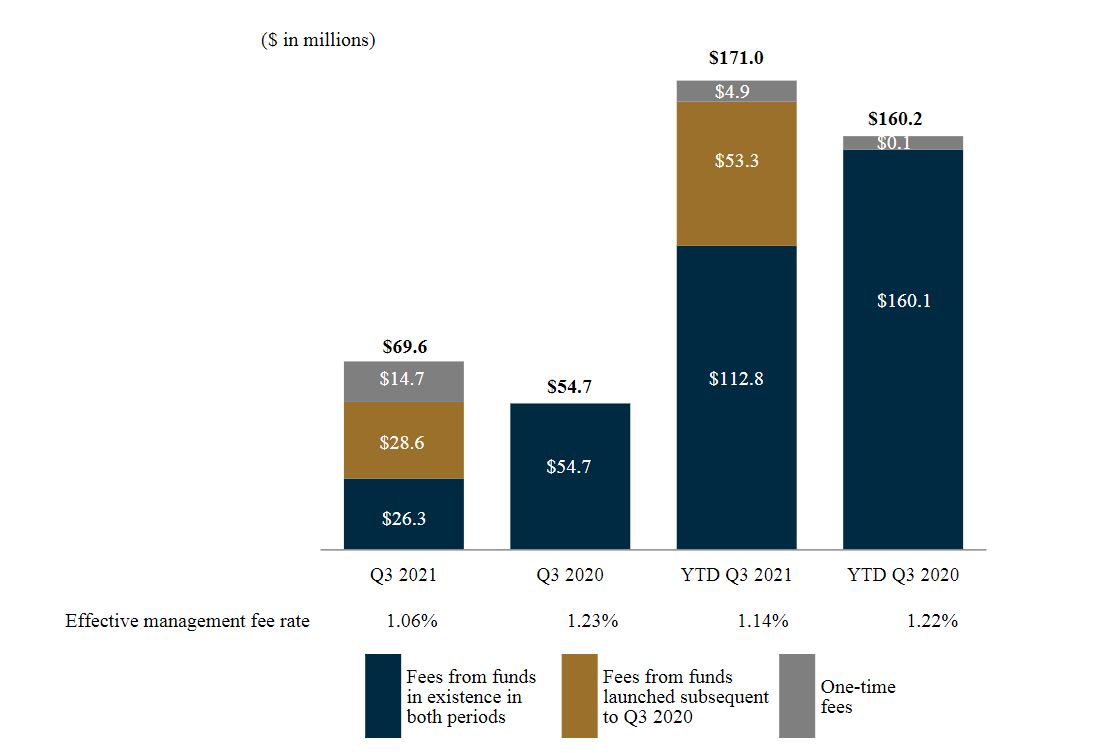
Management fees increased primarily due to additional commitments and one-time catch up fees. Management fees from ACOF VI increased by $28.6 million and $53.3 million for the
three and nine months ended September 30, 2021, respectively,
when compared to the same periods in 2020, and management fees from our first climate infrastructure fund increased by $5.1 million and $8.7 million, respectively, over the comparative periods. Excluding one-time catch up fees, management fees from ACOF VI increased by $17.0 million and $50.8 million over the comparative periods, offset by a decrease of $18.6 million and $55.1 million of fees from ACOF V over the same periods. The decrease in management fees from ACOF V over the comparative periods was due to the step down in fee rate and change in fee base from committed capital to invested capital in the first quarter of 2021 as a result of ACOF VI beginning to pay fees in the fourth quarter of 2020.
90
Excluding one-time catch up fees, fees from our first climate infrastructure fund increased by $1.9 million and $6.2 million over the comparative periods. Management fees from ASOF increased by
$4.9 million and $15.4 million from the respective periods that was driven by increased deployment.
The decreases in effective management fee rate for the three and nine months ended September 30, 2021 compared to the three and nine months ended September 30, 2020 were primarily driven by the step down in fee rate to 0.75% for ACOF V, partially offset by increased deployment in ASOF that has a higher fee rate than the Private Equity Group’s average effective management fee rate.
Compensation and Benefits.
Compensation and benefits increased by $5.5 million, or 26%, for the three months ended September 30, 2021 compared to the three months ended September 30, 2020 and by $10.6 million, or 17%, for the nine months ended September 30, 2021 compared to the nine months ended September 30, 2020. The increases were driven by certain annual discretionary payments and by higher incentive compensation resulting from increased management fees, specifically one-time catch up fees from ACOF VI and our first climate infrastructure fund.
General, Administrative and Other Expenses.
General, administrative and other expenses increased by $0.2 million, or 4%, for the three months ended September 30, 2021 compared to the three months ended September 30, 2020 and by $1.4 million, or 9%, for the nine months ended September 30, 2021 compared to the nine months ended September 30, 2020. In connection with our fundraising efforts, placement fees have increased by $1.1 million and $3.0 million for the three and nine months ended September 30, 2021, respectively, when compared to the same periods in 2020. The increase was primarily associated with new commitments to ASOF, ACOF VI and our first climate infrastructure fund. The increase was also driven by higher professional service fees to support the expanding platform of $1.0 million for the nine months ended September 30, 2021 when compared to the same period in 2020.
There continue to be positive developments in the recovery from the COVID-19 pandemic that have reduced restrictions on travel and gathering. Those operating expenses that were impacted by the pandemic, particularly marketing sponsorships and events, increased during the third quarter of 2021. We, however,
recognized cost savings when comparing the nine months ended September 30, 2021 and 2020. For the three months ended March 31, 2020, our expenses reflected a pre-pandemic cost structure and are not comparable to the lower expenses incurred in our modified work environment during the three months ended March 31, 2021.
Our operating expenses, most notably travel, entertainment and marketing sponsorships, and certain office services and fringe benefits from the modified remote working environment, decreased by $1.2 million for the nine months ended September 30, 2021, when compared to the same period in 2020.
For the three and nine months ended September 30, 2020, we also recorded $0.9 million and $1.5 million, respectively, in association with the launch of ACOF VI, ASOF and AEOF.
Realized Income:
The following table presents the components of the Private Equity Group's RI:
| Three months ended September 30, | Favorable (Unfavorable) | Nine months ended September 30, | Favorable (Unfavorable) | ||||||||||||||||||||||||||||||||||||||||||||
| ($ in thousands) | 2021 | 2020 | $ Change | % Change | 2021 | 2020 | $ Change | % Change | |||||||||||||||||||||||||||||||||||||||
| Fee Related Earnings | $ | 36,950 | $ | 27,429 | $ | 9,521 | 35 | % | $ | 80,712 | $ | 81,319 | $ | (607) | (1) | % | |||||||||||||||||||||||||||||||
| Performance income—realized | 34,316 | 115,997 | (81,681) | (70) | 159,479 | 276,469 | (116,990) | (42) | |||||||||||||||||||||||||||||||||||||||
| Performance related compensation—realized | (27,483) | (93,284) | 65,801 | 71 | (127,706) | (222,949) | 95,243 | 43 | |||||||||||||||||||||||||||||||||||||||
| Realized net performance income | 6,833 | 22,713 | (15,880) | (70) | 31,773 | 53,520 | (21,747) | (41) | |||||||||||||||||||||||||||||||||||||||
| Investment income—realized | 2,020 | 16,351 | (14,331) | (88) | 5,308 | 35,866 | (30,558) | (85) | |||||||||||||||||||||||||||||||||||||||
| Interest and other investment income—realized | 4,861 | 1,065 | 3,796 | NM | 10,716 | 2,364 | 8,352 | NM | |||||||||||||||||||||||||||||||||||||||
| Interest expense | (2,726) | (2,216) | (510) | (23) | (6,032) | (6,106) | 74 | 1 | |||||||||||||||||||||||||||||||||||||||
| Realized net investment income | 4,155 | 15,200 | (11,045) | (73) | 9,992 | 32,124 | (22,132) | (69) | |||||||||||||||||||||||||||||||||||||||
| Realized Income | $ | 47,938 | $ | 65,342 | (17,404) | (27) | $ | 122,477 | $ | 166,963 | (44,486) | (27) | |||||||||||||||||||||||||||||||||||
NM - Not Meaningful
91
Realized net performance income and realized net investment income for the three and nine months ended September 30, 2021 was primarily attributable to realizations from monetization of ACOF IV’s investment in Farrow & Ball following the sale of the company and from the monetization of various assets in a fund within our special opportunities strategy. Realized net performance income for the nine months ended September 30, 2021 also included realizations from partial sales of ACOF IV’s position in AZEK. Realized net investment income for the nine months ended September 30, 2021 was also attributable to the monetization of various assets in an infrastructure and power fund and a special opportunities fund, offset by a realized loss recognized in connection with an Asian corporate private equity fund’s sale of its investment in a dairy farm company.
Realized net performance income and realized net investment income for the three and nine months ended September 30, 2020 were primarily attributable to realizations from the sale of ACOF III's remaining position in Floor & Decor Holdings, Inc. and the partial sale of ACOF IV's position in AZEK. Realized net performance income and realized net investment income for the nine months ended September 30, 2020 also included realizations from the monetization of ACOF IV's investment in National Veterinary Associates following the sale of the company. Realized net investment income for the three and nine months ended September 30, 2020 was also attributable to the monetization of an infrastructure and power fund's investment in a wind project.
Private Equity Group—Carried Interest
The following table presents the accrued carried interest, also referred to as accrued performance income, and related performance compensation for the Private Equity Group:
| As of September 30, 2021 | As of December 31, 2020 | ||||||||||||||||||||||||||||||||||
| ($ in thousands) | Accrued Performance Income | Accrued Performance Compensation | Accrued Net Performance Income | Accrued Performance Income | Accrued Performance Compensation | Accrued Net Performance Income | |||||||||||||||||||||||||||||
| ACOF III | $ | 48,928 | $ | 39,143 | $ | 9,785 | $ | 55,022 | $ | 44,018 | $ | 11,004 | |||||||||||||||||||||||
| ACOF IV | 363,532 | 290,826 | 72,706 | 345,748 | 276,598 | 69,150 | |||||||||||||||||||||||||||||
| ACOF V | 532,215 | 425,772 | 106,443 | — | — | — | |||||||||||||||||||||||||||||
| ACOF VI | 66,493 | 53,194 | 13,299 | 2,624 | 2,099 | 525 | |||||||||||||||||||||||||||||
| ASOF | 305,758 | 214,031 | 91,727 | 113,313 | 79,319 | 33,994 | |||||||||||||||||||||||||||||
| EIF V | 57,880 | 43,265 | 14,615 | 54,086 | 40,429 | 13,657 | |||||||||||||||||||||||||||||
| Other funds | 28,717 | 18,664 | 10,053 | 175 | 175 | — | |||||||||||||||||||||||||||||
| Total Private Equity Group | $ | 1,403,523 | $ | 1,084,895 | $ | 318,628 | $ | 570,968 | $ | 442,638 | $ | 128,330 | |||||||||||||||||||||||
The following table presents the change in accrued carried interest during the period for the Private Equity Group:
| As of December 31, 2020 | Activity during the period | As of September 30, 2021 | ||||||||||||||||||||||||||||||
| ($ in thousands) | Waterfall Type | Accrued Carried Interest | Change in Unrealized | Realized | Accrued Carried Interest | |||||||||||||||||||||||||||
| ACOF III | American | $ | 55,022 | $ | 98 | $ | (6,192) | $ | 48,928 | |||||||||||||||||||||||
| ACOF IV | American | 345,748 | 171,071 | (153,287) | 363,532 | |||||||||||||||||||||||||||
| ACOF V | American | — | 532,215 | — | 532,215 | |||||||||||||||||||||||||||
| ACOF VI | American | 2,624 | 63,869 | — | 66,493 | |||||||||||||||||||||||||||
| ASOF | European | 113,313 | 192,445 | — | 305,758 | |||||||||||||||||||||||||||
| EIF V | European | 54,086 | 3,794 | — | 57,880 | |||||||||||||||||||||||||||
| Other funds | European | — | 10,781 | — | 10,781 | |||||||||||||||||||||||||||
| Other funds | American | 175 | 17,761 | — | 17,936 | |||||||||||||||||||||||||||
| Total Private Equity Group | $ | 570,968 | $ | 992,034 | $ | (159,479) | $ | 1,403,523 | ||||||||||||||||||||||||
92
Private Equity Group—Assets Under Management
The tables below present rollforwards of AUM for the Private Equity Group:
| ($ in millions) | Corporate Private Equity | Special Opportunities | Infrastructure & Power | Total Private Equity Group | ||||||||||||||||||||||
| Balance at 6/30/2021 | $ | 20,603 | $ | 6,307 | $ | 3,822 | $ | 30,732 | ||||||||||||||||||
| Net new par/equity commitments | 1,453 | 200 | 324 | 1,977 | ||||||||||||||||||||||
| Net new debt commitments | — | 200 | — | 200 | ||||||||||||||||||||||
| Capital reductions | (2) | — | — | (2) | ||||||||||||||||||||||
| Distributions | (864) | (269) | (358) | (1,491) | ||||||||||||||||||||||
| Change in fund value | 828 | 506 | (54) | 1,280 | ||||||||||||||||||||||
| Balance at 9/30/2021 | $ | 22,018 | $ | 6,944 | $ | 3,734 | $ | 32,696 | ||||||||||||||||||
|
Average AUM
(1)
|
$ | 21,311 | $ | 6,626 | $ | 3,778 | $ | 31,715 | ||||||||||||||||||
| Corporate Private Equity | Special Opportunities | Infrastructure & Power | Total Private Equity Group | |||||||||||||||||||||||
| Balance at 6/30/2020 | $ | 18,090 | $ | 5,343 | $ | 3,169 | $ | 26,602 | ||||||||||||||||||
| Net new par/equity commitments | 270 | (30) | 235 | 475 | ||||||||||||||||||||||
| Capital reductions | (3) | (15) | — | (18) | ||||||||||||||||||||||
| Distributions | (966) | (10) | (90) | (1,066) | ||||||||||||||||||||||
| Redemptions | (5) | — | — | (5) | ||||||||||||||||||||||
| Change in fund value | 473 | 170 | 59 | 702 | ||||||||||||||||||||||
| Balance at 9/30/2020 | $ | 17,859 | $ | 5,458 | $ | 3,373 | $ | 26,690 | ||||||||||||||||||
|
Average AUM
(1)
|
$ | 17,975 | $ | 5,401 | $ | 3,271 | $ | 26,647 | ||||||||||||||||||
| (1) Represents the quarterly average of beginning and ending balances. | ||||||||||||||||||||||||||
| Corporate Private Equity | Special Opportunities | Infrastructure & Power | Total Private Equity Group | |||||||||||||||||||||||
| Balance at 12/31/2020 | $ | 18,233 | $ | 5,721 | $ | 3,485 | $ | 27,439 | ||||||||||||||||||
| Net new par/equity commitments | 1,554 | 150 | 592 | 2,296 | ||||||||||||||||||||||
| Net new debt commitments | — | 200 | — | 200 | ||||||||||||||||||||||
| Capital reductions | (7) | — | — | (7) | ||||||||||||||||||||||
| Distributions | (2,273) | (554) | (692) | (3,519) | ||||||||||||||||||||||
| Change in fund value | 4,511 | 1,427 | 349 | 6,287 | ||||||||||||||||||||||
| Balance at 9/30/2021 | $ | 22,018 | $ | 6,944 | $ | 3,734 | $ | 32,696 | ||||||||||||||||||
|
Average AUM
(1)
|
$ | 20,059 | $ | 6,241 | $ | 3,672 | $ | 29,972 | ||||||||||||||||||
| Corporate Private Equity | Special Opportunities | Infrastructure & Power | Total Private Equity Group | |||||||||||||||||||||||
| Balance at 12/31/2019 | $ | 18,406 | $ | 3,527 | $ | 3,233 | $ | 25,166 | ||||||||||||||||||
| Net new par/equity commitments | 3,558 | 1,800 | 235 | 5,593 | ||||||||||||||||||||||
| Capital reductions | (8) | (125) | — | (133) | ||||||||||||||||||||||
| Distributions | (3,173) | (12) | (108) | (3,293) | ||||||||||||||||||||||
| Redemptions | (5) | — | — | (5) | ||||||||||||||||||||||
| Change in fund value | (919) | 268 | 13 | (638) | ||||||||||||||||||||||
| Balance at 9/30/2020 | $ | 17,859 | $ | 5,458 | $ | 3,373 | $ | 26,690 | ||||||||||||||||||
|
Average AUM
(1)
|
$ | 17,357 | $ | 4,511 | $ | 3,251 | $ | 25,119 | ||||||||||||||||||
| (1) Represents a four-point average of quarter-end balances for each period. | ||||||||||||||||||||||||||
93
The components of our AUM for the Private Equity Group are presented below ($ in billions):
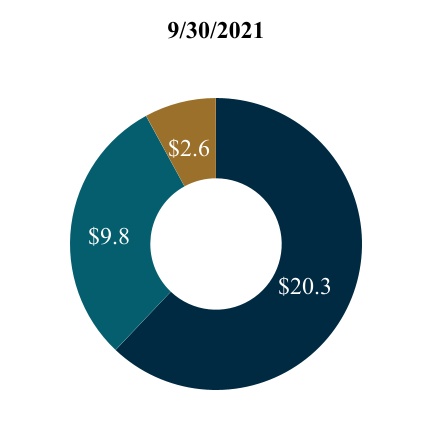
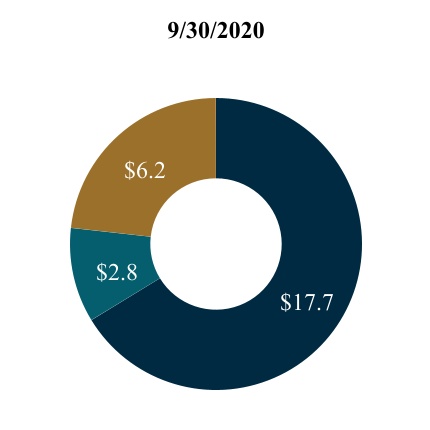
| AUM: $32.7 | AUM: $26.7 | |||||||||||||
| FPAUM |
Non-fee paying
(1)
|
AUM not yet paying fees | |||||||||||||||
(1) Includes $1.2 billion of non-fee paying AUM based on our general partner commitment as of September 30, 2021 and 2020.
94
Private Equity Group—Fee Paying AUM
The tables below present rollforwards of fee paying AUM for the Private Equity Group:
| ($ in millions) | Corporate Private Equity | Special Opportunities | Infrastructure & Power | Total Private Equity Group | ||||||||||||||||||||||
| Balance at 6/30/2021 | $ | 11,748 | $ | 3,259 | $ | 3,725 | $ | 18,732 | ||||||||||||||||||
| Commitments | 1,427 | — | 324 | 1,751 | ||||||||||||||||||||||
| Subscriptions/deployment/increase in leverage | 89 | 487 | — | 576 | ||||||||||||||||||||||
| Distributions | (471) | (44) | (294) | (809) | ||||||||||||||||||||||
| Change in fund value | 5 | — | — | 5 | ||||||||||||||||||||||
| Change in fee basis | (6) | — | — | (6) | ||||||||||||||||||||||
| Balance at 9/30/2021 | $ | 12,792 | $ | 3,702 | $ | 3,755 | $ | 20,249 | ||||||||||||||||||
|
Average FPAUM
(1)
|
$ | 12,270 | $ | 3,481 | $ | 3,740 | $ | 19,491 | ||||||||||||||||||
| Corporate Private Equity | Special Opportunities | Infrastructure & Power | Total Private Equity Group | |||||||||||||||||||||||
| Balance at 6/30/2020 | $ | 11,748 | $ | 2,425 | $ | 3,300 | $ | 17,473 | ||||||||||||||||||
| Commitments | — | — | 210 | 210 | ||||||||||||||||||||||
| Subscriptions/deployment/increase in leverage | 16 | 294 | — | 310 | ||||||||||||||||||||||
| Distributions | (170) | (42) | (7) | (219) | ||||||||||||||||||||||
| Change in fund value | (33) | — | — | (33) | ||||||||||||||||||||||
| Change in fee basis | (17) | — | (5) | (22) | ||||||||||||||||||||||
| Balance at 9/30/2020 | $ | 11,544 | $ | 2,677 | $ | 3,498 | $ | 17,719 | ||||||||||||||||||
|
Average FPAUM
(1)
|
$ | 11,646 | $ | 2,551 | $ | 3,399 | $ | 17,596 | ||||||||||||||||||
| (1) Represents the quarterly average of beginning and ending balances. | ||||||||||||||||||||||||||
| Corporate Private Equity | Special Opportunities | Infrastructure & Power | Total Private Equity Group | |||||||||||||||||||||||
| Balance at 12/31/2020 | $ | 14,770 | $ | 2,723 | $ | 3,679 | $ | 21,172 | ||||||||||||||||||
| Commitments | 1,579 | — | 592 | 2,171 | ||||||||||||||||||||||
| Subscriptions/deployment/increase in leverage | 535 | 1,308 | — | 1,843 | ||||||||||||||||||||||
| Distributions | (1,332) | (329) | (341) | (2,002) | ||||||||||||||||||||||
| Change in fund value | 5 | — | — | 5 | ||||||||||||||||||||||
| Change in fee basis | (2,765) | — | (175) | (2,940) | ||||||||||||||||||||||
| Balance at 9/30/2021 | $ | 12,792 | $ | 3,702 | $ | 3,755 | $ | 20,249 | ||||||||||||||||||
|
Average FPAUM
(1)
|
$ | 12,779 | $ | 3,181 | $ | 3,710 | $ | 19,670 | ||||||||||||||||||
| Corporate Private Equity | Special Opportunities | Infrastructure & Power | Total Private Equity Group | |||||||||||||||||||||||
| Balance at 12/31/2019 | $ | 11,968 | $ | 1,720 | $ | 3,352 | $ | 17,040 | ||||||||||||||||||
| Commitments | — | — | 210 | 210 | ||||||||||||||||||||||
| Subscriptions/deployment/increase in leverage | 35 | 1,295 | — | 1,330 | ||||||||||||||||||||||
| Distributions | (404) | (338) | (59) | (801) | ||||||||||||||||||||||
| Change in fund value | (39) | — | — | (39) | ||||||||||||||||||||||
| Change in fee basis | (16) | — | (5) | (21) | ||||||||||||||||||||||
| Balance at 9/30/2020 | $ | 11,544 | $ | 2,677 | $ | 3,498 | $ | 17,719 | ||||||||||||||||||
|
Average FPAUM
(1)
|
$ | 11,753 | $ | 2,184 | $ | 3,376 | $ | 17,313 | ||||||||||||||||||
| (1) Represents a four-point average of quarter-end balances for each period. | ||||||||||||||||||||||||||
95
The charts below present FPAUM for the Private Equity Group by its fee basis ($ in billions):
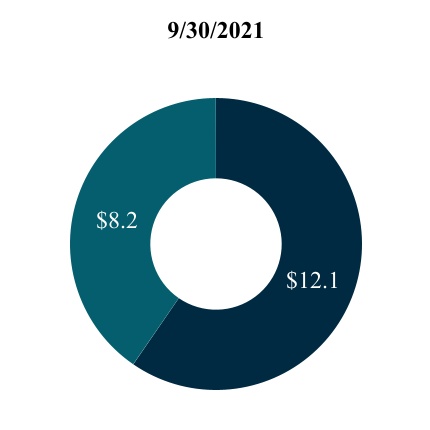
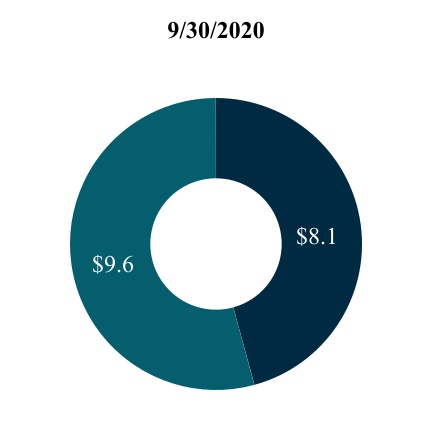
| FPAUM: $20.3 | FPAUM: $17.7 | |||||||||||||
| Invested capital | Capital commitments | |||||||||||||
Private Equity Group—Fund Performance Metrics as of September 30, 2021
Four significant funds, U.S. Power Fund IV (“USPF IV”), ACOF V, ASOF and ACOF VI, collectively contributed approximately 69% of the Private Equity Group’s management fees for the nine months ended September 30, 2021.
The following table presents the performance data as of September 30, 2021 for our significant funds in the Private Equity Group, all of which are drawdown funds:
| ($ in millions) | Year of Inception | AUM | Original Capital Commitments | Capital Invested to Date |
Realized Value
(1)
|
Unrealized Value
(2)
|
Total Value | MoIC | IRR(%) | Primary Investment Strategy | |||||||||||||||||||||||||||||||||||||||||||||||||||||||||||||
| Fund |
Gross
(3)
|
Net
(4)
|
Gross
(5)
|
Net
(6)
|
|||||||||||||||||||||||||||||||||||||||||||||||||||||||||||||||||||
| Funds Harvesting Investments | |||||||||||||||||||||||||||||||||||||||||||||||||||||||||||||||||||||||
| USPF IV | 2010 | $ | 993 | $ | 1,688 | $ | 2,121 | $ | 1,633 | $ | 981 | $ | 2,614 | 1.2x | 1.1x | 5.1 | 1.2 | Infrastructure and Power | |||||||||||||||||||||||||||||||||||||||||||||||||||||
| Funds Deploying Capital | |||||||||||||||||||||||||||||||||||||||||||||||||||||||||||||||||||||||
| ACOF V | 2017 | 9,716 | 7,850 | 7,365 | 1,713 | 9,011 | 10,724 | 1.5x | 1.3x | 15.9 | 10.8 | Corporate Private Equity | |||||||||||||||||||||||||||||||||||||||||||||||||||||||||||
| ASOF | 2019 | 5,285 | 3,518 | 4,248 | 1,966 | 3,916 | 5,882 | 1.7x | 1.6x | 64.7 | 50.3 | Special Opportunities | |||||||||||||||||||||||||||||||||||||||||||||||||||||||||||
| ACOF VI | 2020 | 6,127 | 5,743 | 1,972 | 185 | 2,217 | 2,402 | 1.2x | 1.1x | N/A | N/A | Corporate Private Equity | |||||||||||||||||||||||||||||||||||||||||||||||||||||||||||
(1)
Realized value represents the sum of all cash dividends, interest income, other fees and cash proceeds from realizations of interests in portfolio investments. Realized value excludes any proceeds related to bridge financings.
(2)
Unrealized value represents the fair market value of remaining investments. Unrealized value does not take into account any bridge financings. There can be no assurance that unrealized investments will be realized at the valuations indicated.
(3)
For the corporate private equity and infrastructure and power funds, the gross MoIC is calculated at the investment-level and is based on the interests of all partners. The gross MoIC is before giving effect to management fees, carried interest, as applicable, and other expenses. For the special opportunities funds, the gross MoIC is calculated at the fund-level and is based on the interests of the fee-paying limited partners and if applicable, excludes interests attributable to the non-fee paying limited partners and/or the general partner which does not pay management fees or carried interest. The gross MoIC is before giving effect to management fees, carried interest as applicable, and other expenses, but after giving effect to credit facility interest expenses, as applicable. The funds may utilize a credit facility during the investment period and for general cash management purposes. Early in the life of a fund, the gross fund-level MoICs would generally have been lower had such fund called capital from its limited partners instead of utilizing the credit facility. The gross MoICs for the corporate private equity and special opportunities funds are also calculated before giving effect to any bridge financings. Inclusive of bridge financings, the gross MoIC would be 1.4x for ACOF V, 1.2x for ACOF VI, and 1.7x for ASOF.
(4)
The net MoIC for USPF IV and ASOF is calculated at the fund-level. The funds may utilize a credit facility during the investment period and for general cash management purposes. Early in the life of a fund, the net fund-level MoICs would generally have been lower had such fund called capital from its limited partners instead of utilizing the credit facility. The net MoIC for the corporate private equity funds is calculated at the investment level. For all funds, the net MoIC is based on the interests of the fee-paying limited partners and if applicable, excludes interests attributable to the non-fee paying limited partners and/or the general partner which does not pay management fees or performance fees. The net MoIC is after giving effect to management fees and carried interest, other expenses and credit facility interest expenses, as applicable.
(5)
For the corporate private equity and infrastructure and power funds, the gross IRR is an annualized since inception gross internal rate of return of cash flows to and from investments and the residual value of the investments at the end of the measurement period. Gross IRRs reflect returns to all partners. The cash flow dates used in the gross IRR calculation are assumed to occur at month-end. The gross IRRs are calculated before giving effect to management fees, carried interest, as applicable, and other expenses. For the special opportunities funds the gross IRR is an annualized since inception gross internal rate of return of cash flows to and from the fund and the fund’s residual value at the end of the measurement period. Gross IRRs reflect returns to the fee-paying limited partners and, if applicable, excludes interests attributable to the non-fee paying limited partners and/or the general partner which does not pay management fees or carried interest. The cash flow dates used in the gross IRR calculation are based on the actual dates of the cash flows. The gross IRRs are calculated before giving effect to management fees, carried interest, as applicable, and other expenses, but after giving effect to credit facility interest expenses, as applicable. The gross IRRs for the corporate private equity and special opportunities funds are also calculated before giving effect to any bridge financings. Inclusive of bridge financings, the gross IRRs would be 15.7% for ACOF V, "N/A" for ACOF VI, and 63.3% for ASOF.
96
(6)
The net IRR is an annualized since inception net internal rate of return of cash flows to and from the fund and the fund’s residual value at the end of the measurement period. Net IRRs reflect returns to the fee-paying limited partners and if applicable, exclude interests attributable to the non-fee paying limited partners and/or the general partner which does not pay management fees or carried interest. The cash flow dates used in the net IRR calculation are based on the actual dates of the cash flows. The net IRRs are calculated after giving effect to management fees, carried interest as applicable, and other expenses and exclude commitments by the general partner and non-fee paying limited partners who do not pay either management fees or carried interest. The funds may utilize a credit facility during the investment period and for general cash management purposes. Net fund-level IRRs would generally have been lower had such fund called capital from its limited partners instead of utilizing the credit facility.
Real Estate Group—Three and Nine Months Ended September 30, 2021
Compared to Three and Nine Months Ended September 30, 2020
Fee Related Earnings:
The following table presents the components of the Real Estate Group's FRE:
| Three months ended September 30, | Favorable (Unfavorable) | Nine months ended September 30, | Favorable (Unfavorable) | ||||||||||||||||||||||||||||||||||||||||||||
| ($ in thousands) | 2021 | 2020 | $ Change | % Change | 2021 | 2020 | $ Change | % Change | |||||||||||||||||||||||||||||||||||||||
| Management fees | $ | 55,160 | $ | 23,787 | $ | 31,373 | 132 | % | $ | 115,602 | $ | 71,459 | $ | 44,143 | 62 | % | |||||||||||||||||||||||||||||||
| Other fees | 3,681 | 5 | 3,676 | NM | 4,604 | 716 | 3,888 | NM | |||||||||||||||||||||||||||||||||||||||
| Compensation and benefits | (29,160) | (13,011) | (16,149) | (124) | (60,767) | (38,159) | (22,608) | (59) | |||||||||||||||||||||||||||||||||||||||
| General, administrative and other expenses | (5,420) | (2,987) | (2,433) | (81) | (12,064) | (9,185) | (2,879) | (31) | |||||||||||||||||||||||||||||||||||||||
| Fee Related Earnings | $ | 24,261 | $ | 7,794 | 16,467 | 211 | $ | 47,375 | $ | 24,831 | 22,544 | 91 | |||||||||||||||||||||||||||||||||||
NM - Not Meaningful
Management Fees.
The chart below presents Real Estate Group management fees and effective management fee rates:
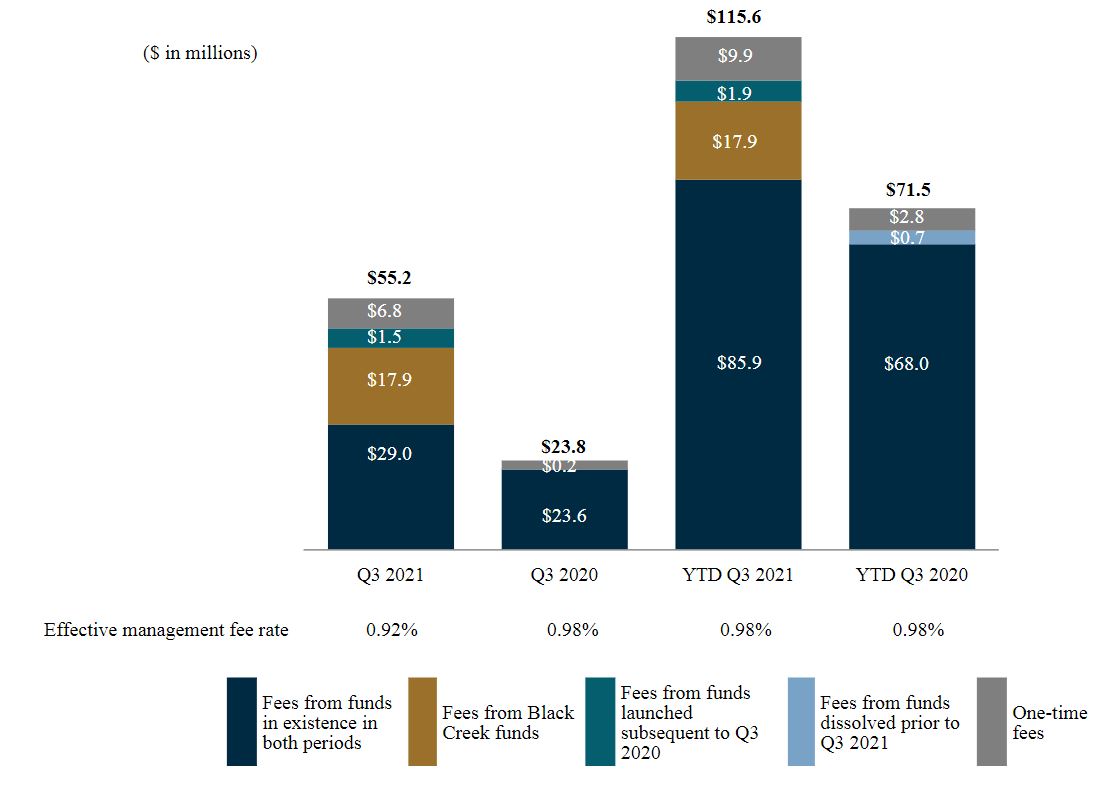
Management fees increased for the three and nine months ended September 30, 2021
compared to the
three and nine months ended September 30, 2020 primarily due to the Black Creek Acquisition. Additional commitments to AREOF III increased fees by $1.4 million and $4.1 million for the three and nine months ended September 30, 2021
compared to the
three and nine months ended September 30, 2020, respectively, and also generated one-time catch-up fees of $2.8 million for the nine
97
months ended September 30, 2021. Additional commitments to Ares European Property Enhancement Partners III, SCSp. (“EPEP III”)
also generated one-time catch-up fees of $6.8 million and $7.0 million for the t
hree and nine months ended September 30, 2021
compared to the
three and nine months ended September 30, 2020, respectively
. Excluding one-time catch-up fees, fees from EPEP III
increased by
$2.6 million and $9.0 million over the respective periods
. Management fees from real estate debt funds increased by $2.2 million and $4.7 million for the respective periods primarily due to the continued fundraising and subsequent deployment within these open-ended funds. Management fees included $2.0 million of one-time fees for the nine months ended September 30, 2020, driven by our Real Estate Group completing the sale of its stake in a 40-property pan-European logistics portfolio.
The decrease in effective management fee rate for the three months ended September 30, 2021 compared to the three months ended September 30, 2020 was primarily due to deployment in real estate debt funds with effective management fee rates below 0.75% and to certain funds previously managed by Black Creek with effective management fee rates below 0.75%. The decrease in effective management fee rate is partially offset by an increase in management fees from real estate equity funds. Our most recent real estate equity funds pay a fee on committed capital that increases once that capital is invested. As a result, our effective management fee rate decreases immediately following capital raising and increases as capital is subsequently deployed.
Other Fees:
Other fees increased by $3.7 million for the three months ended September 30, 2021 compared to the three months ended September 30, 2020 and by $3.9 million for the nine months ended September 30, 2021 compared to the nine months ended September 30, 2020. These increases were primarily due to fees generated from funds previously managed by Black Creek, including property-related fees, such as acquisition, development and property management.
Compensation and Benefits.
Compensation and benefits increased by $16.1 million, or 124%, for the three months ended September 30, 2021 compared to the three months ended September 30, 2020 and by $22.6 million, or 59%, for the nine months ended September 30, 2021 compared to the nine months ended September 30, 2020. The increase in salaries and benefits was primarily driven by headcount growth from the Black Creek Acquisition and in the U.S. real estate equity strategy, by higher incentive compensation attributable to improved operating performance and margin expansion from scaling our business. During the three months ended September 30, 2021, we recorded $8.1 million of compensation and benefit expenses associated with the investment professionals hired as part of the Black Creek Acquisition.
Average headcount for the third quarter of 2021 increased by 115% to 232 investment and investment support professionals for the 2021 period from 108 professionals for the same period in 2020, including 119 professionals from the Black Creek Acquisition. Average headcount for the year-to-date period increased by 48% to 148 investment and investment support professionals for the 2021 period from 100 professionals for the same period in 2020, including 40 professionals from the Black Creek Acquisition.
General, Administrative and Other Expenses.
General, administrative and other expenses increased by $2.4 million, or 81%, for the three months ended September 30, 2021 compared to the three months ended September 30, 2020 and by $2.9 million, or 31%, for the nine months ended September 30, 2021 compared to the nine months ended September 30, 2020. The change was principally driven by an increase in expenses of $2.0 million from the Black Creek Acquisition and by placement fees of $0.2 million and $0.8 million for the three and nine months ended September 30, 2021, respectively, primarily associated with new commitments to AREOF III.
98
Realized Income:
The following table presents the components of the Real Estate Group's RI:
| Three months ended September 30, | Favorable (Unfavorable) | Nine months ended September 30, | Favorable (Unfavorable) | ||||||||||||||||||||||||||||||||||||||||||||
| ($ in thousands) | 2021 | 2020 | $ Change | % Change | 2021 | 2020 | $ Change | % Change | |||||||||||||||||||||||||||||||||||||||
| Fee Related Earnings | $ | 24,261 | $ | 7,794 | $ | 16,467 | 211% | $ | 47,375 | $ | 24,831 | $ | 22,544 | 91% | |||||||||||||||||||||||||||||||||
| Performance income—realized | 4,693 | 199 | 4,494 | NM | 12,255 | 27,106 | (14,851) | (55) | |||||||||||||||||||||||||||||||||||||||
| Performance related compensation—realized | (3,166) | (123) | (3,043) | NM | (8,167) | (17,484) | 9,317 | 53 | |||||||||||||||||||||||||||||||||||||||
| Realized net performance income | 1,527 | 76 | 1,451 | NM | 4,088 | 9,622 | (5,534) | (58) | |||||||||||||||||||||||||||||||||||||||
| Investment income—realized | 1,699 | 486 | 1,213 | 250 | 4,182 | 2,740 | 1,442 | 53 | |||||||||||||||||||||||||||||||||||||||
| Interest and other investment income—realized | 918 | 1,308 | (390) | (30) | 3,892 | 3,024 | 868 | 29 | |||||||||||||||||||||||||||||||||||||||
| Interest expense | (1,683) | (1,389) | (294) | (21) | (3,930) | (3,715) | (215) | (6) | |||||||||||||||||||||||||||||||||||||||
| Realized net investment income | 934 | 405 | 529 | 131 | 4,144 | 2,049 | 2,095 | 102 | |||||||||||||||||||||||||||||||||||||||
| Realized Income | $ | 26,722 | $ | 8,275 | 18,447 | 223 | $ | 55,607 | $ | 36,502 | 19,105 | 52 | |||||||||||||||||||||||||||||||||||
NM - Not Meaningful
Realized net performance income and realized net investment income for the three and nine months ended September 30, 2021 and 2020 were primarily attributable to realizations from the sale of multiple properties held in U.S. real estate equity funds. Realized net investment income for the nine months ended September 30, 2021 also included distributions from real estate debt vehicles, driven by operating income during the period.
Realized net performance income and realized net investment income also included realizations from the sale of a 40-property pan-European logistics portfolio held within multiple European real estate funds for the nine months ended September 30, 2020.
Real Estate Group— Carried Interest and Incentive Fees
99
The following table presents the accrued carried interest and incentive fees receivable, also referred to as accrued performance income, and related performance compensation for the Real Estate Group:
| As of September 30, 2021 | As of December 31, 2020 | ||||||||||||||||||||||||||||||||||
| ($ in thousands) | Accrued Performance Income | Accrued Performance Compensation | Accrued Net Performance Income | Accrued Performance Income | Accrued Performance Compensation | Accrued Net Performance Income | |||||||||||||||||||||||||||||
| Accrued Carried Interest | |||||||||||||||||||||||||||||||||||
| US VIII | $ | 90,151 | $ | 57,697 | $ | 32,454 | $ | 57,074 | $ | 36,527 | $ | 20,547 | |||||||||||||||||||||||
| US IX | 88,312 | 54,753 | 33,559 | 26,704 | 16,556 | 10,148 | |||||||||||||||||||||||||||||
| EF IV | 66,766 | 40,061 | 26,705 | 55,829 | 33,498 | 22,331 | |||||||||||||||||||||||||||||
| EF V | 61,308 | 42,915 | 18,393 | — | — | — | |||||||||||||||||||||||||||||
|
AREOF III
|
17,490 | 10,494 | 6,996 | — | — | — | |||||||||||||||||||||||||||||
| Other real estate funds | 94,105 | 58,420 | 35,685 | 61,962 | 38,535 | 23,427 | |||||||||||||||||||||||||||||
|
Other fee generating funds
(1)
|
3,825 | — | 3,825 | 2,786 | — | 2,786 | |||||||||||||||||||||||||||||
| Total accrued carried interest | 421,957 | 264,340 | 157,617 | 204,355 | 125,116 | 79,239 | |||||||||||||||||||||||||||||
| Incentive fees | 579 | 347 | 232 | 525 | 315 | 210 | |||||||||||||||||||||||||||||
| Total Real Estate Group | $ | 422,536 | $ | 264,687 | $ | 157,849 | $ | 204,880 | $ | 125,431 | $ | 79,449 | |||||||||||||||||||||||
(1)
Relates to investment income from AREA Sponsor Holdings LLC that is reclassified for segment reporting to align with the character of the underlying income generated.
The following table presents the change in accrued carried interest during the period for the Real Estate Group:
| As of December 31, 2020 | Activity during the period | As of September 30, 2021 | ||||||||||||||||||||||||||||||||||||
| ($ in thousands) |
Waterfall
Type |
Accrued Carried Interest | Change in Unrealized | Realized |
Other
Adjustments |
Accrued Carried Interest | ||||||||||||||||||||||||||||||||
| US VIII | European | $ | 57,074 | $ | 33,077 | $ | — | $ | — | $ | 90,151 | |||||||||||||||||||||||||||
| US IX | European | 26,704 | 61,608 | — | — | 88,312 | ||||||||||||||||||||||||||||||||
| EF IV | American | 55,829 | 10,937 | — | — | 66,766 | ||||||||||||||||||||||||||||||||
| EF V | American | — | 61,306 | — | 2 | 61,308 | ||||||||||||||||||||||||||||||||
| AREOF III | European | — | 17,490 | — | — | 17,490 | ||||||||||||||||||||||||||||||||
| Other real estate funds | European | 29,518 | 10,845 | (117) | — | 40,246 | ||||||||||||||||||||||||||||||||
| Other real estate funds | American | 32,444 | 31,615 | (10,200) | — | 53,859 | ||||||||||||||||||||||||||||||||
|
Other fee generating funds
(1)
|
European | 426 | 18 | — | (246) | 198 | ||||||||||||||||||||||||||||||||
|
Other fee generating funds
(1)
|
American | 2,360 | 1,267 | — | — | 3,627 | ||||||||||||||||||||||||||||||||
| Total Real Estate Group | $ | 204,355 | $ | 228,163 | $ | (10,317) | $ | (244) | $ | 421,957 | ||||||||||||||||||||||||||||
(1)
Relates to investment income from AREA Sponsor Holdings LLC that is reclassified for segment reporting to align with the character of the underlying income generated.
100
Real Estate Group—Assets Under Management
The tables below present rollforwards of AUM for the Real Estate Group:
| ($ in millions) | U.S. Real Estate Equity | European Real Estate Equity |
Real Estate
Debt |
Total Real Estate Group | ||||||||||||||||||||||
| Balance at 6/30/2021 | $ | 5,702 | $ | 5,648 | $ | 8,375 | $ | 19,725 | ||||||||||||||||||
| Acquisitions | 13,719 | — | — | 13,719 | ||||||||||||||||||||||
| Net new par/equity commitments | 791 | 1,040 | 246 | 2,077 | ||||||||||||||||||||||
| Net new debt commitments | — | — | 250 | 250 | ||||||||||||||||||||||
| Capital reductions | — | — | (41) | (41) | ||||||||||||||||||||||
| Distributions | (488) | (180) | (39) | (707) | ||||||||||||||||||||||
| Redemptions | (28) | — | — | (28) | ||||||||||||||||||||||
| Change in fund value | 1,399 | 57 | 50 | 1,506 | ||||||||||||||||||||||
| Balance at 9/30/2021 | $ | 21,095 | $ | 6,565 | $ | 8,841 | $ | 36,501 | ||||||||||||||||||
|
Average AUM
(1)
|
$ | 13,399 | $ | 6,107 | $ | 8,608 | $ | 28,114 | ||||||||||||||||||
| U.S. Real Estate Equity | European Real Estate Equity |
Real Estate
Debt |
Total Real Estate Group | |||||||||||||||||||||||
| Balance at 6/30/2020 | $ | 4,148 | $ | 4,606 | $ | 5,641 | $ | 14,395 | ||||||||||||||||||
| Acquisitions | 30 | (25) | 21 | 26 | ||||||||||||||||||||||
| Net new debt commitments | — | — | 23 | 23 | ||||||||||||||||||||||
| Capital reductions | — | — | (186) | (186) | ||||||||||||||||||||||
| Distributions | (70) | (71) | (20) | (161) | ||||||||||||||||||||||
| Change in fund value | 82 | 171 | 29 | 282 | ||||||||||||||||||||||
| Balance at 9/30/2020 | $ | 4,190 | $ | 4,681 | $ | 5,508 | $ | 14,379 | ||||||||||||||||||
|
Average AUM
(1)
|
$ | 4,169 | $ | 4,644 | $ | 5,575 | $ | 14,388 | ||||||||||||||||||
| (1) Represents the quarterly average of beginning and ending balances. | ||||||||||||||||||||||||||
| U.S. Real Estate Equity | European Real Estate Equity |
Real Estate
Debt |
Total Real Estate Group | |||||||||||||||||||||||
| Balance at 12/31/2020 | $ | 4,404 | $ | 4,811 | $ | 5,593 | $ | 14,808 | ||||||||||||||||||
| Acquisitions | 13,719 | — | — | 13,719 | ||||||||||||||||||||||
| Net new par/equity commitments | 1,985 | 1,917 | 843 | 4,745 | ||||||||||||||||||||||
| Net new debt commitments | — | — | 2,655 | 2,655 | ||||||||||||||||||||||
| Capital reductions | — | — | (273) | (273) | ||||||||||||||||||||||
| Distributions | (788) | (475) | (107) | (1,370) | ||||||||||||||||||||||
| Redemptions | (28) | — | (7) | (35) | ||||||||||||||||||||||
| Change in fund value | 1,803 | 312 | 137 | 2,252 | ||||||||||||||||||||||
| Balance at 9/30/2021 | $ | 21,095 | $ | 6,565 | $ | 8,841 | $ | 36,501 | ||||||||||||||||||
|
Average AUM
(1)
|
$ | 9,028 | $ | 5,449 | $ | 7,565 | $ | 22,042 | ||||||||||||||||||
| U.S. Real Estate Equity | European Real Estate Equity |
Real Estate
Debt |
Total Real Estate Group | |||||||||||||||||||||||
| Balance at 12/31/2019 | $ | 3,793 | $ | 4,588 | $ | 4,826 | $ | 13,207 | ||||||||||||||||||
| Net new par/equity commitments | 664 | 687 | 641 | 1,992 | ||||||||||||||||||||||
| Net new debt commitments | — | — | 287 | 287 | ||||||||||||||||||||||
| Capital reductions | — | — | (222) | (222) | ||||||||||||||||||||||
| Distributions | (214) | (722) | (57) | (993) | ||||||||||||||||||||||
| Change in fund value | (53) | 128 | 33 | 108 | ||||||||||||||||||||||
| Balance at 9/30/2020 | $ | 4,190 | $ | 4,681 | $ | 5,508 | $ | 14,379 | ||||||||||||||||||
|
Average AUM
(1)
|
$ | 4,076 | $ | 4,597 | $ | 5,351 | $ | 14,024 | ||||||||||||||||||
| (1) Represents a four-point average of quarter-end balances for each period. | ||||||||||||||||||||||||||
101
The components of our AUM for the Real Estate Group are presented below ($ in billions):
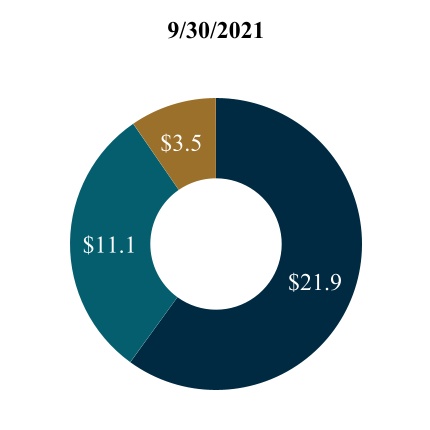

| AUM: $36.5 | AUM: $14.4 | |||||||||||||
| FPAUM |
Non-fee paying
(1)
|
AUM not yet paying fees | |||||||||||||||
(1) Includes $0.4 billion and $0.3 billion of non-fee paying AUM based on our general partner commitment as of September 30, 2021 and 2020, respectively.
102
Real Estate Group—Fee Paying AUM
The tables below present rollforwards of fee paying AUM for the Real Estate Group:
| ($ in millions) | U.S. Real Estate Equity | European Real Estate Equity |
Real Estate
Debt |
Total Real Estate Group | ||||||||||||||||||||||
| Balance at 6/30/2021 | $ | 4,365 | $ | 4,339 | $ | 3,113 | $ | 11,817 | ||||||||||||||||||
| Acquisitions | 7,155 | — | — | 7,155 | ||||||||||||||||||||||
| Commitments | 721 | 602 | — | 1,323 | ||||||||||||||||||||||
| Subscriptions/deployment/increase in leverage | 931 | 234 | 299 | 1,464 | ||||||||||||||||||||||
| Distributions | (114) | (158) | (103) | (375) | ||||||||||||||||||||||
| Redemptions | (28) | — | — | (28) | ||||||||||||||||||||||
| Change in fund value | 610 | (65) | 43 | 588 | ||||||||||||||||||||||
| Change in fee basis | — | (5) | — | (5) | ||||||||||||||||||||||
| Balance at 9/30/2021 | $ | 13,640 | $ | 4,947 | $ | 3,352 | $ | 21,939 | ||||||||||||||||||
|
Average FPAUM
(1)
|
$ | 9,003 | $ | 4,643 | $ | 3,233 | $ | 16,879 | ||||||||||||||||||
| U.S. Real Estate Equity | European Real Estate Equity |
Real Estate
Debt |
Total Real Estate Group | |||||||||||||||||||||||
| Balance at 6/30/2020 | $ | 3,508 | $ | 3,965 | $ | 1,858 | $ | 9,331 | ||||||||||||||||||
| Commitments | 43 | — | — | 43 | ||||||||||||||||||||||
| Subscriptions/deployment/increase in leverage | 18 | 3 | 55 | 76 | ||||||||||||||||||||||
| Capital reductions | — | — | (2) | (2) | ||||||||||||||||||||||
| Distributions | (17) | (48) | (20) | (85) | ||||||||||||||||||||||
| Change in fund value | — | 130 | 26 | 156 | ||||||||||||||||||||||
| Change in fee basis | (86) | — | — | (86) | ||||||||||||||||||||||
| Balance at 9/30/2020 | $ | 3,466 | $ | 4,050 | $ | 1,917 | $ | 9,433 | ||||||||||||||||||
|
Average FPAUM
(1)
|
$ | 3,487 | $ | 4,008 | $ | 1,888 | $ | 9,383 | ||||||||||||||||||
| (1) Represents the quarterly average of beginning and ending balances. | ||||||||||||||||||||||||||
| U.S. Real Estate Equity | European Real Estate Equity |
Real Estate
Debt |
Total Real Estate Group | |||||||||||||||||||||||
| Balance at 12/31/2020 | $ | 3,659 | $ | 4,088 | $ | 2,505 | $ | 10,252 | ||||||||||||||||||
| Acquisitions | 7,155 | — | — | 7,155 | ||||||||||||||||||||||
| Commitments | 1,630 | 1,053 | 202 | 2,885 | ||||||||||||||||||||||
| Subscriptions/deployment/increase in leverage | 1,067 | 271 | 849 | 2,187 | ||||||||||||||||||||||
| Capital reductions | — | — | (32) | (32) | ||||||||||||||||||||||
| Distributions | (322) | (298) | (283) | (903) | ||||||||||||||||||||||
| Redemptions | (28) | — | (7) | (35) | ||||||||||||||||||||||
| Change in fund value | 611 | (162) | 118 | 567 | ||||||||||||||||||||||
| Change in fee basis | (132) | (5) | — | (137) | ||||||||||||||||||||||
| Balance at 9/30/2021 | $ | 13,640 | $ | 4,947 | $ | 3,352 | $ | 21,939 | ||||||||||||||||||
|
Average FPAUM
(1)
|
$ | 6,425 | $ | 4,348 | $ | 2,935 | $ | 13,708 | ||||||||||||||||||
| U.S. Real Estate Equity | European Real Estate Equity |
Real Estate
Debt |
Total Real Estate Group | |||||||||||||||||||||||
| Balance at 12/31/2019 | $ | 2,635 | $ | 3,792 | $ | 1,536 | $ | 7,963 | ||||||||||||||||||
| Commitments | 874 | 594 | 73 | 1,541 | ||||||||||||||||||||||
| Subscriptions/deployment/increase in leverage | 114 | 151 | 343 | 608 | ||||||||||||||||||||||
| Capital reductions | — | (17) | (32) | (49) | ||||||||||||||||||||||
| Distributions | (71) | (267) | (56) | (394) | ||||||||||||||||||||||
| Change in fund value | — | 108 | 53 | 161 | ||||||||||||||||||||||
| Change in fee basis | (86) | (311) | — | (397) | ||||||||||||||||||||||
| Balance at 9/30/2020 | $ | 3,466 | $ | 4,050 | $ | 1,917 | $ | 9,433 | ||||||||||||||||||
|
Average FPAUM
(1)
|
$ | 3,257 | $ | 3,930 | $ | 1,800 | $ | 8,987 | ||||||||||||||||||
| (1) Represents a four-point average of quarter-end balances for each period. | ||||||||||||||||||||||||||
103
The charts below present FPAUM for the Real Estate Group by its fee basis ($ in billions):


| FPAUM: $21.9 | FPAUM: $9.4 | |||||||||||||
|
Market value
(1)
|
Capital commitments |
Invested capital/other
(2)
|
|||||||||||||||
(1)
Amounts represent FPAUM from funds that primarily invest in illiquid strategies. The underlying investments held in these funds are generally subject to less market volatility than investments held in liquid strategies.
(2)
Other consists of ACRE's FPAUM, which is based on ACRE’s stockholders’ equity.
Real Estate Group—Fund Performance Metrics as of September 30, 2021
Five significant funds, EF V, AREOF III, Black Creek Diversified Property Fund, Inc. (“DPF”), Black Creek Industrial REIT IV, Inc. (“BCI IV”) and an open-ended industrial real estate fund, collectively contributed approximately 44% of the Real Estate Group’s management fees for the nine months ended September 30, 2021.
The following table presents the performance data for our significant funds that are not drawdown funds in the Real Estate Group as of September 30, 2021:
|
Returns(%)
(1)
|
|||||||||||||||||||||||||||||||||||||||||||||||||||||
| ($ in millions) | Year of Inception | AUM | Current Quarter | Year-To-Date |
Since Inception
(2)
|
Primary
Investment Strategy
|
|||||||||||||||||||||||||||||||||||||||||||||||
| Fund | Gross | Net | Gross | Net | Gross | Net | |||||||||||||||||||||||||||||||||||||||||||||||
|
Open-ended industrial real estate fund
(3)
|
2017 | $ | 3,819 | 10.1 | 8.7 | 28.9 | 24.2 | 27.2 | 22.4 | U.S. Real Estate Equity | |||||||||||||||||||||||||||||||||||||||||||
|
DPF
(4)
|
2012 | 3,017 | N/A | 3.5 | N/A | 7.8 | N/A | 7.0 | U.S. Real Estate Equity | ||||||||||||||||||||||||||||||||||||||||||||
|
BCI IV
(5)
|
2017 | 4,407 | N/A | 10.5 | N/A | 18.3 | N/A | 9.5 | U.S. Real Estate Equity | ||||||||||||||||||||||||||||||||||||||||||||
(1)
Returns are time-weighted rates of return and include the reinvestment of income and other earnings from securities or other investments and reflect the deduction of all trading expenses.
(2)
Since inception returns are annualized.
(3)
Gross returns do not reflect the deduction of management fees or other expenses. Net returns are calculated by subtracting the applicable management fees and other expenses from the gross returns on a quarterly basis.
(4)
Returns are shown for institutional share class. Net returns are calculated using the fund’s NAV and assume distributions are reinvested at the NAV on the date of distribution. The inception date used in the calculation of the since inception return is the date in which the first shares of common stock were sold after converting to a NAV-based REIT. Additional information related to DPF can be found in its financial statements filed with the SEC, which are not part of this report.
(5)
Returns are shown for institutional share class. Net returns are calculated using the fund’s NAV and assume distributions are reinvested at the NAV on the date of distribution. Additional information related to BCI IV can be found in its financial statements filed with the SEC, which are not part of this report.
104
The following table presents the performance data of our significant drawdown funds as of as of September 30, 2021:
| ($ in millions) | Year of Inception | AUM | Original Capital Commitments | Capital Invested to Date |
Realized Value
(1)
|
Unrealized Value
(2)
|
Total Value | MoIC | IRR(%) | Primary Investment Strategy | |||||||||||||||||||||||||||||||||||||||||||||||||||||||||||||
| Fund |
Gross
(3)
|
Net
(4)
|
Gross
(5)
|
Net
(6)
|
|||||||||||||||||||||||||||||||||||||||||||||||||||||||||||||||||||
| Funds Deploying Capital | |||||||||||||||||||||||||||||||||||||||||||||||||||||||||||||||||||||||
|
EF V
(7)
|
2018 | $ | 2,288 | $ | 1,968 | $ | 1,080 | $ | 332 | $ | 1,196 | $ | 1,528 | 1.4x | 1.2x | 24.8 | 15.9 | European Real Estate Equity | |||||||||||||||||||||||||||||||||||||||||||||||||||||
| AREOF III | 2019 | 1,787 | 1,697 | 480 | 41 | 568 | 609 | 1.3x | 1.2x | N/A | N/A | U.S. Real Estate Equity | |||||||||||||||||||||||||||||||||||||||||||||||||||||||||||
(1)
Realized value includes distributions of operating income, sales and financing proceeds received.
(2)
Unrealized value represents the fair market value of remaining investments. Unrealized value does not take into account any bridge financings. There can be no assurance that unrealized investments will be realized at the valuations indicated.
(3)
The gross MoIC is calculated at the investment level and is based on the interests of all partners. The gross MoIC for all funds is before giving effect to management fees, carried interest and other expenses, as applicable.
(4)
The net MoIC is calculated at the fund-level and is based on the interests of the fee-paying partners and, if applicable, excludes interests attributable to the non fee-paying partners and/or the general partner which does not pay management fees, carried interest or has such fees rebated outside of the fund. The net MoIC is after giving effect to management fees, carried interest as applicable and other expenses. The funds may utilize a credit facility during the investment period and for general cash management purposes. Early in the life of a fund, the net fund-level MoICs would generally have been lower had such fund called capital from its limited partners instead of utilizing the credit facility.
(5)
The gross IRR is an annualized since inception gross internal rate of return of cash flows to and from investments and the residual value of the investments at the end of the measurement period. Gross IRRs reflect returns to all partners. Cash flows used in the gross IRR calculation are assumed to occur at quarter-end. The gross IRRs are calculated before giving effect to management fees, carried interest and other expenses, as applicable.
(6)
The net IRR is an annualized since inception net internal rate of return of cash flows to and from the fund and the fund’s residual value at the end of the measurement period. Net IRRs reflect returns to the fee-paying partners and, if applicable, exclude interests attributable to the non fee-paying partners and/or the general partner which does not pay management fees or carried interest or has such fees rebated outside of the fund. The cash flow dates used in the net IRR calculation are based on the actual dates of the cash flows. The net IRRs are calculated after giving effect to management fees, carried interest as applicable, and other expenses. The funds may utilize a credit facility during the investment period and for general cash management purposes. Net fund-level IRRs would generally have been lower had such fund called capital from its limited partners instead of utilizing the credit facility.
(7)
EF V is made up of two parallel funds, one denominated in U.S. dollars and one denominated in Euros. The gross and net IRR and MoIC presented in the table are for the Euro denominated parallel fund. The gross and net MoIC and IRR presented in the chart is for the Euro denominated parallel fund. The gross and net MoIC for the U.S. Dollar denominated parallel fund are 1.4x and 1.3x, respectively. The gross and net IRR for the U.S. Dollar denominated parallel fund are 25.2% and 17.5%, respectively. Original capital commitments are converted to U.S. dollars at the prevailing exchange rate at the time of fund's closing. All other values for EF V are for the combined fund and are converted to U.S. dollars at the prevailing quarter-end exchange rate.
105
Secondary Solutions Group—Three and Nine Months Ended September 30, 2021
The Secondary Solutions Group is an operating segment formed during the second quarter of 2021 in connection with the Landmark Acquisition that focuses on investing in secondary markets across a range of alternative asset class strategies, including private equity, real estate and infrastructure. The Secondary Solutions Group includes three significant funds, Landmark Equity Partners XV, L.P. (“LEP XV”), LEP XVI and LREP VIII, amongst other funds and related co-investment vehicles.
The following table presents the components of the Secondary Solutions Group's FRE and RI:
| ($ in thousands) |
For the three months ended September 30, 2021
|
For the period June 2, 2021
through September 30, 2021 |
||||||
| Management fees | $ | 41,064 | $ | 53,962 | ||||
| Compensation and benefits | (11,955) | (16,244) | ||||||
| General, administrative and other expenses | (2,593) | (3,452) | ||||||
| Fee Related Earnings | $ | 26,516 | $ | 34,266 | ||||
| Realized net investment income | 272 | 269 | ||||||
| Realized Income | $ | 26,788 | $ | 34,535 | ||||
Secondary Solutions Group—Management Fees
Management fees for the funds in the Secondary Solutions Group typically range from 0.50% to 1.00% of capital commitments, NAV of the underlying funds, or NAV plus unfunded commitments. Funds in each strategy are comprised of closed-end funds with either investment period termination or management contract termination dates and of co-investment accounts that generally do not have termination dates.
The activity for the period presented represents management fees recognized since the closing of the Landmark Acquisition on June 2, 2021. The effective management fee rate for the three months ended September 30, 2021 and for the period from June 2, 2021 through September 30, 2021 was 0.90% and 0.92%, respectively.
The funds across the strategies had an average management contract term from the closing date of more than 10 years.
Secondary Solutions Group—Carried Interest
For funds in the Secondary Solutions Group, carried interest is allocated to us based on cumulative fund performance to date, subject to the achievement of minimum return levels in accordance with the respective terms in each fund’s governing documents. For the private equity and real estate secondaries strategies, carried interest represents 10.0% to 12.5% of each carried interest eligible fund’s profits, subject to a preferred return of approximately 8.0% per annum. We are entitled to carried interest from the funds with closings subsequent to the completion of the Landmark Acquisition and to carried interest we acquired through the purchase of an ownership interest in certain Landmark GP Entities.
The following table presents accrued carried interest, also referred to as accrued performance income, and related performance compensation for the Secondary Solutions Group:
| As of September 30, 2021 | |||||||||||||||||
| ($ in thousands) | Accrued Performance Income | Accrued Performance Compensation | Accrued Net Performance Income | ||||||||||||||
| LEP XVI | $ | 91,902 | $ | 78,117 | $ | 13,785 | |||||||||||
| LREP VIII | 50,497 | 42,923 | 7,574 | ||||||||||||||
| Other fee generating funds | 32,083 | 26,976 | 5,107 | ||||||||||||||
| Total Secondary Solutions Group | $ | 174,482 | $ | 148,016 | $ | 26,466 | |||||||||||
106
The following table presents the change in accrued carried interest during the period for the Secondary Solutions Group:
| Opening balance as of June 2, 2021 | Activity during the period | As of September 30, 2021 | ||||||||||||||||||||||||||||||
| ($ in thousands) | Waterfall Type | Accrued Carried Interest | Change in Unrealized | Realized | Accrued Carried Interest | |||||||||||||||||||||||||||
| LEP XVI | European | 37,281 | 54,621 | — | 91,902 | |||||||||||||||||||||||||||
| LREP VIII | European | 24,398 | 26,099 | — | 50,497 | |||||||||||||||||||||||||||
| Other fee generating funds | European | 15,146 | 16,937 | — | 32,083 | |||||||||||||||||||||||||||
|
Total Secondary Solutions Group
|
$ | 76,825 | $ | 97,657 | $ | — | $ | 174,482 | ||||||||||||||||||||||||
Secondary Solutions Group—Assets Under Management
The table below presents the rollforward of AUM for the Secondary Solutions Group:
| ($ in millions) | Private Equity Secondaries | Real Estate Secondaries | Infrastructure Secondaries |
Total Secondary Solutions
Group
|
||||||||||||||||||||||
| Balance at 6/30/2021 | $ | 12,316 | $ | 5,570 | $ | 1,590 | $ | 19,476 | ||||||||||||||||||
| Net new par/equity commitments | 1,130 | — | — | 1,130 | ||||||||||||||||||||||
| Distributions | (250) | (268) | (17) | (535) | ||||||||||||||||||||||
| Change in fund value | 463 | 184 | 25 | 672 | ||||||||||||||||||||||
| Balance at 9/30/2021 | $ | 13,659 | $ | 5,486 | $ | 1,598 | $ | 20,743 | ||||||||||||||||||
|
Average AUM
(1)
|
$ | 12,988 | $ | 5,528 | $ | 1,594 | $ | 20,110 | ||||||||||||||||||
| (1) Represents the quarterly average of beginning and ending balances. | ||||||||||||||||||||||||||
| ($ in millions) | Private Equity Secondaries | Real Estate Secondaries | Infrastructure Secondaries | Total Secondary Solutions Group | ||||||||||||||||||||||
| Balance at 12/31/2020 | $ | — | $ | — | $ | — | $ | — | ||||||||||||||||||
| Acquisitions | 12,275 | 5,641 | 1,597 | 19,513 | ||||||||||||||||||||||
| Net new par/equity commitments | 1,231 | — | — | 1,231 | ||||||||||||||||||||||
| Distributions | (301) | (335) | (23) | (659) | ||||||||||||||||||||||
| Change in fund value | 454 | 180 | 24 | 658 | ||||||||||||||||||||||
| Balance at 9/30/2021 | $ | 13,659 | $ | 5,486 | $ | 1,598 | $ | 20,743 | ||||||||||||||||||
|
Average AUM
(1)
|
$ | 12,750 | $ | 5,566 | $ | 1,595 | $ | 19,911 | ||||||||||||||||||
| (1) Represents the average calculated using AUM on the date of the Landmark Acquisition and on each subsequent quarter-end. | ||||||||||||||||||||||||||
107
The components of our AUM for the Secondary Solutions Group are presented below ($ in billions):
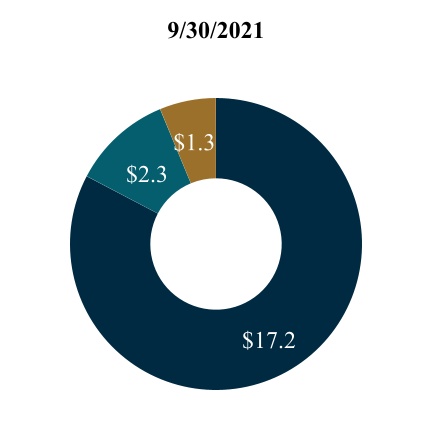
| AUM: $20.8 | ||||||||
| FPAUM |
Non-fee paying
(1)
|
AUM not yet paying fees | |||||||||||||||
(1) Includes $0.4 billion of non-fee paying AUM based on our general partner commitment as of September 30, 2021.
Secondary Solutions
Group—Fee Paying AUM
The table below presents the rollforward of fee paying AUM for the Secondary Solutions Group:
| ($ in millions) | Private Equity Secondaries | Real Estate Secondaries | Infrastructure Secondaries | Total Secondary Solutions Group | ||||||||||||||||||||||
| Balance at 6/30/2021 | $ | 10,828 | $ | 4,928 | $ | 1,171 | $ | 16,927 | ||||||||||||||||||
| Commitments | 278 | — | — | 278 | ||||||||||||||||||||||
| Subscriptions/deployment/increase in leverage | — | — | 7 | 7 | ||||||||||||||||||||||
| Distributions | (38) | (28) | (7) | (73) | ||||||||||||||||||||||
| Change in fund value | 44 | 28 | 11 | 83 | ||||||||||||||||||||||
| Change in fee basis | — | (37) | — | (37) | ||||||||||||||||||||||
| Balance at 9/30/2021 | $ | 11,112 | $ | 4,891 | $ | 1,182 | $ | 17,185 | ||||||||||||||||||
|
Average FPAUM
(1)
|
$ | 10,970 | $ | 4,910 | $ | 1,177 | $ | 17,057 | ||||||||||||||||||
| (1) Represents the quarterly average of beginning and ending balances. | ||||||||||||||||||||||||||
| Private Equity Secondaries | Real Estate Secondaries | Infrastructure Secondaries | Total Secondary Solutions Group | |||||||||||||||||||||||
| Balance at 12/31/2020 | $ | — | $ | — | $ | — | $ | — | ||||||||||||||||||
| Acquisitions | 10,740 | 4,928 | 1,171 | 16,839 | ||||||||||||||||||||||
| Commitments | 378 | — | — | 378 | ||||||||||||||||||||||
| Subscriptions/deployment/increase in leverage | 2 | — | 7 | 9 | ||||||||||||||||||||||
| Distributions | (38) | (28) | (7) | (73) | ||||||||||||||||||||||
| Change in fund value | 42 | 28 | 11 | 81 | ||||||||||||||||||||||
| Change in fee basis | (12) | (37) | — | (49) | ||||||||||||||||||||||
| Balance at 9/30/2021 | $ | 11,112 | $ | 4,891 | $ | 1,182 | $ | 17,185 | ||||||||||||||||||
|
Average FPAUM
(1)
|
$ | 10,893 | $ | 4,916 | $ | 1,175 | $ | 16,984 | ||||||||||||||||||
| (1) Represents the average calculated using FPAUM on the date of the Landmark Acquisition and on each subsequent quarter-end. | ||||||||||||||||||||||||||
108
The chart below presents FPAUM for the Secondary Solutions Group by its fee basis ($ in billions):
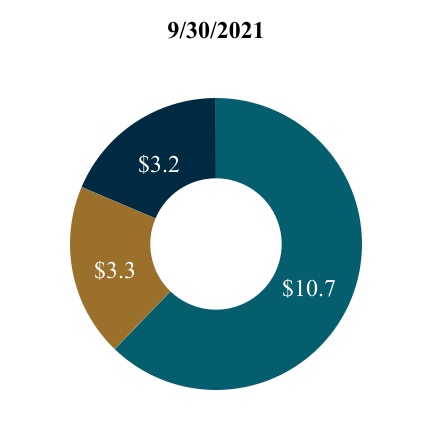
| FPAUM: $17.2 | ||||||||
| Capital commitments |
Market value
(1)
|
Invested capital/other | |||||||||||||||
(1)
Amounts represent FPAUM from funds that primarily invest in illiquid strategies. The underlying investments held in these funds are generally subject to less market volatility than investments held in liquid strategies.
109
Secondary Solutions Group—Fund Performance Metrics as of September 30, 2021
Secondary Solutions includes three significant funds, LEP XV, LEP XVI and LREP VIII, that collectively contributed approximately 66% of the Secondary Solutions Group’s management fees for the nine months ended September 30, 2021.
The following table presents the performance data as of September 30, 2021 for our significant funds in the Secondary Solutions Group, all of which are drawdown funds:
| ($ in millions) | Year of Inception | AUM | Original Capital Commitments | Capital Invested to Date |
Realized Value
(1)
|
Unrealized Value
(2)
|
Total Value | MoIC | IRR(%) | Primary Investment Strategy | |||||||||||||||||||||||||||||||||||||||||||||||||||||||||||||
| Fund |
Gross
(3)
|
Net
(4)
|
Gross
(5)
|
Net
(6)
|
|||||||||||||||||||||||||||||||||||||||||||||||||||||||||||||||||||
| Funds Harvesting Investments | |||||||||||||||||||||||||||||||||||||||||||||||||||||||||||||||||||||||
|
LEP XV
(7)
|
2013 | $ | 2,362 | $ | 3,250 | $ | 2,626 | $ | 2,085 | $ | 1,768 | $ | 3,853 | 1.6x | 1.5x | 20.9 | 15.2 | Private Equity Secondaries | |||||||||||||||||||||||||||||||||||||||||||||||||||||
| Funds Deploying Capital | |||||||||||||||||||||||||||||||||||||||||||||||||||||||||||||||||||||||
|
LEP XVI
(7)
|
2016 | 5,962 | 4,896 | 2,200 | 616 | 2,837 | 3,453 | 1.7x | 1.6x | 67.5 | 41.5 | Private Equity Secondaries | |||||||||||||||||||||||||||||||||||||||||||||||||||||||||||
|
LREP VIII
(7)
|
2016 | 3,428 | 3,300 | 1,571 | 747 | 1,255 | 2,002 | 1.4x | 1.3x | 26.0 | 16.4 | Real Estate Secondaries | |||||||||||||||||||||||||||||||||||||||||||||||||||||||||||
* For all funds in the Secondary Solutions Group, returns are calculated from results that are generally reported on a three month lag and may not include the impact of economic and market activities occurring in the current reporting period.
(1)
Realized value represents the sum of all cash distributions to all limited partners and if applicable, exclude tax and incentive distributions made to the general partner.
(2)
Unrealized value represents the limited partners' share of fund's NAV reduced by the accrued incentive allocation, if applicable. There can be no assurance that unrealized values will be realized at the valuations indicated.
(3)
The gross MoIC is calculated at the fund-level and is based on the interests of all partners. If applicable, limiting the gross MoIC to exclude interests attributable to the non-fee paying limited partners and/or the general partner who does not pay management fees or carried interest would have no material impact on the result. The gross MoIC is before giving effect to management fees, carried interest as applicable and other expenses, but after giving effect to credit facility interest expenses, as applicable. The funds may utilize a short-term credit facility for general cash management purposes, as well as a long-term credit facility as permitted by the respective fund's governing documentation. The gross fund-level MoIC would have generally been lower had such fund called capital from its partners instead of utilizing the credit facility.
(4)
The net MoIC is calculated at the fund-level and is based on the interests of the fee-paying limited partners and if applicable, excludes those interests attributable to the non-fee paying limited partners and/or the general partner which does not pay management fees or carried interest. The net MoIC is after giving effect to management fees and other expenses, carried interest and credit facility interest expense, as applicable. The funds may utilize a short-term credit facility for general cash management purposes, as well as a long-term credit facility as permitted by the respective fund's governing documentation. The net fund-level MoICs would generally have been lower had such fund called capital from its limited partners instead of utilizing the credit facility.
(5)
The gross IRR is an annualized since inception gross internal rate of return of cash flows to and from the fund and the fund’s residual value at the end of the measurement period. Gross IRR reflects returns to all partners. If applicable, limiting the gross IRR to exclude interests attributable to the non-fee paying limited partners and/or the general partner who does not pay management fees or carried interest would have no material impact on the result. The cash flow dates used in the gross IRR calculation are based on the actual dates of the cash flows. The gross IRRs are calculated before giving effect to management fees, carried interest, as applicable, and other expenses, but after giving effect to credit facility interest expenses, as applicable. The funds may utilize a short-term credit facility for general cash management purposes, as well as a long-term credit facility as permitted by the respective fund's governing documents. The gross fund-level IRR would generally have been lower had such fund called capital from its partners instead of utilizing the credit facility.
(6)
The net IRR is an annualized since inception net internal rate of return of cash flows to and from the fund and the fund’s residual value at the end of the measurement period. Net IRRs reflect returns to the fee-paying limited partners and, if applicable, exclude interests attributable to the non-fee paying limited partners and/or the general partner who does not pay management fees or carried interest. The cash flow dates used in the net IRR calculations are based on the actual dates of the cash flows. The net IRRs are calculated after giving effect to management fees and other expenses, carried interest and credit facility interest expenses, as applicable. The funds may utilize a short-term credit facility for general cash management purposes, as well as a long-term credit facility as permitted by the respective fund's governing documents. Net fund-level IRRs would generally have been lower had such fund called capital from its limited partners instead of utilizing the credit facility.
(7)
The results of each fund is presented on a combined basis with the affiliated parallel funds or accounts, given that the investments are substantially the same.
110
Strategic Initiatives—Three and Nine Months Ended September 30, 2021
Compared to Three and Nine Months Ended September 30, 2020
Strategic Initiatives represents an all-other category formed in 2020 that includes operating segments and strategic investments that are seeking to broaden our distribution channels or expand our access to global markets. It includes the AUM and results of Ares SSG subsequent to the completion of the SSG Acquisition on July 1, 2020, Ares Insurance Solutions (“AIS”) and Aspida Holdings Ltd. (“Aspida”) following the acquisition of the outstanding common shares of F&G Reinsurance Ltd (rebranded to Aspida Life Re Ltd. post-acquisition, “Aspida Life Re”) on December 18, 2020 and SPACs subsequent to the consummation of AAC’s initial public offering on February 4, 2021.
Fee Related Earnings:
The following table presents the components of Strategic Initiatives’ FRE:
| Three months ended September 30, | Favorable (Unfavorable) | Nine months ended September 30, | Favorable (Unfavorable) | ||||||||||||||||||||||||||||||||||||||||||||
| ($ in thousands) | 2021 | 2020 | $ Change | % Change | 2021 | 2020 | $ Change | % Change | |||||||||||||||||||||||||||||||||||||||
| Management fees | $ | 16,544 | $ | 13,320 | $ | 3,224 | 24 | % | $ | 48,963 | $ | 13,320 | $ | 35,643 | 268 | % | |||||||||||||||||||||||||||||||
| Other fees | 2 | 6 | (4) | (67) | 82 | 6 | 76 | NM | |||||||||||||||||||||||||||||||||||||||
| Compensation and benefits | (5,316) | (4,241) | (1,075) | (25) | (15,440) | (4,241) | (11,199) | (264) | |||||||||||||||||||||||||||||||||||||||
| General, administrative and other expenses | (1,774) | (1,514) | (260) | (17) | (5,580) | (1,514) | (4,066) | (269) | |||||||||||||||||||||||||||||||||||||||
| Fee Related Earnings | $ | 9,456 | $ | 7,571 | 1,885 | 25 | $ | 28,025 | $ | 7,571 | 20,454 | 270 | |||||||||||||||||||||||||||||||||||
NM - Not Meaningful
Management Fees.
The chart below presents Strategic Initiatives management fees and effective management fee rates:
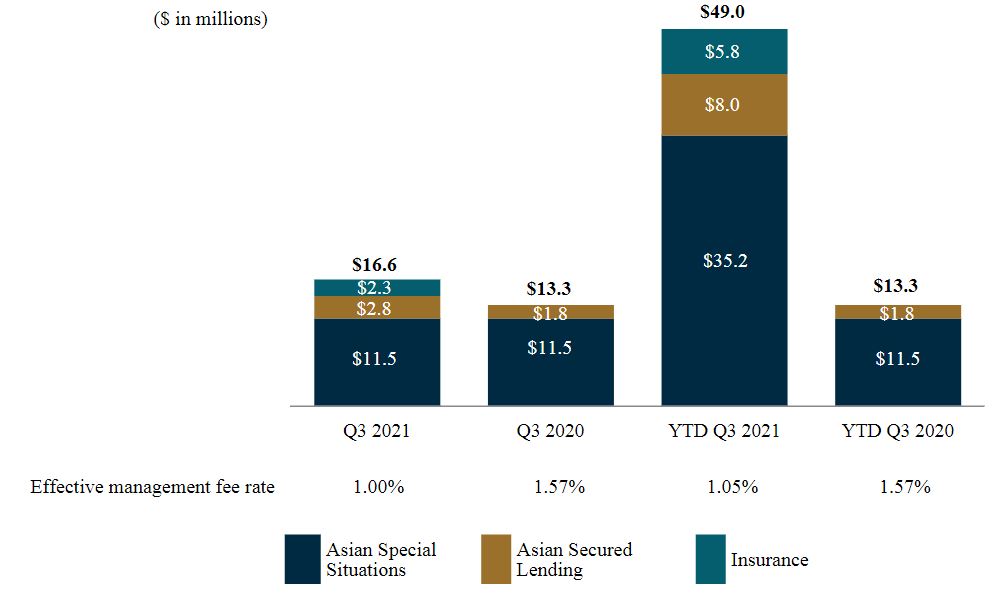
Management fees increased for the three and nine months ended September 30, 2021 compared to the three and nine months ended September 30, 2020 primarily due to the acquisition of Aspida Life Re that occurred in the fourth quarter of 2020 and to additional commitments to SLO III. In addition, the increase for the nine months ended September 30, 2021 compared to the nine months ended September 30, 2020 was due to the full year-to-date impact of the SSG Acquisition which closed at the beginning of the third quarter of 2020.
111
The decrease in effective management fee rate for the three months ended September 30, 2021 compared to the three months ended September 30, 2020 was primarily driven by the acquisition of Aspida Life Re that occurred in the fourth quarter of 2020. The insurance strategy has an effective management fee rate below 0.50% and is driving the decrease in the overall effective management fee rate.
Compensation and Benefits.
Compensation and benefits increased by $1.1 million, or 25%, for the three months ended September 30, 2021 compared to the three months ended September 30, 2020 and by $11.2 million, or 264%, for the nine months ended September 30, 2021 compared to the nine months ended September 30, 2020. The increase in salaries and benefits for the three months ended September 30, 2021 was primarily driven by headcount growth across the Asian special situations, Asian secured lending and insurance strategies. Average headcount for the third quarter of 2021 increased by 43% to 50 investment and investment support professionals from 35 professionals for the same period in 2020.
The increase in salaries and benefits for the nine months ended September 30, 2021 when compared to the same period in 2020 was also due to the full impact of the SSG Acquisition which closed at the beginning of the third quarter of 2020 and to the insurance platform which has been included within Strategic Initiatives subsequent to the acquisition of Aspida Life Re in the fourth quarter of 2020.
General, Administrative and Other Expenses.
General, administrative and other expenses increased by $0.3 million, or 17%, for the three months ended September 30, 2021 compared to the three months ended September 30, 2020 and by $4.1 million, or 269%, for the nine months ended September 30, 2021 compared to the nine months ended September 30, 2020. The increase for the nine months ended September 30, 2021 compared to the nine months ended September 30, 2020 was due to the full impact of the SSG Acquisition which closed at the beginning of the third quarter of 2020.
Realized Income:
The following table presents the components of the Strategic Initiatives RI:
| Three months ended September 30, | Favorable (Unfavorable) | Nine months ended September 30, | Favorable (Unfavorable) | ||||||||||||||||||||||||||||||||||||||||||||
| ($ in thousands) | 2021 | 2020 | $ Change | % Change | 2021 | 2020 | $ Change | % Change | |||||||||||||||||||||||||||||||||||||||
| Fee Related Earnings | $ | 9,456 | $ | 7,571 | $ | 1,885 | 25% | $ | 28,025 | $ | 7,571 | $ | 20,454 | 270% | |||||||||||||||||||||||||||||||||
| Investment income—realized | 1,025 | — | 1,025 | NM | 1,347 | — | 1,347 | NM | |||||||||||||||||||||||||||||||||||||||
| Interest and other investment income (loss)—realized | 163 | (4) | 167 | NM | 2,824 | (4) | 2,828 | NM | |||||||||||||||||||||||||||||||||||||||
| Interest expense | (4,135) | (729) | (3,406) | NM | (8,962) | (729) | (8,233) | NM | |||||||||||||||||||||||||||||||||||||||
| Realized net investment loss | (2,947) | (733) | (2,214) | NM | (4,791) | (733) | (4,058) | NM | |||||||||||||||||||||||||||||||||||||||
| Realized Income | $ | 6,509 | $ | 6,838 | (329) | (5) | $ | 23,234 | $ | 6,838 | 16,396 | 240 | |||||||||||||||||||||||||||||||||||
NM - Not Meaningful
Realized net investment loss for the three and nine months ended September 30, 2021 and 2020 was primarily attributable to interest expense allocations based on the cost basis of investments. The activity for the nine months ended September 30, 2021 also included realized net investment income attributable to distributions from an investment vehicle that manages a portfolio of non-performing loans.
112
Strategic Initiatives—Assets Under Management
The tables below present rollforwards of AUM for the Strategic Initiatives:
| ($ in millions) | Asian Special Situations | Asian Secured Lending | Insurance | SPACs | Total Strategic Initiatives | ||||||||||||||||||||||||||||||
| Balance at 6/30/2021 | $ | 5,025 | $ | 2,467 | $ | 1,874 | $ | — | $ | 1,000 | $ | 10,366 | |||||||||||||||||||||||
| Net new par/equity commitments | — | 70 | 143 | — | 213 | ||||||||||||||||||||||||||||||
| Capital reductions | — | (29) | — | — | (29) | ||||||||||||||||||||||||||||||
| Distributions | 252 | (2) | (48) | — | 202 | ||||||||||||||||||||||||||||||
| Change in fund value | 94 | (21) | 11 | — | 84 | ||||||||||||||||||||||||||||||
| Balance at 9/30/2021 | $ | 5,371 | $ | 2,485 | $ | 1,980 | $ | 1,000 | $ | 10,836 | |||||||||||||||||||||||||
|
Average AUM
(1)
|
$ | 5,198 | $ | 2,476 | $ | 1,927 | $ | 1,000 | $ | 10,601 | |||||||||||||||||||||||||
| Asian Special Situations | Asian Secured Lending | Insurance | SPACs | Total Strategic Initiatives | |||||||||||||||||||||||||||||||
| Balance at 6/30/2020 | $ | — | $ | — | $ | — | $ | — | $ | — | |||||||||||||||||||||||||
| Acquisitions | 5,220 | 1,651 | — | — | 6,871 | ||||||||||||||||||||||||||||||
| Net new par/equity commitments | — | 190 | — | — | 190 | ||||||||||||||||||||||||||||||
| Distributions | (122) | — | — | — | (122) | ||||||||||||||||||||||||||||||
| Change in fund value | (1) | 2 | — | — | 1 | ||||||||||||||||||||||||||||||
| Balance at 9/30/2020 | $ | 5,097 | $ | 1,843 | $ | — | $ | — | $ | 6,940 | |||||||||||||||||||||||||
|
Average AUM
(2)
|
$ | 5,159 | $ | 1,747 | $ | — | $ | — | $ | 6,906 | |||||||||||||||||||||||||
| (1) Represents the quarterly average of beginning and ending balances. | |||||||||||||||||||||||||||||||||||
| (2) Represents the average calculated using AUM on the date of the SSG Acquisition and the subsequent quarter-end. | |||||||||||||||||||||||||||||||||||
| Asian Special Situations | Asian Secured Lending | Insurance | SPACs | Total Strategic Initiatives | |||||||||||||||||||||||||||||||
| Balance at 12/31/2020 | $ | 5,154 | $ | 1,864 | $ | 2,243 | $ | — | $ | 9,261 | |||||||||||||||||||||||||
| Net new par/equity commitments | 3 | 620 | (230) | 1,000 | 1,393 | ||||||||||||||||||||||||||||||
| Distributions | (73) | (2) | (103) | — | (178) | ||||||||||||||||||||||||||||||
| Change in fund value | 287 | 3 | 70 | — | 360 | ||||||||||||||||||||||||||||||
| Balance at 9/30/2021 | $ | 5,371 | $ | 2,485 | $ | 1,980 | $ | 1,000 | $ | 10,836 | |||||||||||||||||||||||||
|
Average AUM
(1)
|
$ | 5,167 | $ | 2,172 | $ | 2,000 | $ | 750 | $ | 10,089 | |||||||||||||||||||||||||
| Asian Special Situations | Asian Secured Lending | Insurance | SPACs | Total Strategic Initiatives | |||||||||||||||||||||||||||||||
| Balance at 12/31/2019 | $ | — | $ | — | $ | — | $ | — | $ | — | |||||||||||||||||||||||||
| Acquisitions | 5,220 | 1,651 | — | — | 6,871 | ||||||||||||||||||||||||||||||
| Net new par/equity commitments | — | 190 | — | — | 190 | ||||||||||||||||||||||||||||||
| Distributions | (122) | — | — | — | (122) | ||||||||||||||||||||||||||||||
| Change in fund value | (1) | 2 | — | — | 1 | ||||||||||||||||||||||||||||||
| Balance at 9/30/2020 | $ | 5,097 | $ | 1,843 | $ | — | $ | — | $ | 6,940 | |||||||||||||||||||||||||
|
Average AUM
(2)
|
$ | 5,159 | $ | 1,747 | $ | — | $ | — | $ | 6,906 | |||||||||||||||||||||||||
| (1) Represents a four-point average of quarter-end balances for each period. | |||||||||||||||||||||||||||||||||||
| (2) Represents the average calculated using AUM on the date of the SSG Acquisition and the subsequent quarter-end. | |||||||||||||||||||||||||||||||||||
113
The components of our AUM for the Strategic Initiatives are presented below ($ in billions):
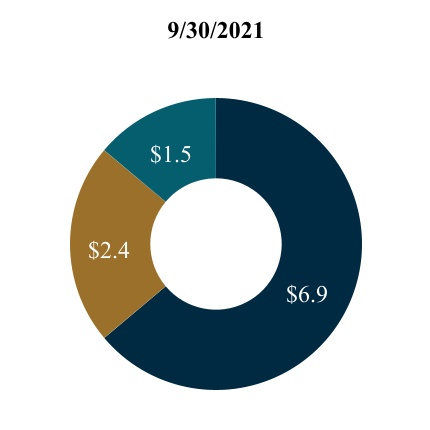
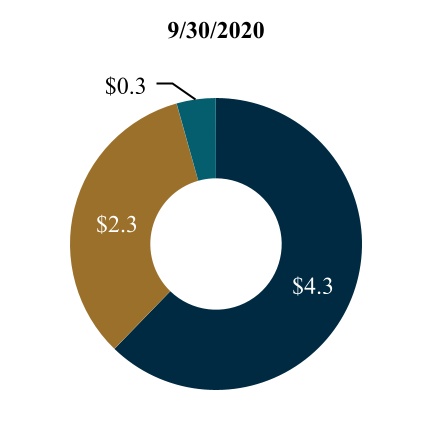
| AUM: $10.8 | AUM: $6.9 | |||||||||||||
| FPAUM | AUM not yet paying fees |
Non-fee paying
(1)
|
|||||||||||||||
(1) Includes $0.1 billion of non-fee paying AUM based on our general partner commitment as of September 30, 2021 and 2020.
114
Strategic Initiatives—Fee Paying AUM
The tables below present rollforwards of fee paying AUM for the Strategic Initiatives:
| ($ in millions) | Asian Special Situations | Asian Secured Lending | Insurance | Total Strategic Initiatives | |||||||||||||||||||||||||
| Balance at 6/30/2021 | $ | 3,618 | $ | 1,055 | $ | 1,948 | $ | 6,621 | |||||||||||||||||||||
| Commitments | — | — | 233 | 233 | |||||||||||||||||||||||||
| Subscriptions/deployment/increase in leverage | 236 | 143 | — | 379 | |||||||||||||||||||||||||
| Capital reductions | — | (121) | — | (121) | |||||||||||||||||||||||||
| Distributions | (163) | (62) | (48) | (273) | |||||||||||||||||||||||||
| Change in fund value | — | — | 53 | 53 | |||||||||||||||||||||||||
| Balance at 9/30/2021 | $ | 3,691 | $ | 1,015 | $ | 2,186 | $ | 6,892 | |||||||||||||||||||||
|
Average FPAUM
(1)
|
$ | 3,655 | $ | 1,035 | $ | 2,067 | $ | 6,757 | |||||||||||||||||||||
| Asian Special Situations | Asian Secured Lending | Insurance | Total Strategic Initiatives | ||||||||||||||||||||||||||
| Balance at 6/30/2020 | $ | — | $ | — | $ | — | $ | — | |||||||||||||||||||||
| Acquisitions | 3,615 | 568 | — | 4,183 | |||||||||||||||||||||||||
| Subscriptions/deployment/increase in leverage | 96 | 182 | — | 278 | |||||||||||||||||||||||||
| Capital reductions | (22) | — | — | (22) | |||||||||||||||||||||||||
| Distributions | (143) | (31) | — | (174) | |||||||||||||||||||||||||
| Change in fee basis | 24 | — | — | 24 | |||||||||||||||||||||||||
| Balance at 9/30/2020 | $ | 3,570 | $ | 719 | $ | — | $ | 4,289 | |||||||||||||||||||||
|
Average FPAUM
(2)
|
$ | 3,592 | $ | 644 | $ | — | $ | 4,236 | |||||||||||||||||||||
| (1) Represents the quarterly average of beginning and ending balances. | |||||||||||||||||||||||||||||
| (2) Represents the average calculated using FPAUM on the date of the SSG Acquisition and the subsequent quarter-end. | |||||||||||||||||||||||||||||
| Asian Special Situations | Asian Secured Lending | Insurance | Total Strategic Initiatives | ||||||||||||||||||||||||||
| Balance at 12/31/2020 | $ | 3,614 | $ | 739 | $ | 2,243 | $ | 6,596 | |||||||||||||||||||||
| Commitments | — | — | (66) | (66) | |||||||||||||||||||||||||
| Subscriptions/deployment/increase in leverage | 952 | 552 | — | 1,504 | |||||||||||||||||||||||||
| Capital reductions | (180) | (122) | — | (302) | |||||||||||||||||||||||||
| Distributions | (695) | (154) | (103) | (952) | |||||||||||||||||||||||||
| Change in fund value | — | — | 112 | 112 | |||||||||||||||||||||||||
| Balance at 9/30/2021 | $ | 3,691 | $ | 1,015 | $ | 2,186 | $ | 6,892 | |||||||||||||||||||||
|
Average FPAUM
(1)
|
$ | 3,672 | $ | 923 | $ | 2,089 | $ | 6,684 | |||||||||||||||||||||
| Asian Special Situations | Asian Secured Lending | Insurance | Total Strategic Initiatives | ||||||||||||||||||||||||||
| Balance at 12/31/2019 | $ | — | $ | — | $ | — | $ | — | |||||||||||||||||||||
| Acquisition | 3,615 | 568 | — | 4,183 | |||||||||||||||||||||||||
| Subscriptions/deployment/increase in leverage | 96 | 182 | — | 278 | |||||||||||||||||||||||||
| Capital reductions | (22) | — | — | (22) | |||||||||||||||||||||||||
| Distributions | (143) | (31) | — | (174) | |||||||||||||||||||||||||
| Change in fee basis | 24 | — | — | 24 | |||||||||||||||||||||||||
| Balance at 9/30/2020 | $ | 3,570 | $ | 719 | $ | — | $ | 4,289 | |||||||||||||||||||||
|
Average FPAUM
(2)
|
$ | 3,592 | $ | 644 | $ | — | $ | 4,236 | |||||||||||||||||||||
| (1) Represents a four-point average of quarter-end balances for each period. | |||||||||||||||||||||||||||||
| (2) Represents the average calculated using FPAUM on the date of the SSG Acquisition and the subsequent quarter-end. | |||||||||||||||||||||||||||||
115
The charts below present FPAUM for the Strategic Initiatives by its fee basis ($ in billions):
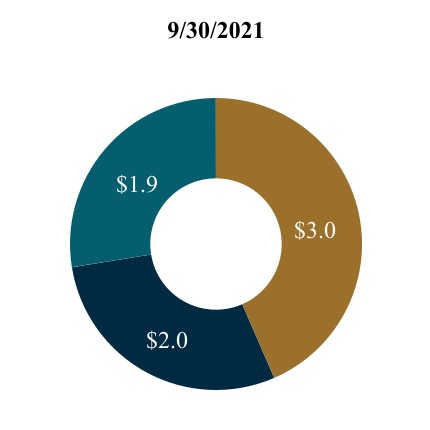

| FPAUM: $6.9 | FPAUM: $4.3 | |||||||||||||
| Market value | Invested capital/other | Capital commitments | |||||||||||||||
Strategic Initiatives—Fund Performance Metrics as of September 30, 2021
Strategic Initiatives includes one significant fund, SSG Capital Partners V, L.P. (“SSG Fund V”), that contributed approximately 35% of the management fees reported in Strategic Initiatives for the nine months ended September 30, 2021.
The following table presents the performance data as of September 30, 2021 for our significant fund reported in Strategic Initiatives, which is a drawdown fund:
| ($ in millions) | Year of Inception | AUM | Original Capital Commitments | Capital Invested to Date |
Realized Value
(1)
|
Unrealized Value
(2)
|
Total Value | MoIC | IRR(%) | Primary Investment Strategy | |||||||||||||||||||||||||||||||||||||||||||||||||||||||||||||
| Fund |
Gross
(3)
|
Net
(4)
|
Gross
(5)
|
Net
(6)
|
|||||||||||||||||||||||||||||||||||||||||||||||||||||||||||||||||||
| Funds Deploying Capital | |||||||||||||||||||||||||||||||||||||||||||||||||||||||||||||||||||||||
| SSG Fund V | 2018 | $ | 2,073 | $ | 1,878 | $ | 1,570 | $ | 804 | $ | 958 | $ | 1,762 | 1.2x | 1.1x | 45.1 | 25.5 | Asian Special Situations | |||||||||||||||||||||||||||||||||||||||||||||||||||||
(1)
Realized value represents the sum of all cash distributions to all partners and if applicable, exclude tax and incentive distributions made to the general partner.
(2)
Unrealized value represents the fund's NAV reduced by the accrued incentive allocation, if applicable. There can be no assurance that unrealized values will be realized at the valuations indicated.
(3)
The gross MoIC is calculated at the fund-level and is based on the interests of the fee-paying limited partners and if applicable, excludes interests attributable to the non-fee paying limited partners and/or the general partner which does not pay management fees or carried interest. The gross MoIC is before giving effect to management fees, carried interest as applicable and other expenses, but after giving effect to credit facility interest expenses, as applicable. The funds may utilize a credit facility during the investment period and for general cash management purposes. Early in the life of a fund, the gross fund-level MoICs would generally have been lower had such fund called capital from its limited partners instead of utilizing the credit facility.
(4)
The net MoIC is calculated at the fund-level and is based on the interests of the fee-paying limited partners and if applicable, excludes those interests attributable to the non-fee paying limited partners and/or the general partner which does not pay management fees or carried interest. The net MoIC is after giving effect to management fees and other expenses, carried interest and credit facility interest expense, as applicable. The funds may utilize a credit facility during the investment period and for general cash management purposes. Early in the life of a fund, the net fund-level MoICs would generally have been lower had such fund called capital from its limited partners instead of utilizing the credit facility.
(5)
The gross IRR is an annualized since inception gross internal rate of return of cash flows to and from the fund and the fund’s residual value at the end of the measurement period. Gross IRR reflects returns to the fee-paying limited partners and, if applicable, excludes interests attributable to the non-fee paying limited partners and/or the general partner which does not pay management fees or carried interest. The cash flow dates used in the gross IRR calculation are based on the actual dates of the cash flows. The gross IRRs are calculated before giving effect to management fees, carried interest, as applicable, and other expenses, but after giving effect to credit facility interest expenses, as applicable. The funds may utilize a credit facility during the investment period and for general cash management purposes. The gross fund-level IRR would generally have been lower had such fund called capital from its limited partners instead of utilizing the credit facility.
(6)
The net IRR is an annualized since inception net internal rate of return of cash flows to and from the fund and the fund’s residual value at the end of the measurement period. Net IRRs reflect returns to the fee-paying limited partners and, if applicable, exclude interests attributable to the non-fee paying limited partners and/or the general partner who does not pay management fees or carried interest. The cash flow dates used in the net IRR calculations are based on the actual dates of the cash flows. The net IRRs are calculated after giving effect to management fees and other expenses, carried interest and credit facility interest expenses, as applicable. The funds may utilize a credit facility during the investment period and for general cash management purposes. Net fund-level IRRs would generally have been lower had such fund called capital from its limited partners instead of utilizing the credit facility.
116
Operations Management Group—Three and Nine Months Ended September 30, 2021
Compared to Three and Nine Months Ended September 30, 2020
Fee Related Earnings:
The following table presents the components of the Operations Management Group’s FRE:
| Three months ended September 30, | Favorable (Unfavorable) | Nine months ended September 30, | Favorable (Unfavorable) | ||||||||||||||||||||||||||||||||||||||||||||
| ($ in thousands) | 2021 | 2020 | $ Change | % Change | 2021 | 2020 | $ Change | % Change | |||||||||||||||||||||||||||||||||||||||
| Other fees | $ | 3,446 | $ | — | $ | 3,446 | NM | $ | 3,446 | $ | — | $ | 3,446 | NM | |||||||||||||||||||||||||||||||||
| Compensation and benefits | (66,107) | (41,551) | (24,556) | (59) | (158,943) | (114,916) | $ | (44,027) | (38) | ||||||||||||||||||||||||||||||||||||||
| General, administrative and other expenses | (28,142) | (19,519) | (8,623) | (44) | (69,872) | (56,877) | (12,995) | (23) | |||||||||||||||||||||||||||||||||||||||
| Fee Related Earnings | $ | (90,803) | $ | (61,070) | (29,733) | (49) | $ | (225,369) | $ | (171,793) | (53,576) | (31) | |||||||||||||||||||||||||||||||||||
NM - Not Meaningful
Other Fees.
Other fees of $3.4 million for the three and nine months ended September 30, 2021 represents fees earned through WMS for the sale and distribution of our non-traded REITs. The fees earned include trade-based commissions and facilitation fees as well as asset-based distribution fees that we earn following the Black Creek Acquisition.
Compensation and Benefits.
Compensation and benefits increased by $24.6 million, or 59%, for the three months ended September 30, 2021 compared to the three months ended September 30, 2020 and by $44.0 million, or 38%, for the nine months ended September 30, 2021 compared to the nine months ended September 30, 2020. The increases were primarily driven by the headcount growth from the Black Creek Acquisition
and Landmark Acquisition,
the expansion of our strategy and relationship management teams to support global fundraising, and the expansion of our business operations teams to support the growth of our business and other strategic initiatives
. In connection with the sale and distribution of shares in our non-traded REITs, we incurred commission expense of $5.1 million during the three and nine months ended September 30, 2021. The increases in compensation and benefits were further driven by increases in payroll related taxes
of $3.9 million and $5.2 million for the three and nine months ended September 30, 2021 compared to the three and nine months ended September 30, 2020, respectively, primarily attributable to the vesting of non-recurring equity compensation awards.
Average headcount increased by 43% to 1,055 operations management professionals for the third quarter of 2021 from 740 professionals for the same period in 2020. Average headcount for our operations management professionals increased by 44 to support the expansion of our team in India and by 6 in connection with the SSG Acquisition. Average headcount also increased by 232 professionals from the Landmark Acquisition and Black Creek Acquisition, including the increase from WMS. Average headcount increased by 28% to 868 operations management professionals for the year-to-date period from 679 professionals for the same period in 2020. Average headcount for our operations management professionals increased by 41 to support the expansion of our team in India and by 32 in connection with the SSG Acquisition. Average headcount also increased by 84 professionals from the Landmark Acquisition and Black Creek Acquisition, including the increase from WMS.
General, Administrative and Other Expenses.
General, administrative and other expenses increased by $8.6 million, or 44%, for the three months ended September 30, 2021 compared to the three months ended September 30, 2020 and by $13.0 million, or 23%, for the nine months ended September 30, 2021 compared to the nine months ended September 30, 2020. The change included an increase in general, administrative and other expenses of $1.4 million and $1.6 million for the three and nine months ended September 30, 2021, respectively, from the Black Creek Acquisition and Landmark Acquisition. The impact from the acquisitions has been excluded from the discussion below.
Certain expenses have also increased during the current period, including occupancy costs to support our growing headcount and information services and information technology to support the expansion of our business, despite the temporary cost savings recognized with our transition to a modified remote working environment. Collectively, these expenses increased by $0.7 million and $3.7 million for the three and nine months ended September 30, 2021, respectively, when compared to the same periods in 2020. The increase was also driven by higher professional service fees and recruiting fees of $3.0 million and $2.9 million, for the three and nine months ended September 30, 2021, respectively, largely to support the expanding platform. The three and nine months ended September 30, 2021 also included a $1.5 million donation to the Ares Charitable Foundation that launched in the second quarter of 2021.
117
There continue to be positive developments in the recovery from the COVID-19 pandemic that have reduced restrictions on travel and gathering. Those operating expenses that were impacted by the pandemic, particularly marketing sponsorships and events, increased during the third quarter of 2021. For the three months ended September 30, 2021, our travel, entertainment and marketing sponsorships expenses increased by $0.8 million when compared to the same period in 2020. We, however,
recognized cost savings when comparing the nine months ended September 30, 2021 and 2020. For the three months ended March 31, 2020, our expenses reflected a pre-pandemic cost structure and are not comparable to the lower expenses incurred in our modified work environment during the three months ended March 31, 2021.
Our operating expenses, most notably travel, and certain office services and fringe benefits from the modified remote working environment, decreased by $1.5 million for the nine months ended September 30, 2021, when compared to the same period in 2020.
Realized Income:
The following table presents the components of the OMG's RI:
| Three months ended September 30, | Favorable (Unfavorable) | Nine months ended September 30, | Favorable (Unfavorable) | ||||||||||||||||||||||||||||||||||||||||||||
| ($ in thousands) | 2021 | 2020 | $ Change | % Change | 2021 | 2020 | $ Change | % Change | |||||||||||||||||||||||||||||||||||||||
| Fee Related Earnings | $ | (90,803) | $ | (61,070) | $ | (29,733) | (49) | % | $ | (225,369) | $ | (171,793) | $ | (53,576) | (31) | % | |||||||||||||||||||||||||||||||
| Investment loss—realized | — | — | — | — | — | (5,698) | 5,698 | 100 | |||||||||||||||||||||||||||||||||||||||
| Interest and other investment income (loss)—realized | (270) | (503) | 233 | (46) | 170 | (588) | 758 | NM | |||||||||||||||||||||||||||||||||||||||
| Interest expense | (160) | (141) | (19) | (13) | (397) | (1,262) | 865 | 69 | |||||||||||||||||||||||||||||||||||||||
| Realized net investment loss | (430) | (644) | 214 | 33 | (227) | (7,548) | 7,321 | 97 | |||||||||||||||||||||||||||||||||||||||
| Realized Income | $ | (91,233) | $ | (61,714) | (29,519) | (48) | $ | (225,596) | $ | (179,341) | (46,255) | (26) | |||||||||||||||||||||||||||||||||||
NM - Not Meaningful
Realized net investment loss for the nine months ended September 30, 2020 was primarily driven by a realized loss associated with the sale of a non–core insurance-related investment.
Liquidity and Capital Resources
Management assesses liquidity in terms of our ability to generate cash to fund operating, investing and financing activities. In the wake of the COVID-19 pandemic, management believes that the Company is well-positioned and its liquidity will continue to be sufficient for its foreseeable working capital needs, contractual obligations, dividend payments, pending acquisitions and strategic initiatives. For further discussion regarding the potential risks and impact of the COVID-19 pandemic on the Company, see “Item 1A. Risk Factors” in this Quarterly Report on Form 10-Q.
Sources and Uses of Liquidity
Our sources of liquidity are (1) cash on hand, (2) net working capital, (3) cash from operations, including management fees, which are collected monthly, quarterly or semi-annually, and net realized performance income, which is unpredictable as to amount and timing, (4) fund distributions related to our investments that are also unpredictable as to amount and timing and (5) net borrowing from the Credit Facility. As of September 30, 2021, our cash and cash equivalents were $295.7 million, and we had $150.0 million borrowings outstanding under our Credit Facility. Our ability to draw from the Credit Facility is subject to a leverage and other covenants. We remain in compliance with all covenants as of September 30, 2021. We believe that these sources of liquidity will be sufficient to fund our working capital requirements and to meet our commitments in the ordinary course of business and under the current market conditions for the foreseeable future. Cash flows from management fees may be impacted by a slowdown or declines in deployment, declines or write downs in valuations, or a slowdown or negatively impacted fundraising. In addition, management fees may be subject to deferral. Declines or delays and transaction activity may impact our fund distributions and net realized performance income which could adversely impact our cash flows and liquidity. Market conditions may make it difficult to extend the maturity or refinance our existing indebtedness or obtain new indebtedness with similar terms.
We expect that our primary liquidity needs will continue to be to (1) provide capital to facilitate the growth of our existing investment management businesses, (2) fund our investment commitments, (3) provide capital to facilitate our expansion into businesses that are complementary to our existing investment management businesses as well as other strategic growth initiatives, (4) pay operating expenses, including cash compensation to our employees, and make payments under the tax receivable agreement (“TRA”), (5) fund capital expenditures, (6) service our debt, (7) pay income taxes, (8) make dividend
118
payments to our Class A and non-voting common stockholders in accordance with our dividend policies and (9) pay distributions to AOG unitholders.
In the normal course of business, we expect to pay dividends to our Class A and non-voting common stockholders that are aligned with the expected changes in our after-tax fee related earnings. If cash flows from operations were insufficient to fund dividends over a sustained period of time, we expect that we would suspend or reduce paying such dividends. In addition, there is no assurance that dividends would continue at the current levels or at all. The final dividend was paid to our Series A Preferred stockholders in connection with the redemption on June 30, 2021.
Our ability to obtain debt financing and complete stock offerings provides us with additional sources of liquidity. For further discussion of financing transactions occurring in the current period, see “Cash Flows” within this section and “Note 8. Debt” and “Note 14. Equity and Redeemable Interest” to our unaudited condensed consolidated financial statements included in this Quarterly Report on Form 10-Q.
Our condensed consolidated financial statements reflect the cash flows of our operating businesses as well as those of our Consolidated Funds. The assets of our Consolidated Funds, on a gross basis, are significantly larger than the assets of our operating businesses and therefore have a substantial effect on our reported cash flows. The primary cash flow activities of our Consolidated Funds include: (1) raising capital from third-party investors, which is reflected as non-controlling interests of our Consolidated Funds, (2) financing certain investments by issuing debt, (3) purchasing and selling investment securities, (4) generating cash through the realization of certain investments, (5) collecting interest and dividend income and (6) distributing cash to investors. Our Consolidated Funds are generally accounted for as investment companies under GAAP; therefore, the character and classification of all Consolidated Fund transactions are presented as cash flows from operations. Liquidity available at our Consolidated Funds is typically not available for corporate liquidity needs, and debt of the Consolidated Funds is non–recourse to the Company except to the extent of the Company's investment in the fund.
Cash Flows
We consolidate funds where we are deemed to hold a controlling interest. The Consolidated Funds are not necessarily the same entities in each year presented due to changes in ownership, changes in limited partners' rights and the creation or termination of funds. The consolidation of these funds had no effect on cash flows attributable to us for the periods presented. As such, we evaluate the activity of the Consolidated Funds and the eliminations resulting from consolidation separately. The following tables and discussion summarize our condensed consolidated statements of cash flows by activities attributable to the Company and to our Consolidated Funds. For more details on the activity of the Company and Consolidated Funds, refer to “Note 16. Consolidation” to our unaudited condensed consolidated financial statements included in this Quarterly Report on Form 10-Q.
| Nine months ended September 30, | |||||||||||
| ($ in thousands) | 2021 | 2020 | |||||||||
| Net cash provided by operating activities | $ | 368,259 | $ | 480,848 | |||||||
| Net cash used in the Consolidated Funds' operating activities, net of eliminations | (2,212,010) | (468,386) | |||||||||
| Net cash provided by (used in) operating activities | (1,843,751) | 12,462 | |||||||||
| Net cash used in the Company's investing activities | (1,072,578) | (126,437) | |||||||||
| Net cash provided by the Company's financing activities | 476,110 | 360,171 | |||||||||
| Net cash provided by the Consolidated Funds' financing activities, net of eliminations | 2,216,874 | 467,379 | |||||||||
| Net cash provided by financing activities | 2,692,984 | 827,550 | |||||||||
| Effect of exchange rate changes | (20,763) | 16,793 | |||||||||
| Net change in cash and cash equivalents | $ | (244,108) | $ | 730,368 | |||||||
Operating Activities
As summarized in the table below, cash flow from operations is principally composed of (i) cash generated from our core operating activities, primarily consisting of profits generated principally from management fees after covering for operating expenses, (ii) net realized performance income and (iii) net cash from investment related activities including purchases, sales and net realized investment income. We generated meaningful cash flow from operations in each period presented. Although cash generated from our core operating activities increased when compared to the prior year, cash provided by the Company’s operating activities decreased due to greater net purchases associated with our investment portfolio, which represent a use of cash, when compared to the prior year period.
119
| Nine months ended September 30, | Favorable (Unfavorable) | ||||||||||||||||||||||
| 2021 | 2020 | $ Change | % Change | ||||||||||||||||||||
| Core operating activities | $ | 457,884 | $ | 371,480 | $ | 86,404 | 23% | ||||||||||||||||
| Net realized performance income | 53,515 | 78,585 | (25,070) | (32) | |||||||||||||||||||
| Net cash from investment related activities | (143,140) | 30,783 | (173,923) | NM | |||||||||||||||||||
| Net cash provided by operating activities | $ | 368,259 | $ | 480,848 | (112,587) | (23) | |||||||||||||||||
NM - Not Meaningful
Net cash used in the Consolidated Funds' operating activities continues to be principally attributable to net purchases of investment securities by recently launched funds during both years.
Our increasing working capital needs reflect the growth of our business, while the capital requirements needed to support fund-related activities vary based upon the specific investment activities being conducted during such period.
Investing Activities
| Nine months ended September 30, | |||||||||||
| 2021 | 2020 | ||||||||||
| Purchase of furniture, equipment and leasehold improvements, net of disposals | $ | (15,152) | $ | (8,608) | |||||||
| Acquisitions, net of cash acquired | (1,057,426) | (117,829) | |||||||||
| Net cash used in investing activities | $ | (1,072,578) | $ | (126,437) | |||||||
Net cash used in the Company's investing activities was principally composed of cash used to complete the Landmark Acquisition and Black Creek Acquisition in the current year period and cash used to complete the SSG Acquisition and purchase CLO collateral management agreements from Crestline Denali in the pri
or year period. We also used cash to purchase furniture, fixtures, equipment and leasehold improvements during both years to support the growth in our staffing levels and our expanding global presence.
Financing Activities
| Nine months ended September 30, | |||||||||||
| 2021 | 2020 | ||||||||||
| Net proceeds from issuance of Class A and non-voting common stock | $ | 827,430 | $ | 383,154 | |||||||
| Net borrowings of Credit Facility | 150,000 | (70,000) | |||||||||
| Proceeds from issuance of senior and subordinated notes | 450,000 | 399,084 | |||||||||
| Class A and non-voting common stock dividends | (239,816) | (169,870) | |||||||||
| AOG unitholder distributions | (198,752) | (165,087) | |||||||||
| Series A Preferred Stock dividends | (10,850) | (16,275) | |||||||||
|
Redemption of Series A Preferred Stock
|
(310,000) | — | |||||||||
| Stock option exercises | 27,409 | 78,959 | |||||||||
| Taxes paid related to net share settlement of equity awards | (221,287) | (75,657) | |||||||||
| Other financing activities | 1,976 | (4,137) | |||||||||
| Net cash provided by the Company's financing activities | $ | 476,110 | $ | 360,171 | |||||||
Net cash provided by the Company's financing activities for the nine months ended September 30, 2021 was principally composed of net proceeds from the public offering of Class A common stock, a private offering of Class A common stock and non-voting common stock to SMBC and the issuance of the 2051 Subordinated Notes. A portion of the proceeds were used to redeem the Series A Preferred Stock and to pay higher dividends and distributions to Class A and non-voting common stockholders and AOG unitholders, respectively, as we generated higher fee related earnings and increased our shareholder base.
In connection with the vesting of restricted units that are granted to our employees under the Equity Incentive Plan, we withhold shares equal to the fair value of our employee's withholding tax liabilities and pay the taxes on their behalf. This use of cash increased from the prior period primarily as a result of our appreciating stock price, which is the basis on which employee compensation is recognized. The net settlement of shares minimizes the dilutive impact of our Equity Incentive Plan as fewer shares are issued upon vesting. For the nine months ended September 30, 2021 and 2020, we retained and did not issue 3.8 million shares and 2.0 million shares, respectively.
120
Net cash provided by the Company's financing activities for nine months ended September 30, 2020 was principally composed of net proceeds from the issuance of the 2030 Senior Notes to provide additional liquidity at a reduced cost of capital in response to the uncertainty caused by the COVID-19 pandemic and to leverage our growth in future periods. A portion of these proceeds was used to repay revolving borrowings under our Credit Facility. In addition, net cash provided by the Company's financing activities includes cash proceeds from the private offering of Class A common stock to SMBC. These proceeds were partially offset by cash used to pay higher dividends and distributions to Class A common stockholders and AOG unitholders, respectively.
| Nine months ended September 30, | |||||||||||
| 2021 | 2020 | ||||||||||
| Contributions from redeemable and non-controlling interests in Consolidated Funds, net of eliminations | $ | 919,666 | $ | 123,713 | |||||||
| Distributions to non-controlling interests in Consolidated Funds, net of eliminations | (84,770) | (169,747) | |||||||||
| Borrowings under loan obligations by Consolidated Funds | 1,456,887 | 618,207 | |||||||||
| Repayments under loan obligations by Consolidated Funds | (74,909) | (104,794) | |||||||||
| Net cash provided by the Consolidated Funds' financing activities | $ | 2,216,874 | $ | 467,379 | |||||||
Net cash provided by the Consolidated Funds' financing activities for the nine months ended September 30, 2021 was principally attributable to contributions from shareholders in the initial public offering of the SPAC and to the borrowings of two newly issued CLOs.
Net cash provided by the Consolidated Funds’ financing activities for nine months ended September 30, 2020 was principally attributable to the borrowings of a newly issued CLO.
Capital Resources
We intend to use a portion of our available liquidity to pay cash dividends to our Class A and non-voting common stockholders on a quarterly basis in accordance with our dividend policies. Our ability to make cash dividends is dependent on a myriad of factors, including among others: general economic and business conditions; our strategic plans and prospects; our business and investment opportunities; timing of capital calls by our funds in support of our commitments; our financial condition and operating results; working capital requirements and other anticipated cash needs; contractual restrictions and obligations; legal, tax and regulatory restrictions; restrictions on the payment of distributions by our subsidiaries to us and other relevant factors.
We are required to maintain minimum net capital balances for regulatory purposes for our broker-dealer entities and certain subsidiaries operating outside the U.S. These net capital requirements in the U.S. are met in part by retaining cash, cash equivalents and investment securities. As a result, we may be restricted in our ability to transfer cash between different operating entities and jurisdictions. As of September 30, 2021, we were required to maintain approximately $37.4 million in net assets within these subsidiaries to meet regulatory net capital and capital adequacy requirements. We remain in compliance with all regulatory requirements.
Holders of AOG Units, subject to the terms of the exchange agreement, may exchange their AOG Units for shares of our Class A common stock on a one-for-one basis. These exchanges are expected to result in increases in the tax basis of the tangible and intangible assets of AMC that otherwise would not have been available. These increases in tax basis may increase depreciation and amortization for U.S. income tax purposes and thereby reduce the amount of tax that we would otherwise be required to pay in the future. We entered into the TRA that provides payment to the TRA recipients of 85% of the amount of actual cash savings, if any, in U.S. federal, state, local and foreign income tax or franchise tax that we actually realize as a result of these increases in tax basis and of certain other tax benefits related to entering into the TRA, including tax benefits attributable to payments under the TRA and interest accrued thereon. Future payments under the TRA in respect of subsequent exchanges are expected to be substantial. The TRA liability balance was $97.7 million as of September 30, 2021.
For a discussion of our debt obligations, including the debt obligations of our consolidated funds, see "Note 8. Debt,” to our unaudited condensed consolidated financial statements included in this Quarterly Report on Form 10-Q.
Series A Preferred Stock
The Series A Preferred Stock was redeemed in full on June 30, 2021. For a discussion of our equity, including the redemption of our Series A Preferred Stock, see "Note 14. Equity and Redeemable Interest,” to our unaudited condensed consolidated financial statements included in this Quarterly Report on Form 10-Q.
121
Critical Accounting Estimates
We prepare our condensed consolidated financial statements in accordance with GAAP. In applying many of these accounting principles, we need to make assumptions, estimates or judgments that affect the reported amounts of assets, liabilities, revenues and expenses in our condensed consolidated financial statements. We base our estimates and judgments on historical experience and other assumptions that we believe are reasonable under the circumstances. These assumptions, estimates or judgments, however, are both subjective and subject to change, and actual results may differ from our assumptions and estimates. Actual results may also differ from our estimates and judgments due to risks and uncertainties. If actual amounts are ultimately different from our estimates, the revisions are included in our results of operations for the period in which the actual amounts become known.
Except as disclosed below, there have been no material changes to the critical accounting estimates previously disclosed in our Annual Report on Form 10-K for the year ended December 31, 2020. For a summary of our significant accounting policies, see "Note 2. Summary of Significant Accounting Policies,” to our unaudited condensed consolidated financial statements included in this Quarterly Report on Form 10-Q and in our Annual Report on Form 10-K. For a summary of our critical accounting estimates, please see "Management's Discussion and Analysis of Financial Condition and Results of Operations—Critical Accounting Estimates" in our Annual Report on Form 10-K.
Acquisitions
Management’s determination of fair value of assets acquired and liabilities assumed at the acquisition date is based on the best information available in the circumstances and may incorporate management’s own assumptions and involve a significant degree of judgment. We use our best estimates and assumptions to accurately assign fair value to the tangible and identifiable intangible assets acquired and liabilities assumed at the acquisition date as well as the useful lives of those acquired intangible assets. For business combinations accounted for under the acquisition method, the excess of the purchase consideration, including the fair value of certain elements of contingent consideration as of the acquisition date, over the fair value of net assets acquired is recorded as goodwill. Conversely, any excess of the fair value of the net assets acquired over the purchase consideration is recognized as a bargain purchase gain. Examples of critical estimates in valuing certain of the intangible assets we have acquired include, but are not limited to, future expected cash inflows and outflows, expected useful life, discount rates and income tax rates. Our estimates for future cash flows are based on historical data, various internal estimates and certain external sources, and are based on assumptions that are consistent with the plans and estimates we are using to manage the underlying assets acquired. We estimate the useful lives of the intangible assets based on the expected period over which we anticipate generating economic benefit from the asset. We base our estimates on assumptions we believe to be reasonable but that are unpredictable and inherently uncertain. Unanticipated events and circumstances may occur that could affect the accuracy or validity of such assumptions, estimates or actual results.
Equity-Based Compensation
We granted certain restricted units with a vesting condition based upon the volume-weighted, average closing price of our Class A common stock meeting or exceeding a stated price for 30 consecutive calendar days on or prior to January 22, 2029, referred to as the market condition. Vesting is also generally subject to continued employment at the time such market condition is achieved. Under the terms of the awards, if the target price of the applicable market condition is not achieved by the close of business on January 22, 2029, the unvested market condition awards will be automatically canceled and forfeited for no consideration, with any expense that was previously recognized reversed. Restricted units subject to a market condition are not eligible to receive dividend equivalents.
The grant date fair values are based on a probability distributed Monte-Carlo simulation. Due to the existence of the market condition, the vesting period for the awards is not explicit, and as such, compensation expense is recognized on a straight-line basis over the median vesting period derived from the positive iterations of the Monte Carlo simulations where the market condition is achieved. The market conditions were met for the market condition awards and the associated compensation expense was accelerated during the nine months ended September 30, 2021.
Below is a summary of the significant assumptions used to estimate the grant date fair value of market condition awards:
122
| Closing price of the Company's common shares as of grant date | $45.76 | |||||||
| Risk-free interest rate | 0.88% | |||||||
| Volatility | 35.0% | |||||||
| Dividend yield | 3.5% | |||||||
| Cost of equity | 10.0% | |||||||
Recent Accounting Pronouncements
Information regarding recent accounting pronouncements and their impact on the Company can be found in “Note 2. Summary of Significant Accounting Policies” in the “Notes to the Condensed Consolidated Financial Statements” included in this Quarterly Report on Form 10-Q and in our Annual Report on Form 10-K.
Off-Balance Sheet Arrangements
In the normal course of business, we engage in off-balance sheet arrangements, including transactions in derivatives, guarantees, commitments, indemnifications and potential contingent repayment obligations. See “Note 9. Commitments and Contingencies,” to our unaudited condensed consolidated financial statements included in this Quarterly Report on Form 10-Q.
Commitments and Contingencies
For further discussion of our capital commitments, indemnification arrangements and contingent obligations, see “Note 9. Commitments and Contingencies,” to our audited consolidated financial statements included in this Quarterly Report on Form 10-Q.
Item 3. Quantitative and Qualitative Disclosures About Market Risk
Our primary exposure to market risk is related to our role as general partner or investment adviser to our investment funds and the sensitivity to movements in the fair value of their investments, including the effect on management fees, performance income and investment income. Uncertainty with respect to the economic effects of the COVID-19 pandemic has introduced uncertainty in the financial markets, and the effects of this uncertainty could materially impact our market risks, including those listed below. For additional information concerning the COVID-19 pandemic and its potential impact on our business and our operating results, see Item 1A. "Risk Factors" in our
Annual Report on Form 10-K.
Market Risk
The market price of investments may significantly fluctuate during the period of investment. Investments may decline in value due to factors affecting securities markets generally or particular industries represented in the securities markets. The value of an investment may decline due to general market conditions, which are not specifically related to such investment, such as real or perceived adverse economic conditions, changes in the general outlook for corporate earnings, changes in interest or currency rates or adverse investor sentiment generally. It may also decline due to factors that affect a particular industry or industries, such as labor shortages or increased production costs and competitive conditions within an industry.
Our credit orientation has been a central tenet of our business across our debt and equity investment strategies. We believe the combination of high-quality proprietary information flow and a consistent, rigorous approach to managing investments across our strategies has been, and we believe will continue to be, a major driver of our strong risk-adjusted returns and the stability and predictability of our income.
123
Credit Risk
We are party to agreements providing for various financial services and transactions that contain an element of risk in the event that the counterparties are unable to meet the terms of such agreements. In such agreements, we depend on the counterparty to make payment or otherwise perform. We generally endeavor to minimize our risk of exposure by limiting to reputable financial institutions the counterparties with which we enter into financial transactions. In other circumstances, availability of financing from financial institutions may be uncertain due to market events, and we may not be able to access these financing markets.
In the ordinary course of business, we may extend loans to our funds or guarantee credit facilities held by our funds and could be subject to risk of loss or repayment if our funds do not perform.
Certain of our funds’ investments include lower-rated and comparable quality unrated distressed investments and other instruments. These issuers can be more sensitive to adverse market conditions, such as a recession or increasing interest rates, as compared to higher rated issuers. We seek to minimize risk exposure by subjecting each prospective investment to our rigorous, credit-oriented investment approach.
At September 30, 2021 and December 31, 2020, we had cash balances with financial institutions in excess of Federal Deposit Insurance Corporation insured limits. We seek to mitigate this exposure by monitoring the credit standing of these financial institutions.
There have been no material changes in our market risks for the nine months ended September 30, 2021. For additional information on our market risks, refer to our
Annual Report on Form 10-K
for the year ended December 31, 2020, which is accessible on the SEC's website at sec.gov.
Item 4. Controls and Procedures
Evaluation of Disclosure Controls and Procedures
We maintain disclosure controls and procedures (as that term is defined in Rules 13a-15(e) and 15d-15(e) under the Exchange Act) that are designed to ensure that information required to be disclosed in our reports under the Exchange Act is recorded, processed, summarized and reported within the time periods specified in the SEC’s rules and forms, and that such information is accumulated and communicated to our management, including our principal executive officer and principal financial officer, as appropriate, to allow timely decisions regarding required disclosures. Any controls and procedures, no matter how well designed and operated, can provide only reasonable assurance of achieving the desired control objectives. Our management, with the participation of our principal executive officer and principal financial officer, has evaluated the effectiveness of the design and operation of our disclosure controls and procedures as of September 30, 2021. Based upon that evaluation and subject to the foregoing, our principal executive officer and principal financial officer concluded that, as of September 30, 2021, the design and operation of our disclosure controls and procedures were effective to accomplish their objectives at the reasonable assurance level.
Changes in Internal Control over Financial Reporting
There have been no changes in our internal control over financial reporting (as defined in Rule 13a-15(f) and 15d-15(f) under the Exchange Act) during the quarter ended September 30, 2021 that have materially affected, or that are reasonably likely to materially affect, our internal control over financial reporting.
124
PART II.
Item 1. Legal Proceedings
From time to time we are involved in various legal proceedings, lawsuits and claims incidental to the conduct of our business, some of which may be material. As of September 30, 2021 and December 31, 2020, we were not subject to any material pending legal proceedings. Our businesses are also subject to extensive regulation, which may result in regulatory proceedings against us.
Item 1A. Risk Factors
In addition to the other information set forth in this report, you should carefully consider the risk factors described below and in Part I, “Item 1A, Risk Factors” in our Annual Report on Form 10-K for the year ended December 31, 2020, which could materially affect our business, financial condition and/or operating results. The risks described below and in our
Annual Report on Form 10-K
for the year ended December 31, 2020 are not the only risks facing us. Additional risks and uncertainties not currently known to us or that we currently deem to be immaterial also may materially and adversely affect our business, financial condition and/or operating results.
The rapid development and fluidity of the ongoing COVID-19 pandemic, including the emergence and spread of the Delta variant, among other COVID-19 variants, precludes any prediction as to the ultimate adverse impact of the situation on economic and market conditions. In addition to the foregoing, the impact of the COVID-19 pandemic may exacerbate the potential adverse effects on our business, financial performance, operating results, cash flows and financial condition described in the risk factors in our
Annual Report on Form 10-K
for the year ended December 31, 2020 filed with the SEC. Our Annual Report on Form 10-K for the year ended December 31, 2020 is accessible on the SEC’s website at www.sec.gov.
Risks Related to Our Businesses
The COVID-19 pandemic has caused severe disruptions in the U.S. and global economy, has disrupted, and may continue to disrupt, industries in which we, our funds and our funds’ portfolio companies operate and could potentially negatively impact us, our funds or our funds’ portfolio companies.
Since the first quarter of 2020, the COVID-19 pandemic has resulted in a global and national health crisis, adversely impacted global commercial activity and contributed to significant volatility in equity and debt markets. Many countries and states in the United States, including those in which we, our funds’ and our funds’ portfolio companies operate, issued (and continue to re-issue) orders requiring the closure of, or certain restrictions on the operation of, nonessential businesses and/or requiring residents to stay at home. The COVID-19 pandemic and preventative measures taken to contain or mitigate its spread have caused, and are continuing to cause, business shutdowns or the re-introduction of business shutdowns, cancellations of events and restrictions on travel, significant reductions in demand for certain goods and services, reductions in business activity and financial transactions, supply chain interruptions and overall economic and financial market instability both globally and in the United States. Such measures, as well as the general uncertainty surrounding the dangers and impact of the COVID-19 pandemic, have created significant disruption in supply chains and economic activity and have had a particularly adverse impact on the energy, hospitality, travel, retail and restaurant industries, as well as other industries, including industries in which certain of our funds’ portfolio companies operate. Such effects will likely continue for the duration of the pandemic, which is uncertain, and for some period thereafter. While several countries, as well as certain states, counties and cities in the United States, relaxed the early public health restrictions with a view to partially or fully reopening their economies, many cities, both globally and in the United States, subsequently experienced a surge in the reported number of cases and hospitalizations related to the COVID-19 pandemic. This increase in cases led to the re-introduction of such restrictions and business shutdowns in certain states, counties and cities in the United States and globally and could lead to the re-introduction of such restrictions elsewhere. In December 2020, the Federal Food and Drug Administration authorized COVID‑19 vaccines and the distribution of such vaccines has commenced. However, it remains unclear how quickly “herd immunity” will be achieved and whether the restrictions that were imposed to slow the spread of the virus will be lifted entirely. These uncertainties could lead people to continue to refrain from participating in the economy at pre-pandemic levels for a prolonged period of time. Even after the COVID-19 pandemic subsides, the U.S. economy and most other major global economies may experience a recession, and we anticipate our and our funds’ business and operations, as well as the business and operations of our funds’ portfolio companies, could be materially adversely affected by a prolonged recession in the U.S. and other major markets.
The extent of the impact of the COVID-19 pandemic (including the restrictive measures taken in response thereto) on our and our funds’ operational and financial performance will depend on many factors, including the duration, severity and
125
scope of the public health emergency, the actions taken by governmental authorities to contain its financial and economic impact, the continued implementation of travel advisories and restrictions, the impact of such public health emergency on overall supply and demand, goods and services, investor liquidity, consumer confidence and levels of economic activity and the extent of its disruption to global, regional and local supply chains and economic markets, all of which are uncertain and difficult to assess. The COVID-19 pandemic is continuing as of the filing date of this Quarterly Report and its extended duration may have further adverse impacts on our business, financial performance, operating results, cash flows and financial condition, including the market price of shares of our securities, including for the reasons described below.
The effects of a public health crisis such as the COVID-19 pandemic may materially and adversely impact our value and performance and the value and performance of our funds and our funds’ portfolio companies. Further, the impact of the COVID-19 pandemic may not be fully reflected in the valuation of our or our funds’ investments, which may differ materially from the values that we may ultimately realize with respect to such investments. Our valuations, and particularly valuations of our interests in our funds and our funds’ investments, reflect a moment in time, are inherently uncertain, may fluctuate over short periods of time and are often based on subjective estimates, comparisons and qualitative evaluations of private information. Valuations, on an unrealized basis, can also be significantly affected by a variety of external factors including, but not limited to, public equity market volatility, industry trading multiples and interest rates, all of which have been impacted and continue to be impacted by the COVID-19 pandemic. It is uncertain whether such valuations may decline and could become increasingly difficult to ascertain depending on the pace of recovery. As a result, the valuations of our interests in our funds and our funds’ investments, may not show the complete or continuing impact of the COVID-19 pandemic and the resulting measures taken in response thereto. Accordingly, our funds may incur additional net unrealized losses or may incur realized losses in the future, which could have a material adverse effect on our business, financial condition and results of operations. Any public health emergency, including the COVID-19 pandemic or any outbreak of other existing or new epidemic diseases, or the threat thereof, and the resulting financial and economic market uncertainty could have a significant adverse impact on us, the fair value of our and our funds’ investments and could adversely impact our funds’ ability to fulfill our investment objectives.
Our ability to market and raise new or successor funds in the future may be impacted by the continuation and reintroduction of shelter-in-place orders, travel restrictions and social distancing requirements implemented in response to the COVID-19 pandemic. This may reduce or delay anticipated fee revenues. In addition, the significant volatility and declines in valuations in the global markets as well as liquidity concerns may impact our ability to raise funds or deter fund investors from investing in new or successor funds that we are marketing.
Our funds may experience a slowdown in the pace of their investment activity and capital deployment, which could also adversely affect the timing of raising capital for new or successor funds and could also impact the management fees we earn on funds that generate fees based on invested (and not committed) capital. While the increased volatility in the financial markets caused by the COVID-19 pandemic may present attractive investment opportunities, we or our funds may not be able to complete those investments due to, among other factors, increased competition or operational challenges such as our ability to obtain attractive financing, conduct due diligence and consummate the acquisition and disposition of investments for our funds because of continued and re-introduced shelter-in-place orders, travel restrictions and social distancing requirements.
If the impact of the COVID-19 pandemic and current market conditions continue, we and our funds may have fewer opportunities to successfully exit investments, due to, among other reasons, lower valuations, decreased revenues and earnings, lack of potential buyers with financial resources or access to financing to pursue an acquisition, lack of refinancing markets, resulting in a reduced ability to realize value from such investments at attractive valuations or at all, and thereby negatively impacting our realized income.
Adverse market conditions resulting from the COVID-19 pandemic may impact our liquidity. Our cash flows from management fees may be impacted by, among other things, a slowdown in fundraising or delayed deployment. Cash payment of adverse market conditions may make it difficult for us to refinance our existing indebtedness or obtain new indebtedness with similar terms and any failure to do so could have a material adverse effect on our business. The capital that will be available to us in the future, if at all, may be at a higher cost and on less favorable terms and conditions than we currently experience. While our senior professionals have historically made co-investments in our funds alongside our limited partners, thereby reducing our obligation to make such investments, due to financial uncertainty or liquidity concerns, our employees may be less likely to make co-investments, which would result in such general partner commitments remaining our obligation to fund and reducing our liquidity. In addition, our funds may be impacted due to failure by our fund investors to meet capital calls, which would negatively impact our funds’ ability to make investments or pay us management fees.
The COVID-19 pandemic is having a particularly severe impact on certain industries, including but not limited to the energy, hospitality, travel, retail and restaurant industries, which are industries in which some of our funds have made
126
investments. As of September 30, 2021, approximately 2% of our total AUM was invested in the energy sector (including oil and gas exploration and midstream investments) and approximately 2% in the retail sector that were challenged from the market disruption and volatility seen in the recent past as a result of the COVID-19 pandemic. Many of our funds’ portfolio companies in these industries have faced and are continuing to face operational and financial challenges resulting from the spread of COVID-19 and related governmental measures, such as the closure of stores, hotels, restaurants and other locations, restrictions on travel, quarantines or continued and re-introduced stay-at-home orders. As a result of these disruptions, the businesses, financial results and prospects of certain of these portfolio companies have already been severely affected and could continue to be so affected. These disruptions have caused and may in the future result in impairment and decrease in value of our funds’ investments, which may be material.
Our funds’ portfolio companies are also facing or may face in the future increased credit and liquidity risk due to volatility in financial markets, reduced or eliminated revenue streams, and limited or higher cost of access to preferred sources of funding. Changes in the debt financing markets are impacting, and, if the volatility in financial markets continues, may in the future impact, the ability of our funds’ portfolio companies to meet their respective financial obligations and continue as going concerns. This could lead to the insolvency and/or bankruptcy of these companies which would cause our funds to realize losses in respect of those investments. Any of the foregoing would adversely affect our results of operations, perhaps materially, and could harm our reputation.
Our funds may experience similar credit and liquidity risk. Failure of our funds to meet their financial obligations could result in our funds being required to repay indebtedness or other financial obligations immediately in whole or in part, together with any attendant costs, and our funds could be forced to sell some of their assets to fund such costs. Our funds could lose both invested capital in, and anticipated profits from, the affected investment.
Borrowers of loans and other credit instruments made by our funds may be unable to make their loan payments on a timely basis and meet their loan covenants, and tenants leasing real estate properties owned by our funds may not be able to pay rents in a timely manner or at all, resulting in a decrease in value of our funds’ credit and real estate investments and lower than expected returns. In addition, for variable interest instruments, lower reference rates resulting from government stimulus programs in response to the COVID-19 pandemic could lead to lower interest income for funds making loans.
The COVID-19 pandemic may adversely impact our business and operations since an extended period of remote working by our employees could strain our technology resources and introduce operational risks, including heightened cybersecurity risk. While we have taken steps to secure our networks and systems, remote working environments may be less secure and more susceptible to hacking attacks, including phishing and social engineering attempts that seek to exploit the COVID-19 pandemic. In addition, our data security, data privacy, investor reporting and business continuity processes could be impacted by a third party’s inability to perform due to the COVID-19 pandemic or by failures of, or attacks on, their information systems and technology. In addition, COVID-19 presents a significant threat to our employees’ well-being and morale, and we may experience potential loss of productivity. If our senior management or other key personnel become ill or are otherwise unable to perform their duties for an extended period of time, we may experience a loss of productivity or a delay in the implementation of certain strategic plans. In addition to any potential impact of such extended illness on our operations, we may be exposed to the risk of litigation by our employees against us for, among other things, failure to take adequate steps to protect their well-being, particularly in the event they become sick after a return to the office. Further, local COVID-19 related laws can be subject to rapid change depending on public health developments, which can lead to confusion and make compliance with laws uncertain and subject us, our funds or our funds’ portfolio companies to increased risk of litigation for non-compliance.
Additionally, due to stay-at-home orders, travel restrictions, and other COVID-19 related responses, many of our staff cannot travel for in-person meetings and/or have been working remotely outside of their usual work location. This could create taxable presence or residency risks for our corporate entities, professionals, funds and portfolio companies, which could lead to increased tax liability and additional compliance complexities.
127
Item 2. Unregistered Sales of Equity Securities and Use of Proceeds
We did not sell any equity securities during the period covered in this report that were not registered under the Securities Act of 1933.
Except as set forth below, all unregistered purchases of equity securities during the period covered by this Quarterly Report were previously disclosed in our current reports on Form 8-K or quarterly reports on Form 10-Q ($ in thousands; except share data):
| Period | Total Number of Shares Purchased | Average Price Paid Per Share | Total Number of Shares Purchased as Part of Publicly Announced Plans or Programs |
Approximate Dollar Value of Shares That May Yet be Purchased Under the Plans or Programs
(1)
|
||||||||||
|
July 1, 2021 - July 31, 2021
|
— | $ | — | — | $ | 150,000 | ||||||||
|
August 1, 2021 - August 31, 2021
|
— | — | — | 150,000 | ||||||||||
|
September 1, 2021 - September 30, 2021
|
— | — | — | 150,000 | ||||||||||
| Total | — | — | ||||||||||||
(1)
In February 2021, our board of directors approved the renewal of our stock repurchase program that authorizes the repurchase of up to $150 million of shares of our Class A common stock. Under this stock repurchase program, shares may be repurchased from time to time in open market purchases, privately negotiated transactions or otherwise, including in reliance on Rule 10b5-1 of the Securities Act. The program is scheduled to expire in February 2022. Repurchases under the program depend on the prevailing market conditions and other factors.
As permitted by our policies and procedures governing transactions in our securities by our directors, executive officers and other employees, from time to time some of these persons may establish plans or arrangements complying with Rule 10b5-1 under the Exchange Act, and similar plans and arrangements relating to our Class A common stock.
Item 3. Defaults Upon Senior Securities
None.
Item 4. Mine Safety Disclosures
Not applicable.
Item 5. Other Information
Disclosure Pursuant to Section 219 of the Iran Threat Reduction and Syria Human Rights Act
Section 219 of the Iran Threat Reduction and Syria Human Rights Act of 2012 (“ITRA”) and Section 13(r) of the Exchange Act, require an issuer to disclose in its annual and quarterly reports whether it or any of its affiliates have knowingly engaged in specified activities or transactions relating to Iran. On January 31, 2019, funds and accounts managed by Ares’ European direct lending strategy (together, the “Ares funds”) collectively acquired a 32% equity stake in Daisy Group Limited (“Daisy”). Daisy is a provider of communication services to businesses based in the United Kingdom. The Ares funds do not hold a majority equity interest in Daisy and do not have the right to appoint a majority of directors to Daisy’s board of directors.
Subsequent to completion of the Ares funds’ investment in Daisy, in connection with Ares’s routine quarterly survey of its investment funds’ portfolio companies, Daisy informed the Ares funds that it has customer contracts with Melli Bank Plc, Persia International Bank Plc and Bank Saderat Plc. Melli Bank Plc, Persia International Bank Plc and Bank Saderat Plc have been designated by the Office of Foreign Assets Control within the U.S. Department of Treasury pursuant to Executive Order 13324. Daisy generated a total of £84,806 in annual revenues (less than 0.02% of Daisy’s annual revenues) from its dealings with Melli Bank Plc, Persia International Bank Plc and Bank Saderat Plc and de minimis net profits. Daisy entered into the customer contracts with Melli Bank Plc, Persia International Bank Plc and Bank Saderat Plc prior to the Ares funds’ investment in Daisy.
Daisy has given notice of termination of the contracts to Melli Bank Plc, Persia International Bank Plc and Bank Saderat Plc. Following termination of the contracts, Daisy does not intend to engage in any further dealings or transactions with Melli Bank Plc, Persia International Bank Plc or Bank Saderat Plc.
128
Item 6. Exhibits, Financial Statement Schedules
(a)
Exhibits.
The following is a list of all exhibits filed or furnished as part of this report.
| Exhibit No. | Description | |||||||
| Second Amended and Restated Certificate of Incorporation of Ares Management Corporation. | ||||||||
| Bylaws of Ares Management Incorporation (incorporated by reference to Exhibit 99.4 to the Registrant’s Current Report on Form 8-K (File No. 001-36429) filed with the SEC on November 15, 2018). | ||||||||
|
31.1
*
|
Certification of the Chief Executive Officer pursuant to Rule 13a-14(a). | |||||||
|
31.2
*
|
Certification of the Chief Financial Officer pursuant to Rule 13a-14(a). | |||||||
|
32.1
*
|
Certification of the Chief Executive Officer and Chief Financial Officer pursuant to 18 U.S.C. Section 1350. | |||||||
| 101.INS* | XBRL Instance Document - the instance document does not appear in the Interactive Data File because its XBRL tags are embedded within the Inline XBRL document. | |||||||
| 101.SCH* | Inline XBRL Taxonomy Extension Schema Document. | |||||||
| 101.CAL* | Inline XBRL Taxonomy Extension Calculation Linkbase Document. | |||||||
| 101.DEF* | Inline XBRL Taxonomy Extension Definition Linkbase Document. | |||||||
| 101.LAB* | Inline XBRL Taxonomy Extension Label Linkbase Document. | |||||||
| 101.PRE* | Inline XBRL Taxonomy Extension Presentation Linkbase Document. | |||||||
| 104* | Cover Page Interactive Data File - the cover page interactive data file does not appear in the Interactive Data File because its XBRL tags are embedded within the Inline XBRL document. | |||||||
* These certifications are not deemed filed by the SEC and are not to be incorporated by reference in any filing we make under the Securities Act of 1933 or the Securities Exchange Act of 1934, irrespective of any general incorporation language in any filings.
129
SIGNATURES
Pursuant to the requirements of the Securities Exchange Act of 1934, the registrant has duly caused this report to be signed on its behalf by the undersigned thereunto duly authorized.
| ARES MANAGEMENT CORPORATION | |||||||||||
| Dated: November 5, 2021 | By: | /s/ Michael J Arougheti | |||||||||
| Name: | Michael J Arougheti | ||||||||||
| Title: | Co-Founder, Chief Executive Officer & President (Principal Executive Officer) | ||||||||||
| Dated: November 5, 2021 | By: | /s/ Jarrod Phillips | |||||||||
| Name: | Jarrod Phillips | ||||||||||
| Title: |
Chief Financial Officer
(Principal Financial and Accounting Officer) |
||||||||||
130
TABLE OF CONTENTS
Part I Financial InformationItem 1. Financial StatementsItem 2. Management S Discussion and Analysis Of Financial Condition and Results Of OperationsItem 2. Management S Discussion and AnalysisItem 3. Quantitative and Qualitative Disclosures About Market RiskItem 4. Controls and ProceduresPart IIItem 1. Legal ProceedingsItem 1A. Risk FactorsItem 2. Unregistered Sales Of Equity Securities and Use Of ProceedsItem 3. Defaults Upon Senior SecuritiesItem 4. Mine Safety DisclosuresItem 5. Other InformationItem 6. Exhibits, Financial Statement Schedules