ARAMARK
10-Ks and 10-Qs
|
|
|
|
|
|
|
|
|
|
|
|
|
|
|
|
|
|
|
|
|
|
|
|
|
|
|
|
|
|
|
|
|
|
|
UNITED STATES SECURITIES AND EXCHANGE COMMISSION
Washington, D.C. 20549
___________________________________________
FORM 10-K
ANNUAL REPORT PURSUANT TO SECTION 13 or 15(d) OF
THE SECURITIES EXCHANGE ACT OF 1934
___________________________________________
For the fiscal year ended October 3, 2014 Commission File Number: 001-36223

|
Aramark
|
|
|
(Exact name of registrant as specified in its charter)
|
|
|
Delaware
|
20-8236097
|
|
(State or other jurisdiction of
incorporation or organization)
|
(I.R.S. Employer
Identification Number)
|
|
Aramark Tower
1101 Market Street
Philadelphia, Pennsylvania
|
19107
|
|
(Address of principal executive offices)
|
(Zip Code)
|
(215) 238-3000
(Registrant’s telephone number, including area code)
Securities registered pursuant to Section 12(b) of the Act:
|
Title of Each Class
|
Name of Each Exchange on which Registered
|
|
Common Stock, par value $0.01 per share
|
New York Stock Exchange
|
Securities registered pursuant to Section 12(g) of the Act: None
___________________________________________
Indicate by check mark if the registrant is a well-known seasoned issuer, as defined in Rule 405 of the Securities Act.
Yes
¨
No
x
Indicate by check mark if the registrant is not required to file reports pursuant to Section 13 or 15(d) of the Act.
Yes
¨
No
x
Indicate by check mark whether the registrant (1) has filed all reports required to be filed by Section 13 or 15(d) of the Securities Exchange Act of 1934 during the preceding 12 months (or for such shorter period that the registrant was required to file such reports), and (2) has been subject to such filing requirements for the past 90 days.
Yes
x
No
¨
Indicate by check mark whether the registrant has submitted electronically and posted on its corporate Web site, if any, every Interactive Data File required to be submitted and posted pursuant to Rule 405 of Regulation S-T (§232.405 of this chapter) during the preceding 12 months (or for such shorter period that registrant was required to submit and post such files).
Yes
x
No
¨
Indicate by check mark if disclosure of delinquent filers pursuant to Item 405 of Regulation S-K is not contained herein, and will not be contained, to the best of registrant’s knowledge, in definitive proxy or information statements incorporated by reference in Part III of this Form 10-K or any amendment to this Form 10-K.
x
Indicate by check mark whether the registrant is a large accelerated filer, an accelerated filer, a non-accelerated filer, or a smaller reporting company. See the definitions of “large accelerated filer,” “accelerated filer” and “smaller reporting company” in Rule 12b-2 of the Exchange Act.
|
Large accelerated filer
|
o
|
Accelerated filer
|
o
|
Non-accelerated filer
|
x
|
Smaller reporting company
|
o
|
Indicate by check mark whether the registrant is a shell company (as defined in Rule 12b-2 of the Exchange Act). Yes
¨
No
x
As of March 28, 2014, the aggregate market value of the common stock of the registrant held by non-affiliates of the registrant was approximately $1,443.9 million.
As of
November 28, 2014
, the number of the registrant's stock outstanding is 234,462,317.
___________________________________________
DOCUMENTS INCORPORATED BY REFERENCE
Portions of the definitive proxy statement to be filed with the Securities and Exchange Commission pursuant to Regulation 14A relating to the registrant’s 2015 Annual Meeting of Stockholders, to be held on February 3, 2015, will be incorporated by reference in this Form 10-K in response to portions of Part III. The definitive proxy statement will be filed with the SEC not later than 120 days after the registrant’s fiscal year ended October 3, 2014.
|
TABLE OF CONTENTS
|
|||
|
Page
|
|||
Overview
Aramark (the “Company,” “we” or “us”) is a leading global provider of food, facilities and uniform services to education, healthcare, business and industry, and sports, leisure and corrections clients. Our core market is North America (composed of the United States and Canada), which is supplemented by an additional 20-country footprint serving some of the fastest growing global geographies. We hold the #2 position in North America in food, and facilities services and uniform services based on total sales in fiscal 2014. Internationally, we hold a top 3 position in food and facilities services based on total sales in fiscal 2014 in most countries in which we have significant operations, and are one of only 3 food and facilities competitors with our combination of scale, scope, and global reach. Through our established brand, broad geographic presence and approximately
269,500
employees, we anchor our business in our partnerships with thousands of education, healthcare, business, sports, leisure and corrections clients. Through these partnerships we serve millions of consumers including students, patients, employees, sports fans and guests worldwide.
We operate our business in three reportable segments that share many of the same operating characteristics: Food and Support Services North America ("FSS North America"), Food and Support Services International ("FSS International") and Uniform. Both FSS North America and Uniform have significant scale and hold the #2 position in North America, while in our FSS International segment we hold a top 3 position in most countries in which we have significant operations based on fiscal 2014 total sales. The following chart shows a breakdown of our sales and operating income by our reportable segments:
|
|
||||||||||||||
|
Reportable Segments:
|
FSS North America
|
FSS International
|
Uniform
|
|||||||||||
|
FY 2014 Sales
(a)
:
|
$
|
10,232.8
|
|
$
|
3,111.2
|
|
$
|
1,488.9
|
|
|||||
|
FY 2014 Operating Income
(a)
:
|
$
|
501.3
|
|
$
|
106.2
|
|
$
|
172.1
|
|
|||||
|
Services:
|
Food, hospitality and facilities
|
Food, hospitality and facilities
|
Rental, sale, cleaning, maintenance, direct marketing and delivery of personalized uniform apparel and other items
|
|||||||||||
|
Sectors:
|
Business and industry, sports, leisure and corrections, education and healthcare
|
Business and industry, sports, leisure and corrections, healthcare and education
|
Business, public institutions, manufacturing, transportation and service industries
|
|||||||||||
(a) Dollars in millions. Operating income excludes $
(215.0) million
related to corporate expenses. For certain other financial information relating to our segments, see Note 15 to the audited consolidated financial statements.
In
fiscal
2014
, we generated
$14.8 billion
of sales,
$149.5 million
of net income and
$564.6 million
of operating income.
Our History
Since our founding in 1959, we have broadened our service offerings and expanded our client base through a combination of organic growth and successful acquisitions, with the goal of further developing our food, facilities and uniform capabilities, as well as growing our international presence. In 1984, we completed a management buyout, after which our management and employees increased their Company ownership to approximately 90% of our equity capital leading up to our December 2001 public offering. On January 26, 2007, we delisted from the NYSE in conjunction with a going-private transaction (the "2007 Transaction") executed with investment funds affiliated with GS Capital Partners, CCMP Capital Advisors, J.P. Morgan Partners, Thomas H. Lee Partners, L.P. and Warburg Pincus LLC as well as approximately 250 senior management personnel.
On December 17, 2013, we completed an initial public offering of 41,687,500 shares of our common stock, including 13,687,500 shares of common stock sold by our selling stockholders. We did not receive any of the proceeds from the sale of the shares sold by the selling stockholders and we used our proceeds from the initial public offering, net of costs, to pay down debt. Our common stock began trading on the NYSE under the ticker symbol “ARMK” on December 12, 2013.
1
Food and Support Services
Our Food and Support Services segments manage a number of interrelated services-including food, hospitality and facility services-for school districts, colleges and universities, healthcare facilities, businesses, sports, entertainment and recreational venues, conference and convention centers, national and state parks and correctional institutions. Our Food and Support Services segments holds the #2 position in North America and a top 3 position in most countries in which FSS has significant operations based on fiscal 2014 total sales.
We are the exclusive provider of food and beverage services at most of the locations we serve and are responsible for hiring, training and supervising substantially all of the food service personnel in addition to ordering, receiving, preparing and serving food and beverage items sold at those facilities. Our facilities services capabilities are broad, and include plant operations and maintenance, custodial/housekeeping, energy management, clinical equipment maintenance, grounds keeping, and capital project management. In governmental, business, educational and healthcare facilities (for example, offices and industrial plants, schools and universities and hospitals), our clients provide us with a captive client base through their on-site employees, students and patients. At sports, entertainment and recreational facilities, our clients attract patrons to their site, usually for specific events such as sporting events and conventions.
We manage our FSS business in two geographic reportable segments split between our North America and International operations. In fiscal
2014
, our FSS North America segment generated
$10,232.8 million
in sales, or
69%
of our total sales, and our FSS International segment generated
$3,111.2 million
in sales, or
21%
of our total sales. No individual client represents more than 2% of our total sales, other than, collectively, a number of U.S. government agencies. See Note 15 to the audited consolidated financial statements for information on sales, operating income and total assets for the FSS North America segment and the FSS International segment.
Clients and Services
Our Food and Support Services segments serves a number of client sectors across 22 countries around the world. Our Food and Support Services operations focus on serving clients in four principal sectors:
|
Sector
|
Types of Clients
|
Food Services
|
Facilities Services
|
|||
|
Education
|
Colleges and universities
Public school districts and systems
Private schools
|
Dining services
Catering
Food service management
Retail operations
|
Facilities management
Custodial services
Grounds
Energy management
Construction management
Capital project management
|
|||
|
Healthcare
|
Hospitals
Nursing homes
|
Food and nutrition services
Retail operations
|
Clinical equipment maintenance
Environmental services
Laundry and linen distribution
Plant operations
Energy management
Strategic and technical services
Supply chain management
Purchasing
Central transportation
|
|||
|
Business & Industry
|
Office parks and buildings
Manufacturing plants
Corporate cafeterias
Mining operations
Oil & Gas drilling operations
|
Dining services
On-site restaurants
Catering
Convenience stores
Executive dining rooms
Coffee and vending
Drinking water filtration
|
Housekeeping management
Plant operations/maintenance
Energy management
Groundskeeping
Landscaping
Transportation
Capital program management
Commissioning services
Building operations consulting
|
|||
|
Sports, Leisure and Corrections
|
Professional and collegiate stadiums and arenas
Concert venues
National and state parks
Convention and civic centers
Correctional facilities
|
Concessions
Banquet and catering
Retail and merchandise sales
Food and nutrition services
Premium and restaurant
|
Recreational and lodging services
Commissary services
Laundry and linen management
Property room management
Housekeeping management
Facility management
|
|||
Education.
Within the Education sector we serve Higher Education and K-12 clients. We deliver a wide range of food and facility services at more than 1,500 colleges, universities, school systems and districts and private schools. We offer our education clients a single source provider for managed service solutions, including dining, catering, food service management, convenience-oriented retail operations, grounds and facilities maintenance, custodial, energy management, construction management, and capital project management.
Healthcare.
We provide a wide range of non-clinical support services to approximately
1,200
healthcare clients and more than 2,000 facilities across our global footprint. We offer healthcare organizations a single source provider for managed service solutions, which include food services such as patient food and nutrition services and retail food services, and facilities services such as clinical equipment maintenance, environmental services, laundry and linen distribution, plant operations, energy management, strategic/technical services, supply chain management, purchasing and central transportation.
2
Business & Industry
. We provide a comprehensive range of business dining services, including on-site restaurants, catering, convenience stores and executive dining.
We also provide beverage and vending services to business and industry clients at thousands of locations. Our service and product offerings include a full range of coffee offerings, “grab and go” food operations, convenience stores, micromarkets and a proprietary drinking water filtration system.
We also offer a variety of facility management services to business and industry clients. These services include the management of housekeeping, plant operations and maintenance, energy management, laundry and linen, groundskeeping, landscaping, transportation, capital program management and commissioning services and other facility consulting services relating to building operations.
We also offer remote services which include facility and business support services primarily for mining and oil operations.
Sports, Leisure and Corrections
. We administer concessions, banquet and catering services, retail services and merchandise sales, recreational and lodging services and facility management services at sports, entertainment and recreational facilities. We serve
149
professional (including minor league affiliates) and college sports teams, including
38
teams in Major League Baseball, the National Basketball Association, the National Football League and the National Hockey League. We also serve
24
convention and civic centers,
17
national and state parks and other resort operations, plus numerous concert venues, entertainment complexes and other popular tourist attractions in the United States and Canada. Additionally, we provide correctional food services, operate commissaries, laundry facilities and property rooms and provide food and facilities management services for parks.
Our FSS International segment provides a similar range of services as those provided to our FSS North America segment clients and operates in all of our sectors. We have operations in
20
countries outside the United States and Canada. Our largest international operations are in the United Kingdom, Germany, Chile, Ireland and China, and in each of these countries we are one of the leading food service providers. We also have a strong presence in Japan through our 50% ownership of AIM Services Co., Ltd., which is a leader in providing outsourced food services in Japan. In addition to the core Business & Industry sector, our FSS International segment serves many soccer stadiums across Europe, and numerous educational institutions, correctional institutions and convention centers globally. There are particular risks attendant with our international operations. Please see Item 1A. “Risk Factors.”
Purchasing
We negotiate the pricing and other terms for the majority of our purchases of food and related products in the United States and Canada directly with national manufacturers. We purchase these products and other items through SYSCO Corporation and other distributors. We have a master distribution agreement with SYSCO that covers a significant amount of our purchases of these products and items in the United States and another distribution agreement with SYSCO that covers our purchases of these products in Canada. Our distributors are responsible for tracking our orders and delivering products to our specific locations. Due to our ability to negotiate favorable terms with our suppliers, we receive vendor consideration, including rebates, allowances and volume discounts. See “Types of Contracts” below. Our location managers also purchase a number of items, including bread, dairy products and alcoholic beverages from local suppliers, and we purchase certain items directly from manufacturers.
Our relationship with SYSCO is important to our operations—we have had distribution agreements in place for more than 20 years. In fiscal
2014
, SYSCO distributed approximately
57%
of our food and non-food products in the United States and Canada, and we believe that we are one of their largest clients. However, we believe that the products acquired through SYSCO can, in significant cases, be purchased through other sources and that termination of our relationship with them or any disruption of their business would cause only short-term disruptions to our operations.
Our agreements with our distributors are generally for an indefinite term, subject to termination by either party after a notice period, which is generally 60 to 120 days. The pricing and other financial terms of these agreements are renegotiated periodically. Our current agreement with SYSCO is terminable by either party with 180 days notice.
In our international segment, our approach to purchasing is substantially similar. On a country-by-country basis, we negotiate pricing and other terms for a majority of our purchases of food and related products with manufacturers operating in the applicable country, and we purchase these products and other items through distributors in that country. Due to our ability to negotiate favorable terms with our suppliers, we receive vendor consideration, including rebates, allowances and volume discounts. See “Types of Contracts” below. As in North America, our location managers also purchase a number of items, including bread, dairy products and alcoholic beverages from local suppliers, and we purchase certain items directly from manufacturers. Our agreements with our distributors are subject to termination by either party after a notice period, which is generally 60 days. The pricing and other financial terms of these agreements are renegotiated periodically.
3
Our relationship with distributors in the countries outside the United States and Canada is important to our operations, but from an overall volume standpoint, no distributor outside the United States and Canada distributes a significant volume of products. We believe that products we acquire from our distributors in countries outside the United States and Canada can, in significant cases, be purchased from other sources, and that the termination of our relationships with our distributors outside the United States and Canada, or the disruption of their business operations, would cause only short-term disruption to our operations.
Sales and Marketing
We maintain selling and marketing excellence by focusing on the execution of a common selling process as well as optimal resource allocation and deployment. Our common selling process ensures that we sell our services to our clients in the same way, regardless of the sector in which such client is located. We have developed consistent tools and training that are used across all of our businesses to train our employees on this selling process. Our business development functions are aligned directly with the sectors and services in which we have leadership positions, and we combine our targeted business development strategies with our strong client relationships to deliver differentiated and innovative solutions. We target our business development by aligning our sales efforts directly with the sectors and services in which we operate. We identify individuals at various levels in our organization to match up with individuals in a variety of roles at both existing and potential clients. We believe that these connections throughout various levels within the client organization allow us to develop strong relationships with the client and gain a better understanding of the clients’ requirements. Based on the knowledge of the clients’ requirements and the sector, our goal is to develop solutions for the client that are unique and that help to differentiate us from our competitors.
Types of Contracts
We use contracts that allow us to manage our potential upside and downside risk in connection with our various business interactions with clients. Our contracts may require that the client’s consent be obtained in order to raise prices on the food, beverages and merchandise we sell within a particular facility. The length of contracts that we enter into with clients varies. Contracts generally are for fixed terms, many of which are in excess of one year. Client contracts for sports, entertainment and recreational services typically require larger capital investments, but have correspondingly longer and fixed terms, usually from five to fifteen years.
When we enter into new contracts, or extend or renew existing contracts, particularly those for stadiums, arenas, convention centers, colleges and universities and business dining accounts, we are sometimes contractually required to make some form of up-front or future capital investment to help finance improvement or renovation, typically to the food and beverage facilities of the venue from which we operate. Contractually required capital expenditures typically take the form of investment in leasehold improvements, food service equipment and/or grants to clients. At the end of the contract term or upon its earlier termination, assets such as equipment and leasehold improvements typically become the property of the client, but generally the client must reimburse us for any undepreciated or unamortized capital investments.
Food and Support Services contracts are generally obtained and renewed either through a competitive process or on a negotiated basis, although contracts in the public sector are frequently awarded on a competitive bid basis, as required by applicable law. Contracts for Food and Support Services with school districts and correctional clients are typically awarded through a formal bid process. Contracts in the private sector may be entered into without a formal bid process, but we and other companies will often compete in the process leading up to the award or the completion of contract negotiations. Typically, after the award, final contract terms are negotiated and agreed upon.
We use two general contract types in our Food and Support Services segments: profit and loss contracts and client interest contracts. These contracts differ in their provision for the amount of financial risk that we bear and, accordingly, the potential compensation, profits or fees we may receive. Commission rates and management fees, if any, may vary significantly among contracts based upon various factors, including the type of facility involved, the term of the contract, the services we provide and the amount of capital we invest.
Profit and Loss Contracts.
Under profit and loss contracts, we receive all of the revenue from, and bear all of the expenses of, the provision of our services at a client location. Expenses under profit and loss contracts sometimes include commissions paid to the client, typically calculated as a fixed or variable percentage of various categories of sales, and, in some cases, require minimum guaranteed commissions. We benefit from greater upside potential with a profit and loss contract, although we do consequently bear greater downside risk than with a client interest contract. For
fiscal
2014
, approximately
73%
of our Food and Support Services sales were derived from profit and loss contracts.
Client Interest Contracts.
Client interest contracts include management fee contracts, under which our clients reimburse our operating costs and pay us a management fee, which may be calculated as a fixed dollar amount or a percentage of sales or operating costs. Some management fee contracts entitle us to receive incentive fees based upon our performance under the contract, as measured by factors such as sales, operating costs and client satisfaction surveys. Client interest contracts also
4
include limited profit and loss contracts, under which we receive a percentage of any profits earned from the provision of our services at the facility and we generally receive no payments if there are losses. As discussed above under “Purchasing,” we receive vendor consideration, including rebates, allowances and volume discounts that we retain except in those cases and to the extent that, under certain arrangements, they are allocated and credited to our clients. For our client interest contracts, both our upside potential and downside risk are reduced compared to our profit and loss contracts. For
fiscal
2014
, approximately
27%
of our Food and Support Services sales were derived from client interest contracts.
Competition
There is significant competition in the Food and Support Services business from local, regional, national and international companies, as well as from the businesses, healthcare institutions, colleges and universities, correctional facilities, school districts and public assembly facilities that decide to provide these services themselves. Institutions may decide to operate their own services or outsource to one of our competitors following the expiration or termination of contracts with us. Clients do not necessarily choose the lowest cost provider, and tend to place a premium on the total value proposition offered. In our FSS North America segment, our external competitors include other multi-regional food and support service providers, such as Centerplate, Inc., Compass Group plc, Delaware North Companies Inc. and Sodexo SA. Internationally, our external food service and support service competitors include Compass Group plc, Elior SA, International Service System A/S and Sodexo SA. We also face competition from many regional and local service providers.
We believe that the following competitive factors are the principal drivers of our success:
|
•
|
quality and breadth of services and management talent;
|
|
•
|
service innovation;
|
|
•
|
reputation within the industry;
|
|
•
|
pricing; and
|
|
•
|
financial strength and stability.
|
Seasonality
Our sales and operating results have varied, and we expect them to continue to vary, from quarter to quarter as a result of different factors. Within our FSS North America segment, historically there has been a lower level of activity during our first and second fiscal quarters in operations that provide services to sports and leisure clients. This lower level of activity historically has been partially offset during our first and second fiscal quarters by the increased activity in our educational operations. Conversely, historically there has been a significant increase in the provision of services to sports and leisure clients during our third and fourth fiscal quarters, which is partially offset by the effect of summer recess at colleges, universities and schools.
Uniform
Our Uniform segment provides uniforms and other garments and work clothes and ancillary items such as mats and shop towels in the United States, Puerto Rico, Canada and through a joint venture in Japan. We hold the #2 position in the North America uniform services market. We operate over 2,600 routes nationally, giving us a broad reach to service our clients’ needs.
Clients use our uniforms to meet a variety of needs, including:
|
•
|
establishing corporate identity and brand awareness;
|
|
•
|
projecting a professional image:
|
|
•
|
protecting workers—work clothes can help protect workers from difficult environments such as heavy soils, heat, flame or chemicals; and
|
|
•
|
protecting products—uniforms can help protect products against contamination in the food, pharmaceutical, electronics, health care and automotive industries.
|
We provide a full service employee uniform solution, including design, sourcing and manufacturing, delivery, cleaning and maintenance. We rent uniforms, work clothing, outerwear, particulate-free garments and non-garment items and related services, including industrial towels, floor mats, mops, linen products, and paper products to businesses in a wide range of industries, including manufacturing, food services, automotive, healthcare, construction, utilities, repair and maintenance services, restaurant and hospitality. In
fiscal
2014
, our Uniform segment generated
$1,488.9 million
in sales, or
10%
of our total sales. See Note 15 to the audited consolidated financial statements for information on sales, operating income and total assets for the Uniform segment.
5
Clients and Services
We serve businesses of all sizes in many different industries. We have a diverse client base, serving clients in all
50
states, Puerto Rico and one Canadian province, from over
200
service location and distribution centers across the United States and
one
service center in Ontario, Canada. None of our clients individually represents a material portion of our sales. We typically visit our clients’ sites weekly, delivering clean, finished uniforms and, at the same time, removing the soiled uniforms or other items for cleaning, repair or replacement. We also offer products for direct sale.
Our cleanroom service offers advanced static dissipative garments, barrier apparel, sterile garments and cleanroom application accessories for clients with contamination-free operations in the technology, food, healthcare and pharmaceutical industries.
We conduct our direct marketing business through three primary brands-WearGuard, Crest and Aramark. We design, source or manufacture and distribute distinctive image apparel to workers in a wide variety of industries through the Internet at www.shoparamark.com, dedicated sales representatives and telemarketing sales channels. We customize and embroider personalized uniforms and logos for clients through an extensive computer assisted design center and distribute work clothing, outerwear, business casual apparel and footwear throughout the United States, Puerto Rico and Canada.
Operations
We operate our uniform rental business as a network of
80
laundry plants and
169
satellite plants and depots supporting over
2,600
pick-up and delivery routes. We operate a fleet of service vehicles that pick up and deliver uniforms for cleaning and maintenance. We conduct our direct marketing activities principally from our facilities in Salem, Virginia; Norwell, Massachusetts; and Reno, Nevada. We market our own brands of apparel and offer a variety of customized personalization options such as embroidery and logos. We also source uniforms and other products to our specifications from a number of domestic and international suppliers and also manufacture a significant portion of our uniform requirements. We purchase uniform and textile products as well as equipment and supplies from domestic and international suppliers. The loss of any one supplier would not have a significant impact on us. We also operate a cutting and sewing plant in Mexico, which satisfies a substantial amount of our standard uniform inventory needs.
Sales and Marketing
Our sales representatives and route sales drivers are responsible for selling our services to current and potential clients and developing new accounts through the use of an extensive, proprietary database of pre-screened and qualified business prospects. We build our brand identity through local advertising, promotional initiatives and through our distinctive service vehicles. Our clients frequently come to us through client referrals, either from our uniform rental business or from our other service sectors. Our customer service representatives generally interact on a weekly basis with their clients, while our support personnel are charged with expeditiously handling client requirements regarding the outfitting of new client employees and other customer service needs.
Types of Contracts
We typically serve our rental clients under written service contracts for an initial term of three to five years. While clients are not required to make an up-front investment for their uniforms, in the case of nonstandard uniforms and certain specialty programs, clients typically agree to reimburse us for our costs if they terminate their agreement early. With the exception of certain governmental bid business, most of our direct marketing business is conducted under invoice arrangement with repeat clients.
Competition
Although the United States rental industry has experienced some consolidation, there is significant competition in all the areas that we serve, and such competition varies across geographies. Although many competitors are smaller local and regional firms, we also face competition from other large national firms such as Cintas Corporation, G&K Services, Inc. and UniFirst Corporation. We believe that the primary competitive factors that affect our operations are quality, service, design, consistency of product, and distribution capability, particularly for large multi-location clients, and price. We believe that our ability to compete effectively is enhanced by the quality and breadth of our product line as well as our nationwide reach.
Employees of Aramark
As of October 3, 2014, we had a total of approximately
269,500
employees, including seasonal employees, consisting of approximately
163,000
full-time and approximately
106,000
part-time employees in our three business segments. The number of part-time employees varies significantly from time to time during the year due to seasonal and other operating requirements. We generally experience our highest level of employment during the fourth fiscal quarter. The approximate number of employees by segment is as follows: FSS North America:
168,000
; FSS International:
88,000
; Uniform:
13,000
. In addition, the Aramark corporate staff is approximately
500
employees. Approximately
39,300
employees in the United States are covered by
6
collective bargaining agreements. We have not experienced any material interruptions of operations due to disputes with our employees and consider our relations with our employees to be satisfactory.
Governmental Regulation
Our business is subject to various federal, state, local and international laws and regulations, in areas such as environmental, labor, employment, immigration, health and safety laws and liquor licensing and dram shop. In addition, our facilities and products are subject to periodic inspection by federal, state, local and international authorities. We have established, and periodically update, various internal controls and procedures designed to maintain compliance with these laws and regulations. Our compliance programs are subject to legislative changes, or changes in regulatory interpretation, implementation or enforcement. From time to time both federal and state government agencies have conducted audits of certain of our practices as part of routine investigations of providers of services under government contracts, or otherwise. Like others in our business, we receive requests for information from governmental agencies in connection with these audits. If we fail to comply with applicable laws, we may be subject to investigations, criminal sanctions or civil remedies, including fines, penalties, damages, reimbursement, injunctions, seizures, debarments from government contracts or loss of liquor licenses.
Our operations are subject to various governmental regulations, including, but not limited to, those governing:
|
•
|
the service of food and alcoholic beverages;
|
|
•
|
collection of sales and other taxes;
|
|
•
|
minimum wage, overtime, wage payment and employment discrimination;
|
|
•
|
immigration;
|
|
•
|
governmentally funded entitlement programs and cost and accounting principles;
|
|
•
|
false claims, whistleblowers and consumer protection;
|
|
•
|
environmental protection;
|
|
•
|
food, safety, sanitation, labeling and human health and safety;
|
|
•
|
customs, import and export control laws;
|
|
•
|
the Foreign Corrupt Practices Act, the U.K. Bribery Act and other anti-corruption laws;
|
|
•
|
antitrust, competition, procurement and lobbying;
|
|
•
|
minority, women and disadvantaged business enterprise statutes;
|
|
•
|
federal motor carrier safety; and
|
|
•
|
privacy and client data security.
|
The laws relating to each of our food and support services segments are numerous and complex. There are a variety of laws and regulations at various governmental levels relating to the handling, preparation and serving of food, including in some cases requirements relating to the temperature of food, the cleanliness of food production facilities, and the hygiene of food-handling personnel, which are enforced primarily at the local public health department level. While we attempt to comply with applicable laws and regulations, there can be no assurance that we are in full compliance at all times with all of the applicable laws and regulations or that we will be able to comply with any future laws and regulations. Furthermore, legislation and regulatory attention to food safety is very high. Additional or amended regulations in this area may significantly increase the cost of compliance or expose us to liability.
In addition, various government agencies impose nutritional guidelines and other requirements on us at certain of the healthcare, education and corrections facilities we serve. We may also be subject to laws and regulations that limit or restrict the use of trans fats in the food we serve or other requirements relating to ingredient or nutrient labeling. There can be no assurance that legislation, or changes in regulatory implementation or interpretation of government regulations, would not limit our activities in the future or significantly increase the cost of regulatory compliance.
Because we serve alcoholic beverages at many sports, entertainment and recreational facilities, including convention centers and national and state parks, we also hold liquor licenses incidental to our contract food service business and are subject to the liquor license requirements of the jurisdictions in which we hold a liquor license. As of
October 3, 2014
, our subsidiaries held liquor licenses in
43
states and the District of Columbia,
four
Canadian provinces and certain other countries. Typically, liquor licenses must be renewed annually and may be revoked or suspended for cause at any time. Alcoholic beverage control regulations relate to numerous aspects of our operations, including minimum age of patrons and employees, hours of operation, advertising, wholesale purchasing, inventory control and handling, and storage, dispensing and service of alcoholic beverages. We have not encountered any material problems relating to alcoholic beverage licenses to date. The failure to receive or retain a
7
liquor license in a particular location could adversely affect our ability to obtain such a license elsewhere. Some of our contracts require us to pay liquidated damages during any period in which our liquor license for the facility is suspended, and most contracts are subject to termination if we lose our liquor license for the facility. Our service of alcoholic beverages is also subject to alcoholic service beverage laws, commonly called dram shop statutes. Dram shop statutes generally prohibit serving alcoholic beverages to certain persons such as minors or visibly intoxicated persons. If we violate dram shop laws, we may be liable to the patron or to third parties for the acts of the patron. We sponsor regular training programs designed to minimize the likelihood of such a situation. However, we cannot guarantee that intoxicated or minor patrons will not be served or that liability for their acts will not be imposed on us.
Our uniform rental business and our food and support service business are subject to various environmental protection laws and regulations, including the U.S. Federal Clean Water Act, Clean Air Act, Resource Conservation and Recovery Act, Comprehensive Environmental Response, Compensation, and Liability Act and similar state and local statutes and regulations governing the use, management, shipping and disposal of chemicals and hazardous materials. In particular, industrial laundries use certain detergents and cleaning chemicals to launder garments and other merchandise. The residues from such detergents and chemicals and residues from soiled garments and other merchandise laundered at our facilities may result in potential discharges to air and to water (through sanitary sewer systems and publicly owned treatment works) and may be contained in waste generated by our wastewater treatment systems. Our industrial laundries are subject to certain volume and chemical air and water pollution discharge limits, monitoring, permitting and recordkeeping requirements. We own or operate aboveground and underground storage tank systems at some locations to store petroleum products for use in our or our clients’ operations. Certain of these storage tank systems also are subject to performance standards, periodic monitoring and recordkeeping requirements. We also may use and manage chemicals and hazardous materials in our operations from time to time. We are mindful of the environmental concerns surrounding the use, management, shipping and disposal of these chemicals and hazardous materials, and have taken and continue to take measures to maintain compliance with environmental protection laws and regulations. Given the regulated nature of our operations, we could face penalties and fines for non-compliance. In the past, we have settled, or contributed to the settlement of, actions or claims relating to the management of underground storage tanks and the handling and disposal of chemicals or hazardous materials, either on or off-site. We may, in the future, be required to expend material amounts to rectify the consequences of any such events. Under environmental laws, we may be liable for the costs of removal or remediation of certain hazardous materials located on or in or migrating from our owned or leased property or our clients’ properties, as well as related costs of investigation and property damage. Such laws may impose liability without regard to our fault, knowledge or responsibility for the presence of such hazardous substances. We may not know whether our clients’ properties or our acquired or leased properties have been operated in compliance with environmental laws and regulations or that our future uses or conditions will not result in the imposition of liability upon us under such laws or expose us to third-party actions such as tort suits.
We do not anticipate any capital expenditures for environmental remediation that would have a material effect on our financial condition.
Intellectual Property
We have the patents, trademarks, trade names and licenses that are necessary for the operation of our business. Other than the Aramark brand, which includes our corporate starperson logo design (both old and new) and the Aramark word mark (our name),we do not consider our patents, trademarks, trade names and licenses to be material to the operation of our business in any material respect.
Available Information
We file annual, quarterly and current reports and other information with the Securities and Exchange Commission (the “SEC”). These filings are available to the public over the Internet at the SEC's web site at http://www.sec.gov. You may also read and copy any document we file at the SEC’s public reference room at 100 F. Street, N.E., Washington, D.C. 20549. Please call the SEC at 1-800-SEC-0330 for further information on the public reference room.
Our principal Internet address is www.aramark.com. We make available free of charge on www.aramark.com our annual, quarterly and current reports, and amendments to those reports, as soon as reasonably practicable after we electronically file such material with, or furnish it to, the SEC.
Our Business Conduct Policy includes a code of ethics for our principal executive officer, our principal financial officer and our principal accounting officer and applies to all of our employees and non-employee directors. Our Business Conduct Policy is available on the Investor Relations section of our website at www.aramark.com and is available in print to any person who requests it by writing or telephoning us at the address or telephone number set forth below.
8
You may request a copy of our SEC filings (excluding exhibits) and our Business Conduct Policy at no cost by writing or telephoning us at the following address or telephone number:
Aramark
1101 Market Street
Philadelphia, PA 19107
Attention: Corporate Secretary
Telephone: (215) 238-3000
The references to our web site and the SEC’s web site are intended to be inactive textual references only and the contents of those websites are not incorporated by reference herein.
9
Risks related to our business
Unfavorable economic conditions have, and in the future could, adversely affect our results of operations and financial condition.
A national or international economic downturn has, and in the future could, reduce demand for our services in each of our reportable segments, which may result in the loss of business or increased pressure to contract for business on less favorable terms than our generally preferred terms. Economic hardship among our client base can also impact our business. For example, during the recent period of economic distress, certain of our businesses have been negatively affected by reduced employment levels at our clients’ locations and declining levels of business and consumer spending. In addition, insolvency experienced by clients, especially larger clients, has, and in the future could, make it difficult for us to collect amounts we are owed and could result in the voiding of existing contracts. Similarly, financial distress or insolvency, if experienced by our key vendors and service providers such as insurance carriers, could significantly increase our costs.
The portion of our food and support services business that provides services in public facilities such as convention centers and tourist and recreational attractions is particularly sensitive to an economic downturn, as expenditures to take vacations or hold or attend conventions are funded to a partial or total extent by discretionary income. A decrease in such discretionary income on the part of potential attendees at our clients’ facilities has, and in the future could, result in a reduction in our sales. Further, because our exposure to the ultimate consumer of what we provide is limited by our dependence on our clients to attract those consumers to their facilities and events, our ability to respond to such a reduction in attendance, and therefore our sales, is limited. There are many factors that could reduce the numbers of events in a facility or attendance at an event, including labor disruptions involving sports leagues, poor performance by the teams playing in a facility, number of playoff games, inclement weather and adverse economic conditions which would adversely affect sales and profits.
Natural disasters, global calamities, sport strikes and other adverse incidents could adversely affect our sales and operating results.
Natural disasters, including hurricanes and earthquakes, or global calamities, such as an Ebola outbreak or a flu pandemic, have, and in the future could, affect our sales and operating results. In the past, we experienced lost and closed client locations, business disruptions and delays, the loss of inventory and other assets, and the effect of the temporary conversion of a number of our client locations to provide food and shelter to those left homeless by storms. In addition, any terrorist attacks, particularly against venues that we serve, and the national and global military, diplomatic and financial response to such attacks or other threats, also may adversely affect our sales and operating results. Sports strikes, particularly those that are for an extended time period, can reduce our sales and have an adverse impact on our results of operations. For example, in 2012, the collective bargaining agreement for the players in the National Hockey League expired. As a result, the 2012/2013 season was significantly shortened and our sales and profits were negatively impacted. Any decrease in the number of games played would mean a loss of sales and reduced profits at the venues we service.
Our failure to retain our current clients, renew our existing client contracts and obtain new client contracts could adversely affect our business.
Our success depends on our ability to retain our current clients, renew our existing client contracts and obtain new business. Our ability to do so generally depends on a variety of factors, including the quality, price and responsiveness of our services, as well as our ability to market these services effectively and differentiate ourselves from our competitors. There can be no assurance that we will be able to obtain new business, renew existing client contracts at the same or higher levels of pricing or that our current clients will not turn to competitors, cease operations, elect to self-operate or terminate contracts with us. The failure to renew a significant number of our existing contracts would have a material adverse effect on our business and results of operations and the failure to obtain new business could have an adverse impact on our growth.
We may be adversely affected if clients reduce their outsourcing or use of preferred vendors.
Our business and growth strategies depend in large part on the continuation of a current trend toward outsourcing services. Clients will outsource if they perceive that outsourcing may provide quality services at a lower overall cost and permit them to focus on their core business activities. We cannot be certain that this trend will continue or not be reversed or that clients that have outsourced functions will not decide to perform these functions themselves.
In addition, labor unions representing employees of some of our current and prospective clients have occasionally opposed the outsourcing trend to the extent that they believed that current union jobs for their memberships might be lost. In these cases, unions typically seek to prevent public sector entities from outsourcing and if that fails, ensure that jobs that are outsourced continue to be unionized, which can reduce our pricing and operational flexibility with respect to such businesses.
We have also identified a trend among some of our clients toward the retention of a limited number of preferred vendors to provide all or a large part of their required services. We cannot be certain that this trend will continue or not be reversed or, if it does continue, that we will be selected and retained as a preferred vendor to provide these services. Unfavorable developments
10
with respect to either outsourcing or the use of preferred vendors could have a material adverse effect on our business and results of operations.
Competition in our industries could adversely affect our results of operations.
There is significant competition in the food and support services business from local, regional, national and international companies, of varying sizes, many of which have substantial financial resources. Our ability to successfully compete depends on our ability to provide quality services at a reasonable price and to provide value to our clients and consumers. Certain of our competitors have been and may in the future be willing to underbid us or accept a lower profit margin or expend more capital in order to obtain or retain business. Also, certain regional and local service providers may be better established than we are within a specific geographic region. In addition, existing or potential clients may elect to self-operate their food and support services, eliminating the opportunity for us to serve them or compete for the account. While we have a significant international presence, certain of our competitors have more extensive portfolios of services and a broader geographic footprint than we do. Therefore, we may be placed at a competitive disadvantage for clients who require multiservice or multinational bids.
We have a number of major national competitors in the uniform rental industry with significant financial resources. In addition, there are regional and local uniform suppliers whom we believe may have strong client loyalty. While most clients focus primarily on quality of service, uniform rental also is a price-sensitive service and if existing or future competitors seek to gain clients or accounts by reducing prices, we may be required to lower prices, which would reduce our sales and profits. The uniform rental business requires investment capital for growth. Failure to maintain capital investment in this business would put us at a competitive disadvantage. In addition, due to competition in our uniform rental business, it has become increasingly important for us to source garments and other products overseas, particularly from Asia. To the extent we are not able to effectively source such products from Asia and gain the related cost savings, we may be at a further disadvantage in relation to some of our competitors.
Increased operating costs and obstacles to cost recovery due to the pricing and cancellation terms of our food and support services contracts may constrain our ability to make a profit.
Our profitability can be adversely affected to the extent we are faced with cost increases for food, wages, other labor related expenses (including workers’ compensation, state unemployment insurance and federal or state mandated health benefits and other healthcare costs), insurance, fuel, utilities, piece goods, clothing and equipment, especially to the extent we are unable to recover such increased costs through increases in the prices for our products and services, due to one or more of general economic conditions, competitive conditions or contractual provisions in our client contracts. For example, if federal, state, foreign or local minimum wage rates increase, we may have to increase the wages of both minimum wage employees and employees whose wages are above the minimum wage. Oil and natural gas prices have fluctuated significantly in the last several years. Substantial increases in the cost of fuel and utilities have historically resulted in substantial cost increases in our uniform rental business, and to a lesser extent in our food and support services segments. From time to time we have experienced increases in our food costs. While we believe a portion of these increases were attributable to fuel prices, we believe the increases also resulted from rising global food demand and the increased production of biofuels such as ethanol. In addition, food prices can fluctuate as a result of temporary changes in supply, including as a result of incidences of severe weather such as droughts, heavy rains and late freezes. We have two main types of contract in our food and facilities business: profit and loss contracts in which we bear all of the expenses of the contract but gain the benefit of the sales, and client interest contracts in which our clients share some or all of the expenses and gain some or all of the sales. Approximately 73% of our food and support services sales in fiscal 2014 are from profit and loss contracts under which we have limited ability to pass on cost increases to our clients. Therefore, in many cases, we will have to absorb any cost increases, which may adversely impact our operating results.
The amount of risk that we bear and our profit potential vary depending on the type of contract under which we provide food and support services. We may be unable to fully recover costs on contracts that limit our ability to increase prices. In addition, we provide many of our services under contracts of indefinite term, which are subject to termination on short notice by either party without cause. Some of our profit and loss contracts contain minimum guaranteed remittances to our client regardless of our sales or profit at the facility involved. If sales do not exceed costs under a contract that contains minimum guaranteed commissions, we will bear any losses which are incurred, as well as the guaranteed commission. Generally, our contracts also limit our ability to raise prices on the food, beverages and merchandise we sell within a particular facility without the client’s consent. In addition, some of our contracts exclude certain events or products from the scope of the contract, or give the client the right to modify the terms under which we may operate at certain events. The payment of guaranteed commissions to a client under a profit and loss contract that is not profitable, the refusal by individual clients to permit the sale of some products at their venues, the imposition by clients of limits on prices which are not economically feasible for us, or decisions by clients to curtail their use of the services we provide could adversely affect our sales and results of operations. For example, during the recent economic downturn, certain of our business and industry clients curtailed their employees’ use of catering, which had a negative effect on our sales and profits.
11
Our inability to achieve cost savings through our cost reduction efforts could impact our results of operations.
The achievement of the goals we set in our plans and our future financial performance is dependent, in part, on our efforts to reduce our cost structure through various cost reduction initiatives. One of our recent initiatives is the establishment of a North American business services center that will bring together certain back office operations that are currently dispersed in many areas. Successful execution of our cost reduction initiatives is not assured and there are several obstacles to success, including our ability to enable the information technology and business process required for these efforts, as well as the timing of the transition to our business services center. In addition, there can be no assurance that our efforts, if properly executed, will result in our desired outcome of improved financial performance.
Our expansion strategy involves risks.
We may seek to acquire companies or interests in companies or enter into joint ventures that complement our business, and our inability to complete acquisitions, integrate acquired companies successfully or enter into joint ventures may render us less competitive. At any given time, we may be evaluating one or more acquisitions or engaging in acquisition negotiations, although we are not currently contemplating any acquisition transaction that would be material to our business. We cannot be sure that we will be able to continue to identify acquisition candidates or joint venture partners on commercially reasonable terms or at all. If we make acquisitions, we also cannot be sure that any benefits anticipated from the acquisitions will actually be realized. Likewise, we cannot be sure that we will be able to obtain necessary financing for acquisitions. Such financing could be restricted by the terms of our debt agreements or it could be more expensive than our current debt. The amount of such debt financing for acquisitions could be significant and the terms of such debt instruments could be more restrictive than our current covenants. In addition, our ability to control the planning and operations of our joint ventures and other less than majority-owned affiliates may be subject to numerous restrictions imposed by the joint venture agreements and majority stockholders. Our joint venture partners may also have interests which differ from ours.
The process of integrating acquired operations into our existing operations may result in operating, contract and supply chain difficulties, such as the failure to retain clients or management personnel and problems coordinating technology and supply chain arrangements. Also, in connection with any acquisition, we could fail to discover liabilities of the acquired company for which we may be responsible as a successor owner or operator in spite of any investigation we make prior to the acquisition. In addition, labor laws in certain countries may require us to retain more employees than would otherwise be optimal from entities we acquire. Such difficulties may divert significant financial, operational and managerial resources from our existing operations, and make it more difficult to achieve our operating and strategic objectives. The diversion of management attention, particularly in a difficult operating environment, may affect our sales. Similarly, our business depends on effective information technology systems and implementation delays or poor execution of the integration of different information technology systems could disrupt our operations and increase costs. Possible future acquisitions could result in the incurrence of additional debt and related interest expense or contingent liabilities and amortization expenses related to intangible assets, which could have a material adverse effect on our financial condition, operating results and/or cash flow. In addition, goodwill resulting from business combinations represents a significant portion of our assets. If the goodwill were deemed to be impaired, we would need to take a charge to earnings to write down the goodwill to its fair value.
A failure to maintain food safety throughout our supply chain and food-borne illness concerns may result in reputational harm and claims of illness or injury that could adversely affect us.
Food safety is a top priority for us and we dedicate substantial resources to ensuring that our consumers enjoy safe, quality food products. Claims of illness or injury relating to food quality or food handling are common in the food service industry, and a number of these claims may exist at any given time. Because food safety issues could be experienced at the source or by food suppliers or distributors, food safety could, in part, be out of our control. Regardless of the source or cause, any report of food-borne illness or other food safety issues such as food tampering or contamination at one of our locations could adversely impact our reputation, hindering our ability to renew contracts on favorable terms or to obtain new business, and have a negative impact on our sales. Even instances of food-borne illness, food tampering or contamination at a location served by one of our competitors could result in negative publicity regarding the food service industry generally and could negatively impact our sales. Future food safety issues may also from time to time disrupt our business. In addition, product recalls or health concerns associated with food contamination may also increase our raw materials costs.
Laws and governmental regulations relating to food and beverages may subject us to significant liability.
The regulations relating to each of our food and support services segments are numerous and complex. A variety of laws and regulations at various governmental levels relating to the handling, preparation and serving of food (including, in some cases, requirements relating to the temperature of food), and the cleanliness of food production facilities and the hygiene of food-handling personnel are enforced primarily at the local public health department level. There can be no assurance that we are in full compliance with all applicable laws and regulations at all times or that we will be able to comply with any future laws and regulations. Furthermore, legislation and regulatory attention to food safety is very high. Additional or amended laws or regulations in this area may significantly increase the cost of compliance or expose us to liabilities.
12
We serve alcoholic beverages at many facilities, and must comply with applicable licensing laws, as well as state and local service laws, commonly called dram shop statutes. Dram shop statutes generally prohibit serving alcoholic beverages to certain persons, such as an individual who is visibly intoxicated or a minor. If we violate dram shop laws, we may be liable to the patron and/or third parties for the acts of the patron. Although we sponsor regular training programs designed to minimize the likelihood of such a situation, we cannot guarantee that visibly intoxicated or minor patrons will not be served or that liability for their acts will not be imposed on us. There can be no assurance that additional laws or regulations in this area would not limit our activities in the future or significantly increase the cost of regulatory compliance. We must also obtain and comply with the terms of licenses in order to sell alcoholic beverages in the states in which we serve alcoholic beverages. Some of our contracts require us to pay liquidated damages during any period in which our liquor license for the facility is suspended, and most contracts are subject to termination if we lose our liquor license for the facility.
If we fail to comply with requirements imposed by applicable law or other governmental regulations, we could become subject to lawsuits, investigations and other liabilities and restrictions on our operations that could significantly and adversely affect our business.
We are subject to governmental regulation at the federal, state, international, national, provincial and local levels in many areas of our business, such as employment laws, wage and hour laws, discrimination laws, immigration laws, human health and safety laws, import and export controls and customs laws, environmental laws, false claims or whistleblower statutes, minority, women and disadvantaged business enterprise statutes, tax codes, antitrust and competition laws, consumer protection statutes, procurement regulations, intellectual property laws, food safety, labeling and sanitation laws, cost and accounting principles, the Foreign Corrupt Practices Act, the U.K. Bribery Act, other anti-corruption laws, lobbying laws, motor carrier safety laws, data privacy laws and alcohol licensing and service laws.
From time to time, governmental agencies have conducted reviews and audits of certain of our practices as part of routine investigations of providers of services under government contracts, or otherwise. Like others in our business, we also receive requests for information from government agencies in connection with these reviews and audits. While we attempt to comply with all applicable laws and regulations, there can be no assurance that we are in full compliance with all applicable laws and regulations or interpretations of these laws and regulations at all times or that we will be able to comply with any future laws, regulations or interpretations of these laws and regulations.
If we fail to comply with applicable laws and regulations, including those referred to above, we may be subject to investigations, criminal sanctions or civil remedies, including fines, penalties, damages, reimbursement, injunctions, seizures, disgorgements or debarments from government contracts or the loss of liquor licenses. The cost of compliance or the consequences of non-compliance, including debarments, could have a material adverse effect on our business and results of operations. In addition, government agencies may make changes in the regulatory frameworks within which we operate that may require either the corporation as a whole or individual businesses to incur substantial increases in costs in order to comply with such laws and regulations.
Changes in, new interpretations of or changes in the enforcement of the governmental regulatory framework may affect our contracts and contract terms and may reduce our sales or profits.
A portion of our sales, estimated to be approximately
13.1%
in fiscal 2014, is derived from business with U.S. federal, state and local governments and agencies. Changes or new interpretations in, or changes in the enforcement of, the statutory or regulatory framework applicable to services provided under government contracts or bidding procedures, including an adverse change in government spending policies or appropriations, budget priorities or revenue levels, particularly by our food and support services businesses, could result in fewer new contracts or contract renewals, modifications to the methods we apply to price government contracts, or in contract terms of shorter duration than we have historically experienced. Any of these changes could result in lower sales or profits than we have historically achieved, which could have an adverse effect on our results of operations.
Environmental regulations may subject us to significant liability and limit our ability to grow.
We are subject to various environmental protection laws and regulations, including the U.S. Federal Clean Water Act, Clean Air Act, Resource Conservation and Recovery Act, Comprehensive Environmental Response, Compensation, and Liability Act and similar state statutes and regulations governing the use, management, and disposal of chemicals and hazardous materials. In particular, industrial laundries in our uniform rental business use certain detergents and cleaning chemicals to launder garments and other merchandise. The residues from such detergents and chemicals and residues from soiled garments and other merchandise laundered at our facilities may result in potential discharges to air and to water (through sanitary sewer systems and publicly owned treatment works) and may be contained in waste generated by our wastewater treatment systems.
Our industrial laundries are subject to certain volume and chemical air and water pollution discharge limits, monitoring, permitting and recordkeeping requirements.
13
We own or operate aboveground and underground storage tank systems at some locations to store petroleum products for use in our or our clients’ operations. Certain of these storage tank systems also are subject to performance standards, periodic monitoring, and recordkeeping requirements. We also may use and manage chemicals and hazardous materials in our operations from time to time. In the course of our business, we may be subject to penalties and fines for non-compliance with environmental protection laws and regulations and we may settle, or contribute to the settlement of, actions or claims relating to the management of underground storage tanks and the handling and disposal of chemicals or hazardous materials. We may, in the future, be required to expend material amounts to rectify the consequences of any such events.
In addition, changes to environmental laws may subject us to additional costs or cause us to change aspects of our business. Under U.S. federal and state environmental protection laws, as an owner or operator of real estate we may be liable for the costs of removal or remediation of certain hazardous materials located on or in or migrating from our owned or leased property or our client’s properties, as well as related costs of investigation and property damage, without regard to our fault, knowledge, or responsibility for the presence of such hazardous materials. There can be no assurance that locations that we own, lease or otherwise operate, either for ourselves or for our clients, or that we may acquire in the future, have been operated in compliance with environmental laws and regulations or that future uses or conditions will not result in the imposition of liability upon us under such laws or expose us to third-party actions such as tort suits. In addition, such regulations may limit our ability to identify suitable sites for new or expanded facilities. In connection with our present or past operations and the present or past operations of our predecessors or companies that we have acquired, hazardous substances may migrate from properties on which we operate or which were operated by our predecessors or companies we acquired to other properties. We may be subject to significant liabilities to the extent that human health is adversely affected or the value of such properties is diminished by such migration.
Our international business faces risks different from those we face in the United States that could have an effect on our results of operations and financial condition.
A significant portion of our sales is derived from international business. During fiscal 2014, approximately
21%
of our sales were generated outside of North America. We currently have a presence in 20 countries outside of the United States and Canada with approximately 88,000 personnel. Our international operations are subject to risks that are different from those we face in the United States, including the requirement to comply with changing and conflicting national and local regulatory requirements; Foreign Corrupt Practices Act, U.K. Bribery Act and other anti-corruption law compliance matters; potential difficulties in staffing and labor disputes; differing local labor laws; managing and obtaining support and distribution for local operations; credit risk or financial condition of local clients; potential imposition of restrictions on investments; potentially adverse tax consequences, including imposition or increase of withholding, VAT and other taxes on remittances and other payments by subsidiaries; foreign exchange controls; and local political and social conditions. In addition, the operating results of our non-U.S. subsidiaries are translated into U.S. dollars and those results are affected by movements in foreign currencies relative to the U.S. dollar.
We intend to continue to develop our business in emerging countries over the long term. Emerging international operations present several additional risks, including greater fluctuation in currencies relative to the U.S. dollar; economic and governmental instability; civil disturbances; volatility in gross domestic production; and nationalization and expropriation of private assets.
There can be no assurance that the foregoing factors will not have a material adverse effect on our international operations or on our consolidated financial condition and results of operations.
Continued or further unionization of our workforce may increase our costs and work stoppages could damage our business.
Approximately 39,300 employees in our North America operations are represented by unions and covered by collective bargaining agreements. The continued or further unionization of a significantly greater portion of our workforce could increase our overall costs at the affected locations and adversely affect our flexibility to run our business in the most efficient manner to remain competitive or acquire new business. In addition, any significant increase in the number of work stoppages at our various operations could adversely affect our business, financial condition or results of operations.
We may incur significant liability as a result of our participation in multiemployer defined benefit pension plans.
We operate at several locations under collective bargaining agreements. Under some of these agreements, we are obligated to contribute to multiemployer defined benefit pension plans. As a contributing employer to such plans, should we trigger either a “complete” or a “partial withdrawal,” we would be subject to withdrawal liability (or partial withdrawal liability) for our proportionate share of any unfunded vested benefits. In addition, if a multiemployer defined benefit pension plan fails to satisfy the minimum funding standards, we could be liable to increase our contributions to meet minimum funding standards. Also, if a participating employer withdraws from the plan or experiences financial difficulty, including bankruptcy, our obligation could increase. The financial status of certain of the plans to which we contribute has deteriorated in the recent past and continues to deteriorate. In addition, any increased funding obligations for underfunded multiemployer defined benefit pension plans could have a financial impact on us.
14
Risks associated with the suppliers from whom our products are sourced could adversely affect our results of operations.
The raw materials we use in our business and the finished products we sell are sourced from a wide variety of domestic and international suppliers. We seek to require our suppliers to comply with applicable laws and otherwise be certified as meeting our supplier standards of conduct. Our ability to find qualified suppliers who meet our standards, and to access raw materials and finished products in a timely and efficient manner is a challenge, especially with respect to suppliers located and goods sourced outside the United States. In addition, insolvency experienced by suppliers could make it difficult for us to source the items we need to run our business. Political and economic stability in the countries in which foreign suppliers are located, the financial stability of suppliers, suppliers’ failure to meet our supplier standards, labor problems experienced by our suppliers, the availability of raw materials to suppliers, currency exchange rates, transport availability and cost, inflation and other factors relating to the suppliers and the countries in which they are located are beyond our control. In addition, United States foreign trade policies, tariffs and other impositions on imported goods, trade sanctions imposed on certain countries, the limitation on the importation of certain types of goods or of goods containing certain materials from other countries and other factors relating to foreign trade are beyond our control. In addition, if one of our suppliers were to violate the law, our reputation may be harmed simply due to our association with that supplier. These and other factors affecting our suppliers and our access to raw materials and finished products could adversely affect our results of operations.
In fiscal 2014, one distributor distributed approximately 57% of our food and non-food products in the United States and Canada, and if our relationship or their business were to be disrupted, we could experience disruptions to our operations and cost structure.
Although we negotiate the pricing and other terms for the majority of our purchases of food and related products in the U.S. and Canada directly with national manufacturers, we purchase these products and other items through SYSCO Corporation and other distributors. SYSCO, the main U.S. and Canadian distributor of our food and non-food products, and other distributors are responsible for tracking our orders and delivering products to our specific locations. If our relationship with, or the business of, SYSCO were to be disrupted, we would have to arrange alternative distributors and our operations and cost structure could be adversely affected in the short term. Similarly, a sudden termination of the relationship with a significant provider in other geographic areas could in the short term adversely affect our ability to provide services and disrupt our client relationships in such areas.
Our business may suffer if we are unable to hire and retain sufficient qualified personnel or if labor costs increase.
From time to time, we have had difficulty in hiring and retaining qualified management personnel, particularly at the entry management level. We will continue to have significant requirements to hire such personnel. In the past, at times when the United States or other geographic regions have periodically experienced reduced levels of unemployment, there has been a shortage of qualified workers at all levels. Given that our workforce requires large numbers of entry level and skilled workers and managers, low levels of unemployment when such conditions exist or mismatches between the labor markets and our skill requirements can compromise our ability in certain areas of our businesses to continue to provide quality service or compete for new business. We also regularly hire a large number of part-time and seasonal workers, particularly in our food and support services segments. Any difficulty we may encounter in hiring such workers could result in significant increases in labor costs, which could have a material adverse effect on our business, financial condition and results of operations. Competition for labor has at times resulted in wage increases in the past and future competition could substantially increase our labor costs. Due to the labor intensive nature of our businesses and the fact that 73% of our food and support services segments’ sales are from profit and loss contracts under which we have limited ability to pass along cost increases, a shortage of labor or increases in wage levels in excess of normal levels could have a material adverse effect on our results of operations.
Healthcare reform legislation could have an impact on our business.
During 2010, the Patient Protection and Affordable Care Act and the Health Care and Education Reconciliation Act of 2010 were signed into law in the United States. Certain of the provisions that have increased our healthcare costs include the removal of annual plan limits and the mandate that health plans provide 100% coverage on expanded preventative care. In addition, our healthcare costs could increase as the new legislation and accompanying regulations require us to apply new eligibility rules, which could potentially cover more variable hour employees than we do currently or pay penalty amounts in the event that employees do not elect our offered coverage. While much of the cost of the recent healthcare legislation enacted will occur after 2014 due to provisions of the legislation being delayed and phased in over time, changes to our healthcare cost structure could have an impact on our business and operating costs.
Our business is contract intensive and may lead to client disputes.
Our business is contract intensive and we are parties to many contracts with clients all over the world. Our client interest contracts provide that client billings, and for some contracts the sharing of profits and losses, are based on our determinations of costs of service. Contract terms under which we base these determinations and, for certain government contracts, regulations governing our cost determinations, may be subject to differing interpretations which could result in disputes with our clients from time to time. Clients generally have the right to audit our contracts, and we periodically review our compliance with
15
contract terms and provisions. If clients were to dispute our contract determinations, the resolution of such disputes in a manner adverse to our interests could negatively affect sales and operating results. While we do not believe any reviews, audits or other such matters should result in material adjustments, if a large number of our client arrangements were modified in response to any such matter, the effect could be materially adverse to our business or results of operations.
Our operations are seasonal and quarter to quarter comparisons may not be a good indicator of our performance.
In our first and second fiscal quarters, within the FSS North America segment, there historically has been a lower level of sales at the sports, entertainment and recreational clients, which is partly offset by increased activity in educational operations. In our third and fourth fiscal quarters, there historically has been a significant increase in sales at the sports, entertainment and recreational clients, which is partially offset by the effect of summer recess in educational operations. For these reasons, a quarter to quarter comparison is not a good indication of our performance or how we will perform in the future.
Our operations and reputation may be adversely affected by disruptions to or breaches of our information security systems or if our data is otherwise compromised.
We are increasingly utilizing information technology systems to enhance the efficiency of our business. We maintain confidential, proprietary and personal information about our potential, current and former clients, customers, employees and other third parties in these systems. Our systems are subject to damage or interruption from power outages, computer or telecommunication failures, computer viruses and catastrophic events. Our systems are also vulnerable to an increasing threat of rapidly evolving cyber-based attacks, including malicious software, attempts to gain unauthorized access to data and other electronic security breaches. The development and maintenance of these systems is costly and requires ongoing monitoring and updating as technologies change and efforts to overcome security measures become more sophisticated. Despite our efforts, the possibility of risks described above, particularly cyber-based attacks, cannot be eliminated entirely, and each of these risks remain. In addition, we provide confidential, proprietary and personal information to third parties when it is necessary to pursue business objectives. While we obtain assurances that these third parties will protect this information, there is a risk the confidentiality of data held by third parties may be compromised. In addition, data and security breaches can also occur as the result of non-technical issues, including intentional or inadvertent breach by our employees or others with whom we have a relationship. Any damage to, or compromise or breach of our systems could impair our ability to conduct our business, and result in a violation of applicable privacy and other laws, significant legal and financial exposure, including litigation and other potential liability, and a loss of confidence in our security measures, which could have an adverse effect on our results of operations and our reputation as a brand, business partner or an employer.
Failure to achieve and maintain effective internal controls could adversely affect our business and stock price.
Our management is responsible for establishing and maintaining effective internal control over financial reporting. Internal control over financial reporting is a process to provide reasonable assurance regarding the reliability of financial reporting in accordance with accounting principles generally accepted in the United States. Because of its inherent limitations, internal control over financial reporting is not intended to provide absolute assurance that we would prevent or detect a misstatement of our financial statements or fraud. While we continue to evaluate our internal controls, we cannot be certain that these measures will ensure that we implement and maintain adequate controls over our financial processes and reporting in the future. Any failure to maintain an effective system of internal control over financial reporting could limit our ability to report our financial results accurately and timely or to detect and prevent fraud. A significant financial reporting failure or material weakness in internal control over financial reporting could cause a loss of investor confidence and decline in the market price of our common stock.
Our leverage could adversely affect our ability to raise additional capital to fund our operations, limit our ability to react to changes in the economy or our industries, expose us to interest rate risk to the extent of our variable rate debt and prevent us from meeting our obligations.
We are highly leveraged. As of
October 3, 2014
, our outstanding indebtedness was $
5,445.6 million
, including amounts outstanding under our credit facilities, senior notes and receivables facility. We also had additional availability of
$753.9 million
under our revolving credit facility at that date.
This degree of leverage could have important consequences, including:
|
•
|
exposing us to the risk of increased interest rates as certain of our borrowings, including borrowings under our senior secured credit facilities and our receivables facility, are at variable rates of interest;
|
|
•
|
making it more difficult for us to make payments on our indebtedness;
|
|
•
|
increasing our vulnerability to general economic and industry conditions;
|
16
|
•
|
requiring a substantial portion of cash flow from operations to be dedicated to the payment of principal and interest on our indebtedness, thereby reducing our ability to use our cash flow to fund our operations, capital expenditures and future business opportunities;
|
|
•
|
restricting us from making strategic acquisitions or causing us to make non-strategic divestitures;
|
|
•
|
limiting our ability to obtain additional financing for working capital, capital expenditures, debt service requirements, acquisitions and general corporate or other purposes; and
|
|
•
|
limiting our ability to adjust to changing market conditions and placing us at a competitive disadvantage compared to our competitors who are less highly leveraged.
|
We and our subsidiaries may be able to incur substantial additional indebtedness in the future, subject to the restrictions contained in our senior secured credit facilities and the indenture governing our senior notes. If new indebtedness is added to our current debt levels, the related risks that we now face could increase.
If our financial performance were to deteriorate, we may not be able to generate sufficient cash to service all of our indebtedness and may be forced to take other actions to satisfy our obligations under our indebtedness, which may not be successful.
Our ability to make scheduled payments on or to refinance our debt obligations depends on our financial condition and operating performance, which is subject to prevailing economic and competitive conditions and to certain financial, business and other factors beyond our control. While we believe that we currently have adequate cash flows to service our indebtedness, if our financial performance were to deteriorate significantly, we might be unable to maintain a level of cash flows from operating activities sufficient to permit us to pay the principal, premium, if any, and interest on our indebtedness.
If, due to such a deterioration in our financial performance, our cash flows and capital resources were to be insufficient to fund our debt service obligations, we may be forced to reduce or delay investments and capital expenditures, or to sell assets, seek additional capital or restructure or refinance our indebtedness. These alternative measures may not be successful and may not permit us to meet our scheduled debt service obligations. In addition, if we were required to raise additional capital in the current financial markets, the terms of such financing, if available, could result in higher costs and greater restrictions on our business. In addition, although a significant amount of our long-term borrowings do not mature until 2019 and later, if we were to need to refinance our existing indebtedness, the conditions in the financial markets at that time could make it difficult to refinance our existing indebtedness on acceptable terms or at all. If such alternative measures proved unsuccessful, we could face substantial liquidity problems and might be required to dispose of material assets or operations to meet our debt service and other obligations. Our senior secured credit agreement and the indenture governing our senior notes restrict our ability to dispose of assets and use the proceeds from any disposition of assets and to refinance our indebtedness. We may not be able to consummate those dispositions or to obtain the proceeds that we could realize from them and these proceeds may not be adequate to meet any debt service obligations then due.
Our debt agreements contain restrictions that limit our flexibility in operating our business.
Our senior secured credit agreement and the indenture governing our senior notes contain various covenants that limit our ability to engage in specified types of transactions. These covenants limit our and our restricted subsidiaries’ ability to, among other things:
|
•
|
incur additional indebtedness, refinance or restructure indebtedness or issue certain preferred shares;
|
|
•
|
pay dividends on, repurchase or make distributions in respect of our capital stock, make unscheduled payments on our notes, repurchase or redeem our notes or make other restricted payments;
|
|
•
|
make certain investments;
|
|
•
|
sell certain assets;
|
|
•
|
create liens;
|
|
•
|
consolidate, merge, sell or otherwise dispose of all or substantially all of our assets; and
|
|
•
|
enter into certain transactions with our affiliates.
|
In addition, our senior secured revolving credit facility requires us to satisfy and maintain specified financial ratios and other financial condition tests. Our ability to meet those financial ratios and tests can be affected by events beyond our control, and in the event of a significant deterioration of our financial performance, there can be no assurance that we will satisfy those ratios and tests. A breach of any of these covenants could result in a default under the senior secured credit agreement. Upon our failure to maintain compliance with these covenants that is not waived by the lenders under the revolving credit facility, the lenders under the senior secured credit facilities could elect to declare all amounts outstanding under the senior secured credit facilities to be immediately due and payable and terminate all commitments to extend further credit under such facilities. If we were unable to repay those amounts, the lenders under the senior secured credit facilities could proceed against the collateral
17
granted to them to secure that indebtedness. We have pledged a significant portion of our assets as collateral under the senior secured credit agreement. If the lenders under the senior secured credit facilities accelerate the repayment of borrowings, there can be no assurance that we will have sufficient assets to repay those borrowings, as well as our unsecured indebtedness. If our senior secured indebtedness was accelerated by the lenders as a result of a default, our senior notes may become due and payable as well. Any such acceleration may also constitute an amortization event under our receivables facility, which could result in the amount outstanding under that facility becoming due and payable.
Risks Related to Ownership of Our Common Stock
Our share price may change significantly, and you may not be able to resell shares of our common stock at or above the price you paid or at all, and you could lose all or part of your investment as a result.
We completed our initial public offering on December 17, 2013. Since our initial public offering, the trading price of our common stock, as reported by the NYSE, has been and is likely to continue to be volatile and could fluctuate due to a number of factors such as those listed in “—Risks Related to Our Business” and the following, some of which are beyond our control:
|
•
|
quarterly variations in our results of operations;
|
|
•
|
results of operations that vary from the expectations of securities analysts and investors;
|
|
•
|
results of operations that vary from those of our competitors;
|
|
•
|
changes in expectations as to our future financial performance, including financial estimates by securities analysts and investors;
|
|
•
|
announcements by us, our competitors or our vendors of significant contracts, acquisitions, joint marketing relationships, joint ventures or capital commitments;
|
|
•
|
announcements by third parties of significant claims or proceedings against us;
|
|
•
|
future sales of our common stock;
|
|
•
|
general domestic and international economic conditions; and
|
|
•
|
unexpected and sudden changes in senior management.
|
Furthermore, the stock market has experienced extreme volatility that, in some cases, has been unrelated or disproportionate to the operating performance of particular companies. These broad market and industry fluctuations may adversely affect the market price of our common stock, regardless of our actual operating performance.
In the past, following periods of market volatility, stockholders have instituted securities class action litigation. If we were involved in securities litigation, it could have a substantial cost and divert resources and the attention of executive management from our business regardless of the outcome of such litigation.
Future sales, or the perception of future sales, by us or our existing stockholders in the public market could cause the market price for our common stock to decline.
The sale of a substantial number of shares of our common stock in the public market, or the perception that such sales could occur, could harm the prevailing market price of shares of our common stock. These sales, or the possibility that these sales may occur, also might make it more difficult for us to sell equity securities in the future at a time and at a price that we deem appropriate.
Under our Stockholders Agreement that was amended and restated in connection with our initial public offering, management stockholders were generally permitted to sell up to 50% of their shares (including shares underlying vested share-based awards) commencing June 18, 2014, which was the day following the six-month anniversary of our initial public offering, and the remainder of their shares commencing December 18, 2014, which is the day following the one-year anniversary of our initial public offering. A total of 17,235,676 shares were held by current and former management stockholders as of November 3, 2014, including 13,133,774 vested stock options. Based on the average exercise price for the vested stock options of $9.64 and the closing price of our common stock on the NYSE on November 25, 2014, exercise of these options on a cashless basis (with the option exercise price and withholding taxes deducted from the number of shares to be issued) could lead to the issuance of an additional 8,805,127 shares. We cannot assure you that upon our management stockholders becoming free to sell all of their shares under the stockholders agreement on December 18, 2014, these shares (including shares underlying vested options) will not be exercised or that the shares underlying them will not be sold.
The sale of a substantial number of shares of our common stock into the market could cause the market price of our common stock to decline. These shares may be sold pursuant to Rule 144 depending on their holding period and subject to restrictions in the case of shares held by persons deemed to be our affiliates. As restrictions on resale end, the market price of our common stock could also decline if the holders of restricted shares sell them or are perceived by the market as intending to sell them.
18
These factors could also make it more difficult for us to raise additional funds through future offerings of our shares of common stock or other securities.
In addition, we also have outstanding options to purchase our common stock. To the extent that these options are exercised, there will be further dilution. We have filed a registration statement on Form S-8 under the Securities Act covering all of the common stock subject to outstanding equity awards, as well as options and shares reserved for future issuance, under our stock incentive plans. These shares may be freely sold in the public market upon issuance and vesting unless they are held by “affiliates,” as that term is defined in Rule 144. Sales of a substantial number of shares of these shares could cause the market price of our common stock to decline.
In the future, we may also issue our securities in connection with investments or acquisitions. The amount of shares of our common stock issued in connection with an investment or acquisition could constitute a material portion of our then-outstanding shares of our common stock. Any issuance of additional securities in connection with investments or acquisitions may result in additional dilution.
There can be no assurance that we will continue to pay dividends on our common stock, and our indebtedness could limit our ability to pay dividends on our common stock.
Payment of cash dividends on our common stock is subject to our compliance with applicable law and depends on, among other things, our results of operations, financial condition, level of indebtedness, capital requirements, contractual restrictions, business prospects and other factors that our board of directors may deem relevant. Our senior secured credit facilities and the indenture governing our senior notes contain, and the terms of any future indebtedness we or our subsidiaries incur may contain, limitations on our ability to pay dividends. For more information, see Item 5. "Market for Registrant's Common Equity, Related Stockholder Matters and Issuer Purchases of Equity Securities - Dividends.” Although we have paid cash dividends in the past, there can be no assurance that we will continue to pay any dividend in the future.
Our Controlling Owners can significantly influence our business and affairs and may have conflicts of interest with us in the future.
Investment funds associated with or designated by GS Capital Partners, CCMP Capital Advisors, LLC, J.P. Morgan Partners, LLC, Thomas H. Lee Partners, L.P. and Warburg Pincus, which we refer to as the Sponsors, and Joseph Neubauer, who, together with the Sponsors, we refer to as the Controlling Owners (with CCMP Capital Advisors, LLC and J.P. Morgan Partners, LLC acting together as one Controlling Owner for purposes of our Stockholders Agreement), collectively own approximately 66.8% of our common stock as of November 28, 2014. As a result, the Controlling Owners have the ability to prevent any transaction that requires the approval of stockholders, including the election of directors, mergers and takeover offers, regardless of whether others believe that approval of those matters is in our best interests. In addition, under the Stockholders Agreement, each of the Controlling Owners is entitled to select for nomination one person to serve on our board of directors and a majority of the Sponsor directors and Mr. Neubauer must be present in order to constitute a quorum for purposes of any meetings of the board of directors. See Item 13 “Certain Relationships and Related Transactions, and Director Independence - Stockholder Arrangements - Stockholders Agreement.”
In addition, the Sponsors are in the business of making investments in companies and may from time to time acquire and hold interests in businesses that compete directly or indirectly with us. One or more of the Sponsors may also pursue acquisition opportunities that may be complementary to our business and, as a result, those acquisition opportunities may not be available to us. So long as the Controlling Owners, or funds controlled by or associated with the Sponsors, continue to own a significant amount of the outstanding shares of our common stock, even if such amount is less than 50%, the Controlling Owners will continue to be able to strongly influence us. Our amended and restated certificate of incorporation provides that none of the Controlling Owners or any of their affiliates will have any duty to refrain from (i) engaging in a corporate opportunity in the same or similar lines of business in which we or our affiliates now engage or propose to engage or (ii) otherwise competing with us or our affiliates.
Anti-takeover provisions in our organizational documents could delay or prevent a change of control.
Certain provisions of our amended and restated certificate of incorporation and amended and restated bylaws may have an anti-takeover effect and may delay, defer or prevent a merger, acquisition, tender offer, takeover attempt or other change of control transaction that a stockholder might consider in its best interest, including those attempts that might result in a premium over the market price for the shares held by our stockholders.
These provisions provide for, among other things:
|
•
|
the ability of our board of directors to issue one or more series of preferred stock;
|
|
•
|
advance notice for nominations of directors by stockholders and for stockholders to include matters to be considered at our annual meetings;
|
|
•
|
certain limitations on convening special stockholder meetings;
|
19
|
•
|
the removal of directors only upon the affirmative vote of the holders of at least 75% in voting power of all the then-outstanding common stock of the company entitled to vote thereon, voting together as a single class, if the Controlling Owners and their affiliates beneficially own, in the aggregate, less than a majority in voting power of the common stock of the Company entitled to vote generally in the election of directors; and
|
|
•
|
that certain provisions may be amended only by the affirmative vote of the holders of at least 75% in voting power of all the then-outstanding common stock of the company entitled to vote thereon, voting together as a single class, if the Controlling Owners and their affiliates beneficially own, in the aggregate, less than 50% in voting power of the common stock of the Company entitled to vote generally in the election of directors.
|
These anti-takeover provisions could make it more difficult for a third-party to acquire us, even if the third-party’s offer may be considered beneficial by many of our stockholders. As a result, our stockholders may be limited in their ability to obtain a premium for their shares.
Our amended and restated certificate of incorporation designates the Court of Chancery of the State of Delaware as the sole and exclusive forum for certain types of actions and proceedings that may be initiated by our stockholders, which could limit our stockholders’ ability to obtain a favorable judicial forum for disputes with us or our directors, officers or other employees.
Our amended and restated certificate of incorporation provides that, with certain limited exceptions, unless we consent in writing to the selection of an alternative forum, the Court of Chancery of the State of Delaware will be the sole and exclusive forum for any stockholder (including any beneficial owner) to bring (i) any derivative action or proceeding brought on our behalf, (ii) any action asserting a claim of breach of fiduciary duty owed by any director or officer of the Company owed to us or our stockholders, creditors or other constituents, (iii) any action asserting a claim against us or any director or officer of the Company arising pursuant to any provision of the Delaware General Corporation Law or our amended and restated certificate of incorporation or our amended and restated bylaws, or (iv) any action asserting a claim against the Company or any director or officer of the Company governed by the internal affairs doctrine. Any person or entity purchasing or otherwise acquiring any interest in shares of our capital stock is deemed to have received notice of and consented to the foregoing provisions. This choice of forum provision may limit a stockholder’s ability to bring a claim in a judicial forum that it finds favorable for disputes with us or our directors, officers or other employees, which may discourage such lawsuits against us and our directors, officers and employees. Alternatively, if a court were to find this choice of forum provision inapplicable to, or unenforceable in respect of, one or more of the specified types of actions or proceedings, we may incur additional costs associated with resolving such matters in other jurisdictions, which could adversely affect our business, financial condition or results of operations.
So long as we are a “controlled company” within the meaning of the New York Stock Exchange rules, we will continue to qualify for, and intend to continue to rely on, exemptions from certain corporate governance requirements. You will not have the same protections afforded to stockholders of companies that are subject to such requirements.
Certain stockholders beneficially own a majority of the voting power of all outstanding shares of our common stock. Under New York Stock Exchange corporate governance standards, a company of which more than 50% of the voting power is held by an individual, group or another company is a “controlled company” and may elect not to comply with certain corporate governance requirements, including:
|
•
|
the requirement that a majority of the board of directors consist of “independent directors” as defined under the rules of the NYSE;
|
|
•
|
the requirement that we have a nominating/corporate governance committee that is composed entirely of independent directors with a written charter addressing the committee’s purpose and responsibilities;
|
|
•
|
the requirement that we have a compensation committee that is composed entirely of independent directors with a written charter addressing the committee’s purpose and responsibilities; and
|
|
•
|
the requirement for an annual performance evaluation of the nominating/corporate governance and compensation committees.
|
We intend to continue to utilize these exemptions so long as they are available. As a result, we may not have a majority of independent directors, our nominating and corporate governance committee and compensation committee may not consist entirely of independent directors and such committees may not be subject to annual performance evaluations. Accordingly, you will not have the same protections afforded to stockholders of companies that are subject to all of the corporate governance requirements of the New York Stock Exchange.
If securities or industry research analysts do not publish or cease publishing research or reports about our business or if they issue unfavorable commentary or downgrade our common stock, our share price and trading volume could decline.
The trading market for our common stock relies in part on the research and reports that securities and industry research analysts publish about us, our industry, our competitors and our business. We do not have any control over these analysts. Our share
20
price and trading volumes could decline if one or more securities or industry analysts downgrade our common stock, issue unfavorable commentary about us, our industry or our business, cease to cover our company or fail to regularly publish reports about us, our industry or our business.
Not Applicable.
Our principal executive offices are leased at Aramark Tower, 1101 Market Street, Philadelphia, Pennsylvania 19107. Our principal real estate is primarily comprised of Uniform and Career Apparel facilities. As of
October 3, 2014
, we operated
246
service facilities in our Uniform and Career Apparel segment, consisting of industrial laundries, cleanroom laundries, warehouses, distribution centers, satellites, depots, and stand alone garages that are located in
40
states, Mexico, Canada and Puerto Rico. Of these, approximately
50%
are leased and approximately
50%
are owned. In addition, we operate
one
cutting and sewing plant in Mexico. We own
11
buildings that we use in our FSS North America segment, including
two
office buildings,
two
hotels and several office/warehouse spaces, and we lease
126
premises, consisting of offices, office/warehouses and distribution centers. In addition, we own a distribution center, two office and
five
other properties and lease
121
facilities throughout the world that we use in our FSS International segment. We also maintain other real estate and leasehold improvements, which we use in the Uniform and FSS segments. No individual parcel of real estate owned or leased is of material significance to our total assets.
Our business is subject to various federal, state and local laws and regulations governing, among other things, the generation, handling, storage, transportation, treatment and disposal of water wastes and other substances. We engage in informal settlement discussions with federal, state, local and foreign authorities regarding allegations of violations of environmental laws in connection with our operations or businesses conducted by our predecessors or companies that we have acquired, the aggregate amount of which and related remediation costs we do not believe should have a material adverse effect on our financial condition or results of operations.
From time to time, the Company and its subsidiaries are party to various legal actions, proceedings and investigations involving claims incidental to the conduct of their business, including those brought by clients, consumers, employees, government entities and third parties under, among others, federal, state, international, national, provincial and local employment laws, wage and hour laws, discrimination laws, immigration laws, human health and safety laws, import and export controls and customs laws, environmental laws, false claims or whistleblower statutes, minority, women and disadvantaged business enterprise statutes, tax codes, antitrust and competition laws, consumer protection statutes, procurement regulations, intellectual property laws, food safety and sanitation laws, cost and accounting principles, the Foreign Corrupt Practices Act, the U.K. Bribery Act, other anti-corruption laws, lobbying laws, motor carrier safety laws, data privacy laws and alcohol licensing and service laws, or alleging negligence and/or breaches of contractual and other obligations. Based on information currently available, advice of counsel, available insurance coverage, established reserves and other resources, the Company does not believe that any such actions, proceedings or investigations are likely to be, individually or in the aggregate, material to its business, financial condition, results of operations or cash flows. However, in the event of unexpected further developments, it is possible that the ultimate resolution of these matters, or other similar matters, if unfavorable, may be materially adverse to the Company’s business, financial condition, results of operations or cash flows.
Not Applicable.
21
|
Item 5.
|
Market for Registrant’s Common Equity, Related Stockholder Matters and Issuer Purchases of Equity Securities
|
Market Information
Shares of our common stock began trading on December 12, 2013 and are quoted on the New York Stock Exchange (“NYSE”) under the ticker symbol “ARMK.” Prior to that date, there was no public market for our common stock. As of November 28, 2014, there were approximately 551 holders of record of our outstanding common stock. This does not include persons who hold our common stock in nominee or “street name” accounts through brokers or banks. The following table sets forth the high and low closing sales prices per share of our common stock during the periods indicated and the amount of cash dividends declared per share:
|
Calendar Period
|
High
|
Low
|
Cash
Dividend
Declared
Per Share
|
|||||||||
|
Quarter ended December 27, 2013 (from December 12, 2013)
|
$
|
26.22
|
|
$
|
22.70
|
|
$
|
—
|
|
|||
|
Quarter ended March 28, 2014
|
$
|
29.89
|
|
$
|
23.64
|
|
$
|
0.075
|
|
|||
|
Quarter ended June 27, 2014
|
$
|
28.92
|
|
$
|
25.38
|
|
$
|
0.075
|
|
|||
|
Quarter ended October 3, 2014
|
$
|
27.40
|
|
$
|
25.88
|
|
$
|
0.075
|
|
|||
Dividends
The Company declared quarterly cash dividends of $0.075 per share to all common stockholders of record at the close of business on February 18, May 19 and August 19, which were paid on March 11, June 9, and September 9, 2014, respectively. On November 11, 2014, the Company declared a cash dividend of $.08625 per share to all common stockholders of record at the close of business on November 25, 2014, payable on December 16, 2014.
We intend to continue to pay cash dividends on our common stock, subject to our compliance with applicable law, and depending on, among other things, our results of operations, financial condition, level of indebtedness, capital requirements, contractual restrictions, restrictions in our debt agreements, business prospects and other factors that our Board of Directors may deem relevant. However, the payment of any future dividends will be at the discretion of our Board of Directors and our Board of Directors may, at any time, determine not to continue to declare quarterly dividends.
Our ability to pay dividends depends on our receipt of cash dividends from our main operating subsidiary, Aramark Services, Inc., formerly known as ARAMARK Corporation, which may further restrict our ability to pay dividends as a result of covenants under any existing and future outstanding indebtedness of Aramark Services, Inc. In particular, the ability of Aramark Services, Inc. to distribute cash to the Company to pay dividends is limited by covenants in Aramark Services, Inc.’s Amended and Restated Credit Agreement dated as of February 24, 2014, as amended from time to time, and the indenture governing Services’ 5.75% Senior Notes entered into on March 7, 2013. See Item 7. “Management’s Discussion and Analysis of Financial Condition and Results of Operations” for a description of the restrictions on our ability to pay dividends and Note 5 to the audited consolidated financial statements included elsewhere in this Annual Report on Form 10-K.
Stock Price Performance
This performance graph and related information shall not be deemed “filed” for purposes of Section 18 of the Exchange Act, or incorporated by reference into any filing of Aramark under the Securities Act or the Exchange Act, except as shall be expressly set forth by specific reference in such filing.
The following graph shows a comparison from December 12, 2013 (the date our common stock commenced trading on the New York Stock Exchange) through October 3, 2014 of the cumulative total return for our common stock, The Standard & Poor’s (“S&P”) 500 Stock Index and The Dow Jones Consumer Non-Cyclical Index. The graph assumes that $100 was invested in the Company’s common stock and in each index at the market close on December 12, 2013 and assumes that all dividends were reinvested. The stock price performance of the following graph is not necessarily indicative of future stock price performance.
22
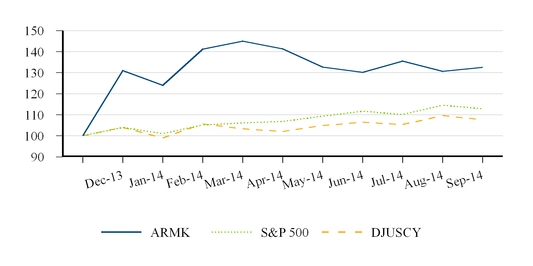
Unregistered Sales of Equity Securities
There were no unregistered sales of equity securities during the fiscal year ended October 3, 2014 which have not been previously disclosed in a quarterly report on Form 10-Q or a current report on Form 8-K.
Purchases of Equity Securities by the Issuer
There were no repurchases of equity securities by the Company in the fourth fiscal quarter ended October 3, 2014.
The following table presents selected consolidated financial data. This information should be read in conjunction with the audited consolidated financial statements and the related notes thereto, Management’s Discussion and Analysis of Financial Condition and Results of Operations, and Risk Factors, each included elsewhere herein.
|
(dollars in millions, except per share
amounts)
|
Fiscal Year Ended on or near
September 30
(1)
|
|||||||||||||||||||
|
|
2014
|
2013
|
2012
|
2011
|
2010
|
|||||||||||||||
|
|
||||||||||||||||||||
|
Sales
|
$
|
14,832.9
|
|
$
|
13,945.7
|
|
$
|
13,505.4
|
|
$
|
13,082.4
|
|
$
|
12,419.1
|
|
|||||
|
Depreciation and amortization
|
521.6
|
|
542.1
|
|
529.2
|
|
510.5
|
|
502.9
|
|
||||||||||
|
Operating income
|
564.6
|
|
514.4
|
|
581.8
|
|
547.1
|
|
477.5
|
|
||||||||||
|
Interest and other financing costs, net
|
334.9
|
|
423.8
|
|
456.8
|
|
451.1
|
|
444.5
|
|
||||||||||
|
Income from continuing operations
(2)
|
149.5
|
|
71.4
|
|
106.9
|
|
96.7
|
|
32.3
|
|
||||||||||
|
Net income
(2)
|
149.5
|
|
70.4
|
|
107.2
|
|
85.0
|
|
30.7
|
|
||||||||||
|
Net income attributable to Aramark stockholders
|
149.0
|
|
69.4
|
|
103.6
|
|
83.8
|
|
30.7
|
|
||||||||||
|
Basic earnings per share attributable to Aramark stockholders
|
|
$0.66
|
|
|
$0.34
|
|
|
$0.51
|
|
|
$0.41
|
|
|
$0.15
|
|
|||||
|
Diluted earnings per share attributable to Aramark stockholders
|
|
$0.63
|
|
|
$0.33
|
|
|
$0.49
|
|
|
$0.40
|
|
|
$0.15
|
|
|||||
|
Cash dividends per common share
(3)
|
|
$0.23
|
|
—
|
|
—
|
|
|
$3.50
|
|
—
|
|
||||||||
|
Ratio of earnings to fixed charges
(4)
|
1.5x
|
|
1.2x
|
|
1.2x
|
|
1.1x
|
|
1.0x
|
|
||||||||||
|
|
||||||||||||||||||||
|
Total assets
(5)
|
$
|
10,455.7
|
|
$
|
10,267.1
|
|
$
|
10,487.4
|
|
$
|
10,523.1
|
|
$
|
10,221.9
|
|
|||||
|
Long-term borrowings
(5)(6)(7)
|
5,355.8
|
|
5,758.2
|
|
5,971.3
|
|
6,183.1
|
|
5,350.2
|
|
||||||||||
|
Stockholders' Equity
(3)(7)
|
1,718.0
|
|
903.7
|
|
966.9
|
|
882.5
|
|
1,397.0
|
|
||||||||||
|
(1)
|
Our fiscal year ends on the Friday nearest to September 30th. Fiscal years 2014, 2013, 2012, 2011 and 2010 refer to the fiscal years ended October 3, 2014, September 27, 2013, September 28, 2012, September 30, 2011 and October 1, 2010, respectively. Fiscal 2014 is a 53-week year. All other periods presented are 52-week years.
|
23
|
(2)
|
On September 30, 2011, the Company completed the sale of its wholly-owned subsidiary, Galls, for approximately $75.0 million in cash. The transaction resulted in a pretax loss of approximately $1.5 million (after-tax loss of approximately $12.0 million). Galls’ results of operations have been removed from the Company’s results of continuing operations for all periods presented, where applicable.
|
|
(3)
|
During fiscal 2014, the Company paid cash dividends totaling
$52.2 million
($0.075 per share during the second, third and fourth quarters of fiscal 2014). During fiscal 2011, the Company paid a dividend of approximately $711 million to its stockholders. On October 29, 2012, the Company completed the spin-off of its majority interest in Seamless North America, LLC, an online and mobile food ordering service, to its stockholders in the form of a dividend. Each stockholder received one share of the common stock of Seamless Holdings, a newly formed company created to hold the Company's former interest in Seamless North America, LLC, for each share of its common stock held as of the record date.
|
|
(4)
|
For the purpose of determining the ratio of earnings to fixed charges, earnings include pre-tax income from continuing operations plus fixed charges (excluding capitalized interest). Fixed charges consist of interest on all indebtedness (including capitalized interest) plus that portion of operating lease rentals representative of the interest factor (deemed to be one-third of operating lease rentals).
|
|
(5)
|
In the first quarter of fiscal 2011, the Company adopted the new authoritative accounting guidance regarding transfers of financial assets. The impact upon adoption resulted in the recognition of both the receivables securitized under the program and the borrowings they collateralize on the Consolidated Balance Sheet, which led to a $220.9 million increase in “Receivables” and “Long-Term Borrowings.”
|
|
(6)
|
During fiscal 2011, the Company completed a private placement of $600 million, net of a 1% discount, in aggregate principal amount of 8.625% / 9.375% Senior Notes due 2016. During fiscal 2013, the Company completed a refinancing, repurchasing Aramark Services, Inc.’s outstanding 8.50% Senior Notes due 2015 and Senior Floating Rate Notes due 2015 and the Company's 8.625% / 9.375% Senior Notes due 2016. The Company refinanced that debt with new term loan borrowings under its senior secured credit facilities and the issuance of its 5.75% Senior Notes due 2020.
|
|
(7)
|
On December 17, 2013, the Company completed its initial public offering ("IPO") of 28,000,000 shares of its common stock at a price of $20.00 per share, raising approximately $524.1 million, net of costs directly related to the IPO. The Company used the net proceeds to repay borrowings of approximately $154.1 million on the senior secured revolving credit facility that were borrowed during the first quarter of fiscal 2014 and $370.0 million on the senior secured term loan facility.
|
24
Item 7.
MANAGEMENT’S DISCUSSION AND ANALYSIS
OF FINANCIAL CONDITION AND RESULTS OF OPERATIONS
The following discussion and analysis of our financial condition and results of operations for the
fiscal
years ended
October 3, 2014
,
September 27, 2013
and September 28, 2012 should be read in conjunction with Selected Consolidated Financial Data and our audited consolidated financial statements and the notes to those statements.
On December 17, 2013, Aramark (the "Company", "we", "our" and "us") completed its initial public offering ("IPO") of 28,000,000 shares of its common stock at a price of $20.00 per share. The Company's common stock trades on the New York Stock Exchange under the symbol "ARMK".
Our discussion contains forward-looking statements based upon current expectations that involve risks and uncertainties, such as our plans, objectives, opinions, expectations, anticipations, intentions and beliefs. Actual results and the timing of events could differ materially from those anticipated in those forward-looking statements as a result of a number of factors, including those set forth under "Risk Factors," "Statements Regarding Forward-looking Information" and "Business" sections and elsewhere in this Annual Report on Form 10-K ("Annual Report"). In the following discussion and analysis of financial condition and results of operations, certain financial measures may be considered “non-GAAP financial measures” under Securities and Exchange Commission (“SEC”) rules. These rules require supplemental explanation and reconciliation, which is provided elsewhere in this Annual Report on Form 10-K.
Overview
Aramark is a leading global provider of food, facilities and uniform services to education, healthcare, business and industry and sports, leisure and corrections clients. Our core market is North America, which is supplemented by an additional
20
-country footprint serving many of the fastest growing global economies. Through our established brand, broad geographic presence and approximately
269,500
employees, we anchor our business in our partnerships with thousands of education, healthcare, business, sports, leisure and corrections clients. Through these partnerships we serve millions of consumers including students, patients, employees, sports fans and guests worldwide.
We operate our business in three reportable segments:
|
•
|
Food and Support Services North America ("FSS North America") - Food, refreshment, specialized dietary and supports services, including facility maintenance and housekeeping, provided to business, educational and healthcare institutions and in sports, leisure and other facilities serving the general public in the United States and Canada.
|
|
•
|
Food and Support Services International ("FSS International") - Food, refreshment, specialized dietary and support services, including facility maintenance and housekeeping, provided to business, educational and healthcare institutions and in sports, leisure and other facilities serving the general public. We have operations in
20
countries outside FSS North America. Our largest international operations are in the United Kingdom, Germany, Chile, and Ireland, and in each of these countries we are one of the leading food service providers. We also have operations in emerging market countries, such as South America, China and Mexico, and we own 50% of AIM Services Co., Ltd., a leader in providing food services in Japan.
|
|
•
|
Uniform and Career Apparel ("Uniform") - Rental, sale, cleaning, maintenance and delivery of personalized uniforms and other textile items on a contract basis and direct marketing of personalized uniforms and accessories to clients in a wide range of industries in the United States, Puerto Rico, Japan and Canada, including manufacturing, transportation, construction, restaurants and hotels, healthcare and pharmaceutical industries. We supply garments, other textile and paper products and other accessories through rental and direct purchase programs to businesses, public institutions and individuals.
|
Our Food and Support Services operations focus on serving clients in four principal sectors: Education, Healthcare, Business & Industry and Sports, Leisure and Corrections. Our FSS International reportable segment provides a similar range of services as those provided to our FSS North America clients and operates in the same sectors although it is more heavily weighted towards Business & Industry. In
fiscal
2014
, our FSS North America segment generated
$10.2 billion
in sales, or
69%
of our total sales, our FSS International segment generated
$3.1 billion
in sales, or
21%
of our total sales and our Uniform segment generated
$1.5 billion
in sales, or
10%
of total sales. Administrative expenses not allocated to our three reportable segments are presented separately as corporate expenses and are not included in our segment results.
Our operating results are affected by the economic conditions being experienced in the countries in which we operate. Across all of our businesses, we continue to plan and execute both growth and productivity initiatives and continue to focus on streamlining and improving the efficiency and effectiveness of our general and administrative functions through increased
25
standards, process improvements, and consolidation. As a result, we recorded certain costs related to these initiatives starting in the second quarter of fiscal 2013 and continuing through fiscal 2014 and estimate that we will incur approximately an additional $100 million over the next two fiscal years in accordance with our plans (see Note 3 to our audited consolidated financial statements for more information).
Seasonality
Our sales and operating results have varied from quarter to quarter, as a result of different factors. Historically, within our FSS North America segment, there has been a lower level of activity during our first and second fiscal quarters in operations that provide services to sports and leisure clients. This lower level of activity, historically, has been partially offset during our first and second fiscal quarters by the increased activity levels in our educational operations. Conversely, historically there has been a significant increase in the provision of services to sports and leisure clients during our third and fourth fiscal quarters, which is partially offset by the effect of summer recess at colleges, universities and schools on our educational operations.
Sources of Sales
Our clients engage us, generally through written contracts, to provide our services at their locations. Depending on the type of client and service, we are paid either by our client or directly by the consumer to whom we have been provided access by our client. We typically use either profit and loss contracts or client interest contracts in our FSS North America and FSS International segments. These contracts differ in their provision for the amount of financial risk we bear and, accordingly, the potential compensation, profits or fees we may receive. Under profit and loss contracts, we receive all of the revenue from, and bear all of the expenses of, the provision of our services at a client location. For
fiscal
2014
, approximately 73% of our FSS North America and FSS International sales were derived from profit and loss contracts. Client interest contracts include management fee contracts, under which our clients reimburse our operating costs and pay us a management fee, which may be calculated as a fixed dollar amount or a percentage of sales or operating costs. Some management fee contracts entitle us to receive incentive fees based upon our performance under the contract, as measured by factors such as sales, operating costs and customer satisfaction surveys. For
fiscal
2014
, approximately 27% of our FSS North America and FSS International sales were derived from client interest contracts.
For our Uniform segment, we typically serve our rental clients under written service contracts for an initial term of three to five years. As the majority of our clients purchase on a recurring basis, our backlog of orders at any given time consists principally of orders in the process of being filled. With the exception of certain governmental bid business, most of our direct marketing business is conducted under invoice arrangement with repeat clients. To a large degree, our direct marketing business is relationship-driven. While we have long-term relationships with our larger clients, we generally do not have contracts with these clients.
Costs and Expenses
Our costs and expenses are comprised of cost of services provided, depreciation and amortization and selling and general corporate expenses. Cost of services provided consists of direct expenses associated with our operations, which includes food costs, wages, other labor-related expenses (including workers' compensation, state unemployment insurance and federal or state mandated health benefits and other healthcare costs), insurance, fuel, utilities, piece goods and clothing and equipment. Depreciation and amortization expenses mainly relate to assets used in generating sales. Selling and general corporate expenses include sales commissions, marketing, share-based compensation and other costs related to administrative functions including finance, legal, human resources and information technology.
Interest and Other Financing Costs, net
Interest and other financing costs, net relates primarily to interest expense on long-term borrowings. Interest and other financing costs, net also includes third-party costs associated with long-term borrowings that were capitalized as deferred financing costs and are being amortized over the term of the borrowing.
Provision for Income Taxes
The provision for income taxes represents federal, foreign, state and local income taxes. Our effective tax rate differs from the statutory U.S. income tax rate due to the effect of state and local income taxes, tax rates in foreign jurisdictions and certain nondeductible expenses. Our effective tax rate will change from quarter to quarter based on recurring and nonrecurring factors including, but not limited to, the geographical mix of earnings, state and local income taxes, tax audit settlements, the effect of various global tax strategies and enacted tax legislation, including certain business tax credits. Changes in judgment due to the evaluation of new information resulting in the recognition, derecognition or remeasurement of a tax position taken in a prior annual period are recognized separately in the quarter of the change.
26
Foreign Currency Fluctuations
The impact from foreign currency translation assumes constant foreign currency exchange rates based on the rates in effect for the current year period being used in translation for the comparable prior year period. We believe that providing the impact of fluctuations in foreign currency rates on certain financial results can facilitate analysis of period-to-period comparisons of business performance.
Fiscal Year
Our fiscal year is the fifty-two or fifty-three week period which ends on the Friday nearest September 30th. The fiscal year ended
October 3, 2014
was a fifty-three week period and the fiscal years ended
September 27, 2013
and
September 28, 2012
were each fifty-two week periods.
Results of Operations
The following tables present our sales and operating income from continuing operations, and the related percentages, attributable to each operating segment, for the
fiscal
years
2014
,
2013
and
2012
(dollars in millions). In the fourth quarter of 2014, the segment reporting structure was modified to align the segment reporting more closely with our management and internal reporting structure. Specifically, the Mexican operations have been combined with the FSS International segment. Previously, the Mexican operations were included in the FSS North America segment. All prior period segment information has been restated to reflect the new reporting structure. The financial effect of this segment realignment was not material for fiscal years 2014, 2013 and 2012.
|
Fiscal Year Ended
|
|||||||||||||||||||||
|
October 3, 2014
|
September 27, 2013
|
September 28, 2012
|
|||||||||||||||||||
|
Sales by Segment
|
$
|
%
|
$
|
%
|
$
|
%
|
|||||||||||||||
|
FSS North America
|
$
|
10,232.8
|
|
69
|
%
|
$
|
9,594.2
|
|
69
|
%
|
$
|
9,347.9
|
|
69
|
%
|
||||||
|
FSS International
|
3,111.2
|
|
21
|
%
|
2,940.2
|
|
21
|
%
|
2,794.8
|
|
21
|
%
|
|||||||||
|
Uniform
|
1,488.9
|
|
10
|
%
|
1,411.3
|
|
10
|
%
|
1,362.7
|
|
10
|
%
|
|||||||||
|
$
|
14,832.9
|
|
100
|
%
|
$
|
13,945.7
|
|
100
|
%
|
$
|
13,505.4
|
|
100
|
%
|
|||||||
|
Fiscal Year Ended
|
|||||||||||||||||||||
|
October 3, 2014
|
September 27, 2013
|
September 28, 2012
|
|||||||||||||||||||
|
Operating Income by Segment
|
$
|
%
|
$
|
%
|
$
|
%
|
|||||||||||||||
|
FSS North America
|
$
|
501.3
|
|
89
|
%
|
$
|
403.2
|
|
78
|
%
|
$
|
424.9
|
|
73
|
%
|
||||||
|
FSS International
|
106.2
|
|
19
|
%
|
68.1
|
|
13
|
%
|
90.6
|
|
16
|
%
|
|||||||||
|
Uniform
|
172.1
|
|
30
|
%
|
117.3
|
|
23
|
%
|
118.1
|
|
20
|
%
|
|||||||||
|
779.6
|
|
138
|
%
|
588.6
|
|
114
|
%
|
633.6
|
|
109
|
%
|
||||||||||
|
Corporate
|
(215.0
|
)
|
-38
|
%
|
(74.2
|
)
|
-14
|
%
|
(51.8
|
)
|
-9
|
%
|
|||||||||
|
$
|
564.6
|
|
100
|
%
|
$
|
514.4
|
|
100
|
%
|
$
|
581.8
|
|
100
|
%
|
|||||||
Fiscal
2014
Compared to Fiscal
2013
Consolidated Overview
Sales of
$14.8 billion
for
fiscal
2014
represented an increase of
6%
over the prior year. This increase is primarily attributable to growth across all sectors of the FSS North America segment, growth in the U.K., Germany, China, Chile and Argentina in our FSS International segment, growth in the uniform rental business in our Uniform segment and the estimated impact of the 53rd week (approximately 2%). This increase was partially offset by the negative impact of foreign currency translation (approximately -1%). Sales for fiscal 2013 were negatively impacted as a result of the National Hockey League ("NHL") lockout and the impact of Hurricane Sandy in our FSS North America segment.
Cost of services provided was
$13.4 billion
for
fiscal
2014
compared to
$12.7 billion
for the prior year period. Cost of services provided as a percentage of sales was 90% for fiscal 2014 compared to 91% in the prior year period. Food and support service costs comprised approximately 28% of Cost of services provided for fiscal 2014 compared to 27% for fiscal 2013, personnel costs comprised approximately 46% of Cost of services provided for fiscal 2014 compared to 47% for fiscal 2013, and other direct costs comprised the remaining approximately 26% of Cost of services provided in both periods. Cost of services provided was impacted by the items discussed below for operating income.
Operating income was
$564.6 million
for
fiscal
2014
compared to $
514.4 million
for the prior year, an increase of approximately 10%. This increase is primarily attributable to profit growth in all reportable segments, a decrease in acquisition-
27
related amortization expense and the estimated impact of the 53rd week (approximately 3%), which more than offset the increase in share-based compensation expense and the negative impact of foreign currency translation (approximately -1%). Fiscal 2014 includes an increase in share-based compensation expense of approximately $76.9 million, of which $50.9 million relates to the modification of performance-based options (see Note 10 to the audited consolidated financial statements), the loss on the sale of the McKinley Chalet Hotel (the "Chalet") of approximately $6.7 million (see Note 2 to the audited consolidated financial statements), cash bonuses and certain other expenses of approximately $5.0 million related to the completion of the IPO, net severance and related costs of $21.3 million during fiscal
2014
, expenses of approximately $32.3 million related to transformation initiatives and $26.9 million in rebranding costs. Operating income in fiscal 2013 includes $63.9 million of severance and related costs as a result of the series of actions we initiated in the second quarter of fiscal 2013 to drive efficiency through the consolidation and centralization of our operations. In addition, we also recorded approximately $11.7 million of goodwill impairment charges, other asset write-downs of approximately $12.0 million primarily related to the write-offs of certain client contractual investments and approximately $20.7 million of costs related to transformation initiatives. Fiscal 2013 also includes other income recognized of approximately $14.0 million relating to the recovery of our investment (possessory interest) at one of the National Park Service ("NPS") sites in the Sports, Leisure and Corrections sector, which was terminated in the prior year. Operating income for fiscal 2014 was negatively impacted by the severe winter weather in our FSS North America segment. Operating income for fiscal 2013 was negatively affected by the NHL lockout and Hurricane Sandy.
Interest and Other Financing Costs, net, for
fiscal
2014
decreased approximately
$89.0 million
from the prior year primarily due to the favorable interest rate impact of the debt refinancings during fiscal 2014 and fiscal 2013, lower average debt levels and lower refinancing fees. Interest and Other Financing Costs, net, for fiscal 2014 includes charges of $25.7 million in connection with the February 24, 2014, Aramark Services, Inc. Amendment Agreement ("2014 Amendment Agreement") to the Amended and Restated Credit Agreement dated as of March 26, 2010 (as amended, supplemented or otherwise modified from time to time, the “Credit Agreement”). Interest and Other Financing Costs, net, for fiscal 2013 includes charges of $39.8 million in connection with the tender offer and repayment of the 8.625% / 9.375% Senior Notes due 2016 ("Holdings Notes"), 8.50% senior notes due 2015 ("Fixed Rate Notes") and senior floating rate notes due 2015 ("Floating Rate Notes"), consisting of $12.9 million of third-party costs for the tender offer premium and $26.9 million of non-cash charges for the write-off of deferred financing costs. Interest and Other Financing Costs, net, for fiscal 2013 also includes approximately $11.6 million of third-party costs incurred related to Amendment Agreement No. 3 to the senior secured credit agreement and approximately $3.2 million of hedge ineffectiveness related to the repayment of the Canadian subsidiary's term loan with a maturity date of January 26, 2014.
The effective income tax rate for
fiscal
2014
was
34.9%
compared to
21.2%
in the prior year. The effective tax rate for fiscal 2014 includes the reduction of goodwill in connection with the sale of the Chalet that was not tax deductible. The effective tax rate for fiscal 2013 includes the extension of tax credits under the 2012 American Taxpayer Relief Act, non-tax deductible goodwill impairment charges and the reversal of tax reserves related to audit settlements in the first quarter of fiscal 2013.
Income from continuing operations for
fiscal
2014
was
$149.5 million
compared to
$71.4 million
in the prior year. Income (loss) from discontinued operations during
fiscal
2014
was $0 compared to
($1.0) million
in
fiscal
2013
. Net income attributable to noncontrolling interests for
fiscal
2014
was
$0.5 million
compared to
$1.0 million
in the prior year.
Segment Results
The following tables present a
fiscal
2014
to fiscal
2013
comparison of segment sales and operating income from continuing operations together with the amount of and percentage change between periods (dollars in millions).
|
Fiscal Year Ended
|
|||||||||||||||
|
Sales by Segment
|
October 3, 2014
|
September 27, 2013
|
$
|
%
|
|||||||||||
|
FSS North America
|
$
|
10,232.8
|
|
$
|
9,594.2
|
|
$
|
638.6
|
|
7
|
%
|
||||
|
FSS International
|
3,111.2
|
|
2,940.2
|
|
171.0
|
|
6
|
%
|
|||||||
|
Uniform
|
1,488.9
|
|
1,411.3
|
|
77.6
|
|
5
|
%
|
|||||||
|
$
|
14,832.9
|
|
$
|
13,945.7
|
|
$
|
887.2
|
|
6
|
%
|
|||||
|
Fiscal Year Ended
|
|||||||||||||||
|
Operating Income by Segment
|
October 3, 2014
|
September 27, 2013
|
$
|
%
|
|||||||||||
|
FSS North America
|
$
|
501.3
|
|
$
|
403.2
|
|
$
|
98.1
|
|
24
|
%
|
||||
|
FSS International
|
106.2
|
|
68.1
|
|
38.1
|
|
56
|
%
|
|||||||
|
Uniform
|
172.1
|
|
117.3
|
|
54.8
|
|
47
|
%
|
|||||||
|
Corporate
|
(215.0
|
)
|
(74.2
|
)
|
(140.8
|
)
|
190
|
%
|
|||||||
|
$
|
564.6
|
|
$
|
514.4
|
|
$
|
50.2
|
|
10
|
%
|
|||||
28
FSS North America Segment
The FSS North America reportable segment consists of four operating segments which have similar economic characteristics and are aggregated into a single operating segment. The four operating segments or sectors of the FSS North America reportable segment are Business & Industry, Education, Healthcare and Sports, Leisure and Corrections.
Sales for each of these sectors are summarized as follows (in millions):
|
Fiscal Year Ended
|
|||||||||
|
October 3, 2014
|
September 27, 2013
|
||||||||
|
Business & Industry
|
$
|
2,264.4
|
|
$
|
2,216.1
|
|
|||
|
Education
|
3,744.6
|
|
3,385.5
|
|
|||||
|
Healthcare
|
2,011.1
|
|
1,982.5
|
|
|||||
|
Sports, Leisure and Corrections
|
2,212.7
|
|
2,010.1
|
|
|||||
|
$
|
10,232.8
|
|
$
|
9,594.2
|
|
||||
The Healthcare and Education sectors generally have high-single digit operating margins and the Business & Industry and Sports, Leisure and Corrections sectors generally have mid-single digit operating margins.
FSS North America segment sales for
fiscal
2014
increased
7%
over the prior period, primarily due to growth in our Education and Sports, Leisure and Corrections sectors and the estimated impact of the 53rd week (approximately 2%).
The Business & Industry sector had a low-single digit sales increase for
fiscal
2014
primarily due to growth in our base business primarily related to a non-recurring facility project (approximately $70 million) and the estimated impact of the 53rd week (approximately 2%).
The Education sector had a double-digit sales increase for
fiscal
2014
due to growth in our base business within our Higher Education food business, net new business in our K-12 food and facilities business and the estimated impact of the 53rd week (approximately 3%).
The Healthcare sector had a low-single digit sales increase for
fiscal
2014
. This was driven by net new business in our hospitality business and the estimated impact of the 53rd week (approximately 2%), which more than offset the impact of prior year lost business within our healthcare technologies business.
The Sports, Leisure and Corrections sector had a double-digit sales increase for
fiscal
2014
primarily due to base business growth in our stadiums and arenas, new business within our Corrections business and the estimated impact of the 53rd week (approximately 2%). This more than offset the impact of prior year lost business within the Major League Baseball stadiums we serve.
Cost of services provided was $9.3 billion for
fiscal
2014
compared to $8.7 billion for the prior year period. Cost of services provided as a percentage of sales was 91% in both periods. Cost of services provided was impacted by the items discussed below for operating income.
Operating income for
fiscal
2014
was
$501.3 million
compared to
$403.2 million
in the prior year. This increase is primarily attributable to profit growth in our Sports, Leisure and Corrections and Business & Industry sectors and Higher Education business, the impact of our productivity initiatives, a net reduction in severance reserves as a result of refinements to our plan for consolidation and centralization initiatives and higher levels of actual attrition for the impacted workforce for fiscal 2014 and the estimated impact of the 53rd week (approximately 3%). FSS North America operating income for fiscal 2014 also includes a favorable risk insurance adjustment of $4.3 million related to favorable claims experience offset by the loss of approximately $6.7 million on the Chalet divestiture and the negative impact of severe winter weather. Operating income for fiscal 2013 includes $43.5 million of severance and related costs, $6.8 million of asset write-offs, approximately $15.2 million of costs related to transformation initiatives and the other income recognized of approximately $14.0 million relating to the recovery of our investment (possessory interest) at one of the NPS sites in the Sports, Leisure and Corrections sector, which was terminated in the prior year. Fiscal 2013 was also negatively affected by the NHL lockout and Hurricane Sandy.
FSS International Segment
Sales in the FSS International segment for
fiscal
2014
increased
6%
compared to the prior year period, as growth in the U.K., Germany, China, Chile and Argentina more than offset the negative impact of foreign currency translation (approximately -2%).
Cost of services provided was $2.9 billion for
fiscal
2014
compared to $2.8 billion in the prior year period. Cost of services provided as a percentage of sales was 94% in fiscal 2014 compared to 95% in fiscal 2013. Cost of services provided was impacted by the items discussed below for operating income.
29
Operating income for
fiscal
2014
was
$106.2 million
compared to
$68.1 million
in the prior year. This increase is primarily attributable to profit growth in the U.K., Germany, Chile and China and productivity initiatives in the current year. In fiscal 2013, there was $16.9 million of goodwill impairment charges and other asset write-offs and $2.3 million of costs related to transformation initiatives recorded. Operating income in fiscal 2014 and fiscal 2013 includes $23.6 million and $14.6 million of severance and related costs, respectively. Operating income for fiscal 2014 was negatively impacted by foreign currency translation (approximately -4%).
Uniform Segment
Uniform segment sales increased
5%
for
fiscal
2014
compared to the prior year, resulting primarily from growth in our uniform rental base business and the estimated impact of the 53rd week (approximately 2%).
Cost of services provided was $1.2 billion for
fiscal
2014
compared to $1.1 billion in the prior year period. Cost of services provided as a percentage of sales was 78% for
fiscal
2014
compared to 80% for the prior year period due to merchandise and plant productivity initiatives. Cost of services provided was impacted by the items discussed below for operating income.
Operating income for
fiscal
2014
was
$172.1 million
compared to
$117.3 million
in the prior year due to profit growth in the uniform rental business, merchandise and plant productivity initiatives and the decrease in acquisition-related amortization expense compared to the prior period. Operating income in fiscal 2014 and fiscal 2013 includes $2.2 million and $8.5 million of severance and related costs, respectively. Both periods also include favorable risk insurance adjustments related to favorable claims experience. Fiscal 2013 includes approximately $8.0 million of charges related to multiemployer pension plan withdrawals and a final settlement of wage and hour claims.
Corporate
Corporate expenses, those administrative expenses not allocated to the business segments, were
$215.0 million
in
fiscal
2014
, compared to
$74.2 million
for the prior year. The increase is primarily due to additional share-based compensation expense of approximately $76.9 million, of which $50.9 million related to a modification of the vesting provisions relating to outstanding performance-based options, cash bonuses and certain other expenses of approximately $5.0 million related to the completion of the IPO, approximately $24.0 million of rebranding initiatives and approximately $30.8 million of other transformation related expenses, primarily related to the establishment of our shared service center in Nashville, Tennessee.
Fiscal
2013
Compared to Fiscal
2012
Consolidated Overview
Sales of
$13.9 billion
for
fiscal
2013
represented an increase of
3%
over the prior year period. This increase is primarily attributable to growth in the Sports, Leisure and Corrections, Healthcare and Education sectors and the facilities business in the Business & Industry sector of the FSS North America segment, growth in Ireland, China, Chile and Argentina in our FSS International segment and growth in the uniform rental base business in our Uniform segment. This increase was partially offset by a sales decline in the U.K. in our FSS International segment. Sales for fiscal 2013 were negatively impacted as a result of the NHL lockout and the impact of Hurricane Sandy in our FSS North America segment and the spin-off of Seamless North America, LLC (“Seamless”) in October 2012 in the Business & Industry sector of the FSS North America segment.
Cost of services provided was
$12.7 billion
for
fiscal
2013
compared to
$12.2 billion
for the prior year period. Cost of services provided as a percentage of sales was 91% for
fiscal
2013
compared to 90% in the prior year period. Food and support service costs comprised approximately 27% of Cost of services provided for fiscal
2013
compared to 28% for fiscal
2012
, personnel costs comprised approximately 47% of Cost of services provided for both periods, and other direct costs comprised the remaining approximately 26% of Cost of services provided for fiscal
2013
as compared to 25% for fiscal
2012
. Cost of services provided was impacted by the items discussed below for operating income.
Operating income for
fiscal
2013
was
$514.4 million
compared to
$581.8 million
for the prior year period, a decrease of approximately 12%. The decline in operating income for
fiscal
2013
was primarily due to $63.9 million of severance and related costs as a result of the series of actions we initiated in the second quarter of fiscal 2013 to drive efficiency through the consolidation and centralization of its operations (see Note 3 to the audited consolidated financial statements). During fiscal 2013, we also recorded approximately $11.7 million of goodwill impairment charges (see Note 3 to the audited consolidated financial statements), other asset write-downs of approximately $12.0 million primarily related to the write-offs of certain client contractual investments and approximately $20.7 million of costs related to transformation initiatives. In addition, fiscal 2013 was also negatively affected by the NHL lockout and Hurricane Sandy. This profit decline was partially offset by profit growth in our Business & Industry and Education sectors and other income recognized of approximately $14.0 million relating to the recovery of our investment (possessory interest) at one of the NPS sites in the Sports, Leisure and Corrections sector, which was terminated during fiscal 2013. Fiscal 2012 includes other income recognized of $6.7 million relating to the recovery of the our investment (possessory interest) at one of the NPS sites in the Sports, Leisure and Corrections sector, which was terminated during fiscal 2012, a favorable risk insurance adjustment of $7.4 million related to favorable claims experience, of which $5.7
30
million relates to our Uniform segment, transition and integration costs of $4.9 million related to the Filterfresh acquisition and severance related charges of $6.9 million in the Uniform segment and FSS International segment.
Interest and other financing costs, net, for
fiscal
2013
decreased by approximately $33.0 million when compared to the prior year period. The decrease in fiscal
2013
was primarily due to the maturity of interest rate swaps during fiscal 2012 and the repurchase of the Holdings Notes, Fixed Rate Notes and Floating Rate Notes. Interest and Other Financing Costs, net, for fiscal 2013 includes charges of $39.8 million in connection with the tender offer and repayment of the Holdings Notes, Fixed Rate Notes and Floating Rate Notes, consisting of $12.9 million of third-party costs for the tender offer premium and $26.9 million of non-cash charges for the write-off of deferred financing costs. Interest and Other Financing Costs, net, for fiscal 2013 also includes approximately $11.6 million of third-party costs incurred related to Amendment Agreement No. 3 to the senior secured credit agreement and approximately $3.2 million of hedge ineffectiveness related to the repayment of the Canadian subsidiary’s term loan with a maturity date of January 26, 2014. Interest and Other Financing Costs, net, for fiscal 2012 includes $11.1 million of third-party costs related to Amendment Agreement No. 2 and the amendment of the Company’s Canadian subsidiary cross currency swap
The effective income tax rate for
fiscal
2013
was
21.2%
compared to
14.5%
in the prior year period. The increase is primarily due to the goodwill impairment charges in the second quarter of fiscal 2013 that were non-tax deductible which more than offset the impact of the work opportunity tax credits that were extended under the American Taxpayer Relief Act.
Income from continuing operations was
$71.4 million
during fiscal
2013
compared to
$106.9 million
in the prior year period. Income (loss) from discontinued operations was
($1.0) million
during fiscal 2013 compared to
$0.3 million
in the prior year period. Net income attributable to noncontrolling interests for fiscal
2013
was
$1.0 million
compared to
$3.6 million
in the prior year period.
Segment Results
The following tables present a fiscal
2013
to fiscal
2012
comparison of segment sales and operating income from continuing operations together with the amount of and percentage change between periods (in millions).
|
Fiscal Year Ended
|
||||||||||||||||
|
Sales by Segment
|
September 27, 2013
|
September 28, 2012
|
$
|
%
|
||||||||||||
|
FSS North America
|
$
|
9,594.2
|
|
$
|
9,347.9
|
|
$
|
246.3
|
|
3
|
%
|
|||||
|
FSS International
|
2,940.2
|
|
2,794.8
|
|
145.4
|
|
5
|
%
|
||||||||
|
Uniform
|
1,411.3
|
|
1,362.7
|
|
48.6
|
|
4
|
%
|
||||||||
|
$
|
13,945.7
|
|
$
|
13,505.4
|
|
$
|
440.3
|
|
3
|
%
|
||||||
|
Fiscal Year Ended
|
||||||||||||||||
|
Operating Income by Segment
|
September 27, 2013
|
September 28, 2012
|
$
|
%
|
||||||||||||
|
FSS North America
|
$
|
403.2
|
|
$
|
424.9
|
|
$
|
(21.7
|
)
|
-5
|
%
|
|||||
|
FSS International
|
68.1
|
|
90.6
|
|
(22.5
|
)
|
-25
|
%
|
||||||||
|
Uniform
|
117.3
|
|
118.1
|
|
(0.8
|
)
|
-1
|
%
|
||||||||
|
Corporate
|
(74.2
|
)
|
(51.8
|
)
|
(22.4
|
)
|
43
|
%
|
||||||||
|
$
|
514.4
|
|
$
|
581.8
|
|
$
|
(67.4
|
)
|
-12
|
%
|
||||||
FSS North America Segment
The FSS North America reportable segment consists of four operating segments which have similar economic characteristics and are aggregated into a single operating segment. The four operating segments or sectors of the FSS North America reportable segment are Business & Industry; Education; Healthcare; and Sports, Leisure and Corrections.
31
Sales for each of these sectors are summarized as follows (in millions):
|
Fiscal Year Ended
|
|||||||||
|
September 27, 2013
|
September 28, 2012
|
||||||||
|
Business & Industry
|
$
|
2,216.1
|
|
$
|
2,250.1
|
|
|||
|
Education
|
3,385.5
|
|
3,217.9
|
|
|||||
|
Healthcare
|
1,982.5
|
|
1,941.6
|
|
|||||
|
Sports, Leisure and Corrections
|
2,010.1
|
|
1,938.3
|
|
|||||
|
$
|
9,594.2
|
|
$
|
9,347.9
|
|
||||
The Education and Healthcare sectors generally have high-single digit operating margins while the Business & Industry and Sports, Leisure and Corrections sectors generally have mid-single digit operating margins.
FSS North America segment sales for
fiscal
2013
increased
3%
over the prior year period, primarily due to growth in the Sports, Leisure and Corrections, Healthcare and Education sectors and in the facilities business in the Business & Industry sector. Sales for fiscal 2013 were negatively impacted by the NHL lockout and Hurricane Sandy. The negative impact of acquisitions and divestitures was approximately -1% in fiscal 2013.
The Business & Industry sector had a low-single digit sales decline for
fiscal
2013
primarily due to the spin-off of Seamless in October 2012 and the impact of Hurricane Sandy on our business dining operations. This was somewhat offset by growth in our facilities business as a result of base and net new business growth.
The Education sector had mid-single digit sales growth for
fiscal
2013
due to base and net new business growth in our Higher Education and K-12 food and facilities businesses.
The Healthcare sector had low-single digit sales growth for
fiscal
2013
. This was primarily due to base business growth as net new business has been impacted by sector uncertainty.
The Sports, Leisure and Corrections sector had mid-single digit sales growth for
fiscal
2013
due to growth in our Major League Baseball venues. In addition, we have seen an increase in attendance and number of events in our amphitheaters. This growth was partially offset by the effect of the NHL lockout.
Cost of services provided was $8.7 billion for
fiscal
2013
compared to $8.5 billion for the prior year period. Cost of services provided as a percentage of sales was 91% in both periods. Cost of services provided was impacted by the items discussed below for operating income.
Operating income for
fiscal
2013
was
$403.2 million
compared to
$424.9 million
in the prior year period. The decrease in fiscal 2013 is due to approximately $43.5 million of severance and related costs, $6.8 million of asset write-offs and approximately $15.2 million of costs related to transformation initiatives, which more than offset the profit growth in our Business & Industry and Education sectors from food and labor productivity initiatives and the other income recognized of approximately $14.0 million relating to the recovery of the our investment (possessory interest) at one of the NPS sites in the Sports, Leisure and Corrections sector, which was terminated during fiscal 2013. Fiscal 2013 was also negatively affected by the NHL lockout and Hurricane Sandy. Operating income for fiscal 2012 includes other income recognized of $6.7 million relating to the recovery of the our investment (possessory interest) at one of the NPS sites in the Sports, Leisure and Corrections sector, which was terminated during fiscal 2012 and $4.9 million of transition and integration costs related to the Filterfresh acquisition.
FSS International Segment
Sales in the FSS International segment for
fiscal
2013
increased
5%
compared to the prior year period, as net new and base business growth in Chile, China, Argentina and Germany more than offset the sales decline in the U.K. as a result of the Olympics in the prior year (-2%) and prior year lost business.
Cost of services provided was $2.8 billion for
fiscal
2013
compared to $2.6 billion for the prior year period. Cost of services provided as a percentage of sales was 95% in fiscal 2013 compared to 94% in fiscal 2012. Cost of services provided was impacted by the items discussed below for operating income.
Operating income for
fiscal
2013
was
$68.1 million
compared to
$90.6 million
in the prior year period as profit growth in Chile and Germany was more than offset by $14.6 million of severance and related costs, $16.9 million of goodwill impairment charges and other asset write-offs and $2.3 million of costs related to transformation initiatives as well as the negative impact of foreign currency translation (approximately -3%).
Uniform Segment
Uniform segment sales increased
4%
for
fiscal
2013
compared to the prior year period primarily due to growth in our uniform rental base business.
32
Cost of services provided was $1.1 billion for both periods. Cost of services provided as a percentage of sales was 80% for fiscal 2013 compared to 79% for the prior year period. Cost of services provided was impacted by the items discussed below for operating income.
Operating income for
fiscal
2013
was
$117.3 million
compared to
$118.1 million
in the prior year period as growth in the uniform rental business and operational efficiencies across the segment were more than offset by $8.5 million of severance and related costs, which includes $3.7 million of severance related expenses recorded in the first quarter of fiscal 2013, and a net charge of approximately $6.5 million related to multiemployer pension withdrawals and a final settlement of wage and hour claims, net of a favorable risk insurance adjustment. Operating income for fiscal 2012 includes severance related charges of $2.6 million and a favorable risk insurance adjustment of $5.7 million.
Corporate
Corporate expenses, those administrative expenses not allocated to the business segments, were
$74.2 million
for
fiscal
2013
compared to
$51.8 million
for the prior year period. The increase is primarily due to the increase in share-based compensation expense for performance-based options and the issuance of restricted stock units, an accounting charge related to the retirement obligation to our current Chairman and former Chief Executive Officer, increase in consulting costs, approximately $1.0 million of severance and related costs and approximately $3.2 million of costs related to transformation initiatives.
Liquidity and Capital Resources
Overview
Our principal sources of liquidity are cash generated from operating activities, funds from borrowings and existing cash on hand. As of
October 3, 2014
, we had
$111.7 million
of cash and cash equivalents and approximately
$753.9 million
of availability under our senior secured revolving credit facility. As of October 3, 2014, there was approximately
$486.3
million of outstanding foreign currency borrowings.
We believe that our cash and cash equivalents and the unused portion of our committed credit availability under the senior secured revolving credit facility will be adequate to meet anticipated cash requirements to fund working capital, capital spending, debt service obligations, refinancings, dividends and other cash needs. We will continue to seek to invest strategically but prudently in certain sectors and geographies. Over time, we have repositioned our service portfolio so that today a significant portion of the operating income in our FSS North America segment comes from sectors and businesses which we believe to be economically less sensitive, such as Education, Healthcare and Corrections. In addition, we have worked to further diversify our international business by geography and sector. We routinely monitor our cash flow and the condition of the capital markets in order to be prepared to respond to changing conditions.
The table below summarizes our cash activity (in millions):
|
Fiscal Year Ended
|
|||||||||||
|
October 3, 2014
|
September 27, 2013
|
September 28, 2012
|
|||||||||
|
Net cash provided by operating activities
|
$
|
398.2
|
|
$
|
695.9
|
|
$
|
691.8
|
|
||
|
Net cash used in investing activities
|
(505.2
|
)
|
(385.4
|
)
|
(481.6
|
)
|
|||||
|
Net cash provided by (used in) financing activities
|
107.8
|
|
(336.3
|
)
|
(286.8
|
)
|
|||||
Reference to the audited Consolidated Statements of Cash Flows will facilitate understanding of the discussion that follows.
Cash Flows Provided by Operating Activities
During
fiscal
2014
, the increase in the total of net income and noncash charges results mainly from the overall growth of the business, improved operating results of our segments and the estimated impact of the 53rd week, as discussed above. As expected, working capital was a use of cash during
fiscal
2014
. The change in working capital requirements relates to changes in Accrued Expenses (approximately $274.6 million), related to payments for severance and related costs from the series of actions undertaken during fiscal 2013, the timing of payments for interest, commissions and payroll due to the 53rd week and medical insurance payments due to switching from being self-insured to a private exchange, Accounts Receivable (approximately $118.2 million), primarily due to business growth, mainly from the non-recurring facility project in the Business & Industry sector, and an increase in days sales outstanding, Accounts Payable (approximately $64.8 million) due to timing of disbursements and the increase in employee payroll tax withholding payments from exercises of share-based awards and Prepayments and other current assets (approximately $28.4 million) due to a change in tax method that impacts the timing of deductions. The "Other operating activities" caption reflects adjustments to net income in the current year and prior year periods related to nonoperating gains and losses, including goodwill write-offs and impairments and other financing related charges.
33
During
fiscal
2013
, the decrease in the total of net income and noncash charges results mainly from the results of operations. As expected and consistent with historical patterns, working capital was a source of cash for us during fiscal 2013. The change in working capital requirements relates principally to changes in Inventory (approximately $15.4 million) due to less inventory purchases in our Uniform segment offset by inventory purchases for new business in our Sports, Leisure and Corrections sector and Accrued Expenses (approximately $144.9 million) due to the severance and related costs from the series of actions undertaken to drive efficiency through the consolidation and centralization of its operations, timing of interest payments and timing of higher commission payments from increased business offset by Accounts Receivable (approximately $63.4 million) primarily due to business growth and the timing of collections, Prepayments (approximately $87.5 million) due to the timing of estimated tax payments and a change in tax regulations that impacts the timing of deductions allowable for certain in service inventory and Accounts Payable (approximately $9.5 million) primarily due to business growth and the timing of disbursements. The “Other operating activities” caption reflects adjustments to net income in the current year period related to nonoperating gains and losses, which are primarily non-cash and include goodwill impairments and other financing related charges and write-offs.
During fiscal 2012, the increase in the total of net income and noncash charges results mainly from the overall growth of the business and higher results of operations. As expected and consistent with historical patterns, working capital was a source of cash for us during fiscal 2012. The change in working capital requirements relates principally to changes in Accounts Receivable (approximately $66.7 million), primarily due to the improvement and timing of collections offset by the overall growth in the business, Accounts Payable (approximately $57.0 million), due to the timing of disbursements and Prepayments (approximately $41.4 million), primarily due to the timing of income tax payments, partially offset by changes in Inventory (approximately $24.3 million), primarily due to the growth of the business. The increase in the “Changes in other assets” caption is primarily due to $34.9 million of cash distributions received in fiscal 2012 from our 50% ownership interest in AIM Services Co., Ltd. The “Other operating activities” caption reflects adjustments to net income in the current year and prior year periods related to nonoperating gains and losses.
Cash Flows Used in Investing Activities
During
fiscal
2014
, the increase in purchases of property and equipment, client contract investments and other mainly relates to an increase in client contract investments resulting from new business wins and contract extensions, mainly within the Education sector. We also received proceeds of $24.0 million as a result of the sale of the Chalet in our Sports, Leisure and Corrections sector.
During
fiscal
2013
, we received proceeds of approximately $15.3 million related to the recovery of our investment (possessory interest) in certain assets at one of our NPS sites in our Sports, Leisure and Corrections sector.
During
fiscal
2012
, ARAMARK Refreshment Services, LLC, our subsidiary, acquired all of the outstanding shares of common stock of Van Houtte USA Holdings, Inc. (doing business as “Filterfresh”), a refreshment services company, for approximately $145.2 million. Under the terms of the purchase agreement, if a certain significant customer relationship was not maintained within a specific time frame, we were entitled to a refund of a portion of the purchase price. During fiscal 2012, we received a refund of approximately $7.4 million related to the termination of this customer relationship. We also received $5.5 million in cash related to the settlement of indemnity claims filed against the former owners of Masterplan, an acquisition that occurred during fiscal 2011. During fiscal 2012, we received proceeds of approximately $7.3 million related to the recovery of our investment (possessory interest) at one of our NPS sites in our Sports, Leisure and Corrections sector.
Cash Flows Provided by (Used In) Financing Activities
On December 17, 2013, the Company completed an IPO of
28.0 million
shares of its common stock at a price of
$20.00
per share raising approximately
$524.1 million
, net of costs directly related to the IPO. The Company used the net proceeds from the IPO to repay borrowings of approximately
$154.1 million
on the senior secured revolving credit facility that were borrowed during the first quarter of fiscal 2014 and
$370.0 million
on the senior secured term loan facility. During
fiscal
2014
, we paid dividends of approximately
$52.2 million
to our stockholders. The "Other financing activities" caption reflects financing related fees, distributions to noncontrolling interests and the excess tax benefit recorded on exercises of share-based awards.
Among other things, the 2014 Amendment Agreement provides for approximately $3,982.0 million in the aggregate of new term loans, $2,582.0 million of which have a maturity date of February 24, 2021 and $1,400.0 million of which have a maturity date of September 7, 2019. The term loans due on February 24, 2021 include €140.0 million of term loans denominated in euros, £115.0 million of term loans denominated in sterling and ¥5,042.0 million of term loans denominated in yen. The new term loans were borrowed on February 24, 2014 and the proceeds were used to refinance Aramark Services, Inc.'s existing term loans due 2016 and 2019 (with the exception of term loans due 2016 borrowed by Aramark Services, Inc.’s Canadian subsidiary in the amount of approximately $
75.0 million
, which remain outstanding). During fiscal 2014, approximately $22.9 million of lender fees and third-party costs directly attributable to the term loans of the 2014 Amendment Agreement were capitalized. The Company also recorded charges to "Interest and Other Financing Costs, net” during fiscal 2014 consisting of $13.1 million
34
of third party costs and $12.6 million of non-cash charges for the write-off of deferred financing costs and original issue discount.
The 2014 Amendment Agreement also provides for the extension, from January 26, 2017 to February 24, 2019, of the maturity of $565.0 million in revolving lender commitments of the existing $605.0 million revolving credit facility under the Credit Agreement. The 2014 Amendment Agreement also increased the revolving lender commitments by $165.0 million, for a total revolving credit facility of $770.0 million. During fiscal 2014, approximately $4.8 million of third-party costs directly attributable to the revolving credit facility of the 2014 Amendment Agreement were capitalized.
On December 20, 2012, Aramark Services, Inc. amended the senior secured credit agreement ("Amendment Agreement No. 3") to, among other things, borrow $670 million of new term loans to repay approximately $650 million of existing term loans and to fund certain discounts, fees and costs associated with the amendment. The existing term loans that were repaid in connection with Amendment Agreement No. 3 included U.S. dollar denominated term loans as well as non-U.S. dollar term loans. The new term loans were borrowed by Aramark Services, Inc. with an original issue discount of 0.25%. During fiscal 2013, approximately $11.6 million of third-party costs directly attributable to the amendment were expensed in “Interest and Other Financing Costs, net.”
On February 22, 2013, Aramark Services, Inc. amended the senior secured credit agreement (“Amendment Agreement No. 4”) to provide for, among other things, additional term loans and the extension of a portion of the revolving credit facility. On March 7, 2013, Aramark Services, Inc. borrowed $1,400 million of term loans pursuant to Amendment Agreement No. 4. The new term loans were borrowed by Aramark Services, Inc. with an original issue discount of 0.50% and mature on September 7, 2019. During fiscal 2013, approximately $14.0 million of third-party costs directly attributable to the term loans borrowed pursuant to Amendment Agreement No. 4 were capitalized, of which approximately $6.2 million were paid to entities affiliated with GS Capital Partners and J.P. Morgan Partners. Amendment Agreement No. 4 also provided for the extension, from January 26, 2015 to January 26, 2017, of the maturity of $500 million in revolving lender commitments of the existing $550 million revolving credit facility. Third-party costs directly attributable to the revolving credit facility of approximately $2.8 million were capitalized, of which approximately $0.6 million were paid to entities affiliated with GS Capital Partners and J.P. Morgan Partners.
On March 7, 2013, Aramark Services, Inc. issued $1,000 million of 5.75% Senior Notes due 2020 (the “Senior Notes”) pursuant to a new indenture, dated as of March 7, 2013 (the “Indenture”), entered into by Aramark Services, Inc. During fiscal 2013, approximately $13.8 million of third-party costs directly attributable to the Senior Notes were capitalized. Approximately $7.3 million of the third-party costs were paid to entities affiliated with GS Capital Partners and J.P. Morgan Partners.
In February 2013, the Company and Aramark Services, Inc. commenced a tender offer to purchase for cash any and all of the Holding Notes, Fixed Rate Notes and the Floating Rate Notes. On March 7, 2013, Aramark Services, Inc. used a portion of the aggregate proceeds of the Senior Notes offering and the borrowings under the new term loans pursuant to Amendment Agreement No. 4 to purchase all Notes tendered by March 6, 2013, the early tender date. On March 7, 2013, Aramark Services, Inc. issued redemption notices for the portions of Aramark Services, Inc.’s Fixed Rate Notes and the Floating Rate Notes that remained outstanding, including accrued and unpaid interest, as of March 7, 2013, which provided for the redemption of such notes on April 6, 2013 at prices of 100% of the principal amount thereof. On March 7, 2013, we issued a redemption notice for the portion of the Holding Notes that remained outstanding as of March 7, 2013, including accrued and unpaid interest, which notices provided for the redemption of these borrowings on May 1, 2013, at a price of 101% of the principal amount thereof. In connection with the tender offer and satisfaction and discharge of the Notes, we recorded $39.8 million of charges to “Interest and Other Financing Costs, net” in the Consolidated Statements of Income for fiscal 2013, consisting of $12.9 million cash charges for the tender offer premium and $26.9 million of non-cash charges for the write-off of deferred financing costs.
During
fiscal
2013
, Aramark Services, Inc. made a payment of $265.0 million on the outstanding U.S. dollar term loan. During fiscal 2013, the Company completed the spin-off of its majority interest in Seamless to its stockholders. We distributed cash of approximately $47.4 million to Seamless prior to the spin-off.
During
fiscal
2012
, our 5.00% Senior Notes, contractually due in June 2012, were paid in full. Also during fiscal 2012, we paid an amendment fee of approximately $3.2 million and third-party costs of approximately $7.5 million related to Amendment Agreement No. 2 to the senior secured credit agreement, which extended the maturity date of an aggregate U.S. dollar equivalent of approximately $1,231.6 million of our term loans and $66.7 million of letter of credit deposits securing our synthetic letter of credit facility. Approximately $4.5 million of the third-party costs were paid to entities affiliated with GS Capital Partners and J.P. Morgan Partners.
Covenant Compliance
The Credit Agreement contains a number of covenants that, among other things, restrict our ability to: incur additional indebtedness; issue preferred stock or provide guarantees; create liens on assets; engage in mergers or consolidations; sell assets; pay dividends, make distributions or repurchase our capital stock; make investments, loans or advances; repay or repurchase any notes, except as scheduled or at maturity; create restrictions on the payment of dividends or other amounts to us
35
from our restricted subsidiaries; make certain acquisitions; engage in certain transactions with affiliates; amend material agreements governing the notes (or any indebtedness that refinances the notes); and fundamentally change our business. The Indenture governing our Senior Notes contains similar provisions. As of
October 3, 2014
, we were in compliance with these covenants.
Under the Credit Agreement and the Indenture governing our Senior Notes, we are required to satisfy and maintain specified financial ratios and other financial condition tests and covenants. Our continued ability to meet those financial ratios, tests and covenants can be affected by events beyond our control, and there can be no assurance that we will meet those ratios, tests and covenants.
These financial ratios, tests and covenants involve the calculation of certain measures that we refer to in this discussion as “Covenant EBITDA” and “Covenant Adjusted EBITDA.” Covenant EBITDA and Covenant Adjusted EBITDA are not measurements of financial performance under U.S. GAAP. Covenant EBITDA is defined as net income (loss) of Aramark Services, Inc. and its restricted subsidiaries plus interest and other financing costs, net, provision (benefit) for income taxes, and depreciation and amortization. Covenant Adjusted EBITDA is defined as Covenant EBITDA, further adjusted to give effect to adjustments required in calculating covenant ratios and compliance under our Credit Agreement and the Indenture.
Our presentation of these measures has limitations as an analytical tool, and should not be considered in isolation or as a substitute for analysis of our results as reported under U.S. GAAP. You should not consider these measures as alternatives to net income or operating income determined in accordance with U.S. GAAP. Covenant EBITDA and Covenant Adjusted EBITDA, as presented by us, may not be comparable to other similarly titled measures of other companies because not all companies use identical calculations.
The following is a reconciliation of net income attributable to Aramark Services, Inc. stockholder, which is a U.S. GAAP measure of Aramark Services, Inc.’s operating results, to Covenant Adjusted EBITDA as defined in our debt agreements. The terms and related calculations are defined in the Credit Agreement and the Indenture governing our Senior Notes. Covenant EBITDA and Covenant Adjusted EBTIDA are measures of Aramark Services, Inc. and its restricted subsidiaries only and do not include the results of Aramark.
|
Fiscal Year Ended
|
|||||||||||||
|
(in millions)
|
October 3, 2014
|
September 27, 2013 |
September 28, 2012 |
||||||||||
|
Net income attributable to Aramark Services, Inc. stockholder
|
$
|
149.0
|
|
$
|
102.1
|
|
$
|
138.3
|
|
||||
|
Interest and other financing costs, net
|
334.9
|
|
372.8
|
|
401.7
|
|
|||||||
|
Provision for income taxes
|
80.2
|
|
38.4
|
|
38.8
|
|
|||||||
|
Depreciation and amortization
|
521.6
|
|
542.1
|
|
529.2
|
|
|||||||
|
Covenant EBITDA
|
1,085.7
|
|
1,055.4
|
|
1,108.0
|
|
|||||||
|
Share-based compensation expense
(1)
|
96.3
|
|
19.4
|
|
15.7
|
|
|||||||
|
Unusual or non-recurring (gains)/losses
(2)
|
2.9
|
|
8.7
|
|
(6.7
|
)
|
|||||||
|
Pro forma EBITDA for equity method investees
(3)
|
18.8
|
|
21.0
|
|
26.0
|
|
|||||||
|
Pro forma EBITDA for certain transactions
(4)
|
—
|
|
—
|
|
(0.1
|
)
|
|||||||
|
Seamless North America, LLC EBITDA
(5)
|
—
|
|
(1.6
|
)
|
(17.5
|
)
|
|||||||
|
Other
(6)
|
28.3
|
|
76.1
|
|
10.3
|
|
|||||||
|
Covenant Adjusted EBITDA
|
$
|
1,232.0
|
|
$
|
1,179.0
|
|
$
|
1,135.7
|
|
||||
|
(1)
|
Represents share-based compensation expense resulting from the application of accounting for stock options, restricted stock units, performance stock units, Installment Stock Purchase Opportunities and deferred stock unit awards (see Note 10 to the audited consolidated financial statements).
|
|
(2)
|
Fiscal 2014 includes a loss of approximately $6.7 million related to the sale of the Chalet, a gain from proceeds from the impact of Hurricane Sandy and other income related to our investment (possessory interest) at one of our NPS client sites. Fiscal 2013 includes goodwill impairment charges in Spain and Korea, asset write-downs mainly related to client contract investments and other income related to the Company's investments (possessory interests) at one of our terminated NPS client sites. Fiscal 2012 includes other income related to the recovery of our investment (possessory interest) at one of our NPS sites.
|
|
(3)
|
Represents our estimated share of EBITDA from our AIM Services Co., Ltd. equity method investment not already reflected in our Covenant EBITDA. EBITDA for this equity method investee is calculated in a manner consistent with consolidated Covenant EBITDA but does not represent cash distributions received from this investee.
|
36
|
(4)
|
Represents the annualizing of estimated EBITDA from acquisitions and divestitures made during the period.
|
|
(5)
|
During the third quarter of fiscal 2011, we sold a noncontrolling ownership interest in Seamless North America, LLC. The terms of the sale agreement stipulated that Seamless North America, LLC cease to qualify as an unrestricted Subsidiary under the Credit Agreement, and as a result, its EBITDA for all periods presented must be excluded from our consolidated Covenant Adjusted EBITDA.
|
|
(6)
|
Other includes certain other miscellaneous items (primarily severance related expenses).
|
Our covenant requirements and actual ratios for the twelve months ended
October 3, 2014
are as follows:
|
Covenant
Requirements |
Actual
Ratios |
|||
|
Maximum Consolidated Secured Debt Ratio
(1)
|
5.50
|
|
3.50
|
|
|
Interest Coverage Ratio (Fixed Charge Coverage Ratio)
(2)
|
2.00
|
|
4.16
|
|
|
(1)
|
Our Credit Agreement requires us to maintain a maximum Consolidated Secured Debt Ratio, defined as consolidated total indebtedness secured by a lien to Covenant Adjusted EBITDA, of 5.875x, being reduced over time to 5.125x. Consolidated total indebtedness secured by a lien is defined in the Credit Agreement as total indebtedness outstanding under the Credit Agreement, capital leases, advances under the Receivables Facility and any other indebtedness secured by a lien reduced by the lesser of the amount of cash and cash equivalents on our balance sheet that is free and clear of any lien and $75 million. Non-compliance with the maximum Consolidated Secured Debt Ratio could result in the requirement to immediately repay all amounts outstanding under such agreement, which, if our revolving credit facility lenders failed to waive any such default, would also constitute a default under our indenture.
|
|
(2)
|
Our Credit Agreement establishes an incurrence-based minimum Interest Coverage Ratio, defined as Covenant Adjusted EBITDA to consolidated interest expense, the achievement of which is a condition for us to incur additional indebtedness and to make certain restricted payments. If we do not maintain this minimum Interest Coverage Ratio calculated on a pro forma basis for any such additional indebtedness or restricted payments, we could be prohibited from being able to incur additional indebtedness, other than the additional funding provided for under the Credit Agreement and pursuant to specified exceptions, and make certain restricted payments, other than pursuant to certain exceptions. The minimum Interest Coverage Ratio is 2.00x for the term of the Credit Agreement. Consolidated interest expense is defined in the Credit Agreement as consolidated interest expense excluding interest income, adjusted for acquisitions and dispositions, further adjusted for certain non-cash or nonrecurring interest expense and our estimated share of interest expense from one equity method investee. The Indenture includes a similar requirement which is referred to as a Fixed Charge Coverage Ratio.
|
The Company and its subsidiaries, affiliates or significant stockholders may from time to time, in their sole discretion, purchase, repay, redeem or retire any of our outstanding debt securities (including any publicly issued debt securities), in privately negotiated or open market transactions, by tender offer or otherwise, or extend or refinance any of our outstanding indebtedness. The Company used the net proceeds from its IPO to repay borrowings of approximately $154.1 million on the senior secured revolving credit facility that were borrowed during the first quarter of fiscal 2014 and $370.0 million on the senior secured term loan facility.
37
The following table summarizes our future obligations for debt repayments, capital leases, estimated interest payments, future minimum rental and similar commitments under noncancelable operating leases as well as contingent obligations related to outstanding letters of credit and guarantees as of
October 3, 2014
(dollars in thousands):
|
|
Payments Due by Period
|
|||||||||||||||||||
|
Contractual Obligations as of October 3, 2014
|
Total
|
Less than
1 year
|
1-3 years
|
3-5 years
|
More than
5 years
|
|||||||||||||||
|
Long-term borrowings
(1)
|
$
|
5,410,213
|
|
$
|
76,771
|
|
$
|
486,282
|
|
$
|
1,396,811
|
|
$
|
3,450,349
|
|
|||||
|
Capital lease obligations
|
54,420
|
|
13,034
|
|
22,132
|
|
14,675
|
|
4,579
|
|
||||||||||
|
Estimated interest payments
(2)
|
1,179,300
|
|
224,100
|
|
435,400
|
|
389,400
|
|
130,400
|
|
||||||||||
|
Operating leases
|
641,416
|
|
235,049
|
|
180,784
|
|
120,199
|
|
105,384
|
|
||||||||||
|
Purchase obligations
(3)
|
483,990
|
|
300,612
|
|
114,733
|
|
22,736
|
|
45,909
|
|
||||||||||
|
Other long-term liabilities reflected on the balance sheet
(4)
|
291,354
|
|
44,200
|
|
14,300
|
|
8,800
|
|
224,054
|
|
||||||||||
|
$
|
8,060,693
|
|
$
|
893,766
|
|
$
|
1,253,631
|
|
$
|
1,952,621
|
|
$
|
3,960,675
|
|
||||||
|
|
|
Amount of Commitment Expiration Per Period
|
||||||||||||||||||
|
Other Commercial Commitments as of
October 3, 2014
|
Total
Amounts
Committed
|
Less than
1 year
|
1-3 years
|
3-5 years
|
More than
5 years
|
|||||||||||||||
|
Letters of credit
|
$
|
148,608
|
|
$
|
148,608
|
|
$
|
—
|
|
$
|
—
|
|
$
|
—
|
|
|||||
|
Guarantees
|
—
|
|
—
|
|
—
|
|
—
|
|
—
|
|
||||||||||
|
$
|
148,608
|
|
$
|
148,608
|
|
$
|
—
|
|
$
|
—
|
|
$
|
—
|
|
||||||
|
(1)
|
Excludes the $19.0 million discount on the term loans.
|
|
(2)
|
These amounts represent future interest payments related to our existing debt obligations based on fixed and variable interest rates specified in the associated debt agreements. Payments related to variable debt are based on applicable rates at
October 3, 2014
plus the specified margin in the associated debt agreements for each period presented. The amounts provided relate only to existing debt obligations and do not assume the refinancing or replacement of such debt. The average debt balance for each fiscal year from 2015 through 2021 is $5,007,000, $4,965,000, $4,875,300, $4,838,000, $4,731,800, $2,898,000 and $962,000, respectively. The average interest rate (after giving effect to interest rate swaps) for each fiscal year from 2015 through 2021 is 4.48%, 4.51%, 4.34%, 4.14%, 3.99%, 3.39% and 3.34%, respectively (See Note 5 to the audited consolidated financial statements for the terms and maturities of existing debt obligations).
|
|
(3)
|
Represents commitments for capital projects and client contract investments to help finance improvements or renovations at the facilities from which we operate.
|
|
(4)
|
Includes certain unfunded employee retirement obligations.
|
We have excluded from the table above uncertain tax liabilities due to the uncertainty of the amount and period of payment. As of
October 3, 2014
, we have gross uncertain tax liabilities of
$26.2 million
(see Note 8 to the audited consolidated financial statements). During
fiscal
2014
, we made contributions totaling
$23.8 million
into our defined benefit pension plans and benefit payments and settlements of $
16.6 million
out of these plans. Estimated contributions to our defined benefit pension plans in
fiscal
2015 are
$13.1 million
and estimated benefit payments out of these plans in
fiscal
2015 are
$11.6 million
(see Note 7 to the audited consolidated financial statements).
Prior to the IPO, pursuant to the Stockholders Agreement of the Company, upon termination of employment from us or one of our subsidiaries, members of our management (other than Mr. Neubauer) who held shares of common stock of the Company could have caused the Company to repurchase all of their initial investment shares (as defined) or shares acquired as a result of the exercise of Installment Stock Purchase Opportunities at appraised fair market value. Generally, payment for shares repurchased could have been, at the Company’s option, in cash or installment notes. The amount of this potential repurchase obligation had been classified outside of stockholders' equity. Upon completion of the IPO, the provision was terminated. The amount of common stock subject to repurchase as of
October 3, 2014
and
September 27, 2013
was $0 and $158.7 million, respectively.
We have an agreement (the "Receivables Facility") with several financial institutions whereby it sells on a continuous basis an undivided interest in all eligible accounts receivable, as defined in the Receivables Facility. Pursuant to the Receivables Facility, we formed ARAMARK Receivables, LLC, a wholly-owned, consolidated, bankruptcy-remote subsidiary. ARAMARK Receivables, LLC was formed for the sole purpose of transferring receivables generated by certain of our subsidiaries. Under the Receivables Facility, we and certain of our subsidiaries transfer without recourse all of their accounts receivable to ARAMARK Receivables, LLC. As collections reduce previously transferred interests, interests in new, eligible receivables are transferred to ARAMARK Receivables, LLC, subject to meeting certain conditions. In May 2014, we amended the Receivables
38
Facility to increase the maximum amount from
$300.0 million
to
$350.0 million
and extend the maturity date from January 2015 to May 2017. In addition, the Receivables Facility will now include a seasonal tranche which will increase the capacity by $25 million at certain times of the year. As of
October 3, 2014
, approximately
$350.0 million
was outstanding under the Receivables Facility and is included in “Long-Term Borrowings” in the Consolidated Balance Sheets. Amounts borrowed under the Receivables Facility fluctuate monthly based on our funding requirements and the level of qualified receivables available to collateralize the Receivables Facility.
Our business activities do not include the use of unconsolidated special purpose entities, and there are no significant business transactions that have not been reflected in the accompanying financial statements. We are self-insured for a limited portion of the risk retained under our general liability and workers’ compensation arrangements. Self-insurance reserves are recorded based on actuarial analyses.
Critical Accounting Policies and Estimates
Our significant accounting policies are described in the notes to the consolidated financial statements included in this Annual Report. As described in such notes, we recognize sales in the period in which services are provided pursuant to the terms of our contractual relationships with our clients. Sales from direct marketing activities are recognized upon shipment.
In preparing our financial statements, management is required to make estimates and assumptions that, among other things, affect the reported amounts of assets, liabilities, sales and expenses. These estimates and assumptions are most significant where they involve levels of subjectivity and judgment necessary to account for highly uncertain matters or matters susceptible to change, and where they can have a material impact on our financial condition and operating performance. If actual results were to differ materially from the estimates made, the reported results could be materially affected.
Asset Impairment Determinations
Goodwill and the Aramark trade name are indefinite lived intangible assets that are not amortizable and are subject to an impairment test that we conduct annually or more frequently if a change in circumstances or the occurrence of events indicates that potential impairment exists, using discounted cash flows. We perform the assessment of goodwill at the reporting unit level. Within our FSS International segment, each country is evaluated separately since these operating units are relatively autonomous and separate goodwill balances have been recorded for each entity. We have completed our annual goodwill and trade name impairment tests, which did not result in an impairment charge. Based on our evaluation at the date of our annual goodwill impairment test, the estimated fair value of each reporting unit exceeded its corresponding carrying amount, including goodwill.
With respect to our other long-lived assets, we are required to test for asset impairment whenever events or circumstances indicate that the carrying value of an asset may not be recoverable. If indicators of impairment are present, we compare the sum of the future expected cash flows from the asset, undiscounted and without interest charges, to the asset’s carrying value. If the sum of the future expected cash flows from the asset is less than the carrying value, an impairment would be recognized for the difference between the estimated fair value and the carrying value of the asset.
In making future cash flow analyses of various assets, we make assumptions relating to the following:
|
•
|
The intended use of assets and the expected future cash flows resulting directly from such use;
|
|
•
|
Comparable market valuations of businesses similar to Aramark's business segments;
|
|
•
|
Industry specific economic conditions;
|
|
•
|
Competitor activities and regulatory initiatives; and
|
|
•
|
Client and customer preferences and behavior patterns.
|
We believe that an accounting estimate relating to asset impairment is a critical accounting estimate because the assumptions underlying future cash flow estimates are subject to change from time to time and the recognition of an impairment could have a significant impact on our consolidated statement of income.
Environmental Loss Contingencies
Accruals for environmental loss contingencies (i.e., environmental reserves) are recorded when it is probable that a liability has been incurred and the amount can reasonably be estimated. We view the measurement of environmental reserves as a critical accounting estimate because of the considerable uncertainty surrounding estimation, including the need to forecast well into the future. We are involved in legal proceedings under federal, state, local and foreign environmental laws in connection with our operations or businesses conducted by our predecessors or companies that we have acquired. The calculation of environmental reserves is based on the evaluation of currently available information, prior experience in the remediation of contaminated sites and assumptions with respect to government regulations and enforcement activity, changes in remediation technology and practices, and financial obligations and creditworthiness of other responsible parties and insurers.
39
Litigation and Claims
From time to time, the Company and its subsidiaries are party to various legal actions, proceedings and investigations involving claims incidental to the conduct of our businesses, including those brought by clients, consumers, employees, government entities and third parties under, among others, federal, state, international, national, provincial and local employment laws, wage and hour laws, discrimination laws, immigration laws, human health and safety laws, import and export controls and customs laws, environmental laws, false claims or whistleblower statutes, procurement regulations, intellectual property laws, food safety and sanitation laws, cost and accounting principles, the Foreign Corrupt Practices Act, the U.K. Bribery Act, other anti-corruption laws, lobbying laws, motor carrier safety laws, data privacy laws and alcohol licensing and service laws, or alleging negligence and/or breach of contractual and other obligations. We consider the measurement of litigation reserves as a critical accounting estimate because of the significant uncertainty in some cases relating to the outcome of potential claims or litigation and the difficulty of predicting the likelihood and range of potential liability involved, coupled with the material impact on our results of operations that could result from litigation or other claims. In determining legal reserves, we consider, among other issues:
|
•
|
interpretation of contractual rights and obligations;
|
|
•
|
the status of government regulatory initiatives, interpretations and investigations;
|
|
•
|
the status of settlement negotiations;
|
|
•
|
prior experience with similar types of claims;
|
|
•
|
whether there is available insurance; and
|
|
•
|
advice of counsel.
|
Allowance for Doubtful Accounts
We encounter risks associated with sales and the collection of the associated accounts receivable. We record a provision for accounts receivable that are considered to be uncollectible. In order to calculate the appropriate provision, we analyze the creditworthiness of specific customers, aging of customer balances, general and specific industry economic conditions, industry concentrations, such as exposure to small and medium-sized businesses, the non-profit healthcare sector and the automotive, airline and financial services industries, and contractual rights and obligations. The accounting estimate related to the allowance for doubtful accounts is a critical accounting estimate because the underlying assumptions used for the allowance can change from time to time and uncollectible accounts could potentially have a material impact on our results of operations.
Inventory Obsolescence
We record an inventory obsolescence reserve for obsolete, excess and slow-moving inventory, principally in the Uniform segment. In calculating our inventory obsolescence reserve, we analyze historical and projected data regarding customer demand within specific product categories and makes assumptions regarding economic conditions within customer specific industries, as well as style and product changes. Our accounting estimate related to inventory obsolescence is a critical accounting estimate because customer demand in certain of our businesses can be variable and changes in our reserve for inventory obsolescence could materially affect our results of operations.
Income Taxes
We use the asset and liability method of accounting for income taxes. Under this method, income tax expense is recognized for the amount of taxes payable or refundable for the current year and for deferred tax liabilities and assets for the future tax consequences of events that have been recognized in our consolidated financial statements or tax returns. We must make assumptions, judgments and estimates to determine our current provision for income taxes and also our deferred tax assets and liabilities and any valuation allowance to be recorded against a deferred tax asset. Our assumptions, judgments and estimates relative to the current provision for income taxes take into account current tax laws, our interpretation of current tax laws and possible outcomes of current and future audits conducted by foreign and domestic tax authorities. Changes in tax law or our interpretation of tax laws and the resolution of current and future tax audits could significantly impact the amounts provided for income taxes in our consolidated financial statements. Our assumptions, judgments and estimates relative to the amount of deferred income taxes take into account estimates of the amount of future taxable income, and actual operating results in future years could render our current assumptions, judgments and estimates inaccurate. Any of the assumptions, judgments and estimates mentioned above could cause our actual income tax obligations to differ from our estimates.
*****
Critical accounting estimates and the related assumptions are evaluated periodically as conditions warrant, and changes to such estimates are recorded as new information or changed conditions require.
40
New Accounting Standard Updates
See Note 1 to the audited consolidated financial statements for a full description of recent accounting standard updates, including the expected dates of adoption.
Special Note About Forward-Looking Statements
This report includes “forward-looking statements” within the meaning of the Private Securities Litigation Reform Act of 1995 that reflect our current views as to future events and financial performance with respect to, without limitation, conditions in our industry, our operations, our economic performance and financial condition, including, in particular, statements relating to our business and growth strategy. These statements can be identified by the fact that they do not relate strictly to historical or current facts. They use words such as “outlook,” “aim,” “anticipate,” “are confident,” “estimate,” “expect,” “will be,” “will continue,” “will likely result,” “project,” “intend,” “plan,” “believe,” “see,” “look to” and other words and terms of similar meaning or the negative versions of such words.
Forward-looking statements speak only as of the date made. All statements we make relating to our estimated and projected earnings, costs, expenditures, cash flows, growth rates and financial results are forward-looking statements. In addition, we, through our senior management, from time to time make forward-looking public statements concerning our expected future operations and performance and other developments. These forward-looking statements are subject to risks and uncertainties that may change at any time, and, therefore, our actual results may differ materially from those that we expected. We derive many of our forward-looking statements from our operating budgets and forecasts, which are based upon many detailed assumptions. While we believe that our assumptions are reasonable, we caution that it is very difficult to predict the impact of known factors, and, of course, it is impossible for us to anticipate all factors that could affect our actual results. All subsequent written and oral forward-looking statements attributable to us, or persons acting on our behalf, are expressly qualified in their entirety by the cautionary statements. Some of the factors that we believe could affect our results include without limitation: unfavorable economic conditions; natural disasters, global calamities, sports strikes and other adverse incidents; the failure to retain current clients, renew existing client contracts and obtain new client contracts; a determination by clients to reduce their outsourcing or use of preferred vendors; competition in our industries; increased operating costs and obstacles to cost recovery due to the pricing and cancellation terms of our food and support services contracts; the inability to achieve cost savings through our cost reduction efforts; our expansion strategy; the failure to maintain food safety throughout our supply chain, food-borne illness concerns and claims of illness or injury; governmental regulations including those relating to food and beverages, the environment, wage and hour and government contracting; liability associated with noncompliance with applicable law or other governmental regulations; changes in, new interpretations of or changes in the enforcement of the government regulatory framework; currency risks and other risks associated with international operations, including Foreign Corrupt Practices Act, U.K. Bribery Act and other anti-corruption law compliance; continued or further unionization of our workforce; liability resulting from our participation in multiemployer defined benefit pension plans; risks associated with suppliers from whom our products are sourced; disruptions to our relationship with, or to the business of, our primary distributor; the inability to hire and retain sufficient qualified personnel or increases in labor costs; healthcare reform legislation; the contract intensive nature of our business, which may lead to client disputes; seasonality; disruptions in the availability of our computer systems or privacy breaches; failure to achieve and maintain effective internal controls; our leverage; the inability to generate sufficient cash to service all of our indebtedness; debt agreements that limit our flexibility in operating our business; potential conflicts of interest between certain of our controlling shareholders and us; and other factors set forth herein, including in Item 1A “Risk Factors,” Item 3“Legal Proceedings” and Item 7 “Management Discussion and Analysis of Financial Condition and Results of Operations" as such factors may be updated from time to time in our periodic filings with the SEC, which are accessible on the SEC’s website at www.sec.gov and which may be obtained by contacting Aramark’s investor relations department via its website www.aramark.com. Accordingly, there are or will be important factors that could cause actual outcomes or results to differ materially from those indicated in these statements. These factors should not be construed as exhaustive and should be read in conjunction with the other cautionary statements that are included in this report and in our other filings with the SEC. As a result of these risks and uncertainties, readers are cautioned not to place undue reliance on any forward-looking statements included herein or that may be made elsewhere from time to time by, or on behalf of, us. We undertake no obligation to publicly update or review any forward-looking statement, whether as a result of new information, future developments, changes in our expectations, or otherwise, except as required by law.
41
We are exposed to the impact of interest rate changes and manage this exposure through the use of variable-rate and fixed-rate debt and by utilizing interest rate swaps. We do not enter into contracts for trading purposes and do not use leveraged instruments. The information below summarizes our market risks associated with debt obligations and other significant financial instruments as of
October 3, 2014
(see Notes 5 and 6 to the audited consolidated financial statements). Fair values were computed using market quotes, if available, or based on discounted cash flows using market interest rates as of the end of the respective periods. For debt obligations, the table presents principal cash flows and related interest rates by contractual fiscal year of maturity. Variable interest rates disclosed represent the weighted-average rates of the portfolio at
October 3, 2014
. For interest rate swaps, the table presents the notional amounts and related weighted-average interest rates by fiscal year of maturity. The variable rates presented are the average forward rates for the term of each contract.
|
(US$ equivalent in millions)
|
||||||||||||||||||||||||||||||||
|
Expected Fiscal Year of Maturity
|
||||||||||||||||||||||||||||||||
|
As of October 3, 2014
|
2015
|
2016
|
2017
|
2018
|
2019
|
Thereafter
|
Total
|
Fair Value
|
||||||||||||||||||||||||
|
Debt:
|
||||||||||||||||||||||||||||||||
|
Fixed rate
|
$
|
13
|
|
$
|
14
|
|
$
|
9
|
|
$
|
8
|
|
$
|
7
|
|
$
|
1,005
|
|
$
|
1,056
|
|
$
|
1,085
|
|
||||||||
|
Average interest rate
|
5.0
|
%
|
5.0
|
%
|
5.0
|
%
|
5.0
|
%
|
5.0
|
%
|
5.8
|
%
|
5.7
|
%
|
||||||||||||||||||
|
Variable rate
|
$
|
77
|
|
$
|
103
|
|
$
|
383
|
|
(a)
|
$
|
40
|
|
$
|
1,356
|
|
$
|
2,450
|
|
$
|
4,409
|
|
$
|
4,357
|
|
|||||||
|
Average interest rate
|
7.7
|
%
|
3.7
|
%
|
1.5
|
%
|
3.3
|
%
|
3.3
|
%
|
3.3
|
%
|
3.3
|
%
|
||||||||||||||||||
|
Interest Rate Swaps:
|
||||||||||||||||||||||||||||||||
|
Receive variable/pay fixed
|
$
|
575
|
|
$
|
1,000
|
|
$
|
600
|
|
$
|
575
|
|
$
|
225
|
|
$
|
2,975
|
|
$
|
(34
|
)
|
|||||||||||
|
Average pay rate
|
3.2
|
%
|
1.6
|
%
|
1.7
|
%
|
2.0
|
%
|
2.9
|
%
|
||||||||||||||||||||||
|
Average receive rate
|
0.7
|
%
|
0.8
|
%
|
0.8
|
%
|
0.8
|
%
|
0.8
|
%
|
||||||||||||||||||||||
|
(a)
|
Balance includes $350 million of borrowings under the Receivables Facility.
|
As of
October 3, 2014
, the Company had foreign currency forward exchange contracts outstanding with notional amounts of
€13.4 million
,
£6.0 million
and CAD
74.8 million
to mitigate the risk of changes in foreign currency exchange rates on short-term intercompany loans to certain international subsidiaries. As of
October 3, 2014
, the fair value of these foreign exchange contracts is $0.4 million, which is included in "Prepayments and Other Current Assets" in our Consolidated Balance Sheets.
The Company entered into a series of pay fixed/receive floating gasoline and diesel fuel agreements based on the Department of Energy weekly retail on-highway index in order to limit its exposure to price fluctuations for gasoline and diesel fuel. As of
October 3, 2014
, the Company has contracts for approximately
6.2 million
gallons outstanding for fiscal 2015. As of
October 3, 2014
, the fair value of the Company’s gasoline and diesel fuel hedge agreements is $1.8 million, which is included in "Accounts Payable" in our Consolidated Balance Sheets.
See Financial Statements and Schedule beginning on page S-1.
Not applicable.
(a) Evaluation of Disclosure Controls and Procedures
The Company’s management, with the participation of the Company’s Chief Executive Officer and Chief Financial Officer, evaluated the effectiveness of the Company’s disclosure controls and procedures (as that term is defined in Rules 13a-15(e) and 15d-15(e) under the Securities Exchange Act of 1934, as amended) as of the end of the period covered by this report. Based on that evaluation, management, with the participation of the Chief Executive Officer and Chief Financial Officer, concluded that the Company’s disclosure controls and procedures, as of the end of the period covered by this report, are functioning effectively to provide reasonable assurance that the information required to be disclosed by the Company in reports filed under the Securities Exchange Act of 1934 is recorded, processed, summarized and reported within the time periods specified in the SEC’s rules and forms. A controls system, no matter how well designed and operated, cannot provide absolute assurance that
42
the objectives of the controls system are met, and no evaluation of controls can provide absolute assurance that all control issues and instances of fraud, if any, within a company have been detected.
(b) Internal Control over Financial Reporting
The Annual Report on Form 10-K does not include a report of management's assessment regarding internal control over financial reporting or an attestation report of our independent registered public accounting firm due to a transition period established by the rules of the SEC for newly public companies. The Company is in the process of several productivity and transformation initiatives that include redesigning several key business processes in a number of areas, including transferring certain controls over financial reporting to a shared service center in Nashville, Tennessee.
(c) Change in Internal Control over Financial Reporting
No change in the Company’s internal control over financial reporting occurred during the Company’s fourth quarter of fiscal 2014 that has materially affected, or is reasonably likely to materially affect, the Company’s internal control over financial reporting.
Board of Directors Developments
On November 26, 2014, Joseph Neubauer, the Company’s current Chairman of the Board of Directors and former Chief Executive Officer, informed the Chairman of the Nominating and Corporate Governance Committee of the Board of Directors of his decision not to stand for re-election to the Board of Directors at the Company’s 2015 annual meeting of shareholders to be held in February 2015. In addition, on December 1, 2014, the Board elected Eric J. Foss, the Company’s Chief Executive Officer and President, to the position of Chairman to become effective immediately following the 2015 annual meeting. In addition, on December 1, 2014, our Board of Directors appointed Sanjeev Mehra as the Lead Director of the Board effective immediately following the 2015 annual meeting.
Disclosure Pursuant to Section 219 of the Iran Threat Reduction and Syria Human Rights Act of 2012
Pursuant to Section 219 of the Iran Threat Reduction and Syria Human Rights Act of 2012, which added Section 13(r) to the Securities Exchange Act of 1934, as amended (the “Exchange Act”), an issuer is required to disclose in its annual or quarterly reports, as applicable, whether it or any of its “affiliates” knowingly engaged in certain specified activities during the period covered by the report. Disclosure is generally required even where the activities, transactions or dealings were conducted in compliance with applicable law. Because the SEC defines the term “affiliate” broadly, it includes any entity controlled by us as well as any person or entity that controls us or is under common control with us (“control” is also construed broadly by the SEC). We are not presently aware that we and our consolidated subsidiaries have knowingly engaged in any transaction or dealing reportable under Section 13(r) of the Exchange Act during the fiscal year ended October 3, 2014. In addition, we sought confirmation from our Sponsors with respect to companies that may be considered our affiliates as to whether they have knowingly engaged in any such reportable transactions or dealings during such period and, except as described below, are not presently aware of any such reportable transactions or dealings by such companies.
JP Morgan
Investment funds associated with or designated by J.P. Morgan Partners, LLC own shares of our common stock, and we were informed that JPMorgan Chase & Co. (“JPMorgan”) included disclosure, as reproduced below, in its quarterly reports on Form 10-Q and Annual Report on Form 10-K as filed with the SEC during the Company’s fiscal year ended October 3, 2014 as required by Section 13(r) of the Exchange Act. We have no involvement in or control over the activities of this company or any of its subsidiaries, and we have not independently verified or participated in the preparation of JPMorgan’s disclosure.
Disclosure from Quarterly Report on Form 10-Q, filed with the SEC on November 1, 2013
“Carlson Wagonlit Travel (“CWT”), a business travel management firm in which JPMorgan Chase has invested through its merchant banking activities, may be deemed to be an affiliate of the Firm, as that term is defined in Exchange Act Rule 12b-2. CWT has informed the Firm that, during the three month period ended September 30, 2013, it booked approximately 6 flights (of the approximately 15 million transactions it booked during the period) to Iran on Iran Air for passengers. All of such flights originated outside of the United States from countries that permit travel to Iran, and none of such passengers were persons designated under Executive Orders 13224 or 13382 at the time of travel or were employees of foreign governments that are targets of U.S. sanctions. CWT and the Firm believe that this activity is permissible pursuant to certain exemptions from U.S. sanctions for travel-related transactions under the International Emergency Economic Powers Act, as amended. CWT had approximately $3,000 in gross revenues attributable to these transactions. CWT has
informed the Firm that it intends to continue to engage in this activity so long as such activity is permitted under U.S. law.”
43
Disclosure from Annual Report on Form 10-K, filed with the SEC on February 20, 2014
“Carlson Wagonlit Travel (“CWT”), a business travel management firm in which JPMorgan Chase has invested through its merchant banking activities, may be deemed to be an affiliate of the Firm, as that term is defined in Exchange Act Rule 12b-2. CWT has informed the Firm that, during the year ended December 31, 2013, it booked approximately 15 flights (of the approximately 60 million transactions it booked in 2013) to Iran on Iran Air for passengers, including employees of foreign governments and non-governmental organizations. All of such flights originated outside of the United States from countries that permit travel to Iran, and none of such passengers were persons designated under Executive Orders 13224 or 13382 or were employees of foreign governments that are targets of U.S. sanctions. CWT and the Firm believe that this activity is permissible pursuant to certain exemptions from U.S. sanctions for travel-related transactions under the International Emergency Economic Powers Act, as amended. CWT had approximately $10,000 in gross revenues attributable to these transactions. CWT has informed the Firm that it intends to continue to engage in this activity so long as such activity is permitted under U.S. law.”
Disclosure from Quarterly Report on Form 10-Q, filed with the SEC on August 4, 2014
“Carlson Wagonlit Travel (“CWT”), a business travel management firm in which JPMorgan Chase has invested through its merchant banking activities, may be deemed to be an affiliate of the Firm, as that term is defined in Exchange Act Rule 12b-2. CWT has informed the Firm that, during the three months ended June 30, 2014, it booked approximately 2 flights (of the approximately 15 million transactions it booked during the period) to Iran on Iran Air for passengers, including employees of foreign governments and/or non-governmental organizations. All of such flights originated outside of the United States from countries that permit travel to Iran, and none of such passengers were persons designated under Executive Orders 13224 or 13382 or were employees of foreign governments that are targets of U.S. sanctions. CWT and the Firm believe that this activity is permissible pursuant to certain exemptions from U.S. sanctions for travel-related transactions under the International Emergency Economic Powers Act, as amended. CWT had approximately $5,000 in gross revenues attributable to these transactions. CWT has informed the Firm that it intends to continue to engage in this activity so long as such activity is permitted under U.S. law.”
Disclosure from Quarterly Report on Form 10-Q, filed with the SEC on November 3, 2014
“During the reporting period, JPMorgan Chase Bank, N.A. processed one payment from Iran Air on behalf of a U.S. client into such client’s account at JPMorgan Chase Bank, N.A. Iran Air is designated pursuant to Executive Order 13382. This transaction was authorized by and conducted pursuant to a license from the Treasury Department’s Office of Foreign Assets Control (OFAC).
JPMorgan Chase Bank, N.A. charged a fee of USD 3.50 for this transaction. JPMorgan Chase Bank, N.A. has no current intention to continue such activities but may in the future engage in similar transactions for its clients to the extent permitted by U.S. law.”
Warburg Pincus LLC Disclosure
The description of the activities below has been provided to us by Warburg Pincus LLC (“WP”), affiliates of which: (i) beneficially own more than 10% of our outstanding common stock and/or are members of our board of directors and (ii) beneficially own more than 10% of the equity interests of, and have the right to designate members of the board of directors of Endurance International Group (“EIG”) and Santander Asset Management Investment Holdings Limited (“SAMIH”). EIG and SAMIH may therefore be deemed to be under common “control” with us; however, this statement is not meant to be an admission that common control exists.
The disclosure below relates solely to activities conducted by EIG and SAMIH and its non-U.S. affiliates that may be deemed to be under common “control” with us. The disclosure does not relate to any activities conducted by Aramark or by WP and does not involve our or WP’s management. Neither Aramark nor WP has had any involvement in or control over the disclosed activities of SAMIH or EIG, and neither Aramark nor WP has independently verified or participated in the preparation of the disclosure. Neither Aramark nor WP is representing as to the accuracy or completeness of the disclosure nor do we or WP undertake any obligation to correct or update it.
As to EIG:
Aramark understands that EIG’s affiliates intend to disclose in their next annual or quarterly SEC report that: “On July 2, 2013, the billing information for a subscriber account, or the Subscriber Account was updated to include Seyed Mahmoud Mohaddes, or Mohaddes. On September 16, 2013, the Office of Foreign Assets Control, or OFAC designated Mohaddes as a Specially Designated National, or SDN, pursuant to 31 C.F.R. Part 560.304. On or around September 26, 2014, during a routine compliance scan of new and existing subscriber accounts, EIG discovered that Mohaddes, a SDN, was named as an account contact for the Subscriber Account. EIG promptly suspended the Subscriber Account, locked the domain name IOCUKLTD.COM, which was registered to the Subscriber Account, and reported the domain name to OFAC as potentially the p
44
roperty of a SDN subject to blocking pursuant to Executive Order 13599. Since September 16, 2013, when Mohaddes was added to the SDN list, charges in the total amount of $120.35 were made to the Subscriber Account for web hosting and domain privacy services. EIG ceased billing for the Subscriber Account. To date, EIG has not received any correspondence from OFAC regarding this matter.”
“On July 10, 2014, OFAC designated each of Stars Group Holding, or Stars, and Teleserve Plus SAL, or Teleserve, as SDNs under Executive Order 13224, and their property became subject to blocking pursuant to the Global Terrorism Sanctions Regulations, 31 C.F.R. Part 594. On July 15, 2014, as part of EIG’s compliance review processes, they discovered that the domain names associated with each of Stars, STARSCOM.NET, and Teleserve, TELESERVEPLUS.COM, or collectively, the “Stars/Teleserve Domain Names, were registered through EIG’s platform. EIG immediately took steps to suspend and lock the Stars/Teleserve Domain Names to prevent them from being transferred or resolving to a website, and they promptly reported the Domain Names as potentially blocked property to OFAC. EIG did not generate any revenue from the Stars/Teleserve Domain Names between when they were added to the SDN list on July 10, 2014 and when EIG discovered that they were registered through EIG’s platform on July 15, 2014. To date, EIG has not received any correspondence from OFAC regarding the matter.”
“On July 15, 2014 during a compliance scan of all domain names on one of its platforms, EIG identified the domain name KAHANETZADAK.COM, or the Domain Name, which was listed as an ‘also known as,’ or AKA, of the entity Kahane Chai which operates as the American Friends of the United Yeshiva. Kahane Chai was designated as a SDN on November 2, 2001 pursuant to Executive Order 13224. Because the Domain Name was transferred into a customer account of one of EIG’s resellers, there was no direct financial transaction between EIG and the registered owner of the Domain Name. The Domain Name was suspended upon discovering it on their platform, and EIG reported the Domain Name to OFAC as potentially the property of a SDN. To date, EIG has not received any correspondence from OFAC regarding the matter.”
As to SAMIH:
Aramark understands that SAMIH’s affiliates intend to disclose in their next annual or quarterly SEC report that “an Iranian national, resident in the United Kingdom, who is currently designated by the United States under the Iranian Financial Sanctions Regulations and the Weapons of Mass Destruction Proliferators Sanctions Regulations (“NPWMD sanctions program”) , holds a mortgage and two investment accounts with Santander Asset Management UK Limited. No further drawdown has been made (or would be permitted) under this mortgage although Santander UK continues to receive repayment installments. In the nine months ended September 30, 2014, total revenue in connection with the mortgage was approximately £1,800 and net profits were negligible relative to the overall profits of Santander UK. The same Iranian national also holds two investment accounts with Santander UK. The accounts have remained frozen for the nine months ended September 30, 2014. The investment returns are being automatically reinvested, and no disbursements have been made to the customer. In the nine months ended September 30, 2014, the total revenue for the Banco Santander group in connection with the investment accounts was £190 and net profits were negligible relative to the overall profits of Banco Santander, S.A.”
“In addition, during the third quarter 2014, Santander UK identified two additional customers: a UK national designated by the U.S. under the NPWMD sanctions program who holds a business account, where no transactions have taken place. Such account is in the process of being closed. No revenue or profit has been generated. A second UK national designated by the US for reasons of terrorism held a personal current account and a personal credit card account in the third quarter 2014, both of which have now been closed. Although transactions have taken place on the current account during the reportable period, revenue and profits generated were negligible. No transactions have taken place on the credit card.”
45
Item 10.
Directors, Executive Officers and Corporate Governance
Executive Officers and Directors
The following table sets forth certain information regarding our executive officers and directors as of November 28, 2014:
|
Name
|
Age
|
Position
|
With the company since
|
|||
|
Joseph Neubauer
|
73
|
Chairman of the Board and Director
|
1979
|
|||
|
Eric J. Foss
|
56
|
Chief Executive Officer and President and Director
|
2012
|
|||
|
Lynn B. McKee
|
59
|
Executive Vice President, Human Resources
|
1980
|
|||
|
Christina Morrison
|
47
|
Senior Vice President, Finance
|
2013
|
|||
|
Joseph Munnelly
|
50
|
Senior Vice President, Controller and Chief Accounting Officer
|
2007
|
|||
|
Stephen Reynolds
|
56
|
Executive Vice President, General Counsel and Secretary
|
2012
|
|||
|
L. Frederick Sutherland
|
62
|
Executive Vice President and Chief Financial Officer
|
1980
|
|||
|
Karen A. Wallace
|
48
|
Vice President and Treasurer
|
2004
|
|||
|
Todd M. Abbrecht
|
46
|
Director
|
2007
|
|||
|
Lawrence T. Babbio, Jr.
|
69
|
Director
|
1999
|
|||
|
David A. Barr
|
51
|
Director
|
2013
|
|||
|
Leonard S. Coleman, Jr.
|
65
|
Director
|
1999
|
|||
|
Daniel J. Heinrich
|
58
|
Director
|
2013
|
|||
|
James E. Ksansnak
|
74
|
Director
|
1986
|
|||
|
Sanjeev Mehra
|
55
|
Director
|
2007
|
|||
|
Stephen P. Murray
|
52
|
Director
|
2007
|
|||
|
Stephen Sadove
|
63
|
Director
|
2013
|
|||
Joseph Neubauer has been our Chairman of the Board since April 1984. He served as our Chief Executive Officer from February 1983 to December 2003 and from September 2004 to May 2012. From January 2004 to September 2004, he served as our Executive Chairman. He was our President from April 1981 to May 1997. He currently is a director of Macy’s, Inc. and previously served as a director of Verizon Communications, Inc. and Wachovia Corporation.
Eric J. Foss has been our Chief Executive Officer and President since May 2012. Before joining us, Mr. Foss served as Chief Executive Officer of Pepsi Beverages Company from February 2010 until December 2011. Prior to that Mr. Foss served as Chairman and Chief Executive Officer of The Pepsi Bottling Group from 2008 until 2010; President and Chief Executive Officer from 2006 until 2007; and Chief Operating Officer from 2005 until 2006. Mr. Foss serves on the board of UDR, Inc. and CIGNA Corporation.
Lynn B. McKee has served as our Executive Vice President, Human Resources from May 2004 to August 2012 and from August 2013 to present. From August 2012 to August 2013, Ms. McKee served as our Executive Vice President, Human Resources and Communications. From January 2004 to May 2004, she was our Senior Vice President of Human Resources and from September 2001 to December 2003, she served as Senior Vice President of Human Resources for our Food and Support Services Group. From August 1998 to August 2001, she served as our Staff Vice President, Executive Development and Compensation. Ms. McKee serves on the board of directors of Bryn Mawr Bank Co.
Christina Morrison joined us in June 2013 as our Senior Vice President, Finance. Before joining us, Ms. Morrison served as Senior Vice President, Business and Financial Planning of Merck & Co., Inc. from November 2009 to June 2013. Prior to that, Ms. Morrison served as Senior Vice President, Chief Financial Officer of Wyeth Pharmaceuticals from July 2007 to October 2009 and as Vice President, U.S. Chief Financial Officer from 2005 to 2007; she served as Wyeth’s Vice President, New Business, Women’s Health Care from 2004 to 2005. From 2003 to 2004 Ms. Morrison was Executive Director, Strategic Planning of The Rouse Company. From 1989 to 2002 Ms. Morrison served in various capacities at Deutsche Bank’s Mergers and Acquisitions and Health Care Groups.
46
Joseph Munnelly joined us in September 2007 as Senior Vice President and Deputy Controller and was elected as our Senior Vice President and appointed Controller and Chief Accounting Officer effective March 2008. Prior to joining us, he served as Vice President and Corporate Controller at Unisys Corporation, a worldwide information technology services and solutions company, since 2005. Prior to that, he served as a partner at KPMG LLP in the Audit and Risk Advisory Services Practice. Prior to his tenure at KPMG, he spent 16 years with Arthur Andersen LLP, most recently as a partner in the Audit and Business Advisory practice.
Stephen R. Reynolds was appointed our Executive Vice President, General Counsel and Secretary, effective September 2012. Before joining us, Mr. Reynolds was an executive with Alcatel-Lucent for seven years, having most recently served as Senior Vice President and General Counsel from January 2006 to August 2012.
L. Frederick Sutherland became our Chief Financial Officer in May 1997. He has served as an Executive Vice President since May 1993. He served as Group Executive, Aramark Uniform and Career Apparel from June 2009 to August 2012. From May 1993 to May 1997, he also served as President of our Uniform Services division and from February 1991 to May 1993, he served as our Senior Vice President of Finance and Corporate Development. Mr. Sutherland served as our Treasurer from February 1984 to February 1991. Mr. Sutherland is a director of Consolidated Edison, Inc.
Karen A. Wallace became our Vice President and Treasurer in May 2012. From November 2010 to May 2012, she served as Staff Vice President and Assistant Treasurer. She joined us in December 2004 and was elected Assistant Treasurer in February 2005 and served in that role until November 2010. Before joining us, Ms. Wallace served as Assistant Treasurer of Armstrong World Industries.
Todd M. Abbrecht is a Managing Director of Thomas H. Lee Partners, L.P. Prior to joining Thomas H. Lee Partners in 1992, Mr. Abbrecht was in the Mergers and Acquisitions department of Credit Suisse First Boston. Mr. Abbrecht previously served on the board of directors of Warner Chilcott plc and Dunkin’ Brands Group, Inc. Mr. Abbrecht currently serves as a director of Fogo de Chão, Intermedix Corporation, inVentiv Health, Inc. and Party City.
Lawrence T. Babbio, Jr. is currently retired. He most recently served as a Senior Advisor to Warburg Pincus, a private equity firm, from June 2007 until March 2012. Previously, Mr. Babbio served as Vice Chairman and President of Verizon Communications, Inc., a telecommunications company, from 2000 until his retirement in April 2007. Mr. Babbio also served as Vice Chairman of Bell Atlantic Corporation, a telecommunications company, from 1995 until the formation of Verizon through the merger of Bell Atlantic and GTE Corporation, another telecommunications company, in July 2000; as President and Chief Operating Officer of Bell Atlantic from 1994 to 1995; and Chairman, Chief Executive Officer and President of Bell Atlantic Enterprises International, Inc. from 1991 to 1994. Mr. Babbio previously served on the board of directors of Hewlett-Packard Company and Verizon Communications, Inc.
David A. Barr has been a Partner of Warburg Pincus & Co. and a Member and Managing Director of Warburg Pincus LLC since January 2001. Prior to joining Warburg Pincus, Mr. Barr was a managing director at Butler Capital for more than 10 years and worked at Goldman Sachs. He currently serves on the board of Builders FirstSource, Inc and several private companies. Previously, he served as a director of The Neiman Marcus Group, Inc., TransDigm Group Incorporated and Polypore International, Inc.
Leonard S. Coleman, Jr. is currently retired. Mr. Coleman most recently served as a Senior Advisor to Major League Baseball from 1999 to December 2005. Mr. Coleman served as President of The National League of Professional Baseball Clubs from 1994 to 1999, having served since 1992 as Executive Director, Market Development of Major League Baseball. Previously, Mr. Coleman was a municipal finance banker for Kidder, Peabody & Company. Mr. Coleman is a director of Avis Budget Group, Inc., Omnicom Group Inc., Churchill Downs Incorporated and Electronic Arts Inc. He previously served on the board of directors of H.J. Heinz Company.
Daniel J. Heinrich most recently served as Executive Vice President and Chief Financial Officer at The Clorox Company from June 2009 to November 2011. He started with Clorox in 2001 as Vice President and Controller and served in that role until 2003. In 2003 he became Chief Financial Officer and from 2004 until June 2009, Senior Vice President and Chief Financial Officer. Prior to joining Clorox he was Senior Vice President and Treasurer of Transamerica Finance Corporation from 1996 to 2001; Senior Vice President, Controller and Treasurer of Granite Management Company from 1994 to 1996; Senior Vice President, Controller and Chief Accounting Officer of First Nationwide Bank from 1986 to 1994 and at Ernst & Young LLP from 1978 to 1986 as an accountant and then Senior Audit Manager. Mr. Heinrich serves on the board of directors of Energizer Holdings, Inc. and E.&J. Gallo Winery. He previously served on the board of Advanced Medical Optics, Inc.
James E. Ksansnak is currently retired. Mr. Ksansnak served as Chairman of the board of directors of Tasty Baking Company from May 2003 until May 2011. He was our vice chairman from May 1997 until March 2000. From February 1991 to May 1997, he was our executive vice president; from May 1986 to February 1991, he was our senior vice president; and from May
47
1986 to May 1997, he was our chief financial officer. Previously, Mr. Ksansnak also served on the board of directors of CSS Industries, Inc.
Sanjeev Mehra has been a Managing Director of Goldman, Sachs & Co.’s Principal Investment Area of its Merchant Banking Division since 1996 and is currently Vice Chairman of global private equity. He serves on the board of directors of Sungard Data Systems, Inc., and Interline Brands, Inc. and Mr. Mehra previously served on the board of directors of Hawker Beechcraft, Inc., Burger King Holdings, Inc. and KAR Auction Services, Inc.
Stephen P. Murray has been the President and Chief Executive Officer of CCMP Capital Advisors, LLC (“CCMP”) since March 2007. Currently, he serves on the board of directors of several private companies. Previously, Mr. Murray also served on the board of directors of AMC Entertainment Inc., Warner Chilcott plc, Cabela’s Incorporated and Generac Holdings, Inc.
Stephen Sadove is currently head of Stephen Sadove & Associates. He served as Chief Executive Officer of Saks Incorporated from 2006 until November 2013 and Chairman and CEO from 2007 until November 2013. He was Chief Operating Officer of Saks from 2004 to 2006. He started with Saks in 2002, serving as Vice Chairman of the board of directors and has been Chairman of the board since 2007. Prior to joining Saks, Mr. Sadove was with Bristol-Meyers Squibb Company from 1991 until 2002, first as President, Clairol from 1991 to 1996, then President, Worldwide Beauty Care from 1996 to 1997, then President, Worldwide Beauty Care and Nutritionals from 1997 to 1998, and finally, Senior Vice President and President, Worldwide Beauty Care. He was employed by General Foods Corporation from 1975 until 1991 in various managerial roles, most recently as Executive Vice President and General Manager, Desserts Division from 1989 until 1991. Mr. Sadove currently serves on the board of directors of Colgate-Palmolive Company, Ruby Tuesday, Inc. and J.C. Penney Company, Inc. He was previously a director of Equity Office Properties Trust.
Our executive officers are elected annually by the board of directors and serve at its discretion or until their successors are duly elected and qualified.
The Stockholders Agreement contains provisions relating to the nomination and election of directors. Pursuant to such agreement, Messrs. Abbrecht, Barr, Mehra and Murray were elected to the Board as a result of their respective relationships with certain of our Sponsors, Mr. Foss serves as a management stockholders’ representative and Mr. Neubauer is entitled to serve on our Board for as long as he and our employees collectively own 5% or more of our outstanding shares on a fully diluted basis.
In November 2014, the Board of Directors determined to nominate Irene M. Esteves as a director for election at the 2015 Annual Meeting of Stockholders. Ms. Esteves most recently served as Chief Financial Officer of Time Warner Cable Inc. from July 2011 to May 2013. She previously served as Executive Vice President and Chief Financial Officer of XL Group plc from May 2010 to June 2011. Prior to that position, Ms. Esteves was Senior Vice President and Chief Financial Officer of Regions Financial Corporation from April 2008 to February 2010. She currently serves as a director of Level 3 Communications, Inc. and previously served on the board of directors of Timberland Co., Johnson Diversey Inc. and tw telecom inc. With over 20 years of experience overseeing global finance, risk management, and corporate strategy for U.S. and multi-national companies, the Board believes Ms. Esteves will bring a strong strategic leadership, accounting and finance background to the Board.
Director Independence and Composition of the Board of Directors
Director Independence and Independence Determinations
Under our Corporate Governance Guidelines and NYSE rules, a director is not independent unless our board of directors affirmatively determines that he or she does not have a direct or indirect material relationship with the Company or any of its subsidiaries.
Our board of directors has established guidelines of director independence to assist it in making independence determinations, which conform to the independence requirements in the NYSE listing standards. In addition to applying these guidelines, which are set forth in our Corporate Governance Guidelines (which may be found on the Corporate Governance page of the Investor Relations section on our website at www.aramark.com), the board of directors will consider all relevant facts and circumstances in making an independence determination. Our Corporate Governance Guidelines provide that none of the following relationships will disqualify any director or nominee from being considered “independent” and such relationships will be deemed to be an immaterial relationship with Aramark:
|
•
|
A director’s or a director’s immediate family member’s ownership of five percent or less of the equity of an organization that has a relationship with Aramark;
|
|
•
|
A director’s service as an executive officer or director of or employment by, or a director’s immediate family member’s service as an executive officer of, a company that makes payments to or receives payments from Aramark for property or services in an amount which, in any fiscal year, is less than the greater of $1 million or two percent of such other company’s consolidated gross revenues; or
|
48
|
•
|
A director’s service as an executive officer of a charitable organization that received annual contributions from Aramark and its Foundation that have not exceeded the greater of $1 million or two percent of the charitable organization’s annual gross revenues (Aramark’s automatic matching of employee contributions will not be included in the amount of Aramark’s contributions for this purpose).
|
The policy of our board of directors is to review the independence of all directors at least annually. The Nominating Committee undertook its annual review of director independence and made a recommendation to our board of directors regarding director independence. As a result of this review, our board of directors affirmatively determined that each of Messrs. Babbio, Coleman, Heinrich, Ksansnak and Sadove is independent under the guidelines for director independence set forth in the our Corporate Governance Guidelines and for purposes of applicable NYSE standards. Our board of directors has also determined that each of Messrs. Babbio, Coleman, Heinrich, Ksansnak and Sadove is “independent” for purposes of Section 10A(m)(3) of the Securities Exchange Act of 1934, as amended (the “Exchange Act”).
Background and Experience of Directors
When considering whether directors have the experience, qualifications, attributes or skills, taken as a whole, to enable our board of directors to satisfy its oversight responsibilities effectively in light of our business and structure, the board of directors focused primarily on each person’s background and experience as reflected in the information discussed in each of the directors’ individual biographies set forth above. We believe that our directors provide an appropriate mix of experience and skills relevant to the size and nature of our business. In particular, the members of our board of directors considered the following important characteristics, among others:
Mr. Neubauer—our board considered his extensive history with and knowledge of the Company, his business experience both before and after he joined the Company and his experience serving on the boards of other public companies.
Mr. Foss—our board considered his extensive knowledge of the Company through his service as CEO and President, his business experience and his experience serving on boards of other public companies.
Mr. Abbrecht—our board considered his financial acumen and business leadership skills gained during his tenure at Thomas H. Lee Partners, L.P. and his experience serving on the boards of a number of other public companies, including his past performance as a board member of the Company.
Mr. Babbio—our board considered his strong business skills and experience, extensive knowledge of financial and operational matters and his service on boards of other public companies, including his long history of service as a board member of the Company.
Mr. Barr—our board considered his financial acumen and business leadership skills gained during his tenure at Warburg Pincus and his experience serving on the boards of a number of other public companies.
Mr. Coleman—our board considered his leadership roles, his long history of board service to the Company, his extensive experience as a board member of other public companies and his sports industry background.
Mr. Heinrich—our board considered his extensive financial and business background, including his tenure as chief financial officer of a public company.
Mr. Ksansnak—our board considered his extensive financial and business background, his food industry background, his long history with the Company, and his experience serving on the board of a number of public companies, including his past performance as a board member of the Company.
Mr. Mehra—our board considered his financial acumen and business leadership skills gained during his tenure at Goldman, Sachs & Co. and his experience serving on the boards of a number of other public companies, including his past performance as a board member of the Company.
Mr. Murray—our board considered his financial acumen and business leadership skills gained during his tenure at CCMP, and prior to that, at J.P. Morgan Partners, and his experience serving on the boards of a number of other public companies, including his past performance as a board member of the Company.
Mr. Sadove—our board considered his strong business skills and experience, his extensive knowledge of financial and operational matters in the retail industry and his service on boards of other public companies.
Controlled Company Exception
Certain stockholders beneficially own a majority of the voting power of all outstanding shares of our common stock. Under the NYSE corporate governance standards, a company of which more than 50% of the voting power is held by an individual, group or another company is a “controlled company” and may elect not to comply with certain corporate governance standards, including (1) the requirement that a majority of the board of directors consist of independent directors, (2) the requirement that
49
we have a compensation committee that is composed entirely of independent directors with a written charter addressing the committee’s purpose and responsibilities, (3) the requirement that we have a nominating and corporate governance committee that is composed entirely of independent directors with a written charter addressing the committee’s purpose and responsibilities and (4) the requirement for an annual performance evaluation of the nominating and corporate governance and compensation committees. We utilize certain of these exemptions and have not determined that we have a majority of independent directors on our board of directors; and have not determined that we have a nominating and corporate governance committee or a compensation committee that is composed entirely of independent directors. Accordingly, you will not have the same protections afforded to stockholders of companies that are subject to all of the NYSE corporate governance requirements. In the event that we cease to be a “controlled company,” we will be required to comply with these provisions within the transition periods specified in the NYSE corporate governance rules.
Board Committees
Our board of directors has five standing committees: the Audit and Corporate Practices Committee (the “Audit Committee”), the Compensation and Human Resources Committee (the “Compensation Committee”), the Nominating and Corporate Governance Committee (the “Nominating Committee”), the Finance Committee and the Stock Committee.
Each of our standing committees operates under a written charter approved by our board of directors. The charters of each of our standing committees are available on our website. The board and each of our standing committees, other than the Stock Committee, perform self-evaluations on an annual basis.
Our chief executive officer and president and other executive officers regularly report to the non-executive directors and the Audit, the Compensation, the Nominating and the Finance Committees to ensure effective and efficient oversight of our activities and to assist in proper risk management and the ongoing evaluation of management controls. The vice president of internal audit reports functionally and administratively to our chief financial officer and directly to the Audit Committee. We believe that the leadership structure of our board of directors provides appropriate risk oversight of our activities given the controlling interests held by certain of our stockholders.
Audit Committee
.
Our Audit Committee consists of Messrs. Ksansnak (Chairman), Coleman and Heinrich. Messrs. Coleman, Ksansnak and Heinrich qualify as independent directors under the NYSE corporate governance standards and the independence requirements of Rule 10A-3 of the Securities Exchange Act of 1934, as amended (the “Exchange Act”) and each of Messrs. Ksansnak and Heinrich qualifies as an “audit committee financial expert” as such term is defined in Item 407(d)(5) of Regulation S-K. Effective immediately following the filing of this annual report, Mr. Heinrich will become Chairman of the Audit Committee.
The purpose of the Audit Committee is to prepare the audit committee report required by the SEC to be included in our proxy statement and to assist our board of directors in overseeing and monitoring (1) the quality and integrity of our financial statements, (2) our compliance with legal and regulatory requirements, (3) our independent registered public accounting firm’s qualifications and independence, (4) the performance of our internal audit function and (5) the performance of our independent registered public accounting firm.
Compensation and Human Resources Committee.
Our Compensation and Human Resources Committee consists of Messrs. Murray (Chairman), Neubauer, Babbio, Coleman, Mehra and Sadove.
The purpose of the Compensation and Human Resources Committee is to assist our board of directors in discharging its responsibilities relating to (1) setting our compensation program and compensation of our executive officers and directors, (2) monitoring our incentive and equity-based compensation plans, (3) preparing the compensation committee report required to be included in our proxy statement under the rules and regulations of the SEC and (4) reviewing our contribution policy and practices for our retirement benefit plans.
Nominating and Corporate Governance Committee.
Our Nominating and Corporate Governance Committee consists of Messrs. Mehra (Chairman), Neubauer, Barr, Coleman and Sadove.
The purpose of our Nominating and Corporate Governance Committee is to assist our board of directors in discharging its responsibilities relating to (1) identifying individuals qualified to become new members of the board of directors, consistent with criteria approved by the board of directors, subject to the Stockholders Agreement; (2) reviewing the qualifications of incumbent directors to determine whether to recommend them for reelection and selecting, or recommending that the board of directors select, the director nominees for the next annual meeting of stockholders; (3) identifying board of directors members qualified to fill vacancies on any board of directors committee and recommending that the board of directors appoint the identified member or members to the applicable committee, subject to the Stockholders Agreement; (4) reviewing and recommending to the board of directors corporate governance principles applicable to us; (5) overseeing the evaluation of the board of directors and management; and (6) handling such other matters that are specifically delegated to the committee by the
50
board of directors from time to time. For more information on the Stockholders Agreement, see the disclosure under Item 13. “Certain Relationships and Related Transactions, and Director Independence.”
Finance Committee.
Our Finance Committee consists of Messrs. Abbrecht (Chairman), Neubauer, Babbio, Barr, Heinrich and Ksansnak.
The purpose of our Finance Committee is to assist our board of directors in discharging its responsibilities relating to the review of our long-term business direction and goals and the strategy for maintaining that direction and achieving those goals. In connection with its fulfillment of this responsibility, the Finance Committee reviews with management and recommends to the board of directors our overall financial plans, including capital expenditures, acquisitions and divestitures, securities issuances and incurrences of debt, and reviews the performance of our retirement benefit plans. It will also recommend to our board of directors specific transactions involving these matters, and it has been empowered by our board of directors to approve certain financial commitments and acquisitions and divestitures by us up to specified levels.
Stock Committee.
Our Stock Committee consists of Messrs. Coleman and Sadove.
The Stock Committee has authority to administer or grant approvals under our equity and incentive compensation plans and to approve specific equity transactions or incentive awards involving our officers and directors and us. The Stock Committee also approves performance targets under our Senior Executive Annual Performance Bonus Plan and equity compensation plans.
The remaining information called for by Item 10 will be included in the Company’s Proxy Statement for the 2015 Annual Meeting of Stockholders and is incorporated herein by reference.
Compensation Discussion and Analysis
Background
This compensation discussion and analysis provides information regarding our executive compensation programs for the following executive officers in fiscal 2014:
|
•
|
Eric J. Foss, our Chief Executive Officer and President;
|
|
•
|
L. Frederick Sutherland, our Executive Vice President and Chief Financial Officer;
|
|
•
|
Lynn B. McKee, our Executive Vice President, Human Resources;
|
|
•
|
Stephen R. Reynolds, our Executive Vice President, General Counsel and Secretary; and
|
|
•
|
Christina T. Morrison, our Senior Vice President, Finance.
|
Equity Compensation Background
Each of our named executive officers holds a substantial amount of equity in the Company that they were granted in connection with our 2007 Transaction or upon their commencement of employment with us, and through subsequent equity grants. Prior to June 2013, one-half of all stock options granted had a time-based vesting schedule and vest over a four-year period, provided that the employee continues to be employed by us. The other half of the stock options were performance-based and required, in addition to the elapse of certain time periods, that we achieve specified financial targets before those stock options will vest. See “Components of Executive Compensation-Equity Incentives.”
In fiscal 2013, the compensation committee reviewed our equity program and determined to align it more closely to that of large public companies, by utilizing restricted stock, time-based stock options and restricted stock units and discontinuing the grant of performance-based stock options and an uncommon type of stock option called an Installment Stock Purchase Opportunity, or an ISPO, which required upfront employee investment in accordance with the terms of the ISPO. Stock options and restricted stock units granted in fiscal 2013 are time-based and vest 25% per year over four years, provided that the named executive officer remains employed by us. This four-year pro rata vesting schedule supports our retention objective. Beginning in early fiscal 2014, we also began granting performance stock units, to directly link a portion of long term incentives to achievement of financial goals.
In November 2013, the compensation committee approved grants of restricted stock units to each of the named executive officers, which became effective at the time of our initial public offering. See “Components of Executive Compensation-Equity Incentives-Grants in Connection with our Initial Public Offering.”
The compensation committee made further grants of equity in late December 2013 to our named executive officers, in respect of fiscal 2013 equity compensation. Such grants consisted of performance stock units, vesting in one-third annual increments, subject to the achievement of an adjusted earnings per share target for the 2014 fiscal year, time-based stock options, vesting in
51
equal annual installments over a four-year period and time-based restricted stock units, vesting in equal annual installments over a four-year period.
Our Executive Compensation Policy
Our compensation programs are designed to support our overall commitment to continued growth and the provision of quality services to our clients and customers. Our programs are focused on three important goals:
|
•
|
Attraction and Retention-to enable us to recruit and retain the best performers;
|
|
•
|
Company and Individual Performance-to provide compensation levels consistent with the executive’s level of contribution and degree of accountability; and
|
|
•
|
Alignment and Stockholder Value Creation-to use performance measures consistent with our goals and to include a significant portion of incentive compensation to motivate business results and strengthen the connection between the long-term interests of our executives and the interests of stockholders by encouraging each executive to maintain a significant ownership interest in us.
|
Attraction and Retention
Our compensation programs are an integral part of attracting and retaining our named executive officers. When we are attracting new executives, we aim to be competitive with the overall market, while maintaining internal consistency in the compensation among executives at similar levels in the Company and building compensation packages that will motivate executives to leave their then current positions and join us. We primarily achieve retention through equity grants with multi-year vesting schedules. Our stock options, restricted stock units and performance stock units generally vest over three or four years, which encourages executives who receive these grants to remain with us.
Company and Individual Performance
Our business requires us to deliver exceptional, value-driven experiences to our clients and customers. Our compensation programs, particularly Senior Executive Performance Bonus Plan (the “Bonus Plan”) and the Amended and Restated Management Incentive Bonus Plan (the “MIB”), are designed to reward all executives, including our named executive officers, who perform to or exceed our standards by recognizing each executive’s scope of responsibilities, and management capabilities, and providing incentives to him or her to optimize Company-wide financial results including, among other measures, earnings before interest and taxes, or EBIT. In some cases, individual performance is also considered by the compensation committee in making decisions that depart from the general benchmarking targets.
Alignment and Stockholder Value Creation
We attempt to align our named executive officers’ and other executives’ goals with those of our clients, customers and stockholders. The interests of our named executive officers who hold a significant amount of stock, either due to their initial purchases in connection with the 2007 Transaction or their commencement of employment, or who have been granted significant equity, are strongly aligned with those of our stockholders. In addition, because historically 50% of stock options granted were subject to performance-based vesting as described below in “Components of Executive Compensation-Equity Incentives,” portions of the total number of stock options held by our named executive officers vest based on Company performance. Further, in December 2013, we began granting performance stock units subject to vesting based, in part, on the achievement of an adjusted earnings per share target. Therefore, if any executive helps us to achieve corporate EBIT growth and/or certain earnings per share targets, he or she has a direct impact on the vesting of a portion of his or her equity. This emphasis on long-term compensation underscores the importance of maintaining our executives’ focus on creating long-term success and sustained stockholder value.
The compensation committee has also instituted stock ownership guidelines for our named executive officers requiring that they obtain and maintain ownership of Aramark stock equal to two times (for Ms. Morrison) or three times (for Messrs. Sutherland and Reynolds and Ms. McKee) their base salaries. Mr. Foss is required under the terms of his employment letter agreement to retain shares of our common stock equal to six times his base salary. Our ownership guidelines further align the interests of our executives with those of our stockholders.
We also restrict hedging and pledging of Aramark stock. Our Securities Trading Policy prohibits our directors, executive officers and employees from engaging in hedging, speculative or other transactions that hedge or offset any decrease in the market value of Aramark stock without the consent of our board of directors and provided that the number of shares hedged does not exceed the total number of Aramark shares owned by the person. Prohibited transactions include, but are not limited to, trading in swaps, forwards, options and futures. In addition, our Securities Trading Policy provides that no Aramark director or executive officer may purchase Aramark stock on margin, or borrow against any account in which Aramark stock is held, or pledge the Aramark stock as collateral for a loan, without first obtaining pre-clearance from Aramark’s General Counsel. Approvals will be based on the particular facts and circumstances of the request, including, but not limited to, the percentage
52
amount that the securities being pledged represents of the total number of the Aramark shares held by the person making the request and the financial capacity of the person making the request. Our General Counsel is under no obligation to approve any request for pre-clearance and may determine not to permit the arrangement for any reason. To our knowledge, none of our directors or named executive officers or other executive officers has currently pledged Aramark stock.
Independence of the Compensation Consultant
Our compensation committee recognizes the importance of using an independent compensation consultant that is appropriately qualified and that provides services solely to our compensation committee and not to the Company. In November 2014, the compensation committee discussed various aspects of Frederic W. Cook & Co., Inc.’s relationship with the Company, the members of the compensation committee and our executive officers, and considered the following:
|
•
|
the provision of other services to the Company by Frederic W. Cook & Co., Inc.;
|
|
•
|
the amount of fees paid to Frederic W. Cook & Co., Inc. as a percentage of Frederic W. Cook & Co., Inc.’s total revenue;
|
|
•
|
the policies and procedures of Frederic W. Cook & Co., Inc. that are designed to prevent conflicts of interest;
|
|
•
|
any business or personal relationship between the consultant and a member of the compensation committee;
|
|
•
|
any Company stock owned by the consultant;
|
|
•
|
any business or personal relationship between the consultant and an executive officer of the Company;
|
|
•
|
any other factor deemed relevant to the consultant's independence from management.
|
Based upon information provided to the compensation committee, including, by Frederic W. Cook & Co., Inc., the compensation committee determined that no conflicts of interest have been raised in connection with the services Frederic W. Cook & Co., Inc. performed for the Company in fiscal 2014.
Role of Compensation Consultants
The compensation committee originally engaged Frederic W. Cook & Co., Inc. as its compensation consultant in October 2007 and has reengaged Frederic W. Cook & Co., Inc. each fiscal year since that time. Frederic W. Cook & Co., Inc. has provided us with market intelligence and guidance on compensation trends, along with general views on specific compensation programs being designed by our Human Resources management. While only the compensation committee may formally engage compensation consultants with respect to the compensation of executive officers and directors, our management may seek the advice of these or other compensation consultants from time to time with the approval of our compensation committee chairman. In addition, only the compensation committee has the right to terminate Frederic W. Cook & Co., Inc., its compensation consultant.
The compensation committee re-engaged Frederic W. Cook & Co., Inc. in November 2013 to assist in the evaluation of compensation for our named executive officers (other than Ms. Morrison) and our board of directors, as well as other compensation-related matters for fiscal 2014. In fiscal 2014, Frederic W. Cook & Co., Inc. assisted the compensation committee with the design of the Company’s post-IPO long-term incentive program and provided competitive data to assist the compensation committee with sizing equity awards to our named executive officers and the compensation of our directors.
In the past, Frederic W. Cook & Co., Inc. assisted the compensation committee with the configuration of our peer group of companies, which the compensation committee uses to benchmark or market check compensation for certain of our named executive officers. Since 2008, our peer group has consisted of Cintas, Compass Group PLC, Darden Restaurants, FedEx, Hertz, Manpower, Marriott, McDonald’s, RR Donnelley, Ryder System, Starbucks, Sysco, Tyco International, UPS, Waste Management and Yum Brands. In terms of size, our revenues approximate the median of the peer companies, our enterprise value is between the 25th percentile and the median and the number of our employees is between the median and the 75th percentile.
In November 2013, Frederic W. Cook & Co., Inc. performed a competitive review of 2013 compensation paid to Mr. Foss and the named executive officers who report directly to him to provide the compensation committee with information relating to the competitiveness of existing compensation and to assist the compensation committee with compensation decisions for fiscal 2014. In November 2013, for Mr. Foss, Frederic W. Cook & Co., Inc. benchmarked the individual components of his compensation and his total compensation against chief executive officers in our peer group as is required by his Employment Letter Agreement. For Mr. Sutherland, Frederic W. Cook & Co., Inc. performed a market check of individual components of his compensation, as well as his total compensation against other chief financial officers in our peer group. For Ms. McKee and Mr. Reynolds, Frederic W. Cook & Co., Inc. utilized a subset of the Towers Watson 2013 CDB General Industry Executive Compensation Survey - U.S. that relates to companies with over $10 billion in global corporate revenue (220 companies from the overall survey of 442 companies) (the “Survey Data” and together with our peer group data, “Market Practice”) to perform
53
a market check of the individual components of their compensation, as well as their total compensation. We do not consider any specific company included in the survey data to be a material factor in the review of the compensation of our named executive officers. Based on the 2013 review, named executive officer target total cash compensation was generally between the median and 75th percentile of Market Practice, which is consistent with our targeted competitive positioning, but reflects the experience, skill set and sustained performance of the named executive officers. Base salaries paid to our named executive officers in fiscal 2014 was generally between the median and 75th percentile of Market Practice and target bonus as a percentage of base salary generally approximated the median. Frederic W. Cook & Co., Inc.’s report, which was based upon 2012/2013 compensation data for the above-mentioned named executive officers, was utilized as one data point by the compensation committee to determine base salary and bonus targets for fiscal 2014.
In November 2014, Frederic W. Cook & Co., Inc. confirmed to the compensation committee that the design of the Company’s compensation programs is within the range of peer group practice and is balanced to provide annual and longer-term capital accumulation opportunities by way of salary, annual incentives and equity interests. As described below, in fiscal 2014, after evaluating current named executive officer compensation levels and Market Practice, Frederic W. Cook & Co., Inc. indicated that no significant changes to base salary levels of Messrs. Sutherland and Reynolds and Ms. McKee and Ms. Morrison were required in order to support the competitiveness of the Company’s compensation programs. Frederic W. Cook & Co., Inc. provided an updated report to the compensation committee in November 2014 containing updated Market Practice information, which the compensation committee used in making its compensation decisions for fiscal 2015. After reviewing the information provided by Frederic W. Cook & Co., Inc. and consideration of other factors, the compensation committee determined to make changes to the base salary levels and target bonus and long term incentive opportunities for Messrs. Sutherland and Reynolds and Ms. McKee to position their fiscal 2015 target total direct compensation between the median and 75
th
percentile of Market Practice.
Role of Compensation Committee and Executive Officers
The compensation committee is responsible for the oversight of our executive compensation program. The compensation committee or its subcommittee (in the case of equity grants and bonus plan payments to executive officers, subject to the approval of the stock committee) makes or approves all decisions concerning compensation awarded to our named executive officers.
Compensation decisions for Mr. Foss and the named executive officers who report directly to him (Messrs. Sutherland and Reynolds and Ms. McKee) are made differently than those for our other executive officers. Compensation recommendations for Ms. Morrison are made by Mr. Sutherland, who is her supervisor, with input from Ms. McKee.
Messrs. Foss, Sutherland and Reynolds and Ms. McKee
Mr. Foss joined us as our Chief Executive Officer and President in May 2012. Mr. Foss’ compensation package was based upon benchmarking data with regard to compensation paid to other chief executive officers in our peer group. Mr. Foss’ Employment Letter Agreement contains parameters for his compensation for fiscal 2013 and 2014. For fiscal 2014, the compensation committee was required to take into consideration Mr. Foss’ total annual compensation framework in respect of fiscal 2012 and 2013 (including the fact that his total annual compensation package has been targeted at the 75th percentile of the Company’s market peer group, the fact that his compensation included equity compensation and other relevant factors), and determine Mr. Foss’ actual total annual compensation package in good faith and based on Mr. Foss’ and the Company’s performance. For fiscal 2014, Mr. Foss’ base salary of $1,390,500, bonus of $3,100,000 and equity grants with a value of $22,500,000 (including his one-time IPO grant of RSUs with a grant date fair value of $10,000,000) exceeded the 75
th
percentile of our peer group of companies. The compensation committee determined to exceed the 75
th
percentile of the Company’s peer group with regard to Mr. Foss’ fiscal 2014 compensation to recognize Mr. Foss’ individual performance, his contributions to the Company’s performance, to further encourage retention and to further align Mr. Foss’ interests with long-term shareholder interests.
For fiscal 2014, our Human Resources department initially prepared a tally sheet for use by Frederic W. Cook & Co., Inc. in its analysis of the compensation of Mr. Foss and the named executive officers who are Mr. Foss’ direct reports (Messrs. Sutherland and Reynolds and Ms. McKee). The tally sheet contained the following information for Mr. Foss and each of our named executive officers who are direct reports of Mr. Foss: current base salary, bonus target and prior year’s bonus award, current year equity grant, if any, and current equity holdings. Frederic W. Cook & Co., Inc. used the information contained in the tally sheet, along with market data (relating to our peer group for Messrs. Foss and Sutherland and Survey Data for Ms. McKee and Mr. Reynolds) to prepare a compensation competitive review report to the compensation committee, which it provided directly to the chairman of the compensation committee. Frederic W. Cook & Co., Inc. then provided the report to Ms. McKee and discussed the report with the chairman of the compensation committee and Ms. McKee. With regard to bonus awards, our Human Resources department also prepared a report containing hypothetical bonus amounts that Messrs. Foss, Sutherland and Reynolds and Ms. McKee could have received under the MIB, which is the bonus plan available to other executives at the Company, based on business results, including revenue, EBIT and a group metric, as if they had been participants in the MIB.
54
For 2014 base salary recommendations, which were determined in November 2013, Ms. McKee engaged in discussions with Mr. Foss regarding Messrs. Sutherland’s and Reynolds’ proposed calendar 2014 base salaries. Following this consultation, Mr. Foss presented a recommendation for Ms. McKee’s base salary and Ms. McKee presented the recommendations for Messrs. Foss’, Sutherland’s and Reynolds’ base salaries, to the compensation committee for its consideration.
For fiscal 2014 bonuses, Ms. McKee engaged in discussions with Mr. Foss regarding a bonus recommendation for Messrs. Sutherland and Reynolds. Mr. Foss then presented bonus recommendations for Messrs. Sutherland and Reynolds and Ms. McKee directly to the compensation committee. The compensation committee met in executive session to discuss Mr. Foss’ fiscal 2014 bonus.
In November 2013, the compensation committee and the stock committee approved one-time grants of restricted stock units to each of our named executive officers, which became effective at the time of our initial public offering. With respect to these grants, Mr. Foss and Ms. McKee met with members of the compensation committee, including the chairman of the compensation committee, over a period of weeks prior to the grants to discuss their recommendations for the dollar amount of the pool of equity to be distributed, the particular executives who would receive restricted stock unit grants and the amount of such individual awards, which were based upon a multiple of the average of base salary and bonus target for each particular executive level. Mr. Foss and Ms. McKee made recommendations regarding the restricted stock unit award amounts for each of the named executive officers other than Mr. Foss. Mr. Foss made the recommendation for Ms. McKee. Recommended amounts were consistent for Company executives at similar levels. The compensation committee approved the recommendations of management for the named executive officers other than Mr. Foss and determined a grant amount for Mr. Foss based upon earlier compensation committee discussions. These grants are more fully described below in “Components of Executive Compensation - Equity Incentives.”
In fiscal 2013, Messrs. Sutherland and Reynolds and Ms. McKee received equity grants consisting of time-based stock options and restricted stock units that were generally based upon the 50th percentile of Market Practice for equity grants made to similarly situated executives, adjusted to maintain consistency among similarly situated Company executives. In making those grants, after input from Frederic W. Cook & Co., Inc. and discussions among the chairman of the compensation committee, Frederick W. Cook & Co., Inc. and Ms. McKee, the compensation committee was presented with a recommended grant level in June 2013. Final awards were made after consultation with Mr. Foss and Ms. McKee regarding, among other things, individual grant amounts, aggregate amount of equity to be awarded to management, and the effects of stockholder dilution and accounting expense, balanced against reward and retention factors.
In December 2013, the compensation committee was presented with and approved, subject to stock committee approval, the recommended grants for each of the named executive officers other than Mr. Foss at 50% of the value of the July 2013 equity grants (in the case of Ms. Morrison, who did not receive a July 2013 grant, her grant was equal to 50% of the value of a July 2013 grant made to a Company executive at her level). The grants consisted of 40% performance stock units, 40% time-based stock options and 20% time-based restricted stock units, a ratio that the compensation committee had discussed at its June 2013 meeting after input from Frederic W. Cook & Co., Inc. and Ms. McKee. The compensation committee then met in executive session with Ms. McKee to discuss the equity grant for Mr. Foss and considered a recommendation from the chairman of the compensation committee. Mr. Foss’ grant of equity with a value of $12,500,000 was not made at 50% of the value of his June 2013 equity grant (which had a value of $11,000,000) because the compensation committee wanted to further encourage Mr. Foss' retention. The final recommended grants were submitted to the stock committee, which approved the grants to our named executive officers.
In November 2014, Mr. Foss presented the compensation committee with recommended grants for Messrs. Sutherland and Reynolds and Ms. McKee that were generally between the median and 75
th
percentile of Market Practice. The Chairman of the compensation committee presented the compensation committee with a recommended grant for Mr. Foss that was above the 75
th
percentile of Market Practice to further encourage the retention of Mr. Foss. The equity grants were discussed by the compensation committee and approved, subject to stock committee approval, at the following levels: equity grants with a value of $13 million for Mr. Foss and equity grants with a value of $1,600,000 for each of Messrs. Sutherland and Reynolds and Ms. McKee. Ms. Morrison received an equity grant with a value of $500,000 that was consistent with other Company executives at her level. The November 2014 equity grants, like the December 2013 equity grants, consisted of 40% performance stock units, 40% time-based stock options and 20% time-based restricted stock units.
Ms. Morrison
Ms. Morrison joined us in June 2013. In making Ms. Morrison’s cash compensation recommendation, Ms. McKee and Mr. Sutherland considered the level of cash compensation that was likely to be attractive to Ms. Morrison considering her then-current compensation at her previous employer, internal consistency with respect to the compensation of executives at similar levels in the Company, and the results of a market check against the Survey Data at the 50
th
and 75
th
percentile for similarly situated positions. Ms. Morrison’s starting base salary was $500,000 and her bonus target was equal to $250,000, or 50% of her
55
base salary, which is generally consistent with the bonus targets for Company executives at her level. With regard to Ms. Morrison’s fiscal 2014 compensation, our Human Resources department followed its typical process for executives at her level and sent a request for a salary recommendation to her supervisor, Mr. Sutherland, in October for compensation decisions that will be effective the following year. Supervisors are allotted an annual increase pool (described below) to allocate at their discretion across all of the employees who report directly to them. A portion of that pool is intended for promotions, new hires, market adjustments or equity adjustments that may have occurred throughout the year, but, at the supervisor’s discretion, can be used for on-cycle increases to existing employees. For fiscal 2014, the total pool to be allocated was 2.0% of the total of salaries and bonus targets for the executives that the supervisor oversees, with an additional 0.5% of that total intended for promotions, new hires and market adjustments or equity adjustments. Once the 2014 recommendations were received by the Human Resources department, the recommendations were sent to Ms. McKee and Mr. Foss for review and approval. Mr. Foss and Ms. McKee were able to make changes to the recommendations based on their assessments of individual performance, in consultation with Mr. Sutherland. The recommendations were then submitted to the compensation committee for review and the compensation committee used this information to make the final decisions regarding fiscal 2014 executive compensation for Ms. Morrison. Ms. Morrison's bonus for fiscal 2014 was approved by the compensation committee in November 2014.
In November 2013, the compensation committee and the stock committee also approved a grant to Ms. Morrison of $500,000 worth of restricted stock units, which became effective at the time of our initial public offering. Ms. Morrison received an additional grant in December 2013 that consisted of 40% performance stock units, 40% time-based stock options and 20% time-based restricted stock units. The grant was equal to 50% of the value she would have received in July 2013, had she been eligible to receive that grant, which was 50% of the 50th percentile of Market Practice for equity grants made to similarly situated executives, adjusted to maintain consistency among similarly situated Company executives. Ms. Morrison's grant was recommended to the compensation committee by Mr. Foss and Ms. McKee and was consistent with grants made to other executives at her level.
The Compensation Committee’s Processes
The compensation committee generally makes its cash compensation decisions at its November meeting. New hires and promotions and other compensation adjustments are considered at its meetings throughout the year. Annual base salary decisions for the following calendar year and bonus decisions for the immediately preceding fiscal year are made in November. The bonus pool under the Bonus Plan for the current fiscal year is set in November as well. The compensation committee makes its decisions after review and discussion of recommendations made by Ms. McKee, with input from Mr. Foss, and, with respect to Mr. Foss and the named executive officers who report directly to him, materials prepared by Frederic W. Cook & Co., Inc., and in the case of bonus recommendations, by our Human Resources department. In addition, with regard to participants in the Bonus Plan, Mr. Foss provides the compensation committee with qualitative assessments of the performance of the other named executive officers who are his direct reports and his review of their performance, before it makes its compensation decisions. The compensation committee also considers skill set and experience, data based upon Market Practice, incumbent responsibilities relative to the applicable position, and internal consistency with respect to compensation among similarly situated executives when making its compensation decisions. The compensation committee is entitled to exercise its discretion with regard to any element of compensation and exercised negative discretion with regard to bonuses under the Bonus Plan.
Historically, stock options were granted in 2007 to certain of our named executive officers who were employed at that time in connection with their individual investments in the Company. Since that time, stock options have generally been granted in connection with new employment, management realignments and changes in responsibility and from time to time at the discretion of the compensation committee. In June 2013, Mr. Foss received an equity grant consisting of time-based stock options and restricted stock units in accordance with the terms of his Employment Letter Agreement. Messrs. Sutherland and Reynolds and Ms. McKee received equity grants consisting of time-based stock options and restricted stock units in July 2013 that were intended, for Mr. Sutherland and Ms. McKee, to make up for grants that they did not receive in 2012. The value of the July 2013 grant for executives other than Mr. Foss was generally based upon the 50
th
percentile of Market Practice, adjusted to maintain consistency among levels of Company executives. In November 2013, the compensation committee and the stock committee approved an additional one-time grant of restricted stock units to each of the named executive officers that became effective at the time of our initial public offering. These grants are more fully described below in “Components of Executive Compensation-Equity Incentives.” Each of the named executive officers other than Mr. Foss received additional grants in December 2013 in respect of fiscal 2013 equity compensation that were equal to 50% of the July 2013 grants. Regular annual grants began in November 2014.
Components of Executive Compensation
The principal components of our executive compensation program are base salary, bonus and equity incentives. We also provide employee and post-employment benefits and perquisites.
56
Base Salary
We use base salary to reflect the value of a particular position-to us and the marketplace-and the value the individual contributes to us. Salary levels for our executives are reviewed at least annually.
Messrs. Foss, Sutherland, Reynolds and Ms. McKee
Mr. Foss’ initial annual base salary of $1,350,000 was negotiated in connection with his total compensation package in 2012 and was increased by 3% to $1,390,500 in fiscal 2013. Mr. Foss’ Employment Letter Agreement provides that in setting Mr. Foss’ compensation for fiscal 2014, the compensation committee should consider the framework for his 2012 and 2013 compensation, including the fact that his total annual compensation package has been targeted at the 75th percentile of the chief executive officers in the Company’s peer group, as well as the Company’s and Mr. Foss’ performance. Due to the compensation committee’s focus on equity grants for Mr. Foss, as well as his cash bonus, and following a review of market data, the compensation committee determined not to increase Mr. Foss’ base salary for calendar 2014. Upon a recommendation made by the chairman of the compensation committee, and after discussion with Frederic W. Cook & Co., Inc., the compensation committee set Mr. Foss’ calendar 2015 base salary of $1,700,000 at its November 2014 meeting. Mr. Foss’ calendar 2015 base salary represents approximately a 22% increase from his calendar 2014 base salary, and reflects the compensation committee’s assessment of Mr. Foss’ skill set, experience and scope of responsibilities, as well as the compensation committee’s perception of his value in the marketplace.
For 2014, the specific salary recommendations for each of our named executive officers who are Mr. Foss’ direct reports were based upon a review of Market Practice between the median and 75
th
percentile, their previous salary increases, internal consistency with respect to the compensation of Company executives at similar levels, budgetary considerations and consideration of the percentage increases for other members of management. The salary recommendations were then made to the compensation committee for its review and approval. Salaries for Messrs. Sutherland and Reynolds and Ms. McKee were reviewed by Mr. Foss. Ms. McKee participated in reviews for Messrs. Sutherland and Reynolds. Ms. McKee reviewed Mr. Foss’ base salary with the compensation committee and the compensation committee then met in executive session to make its determination with regard to Mr. Foss’ calendar 2014 base salary. Salary adjustments generally are effective at the beginning of the following calendar year. Salary increases or decreases also can be recommended and approved in connection with a promotion or a significant change in responsibilities. For calendar 2013, Mr. Sutherland’s base salary was $824,000, Mr. Reynolds’ base salary was $500,000, and Ms. McKee’s base salary was $643,750. Messrs. Sutherland and Reynolds and Ms. McKee each received a salary increase for calendar 2014 of 2%, which was generally consistent with the overall salary increase budget for the Company. The compensation committee believes that the 2014 salaries are consistent with Market Practice for similarly situated executives. For calendar 2014, base salaries were as follows: for Mr. Sutherland, $840,480, for Mr. Reynolds, $510,000, and for Ms. McKee, $656,625. Base salaries for calendar 2015 are as follows: for Mr. Sutherland, $857,300, for Mr. Reynolds, $520,200, and for Ms. McKee, $669,800. These base salaries represent a 2% increase over their 2014 base salaries, which is consistent with overall increases for all salaried employees in the Company.
Ms. Morrison
Ms. Morrison joined us in June 2013. Ms. McKee and Mr. Sutherland considered the level of cash compensation that was likely to be attractive to Ms. Morrison considering her then-current compensation at her previous employer, internal consistency with respect to the compensation of executives at similar levels in the Company and the results of a market check against the Survey Data at the 50
th
and 75
th
percentile for similarly situated positions to determine the recommended base salary for Ms. Morrison of $500,000. Ms. Morrison’s base salary was then approved by the compensation committee at its June 2013 meeting. For calendar 2014, Ms. Morrison’s base salary was $507,500, which represents a 1.5% increase over her 2013 base salary. This increase is consistent with those of other salaried employees at the Company, prorated due to Ms. Morrison’s brief tenure at the Company. Ms. Morrison received a salary increase of 2% for calendar 2015, to $517,700. This increase is consistent with overall increases for all salaried employees in the Company.
Bonus
Messrs. Foss, Sutherland and Reynolds and Ms. McKee
In fiscal 2014, Messrs. Foss, Sutherland and Reynolds and Ms. McKee participated in the Bonus Plan. Under the Bonus Plan, the compensation committee approved in November 2013 the establishment of a bonus pool that was funded based on 1.58% of adjusted EBIT. This pool method was chosen to satisfy the requirements of the performance-based pay exception to Section 162(m) of the Internal Revenue Code, which limits tax deductions for compensation paid to a public company’s named executive officers (other than the chief financial officer) to $1,000,000. Although we are not currently subject to the Section 162(m) compensation deduction limit, following the applicable phase-in period, we will become subject to the Section 162(m) compensation deduction limit. Therefore, we intend to operate our Bonus Plan to comply with Section 162(m). For purposes of the Bonus Plan and the formula used to determine the bonus pool approved by the compensation committee, adjusted EBIT is
57
income from both continuing and discontinued operations before income taxes, if any, and before interest expense and other financing costs, in each case as shown on our consolidated financial statements and notes thereto. In addition, adjusted EBIT for purposes of the pool excluded incremental customer relationship amortization and incremental depreciation that resulted from the 2007 Transaction and share-based compensation expense. For fiscal 2014 bonuses, the compensation committee adjusted the calculation of actual adjusted EBIT for purposes of the Bonus Plan to exclude share-based compensation expense and incremental customer relationship amortization and incremental depreciation that resulted from the 2007 Transaction and the estimated impact of the 53
rd
week (fiscal 2014 had 53 weeks as opposed to the typical 52 weeks). These adjustments were made to normalize the adjusted EBIT number so that it does not reflect certain non-operational items. For fiscal 2014, our adjusted EBIT under the Bonus Plan was $775.9 million. The following percentages of adjusted EBIT for Mr. Foss and the named executive officers who are his direct reports represent the maximum amount that could have been awarded to him or her for fiscal 2014: for Mr. Foss, 0.76% (up to the plan maximum of $6,000,000), for Mr. Sutherland, 0.32%, and for Mr. Reynolds and Ms. McKee, 0.25%. The potential bonus amounts under the Bonus Plan for fiscal 2014 based upon the percentages of adjusted EBIT were as follows: For Mr. Foss, $5,880,000, for Mr. Sutherland, $2,450,000, and for Ms. McKee and Mr. Reynolds, $1,960,000. For fiscal 2014, the compensation committee exercised negative discretion under the Bonus Plan with regard to the actual bonus amounts awarded to Mr. Foss and the other named executive officers who report directly to him and those actual bonus amounts are as follows: for Mr. Foss, $3,100,000, for Mr. Sutherland, $680,000, for Ms. McKee, $531,000 and for Mr. Reynolds, $413,000. For fiscal 2015, the compensation committee approved the following percentages of adjusted EBIT for each of the participants in the Bonus Plan, which represent the maximum amount that can be awarded to him or her in respect of his or her fiscal 2015 bonus under the Bonus Plan: for Mr. Foss, 0.68% (up to a plan maximum of $6,000,000), for Mr. Sutherland, 0.28%, and for Ms. McKee and Mr. Reynolds, 0.23%.
Bonuses are designed to encourage and reward performance that is consistent with our financial objectives and individual performance goals and targets. In determining the actual bonuses paid to our named executive officers who are Mr. Foss’ direct reports for fiscal 2014, the compensation committee considered the maximum bonus amount based on the above adjusted EBIT formula and then considered reference points, including amounts that the named executive officers would have received under the MIB had they participated in the MIB and the named executive officers’ historical bonus awards. As described in more detail below, bonus calculations under the MIB are based on achievement against an adjusted EBIT target, a sales target, and additional functional objectives depending on the participant’s responsibilities. Had Messrs. Foss, Sutherland and Reynolds and Ms. McKee participated in the MIB, the functional objectives would have consisted of EBIT margin for Messrs. Foss and Sutherland, the rollout of contract life cycle management and improvement in crisis management and background check processes for Mr. Reynolds, and the execution of the campus recruiting program for North America for Ms. McKee. Based upon fiscal 2014 performance, Messrs. Foss and Sutherland would have been deemed to have achieved a 100% payout on the functional objective metric (resulting from achievement of EBIT margin of approximately 100% of target in fiscal 2014) and Mr. Reynolds would have been deemed to have achieved a 100% payout on his functional objective and Ms. McKee would have been deemed to have achieved a 100% payout on her functional objective, based on a qualitative assessment of the performance of each of Mr. Reynolds’ and Ms. McKee’s respective departments against the stated objective, in each case, had the executive been a participant in the MIB in fiscal 2014. Ms. McKee presented the reference points for the named executive officers who report to Mr. Foss (other than herself) to Mr. Foss for his review. Mr. Foss reviewed the reference points and considered the individual contributions of the named executive officers who report to him before making final bonus recommendations for those executives to the compensation committee in November 2014. The compensation committee considered the reference points and recommendations and exercised negative discretion to determine the bonus amounts under the Bonus Plan for our named executive officers who are Mr. Foss’ direct reports. The compensation committee also considered a target percentage of base salary, which represents the compensation committee’s view of a market competitive award based upon a competitive review by Frederic W. Cook and Co., Inc. at approximately the 75th percentile of Market Practice. For fiscal 2014, as determined in November 2013, bonus targets were equal to approximately 80% of salary or $672,384 for Mr. Sutherland, $408,000 for Mr. Reynolds and $525,300 for Ms. McKee. Messrs. Sutherland’s and Reynolds’ and Ms. McKee’s bonus awards for fiscal 2014 that were determined by the compensation committee in November 2014 were equal to the amounts each would have received if he or she were a participant in the MIB. For fiscal 2015, bonus targets are as follows: for Mr. Sutherland, $857,300, for Mr. Reynolds, $520,200, and Ms. McKee, $669,800, which targets are equal to approximately 100% of salary. The compensation committee increased Messrs. Sutherland and Reynolds and Ms. McKee’s bonus targets as a percentage of base salary from 80% to 100% upon a recommendation from Mr. Foss, with the aim of incentivizing them to achieve the Company's goals for fiscal 2015. Frederic W. Cook & Co., Inc. indicated that the target bonuses were at or above the 75
th
percentile of Market Practice, but that the target total direct compensation (salary, bonus and equity compensation) for fiscal 2015 for Messrs. Sutherland and Reynolds and Ms. McKee generally approximated the median and 75th percentile of Market Practice.
In determining the actual bonus paid to Mr. Foss, the compensation committee considered a recommendation from the chairman of the compensation committee and the maximum bonus amount based on the above Bonus Plan formula and took into account
58
as reference points Mr. Foss’ historical bonus awards, and the amount Mr. Foss would have received had he participated in the MIB, keeping in mind the provision in Mr. Foss’ agreement that his total annual compensation for fiscal 2014 should take into consideration the framework for fiscal 2012 and fiscal 2013, for which his total annual compensation was required to be targeted to the 75th percentile of the Company’s market peer group. The compensation committee also considered a target amount as a percentage of base salary, which represented the compensation committee’s view of a market competitive award (for fiscal 2014, Mr. Foss’ target bonus was $2,085,750, which is equal to 150% of his base salary for 2014). The compensation committee also discussed with Frederic W. Cook & Co., Inc. the compensation committee’s proposed bonus amount relative to the Company’s market peer group. The compensation committee then awarded Mr. Foss a bonus of $3,100,000 under the Bonus Plan, consisting of $2,100,000, which approximated the amount he would have received under the MIB, plus an additional $1,000,000 to recognize his individual performance for fiscal 2014, including his performance in guiding the Company after a successful initial public offering. Mr. Foss’ fiscal 2014 bonus was above the 75
th
percentile of Market Practice. The compensation committee determined to increase Mr. Foss’ bonus target to $3,400,000 for fiscal 2015, increasing his target from 150% to 200% of his base salary, which also is above the 75
th
percentile of Market Practice, to incent his continued performance.
IPO Bonuses
In connection with our initial public offering, in December 2013, Mr. Foss and the other named executive officers who report directly to him were awarded one-time special bonuses designed to recognize the critical role each of them played in positioning the Company for and executing a successful initial public offering as follows: for Mr. Foss, $2,367,800, for Mr. Sutherland, $704,700, for Ms. McKee, $558,000, and for Mr. Reynolds, $432,900. These bonus amounts, which were based upon approximately 90% of the bonuses awarded under the Bonus Plan for fiscal 2013, were determined by the compensation committee in executive session based upon a recommendation by the chairman of the compensation committee and were contingent upon the successful completion of our initial public offering. Prior to the meeting at which the bonuses were awarded, the chairman of the compensation committee had discussed with Ms. McKee the IPO bonus that he had been planning to recommend for Mr. Foss, which equated to approximately 90% of Mr. Foss’s annual bonus, and based upon that amount, made an IPO bonus recommendation for the other named executive officers at the same percentage level.
Ms. Morrison
Ms. Morrison participates in the MIB, which provides annual cash bonuses to eligible executives for the achievement of explicit performance objectives established for each fiscal year. Each November (or at another time during the year in the case of a new hire or promotion), the compensation committee sets a bonus target in dollars for each executive who participates in the MIB. For fiscal 2014, the MIB was composed of two parts: a financial portion representing 80% of the overall potential MIB award, with functional or business group objectives representing the remaining 20%. In the MIB in fiscal 2014, the financial portion focused on top and bottom line performance, with a sales target ($14.693 billion) representing 39% of the total target and an adjusted EBIT target ($885,941,000) representing 41% of the total target. The sales target for purposes of the MIB is adjusted for the impact of currency translation and acquisitions and divestitures and includes an amount intended to normalize the plan targets for corporate functional participants. The adjusted EBIT target for purposes of the MIB excludes the impact of currency translation, acquisitions and divestitures, the incremental customer relationship amortization and incremental depreciation from the 2007 Transaction and share-based compensation expense and includes an adjustment for severance and other charges and branding charges and an amount intended to normalize the plan targets for corporate functional participants. The functional objective that comprised 20% of the overall MIB award for Ms. Morrison in fiscal 2014 was EBIT margin (with a target of 5.97%), which consists of adjusted EBIT divided by sales. For fiscal 2014, achieved EBIT margin for purposes of the MIB equaled 5.97%. Actual adjusted sales for purposes of the MIB excluded the impact of acquisitions and divestitures. Actual adjusted EBIT for purposes of the MIB excludes share-based compensation expense, incremental customer relationship amortization and incremental depreciation that resulted from the 2007 Transaction, the impact of acquisitions and divestitures, severance and other charges, branding charges, initial public offering-related expenses, including share-based compensation, and gains, losses and settlements impacting comparability.
The following table describes the threshold, targets and maximum for each of the components of the MIB award to Ms. Morrison for fiscal 2014:
|
Business Performance
|
Payout
|
|||||||||||||||||
|
(Percentage of Target Performance)
|
(Percentage of Target Payout)
|
|||||||||||||||||
|
Measure
|
Threshold
|
Target
|
Maximum
|
Threshold
|
Target
|
Maximum
|
||||||||||||
|
EBIT (41%)
|
87.5
|
|
100.0
|
|
110.0
|
|
25.0
|
|
100.0
|
|
200.0
|
|
||||||
|
Sales (39%)
|
90.0
|
|
100.0
|
|
110.0
|
|
25.0
|
|
100.0
|
|
200.0
|
|
||||||
|
EBIT margin (20%)
|
87.5
|
|
100.0
|
|
110.0
|
|
25.0
|
|
100.0
|
|
150.0
|
|
||||||
59
As the table illustrates, the Company must attain a threshold, or minimum, performance on each financial measure for the participant to receive any payout for the measure. If the threshold performance is achieved, the participant will receive 25% of the payout for that measure, which increases to 100% when 100% of the measure is attained. If greater than 100% of the target for a particular measure is achieved, the participant will receive more than 100% payout on that measure up to the maximum amount set forth in the table. Therefore, if the maximum performance of all measures was achieved, Ms. Morrison could receive up to 190% of her target bonus amount.
Ms. Morrison’s target bonus amount of 50% of her base salary, or $253,750, was based upon bonus targets for similarly situated executives at the Company, market checked against the Survey Data and approved by the compensation committee.
The actual award of bonuses under the MIB was based on the mechanical calculation of the financial target (for the 80% financial portion) and the achievement of a certain functional group objective (for Ms. Morrison, EBIT margin). Ms. Morrison’s fiscal 2014 bonus was $257,000 and was approved by the compensation committee in November 2014. Her fiscal 2015 bonus target as determined by the compensation committee is 50% of base salary, or $258,850.
Equity Incentives
Historical Grants
Historically, stock options were granted in 2007 to certain of our named executive officers who were employed at that time in connection with their individual investments in the Company. Since that time, stock options have generally been granted in connection with new employment, management realignments and changes in responsibility and from time to time at the discretion of the compensation committee.
As was negotiated with the sponsors in connection with the 2007 Transaction, half of all of the stock options granted through March 2013 have a time-based vesting schedule and vest over a four-year period, while half of all stock options granted through March 2013 were intended to have a performance-based vesting schedule and require that we achieve specified financial targets in addition to the four-year vesting period before those options will vest, subject to the compensation committee’s discretion to accelerate vesting.
The Company completed a spinoff of Seamless Holdings Corporation on October 26, 2012. The exercise price of all stock options granted prior to that spinoff was adjusted to reflect the reduction of $1.06 per share, which was the portion of the appraisal price of a share of Company common stock allocated to each share of Seamless Holdings Corporation common stock at the time of the spinoff.
New Equity Program
After review of our equity compensation program, the compensation committee determined to change our equity program in June 2013 to make it more like the equity programs of large public companies. The new equity program generally consists of time-based stock options, restricted stock units and performance stock units and may in the future include additional stock-based awards, including other performance-based awards.
Time-based awards under the new equity program are generally subject to a vesting schedule with 25% of the award vesting on each of the first four anniversaries of the date of grant, subject to the participant’s continued employment with the Company or one of its subsidiaries through each such anniversary. Performance stock units under the new equity program generally vest over a three-year period, subject to achievement of certain specified performance targets and the participant’s continued employment with the Company. All restricted stock units and performance stock units will accrue dividend equivalents from the date of grant until the date of vesting (with the dividend equivalents on performance stock units determined based upon the actual achievement against target). Upon termination of employment, unvested stock options, restricted stock, restricted stock units or performance stock units are immediately forfeited (other than in the case of death, disability or retirement) and vested stock options are forfeited immediately, in the case of termination for cause or 90 days after termination, in the case of any other termination of employment other than death, disability or retirement, when vested stock options are forfeited one year after termination of employment. If the participant’s service with the Company or any of its subsidiaries terminates due to death, disability or retirement (as disability and retirement are defined in the Fifth Amended and Restated Aramark 2007 Management Stock Incentive Plan (the "2007 Stock Plan") or the Aramark 2013 Stock Incentive Plan (the "2013 Stock Plan"), as applicable, as defined below), the installment of stock options, restricted stock, restricted stock units or performance stock units that are scheduled to vest on the next vesting date (subject to achievement of the performance target(s), if applicable) following such termination will immediately vest, and all remaining unvested stock options, restricted stock, restricted stock units and performance stock units will be forfeited, except that with respect to performance stock units, if the date of termination due to retirement, death or disability occurs prior to the date achievement of the applicable performance goals is certified by the compensation committee or the stock committee, then the first tranche of performance stock units will become vested on the original vesting date (subject to achievement of the applicable performance target(s)). Mr. Sutherland is the only named executive officer who has attained the retirement age under the the 2007 Stock Plan and the 2013 Stock Plan. In the
60
event of a change of control (as defined in the 2007 Stock Plan) prior to a termination of the participant’s service, any remaining unvested time-based stock options, restricted stock and restricted stock units granted under the 2007 Stock Plan will vest and a percentage of the unvested performance-based options granted under the 2007 Stock Plan will be eligible to vest based on achievement of the applicable performance targets. With respect to equity awards granted under the 2013 Plan, in the event of a change of control (as defined under the 2013 Stock Plan) and a termination of the participant’s employment without cause (or, if applicable, a resignation for good reason), time-based equity awards become immediately vested and performance stock units become vested either at target level or based on actual performance. For more information regarding the treatment of equity awards upon a termination of employment, see “Potential Post-Employment Benefits.” Participants holding restricted stock units or performance stock units will receive the benefit of any dividends paid on shares in the form of additional restricted stock units or performance stock units.
Fiscal 2014 Equity Grants to Messrs. Foss, Sutherland and Reynolds and Mses. McKee and Morrison
In June 2013 Mr. Foss, and in July 2013 Messrs. Sutherland and Reynolds and Ms. McKee, received equity grants consisting of stock options and restricted stock units, each with the time-based vesting schedules described above. Mr. Foss’ grant was made in satisfaction of the Company’s obligation under Mr. Foss’ Employment Letter Agreement. With regard to Mr. Sutherland and Ms. McKee, the July grants were intended to represent compensation for fiscal 2012, though there was no formal grant program in place for fiscal 2012, as Mr. Sutherland and Ms. McKee had not received an equity grant since June 2011. The value of the aggregate annual equity grants to Messrs. Sutherland and Reynolds and Ms. McKee for fiscal 2013 was at approximately the 50
th
percentile of Market Practice, adjusted to maintain consistency among the levels of Company executives.
As contemplated at the time of our initial public offering, our compensation committee determined to make additional grants of equity to our named executive officers in December 2013 in respect of fiscal 2013 performance. These grants were made under the Company’s 2013 Stock Incentive Plan, described below. The compensation committee and stock committee approved grants of performance stock units which vest over a three-year period, subject to the achievement of an adjusted earnings per share target for fiscal 2014 and the participant’s continued employment with the Company, as well as time-based stock options and time-based restricted stock units, each of which vest in equal annual installments over a four-year period, in each case, subject to the participant’s continued employment with the Company. The value of the equity grants that the compensation committee made to Messrs. Sutherland and Reynolds and Ms. McKee in December 2013 was approximately 50% of the value of the equity award that they received in July 2013, or, in the case of Ms. Morrison, 50% of the value of the award that a similarly situated Company executive received in July 2013, and was allocated as follows: 40% performance stock units, 40% time-based stock options and 20% time-based restricted stock units. The compensation committee discussed the equity mix for the December 2013 grants at its June 2013 meeting, after consultation with Frederic W. Cook & Co., Inc. and Ms. McKee, with the goal of supporting multiple objectives, including alignment with long-term shareholder interests, linkage of compensation to operating performance and retention. The performance metric for the performance-based restricted stock units is based upon an adjusted earnings per share target for fiscal 2014 ($1.33 per share), which was a metric recommended by management after considering market data from Frederic W. Cook & Co., Inc. regarding metrics used by members of the Company’s peer group, and approved by the compensation committee. The adjusted earnings per share target is equal to adjusted net income divided by a constant share number. The adjusted net income target is equal to reported net income excluding acquisitions and divestitures, the incremental customer relationship amortization and incremental depreciation from the 2007 Transaction, share-based compensation expense and gains, losses and settlements impacting comparability and including an adjustment for severance and other charges and branding charges and the tax impact related to these adjustments. Actual adjusted net income is equal to net income excluding the impact of currency translation, acquisitions and divestitures, the incremental customer relationship amortization and incremental depreciation from the 2007 Transaction, the effects of the refinancing on interest and other financing costs, share-based compensation expense, and gains, losses and settlements impacting comparability and including an adjustment for severance and other charges and branding charges and the tax impact related to these adjustments.
The number of performance stock units that can be earned is based upon the percentage of the adjusted earnings per share target that is achieved as follows:
|
Target Adjusted Earnings per Share
Performance Level
|
Percentage of
Target Number of PSUs Earned
|
|
|
less than 90%
|
0%
|
|
|
90%
|
50%
|
|
|
100%
|
100%
|
|
|
110%
|
150%
|
|
|
115% or greater
|
200%
|
|
61
If the performance target is satisfied at or above 90%, the performance stock units earned effectively convert into time-based restricted stock units, vesting in equal annual installments over a three year period from the date of grant. In December 2013, Mr. Sutherland received 8,526 performance stock units, 30,817 time-based stock options and 4,263 time-based restricted stock units; Mr. Reynolds received 6,821 performance stock units, 24,654 time-based stock options and 3,411 time-based restricted stock units; Ms. McKee received 8,526 performance stock units, 30,817 time-based stock options and 4,263 time-based restricted stock units and Ms. Morrison received 3,411 performance stock units, 12,327 time-based stock options and 1,706 time-based restricted stock units.
Mr. Foss’ December 2013 grant was considered separately by the compensation committee and recommended by the chairman of the compensation committee. The compensation committee and the stock committee approved the equity grant to Mr. Foss based upon his performance to date and in order to retain him in his current position, rather than 50% of his June 2013 grant. Mr. Foss received a December 2013 equity grant consisting of 213,129 performance stock units, 770,417 stock options and 106,565 restricted stock units.
In November 2014, the compensation committee determined that the Company had attained 108.5% of the 2014 adjusted earnings per share target for the fiscal 2014 grants of performance stock units (granted in December 2013). As a result, the named executive officers are entitled to receive delivery of 142.5% of the target amount of performance stock units that they were granted over the three-year vesting period (subject to continued employment) as follows (amounts include accrued dividend equivalents): for Mr. Foss, 306,201shares, for each of Mr. Sutherland and Ms. McKee, 12,249 shares, for Mr. Reynolds, 9,800 shares, and for Ms. Morrison, 4,901 shares. See "Grants of Plan Based Awards for Fiscal Year 2014" for further information regarding the December 2013 equity grants.
The compensation committee began making regular annual equity grants in November 2014, as described above.
Vesting of Performance-based Options
On November 11, 2013, the compensation committee approved an amendment to all outstanding non-qualified stock options agreements containing performance-based options that modified the vesting provisions relating to outstanding performance-based options granted prior to our initial public offering and awarded under the 2007 Stock Plan. The amendment provided that in the event of an initial public offering of the Company, subject to the option holder’s continued employment on that date, 50% of any then-unvested performance-based options that did not meet applicable performance thresholds in prior years (the “Missed Year Options”) would become vested if the initial public offering price for the common stock of the Company equaled or exceeded $20.00 per share. In addition, if, during the 18-month period following the initial public offering, the closing trading price for common stock of the Company equaled or exceeded $25.00 per share over any consecutive twenty day trading period, 100% of the Missed Year Options would become vested. Both thresholds were satisfied during fiscal 2014 and all of the Missed Year Options vested.
Grants in Connection with our Initial Public Offering
In November 2013, the compensation committee and stock committee approved one-time grants of restricted stock units to each of the named executive officers, which became effective at the time of our initial public offering. The restricted stock units vest in one third increments on the first three anniversaries of the grant date, subject to the named executive officer’s continued employment with the Company and its subsidiaries. The number of restricted stock units received was based on the following dollar values divided by $20.00, the initial public offering price per share:
|
Name
|
Amount
|
Number of RSUs
|
||||
|
Eric Foss
|
$
|
10,000,000
|
|
500,000
|
||
|
L. Frederick Sutherland
|
$
|
1,875,000
|
|
93,750
|
||
|
Lynn B. McKee
|
$
|
1,875,000
|
|
93,750
|
||
|
Stephen R. Reynolds
|
$
|
1,150,000
|
|
57,500
|
||
|
Christina T. Morrison
|
$
|
500,000
|
|
25,000
|
||
Mr. Foss and Ms. McKee met with members of the compensation committee, including the chairman of the compensation committee, over a period of time prior to the grants to discuss the dollar amount of the pool of equity to be distributed, the particular executives who would receive restricted stock unit grants and the amount of such individual awards, which were based upon a multiple of the average of base salary and bonus target for a particular executive level. Mr. Foss and Ms. McKee made recommendations regarding the restricted stock unit award amounts for each of the named executive officers other than Mr. Foss. Recommended amounts were consistent for executives at similar levels. The compensation committee approved the recommendations of management for the named executive officers other than Mr. Foss and determined a grant amount for Mr. Foss based upon earlier compensation committee discussions.
62
Equity Grant Procedures
The compensation committee intends to make annual awards of equity at its meeting held early in each fiscal year. The compensation committee has in the past, and may in the future, make limited grants of equity on other dates to retain key employees, to compensate an employee in connection with a promotion or to compensate newly hired executives for equity or other benefits lost upon termination of their previous employment or to otherwise induce them to join our Company or otherwise at the discretion of the compensation committee. The grant date of equity awards to executives may be the date of compensation committee approval or a later date of subcommittee or stock committee approval if designated by the compensation committee or a date that is designated by the compensation committee or stock committee. The exercise price of option grants is the closing market price of our common stock on the date of grant.
Stock Ownership Guidelines
Our compensation committee has adopted stock ownership guidelines that apply to our named executive officers. Mr. Foss must retain Aramark common stock with a value equal to six times his base salary under the terms of his Employment Letter Agreement, Messrs. Sutherland and Reynolds and Ms. McKee must retain stock with a value equal to three times his or her base salary and Ms. Morrison must retain stock with a value equal to two times her base salary. Directly owned shares and beneficially owned shares held indirectly (including by family members or family trusts) count toward the guidelines for Messrs. Sutherland and Reynolds and Ms. McKee and Ms. Morrison. There is no required time period for attaining the minimum stock ownership level for these executives.
Other Components of Compensation
Employee and Post-Employment Benefits
. We offer basic employee benefits to provide our workforce with a reasonable level of coverage in the event of illness or injury. The cost of certain employee benefits is partially or fully borne by the employee, including each named executive officer. We offer comparable benefits to our eligible U.S. employees, which include medical, dental and vision coverage, disability insurance and optional life insurance. In addition, our named executive officers receive excess medical coverage that provides reimbursement for medical, dental and vision expenses in excess of $1,500 per covered individual per year. Our named executive officers also participate in a Survivor Income Protection Plan, which entitles a surviving spouse or domestic partner and dependent children to receive the executive’s full base salary for one year after the executive’s death and one-half of the executive’s base salary for the subsequent nine years or, alternatively, may receive excess term life insurance. A participant in the Survivor Income Protection Plan who is 65 and has attained 5 years of employment with us is entitled to a benefit equal to one times his or her base salary upon his or her retirement or death instead of the benefit described above.
Generally, our highly compensated employees (for 2014, those earning more than $115,000), including our named executive officers, are not eligible to participate in our 401(k) plans because of certain legal requirements. Instead, those employees are eligible to participate in a non-qualified savings plan that we call our Savings Incentive Retirement Plan, the successor plan to our Stock Unit Retirement Plan. This plan is intended to be a substitute for those employees’ participation in our 401(k) plans. See “Non-Qualified Deferred Compensation for Fiscal Year 2014” below for further information.
Messrs. Foss, Reynolds and Sutherland and Ms. McKee
Messrs. Foss, Reynolds and Sutherland and Ms. McKee are also parties to employment agreements that entitle them to lump sum payments and severance payments in installments if there is a change of control of us or Aramark Services, Inc. as described in those agreements and their employment is terminated under specified circumstances. These provisions are intended to align executive and stockholder interests by enabling executives to consider corporate transactions that are in the best interests of the stockholders and our other constituents without concern over whether the transactions may jeopardize the executives’ own employment.
Mr. Foss’ employment agreement contains a “double trigger”-for payments to be made, there must be a change of control followed by an involuntary loss of employment (or resignation by Mr. Foss for “good reason”) within three years or his employment must be terminated in anticipation of a change of control. See “Potential Post-Employment Benefits” below for the applicable definition of “good reason.” The agreements with Messrs. Sutherland and Reynolds and Ms. McKee also contain a “double trigger.” We chose to implement a “double trigger” for Mr. Foss and the other named executive officers who report directly to him after receiving advice from Frederic W. Cook & Co., Inc. that a “double trigger” is a more common practice in the market than a “single trigger.”
Ms. Morrison
Ms. Morrison is a party to an Agreement Relating to Employment and Post Employment Competition that provides for certain benefits if she should be terminated by us without cause. Those benefits include between 26 and 52 weeks of severance pay, depending on her length of service with the Company, as well as the continuation of an auto allowance and the continuation of basic health care coverage through the end of the severance pay period. Pursuant to the agreement, Ms. Morrison must adhere
63
to certain non-disclosure, non-disparagement, non-competition and non-solicitation requirements for various periods of time after a termination of employment. Ms. Morrison is currently entitled to 26 weeks of severance pay if she is terminated by us without cause.
For more information on change of control and severance payments for our named executive officers, see the disclosure under “Narrative Disclosure to Summary Compensation Table and Grants of Plan-Based Awards Table - Employment Agreements and Change of Control Arrangements” and under “Potential Post-Employment Benefits.”
Perquisites.
We provide our named executive officers with other benefits, reflected in the All Other Compensation column in the Summary Compensation Table, that we believe are reasonable and encourage retention. We believe that these benefits enable our executives to focus on our business and enhance their commitment to us. These benefits include premiums paid on life insurance or the Survivor Income Protection Plan, disability insurance (in Mr. Sutherland’s case, a legacy policy the premiums for which are paid 100% by the Company), excess health insurance, receipt of a car allowance, no cost parking at a garage near Company offices, an executive physical, financial planning services and personal use of Company tickets or the Company box and related items at sporting or other events, and the costs of these benefits constitute a small percentage of each named executive officer’s total compensation. The availability of financial planning services assists those who receive them to optimize the value received from all of the compensation and benefit programs offered. Generally, Company-provided perquisites are reviewed by the compensation committee in consultation with Frederic W. Cook & Co., Inc. on a periodic basis. Based upon the usefulness of such perquisites in support of attraction and retention objectives, the compensation committee determines whether or not to continue them.
Ms. Morrison received benefits under our relocation program in fiscal 2014 that provided her with temporary housing and reimbursement for moving costs, closing costs and or other incidental expenses. Although the relocation program provides for benefits for a 90-day period to enable new employees to search for and purchase a permanent residence, we may extend the temporary housing benefit due to the tight housing market, work demands and/or family-related issues. We extended relocation benefits for Ms. Morrison due to delays in procuring a new permanent residence.
Our compensation committee established a policy, which it has determined to be in our business interest, directing the Chief Executive Officer to use Company aircraft, whenever possible, for all air travel, whether personal or business. Under the policy, the Chief Executive Officer may also designate other members of senior management to use the Company aircraft for air travel. Some of Mr. Foss’ business use of the corporate aircraft in fiscal 2014 included flights to attend outside board meetings at the companies or organizations for which he serves as a director. We believe that Mr. Foss’ service on these boards, and his ability to conduct Company business while traveling to these board meetings, provides benefits to us and therefore deem it to be business use. In addition, depending on seat availability, Mr. Foss’ family members may accompany him on the Company aircraft. Although there is little or no incremental cost to us for these trips, we reflect a $500 per seat charge in the “All Other Compensation” amounts in the Summary Compensation Table for flights in which those additional passengers’ travel is not business-related. Mr. Foss has a car and driver that we provide to him. Much of his use of the Company-provided car and driver, which generally enables him to make efficient use of travel time, is business use, although Mr. Foss utilizes the car and driver for commuting to and from the office, which is considered personal use, and for other limited personal use.
Impact of Regulatory Requirements on our Executive Compensation
Sections 280G and 4999
. Sections 280G and 4999 of the Internal Revenue Code, respectively, limit our ability to take a tax deduction for certain “excess parachute payments” (as defined in Sections 280G and 4999) and impose excise taxes on each executive that receives “excess parachute payments” in connection with his or her severance from us in connection with a change of control. The compensation committee considered the adverse tax liabilities imposed by Sections 280G and 4999, as well as other competitive factors, when it structured certain post-termination compensation payable to our named executive officers. The potential adverse tax consequences to us and/or the executive, however, are not necessarily determinative factors in such decisions. Our 2007 agreements with Mr. Sutherland and Ms. McKee relating to employment require us to make a gross-up payment to compensate them for any excise taxes (and income taxes on such gross-up payment) that they incur under Section 4999. Messrs. Foss’ and Reynolds’ agreements do not provide for such gross-up payments, as the compensation committee was advised that it is no longer a common practice in the marketplace. Similarly, Ms. Morrison’s agreement does not provide for a gross-up.
Section 162(m)
. Section 162(m) of the Internal Revenue Code limits tax deductions for compensation paid to a public company’s named executive officers (other than the chief financial officer) to $1,000,000. Although we are not currently subject to the Section 162(m) compensation deduction limit, following the applicable phase-in period, we will become subject to the Section 162(m) compensation deduction limit. The compensation committee considers the loss of deductibility, as well as other factors, when it structures compensation arrangements for our named executive officers (such as the Bonus Plan, which we intend to operate in compliance with Section 162(m)). However, the potential tax consequences to us are not necessarily determinative in such decisions and the compensation committee believes it should have flexibility in awarding compensation
64
to accomplish business objectives and to attract and retain our named executive officers, even though some compensation awards may result in non-deductible compensation expenses.
Compensation Committee Interlocks and Insider Participation
Joseph Neubauer, who is our Chairman and former Chief Executive Officer (and was an employee of the Company until December 31, 2013), serves on our compensation committee.
Please see Item 13, “Certain Relationships and Related Transactions, and Director Independence” for information on transactions with JPMorgan and Goldman, Sachs & Co. Stephen P. Murray, Chairman of our compensation committee, is the President and Chief Executive Officer of CCMP Capital Advisors, LLC (“CCMP”), a private equity firm specializing in buyout and growth equity investments. Pursuant to an agreement with JPMorgan and J.P. Morgan Partners, LLC, CCMP advises J.P. Morgan Partners with respect to certain of its private equity investments, including its investment in us. Sanjeev Mehra, a member of our Compensation and Human Resources Committee, is Managing Director of Goldman, Sachs & Co.’s Principal Investment Area of its Merchant Banking Division.
The remaining information called for by Item 11 will be included in the section “Compensation Committee Report” in the Company’s Proxy Statement for the 2015 Annual Meeting of Stockholders and is incorporated herein by reference.
Compensation Risk Disclosure
As part of its oversight responsibilities, the compensation committee considered the impact of our compensation programs on our risk profile and whether these programs promote excessive risk taking. Based on its review and the recommendation of its compensation consultant, the compensation committee determined that our compensation programs are appropriately structured and that risks arising from our compensation programs are not reasonably likely to have a material adverse effect on us for the following reasons, among others:
|
•
|
our compensation programs are well aligned with sound compensation design principles;
|
|
•
|
our Bonus Plan and the MIB utilize financial performance measures at the corporate level, which cannot be easily manipulated by any one individual;
|
|
•
|
none of our individual business areas pose a significant business risk to the overall enterprise;
|
|
•
|
our stock ownership guidelines will encourage a long-term focus by our executives on our growth and long-term viability; and
|
|
•
|
equity compensation constitutes a meaningful portion of pay for most senior executives and focuses them on enhancing long-term stockholder value over a multi-year period.
|
65
Summary Compensation Table
The following table provides summary information concerning the compensation we paid to our named executive officers in the fiscal years indicated.
|
Name and
Principal Position
|
Year
|
Salary
(1)
($)
|
Bonus
(2)
($)
|
Stock Awards
(3)
($)
|
Option Awards
(4)
($)
|
Non-Equity Incentive Plan Compen-sation
(2)
($)
|
Change in Pension Value and Non-Qualified Deferred Compensation Earnings
(5)
($)
|
All Other Compensation
(6)
($)
|
Total ($)
|
||||||||
|
Eric J. Foss
|
2014
|
1,417,240
|
|
5,467,800
|
|
17,647,080
|
|
6,767,223
|
|
—
|
|
799
|
|
1,122,240
|
|
32,422,382
|
|
|
Chief Executive
|
2013
|
1,380,375
|
|
2,632,200
|
|
5,160,987
|
|
8,161,031
|
|
—
|
|
155
|
|
742,452
|
|
18,077,200
|
|
|
Officer and President
|
2012
|
545,192
|
|
1,512,500
|
|
—
|
|
5,658,563
|
|
—
|
|
—
|
|
339,240
|
|
8,055,495
|
|
|
L. Frederick Sutherland
|
2014
|
852,523
|
|
1,384,700
|
|
2,180,913
|
|
5,562,941
|
|
—
|
|
19,261
|
|
100,155
|
|
10,100,493
|
|
|
EVP and Chief
|
2013
|
818,000
|
|
783,000
|
|
639,676
|
|
723,363
|
|
—
|
|
17,915
|
|
58,408
|
|
3,040,362
|
|
|
Financial Officer
|
2012
|
787,500
|
|
625,000
|
|
—
|
|
111,875
|
|
—
|
|
16,655
|
|
57,661
|
|
1,598,691
|
|
|
Lynn B. McKee
|
2014
|
666,034
|
|
1,089,000
|
|
2,180,913
|
|
3,715,615
|
|
10,854
|
|
75,134
|
|
7,737,550
|
|
||
|
EVP, Human
|
2013
|
639,063
|
|
620,000
|
|
639,676
|
|
723,363
|
|
—
|
|
9,990
|
|
41,163
|
|
2,673,255
|
|
|
Resources
|
2012
|
616,250
|
|
460,000
|
|
—
|
|
111,875
|
|
—
|
|
9,189
|
|
36,436
|
|
1,233,750
|
|
|
Stephen R. Reynolds
|
2014
|
517,307
|
|
845,900
|
|
1,394,749
|
|
418,470
|
|
—
|
|
346
|
|
55,947
|
|
3,232,719
|
|
|
EVP, General Counsel
and Secretary
|
2013
|
500,000
|
|
481,000
|
|
460,303
|
|
1,428,714
|
|
—
|
|
89
|
|
290,152
|
|
3,160,258
|
|
|
Christina T. Morrison
|
2014
|
515,385
|
|
—
|
|
622,399
|
|
83,454
|
|
257,000
|
|
—
|
|
344,857
|
|
1,823,095
|
|
|
SVP, Finance
|
2013
|
140,385
|
|
129,000
|
|
615,980
|
|
1,023,000
|
|
99,000
|
|
—
|
|
96,279
|
|
2,103,644
|
|
|
(1)
|
Messrs. Foss, Sutherland and Reynolds and Ms. McKee each deferred a portion of their salaries for fiscal 2013 and 2014 under the 2007 Savings Incentive Retirement Plan and Mr. Sutherland and Ms. McKee each deferred a portion of their salaries for fiscal 2012. These amounts for fiscal 2014 are reflected in the Non-Qualified Deferred Compensation Table for Fiscal Year 2014 and in this column.
|
|
(2)
|
Includes payments under the Bonus Plan for each of Messrs. Foss, Sutherland and Reynolds and Ms. McKee. For fiscal 2014, also includes one-time bonus amounts paid to Messrs. Foss, Sutherland and Reynolds and Ms. McKee in December 2013 to recognize the critical role each of them played in positioning the Company for and executing a successful initial public offering as follows: for Mr. Foss, $2,367,800, for Mr. Sutherland, $704,700, for Ms. McKee, $558,000, and for Mr. Reynolds, $432,900. For fiscal 2012, Mr. Foss’ bonus amount includes a signing bonus of $500,000, which was intended to cover relocation and commuting expenses, as well as $1,012,500, which was his target bonus, prorated for six months. For fiscal 2013, Ms. Morrison was guaranteed a bonus amount of $129,000, which was intended to compensate her for her forgone bonus at her previous employer and her fiscal 2013 bonus under the MIB was prorated to reflect the portion of the year that she was employed by us.
|
|
(3)
|
Includes the aggregate grant date fair value of restricted stock units and performance stock units granted in the respective fiscal year computed in accordance with FASB ASC Topic 718. Also includes, with respect to fiscal 2013, the grant date fair value of restricted stock issued in the ISPO Exchange Offer to Messrs. Foss, Sutherland and Reynolds and Ms. McKee. See discussion of ISPO Exchange Offer below. The grant date fair value per share for restricted stock, restricted stock units and performance stock units was equal to the appraisal price of a share of Company common stock on the date of grant while we were a private company, was equal to the price per share of our common stock in our initial public offering for restricted stock units granted on December 11, 2013 and, since December 12, 2013, is based on the closing price of a share of our common stock on the NYSE on the date of grant. For performance stock units, the grant date fair value reported for fiscal 2014 is based upon the probable outcome of the performance condition at the grant date and is as follows: for Mr. Foss, $5,098,046, for Mr. Sutherland and Ms. McKee, $203,942, for Mr. Reynolds, $163,158, and for Ms. Morrison, $81,591. At the highest level of performance, the grant date fair value would be as follows: for Mr. Foss, $10,196,091, for Mr. Sutherland and Ms. McKee, $407,884, for Mr. Reynolds, $326,317, and for Ms. Morrison, $163,182. For additional information on the valuation assumptions and more discussion with respect to the restricted stock, restricted stock units, and performance stock units refer to Note 10 to the audited consolidated financial statements.
|
|
(4)
|
This column represents the aggregate grant date fair value computed in accordance with FASB ASC Topic 718. The amounts shown for each fiscal year include the grant date fair value for performance-based stock options granted prior to such fiscal year for which vesting was subject to EBIT targets where such target was not established at the time the
|
66
option was granted, as targets for later years had not been determined. As future targets are determined in future years, additional grant date fair value will be reflected in the years in which such targets are set. For Mr. Sutherland and Ms. McKee, includes the incremental grant date fair value of the Missed Year Options in fiscal 2014 as follows: for Mr. Sutherland, $5,051,185 and for Ms. McKee, $3,203,859. See “Components of Executive Compensation - Equity Incentives - Vesting of Performance-based Options” for additional information. See “Grants of Plan Based Awards for Fiscal Year 2014” for additional information on stock options granted or deemed granted in 2014. Fiscal 2013 also includes the incremental fair value of Replacement Stock Options in the ISPO Exchange Offer, computed as of the modification date in accordance with FASB ASC Topic 718, with respect to the modified award. See the discussion of the ISPO Exchange Offer below. For Mr. Reynolds, the fiscal 2013 amount also includes the incremental grant date fair value of the Replacement Stock Options he received and the grant date fair value of the ISPO that he was granted in fiscal 2013, but later exchanged in fiscal 2013 for restricted stock and Replacement Stock Options. For additional information on the valuation assumptions and more discussion with respect to the stock options, refer to Note 10 to the audited consolidated financial statements.
|
(5)
|
Includes amounts earned on deferred compensation in excess of 120% of the applicable federal rate, based upon the above-market return at the time the rate basis was set.
|
|
(6)
|
The following are included in this column for 2014:
|
|
a.
|
The aggregate incremental cost to us of the following perquisites: car allowance, premium payments for disability insurance, premium payments for an excess health insurance plan, payments for an executive physical, parking fees paid by the Company, costs associated with personal use of Company-owned tickets or the Company-owned suite at sports stadiums with respect to Messrs. Foss and Reynolds and Ms. Morrison, relocation expenses with respect to Ms. Morrison, and, for Mr. Foss, personal use of the Company aircraft and personal use of a Company-provided car and driver.
|
|
b.
|
With regard to Mr. Foss, $789,658 for Mr. Foss’ personal use of the Company aircraft and personal use of the Company’s Net Jets share. The calculation of incremental cost for personal use of Company aircraft includes the variable costs incurred as a result of personal flight activity: aircraft fuel, landing fees, telephone communications and any travel expenses for the flight crew. The variable costs for the Company’s Net Jets share include the regular hourly charge, the fuel variable charge, international flat fees and other fees. With regard to Ms. Morrison, $304,179 for relocation expenses incurred by Ms. Morrison and paid under our relocation program (including a tax gross up of $73,391 as provided for in the program).
|
|
c.
|
Premium payments for term life insurance or the Survivor Income Protection Plan as follows: for Mr. Foss, $1,308, for Mr. Sutherland, $29,953, for Ms. McKee, $5,548, for Mr. Reynolds, $1,308 and for Ms. Morrison, $1,308.
|
|
d.
|
Amounts that constitute the Company match to the Savings Incentive Retirement Plan for fiscal 2014 of $10,500 for each of Messrs. Foss, Sutherland and Reynolds and Ms. McKee.
|
|
e.
|
The dollar value of dividend equivalents accrued or credited on restricted stock units and performance stock units, as dividends were not factored into the grant date fair value required to be reported for the restricted stock unit awards. Also includes the cash dividends accrued on restricted stock awards, which will be paid out on the applicable vesting date.
The total value of dividend equivalents accrued or credited on restricted stock units and performance stock units and the total value of cash dividends accrued on restricted stock for the executive officers is as follows: for Mr. Foss, $271,096, for Mr. Sutherland, $32,756, for Ms. McKee, $32,756, for Mr. Reynolds, $21,646, and for Ms. Morrison, $14,978 (dividend equivalents only).
|
Grants of Plan-Based Awards for Fiscal Year 2014
The following table provides information about equity awards granted or deemed granted to our named executive officers in fiscal 2014.
67
|
Name
|
Grant Date
|
Committee Meeting Date
|
Estimated Future
Payouts under
Non-Equity
Incentive Plan Awards
(1)
|
Estimated Future
Payouts under
Equity
Incentive Plan Awards
|
All Other Stock Awards: Number of Shares of Stock or Units
|
All Other Option Awards: Number of Securities Underlying Options
|
Exercise or Base Price of Option Awards
(2)
($/sh)
|
Grant Date Fair Value of Stock and Option Awards
(3)
|
|||||||||||||||||||||||||
|
Thres-hold
|
Target
|
Max
|
Thres-hold (#)
|
Target (#)
|
Max (#)
|
||||||||||||||||||||||||||||
|
Foss
|
11/11/2013
|
11/11/2013
|
—
|
|
—
|
|
—
|
|
—
|
|
181,250
|
|
(4)
|
—
|
|
—
|
|
—
|
|
$
|
13.90
|
|
(5)
|
$
|
1,551,500
|
|
|||||||
|
12/11/2013
|
11/11/2013
|
—
|
|
—
|
|
—
|
|
—
|
|
—
|
|
—
|
|
500,000
|
|
(6)
|
—
|
|
—
|
|
$
|
10,000,000
|
|
||||||||||
|
12/20/2013
|
12/20/2013
|
—
|
|
—
|
|
—
|
|
—
|
|
—
|
|
—
|
|
—
|
|
770,417
|
|
(7)
|
$
|
23.92
|
|
$
|
5,215,723
|
|
|||||||||
|
12/20/2013
|
12/20/2013
|
—
|
|
—
|
|
—
|
|
—
|
|
—
|
|
—
|
|
106,565
|
|
(8)
|
—
|
|
—
|
|
$
|
2,549,035
|
|
||||||||||
|
12/20/2013
|
12/20/2013
|
—
|
|
—
|
|
—
|
|
106,565
|
|
213,129
|
|
426,258
|
|
(9)
|
—
|
|
—
|
|
—
|
|
$
|
5,098,046
|
|
||||||||||
|
Sutherland
|
11/11/2013
|
11/11/2013
|
—
|
|
—
|
|
—
|
|
—
|
|
31,250
|
|
(4)
|
—
|
|
—
|
|
—
|
|
$
|
11.63
|
|
(5)
|
$
|
303,125
|
|
|||||||
|
11/11/2013
|
11/11/2013
|
—
|
|
—
|
|
—
|
|
—
|
|
—
|
|
—
|
|
—
|
|
470,220
|
|
(10
|
)
|
(10
|
)
|
$
|
5,051,185
|
|
|||||||||
|
12/11/2013
|
11/11/2013
|
—
|
|
—
|
|
—
|
|
—
|
|
—
|
|
—
|
|
93,750
|
|
(6)
|
—
|
|
—
|
|
$
|
1,875,000
|
|
||||||||||
|
12/20/2013
|
12/20/2013
|
—
|
|
—
|
|
—
|
|
—
|
|
—
|
|
—
|
|
—
|
|
30,817
|
|
(7)
|
$
|
23.92
|
|
$
|
208,631
|
|
|||||||||
|
12/20/2013
|
12/20/2013
|
—
|
|
—
|
|
—
|
|
—
|
|
—
|
|
—
|
|
4,263
|
|
(8)
|
—
|
|
—
|
|
$
|
101,971
|
|
||||||||||
|
12/20/2013
|
12/20/2013
|
—
|
|
—
|
|
—
|
|
4,263
|
|
8,526
|
|
17,052
|
|
(9)
|
—
|
|
—
|
|
—
|
|
$
|
203,942
|
|
||||||||||
|
McKee
|
11/11/2013
|
11/11/2013
|
—
|
|
—
|
|
—
|
|
—
|
|
31,250
|
|
(4)
|
—
|
|
—
|
|
—
|
|
$
|
11.63
|
|
(5)
|
$
|
303,125
|
|
|||||||
|
11/11/2013
|
11/11/2013
|
—
|
|
—
|
|
—
|
|
—
|
|
—
|
|
—
|
|
—
|
|
297,195
|
|
(11
|
)
|
(11
|
)
|
$
|
3,203,859
|
|
|||||||||
|
12/11/2013
|
11/11/2013
|
—
|
|
—
|
|
—
|
|
—
|
|
—
|
|
—
|
|
93,750
|
|
(6)
|
—
|
|
—
|
|
$
|
1,875,000
|
|
||||||||||
|
12/20/2013
|
12/20/2013
|
—
|
|
—
|
|
—
|
|
—
|
|
—
|
|
—
|
|
—
|
|
30,817
|
|
(7)
|
$
|
23.92
|
|
$
|
208,631
|
|
|||||||||
|
12/20/2013
|
12/20/2013
|
—
|
|
—
|
|
—
|
|
—
|
|
—
|
|
—
|
|
4,263
|
|
(8)
|
—
|
|
—
|
|
$
|
101,971
|
|
||||||||||
|
12/20/2013
|
12/20/2013
|
—
|
|
—
|
|
—
|
|
4,263
|
|
8,526
|
|
17,052
|
|
(9)
|
—
|
|
—
|
|
—
|
|
$
|
203,942
|
|
||||||||||
|
Reynolds
|
11/11/2013
|
11/11/2013
|
—
|
|
—
|
|
—
|
|
—
|
|
31,250
|
|
(4)
|
—
|
|
—
|
|
—
|
|
$
|
14.99
|
|
(5)
|
$
|
251,563
|
|
|||||||
|
12/11/2013
|
11/11/2013
|
—
|
|
—
|
|
—
|
|
—
|
|
—
|
|
—
|
|
57,500
|
|
(6)
|
—
|
|
—
|
|
$
|
1,150,000
|
|
||||||||||
|
12/20/2013
|
12/20/2013
|
—
|
|
—
|
|
—
|
|
—
|
|
—
|
|
—
|
|
—
|
|
24,654
|
|
(7)
|
$
|
23.92
|
|
$
|
166,908
|
|
|||||||||
|
12/20/2013
|
12/20/2013
|
—
|
|
—
|
|
—
|
|
—
|
|
—
|
|
—
|
|
3,411
|
|
(8)
|
—
|
|
—
|
|
$
|
81,591
|
|
||||||||||
|
12/20/2013
|
12/20/2013
|
—
|
|
—
|
|
—
|
|
3,411
|
|
6,821
|
|
13,642
|
|
(9)
|
—
|
|
—
|
|
—
|
|
$
|
163,158
|
|
||||||||||
|
Morrison
|
11/11/2013
|
11/11/2013
|
$
|
63,438
|
|
$
|
253,750
|
|
$
|
482,125
|
|
—
|
|
—
|
|
—
|
|
—
|
|
—
|
|
—
|
|
—
|
|
||||||||
|
12/11/2013
|
11/11/2013
|
—
|
|
—
|
|
—
|
|
—
|
|
—
|
|
—
|
|
25,000
|
|
(6)
|
—
|
|
—
|
|
$
|
500,000
|
|
||||||||||
|
12/20/2013
|
12/20/2013
|
—
|
|
—
|
|
—
|
|
—
|
|
—
|
|
—
|
|
—
|
|
12,327
|
|
(7)
|
$
|
23.92
|
|
$
|
83,454
|
|
|||||||||
|
12/20/2013
|
12/20/2013
|
—
|
|
—
|
|
—
|
|
—
|
|
—
|
|
—
|
|
1,706
|
|
(8)
|
—
|
|
—
|
|
$
|
40,808
|
|
||||||||||
|
12/20/2013
|
12/20/2013
|
—
|
|
—
|
|
—
|
|
1,706
|
|
3,411
|
|
6,822
|
|
(9)
|
—
|
|
—
|
|
—
|
|
$
|
81,591
|
|
||||||||||
|
(1)
|
The amounts represent the threshold, target, and maximum payouts under our MIB for the fiscal 2014 performance period. The payment for threshold performance is 25% of target on all measures.
|
|
(2)
|
The exercise price of the options granted after our initial public offering is the closing price of our common stock on the NYSE on the date of grant.
|
|
(3)
|
This column shows the full or incremental grant date fair value of stock options, restricted stock units and performance stock units granted or deemed granted to our named executive officers in fiscal 2014 under FASB ASC Topic 718. The grant date fair value for performance stock units granted in fiscal 2014 assumes achievement of the target amount. For additional information on the valuation assumptions, refer to Note 10 to our audited consolidated financial statements. These amounts do not correspond to the actual value that will be received by the named executive officers.
|
68
|
(4)
|
Represents performance-based stock options granted under the 2007 Stock Plan to certain of our named executive officers in prior fiscal years, for which the vesting was subject to the 2014 EBIT target and such target was not established at the time the option was granted, as targets for later years had not been determined. Named executive officers may receive all, or less than all, of the target amount of performance-based options when certain events occur, including the achievement of certain percentage returns by our Sponsors. See the discussion under “Performance-Based Stock Options” below. Shares underlying options granted vest in 25% increments on each of the first four anniversaries of the original date of grant and upon the attainment of certain EBIT targets that are established by the compensation committee within the first ninety days of each fiscal year and described in the Compensation Discussion and Analysis and the narrative following this table. These stock options will expire ten years from the original date of grant. The EBIT targets associated with the grants of performance-based options in this table are listed below under “Performance-Based Stock Options.” The grant date fair value for these previously granted performance-based stock options reflects the value attributable only to those options whose vesting is based on 2014 targets, which were set on November 11, 2013, as that is the only target that had been determined during fiscal 2014. As future targets are determined in future years, additional grant date fair value will be reflected in the years in which such targets are set.
|
|
(5)
|
The exercise price was equal to the most recent appraisal price of a share of the Company’s common stock on the original date of grant, which was prior to our initial public offering, and for Messrs. Foss and Sutherland and Ms. McKee, the exercise price reflects the reduction of $1.06 per share, in connection with the spin-off of Seamless Holdings Corporation on October 26, 2012, which was the portion of the appraisal price of a share of Company common stock allocated to each share of Seamless Holdings Corporation common stock.
|
|
(6)
|
These restricted stock units were granted under the 2013 Plan and vest annually 1/3 per year over three years, subject to the grantee’s continued employment with the Company.
|
|
(7)
|
These stock options were granted under the 2013 Plan and vest annually 25% per year over four years and have a ten-year term, subject to the grantee’s continued employment with the Company.
|
|
(8)
|
These restricted stock units were granted under the 2013 Plan vest annually 25% per year over four years, subject to the grantee’s continued employment with the Company.
|
|
(9)
|
These are performance stock units granted under the 2013 Plan that vest annually 1/3 per year, provided that the performance target, adjusted earnings per share, is met for the first year, fiscal 2014. As of the end of fiscal 2014, the performance target was satisfied and these performance stock units are now time-based and will vest 1/3 on each of December 20, 2014, December 20, 2015 and December 20, 2016, subject to the grantee’s continued employment with the Company through the applicable vesting date.
|
|
(10)
|
Represents stock options granted in previous fiscal years (Missed Year Options) under the 2007 Stock Plan that were modified on November 11, 2013 to provide for additional vesting opportunity upon the achievement of certain price per share targets in our initial public offering and in the subsequent 18 months. Grant date fair value represents incremental accounting expense under FASB Topic 718 recognized in fiscal 2014 related to the modification. See "Compensation Discussion and Analysis - Components of Executive Compensation - Equity Incentives - Vesting of Performance-based Options" for additional information. The grant dates, associated numbers of options and exercise prices of Mr. Sutherland's Missed Year Options are as follows:
|
|
Grant Date
|
Number of Options
|
Exercise Price
|
|||||
|
1/26/2007
|
235,659
|
|
$
|
5.44
|
|
||
|
2/27/2007
|
85,500
|
|
$
|
5.44
|
|
||
|
3/5/2008
|
17,811
|
|
$
|
9.74
|
|
||
|
9/2/2009
|
50,000
|
|
$
|
8.59
|
|
||
|
3/2/2010
|
50,000
|
|
$
|
9.48
|
|
||
|
6/22/2011
|
31,250
|
|
$
|
11.63
|
|
||
69
|
(11)
|
Represents stock options granted in previous fiscal years (Missed Year Options) under the 2007 Stock Plan that were modified on November 11, 2013 to provide for additional vesting opportunity upon the achievement of certain price per share targets in our initial public offering and in the subsequent 18 months. Grant date fair value represents incremental accounting expense under FASB Topic 718 recognized in fiscal 2014 related to the modification. See "Compensation Discussion and Analysis - Components of Executive Compensation - Equity Incentives - Vesting of Performance-based Options" for additional information. The grant dates, associated numbers of options and exercise prices of Ms. McKee's Missed Year Options are as follows:
|
|
Grant Date
|
Number of Options
|
Exercise Price
|
|||||
|
1/26/2007
|
145,321
|
|
$
|
5.44
|
|
||
|
2/27/2007
|
71,250
|
|
$
|
5.44
|
|
||
|
3/5/2008
|
11,874
|
|
$
|
9.74
|
|
||
|
3/2/2010
|
37,500
|
|
$
|
9.48
|
|
||
|
6/22/2011
|
31,250
|
|
$
|
11.63
|
|
||
Narrative Disclosure to Summary Compensation Table and Grants of Plan Based Awards Table
Performance-Based Stock Options
The performance targets for 50% of the stock options granted to our named executive officers through June 2013 are based upon our annual EBIT. If we do not achieve the performance target for any particular fiscal year, but we do achieve a cumulative performance target at the end of a later fiscal year, then all installments of performance-based options that did not become vested because of a missed performance target or targets in a prior year will vest. Our stock options granted after June 2011 provide that annual and cumulative EBIT targets for performance-based stock options will be established by the compensation committee within the first ninety days of each fiscal year based upon the Company’s business plan as approved by our board. For example, performance-based options granted to certain of our named executive officers in fiscal 2011 had only an EBIT target for fiscal 2011 and those granted in fiscal 2012 had only an EBIT target for fiscal 2012 at the time of grant. The EBIT target for fiscal 2014 was set by the compensation committee in November 2013 at $823.2 million. The compensation committee establishes EBIT targets for each fiscal year in November of that fiscal year based upon the Company’s business plan. The compensation committee may make adjustments for unforeseen events that were not reflected in the business plan when it determines whether the Company achieved the performance target.
When we calculate our EBIT (which calculation is subject to review and approval by the compensation committee) for purposes of determining whether we have achieved our annual EBIT target, we take our net income and increase it by: (1) net interest expense and (2) the provision for income taxes. We are then required to exclude a number of categorical amounts as follows:
|
•
|
any extraordinary gains or losses, cumulative effect of a change in accounting principle, income or loss from disposed or discontinued operations and any gains or losses on disposed or discontinued operations, all as determined in accordance with generally accepted accounting principles;
|
|
•
|
any gain or loss greater than $2 million attributable to asset dispositions, contract terminations and similar items, provided that losses on contract terminations and asset dispositions in connection with client contract terminations are limited in any given fiscal year to $5 million;
|
|
•
|
any increase in amortization or depreciation resulting from the application of purchase accounting to the 2007 Transaction, including the current amortization of existing acquired intangibles;
|
|
•
|
any gain or loss from the early extinguishment of indebtedness, including any hedging obligation or other derivative instrument;
|
|
•
|
any impairment charge or similar asset write-off required by generally accepted accounting principles;
|
|
•
|
any non-cash compensation expense resulting from the application of the authoritative accounting pronouncement for share-based compensation expense or similar accounting requirements;
|
|
•
|
any expenses or charges related to any equity offering, acquisition, disposition, recapitalization, refinancing or similar transaction, including the 2007 Transaction;
|
|
•
|
any transaction, management, monitoring, consulting, advisory and related fees and expenses paid or payable to the Sponsors;
|
70
|
•
|
the effects of changes in foreign currency translation rates from the rates used in the calculation of the EBIT targets. The 2011 and later EBIT targets are based on the foreign currency translation rates used in the Business Plan approved by our board for the applicable year;
|
|
•
|
the impact of the 53rd week of operations on our financial results during any 53-week fiscal year; and
|
|
•
|
with respect to fiscal 2015 and later, the impact of transformation expenses, which include severance and other charges and branding-related charges.
|
Our calculation of EBIT is adjusted for acquisitions as follows:
|
•
|
for small acquisitions, which have purchase prices of less than $20 million each, there is no adjustment until the total consideration for all small acquisitions exceeds $20 million in any fiscal year, and then the EBIT targets will be adjusted for the percentage of EBIT that results from the cumulative amounts of such acquisitions over $20 million; and
|
|
•
|
for larger acquisitions, which have purchase prices of more than $20 million, our EBIT targets are adjusted based on the amount of EBIT that we project for that acquisition when it is approved by our board.
|
Our calculation of EBIT also is adjusted when we sell a business by an amount equal to the last twelve months of earnings of the divested business.
During the time period in which the performance-based stock options have been outstanding, there were fiscal years when we achieved the applicable annual EBIT target (2007, 2011 and 2013), fiscal years when we did not achieve the applicable annual EBIT target but the Board determined to vest a portion of the performance-based options whose vesting was subject to that fiscal year’s target (2008 and 2009) and fiscal years when we did not achieve the applicable annual EBIT target and none of the performance-based stock options whose vesting was subject to the achievement of that fiscal year’s EBIT target vested (2010 and 2012). The compensation committee determined on November 18, 2014 that the performance-based options whose vesting was based upon the 2014 target will vest.
Amendment to Vesting of Outstanding Performance-Based Options
On November 11, 2013, the compensation committee approved a form of amendment to all outstanding Non-Qualified Option Agreements under the 2007 Stock Plan modifying the vesting provisions relating to outstanding stock options subject to performance-based vesting conditions granted under the 2007 Stock Plan. This amendment provided that at our initial public offering, 50% of any then-unvested performance-based options that did not meet applicable performance thresholds in prior years (the “Missed Year Options”) would become vested if the price of our common stock in the offering equaled or exceeded $20.00 per share. In addition, during the 18-month period following our initial public offering, if the closing trading price for our common stock equaled or exceeded $25.00 per share over any twenty consecutive trading-day period, 100% of the Missed Year Options would become vested. As a result of meeting these performance targets, all Missed Year Options vested as of March 5, 2014.
Some or all of the performance-based options also will vest if certain other events occur, including the achievement of a return or internal rate of return by our Sponsors. For example, if our Sponsors were to sell a portion of their investment in us and, in connection with that sale, achieve an internal rate of return (i) on or after the third anniversary of the grant date of the options for options granted prior to June 2012 and (ii) at any time for options granted in June 2012 or later equal to 15%, or, for options granted prior to June 2012, prior to the third anniversary of the grant date, that equals or exceeds 200% of that Sponsor’s investment, the sale would be a qualified partial liquidity event and a percentage of the unvested performance-based options would vest. The percentage will be based upon the percentage of our Sponsors’ interest in us that was sold in the qualified partial liquidity event. In addition, if there is a change of control of us in which our sponsors do not achieve the return or internal rate of return described above, a portion of the unvested performance-based options will vest, with the percentage vesting based upon the percentage of eligible performance-based options that had previously vested (all unvested time-based options will vest on a change of control). Upon death, disability or retirement (attaining at least age 60 with five years of service), unvested performance-based options that would have vested during the twelve-month period immediately following termination had the termination not occurred during that period will vest if the performance targets for that period are satisfied. Time-based options that would have vested in the year following retirement, death or disability would also vest according to the vesting schedule. In addition, if employment terminates due to death, disability or retirement, the exercise period for vested options is one year, rather than the 90-day period that is otherwise available for terminations other than for cause. All performance-based options terminate on the date of termination of employment in the case of termination for cause.
ISPO Exchange Offer
On July 29, 2013, we closed the ISPO Exchange Offer whereby we offered to holders of outstanding ISPO awards (including Messrs. Foss, Sutherland, Reynolds and Ms. McKee) the ability to exchange such awards for new grants of Restricted Stock
71
equal to the spread value of the ISPO and a number of Replacement Stock Options equal to the number of ISPOs exchanged minus the number of shares of Restricted Stock granted. The exercise price of the Replacement Stock Options ($16.21) was equal to the fair market value of the Company’s common stock on the date of grant based upon the most recent appraisal price of our common stock on the date of grant and had vesting schedules based upon the vesting schedules of the ISPOs that they replaced. The grants of Restricted Stock and Replacement Stock Options were made to certain of our named executive officers by the stock committee on July 31, 2013.
Vesting Terms of Outstanding Time-Based Stock Options, Restricted Stock Units and Performance Stock Units
Form information on the vesting terms of outstanding time-based stock options, restricted stock units and performance stock units, see "Components of Executive Compensation - Equity Incentives - New Equity Program."
Employment Agreements and Change of Control Arrangements
We have employment agreements with all of the named executive officers for indeterminate periods terminable by either party, in most cases subject to post-employment severance and benefit obligations. While we do have these agreements in place, from time to time, it has been necessary to renegotiate some terms upon actual termination.
For more information regarding change of control and severance payments for our named executive officers, see the disclosure under “Potential Post-Employment Benefits.”
Mr. Foss
In connection with his employment with us, we entered into an employment letter agreement and an agreement relating to employment and post-employment competition, dated May 7, 2012, with Mr. Foss, which was later amended in June 2013. Mr. Foss’ letter agreement provides that Mr. Foss will serve as Chief Executive Officer and President of the Company and will be elected to our board so long as we are controlled by investment funds associated with or designated by our Sponsors. Thereafter, Mr. Foss, while he remains the Chief Executive Officer and President, will be included as a nominee for election to our board at each annual stockholders meeting.
Mr. Foss is employed with us “at-will” and may be terminated at any time, subject to the severance provisions contained in his employment letter agreement. Mr. Foss’ initial annual base salary was $1,350,000, and is subject to periodic review by the compensation committee. The compensation committee may, in its discretion, increase Mr. Foss’ annual base salary. Mr. Foss’ annual cash bonus will be determined by the compensation committee under our Bonus Plan. For fiscal 2012, however, Mr. Foss received a guaranteed bonus of $1,012,500 (his 2012 target bonus prorated for six months). His target bonus for fiscal 2014 was equal to 150% of his annual base salary. When we hired Mr. Foss, we committed to providing a total annual compensation package to Mr. Foss for fiscal 2013 based on total annual compensation values at the 75th percentile of the Company’s peer group. In determining Mr. Foss’ fiscal 2014 compensation, the compensation committee was required, under the terms of Mr. Foss' Employment Letter Agreement, to take into consideration Mr. Foss’ total annual compensation framework in respect of fiscal 2012 and 2013 (including the fact that his total annual compensation package has been targeted at the 75th percentile of the Company’s peer group, the fact that his compensation included equity compensation and other relevant factors), and determine Mr. Foss’ actual total annual compensation package for fiscal 2014 in good faith and based on Mr. Foss’ and the Company’s performance. Mr. Foss received a one-time signing bonus of $500,000 intended to cover commuting and relocation expenses and is eligible to participate in all retirement, welfare and perquisite programs applicable to senior executives of the Company at benefit levels applicable to senior executives. Mr. Foss also receives a $2,000 monthly car allowance. Under our agreement with Mr. Foss, he is entitled to serve on two for-profit boards, subject to the prior approval of the board. His current service on the boards of Cigna Corporation and UDR, Inc. was approved by our board in connection with the approval of his employment arrangements.
Mr. Foss invested $3,750,000 through the purchase of our common stock at a per share purchase price equal to $14.96, which was equal to the fair market value (the appraisal price on the date of purchase) per share of our common stock. In addition, Mr. Foss received an ISPO to purchase 500,000 shares of our common stock, of which Mr. Foss exercised the first installment for 100,000 shares of our common stock, which he had committed to do under the terms of his employment letter agreement. The remaining portion of Mr. Foss’s ISPO grant was exchanged in connection with the ISPO Exchange Offer described above. Mr. Foss was also granted a nonqualified stock option to purchase 1,450,000 shares of our common stock, one-half of which has time-based vesting conditions and the other half of which has service and performance-based vesting conditions, except that the performance-based tranche that would vest based on our performance for fiscal year 2012 was to become fully vested so long as Mr. Foss remained employed with us through the applicable vesting date (regardless of whether the 2012 EBIT target was achieved). Accordingly, even though we did not achieve our 2012 EBIT target, in May 2013, the compensation committee vested the tranche of Mr. Foss’s performance options whose vesting was subject to the 2012 EBIT target. In addition, under his Employment Letter Agreement, Mr. Foss is required to hold shares of our common stock having a fair market value equal to six times his base salary.
72
If we terminate Mr. Foss’ employment without cause or Mr. Foss resigns for good reason prior to a change of control (as defined in his agreement relating to employment and post-employment competition), Mr. Foss will receive severance payments equal to two times his base salary plus two times his most recent annual bonus, paid over a twenty-four month period. In addition, he would receive a pro rata portion of his bonus for the year of his termination, based upon our actual performance. Mr. Foss would also continue to receive his car allowance and to participate in our medical and life insurance programs for the same period. Finally, Mr. Foss’ time-based stock options that would have vested in the 24-month period following his termination date, but for his termination of employment, would vest immediately.
Mr. Foss’ agreement relating to employment and post-employment competition contains a double trigger in the event of a change of control. If we experience a change of control (as defined in Mr. Foss’ agreement), and in anticipation of or within three years after that change of control Mr. Foss is terminated without cause or resigns for good reason, he would be entitled to similar payments as if he were terminated without cause or resigned for good reason prior to a change of control. Mr. Foss would receive severance payments equal to two times his base salary plus two times his most recent annual bonus or his target bonus, whichever is higher, paid over a twenty-four month period. In addition, he would receive a pro rata portion of his bonus for the year of his termination payable in a lump sum within 60 days of the date of termination. Mr. Foss would also continue to receive his car allowance and to participate in our medical and life insurance programs for the severance period. Finally, Mr. Foss’ stock options would vest in accordance with the applicable plan document or award agreement.
Upon any termination of employment, Mr. Foss would also receive any accrued amounts (earned but unpaid salary and benefits) owed to him by us. During his employment term and for a period of two years thereafter, Mr. Foss would be subject to a non-competition restriction that would restrict him from associating with or acquiring or maintaining an ownership interest in a competing business and non-solicitation restrictions.
Messrs. Sutherland and Reynolds and Ms. McKee
In connection with the 2007 Transaction, we entered into employment agreements relating to employment and post-employment competition with Mr. Sutherland and Ms. McKee in July 2007. We entered into an employment agreement relating to employment and post-employment competition with Mr. Reynolds in connection with his commencement of employment with us.
If Messrs. Sutherland or Reynolds or Ms. McKee is terminated for any reason other than “cause,” the agreements generally provide, subject to execution of a general release, for severance payments equal to 6 to 18 months of pay based on years of service, plus the continuation of certain other benefits, including basic group medical and life insurance coverage and continuation of a car allowance, during the period of such payment. The agreements contain non-competition provisions pursuant to which the executive would be restricted from associating with or acquiring or maintaining an ownership interest in a competing business for a period of two years (or one year if employment is terminated by us other than for cause or is terminated by the employee for good reason after a change of control).
Upon a change of control of us as described in the agreements, in addition to the severance payments discussed in the preceding paragraph, each executive also would be entitled to a lump sum payment if their employment is terminated within the three years following such change of control or in anticipation of such change of control. The agreements provide a payout in the event of a change of control based on a “double trigger” (more fully described under “Potential Post-Employment Benefits”). The agreements, including the “double trigger” provision, were negotiated with the Sponsors in connection with the 2007 Transaction. These provisions are intended to align executive and stockholder interests by enabling executives to consider corporate transactions that are in the best interests of the stockholders and our other constituents without undue concern over whether the transactions may jeopardize the executives’ own employment.
Ms. Morrison
We entered into an agreement relating to employment and post-employment competition with Ms. Morrison in connection with her commencement of employment with us. The agreement provides for post-employment benefits should Ms. Morrison be terminated by us without cause. Those benefits include between 26 and 52 weeks of severance pay (Ms. Morrison is currently entitled to 26 weeks of severance pay), depending on the length of time Ms. Morrison has been employed by the Company, and basic group medical coverage and continuation of the Company-paid auto allowance during the severance pay period. The agreements contain non-disclosure and non-disparagement provisions to which Ms. Morrison must adhere for certain periods of time after termination of employment, as well as a two-year non-competition provision and a two-year non-solicitation provision.
Indemnification Agreements
We have entered into Indemnification Agreements with our named executive officers, among others, that provide rights that are substantially similar to those to which they are currently entitled pursuant to our certificate of incorporation and by-laws and that spell out further the procedures to be followed in connection with indemnification.
73
Outstanding Equity Awards at 2014 Fiscal Year-End
The following table provides information with respect to outstanding equity awards held by our named executive officers at 2014 fiscal year-end.
74
|
Option Awards
|
Stock Awards
|
||||||||||||||||||||||
|
Name
|
Number of Securities Underlying Unexercised Options(#) Exercisable
(1)
|
Number of Securities Underlying Unexercised Options(#) Unexercisable
(2)
|
Equity Incentive Plan Awards: Number of Securities Underlying Unexercised Unearned Options
(3)
(#)
|
Option
Exercise
Price
|
Option
Expiration
Date
|
Number of
Shares or
Units of
Stock That
Have Not
Vested (#)
|
Market Value
of Shares or
Units of Stock
That Have Not
Vested
|
||||||||||||||||
|
Foss
|
725,000
|
|
362,500
|
|
362,500
|
|
$
|
13.90
|
|
(4)
|
6/6/2022
|
—
|
|
—
|
|
||||||||
|
311,909
|
|
935,729
|
|
—
|
|
$
|
16.21
|
|
6/20/2023
|
—
|
|
—
|
|
||||||||||
|
—
|
|
—
|
|
—
|
|
—
|
|
—
|
|
205,250
|
|
(5)
|
$5,426,806
|
|
|||||||||
|
85,750
|
|
257,248
|
|
—
|
|
$16.21
|
|
7/31/2022
|
—
|
|
—
|
|
|||||||||||
|
—
|
|
—
|
|
—
|
|
—
|
|
—
|
|
42,752
|
|
(6)
|
$
|
1,130,363
|
|
||||||||
|
—
|
|
—
|
|
504,104
|
|
(8)
|
$13,328,501
|
|
|||||||||||||||
|
—
|
|
770,417
|
|
—
|
|
$
|
23.92
|
|
12/20/2023
|
||||||||||||||
|
—
|
|
—
|
|
—
|
|
—
|
|
—
|
|
107,440
|
|
(9)
|
$2,840,703
|
|
|||||||||
|
—
|
|
—
|
|
—
|
|
—
|
|
—
|
|
306,201
|
|
(10)
|
$8,095,967
|
||||||||||
|
Sutherland
|
992,250
|
|
—
|
|
—
|
|
$
|
5.44
|
|
(4)
|
1/26/2017
|
—
|
|
—
|
|
||||||||
|
360,000
|
|
—
|
|
—
|
|
$
|
5.44
|
|
(4)
|
2/27/2017
|
—
|
|
—
|
|
|||||||||
|
75,000
|
|
—
|
|
—
|
|
$
|
9.74
|
|
(4)
|
3/5/2018
|
—
|
|
—
|
|
|||||||||
|
200,000
|
|
—
|
|
—
|
|
$
|
8.59
|
|
(4)
|
9/2/2019
|
—
|
|
—
|
|
|||||||||
|
200,000
|
|
—
|
|
—
|
|
$
|
9.48
|
|
(4)
|
3/2/2020
|
—
|
|
—
|
|
|||||||||
|
187,500
|
|
31,250
|
|
31,250
|
|
$
|
11.63
|
|
(4)
|
6/22/2021
|
—
|
|
—
|
|
|||||||||
|
23,629
|
|
70,889
|
|
—
|
|
$
|
16.21
|
|
7/9/2023
|
—
|
|
—
|
|
||||||||||
|
—
|
|
—
|
|
—
|
|
—
|
|
—
|
|
23,325
|
|
(7)
|
$616,710
|
|
|||||||||
|
8,609
|
|
17,219
|
|
—
|
|
$
|
16.21
|
|
7/31/2021
|
—
|
|
—
|
|
||||||||||
|
—
|
|
—
|
|
—
|
|
—
|
|
—
|
|
6,782
|
|
(6)
|
$179,316
|
||||||||||
|
—
|
|
—
|
|
—
|
|
—
|
|
—
|
|
94,519
|
|
(8)
|
$2,499,094
|
||||||||||
|
—
|
|
30,817
|
|
—
|
|
$
|
23.92
|
|
12/20/2023
|
—
|
|
—
|
|
||||||||||
|
—
|
|
—
|
|
—
|
|
—
|
|
—
|
|
4,298
|
|
(9)
|
$113,639
|
|
|||||||||
|
—
|
|
—
|
|
—
|
|
—
|
|
—
|
|
12,249
|
|
(10)
|
$323,871
|
||||||||||
|
McKee
|
300,000
|
|
—
|
|
—
|
|
$
|
5.44
|
|
(4)
|
2/27/2017
|
—
|
|
—
|
|
||||||||
|
50,000
|
|
—
|
|
—
|
|
$
|
9.74
|
|
(4)
|
3/5/2018
|
—
|
|
—
|
|
|||||||||
|
150,000
|
|
—
|
|
$
|
9.48
|
|
(4)
|
3/2/2020
|
—
|
|
—
|
|
|||||||||||
|
187,500
|
|
31,250
|
|
31,250
|
|
$
|
11.63
|
|
(4)
|
6/22/2021
|
—
|
|
—
|
|
|||||||||
|
23,629
|
|
70,889
|
|
—
|
|
$
|
16.21
|
|
7/9/2023
|
—
|
|
—
|
|
||||||||||
|
—
|
|
—
|
|
—
|
|
—
|
|
—
|
|
23,325
|
|
(7)
|
$616,710
|
|
|||||||||
|
8,609
|
|
17,219
|
|
—
|
|
$
|
16.21
|
|
7/31/2021
|
—
|
|
—
|
|
||||||||||
|
—
|
|
—
|
|
—
|
|
—
|
|
—
|
|
6,782
|
|
(6)
|
$179,316
|
|
|||||||||
|
—
|
|
—
|
|
—
|
|
—
|
|
—
|
|
94,519
|
|
(8)
|
$2,499,094
|
||||||||||
|
—
|
|
30,817
|
|
—
|
|
$
|
23.92
|
|
12/20/2023
|
—
|
|
—
|
|
||||||||||
|
—
|
|
—
|
|
—
|
|
—
|
|
—
|
|
4,298
|
|
(9)
|
$
|
113,639
|
|
||||||||
|
—
|
|
—
|
|
—
|
|
—
|
|
—
|
|
12,249
|
|
(10)
|
$323,871
|
||||||||||
|
Reynolds
|
62,500
|
|
93,750
|
|
93,750
|
|
$
|
14.99
|
|
12/5/2022
|
—
|
|
—
|
|
|||||||||
|
18,903
|
|
56,712
|
|
—
|
|
$
|
16.21
|
|
7/9/2023
|
—
|
|
—
|
|
||||||||||
|
—
|
|
—
|
|
—
|
|
—
|
|
—
|
|
18,660
|
|
(7)
|
$493,368
|
|
|||||||||
|
22,194
|
|
33,290
|
|
—
|
|
$
|
16.21
|
|
7/31/2023
|
—
|
|
—
|
|
||||||||||
|
—
|
|
—
|
|
—
|
|
—
|
|
—
|
|
2,710
|
|
(6)
|
$71,652(9)
|
|
|||||||||
|
—
|
|
—
|
|
—
|
|
—
|
|
—
|
|
57,972
|
|
(8)
|
$1,532,778
|
||||||||||
|
—
|
|
24,654
|
|
—
|
|
$
|
23.92
|
|
12/20/2023
|
—
|
|
—
|
|
||||||||||
|
—
|
|
—
|
|
—
|
|
—
|
|
—
|
|
3,439
|
|
(9)
|
$90,927
|
|
|||||||||
|
—
|
|
—
|
|
—
|
|
—
|
|
—
|
|
9,800
|
|
(10)
|
$259,104
|
||||||||||
|
Morrison
|
46,500
|
|
139,500
|
|
—
|
|
$
|
16.21
|
|
7/9/2023
|
—
|
|
—
|
|
|||||||||
|
—
|
|
—
|
|
—
|
|
—
|
|
—
|
|
28,734
|
|
$759,725
|
|
||||||||||
|
—
|
|
12,327
|
|
—
|
|
$
|
23.92
|
|
12/20/2023
|
—
|
|
(7)
|
—
|
|
|||||||||
|
—
|
|
—
|
|
—
|
|
—
|
|
—
|
|
25,205
|
|
(8)
|
$666,425
|
||||||||||
|
—
|
|
—
|
|
—
|
|
—
|
|
—
|
|
1,720
|
|
(9)
|
$45,477
|
|
|||||||||
|
—
|
|
—
|
|
—
|
|
—
|
|
—
|
|
4,901
|
|
(10)
|
$129,571
|
||||||||||
75
|
(1)
|
The amounts in this column are time-based and performance-based options that have vested.
|
|
(2)
|
These are options subject to time-based vesting (including options previously also subject to performance-based conditions which have been satisfied) and, other than as set forth below, vest 25% per year over four years from the date of grant, provided that the named executive officer is still employed by us, with certain exceptions (disability, retirement or death). See “Narrative Disclosure to Summary Compensation Table and Grants of Plan Based Awards Table”. Other than as set forth below, all options were granted on the date that is ten years prior to the listed expiration date. Certain options included in this column were granted in connection with our ISPO Exchange Offer and have vesting schedules based upon the original vesting schedule of the ISPO that was exchanged, as set forth below.
|
|
Expiration Date
|
Grant Date
|
Vesting Schedule
|
Equity Instrument
|
|||
|
February 27, 2017
|
February 27, 2007
|
25% on each of the first four anniversaries of
January 26, 2007.
|
Option
|
|||
|
July 31, 2021
|
July 31, 2013
|
One-third on each of December 15, 2013, 2014 and 2015.
|
Replacement Option (ISPO Exchange)
|
|||
|
July 31, 2022
|
July 31, 2013
|
25% on each of December 15, 2013, 2014, 2015 and 2016.
|
Replacement Option (ISPO Exchange)
|
|||
|
July 31, 2023
|
July 31, 2013
|
20% vested and 20% to vest on each of December 15, 2013, 2014, 2015 and 2016.
|
Replacement Option (ISPO Exchange)
|
|||
|
(3)
|
These are the total number of options that are still subject to performance-based vesting. 25% of the performance-based portion of the original award (which was originally 50% of the total award) is eligible to vest each year over four years from the grant date, which in each case was 10 years prior to the listed expiration date, provided that certain annual EBIT performance targets are satisfied and the named executive officer is still employed by us, with certain exceptions (disability, retirement or death). See “Narrative Disclosure to Summary Compensation Table and Grants of Plan Based Awards Table”.
|
|
(4)
|
Exercise price reflects the reduction of $1.06 per share, which was the portion of the appraisal price of a share of Company common stock allocated to each share of Seamless Holdings Corporation common stock. Seamless Holdings Corporation was spun off by the Company on October 26, 2012 and the exercise prices of all stock options issued prior to that time were adjusted to reflect the spinoff.
|
|
(5)
|
These are restricted stock units granted to Mr. Foss on June 20, 2013 that are subject to time-based vesting and vest 25% per year over four years from the date of grant, provided Mr. Foss is still employed by us on such dates. The number of restricted stock units listed includes dividend equivalents accrued with respect to such award.
|
|
(6)
|
These are shares of restricted stock that were granted as part of the ISPO Exchange on July 31, 2013 and vest as follows:
|
|
Name
|
Vesting Schedule
|
|
|
Foss
|
Of the 57,002 originally granted, 25% on each of December 15, 2013, 2014, 2015 and 2016.
|
|
|
Sutherland
|
Of the 10,172 originally granted, one-third on each of December 15, 2013, 2014 and 2015.
|
|
|
McKee
|
Of the 10,172 originally granted, one-third on each of December 15, 2013, 2014 and 2015.
|
|
|
Reynolds
|
Of the 4,516 shares originally granted, 20% vested immediately upon grant and 20% vest on each of December 15, 2013, 2014, 2015 and 2016.
|
|
|
(7)
|
These are restricted stock units granted on July 9, 2013 that are subject to time-based vesting and vest 25% per year over four years from the date of grant, provided that the named executive officer is still employed by us on such dates. The number of restricted stock units listed includes dividend equivalents accrued with respect to such award.
|
|
(8)
|
These are restricted stock units granted on December 11, 2013 that are subject to time-based vesting and vest 1/3 per year over three years from the date of grant, provided that the named executive officer is still employed by us on such dates. The number of restricted stock units listed includes dividend equivalents accrued with respect to such award.
|
|
(9)
|
These are restricted stock units granted on December 20, 2013 that are subject to time-based vesting and vest 25% per year over four years from the date of grant, provided that the named executive officer is still employed by us on such dates. The number of restricted stock units listed also includes dividend equivalents accrued with respect to such award.
|
|
(10)
|
These are performance stock units granted on December 20, 2013 that, subject to the achievement of an earnings per share target for fiscal 2014, vest 1/3 per year over three years from the date of grant, provided that the named executive
|
76
officer is still employed by us on such dates. The 2014 adjusted earnings per share target was achieved at 108.5% of target, resulting in 142,5% of that target award earned and the number of performance stock units shown is predicated at this achievement level. The number of performance stock units listed include dividend equivalents.
|
(11)
|
If a participant’s service with the Company or any of its subsidiaries terminates due to retirement (as defined in the 2007 Stock Plan or the 2013 Stock Plan, as applicable), the installment of stock options, restricted stock, restricted stock units or performance stock units that are scheduled to vest on the next vesting date (subject to achievement of the performance target(s), if applicable) following such termination will immediately vest. Only Mr. Sutherland is retirement eligible as of the end of fiscal 2014. For information on the value of equity awards which would vest upon his retirement as of such date, see the table of estimated payments presented in “Potential Post-Employment Benefits” below.
|
Options Exercises and Stock Vested Table for Fiscal Year 2014
The following table sets forth information with respect to the named executive officers concerning the exercise of options and the vesting of restricted stock and restricted stock unit awards in fiscal 2014.
|
Name
|
Option Awards
|
Stock awards
|
||||||||||||
|
Number of Shares Acquired on Exercise
(1)
(#)
|
Value Realized on Exercise ($)
|
Number of Shares Acquired on Vesting
(2)
(#)
|
Value Realized on Vesting
(3)
($)
|
|||||||||||
|
Foss
|
—
|
|
—
|
|
||||||||||
|
82,475
|
|
(4)
|
$
|
2,076,597
|
|
|||||||||
|
Sutherland
|
—
|
|
—
|
|
||||||||||
|
11,142
|
|
(4)
|
$
|
290,415
|
|
|||||||||
|
McKee
|
611,876
|
|
$
|
13,106,384
|
|
|||||||||
|
11,142
|
|
(4)
|
$
|
290,415
|
|
|||||||||
|
Reynolds
|
—
|
|
—
|
|
||||||||||
|
7,105
|
|
(4)
|
$
|
189,229
|
|
|||||||||
|
Morrison
|
||||||||||||||
|
—
|
|
—
|
|
9,551
|
|
(4)
|
$
|
258,267
|
|
|||||
|
(1)
|
Shares actually delivered on exercise were net of amounts withheld related to the payment of the exercise price and taxes.
|
|
(2)
|
This column includes restricted stock and restricted stock units that have vested during the fiscal year. For restricted stock units, the number of shares acquired on vesting includes dividend equivalents.
|
|
(3)
|
Value realized on exercise and vesting is calculated based upon the closing price of our common stock on the NYSE at the date of exercise or vesting, as applicable.
|
|
(4)
|
For each named executive officer, shares actually delivered upon vesting of restricted stock units were net of amounts withheld related to taxes.
|
Pension Benefits for Fiscal 2014
No named executive officer participated in a pension benefit plan during fiscal 2014.
77
Non-Qualified Deferred Compensation for Fiscal Year 2014
Our named executive officers are eligible to participate in two deferred compensation plans: the 2007 Savings Incentive Retirement Plan and the 2005 Deferred Compensation Plan, each of which is discussed in “Other Components of Compensation” in the Compensation Discussion and Analysis above. Mr. Sutherland and Ms. McKee participated in predecessor plans to the 2007 Savings Incentive Retirement Plan and retain balances in these older plans, all of which are reflected in the table.
|
Name
|
Executive
Contributions in
Last FY
(1)
($)
|
Registrant
Contributions in
Last FY
(2)
($)
|
Aggregate Earnings in
Last FY
(3)
($)
|
Aggregate
Withdrawals/
Distributions ($)
|
Aggregate
Balance at Last
FYE
(3)(4)
($)
|
||||||||||
|
Foss
|
|||||||||||||||
|
2007 SIRP
|
83,430
|
|
10,500
|
|
6,114
|
|
—
|
|
176,607
|
|
|||||
|
2005 Deferred Comp Plan
|
—
|
|
—
|
|
—
|
|
—
|
|
—
|
|
|||||
|
Sutherland
|
|||||||||||||||
|
2007 SIRP
|
50,163
|
|
10,500
|
|
147,406
|
|
—
|
|
3,003,125
|
|
|||||
|
2005 Deferred Comp Plan
|
—
|
|
—
|
|
—
|
|
—
|
|
—
|
|
|||||
|
McKee
|
|||||||||||||||
|
2007 SIRP
|
39,190
|
|
10,500
|
|
83,067
|
|
—
|
|
1,702,939
|
|
|||||
|
2005 Deferred Comp Plan
|
—
|
|
—
|
|
—
|
|
—
|
|
—
|
|
|||||
|
Reynolds
|
|||||||||||||||
|
2007 SIRP
|
42,196
|
|
10,500
|
|
2,645
|
|
—
|
|
86,319
|
|
|||||
|
2005 Deferred Comp Plan
|
—
|
|
—
|
|
—
|
|
—
|
|
—
|
|
|||||
|
Morrison
|
|||||||||||||||
|
2007 SIRP
|
—
|
|
—
|
|
—
|
|
—
|
|
—
|
|
|||||
|
2005 Deferred Comp Plan
|
—
|
|
—
|
|
—
|
|
—
|
|
—
|
|
|||||
|
(1)
|
All amounts in this column were deferred under the 2007 Savings Incentive Retirement Plan during fiscal 2014. All amounts deferred are included in the named executive officer’s salary amount in the Summary Compensation Table.
|
|
(2)
|
These amounts constitute the Company match to the 2007 Savings Incentive Retirement Plan for fiscal 2014, which were made in November 2014. These amounts are reported in the Summary Compensation Table.
|
|
(3)
|
Our Summary Compensation Table for previous years included the amount of salary deferred and Company match for those years. The amounts in the Executive Contributions column are included in the Salary column in the Summary Compensation Table for fiscal 2014 and amounts in the Registrant Contributions column are reflected in the All Other Compensation column and separately footnoted. To the extent that earnings for the 2007 Savings Incentive Retirement Plan and the 2005 Deferred Compensation Plan exceeded 120% of the applicable federal rate, those excess earnings were reported in the Change in Pension Value and Non-Qualified Deferred Compensation Earnings column of the Summary Compensation Table as follows: for Mr. Foss, $799, for Mr. Sutherland, $19,261, for Ms. McKee, $10,854, and for Mr. Reynolds, $346.
|
|
(4)
|
The Aggregate Balance at Fiscal Year End includes amounts that were reported in the Summary Compensation Table for the last three fiscal years as follows: for Mr. Foss, $170,343 (for 2013 and 2014 only), for Mr. Sutherland, $232,313, for Ms. McKee, $176,555, and for Mr. Reynolds, $83,477 (for 2013 and 2014 only).
|
The 2007 Savings Incentive Retirement Plan enables our named executive officers to defer up to 25% of their base salaries, which become our unfunded deferral obligations. We credit amounts deferred with interest at the Moody’s Long Term Corporate Baa Bond Index rate for October of the previous year; which was 5.31% beginning January 1, 2014. From September 28, 2013 until December 31, 2013, we credited amounts deferred with an interest rate equal to 4.58%. Employees who participate in the 2007 Savings Incentive Retirement Plan are eligible to receive a Company matching contribution equal to 25-75% of the first 6% of their salary deferred up to the Internal Revenue Code maximum deferral limit ($17,500 for fiscal 2014). This match is intended to replicate what the employee would have received if he or she had been able to participate in our 401(k) plans. For fiscal 2014, the Company matching contribution was 60%. Participants in the Savings Incentive Retirement Plan may only make account withdrawals if there occurs an unforeseeable emergency as defined in the plan and the withdrawal is approved by the plan administrative committee. Company match amounts are not available for a hardship withdrawal. The 2007 Savings Incentive Retirement Plan is settled in cash following termination of employment and in compliance with certain requirements of Section 409A of the Internal Revenue Code.
Named executive officers may defer receipt of part or all of their cash compensation under our 2005 Deferred Compensation Plan. The 2005 Deferred Compensation Plan allows executives to save for retirement in a tax-deferred way at minimal cost to us. Under this unfunded Plan, amounts deferred by the executive are credited at an interest rate based on Moody’s Long Term
78
Corporate Baa Bond Index rate for October of the previous year, which was 5.31% beginning January 1, 2014. From September 28, 2013 until December 31, 2013, we credited amounts deferred with an interest rate equal to 4.58%. The 2005 Deferred Compensation Plan permits participants to select a payment schedule at the time they make their deferral election, subject to a three-year minimum deferral period as long as the participant remains employed by us. All or a portion of the amount then credited to a deferral account may be withdrawn, if the withdrawal is necessary in light of a severe financial hardship.
The interest rate for both the 2007 Savings Incentive Retirement Plan and the 2005 Deferred Compensation Plan will be adjusted on January 1, 2015 based on the Moody’s Long Term Corporate Baa Bond Index rate for October 2014 which is 4.69%.
In connection with, and effective upon, our initial public offering, our board of directors approved the assumption by us of the obligations of Aramark Services, Inc. under the 2007 Savings Incentive Retirement Plan and the 2005 Deferred Compensation Plan, each as amended from time to time.
Potential Post-Employment Benefits
Our named executive officers may be eligible to receive benefits in the event their employment is terminated (1) upon their retirement, disability or death, (2) by Aramark without cause, or (3) in certain circumstances following a change of control. The amount of benefits will vary based on the reason for the termination.
The following sections present a discussion and calculations, as of October 3, 2014, of the estimated benefits the named executive officers would receive in these situations. Although the calculations are intended to provide reasonable estimates of the potential benefits, they are based on numerous assumptions discussed in the footnotes to the table and may not represent the actual amount an executive would receive if an eligible termination event were to occur.
In addition to the amounts disclosed in the following sections, each of our named executive officers would retain the amounts which he or she has earned or accrued over the course of his or her employment prior to the termination event, such as the executive’s balances under our deferred compensation plans and previously vested equity awards. For further information about previously earned and accrued amounts, see “Summary Compensation Table,” “Outstanding Equity Awards at Fiscal 2014 Year-End” and “Nonqualified Deferred Compensation for Fiscal Year 2014.”
Treatment of Equity Grants
Retirement, Death, Disability
Upon retirement, death or disability, our named executive officers are eligible to vest in one additional tranche of time-based equity awards, performance-based stock options and performance stock units (subject to the achievement of the applicable performance target(s)) that are scheduled to vest in the year following retirement, death or disability, except that with respect to performance stock units, if the date of termination due to retirement, death or disability occurs prior to the date achievement of the applicable performance goals is certified by the compensation committee or stock committee (the “PSU Determination Date”), then the first tranche of performance stock units will become vested on the original vesting date (subject to achievement of the applicable performance target(s)). In addition, vested stock options remain exercisable for one year following termination of employment due to death, disability or retirement. Mr. Sutherland has attained the retirement age under our equity plans.
Termination for Cause
Upon termination for cause, all vested stock options and unvested equity awards are immediately canceled.
Termination without Cause or Resignation for Good Reason Prior to a Change of Control
Upon termination without cause prior to a change of control, all of our named executive officers’ unvested equity awards (other than Mr. Foss’ stock options) are canceled and the named executive officers have 90 days to exercise vested stock options. Upon a termination of Mr. Foss’ employment without cause or Mr. Foss’ resignation for good reason, in each case, prior to a change of control, all time-based stock options that would have vested during the 24-month period following his termination would vest immediately.
Change of Control
With respect to equity awards granted under the 2007 Stock Plan, upon a change of control, all time-based equity awards become immediately vested. If the change of control occurs prior to the final fiscal year of the performance-based vesting schedule for a performance-based option, a percentage of the then-unvested performance-based options which would have been eligible for vesting based on EBIT performance for the fiscal year during which the change of control occurs and those eligible for any subsequent fiscal years, equal to (x) 100% multiplied by (y) a quotient, the numerator of which is the aggregate number of performance-based options that previously became vested options prior to the fiscal year in which the change of control occurs, and the denominator of which is the aggregate number of performance-based options that were eligible to become
79
vested options if all EBIT Targets were achieved prior to the fiscal year in which the change of control occurs, will vest. Some or all of the performance-based options also will vest if certain other events occur, including the achievement of a return or internal rate of return by our Sponsors. See “Narrative Disclosure to Summary Compensation Table and Grants of Plan Based Awards Table.”
With respect to equity awards granted under the 2013 Plan, upon a termination without cause (or, if applicable, a resignation for good reason) during the 2 year period following a change of control, all time-based equity awards become immediately vested and all performance stock units will become vested (i) at the target level if the termination date occurs prior to the PSU Determination Date and (ii) based on the actual performance level if the termination date occurs on or after the PSU Determination Date.
Retirement, Death and Disability
The named executive officers do not receive any special benefits upon retirement, disability or death, other than those under the Survivor Income Protection Plan and/or life insurance, as applicable, in the case of death as more fully described in the “Other Components of Compensation” section of the Compensation Discussion and Analysis, or with regard to their equity awards that are more fully described above.
Termination for Cause or Resignation without Good Reason
Mr. Foss
Mr. Foss is not entitled to any benefits under his employment agreement upon termination for cause or resignation without good reason. Termination for cause as defined in his employment agreement means termination of employment due to conviction or plea of guilty or nolo contendere to a felony or a misdemeanor involving moral turpitude that has a substantial adverse effect on Mr. Foss’ ability to perform his duties, willful and continuous failure to perform his or her duties after written notice, willful and continuous failure to perform lawfully assigned duties that are consistent with his position with the Company, willful violation of our Business Conduct Policy that causes us material harm or intentionally working against our best interests, in each case after notice and failure to cure the conduct within 15 business days. Mr. Foss is subject to a two-year non-competition covenant if his employment is terminated for cause or if he resigns without good reason.
Messrs. Sutherland and Reynolds and Ms. McKee
Messrs. Sutherland and Reynolds and Ms. McKee are not entitled to any benefits under their employment agreements upon termination for cause or resignation without good reason. With respect to Messrs. Sutherland and Reynolds and Ms. McKee, termination for cause means termination of employment due to conviction or plea of nolo contendere to a felony, intentional fraud or dishonesty with regard to us that causes us demonstrable harm, willful and continuous failure to perform his or her lawfully assigned duties that are consistent with his or her position, willful violation of our Business Conduct Policy that causes material harm to us or our business reputation or intentionally working against our best interests, in each case after notice and failure to cure the conduct within 10 business days. Messrs. Sutherland and Reynolds and Ms. McKee are subject to a two-year non-competition covenant if their employment is terminated for cause or if they resign without good reason.
Ms. Morrison
Ms. Morrison is not entitled to any benefits under her employment agreements upon termination for cause or resignation without good reason. With respect to Ms. Morrison, termination for cause means termination of employment due to conviction or plea of nolo contendere to a felony, fraud or dishonesty, willful failure to perform her assigned duties, willful violation of our Business Conduct Policy or intentionally working against our best interests. Ms. Morrison is subject to a one-year non-competition and a two-year non-solicitation covenant if her employment is terminated for cause or she resigns without good reason.
Termination without Cause / Resignation for Good Reason in the Absence of a Change of Control
Mr. Foss
If Mr. Foss is terminated without cause or resigns for good reason in the absence of a change of control (as defined in his agreement and described below), he will be entitled to the following payments and benefits:
|
•
|
a pro rata bonus for the year of termination based upon actual performance;
|
|
•
|
continued payment of his base salary for 24 months;
|
|
•
|
two times the prior year’s bonus (if any) paid over 24 months (for 2012, this is deemed to be his full target bonus);
|
|
•
|
continued participation in the Company’s basic medical and life insurance programs on the same terms as prior to termination for a period of 24 months, both for Mr. Foss and for his dependents;
|
|
•
|
continued payment of his car allowance for 24 months;
|
80
|
•
|
immediate vesting of time-based stock options that would have vested during the 24 month period following his termination; and
|
|
•
|
all of his vested stock options, with 90 days following termination of employment to exercise.
|
Mr. Foss is subject to non-competition and non-solicitation provisions for the two year period following his termination of employment.
Messrs. Sutherland and Reynolds and Ms. McKee
If we terminate Messrs. Sutherland or Reynolds or Ms. McKee without cause, he or she will receive:
|
•
|
severance payments equal to his or her monthly base salary for 12 to 18 months, depending on length of service (Mr. Sutherland and Ms. McKee would receive severance for 18 months, while Mr. Reynolds would receive severance for 12 months, based on their respective length of service), made in the course of our normal payroll cycle;
|
|
•
|
participation in our basic medical and life insurance programs during the period over which he or she receives severance payments, with the employee’s share of premiums deducted from the severance payments;
|
|
•
|
continuation of his or her car allowance payments during the severance period; and
|
|
•
|
all of his or her vested stock options, with 90 days following termination of employment to exercise.
|
Messrs. Sutherland and Reynolds and Ms. McKee are subject to a two-year non-competition covenant if their employment is terminated in the absence of a change of control and it is reduced to one year if, following a change of control, they are terminated without cause or they resign for good reason.
Ms. Morrison
If we terminate Ms. Morrison without cause, she will receive:
|
•
|
severance payments equal to her monthly base salary for 26 weeks made in the course of our normal payroll cycle;
|
|
•
|
participation in our basic medical and life insurance programs during the period over which she receives severance payments, with her share of premiums deducted from the severance payments;
|
|
•
|
continuation of her car allowance payments, as applicable, during the severance period; and
|
|
•
|
all of her vested stock options, with 90 days following termination of employment to exercise.
|
Ms. Morrison is subject to non-disclosure and non-disparagement obligations, a one-year non-competition covenant and a two-year non-solicitation covenant after termination of employment under her agreement.
Termination without Cause or Resignation for Good Reason in Relation to a Change of Control
Mr. Foss
Our employment agreement with Mr. Foss contains a “double trigger”-to be initiated, there must be a change of control followed by an involuntary loss of employment or decrease in responsibilities within three years thereafter, or employment must be terminated in anticipation of a change of control. If we terminate Mr. Foss’ employment without cause during the three-year period following a change of control or he resigns for good reason following a change of control, Mr. Foss would receive:
|
•
|
a pro-rata portion of his annual target bonus in effect on the date of the change of control or on the date of termination, whichever is higher, in a lump sum;
|
|
•
|
two times his base salary in effect on the date of the change of control or on the date of termination, whichever is higher, payable over 24 months;
|
|
•
|
two times the higher of his annual target bonus in effect on the date of the change of control or his most recent annual bonus, whichever is higher, payable over 24 months;
|
|
•
|
outplacement counseling in an amount not to exceed 20% of his base salary, for a period of 24 months;
|
|
•
|
continued participation in our medical (for Mr. Foss and his dependents), life and disability insurance programs on the same terms as in effect immediately prior to his termination, for a period of 24 months;
|
|
•
|
continued payment of his car allowance, if provided at the time of termination, for a period of 24 months; and
|
|
•
|
accelerated vesting of outstanding equity-based awards or retirement plan benefits (this would not be applicable to Mr. Foss for 2014 as he does not have any unvested retirement plan benefits) as is specified under the terms of the
|
81
applicable plans. See “Narrative Disclosure to Summary Compensation Table and Grants of Plan Based Awards Table.”
Change of control is defined in Mr. Foss’ agreement relating to employment and post-employment competition to include the following:
|
•
|
an entity or group other than us, our Sponsors or one of our employee benefit plans acquires more than 50% of our voting stock;
|
|
•
|
the Company experiences a reorganization, merger or sale or disposition of substantially all of our assets or we purchase the assets or stock of another entity unless the stockholders prior to the transaction own at least 50% of the voting stock after the transaction and no person owns a majority of the voting stock (unless that ownership existed before the transaction); or
|
|
•
|
a majority of the members of our board are replaced during any 12-month period and the new directors are not endorsed by a majority of the Company’s board before the replacement or the replacement is not contemplated by our stockholders’ agreement.
|
In addition to termination by us following a change of control, Mr. Foss’ employment agreement provides the same benefits to him if he resigns for good reason following a change of control. Good reason is defined in Mr. Foss’ agreement relating to employment and post-employment competition as:
|
•
|
any diminution in title or reporting relationships, or substantial diminution in duties or responsibilities (other than a change of control after which we are no longer publicly held or independent) including the requirement that he report to any person or entity other than our board;
|
reduction in base salary or target annual bonus opportunity, other than, prior to a change of control, an across-the-board reduction applicable to all senior executives;
|
•
|
the relocation of his principal place of employment by more than 35 miles in a direction further away from his current residence;
|
|
•
|
a material decrease in his employee benefits in the aggregate; and
|
|
•
|
failure to pay or provide (in any material respect) the compensation and benefits under his employment letter agreement or his agreement relating to employment and post-employment competition.
|
Mr. Foss must provide 90 days’ written notice that he is resigning for good reason and the Company then has 30 days to cure. If the condition is not cured, Mr. Foss has 30 days from the end of the cure period to resign for good reason.
Mr. Foss’ employment agreement also provides that if any payments to Mr. Foss in connection with a change of control of the Company would constitute excess parachute payments that are subject to excise taxes under Section 4999 of the Internal Revenue Code, such payments will be subject to a reduction to avoid any such excise taxes that may be due, if such reduction results in Mr. Foss retaining a greater after-tax amount than if Mr. Foss paid the excise taxes otherwise due. Mr. Foss is not eligible to receive a gross-up payment in respect of any such excise taxes he may pay. During his employment term and for a period of two years thereafter, Mr. Foss would be subject to non-competition and non-solicitation restrictions with the Company.
Messrs. Sutherland and Reynolds and Ms. McKee
Our employment agreements with Messrs. Sutherland and Reynolds and Ms. McKee contain a “double trigger”-to be initiated, there must be a change of control followed by a termination of employment by us without cause or by them for good reason within three years thereafter, or in anticipation of a change of control. We chose to implement a “double trigger” because we were advised by Frederic W. Cook & Co., Inc. that a “double trigger” is more common in the market than a “single trigger.” With respect to Messrs. Sutherland and Reynolds and Ms. McKee, a change of control is deemed to occur if:
|
•
|
an entity or group other than our Sponsors acquires more than 50% of our voting stock;
|
|
•
|
the Company experiences a reorganization, merger or sale or disposition of substantially all of our assets or we purchase the assets or stock of another entity unless the stockholders prior to the transaction own at least 50% of the voting stock after the transaction and no person owns a majority of the voting stock (unless that ownership existed before the transaction); or
|
|
•
|
a majority of the members of our board are replaced during any 12-month period and the new directors are not endorsed by a majority of the Company’s board before the replacement or the replacement is not contemplated by our stockholders’ agreement.
|
82
In addition to termination by us following a change of control, the employment agreements with Messrs. Sutherland and Reynolds and Ms. McKee provide the same benefits to them if they resign for good reason following a change of control. Good reason is defined in their employment agreements as any of the following actions occurring after a change of control:
|
•
|
a decrease in base salary or target bonus;
|
|
•
|
a material decrease in aggregate employee benefits;
|
|
•
|
diminution in title or substantial diminution in reporting relationship or responsibilities; or
|
|
•
|
relocation of his or her principal place of business by 35 miles or more.
|
If Messrs. Sutherland’s or Reynolds’ or Ms. McKee’s employment is terminated by us without cause or if he or she resigns with good reason (as defined in his or her employment agreement), following a Change of Control, he or she is entitled to the following in addition to severance payments and benefits, which are also included in the “change of control” amounts in the table (see “Employment Agreements and Change of Control Arrangements”):
|
•
|
cash severance benefits based on a multiple of two times his or her base salary and target bonus (or the prior year’s actual bonus, if higher) over a two-year period according to our payroll cycle;
|
|
•
|
a lump sum payment, within 40 days after his or her termination date, equal to the portion of his or her target bonus attributable to the portion of the fiscal year served prior to termination, plus any earned but unpaid amounts;
|
|
•
|
continued medical, life and disability insurance at our expense for a two-year period following termination;
|
|
•
|
outplacement counseling in an amount not to exceed 20% of base salary; and
|
|
•
|
accelerated vesting of outstanding equity-based awards or retirement plan benefits (this would not be applicable to Messrs. Sutherland or Reynolds or Ms. McKee for 2013 as they do not have any unvested retirement plan benefits) as is specified under the terms of the applicable plans. See “Narrative Disclosure to Summary Compensation Table and Grants of Plan Based Awards Table.”
|
Messrs. Sutherland and Reynolds and Ms. McKee are subject to a one-year non-competition covenant if their employment is terminated without cause or they terminate for good reason, each after a change of control.
If the payments made to Mr. Sutherland or Ms. McKee were to result in excise taxes or interest and penalties, the Company is required to gross up the payments to Mr. Sutherland or Ms. McKee for the income or excise tax imposed. This gross-up provision ensures that Mr. Sutherland or Ms. McKee receives the full benefit of payments related to a change of control to which they are entitled. If a change of control were to have occurred at the end of fiscal 2014, excise tax would have been imposed on Messrs. Foss, Sutherland and Reynolds and Ms. McKee and, therefore, the table below includes any gross-up for excise taxes for Mr. Sutherland or Ms. McKee.
Mr. Reynolds’ employment agreement also provides that if any payments to Mr. Reynolds in connection with a change of control of the Company would constitute excess parachute payments that are subject to excise taxes under Section 4999 of the Internal Revenue Code, such payments will be subject to a reduction to avoid any such excise taxes that may be due, if such reduction results in Mr. Reynolds retaining a greater after-tax amount than if Mr. Reynolds paid the excise taxes otherwise due. Mr. Reynolds is not eligible to receive a gross-up payment in respect of any such excise taxes he may pay.
Ms. Morrison
Ms. Morrison is not entitled to any additional benefits under her employment agreement upon termination without cause after a change of control, other than severance benefits as follows:
|
•
|
severance payments equal to her monthly base salary for 26 weeks made in the course of our normal payroll cycle;
|
|
•
|
participation in our basic medical and life insurance programs during the period over which she receives severance payments, with her share of premiums deducted from the severance payments;
|
|
•
|
continuation of her car allowance payments during the severance period;
|
|
•
|
all of her vested stock options; and
|
|
•
|
accelerated vesting of unvested time-based options and restricted stock units in accordance with the applicable plan.
|
There is no concept of “good reason” in her employment agreement.
83
Estimated Benefits Upon Termination
The following table shows potential payments to our named executive officers under existing contracts, agreements, plans or arrangements, whether written or unwritten, for various scenarios involving a termination of employment, assuming a October 3, 2014 termination date and using the closing price of our common stock on the NYSE ($26.44) as of October 3, 2014. The named executive officers would also be eligible to receive their accrued deferred compensation (see “Nonqualified Deferred Compensation for Fiscal Year 2014”), which does not automatically accelerate upon a change of control, and the value of any vested stock options. Certain of the named executive officers have optional life insurance for which they pay 100% of the premium.
84
This table shows amounts that would be payable under existing employment and post-employment competition and other agreements.
|
Name
|
Retirement ($)
|
Death
(3)
($)
|
Disability ($)
|
Termination
without cause
(4)
($)
|
Change of Control
(5)
($)
|
||||||||||
|
Foss
(6)
|
|||||||||||||||
|
Cash Payment (Lump Sum)
|
—
|
|
2,000,000
|
|
—
|
|
2,085,750
|
|
2,085,750
|
|
|||||
|
Cash Payment (Over Time)
|
—
|
|
—
|
|
—
|
|
8,045,400
|
|
8,045,400
|
|
|||||
|
Acceleration of Unvested Equity Awards
(1)
|
—
|
|
18,331,690
|
|
18,331,690
|
|
13,652,579
|
|
51,644,859
|
|
|||||
|
Perquisites
(2)
|
—
|
|
—
|
|
—
|
|
77,325
|
|
367,845
|
|
|||||
|
Total
|
—
|
|
20,331,690
|
|
18,331,690
|
|
23,861,054
|
|
62,143,854
|
|
|||||
|
Sutherland
(7)
|
|||||||||||||||
|
Cash Payment (Lump Sum)
|
—
|
|
1,000,000
|
|
—
|
|
—
|
|
672,384
|
|
|||||
|
Cash Payment (Over Time)
|
—
|
|
4,122,640
|
|
—
|
|
1,260,720
|
|
12,340,619
|
|
|||||
|
Acceleration of Unvested Equity Awards
(1)
|
2,507,271
|
|
2,507,271
|
|
2,507,271
|
|
—
|
|
5,540,665
|
|
|||||
|
Perquisites
(2)
|
—
|
|
—
|
|
—
|
|
44,744
|
|
293,511
|
|
|||||
|
Total
|
2,507,271
|
|
7,629,911
|
|
2,507,271
|
|
1,305,464
|
|
18,847,179
|
|
|||||
|
McKee
(8)
|
|||||||||||||||
|
Cash Payment (Lump Sum)
|
—
|
|
1,500,000
|
|
—
|
|
—
|
|
525,300
|
|
|||||
|
Cash Payment (Over Time)
|
—
|
|
3,111,438
|
|
—
|
|
984,938
|
|
9,821,800
|
|
|||||
|
Acceleration of Unvested Equity Awards
(1)
|
—
|
|
2,507,271
|
|
2,507,271
|
|
—
|
|
5,540,665
|
|
|||||
|
Perquisites
(2)
|
—
|
|
—
|
|
—
|
|
20,782
|
|
163,725
|
|
|||||
|
Total
|
—
|
|
7,118,709
|
|
2,507,271
|
|
1,005,720
|
|
16,051,490
|
|
|||||
|
Reynolds
(9)
|
|||||||||||||||
|
Cash Payment (Lump Sum)
|
—
|
|
2,000,000
|
|
—
|
|
—
|
|
408,000
|
|
|||||
|
Cash Payment (Over Time)
|
—
|
|
—
|
|
—
|
|
510,000
|
|
4,124,000
|
|
|||||
|
Acceleration of Unvested Equity Awards
(1)
|
—
|
|
1,820,669
|
|
1,820,669
|
|
—
|
|
5,500,280
|
|
|||||
|
Perquisites
(2)
|
—
|
|
—
|
|
—
|
|
32,821
|
|
158,674
|
|
|||||
|
Total
|
—
|
|
3,820,669
|
|
1,820,669
|
|
542,821
|
|
10,190,954
|
|
|||||
|
Morrison
(10)
|
|||||||||||||||
|
Cash Payment (Lump Sum)
|
—
|
|
2,000,000
|
|
—
|
|
—
|
|
—
|
|
|||||
|
Cash Payment (Over Time)
|
—
|
|
—
|
|
—
|
|
253,750
|
|
253,750
|
|
|||||
|
Acceleration of Unvested Equity Awards
(1)
|
—
|
|
1,000,522
|
|
1,000,522
|
|
—
|
|
3,020,703
|
|
|||||
|
Perquisites
(2)
|
—
|
|
—
|
|
—
|
|
17,750
|
|
17,750
|
|
|||||
|
Total
|
—
|
|
3,000,522
|
|
1,000,522
|
|
271,500
|
|
3,292,203
|
|
|||||
|
(1)
|
Represents acceleration of unvested stock options, restricted stock, restricted stock units and performance stock units that would vest upon the occurrence of the specified event. Calculations are based upon the closing price of our common stock on the NYSE ($26.44) as of October 3, 2014.
|
|
(a)
|
Only Mr. Sutherland has attained the eligible retirement age of 60 under the 2007 Stock Plan and the 2013 Stock Plan. Therefore, the accelerated vesting for equity awards on retirement would apply only to Mr. Sutherland.
|
85
|
(b)
|
In the case of death or disability of any named executive officer, amounts were calculated assuming that all time-based options, restricted stock and restricted stock units scheduled to vest in fiscal 2015 vest and the performance-based options granted in 2011 and 2012 that were scheduled to vest based upon the achievement of the 2014 EBIT target would vest and performance stock units granted in fiscal 2014 at target scheduled to vest in 2015 (assuming the attainment of the performance target) vest.
|
|
(c)
|
Stock option amounts on a change of control for named executive officers assume that unvested performance-based options scheduled to vest based upon the achievement on the 2014 EBIT target that were granted in 2011 and 2012 vest at a rate of 100% which is the achieved rate for the vesting of performance-based stock options based on the 2014 EBIT target. Assumes that other events that would trigger vesting of performance-based options do not occur, including the achievement of a return or internal rate of return by our Sponsors. See “Grants of Plan Based Awards for Fiscal Year 2014” and “Narrative Disclosure to Summary Compensation Table and Grants of Plan Based Awards Table.” Unvested time based stock options, restricted stock and restricted stock units granted under the 2007 Stock Plan would become fully vested upon a change of control and unvested time-based stock options, restricted stock units and performance stock units would become fully vested if the named executive officer is terminated without cause (or, if applicable, resigns for good reason) during the two-year period following the change of control (which, for purposes of this table, is assumed to have occurred on the last day of fiscal 2014) such full vesting is reflected in the table.
|
|
(2)
|
The following assumptions were used in our calculation of the cost of perquisites in connection with termination of employment: a 7.5% increase annually for health insurance premiums, dental insurance premiums, vision insurance premiums and excess health, with 2014 used as the base year, and no increase annually for life and accident insurance premiums.
|
|
(3)
|
Includes amounts payable under the Survivor Income Protection Plan (for Mr. Sutherland and Ms. McKee), various term life insurance policies and accidental death and dismemberment policies for which we pay all or part of the premium, which amounts are reflected in the “Summary Compensation Table.”
|
|
(4)
|
For Mr. Foss, the “Termination Without Cause” column means termination without cause or resignation for Good Reason (as defined in his employment arrangements) prior to a change of control.
|
|
(5)
|
Cash payments and perquisites included in this column will only be paid to or received by the named executive officers if they are terminated following the change of control. Equity awards granted under the 2013 Stock Plan vest if the named executive officer is terminated without cause (or, if applicable, resigns for good reason) during the two-year period following the change of control.
|
|
(6)
|
Included in Mr. Foss’ perquisites: (a) in the case of termination without cause, are basic medical and life insurance coverage and a car allowance over a 24-month severance period; and (b) in the case of a change of control, are health care, accident, disability and survivor insurance premiums for two years and a car allowance for 24-months, as well as outplacement benefits of 20% of his base salary for 24 months. Mr. Foss would incur excise tax if a change of control of the Company had occurred on October 3, 2014, as his payout would be considered a parachute payment. He is not entitled to a 280G gross up, but under the terms of his employment agreement, if his payout on a change of control would be considered a parachute payment, we would reduce his payments if that reduction (to avoid the excise tax) would result in him receiving a greater after tax amount than he would have received had he been paid the full amount and then paid the excise tax. If Mr. Foss would receive a greater after tax amount if his payout were cut back to avoid the excise tax, his payments on change of control would be reduced. In the event that Mr. Foss’ payments were considered parachute payments, the Company would lose the tax deduction for all amounts it paid to Mr. Foss above the “base amount” as defined in the Internal Revenue Code.
|
(7)
|
(a)
|
Only Mr. Sutherland has attained the eligible retirement age of 60 under the 2007 Stock Plan and the 2013 Stock Plan. Therefore, the accelerated vesting for equity awards on retirement would apply only to Mr. Sutherland.
|
|
(b)
|
Included in the amount paid to Mr. Sutherland over time upon a change of control is $5,143,403 which is the gross up amount to compensate him for excise tax imposed.
|
|
(c)
|
Included in Mr. Sutherland’s perquisites: (i) in the case of termination without cause, are basic medical and life insurance coverage and a car allowance over an 18-month severance period; and (ii) in the case of a change of control, are health care, accident, disability and survivor insurance premiums for two years, a car allowance for eighteen months and outplacement benefits of 20% of his base salary.
|
86
(8)
|
(a)
|
Included in the amount paid to Ms. McKee over time upon a change of control is $4,182,412 which is the gross up amount to compensate her for excise tax imposed.
|
|
(b)
|
Included in Ms. McKee’s perquisites: (i) in the case of termination without cause, are basic life insurance coverage and a car allowance over an 18-month severance period; and (ii) in the case of a change of control, are health care, accident, disability and survivor insurance premiums for two years, a car allowance for 18 months, as well as outplacement benefits of 20% of her base salary.
|
(9)
|
(a)
|
Mr. Reynolds would incur excise tax if a change of control of the Company had occurred on October 3, 2014, as his payout would be considered a parachute payment. He is not entitled to a 280G gross up, but under the terms of his employment agreement, if his payout on a change of control would be considered a parachute payment, we would reduce his payments if that reduction (to avoid the excise tax) would result in him receiving a greater after tax amount than he would have received had he been paid the full amount and then paid the excise tax. If Mr. Reynolds would receive a greater after tax amount if his payout were cut back to avoid the excise tax, his payments on change of control would be reduced. In the event that Mr. Reynolds’ payments were considered parachute payments, the Company would lose the deduction for all amounts it paid to Mr. Reynolds above the “base amount” as defined in the Internal Revenue Code.
|
|
(b)
|
Included in Mr. Reynolds’ perquisites: (i) in the case of termination without cause, are basic medical and life insurance coverage and a car allowance over a 12-month severance period; and (ii) in the case of a change of control, are health care, accident, disability and survivor insurance premiums for two years, a car allowance for 12 months, and outplacement benefits of 20% of his base salary.
|
|
(10)
|
Included in Ms. Morrison’s perquisites, in the case of termination without cause, are basic medical and life insurance coverage and receipt of a car allowance over a 26-week severance period.
|
Director Compensation
Annual Cash Compensation for Board Service
For fiscal 2014, each non-employee director received $100,000 annually for service on the board, payable quarterly in arrears. The chairman of the Audit Committee was eligible to receive an additional annual retainer of $20,000, the chairmen of the Compensation Committee and the Nominating Committee were eligible to receive an additional annual retainer of $15,000 and the chairman of the Finance Committee was eligible to receive an additional annual retainer of $10,000, provided, in each case, that such committee chairmen were non-employee, non-Sponsor directors. In fiscal 2014, Mr. Ksansnak (Audit Committee) received additional fees for chairing the Audit Committee.
Annual Deferred Stock Unit Grant
In connection with our initial public offering, our non-employee directors received grants of deferred stock units (“DSUs”) under the 2013 Stock Plan in respect of service on the board in early fiscal 2014. These DSUs will vest on the first anniversary of the date of grant, subject to the director’s continued service on the board of directors through the vesting date, and will be settled in shares of the Company’s common stock on the first day of the seventh month following termination of service.
Under the Company’s current director compensation policy, non-employee directors are eligible for an annual grant of DSUs with a value of $125,000 each February. As a result, in February 2014, each member of the board who was not an employee of the Company received a grant of $125,000 worth of DSUs under the 2013 Stock Plan. These DSUs have the same vesting schedule and settlement terms as the December 2013 DSU grants. Directors who are appointed to the board during the year will be entitled to a prorated DSU grant. All DSUs accrue dividend equivalents from the date of grant until the date of settlement.
In November 2014, to ensure that directors who serve on the Board until the next annual meeting of stockholders but do not stand for re-election at the next annual meeting of stockholders after a particular grant date will not forfeit the DSUs without vesting, the board determined to change the vesting schedule of the DSUs automatically granted each February such that the DSUs will vest on the day prior to the Company’s next annual meeting of stockholders (rather than on the first anniversary of the date of grant). To make the vesting schedule of the DSUs granted on February 4, 2014 consistent with the revised vesting schedule for future grants of DSUs described above, the board accelerated the vesting of DSUs granted on February 4, 2014 so that such DSUs will vest on February 2, 2015, which is the day prior to the Corporation’s 2015 annual meeting of stockholders, subject to the directors’ continued service on the Board.
87
Director Deferred Compensation Plan
Prior to our going private transaction in January 2007, our non-employee directors could participate in our Deferred Compensation Plan for Directors, electing to receive all or part of an annual cash retainer in the form of deferred shares and/or deferred cash. We credit amounts deferred with interest at the Moody’s Long Term Corporate Baa Bond Index rate for October of the previous year; which was 4.58% from September 28, 2013 until December 31, 2013. Beginning January 1, 2014, the interest rate was 5.31%. This plan was frozen in 2007 and only Governor Kean, one of our former directors, retains a balance, which accrues interest.
Health and Welfare Premiums
Mr. Neubauer, our Chairman and former Chief Executive Officer, participates in the Company’s health and welfare programs, for which the Company pays a portion of the premiums. Mr. Neubauer received those benefits as an employee of the Company through December 31, 2013 and those benefits have continued after his retirement.
Non-Employee Directors
The following table sets forth compensation information for our non-employee directors in fiscal 2014. Governor Kean did not stand for re-election in November 2013.
|
Name
|
Fees Earned or Paid in Cash
(1)
($)
|
Stock Awards
(2)
($)
|
Option Awards
(3)
($)
|
Change in Pension Value and Nonqualified Deferred Compensation Earnings
(4)
($)
|
All Other Compensation
(5)
($)
|
Total ($)
|
||||||||||
|
Todd M. Abbrecht
|
80,707
|
150,000
|
|
—
|
|
—
|
|
1,231
|
|
231,938
|
||||||
|
Lawrence T. Babbio, Jr.
|
100,000
|
150,000
|
|
—
|
|
—
|
|
1,231
|
|
251,231
|
||||||
|
David A. Barr
|
80,707
|
150,000
|
|
—
|
|
—
|
|
1,166
|
|
223,993
|
||||||
|
Leonard S. Coleman, Jr.
|
100,000
|
150,000
|
|
—
|
|
—
|
|
1,231
|
|
251,231
|
||||||
|
Daniel J. Heinrich
|
88,587
|
142,120
|
|
—
|
|
—
|
|
1,166
|
|
231,873
|
||||||
|
Thomas H. Kean
|
11,685
|
—
|
|
—
|
|
351
|
|
—
|
|
12,036
|
||||||
|
James E. Ksansnak
|
120,000
|
150,000
|
|
—
|
|
—
|
|
1,231
|
|
271,231
|
||||||
|
Sanjeev Mehra
|
80,707
|
150,000
|
|
—
|
|
—
|
|
1,231
|
|
231,938
|
||||||
|
Stephen P. Murray
|
80,707
|
150,000
|
|
—
|
|
—
|
|
1,231
|
|
231,938
|
||||||
|
Joseph Neubauer
|
75,000
|
125,000
|
|
—
|
|
43,434
|
|
190,259
|
|
433,693
|
||||||
|
Stephen Sadove
|
88,587
|
142,120
|
|
—
|
|
—
|
|
1,166
|
|
231,873
|
||||||
|
(1)
|
Includes base director fees of $100,000, as well as chair fees of $20,000 for Mr. Ksansnak.
|
|
(2)
|
Represents the aggregate grant date fair value computed in accordance with FASB ASC Topic 718 with respect to the DSUs granted on December 11, 2013 (which had a grant date fair value of $20 per DSU) and February 4, 2014 (which had a grant date fair value of $24.99 per DSU). As of the end of fiscal 2014, directors held the following deferred stock units (including dividend equivalent units): Messrs. Babbio, Coleman, and Ksansnak each holds 62,343.6058 deferred stock units, Messrs. Abbrecht, Mehra, and Murray each holds 6,303.3124 deferred stock units. Messrs. Barr, Heinrich, and Sadove each holds 5,906.0787 deferred stock units. Mr. Neubauer holds 5,043.0532 deferred stock units. For additional information on the valuation assumptions and more discussion with respect to the stock options, refer to Note 10 to our audited consolidated financial statements.
|
|
(3)
|
As of the end of fiscal 2014, Mr. Neubauer held 486,249 outstanding stock options.
|
|
(4)
|
Includes amounts earned on deferred compensation in excess of 120% of the applicable federal rate, based upon the above-market return at the time the rate basis was set. Mr. Neubauer received interest on his balance in the Savings Incentive Retirement Plan until it was distributed to him in March and July 2014. Mr. Neubauer also receives interest on his deferred compensation that he deferred while he was an employee of the Company.
|
|
(5)
|
For directors other than Mr. Neubauer, consists of dividend equivalents accrued on deferred stock units as the value of dividends was not factored into the grant date fair value. With regard to Mr. Neubauer, includes dividend equivalents accrued on deferred stock units and his salary of $175,000 and his car allowance that he received as our employee through December 31, 2013. Also includes, with respect to Mr. Neubauer, company-paid premiums for health and welfare benefits equal to $10,933.
|
88
Item 12.
Security Ownership of Certain Beneficial Owners and Management and Related Stockholder Matters
Equity Compensation Plan Information
The following table sets forth information about Aramark common stock that may be issued under all of Aramark’s existing equity compensation plans as of October 3, 2014, including the 2013 Stock Incentive Plan (the “2013 Stock Plan”) and the Fifth Amended and Restated Aramark 2007 Management Stock Incentive Plan (the “2007 Stock Plan”).
|
(a)
|
(b)
|
(c)
|
|||||
|
Plan category
|
Number of securities to be issued upon exercise of outstanding options, warrants and rights
(1)
|
Weighted average exercise price of outstanding options, warrants and rights
|
Number of securities remaining available for future issuance (excluding securities reflected in column (a))
|
||||
|
Equity compensation plans approved by security holders:
|
29,125,725
|
|
2
|
$10.43
|
22,645,844
|
||
|
Equity compensation plans not approved by security holders:
|
--
|
|
--
|
--
|
|||
|
Total
|
29,125,725
|
|
$10.43
|
22,645,844
|
|||
|
(1)
|
Under the 2007 Plan, options, restricted stock units and restricted stock were granted to employees of or consultants to the Company. Deferred stock units were granted to directors of the Company under the 2007 Stock Plan. As of December 12, 2013, no further grants were made or may be made under the 2007 Stock Plan. Under the 2013 Stock Plan, options, stock appreciation rights, restricted shares, restricted stock units, shares and deferred stock units and dividend equivalent awards may be granted, but the 2013 Stock Plan does not separately segregate the shares used for each type of award. As of October 3, 2014, 22,645,844 shares were available for issuance under the 2013 Stock Plan. This column does not include 140,167 shares of restricted stock that have been granted subject to forfeiture under the 2007 Stock Plan.
|
|
(2)
|
In addition to shares issuable upon exercise of stock options, includes shares issuable upon the settlement of 228,703 deferred stock units and 2,770,275 restricted stock units issuable under the 2007 Stock Plan and the 2013 Stock Plan at a rate of one share for each unit. Also includes shares issuable upon the settlement of 499,337 performance stock units issued under the 2013 Stock Plan at the maximum 200% payout rate (998,674 shares). The deferred stock units, restricted stock units and performance stock units do not have an exercise price. Therefore, these awards are not included in the calculation of weighted average exercise price in column b.
|
Beneficial ownership information required by this item will be included in the section "Security Ownership of Certain Beneficial Owners and Management" in the Company's Proxy Statement for the 2015 Annual Meeting of Stockholders and is incorporated herein by reference.
Item 13.
Certain Relationships and Related Transactions, and Director Independence
Review of Related Party Transactions
Our board of directors adopted a written Policy Regarding Transactions with Related Persons, which is administered by our Audit and Corporate Practices Committee (the “Audit Committee”). This policy applies to any transaction or series of transactions in which the Company or a subsidiary is a participant, the amount involved exceeds $120,000 and a Related Person (as defined in Item 404(a) of SEC Regulation S-K) has a direct or indirect material interest; provided, however, our board of directors has determined that certain transactions not required to be reported pursuant to Item 404(a) of SEC Regulation S-K are not considered to be transactions covered by the Policy. Under the policy, a related person transaction must be reported to the Company’s General Counsel and be reviewed and approved or ratified by the Audit Committee in accordance with the terms of the policy, prior to the effectiveness or consummation of the transaction, whenever practicable. The Audit Committee will review all relevant information available to it about the potential related person transaction. The Audit Committee, in its sole discretion, may impose such conditions as it deems appropriate on the Company or the Related Person in connection with the approval of the Related Person Transaction.
Stockholder Arrangements
Stockholders Agreement
In connection with our 2007 Transaction, we entered into a stockholders agreement with Joseph Neubauer, the Sponsors and other management participants, which agreement was amended and restated in connection with our initial public offering (as so amended, the “Stockholders Agreement”). The Stockholders Agreement contains agreements among the parties with respect to
89
the nomination and election of directors, restrictions on the transfer of shares, informational rights, corporate opportunities, and certain other corporate governance provisions.
Under the Stockholders Agreement, each of GS Capital Partners, CCMP Capital Advisors, Thomas H. Lee Partners, L.P. and Warburg Pincus is entitled to select for nomination one person to serve on our board of directors, which right falls away when such Sponsor’s share ownership falls below 20% of the original share amount acquired by such Sponsor in connection with our 2007 Transaction (which was equal to the share amount held by such Sponsor immediately prior to our initial public offering). In addition, pursuant to the agreement Mr. Neubauer is entitled to serve on our board of directors for as long as he and our employees collectively own 5% or more of outstanding shares on a fully diluted basis and will serve as the chairman of the board until at least the earlier of the first annual meeting of stockholders following our initial public offering and November 30, 2014. Management stockholders are entitled to proportionate director representation based on their aggregate share ownership and Mr. Foss serves as the management stockholders’ representative. Unless waived, a majority of the Sponsor directors and Mr. Neubauer must be present in order to constitute a quorum for purposes of any meeting of our board of directors.
Stockholders party to the Stockholders Agreement may not transfer shares except pursuant to certain exceptions set forth in the agreement, including to specifically permitted transferees, in a public offering subject to the Registration Rights Agreement (as defined below) or as otherwise approved by the coordination committee established under the Registration Rights Agreement. In addition, under the Stockholders Agreement management stockholders became generally permitted to sell up to 50% of their shares (including shares underlying vested stock-based awards) commencing June 18, 2014, which was the day following the six-month anniversary of our initial public offering, and will become generally permitted to sell the remainder of their shares commencing December 18, 2014, which is the day following the one-year anniversary of our initial public offering, in each case subject to the company’s policies. Management stockholders may also transfer shares to pay an option price or withholding tax in connection with a stock-based award. Mr. Neubauer and certain affiliated stockholders are also entitled to make certain transfers including to cultural or academic not-for-profit institutions.
Registration Rights Agreement
In connection with our 2007 Transaction, we entered into a registration rights agreement with Mr. Neubauer, the Sponsors and other management participants, which agreement was amended and restated in connection with our initial public offering (as so amended, the “Registration Rights Agreement”). Pursuant to the Registration Rights Agreement, these existing stockholders are entitled to participate in certain offerings of the Company’s securities registered under the Securities Act which are initiated by the Company, the Sponsors or Mr. Neubauer, subject to certain exceptions. In addition, under the agreement certain stockholders who hold more than 10% of our then-outstanding shares, or Mr. Neubauer, or the coordination committee (in the case of a “shelf” registration), have the right to require us to file a registration statement with the SEC for the resale of our common stock. The agreement provides to the Sponsors an unlimited number of “demand” registrations and provides to Mr. Neubauer two “demand” registrations. In addition, the Sponsors, Mr. Neubauer and, in certain circumstances, some members of senior management are also entitled to “piggy back” rights in subsequent offerings. In any subsequent offering in which “piggy back” rights apply, Mr. Neubauer is entitled to participate in such offering at a participation rate two times his pro rata share as compared to the pro rata share of the Sponsors. The Registration Rights Agreement also provides that we will pay certain expenses of these stockholders relating to such registrations and indemnify them against certain liabilities which may arise under the Securities Act of 1933, as amended.
Financing Transactions
We manage our exposure to interest rate changes with respect to our floating rate indebtedness through the use of interest rate swaps. Before and subsequent to the closing of the 2007 Transaction on January 26, 2007, our financial institution counterparties on these swaps have included entities affiliated with GS Capital Partners and with J.P. Morgan Partners, two of our Sponsors. The notional value of interest rate swaps with entities affiliated with GS Capital Partners was
$487.4 million
as of October 3, 2014, $230 million as of September 27, 2013 and $96 million as of September 28, 2012. The notional value of interest rate swaps with entities affiliated with J.P. Morgan Partners was
$437.4 million
as of October 3, 2014, $205 million as of September 27, 2013 and $221 million as of September 28, 2012. In all of these swaps, we pay the counterparty a fixed interest rate in exchange for their payment of a floating interest rate. The net payments to entities affiliated with GS Capital Partners pursuant to interest rate swap transactions were approximately
$21.5 million
in fiscal 2012, approximately
$3.1 million
in fiscal 2013 and approximately
$7.9 million
in fiscal 2014. The net payments to entities affiliated with J.P. Morgan Partners pursuant to interest rate swap transactions were approximately
$28.2 million
in fiscal 2012, approximately
$5.5 million
in fiscal 2013 and approximately
$6.9 million
in fiscal 2014.
JP Morgan Chase Bank, N.A., an affiliate of J.P. Morgan Partners, serves as administrative agent, collateral agent and LC facility issuing bank for our senior secured credit agreement. In each of fiscal 2012, 2013 and 2014 we paid JPMorgan Chase Bank, N.A. $200,000 for these services.
90
We engaged Goldman Sachs Lending Partners LLC and J.P. Morgan Securities LLC, affiliates of GS Capital Partners and J.P. Morgan Partners, respectively, as co-lead arrangers in connection with several amendments to our Credit Agreement since the beginning of fiscal 2012. Under these engagements, Goldman Sachs Lending Partners LLC was paid approximately $2.3 million in fiscal 2012, approximately $5.3 million in fiscal 2013 and approximately $3.4 million in fiscal 2014 and J.P. Morgan Securities LLC was paid approximately $2.3 million in fiscal 2012, approximately $5.3 million in fiscal 2013 and approximately $5.1 million in fiscal 2014. In addition, we paid approximately $250,000 in fiscal 2012, $315,000 in fiscal 2013 and $362,000 in fiscal 2014 in legal fees for amendments to the senior secured credit agreement on behalf of these co-lead arrangers.
Goldman, Sachs & Co. and J.P. Morgan Securities LLC, affiliates of GS Capital Partners and J.P. Morgan Partners, respectively, each acted as a lead book running manager and a representative of the initial purchasers of the $1,000 million aggregate principal amount of 5.75% Senior Notes due 2020 (the “2020 Notes”) that Aramark Services, Inc. issued on March 7, 2013. Goldman, Sachs & Co. and J.P. Morgan Securities LLC were each paid $3.6 million in connection with the offering of the 2020 Notes. The proceeds from the offering, along with borrowings under the new term loans pursuant to Amendment Agreement No. 4, were used to tender any and all of (i) our outstanding 8.625% / 9.375% Senior Notes due 2016 (ii) Aramark Services, Inc.’s outstanding 8.50% Senior Notes due 2015 and (iii) Aramark Services, Inc.’s outstanding Senior Floating Rate Notes due 2015 (the “March 2013 Tender Offer”). Goldman, Sachs & Co. acted as a dealer manager in connection with the March 2013 Tender Offer and we paid approximately $42,000 in legal fees in connection with this engagement on behalf of Goldman, Sachs & Co.
Goldman Sachs & Co. and J.P. Morgan Securities LLC, affiliates of GS Capital Partners and J.P. Morgan Partners, respectively, each acted as a joint book running manager and a representative of the underwriters of our initial public offering. Goldman Sachs & Co. and J.P. Morgan Securities LLC each received approximately $6.5 million of underwriters' discounts relating to the shares sold by the Company in the IPO.
Goldman Sachs Lending Partners LLC is an affiliate of GS Capital Partners, and Sanjeev Mehra, Managing Director of Goldman, Sachs & Co. and a member of the board of directors of the Company. JPMorgan Chase Bank, N.A. and J.P. Morgan Securities LLC are affiliates of J.P. Morgan Partners, Stephen P. Murray, who serves on the board of directors of the Company, was employed by J.P. Morgan Partners until August 2006 and has been employed by CCMP Capital Advisors since August 2006.
Other Transactions
Effective March 5, 2013, Mr. Neubauer’s 1995 Trust surrendered split dollar life insurance policies it owned, in which the Company held a security interest. Pursuant to Mr. Neubauer’s Split Dollar Life Insurance Agreement, prior to 2003 we paid a substantial portion of the premiums on the policies, and those amounts were required to be repaid from the proceeds of the policies upon their termination. We did not charge interest in each fiscal year on this amount, but we captured at least some of the foregone interest because we reduced the amount of the interest that would otherwise accrue on Mr. Neubauer’s deferred compensation. At March 5, 2013, the effective date of the surrender of the policies, the amount of the premium repayment obligation was $ 2,497,692. Upon the surrender of the policies, we received the amount of the premium repayment obligation and then remitted the remaining $1,341,212 to Mr. Neubauer’s 1995 Trust.
Director Independence
Please see Item 10. "Directors, Executive Officers and Corporate Governance-Director Independence and Composition of the Board of Directors" for information on director independence.
Item 14.
Principal Accountant Fees and Services
Information required by Item 14 will be included in the section “Fees to Independent Registered Public Accounting Firm” in the Company's Proxy Statement for the 2015 Annual Meeting of Stockholders and is incorporated herein by reference.
91
(a)
Financial Statements
See Index to Financial Statements and Schedule at page S-1 and the Exhibit Index.
(b)
Exhibits Required by Item 601 of Regulation S-K
See the Exhibit Index which is incorporated herein by reference.
(c)
Financial Statement Schedules
See Index to Financial Statements and Schedule at page S-1.
92
SIGNATURES
Pursuant to the requirements of Section 13 or 15(d) of the Securities Exchange Act of 1934, as amended, the registrant has duly caused this annual report to be signed on its behalf by the undersigned, thereunto duly authorized, in the City of Philadelphia, Commonwealth of Pennsylvania, on December 2, 2014.
|
Aramark
|
||||||
|
By:
|
/s/ J
OSEPH
M
UNNELLY
|
|||||
|
Name:
|
Joseph Munnelly
|
|||||
|
Title:
|
Senior Vice President, Controller and Chief Accounting Officer
|
|||||
Pursuant to the requirements of the Securities Exchange Act of 1934, this annual report has been signed below by the following persons on behalf of the registrant and in the capacities indicated on December 2, 2014.
|
Name
|
Capacity
|
|
|
/s/ E
RIC
J.
F
OSS
|
Chief Executive Officer, President and Director
|
|
|
Eric J. Foss
|
||
|
/s/ L. F
REDERICK
S
UTHERLAND
|
Executive Vice President, Chief Financial Officer
|
|
|
L. Frederick Sutherland
|
(Principal Financial Officer)
|
|
|
/s/ J
OSEPH
M
UNNELLY
|
Senior Vice President, Controller and Chief Accounting Officer
|
|
|
Joseph Munnelly
|
(Principal Accounting Officer)
|
|
|
/s/ J
OSEPH
N
EUBAUER
|
Chairman of the Board and Director
|
|
|
Joseph Neubauer
|
||
|
/s/ T
ODD
M. A
BBRECHT
|
Director
|
|
|
Todd M. Abbrecht
|
||
|
/s/ L
AWRENCE
T. B
ABBIO
, J
R
.
|
Director
|
|
|
Lawrence T. Babbio, Jr.
|
||
|
/s/ D
AVID
A. B
ARR
|
Director
|
|
|
David A. Barr
|
||
|
/s/ L
EONARD
S. C
OLEMAN
, J
R
.
|
Director
|
|
|
Leonard S. Coleman, Jr.
|
||
|
/s/ D
ANIEL
J. H
EINRICH
|
Director
|
|
|
Daniel J. Heinrich
|
||
|
/s/ J
AMES
E. K
SANSNAK
|
Director
|
|
|
James E. Ksansnak
|
||
|
/s/ S
ANJEEV
M
EHRA
|
Director
|
|
|
Sanjeev Mehra
|
||
|
/s/ S
TEPHEN
P. M
URRAY
|
Director
|
|
|
Stephen P. Murray
|
||
|
/s/ S
TEPHEN
S
ADOVE
|
Director
|
|
|
Stephen Sadove
|
||
93
[THIS PAGE INTENTIONALLY LEFT BLANK]
94
ARAMARK AND SUBSIDIARIES
INDEX TO CONSOLIDATED FINANCIAL STATEMENTS AND SCHEDULE
|
Page
|
|||
All other schedules are omitted because they are not applicable, not required, or the information required to be set forth therein is included in the consolidated financial statements or in the notes thereto.
S-1
Report of Independent Registered Public Accounting Firm
The Board of Directors and Stockholders
Aramark:
We have audited the accompanying consolidated balance sheets of Aramark and subsidiaries (the Company) as of October 3, 2014 and September 27, 2013, and the related consolidated statements of income, comprehensive income, cash flows, and stockholders' equity for each of the fiscal years ended October 3, 2014, September 27, 2013 and September 28, 2012. In connection with our audits of the consolidated financial statements, we also have audited the financial statement schedule. These consolidated financial statements and financial statement schedule are the responsibility of the Company’s management. Our responsibility is to express an opinion on these consolidated financial statements and financial statement schedule based on our audits.
We conducted our audits in accordance with the standards of the Public Company Accounting Oversight Board (United States). Those standards require that we plan and perform the audit to obtain reasonable assurance about whether the financial statements are free of material misstatement. An audit includes examining, on a test basis, evidence supporting the amounts and disclosures in the financial statements. An audit also includes assessing the accounting principles used and significant estimates made by management, as well as evaluating the overall financial statement presentation. We believe that our audits provide a reasonable basis for our opinion.
In our opinion, the consolidated financial statements referred to above present fairly, in all material respects, the financial position of Aramark and subsidiaries as of October 3, 2014 and September 27, 2013, and the results of their operations and their cash flows for each of the fiscal years ended October 3, 2014, September 27, 2013 and September 28, 2012, in conformity with U.S. generally accepted accounting principles. Also in our opinion, the related financial statement schedule, when considered in relation to the basic consolidated financial statements taken as a whole, presents fairly, in all material respects, the information set forth therein.
|
/s/ KPMG LLP
|
|
Philadelphia, Pennsylvania
|
|
December 2, 2014
|
S-2
ARAMARK AND SUBSIDIARIES
CONSOLIDATED BALANCE SHEETS
OCTOBER 3, 2014
AND
SEPTEMBER 27, 2013
(in thousands, except share amounts)
|
October 3, 2014
|
September 27, 2013
|
||||||
|
ASSETS
|
|||||||
|
Current Assets:
|
|||||||
|
Cash and cash equivalents
|
$
|
111,690
|
|
$
|
110,998
|
|
|
|
Receivables (less allowances: 2014 - $37,381; 2013 - $34,676)
|
1,582,431
|
|
1,405,843
|
|
|||
|
Inventories
|
553,815
|
|
541,972
|
|
|||
|
Prepayments and other current assets
|
217,040
|
|
228,352
|
|
|||
|
Total current assets
|
2,464,976
|
|
2,287,165
|
|
|||
|
Property and Equipment, at cost:
|
|||||||
|
Land, buildings and improvements
|
610,569
|
|
611,591
|
|
|||
|
Service equipment and fixtures
|
1,745,146
|
|
1,642,395
|
|
|||
|
2,355,715
|
|
2,253,986
|
|
||||
|
Less - Accumulated depreciation
|
(1,358,384
|
)
|
(1,276,663
|
)
|
|||
|
997,331
|
|
977,323
|
|
||||
|
Goodwill
|
4,589,680
|
|
4,619,987
|
|
|||
|
Other Intangible Assets
|
1,252,741
|
|
1,408,764
|
|
|||
|
Other Assets
|
1,150,965
|
|
973,867
|
|
|||
|
$
|
10,455,693
|
|
$
|
10,267,106
|
|
||
|
LIABILITIES AND STOCKHOLDERS' EQUITY
|
|||||||
|
Current Liabilities:
|
|||||||
|
Current maturities of long-term borrowings
|
$
|
89,805
|
|
$
|
65,841
|
|
|
|
Accounts payable
|
986,240
|
|
888,969
|
|
|||
|
Accrued payroll and related expenses
|
532,160
|
|
555,894
|
|
|||
|
Accrued expenses and other current liabilities
|
770,668
|
|
878,549
|
|
|||
|
Total current liabilities
|
2,378,873
|
|
2,389,253
|
|
|||
|
Long-Term Borrowings
|
5,355,789
|
|
5,758,229
|
|
|||
|
Deferred Income Taxes and Other Noncurrent Liabilities
|
993,118
|
|
1,047,002
|
|
|||
|
Common Stock Subject to Repurchase and Other
|
9,877
|
|
168,915
|
|
|||
|
Stockholders' Equity:
|
|||||||
|
Common stock, par value $.01 (authorized: 600,000,000 shares; issued: 2014—256,086,839 shares and 2013—219,585,247;
and outstanding: 2014—233,910,487 and 2013—201,798,518)
|
2,561
|
|
2,194
|
|
|||
|
Capital surplus
|
2,575,011
|
|
1,693,663
|
|
|||
|
Accumulated deficit
|
(382,463
|
)
|
(479,233
|
)
|
|||
|
Accumulated other comprehensive loss
|
(106,298
|
)
|
(59,225
|
)
|
|||
|
Treasury stock (shares held in treasury: 2014—22,176,352 shares and 2013—17,786,729)
|
(370,775
|
)
|
(253,692
|
)
|
|||
|
Total stockholders' equity
|
1,718,036
|
|
903,707
|
|
|||
|
$
|
10,455,693
|
|
$
|
10,267,106
|
|
||
Th
e accompanying notes are an integral part of these consolidated financial statements.
S-3
ARAMARK AND SUBSIDIARIES
CONSOLIDATED STATEMENTS OF INCOME
FOR THE FISCAL YEARS ENDED
OCTOBER 3, 2014
,
SEPTEMBER 27, 2013
AND
SEPTEMBER 28, 2012
(in thousands, except per share data)
|
Fiscal Year Ended
|
|||||||||||
|
October 3, 2014
|
September 27, 2013
|
September 28, 2012
|
|||||||||
|
Sales
|
$
|
14,832,913
|
|
$
|
13,945,657
|
|
$
|
13,505,426
|
|
||
|
Costs and Expenses:
|
|||||||||||
|
Cost of services provided
|
13,363,918
|
|
12,661,145
|
|
12,191,419
|
|
|||||
|
Depreciation and amortization
|
521,581
|
|
542,136
|
|
529,213
|
|
|||||
|
Selling and general corporate expenses
|
382,851
|
|
227,902
|
|
203,019
|
|
|||||
|
14,268,350
|
|
13,431,183
|
|
12,923,651
|
|
||||||
|
Operating income
|
564,563
|
|
514,474
|
|
581,775
|
|
|||||
|
Interest and Other Financing Costs, net
|
334,886
|
|
423,845
|
|
456,807
|
|
|||||
|
Income from Continuing Operations Before Income Taxes
|
229,677
|
|
90,629
|
|
124,968
|
|
|||||
|
Provision for Income Taxes
|
80,218
|
|
19,233
|
|
18,066
|
|
|||||
|
Income from Continuing Operations
|
149,459
|
|
71,396
|
|
106,902
|
|
|||||
|
Income (loss) from Discontinued Operations, net of tax
|
—
|
|
(1,030
|
)
|
297
|
|
|||||
|
Net income
|
149,459
|
|
70,366
|
|
107,199
|
|
|||||
|
Less: Net income attributable to noncontrolling interests
|
503
|
|
1,010
|
|
3,648
|
|
|||||
|
Net income attributable to Aramark stockholders
|
$
|
148,956
|
|
$
|
69,356
|
|
$
|
103,551
|
|
||
|
Earnings per share attributable to Aramark stockholders:
|
|||||||||||
|
Basic:
|
|||||||||||
|
Income from Continuing Operations
|
$
|
0.66
|
|
$
|
0.35
|
|
$
|
0.51
|
|
||
|
Income (loss) from Discontinued Operations
|
—
|
|
(0.01
|
)
|
—
|
|
|||||
|
$
|
0.66
|
|
$
|
0.34
|
|
$
|
0.51
|
|
|||
|
Diluted:
|
|||||||||||
|
Income from Continuing Operations
|
$
|
0.63
|
|
$
|
0.34
|
|
$
|
0.49
|
|
||
|
Income (loss) from Discontinued Operations
|
—
|
|
(0.01
|
)
|
—
|
|
|||||
|
$
|
0.63
|
|
$
|
0.33
|
|
$
|
0.49
|
|
|||
|
Weighted Average Shares Outstanding:
|
|||||||||||
|
Basic
|
225,866
|
|
201,916
|
|
203,211
|
|
|||||
|
Diluted
|
237,451
|
|
209,370
|
|
209,707
|
|
|||||
The accompanying notes are an integral part of these consolidated financial statements.
S-4
ARAMARK AND SUBSIDIARIES
CONSOLIDATED STATEMENTS OF COMPREHENSIVE INCOME
FOR THE FISCAL YEARS ENDED
OCTOBER 3, 2014
,
SEPTEMBER 27, 2013
AND
SEPTEMBER 28, 2012
(in thousands)
|
Fiscal Year Ended
|
|||||||||||
|
October 3, 2014
|
September 27, 2013
|
September 28, 2012
|
|||||||||
|
Net income
|
$
|
149,459
|
|
$
|
70,366
|
|
$
|
107,199
|
|
||
|
Other comprehensive income (loss), net of tax:
|
|||||||||||
|
Pension plan adjustments
|
(13,596
|
)
|
19,745
|
|
(16,208
|
)
|
|||||
|
Foreign currency translation adjustments
|
(31,281
|
)
|
(17,142
|
)
|
(4,368
|
)
|
|||||
|
Cash flow hedges:
|
|
|
|
||||||||
|
(Losses) on cash flow hedges
|
(17,626
|
)
|
(5,281
|
)
|
(18,091
|
)
|
|||||
|
Reclassification adjustments
|
15,430
|
|
14,393
|
|
53,067
|
|
|||||
|
Share of equity investee's comprehensive income (loss)
|
—
|
|
2,805
|
|
(10,800
|
)
|
|||||
|
Other comprehensive income (loss), net of tax
|
(47,073
|
)
|
14,520
|
|
3,600
|
|
|||||
|
Comprehensive income
|
102,386
|
|
84,886
|
|
110,799
|
|
|||||
|
Less: Net income attributable to noncontrolling interests
|
503
|
|
1,010
|
|
3,648
|
|
|||||
|
Comprehensive income attributable to Aramark stockholders
|
$
|
101,883
|
|
$
|
83,876
|
|
$
|
107,151
|
|
||
The accompanying notes are an integral part of these consolidated financial statements.
S-5
ARAMARK AND SUBSIDIARIES
FOR THE FISCAL YEARS ENDED
OCTOBER 3, 2014
,
SEPTEMBER 27, 2013
AND
SEPTEMBER 28, 2012
(in thousands)
|
Fiscal Year Ended
|
|||||||||||
|
October 3, 2014
|
September 27, 2013
|
September 28, 2012
|
|||||||||
|
Cash flows from operating activities:
|
|||||||||||
|
Net income
|
$
|
149,459
|
|
$
|
70,366
|
|
$
|
107,199
|
|
||
|
Adjustments to reconcile net income to net cash provided by operating activities:
|
|||||||||||
|
Depreciation and amortization
|
521,581
|
|
542,136
|
|
529,213
|
|
|||||
|
Income taxes deferred
|
37,372
|
|
(17,791
|
)
|
(66,613
|
)
|
|||||
|
Share-based compensation expense
|
96,332
|
|
19,417
|
|
15,678
|
|
|||||
|
Changes in noncash working capital:
|
|||||||||||
|
Receivables
|
(226,756
|
)
|
(108,583
|
)
|
(45,190
|
)
|
|||||
|
Inventories
|
(19,810
|
)
|
(34,950
|
)
|
(50,324
|
)
|
|||||
|
Prepayments
|
(77,609
|
)
|
(49,224
|
)
|
38,267
|
|
|||||
|
Accounts payable
|
9,657
|
|
74,462
|
|
83,981
|
|
|||||
|
Accrued expenses
|
(113,193
|
)
|
161,441
|
|
16,495
|
|
|||||
|
Changes in other noncurrent liabilities
|
(9,034
|
)
|
(26,506
|
)
|
4,569
|
|
|||||
|
Changes in other assets
|
10,123
|
|
30,581
|
|
43,038
|
|
|||||
|
Other operating activities
|
20,037
|
|
34,558
|
|
15,448
|
|
|||||
|
Net cash provided by operating activities
|
398,159
|
|
695,907
|
|
691,761
|
|
|||||
|
Cash flows from investing activities:
|
|||||||||||
|
Purchases of property and equipment, client contract investments and other
|
(545,194
|
)
|
(392,932
|
)
|
(354,542
|
)
|
|||||
|
Disposals of property and equipment
|
28,494
|
|
11,298
|
|
11,666
|
|
|||||
|
Proceeds from divestitures
|
24,000
|
|
919
|
|
6,479
|
|
|||||
|
Acquisition of certain businesses:
|
|||||||||||
|
Working capital other than cash acquired
|
(540
|
)
|
(547
|
)
|
(8,415
|
)
|
|||||
|
Property and equipment
|
(6,681
|
)
|
(183
|
)
|
(18,905
|
)
|
|||||
|
Additions to goodwill, other intangible assets and other assets, net
|
(14,235
|
)
|
(21,836
|
)
|
(124,427
|
)
|
|||||
|
Other investing activities
|
8,934
|
|
17,893
|
|
6,568
|
|
|||||
|
Net cash used in investing activities
|
(505,222
|
)
|
(385,388
|
)
|
(481,576
|
)
|
|||||
|
Cash flows from financing activities:
|
|||||||||||
|
Proceeds from long-term borrowings
|
1,570,818
|
|
3,080,464
|
|
3,449
|
|
|||||
|
Payments of long-term borrowings
|
(1,978,606
|
)
|
(3,314,853
|
)
|
(288,940
|
)
|
|||||
|
Net change in funding under the Receivables Facility
|
50,000
|
|
36,200
|
|
37,895
|
|
|||||
|
Payments of dividends
|
(52,186
|
)
|
—
|
|
—
|
|
|||||
|
Proceeds from initial public offering, net
|
524,081
|
|
—
|
|
—
|
|
|||||
|
Proceeds from issuance of common stock
|
4,408
|
|
5,597
|
|
11,258
|
|
|||||
|
Distribution in connection with spin-off of Seamless
|
—
|
|
(47,352
|
)
|
—
|
|
|||||
|
Repurchase of common stock
|
(4,730
|
)
|
(42,399
|
)
|
(37,704
|
)
|
|||||
|
Other financing activities
|
(6,030
|
)
|
(53,926
|
)
|
(12,785
|
)
|
|||||
|
Net cash provided by (used in) financing activities
|
107,755
|
|
(336,269
|
)
|
(286,827
|
)
|
|||||
|
Increase (decrease) in cash and cash equivalents
|
692
|
|
(25,750
|
)
|
(76,642
|
)
|
|||||
|
Cash and cash equivalents, beginning of period
|
110,998
|
|
136,748
|
|
213,390
|
|
|||||
|
Cash and cash equivalents, end of period
|
$
|
111,690
|
|
$
|
110,998
|
|
$
|
136,748
|
|
||
The accompanying notes are an integral part of these consolidated financial statements.
S-6
ARAMARK AND SUBSIDIARIES
CONSOLIDATED STATEMENTS OF STOCKHOLDERS' EQUITY
FOR THE FISCAL YEARS ENDED
OCTOBER 3, 2014
,
SEPTEMBER 27, 2013
AND
SEPTEMBER 28, 2012
(In thousands)
|
Total
|
Total
Aramark Stockholders'
Equity
|
Common
Stock |
Capital
Surplus |
Accumulated Deficit
|
Accumulated
Other
Comprehensive
Loss |
Treasury Stock
|
Noncontrolling
Interest |
||||||||||||||||||||||||
|
Balance, September 30, 2011
|
$
|
882,465
|
|
$
|
850,686
|
|
$
|
2,123
|
|
$
|
1,593,711
|
|
$
|
(548,030
|
)
|
$
|
(77,345
|
)
|
$
|
(119,773
|
)
|
$
|
31,779
|
|
|||||||
|
Net income
|
106,076
|
|
103,551
|
|
103,551
|
|
2,525
|
|
|||||||||||||||||||||||
|
Other comprehensive income
|
3,600
|
|
3,600
|
|
3,600
|
|
|||||||||||||||||||||||||
|
Capital contributions from issuance of common stock
|
31,636
|
|
31,636
|
|
36
|
|
31,600
|
|
|||||||||||||||||||||||
|
Compensation expense related to stock incentive plans
|
15,678
|
|
15,678
|
|
15,678
|
|
|||||||||||||||||||||||||
|
Tax benefits related to stock incentive plans
|
4,539
|
|
4,539
|
|
4,539
|
|
|||||||||||||||||||||||||
|
Increase in common stock subject to repurchase obligation, net
|
(9,400
|
)
|
(9,400
|
)
|
(9,400
|
)
|
|||||||||||||||||||||||||
|
Repurchases of common stock
|
(67,273
|
)
|
(67,273
|
)
|
(67,273
|
)
|
|||||||||||||||||||||||||
|
Distributions to noncontrolling interest
|
(457
|
)
|
—
|
|
(457
|
)
|
|||||||||||||||||||||||||
|
Balance, September 28, 2012
|
$
|
966,864
|
|
$
|
933,017
|
|
$
|
2,159
|
|
$
|
1,636,128
|
|
$
|
(444,479
|
)
|
$
|
(73,745
|
)
|
$
|
(187,046
|
)
|
$
|
33,847
|
|
|||||||
|
Net income
|
69,572
|
|
69,356
|
|
69,356
|
|
216
|
|
|||||||||||||||||||||||
|
Other comprehensive income
|
14,520
|
|
14,520
|
|
14,520
|
|
|||||||||||||||||||||||||
|
Capital contributions from issuance of common stock
|
24,559
|
|
24,559
|
|
35
|
|
24,524
|
|
|||||||||||||||||||||||
|
Compensation expense related to stock incentive plans
|
19,417
|
|
19,417
|
|
19,417
|
|
|||||||||||||||||||||||||
|
Tax benefits related to stock incentive plans
|
4,841
|
|
4,841
|
|
4,841
|
|
|||||||||||||||||||||||||
|
Decrease in common stock subject to repurchase obligation, net
|
8,753
|
|
8,753
|
|
8,753
|
|
|||||||||||||||||||||||||
|
Repurchases of common stock
|
(66,646
|
)
|
(66,646
|
)
|
(66,646
|
)
|
|||||||||||||||||||||||||
|
Distributions of Seamless
|
(138,173
|
)
|
(104,110
|
)
|
(104,110
|
)
|
(34,063
|
)
|
|||||||||||||||||||||||
|
Balance, September 27, 2013
|
$
|
903,707
|
|
$
|
903,707
|
|
$
|
2,194
|
|
$
|
1,693,663
|
|
$
|
(479,233
|
)
|
$
|
(59,225
|
)
|
$
|
(253,692
|
)
|
$
|
—
|
|
|||||||
The accompanying notes are an integral part of these consolidated financial statements.
S-7
ARAMARK AND SUBSIDIARIES
CONSOLIDATED STATEMENTS OF STOCKHOLDERS' EQUITY
FOR THE FISCAL YEARS ENDED
OCTOBER 3, 2014
,
SEPTEMBER 27, 2013
AND
SEPTEMBER 28, 2012
(In thousands)
|
Total
Stockholders'
Equity
|
Common
Stock |
Capital
Surplus |
Accumulated Deficit
|
Accumulated
Other
Comprehensive
Loss |
Treasury Stock
|
|||||||||||||||||||
|
Balance, September 27, 2013
|
$
|
903,707
|
|
$
|
2,194
|
|
$
|
1,693,663
|
|
$
|
(479,233
|
)
|
$
|
(59,225
|
)
|
$
|
(253,692
|
)
|
||||||
|
Net income attributable to Aramark stockholders
|
148,956
|
|
148,956
|
|
||||||||||||||||||||
|
Other comprehensive (loss)
|
(47,073
|
)
|
(47,073
|
)
|
||||||||||||||||||||
|
Capital contributions from issuance of common stock
|
62,087
|
|
87
|
|
62,000
|
|
||||||||||||||||||
|
Capital contributions from initial public offering
|
524,081
|
|
280
|
|
523,801
|
|
||||||||||||||||||
|
Compensation expense related to stock incentive plans
|
96,332
|
|
96,332
|
|
||||||||||||||||||||
|
Tax benefits related to stock incentive plans
|
40,507
|
|
40,507
|
|
||||||||||||||||||||
|
Change due to termination of provision in Stockholders' Agreement (see Note 9)
|
158,708
|
|
158,708
|
|
||||||||||||||||||||
|
Repurchases of common stock
|
(117,083
|
)
|
(117,083
|
)
|
||||||||||||||||||||
|
Payments of dividends
|
(52,186
|
)
|
(52,186
|
)
|
||||||||||||||||||||
|
Balance, October 3, 2014
|
$
|
1,718,036
|
|
$
|
2,561
|
|
$
|
2,575,011
|
|
$
|
(382,463
|
)
|
$
|
(106,298
|
)
|
$
|
(370,775
|
)
|
||||||
The accompanying notes are an integral part of these consolidated financial statements.
S-8
On January 26, 2007, ARAMARK Holdings Corporation, a Delaware corporation controlled by investment funds associated with GS Capital Partners, CCMP Capital Advisors, J.P. Morgan Partners, Thomas H. Lee Partners and Warburg Pincus LLC (collectively the "Sponsors"), Joseph Neubauer, Chairman and former Chief Executive Officer of ARAMARK Holdings Corporation, and certain other members of ARAMARK Holdings Corporation's management, acquired all of the outstanding shares of ARAMARK Holdings Corporation's wholly-owned subsidiary ARAMARK Corporation, in a going-private transaction (the "2007 Transaction").
On December 12, 2013, ARAMARK Holdings Corporation's common stock began trading on the New York Stock Exchange under the symbol "ARMK" after its initial public offering ("IPO") of
28,000,000
shares of its common stock at a price of
$20.00
per share (see Note 9).
On May 9, 2014, ARAMARK Holdings Corporation changed its name to Aramark (the “Company”) pursuant to Section 253 of the Delaware General Corporation Law. ARAMARK Holdings Corporation amended Article FIRST of ARAMARK Holdings Corporation's Amended and Restated Certificate of Incorporation to change its corporate name to Aramark pursuant to a Certificate of Ownership and Merger filed with the Secretary of State of the State of Delaware on May 9, 2014. Also on May 9, 2014, the By-laws of the Company were amended and restated to reflect the name change to Aramark. The Company's wholly-owned subsidiary, ARAMARK Corporation, also changed its name on May 9, 2014 to Aramark Services, Inc.
The consolidated financial statements include the accounts of the Company and all of its subsidiaries in which a controlling financial interest is maintained in accordance with generally accepted accounting principles in the United States ("U.S. GAAP"). All significant intercompany transactions and accounts have been eliminated.
Fiscal Year
The Company’s fiscal year is the fifty-two or fifty-three week period which ends on the Friday nearest September 30th. The fiscal year ended
October 3, 2014
was a fifty-three week period and the fiscal years ended
September 27, 2013
and
September 28, 2012
were each fifty-two week periods.
New Accounting Standard Updates
In June 2014, the FASB issued an accounting standard update ("ASU") on stock compensation which requires that a performance target affecting vesting and that could be achieved after the requisite service period be treated as a performance condition. The guidance is effective for the Company beginning in the first quarter of fiscal 2017. The Company is currently evaluating the impact of the pronouncement relative to its stock incentive awards.
In May 2014, the FASB issued an ASU on revenue from contracts with customers which outlines a single comprehensive model to use in accounting for revenue arising from contracts with customers and supersedes most current revenue recognition guidance. The guidance is effective for the Company beginning in the first quarter of fiscal 2018. The Company is currently evaluating the impact of the pronouncement.
In January 2014, the FASB issued an ASU which states that companies should not account for certain service concession arrangements with public-sector entities as leases and should not recognize the related infrastructure as property, plant and equipment. The guidance is effective for the Company beginning in the first quarter of fiscal 2016. The Company is currently evaluating the impact of the pronouncement.
In July 2013, the FASB issued an ASU which requires unrecognized tax benefits to be offset against a deferred tax asset for a net operating loss carryforward, similar tax loss or tax credit carryforward in certain situations. The guidance will likely change the balance sheet presentation of certain unrecognized tax benefits. The guidance is effective in the first quarter of fiscal 2015. The Company is currently evaluating the impact of the pronouncement.
In February 2013, the FASB issued an accounting standard update which requires companies to disclose information about reclassifications out of accumulated other comprehensive income ("AOCI"). Companies also are required to present reclassifications by component when reporting changes in AOCI balances. For significant items reclassified out of AOCI to net income in their entirety in the period, companies must report the effect of the reclassifications on the respective line items in the statement where net income is presented. The Company adopted the guidance in the first quarter of fiscal 2014 (see below).
In December 2011, the FASB issued an accounting standard update ("ASU") that requires companies with financial instruments and derivative instruments that are offset on the balance sheet or subject to a master netting arrangement to provide additional disclosures regarding the instruments impact on a company’s financial position. In January 2013, the FASB issued an
S-9
accounting standard update to clarify the scope of this ASU. The Company adopted the guidance in the first quarter of fiscal 2014 which did not have a material impact on the consolidated financial statements.
Revenue Recognition
The Company recognizes sales when persuasive evidence of an arrangement exists, delivery has occurred or services have been rendered, the fee is fixed and determinable and collectability is reasonably assured. In each of the Company’s operating segments, sales are recognized in the period in which services are provided pursuant to the terms of the Company’s contractual relationships with its clients. The Company generally records sales on food and support services contracts (both profit and loss contracts and client interest contracts) on a gross basis as the Company is the primary obligor and service provider.
Certain profit and loss contracts include commissions paid to the client, typically calculated as a fixed or variable percentage of various categories of sales. In some cases these contracts require minimum guaranteed commissions. Commissions paid to clients are recorded in “Cost of services provided.”
Sales from client interest contracts are generally comprised of amounts billed to clients for food, labor and other costs that the Company incurs, controls and pays for. Sales from client interest contracts also include any associated management fees, client subsidies or incentive fees based upon the Company’s performance under the contract. Sales from direct marketing activities are recognized upon shipment. All sales related taxes are presented on a net basis.
Vendor Consideration
Consideration received from vendors include rebates, allowances and volume discounts and are accounted for as an adjustment to the cost of the vendors’ products or services and are reported as a reduction of “Cost of services provided,” “Inventory,” or “Property and Equipment.” Income from rebates, allowances and volume discounts is recognized based on actual purchases in the fiscal period relative to total actual or forecasted purchases to be made over the contractual rebate period agreed to with the vendor. Rebates, allowances and volume discounts related to Inventory held at the balance sheet date are deducted from the carrying value of these inventories. Rebates, allowances and volume discounts related to Property and Equipment are deducted from the costs capitalized.
Use of Estimates
The preparation of financial statements in conformity with U.S. GAAP requires management to make estimates and assumptions that affect the reported amounts of assets and liabilities and disclosure of contingent assets and liabilities at the date of the financial statements and the reported amounts of sales and expenses during the reporting period. Actual results could materially differ from those estimates.
Comprehensive Income
Comprehensive income includes all changes to stockholders' equity during a period, except those resulting from investments by and distributions to stockholders. Components of comprehensive income include net income (loss), changes in foreign currency translation adjustments (net of tax), pension plan adjustments (net of tax), changes in the fair value of cash flow hedges (net of tax) and changes to the share of any equity investees' comprehensive income (net of tax).
S-10
The summary of the components of comprehensive income (loss) is as follows (in thousands):
|
Fiscal Year Ended
|
|||||||||||||||||||||||
|
October 3, 2014
|
September 27, 2013
|
September 28, 2012
|
|||||||||||||||||||||
|
Pre-Tax Amount
|
Tax Effect
|
After-Tax Amount
|
Pre-Tax Amount
|
Tax Effect
|
After-Tax Amount
|
Pre-Tax Amount
|
Tax Effect
|
After-Tax Amount
|
|||||||||||||||
|
Net income
|
$
|
149,459
|
|
$
|
70,366
|
|
$
|
107,199
|
|
||||||||||||||
|
Pension plan adjustments
|
(17,640
|
)
|
4,044
|
|
(13,596
|
)
|
29,943
|
|
(10,198
|
)
|
19,745
|
|
(24,854
|
)
|
8,646
|
|
(16,208
|
)
|
|||||
|
Foreign currency translation adjustments
|
(37,246
|
)
|
5,965
|
|
(31,281
|
)
|
(30,832
|
)
|
13,690
|
|
(17,142
|
)
|
(7,052
|
)
|
2,684
|
|
(4,368
|
)
|
|||||
|
Cash flow hedges:
|
|
|
|||||||||||||||||||||
|
Gains (losses) on cash flow hedges
|
(29,201
|
)
|
11,575
|
|
(17,626
|
)
|
(8,881
|
)
|
3,600
|
|
(5,281
|
)
|
(29,199
|
)
|
11,108
|
|
(18,091
|
)
|
|||||
|
Reclassification adjustments
|
25,921
|
|
(10,491
|
)
|
15,430
|
|
23,768
|
|
(9,375
|
)
|
14,393
|
|
86,372
|
|
(33,305
|
)
|
53,067
|
|
|||||
|
Share of equity investee's comprehensive loss
|
—
|
|
—
|
|
—
|
|
4,315
|
|
(1,510
|
)
|
2,805
|
|
(18,000
|
)
|
7,200
|
|
(10,800
|
)
|
|||||
|
Other comprehensive income (loss)
|
(58,166
|
)
|
11,093
|
|
(47,073
|
)
|
18,313
|
|
(3,793
|
)
|
14,520
|
|
7,267
|
|
(3,667
|
)
|
3,600
|
|
|||||
|
Comprehensive income
|
102,386
|
|
84,886
|
|
110,799
|
|
|||||||||||||||||
|
Less: Net income attributable to noncontrolling interests
|
503
|
|
1,010
|
|
3,648
|
|
|||||||||||||||||
|
Comprehensive income attributable to Aramark stockholders
|
$
|
101,883
|
|
$
|
83,876
|
|
$
|
107,151
|
|
||||||||||||||
Accumulated other comprehensive loss consists of the following (in thousands):
|
October 3, 2014
|
September 27, 2013
|
||||||
|
Pension plan adjustments
|
$
|
(44,119
|
)
|
$
|
(30,523
|
)
|
|
|
Foreign currency translation adjustments
|
(27,994
|
)
|
3,287
|
|
|||
|
Cash flow hedges
|
(26,190
|
)
|
(23,994
|
)
|
|||
|
Share of equity investee's Accumulated Other Comprehensive loss
|
(7,995
|
)
|
(7,995
|
)
|
|||
|
$
|
(106,298
|
)
|
$
|
(59,225
|
)
|
||
Currency Translation
Gains and losses resulting from the translation of financial statements of non-U.S. subsidiaries are reflected as a component of accumulated other comprehensive income (loss) in stockholders' equity. Transaction gains and losses included in operating results for fiscal
2014
, fiscal
2013
and fiscal
2012
were not material.
Current Assets
The Company considers all highly liquid investments with an original maturity of three months or less to be cash equivalents.
Inventories are valued at the lower of cost (principally the first-in, first-out method) or market. Personalized work apparel, linens and other rental items in service are recorded at cost and are amortized over their estimated useful lives, which primarily range from
one
to
four
years. The amortization rates used are based on the Company’s specific experience.
S-11
The components of inventories are as follows:
|
October 3, 2014
|
September 27, 2013
|
|||||
|
Food
|
39.3
|
%
|
40.4
|
%
|
||
|
Career apparel and linens
|
57.9
|
%
|
56.5
|
%
|
||
|
Parts, supplies and novelties
|
2.8
|
%
|
3.1
|
%
|
||
|
100.0
|
%
|
100.0
|
%
|
|||
Property and Equipment
Property and equipment are stated at cost and are depreciated over their estimated useful lives on a straight-line basis. Gains and losses on dispositions are included in operating results. Maintenance and repairs are charged to current operations, and replacements and significant improvements that extend the useful life of the asset are capitalized. The estimated useful lives for the major categories of property and equipment are
10
to
40
years for buildings and improvements and
3
to
10
years for service equipment and fixtures. Depreciation expense during fiscal
2014
, fiscal
2013
and fiscal
2012
was
$239.9 million
,
$239.1 million
, and
$236.6 million
, respectively.
Other Assets
Other assets consist primarily of investments in 50% or less owned entities, client contract investments, deferred financing costs, computer software costs and long-term receivables. Investments in which the Company owns more than 20% but less than a majority are accounted for using the equity method. Investments in which the Company owns less than 20% are accounted for under the cost method. Client contract investments generally represent a cash payment provided by the Company to help finance improvement or renovation at the facility from which the Company operates. These amounts are amortized over the contract period. If a contract is terminated prior to its maturity date, the Company is generally reimbursed for the unamortized client contract investment amount. Client contract investments, net of accumulated amortization, were
$670.6 million
and
$495.6 million
as of
October 3, 2014
and
September 27, 2013
, respectively. Amortization expense for client contract investments was
$106.2 million
,
$100.9 million
and
$86.9 million
during fiscal
2014
, fiscal
2013
and fiscal
2012
, respectively.
The Company’s principal equity method investment is its
50%
ownership interest in AIM Services Co., Ltd., a Japanese food and support services company (approximately
$180.3 million
and
$190.7 million
at
October 3, 2014
and
September 27, 2013
, respectively, which is included in “Other Assets” in the Consolidated Balance Sheets). Summarized financial information for AIM Services Co., Ltd. follows (in thousands):
|
October 3, 2014
|
September 27, 2013
|
||||||||||
|
Current assets
|
$
|
376,914
|
|
$
|
353,240
|
|
|||||
|
Noncurrent assets
|
154,510
|
|
169,469
|
|
|||||||
|
Current liabilities
|
302,230
|
|
291,926
|
|
|||||||
|
Noncurrent liabilities
|
52,489
|
|
50,880
|
|
|||||||
|
Fiscal Year Ended
|
|||||||||||
|
October 3, 2014
|
September 27, 2013
|
September 28, 2012
|
|||||||||
|
Sales
|
$
|
1,552,250
|
|
$
|
1,693,598
|
|
$
|
1,916,620
|
|
||
|
Gross profit
|
174,194
|
|
192,857
|
|
222,033
|
|
|||||
|
Net income
|
26,869
|
|
29,236
|
|
39,174
|
|
|||||
The period to period comparisons of the summarized financial information for AIM Services Co., Ltd., presented in U.S. dollars above, is significantly impacted by currency translation. The Company’s equity in undistributed earnings of AIM Services Co., Ltd., net of amortization related to purchase accounting for the 2007 Transaction, was
$10.5 million
,
$11.5 million
and
$14.7 million
for fiscal
2014
, fiscal
2013
and fiscal
2012
, respectively, and is recorded as a reduction of "Cost of services provided" in the Consolidated Statements of
Income
. During fiscal
2014
, fiscal
2013
and fiscal
2012
, the Company received
$6.5 million
,
$7.9 million
and
$34.9 million
of cash distributions from AIM Services Co., Ltd, respectively.
Other Accrued Expenses and Liabilities
Accrued expenses and other current liabilities consist principally of insurance accruals, advanced payments from clients, taxes, interest, fair value of interest rate swaps and accrued commissions. Advanced payments from clients as of
October 3, 2014
and
September 27, 2013
were
$267.7 million
and
$292.9 million
, respectively. The Company is self-insured for the risk retained under its general liability and workers’ compensation arrangements. Self-insurance reserves are recorded based on historical
S-12
claims experience and actuarial analyses. As of October 3, 2014 and September 27, 2013,
$51.1 million
and
$93.2 million
of insurance accruals were included in accrued expenses and other current liabilities, respectively.
Noncurrent liabilities consist primarily of deferred compensation, insurance accruals, pension liabilities, environmental obligations, fair value of interest rate swaps and other hedging agreements and asset retirement obligations.
Share-Based Compensation
The Company recognizes compensation cost related to share-based payment transactions in the consolidated financial statements. The cost is measured at the grant date, based on the estimated fair value of the award, and is recognized as an expense over the employee’s requisite service period (generally the vesting period of the equity award). See Note 10 for additional information on share-based compensation.
Supplemental Cash Flow Information
|
Fiscal Year Ended
|
||||||||||||
|
(dollars in millions)
|
October 3, 2014
|
September 27, 2013
|
September 28, 2012
|
|||||||||
|
Interest paid
|
$
|
348.5
|
|
$
|
350.6
|
|
$
|
422.5
|
|
|||
|
Income taxes paid
|
$
|
55.8
|
|
$
|
74.8
|
|
$
|
82.5
|
|
|||
Significant noncash activities follow:
|
•
|
During fiscal
2014
, fiscal
2013
and fiscal
2012
, the Company executed capital lease transactions. The present value of the future rental obligations was approximately
$16.6 million
,
$16.1 million
and
$17.0 million
for the respective periods, which is included in property and equipment and long-term borrowings.
|
|
•
|
During fiscal
2014
, fiscal
2013
and fiscal
2012
, approximately
$0.6 million
,
$3.5 million
and
$6.7 million
of common stock of the Company was repurchased through the issuance of promissory notes, respectively.
|
|
•
|
During fiscal
2014
, fiscal
2013
and fiscal
2012
, cashless settlements of the exercise price and related employee minimum tax withholding liabilities of share-based payment awards were approximately
$116.3 million
,
$26.9 million
and
$27.0 million
, respectively.
|
|
•
|
Obligations related to client contract investments of approximately
$57.2 million
that were unpaid as of October 3,
2014
are included in other assets and accounts payable.
|
Fiscal 2014
McKinley Chalet Hotel Divestiture
On October 7, 2013, the Company completed the sale of its McKinley Chalet Hotel (the "Chalet") located adjacent to Denali National Park for approximately
$24.0 million
in cash. The transaction resulted in a pretax loss of approximately
$6.7 million
(net of tax loss of approximately
$9.1 million
), which is included in "Cost of services provided" in the Consolidated Statements of Income for fiscal 2014. The pretax loss includes a write-off of an allocation of goodwill of approximately
$12.8 million
(see note 4). The results of operations and cash flows associated with the Chalet divestiture were not material to the Company's Consolidated Statements of Income and Cash Flows.
Fiscal 2013
Spin-off of Seamless Holdings Corporation (now a part of GrubHub Inc.)
On October 29, 2012, the Company completed the spin-off of its majority interest in Seamless North America, LLC ("Seamless") to its stockholders.
In the spin-off, Aramark Services, Inc. distributed all of the issued and outstanding shares of the common stock of Seamless Holdings Corporation (“Seamless Holdings”), an entity formed for the purpose of completing the spin-off and whose assets primarily consist of the Company's former interest in Seamless, to its parent company and sole stockholder, ARAMARK Intermediate. Thereafter, ARAMARK Intermediate distributed such shares to the Company, its parent company and sole stockholder, who then distributed all of the shares of Seamless Holdings on a pro rata basis to the holders of the Company's common stock as of October 26, 2012, the record date, through a tax-free stock dividend. Each Company stockholder received one share of Seamless Holdings common stock for each share of the Company's common stock held as of the record date.
Until October 29, 2012, Seamless Holdings and its subsidiaries were part of the Company and its assets, liabilities, results of operations, and cash flows are included in the amounts reported in these consolidated financial statements until that date.
S-13
Following the spin-off, Seamless Holdings is an independent company and the Company retains no ownership interest in Seamless Holdings or Seamless. The Company's proforma results of operations for fiscal 2013 and fiscal 2012 would not have been materially different than reported assuming the spin-off and related transactions had occurred at the beginning of fiscal 2012.
Fiscal 2012
Acquisitions
On October 3, 2011, ARAMARK Refreshment Services, LLC, a subsidiary of the Company, purchased all of the outstanding shares of capital stock of Van Houtte USA Holdings, Inc. (doing business as “Filterfresh”), a provider of office coffee services in the United States, for cash consideration of approximately
$145.2 million
. Under the terms of the purchase agreement, if a certain significant customer relationship was not maintained within a specific time frame, the Company was entitled to a refund of a portion of the purchase price. During the second quarter of fiscal 2012, the Company received a refund of approximately
$7.4 million
related to the termination of this customer relationship.
As part of the acquisition of Filterfresh, the Company acquired a subsidiary with a redeemable noncontrolling interest. The Company classifies redeemable noncontrolling interests outside of stockholders' equity in the Consolidated Balance Sheets in “Common Stock Subject to Repurchase and Other.” As of
October 3, 2014
and
September 27, 2013
, the redeemable noncontrolling interest related to the subsidiary was approximately
$9.9 million
and $
10.2 million
, respectively. For fiscal
2014
, fiscal 2013 and fiscal 2012, net income attributable to the redeemable noncontrolling interest was
$0.5 million
,
$0.8 million
and
$1.1 million
, respectively. Distributions to the redeemable noncontrolling interest was
$0.8 million
,
$0.9 million
and
$0.9 million
for fiscal years
2014
, 2013, and 2012, respectively.
During fiscal 2013, the Company initiated a series of actions and developed plans to drive efficiencies through the consolidation and centralization of select functions. As a result, the Company recorded charges during fiscal 2013 of approximately
$63.9 million
for severance and related costs. In addition, the Company recorded charges during fiscal 2013 of approximately
$11.7 million
for goodwill impairments and other asset write-downs of approximately
$12.0 million
primarily related to the write-offs of certain client contractual investments. During fiscal 2014, as a result of additional cost saving and refinements and the continuation of productivity initiatives to the Company's original plans for consolidation and centralization initiatives and actual attrition of the workforce, the Company recorded net severance charges of approximately
$21.3 million
.
The following table summarizes the unpaid obligations for severance and related costs as of October 3, 2014, which are included in "Accrued payroll and related expenses" in the Consolidated Balance Sheets. The majority of the unpaid obligations are expected to be paid during fiscal 2015.
|
(in millions)
|
September 27, 2013
|
Net Charges
|
Payments and Other
|
October 3, 2014
|
|||||||||
|
Severance and Related Costs Accrual
|
|
$46.7
|
|
21.3
|
|
(27.3
|
)
|
|
$40.7
|
|
|||
Goodwill represents the excess of the fair value of consideration paid for an acquired entity over the fair value of assets acquired and liabilities assumed in a business combination. Goodwill is not amortized and is subject to an impairment test that the Company conducts annually, or more frequently if a change in circumstances or the occurrence of events indicates that potential impairment exists, using discounted cash flows. The Company performs its assessment of goodwill at the reporting unit level. Within the Food and Support Services International ("FSS International") segment, each country is evaluated separately since such operating units are relatively autonomous and separate goodwill balances have been recorded for each entity. The Company has completed its annual goodwill impairment test for fiscal 2014, which determined goodwill was not impaired. The Company performs its annual impairment test as of the end of fiscal month August.
S-14
Goodwill, allocated by segment, is as follows (in thousands):
|
Segment
|
September 27, 2013
|
Acquisitions and
Divestitures |
Translation
|
October 3, 2014
|
|||||||||||
|
FSS North America
|
$
|
3,595,048
|
|
$
|
(11,165
|
)
|
$
|
(227
|
)
|
$
|
3,583,656
|
|
|||
|
FSS International
|
451,154
|
|
—
|
|
(19,909
|
)
|
431,245
|
|
|||||||
|
Uniform
|
573,785
|
|
994
|
|
—
|
|
574,779
|
|
|||||||
|
$
|
4,619,987
|
|
$
|
(10,171
|
)
|
$
|
(20,136
|
)
|
$
|
4,589,680
|
|
||||
The reduction in goodwill for Food and Support Services North America ("FSS North America") is primarily related to the Chalet divestiture (see Note 2).
Other intangible assets consist of (in thousands):
|
October 3, 2014
|
September 27, 2013
|
||||||||||||||||||||||
|
Gross
Amount |
Accumulated
Amortization |
Net
Amount |
Gross
Amount |
Accumulated
Amortization |
Net
Amount |
||||||||||||||||||
|
Customer relationship assets
|
$
|
1,885,222
|
|
$
|
(1,386,248
|
)
|
$
|
498,974
|
|
$
|
1,892,484
|
|
$
|
(1,242,578
|
)
|
$
|
649,906
|
|
|||||
|
Trade names
|
755,400
|
|
(1,633
|
)
|
753,767
|
|
760,491
|
|
(1,633
|
)
|
758,858
|
|
|||||||||||
|
$
|
2,640,622
|
|
$
|
(1,387,881
|
)
|
$
|
1,252,741
|
|
$
|
2,652,975
|
|
$
|
(1,244,211
|
)
|
$
|
1,408,764
|
|
||||||
Acquisition-related intangible assets consist of customer relationship assets, the Aramark trade name and other trade names. Customer relationship assets are being amortized principally on a straight-line basis over the expected period of benefit,
3
to
24
years, with a weighted average life of approximately
12
years. The Aramark trade name is an indefinite lived intangible asset and is not amortizable but is evaluated for impairment at least annually. The Company completed its annual trade name impairment test, which did not result in an impairment charge.
Intangible assets of approximately
$11.3 million
were acquired through business combinations during fiscal
2014
. Amortization of intangible assets for fiscal
2014
, fiscal
2013
and fiscal
2012
was approximately
$158 million
,
$192 million
and
$198 million
, respectively.
Based on the recorded balances at
October 3, 2014
, total estimated amortization of all acquisition-related intangible assets for fiscal years
2015
through
2019
follows (in thousands):
|
2015
|
$
|
133,428
|
|
|
2016
|
$
|
97,451
|
|
|
2017
|
$
|
73,997
|
|
|
2018
|
$
|
50,732
|
|
|
2019
|
$
|
41,186
|
|
S-15
Long-term borrowings are summarized in the following table (in thousands):
|
October 3,
2014 |
September 27,
2013 |
|||||||
|
Senior secured revolving credit facility
|
$
|
—
|
|
$
|
10,000
|
|
||
|
Senior secured term loan facility, due July 2016
|
74,884
|
|
3,032,349
|
|
||||
|
Senior secured term loan facility, due September 2019
|
1,351,189
|
|
1,393,559
|
|
||||
|
Senior secured term loan facility, due February 2021
|
2,559,925
|
|
—
|
|
||||
|
5.75% senior notes, due March 2020
|
1,000,000
|
|
1,000,000
|
|
||||
|
Receivables Facility, due May 2017
|
350,000
|
|
300,000
|
|
||||
|
Capital leases
|
54,420
|
|
52,385
|
|
||||
|
Other
|
55,176
|
|
35,777
|
|
||||
|
5,445,594
|
|
5,824,070
|
|
|||||
|
Less—current portion
|
(89,805
|
)
|
(65,841
|
)
|
||||
|
$
|
5,355,789
|
|
$
|
5,758,229
|
|
|||
The Company used the net proceeds from its December 2013 IPO to repay borrowings of approximately
$154.1 million
on the senior secured revolving credit facility that were borrowed during the first quarter of fiscal 2014 and
$370.0 million
on the senior secured term loan facility (see Note 9). As of October 3, 2014, there was approximately
$486.3
million of outstanding foreign currency borrowings.
Senior Secured Credit Agreement
Senior Secured Term Loan Facilities
The senior secured term loan facility consists of the following subfacilities as of
October 3, 2014
:
|
•
|
A U.S. dollar denominated term loan to Aramark Services, Inc. in the amount of
$1,351.2 million
(due 2019) and
$2,128.8 million
(due 2021);
|
|
•
|
A U.S. dollar denominated term loan to a Canadian subsidiary in the amount of
$74.9 million
(due 2016);
|
|
•
|
A yen denominated term loan to Aramark Services, Inc. in the amount of
¥5,017.2 million
(due 2021);
|
|
•
|
A Canadian dollar denominated term loan to a Canadian subsidiary in the amount of CAD
29.9 million
(due 2021);
|
|
•
|
A euro denominated term loan to an Irish subsidiary in an amount of
€138.7 million
(due 2021); and
|
|
•
|
A sterling denominated term loan to a U.K. subsidiary in an amount of
£113.9 million
(due 2021);
|
The primary borrower under the senior secured credit facilities is Aramark Services, Inc. In addition, certain subsidiaries of Aramark Services, Inc. are borrowers under certain subfacilities of the term loan facility and/or the revolving credit facility. The Company is not a guarantor under the senior secured credit facilities and is not subject to the covenants or obligations under the senior secured credit agreement.
2014 Amendment Agreements
On February 24, 2014, Aramark Services, Inc. entered into an Amendment Agreement (“2014 Amendment Agreement”) to the Amended and Restated Credit Agreement dated as of March 26, 2010 (as amended, supplemented or otherwise modified from time to time, the “Credit Agreement”). The 2014 Amendment Agreement amends and restates the Credit Agreement effective as of February 24, 2014. Among other things, the 2014 Amendment Agreement provided for approximately
$3,982.0 million
in the aggregate of new term loans, all of which were borrowed on February 24, 2014.
$2,582.0 million
of these new term loans have a maturity date of February 24, 2021, with an acceleration to December 13, 2019 if the
5.75%
Senior Notes due March 15, 2020 remain outstanding on December 13, 2019. The remaining
$1,400.0 million
of new term loans have a maturity date of September 7, 2019. The term loans due on February 24, 2021 include €
140.0 million
of term loans denominated in euros, £
115.0 million
of term loans denominated in sterling and ¥
5,042.0 million
of term loans denominated in yen. The proceeds of the new term loans were used to refinance all existing term loans under the Credit Agreement with the exception of approximately $
75.0 million
in term loans due 2016 borrowed by Aramark Services, Inc.’s Canadian subsidiary. All U.S. dollar denominated new term loans have an applicable margin of
2.50%
for eurocurrency (LIBOR) borrowings, subject to a LIBOR floor of
0.75%
, and an applicable margin of
1.50%
for base-rate borrowings, subject to a minimum base rate of
1.75%
. The new yen denominated and euro denominated term loans have an applicable margin of
2.75%
, subject to a LIBOR floor of
0.75%
, and the new sterling denominated terms loans have an applicable margin of
3.25%
., subject to a LIBOR floor of
0.75%
. The
S-16
term loans due on February 24, 2021 were borrowed with an original issue discount of
0.50%
. The term loans due on September 7, 2019 were borrowed with an original issue discount of
0.25%
.
During fiscal 2014, approximately
$22.9 million
of lender fees and third-party costs directly attributable to the term loans of the 2014 Amendment Agreement were capitalized and are included in the Consolidated Balance Sheets. Approximately
$3.4 million
and
$5.1 million
of the third-party costs were paid to entities affiliated with GS Capital Partners and J.P. Morgan Partners, respectively. The Company also recorded charges to "Interest and Other Financing Costs, net” in the Consolidated Statements of Income during fiscal 2014 consisting of
$13.1 million
of third-party costs and
$12.6 million
of non-cash charges for the write-off of deferred financing costs and original issue discount.
Amendment Agreement No. 1
On March 28, 2014, Aramark Services, Inc. entered into Amendment Agreement No. 1 to the 2014 Amendment Agreement, which allowed Aramark Services, Inc. to borrow in a Canadian dollar denominated term loan in an amount of CAD
34.0 million
, due February 2021.
2013 Amendment Agreements
Amendment Agreement No. 4
On February 22, 2013, Aramark Services, Inc. entered into Amendment Agreement No. 4 (“Amendment Agreement No. 4”) to the Amended and Restated Credit Agreement dated as of March 26, 2010 (as amended, the “Credit Agreement”) which provided for, among other things, additional term loans and the extension of a portion of the revolving credit facility. On March 7, 2013, Aramark Services, Inc. borrowed
$1,400 million
of term loans pursuant to Amendment Agreement No. 4. The new term loans were borrowed by Aramark Services, Inc. with an original issue discount of
0.50%
. The term loans under Amendment Agreement No. 4 mature on September 7, 2019.
During fiscal 2013, approximately
$14.0 million
of third-party costs directly attributable to the term loans borrowed pursuant to Amendment Agreement No. 4 were capitalized and are included in “Other Assets” in the Consolidated Balance Sheets, of which approximately
$6.2 million
were paid to entities affiliated with GS Capital Partners and J.P. Morgan Partners.
Amendment Agreement No. 3
On December 20, 2012, Aramark Services, Inc. amended the senior secured credit agreement (“Amendment Agreement No. 3”) to, among other things, borrow
$670 million
of new term loans to repay approximately
$650 million
of existing term loans and to fund certain discounts, fees and costs associated with the amendment.
During fiscal 2013, approximately
$11.6 million
of third-party costs directly attributable to Amendment Agreement No. 3 were expensed and are included in “Interest and Other Financing Costs, net” in the Consolidated Statements of Income. Approximately
$4.6 million
of the third-party costs were paid to entities affiliated with GS Capital Partners and J.P. Morgan Partners.
Senior Secured Revolving Credit Facility
The senior secured revolving credit facility consists of the following subfacilities:
|
•
|
A revolving credit facility available for loans in U.S. dollars to Aramark Services, Inc. with aggregate commitments of
$720 million
(
$680 million
with a final maturity of February 24, 2019 and
$40 million
with a final maturity of January 26, 2015); and
|
|
•
|
A revolving credit facility available for loans in Canadian dollars or U.S. dollars to Aramark Services, Inc. or a Canadian subsidiary with aggregate commitments of
$50 million
(due February 24, 2019).
|
2014 Amendment Agreement
The 2014 Amendment Agreement also extended, from January 26, 2017, to February 24, 2019, of the maturity of
$565.0 million
in revolving lender commitments of the existing
$605.0 million
revolving credit facility under the Credit Agreement. The 2014 Amendment Agreement also increased the revolving lender commitments by
$165.0 million
, for a total revolving facility of
$770.0 million
.
During fiscal 2014, approximately
$4.8 million
of third-party costs directly attributable to the revolving credit facility of the 2014 Amendment Agreement were capitalized and are included in "Other Assets" in the Consolidated Balance Sheets.
The applicable margin spread for U.S. dollar borrowings under the
$680.0 million
of extended revolving credit commitments is
2.50%
with respect to eurocurrency (LIBOR) borrowings and
1.50%
with respect to base-rate borrowings. The applicable margin spread for U.S. dollar borrowings under the remaining
$40.0 million
of unextended revolving credit commitments is
3.25%
with respect to eurocurrency (LIBOR) borrowings and
2.25%
with respect to base-rate borrowings. The applicable
S-17
margin spread for Canadian dollar borrowings under the revolving credit facility are
2.50%
for BA (bankers’ acceptance) rate borrowings and
1.50%
for base rate borrowings. U.S. and Canadian swingline loans must be base rate borrowings.
In addition to paying interest on outstanding principal, the Company is required to pay a commitment fee to the lenders under the revolving credit facility in respect of the unutilized commitments thereunder. The commitment fee rate is
0.50%
per annum.
The Company's revolving credit facility includes a
$250.0 million
sublimit for letters of credit and includes borrowing capacity available for short-term borrowings referred to as swingline loans subject to a sublimit.
The senior secured credit facilities provide that the Company has the right at any time to request up to
$555.0 million
of incremental commitments in the aggregate under one or more incremental term loan facilities and/or synthetic letter of credit facilities and/or revolving credit facilities and/or by increasing commitments under the revolving credit facility. The lenders under these facilities are not under any obligation to provide any such incremental facilities or commitments, and any such addition of or increase in facilities or commitments will be subject to pro forma compliance with an incurrence-based financial covenant and customary conditions precedent. Our ability to obtain extensions of credit under these incremental facilities or commitments is subject to the same conditions as extensions of credit under the existing credit facilities.
As of October 3, 2014, there was approximately
$753.9 million
available for borrowing on the revolving credit facility.
Prepayments and Amortization
The senior secured credit agreement requires us to prepay outstanding term loans, subject to certain exceptions, with:
|
•
|
50%
of Aramark Services, Inc.’s annual excess cash flow (as defined in the senior secured credit agreement) with stepdowns to
25%
and
0%
upon Aramark Services, Inc.’s reaching a certain consolidated leverage ratio threshold;
|
|
•
|
100%
of the net cash proceeds of all nonordinary course asset sales or other dispositions of property subject to certain exceptions and customary reinvestment rights; and
|
|
•
|
100%
of the net cash proceeds of any incurrence of debt, including debt incurred by any business securitization subsidiary in respect of any business securitization facility, but excluding proceeds from the receivables facilities and other debt permitted under the senior secured credit agreement.
|
The foregoing mandatory prepayments will be applied to the term loan facilities as directed by us. The Company may voluntarily repay outstanding loans under the senior secured credit facilities at any time without premium or penalty, other than as set forth below and customary “breakage” costs with respect to LIBOR loans. Prepaid term loans may not be reborrowed.
If prior to February 24, 2015, any term loan is voluntarily repaid or repriced pursuant to a Repricing Transaction (as defined in the senior secured credit agreement), it shall be subject to a prepayment premium of 1% of the amount of such term loans.
During fiscal 2014, the Company prepaid approximately
$35.0 million
to cover required principal payments on the 2019 term loan for
10
months. During fiscal 2013, the Company made an optional prepayment of
$265.0 million
of outstanding U.S. dollar term loans.
If a change of control as defined in the senior secured credit agreement occurs, this will cause an event of default under the credit agreement. Upon an event of default, the senior secured credit facilities may be accelerated, in which case the Company would be required to repay all outstanding loans plus accrued and unpaid interest and all other amounts outstanding under the senior credit facilities.
The Company is required to repay installments on the loans under the term loan facilities in quarterly principal amounts of
1%
per annum of their funded total principal amount beginning on June 30, 2014 (except for the Canadian term loans due on July 26, 2016, which the Company began to repay on March 31, 2014).
Guarantees and Certain Covenants
All obligations under the senior secured credit agreement are unconditionally guaranteed by Aramark Intermediate Holdco Corporation and, subject to certain exceptions, substantially all of Aramark Services, Inc.’s existing and future domestic subsidiaries (excluding certain immaterial and dormant subsidiaries, receivables facility subsidiaries, business securitization subsidiaries and certain subsidiaries designated by us under our senior secured credit agreement as “unrestricted subsidiaries”), referred to, collectively, as U.S. Guarantors. All obligations of each foreign borrower under the senior secured credit facilities are unconditionally guaranteed by Aramark Services, Inc., the U.S. guarantors and, subject to certain exceptions and qualifications, the respective other foreign borrowers. All obligations under the senior secured credit facilities, and the guarantees of those obligations, are also secured by pledges of
100%
of the capital stock of Aramark Services, Inc. and
100%
of the capital stock held by Aramark Services, Inc. or any of the U.S. Guarantors.
The senior secured credit agreement contains a number of covenants that, among other things, restrict, subject to certain exceptions, Aramark Services, Inc.’s ability to: incur additional indebtedness; issue preferred stock or provide guarantees;
S-18
create liens on assets; engage in mergers or consolidations; sell assets; pay dividends, make distributions or repurchase its capital stock; make investments, loans or advances; repay or repurchase any notes; create restrictions on the payment of dividends or other amounts to Aramark Services, Inc. from its restricted subsidiaries; make certain acquisitions; engage in certain transactions with affiliates; amend material agreements governing Aramark Services, Inc.’s outstanding notes (or any indebtedness that refinances the notes); and fundamentally change Aramark Services, Inc.’s business. In addition, the senior secured revolving credit facility requires Aramark Services, Inc. to maintain a maximum senior secured leverage ratio and imposes limitations on capital expenditures. The senior secured credit agreement also contains certain customary affirmative covenants, such as financial and other reporting, and certain events of default. At
October 3, 2014
, Aramark Services, Inc. was in compliance with all of these covenants.
The senior secured credit agreement requires Aramark Services, Inc. to maintain a maximum Consolidated Secured Debt Ratio, defined as consolidated total indebtedness secured by a lien to Covenant Adjusted EBITDA, of
5.875
x, being reduced over time to
5.125
x (as of
October 3, 2014
—
5.50
x). Consolidated total indebtedness secured by a lien is defined in the senior secured credit agreement as total indebtedness outstanding under the senior secured credit agreement, capital leases, advances under the Receivables Facility and any other indebtedness secured by a lien reduced by the lesser of the amount of cash and cash equivalents on the consolidated balance sheet that is free and clear of any lien and
$75 million
. Non-compliance with the maximum Consolidated Secured Debt Ratio could result in the requirement to immediately repay all amounts outstanding under such agreement, which, if Aramark Services, Inc.’s revolving credit facility lenders failed to waive any such default, would also constitute a default under the indenture. The actual ratio at
October 3, 2014
was
3.50
x.
The senior secured credit agreement establishes an incurrence-based minimum Interest Coverage Ratio, defined as Adjusted EBITDA to consolidated interest expense, as a condition for Aramark Services, Inc. to incur additional indebtedness and to make certain restricted payments. The minimum Interest Coverage Ratio is
2.00
x for the term of the senior secured credit agreement. If Aramark Services, Inc. does not maintain this minimum Interest Coverage Ratio calculated on a pro forma basis for any such additional indebtedness or restricted payments, it could be prohibited from being able to incur additional indebtedness, other than the additional funding provided for under the senior secured credit agreement and pursuant to specified exceptions, and make certain restricted payments, other than pursuant to certain exceptions. Consolidated interest expense is defined in the senior secured credit agreement as consolidated interest expense excluding interest income, adjusted for acquisitions and dispositions, further adjusted for certain non-cash or nonrecurring interest expense and Aramark Services, Inc.’s estimated share of interest expense from one equity method investee. The actual ratio was
4.16
x for the twelve months ended
October 3, 2014
.
5.75%
Senior Notes due 2020
On March 7, 2013, Aramark Services, Inc. issued
$1,000 million
of
5.75%
Senior Notes due March 15, 2020 (the “Senior Notes”) pursuant to an indenture, dated as of March 7, 2013 (the “Indenture”), entered into by Aramark Services, Inc. The Senior Notes were issued at par. The Senior Notes are unsecured obligations of Aramark Services, Inc. The Senior Notes rank equal in right of payment to all of Aramark Services, Inc.’s existing and future senior debt and senior in right of payment to all of Aramark Services, Inc.’s existing and future debt that is expressly subordinated in right of payment to the Senior Notes. The Senior Notes are guaranteed on a senior, unsecured basis by substantially all of the domestic subsidiaries of Aramark Services, Inc. Interest on the Senior Notes is payable on March 15 and September 15 of each year. The Senior Notes and guarantees are structurally subordinated to all of the liabilities of any of Aramark Services, Inc.’s subsidiaries that do not guarantee the Senior Notes. On December 17, 2013, the Company became a guarantor of Aramark Services, Inc.'s obligations with respect to the Senior Notes.
Prior to March 15, 2015, Aramark Services, Inc. may redeem up to
40%
of the Senior Notes with the proceeds from one or more qualified equity offerings at a price equal to
105.750%
of the principal amount of the Senior Notes redeemed, plus accrued and unpaid interest and additional interest, if any, to the date of redemption. In addition, at any time prior to March 15, 2015, Aramark Services, Inc. may redeem all or a portion of the Senior Notes at a price equal to
100%
of the principal amount of the Senior Notes redeemed plus a “make whole” premium and accrued and unpaid interest and additional interest, if any, to the date of redemption. Thereafter, Aramark Services, Inc. has the option to redeem all or a portion of the Senior Notes at any time at the redemption prices set forth in the Indenture.
In the event of certain types of changes of control, the holders of the Senior Notes may require Aramark Services, Inc. to purchase for cash all or a portion of their Senior Notes at a purchase price equal to
101%
of the principal amount of such Senior Notes, plus accrued and unpaid interest, if any, to the date of repurchase.
The Indenture contains covenants limiting Aramark Services, Inc.’s ability and the ability of its restricted subsidiaries to: incur additional indebtedness or issue certain preferred shares; pay dividends and make certain distributions, investments and other restricted payments; create certain liens; sell assets; enter into transactions with affiliates; limit the ability of restricted subsidiaries to make payments to Aramark Services, Inc.; enter into sale and leaseback transactions; merge, consolidate, sell or
S-19
otherwise dispose of all or substantially all of Aramark Services, Inc.’s assets; and designate Aramark Services, Inc.’s subsidiaries as unrestricted subsidiaries. The Indenture also provides for events of default which, if any of them occurs, would permit or require the principal of and accrued interest on the Senior Notes to become or to be declared due and payable.
During fiscal 2013, approximately
$13.8 million
of third-party costs directly attributable to the Senior Notes were capitalized and are included in “Other Assets” in the Consolidated Balance Sheets. Approximately
$7.3 million
of the third-party costs were paid to entities affiliated with GS Capital Partners and J.P. Morgan Partners.
Repurchase of
8.50%
Senior Notes due 2015, Senior Floating Rate Notes due 2015 and
8.625%
/
9.375%
Senior Notes due 2016
During fiscal 2013, in connection with the tender offer and the full and complete satisfaction and discharge of the remaining aggregate principal of the
8.625%
/
9.375%
Senior Notes due 2016, the
8.50%
Senior Notes due 2015 and the Senior Floating Notes due 2015, the Company recorded
$39.8 million
of charges to "interest and Other Financing Costs, net" in the Consolidated Statements of Income consisting of
$12.9 million
of third party costs for the tender offer premium and
$26.9 million
of non-cash charges for the write-off of deferred financing costs.
Future Maturities and Interest and Other Financing Costs, net
At
October 3, 2014
, annual maturities on long-term borrowings maturing in the next five fiscal years and thereafter (excluding the $
19.0 million
discount on the senior secured term loan facilities) are as follows (in thousands):
|
2015
|
$
|
89,805
|
|
|
2016
|
$
|
116,750
|
|
|
2017
|
$
|
391,664
|
|
|
2018
|
$
|
48,011
|
|
|
2019
|
$
|
1,363,475
|
|
|
Thereafter
|
$
|
3,454,928
|
|
The components of interest and other financing costs, net, are summarized as follows (in thousands):
|
Fiscal Year Ended
|
||||||||||||
|
October 3, 2014
|
September 27, 2013
|
September 28, 2012
|
||||||||||
|
Interest expense
|
$
|
334,442
|
|
$
|
425,625
|
|
$
|
459,083
|
|
|||
|
Interest income
|
(4,338
|
)
|
(6,430
|
)
|
(5,477
|
)
|
||||||
|
Other financing costs
|
4,782
|
|
4,650
|
|
3,201
|
|
||||||
|
Total
|
$
|
334,886
|
|
$
|
423,845
|
|
$
|
456,807
|
|
|||
The Company enters into contractual derivative arrangements to manage changes in market conditions related to interest on debt obligations, foreign currency exposures and exposure to fluctuating gasoline and diesel fuel prices. Derivative instruments utilized during the period include interest rate swap agreements, foreign currency forward exchange contracts, and gasoline and diesel fuel agreements. All derivative instruments are recognized as either assets or liabilities on the balance sheet at fair value at the end of each quarter. The counterparties to the Company’s contractual derivative agreements are all major international financial institutions. The Company is exposed to credit loss in the event of nonperformance by these counterparties. The Company continually monitors its positions and the credit ratings of its counterparties, and does not anticipate nonperformance by the counterparties. For designated hedging relationships, the Company formally documents the hedging relationship and its risk management objective and strategy for undertaking the hedge, the hedging instrument, the hedged item, the nature of the risk being hedged, how the hedging instrument’s effectiveness in offsetting the hedged risk will be assessed prospectively and retrospectively, and a description of the method of measuring ineffectiveness. The Company also formally assesses, both at the hedge’s inception and on an ongoing basis, whether the derivatives that are used in hedging transactions are highly effective in offsetting cash flows of hedged items.
Cash Flow Hedges
The Company has
$2.9 billion
notional amount of outstanding interest rate swap agreements, fixing the rate on a like amount of variable rate borrowings. During fiscal 2014, the Company entered into
$1.1 billion
notional amount of forward starting interest rate swap agreements to hedge the cash flow risk of variability in interest payments on variable rate borrowings. During the second quarter of fiscal 2014, as a result of the 2014 Amendment Agreement, the Company de-designated the interest rate swap
S-20
agreements as the terms of the interest rate swaps did not match the terms of the new term loans. Prior to the 2014 Amendment Agreement, these agreements met the required criteria to be designated as cash flow hedging instruments. As a result of the de-designation, the mark-to-market values of the Company's cash flow hedges included in Accumulated Other Comprehensive Loss, which was approximately
$22.8 million
of unrealized net of tax losses, were frozen as of the de-designation date and will be reclassified into earnings as the underlying hedged transactions affect earnings. In February 2014, the Company amended the interest rate swap agreements to match the terms of the new term loans under the 2014 Amendment Agreement to meet the criteria to be designated as cash flow hedging instruments. Changes in the fair value of a derivative that is designated as and meets all the required criteria for a cash flow hedge are recorded in accumulated other comprehensive income (loss) and reclassified into earnings as the underlying hedged item affects earnings. As of
October 3, 2014
and
September 27, 2013
, approximately
($19.7) million
and
($20.5) million
of unrealized net of tax losses related to the interest rate swaps were included in “Accumulated other comprehensive loss,” respectively. The hedge ineffectiveness for these cash flow hedging instruments during
fiscal
2014
,
fiscal
2013
and
fiscal
2012
was not material.
The Company has
$74.9 million
of outstanding amortizing cross currency swaps to mitigate the risk of variability in principal and interest payments on the Canadian subsidiary's variable rate debt denominated in U.S. dollars. During fiscal 2014, approximately
$82.7 million
of amortizing cross currency swaps matured. As of
October 3, 2014
and
September 27, 2013
, unrealized net of tax losses of approximately
($6.5) million
and
($3.5) million
related to the cross currency swap were included in “Accumulated other comprehensive loss,” respectively. The hedge ineffectiveness for this cash flow hedging instrument during
fiscal
2014
and
fiscal
2013
was not material. The hedge ineffectiveness for
fiscal
2012 was approximately
$3.6 million
.
As a result of Amendment Agreement No. 3 on December 20, 2012, the Company de-designated the cross currency swap that hedged the Canadian subsidiary's term loan with a maturity date of January 26, 2014. Prior to Amendment Agreement No. 3, these contracts met the required criteria to be designated as cash flow hedging instruments. As a result, approximately
$3.2 million
was reclassified from “Accumulated other comprehensive loss” in the Consolidated Balance Sheets to “Interest and Other Financing Costs, net” in the Consolidated Statements of
Income
during
fiscal
2013
.
The following table summarizes the net of tax effect of our derivatives designated as cash flow hedging instruments on Comprehensive Income (in thousands):
|
Fiscal Year Ended
|
|||||||||||
|
October 3, 2014
|
September 27, 2013
|
September 28, 2012
|
|||||||||
|
Interest rate swap agreements
|
$
|
854
|
|
$
|
7,598
|
|
$
|
28,147
|
|
||
|
Cross currency swap agreements
|
(3,050
|
)
|
1,514
|
|
5,580
|
|
|||||
|
Natural gas hedge agreements
|
—
|
|
—
|
|
113
|
|
|||||
|
$
|
(2,196
|
)
|
$
|
9,112
|
|
$
|
33,840
|
|
|||
Derivatives not Designated in Hedging Relationships
In fiscal 2013, as a result of Amendment Agreement No. 3, the Company elected to de-designate the cross currency swaps that hedged the Canadian subsidiary's term loan with a maturity date of January 26, 2014. As a result, changes in the fair value of these swaps are recorded in earnings. During the second quarter of fiscal 2014, the cross currency swap matured. For fiscal 2014 and fiscal 2013, the Company recorded a pretax gain of approximately
$5.8 million
and
$3.0 million
for the change in the fair value of these swaps in “Interest and Other Financing Costs, net” in the Consolidated Statements of Income, respectively.
The Company entered into a series of pay fixed/receive floating gasoline and diesel fuel agreements based on the Department of Energy weekly retail on-highway index in order to limit its exposure to price fluctuations for gasoline and diesel fuel. During
fiscal
2014
, the Company entered into contracts for approximately
8.8 million
gallons. As of
October 3, 2014
, the Company has contracts for approximately
6.2 million
gallons outstanding for fiscal 2015. The Company does not record its gasoline and diesel fuel agreements as hedges for accounting purposes. During
fiscal
2014
, the Company recorded a pretax loss of $
1.8 million
in the Consolidated Statements of Income for the change in the fair value of these agreements. The impact on earnings related to the change in fair value of these contracts for fiscal years ended 2013 and 2012 was not material.
As of
October 3, 2014
, the Company had foreign currency forward exchange contracts outstanding with notional amounts of
€13.4 million
,
£6.0 million
and CAD
74.8 million
to mitigate the risk of changes in foreign currency exchange rates on short-term intercompany loans to certain international subsidiaries. Gains and losses on these foreign currency exchange contracts are recognized in income as the contracts were not designated as hedging instruments, substantially offsetting currency transaction gains and losses on the short-term intercompany loans.
S-21
The following table summarizes the location and fair value, using Level 2 inputs, of the Company’s derivatives designated and not designated as hedging instruments in the Consolidated Balance Sheets (in thousands):
|
Balance Sheet Location
|
October 3, 2014
|
September 27, 2013
|
||||||||
|
ASSETS
|
||||||||||
|
Not designated as hedging instruments:
|
||||||||||
|
Foreign currency forward exchange contracts
|
Prepayments
|
$
|
379
|
|
$
|
—
|
|
|||
|
Gasoline and diesel fuel agreements
|
Prepayments
|
—
|
|
37
|
|
|||||
|
$
|
379
|
|
$
|
37
|
|
|||||
|
LIABILITIES
|
||||||||||
|
Designated as hedging instruments:
|
||||||||||
|
Interest rate swap agreements
|
Accrued Expenses
|
$
|
—
|
|
$
|
3,494
|
|
|||
|
Interest rate swap agreements
|
Other Noncurrent Liabilities
|
27,015
|
|
30,431
|
|
|||||
|
Cross currency swap agreements
|
Other Noncurrent Liabilities
|
7,467
|
|
16,129
|
|
|||||
|
34,482
|
|
50,054
|
|
|||||||
|
Not designated as hedging instruments:
|
||||||||||
|
Foreign currency forward exchange contracts
|
Accounts Payable
|
—
|
|
366
|
|
|||||
|
Gasoline and diesel fuel agreements
|
Accounts Payable
|
1,783
|
|
—
|
|
|||||
|
Cross currency swap agreements
|
Accrued Expenses
|
—
|
|
12,818
|
|
|||||
|
$
|
36,265
|
|
$
|
63,238
|
|
|||||
The following table summarizes the location of (gain) loss reclassified from “Accumulated other comprehensive loss” into earnings for derivatives designated as hedging instruments and the location of (gain) loss for our derivatives not designated as hedging instruments in the Consolidated Statements of
Income
(in thousands):
|
Fiscal Year Ended
|
||||||||||||||
|
Account
|
October 3, 2014
|
September 27, 2013
|
September 28, 2012
|
|||||||||||
|
Designated as hedging instruments:
|
||||||||||||||
|
Interest rate swap agreements
|
Interest Expense
|
$
|
31,511
|
|
$
|
23,479
|
|
$
|
66,260
|
|
||||
|
Cross currency swap agreements
|
Interest Expense
|
(5,590
|
)
|
289
|
|
18,048
|
|
|||||||
|
Natural gas hedge agreements
|
Cost of services provided
|
—
|
|
—
|
|
396
|
|
|||||||
|
$
|
25,921
|
|
$
|
23,768
|
|
$
|
84,704
|
|
||||||
|
Not designated as hedging instruments:
|
||||||||||||||
|
Cross currency swap agreements
|
Interest Expense
|
$
|
(5,111
|
)
|
$
|
181
|
|
$
|
—
|
|
||||
|
Gasoline and diesel fuel agreements
|
Cost of services provided
|
1,696
|
|
7
|
|
24
|
|
|||||||
|
Foreign currency forward exchange contracts
|
Interest Expense
|
3,644
|
|
2,697
|
|
(265
|
)
|
|||||||
|
229
|
|
2,885
|
|
(241
|
)
|
|||||||||
|
$
|
26,150
|
|
$
|
26,653
|
|
$
|
84,463
|
|
||||||
The Company previously entered into a Japanese yen denominated term loan in the amount of
¥5,017.2 million
. The te
rm loan was designated as a hedge of the Company's net Japanese currency exposure represented by the equity investment in our Japanese affiliate, AIM Services Co., Ltd.
At
October 3, 2014
, the net of tax loss expected to be reclassified from “Accumulated other comprehensive loss” into earnings over the next twelve months based on current market rates is approximately
$18.9 million
.
In the United States, the Company maintains qualified contributory and non-contributory defined contribution retirement plans for eligible employees, with Company contributions to the plans based on earnings performance or salary level. The Company also has a non-qualified retirement savings plan for certain employees. The total expense of the above plans for
fiscal
2014
,
S-22
fiscal
2013
and
fiscal
2012
was
$27.7 million
,
$32.4 million
and
$29.5 million
, respectively. The Company also maintains similar contributory and non-contributory defined contribution retirement plans at several of its international operations. The total expense of these international plans for
fiscal
2014
,
fiscal
2013
and
fiscal
2012
was
$9.6 million
,
$8.5 million
and
$5.0 million
, respectively. Additionally, the Company maintains several contributory and non-contributory defined benefit pension plans, primarily in Canada and the United Kingdom.
The following table sets forth the components of net periodic pension cost for the Company’s single-employer defined benefit pension plans for
fiscal
2014
,
fiscal
2013
and
fiscal
2012
(in thousands):
|
Fiscal Year Ended
|
||||||||||||
|
October 3, 2014
|
September 27, 2013
|
September 28, 2012
|
||||||||||
|
Service cost
|
$
|
9,550
|
|
$
|
11,045
|
|
$
|
9,961
|
|
|||
|
Interest cost
|
13,571
|
|
12,693
|
|
13,001
|
|
||||||
|
Expected return on plan assets
|
(16,544
|
)
|
(14,256
|
)
|
(12,521
|
)
|
||||||
|
Settlements
|
527
|
|
308
|
|
467
|
|
||||||
|
Amortization of prior service cost
|
52
|
|
119
|
|
6
|
|
||||||
|
Recognized net (gain) loss
|
1,131
|
|
3,436
|
|
2,392
|
|
||||||
|
Net periodic pension cost
|
$
|
8,287
|
|
$
|
13,345
|
|
$
|
13,306
|
|
|||
The following table set forth changes in the projected benefit obligation and the fair value of plan assets for these plans (in thousands):
|
Change in benefit obligation:
|
October 3, 2014
|
September 27, 2013
|
||||||
|
Benefit obligation, beginning
|
$
|
296,389
|
|
$
|
306,810
|
|
||
|
Foreign currency translation
|
(17,401
|
)
|
(7,641
|
)
|
||||
|
Service cost
|
9,550
|
|
11,045
|
|
||||
|
Interest cost
|
13,571
|
|
12,693
|
|
||||
|
Employee contributions
|
2,978
|
|
2,954
|
|
||||
|
Actuarial loss (gain)
|
38,274
|
|
(12,958
|
)
|
||||
|
Benefits paid
|
(13,529
|
)
|
(15,172
|
)
|
||||
|
Settlements and curtailments
|
(3,103
|
)
|
(1,342
|
)
|
||||
|
Benefit obligation, end
|
$
|
326,729
|
|
$
|
296,389
|
|
||
|
Change in plan assets:
|
||||||||
|
Fair value of plan assets, beginning
|
$
|
248,679
|
|
$
|
222,272
|
|
||
|
Foreign currency translation
|
(14,451
|
)
|
(5,359
|
)
|
||||
|
Employer contributions
|
23,769
|
|
19,731
|
|
||||
|
Employee contributions
|
2,978
|
|
2,954
|
|
||||
|
Actual return on plan assets
|
32,596
|
|
25,890
|
|
||||
|
Benefits paid
|
(13,529
|
)
|
(15,172
|
)
|
||||
|
Settlements
|
(3,108
|
)
|
(1,637
|
)
|
||||
|
Fair value of plan assets, end
|
$
|
276,934
|
|
$
|
248,679
|
|
||
|
|
||||||||
|
Funded Status at end of year
|
$
|
(49,795
|
)
|
$
|
(47,710
|
)
|
||
S-23
Amounts recognized in the Consolidated Balance Sheets consist of the following (in thousands):
|
October 3, 2014
|
September 27, 2013
|
|||||||
|
Current benefit liability (included in Accrued expenses and other current liabilities)
|
$
|
(955
|
)
|
$
|
(924
|
)
|
||
|
Noncurrent benefit liability (included in Other Noncurrent Liabilities)
|
$
|
(48,840
|
)
|
$
|
(46,786
|
)
|
||
|
Net actuarial loss (gain) (included in Accumulated other comprehensive (income) loss before taxes)
|
$
|
65,104
|
|
$
|
47,456
|
|
||
|
Prior service cost (included in Accumulated other comprehensive (income) loss before taxes)
|
$
|
36
|
|
$
|
44
|
|
||
The following weighted average assumptions were used to determine pension expense of the respective fiscal years:
|
October 3, 2014
|
September 27, 2013
|
|||||
|
Discount rate
|
4.6
|
%
|
4.2
|
%
|
||
|
Rate of compensation increase
|
3.3
|
%
|
3.4
|
%
|
||
|
Long-term rate of return on assets
|
6.6
|
%
|
6.7
|
%
|
||
The following weighted average assumptions were used to determine the funded status of the respective fiscal years:
|
October 3, 2014
|
September 27, 2013
|
|||||
|
Discount rate
|
4.0
|
%
|
4.6
|
%
|
||
|
Rate of compensation increase
|
3.3
|
%
|
3.3
|
%
|
||
Assumptions are adjusted annually, as necessary, based on prevailing market conditions and actual experience.
The accumulated benefit obligation as of
October 3, 2014
was
$302.8 million
. During
fiscal
2014
, actuarial losses of approximately
$21.3 million
were recognized in other comprehensive loss (before taxes) and
$1.1 million
of amortization of actuarial losses was recognized as net periodic pension cost during such period. The estimated portion of net actuarial loss included in accumulated other comprehensive income (loss) as of
October 3, 2014
expected to be recognized in net periodic pension cost during
fiscal
2015 is approximately
$1.9 million
(before taxes).
The accumulated benefit obligation as of
September 27, 2013
was
$273.8 million
. During
fiscal
2013
, actuarial gains of approximately
$24.2 million
were recognized in other comprehensive (loss) (before taxes) and
$3.4 million
of amortization of actuarial losses was recognized as net periodic pension cost during such period.
The following table sets forth information for the Company’s single-employer pension plans with an accumulated benefit obligation in excess of plan assets as of
October 3, 2014
and
September 27, 2013
(in thousands):
|
October 3, 2014
|
September 27, 2013
|
|||||||
|
Projected benefit obligation
|
$
|
148,459
|
|
$
|
166,798
|
|
||
|
Accumulated benefit obligation
|
144,165
|
|
160,798
|
|
||||
|
Fair value of plan assets
|
109,789
|
|
131,392
|
|
||||
Assets of the plans are invested with the goal of principal preservation and enhancement over the long-term. The primary goal is total return, consistent with prudent investment management. The Company’s investment policies also require an appropriate level of diversification across the asset categories. The current overall capital structure and targeted ranges for asset classes are
50
-
70
% invested in equity securities,
25
-
50
% invested in debt securities and
0
-
5%
in real estate investments. Performance of the plans is monitored on a regular basis and adjustments of the asset allocations are made when deemed necessary.
The weighted-average long-term rate of return on assets has been determined based on an estimated weighted-average of long-term returns of major asset classes, taking into account historical performance of plan assets, the current interest rate environment, plan demographics, acceptable risk levels and the estimated value of active asset management.
S-24
The fair value of plan assets for the Company’s defined benefit pension plans as of
October 3, 2014
and
September 27, 2013
is as follows (see Note 16 for a description of the fair value levels) (in thousands):
|
October 3, 2014
|
Quoted prices in
active markets
Level 1
|
Significant other
observable inputs
Level 2
|
Significant
unobservable inputs
Level 3
|
|||||||||||||
|
Cash and cash equivalents and other
|
$
|
697
|
|
$
|
697
|
|
$
|
—
|
|
$
|
—
|
|
||||
|
Investment funds:
|
||||||||||||||||
|
Pooled funds—equity
|
168,605
|
|
—
|
|
168,605
|
|
—
|
|
||||||||
|
Pooled funds—fixed income
|
98,951
|
|
—
|
|
98,951
|
|
—
|
|
||||||||
|
Real estate
|
8,681
|
|
—
|
|
—
|
|
8,681
|
|
||||||||
|
Total
|
$
|
276,934
|
|
$
|
697
|
|
$
|
267,556
|
|
$
|
8,681
|
|
||||
|
|
September 27, 2013
|
Quoted prices in
active markets
Level 1
|
Significant other
observable inputs
Level 2
|
Significant
unobservable inputs
Level 3
|
||||||||||||
|
Cash and cash equivalents and other
|
$
|
2,394
|
|
$
|
2,394
|
|
$
|
—
|
|
$
|
—
|
|
||||
|
Investment funds:
|
||||||||||||||||
|
Pooled funds—equity
|
157,372
|
|
—
|
|
157,372
|
|
—
|
|
||||||||
|
Pooled funds—fixed income
|
88,913
|
|
—
|
|
88,913
|
|
—
|
|
||||||||
|
Total
|
$
|
248,679
|
|
$
|
2,394
|
|
$
|
246,285
|
|
$
|
—
|
|
||||
The fair value of the pooled separate accounts is based on the value of the underlying assets, as reported to the Plan by the trustees. The pooled separate account is comprised of a portfolio of underlying securities that can be valued on active markets. Fair value is calculated by applying the Plan’s percentage ownership in the pooled separate account to the total market value of the account’s underlying securities, and is therefore categorized as Level 2 as the Plan does not directly own shares in these underlying investments. Investments in equity securities include publicly-traded domestic (approximately
23%
) and international (approximately
77%
) companies that are diversified across industry, country and stock market capitalization. Investments in fixed income securities include domestic (approximately
16%
) and international (approximately
84%
) corporate bonds and government securities. Substantially all of the real estate investments are in international markets. Cash and cash equivalents include direct cash holdings, which are valued based on cost, and short-term deposits and investments in money market funds for which fair value measurements are all based on quoted prices for similar assets or liabilities in markets that are active.
It is the Company’s policy to fund at least the minimum required contributions as outlined in the required statutory actuarial valuation for each plan. The following table sets forth the benefits expected to be paid in the next five fiscal years and in aggregate for the five fiscal years thereafter by the Company’s defined benefit pension plans (in thousands):
|
Fiscal 2015
|
$
|
11,617
|
|
|
Fiscal 2016
|
$
|
12,188
|
|
|
Fiscal 2017
|
$
|
12,865
|
|
|
Fiscal 2018
|
$
|
13,495
|
|
|
Fiscal 2019
|
$
|
13,241
|
|
|
Fiscal 2020 – 2024
|
$
|
74,611
|
|
The estimated benefit payments above are based on assumptions about future events. Actual benefit payments may vary significantly from these estimates.
The expected contributions to be paid to the Company’s defined benefit pension plans during fiscal 2015 are approximately
$13.1 million
.
Multiemployer Defined Benefit Pension Plans
The Company contributes to a number of multiemployer defined benefit pension plans under the terms of collective-bargaining agreements ("CBA") that cover its union-represented employees. The risks of participating in these multiemployer plans are different from single-employer plans in the following respects:
|
a.
|
Assets contributed to the multiemployer plan by one employer may be used to provide benefits to employees of other participating employers.
|
S-25
|
b.
|
If a participating employer stops contributing to the plan, the unfunded obligations of the plan may be borne by the remaining participating employers.
|
|
c.
|
If the Company chooses to stop participating in some of its multiemployer plans, the Company may be required to pay those plans an amount based on the underfunded status of the plan, referred to as a withdrawal liability.
|
The Company's participation in these plans for
fiscal
2014
is outlined in the table below. The “EIN/Pension Plan Number” column provides the Employee Identification Number (EIN) and the three-digit plan number, if applicable. Unless otherwise noted, the most recent Pension Protection Act (PPA) zone status available in
2014
and
2013
is for the plans' two most recent fiscal year-ends. The zone status is based on information that the Company received from the plan and is certified by the plan's actuary. Among other factors, plans in the red zone are generally less than 65 percent funded, plans in the yellow zone are less than 80 percent funded, and plans in the green zone are at least 80 percent funded. The “FIP/RP Status Pending/Implemented” column indicates plans for which a financial improvement plan (FIP) or a rehabilitation plan (RP) is either pending or has been implemented. The last column lists the expiration date(s) of the CBA(s) to which the plans are subject. There have been no significant changes that affect the comparability of
fiscal
2014
,
fiscal
2013
and
fiscal
2012
contributions.
|
Pension
Fund
|
EIN/Pension
Plan Number
|
Pension Protection
Act Zone Status
|
FIP/RP Status Pending/ Implemented
|
Contributions by the Company
(in thousands)
|
Range of Expiration Dates of CBAs
|
||||||||||
|
2014
|
2013
|
2014
|
2013
|
2012
|
Surcharge
Imposed
|
||||||||||
|
National Retirement Fund
|
13-6130178/ 001
|
Red
|
Red
|
Implemented
|
$
|
6,304
|
|
$
|
6,011
|
|
$
|
4,868
|
|
No
|
10/31/2012- 6/30/2018
|
|
Service Employees Pension Fund of Upstate New York (1)
|
16-0908576/ 001
|
Red
|
Red
|
Implemented
|
440
|
|
360
|
|
247
|
|
No
|
9/30/2014- 6/30/2015
|
|||
|
Local 1102 Retirement Trust (2)
|
13-1847329/ 001
|
Red
|
Red
|
Implemented
|
334
|
|
275
|
|
201
|
|
No
|
6/30/2013- 6/30/2015
|
|||
|
Central States SE and SW Areas Pension Plan
|
36-6044243/ 001
|
Red
|
Red
|
Implemented
|
3,549
|
|
3,415
|
|
3,164
|
|
No
|
1/31/2007- 11/26/2015
|
|||
|
Pension Plan for Hospital & Health Care Employees Philadelphia & Vicinity
|
23-2627428/ 001
|
Yellow
|
Yellow
|
Implemented
|
156
|
|
161
|
|
154
|
|
No
|
1/31/2018
|
|||
|
Retail, Wholesale and Department Store International Union and Industry Pension Fund
|
63-0708442/001
|
Green
|
Green
|
N/A
|
307
|
|
306
|
|
292
|
|
No
|
5/13/2014- 1/29/2018
|
|||
|
Local 731 IBT Textile Maintenance and Laundry Craft Pension Fund
|
51-6056180/001
|
Red
|
Red
|
Implemented
|
668
|
|
453
|
|
384
|
|
No
|
4/29/2016
|
|||
|
SEIU National Industry Pension Fund
|
52-6148540/001
|
Red
|
Red
|
Implemented
|
47
|
|
173
|
|
280
|
|
No
|
4/14/2016
|
|||
|
Automotive Industries Pension Plan
|
94-1133245/001
|
Red
|
Red
|
Implemented
|
29
|
|
28
|
|
27
|
|
No
|
5/31/2014
|
|||
|
Other funds
|
|
|
|
|
13,289
|
|
13,081
|
|
12,684
|
|
|
||||
|
Total contributions
|
|
|
|
|
$
|
25,123
|
|
$
|
24,263
|
|
$
|
22,301
|
|
|
|
|
(1)
|
Over 60% of the Company's participants in this fund are covered by a single CBA that expires on 6/30/2015.
|
|
(2)
|
Over 90% of the Company's participants in this fund are covered by a single CBA that expires on 6/30/2015.
|
The Company provided more than 5 percent of the total contributions for the following plans and plan years:
|
Pension
Fund |
Contributions to the plan exceeded more than 5% of total contributions (as of the plan's year-end)
|
|
|
Local 1102 Retirement Trust
|
12/31/ 2013 and 12/31/2012
|
|
|
Service Employees Pension Fund of Upstate New York
|
12/31/ 2013 and 12/31/2012
|
|
|
Local 731 IBT Textile Maintenance and Laundry Craft Pension Fund
|
12/31/2013 and 12/31/2012
|
|
At the date the Company's financial statements were issued, Forms 5500 were not available for the plan years ending in 2014.
S-26
The Company accounts for income taxes using the asset and liability method. Under this method, the provision for income taxes represents income taxes payable or refundable for the current year plus the change in deferred taxes during the year. Deferred taxes result from differences between the financial and tax bases of the Company’s assets and liabilities and are adjusted for changes in tax rates and tax laws when changes are enacted. Valuation allowances are recorded to reduce deferred tax assets when it is more likely than not that a tax benefit will not be realized. Interest and penalties related to income tax matters are included in the provision for income taxes.
The components of income from continuing operations before income taxes by source of income are as follows (in thousands):
|
Fiscal Year Ended
|
||||||||||||
|
October 3, 2014
|
September 27, 2013
|
September 28, 2012
|
||||||||||
|
United States
|
$
|
110,936
|
|
$
|
18,557
|
|
$
|
34,498
|
|
|||
|
Non-U.S.
|
118,741
|
|
72,072
|
|
90,470
|
|
||||||
|
$
|
229,677
|
|
$
|
90,629
|
|
$
|
124,968
|
|
||||
The provision for income taxes consists of (in thousands):
|
Fiscal Year Ended
|
||||||||||||
|
October 3, 2014
|
September 27, 2013
|
September 28, 2012
|
||||||||||
|
Current:
|
||||||||||||
|
Federal
|
$
|
6,692
|
|
$
|
2,740
|
|
$
|
45,173
|
|
|||
|
State and local
|
5,308
|
|
126
|
|
7,205
|
|
||||||
|
Non-U.S.
|
30,846
|
|
34,158
|
|
32,301
|
|
||||||
|
$
|
42,846
|
|
$
|
37,024
|
|
$
|
84,679
|
|
||||
|
Deferred:
|
||||||||||||
|
Federal
|
$
|
32,843
|
|
$
|
(1,007
|
)
|
$
|
(42,515
|
)
|
|||
|
State and local
|
2,515
|
|
(656
|
)
|
(11,189
|
)
|
||||||
|
Non-U.S.
|
2,014
|
|
(16,128
|
)
|
(12,909
|
)
|
||||||
|
37,372
|
|
(17,791
|
)
|
(66,613
|
)
|
|||||||
|
$
|
80,218
|
|
$
|
19,233
|
|
$
|
18,066
|
|
||||
Current taxes
receivable
of
$85.8 million
and
$44.6 million
at
October 3, 2014
and
September 27, 2013
, respectively, are included in “
Prepayments and other current assets
.”
The provision for income taxes varies from the amount determined by applying the United States Federal statutory rate to pretax income as a result of the following (all percentages are as a percentage of income from continuing operations before income taxes):
|
Fiscal Year Ended
|
|||||||||
|
October 3, 2014
|
September 27, 2013
|
September 28, 2012
|
|||||||
|
United States statutory income tax rate
|
35.0
|
%
|
35.0
|
%
|
35.0
|
%
|
|||
|
Increase (decrease) in taxes, resulting from:
|
|||||||||
|
State income taxes, net of Federal tax benefit
|
2.2
|
|
1.0
|
|
0.5
|
|
|||
|
Foreign taxes
|
(2.3
|
)
|
(2.2
|
)
|
(9.8
|
)
|
|||
|
Permanent book/tax differences
|
2.7
|
|
1.8
|
|
(0.6
|
)
|
|||
|
Uncertain tax positions
|
(0.4
|
)
|
(1.6
|
)
|
(1.8
|
)
|
|||
|
Tax credits & other
|
(2.3
|
)
|
(12.8
|
)
|
(8.8
|
)
|
|||
|
Effective income tax rate
|
34.9
|
%
|
21.2
|
%
|
14.5
|
%
|
|||
The effective tax rate is based on expected income, statutory tax rates and tax planning opportunities available to the Company in the various jurisdictions in which it operates. Judgment is required in determining the effective tax rate and in evaluating the Company’s tax positions. The Company establishes reserves when, despite the belief that the Company’s tax return positions are supportable, the Company believes that certain positions are likely to be challenged and that the Company may not succeed.
S-27
The Company adjusts these reserves in light of changing facts and circumstances, such as the progress of a tax audit. The effective tax rate includes the impact of reserve provisions and changes to the reserve that the Company considers appropriate, as well as related interest and penalties.
As of
October 3, 2014
, certain subsidiaries have recorded deferred tax assets of
$27.1 million
associated with accumulated federal, state and foreign net operating loss carryforwards. The Company has approximately
$12.0 million
valuation allowance as of
October 3, 2014
against these carryforwards due to the uncertainty of its realization. In addition, certain subsidiaries have accumulated state net operating loss carryforwards for which no benefit has been recorded as they are attributable to uncertain tax positions. The unrecognized tax benefits, as of
October 3, 2014
, attributable to these net operating losses was approximately
$5.2 million
. Due to the uncertain tax position, these net operating losses are not included as components of deferred tax assets as of
October 3, 2014
. The federal, state and foreign net operating loss carryforwards will expire from
2014
through
2034
.
As of
October 3, 2014
, the Company has approximately
$7.3 million
of general business credit carryforwards and
$7.6 million
of foreign tax credit carryforwards, which expire in
2034
and 2024, respectively. The Company believes it is more likely than not that it will be able to generate taxable income in the future sufficient to utilize these carryforwards, and no valuation allowance is necessary. The Company does not currently hold significant or excessive cash balances at any of its foreign operations and does not consider any of its unremitted earnings to be permanently reinvested. Therefore, the Company has provided a deferred tax liability for incremental United States taxes on all unremitted earnings.
As of
October 3, 2014
and
September 27, 2013
, the components of deferred taxes are as follows (in thousands):
|
October 3, 2014
|
September 27, 2013
|
|||||||
|
Deferred tax liabilities:
|
||||||||
|
Property and equipment
|
$
|
52,484
|
|
$
|
71,425
|
|
||
|
Investments
|
36,233
|
|
43,527
|
|
||||
|
Other intangible assets, including goodwill
|
674,097
|
|
700,526
|
|
||||
|
Inventory and Other
|
96,919
|
|
70,037
|
|
||||
|
Gross deferred tax liability
|
859,733
|
|
885,515
|
|
||||
|
Deferred tax assets:
|
||||||||
|
Insurance
|
27,574
|
|
36,458
|
|
||||
|
Employee compensation and benefits
|
210,906
|
|
218,491
|
|
||||
|
Accruals and allowances
|
22,216
|
|
37,876
|
|
||||
|
Derivatives
|
—
|
|
18,449
|
|
||||
|
Net operating loss/credit carryforwards and other
|
43,320
|
|
37,264
|
|
||||
|
Gross deferred tax asset, before valuation allowances
|
304,016
|
|
348,538
|
|
||||
|
Valuation allowances
|
(12,032
|
)
|
(10,263
|
)
|
||||
|
Net deferred tax liability
|
$
|
567,749
|
|
$
|
547,240
|
|
||
Current deferred tax assets of
$0
and
$42.7 million
are included in “Prepayments and other current assets” as of October 3, 2014 and
September 27, 2013
, respectively. Current deferred tax liabilities of
$14.7 million
and
$0
are included in "Accrued expenses and other current liabilities" as of October 3, 2014 and September 27, 2013, respectively. Deferred tax liabilities of
$553.0 million
and
$589.9 million
as of
October 3, 2014
and
September 27, 2013
, respectively, are included in “Deferred Income Taxes and Other Noncurrent Liabilities."
The Company had approximately
$26.2 million
of total gross unrecognized tax benefits as of
October 3, 2014
, all of which, if recognized, would impact the effective tax rate. A reconciliation of the beginning and ending amount of gross unrecognized tax benefits follows (in thousands):
|
|
October 3, 2014
|
September 27, 2013
|
||||
|
Balance, beginning of year
|
$
|
27,337
|
|
$
|
31,977
|
|
|
Additions based on tax positions taken in the current year
|
804
|
|
2,342
|
|
||
|
Additions/Reductions for tax positions taken in prior years
|
3,306
|
|
(1,123
|
)
|
||
|
Reductions for remeasurements, settlements and payments
|
(597
|
)
|
(3,919
|
)
|
||
|
Reductions due to statute expiration
|
(4,633
|
)
|
(1,940
|
)
|
||
|
|
||||||
|
Balance, end of year
|
$
|
26,217
|
|
$
|
27,337
|
|
S-28
The Company had approximately
$5.9 million
and
$7.0 million
accrued for interest and penalties as of
October 3, 2014
and
September 27, 2013
, respectively, and recorded approximately
($1.0) million
and
($0.3) million
in interest and penalties during fiscal
2014
and fiscal
2013
, respectively.
The Company does not expect the amount of unrecognized tax benefits to significantly change within the next 12 months.
The Company is subject to United States federal income tax as well as income tax of multiple state and foreign jurisdictions. The Company has substantially concluded all United States federal income tax matters for years through 2010, with the exception of certain Work Opportunity Tax Credits and Welfare to Work Tax Credits which are pending the outcome of Protective Refund Claims filed for 1998 through 2006. The Company's federal income tax returns for fiscal years ended September 28, 2012 and September 27, 2013 will be under examination by the Internal Revenue Service beginning in the first quarter of 2015. The Company believes that adequate amounts have been reserved for any adjustments which may ultimately result from these examinations.
The Company has significant operations in approximately
20
states and foreign taxing jurisdictions. A number of years may elapse before a particular tax reporting year is audited and finally resolved. The Company has open tax years in these jurisdictions ranging from
1
to
10
years. While it is often difficult to predict the final outcome or the timing of resolution of any particular tax matter, the Company does not anticipate any adjustments resulting from state or foreign tax audits would result in a material change to the results of operations or financial condition. However, unfavorable settlement of any particular issue would require use of the Company's cash.
On December 17, 2013, the Company completed an IPO of
28.0 million
shares of its common stock at a price of
$20.00
per share raising approximately
$524.1 million
, net of costs directly related to the IPO. GS Capital Partners and J.P. Morgan Partners each received approximately
$6.5 million
of underwriters' discounts relating to the shares sold by the Company which were included in the costs directly related to the IPO. The Company used the net proceeds to repay borrowings on the senior secured revolving credit facility and a portion of the principal on the senior secured term loan facility (see Note 5). In addition, the Company paid cash bonuses and certain other expenses of approximately
$5.0 million
related to the IPO which were included in the Consolidated Statements of Income.
Prior the IPO, pursuant to the Amended and Restated Stockholders Agreement of the Company, upon termination of employment from the Company or one of its subsidiaries members of the Company's management (other than Mr. Neubauer) who held shares of common stock could have caused the Company to repurchase all of their initial investment shares (as defined) or shares acquired as a result of the exercise of Installment Stock Purchase Opportunities at appraised market fair value. Generally, payment for shares repurchased could have been, at the Company's option, in cash or installment notes, which would be effectively subordinated to all indebtedness of the Company. The amount of this potential repurchase obligation had been classified outside of stockholders' equity. With completion of the IPO, this provision was terminated. The amount of common stock subject to repurchase as of October 3, 2014 and September 27, 2013 was
$0
and
$158.7 million
, respectively.
During the fiscal year ended October 3, 2014, the Company paid dividends of approximately
$52.2 million
to its stockholders. On November 11, 2014, the Company's Board declared a
$0.08625
dividend per share of common stock, payable on December 16, 2014, to shareholders of record on the close of business on November 25, 2014.
On November 12, 2013, the Board of Directors (the "Board") approved, and the stockholders of Aramark adopted by written consent, the Aramark 2013 Stock Incentive Plan (the “2013 Stock Plan”), which became effective on December 1, 2013. The 2013 Stock Plan provides that the total number of shares of common stock that may be issued under the 2013 Stock Plan is
25,500,000
. In connection with the adoption of the 2013 Stock Plan, the Board approved, and the stockholders of Aramark adopted by written consent, the Fifth Amended and Restated Aramark 2007 Management Stock Incentive Plan (the “Fifth Amended Stock Plan”) which amended certain terms of the 2007 Management Stock Incentive Plan ("2007 MSIP") in contemplation of the IPO, including providing that no awards will be granted under the Fifth Amended Stock Plan shortly following the consummation of an initial public offering, as grants following the IPO are made under the 2013 Stock Plan.
Share-based compensation expense charged to expense for
fiscal
2014
,
fiscal
2013
and
fiscal
2012
was approximately
$96.3 million
, before taxes of approximately
$37.6 million
, approximately
$19.4 million
, before taxes of approximately
$7.6 million
, and approximately
$15.7 million
, before taxes of approximately
$6.1 million
, respectively. The compensation expense recognized is classified as "Selling and general corporate expenses" in the Consolidated Statements of
Income
. No compensation expense was capitalized.
S-29
Cash received from option exercises during
fiscal
2014
,
fiscal
2013
and
fiscal
2012
was
$4.4 million
,
$5.6 million
and
$6.7 million
, respectively. For
fiscal
2014
,
fiscal
2013
and
fiscal
2012
, the amount of tax benefits included in “Other financing activities” in the Consolidated Statements of Cash Flows was
$40.5 million
,
$4.8 million
and
$4.5 million
, respectively.
Stock Options
Each award of stock options under the 2007 MSIP is comprised of
two
types of stock options. One-half of the options awarded vest solely based upon continued employment over a specific period of time, generally
four years
(“Time-Based Options”). One-half of the options awarded vest based both upon continued employment and upon the achievement of a level of earnings before interest and taxes (“EBIT”), as defined in the 2007 MSIP, over time, generally
four years
(“Performance-Based Options”). The Performance-Based Options may also vest in part or in full upon the occurrence of specific return-based events. The exercise price for Time-Based Options and Performance-Based Options equals the fair value of the Company’s stock on the date of the grant. All options remain exercisable for
ten years
from the date of grant. Due to the adoption of the Fifth Amended and Restated Aramark 2007 MSIP on during fiscal 2013, all stock option awards will provide for
100%
time-based vesting.
Time-Based Options
The fair value of the Time-Based Options granted was estimated using the Black-Scholes option pricing model and the weighted-average assumptions noted in the table below. The expected volatility is based on an average of the historical volatility of the Company’s competitors’ stocks over the expected term of the stock options. The expected life represents the period of time that options granted are expected to be outstanding and is calculated using the simplified method as permitted under Securities and Exchange Commission (“SEC”) rules and regulations due to the lack of history of our equity incentive plan. The simplified method uses the midpoint between an option's vesting date and contractual term. The risk-free rate is based on the United States Treasury security with terms equal to the expected life of the option as of the grant date.
|
Fiscal Year Ended
|
||||||
|
October 3, 2014
|
September 27, 2013
|
September 28, 2012
|
||||
|
Expected volatility
|
30%
|
30%
|
30%
|
|||
|
Expected dividend yield
|
1.5%
|
0%
|
0%
|
|||
|
Expected life (in years)
|
6.25
|
6.25
|
6.25
|
|||
|
Risk-free interest rate
|
2.06% - 2.33%
|
1.02% - 2.36%
|
1.04% - 1.61%
|
|||
The weighted-average grant-date fair value of Time-Based Options granted during
fiscal
2014
,
fiscal
2013
and
fiscal
2012
was
$6.72
,
$5.41
and
$4.57
per option, respectively.
Compensation expense for Time-Based Options is recognized on a straight-line basis over the vesting period during which employees perform related services. Approximately
$12.9 million
,
$9.3 million
and
$8.5 million
was charged to expense during
fiscal
2014
,
fiscal
2013
and
fiscal
2012
for Time-Based Options, respectively. The Company has applied a forfeiture assumption of
8.7%
per annum in the calculation of such expense.
As of
October 3, 2014
, there was approximately
$26.6 million
of unrecognized compensation expense related to nonvested Time-Based Options, which is expected to be recognized over a weighted-average period of approximately
2.71
years.
A summary of Time-Based Options activity is presented below:
|
Options
|
Shares
(000s) |
Weighted-
Average Exercise Price |
Aggregate Intrinsic Value ($000s)
|
Weighted-Average Remaining Term (Years)
|
||||||||
|
Outstanding at September 27, 2013
|
18,908
|
|
$
|
11.04
|
|
|||||||
|
Granted
|
2,080
|
|
$
|
23.81
|
|
|||||||
|
Exercised
|
(4,283
|
)
|
$
|
7.70
|
|
|||||||
|
Forfeited and expired
|
(956
|
)
|
$
|
15.48
|
|
|||||||
|
Outstanding at October 3, 2014
|
15,749
|
|
$
|
13.37
|
|
$
|
205,928
|
|
6.6
|
|||
|
Exercisable at October 3, 2014
|
8,475
|
|
$
|
9.74
|
|
$
|
141,562
|
|
5.0
|
|||
|
Expected to vest at October 3, 2014
|
5,795
|
|
$
|
17.68
|
|
$
|
50,827
|
|
8.6
|
|||
The total intrinsic value of Time-Based Options exercised during
fiscal
2014
,
fiscal
2013
and
fiscal
2012
was
$79.9 million
,
$17.2 million
and
$15.0 million
, respectively. The total fair value of Time-Based Options that vested during
fiscal
2014
,
fiscal
2013
and
fiscal
2012
was
$13.2 million
,
$3.9 million
and
$7.9 million
, respectively.
S-30
Performance-Based Options
The fair value of the Performance-Based Options was estimated using the Black-Scholes option pricing model and the weighted-average assumptions noted in the table below. The expected volatility is based on an average of the historical volatility of the Company’s competitors’ stocks over the expected term of the stock options. The expected life represents the period of time that options granted are expected to be outstanding and is calculated using the simplified method as permitted under SEC rules and regulations due to the lack of history of our equity incentive plan. The simplified method uses the midpoint between an option's vesting date and contractual term. The risk-free rate is based on the United States Treasury security with terms equal to the expected life of the option as of the grant date.
|
Fiscal Year Ended
|
||||||
|
October 3, 2014
|
September 27, 2013
|
September 28, 2012
|
||||
|
Expected volatility
|
30%
|
30%
|
30%
|
|||
|
Expected dividend yield
|
1.5%
|
0%
|
0%
|
|||
|
Expected life (in years)
|
4.0 - 5.0
|
4.5 - 5.5
|
5.0 - 6.0
|
|||
|
Risk-free interest rate
|
0.65% - 1.47%
|
0.61% - 0.85%
|
0.73% - 1.04%
|
|||
The weighted-average grant-date fair value of the Performance-Based Options granted during
fiscal
2014
,
fiscal
2013
and
fiscal
2012
was
$9.20
,
$4.54
and
$3.91
per option, respectively.
On November 11, 2013, the Compensation Committee approved an amendment to all outstanding 2007 MSIP Option Agreements (the “Performance Option Amendment”) modifying the vesting provisions relating to outstanding performance-based options granted under the 2007 MSIP. The Performance Option Amendment provides that in the event of an initial public offering of Aramark, subject to continued employment on such date,
50%
of any then-unvested performance-based options that did not meet applicable performance thresholds in prior years (the “Missed Year Options”) will become vested if the initial public offering price for the common stock of Aramark equals or exceeds
$20.00
per share. In addition, during the
18
month period following the initial public offering, if the closing trading price for common stock of Aramark equals or exceeds
$25.00
per share over any consecutive
twenty
day trading period,
100%
of the Missed Year Options will become vested. There were a total of approximately
5.0 million
Missed Year Options which fully vested by the second quarter of fiscal 2014 as all performance targets were met. The fair values of the Missed Year Options were valued at the award modification date using a Monte-Carlo option model, which simulates a range of possible future stock prices and estimates the probabilities of meeting the modified vesting provision of the trading price for the common stock of Aramark equaling or exceeding
$25.00
per share over any consecutive twenty day trading period during the 18 month period following the initial public offering. The following weighted-average assumptions were used in estimating the fair value of the Missed Year Options: estimated volatility (
30%
), expected dividend yield (
1.5%
), expected life (
3
-
8
years) and risk-free rate (
0.66%
-
2.63%
). The weighted-average fair value of the Missed Year Options modified on November 11, 2013 was
$10.19
per option.
Compensation expense for Performance-Based Options is recognized principally on a straight-line basis over the requisite performance and service periods. During fiscal 2014, the Company recognized a charge to expense of approximately $
58.5 million
, which includes approximately $
50.9 million
million related to the Missed Year Options that were modified. During fiscal 2013 and 2012, $
6.4 million
and $
3.6 million
was charged to expense for Performance-Based Options, respectively. The Company has applied a forfeiture assumption of
8.7%
per annum in the calculation of such expense.
As of
October 3, 2014
, there was approximately
$2.2 million
of unrecognized compensation expense related to nonvested Performance-Based Options, which is expected to be recognized over a weighted-average period of approximately
0.56
years.
A summary of Performance-Based Options activity is presented below:
|
Options
|
Shares
(000s) |
Weighted-
Average Exercise Price |
Aggregate Intrinsic Value ($000s)
|
Weighted-Average Remaining Term (Years)
|
||||||||
|
Outstanding at September 27, 2013
|
13,938
|
|
$
|
8.86
|
|
|||||||
|
Granted
|
—
|
|
$
|
—
|
|
|||||||
|
Exercised
|
(3,853
|
)
|
$
|
7.46
|
|
|||||||
|
Forfeited and expired
|
(755
|
)
|
$
|
9.88
|
|
|||||||
|
Outstanding at October 3, 2014
|
9,330
|
|
$
|
9.36
|
|
$
|
159,341
|
|
4.9
|
|||
|
Exercisable at October 3, 2014
|
7,646
|
|
$
|
8.52
|
|
$
|
137,025
|
|
4.4
|
|||
|
Expected to vest at October 3, 2014
|
901
|
|
$
|
12.81
|
|
$
|
12,291
|
|
6.5
|
|||
S-31
The total intrinsic value of Performance-Based Options exercised during
fiscal
2014
,
fiscal
2013
and
fiscal
2012
was
$74.6 million
,
$8.5 million
and
$7.5 million
, respectively. The total fair value of Performance-Based Options that vested during
fiscal
2014
,
fiscal
2013
and
fiscal
2012
was
$58.8 million
,
$0.2 million
and
$6.7 million
, respectively.
Installment Stock Purchase Opportunities
The Company recorded approximately $
2.0 million
, $
1.6 million
and $
1.0 million
of compensation expense related to ISPOs and the exchanged restricted stock and non-qualified stock options during the fiscal years ended 2014, 2013 and 2012, respectively.
Deferred Stock Units
Deferred stock units are issued only to non-employee members of the Board of Directors of the Company and represent the right to receive shares of the Company’s common stock in the future. Each deferred stock unit will be converted to one share of the Company’s common stock six months and one day after the date on which such director ceases to serve as a member of the Board of Directors. The grant-date fair value of deferred stock units is based on the fair value of the Company’s common stock. The deferred stock units vest at the time of the next annual meeting of stockholders (which is generally one year after grant). The Company granted
60,088
deferred stock units during
fiscal
2014
. The compensation cost charged to expense during
fiscal
2014
,
fiscal
2013
and
fiscal
2012
for deferred stock units was approximately
$1.5 million
,
$0.6 million
and
$0.5 million
, respectively.
Time-Based Restricted Stock Units
The Restricted Stock Unit Agreement provides for grants of restricted stock units ("RSUs"),
25%
of which will vest and be settled in shares on each of the first four anniversaries of the date of grant, subject to the participant's continued employment with the Company through each such anniversary. The RSU grant in connection with the IPO will vest and be settled in shares on each of the first three anniversaries of the date of grant, subject to the participant's continued employment with the Company through each such anniversary. The grant-date fair value of RSUs is based on the fair value of the Company’s common stock. Participants holding RSUs will receive the benefit of any dividends paid on shares in the form of additional RSUs. The unvested units are subject to forfeiture if employment is terminated other than due to death, disability or retirement, and the units are nontransferable while subject to forfeiture.
|
Restricted Stock Units
|
Units
(000s) |
Weighted Average Grant Date Fair Value
|
||
|
Outstanding at September 27, 2013
|
1,267
|
$16.22
|
||
|
Granted
|
2,100
|
$20.53
|
||
|
Vested
|
(288)
|
$16.23
|
||
|
Forfeited
|
(309)
|
$18.23
|
||
|
Outstanding at October 3, 2014
|
2,770
|
|
$19.22
|
|
The compensation cost charged to expense during
fiscal
2014
and
fiscal
2013
for RSUs was approximately
$14.2 million
and
$1.3 million
, respectively. As of
October 3, 2014
, there was approximately
$35.9 million
of unrecognized compensation expense related to nonvested RSUs, which is expected to be recognized over a weighted-average period of approximately
2.50
years.
Performance Stock Units
Under the 2013 Stock Plan, the Company is authorized to grant Performance Stock Units ("PSUs") to its employees. A participant is eligible to become vested in a number of PSUs equal to a percentage, higher or lower, of the target number of PSUs granted based on the level of the Company’s achievement of the performance condition. The first
33%
of the award will vest on the first anniversary of the grant date if and to the extent the Company achieves these performance conditions while the remaining
67%
will generally vest ratably over the next two anniversaries of the date of grant, subject to the achievement of the performance condition in the first year of grant and the participant's continued employment with the Company through each such anniversary. The grant-date fair value of the PSUs is based on the fair value of the Company's common stock.
During fiscal 2014, the Company granted approximately
0.7 million
PSUs with a weighted-average grant-date fair value of
$24.12
with performance conditions based upon the achievement of a level of adjusted earnings per share. The compensation cost charged to expense during fiscal 2014 for PSUs was approximately $
7.2 million
. As of
October 3, 2014
, there was approximately
$7.8 million
of unrecognized compensation expense related to nonvested PSUs, which is expected to be recognized over a weighted-average period of approximately
1.55
years.
S-32
Basic earnings per share is computed using the weighted average number of common shares outstanding during the periods presented. Diluted earnings per share is computed using the weighted average number of common shares outstanding adjusted to include the potentially dilutive effect of stock awards.
The following table sets forth the computation of basic and diluted earnings per share attributable to the Company's stockholders (in thousands, except per share data):
|
Fiscal Year Ended
|
||||||||||||
|
October 3, 2014
|
September 27, 2013
|
September 28, 2012
|
||||||||||
|
Earnings:
|
||||||||||||
|
Income from Continuing Operations attributable to Aramark stockholders
|
|
$148,956
|
|
|
$70,386
|
|
|
$103,254
|
|
|||
|
Income (loss) from Discontinued Operations attributable to Aramark stockholders
|
—
|
|
(1,030
|
)
|
297
|
|
||||||
|
Net income attributable to Aramark stockholders
|
|
$148,956
|
|
|
$69,356
|
|
|
$103,551
|
|
|||
|
Shares:
|
||||||||||||
|
Basic weighted-average shares outstanding
|
225,866
|
|
201,916
|
|
203,211
|
|
||||||
|
Effect of dilutive securities
|
11,585
|
|
7,454
|
|
6,496
|
|
||||||
|
Diluted weighted-average shares outstanding
|
237,451
|
|
209,370
|
|
209,707
|
|
||||||
|
Basic Earnings Per Share:
|
||||||||||||
|
Income from Continuing Operations
|
|
$0.66
|
|
|
$0.35
|
|
|
$0.51
|
|
|||
|
Income (loss) from Discontinued Operations
|
—
|
|
(0.01
|
)
|
—
|
|
||||||
|
|
|
$0.66
|
|
|
$0.34
|
|
|
$0.51
|
|
|||
|
Diluted Earnings Per Share:
|
||||||||||||
|
Income from Continuing Operations
|
|
$0.63
|
|
|
$0.34
|
|
|
$0.49
|
|
|||
|
Income (loss) from Discontinued Operations
|
—
|
|
(0.01
|
)
|
—
|
|
||||||
|
|
|
$0.63
|
|
|
$0.33
|
|
|
$0.49
|
|
|||
Share-based awards to purchase
1.5 million
,
6.0 million
and
3.2 million
shares were outstanding at
October 3, 2014
,
September 27, 2013
and
September 28, 2012
, respectively, but were not included in the computation of diluted earnings per common share, as their effect would have been antidilutive. In addition, performance-based options and performance stock units to purchase
0.8 million
,
7.8 million
and
8.7 million
shares were outstanding at
October 3, 2014
,
September 27, 2013
and
September 28, 2012
, respectively, but were not included in the computation of diluted earnings per common share, as the performance targets were not yet met.
The Company has an agreement (the "Receivables Facility") with several financial institutions whereby it sells on a continuous basis an undivided interest in all eligible trade accounts receivable, as defined in the Receivables Facility. In May 2014, the Company amended the Receivables Facility to increase the maximum amount from
$300.0 million
to
$350.0 million
and extend the maturity date from January 2015 to May 2017. In addition, the Receivables Facility will now include a seasonal tranche which will increase the capacity of the Receivables Facility by
$25.0 million
at certain times of the year. Pursuant to the Receivables Facility, the Company formed ARAMARK Receivables, LLC, a wholly-owned, consolidated, bankruptcy-remote subsidiary. ARAMARK Receivables, LLC was formed for the sole purpose of buying and selling receivables generated by certain subsidiaries of the Company. Under the Receivables Facility, the Company and certain of its subsidiaries transfer without recourse all of their accounts receivable to ARAMARK Receivables, LLC. As collections reduce previously transferred interests, interests in new, eligible receivables are transferred to ARAMARK Receivables, LLC, subject to meeting certain conditions. At
October 3, 2014
and
September 27, 2013
, the amount of outstanding borrowings under the Receivables Facility was
$350.0 million
and
$300.0 million
, respectively, and is included in “Long-Term Borrowings."
S-33
The Company has capital and other purchase commitments of approximately
$484.0 million
at
October 3, 2014
, primarily in connection with commitments for capital projects and client contract investments. At
October 3, 2014
, the Company also has letters of credit outstanding in the amount of
$148.6 million
.
Certain of the Company’s lease arrangements, primarily vehicle leases, with terms of
one
to
eight
years, contain provisions related to residual value guarantees. The maximum potential liability to the Company under such arrangements was approximately
$119.2 million
at
October 3, 2014
if the terminal fair value of vehicles coming off lease was
zero
. Consistent with past experience, management does not expect any significant payments will be required pursuant to these arrangements.
No
amounts have been accrued for guarantee arrangements at
October 3, 2014
.
Rental expense for all operating leases was
$188.0 million
,
$179.3 million
and
$177.4 million
for
fiscal
2014
,
fiscal
2013
and
fiscal
2012
, respectively. Following is a schedule of the future minimum rental and similar commitments under all noncancelable operating leases as of
October 3, 2014
(in thousands):
|
2015
|
$
|
235,049
|
|
|
2016
|
95,150
|
|
|
|
2017
|
85,634
|
|
|
|
2018
|
72,716
|
|
|
|
2019
|
47,483
|
|
|
|
2020-Thereafter
|
105,384
|
|
|
|
Total minimum rental obligations
|
$
|
641,416
|
|
From time to time, the Company is a party to various legal actions and investigations involving claims incidental to the conduct of its business, including actions by clients, customers, employees, government entities and third parties, including under federal, state, international, national, principal and local employment laws, wage and hour laws, immigration laws, discrimination laws, human health and safety laws, import and export controls and customs laws, environmental laws, false claims or whistleblower statutes, minority, women and disadvantaged business enterprise statutes, contractual disputes, tax codes, antitrust and competition laws, consumer protection statues, procurement regulations, intellectual property laws, food safety and sanitation laws, cost and accounting principals, the Foreign Corrupt Practices Act, the U.K. Bribery Act, other anti-corruption laws,, lobbying laws, motor carrier safety laws, data privacy laws and alcohol licensing and service laws or alleging negligence and law breaches of contractual or other obligations. Based on information currently available, advice of counsel, available insurance coverage, established reserves and other resources, the Company does not believe that any such actions are likely to be, individually or in the aggregate, material to its business, financial condition, results of operations or cash flows. However, in the event of unexpected further developments, it is possible that the ultimate resolution of these matters, or other similar matters, if unfavorable, may be materially adverse to the Company’s business, financial condition, results of operations or cash flows.
S-34
The following table summarizes the Company's unaudited quarterly results for fiscal 2014 and fiscal 2013 (in thousands):
|
Quarter Ended
|
||||||||||||||||
|
December 27, 2013
|
March 28, 2014
|
June 27, 2014
|
October 3, 2014
|
|||||||||||||
|
Sales
|
$
|
3,763,081
|
|
$
|
3,502,007
|
|
$
|
3,620,057
|
|
$
|
3,947,768
|
|
||||
|
Cost of services provided
|
3,354,819
|
|
3,159,808
|
|
3,275,409
|
|
3,573,882
|
|
||||||||
|
Income from Continuing Operations
|
44,916
|
|
13,117
|
|
46,916
|
|
44,510
|
|
||||||||
|
Net income attributable to Aramark stockholders
|
44,762
|
|
12,916
|
|
46,873
|
|
44,405
|
|
||||||||
|
Earnings per share:
|
||||||||||||||||
|
Basic
|
$
|
0.22
|
|
$
|
0.06
|
|
$
|
0.20
|
|
$
|
0.19
|
|
||||
|
Diluted
|
0.21
|
|
0.05
|
|
0.19
|
|
0.18
|
|
||||||||
|
Dividends declared per common share
|
—
|
|
0.075
|
|
0.075
|
|
0.075
|
|
||||||||
|
Quarter Ended
|
||||||||||||||||
|
December 28, 2012
|
March 29, 2013
|
June 28, 2013
|
September 27, 2013
|
|||||||||||||
|
Sales
|
$
|
3,535,915
|
|
$
|
3,403,737
|
|
$
|
3,490,030
|
|
$
|
3,515,975
|
|
||||
|
Cost of services provided
|
3,171,540
|
|
3,132,226
|
|
3,178,092
|
|
3,179,286
|
|
||||||||
|
Income (Loss) from Continuing Operations
|
43,192
|
|
(39,904
|
)
|
27,974
|
|
40,134
|
|
||||||||
|
Net income (loss) attributable to Aramark stockholders
|
42,814
|
|
(40,104
|
)
|
27,748
|
|
38,898
|
|
||||||||
|
Earnings per share:
|
||||||||||||||||
|
Basic
|
$
|
0.21
|
|
$
|
(0.20
|
)
|
$
|
0.14
|
|
$
|
0.19
|
|
||||
|
Diluted
|
0.20
|
|
(0.20
|
)
|
0.13
|
|
0.19
|
|
||||||||
|
Dividends declared per common share
|
—
|
|
—
|
|
—
|
|
—
|
|
||||||||
The Company reports its operating results in three reportable segments: FSS North America, FSS International and Uniform and Career Apparel ("Uniform"). Corporate includes general expenses and assets not specifically allocated to an individual segment and share-based compensation expense (see Note 10). In the fourth quarter of 2014, the segment reporting structure was modified to align the segment reporting with the Company's current management and internal reporting structure. Specifically, the Mexican operations have been combined with the FSS International segment. Previously, the Mexican operations were included in the FSS North America segment. All prior period segment information has been restated to reflect the new reporting structure. The financial effect of this segment realignment was not material for fiscal years 2014, 2013 and 2012. Financial information by segment follows (in millions):
|
Sales
|
|||||||||||
|
Fiscal Year Ended
|
|||||||||||
|
October 3, 2014
|
September 27, 2013
|
September 28, 2012
|
|||||||||
|
FSS North America
|
$
|
10,232.8
|
|
$
|
9,594.2
|
|
$
|
9,347.9
|
|
||
|
FSS International
|
3,111.2
|
|
2,940.2
|
|
2,794.8
|
|
|||||
|
Uniform
|
1,488.9
|
|
1,411.3
|
|
1,362.7
|
|
|||||
|
$
|
14,832.9
|
|
$
|
13,945.7
|
|
$
|
13,505.4
|
|
|||
S-35
|
Operating Income
|
|||||||||||
|
Fiscal Year Ended
|
|||||||||||
|
October 3, 2014
|
September 27, 2013
|
September 28, 2012
|
|||||||||
|
FSS North America
|
$
|
501.3
|
|
$
|
403.2
|
|
$
|
424.9
|
|
||
|
FSS International
|
106.2
|
|
68.1
|
|
90.6
|
|
|||||
|
Uniform
|
172.1
|
|
117.3
|
|
118.1
|
|
|||||
|
779.6
|
|
588.6
|
|
633.6
|
|
||||||
|
Corporate
|
(215.0
|
)
|
(74.2
|
)
|
(51.8
|
)
|
|||||
|
Operating Income
|
564.6
|
|
514.4
|
|
581.8
|
|
|||||
|
Interest and Other Financing Costs, net
|
(334.9
|
)
|
(423.8
|
)
|
(456.8
|
)
|
|||||
|
Income from Continuing Operations Before Income Taxes
|
$
|
229.7
|
|
$
|
90.6
|
|
$
|
125.0
|
|
||
|
Depreciation and Amortization
|
|||||||||||
|
Fiscal Year Ended
|
|||||||||||
|
October 3, 2014
|
September 27, 2013
|
September 28, 2012
|
|||||||||
|
FSS North America
|
$
|
381.0
|
|
$
|
374.2
|
|
$
|
363.8
|
|
||
|
FSS International
|
59.2
|
|
64.0
|
|
61.9
|
|
|||||
|
Uniform
|
79.6
|
|
102.0
|
|
102.6
|
|
|||||
|
Corporate
|
1.8
|
|
1.9
|
|
0.9
|
|
|||||
|
$
|
521.6
|
|
$
|
542.1
|
|
$
|
529.2
|
|
|||
|
Capital Expenditures and
Client Contract Investments and Other*
|
|||||||||||
|
Fiscal Year Ended
|
|||||||||||
|
October 3, 2014
|
September 27, 2013
|
September 28, 2012
|
|||||||||
|
FSS North America
|
$
|
431.3
|
|
$
|
283.3
|
|
$
|
278.5
|
|
||
|
FSS International
|
48.4
|
|
63.0
|
|
54.4
|
|
|||||
|
Uniform
|
53.8
|
|
46.7
|
|
40.5
|
|
|||||
|
Corporate
|
18.4
|
|
0.1
|
|
—
|
|
|||||
|
$
|
551.9
|
|
$
|
393.1
|
|
$
|
373.4
|
|
|||
|
* Includes amounts acquired in business combinations
|
|||||||||||
|
Identifiable Assets
|
|||||||
|
October 3, 2014
|
September 27, 2013
|
||||||
|
FSS North America
|
$
|
7,072.9
|
|
$
|
6,916.4
|
|
|
|
FSS International
|
1,485.3
|
|
1,554.1
|
|
|||
|
Uniform
|
1,695.7
|
|
1,670.0
|
|
|||
|
Corporate
|
201.8
|
|
126.6
|
|
|||
|
$
|
10,455.7
|
|
$
|
10,267.1
|
|
||
S-36
The following geographic data include sales generated by subsidiaries within that geographic area and net property & equipment based on physical location (in millions):
|
Sales
|
|||||||||||
|
Fiscal Year Ended
|
|||||||||||
|
October 3, 2014
|
September 27, 2013
|
September 28, 2012
|
|||||||||
|
United States
|
$
|
10,798.5
|
|
$
|
10,025.0
|
|
$
|
9,729.6
|
|
||
|
Foreign
|
4,034.4
|
|
3,920.7
|
|
3,775.8
|
|
|||||
|
$
|
14,832.9
|
|
$
|
13,945.7
|
|
$
|
13,505.4
|
|
|||
|
Net Property & Equipment
|
|||||||
|
October 3, 2014
|
September 27, 2013
|
||||||
|
United States
|
$
|
834.4
|
|
$
|
789.4
|
|
|
|
Foreign
|
162.9
|
|
187.9
|
|
|||
|
$
|
997.3
|
|
$
|
977.3
|
|
||
Fair value is defined as the price that would be received to sell an asset or paid to transfer a liability in an orderly transaction between market participants at the measurement date. Assets and liabilities recorded at fair value are classified based upon the level of judgment associated with the inputs used to measure their fair value. The hierarchical levels related to the subjectivity of the valuation inputs are defined as follows:
|
•
|
Level 1—inputs to the valuation methodology are quoted prices (unadjusted) for identical assets or liabilities in active markets
|
|
•
|
Level 2—inputs to the valuation methodology include quoted prices for similar assets and liabilities in active markets, and inputs that are observable for the asset or liability, either directly or indirectly, for substantially the full term of the financial instrument
|
|
•
|
Level 3—inputs to the valuation methodology are unobservable and significant to the fair value measurement
|
Recurring Fair Value Measurements
The Company’s financial instruments consist primarily of cash and cash equivalents, accounts receivable, accounts payable, borrowings and derivatives. Management believes that the carrying value of cash and cash equivalents, accounts receivable and accounts payable are representative of their respective fair values. In conjunction with the fair value measurement of the derivative instruments, the Company made an accounting policy election to measure the credit risk of its derivative instruments that are subject to master netting agreements on a net basis by counterparty portfolio. The fair value of the Company’s debt at
October 3, 2014
and
September 27, 2013
was
$5,441.5 million
and
$5,854.9 million
, respectively. The carrying value of the Company’s debt at
October 3, 2014
and
September 27, 2013
was
$5,445.6 million
and
$5,824.1 million
, respectively. The fair values were computed using market quotes, if available, or based on discounted cash flows using market interest rates as of the end of the respective periods. The inputs utilized in estimating the fair value of the Company's debt has been classified as level 2 in the fair value hierarchy levels.
During the first quarter of fiscal 2014, the Company's obligation to repurchase shares was eliminated (see Note 9). The following table presents the changes in the Company's common stock subject to repurchase for which level 3 inputs were significant to their valuation for
fiscal
2014
(in thousands):
|
Common Stock
Subject to Repurchase |
|||
|
Balance, September 27, 2013
|
$
|
158,708
|
|
|
Repurchases of common stock
|
(763
|
)
|
|
|
Reclassification of common stock subject to repurchase
|
(157,945
|
)
|
|
|
Balance, October 3, 2014
|
$
|
—
|
|
S-37
As of
October 3, 2014
, the notional value of interest rate swaps with entities affiliated with GS Capital Partners was
$487.4 million
and with entities affiliated with J.P. Morgan Partners was
$437.4 million
. As of
September 27, 2013
, the notional value of interest rate swaps with entities affiliated with GS Capital Partners was
$230 million
and with entities affiliated with J.P. Morgan Partners was
$205 million
. In all of these swaps, the Company pays the counterparty a fixed interest rate in exchange for their payment of a floating interest rate. The net payments in
fiscal
2014
,
fiscal
2013
and
fiscal
2012
to entities affiliated with GS Capital Partners pursuant to interest rate swap transactions were approximately
$7.9 million
,
$3.1 million
and
$21.5 million
, respectively. The net payments in
fiscal
2014
,
fiscal
2013
and
fiscal
2012
to entities affiliated with J.P. Morgan Partners pursuant to interest rate swap transactions were approximately
$6.9 million
,
$5.5 million
and
$28.2 million
, respectively.
The following condensed consolidating financial statements of the Company have been prepared pursuant to Rule 3-10 of Regulation S-X.
These condensed consolidating financial statements have been prepared from the Company’s financial information on the same basis of accounting as the consolidated financial statements. Interest expense and certain other costs are partially allocated to all of the subsidiaries of the Company. Goodwill and other intangible assets have been allocated to the subsidiaries based on management’s estimates. The
5.75%
Senior Notes are an obligation of the Company's wholly-owned subsidiary, Aramark Services, Inc., and are jointly and severally guaranteed on a senior unsecured basis by the Company and substantially all of the Company’s existing and future domestic subsidiaries (excluding the Receivables Facility subsidiary) (“Guarantors”). Each of the Guarantors is wholly-owned, directly or indirectly, by the Company. All other subsidiaries of the Company, either direct or indirect, do not guarantee the Senior Notes (“Non-Guarantors”). The Guarantors also guarantee certain other debt.
S-38
CONDENSED CONSOLIDATING BALANCE SHEETS
October 3, 2014
(in millions)
|
Aramark (Parent)
|
Aramark Services, Inc.
(Issuer)
|
Guarantors
|
Non
Guarantors |
Eliminations
|
Consolidated
|
||||||||||||||||||
|
ASSETS
|
|||||||||||||||||||||||
|
Current Assets:
|
|||||||||||||||||||||||
|
Cash and cash equivalents
|
$
|
—
|
|
$
|
26.3
|
|
$
|
41.6
|
|
$
|
43.8
|
|
$
|
—
|
|
$
|
111.7
|
|
|||||
|
Receivables
|
—
|
|
0.2
|
|
265.4
|
|
1,316.9
|
|
—
|
|
1,582.5
|
|
|||||||||||
|
Inventories, at lower of cost or market
|
—
|
|
15.4
|
|
458.7
|
|
79.7
|
|
—
|
|
553.8
|
|
|||||||||||
|
Prepayments and other current assets
|
—
|
|
73.5
|
|
67.4
|
|
76.1
|
|
—
|
|
217.0
|
|
|||||||||||
|
Total current assets
|
—
|
|
115.4
|
|
833.1
|
|
1,516.5
|
|
—
|
|
2,465.0
|
|
|||||||||||
|
Property and Equipment, net
|
—
|
|
24.9
|
|
796.5
|
|
175.9
|
|
—
|
|
997.3
|
|
|||||||||||
|
Goodwill
|
—
|
|
173.1
|
|
3,982.8
|
|
433.8
|
|
—
|
|
4,589.7
|
|
|||||||||||
|
Investment in and Advances to Subsidiaries
|
1,718.8
|
|
5,677.4
|
|
433.0
|
|
65.7
|
|
(7,894.9
|
)
|
—
|
|
|||||||||||
|
Other Intangible Assets
|
—
|
|
29.7
|
|
1,101.3
|
|
121.7
|
|
—
|
|
1,252.7
|
|
|||||||||||
|
Other Assets
|
—
|
|
70.1
|
|
821.4
|
|
261.5
|
|
(2.0
|
)
|
1,151.0
|
|
|||||||||||
|
$
|
1,718.8
|
|
$
|
6,090.6
|
|
$
|
7,968.1
|
|
$
|
2,575.1
|
|
$
|
(7,896.9
|
)
|
$
|
10,455.7
|
|
||||||
|
LIABILITIES AND STOCKHOLDERS' EQUITY
|
|||||||||||||||||||||||
|
Current Liabilities:
|
|||||||||||||||||||||||
|
Current maturities of long-term borrowings
|
$
|
—
|
|
$
|
22.0
|
|
$
|
13.0
|
|
$
|
54.8
|
|
$
|
—
|
|
$
|
89.8
|
|
|||||
|
Accounts payable
|
—
|
|
189.8
|
|
577.4
|
|
219.0
|
|
—
|
|
986.2
|
|
|||||||||||
|
Accrued expenses and other liabilities
|
0.8
|
|
140.8
|
|
861.1
|
|
300.1
|
|
0.1
|
|
1,302.9
|
|
|||||||||||
|
Total current liabilities
|
0.8
|
|
352.6
|
|
1,451.5
|
|
573.9
|
|
0.1
|
|
2,378.9
|
|
|||||||||||
|
Long-term Borrowings
|
—
|
|
4,503.7
|
|
41.3
|
|
810.8
|
|
—
|
|
5,355.8
|
|
|||||||||||
|
Deferred Income Taxes and Other Noncurrent Liabilities
|
—
|
|
372.3
|
|
535.5
|
|
85.3
|
|
—
|
|
993.1
|
|
|||||||||||
|
Intercompany Payable
|
—
|
|
—
|
|
4,968.2
|
|
1,291.5
|
|
(6,259.7
|
)
|
—
|
|
|||||||||||
|
Common Stock Subject to Repurchase and Other
|
—
|
|
—
|
|
9.9
|
|
—
|
|
—
|
|
9.9
|
|
|||||||||||
|
Total Stockholders' Equity
|
1,718.0
|
|
862.0
|
|
961.7
|
|
(186.4
|
)
|
(1,637.3
|
)
|
1,718.0
|
|
|||||||||||
|
$
|
1,718.8
|
|
$
|
6,090.6
|
|
$
|
7,968.1
|
|
$
|
2,575.1
|
|
$
|
(7,896.9
|
)
|
$
|
10,455.7
|
|
||||||
S-39
CONDENSED CONSOLIDATING BALANCE SHEETS
September 27, 2013
(in millions)
|
Aramark (Parent)
|
Aramark Services, Inc.
(Issuer)
|
Guarantors
|
Non
Guarantors |
Eliminations
|
Consolidated
|
||||||||||||||||||
|
ASSETS
|
|||||||||||||||||||||||
|
Current Assets:
|
|||||||||||||||||||||||
|
Cash and cash equivalents
|
$
|
—
|
|
$
|
23.0
|
|
$
|
40.5
|
|
$
|
47.5
|
|
$
|
—
|
|
$
|
111.0
|
|
|||||
|
Receivables
|
—
|
|
1.4
|
|
242.9
|
|
1,161.6
|
|
—
|
|
1,405.9
|
|
|||||||||||
|
Inventories, at lower of cost or market
|
—
|
|
15.9
|
|
441.0
|
|
85.1
|
|
—
|
|
542.0
|
|
|||||||||||
|
Prepayments and other current assets
|
—
|
|
46.2
|
|
103.1
|
|
79.0
|
|
—
|
|
228.3
|
|
|||||||||||
|
Total current assets
|
—
|
|
86.5
|
|
827.5
|
|
1,373.2
|
|
—
|
|
2,287.2
|
|
|||||||||||
|
Property and Equipment, net
|
—
|
|
24.4
|
|
751.2
|
|
201.7
|
|
—
|
|
977.3
|
|
|||||||||||
|
Goodwill
|
—
|
|
173.1
|
|
3,994.6
|
|
452.3
|
|
—
|
|
4,620.0
|
|
|||||||||||
|
Investment in and Advances to Subsidiaries
|
1,062.7
|
|
6,267.4
|
|
444.8
|
|
124.5
|
|
(7,899.4
|
)
|
—
|
|
|||||||||||
|
Other Intangible Assets
|
—
|
|
32.6
|
|
1,230.0
|
|
146.1
|
|
—
|
|
1,408.7
|
|
|||||||||||
|
Other Assets
|
—
|
|
68.4
|
|
629.5
|
|
278.0
|
|
(2.0
|
)
|
973.9
|
|
|||||||||||
|
$
|
1,062.7
|
|
$
|
6,652.4
|
|
$
|
7,877.6
|
|
$
|
2,575.8
|
|
$
|
(7,901.4
|
)
|
$
|
10,267.1
|
|
||||||
|
LIABILITIES AND STOCKHOLDERS' EQUITY
|
|||||||||||||||||||||||
|
Current Liabilities:
|
|||||||||||||||||||||||
|
Current maturities of long-term borrowings
|
$
|
—
|
|
$
|
22.5
|
|
$
|
12.0
|
|
$
|
31.3
|
|
$
|
—
|
|
$
|
65.8
|
|
|||||
|
Accounts payable
|
—
|
|
147.0
|
|
448.3
|
|
293.7
|
|
—
|
|
889.0
|
|
|||||||||||
|
Accrued expenses and other liabilities
|
0.3
|
|
230.2
|
|
875.6
|
|
328.3
|
|
0.1
|
|
1,434.5
|
|
|||||||||||
|
Total current liabilities
|
0.3
|
|
399.7
|
|
1,335.9
|
|
653.3
|
|
0.1
|
|
2,389.3
|
|
|||||||||||
|
Long-term Borrowings
|
—
|
|
5,101.7
|
|
40.4
|
|
616.1
|
|
—
|
|
5,758.2
|
|
|||||||||||
|
Deferred Income Taxes and Other Noncurrent Liabilities
|
—
|
|
326.2
|
|
618.3
|
|
102.5
|
|
—
|
|
1,047.0
|
|
|||||||||||
|
Intercompany Payable
|
—
|
|
—
|
|
5,016.0
|
|
1,305.7
|
|
(6,321.7
|
)
|
—
|
|
|||||||||||
|
Common Stock Subject to Repurchase and Other
|
158.7
|
|
—
|
|
10.2
|
|
—
|
|
—
|
|
168.9
|
|
|||||||||||
|
Total Stockholders' Equity
|
903.7
|
|
824.8
|
|
856.8
|
|
(101.8
|
)
|
(1,579.8
|
)
|
903.7
|
|
|||||||||||
|
$
|
1,062.7
|
|
$
|
6,652.4
|
|
$
|
7,877.6
|
|
$
|
2,575.8
|
|
$
|
(7,901.4
|
)
|
$
|
10,267.1
|
|
||||||
S-40
CONDENSED CONSOLIDATING STATEMENTS OF INCOME AND COMPREHENSIVE INCOME
For the year ended
October 3, 2014
(in millions)
|
Aramark (Parent)
|
Aramark Services, Inc.
(Issuer)
|
Guarantors
|
Non
Guarantors |
Eliminations
|
Consolidated
|
||||||||||||||||||
|
Sales
|
$
|
—
|
|
$
|
1,047.4
|
|
$
|
9,544.7
|
|
$
|
4,240.8
|
|
$
|
—
|
|
$
|
14,832.9
|
|
|||||
|
Costs and Expenses:
|
|||||||||||||||||||||||
|
Cost of services provided
|
—
|
|
929.1
|
|
8,506.4
|
|
3,928.4
|
|
—
|
|
13,363.9
|
|
|||||||||||
|
Depreciation and amortization
|
—
|
|
13.7
|
|
412.1
|
|
95.8
|
|
—
|
|
521.6
|
|
|||||||||||
|
Selling and general corporate expenses
|
7.8
|
|
216.6
|
|
139.2
|
|
19.2
|
|
—
|
|
382.8
|
|
|||||||||||
|
Interest and other financing costs, net
|
—
|
|
302.9
|
|
(1.2
|
)
|
33.2
|
|
—
|
|
334.9
|
|
|||||||||||
|
Expense allocations
|
(7.8
|
)
|
(376.9
|
)
|
342.3
|
|
42.4
|
|
—
|
|
—
|
|
|||||||||||
|
—
|
|
1,085.4
|
|
9,398.8
|
|
4,119.0
|
|
—
|
|
14,603.2
|
|
||||||||||||
|
Income (Loss) before Income Taxes
|
—
|
|
(38.0
|
)
|
145.9
|
|
121.8
|
|
—
|
|
229.7
|
|
|||||||||||
|
Provision (Benefit) for Income Taxes
|
—
|
|
(15.6
|
)
|
62.9
|
|
32.9
|
|
—
|
|
80.2
|
|
|||||||||||
|
Equity in Net Income of Subsidiaries
|
149.0
|
|
—
|
|
—
|
|
—
|
|
(149.0
|
)
|
—
|
|
|||||||||||
|
Net income
|
149.0
|
|
(22.4
|
)
|
83.0
|
|
88.9
|
|
(149.0
|
)
|
149.5
|
|
|||||||||||
|
Less: Net income attributable to noncontrolling interests
|
—
|
|
—
|
|
0.5
|
|
—
|
|
—
|
|
0.5
|
|
|||||||||||
|
Net income attributable to Aramark stockholders
|
149.0
|
|
(22.4
|
)
|
82.5
|
|
88.9
|
|
(149.0
|
)
|
149.0
|
|
|||||||||||
|
Other comprehensive income (loss), net of tax
|
(47.1
|
)
|
12.1
|
|
(0.6
|
)
|
(82.6
|
)
|
71.1
|
|
(47.1
|
)
|
|||||||||||
|
Comprehensive income (loss) attributable to Aramark stockholders
|
$
|
101.9
|
|
$
|
(10.3
|
)
|
$
|
81.9
|
|
$
|
6.3
|
|
$
|
(77.9
|
)
|
$
|
101.9
|
|
|||||
S-41
CONDENSED CONSOLIDATING STATEMENTS OF INCOME AND COMPREHENSIVE INCOME
For the year ended
September 27, 2013
(in millions)
|
Aramark (Parent)
|
Aramark Services, Inc.
(Issuer)
|
Guarantors
|
Non
Guarantors |
Eliminations
|
Consolidated
|
||||||||||||||||||
|
Sales
|
$
|
—
|
|
$
|
1,034.0
|
|
$
|
8,792.8
|
|
$
|
4,118.8
|
|
$
|
—
|
|
$
|
13,945.6
|
|
|||||
|
Costs and Expenses:
|
|||||||||||||||||||||||
|
Cost of services provided
|
—
|
|
996.6
|
|
7,811.8
|
|
3,852.8
|
|
—
|
|
12,661.2
|
|
|||||||||||
|
Depreciation and amortization
|
—
|
|
21.0
|
|
418.9
|
|
102.2
|
|
—
|
|
542.1
|
|
|||||||||||
|
Selling and general corporate expenses
|
0.9
|
|
82.5
|
|
125.7
|
|
18.8
|
|
—
|
|
227.9
|
|
|||||||||||
|
Interest and other financing costs
|
51.0
|
|
342.4
|
|
(2.7
|
)
|
33.1
|
|
—
|
|
423.8
|
|
|||||||||||
|
Expense allocations
|
—
|
|
(362.8
|
)
|
326.1
|
|
36.7
|
|
—
|
|
—
|
|
|||||||||||
|
51.9
|
|
1,079.7
|
|
8,679.8
|
|
4,043.6
|
|
—
|
|
13,855.0
|
|
||||||||||||
|
Income (Loss) from Continuing Operations before Income Taxes
|
(51.9
|
)
|
(45.7
|
)
|
113.0
|
|
75.2
|
|
—
|
|
90.6
|
|
|||||||||||
|
Provision (Benefit) for Income Taxes
|
(19.2
|
)
|
(31.9
|
)
|
52.3
|
|
18.0
|
|
—
|
|
19.2
|
|
|||||||||||
|
Equity in Net Income of Subsidiaries
|
102.1
|
|
—
|
|
—
|
|
—
|
|
(102.1
|
)
|
—
|
|
|||||||||||
|
Income (Loss) from Continuing Operations
|
69.4
|
|
(13.8
|
)
|
60.7
|
|
57.2
|
|
(102.1
|
)
|
71.4
|
|
|||||||||||
|
Loss from Discontinued Operations, net of tax
|
—
|
|
—
|
|
(1.0
|
)
|
—
|
|
—
|
|
(1.0
|
)
|
|||||||||||
|
Net income (loss)
|
69.4
|
|
(13.8
|
)
|
59.7
|
|
57.2
|
|
(102.1
|
)
|
70.4
|
|
|||||||||||
|
Less: Net income attributable to noncontrolling interests
|
—
|
|
—
|
|
0.8
|
|
0.2
|
|
—
|
|
1.0
|
|
|||||||||||
|
Net income (loss) attributable to Aramark stockholders
|
69.4
|
|
(13.8
|
)
|
58.9
|
|
57.0
|
|
(102.1
|
)
|
69.4
|
|
|||||||||||
|
Other comprehensive income (loss), net of tax
|
14.5
|
|
34.8
|
|
0.6
|
|
(19.2
|
)
|
(16.2
|
)
|
14.5
|
|
|||||||||||
|
Comprehensive income attributable to Aramark stockholders
|
$
|
83.9
|
|
$
|
21.0
|
|
$
|
59.5
|
|
$
|
37.8
|
|
$
|
(118.3
|
)
|
$
|
83.9
|
|
|||||
S-42
CONDENSED CONSOLIDATING STATEMENTS OF INCOME AND COMPREHENSIVE INCOME
For the year ended
September 28, 2012
(in millions)
|
Aramark (Parent)
|
Aramark Services, Inc.
(Issuer)
|
Guarantors
|
Non
Guarantors |
Eliminations
|
Consolidated
|
||||||||||||||||||
|
Sales
|
$
|
—
|
|
$
|
1,025.2
|
|
$
|
8,427.6
|
|
$
|
4,052.6
|
|
$
|
—
|
|
$
|
13,505.4
|
|
|||||
|
Costs and Expenses:
|
|||||||||||||||||||||||
|
Cost of services provided
|
—
|
|
962.0
|
|
7,478.4
|
|
3,751.1
|
|
—
|
|
12,191.5
|
|
|||||||||||
|
Depreciation and amortization
|
—
|
|
19.2
|
|
403.8
|
|
106.2
|
|
—
|
|
529.2
|
|
|||||||||||
|
Selling and general corporate expenses
|
0.5
|
|
58.5
|
|
123.0
|
|
21.0
|
|
—
|
|
203.0
|
|
|||||||||||
|
Interest and other financing costs, net
|
55.0
|
|
364.0
|
|
(0.4
|
)
|
38.2
|
|
—
|
|
456.8
|
|
|||||||||||
|
Expense allocations
|
—
|
|
(353.1
|
)
|
316.0
|
|
37.1
|
|
—
|
|
—
|
|
|||||||||||
|
55.5
|
|
1,050.6
|
|
8,320.8
|
|
3,953.6
|
|
—
|
|
13,380.5
|
|
||||||||||||
|
Income (Loss) from Continuing Operations before Income Taxes
|
(55.5
|
)
|
(25.4
|
)
|
106.8
|
|
99.0
|
|
—
|
|
124.9
|
|
|||||||||||
|
Provision (Benefit) for Income Taxes
|
(20.9
|
)
|
(9.2
|
)
|
30.4
|
|
17.7
|
|
—
|
|
18.0
|
|
|||||||||||
|
Equity in Net Income of Subsidiaries
|
138.2
|
|
—
|
|
—
|
|
—
|
|
(138.2
|
)
|
—
|
|
|||||||||||
|
Income (Loss) from Continuing Operations
|
103.6
|
|
(16.2
|
)
|
76.4
|
|
81.3
|
|
(138.2
|
)
|
106.9
|
|
|||||||||||
|
Income from Discontinued Operations, net of tax
|
—
|
|
—
|
|
0.3
|
|
—
|
|
—
|
|
0.3
|
|
|||||||||||
|
Net income (loss)
|
103.6
|
|
(16.2
|
)
|
76.7
|
|
81.3
|
|
(138.2
|
)
|
107.2
|
|
|||||||||||
|
Less: Net income attributable to noncontrolling interests
|
—
|
|
—
|
|
1.1
|
|
2.5
|
|
—
|
|
3.6
|
|
|||||||||||
|
Net income (loss) attributable to Aramark stockholders
|
103.6
|
|
(16.2
|
)
|
75.6
|
|
78.8
|
|
(138.2
|
)
|
103.6
|
|
|||||||||||
|
Other comprehensive income (loss), net of tax
|
3.6
|
|
32.9
|
|
2.3
|
|
(28.4
|
)
|
(6.8
|
)
|
3.6
|
|
|||||||||||
|
Comprehensive income attributable to Aramark stockholders
|
$
|
107.2
|
|
$
|
16.7
|
|
$
|
77.9
|
|
$
|
50.4
|
|
$
|
(145.0
|
)
|
$
|
107.2
|
|
|||||
S-43
CONDENSED CONSOLIDATING STATEMENTS OF CASH FLOWS
For the year ended
October 3, 2014
(in millions)
|
Aramark (Parent)
|
Aramark Services, Inc.
(Issuer)
|
Guarantors
|
Non
Guarantors |
Eliminations
|
Consolidated
|
||||||||||||||||||
|
Net cash provided by (used in) operating activities
|
$
|
0.5
|
|
$
|
65.6
|
|
$
|
470.5
|
|
$
|
(105.4
|
)
|
$
|
(33.1
|
)
|
$
|
398.1
|
|
|||||
|
Cash flows from investing activities:
|
|||||||||||||||||||||||
|
Purchases of property and equipment, client contract investments and other
|
—
|
|
(20.2
|
)
|
(456.7
|
)
|
(68.3
|
)
|
—
|
|
(545.2
|
)
|
|||||||||||
|
Disposals of property and equipment
|
—
|
|
8.4
|
|
6.2
|
|
13.9
|
|
—
|
|
28.5
|
|
|||||||||||
|
Proceeds from divestiture
|
—
|
|
—
|
|
24.0
|
|
—
|
|
—
|
|
24.0
|
|
|||||||||||
|
Acquisitions of businesses, net of cash acquired
|
—
|
|
—
|
|
(13.2
|
)
|
(8.2
|
)
|
—
|
|
(21.4
|
)
|
|||||||||||
|
Other investing activities
|
—
|
|
0.3
|
|
14.0
|
|
(5.4
|
)
|
—
|
|
8.9
|
|
|||||||||||
|
Net cash used in investing activities
|
—
|
|
(11.5
|
)
|
(425.7
|
)
|
(68.0
|
)
|
—
|
|
(505.2
|
)
|
|||||||||||
|
Cash flows from financing activities:
|
|||||||||||||||||||||||
|
Proceeds from long-term borrowings
|
—
|
|
1,293.7
|
|
—
|
|
277.1
|
|
—
|
|
1,570.8
|
|
|||||||||||
|
Payments of long-term borrowings
|
—
|
|
(1,877.4
|
)
|
(14.5
|
)
|
(86.7
|
)
|
—
|
|
(1,978.6
|
)
|
|||||||||||
|
Net change in funding under the Receivables Facility
|
—
|
|
—
|
|
—
|
|
50.0
|
|
—
|
|
50.0
|
|
|||||||||||
|
Payments of dividends
|
—
|
|
(52.2
|
)
|
—
|
|
—
|
|
—
|
|
(52.2
|
)
|
|||||||||||
|
Proceeds from initial public offering, net
|
524.1
|
|
—
|
|
—
|
|
—
|
|
—
|
|
524.1
|
|
|||||||||||
|
Proceeds from issuance of common stock
|
—
|
|
4.4
|
|
—
|
|
—
|
|
—
|
|
4.4
|
|
|||||||||||
|
Repurchase of common stock
|
—
|
|
(4.7
|
)
|
—
|
|
—
|
|
—
|
|
(4.7
|
)
|
|||||||||||
|
Other financing activities
|
—
|
|
4.4
|
|
(6.4
|
)
|
(4.0
|
)
|
—
|
|
(6.0
|
)
|
|||||||||||
|
Change in intercompany, net
|
(524.6
|
)
|
581.0
|
|
(22.8
|
)
|
(66.7
|
)
|
33.1
|
|
—
|
|
|||||||||||
|
Net cash provided by (used in) financing activities
|
(0.5
|
)
|
(50.8
|
)
|
(43.7
|
)
|
169.7
|
|
33.1
|
|
107.8
|
|
|||||||||||
|
Increase (decrease) in cash and cash equivalents
|
—
|
|
3.3
|
|
1.1
|
|
(3.7
|
)
|
—
|
|
0.7
|
|
|||||||||||
|
Cash and cash equivalents, beginning of period
|
—
|
|
23.0
|
|
40.5
|
|
47.5
|
|
—
|
|
111.0
|
|
|||||||||||
|
Cash and cash equivalents, end of period
|
$
|
—
|
|
$
|
26.3
|
|
$
|
41.6
|
|
$
|
43.8
|
|
$
|
—
|
|
$
|
111.7
|
|
|||||
S-44
CONDENSED CONSOLIDATING STATEMENTS OF CASH FLOWS
For the year ended
September 27, 2013
(in millions)
|
Aramark (Parent)
|
Aramark Services, Inc.
(Issuer)
|
Guarantors
|
Non
Guarantors |
Eliminations
|
Consolidated
|
||||||||||||||||||
|
Net cash provided by (used in) operating activities
|
$
|
599.9
|
|
$
|
97.7
|
|
$
|
585.5
|
|
$
|
64.0
|
|
$
|
(651.2
|
)
|
$
|
695.9
|
|
|||||
|
Cash flows from investing activities:
|
|||||||||||||||||||||||
|
Purchases of property and equipment, client contract investments and other
|
—
|
|
(14.3
|
)
|
(292.4
|
)
|
(86.2
|
)
|
—
|
|
(392.9
|
)
|
|||||||||||
|
Disposals of property and equipment
|
—
|
|
—
|
|
5.4
|
|
5.9
|
|
—
|
|
11.3
|
|
|||||||||||
|
Proceeds from divestitures
|
—
|
|
—
|
|
0.9
|
|
—
|
|
—
|
|
0.9
|
|
|||||||||||
|
Acquisitions of businesses, net of cash acquired
|
—
|
|
—
|
|
(22.6
|
)
|
—
|
|
—
|
|
(22.6
|
)
|
|||||||||||
|
Other investing activities
|
—
|
|
(1.4
|
)
|
27.4
|
|
(8.1
|
)
|
—
|
|
17.9
|
|
|||||||||||
|
Net cash used in investing activities
|
—
|
|
(15.7
|
)
|
(281.3
|
)
|
(88.4
|
)
|
—
|
|
(385.4
|
)
|
|||||||||||
|
Cash flows from financing activities:
|
|||||||||||||||||||||||
|
Proceeds from long-term borrowings
|
—
|
|
3,071.4
|
|
—
|
|
9.1
|
|
—
|
|
3,080.5
|
|
|||||||||||
|
Payments of long-term borrowings
|
(600.0
|
)
|
(2,521.2
|
)
|
(13.7
|
)
|
(180.0
|
)
|
—
|
|
(3,314.9
|
)
|
|||||||||||
|
Net change in funding under the Receivables Facility
|
—
|
|
—
|
|
—
|
|
36.2
|
|
—
|
|
36.2
|
|
|||||||||||
|
Proceeds from issuance of common stock
|
—
|
|
5.6
|
|
—
|
|
—
|
|
—
|
|
5.6
|
|
|||||||||||
|
Repurchase of common stock
|
—
|
|
(42.4
|
)
|
—
|
|
—
|
|
—
|
|
(42.4
|
)
|
|||||||||||
|
Distribution in connection with spin-off of Seamless
|
—
|
|
(47.4
|
)
|
—
|
|
—
|
|
—
|
|
(47.4
|
)
|
|||||||||||
|
Other financing activities
|
—
|
|
(50.3
|
)
|
(2.7
|
)
|
(0.9
|
)
|
—
|
|
(53.9
|
)
|
|||||||||||
|
Change in intercompany, net
|
—
|
|
(502.1
|
)
|
(289.0
|
)
|
139.9
|
|
651.2
|
|
—
|
|
|||||||||||
|
Net cash provided by (used in) financing activities
|
(600.0
|
)
|
(86.4
|
)
|
(305.4
|
)
|
4.3
|
|
651.2
|
|
(336.3
|
)
|
|||||||||||
|
Decrease in cash and cash equivalents
|
(0.1
|
)
|
(4.4
|
)
|
(1.2
|
)
|
(20.1
|
)
|
—
|
|
(25.8
|
)
|
|||||||||||
|
Cash and cash equivalents, beginning of period
|
0.1
|
|
27.4
|
|
41.7
|
|
67.6
|
|
—
|
|
136.8
|
|
|||||||||||
|
Cash and cash equivalents, end of period
|
$
|
—
|
|
$
|
23.0
|
|
$
|
40.5
|
|
$
|
47.5
|
|
$
|
—
|
|
$
|
111.0
|
|
|||||
S-45
CONDENSED CONSOLIDATING STATEMENTS OF CASH FLOWS
For the year ended
September 28, 2012
(in millions)
|
Aramark (Parent)
|
Aramark Services, Inc.
(Issuer)
|
Guarantors
|
Non
Guarantors |
Eliminations
|
Consolidated
|
||||||||||||||||||
|
Net cash provided by (used in) operating activities
|
$
|
—
|
|
$
|
62.2
|
|
$
|
532.5
|
|
$
|
178.7
|
|
$
|
(81.7
|
)
|
$
|
691.7
|
|
|||||
|
Cash flows from investing activities:
|
|||||||||||||||||||||||
|
Purchases of property and equipment, client contract investments and other
|
—
|
|
(11.7
|
)
|
(262.0
|
)
|
(80.9
|
)
|
—
|
|
(354.6
|
)
|
|||||||||||
|
Disposals of property and equipment
|
—
|
|
0.7
|
|
5.2
|
|
5.8
|
|
—
|
|
11.7
|
|
|||||||||||
|
Proceeds from divestitures
|
—
|
|
—
|
|
6.5
|
|
—
|
|
—
|
|
6.5
|
|
|||||||||||
|
Acquisitions of businesses, net of cash acquired
|
—
|
|
—
|
|
(139.9
|
)
|
(11.9
|
)
|
—
|
|
(151.8
|
)
|
|||||||||||
|
Other investing activities
|
—
|
|
1.3
|
|
3.6
|
|
1.7
|
|
—
|
|
6.6
|
|
|||||||||||
|
Net cash used in investing activities
|
—
|
|
(9.7
|
)
|
(386.6
|
)
|
(85.3
|
)
|
—
|
|
(481.6
|
)
|
|||||||||||
|
Cash flows from financing activities:
|
—
|
|
|||||||||||||||||||||
|
Proceeds from long-term borrowings
|
—
|
|
—
|
|
0.2
|
|
3.2
|
|
—
|
|
3.4
|
|
|||||||||||
|
Payments of long-term borrowings
|
—
|
|
(250.7
|
)
|
(12.9
|
)
|
(25.3
|
)
|
—
|
|
(288.9
|
)
|
|||||||||||
|
Net change in funding under the Receivables Facility
|
—
|
|
—
|
|
—
|
|
37.9
|
|
—
|
|
37.9
|
|
|||||||||||
|
Proceeds from issuance of common stock
|
—
|
|
11.3
|
|
—
|
|
—
|
|
—
|
|
11.3
|
|
|||||||||||
|
Repurchase of common stock
|
—
|
|
(37.7
|
)
|
—
|
|
—
|
|
—
|
|
(37.7
|
)
|
|||||||||||
|
Other financing activities
|
—
|
|
(6.1
|
)
|
(3.8
|
)
|
(2.8
|
)
|
—
|
|
(12.7
|
)
|
|||||||||||
|
Change in intercompany, net
|
—
|
|
120.7
|
|
(119.4
|
)
|
(83.0
|
)
|
81.7
|
|
—
|
|
|||||||||||
|
Net cash used in financing activities
|
—
|
|
(162.5
|
)
|
(135.9
|
)
|
(70.0
|
)
|
81.7
|
|
(286.7
|
)
|
|||||||||||
|
Increase (decrease) in cash and cash equivalents
|
—
|
|
(110.0
|
)
|
10.0
|
|
23.4
|
|
—
|
|
(76.6
|
)
|
|||||||||||
|
Cash and cash equivalents, beginning of period
|
0.1
|
|
137.4
|
|
31.7
|
|
44.2
|
|
—
|
|
213.4
|
|
|||||||||||
|
Cash and cash equivalents, end of period
|
$
|
0.1
|
|
$
|
27.4
|
|
$
|
41.7
|
|
$
|
67.6
|
|
$
|
—
|
|
$
|
136.8
|
|
|||||
S-46
ARAMARK AND SUBSIDIARIES
SCHEDULE II -- VALUATION AND QUALIFYING ACCOUNTS AND RESERVES
FOR THE FISCAL YEARS ENDED
OCTOBER 3, 2014
,
SEPTEMBER 27, 2013
AND
SEPTEMBER 28, 2012
|
Additions
|
Reductions
|
|||||||||||||||
|
|
Balance,
Beginning of
Period
|
Charged to
Income
|
Deductions
from
Reserves
(1)
|
Balance,
End of
Period
|
||||||||||||
|
Description
|
||||||||||||||||
|
Fiscal Year 2014
|
||||||||||||||||
|
Reserve for doubtful accounts, advances & current notes receivable
|
$
|
34,676
|
|
$
|
15,037
|
|
$
|
12,332
|
|
$
|
37,381
|
|
||||
|
Fiscal Year 2013
|
||||||||||||||||
|
Reserve for doubtful accounts, advances & current notes receivable
|
$
|
41,212
|
|
$
|
11,297
|
|
$
|
17,833
|
|
$
|
34,676
|
|
||||
|
Fiscal Year 2012
|
||||||||||||||||
|
Reserve for doubtful accounts, advances & current notes receivable
|
$
|
32,963
|
|
$
|
26,718
|
|
$
|
18,469
|
|
$
|
41,212
|
|
||||
|
(1)
|
Amounts determined not to be collectible and charged against the reserve and translation.
|
S-47
EXHIBIT INDEX
Copies of any of the following exhibits are available to Stockholders for the cost of reproduction upon written request from the Secretary, ARAMARK Corporation, 1101 Market Street, Philadelphia, PA 19107.
|
Exhibit No.
|
|
Description
|
|
|
3.1
|
|
Amended and Restated Certificate of Incorporation of Aramark (incorporated by reference to Exhibit 3.1 to Aramark’s Current Report on Form 8-K filed with the SEC on December 16, 2013, pursuant to the Exchange Act (file number 001-36223)).
|
|
|
3.2
|
|
Certificate of Ownership and Merger (incorporated by reference to Exhibit 3.1 to Aramark’s Current Report on Form 8-K filed with the SEC on May 15, 2014, pursuant to the Exchange Act (file number 001-36223)).
|
|
|
3.3
|
|
Amended and Restated By-laws of Aramark (incorporated by reference to Exhibit 3.2 to Aramark’s Current Report on Form 8-K filed with the SEC on May 15, 2014, pursuant to the Exchange Act
(file number 001-36223)).
|
|
|
4.1
|
|
Indenture, dated as of March 7, 2013, among Aramark Services, Inc., the guarantors named therein and The Bank of New York Mellon, as trustee (incorporated by reference to Exhibit 4.1 to Aramark Services, Inc.’s Current Report on Form 8-K filed with the SEC on March 7, 2013 pursuant to the Exchange Act
(file number 001-04762)).
|
|
|
4.3
|
|
First Supplemental Indenture, dated as of December 17, 2013, among ARAMARK Holdings Corporation and The Bank of New York Mellon, as trustee (incorporated by reference to Exhibit 4.3 to Aramark’s Form S-4 filed with the SEC on December 17, 2013 (file number 333-192907))
.
|
|
|
4.4
|
|
Second Supplemental Indenture, dated as of December 17, 2013, among the entities listed in Schedule I thereto and The Bank of New York Mellon, as trustee (incorporated by reference to Exhibit 4.4 to Aramark’s Form S-4 filed with the SEC on December 17, 2013 (file number 333-192907)).
|
|
|
10.1†
|
|
Employment Agreement dated November 2, 2004 between Aramark Services, Inc. and Joseph Neubauer (incorporated by reference to Exhibit 10.1 to Aramark Services, Inc.’s Current Report on Form 8-K/A filed with the SEC on November 8, 2004, pursuant to the Exchange Act (file number 001-04762)).
|
|
|
10.2†
|
|
Amendment, effective as of January 26, 2007, to the Employment Agreement dated November 2, 2004 between Aramark Services, Inc. and Joseph Neubauer (incorporated by reference to Exhibit 10.3 to Aramark Services, Inc.’s Current Report on Form 8-K filed with the SEC on February 1, 2007, pursuant to the Exchange Act
(file number 001-04762)).
|
|
|
10.4†
|
|
Letter relating to Joseph Neubauer’s Employment Agreement dated November 14, 2008 (incorporated by reference to Exhibit 10.4 to Aramark Services, Inc.’s Annual Report on Form 10-K filed with the SEC on December 15, 2008, pursuant to the Exchange Act (file number 001-04762)).
|
|
|
10.5†
|
|
Letter relating to Joseph Neubauer’s Employment Agreement dated May 7, 2012 (incorporated by reference to Exhibit 10.7 to Aramark Services, Inc.’s Quarterly Report on Form 10-Q filed with the SEC on May 9, 2012, pursuant to the Exchange Act (file number 001-04762)).
|
|
|
10.6†
|
|
Third Amendment dated as of November 14, 2012 to the Employment Agreement, dated as of November 2, 2004, as amended from time to time, between Aramark Services, Inc. and Joseph Neubauer (incorporated by reference to Exhibit 10.4 to Aramark Services, Inc.’s Current Report on Form 8-K filed with the SEC on November 19, 2012, pursuant to the Exchange Act (file number 001-04762)).
|
|
|
10.7†
|
|
Letter Agreement dated May 7, 2012 between Aramark Services, Inc. and Eric Foss (incorporated by reference to Exhibit 10.4 to Aramark Services, Inc.’s Quarterly Report on Form 10-Q filed with the SEC on May 9, 2012, pursuant to the Exchange Act (file number 001-04762)).
|
|
|
10.8†
|
|
Agreement Relating to Employment and Post-Employment Competition dated May 7, 2012 between Aramark Services, Inc. and Eric Foss (incorporated by reference to Exhibit 10.5 to Aramark Services, Inc.’s Quarterly Report on Form 10-Q filed with the SEC on May 9, 2012, pursuant to the Exchange Act
(file number 001-04762)).
|
|
|
10.9†
|
|
Amendment, effective as of June 25, 2013, to the Letter Agreement dated May 7, 2012 between Aramark Services, Inc. and Eric Foss (incorporated by reference to Exhibit 10.6 to Aramark Services, Inc.’s Current Report on Form 8-K filed with the SEC on June 26, 2013, pursuant to the Exchange Act (file number 001-04762)).
|
|
|
10.10†
|
|
Form of Agreement Relating to Employment and Post-Employment Competition and Schedule 1 listing each Executive Officer who is a party to such Agreement (incorporated by reference to Exhibit 10.1 to Aramark Services, Inc.’s Current Report on Form 8-K filed with the SEC on July 19, 2007, pursuant to the Exchange Act (file number 001-04762)).
|
|
|
10.11†
|
|
Form of Amendment to Agreement Relating to Employment and Post-Employment Competition (incorporated by reference to Exhibit 10.8 to Aramark Services, Inc.’s Annual Report on Form 10-K filed with the SEC on December 15, 2008, pursuant to the Exchange Act (file number 001-04762)).
|
|
S-48
|
10.12†
|
|
Agreement Relating to Employment and Post-Employment Competition dated November 14, 2007 between Aramark Services, Inc. and Joseph Munnelly (incorporated by reference to Exhibit 10.2 to Aramark Services, Inc.’s Quarterly Report on Form 10-Q filed with the SEC on February 6, 2008, pursuant to the Exchange Act
(file number 001-04762)).
|
|
|
10.13†
|
|
Agreement Relating to Employment and Post-Employment Competition dated November 8, 2004 between Aramark Services, Inc. and Karen A. Wallace (incorporated by reference to Exhibit 10.21 to Aramark Services, Inc.’s Annual Report on Form 10-K filed with the SEC on December 20, 2012, pursuant to the Exchange Act (file number 001-04762)).
|
|
|
10.14†
|
|
Offer Letter dated July 20, 2012 between Aramark Services, Inc. and Stephen R. Reynolds (incorporated by reference to Exhibit 10.12 to Aramark Services, Inc.’s Annual Report on Form 10-K filed with the SEC on December 20, 2012, pursuant to the Exchange Act (file number 001-04762)).
|
|
|
10.15†
|
|
Agreement Relating to Employment and Post-Employment Competition dated December 6, 2012 between Aramark Services, Inc. and Stephen R. Reynolds (incorporated by reference to Exhibit 10.13 to Aramark Services, Inc.’s Annual Report on Form 10-K filed with the SEC on December 20, 2012, pursuant to the Exchange Act (file number 001-04762)).
|
|
|
10.16†
|
|
Agreement Relating to Employment and Post-Employment Competition dated July 1, 2013 between Aramark Services, Inc. and Christina Takoudes Morrison (incorporated by reference to Exhibit 10.1 to Aramark Services, Inc.’s Quarterly Report on Form 10-Q filed with the SEC on August 7, 2013, pursuant to the Exchange Act
(file number 001-04762)).
|
|
|
10.17†
|
|
Form of Indemnification Agreement and attached schedule (incorporated by reference to Exhibit 10.4 to Aramark Services, Inc.’s Current Report on Form 8-K filed with the SEC on August 10, 2005, pursuant to the Exchange Act (file number 001-04762)).
|
|
|
10.18†
|
|
Indemnification Agreement dated May 7, 2012 between Eric Foss and Aramark Services, Inc. (incorporated by reference to Exhibit 10.6 to Aramark Services, Inc.’s Quarterly Report on Form 10-Q filed with the SEC on May 9, 2012, pursuant to the Exchange Act (file number 001-04762)).
|
|
|
10.19†
|
|
Indemnification Agreement dated December 15, 2011 between Joseph Munnelly and Aramark Services, Inc. (incorporated by reference to Exhibit 10.13 to Aramark Services, Inc.’s Annual Report on Form 10-K filed with the SEC on December 15, 2011, pursuant to the Exchange Act (file number 001-04762)).
|
|
|
10.20†
|
|
Indemnification Agreement dated December 12, 2012 between Karen A. Wallace and Aramark Services, Inc. (incorporated by reference to Exhibit 10.21 to Aramark Services, Inc.’s Annual Report on Form 10-K filed with the SEC on December 20, 2012, pursuant to the Exchange Act (file number 001-04762)).
|
|
|
10.21†
|
|
Indemnification Agreement dated December 12, 2012 between Stephen R. Reynolds and Aramark Services, Inc. (incorporated by reference to Exhibit 10.22 to Aramark Services, Inc.’s Annual Report on Form 10-K filed with the SEC on December 20, 2012, pursuant to the Exchange Act (file number 001-04762)).
|
|
|
10.22†
|
|
Indemnification Agreement dated February 4, 2014 between Daniel J. Heinrich and Aramark (incorporated by reference to Exhibit 10.1 to Aramark’s Quarterly Report on Form 10-Q filed with the SEC on February 5, 2014, pursuant to the Exchange Act (file number 001-36223)).
|
|
|
10.23†
|
|
Indemnification Agreement dated February 4, 2014 between Stephen Sadove and Aramark (incorporated by reference to Exhibit 10.2 to Aramark’s Quarterly Report on Form 10-Q filed with the SEC on February 5, 2014, pursuant to the Exchange Act (file number 001-36223)).
|
|
|
10.24†
|
|
Indemnification Agreement dated February 4, 2014 between Christina Morrison and Aramark (incorporated by reference to Exhibit 10.3 to Aramark’s Quarterly Report on Form 10-Q filed with the SEC on February 5, 2014, pursuant to the Exchange Act (file number 001-36223)).
|
|
|
10.25†
|
|
Form of Performance Stock Unit Award Agreement (incorporated by reference to Exhibit 10.4 to Aramark’s Quarterly Report on Form 10-Q filed with the SEC on February 5, 2014, pursuant to the Exchange Act
(file number 001-36223)).
|
|
|
10.26*†
|
|
Form of Performance Stock Unit Award Agreement (Revised).
|
|
|
10.27†
|
|
Fifth Amended and Restated Aramark 2007 Management Stock Incentive Plan (incorporated by reference to Exhibit 10.22 to Aramark’s Form S-1/A filed with the SEC on November 19, 2013 (file number 333-191057)).
|
|
|
10.28†
|
|
Form of Non-Qualified Stock Option Agreement (incorporated by reference to Exhibit 10.5 to Aramark Services, Inc.’s Current Report on Form 8-K filed with the SEC on February 1, 2007, pursuant to the Exchange Act
(file number 001-04762)).
|
|
|
10.29†
|
|
Form of Non-Qualified Stock Option Agreement (incorporated by reference to Exhibit 10.2 to Aramark Services, Inc.’s Quarterly Report on Form 10-Q filed with the SEC on August 8, 2007, pursuant to the Exchange Act
(file number 001-04762)).
|
|
|
10.30†
|
|
Form of Non-Qualified Stock Option Agreement (incorporated by reference to Exhibit 10.3 to Aramark Services, Inc.’s Current Report on Form 8-K filed with the SEC on November 16, 2007, pursuant to the Exchange Act
(file number 001-04762)).
|
|
S-49
|
10.31†
|
|
Form of Non-Qualified Stock Option Agreement (incorporated by reference to Exhibit 10.3 to Aramark Services, Inc.’s Current Report on Form 8-K filed with the SEC on March 1, 2010, pursuant to the Exchange Act
(file number 001-04762)).
|
|
|
10.32†
|
|
Form of Non-Qualified Stock Option Agreement (incorporated by reference to Exhibit 10.3 to Aramark Services, Inc.’s Current Report on Form 8-K filed with the SEC on June 22, 2011, pursuant to the Exchange Act
(file number 001-04762)).
|
|
|
10.33†
|
|
Amendment to Outstanding Non-Qualified Stock Option Agreements dated March 1, 2010 (incorporated by reference to Exhibit 10.1 to Aramark Services, Inc.’s Current Report on Form 8-K filed with the SEC on March 1, 2010, pursuant to the Exchange Act (file number 001-04762)).
|
|
|
10.34†
|
|
Form of Amendment to Outstanding Non-Qualified Stock Option Agreements (incorporated by reference to Exhibit 10.4 to Aramark Services, Inc.’s Current Report on Form 8-K filed with the SEC on June 22, 2011, pursuant to the Exchange Act (file number 001-04762)).
|
|
|
10.35†
|
|
Form of Non-Qualified Stock Option Agreement (incorporated by reference to Exhibit 10.2 to Aramark Services, Inc.’s Quarterly Report on Form 10-Q filed with the SEC on May 9, 2012, pursuant to the Exchange Act
(file number 001-04762)).
|
|
|
10.36†
|
|
Form of Non-Qualified Installment Stock Purchase Opportunity Agreement (incorporated by reference to Exhibit 10.2 to Aramark Services, Inc.’s Current Report on Form 8-K filed with the SEC on June 22, 2011, pursuant to the Exchange Act (file number 001-04762)).
|
|
|
10.37†
|
|
Form of Non-Qualified Installment Stock Purchase Opportunity Agreement (incorporated by reference to Exhibit 10.3 to Aramark Services, Inc.’s Quarterly Report on Form 10-Q filed with the SEC on May 9, 2012, pursuant to the Exchange Act (file number 001-04762)).
|
|
|
10.38†
|
|
Form of Non-Qualified Installment Stock Purchase Opportunity Agreement (incorporated by reference to Exhibit 10.3 to Aramark Services, Inc.’s Current Report on Form 8-K filed with the SEC on November 19, 2012, pursuant to the Exchange Act (file number 001-04762)).
|
|
|
10.39†
|
|
Form of Non-Qualified Stock Option Award Agreement (incorporated by reference to Exhibit 10.2 to Aramark Services, Inc.’s Current Report on Form 8-K filed with the SEC on June 26, 2013, pursuant to the Exchange Act (file number 001-04762)).
|
|
|
10.40†
|
|
Form of Time-Based Restricted Stock Unit Award Agreement with Aramark (incorporated by reference to Exhibit 10.3 to Aramark Services, Inc.’s Current Report on Form 8-K filed with the SEC on June 26, 2013, pursuant to the Exchange Act (file number 00104762)).
|
|
|
10.41†
|
|
Form of Restricted Stock Award Agreement with Aramark (incorporated by reference to Exhibit 10.4 to Aramark Services, Inc.’s Current Report on Form 8-K filed with the SEC on June 26, 2013, pursuant to the Exchange Act (file number 001-04762)).
|
|
|
10.42†
|
|
Form of Replacement Stock Option Award Agreement with Aramark (incorporated by reference to Exhibit 10.5 to Aramark Services, Inc.’s Current Report on Form 8K filed with the SEC on June 26, 2013, pursuant to the Exchange Act (file number 001-04762)).
|
|
|
10.43†
|
|
Schedule 1s to Outstanding Non-Qualified Stock Option Agreements (incorporated by reference to Exhibit 10.18 to Aramark Services, Inc.’s Annual Report on Form 10-K filed with the SEC on December 15, 2009, pursuant to the Exchange Act (file number 001-04762)).
|
|
|
10.44†
|
|
Schedules 1 to Outstanding Non-Qualified Stock Option Agreements (incorporated by reference to Exhibit 10.2 to Aramark Services, Inc.’s Current Report on Form 8-K filed with the SEC on March 1, 2010, pursuant to the Exchange Act (file number 001-04762)).
|
|
|
10.45†
|
|
New Schedule 1 to Form of Non-Qualified Stock Option Agreement (incorporated by reference to Exhibit 10.2 to Aramark Services, Inc.’s Current Report on Form 8-K filed with the SEC on November 18, 2011, pursuant to the Exchange Act (file number 001-04762)).
|
|
|
10.46†
|
|
Revised Schedule 1s to outstanding Non-Qualified Stock Option Agreements (incorporated by reference to Exhibit 10.3 to Aramark Services, Inc.’s Current Report on Form 8-K filed with the SEC on November 18, 2011, pursuant to the Exchange Act (file number 001-04762)).
|
|
|
10.47†
|
|
New Schedule 1 to Form of Non-Qualified Stock Option Agreement (incorporated by reference to Exhibit 10.1 to Aramark Services, Inc.’s Current Report on Form 8-K filed with the SEC on November 19, 2012, pursuant to the Exchange Act (file number 001-04762)).
|
|
|
10.48†
|
|
Revised Schedule 1s to outstanding Non-Qualified Stock Option Agreements (incorporated by reference to Exhibit 10.2 to Aramark Services, Inc.’s Current Report on Form 8-K filed with the SEC on November 19, 2012, pursuant to the Exchange Act (file number 001-04762)).
|
|
|
10.49†
|
|
Amended and Restated Aramark 2001 Stock Unit Retirement Plan (incorporated by reference to Exhibit 10.22 to Aramark Services, Inc.’s Annual Report on Form 10-K filed with the SEC on December 19, 2003, pursuant to the Exchange Act (file number 001-04762)).
|
|
|
10.50†
|
|
Second Amended and Restated Aramark Savings Incentive Retirement Plan (incorporated by reference to Exhibit 10.45 to Aramark’s Form S-1/A filed with the SEC on November 19, 2013, (file number 333-191057)).
|
|
S-50
|
10.51†
|
|
Form of Deferred Stock Unit Award Agreement under the Fifth Amended and Restated Aramark 2007 Management Stock Incentive Plan (incorporated by reference to Exhibit 10.46 to Aramark’s Form S-1/A filed with the SEC on November 19, 2013 (file number 333-191057)).
|
|
|
10.52†
|
|
Aramark 2001 Deferred Compensation Plan (incorporated by reference to Exhibit 10.1 to Aramark Services, Inc.’s Registration Statement on Form S-8 filed with the SEC on May 24, 2002 (file number 333-89120)).
|
|
|
10.53†
|
|
Second Amended and Restated Aramark 2005 Deferred Compensation Plan (incorporated by reference to Exhibit 10.48 to Aramark’s Form S-1/A filed with the SEC on November 19, 2013 (file number 333-191057)).
|
|
|
10.54†
|
|
Amended and Restated Aramark Senior Executive Performance Bonus Plan (incorporated by reference to Exhibit 10.49 to Aramark’s Form S-1/A filed with the SEC on November 19, 2013 (file number 333-191057)).
|
|
|
10.55†
|
|
Amended and Restated Executive Leadership Council Management Incentive Bonus Plan (2014) (incorporated by reference to Exhibit 10.50 to Aramark’s Form S-1/A filed with the SEC on November 19, 2013
(file number 333-191057)).
|
|
|
10.56†
|
|
Aramark Hardship Stock Repurchase Policy (incorporated by reference to Exhibit 10.35 to Aramark Services, Inc.’s Annual Report on Form 10-K filed with the SEC on December 15, 2011, pursuant to the Exchange Act
(file number 001-04762)).
|
|
|
10.57†
|
|
Limited Liquidity Program (incorporated by reference to Exhibit 10.36 to Aramark Services, Inc.’s Annual Report on Form 10-K filed with the SEC on December 15, 2011, pursuant to the Exchange Act (file number 001-04762)).
|
|
|
10.58†
|
|
Amended Survivor Income Protection Plan (incorporated by reference to Exhibit 10.5 to Aramark Services, Inc.’s Quarterly Report on Form 10-Q filed with the SEC on August 8, 2007, pursuant to the Exchange Act
(file number 001-04762)).
|
|
|
10.59
|
|
Amended and Restated Stockholders Agreement, dated as of December 10, 2013, among Aramark and the other parties thereto (incorporated by reference to Exhibit 10.1 to Aramark’s Current Report on Form 8-K filed with the SEC on December 16, 2013, pursuant to the Exchange Act (file number 001-36223)).
|
|
|
10.60
|
|
Amended and Restated Registration Rights and Coordination Committee Agreement, dated as of December 10, 2013, among Aramark and the other parties thereto (incorporated by reference to Exhibit 10.2 to Aramark’s Current Report on Form 8-K filed with the SEC on December 16, 2013, pursuant to the Exchange Act
(file number 001-36223)).
|
|
|
10.61
|
|
U.S. Pledge and Security Agreement, dated as of January 26, 2007, among ARAMARK Intermediate Holdco Corporation, RMK Acquisition Corporation, Aramark Services, Inc., the Subsidiary Parties from time to time party thereto and Citibank, N.A., as collateral agent (incorporated by reference to Exhibit 10.2 to Aramark Services, Inc.’s Current Report on Form 8-K filed with the SEC on February 1, 2007, pursuant to the Exchange Act (file number 001-04762)).
|
|
|
10.62
|
|
Amendment Agreement, dated as of February 24, 2014 (the “2014 Amendment Agreement”), to the Credit Agreement, dated as of January 26, 2007, as amended and restated as of March 26, 2010, as further amended and supplemented prior to the date of the Amendment Agreement by and among Aramark Services, Inc., ARAMARK Canada Ltd., ARAMARK Investments Limited, ARAMARK Ireland Holdings Limited, ARAMARK Holdings GMBH & Co. KG, ARAMARK GMBH, ARAMARK Intermediate Holdco Corporation, the Guarantors (as defined therein) party thereto, the Lenders (as defined therein) and JPMorgan Chase Bank, N.A., as administrative agent, collateral agent, issuing bank and as LC facility issuing bank and the other parties thereto from time to time (incorporated by reference to Exhibit 10.67 to Aramark’s Form S-1/A filed with the SEC on February 26, 2014 (file number 333-194077)) .
|
|
|
10.63
|
|
Amendment Agreement No. 1, dated as of March 28, 2014, to the Amendment Agreement, dated as of February 24, 2014, to the Credit Agreement, dated as of January 26, 2007, as amended and restated as of March 26, 2010, as further amended and supplemented prior to the date of the Amendment Agreement by and among Aramark Services, Inc., ARAMARK Canada Ltd., ARAMARK Investments Limited, ARAMARK Ireland Holdings Limited, ARAMARK Holdings GMBH & Co. KG, ARAMARK GMBH, ARAMARK Intermediate Holdco Corporation, the Guarantors (as defined therein) party thereto, the Lenders (as defined therein) and JPMorgan Chase Bank, N.A., as administrative agent, collateral agent, issuing bank and as LC facility issuing bank and the other parties thereto from time to time (incorporated by reference to Exhibit 10.1 to Aramark’s Quarterly Report on Form 10-Q filed with the SEC on May 8, 2014, pursuant to the Exchange Act
(file number 001-36223))
|
|
|
10.64
|
|
Assumption Agreement, dated as of March 30, 2007, relating to the Credit Agreement dated as of January 26, 2007 among Aramark Services, Inc., the other Borrowers and Loan Guarantors party thereto, the Lenders party thereto, Citibank, N.A., as administrative agent and collateral agent for the Lenders, and the other parties thereto from time to time (incorporated by reference to Exhibit 99.2 to Aramark Services, Inc.’s Current Report on Form 8-K filed with the SEC on April 5, 2007, pursuant to the Exchange Act (file number 001-04762)).
|
|
|
10.65
|
|
Joinder Agreement, dated as of December 17, 2013, between each New Subsidiary listed on Schedule I thereto and JPMorgan Chase Bank, N.A., as agent (incorporated by reference to Exhibit 10.64 to Aramark’s Form S-4 filed with the SEC on December 17, 2013 (file number 333-192907)).
|
|
S-51
|
10.66
|
|
Amended and Restated Master Distribution Agreement effective as of March 5, 2011 between SYSCO Corporation and ARAMARK Food and Support Services Group, Inc. (incorporated by reference to Exhibit 10.1 to Aramark Services, Inc.’s Quarterly Report on Form 10-Q filed with the SEC on May 12, 2011, pursuant to the Exchange Act (file number 001-04762)) (portions omitted pursuant to a grant of confidential treatment).
|
|
|
10.67
|
|
Amendment Agreement, dated February 26, 2014, to the Master Distribution Agreement dated as of November 25, 2006, between SYSCO Corporation and ARAMARK Food and Support Services Group, Inc., as amended and restated effective as of March 5, 2011 (incorporated by reference to Exhibit 10.71 to Aramark’s Form S-1/A filed with the SEC on February 26, 2014 (file number 333-194077)) (portions omitted pursuant to a grant of confidential treatment).
|
|
|
10.68
|
|
Share Purchase Agreement among Veris plc, ARAMARK Ireland Holdings Limited, ARAMARK Investments Limited and Aramark Services, Inc. dated October 2009 (incorporated by reference to Exhibit 10.1 to Aramark Services, Inc.’s Current Report on Form 8-K filed with the SEC on November 4, 2009, pursuant to the Exchange Act (file number 001-04762)).
|
|
|
10.69
|
|
Agreement and Plan of Merger by and among MPBP Holdings, Inc., ARAMARK Clinical Technology Services, LLC, RMK Titan Acquisition Corporation, Aramark Services, Inc. and the stockholders of MPBP Holdings, Inc. party thereto dated March 18, 2011 (incorporated by reference to Exhibit 10.1 to Aramark Services, Inc.’s Current Report on Form 8-K filed with the SEC on March 24, 2011, pursuant to the Exchange Act
(file number 001-04762)).
|
|
|
10.70†
|
|
Aramark 2005 Deferred Compensation Plan for Directors (incorporated by reference to Exhibit 10.67 to Aramark’s Form S-1/A filed with the SEC on November 19, 2013 (file number 333-191057)).
|
|
|
10.71†
|
|
Revised Schedule 1s to Outstanding Non-Qualified Stock Option Agreements (incorporated by reference to Exhibit 10.68 to Aramark’s Form S-1/A filed with the SEC on November 19, 2013 (file number 333-191057)).
|
|
|
10.72†
|
|
Form of Amendment to Outstanding Non-Qualified Stock Option Agreement (incorporated by reference to Exhibit 10.69 to Aramark’s Form S-1/A filed with the SEC on November 19, 2013 (file number 333-191057)).
|
|
|
10.73†
|
|
Aramark 2013 Stock Incentive Plan (incorporated by reference to Exhibit 10.70 to Aramark’s Form S-1/A filed with the SEC on November 19, 2013 (file number 333-191057)).
|
|
|
10.74†
|
|
Form of Non-Qualified Stock Option Award under the Aramark 2013 Stock Incentive Plan (incorporated by reference to Exhibit 10.71 to Aramark’s Form S-1/A filed with the SEC on November 19, 2013 (file number 333-191057)).
|
|
|
10.75†
|
|
Form of Restricted Stock Unit Award under the Aramark 2013 Stock Incentive Plan (incorporated by reference to Exhibit 10.72 to Aramark’s Form S-1/A filed with the SEC on November 19, 2013 (file number 333-191057)).
|
|
|
10.76†
|
|
Form of Deferred Stock Unit Award under the Aramark 2013 Stock Incentive Plan (incorporated by reference to Exhibit 10.73 to Aramark’s Form S-1/A filed with the SEC on November 19, 2013 (file number 333-191057)).
|
|
|
10.77*
|
|
Form of Deferred Stock Unit Award Agreement under the Aramark 2013 Stock Incentive Plan (Revised).
|
|
|
12.1*
|
|
Ratio of Earnings to Fixed Charges.
|
|
|
21.1*
|
|
List of subsidiaries of Aramark.
|
|
|
23.1*
|
|
Consent of Independent Registered Public Accounting Firm-KPMG LLP.
|
|
|
23.2*
|
|
Consent of Independent Auditors-Deloitte Touche Tohmatsu LLC.
|
|
|
31.1*
|
|
Certification of Eric Foss, Chief Executive Officer, pursuant to Section 302 of the Sarbanes-Oxley Act of 2002.
|
|
|
31.2*
|
|
Certification of L. Frederick Sutherland, Chief Financial Officer, pursuant to Section 302 of the Sarbanes-Oxley Act of 2002.
|
|
|
32.1*
|
|
Certification of Eric Foss, Chief Executive Officer, and L. Frederick Sutherland, Chief Financial Officer, pursuant to Section 906 of the Sarbanes-Oxley Act of 2002.
|
|
|
99.1
|
|
Audited Financial Statements of AIM Services Co., Ltd.
|
|
|
101.INS*
|
|
XBRL Instance Document
|
|
|
101.SCH*
|
|
XBRL Taxonomy Extension Schema Document
|
|
|
101.CAL*
|
|
XBRL Taxonomy Extension Calculation Linkbase Document
|
|
|
101.DEF*
|
|
XBRL Taxonomy Extension Definition Linkbase Document
|
|
|
101.LAB*
|
|
XBRL Taxonomy Extension Label Linkbase Document
|
|
|
101.PRE*
|
|
XBRL Taxonomy Extension Presentation Linkbase Document
|
|
* Filed herewith.
† Identifies exhibits that consist of management contract or compensatory arrangement.
S-52
TABLE OF CONTENTS
Part IItem 1. BusinessItem 1A. Risk FactorsItem 1B. Unresolved Staff CommentsItem 2. PropertiesItem 3. Legal ProceedingsItem 4. Mine Safety DisclosuresPart IIItem 5. Market For Registrant S Common Equity, Related Stockholder Matters and Issuer Purchases Of Equity SecuritiesItem 6. Selected Consolidated Financial DataItem 7A. Quantitative and Qualitative Disclosure About Market RiskItem 8. Financial Statements and Supplementary DataItem 9. Changes and Disagreements with Accountants on Accounting and Financial DisclosureItem 9A. Controls and ProceduresItem 9B. Other InformationPart IIIItem 10. Directors, Executive Officers and Corporate GovernanceItem 11. Executive CompensationItem 12. Security Ownership Of Certain Beneficial Owners and Management and Related Stockholder MattersItem 13. Certain Relationships and Related Transactions, and Director IndependenceItem 14. Principal Accountant Fees and ServicesPart IVItem 15. Exhibits and Financial Statement SchedulesNote 1. Basis Of Presentation and Summary Of Significant Accounting Policies:Note 2. Acquisitions and Divestitures:Note 3. Severance and Asset Write-downs:Note 4. Goodwill and Other Intangible Assets:Note 5. Borrowings:Note 6. Derivative Instruments:Note 7. Employee Pension and Profit Sharing Plans:Note 8. Income Taxes:Note 9. Capital Stock:Note 10. Share-based Compensation:Note 11. Earnings Per Share:Note 12. Accounts Receivable Securitization:Note 13. Commitments and Contingencies:Note 14. Quarterly Results (unaudited):Note 15. Business Segments:Note 16. Fair Value Of Financial Assets and Financial Liabilities:Note 17. Related Party Transactions:Note 18. Condensed Consolidating Financial Statements Of Aramark and Subsidiaries: