ARROW FINANCIAL CORP
10-Ks and 10-Qs
|
|
|
|
|
|
|
|
|
|
|
|
|
|
|
|
|
|
|
|
|
|
|
|
|
|
|
|
|
|
|
|
|
|
|
|
|
|
|
|
|
|
|
|
|
|
|
|
|
|
UNITED STATES
SECURITIES AND EXCHANGE COMMISSION
Washington, D.C. 20549
FORM 10-K
Annual Report Pursuant to Section 13 or 15(d) of
The Securities Exchange Act of 1934
For the Fiscal Year Ended
December 31, 2011
Commission File Number: 0-12507
ARROW FINANCIAL CORPORATION
(Exact name of registrant as specified in its charter)
|
New York
|
22-2448962
|
|||
|
(State or other jurisdiction of incorporation or organization)
|
(IRS Employer Identification Number)
|
|||
|
250 GLEN STREET, GLENS FALLS, NEW YORK 12801
|
||||
|
(Address of principal executive offices) (Zip Code)
|
||||
|
Registrant’s telephone number, including area code: (518) 745-1000
|
||||
|
SECURITIES REGISTERED PURSUANT TO SECTION 12(b) OF THE ACT - NONE
|
||||
|
SECURITIES REGISTERED PURSUANT TO SECTION 12(g) OF THE ACT
|
||||
|
Common Stock, Par Value $1.00
|
||||
|
(Title of Class)
|
||||
I
ndicate by check mark if the registrant is a well-known seasoned issuer, as defined in Rule 405 of the Securities Act.
Yes
x
No
Indicate by check mark if the registrant is not required to file reports pursuant to Section 13 or Section 15(d) of the Act.
Yes
x
No
Indicate by check mark whether the registrant (1) has filed all reports required to be filed by Section 13 or 15(d) of the Securities Exchange Act of 1934 during the preceding 12 months (or for such shorter period that the registrant was required to file such reports), and (2) has been subject to such filing requirements for the past 90 days.
x
Yes
No
Indicate by check mark whether the registrant has submitted electronically and posted on its corporate Website, if any, every Interactive Data File required to be submitted and posted pursuant to Rule 405 of Regulation S-T (§ 232.405 of this chapter) during the preceding 12 months (or for such shorter period that the registrant was required to submit and post such files).
x
Yes
No
Indicate by check mark if disclosure of delinquent filers pursuant to Item 405 of Regulation S-K (§ 229.405 of this chapter) is not contained herein, and will not be contained, to the best of registrant's knowledge, in definitive proxy or information statements incorporated by reference in Part III of this Form 10-K or any amendment to this Form 10-K:
x
Yes
No
Indicate by check mark whether the registrant is a large accelerated filer, an accelerated filer, a non-accelerated filer, or a smaller reporting company. See definition of “large accelerated filer,” “accelerated filer” and “smaller reporting company” in Rule 12b-2 of the Exchange Act.
|
Large accelerated filer
|
Accelerated filer
x
|
Non-accelerated filer
|
Smaller reporting company
|
||||||||||||||
Indicate by check mark whether the registrant is a shell company (as defined in Rule 12b-2 of the Act).
Yes
x
No
State the aggregate market value of the voting and non-voting common equity held by non-affiliates computed by reference to the price at which the common equity was last sold, or the average bid and asked price of such common equity, as of the last business day of the registrant’s most recently completed second fiscal quarter:
$275,731,916
Indicate the number of shares outstanding of each of the registrant’s classes of common stock, as of the latest practicable date.
|
Class
|
Outstanding as of February 17, 2012
|
|
|
Common Stock, par value $1.00 per share
|
11,892,843
|
|
DOCUMENTS INCORPORATED BY REFERENCE
Portions of the Registrant’s Proxy Statement for the Annual Meeting of Stockholders to be held
April 25, 2012
(Part III)
ARROW FINANCIAL CORPORATION
FORM 10-K
TABLE OF CONTENTS
|
Page
|
|
|
|
Note on Terminology
|
3
|
|
|
Forward-Looking Statements
|
3
|
|
|
Use of Non-GAAP Financial Measures
|
4
|
|
|
PART I
|
||
|
|
||
|
|
||
|
|
||
|
|
||
|
|
||
|
|
||
|
PART II
|
||
|
|
||
|
|
||
|
|
||
|
|
||
|
|
||
|
|
||
|
|
||
|
|
||
|
PART III
|
||
|
|
||
|
|
||
|
|
||
|
|
||
|
|
||
|
PART IV
|
||
|
|
||
|
|
||
|
|
||
*These items are incorporated by reference to the Corporation
’
s Proxy Statement for the Annual Meeting of Stockholders to be held
April 25, 2012
.
#
2
NOTE ON TERMINOLOGY
In this Annual Report on Form 10-K, the terms
“
Arrow,
”
“
the registrant,
”
“
the company,
”
“
we,
”
“
us,
”
and
“
our
”
generally refer to Arrow Financial Corporation and subsidiaries as a group, except where the context indicates otherwise. Arrow is a two-bank holding company headquartered in Glens Falls, New York. Our banking subsidiaries are Glens Falls National Bank and Trust Company (Glens Falls National) whose main office is located in Glens Falls, New York, and Saratoga National Bank and Trust Company (Saratoga National) whose main office is located in Saratoga Springs, New York. Subsidiaries of Glens Falls National include Capital Financial Group, Inc. (an insurance agency specializing in selling and servicing group health care policies and life insurance), Loomis & LaPann, Inc. (a property and casualty and sports accident and health insurance agency), Upstate Agency, LLC ( a property and casualty insurance agency), Glens Falls National Insurance Agencies, LLC (a property and casualty insurance agency - currently doing business under the name of McPhillips Agency), North Country Investment Advisers, Inc. (a registered investment adviser that provides investment advice to our proprietary mutual funds) and Arrow Properties, Inc., a real estate investment trust (REIT).
At certain points in this Report, our performance is compared with that of our
“
peer group
”
of financial institutions. Unless otherwise specifically stated, this peer group is comprised of the group of 303 domestic bank holding companies with $1 to $3 billion in total consolidated assets as identified in the Federal Reserve Board
’
s
“
Bank Holding Company Performance Report
”
for
December 31, 2011
, and peer group data has been derived from such Report. This peer group is not, however, identical to either of the peer groups comprising the two bank indices included in the stock performance graphs on pages 17 and 18 of this Report.
FORWARD-LOOKING STATEMENTS
The information contained in this Annual Report on Form 10-K contains statements that are not historical in nature but rather are based on our beliefs, assumptions, expectations, estimates and projections about the future. These statements are
“
forward-looking statements
”
within the meaning of Section 21E of the Securities Exchange Act of 1934, as amended, and involve a degree of uncertainty and attendant risk. Words such as
“
expects,
”
“
believes,
”
“
anticipates,
”
“
estimates
”
and variations of such words and similar expressions often identify such forward-looking statements. Some of these statements, such as those included in the interest rate sensitivity analysis in Item 7A of this Report, entitled
“
Quantitative and Qualitative Disclosures About Market Risk,
”
are merely presentations of what future performance or changes in future performance would look like based on hypothetical assumptions and on simulation models. Other forward-looking statements are based on our general perceptions of market conditions and trends in activity, both locally and nationally, as well as current management strategies for future operations and development.
Examples of forward-looking statements in this Report are referenced in the table below:
|
Topic
|
Section
|
Page
|
Location
|
|
Impact of Legislative Developments
|
Part I, Item 1.D.
|
10
|
Paragraph in "Health Care Reform"
|
|
11
|
Last paragraph in Section D
|
||
|
Part II, Item 7.A.
|
25
|
Paragraph in "Health Care Reform"
|
|
|
Impact of Changing Interest Rates on Earnings
|
Part II, Item 7.B.I.
|
30
|
Last 3 paragraphs
|
|
Part II, Item 7.C.II.a.
|
40
|
Last paragraph under
“
Indirect
Consumer Loans
”
|
|
|
Part II, Item 7.C.II.a.
|
41
|
3
rd
and 4
th
paragraph
|
|
|
Part II, Item 7.C.IV.
|
45
|
2
nd
paragraph
|
|
|
Part II, Item 7A.
|
52
|
Last 4 paragraphs
|
|
|
Adequacy of the Allowance for Loan
Losses
|
Part II, Item 7.B.II.
|
32
|
1
st
paragraph under
“
II. Provision
For Loan Losses and Allowance For
Loan Losses
”
|
|
Expected Level of Real Estate Loans
|
Part II, Item 7.C.II.a.
|
39
|
2
nd
paragraph under
“
Residential
Real Estate Loans
”
|
|
Liquidity
|
Part II, Item 7.D.
|
46
|
Last 2 paragraphs under "Liquidity"
|
|
Dividend Capacity
|
Part I, Item 1.C.
|
7
|
1
st
and 3
rd
paragraph under "Regulatory Capital Standards; Dividend Restrictions"
|
|
Part II, Item 7.E.
|
48
|
3
rd
paragraph under table
|
|
|
Retirement Plans
|
Part II, Item 8
|
87
|
Paragraph in
“
Cash Flows
”
|
|
Commitments to Extend Credit
|
Part II, Item 8
|
91
|
Last 2 paragraphs in Note 20
|
|
VISA Estimation
|
Part II, Item 7.A.
|
26
|
4
th
paragraph
|
|
Noninterest Income
|
Part II, Item 7.C.IV
|
33
|
Last paragraph
|
|
34
|
1
st
paragraph
|
||
#
3
These statements are not guarantees of future performance and involve certain risks and uncertainties that are difficult to quantify or, in some cases, to identify. In the case of all forward-looking statements, actual outcomes and results may differ materially from what the statements predict or forecast. Factors that could cause or contribute to such differences include, but are not limited to:
|
a.
|
rapid and dramatic changes in economic and market conditions, such as the U.S. economy has recently experienced and continues to experience;
|
b.
sharp fluctuations in interest rates, economic activity, and consumer spending patterns;
c.
sudden changes in the market for products we provide, such as real estate loans;
|
d.
|
significant new banking laws and regulations, as are presently anticipated or, as a result of the Dodd-Frank Wall Street Reform and Consumer Protection Act (the Dodd-Frank Act or Dodd-Frank);
|
|
e.
|
enhanced competition from unforeseen sources; and
|
|
f.
|
similar uncertainties inherent in banking operations or business generally.
|
USE OF NON-GAAP FINANCIAL MEASURES
The Securities and Exchange Commission (SEC) has adopted Regulation G, which applies to all public disclosures, including earnings releases, made by registered companies that contain
“
non-GAAP financial measures.
”
GAAP is generally accepted accounting principles in the United States of America. Under Regulation G, companies making public disclosures containing non-GAAP financial measures must also disclose, along with each non-GAAP financial measure, certain additional information, including a reconciliation of the non-GAAP financial measure to the closest comparable GAAP financial measure and a statement of the Company
’
s reasons for utilizing the non-GAAP financial measure as part of its financial disclosures. The SEC has exempted from the definition of
“
non-GAAP financial measures
”
certain commonly used financial measures that are not based on GAAP. When these exempted measures are included in public disclosures, supplemental information is not required. The following measures used in this Report, which are commonly utilized by financial institutions, have not been specifically exempted by the SEC and may constitute "non-GAAP financial measures" within the meaning of the SEC's new rules, although we are unable to state with certainty that the SEC would so regard them.
Tax-Equivalent Net Interest Income and Net Interest Margin:
Net interest income, as a component of the tabular presentation by financial institutions of Selected Financial Information regarding their recently completed operations, is commonly presented on a tax-equivalent basis. That is, to the extent that some component of the institution's net interest income, which is presented on a before-tax basis, is exempt from taxation (e.g., is received by the institution as a result of its holdings of state or municipal obligations), an amount equal to the tax benefit derived from that component is added to the actual before-tax net interest income total. This adjustment is considered helpful in comparing one financial institution's net interest income to that of another institution or in analyzing any institution
’
s net interest income trend line over time, to correct any analytical distortion that might otherwise arise from the fact that financial institutions vary widely in the proportions of their portfolios that are invested in tax-exempt securities, and that even a single institution may significantly alter over time the proportion of its own portfolio that is invested in tax-exempt obligations. Moreover, net interest income is itself a component of a second financial measure commonly used by financial institutions, net interest margin, which is the ratio of net interest income to average earning assets. For purposes of this measure as well, tax-equivalent net interest income is generally used by financial institutions, again to provide a better basis of comparison from institution to institution and to better demonstrate a single institution
’
s performance over time. We follow these practices.
The Efficiency Ratio:
Financial institutions often use an "efficiency ratio" as a measure of expense control. The efficiency ratio typically is defined as the ratio of noninterest expense to net interest income and noninterest income. Net interest income as utilized in calculating the efficiency ratio is typically expressed on a tax-equivalent basis. Moreover, most financial institutions, in calculating the efficiency ratio, also adjust both noninterest expense and noninterest income to exclude from these items (as calculated under GAAP) certain recurring component elements of income and expense, such as intangible asset amortization (deducted from noninterest expense) and securities gains or losses (excluded from noninterest income). We follow these practices.
Tangible Book Value per Share:
Tangible equity is total stockholders
’
equity less intangible assets. Tangible book value per share is tangible equity divided by total shares issued and outstanding. Tangible book value per share is often regarded as a more meaningful comparative ratio than book value per share as calculated under GAAP, that is, total stockholders
’
equity including intangible assets divided by total shares issued and outstanding. Intangible assets includes many items, but is essentially represented by goodwill for Arrow.
Adjustments for Certain Items of Income or Expense:
In addition to our disclosures of net income, earnings per share (i.e. EPS), return on average assets (i.e. ROA), return on average equity (i.e. ROE) and other financial measures in accordance with GAAP, we may also provide comparative disclosures that adjust these GAAP financial measures by removing the impact of certain transactions or other material items of income or expense. We believe that the resulting non-GAAP financial measures may improve an understanding of our results of operations by separating out items that have a disproportional positive or negative impact on the particular period in question. Additionally, we believe that the adjustment for certain items allows a better comparison from period to period in our results of operations with respect to our fundamental lines of business including the commercial banking business.
We believe that the non-GAAP financial measures disclosed by us from time to time are useful in evaluating our performance and that such information should be considered as supplemental in nature and not as a substitute for or superior to the related financial information prepared in accordance with GAAP. Our non-GAAP financial measures may differ from similar measures presented by other companies.
#
4
|
Item 1.
|
Business
|
A. GENERAL
Our holding company, Arrow Financial Corporation, a New York corporation, was incorporated on March 21, 1983 and is registered as a bank holding company within the meaning of the Bank Holding Company Act of 1956. Arrow owns two nationally chartered banks in New York (Glens Falls National and Saratoga National), and indirectly a health and life insurance agency (Capital Financial Group, Inc.), three primarily property and casualty insurance agencies (Loomis and LaPann, Inc., Upstate Agency, LLC and Glens Falls National Insurance Agencies, LLC), a registered investment adviser that advises our proprietary mutual funds (North Country Investment Advisers, Inc.), a Real Estate Investment Trust (Arrow Properties, Inc.) and four other non-bank subsidiaries whose operations are insignificant.
|
Subsidiary Banks
(dollars in thousands)
|
|||||||
|
Glens Falls National
|
Saratoga National
|
||||||
|
Total Assets at Year-End
|
$
|
1,674,323
|
|
$
|
295,645
|
|
|
|
Trust Assets Under Administration and
Investment Management at Year-End
(Not Included in Total Assets)
|
$
|
925,869
|
|
$
|
47,682
|
|
|
|
Date Organized
|
1851
|
|
1988
|
|
|||
|
Employees (full-time equivalent)
|
482
|
|
39
|
|
|||
|
Offices
|
29
|
|
6
|
|
|||
|
Counties of Operation
|
Warren, Washington,
Saratoga, Essex &
Clinton
|
|
Saratoga
|
|
|||
|
Main Office
|
250 Glen Street
Glens Falls, NY
|
|
171 So. Broadway
Saratoga Springs, NY
|
|
|||
The holding company
’
s business consists primarily of the ownership, supervision and control of our two banks. The holding company provides various advisory and administrative services and coordinates the general policies and operation of the banks. There were 521 full-time equivalent employees at
December 31, 2011
.
We offer a full range of commercial and consumer banking and financial products. Our deposit base consists of deposits derived principally from the communities we serve. We target our lending activities to consumers and small and mid-sized companies in our immediate geographic areas. Through our banks' trust operations, we provide retirement planning, trust and estate administration services for individuals, and pension, profit-sharing and employee benefit plan administration for corporations.
On August 1, 2011, we acquired two privately owned insurance agencies located in the greater Glens Falls area, W. Joseph McPhillips, Inc. and McPhillips-Northern, Inc., which were controlled by the same group of shareholders. Each of the acquisitions was structured as a merger of the acquired agency into a newly formed subsidiary of Arrow's principal subsidiary bank, Glens Falls National Bank and Trust Company, named Glens Falls National Insurance Agencies, LLC. Both acquisitions qualified as tax-free reorganizations under the Internal Revenue Code. At closing of the acquisitions, which occurred on the same day, Arrow issued a total of 90,744 shares of its common stock (as restated for stock dividends) and $116 thousand in cash to the agencies' shareholders in exchange for all of their shares of the agencies' stock. Arrow recorded the following intangible assets as a result of the acquisition (none of which are deductible for income tax purposes): goodwill ($1,180) and expirations ($720). The value of the expirations is being amortized over twenty years.
On February 1, 2011, we acquired Upstate Agency, Inc. (Upstate), a privately owned, property and casualty insurance agency with offices located in northern New York. The acquisition was structured as a merger of Upstate into a newly-formed subsidiary limited liability company wholly owned by Glens Falls National, and qualified as a tax-free reorganization under the Internal Revenue Code. At closing of the acquisition, Arrow issued to the sole shareholder of Upstate, in exchange for all of his Upstate stock, 134,778 shares of Arrow
'
s common stock (as restated for stock dividends) and approximately $2.7 million in cash. Arrow recorded the following intangible assets as a result of the acquisition (none of which are deductible for income tax purposes): goodwill ($5,040) and expirations ($2,854). The value of the expirations is being amortized over twenty years. The acquisition agreement provided for possible additional post-closing payments of Arrow's common stock to the former sole shareholder of Upstate, contingent upon the financial performance and business results of Upstate as a subsidiary of Arrow over the three-year period following the closing. The present value of the expected post-closing payments was included in the basis of goodwill recognized at the acquisition date.
On April 1, 2010, we acquired Loomis & LaPann, Inc. (Loomis), a privately owned, property and casualty and sports accident and health insurance agency located in Glens Falls. The acquisition was structured as a merger between a newly-formed acquisition subsidiary of Glens Falls National and Loomis, and qualified as a tax-free reorganization under the Internal Revenue Code. At closing of the acquisition, Arrow issued to the shareholders of Loomis, in exchange for their Loomis stock, 27,838 shares of Arrow
'
s common stock (as restated for dividends). At closing, Arrow recorded the following intangible assets as a result of the acquisition (none of which are deductible for income tax purposes): goodwill ($514 thousand) and portfolio expirations ($126 thousand). The value of the expirations is being amortized over twenty years. The acquisition agreement provided for possible additional post-closing payments of Arrow's common stock to the former Loomis shareholders, contingent upon the financial performance of Loomis as a subsidiary of Arrow over a three-year period following the closing. To date, Arrow has issued 1,702 additional shares of its common stock in such post-closing payments to the former Loomis shareholders. The estimated value of all expected post-closing payments was included in the basis of goodwill recognized at the acquisition date.
#
5
In July 2008, we acquired the key operating assets, including the trade name from U.S. Benefits, Inc., a provider of administrative and recordkeeping services for more complex retirement plans. This acquisition allows the Company to offer enhanced and broadened services to retirement plan clients and will complement the fiduciary services currently offered by the Company through its trust administrative and investment management activities.
In April 2005, we acquired from HSBC Bank USA, N.A. (
“
HSBC
”
) three bank branches located within our service area. Our subsidiary Glens Falls National acquired two HSBC branches located in Argyle and Salem, New York, and our subsidiary Saratoga National acquired a branch located in Corinth, New York. The banks acquired substantially all deposit liabilities, the physical facilities and certain loans related to the branches. At the closing of the acquisitions, total deposits of the three branches were approximately $62 million and the related loans were approximately $8 million. The acquisition resulted in total intangible assets, including goodwill, of approximately $5.9 million.
In November 2004, we acquired all of the outstanding shares of common stock of Capital Financial Group, Inc. (
“
CFG
”
), an insurance agency headquartered in South Glens Falls, New York, which specializes in group health and life insurance products. The acquisition was structured as a tax-free exchange of Arrow
'
s common stock for CFG
'
s common stock. As adjusted for cumulative contingent payments over the five-year period subsequent to the acquisition, we recorded the following intangible assets as a result of the acquisition (none of which are deductible for income tax purposes): goodwill ($2.277 million), covenant not to compete ($117 thousand) and portfolio expirations ($686 thousand). The value of the covenant is being amortized over five years and the value of the expirations is being amortized over twenty years. Under the acquisition agreement, we issued 109,955 shares of Arrow
'
s common stock, including annual contingent post-closing payments of Arrow common stock. These contingent payments were recorded as additional goodwill at the time of payment.
In 2000, we formed a subsidiary, North Country Investment Advisers, Inc. (NCIA), which is an investment adviser registered with the U. S. Securities and Exchange Commission. NCIA advises two SEC-registered mutual funds, the North Country Intermediate Bond Fund and the North Country Equity Growth Fund. Currently, the investors in these funds consist primarily of individual, corporate and institutional trust customers of our Banks. However, the funds are also offered on a retail basis at most of the branch locations of our banks.
B. LENDING ACTIVITIES
Arrow engages in a wide range of lending activities, including commercial and industrial lending primarily to small and mid-sized companies; mortgage lending for residential and commercial properties; and consumer installment and home equity financing. We also maintain an active indirect lending program through our sponsorship of automobile dealer programs under which we purchase dealer paper, primarily from dealers that meet pre-established specifications. From time-to-time we sell a portion of our residential real estate loan originations into the secondary market, primarily to the Federal Home Loan Mortgage Corporation (
“
Freddie Mac
”
) and state housing agencies, while normally retaining the servicing rights.
Generally, we continue to implement lending strategies and policies that are intended to protect the quality of the loan portfolio, including strong underwriting and collateral control procedures and credit review systems. Loans are placed on nonaccrual status either due to the delinquency status of principal and/or interest or a judgment by management that the full repayment of principal and interest is unlikely. Loans secured by home equity lines of credit are put on nonaccrual status when 120 days past due; residential real estate loans when 150 days past due; commercial and commercial real estate loans are evaluated on a loan-by-loan basis and are placed on nonaccrual status when 90 days past due if the full collection of principal and interest is uncertain. (see Part II, Item 7.C.II.c. “Risk Elements”). Subsequent cash payments on loans classified as nonaccrual may be applied all to principal, although income in some cases may be recognized on a cash basis.
We lend almost exclusively to borrowers within our geographic area, with the exception of our indirect consumer lending line of business, where we acquire retail paper from an extensive network of automobile dealers that operate in a geographic area (in the eastern region of upstate New York) that is somewhat larger than our normal retail service area. The loan portfolio does not include any foreign loans or any other significant risk concentrations. We do not participate in loan syndications, either as originator or as a participant. Most of the portfolio, in general, is fully collateralized, and many commercial loans are further secured by personal guarantees.
However, from time-to-time, we buy and sell participations in loans with other financial institutions in our area of operation.
We do not engage in subprime mortgage lending as a business line and we do not extend or purchase so-called
“
Alt A,
”
“
negative amortization,
”
“
option ARM
'
s
”
or
“
negative equity
”
mortgage loans. During 2011, we foreclosed on only six loans held in our own portfolio. We did not foreclose on any sold loans that we serviced for Freddie Mac.
C. SUPERVISION AND REGULATION
The following generally describes the laws and regulations to which we are subject. Bank holding companies, banks and their affiliates are extensively regulated under both federal and state law. To the extent that the following information summarizes statutory or regulatory law, it is qualified in its entirety by reference to the particular provisions of the various statutes and regulations. Any change in applicable law may have a material effect on our business and prospects.
Bank Regulatory Authorities with Jurisdiction over Arrow and its Subsidiary Banks
Arrow is a registered bank holding company within the meaning of the Bank Holding Company Act of 1956 (
“
BHC Act
”
) and is subject to regulation by the Board of Governors of the Federal Reserve System (
“
FRB
”
). Arrow is not a so-called
“
financial holding company
”
under federal banking law. Additionally, as a
“
bank holding company
”
under New York State law, Arrow is subject to regulation by the New York State Department of Financial Services. Our two subsidiary banks are both nationally chartered
#
6
banks and are subject to supervision and examination by the Office of the Comptroller of the Currency (
“
OCC
”
). The banks are members of the Federal Reserve System and the deposits of each bank are insured by the Deposit Insurance Fund of the Federal Deposit Insurance Corporation (
“
FDIC
”
). The BHC Act generally prohibits Arrow from engaging, directly or indirectly, in activities other than banking, activities closely related to banking, and certain other financial activities. Under the BHC Act, a bank holding company must obtain FRB approval before acquiring, directly or indirectly, 5% or more of the voting shares of another bank or bank holding company (unless it already owns a majority of such shares). Bank holding companies are able to acquire banks or other bank holding companies located in all 50 states, subject to certain limitations. The Gramm-Leach-Bliley Act, enacted in 1999, authorized bank holding companies to affiliate with a much broader array of other financial institutions than was previously permitted, including insurance companies, investment banks and merchant banks. See Item 1.D.,
“
Recent Legislative Developments.
”
The FRB and the OCC have broad regulatory, examination and enforcement authority. The FRB and the OCC conduct regular examinations of the entities they regulate. In addition, banking organizations are subject to periodic reporting requirements to the regulatory authorities. The FRB and OCC have the authority to implement various remedies if they determine that the financial condition, capital, asset quality, management, earnings, liquidity or other aspects of a banking organization's operations are unsatisfactory or if they determine the banking organization is violating or has violated any law or regulation. The authority of the FRB and the OCC includes, but is not limited to, prohibiting unsafe or unsound practices; requiring affirmative action to correct a violation or practice; issuing administrative orders; requiring the organization to increase capital; requiring the organization to sell subsidiaries or other assets; restricting dividends and distributions; restricting the growth of the organization; assessing civil money penalties; removing officers and directors; and terminating deposit insurance. The FDIC may terminate a depository institution's deposit insurance upon a finding that the institution's financial condition is unsafe or unsound or that the institution has engaged in unsafe or unsound practices or has violated any applicable rule, regulation, order or condition enacted or imposed by the institution's regulatory agency.
Regulation of Transactions between Banks and their Affiliates
Arrow and its non-bank subsidiaries are “affiliates” within the meaning of Sections 23A and 23B of the Federal Reserve Act (the “FRA”) with Arrow's bank subsidiaries. Extensions of credit that a bank may make to non-bank affiliates, or to third parties secured by securities or obligations of the non-bank affiliates, are substantially limited by the FRA and the Federal Deposit Insurance Act (the “FDIA”). Such acts further restrict the range of permissible transactions between a bank and an affiliate. A bank and subsidiaries of a bank may engage in certain transactions, including loans and purchases of assets, with an affiliate, only if the terms and conditions of the transaction, including credit standards, are substantially the same as, or at least as favorable to the bank as, those prevailing at the time for comparable transactions with non-affiliated companies or, in the absence of comparable transactions, on terms and conditions that would be offered to non-affiliated companies.
Regulatory Capital Standards; Dividend Restrictions
An important area of banking regulation is the federal banking system's promulgation and enforcement of minimum capitalization standards for banks and bank holding companies. The FRB has adopted various "capital adequacy guidelines" for its use in the examination and supervision of bank holding companies. The FRB's risk-based capital guidelines assign risk weightings to all assets and certain off-balance sheet items and establish an 8% minimum ratio of qualified total capital to the aggregate dollar amount of risk-weighted assets (which is almost always less than the dollar amount of such assets without risk weighting). Under the risk-based guidelines, at least half of total capital must consist of "Tier 1" capital, which comprises common equity, retained earnings and a limited amount of permanent preferred stock, less goodwill. Under the FRB's guidelines, trust preferred securities may also qualify as Tier 1 capital, in an amount not to exceed 25% of Tier 1 capital. (Under the recently-enacted Dodd-Frank Act, newly issued trust preferred securities will no longer qualify as Tier 1 capital; previously issued trust preferred securities for holding companies such as Arrow will continue to qualify as Tier 1 capital until maturity or redemption.) The guidelines limit restricted core capital elements to a percentage of the sum of core capital elements, net of goodwill less any associated deferred tax liability. We issued trust preferred securities in 2003 and 2004 to serve as part of our core capital. Up to half of total capital may consist of so-called "Tier 2" capital, comprising a limited amount of subordinated debt, preferred stock not qualifying as Tier 1 capital, certain other instruments and a limited amount of the allowance for loan losses. The FRB's other important guideline for measuring a bank holding company's capital is the leverage ratio standard, which establishes minimum limits on the ratio of a bank holding company's "Tier 1" capital to total tangible assets (not risk-weighted). For top-rated holding companies, the minimum leverage ratio is 3%, but lower-rated companies may be required to meet substantially greater minimum ratios. Our subsidiary banks are subject to capital requirements similar to the capital requirements applicable at the holding company level described above. Our bank's capital requirements have been promulgated by their primary federal regulator, the OCC. It is widely anticipated that prevailing capital guidelines will be strengthened by the regulatory authorities in upcoming years.
Under applicable law, federal banking regulators are required to take prompt corrective action with respect to depository institutions that do not meet minimum capital requirements. The regulators have established five capital classifications for banking institutions, the highest being "well-capitalized." Our holding company and both of our subsidiary banks currently qualify as
“
well-capitalized.
”
Under regulations adopted by the federal bank regulators, a banking institution is considered "well-capitalized" if it has a total risk-adjusted capital ratio of 10% or greater, a Tier 1 risk-adjusted capital ratio of 6% or greater and a leverage ratio of 5% or greater and is not subject to any regulatory order or written directive regarding capital maintenance. The year-end 2011 capital ratios of our holding company and our banks are set forth in Part II, Item 7.E. "Capital Resources and Dividends" and in Note 13
“
Regulatory Matters
”
to the consolidated financial statements under Part II, Item 8 of this Report.
A holding company's ability to pay dividends or repurchase its outstanding stock, as well as its ability to expand its business through acquisitions of additional banking organizations or permitted non-bank companies, may be restricted if its capital falls below
#
7
these minimum capitalization ratios or fails to meet other informal capital guidelines that the regulators may apply from time-to-time to specific banking organizations. In addition to these potential regulatory limitations on payment of dividends, our holding company
'
s ability to pay dividends to our shareholders, and our subsidiary banks
'
ability to pay dividends to our holding company are also subject to various restrictions under applicable corporate laws, including banking laws (affecting our subsidiary banks) and the New York Business Corporation Law (affecting our holding company). The ability of our holding company and banks to pay dividends in the future is, and is expected to continue to be, influenced by regulatory policies, capital guidelines and applicable law.
In cases where banking regulators have significant concerns regarding the financial condition, assets or operations of a bank or bank holding company, the regulators may take enforcement action or impose enforcement orders, formal or informal, against the organization. If the leverage ratio (Tier 1 risk-adjusted capital to total tangible assets ratio) of a bank falls below 2%, the bank may be closed and placed in receivership, with the FDIC as receiver.
The current risk-based capital guidelines that apply to Arrow are based on the 1988 capital accord of the International Basel Committee on Banking Supervision, a committee of central banks and bank supervisors, as implemented by U.S. federal banking agencies. In 2008, these federal banking agencies began to phase-in capital standards based on a second capital accord, referred to as Basel II, for large or "core" international banks (total assets of $250 billion or more or consolidated foreign exposures of $10 billion or more). Basel II emphasizes internal assessment of credit, market and operational risk, as well as supervisory assessment and market discipline in determining minimum capital requirements. On September 12, 2010, the Group of Governors and Heads of Supervision, the oversight body of the Basel Committee, announced agreement on the calibration and phase-in arrangements for a strengthened set of capital requirements, known as Basel III. For more information on the Basel III standards, see Item 7, “Management's Discussion and Analysis of Financial Condition and Results of Operations,” Section D, “Liquidity” and Section E, “Capital Resources and Dividends.”
Anti-Money Laundering and OFAC
Under federal law, financial institutions must maintain anti-money laundering programs that include established internal policies, procedures, and controls. Financial institutions are also prohibited from entering into specified financial transactions and account relationships and must meet enhanced standards for due diligence and customer identification. Financial institutions must take reasonable steps to conduct enhanced scrutiny of account relationships to guard against money laundering and to report any suspicious transactions. Law enforcement authorities have been granted increased access to financial information maintained by financial institutions. Bank regulators routinely examine institutions for compliance with these obligations and they must consider an institution's compliance in connection with the regulatory review of applications, including applications for banking mergers and acquisitions. The U.S. Department of the Treasury's Office of Foreign Assets Control, or "OFAC," is responsible for helping to insure that U.S. entities do not engage in transactions with certain prohibited parties, as defined by various Executive Orders and Acts of Congress. OFAC publishes lists of persons, organizations, and countries suspected of aiding, harboring or engaging in terrorist acts, known as Specially Designated Nationals and Blocked Persons. If Arrow finds a name on any transaction, account or wire transfer that is on an OFAC list, Arrow must freeze or block such account or transaction, file a suspicious activity report and notify the appropriate authorities.
Reserve Requirements
Pursuant to regulations of the FRB, all banking organizations are required to maintain average daily reserves at mandated ratios against their transaction accounts and certain other types of deposit accounts. These reserves must be maintained in the form of vault cash or in an account at a Federal Reserve Bank.
Community Reinvestment Act
Each of Arrow's subsidiary banks are subject to the Community Reinvestment Act (“CRA”) and implementing regulations. CRA regulations establish the framework and criteria by which the bank regulatory agencies assess an institution's record of helping to meet the credit needs of its community, including low and moderate-income neighborhoods. CRA ratings are taken into account by regulators in reviewing certain applications made by Arrow and its bank subsidiaries.
D. RECENT LEGISLATIVE DEVELOPMENTS
As a result of the recent financial crisis that significantly damaged the economy and the financial sector of the United States, the U.S. Congress passed, and the President signed, the Dodd-Frank Act on July 21, 2010. In addition to making other significant legal and regulatory reforms, Dodd-Frank established a new regulatory body known as the Bureau of Consumer Financial Protection (the Bureau), which will operate as an independent entity within the Federal Reserve System and is authorized to issue rules for consumer protection, some of which likely will significantly restrain banks
'
flexibility and profitability. Dodd-Frank also directs the federal banking authorities to issue new capital requirements for banks and holding companies which must be at least as strict as the existing capital requirements for such institutions and may be much more onerous. Of particular importance to bank holding companies like ours, Dodd-Frank provides that any issuances of trust preferred securities on or after May 19, 2010, by bank holding companies with total assets between $500 million and $15 billion will no longer qualify as Tier 1 capital. Dodd-Frank is discussed further below.
#
8
There are several other federal laws enacted since the start of the financial crisis that affect financial institutions like us, as well as other recently-enacted banking laws that continue to significantly impact our operations. These various statutes, as well as Dodd-Frank, are discussed briefly below.
The Dodd-Frank Act
The Dodd-Frank Act, enacted in July 2010, includes many provisions affecting the banking and financial services industries, including our Company. Among other things, Dodd-Frank:
|
•
|
Gives new powers to the Board of Governors of the Federal Reserve System
|
|
▪
|
The Fed is charged with monitoring the systemic safety of the financial system and directed to take proactive steps to reduce or eliminate threats to the system.
|
|
•
|
Creates a new Federal banking agency, the Consumer Financial Protection Bureau, with broad powers.
|
|
▪
|
The Bureau will write and issue new consumer protection rules. For depository institutions with $10 billion or less in assets (such as Arrow's banks), the banks' traditional regulatory agencies (for our banks, the OCC), and not the Bureau, will have primary examination and enforcement authority over the banks' compliance with new Bureau rules as well as all other rules and regulations. However, the Bureau will have the right to include its examiners on a "sampling" basis in examinations conducted by the traditional regulators and will be authorized to give those agencies input and recommendations with respect to consumer protection laws and to require reports and other examination documents.
|
|
▪
|
The Bureau will have broad authority to curb practices it finds to be unfair, deceptive and abusive. What constitutes "abusive" behavior may be very broadly defined and is very likely to create an environment conducive to increased litigation. This is likely to be exacerbated by the fact that, in addition to the Federal authorities charged with enforcing the Bureau's rules, State Attorneys General are also authorized to enforce those Federal consumer laws transferred to the Bureau and the rules issued by the Bureau thereunder.
|
|
▪
|
The activities of the Bureau will be monitored by a Bureau Oversight Council, which is charged with the duty of considering the potential benefits and costs for financial institutions and consumers of any Bureau-proposed regulation and to consider and address any objections from other Federal regulators. However, the Oversight Council will not have authority to set aside a Bureau regulation except in very limited circumstances.
|
|
•
|
Limits current Federal preemption standards for national banks (such as our banks), that is, the Act reduces the extent to which state law is preempted by Federal law with regard to the operation of national banks. Specifically, Dodd-Frank increases the potential for State intervention in the operations of national banks and other Federally chartered depository institutions by creating new procedural hurdles to preemption determinations while also potentially narrowing the circumstances in which preemption would apply. Moreover, the Act provides statutory authority for State law enforcement authorities with respect to Federally chartered depository institutions.
|
|
•
|
Makes the $250,000 limit for federal deposit insurance permanent by statute; provides unlimited federal deposit insurance until December 31, 2012 for non-interest bearing demand transaction accounts at all insured depository institutions; and repeals the federal prohibitions on the payment of interest on demand deposits, thereby permitting depository institutions to pay interest on business transaction and other accounts.
|
|
•
|
Expands interstate branching authority for national and state banks.
|
|
•
|
Directs Federal bank regulators to develop specific capital requirements for holding companies and depository institutions that address activities that pose risk to the financial system, such as significant activities in higher risk areas, or concentrations in assets whose reported values are based on models.
|
|
•
|
Requires the OCC to seek to make its capital requirements for national banks countercyclical so that capital requirements increase in times of economic expansion and decrease in times of economic contraction.
|
|
•
|
Enhances the authority of the Fed to examine non-bank subsidiaries, such as mortgage affiliates, and also gives other bank regulators the opportunity to examine and take enforcement action against such entities.
|
|
•
|
Establishes a statutory source of strength requirement for both bank and savings and loan holding companies (thereby enabling the Fed to compel a holding company to contribute additional capital to its subsidiary banks, if the banks are undercapitalized and if the holding company possesses such capital.
|
|
•
|
Expands the coverage of Section 23A of the FRA to take account of the credit exposure related to additional transactions, including derivatives transactions, along with other additional restrictions under Section 23A.
|
|
•
|
Requires mortgage originators to act in the best interests of a consumer, and seeks to ensure that a consumer will have the capacity to repay a loan that the consumer enters into.
|
|
•
|
Mandates comprehensive additional residential mortgage loan related disclosures.
|
|
•
|
Requires mortgage loan securitizers to retain a certain amount of risk (as established by the regulatory agencies). However, mortgages that conform to the new regulatory standards as "qualified residential mortgages" will not be subject to risk retention requirements.
|
#
9
Implementation of the Act will require dozens of new mandatory and discretionary rulemakings by numerous Federal regulatory agencies over the next several years. As a result, bank holding companies are likely to be faced with thousands of new pages of regulations not to mention increased litigation risk. While many of the provisions contained in Dodd-Frank are already effective, many have delayed effective dates that have not yet been reached, which, in some cases, may be subject to considerable delay and deferral.
Earlier Federal Laws Responding to Financial Crisis
.
Federal laws enacted in 2008 addressing the financial crisis included The Emergency Economic Stabilization Act of 2008 (EESA) and the American Recovery and Reinvestment Act of 2008 (ARRA) and related governmental programs, such as the FDIC's Temporary Liquidity Guarantee Program (TLGP) and the U.S. Treasury's Capital Purchase Program (CPP), a component of the Troubled Asset Relief Program (TARP). In late 2008, the FDIC adopted the TLGP to boost consumer confidence in funds deposited with insured institutions. Among other things, the TLGP allowed insured institutions to participate in a program providing additional deposit insurance; specifically, full coverage of noninterest-bearing accounts through December 31, 2009 (later extended to run through December 31, 2010) at a cost of an additional 10 cents per $100 of additional insured deposits. We elected to participate in the program in 2009, at a cost to us for the additional deposit insurance of $18 thousand. We opted out of this program when it was extended in 2010.
Arrow was preliminarily approved by the U.S. Treasury Department to participate in the CPP program (part of TARP). However, in January 2009, we announced that we would not participate in the CPP due to our strong financial and liquidity positions. See Item 7, Management
'
s Discussion and Analysis of Financial Condition and Results of Operations, page 21.
In addition, as part of the legislative response to the current financial crisis, various other Federal bills have been introduced in the U.S. Congress that would significantly affect banks. We cannot estimate the likelihood of any currently proposed banking bills being enacted into law, or the ultimate effect that any such potential legislation, if enacted, would have upon our financial condition or operations.
Health Care Reform
In March 2010, comprehensive federal health care reform legislation was passed under the Patient Protection and Affordable Care Act, as amended by the Health Care and Education Reconciliation Act of 2010 (collectively, the "Act"). Included among the major provisions of the Act, is a change in tax treatment of the federal drug subsidy paid with respect to eligible retirees. The Act contains provisions that may impact the Company
'
s accounting for some of its benefit plans in future periods by increasing the expense associated with these plans, but at this point, we do not expect that the impact will be material. The exact extent of the Act
'
s impact cannot be determined until final regulations are promulgated and additional interpretations become available. The Company will continue to monitor the effect of the Act.
Other Recently-Enacted Federal Laws Affecting Banks Like Ours, 2001-2005
The Bankruptcy Abuse Prevention and Consumer Protection Act of 2005 became effective October 17, 2005. The Act addressed many areas of bankruptcy practice, including consumer bankruptcy, general and small business bankruptcy, treatment of tax claims in bankruptcy, ancillary and cross-border cases, financial contract protection amendments to Chapter 12 governing family farmer reorganization, and special protection for patients of a health care business filing for bankruptcy. This Act did not have a significant impact on our earnings or on our efforts to recover collateral on secured loans.
The Sarbanes-Oxley Act, signed into law on July 30, 2002, adopted a number of measures having a significant impact on all publicly-traded companies, including Arrow. Generally, the Act sought to improve the quality of financial reporting of these companies by compelling them to adopt good corporate governance practices and by strengthening the independence of their auditors. The Act placed substantial additional duties on directors, officers, auditors and attorneys of public companies. Among other specific measures, the Act required that chief executive officers and chief financial officers certify to the SEC in the holding company
'
s annual and quarterly reports filed with the SEC regarding the accuracy of its financial statements contained therein and the integrity of its internal controls. The Act also accelerated insiders' reporting requirements for transactions in company securities, restricted certain executive officer and director transactions, imposed obligations on corporate audit committees, and provided for enhanced review of company filings by the SEC. As part of the general effort to improve public company auditing, the Act places limits on consulting services that may be performed by a company's independent auditors by requiring that the company
'
s Audit Committee of the Board of Directors evaluate amounts to determine independence. The Act created a federal public company accounting oversight board (the PCAOB) to set auditing standards, inspect registered public accounting firms, and exercise enforcement powers, subject to oversight by the SEC.
In the wake of the Sarbanes-Oxley Act, the nation
'
s stock exchanges, including the exchange on which Arrow
'
s stock is listed, the National Association of Securities Dealers, Inc. (
“
NASD
”
) promulgated a wide array of governance standards that must be followed by listed companies. The NASD standards include having a Board of Directors the majority of whose members are independent of management, and having audit, compensation and nomination committees of the Board consisting exclusively of independent directors. We have implemented a variety of corporate governance measures and procedures to comply with Sarbanes-Oxley and the amended NASD listing requirements, although we have always relied on a Board of Directors a majority of whose members are independent and independent Board committees to make important decisions regarding the Company.
The USA Patriot Act initially adopted in 2001 and re-adopted by the U.S. Congress in 2006 with certain changes (the
“
Patriot Act
”
), imposes substantial record-keeping and due diligence obligations on banks and other financial institutions, with a particular focus on detecting and reporting money-laundering transactions involving domestic or international customers. The U.S. Treasury
#
10
Department has issued and will continue to issue regulations clarifying the Patriot Act's requirements. The Patriot Act requires all financial institutions, including banks, to maintain certain anti-money laundering compliance and due diligence programs. The provisions of the Act impose substantial costs on all financial institutions, including ours.
Recent Changes in Deposit Insurance Laws and Regulations
The FDIC collects both insurance premiums on insured deposits and an assessment for the Financing Corporation (FICO) bonds.
FICO Assessments
. The FICO was established by the Competitive Equality Banking Act of 1987, as a mixed-ownership government corporation whose sole purpose was to issue bonds to insure thrift institutions. In the subsequent two years, FICO issued 30-year noncallable bonds in an aggregate principal amount of approximately $8.1 billion, maturing in 2017 through 2019. FICO has assessment authority, separate from the FDIC's authority to assess risk-based premiums for deposit insurance, to collect funds from all FDIC-insured institutions sufficient to pay interest on FICO bonds. The FDIC acts as collection agent for the FICO. Since the first quarter of 2000, all FDIC-insured deposits have been assessed at the same rate by FICO. For 2011, our FICO assessment was $160 thousand.
FDIC Deposit Premiums
. In recent years, the FDIC has made several modifications to its deposit insurance premium structure, the most important of which was to calibrate premiums based on the total assets (versus total deposits) of insured institutions. This has tended to benefit smaller regional banks such as ours, that typically maintain a higher ratio of deposits to total assets than the large, money-center banks. In 2007, after a several year period in which banks were charged no or very low premiums for deposit insurance, the FDIC resumed charging financial institutions an FDIC deposit insurance premium, under a new risk-based assessment system. Under this system, institutions in Risk Category I (the lowest of four risk categories) paid a rate (based on a formula) of 5 to 7 cents per $100 of assessable deposits. During 2008, both of our banks qualified for the 5 cent per $100 assessment rate.
The Federal Deposit Insurance Reform Act of 2005 allowed "eligible insured depository institutions" to share a one-time assessment credit pool of approximately $4.7 billion. Our credit amounted to $747 thousand. The credit was available to offset FDIC insurance premiums beginning in 2007, but not to offset the FICO bond assessment. The one-time credit fully offset our FDIC insurance premiums for 2008 and offset approximately $134 thousand of our $637 thousand 2008 FDIC premiums.
In 2008, in response to a growing level of claims against the Bank Insurance Fund, resulting from the first stages of the financial crisis, the FDIC announced that it would raise the lowest rate from 5 cents to 12 cents per $100 of assessable deposits, which increase remained in effect through 2009. In addition, beginning with the second quarter of 2009, the FDIC added four new factors to the assessment rate calculation, including factors for brokered deposits, secured liabilities and unsecured liabilities.
In 2009, in light of extraordinary demands on the FDIC's insurance fund, the FDIC imposed a special assessment on all insured institutions, including our banks, at .05% of total assets as adjusted for Tier 1 capital. We charged $787 thousand to earnings in the second quarter of 2009 for this assessment, which was paid on September 30, 2009. In the fourth quarter of 2009, the FDIC collected prepaid assessments for the fourth quarter of 2009 and for all of 2010, 2011 and 2012. Our prepaid assessment amounted to $6.8 million. The expense is being ratably recorded over the respective periods as directed by the FDIC.
In February of 2011, the FDIC finalized a new assessment system that took effect in the second quarter of 2011. The final rule changed the assessment base from domestic deposits to average assets minus average tangible equity, adopted a new large-bank pricing assessment scheme, and set a target size for the Deposit Insurance Fund. The changes went into effect in the second quarter of 2011. The rule (as mandated by Dodd-Frank) finalizes a target size for the Deposit Insurance Fund at 2% of insured deposits. It also implements a lower assessment rate schedule when the fund reaches 1.15% (so that the average rate over time should be about 8.5 basis points) and, in lieu of dividends, provides for a lower rate schedule when the reserve ratio reaches 2% and 2.5%. Also as mandated by Dodd-Frank, the rule changes the assessment base from adjusted domestic deposits to a bank
'
s average consolidated total assets minus average tangible equity. The new assessment system significantly lowered our FDIC insurance assessments in 2011, which decrease by over 48% from the first quarter of 2011 and 2012.
We are unable to predict whether or to what extent the FDIC may elect to impose additional special assessments on insured institutions in upcoming years, although it is commonly understood that the FDIC insurance fund may not be adequate if bank failures continue at significant levels for any significant period of time and/or the cost to the FDIC of the bank failures recently resolved by it should prove even greater than was initially anticipated.
E. STATISTICAL DISCLOSURE
–
(GUIDE 3)
Set forth below is an index identifying the location in this Report of various items of statistical information required to be included in this Report by the SEC
’
s industry guide for Bank Holding Companies.
|
Required Information
|
Location in Report
|
|
Distribution of Assets, Liabilities and Stockholders' Equity; Interest Rates and Interest Differential
|
|
|
Investment Portfolio
|
|
|
Loan Portfolio
|
|
|
Summary of Loan Loss Experience
|
|
|
Deposits
|
|
|
Return on Equity and Assets
|
|
|
Short-Term Borrowings
|
|
#
11
F. COMPETITION
We face intense competition in all markets we serve. Traditional competitors are other local commercial banks, savings banks, savings and loan institutions and credit unions, as well as local offices of major regional and money center banks. Like all banks, we encounter strong competition in mortgage lending from a wide variety of other mortgage originators, all of whom are principally affected in this business by the rate and terms set, and the lending practices established by the very large and growing government supported entities “Fannie Mae” and “Freddie Mac,” who purchase and/or guarantee a very substantial dollar amount and number of mortgage loans, which in
2011
accounted for a large majority of the total amount of mortgage loans extended in the U.S. Additionally, non-banking financial organizations, such as consumer finance companies, insurance companies, securities firms, money market and mutual funds and credit card companies offer substantive equivalents of the various other types of loan and financial products and transactional accounts that we offer, even though these non-banking organizations are not subject to the same regulatory restrictions and capital requirements that apply to us. Under federal banking laws, such non-banking financial organizations not only may offer products comparable to those offered by commercial banks, but also may establish or acquire their own commercial banks.
G. EXECUTIVE OFFICERS OF THE REGISTRANT
The names and ages of the executive officers of Arrow and positions held by each are presented in the following table. Officers are elected annually by the Board of Directors.
|
Name
|
Age
|
Positions Held and Years from Which Held
|
|
Thomas L. Hoy
|
63
|
Chairman, President and Chief Executive Officer of Arrow since 2004, President since 1996, Chief Executive Officer since 1997, and President of Glens Falls National Bank and Trust Company ("GFNB") from 1995 to June 2011. Mr. Hoy has been a Director of Arrow since 1996 and a Director of GFNB since 1994. Mr. Hoy has been with the Company since 1974.
|
|
Thomas J. Murphy
|
53
|
Senior Executive Vice President and President of GFNB since July 1, 2011. Mr. Murphy has also served as Corporate Secretary since 2009, Senior Trust Officer of GFNB since 2010 and Cashier of GFNB since 2009. Mr. Murphy became a Vice President of Arrow beginning in 2009. Mr. Murphy previously served as Assistant Corporate Secretary of Arrow (2008-2009), Senior Vice President of GFNB (2008-2011) and Manager of the Personal Trust Department of GFNB (2004-2011). Mr. Murphy started with the Company in 2004.
|
|
Terry R. Goodemote
|
48
|
Executive Vice President and Senior Executive Vice President of GFNB since July 1, 2011. Mr. Goodemote previously served as our Senior Vice President, Treasurer and Chief Financial Officer and as the Executive Vice President, Treasurer and Chief Financial Officer of GFNB since 2008. Mr. Goodemote was first appointed Chief Financial Officer and Treasurer of Arrow and GFNB on January 1, 2007. Prior to becoming Chief Financial Officer, Mr. Goodemote served as Senior Vice President and Head of the Accounting Division of GFNB. Mr. Goodemote started with the Company in 1992.
|
|
David S. DeMarco
|
50
|
Senior Vice President since May 1, 2009. Mr. DeMarco also has served as our Executive Vice President and Head of the Branch, Corporate Development, Financial Services & Marketing Division of GFNB since January 1, 2003. Mr. DeMarco started with the Company in 1987.
|
|
Raymond F. O
’
Conor
|
56
|
Senior Vice President since May 1, 2009. Mr. O'Conor also has served as the Chairman, President and Chief Executive Officer of Saratoga National Bank and Trust Company ("SNB") since April 2007. Prior to that, Mr. O'Conor was President and CEO of SNB since January 1, 1996. Mr. O'Conor started with the Company in 1985.
|
H. AVAILABLE INFORMATION
Our Internet address is
www.arrowfinancial.com
. We make available free of charge on or through our Internet website our annual report on Form 10-K, quarterly reports on Form 10-Q, current reports on Form 8-K, and amendments to those reports as soon as practicable after we file or furnish them with the SEC pursuant to the Exchange Act. We also make available on the internet website various other documents related to corporate operations, including our Corporate Governance Guidelines, the charters of our principal board committees, and our codes of ethics. We have adopted a financial code of ethics that applies to Arrow
’
s chief executive officer, chief financial officer and principal accounting officer and a business code of ethics that applies to all directors, officers and employees.
#
12
Item 1A.
Risk Factors
Our financial results and the market price of our stock in future periods are subject to risks arising from many factors, including the following: (Please note that the discussions below regarding potential impact on Arrow of certain of these factors that may develop in the future are not meant to provide predictions by Arrow's management that such factors will develop, but to acknowledge the possible impact that could occur if the factors do develop.)
Difficult market conditions have adversely affected the financial services industry
. For many financial institutions, dramatic declines in the U.S. housing market over the past three years, with falling home prices and increasing foreclosures and unemployment, have negatively impacted the credit performance of real estate related loans and resulted in significant write-downs of asset values. To date, the impact of these adverse market conditions has been less significant on Arrow than it has been on many other U.S. financial institutions. Write-downs at many of these other institutions, initially of asset-backed securities but spreading to other securities and loans, have caused a number of those institutions to seek additional capital, to reduce or eliminate dividends, to merge with larger and stronger institutions and, in some cases, to fail. Reflecting concern about the stability of the financial markets generally and the strength of counterparties, many lenders and institutional investors have reduced or ceased providing funding to borrowers, including to other financial institutions. Generally, in the financial services sector, this market turmoil and tightening of credit have led to an increased level of commercial and consumer delinquencies at many institutions, lack of consumer confidence, increased market volatility and widespread reduction of business activity. Although this turmoil has affected Arrow and our local markets less than certain other institutions and markets, the resulting economic pressure on consumers and lack of confidence in the financial markets has already, to some extent, adversely affected our business, financial condition and results of operations. Market developments may continue to negatively affect consumer confidence levels and demand for loans, and may cause adverse changes in payment patterns, causing increases in delinquencies and default rates, which may increase our charge-offs and provision for credit losses. A worsening of these conditions would likely exacerbate the adverse effects of these difficult market conditions on Arrow and others in the financial institutions industry.
We may be adversely affected by new and enhanced government regulation, especially the new rules promulgated under the Dodd-Frank Act.
Even before the recent financial crisis and the new banking laws and regulations resulting therefrom, including the Dodd-Frank Act, we were subject to extensive Federal and state banking regulations and supervision. Banking regulations are intended primarily to protect our depositors
'
funds and the Federal deposit insurance funds, not the Company
'
s shareholders. Regulatory requirements affect our lending practices, capital structure, investment practices, dividend policy and growth. Failure to meet minimum capital requirements could result in the imposition of limitations on our operations that would adversely impact our profitability and could, if capital levels dropped significantly, result in our being required to cease or scale back our operations or raise capital at inopportune times or unsatisfactory prices. On top of the preexisting regulatory structure, the recent changes in governing law, regulations and regulatory practices have already imposed, and likely will continue to impose, substantial additional costs on us and thereby hurt our revenues and profitability. Dodd-Frank has already required us to adopt substantial additional practices and procedures in the normal day-to-day operation of our business, and many of the new and most onerous rules and regulations required by Dodd-Frank, including new capital requirements that may be substantially enhanced from the current requirements, have not yet been implemented or in some cases even proposed. In many case, even the general structure of the new regulations required to be issued under Dodd-Frank is unclear. This uncertainty is a concern. At this time, it is difficult to predict the extent to which the Dodd-Frank or the resulting regulations and rules may adversely impact the Company. It is reasonably certain, however, that Dodd-Frank will increase our costs, require us to modify certain strategies and business operations, and require us to revise our capital and liquidity structures, which, individually or collectively, may very well have a material adverse impact on our financial condition.
If economic conditions, already weak, should worsen and the U.S. experiences a prolonged economic slump, the Company
'
s allowance for loan losses may not be adequate to cover actual losses.
Like all financial institutions, we maintain an allowance for loan losses to provide for probable loan losses at the balance sheet date. Our allowance for loan losses is based on our historical loss experience as well as an evaluation of the risks associated with our loan portfolio, including the size and composition of the portfolio, current economic conditions and geographic concentrations within the portfolio and other factors. If the economy in our geographic market area, northeastern region of New York State, should deteriorate or enter into a prolonged state of recession, this may have an additional adverse impact on our loan portfolio. If the quality of our portfolio should weaken due to this impact, our allowance for loan losses may not be adequate to cover actual loan losses, and future enhanced provisions for loan losses could materially and adversely affect financial results. Moreover, loan portfolio difficulties often accompany difficulties in other areas of our business, including growth of our business generally, thereby compounding the negative effects on earnings.
#
13
A sustained and/or significant increase in domestic interest rates could negatively affect the Company
'
s net interest income.
An institution
'
s net interest income is significantly affected by market rates of interest, including short-term and long-term rates and the relationship between the two. Interest rates are highly sensitive to many factors, which are beyond our control, including general economic conditions, policies of various governmental and regulatory agencies such as the Federal Reserve Board, and actions taken by foreign central banks. Like all financial institutions, the Company
'
s balance sheet is affected by fluctuations in interest rates. Although both short- and long-term interest rates have remained at very low levels for the past several years, and the Federal Reserve has recently announced that its goal is to keep rates in the U.S. at these low levels at least through 2014, there is a widespread concern that the rapid growth in the money supply, another development actively promoted by the Federal Reserve and other central banks in the western world, will eventually lead to a surge in inflation in the U.S. and other developed nations, including in the cost of borrowed funds (i.e., interest rates). Any such development (i.e., a rising rate environment in the U.S. ) may negatively affect banks
'
profitability. See the discussion under
“
Changes in Net Interest Income Due to Rate,
”
on page 29 of this Report.
If economic conditions worsen significantly and the U.S. financial markets should suffer another downturn, the company may experience limited access to credit markets.
As discussed under Part I, Item 7.D.
“
Liquidity,
”
the Company has relationships with various third parties to provide overnight and longer-term credit arrangements. If and as these third parties may themselves have difficulty in accessing their own credit markets, we may, in turn, experience a decrease in our capacity to borrow funds from them or other third parties traditionally relied upon by banks for liquidity.
If the value of real estate in our market area were to suffer an additional material decline, a significant portion of our loan portfolio could become under-collateralized, which might have a material adverse effect on us.
In addition to considering the financial strength and cash flow characteristics of borrowers, we often secure loans with real estate collateral, which in each case provides an alternate source of repayment in the event of default by the borrower. If mortgaged real property deteriorates in value significantly during the time the credit is outstanding and we are required to liquidate the collateral securing a loan to satisfy the debt, our earnings and capital could be adversely affected. Furthermore, the possibility of legislative changes at the Federal or State level adversely impacting the ability of banks to protect themselves when loans begin to go bad, including through foreclosure proceedings, may result in negative impacts to those institutions.
If securities prices should significantly decline in upcoming periods, we likely will experience a reduction in income from fiduciary activities.
The most significant portion of the income we earn from managing assets in our fiduciary capacity is tied to the market value of those assets, i.e., investment securities. If stocks or other equity securities lose market value, in a sudden market crash as was experienced in 2008-2009, we may see our fiduciary income substantially reduced.
We are subject to the local economies where we operate, and unfavorable economic conditions in these areas could have a material adverse effect on our financial condition and results of operations.
Our success depends upon the growth in business activity, income levels and deposits in our geographic market area. Unpredictable and unfavorable economic conditions unique to our market area may have an adverse effect on the quality of our loan portfolio and financial performance. As a community bank, we are less able than our larger regional competitors to spread the risk of unfavorable local economic conditions over a larger market area. Although our market area (northeastern New York State) has not been severely damaged by the financial downturn of the past three years as many other areas of the U.S., this could change in future period if the U.S. economy generally continues to suffer. Moreover, we cannot give any assurances that we, as a single enterprise, will benefit from any unique and favorable economic conditions in our market area, even if they do occur.
Current levels of market volatility.
The market for certain investment securities, including mortgage-backed securities, has been highly volatile or inactive, and may not stabilize or resume in the near future. This volatility can result in significant fluctuation in the prices of those securities, some of which we hold in our investment portfolio, which could affect the results of our operations.
Changes in accounting standards may materially impact the company
'
s financial statements.
From time-to-time, the Financial Accounting Standards Board (
“
FASB
”
) changes the financial accounting and reporting standards that govern the preparation of our financial statements. These changes can be hard to predict and can materially impact how we record and report our financial condition and results of operations. In some cases, we may be required to apply a new or revised standard retroactively, resulting in changes to previously reported financial statements. Specifically, changes in the fair value of our financial assets could have a significant negative impact on our asset portfolios and indirectly on our capital levels
The Company
'
s business could suffer if it loses key personnel unexpectedly or fails to provide for an orderly management succession.
Our success depends, in large part, on our ability to retain our key personnel for the duration of their expected terms of service, and to arrange for an orderly succession of other, equally skilled personnel. Competition for the best people in our business can be intense. While our Board of Directors actively reviews succession plans, any sudden unexpected change at the senior management level may adversely affect our business.
The Company relies on other companies to provide key components of the company
'
s business infrastructure.
Third-party vendors provide key components of our business infrastructure such as Internet connections, network access and mutual fund distribution. These parties are beyond our control, and any problems caused or experienced by these third parties, including their not being able to continue to provide their services to us or performing such services poorly, could adversely affect our ability to deliver products and services to our customers and conduct our business.
#
14
The soundness of other financial institutions could adversely affect Arrow.
Our ability to engage in routine funding transactions could be adversely affected by the actions and commercial soundness of other financial institutions. Financial services institutions are interrelated as a result of trading, clearing, counterparty and other relationships. Arrow has exposure to many different counterparties, and we routinely execute transactions with counterparties in the financial industry, including brokers and dealers, other commercial banks, investment banks, mutual and hedge funds, and other financial institutions. As a result, defaults by, or even rumors or questions about, one or more financial services institutions, or the financial services industry generally, could lead to market-wide liquidity problems and losses or defaults by Arrow or by other institutions and organizations. Many of these transactions expose Arrow to credit risk in the event of default of our counterparty or client. In addition, Arrow
'
s credit risk may be exacerbated when the collateral held by Arrow cannot be liquidated or is liquidated at prices not sufficient to recover the full amount of the financial instrument exposure due Arrow. There is no assurance that any such losses would not materially and adversely affect our results of operations.
The Company faces continuing and growing security risks to its own information base and to information on its customers.
The computer systems and network infrastructure that we use are always vulnerable to unforeseen disruptions, including theft of confidential customer information (identity theft) and interruption of service as a result of fire, natural disasters, explosion, general infrastructure failure or cyber attacks. These disruptions may arise in our internally developed systems, the systems of our third- party service providers or originating from our consumer and business customers who access our systems from their networks or digital devices. Information security risks have increased significantly in recent years because of the increased use of the Internet and telecommunications technologies to conduct financial transactions using new digital devices. This risk is further enhanced due to the increased sophistication and activities of organized crime, hackers, terrorists and other disreputable parties. These cyber attacks and security breaches can occur through our customers' systems when connected to our network, or through retailers or other businesses where our customers use bank cards to purchase goods or services. We regularly assess and attempt to improve our security systems and disaster preparedness, including back-up systems, but the risks are substantially escalating. As a result, cybersecurity and the continued enhancement of our controls and processes to protect our systems, data and networks from attacks or unauthorized access remain a priority. Accordingly, we may be required to expend additional resources to enhance our protective measures or to investigate and remediate any information security vulnerabilities or exposures.
Our stock price may begin to reflect market volatility more closely than it has in the past.
Our stock price can fluctuate widely in response to a variety of factors, including: actual or anticipated variations in our operating results; recommendations by securities analysts; significant acquisitions or business combinations; operating and stock price performance of other companies that investors deem comparable to us; new technology used or services offered by our competitors; news reports relating to trends, concerns and other issues in the financial services industry; and changes in government regulations. Many of these factors that may adversely affect our stock price are less reflective of our particular condition or operating results than general market fluctuations, industry-wide factors or general economic or political conditions and events, including terrorist attacks, economic slowdowns or recessions, interest rate changes, credit loss trends or currency fluctuations.
|
Item 1B.
|
Unresolved Staff Comments
- None
|
|
Item 2.
|
Properties
|
Our main office is at 250 Glen Street, Glens Falls, New York. The building is owned by us and serves as the main office for Glens Falls National, our principal subsidiary. We own twenty-eight branch banking offices and lease seven others at market rates. We own two offices for our insurance operations and lease six others. We also lease office space in a building near our main office in Glens Falls.
In the opinion of management, the physical properties of our holding company and our subsidiary banks are suitable and adequate. For more information on our properties, see Notes 1, 5 and 19 to the Consolidated Financial Statements contained in Part II, Item 8 of this Report.
|
Item 3.
|
Legal Proceedings
|
We are not the subject of any material pending legal proceedings, other than ordinary routine litigation occurring in the normal course of our business. On an ongoing basis, we typically are the subject of or a party to various legal claims, which arise in the normal course of our business. The various legal claims currently pending against us will not, in the opinion of management based upon consultation with counsel, result in any material liability.
|
Item 4.
|
Mine Safety Disclosures -
None
|
#
15
|
Item 5.
|
Market for the Registrant's Common Equity,
Related Stockholder Matters and Issuer Purchases of Equity
|
Securities
The common stock of Arrow Financial Corporation is traded on the Global Select Market of the NASDAQ Stock Market
R
under the symbol AROW.
The high and low prices listed below represent actual sales transactions, as reported by NASDAQ. All stock prices and cash dividends per share have been restated to reflect subsequent stock dividends. On
September 29, 2011
, we distributed a 3% stock dividend on our outstanding shares of common stock.
|
2011
|
2010
|
||||||||||||||||||||||
|
Market Price
|
Cash Dividends Declared
|
Market Price
|
Cash Dividends Declared
|
||||||||||||||||||||
|
Low
|
High
|
Low
|
High
|
||||||||||||||||||||
|
First Quarter
|
$
|
21.93
|
|
$
|
27.27
|
|
$
|
0.243
|
|
$
|
22.37
|
|
$
|
26.12
|
|
$
|
0.236
|
|
|||||
|
Second Quarter
|
22.36
|
|
24.50
|
|
0.243
|
|
21.71
|
|
27.66
|
|
0.236
|
|
|||||||||||
|
Third Quarter
|
21.60
|
|
24.32
|
|
0.243
|
|
20.67
|
|
24.58
|
|
0.236
|
|
|||||||||||
|
Fourth Quarter
|
21.50
|
|
24.00
|
|
0.250
|
|
23.30
|
|
27.68
|
|
0.243
|
|
|||||||||||
The payment of cash dividends by Arrow is determined at the discretion of its Board of Directors and is dependent upon, among other things, our earnings, financial condition and other factors, including applicable legal and regulatory restrictions. See "Capital Resources and Dividends" in Part II, Item 7.E. of this Report.
There were approximately 6,843 holders of record of Arrow
’
s common stock at
December 31, 2011
. Arrow has no other class of stock outstanding.
Equity Compensation Plan Information
The following table sets forth certain information regarding Arrow's equity compensation plans as of December 31, 2011. These equity compensation plans were our 2008 Long-Term Incentive Plan ("Stock Plan"), our 2011 Employee Stock Purchase Plan ("ESPP") and our 2008 Directors' Stock Plan. All of these plans have been approved by Arrow's shareholders.
|
Plan Category
|
(a)
Number of Securities to be Issued Upon Exercise of Outstanding Options, Warrants and Rights
|
(b)
Weighted-Average
Exercise Price of Outstanding Options, Warrants and Rights
|
(c)
Number of Securities Remaining Available for Future Issuance Under Equity Compensation Plans (Excluding Securities Reflected in Column (a))
|
||||||
|
Equity Compensation Plans Approved by Security Holders
(1)(2)
|
473,435
|
|
$
|
22.90
|
|
651,600
|
|
||
|
Equity Compensation Plans Not Approved by Security Holders
|
—
|
|
—
|
|
—
|
|
|||
|
Total
|
473,435
|
|
$
|
22.90
|
|
651,600
|
|
||
|
(1)
|
All 473,435 shares are common stock issuable pursuant to outstanding stock options granted under the Stock Plan and predecessor long-term incentive plans.
|
|
(2)
|
The total of 651,600 shares includes 112,229 shares of common stock available for future award grants under the Stock Plan, 11,039 shares of common stock available for future issuance under the Directors
’
Stock Plan and 528,332 shares of common stock are available for future issuance under the ESPP.
|
#
16
STOCK PERFORMANCE GRAPHS
The following two graphs provide a comparison of the total cumulative return (assuming reinvestment of dividends) for the common stock of Arrow as compared to the Russell 2000 Index, the NASDAQ Banks Index and the Zacks $1B-$5B Bank Assets Index.
The historical information set forth below may not be indicative of the future results. The first graph presents the five-year period from December 31, 2006 to
December 31, 2011
and the second graph presents stock performance for the ten-year period from December 31, 2001 to
December 31, 2011
.
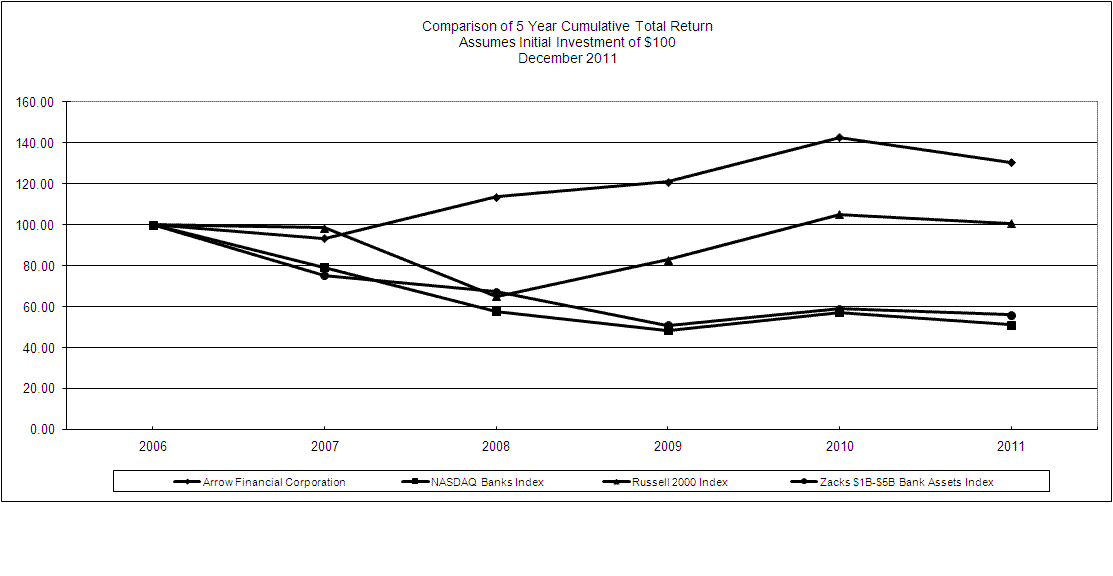
|
TOTAL RETURN PERFORMANCE
Period Ending
|
|||||||||||||||||
|
Index
|
2006
|
2007
|
2008
|
2009
|
2010
|
2011
|
|||||||||||
|
Arrow Financial Corporation
|
100.00
|
|
93.32
|
|
113.66
|
|
120.99
|
|
142.73
|
|
130.53
|
|
|||||
|
Russell 2000 Index
|
100.00
|
|
98.43
|
|
65.18
|
|
82.88
|
|
105.14
|
|
100.75
|
|
|||||
|
NASDAQ Banks Index
|
100.00
|
|
79.26
|
|
57.79
|
|
48.42
|
|
57.29
|
|
51.19
|
|
|||||
|
Zacks $1B - $5B Bank Assets Index
|
100.00
|
|
75.30
|
|
67.27
|
|
50.89
|
|
58.86
|
|
56.05
|
|
|||||
Source:
Zacks Investment Research, Inc., Chicago, IL. Copyright 2012. All rights reserved. Used with permission.
#
17
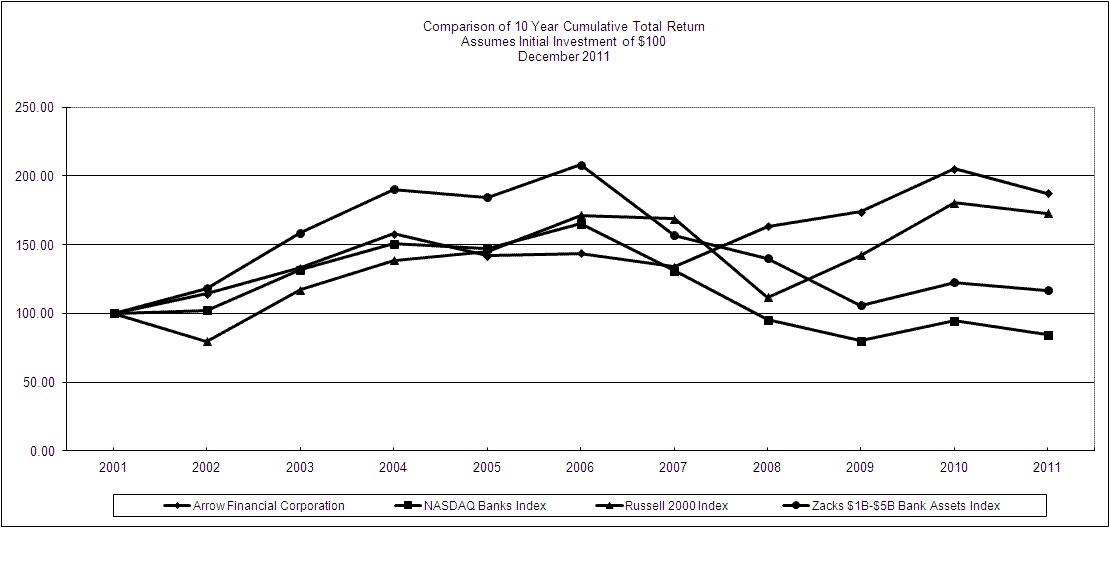
|
TOTAL RETURN PERFORMANCE
Period Ending
|
||||||||||||||||||||||||||||||||
|
Index
|
2001
|
2002
|
2003
|
2004
|
2005
|
2006
|
2007
|
2008
|
2009
|
2010
|
2011
|
|||||||||||||||||||||
|
Arrow Financial
Corporation
|
100.00
|
|
114.32
|
|
133.24
|
|
157.88
|
|
141.95
|
|
143.61
|
|
134.01
|
|
163.23
|
|
173.76
|
|
204.98
|
|
187.45
|
|
||||||||||
|
Russell 2000 Index
|
100.00
|
|
79.52
|
|
117.09
|
|
138.56
|
|
144.86
|
|
171.48
|
|
168.79
|
|
111.76
|
|
142.13
|
|
180.30
|
|
172.77
|
|
||||||||||
|
NASDAQ Banks
Index
|
100.00
|
|
102.37
|
|
131.69
|
|
150.71
|
|
147.24
|
|
165.24
|
|
130.97
|
|
95.50
|
|
80.02
|
|
94.66
|
|
84.59
|
|
||||||||||
|
Zacks $1B - $5B Bank
Assets Index
|
100.00
|
|
118.21
|
|
158.64
|
|
190.22
|
|
184.51
|
|
208.20
|
|
156.77
|
|
140.06
|
|
105.95
|
|
122.54
|
|
116.69
|
|
||||||||||
Source: Zacks Investment Research, Inc., Chicago, IL. Copyright 2012. All rights reserved. Used with permission.
The preceding stock performance graphs shall not be deemed incorporated by reference by virtue of any general statement incorporating by reference this Report into any filing under the Securities Act of 1933, as amended, or the Securities Exchange Act of 1934, as amended, except to the extent the company specifically incorporates this information by reference, and shall not otherwise be deemed filed as part of such other filings.
Unregistered Sales of Equity Securities
In connection with Arrow
'
s acquisition by merger in August 2011 of W. Joseph McPhillips, Inc. and McPhillips-Northern, Inc., two affiliated insurance agencies specializing in the sale of property and casualty insurance, Arrow issued at closing of the transactions to the agencies' shareholders, in exchange for all of their shares, a total of 90,744 shares, as adjusted for subsequent stock dividends, of its common stock and $116 thousand in cash. All Arrow shares thus issued to the shareholders were issued without registration under the Securities Act of 1933, as amended, in reliance upon the exemption for such registration set forth in Section 3(a)(11) of the Act and Rule 147 promulgated by the Securities and Exchange Commission thereunder. This exemption was available because all of the shareholders of the acquired agencies were New York residents and the acquired agencies were both New York corporations having substantially all of their assets and business operations in the State of New York.
In connection with Arrow
'
s acquisition by merger in February 2011 of Upstate Agency, Inc., an insurance agency specializing in the sale of property and casualty insurance, Arrow issued at closing of the transaction to the sole shareholder of Upstate, in exchange for all of his shares, a total of 134,778 shares, as adjusted for subsequent stock dividends, of its common stock and approximately $2.7 million in cash. The acquisition agreement also provided for possible post-closing payments of additional shares of Arrow's common stock to the former shareholder of Upstate, contingent upon the financial performance and business results of Upstate as a subsidiary of Arrow over the three-year period following the closing of the acquisition. The maximum potential value of the Arrow shares issuable under this provision is $274 thousand. All shares issued to the Upstate shareholder at the original closing and issuable to him in future post-closing payments were and will be issued without registration under the Securities Act of 1933, as amended, in reliance upon the exemption for such registration set forth in Section 3(a)(11) of the Act and Rule 147
#
18
promulgated by the Securities and Exchange Commission thereunder. This exemption was and remains available because at closing the sole shareholder of Upstate was a New York resident and Upstate was a New York corporation having substantially all of its assets and business operations in the State of New York.
In connection with Arrow
'
s acquisition by merger in April 2010 of Loomis & LaPann, Inc., an insurance agency specializing in the sale of property and casualty insurance, Arrow issued at closing of the transaction to the shareholders of Loomis, in exchange for all of their shares, a total of 27,838 shares, as adjusted for subsequent stock dividends, of its common stock. The acquisition agreement also provided for possible post-closing payments of additional shares of Arrow's common stock to the former shareholders of Loomis, contingent upon the financial performance and business results of Loomis as a subsidiary of Arrow over the three-year period following the closing of the acquisition. As a result of the financial performance of Loomis during the first year following the closing, Arrow issued to the former shareholders, in 2011, as post-closing consideration under this provision, 1,702 additional shares, as adjusted, of its common stock. The maximum remaining potential dollar value of Arrow stock issuable to the former shareholders of Loomis under this post-closing payment provision is $187 thousand. All shares issued to the Loomis shareholders at the original closing and after the first subsequent year, and all shares issuable to them in future post-closing payments, were and will be issued without registration under the Securities Act of 1933, as amended, in reliance upon the exemption for such registration set forth in Section 3(a)(11) of the Act and Rule 147 promulgated by the Securities and Exchange Commission thereunder. This exemption was and remains available because at closing all of the shareholders of Loomis were New York residents and Loomis was a New York corporation having substantially all of its assets and business operations in the State of New York.
Issuer Purchases of Equity Securities
The following table presents information about repurchases by us during the three months ended
December 31, 2011
of our common stock (our only class of equity securities registered pursuant to Section 12 of the Securities Exchange Act of 1934):
|
Fourth Quarter 2011
Calendar Month
|
Total Number of
Shares Purchased
1
|
Average Price Paid Per Share
1
|
Total Number of
Shares Purchased as
Part of Publicly
Announced
Plans or Programs
2
|
Maximum
Approximate Dollar
Value of Shares that
May Yet be
Purchased Under the
Plans or Programs
2
|
|||||||||
|
October
|
26,452
|
|
$
|
23.61
|
|
10,000
|
|
$
|
1,622,590
|
|
|||
|
November
|
46,632
|
|
22.68
|
|
40,000
|
|
695,690
|
|
|||||
|
December
|
45,380
|
|
23.37
|
|
24,236
|
|
120,570
|
|
|||||
|
Total
|
118,464
|
|
23.15
|
|
74,236
|
|
|||||||
1
The total number of shares purchased and the average price paid per share include shares purchased in open market transactions under the Arrow Financial Corporation Automatic Dividend Reinvestment Plan (the
“
DRIP
”
) by the administrator of the DRIP and shares surrendered or deemed surrendered to Arrow by holders of options to acquire Arrow common stock received by them under the stock plan in connection with the exercise of such options. In the months indicated, the listed number of shares purchased included the following numbers of shares purchased through such methods: October 2011 - DRIP purchases (2,811 shares), stock options (13,641 shares); November 2011
-
DRIP purchases (3,067 shares), stock options (3,565 shares); December 2011
-
DRIP purchases (21,069 shares), stock options (75 shares). Monthly DRIP purchases do not reflect any so-called
“
netting
”
transactions, that is, purchases effected within the DRIP itself by the DRIP administrator consisting of monthly acquisitions of shares on behalf of purchasing participants who are investing funds in the plan from selling participants who are withdrawing funds from the plan.
2
Includes only those shares acquired by Arrow pursuant to its publicly-announced stock repurchase programs; does not include shares purchased or subject to purchase under the DRIP or shares surrendered to Arrow upon exercise of options granted under any compensatory stock plans. Our only current publicly-announced stock repurchase program is the program approved by the Board of Directors and announced in November 2011 under which the Board authorized a twelve-month maximum cumulative purchase of $5 million in stock beginning on January 1, 2012. The plan replaced a similar prior stock repurchase plan approved by the Board and announced in April 2011. By December 31, 2011, Arrow had repurchased approximately $4.9 million of Arrow common stock under the repurchase program announced in April 2011.
#
19
|
Item 6.
|
Selected Financial Data
|
FIVE YEAR SUMMARY OF SELECTED DATA
Arrow Financial Corporation and Subsidiaries
(Dollars In Thousands, Except Per Share Data)
|
|
2011
|
2010
|
2009
|
2008
|
2007
|
||||||||||||||
|
Interest and Dividend Income
|
$
|
76,791
|
|
$
|
84,972
|
|
$
|
86,857
|
|
$
|
89,508
|
|
$
|
86,577
|
|
||||
|
Interest Expense
|
18,679
|
|
23,695
|
|
26,492
|
|
32,277
|
|
40,283
|
|
|||||||||
|
Net Interest Income
|
58,112
|
|
61,277
|
|
60,365
|
|
57,231
|
|
46,294
|
|
|||||||||
|
Provision for Loan Losses
|
845
|
|
1,302
|
|
1,783
|
|
1,671
|
|
513
|
|
|||||||||
|
Net Interest Income After Provision
for Loan Losses
|
57,267
|
|
59,975
|
|
58,582
|
|
55,560
|
|
45,781
|
|
|||||||||
|
Noninterest Income
|
23,133
|
|
17,582
|
|
19,235
|
|
15,886
|
|
16,288
|
|
|||||||||
|
Net Gains (Losses) on Securities Transactions
|
2,795
|
|
1,507
|
|
357
|
|
383
|
|
—
|
|
|||||||||
|
Noninterest Expense
|
(51,548
|
)
|
(47,418
|
)
|
(46,592
|
)
|
(42,393
|
)
|
(37,930
|
)
|
|||||||||
|
Income Before Provision for Income Taxes
|
31,647
|
|
31,646
|
|
31,582
|
|
29,436
|
|
24,139
|
|
|||||||||
|
Provision for Income Taxes
|
9,714
|
|
9,754
|
|
9,790
|
|
8,999
|
|
6,807
|
|
|||||||||
|
Net Income
|
$
|
21,933
|
|
$
|
21,892
|
|
$
|
21,792
|
|
$
|
20,437
|
|
$
|
17,332
|
|
||||
|
Per Common Share:
1
|
|||||||||||||||||||
|
Basic Earnings
|
$
|
1.87
|
|
$
|
1.89
|
|
$
|
1.88
|
|
$
|
1.77
|
|
$
|
1.48
|
|
||||
|
Diluted Earnings
|
1.87
|
|
1.88
|
|
1.88
|
|
1.76
|
|
1.47
|
|
|||||||||
|
Per Common Share:
1
|
|||||||||||||||||||
|
Cash Dividends
|
$
|
0.98
|
|
$
|
0.95
|
|
$
|
0.92
|
|
$
|
0.90
|
|
$
|
0.86
|
|
||||
|
Book Value
|
14.14
|
|
13.13
|
|
12.16
|
|
10.90
|
|
10.51
|
|
|||||||||
|
Tangible Book Value
2
|
11.87
|
|
11.65
|
|
10.72
|
|
9.49
|
|
9.09
|
|
|||||||||
|
|
|||||||||||||||||||
|
Total Assets
|
$
|
1,962,684
|
|
$
|
1,908,336
|
|
$
|
1,841,627
|
|
$
|
1,665,086
|
|
$
|
1,584,846
|
|
||||
|
Securities Available-for-Sale
|
556,538
|
|
517,364
|
|
437,706
|
|
315,414
|
|
328,496
|
|
|||||||||
|
Securities Held-to-Maturity
|
150,688
|
|
159,938
|
|
168,931
|
|
133,976
|
|
114,611
|
|
|||||||||
|
Loans
|
1,131,457
|
|
1,145,508
|
|
1,112,150
|
|
1,109,812
|
|
1,038,844
|
|
|||||||||
|
Nonperforming Assets
(3)
|
8,128
|
|
4,945
|
|
4,772
|
|
4,971
|
|
2,336
|
|
|||||||||
|
Deposits
|
1,644,046
|
|
1,534,004
|
|
1,443,566
|
|
1,275,063
|
|
1,204,200
|
|
|||||||||
|
Federal Home Loan Bank Advances
|
82,000
|
|
130,000
|
|
140,000
|
|
160,000
|
|
160,000
|
|
|||||||||
|
Other Borrowed Funds
|
46,293
|
|
73,214
|
|
93,908
|
|
79,956
|
|
73,719
|
|
|||||||||
|
Stockholders
’
Equity
|
166,385
|
|
152,259
|
|
140,818
|
|
125,802
|
|
122,256
|
|
|||||||||
|
Selected Key Ratios:
|
|||||||||||||||||||
|
Return on Average Assets
|
1.13
|
%
|
1.16
|
%
|
1.24
|
%
|
1.24
|
%
|
1.11
|
%
|
|||||||||
|
Return on Average Equity
|
13.45
|
|
14.56
|
|
16.16
|
|
16.26
|
|
14.68
|
|
|||||||||
|
Dividend Payout
4
|
52.41
|
|
50.53
|
|
48.94
|
|
51.14
|
|
58.50
|
|
|||||||||
1
Share and per share amounts have been adjusted for subsequent stock splits and dividends, including the most recent
September 2011 3% stock dividend.
2
Tangible book value excludes goodwill and other intangible assets from total equity.
3
Nonperforming assets consist of nonaccrual loans, loans past due 90 or more days but still accruing interest, repossessed assets, restructured loans, other real estate owned and nonaccrual investments.
4
Dividend Payout Ratio
–
cash dividends per share to fully diluted earnings per share.
#
20
|
Item 7.
|
Management's Discussion and Analysis of Financial Condition and Results of Operations
|
|
Selected Quarterly Information
Dollars in thousands, except per share amounts
Share and per share amounts have been restated for the September 2011 3% stock dividend
|
|||||||||||||||||||
|
Quarter Ended
|
12/31/2011
|
|
9/30/2011
|
|
6/30/2011
|
|
3/31/2011
|
|
12/31/2010
|
|
|||||||||
|
Net Income
|
$
|
5,431
|
|
$
|
5,372
|
|
$
|
5,849
|
|
$
|
5,281
|
|
$
|
5,188
|
|
||||
|
Transactions Recorded in Net Income (Net of Tax):
|
|
|
|
|
|
||||||||||||||
|
Net Gain on Securities Transactions
|
—
|
|
1,069
|
|
291
|
|
327
|
|
7
|
|
|||||||||
|
Net Gain on Sales of Loans
|
259
|
|
132
|
|
101
|
|
31
|
|
299
|
|
|||||||||
|
Prepayment Penalty on FHLB Advances
|
—
|
|
(989
|
)
|
—
|
|
—
|
|
—
|
|
|||||||||
|
Share and Per Share Data
:
|
|
|
|
|
|
||||||||||||||
|
Period End Shares Outstanding
|
11,763
|
|
11,796
|
|
11,696
|
|
11,745
|
|
11,593
|
|
|||||||||
|
Basic Average Shares Outstanding
|
11,782
|
|
11,754
|
|
11,729
|
|
11,675
|
|
11,576
|
|
|||||||||
|
Diluted Average Shares Outstanding
|
11,788
|
|
11,776
|
|
11,741
|
|
11,698
|
|
11,630
|
|
|||||||||
|
Basic Earnings Per Share
|
$
|
0.46
|
|
$
|
0.46
|
|
$
|
0.50
|
|
$
|
0.45
|
|
$
|
0.45
|
|
||||
|
Diluted Earnings Per Share
|
0.46
|
|
0.46
|
|
0.50
|
|
0.45
|
|
0.45
|
|
|||||||||
|
Cash Dividend Per Share
|
0.25
|
|
0.24
|
|
0.24
|
|
0.24
|
|
0.24
|
|
|||||||||
|
Selected Quarterly Average Balances
:
|
|
|
|
|
|
||||||||||||||
|
Interest-Bearing Deposits at Banks
|
$
|
49,101
|
|
$
|
32,855
|
|
$
|
31,937
|
|
$
|
35,772
|
|
$
|
76,263
|
|
||||
|
Investment Securities
|
674,338
|
|
646,542
|
|
697,796
|
|
683,839
|
|
672,071
|
|
|||||||||
|
Loans
|
1,126,452
|
|
1,119,384
|
|
1,128,006
|
|
1,130,539
|
|
1,147,889
|
|
|||||||||
|
Deposits
|
1,668,062
|
|
1,554,349
|
|
1,596,876
|
|
1,564,677
|
|
1,568,466
|
|
|||||||||
|
Other Borrowed Funds
|
101,997
|
|
164,850
|
|
179,989
|
|
193,960
|
|
223,425
|
|
|||||||||
|
Shareholders’ Equity
|
168,293
|
|
166,514
|
|
161,680
|
|
155,588
|
|
154,677
|
|
|||||||||
|
Total Assets
|
1,963,915
|
|
1,911,853
|
|
1,961,908
|
|
1,935,409
|
|
1,970,085
|
|
|||||||||
|
Return on Average Assets
|
1.10
|
%
|
1.11
|
%
|
1.20
|
%
|
1.11
|
%
|
1.04
|
%
|
|||||||||
|
Return on Average Equity
|
12.80
|
%
|
12.80
|
%
|
14.51
|
%
|
13.77
|
%
|
13.31
|
%
|
|||||||||
|
Return on Tangible Equity
1
|
15.22
|
%
|
15.19
|
%
|
17.16
|
%
|
16.07
|
%
|
14.97
|
%
|
|||||||||
|
Average Earning Assets
|
$
|
1,849,891
|
|
$
|
1,798,781
|
|
$
|
1,857,739
|
|
$
|
1,850,150
|
|
$
|
1,884,402
|
|
||||
|
Average Interest-Bearing Liabilities
|
1,547,071
|
|
1,487,923
|
|
1,559,014
|
|
1,546,849
|
|
1,579,765
|
|
|||||||||
|
Interest Income, Tax-Equivalent
|
19,179
|
|
19,884
|
|
20,500
|
|
20,822
|
|
21,554
|
|
|||||||||
|
Interest Expense
|
4,022
|
|
4,345
|
|
4,975
|
|
5,336
|
|
5,903
|
|
|||||||||
|
Net Interest Income, Tax-Equivalent
|
15,157
|
|
15,539
|
|
15,525
|
|
15,486
|
|
15,651
|
|
|||||||||
|
Tax-Equivalent Adjustment
|
832
|
|
887
|
|
944
|
|
931
|
|
908
|
|
|||||||||
|
Net Interest Margin
1
|
3.25
|
%
|
3.43
|
%
|
3.35
|
%
|
3.39
|
%
|
3.30
|
%
|
|||||||||
|
Efficiency Ratio Calculation
:
|
|
|
|
|
|
||||||||||||||
|
Noninterest Expense
|
$
|
12,455
|
|
$
|
14,603
|
|
$
|
12,171
|
|
$
|
12,319
|
|
$
|
11,770
|
|
||||
|
Less: Intangible Asset Amortization
|
(141
|
)
|
(136
|
)
|
(134
|
)
|
(100
|
)
|
(66
|
)
|
|||||||||
|
Prepayment Penalty on FHLB Advances
|
—
|
|
(1,638
|
)
|
—
|
|
—
|
|
—
|
|
|||||||||
|
Net Noninterest Expense
|
$
|
12,314
|
|
$
|
12,829
|
|
$
|
12,037
|
|
$
|
12,219
|
|
$
|
11,704
|
|
||||
|
Net Interest Income, Tax-Equivalent
|
$
|
15,157
|
|
$
|
15,539
|
|
$
|
15,525
|
|
$
|
15,485
|
|
$
|
15,651
|
|
||||
|
Noninterest Income
|
6,199
|
|
7,881
|
|
6,228
|
|
5,620
|
|
4,738
|
|
|||||||||
|
Less: Net Securities Gains
|
—
|
|
(1,771
|
)
|
(482
|
)
|
(542
|
)
|
(11
|
)
|
|||||||||
|
Net Gross Income, Adjusted
|
$
|
21,356
|
|
$
|
21,649
|
|
$
|
21,271
|
|
$
|
20,563
|
|
$
|
20,378
|
|
||||
|
Efficiency Ratio
|
57.66
|
%
|
59.26
|
%
|
56.59
|
%
|
59.42
|
%
|
57.43
|
%
|
|||||||||
|
Period-End Capital Information
:
|
|
|
|
|
|
||||||||||||||
|
Total Stockholders’ Equity (i.e. Book Value)
|
$
|
166,385
|
|
$
|
168,624
|
|
$
|
163,589
|
|
$
|
159,188
|
|
$
|
152,259
|
|
||||
|
Book Value per Share
|
14.14
|
|
14.29
|
|
13.99
|
|
13.55
|
|
13.13
|
|
|||||||||
|
Intangible Assets
|
26,752
|
|
26,788
|
|
25,044
|
|
24,900
|
|
17,241
|
|
|||||||||
|
Tangible Book Value per Share
1
|
11.87
|
|
12.02
|
|
11.85
|
|
11.43
|
|
11.65
|
|
|||||||||
|
Capital Ratios:
|
|
|
|
|
|
||||||||||||||
|
Tier 1 Leverage Ratio
|
8.95
|
%
|
9.10
|
%
|
8.67
|
%
|
8.66
|
%
|
8.53
|
%
|
|||||||||
|
Tier 1 Risk-Based Capital Ratio
|
14.71
|
%
|
15.06
|
%
|
14.76
|
%
|
14.37
|
%
|
14.50
|
%
|
|||||||||
|
Total Risk-Based Capital Ratio
|
15.96
|
%
|
16.31
|
%
|
16.02
|
%
|
15.63
|
%
|
15.75
|
%
|
|||||||||
|
Assets Under Trust Administration
and Investment Management
|
$
|
973,551
|
|
$
|
925,671
|
|
$
|
1,017,091
|
|
$
|
1,011,618
|
|
$
|
984,394
|
|
||||
1
S
ee "Use of Non-GAAP Financial Measures" on page 4.
#
21
|
Selected Twelve-Month Information
Dollars in thousands, except per share amounts
Share and per share amounts have been restated for the September 2011 3% stock dividend
|
|||||||||||
|
2011
|
2010
|
2009
|
|||||||||
|
Net Income
|
$
|
21,933
|
|
$
|
21,892
|
|
$
|
21,792
|
|
||
|
Transactions Recorded in Net Income (Net of Tax):
|
|||||||||||
|
Other-Than-Temporary Impairment (OTTI)
|
—
|
|
$
|
—
|
|
$
|
(227
|
)
|
|||
|
Net Securities Gains
|
1,688
|
|
910
|
|
216
|
|
|||||
|
Net Gains on Sales of Loans
|
523
|
|
618
|
|
252
|
|
|||||
|
Prepayment Penalty on FHLB Advances
|
(989
|
)
|
—
|
|
—
|
|
|||||
|
Income from Restitution Payment
|
—
|
|
—
|
|
272
|
|
|||||
|
Net Gain on Sale of Merchant Bank Card Processing
|
—
|
|
—
|
|
1,791
|
|
|||||
|
FDIC Special Assessment (see page 25)
|
—
|
|
—
|
|
(475
|
)
|
|||||
|
Period End Shares Outstanding
|
11,763
|
|
11,593
|
|
11,582
|
|
|||||
|
Basic Average Shares Outstanding
|
11,735
|
|
11,604
|
|
11,568
|
|
|||||
|
Diluted Average Shares Outstanding
|
11,747
|
|
11,639
|
|
11,620
|
|
|||||
|
Basic Earnings Per Share
|
$
|
1.87
|
|
$
|
1.89
|
|
$
|
1.88
|
|
||
|
Diluted Earnings Per Share
|
1.87
|
|
1.88
|
|
1.88
|
|
|||||
|
Cash Dividends Per Share
|
0.98
|
|
0.95
|
|
0.92
|
|
|||||
|
Average Assets
|
$
|
1,943,263
|
|
$
|
1,892,324
|
|
$
|
1,761,006
|
|
||
|
Average Equity
|
163,063
|
|
150,377
|
|
134,890
|
|
|||||
|
Return on Average Assets
|
1.13
|
%
|
1.16
|
%
|
1.24
|
%
|
|||||
|
Return on Average Equity
|
13.45
|
|
14.56
|
|
16.16
|
|
|||||
|
Average Earning Assets
|
$
|
1,839,028
|
|
$
|
1,807,763
|
|
$
|
1,688,454
|
|
||
|
Average Interest-Bearing Liabilities
|
1,535,084
|
|
1,512,937
|
|
1,410,022
|
|
|||||
|
Interest Income, Tax-Equivalent
1
|
80,385
|
|
88,424
|
|
90,038
|
|
|||||
|
Interest Expense
|
18,679
|
|
23,695
|
|
26,492
|
|
|||||
|
Net Interest Income, Tax-Equivalent
1
|
61,706
|
|
64,729
|
|
63,546
|
|
|||||
|
Tax-Equivalent Adjustment
|
3,594
|
|
3,452
|
|
3,181
|
|
|||||
|
Net Interest Margin
1
|
3.36
|
%
|
3.58
|
%
|
3.76
|
%
|
|||||
|
Efficiency Ratio Calculation
1
|
|||||||||||
|
Noninterest Expense
|
$
|
51,548
|
|
$
|
47,418
|
|
$
|
46,592
|
|
||
|
Less: Intangible Asset Amortization
|
(510
|
)
|
(271
|
)
|
(324
|
)
|
|||||
|
Prepayment Penalty on FHLB Advances
|
(1,638
|
)
|
—
|
|
—
|
|
|||||
|
Net Noninterest Expense
|
$
|
49,400
|
|
$
|
47,147
|
|
$
|
46,268
|
|
||
|
Net Interest Income, Tax-Equivalent
1
|
$
|
61,706
|
|
$
|
64,729
|
|
$
|
63,546
|
|
||
|
Noninterest Income
|
25,928
|
|
19,089
|
|
19,592
|
|
|||||
|
Less: Net Securities Gains
|
(2,795
|
)
|
(1,507
|
)
|
18
|
|
|||||
|
Net Gross Income, Adjusted
|
$
|
84,839
|
|
$
|
82,311
|
|
$
|
83,156
|
|
||
|
Efficiency Ratio
1
|
58.23
|
%
|
57.28
|
%
|
55.64
|
%
|
|||||
|
Period-End Capital Information
:
|
|||||||||||
|
Tier 1 Leverage Ratio
|
8.96
|
%
|
8.78
|
%
|
8.43
|
%
|
|||||
|
Total Stockholders
’
Equity (i.e. Book Value)
|
$
|
166,385
|
|
$
|
152,259
|
|
$
|
140,818
|
|
||
|
Book Value per Share
|
14.14
|
|
13.13
|
|
12.16
|
|
|||||
|
Intangible Assets
|
26,752
|
|
17,241
|
|
16,712
|
|
|||||
|
Tangible Book Value per Share
1
|
11.87
|
|
11.65
|
|
10.72
|
|
|||||
|
Asset Quality Information:
|
|||||||||||
|
Net Loans Charged-off as a Percentage of Average Loans
|
0.05
|
%
|
0.06
|
%
|
0.09
|
%
|
|||||
|
Provision for Loan Losses as a Percentage of Average Loans
|
0.08
|
%
|
0.11
|
%
|
0.16
|
|
|||||
|
Allowance for Loan Losses as a Percentage of Period-End Loans
|
1.33
|
%
|
1.28
|
%
|
1.26
|
|
|||||
|
Allowance for Loan Losses as a Percentage of Nonperforming Loans
|
197.10
|
%
|
300.57
|
%
|
300.73
|
|
|||||
|
Nonperforming Loans as a Percentage of Period-End Loans
|
0.67
|
%
|
0.43
|
%
|
0.42
|
|
|||||
|
Nonperforming Assets as a Percentage of Total Assets
|
0.41
|
%
|
0.26
|
%
|
0.26
|
|
|||||
1
See
“
Use of Non-GAAP Financial Measures
”
on page 4
.
#
22
CRITICAL ACCOUNTING POLICIES
In order to prepare our consolidated financial statements in accordance with accounting principles generally accepted in the United States of America, we were required to make estimates and assumptions that affected the amounts reported in these statements. There are uncertainties inherent in making these estimates and assumptions, which could materially affect our results of operations and financial position. We consider the following to be critical accounting policies:
The allowance for loan losses
: The adequacy of the allowance for loan losses is sensitive to changes in current economic conditions that may make it difficult for borrowers to meet their contractual obligations. Any downward trend in the economy, regional or national, may require us to increase the allowance for loan losses resulting in a negative impact on our results of operations and financial condition at the same time that other areas of our operations, including new loan originations and assets under administration in our trust department may also be experiencing negative pressures from the same underlying negative economic conditions.
Liabilities for retirement plans
: We have a variety of pension and retirement plans. Liabilities under these plans rely on estimates of future salary increases, numbers of employees and employee retention, discount rates and long-term rates of return on plan investments. Changes in these assumptions due to changes in the financial markets, the economy, our own operations or applicable law and regulation may result in material changes to our liability for postretirement expense, with consequent impact on our results of operations and financial condition.
Valuation allowance for deferred tax assets
: Accounting standards require a reduction in the carrying amount of deferred tax assets by a valuation allowance if, based on the weight of available evidence, it is more likely than not (a likelihood of more than 50%) that some portion or all of the deferred tax assets will not be realized. The valuation allowance should be sufficient to reduce the deferred tax asset to the amount that is more likely than not to be realized. Our analysis of the need for a valuation allowance for deferred tax assets is, in part, based on an estimate of future taxable income.
Goodwill
: Accounting standards require that goodwill be tested for impairment at a level of reporting referred to as a reporting unit. Impairment is the condition that exists when the carrying amount of goodwill exceeds its implied fair value. The first step of the goodwill impairment test, used to identify potential impairment, compares the fair value of a reporting unit with its carrying amount, including goodwill. The second step of the goodwill impairment test, used to measure the amount of impairment loss, compares the implied fair value of a reporting unit
’
s goodwill with the carrying amount of that goodwill.
Other than temporary decline in the value of debt and equity securities
: Accounting standards require that, for individual securities classified as either available-for-sale or held-to-maturity, an enterprise shall determine whether a decline in fair value below the amortized cost basis is other than temporary. When an other-than-temporary impairment has occurred, the amount of the other-than-temporary impairment recognized in earnings depends on whether we intend to sell the security or more likely than not will be required to sell the security before recovery of its amortized cost basis less any current-period credit loss. If we intend to sell the security or more likely than not will be required to sell the security before recovery of its amortized cost basis less any current-period credit loss, the other-than-temporary impairment is recognized in earnings equal to the entire difference between the investment
’
s amortized cost basis and its fair value at the balance sheet date. If we do not intend to sell the security and it is not more likely than not that we will be required to sell the security before recovery of its amortized cost basis less any current-period credit loss, the other-than-temporary impairment is separated into the amount representing the credit loss and the amount related to all other factors. The amount of the total other-than-temporary impairment related to the credit loss is recognized in earnings. Any significant economic downturn might result, and historically have on occasion resulted, in an other-than-temporary impairment in securities held in our portfolio.
Valuation methods for securities available-for-sale measured at fair value on a recurring basis:
Most of the available-for-sale portfolio, which includes U.S. Treasury and agency securities, mortgage-backed securities, collateralized mortgage obligations, municipal securities, corporate debt and equity securities are priced using industry-standard models that consider various assumptions that include time value, yield curves, volatility factors, prepayment speeds, default rates, loss severity, current market and contractual prices for the underlying financial instruments, as well as other relevant economic measures. Substantially all of these assumptions are either observable in the marketplace, derived from observable data or are supported by observable levels at which transactions are executed in the marketplace. Municipal and corporate securities are valued using a type of matrix, or grid, pricing in which securities are benchmarked against the treasury rate based on credit rating. These model and matrix measurements are classified as Level 2 in the fair value hierarchy.
The following discussion and analysis focuses on and reviews our results of operations for each of the years in the three-year period ended
December 31, 2011
and our financial condition as of December 31,
2011
and
2010
. The discussion below should be read in conjunction with the selected quarterly and annual information set forth above and the consolidated financial statements and other financial data presented elsewhere in this Report. When necessary, prior-year financial information has been reclassified to conform to the current-year presentation.
#
23
A. OVERVIEW
Summary of 2011 Financial Results
We reported net income for 2011 of $21.9 million, representing diluted earnings per share (EPS) of $1.87, essentially unchanged from our 2010 results. Return on average equity (ROE) for the 2011 year continued to be strong at 13.45%, although down from the ROE of 14.56% for the 2010 year. Return on average assets (ROA) for 2011 continued to be strong at 1.13%, although down from ROA of 1.16% for 2010. Both decreases were principally due to our shrinking net interest margin, which led to a decrease in our net interest income, despite the fact that our earning assets grew and our asset quality remained strong.
Total assets were $1.963 billion at December 31, 2011, which represented an increase of $54.3 million, or 2.8%, above the $1.908 billion level at December 31, 2010.
Stockholders' equity was $166.4 million at December 31, 2011, an increase of $14.1 million, or 9.3%, from the year earlier level. The components of the change in stockholders' equity since year-end 2010 are presented in the Consolidated Statement of Changes in Stockholders' Equity on page 58, and are discussed in more detail in the last section of this Overview on page 26 entitled, “Increase in Stockholder Equity.”
Regulatory capital:
At period-end, we continue to exceed all current regulatory minimum capital requirements at both the holding company and bank levels, by a substantial amount. As of December 31, 2011 both of our banks, as well as our holding company, qualified as "well-capitalized" under federal bank regulatory guidelines. Our regulatory capital levels have consistently remained well in excess of required minimums during recent years, despite the economic downturn, because of our continued profitability and strong asset quality. Even if the new, enhanced capital requirements set forth in the proposed Basel III accords, currently under consideration by the Group of 20 advanced nations including the United States, were presently in effect, Arrow and its banks would meet all of these new, enhanced capital standards. See “CAPITAL RESOURCES - New Capital Standards to be Promulgated” and “Current Capital Standards” on page 47, and “Important Proposed Changes to Regulatory Capital and Liquidity Standards” on page 46.
Economic recession and loan quality:
During the early stages of the economic crisis in late 2008 and early 2009, our market area of northeastern New York was relatively sheltered from the widespread collapse in real estate values and general surge in unemployment. This may have been due, in part, to the fact that our market area had been less affected by the preceding real estate “bubble” than other areas of the U.S. As the recession became stronger and deeper through late 2009, even northeastern New York began to feel the impact of the worsening national economy reflected in a slow-down in regional real estate sales and increasing unemployment rates. From year-end 2009 and through most of 2010, we experienced a very modest decline in the credit quality of our loan portfolio, although by standard measures our portfolio continued to be significantly stronger than the average for our peer group of U.S. bank holding companies with $1 billion to $3 billion in total assets (see page 3 for peer group information). By year-end 2010, however, our loan quality began to stabilize, a trend that continued through 2011. During this period, although nonperforming loans increased slightly, charge-offs decreased. Nonperforming loans were $7.6 million at December 31, 2011, an increase of $2.7 million from year-end 2010. The increase was primarily attributable to one large commercial loan that we modified during 2011 while it was still performing. The ratio of nonperforming loans to period-end loans at December 31, 2011 was .67%, an increase from .43% at December 31, 2010. By way of comparison, this ratio for our peer group was 2.94% at December 31, 2011, which was a significant improvement for the peer group from the ratio of 3.60% at year-end 2010, but still very high when compared to the ratio of 1.09% at December 31, 2007. Loans charged-off (net of recoveries) against our allowance for loan losses was a very low $531 thousand for 2011, as compared to $627 thousand for 2010. At December 31, 2011, the allowance for loan losses was $15.0 million, representing 1.33% of total loans, an increase of 5 basis points from December 31, 2010.
Since the onset of the financial crisis in 2008, we have not experienced significant deterioration in any of our three major loan portfolio segments:
|
◦
|
Commercial Loans:
Current unemployment rates in our region are higher than in the past few years and the total number of jobs has decreased, but these trends are largely attributable to a scaling back of local operations on the part of a few large corporations having operations in our service area. Commercial property values have not shown significant deterioration. We update the appraisals on our nonperforming and watched commercial properties as deemed necessary, usually when the loan is downgraded or when we perceive significant market deterioration since our last appraisal.
|
|
◦
|
Residential Real Estate Loans:
We have not experienced a notable increase in our foreclosure rates, primarily due to the fact that we never have originated or participated in underwriting high-risk mortgage loans, such as so called “Alt A,” “negative amortization,” “option ARM's” or “negative equity” loans. We originate all of the residential real estate loans held in our portfolio and apply conservative underwriting standards to all of our originations.
|
|
◦
|
Indirect Consumer Lending (Primarily Automobile Loans):
These loans comprise approximately 30% of our loan portfolio. Throughout 2011 and 2010, we did not experience any significant change in our delinquency rate or level of charge-offs on these loans, although both delinquencies and charge-offs did increase modestly during 2009.
|
Recent legislative developments:
The following recent legislation is and will continue to be particularly important to us.
(i)
Dodd-Frank Act:
As a result of the recent financial crisis that significantly damaged the economy and the financial sector of the United States, the U.S. Congress passed and the President signed the Dodd-Frank Act on July 21, 2010. While many of the Act's provisions will not have any direct impact on Arrow, some of the sections will significantly impact our business operations and likely will affect our financial results. These include the establishment of a new regulatory body known as the Bureau of Consumer Financial Protection, which will operate as an independent entity within the Federal Reserve System and is authorized to issue rules for consumer protection, some of which likely will significantly restrain banks' profitability, including our banks. Dodd-Frank
#
24
also directs the federal banking authorities to issue new capital requirements for banks and holding companies which must be at least as strict as the existing capital requirements and may be much more onerous. See the discussion under “Important Proposed Changes to Regulatory Capital and Liquidity Standards” on page 46 of this Report. Dodd-Frank also provided that any new issuances of trust preferred securities (TRUPs) by bank holding companies with between $500 million and $15 billion in assets will no longer be able to qualify as Tier 1 capital, although previously issued and outstanding TRUPs of such small-to-medium-sized bank holding companies, including Arrow's $20 million of TRUPs that are currently outstanding, will continue to qualify as Tier 1 capital until maturity or redemption.
Many of the regulations required to be promulgated by bank regulators in order to give effect to Dodd-Frank's provisions have yet to be promulgated or are pending final approval by the regulators, and will have phase-in periods even after final promulgation. The following are some of the Dodd-Frank legal changes that are likely to have a material impact, positive or negative, as the case may be, on us and our customers:
|
1.
|
FDIC deposit insurance has been substantially expanded.
|
|
2.
|
The FDIC insurance assessment on banks is now asset-based, not deposit-based, which actually reduces insurance costs for most smaller institutions, like Arrow. Under the new method, our premiums were reduced from $513 thousand of FDIC and FICO assessments for the first quarter of 2011 (the last quarter under the old deposit-based method of assessment), to $267 thousand of expense for the second quarter of 2011, a decline of 48%.)
|
|
3.
|
Expansion of consumer protection regulations likely will add to our regulatory compliance expense and reduce our income.
|
|
4.
|
Limitation on debit card interchange fees, which technically applies only to the very large banks having more than $10 billion in assets, will most likely have a negative impact on the fee income of smaller banks like ours, due to competitive pressures.
|
Rules still in the formulation process include those related to short-term borrowing disclosures, retention of a portion of loans initiated and sold and executive compensation. Several of these issues are highly controversial, and the implementing regulations to be forthcoming will be the focus of much discussion and concern. For further information on the impact of the Dodd-Frank Act and other recent legislation developments, see “
RECENT LEGISLATIVE DEVELOPMENTS
” on page 8 of this Report, above.
(ii)
Health care reform:
In March 2010, comprehensive healthcare reform legislation was passed under the Patient Protection and Affordable Care Act, as amended by the Health Care and Education Reconciliation Act of 2010 (collectively, the "Act"). Included among the major provisions of the Act, is a change in tax treatment of the federal drug subsidy paid with respect to eligible retirees. The Act contains provisions that may impact the Company's accounting for some of its benefit plans in future periods. However, we do not currently expect that impact to be material. The exact extent of the Act's impact, if any, cannot be determined until final regulations are promulgated and additional interpretations of the Act become available. The Company will continue to monitor the effect of the Act on its benefit plans.
Liquidity and access to credit markets:
We did not experience any liquidity problems or special concerns during 2010 and 2011, and have not in 2012 through the date of this Report. The terms of our lines of credit with our correspondent banks, the FHLBNY and the Federal Reserve Bank, have not changed, except for some increases in the maximum borrowing capacity (see our general liquidity discussion on page 46). In general, we rely on asset-based liquidity (i.e., funds in overnight investments and cash flow from maturing investments and loans) with liability-based liquidity as a secondary source (overnight borrowing arrangements with our correspondent banks, FHLBNY overnight and term credit arrangement advances and the Federal Reserve Bank discount window, as our main sources). During the recent financial crisis, many financial institutions, small and large, relied extensively on the Fed's discount window to support their liquidity positions, but we did not. In a few well-publicized instances at the height of the crisis, liquidity was such a problem for particular institutions that they experienced a run on deposits, even though there was no reasonable expectation that depositors would lose any of their insured deposits. We maintain, and periodically test, a contingent liquidity plan whose purpose is to ensure that we can generate an adequate amount of available funds to meet a wide variety of potential liquidity crises, including a severe crisis.
FDIC Special Assessment & Prepayment in 2009:
The FDIC announced during the second quarter of 2009 that they would levy a special assessment on all FDIC insured financial institutions to rebuild the FDIC's insurance fund which was significantly depleted by bank failures during the crisis. For most insured banks (including ours), the special assessment was set as a designated percentage (0.05%) of the institution's adjusted assets (total assets less Tier 1 capital), as opposed to a percentage of covered deposits which is how the FDIC had historically set regular assessments. Institutions were instructed to estimate and accrue the special assessment expense in the second quarter of 2009. We determined that our expense was $787 thousand, which we accrued on June 30, 2009. During the third quarter of 2009 the FDIC announced that it would not impose
any additional special assessments in the remainder of 2009, but would generate additional cash for the insurance fund by requiring insured institutions to prepay in the fourth quarter of 2009 their projected regular assessments for the fourth quarter of 2009 and all of 2010, 2011 and 2012. Our prepayment amount was $6.8 million, which is being amortized, as required by bank regulatory guidance, into expense during the relevant periods to which such assessment relates. As a result of Dodd-Frank, beginning with the second quarter of 2011, the calculation of regular FDIC insurance premiums for insured institutions has changed so as to be based on adjusted assets (as defined) rather than deposits, which had the effect of imposing FDIC insurance fees not only on deposits but on other sources of funding as well, including repurchase agreements. The rate, however, given the larger base (assets) on which insurance premiums are now assessed, will be a lower percentage than the rate that applied under the old deposit-based assessments. The FDIC calculated the first asset-based assessment (for the second quarter of 2011, but recognized during the third quarter of 2011), based on June 30, 2011 reported assets. Because our banks, like most small banks, have a much higher ratio of deposits to assets than the large banks maintain, we expected our FDIC premiums to actually decrease considerably.
#
25
VISA Transactions from 2008 to 2011:
On March 28, 2008, VISA Inc. distributed to its member banks, including Glens Falls National, by way of a mandatory redemption of 38.7% of the Visa Class B shares held by the member banks, some of the proceeds realized by Visa from the initial public offering and sale of its Class A shares just then completed. With another portion of the IPO proceeds, Visa established a $3 billion escrow fund to cover certain, but not all, of its continuing litigation liabilities under various antitrust claims, which its member banks would otherwise be required to bear. Accordingly, during the first quarter of 2008, we recorded the following transactions:
|
•
|
A pre-tax gain of $749 thousand from the mandatory redemption by Visa from us of 38.7% of our Class B Visa Inc. shares, reflected as an increase in noninterest income.
|
|
•
|
A reversal of $306 thousand of the $600 thousand accrual previously recorded by us at December 31, 2007, representing our then estimated proportional share of Visa litigation costs, which reversal was reflected as a reduction in 2008 other operating expense.
|
In October 2008, Visa announced that it had settled a lawsuit with Discover Financial Services, which was part of the covered litigation (including several cases) for which the Visa member banks remained contingently liable and for which Visa had established its escrow fund. Since that time, Visa has deposited the following additional amounts into the escrow fund for covered litigation: $1.1 billion in December 2008, $700 million in July 2009, $500 million in May 2010, $800 million in October 2010, $400 million in March 2011 and $1.6 billion in February 2012. These developments reduced our proportionate exposure for covered litigation but also reduced the ultimate value of our remaining Class B Visa shares, as Visa's settlement of covered litigation claims directly reduces the value of member banks' Class B stock. However, even before Visa made these additional provisions against its covered litigation expenses, we did not recognize any dollar value for our remaining Class B shares, in accordance with SEC guidance. In summary, we did not recognize any income or expense in any of the periods presented as a result of Visa's periodic deposits of additional amounts into the escrow fund or settlements of covered litigation with amounts drawn out of the fund.
In October 2011, Visa announced that the so-called interchange litigation was expected to go to trial sometime in the fall of 2012. At that time, Visa was not able to predict when the litigation would be resolved.
The estimation of our proportionate share of any potential losses on Visa's part, in excess of the escrow fund, related to the remaining covered litigation is extremely difficult and involves a high degree of uncertainty. Management has determined that the remaining $294 thousand liability included in “Other Liabilities” on our December 31, 2011 consolidated balance sheet represents the fair value of our proportionate share of the remaining covered Visa litigation obligations in excess of the escrow fund at that date, but this value is subject to change depending upon future developments in the covered litigation.
Increase in Stockholders' Equity:
At December 31, 2011, our tangible book value per share (calculated based on stockholders' equity reduced by intangible assets including goodwill and other intangible assets) amounted to $11.87, an increase of $0.22, or 1.9%, from December 31, 2010. Our total stockholders' equity at December 31, 2011 increased 9.3% over the year-earlier level, and our total book value per share increased by 7.7% over the year earlier level. This increase principally reflected the following factors: i) $21.9 million net income for the period; ii) a $4.7 million net unrealized gain in securities available-for-sale, net of tax, and iii) issuance of $5.3 million of common stock in connection with our acquisition of two insurance agencies; offset in part by iv) cash dividends of $11.4 million; and (v) repurchases of our own common stock of $6.0 million. As of December 31, 2011, our closing stock price was $23.44, resulting in a trading multiple of 1.97 to our tangible book value. From a regulatory capital standpoint, the Company and each of its subsidiary banks also continued to remain classified as “well-capitalized” at quarter end. The Board of Directors declared and the Company paid quarterly cash dividends of $.243 per share for the first three quarters of 2011, as adjusted for a 3% stock dividend distributed September 29, 2011, and cash dividends of $.25 per share for the fourth quarter of 2011 and the first quarter of 2012.
#
26
B. RESULTS OF OPERATIONS
The following analysis of net interest income, the provision for loan losses, noninterest income, noninterest expense and income taxes, highlights the factors that had the greatest impact on our results of operations for
2011
and the prior two years.
I. NET INTEREST INCOME
(Tax-equivalent Basis)
Net interest income represents the difference between interest, dividends and fees earned on loans, securities and other earning assets and interest paid on deposits and other sources of funds. Changes in net interest income result from changes in the level and mix of earning assets and sources of funds (volume) and changes in the yields earned and interest rates paid (rate). Net interest margin is the ratio of net interest income to average earning assets. Net interest income may also be described as the product of average earning assets and the net interest margin. As described in the section entitled
“
Use of Non-GAAP Financial Measures
”
on page 4 of this Report we calculate net interest income on a tax-equivalent basis using a marginal tax rate of 35%.
CHANGE IN NET INTEREST INCOME
(Dollars In Thousands) (Tax-equivalent Basis)
|
Years Ended December 31,
|
Change From Prior Year
|
||||||||||||||||||||||||
|
2010 to 2011
|
2009 to 2010
|
||||||||||||||||||||||||
|
2011
|
2010
|
2009
|
Amount
|
%
|
Amount
|
%
|
|||||||||||||||||||
|
Interest and Dividend Income
|
$
|
80,385
|
|
$
|
88,424
|
|
$
|
90,038
|
|
$
|
(8,039
|
)
|
(9.1
|
)%
|
$
|
(1,614
|
)
|
(1.8
|
)%
|
||||||
|
Interest Expense
|
18,679
|
|
23,695
|
|
26,492
|
|
(5,016
|
)
|
(21.2
|
)
|
(2,797
|
)
|
(10.6
|
)
|
|||||||||||
|
Net Interest Income
|
$
|
61,706
|
|
$
|
64,729
|
|
$
|
63,546
|
|
$
|
(3,023
|
)
|
(4.7
|
)
|
$
|
1,183
|
|
1.9
|
|
||||||
On a tax-equivalent basis, net interest income was $61.7 million in
2011
, a decrease of $3.0 million, or 4.7%, from $64.7 million in
2010
. This compared to an increase of $1.2 million, or 1.9%, from
2009
to
2010
. Factors contributing to the increase in net interest income over the three-year period are discussed in the following portions of this Section B.I.
In the following table, net interest income components are presented on a tax-equivalent basis. Changes between periods are attributed to movement in either the average daily balances or average rates for both earning assets and interest-bearing liabilities. Changes attributable to both volume and rate have been allocated proportionately between the categories.
|
2011 Compared to 2010
Change in Net Interest Income Due to:
|
2010 Compared to 2009
Change in Net Interest Income Due to:
|
||||||||||||||||||||||
|
Interest and Dividend Income:
|
Volume
|
Rate
|
Total
|
Volume
|
Rate
|
Total
|
|||||||||||||||||
|
Interest-Bearing Bank Balances
|
$
|
(58
|
)
|
$
|
(1
|
)
|
$
|
(59
|
)
|
$
|
7
|
|
$
|
1
|
|
$
|
8
|
|
|||||
|
Investment Securities:
|
|||||||||||||||||||||||
|
Fully Taxable
|
1,301
|
|
(3,614
|
)
|
(2,313
|
)
|
1,945
|
|
(1,950
|
)
|
(5
|
)
|
|||||||||||
|
Exempt from Federal Taxes
|
986
|
|
(1,001
|
)
|
(15
|
)
|
1,518
|
|
(974
|
)
|
544
|
|
|||||||||||
|
Loans
|
(489
|
)
|
(5,163
|
)
|
(5,652
|
)
|
1,954
|
|
(4,115
|
)
|
(2,161
|
)
|
|||||||||||
|
Total Interest and Dividend Income
|
1,740
|
|
(9,779
|
)
|
(8,039
|
)
|
5,424
|
|
(7,038
|
)
|
(1,614
|
)
|
|||||||||||
|
Interest Expense:
|
|||||||||||||||||||||||
|
Deposits:
|
|||||||||||||||||||||||
|
NOW Accounts
|
601
|
|
(1,131
|
)
|
(530
|
)
|
858
|
|
(448
|
)
|
410
|
|
|||||||||||
|
Savings Deposits
|
257
|
|
(495
|
)
|
(238
|
)
|
344
|
|
(309
|
)
|
35
|
|
|||||||||||
|
Time Deposits of $100,000 or More
|
(233
|
)
|
(37
|
)
|
(270
|
)
|
(488
|
)
|
(327
|
)
|
(815
|
)
|
|||||||||||
|
Other Time Deposits
|
(238
|
)
|
(519
|
)
|
(757
|
)
|
(11
|
)
|
(1,420
|
)
|
(1,431
|
)
|
|||||||||||
|
Total Deposits
|
387
|
|
(2,182
|
)
|
(1,795
|
)
|
703
|
|
(2,504
|
)
|
(1,801
|
)
|
|||||||||||
|
Short-Term Borrowings
|
(22
|
)
|
(28
|
)
|
(50
|
)
|
9
|
|
(14
|
)
|
(5
|
)
|
|||||||||||
|
Long-Term Debt
|
(2,058
|
)
|
(1,113
|
)
|
(3,171
|
)
|
(680
|
)
|
(311
|
)
|
(991
|
)
|
|||||||||||
|
Total Interest Expense
|
(1,693
|
)
|
(3,323
|
)
|
(5,016
|
)
|
32
|
|
(2,829
|
)
|
(2,797
|
)
|
|||||||||||
|
Net Interest Income
|
$
|
3,433
|
|
$
|
(6,456
|
)
|
$
|
(3,023
|
)
|
$
|
5,392
|
|
$
|
(4,209
|
)
|
$
|
1,183
|
|
|||||
#
27
The following table reflects the components of our net interest income, setting forth, for years ended
December 31, 2011
,
2010
and
2009
(i) average balances of assets, liabilities and stockholders' equity, (ii) interest and dividend income earned on earning assets and interest expense incurred on interest-bearing liabilities, (iii) average yields earned on earning assets and average rates paid on interest-bearing liabilities, (iv) the net interest spread (average yield less average cost) and (v) the net interest margin (yield) on earning assets. Interest income and interest rate information is presented on a tax-equivalent basis (see the discussion under Use of Non-GAAP Financial Measures on page 4 of this Report). The yield on securities available-for-sale is based on the amortized cost of the securities. Nonaccrual loans are included in average loans.
Average Consolidated Balance Sheets and Net Interest Income Analysis
(Tax-equivalent basis using a marginal tax rate of 35%)
(Dollars in Thousands)
|
Years Ended:
|
2011
|
2010
|
2009
|
|||||||||||||||||||||||||||||
|
Interest
|
Rate
|
Interest
|
Rate
|
Interest
|
Rate
|
|||||||||||||||||||||||||||
|
Average
|
Income/
|
Earned/
|
Average
|
Income/
|
Earned/
|
Average
|
Income/
|
Earned/
|
||||||||||||||||||||||||
|
Balance
|
Expense
|
Paid
|
Balance
|
Expense
|
Paid
|
Balance
|
Expense
|
Paid
|
||||||||||||||||||||||||
|
Interest-Bearing Deposits at
Banks
|
$
|
37,440
|
|
$
|
98
|
|
0.26
|
%
|
$
|
59,771
|
|
$
|
157
|
|
0.26
|
%
|
$
|
56,920
|
|
$
|
149
|
|
0.26
|
%
|
||||||||
|
Investment Securities:
|
||||||||||||||||||||||||||||||||
|
Fully Taxable
|
452,264
|
|
12,421
|
|
2.75
|
|
413,212
|
|
14,734
|
|
3.57
|
|
362,059
|
|
14,739
|
|
4.07
|
|
||||||||||||||
|
Exempt from Federal
Taxes
|
223,259
|
|
8,982
|
|
4.02
|
|
200,062
|
|
8,997
|
|
4.50
|
|
167,716
|
|
8,453
|
|
5.04
|
|
||||||||||||||
|
Loans
|
1,126,065
|
|
58,884
|
|
5.23
|
|
1,134,718
|
|
64,536
|
|
5.69
|
|
1,101,759
|
|
66,697
|
|
6.05
|
|
||||||||||||||
|
Total Earning Assets
|
1,839,028
|
|
80,385
|
|
4.37
|
|
1,807,763
|
|
88,424
|
|
4.89
|
|
1,688,454
|
|
90,038
|
|
5.33
|
|
||||||||||||||
|
Allowance for Loan Losses
|
(14,821
|
)
|
(14,385
|
)
|
(13,626
|
)
|
||||||||||||||||||||||||||
|
Cash and Due From Banks
|
28,844
|
|
28,717
|
|
28,096
|
|
||||||||||||||||||||||||||
|
Other Assets
|
90,212
|
|
70,229
|
|
58,082
|
|
||||||||||||||||||||||||||
|
Total Assets
|
$
|
1,943,263
|
|
$
|
1,892,324
|
|
$
|
1,761,006
|
|
|||||||||||||||||||||||
|
Deposits:
|
||||||||||||||||||||||||||||||||
|
NOW Accounts
|
$
|
603,965
|
|
5,052
|
|
0.84
|
|
$
|
541,161
|
|
5,582
|
|
1.03
|
|
$
|
460,096
|
|
5,172
|
|
1.12
|
|
|||||||||||
|
Savings Deposits
|
409,398
|
|
1,898
|
|
0.46
|
|
361,949
|
|
2,136
|
|
0.59
|
|
307,133
|
|
2,101
|
|
0.68
|
|
||||||||||||||
|
Time Deposits of $100,000
Or More
|
122,897
|
|
2,633
|
|
2.14
|
|
133,770
|
|
2,903
|
|
2.17
|
|
155,378
|
|
3,718
|
|
2.39
|
|
||||||||||||||
|
Other Time Deposits
|
238,865
|
|
5,143
|
|
2.15
|
|
249,192
|
|
5,900
|
|
2.37
|
|
249,575
|
|
7,331
|
|
2.94
|
|
||||||||||||||
|
Total Interest-
Bearing Deposits
|
1,375,125
|
|
14,726
|
|
1.07
|
|
1,286,072
|
|
16,521
|
|
1.28
|
|
1,172,182
|
|
18,322
|
|
1.56
|
|
||||||||||||||
|
Short-Term Borrowings
|
56,206
|
|
92
|
|
0.16
|
|
64,481
|
|
125
|
|
0.19
|
|
59,566
|
|
129
|
|
0.22
|
|
||||||||||||||
|
FHLBNY Term Advances and
Other Long-Term Debt
|
103,753
|
|
3,861
|
|
3.72
|
|
162,384
|
|
7,049
|
|
4.33
|
|
178,274
|
|
8,041
|
|
4.51
|
|
||||||||||||||
|
Total Interest-
Bearing Liabilities
|
1,535,084
|
|
18,679
|
|
1.22
|
|
1,512,937
|
|
23,695
|
|
1.57
|
|
1,410,022
|
|
26,492
|
|
1.88
|
|
||||||||||||||
|
Demand Deposits
|
221,035
|
|
205,497
|
|
191,504
|
|
||||||||||||||||||||||||||
|
Other Liabilities
|
24,081
|
|
23,513
|
|
24,590
|
|
||||||||||||||||||||||||||
|
Total Liabilities
|
1,780,200
|
|
1,741,947
|
|
1,626,116
|
|
||||||||||||||||||||||||||
|
Stockholders
’
Equity
|
163,063
|
|
150,377
|
|
134,890
|
|
||||||||||||||||||||||||||
|
Total Liabilities and
Stockholders
’
Equity
|
$
|
1,943,263
|
|
$
|
1,892,324
|
|
$
|
1,761,006
|
|
|||||||||||||||||||||||
|
Net Interest Income
(Tax-equivalent Basis)
|
61,706
|
|
64,729
|
|
63,546
|
|
||||||||||||||||||||||||||
|
Reversal of Tax
Equivalent Adjustment
|
(3,594
|
)
|
0.20
|
%
|
(3,452
|
)
|
0.19
|
%
|
(3,181
|
)
|
0.19
|
%
|
||||||||||||||||||||
|
Net Interest Income
|
$
|
58,112
|
|
$
|
61,277
|
|
$
|
60,365
|
|
|||||||||||||||||||||||
|
Net Interest Spread
|
3.15
|
%
|
3.32
|
%
|
3.45
|
%
|
||||||||||||||||||||||||||
|
Net Interest Margin
|
3.36
|
%
|
3.58
|
%
|
3.76
|
%
|
||||||||||||||||||||||||||
#
28
CHANGES IN NET INTEREST INCOME DUE TO RATE
|
YIELD ANALYSIS (Tax-equivalent basis)
|
December 31,
|
|||||||
|
2011
|
2010
|
2009
|
||||||
|
Yield on Earning Assets
|
4.37
|
%
|
4.89
|
%
|
5.33
|
%
|
||
|
Cost of Interest-Bearing Liabilities
|
1.22
|
|
1.57
|
|
1.88
|
|
||
|
Net Interest Spread
|
3.15
|
%
|
3.32
|
%
|
3.45
|
%
|
||
|
Net Interest Margin
|
3.36
|
%
|
3.58
|
%
|
3.76
|
%
|
||
In 2011, we experienced a decrease in net interest income from 2010. During the recent period, beginning in late 2008 and extending up to the present, our earning assets have continued to reprice downwards at least as fast or faster than our cost of interest bearing liabilities. Following two years of decreases in net interest income in 2005 and 2006 (during a period of rising interest rates), we experienced four successive years of increases in net interest income from 2007 through 2010. In each of these years, we experienced a benefit from an increase in average earning assets, although the substantial increase in net interest income in 2008 was largely attributable to a widened margin during the earlier portion of the year, typical of a period in which interest rates begin to fall, as our paying liabilities reprice downwards more quickly than our earning assets. From 2009 through 2011, however, our net interest margin has been consistently under pressure and has generally declined.
The decrease in net interest income was $3.0 million, or 4.7%, from 2010 to 2011. Net interest income increased $1.2 million, or 1.9%, from 2009 to 2010. In 2011, an increase in average earning assets, net of a smaller increase in average interest-bearing liabilities (i.e., changes in volume) had a $3.4 million positive impact on net interest income, while changes in rates provided a $6.5 million negative impact on our net interest income for the year, as yields on earning assets decreased more rapidly than rates paid on liabilities, the latter being more constrained by the rapid approach of zero as an absolute limit on short term, no or very low-risk rates (i.e., the federal funds rate).
Generally, the following items have a major impact on changes in net interest income due to rate: general interest rate changes, the ratio of our rate sensitive assets to rate sensitive liabilities (interest rate sensitivity gap) during periods of interest rate changes, and changes in the level of nonperforming loans.
Impact of Interest Rate Changes
Changes in Interest Rates in Recent Years
. From mid-2006 to fall 2007, in response to surging prices for certain assets (specifically, residential and commercial real estate assets, the price of which were being driving upward fast by cheap and readily-available credit), the Fed continued to increase and then maintained at elevated levels short-term interest rates, with an ultimate federal funds target rate of 5.25%. In September 2007, however, in response to a sudden weakening in the economy and a loss of liquidity in the short-term credit market, precipitated in large part by the collapse in the housing market and resulting problems in subprime residential real estate lending, the Fed began lowering the federal funds target rate, rapidly and by significant amounts.
By the December 2007 meeting of the Board of Governors, the fed funds rate had decreased 100 basis points, to 4.25%, and in early 2008, the Fed, in response to continuing liquidity concerns in the credit markets, further lowered the targeted federal funds rate by an additional 125 basis points, to 3.00%. In the ensuing year, the Fed in a series of additional rate reductions lowered the target rate to the maximum extent possible; by January 2009, the fed funds target rate was at an unprecedented low of 0% to .25%, where it has remained for the last 12 quarters, that is, through December 31, 2011. Recently, the Fed announced that it would continue to follow policies intended to keep both the Fed funds rate and the rates for longer-maturity Treasury bills at their current historic low levels at least through 2014.
We saw an immediate impact in the reduced cost of our deposits when rates began to fall at year-end 2007, and our deposit costs continued falling in 2008 and 2009 and to a lesser extent throughout 2010 and 2011. Yields on our earning assets have also fallen since 2008, but at a different pace than our cost of funds. Initially, the drop in our asset yields was not as significant as the decline in our deposit rates, but in recent periods (throughout 2009, 2010 and 2011) the decline in yields on our earning assets has exceeded the decline in cost of our deposits. As a result of these trends, our net interest margins generally increased in late 2007 and early 2008, positively impacting our net interest income, but since 2008 we, like almost all banks, have experienced fairly steady contraction in our net interest margin.
Changes in the Yield Curve in Recent Years
. An additional important aspect in recent years with regard to the effect of prevailing interest rates on our profitability has been the changing shape in the yield curve. A positive (upward-sloping) yield curve, where long-term rates significantly exceed short term rates, is both a more common occurrence and generally a better situation for banks, including ours, than a flat or less upwardly-sloping yield curve. We, like many banks, typically fund longer-duration assets with shorter-maturity liabilities, and the flattening of the yield curve directly diminishes the benefit of this strategy. From mid-2005 to mid-2007, the yield curve “flattened,” especially during 2006 and the first half of 2007. After the Fed began increasing short-term interest rates in June 2004, the yield curve did not maintain its traditional upward slope (i.e., lower rates for shorter-duration debt; higher rates for longer-term debt) but flattened; that is, as short-term rates increased, longer-term rates stayed unchanged or even decreased. Therefore, the traditional spread between short-term rates and long-term rates essentially disappeared. In late 2006 and in early 2007, the yield curve actually inverted, with short-term rates exceeding long-term rates. The flattening of the yield curve was the most significant factor in the decrease in our net interest margin during the 2005-2007 period.
At the end of the second quarter of 2007, however, the yield on longer-term securities began to increase compared to short-term investments, and the yield curve began to resume its more traditional upward sloping shape. The increase in rate spread
#
29
between short- and long-term maturities was further enhanced when long-term rates initially held steady after the Fed began lowering short-term rates in September 2007 in response to the economic downturn. Ultimately, as the crisis deepened, long-term rates also began to decrease, while short-term rates continued to decrease, roughly in parity with each other, to the historically low levels that both short- and long-term rates presently occupy, levels that the Federal Reserve explicitly seeks to perpetuate, at least through 2014, through the various means at its disposal. In the third quarter of 2011, the Federal Reserve undertook new measures specifically to reduce longer-term rates as compared to short-term rates, as a means of stimulating the housing market and the economy generally. Thirty-year mortgage rates did subsequently fall to levels not seen in many years, if ever.
The yield curve, however, remains upward-sloping and may continue that way for some time, which should be of some benefit to banks and financial institution generally. On the other hand, all lending institutions, even those like us who have avoided subprime lending problems and continue to maintain high credit quality, have experienced some pressure on credit quality in recent periods, and this may continue if the national or regional economies continue to be weak. Any credit or asset quality erosion will reduce or possibly outweigh the benefit we may experience from the combination of low prevailing interest rates generally and a continuing upward-sloping yield curve. Thus, no assurances can be given on future improvements in our net interest income or net income generally, particularly as residential mortgage related borrowings have diminished across the economy and the redeployment of funds from maturing loans and assets into similarly high yielding asset categories has become progressively more difficult.
Recent Pressure on Our Net Interest Margin.
In September 2007, as noted above, the Fed began lowering short-term interest rates in response to the worsening economy. From the third quarter of 2007 through mid-2008 our margin steadily improved as the rates we paid on our interest-bearing liabilities began to reprice downward more rapidly than the yields on our earning assets. This initially had a significant positive impact on our net interest income, but that trend eventually reversed itself. From mid-2008 into 2009, our net interest margin held steady at around 3.90%, but the margin began to narrow in the last three quarters of 2009 and throughout 2010 and 2011 as the downward repricing of paying liabilities began to slow while interest earning assets continued to reprice downward at a steady rate. During the past five quarters, our net interest margin has ranged from 3.43% to 3.25%. However, even if new assets do not continue to price downward, our average yield on assets may continue to decline in future periods as our older, higher-priced assets continue to mature and pay off at a faster rate than newer, lower-priced assets.
Thus, our margins may continue to be under pressure and we may experience slow compression in upcoming periods. That is, our average yield on assets may decline in upcoming periods at a slightly higher rate than our average cost of deposits. In this light, no assurances can be given that our net interest income will resume the growth experienced in 2010 and prior years, even if asset growth continues or increases, or that net earnings will continue to grow, if net interest income decreases more than other forms of net income increase.
Potential Inflation; Effect on Interest Rates and Margins.
Currently, there is considerable discussion, and some disagreement, about the possible or even likely emergence of meaningful inflation across some or all asset classes in the U.S. and world economies. To the extent that such inflation may occur, or in fact already be occurring, it is widely perceived as attributable in large part to the persistent efforts of the Federal Reserve and other central banks, including the European Central Bank, to significantly increase the money supply in the U.S. and western world economies, which started at least in the U.S. at the onset of the crisis in 2008 and continues. The Fed has increased the U.S. money supply by setting and maintaining the Fed funds rate at historically low levels (with consequent downward pressure on all rates), and by purchasing massive amounts of U.S. Treasuries and other debt securities through the Federal Reserve Bank (i.e., quantitative easing), which is intended to have the identical effect of lowering and reinforcing already low interest rates and thereby expanding the supply of credit. Although the Fed discontinued its quantitative easing program on June 30, 2011, and expressed at the time no immediate plans to resume the program, partially out of concern that the preceding rapid growth in the money supply might cause a sudden surge in inflation, the underlying rate of inflation in the U.S., exclusive of the historically volatile categories of fuel and food purchases, remained quite low in the ensuing months of 2011 and the U.S. economy continues to be sluggish. As a result, in the third quarter of 2011, the Fed signaled a renewed interest in spurring the economy through interest rate manipulations, including the introduction of “Operation Twist,” under which the Fed began to reinvest the proceeds from all maturing securities in its substantial U.S. Treasury and mortgage-backed securities portfolios into longer-dated securities, thereby seeking to lower long-term rates (and mortgage rates), as a priority over further reductions in short-term rates. The extent to which this step served to stimulate the economy was unclear as of year-end 2011, but U.S. inflation remained at or below the Fed's target rate of 2%. Consequently, as of the date of this Report, many analysts are of the opinion that the Fed may yet resume quantitative easing, that is, resume a broad-based program of buying U.S. Treasuries and mortgage-backed securities for the Fed's portfolio using newly-created funds, if it deems that step as necessary to reignite the economy, even at the cost of increased inflation. There remains, consequently, some concern that increased inflation may emerge at some future date, leading to a possible increase in prevailing interest rates in the U.S. financial markets.
At least for the present, management does not anticipate near-term substantial increases in prevailing rates. If modest rate increases should occur, there is some expectation that the impact on our margins, as well as on our net interest income and earnings, may be somewhat negative in the short run but possibly positive in the long run. Given the extraordinary forces currently in play in the financial markets, any speculation on the likely impact of inflation on prevailing interest rates, short- or long-term, or on the net interest margins or the net interest income of banks such as ours, or speculation on the depth or sustainability of inflationary pressures themselves, must be regarded as highly subjective and no undue reliance should be placed thereon.
A discussion of the models we use in projecting the impact on net interest income resulting from possible changes in interest rates vis-à-vis the repricing patterns of our earning assets and interest-bearing liabilities is included later in this report under Item 7.A.,
“
Quantitative and Qualitative Disclosures About Market Risk.
#
30
CHANGES IN NET INTEREST INCOME DUE TO VOLUME
AVERAGE BALANCES
(Dollars In Thousands)
|
Years Ended December 31,
|
Change From Prior Year
|
||||||||||||||||||||||||
|
2010 to 2011
|
2009 to 2010
|
||||||||||||||||||||||||
|
2011
|
2010
|
2009
|
Amount
|
%
|
Amount
|
%
|
|||||||||||||||||||
|
Earning Assets
|
$
|
1,839,028
|
|
$
|
1,807,763
|
|
$
|
1,688,454
|
|
$
|
31,265
|
|
1.7
|
%
|
$
|
119,309
|
|
7.1
|
%
|
||||||
|
Interest-Bearing Liabilities
|
1,535,084
|
|
1,512,937
|
|
1,410,022
|
|
22,147
|
|
1.5
|
|
102,915
|
|
7.3
|
|
|||||||||||
|
Demand Deposits
|
221,035
|
|
205,497
|
|
191,504
|
|
15,538
|
|
7.6
|
|
13,993
|
|
7.3
|
|
|||||||||||
|
Total Assets
|
1,943,263
|
|
1,892,324
|
|
1,761,006
|
|
50,939
|
|
2.7
|
|
131,318
|
|
7.5
|
|
|||||||||||
|
Earning Assets to Total Assets
|
94.64
|
%
|
95.53
|
%
|
95.88
|
%
|
|||||||||||||||||||
2010 to 2011:
In general, an increase in average earning assets has a positive impact on net interest income. For 2011, average earning assets increased $31.3 million or 1.7% over 2010, while average interest-bearing liabilities increased $22.1 million or 1.5%. This combination led to a $3.4 million increase in net interest income, even though our net interest margin decreased by 22 basis points (from 3.58% to 3.26%) between the two years. (This positive effect was more than offset by the $6.4 million negative impact on net interest income resulting from the changes in rates during the year, discussed above.)
The $31.3 million increase in average earning assets from 2010 to 2011 reflected an increase in the average balance of our securities portfolio, while the average balance of total loans actually decreased from 2010 to 2011. Within the loan portfolio, our three principal segments are residential real estate loans, indirect loans (primarily automobile loans) and commercial loans. Through all of 2011 we sold a significant portion of our residential real estate loan originations leading to a decrease in the average balance of that portfolio. The average balance of our indirect portfolio also decreased over the past year reflecting both the weak demand for new vehicles and our pricing on these loans (which, although competitive with the rates charged by other commercial banks, was not competitive with the subsidized, below-market loan rates offered by the financing affiliates of the automobile manufacturers). Of the three basic sectors in our loan portfolio (residential/consumer; indirect/automobile; and commercial/commercial real estate), only our commercial loan portfolio experienced growth over the past year. Consequently, most of the growth in our earning assets in 2011 was in our lower yielding investment portfolio (versus the higher yields in our loan portfolio) and in any event such growth, in total earning assets, was only 1.7 % in 2011 (versus 7.1% in 2010).
The $22.1 million increase in average interest-bearing liabilities reflected the offsetting impact of an $89.1 million increase in interest-bearing deposits and a $66.9 million decrease in our other borrowed funds, primarily FHBL term advances.
2009 to 2010:
For 2010, average earning assets increased $119.3 million or 7.1% over 2009, while average interest-bearing liabilities increased $102.9 million or 7.3%. This combination led to a $5.4 million increase in net interest income, even though our net interest margin decreased by 18 basis points (from 3.76% to 3.58%) between the two years. (This $5.4 million positive effect during 2010 resulting from a change in volume was offset, in part, by the $4.2 million negative impact on net interest income resulting from the changes in rates during the year, discussed above.)
The $119.3 million increase in average earning assets from 2009 to 2010 reflected an increase in average loans of $33.0 million, or 3.0%, an increase of $84.1 million, or 16.2%, in investment securities and a $2.9 increase in the level of bank balances at interest. Within the loan portfolio, our three principal segments are residential real estate loans, indirect loans (primarily automobile loans) and commercial loans. The increase in average loan balances from 2009 to 2010 was principally driven by a strong demand for residential real estate loans. However, during the last six months of 2010 we began to sell our newly originated loans to Freddie Mac while retaining the loan servicing. Some of these sales were refinancing of loans that were formerly in our own portfolio. Consequently, the outstanding balance of residential real estate loans began to decrease in the fourth quarter of 2010, continuing into the early part of 2011. Average indirect loan balances decreased slightly during the year, under 1.0%, while average commercial loans balances remained essentially flat.
The $102.9 million increase in average interest-bearing liabilities was evenly divided between increases in municipal deposits balances and non-municipal account balances. The fact that our average earning assets increased more than our average paying liabilities, was attributable to an increase in non-interest bearing funding sources, including non-interest bearing demand deposits, and increases in stockholders
'
equity.
Increases in the volume of loans and deposits, as well as yields and costs by type, are discussed later in this Report under Item 7.C.
“
Financial Condition.
”
#
31
II.
PROVISION FOR LOAN LOSSES AND ALLOWANCE FOR LOAN LOSSES
We consider our accounting policy relating to the allowance for loan losses to be a critical accounting policy, given the uncertainty involved in evaluating the level of the allowance required to cover credit losses inherent in the loan portfolio, and the material effect that such judgments may have on our results of operations. Beginning in 2010, Note 4 to our consolidated financial statements includes all of the disclosures about our method for calculating our provision for loan losses that was formerly reported in this section of managements
’
discussion and analysis. Note 4 also provides information about impaired loans.
SUMMARY OF THE ALLOWANCE AND PROVISION FOR LOAN LOSSES
(Dollars In Thousands) (Loans, Net of Unearned Income)
|
Years-Ended December 31,
|
2011
|
2010
|
2009
|
2008
|
2007
|
|||||||||||||||
|
Period-End Loans
|
1,131,457
|
|
1,145,508
|
|
1,112,150
|
|
1,109,812
|
|
1,038,844
|
|
||||||||||
|
Average Loans
|
1,126,065
|
|
1,134,718
|
|
1,101,759
|
|
1,071,384
|
|
1,020,856
|
|
||||||||||
|
Period-End Assets
|
1,962,684
|
|
1,908,336
|
|
1,841,627
|
|
1,665,086
|
|
1,584,846
|
|
||||||||||
|
Nonperforming Assets, at Period-End:
|
||||||||||||||||||||
|
Nonaccrual Loans:
|
||||||||||||||||||||
|
Commercial Real Estate
|
1,503
|
|
2,237
|
|
2,235
|
|
2,263
|
|
758
|
|
||||||||||
|
Commercial Loans
|
6
|
|
94
|
|
309
|
|
50
|
|
73
|
|
||||||||||
|
Residential Real Estate Loans
|
2,582
|
|
916
|
|
901
|
|
100
|
|
253
|
|
||||||||||
|
Consumer Loans
|
437
|
|
814
|
|
945
|
|
1,056
|
|
855
|
|
||||||||||
|
Total Nonaccrual Loans
|
4,528
|
|
4,061
|
|
4,390
|
|
3,469
|
|
1,939
|
|
||||||||||
|
Loans Past Due 90 or More Days and
|
||||||||||||||||||||
|
Still Accruing Interest
|
1,662
|
|
810
|
|
270
|
|
457
|
|
245
|
|
||||||||||
|
Restructured
|
1,422
|
|
16
|
|
—
|
|
—
|
|
—
|
|
—
|
|
||||||||
|
Total Nonperforming Loans
|
7,612
|
|
4,887
|
|
4,660
|
|
3,926
|
|
2,184
|
|
||||||||||
|
Repossessed Assets
|
56
|
|
58
|
|
59
|
|
64
|
|
63
|
|
||||||||||
|
Other Real Estate Owned
|
460
|
|
—
|
|
53
|
|
581
|
|
89
|
|
||||||||||
|
Nonaccrual Investments
|
—
|
|
—
|
|
—
|
|
400
|
|
—
|
|
||||||||||
|
Total Nonperforming Assets
|
$
|
8,128
|
|
$
|
4,945
|
|
$
|
4,772
|
|
$
|
4,971
|
|
$
|
2,336
|
|
|||||
|
Allowance for Loan Losses:
|
||||||||||||||||||||
|
Balance at Beginning of Period
|
$
|
14,689
|
|
$
|
14,014
|
|
$
|
13,272
|
|
$
|
12,401
|
|
$
|
12,278
|
|
|||||
|
Loans Charged-off:
|
||||||||||||||||||||
|
Commercial Loans
|
(105
|
)
|
(30
|
)
|
(88
|
)
|
(83
|
)
|
(27
|
)
|
||||||||||
|
Real Estate - Commercial
|
—
|
|
—
|
|
—
|
|
—
|
|
(6
|
)
|
||||||||||
|
Real Estate - Residential
|
(147
|
)
|
—
|
|
(25
|
)
|
(25
|
)
|
—
|
|
||||||||||
|
Consumer Loans
|
(522
|
)
|
(864
|
)
|
(1,317
|
)
|
(1,184
|
)
|
(797
|
)
|
||||||||||
|
Total Loans Charged-off
|
(774
|
)
|
(894
|
)
|
(1,430
|
)
|
(1,292
|
)
|
(830
|
)
|
||||||||||
|
Recoveries of Loans Previously Charged-off:
|
||||||||||||||||||||
|
Commercial Loans
|
17
|
|
5
|
|
14
|
|
38
|
|
13
|
|
||||||||||
|
Real Estate – Commercial
|
—
|
|
—
|
|
—
|
|
197
|
|
17
|
|
||||||||||
|
Real Estate – Residential
|
—
|
|
—
|
|
6
|
|
2
|
|
2
|
|
||||||||||
|
Consumer Loans
|
226
|
|
262
|
|
369
|
|
255
|
|
408
|
|
||||||||||
|
Total Recoveries of Loans Previously Charged-off
|
243
|
|
267
|
|
389
|
|
492
|
|
440
|
|
||||||||||
|
Net Loans Charged-off
|
(531
|
)
|
(627
|
)
|
(1,041
|
)
|
(800
|
)
|
(390
|
)
|
||||||||||
|
Provision for Loan Losses
|
||||||||||||||||||||
|
Charged to Expense
|
845
|
|
1,302
|
|
1,783
|
|
1,671
|
|
513
|
|
||||||||||
|
Balance at End of Period
|
$
|
15,003
|
|
$
|
14,689
|
|
$
|
14,014
|
|
$
|
13,272
|
|
$
|
12,401
|
|
|||||
|
Asset Quality Ratios:
|
||||||||||||||||||||
|
Net Charged-offs to Average Loans
|
0.05
|
%
|
0.06
|
%
|
0.09
|
%
|
0.07
|
%
|
0.04
|
%
|
||||||||||
|
Provision for Loan Losses to Average Loans
|
0.08
|
%
|
0.11
|
%
|
0.16
|
%
|
0.16
|
%
|
0.05
|
%
|
||||||||||
|
Allowance for Loan Losses to Period-end Loans
|
1.33
|
%
|
1.28
|
%
|
1.26
|
%
|
1.20
|
%
|
1.19
|
%
|
||||||||||
|
Allowance for Loan Losses to Nonperforming Loans
|
197.10
|
%
|
300.57
|
%
|
300.73
|
%
|
338.05
|
%
|
567.81
|
%
|
||||||||||
|
Nonperforming Loans to Period-end Loans
|
0.67
|
%
|
0.43
|
%
|
0.42
|
%
|
0.35
|
%
|
0.21
|
%
|
||||||||||
|
Nonperforming Assets to Period-end Assets
|
0.41
|
%
|
0.26
|
%
|
0.26
|
%
|
0.30
|
%
|
0.15
|
%
|
||||||||||
#
32
ALLOCATION OF THE ALLOWANCE FOR LOAN LOSSES
(Dollars in Thousands)
|
2011
|
2010
|
2009
|
2008
|
2007
|
|||||||||||||||
|
Commercial
|
$
|
2,874
|
|
$
|
2,037
|
|
$
|
1,304
|
|
$
|
1,735
|
|
$
|
1,634
|
|
||||
|
Real Estate-Commercial
|
3,167
|
|
3,128
|
|
4,000
|
|
3,568
|
|
3,247
|
|
|||||||||
|
Real Estate-Residential Mortgage
|
3,065
|
|
3,163
|
|
2,954
|
|
2,610
|
|
2,320
|
|
|||||||||
|
Automobile and Other Consumer
|
4,819
|
|
5,088
|
|
4,901
|
|
4,859
|
|
4,369
|
|
|||||||||
|
Unallocated
|
1,078
|
|
1,273
|
|
855
|
|
500
|
|
831
|
|
|||||||||
|
Total
|
$
|
15,003
|
|
$
|
14,689
|
|
$
|
14,014
|
|
$
|
13,272
|
|
$
|
12,401
|
|
||||
III. NONINTEREST INCOME
The majority of our noninterest income constitutes fee income from services, principally fees and commissions from fiduciary services, deposit account service charges, insurance commissions, and other recurring fee income. Net gains or losses on the sale of securities available-for-sale is another category of noninterest income.
ANALYSIS OF NONINTEREST INCOME
(Dollars In Thousands)
|
Years Ended December 31,
|
Change From Prior Year
|
||||||||||||||||||||||||
|
2010 to 2011
|
2009 to 2010
|
||||||||||||||||||||||||
|
2011
|
2010
|
2009
|
Amount
|
%
|
Amount
|
%
|
|||||||||||||||||||
|
Income from Fiduciary Activities
|
$
|
6,113
|
|
$
|
5,391
|
|
$
|
5,009
|
|
$
|
722
|
|
13.4
|
%
|
$
|
382
|
|
7.6
|
%
|
||||||
|
Fees for Other Services to Customers
|
8,034
|
|
7,864
|
|
8,051
|
|
170
|
|
2.2
|
%
|
(187
|
)
|
(2.3
|
)%
|
|||||||||||
|
Net Gain on Securities Transactions
|
2,795
|
|
1,507
|
|
357
|
|
1,288
|
|
85.5
|
%
|
1,150
|
|
322.1
|
%
|
|||||||||||
|
Other-Than-Temporary Impairment (OTTI) on Investment Securities
|
—
|
|
—
|
|
(375
|
)
|
—
|
|
—
|
%
|
375
|
|
100.0
|
%
|
|||||||||||
|
Net Gain on Sale of Merchant Bank Card Processing
|
—
|
|
—
|
|
2,966
|
|
—
|
|
—
|
%
|
(2,966
|
)
|
(100.0
|
)%
|
|||||||||||
|
Income from Restitution Payment
|
—
|
|
—
|
|
450
|
|
—
|
|
—
|
%
|
(450
|
)
|
(100.0
|
)%
|
|||||||||||
|
Insurance Commissions
|
7,374
|
|
2,987
|
|
2,412
|
|
4,387
|
|
146.9
|
%
|
575
|
|
23.8
|
%
|
|||||||||||
|
Net Gain on Sales of Loans
|
866
|
|
1,024
|
|
418
|
|
(158
|
)
|
(15.4
|
)%
|
606
|
|
145.0
|
%
|
|||||||||||
|
Other Operating Income
|
746
|
|
316
|
|
304
|
|
430
|
|
136.1
|
%
|
12
|
|
3.9
|
%
|
|||||||||||
|
Total Noninterest Income
|
$
|
25,928
|
|
$
|
19,089
|
|
$
|
19,592
|
|
$
|
6,839
|
|
35.8
|
%
|
$
|
(503
|
)
|
(2.6
|
)%
|
||||||
2011 compared to 2010:
Total noninterest income in the just completed year was $25.9 million, an increase of $6.8 million, or 35.8%, from total noninterest income of $19.1 million for 2010. The total for both the 2011 and 2010 periods included net gains on securities transactions of $2.8 million and $1.5 million, respectively. However the additions of the Upstate and McPhillips insurance agencies in 2011 had the greatest impact on the increase in noninterest income. Our insurance commissions increased by $4.4 million (or 147%) between the two comparative periods.
Assets under trust administration and investment management at December 31, 2011 were $973.6 million, down somewhat from the prior year-end balance of $984.4 million. However, income from fiduciary services for 2011 increased by $722 thousand, or 13.4%, above the total for 2010, primarily because the average dollar amount of assets under trust administration during 2011 exceeded the average dollar amount during 2010. The year-end total of assets under administration for 2011 was lower than the year-end total for 2010 because, at the end of the third quarter of 2011, the U.S. stock markets experienced a sharp downturn; the average for 2011, however, continued to exceed the 2010 average. A significant portion of our fiduciary fees is indexed to the dollar amount of assets under administration. Any significant downturn in the U.S. stock markets in future periods would likely have a corresponding negative impact on our income from fiduciary activities.
Fees for other services to customers (primarily service charges on deposit accounts, revenues related to the sale of mutual funds to our customers by third party providers and servicing income on sold loans) were $8.0 million for 2011, an increase of $170 thousand, or 2.2%, from 2010. The increase between the two periods in fees for other services to customers was attributable to an increase in revenues derived from third-party mutual fund sales and to an increase in income from debit card transactions, which increased from $2.3 million for 2010 to $2.5 million for 2011. Effective October 1, 2011 VISA announced debit interchange rates and related modifications to comply with new Debit Regulatory Requirements. This reduced rate structure is expected to result in a slight reduction in our fee income. However, debit card usage by our customers continues to grow which is expected to partially offset the reduced rates. We do not believe that the new law's limits on debit transaction interchange fees will have a material adverse impact on our financial condition or results of operations in future periods. These two increases were offset, in part, by a decrease in fee income from service charges on deposit accounts.
Insurance commissions first became a significant source of noninterest income for us following our 2004 acquisition of an insurance agency, Capital Financial Group, Inc. Capital Financial specializes in selling and servicing group health care policies as
#
33
well as life insurance. On April 1, 2010, we acquired a second insurance agency, Loomis & LaPann, Inc., which sells property and casualty insurance to retail customers in our service area and sports insurance products to various sports organizations. In February of 2011, we acquired our third insurance agency, the Upstate Agency, also a property and casualty insurance agency, and in August 2011 we acquired and consolidated two affiliated insurance agencies, the McPhillips Agencies, also sellers of property and casualty insurance. All of these acquired agencies do business within the service areas of our banks. We expect that noninterest income from insurance commissions will continue to represent a growing portion of our net income in upcoming periods, both absolutely and as a percentage of our total net income, as a result of our recent expansion of this line of business and possible future expansion by acquisition, if favorable opportunities should arise.
Starting with the third quarter of 2010, we began to resell most of our newly originated residential real estate loans into the secondary market (i.e., to Freddie Mac), which generates additional noninterest income in the form of net gains on sales of loans. We are unable to predict at what rate we may continue to resell loan originations in future periods versus holding such loans and thereby augmenting our own portfolio. Much depends on the volume of originations, the rates attaching thereto, the ready availability of sale thereof into the secondary market and the pricing of such sales. We generally retain servicing rights for loans originated and sold by us, which generates additional noninterest income (fees for other services to customers). Other operating income includes net gains on the sale of other real estate owned as well as other miscellaneous revenues.
2010 compared to 2009:
Total noninterest income decreased $503 thousand, or 2.6%, from 2009 to 2010. Two significant transactions involving noninterest income that occurred in 2009 were: 1) the net gain on the sale of our merchant bank card processing to TransFirst in the first quarter of 2009 and, 2) the write-down of an inactively-traded common stock in 2009. Other transactions are listed in the table on page 33.
For 2010, income from fiduciary activities increased $382 thousand, or 7.6%, from 2009. The increase reflected a recovery in the dollar amount of assets under administration, largely a result of the general rebound in the U.S. equity and debt markets during 2010. At period-end 2010, the market value of assets under trust administration and investment management amounted to $984.4 million, an increase of $117.2 million, or 13.5%, from period-end 2009. A significant portion of our fiduciary fees are indexed to the market value of assets under administration.
Fees for other services to customers (primarily service charges on deposit accounts, revenues related to the sale of mutual funds to our customers by third party providers and servicing income on sold loans) were $7.9 million for 2010, a decrease of $187 thousand, or 2.3%, from 2009. The decrease between the two periods in fees for other services to customers was in part the result of a modest decline in revenues derived from third-party mutual fund sales. The decrease also reflected the fact that the total for the 2009 period included income from our merchant credit card processing business prior to our sale of that business at the end of the first quarter of 2009; no income from that business was earned by us in 2010. Income from debit card transactions increased from $2.0 million for 2009 to $2.3 million for 2010.
As noted in the foregoing section, “2011 compared to 2010,” insurance commissions first became a significant source of noninterest income for us following our 2004 acquisition of Capital Financial Group, Inc., an insurance agency specializes in selling and servicing group health care policies as well as life insurance, but was augmented as a source of income in April 2010, when we acquired a second insurance agency, Loomis & LaPann, Inc., which sells primarily property and casualty insurance. This second agency acquisition led to an increase in our noninterest income from insurance commissions between 2009 and 2010.
The volume of our sales of loan originations decreased after the second quarter of 2009 until the third quarter of 2010, when we resumed reselling most of our newly originated residential real estate loan originations into the secondary market (i.e., to Freddie Mac). Thus, our 2011 total net gains on sales of loans lagged on 2010 total by approximately 15%. Other operating income includes net gains on the sale of other real estate owned as well as other miscellaneous revenues.
IV. NONINTEREST EXPENSE
Noninterest expense is a means of measuring the delivery cost of services, products and business activities of a company. The key components of noninterest expense are presented in the following table.
ANALYSIS OF NONINTEREST EXPENSE
(Dollars In Thousands)
|
Years Ended December 31,
|
Change From Prior Year
|
||||||||||||||||||||||||
|
2010 to 2011
|
2009 to 2010
|
||||||||||||||||||||||||
|
2011
|
2010
|
2009
|
Amount
|
%
|
Amount
|
%
|
|||||||||||||||||||
|
Salaries and Employee Benefits
|
$
|
30,205
|
|
$
|
27,552
|
|
$
|
27,042
|
|
$
|
2,653
|
|
9.6
|
%
|
$
|
510
|
|
1.9
|
%
|
||||||
|
Occupancy Expense of Premises, Net
|
3,891
|
|
3,456
|
|
3,316
|
|
435
|
|
12.6
|
|
140
|
|
4.2
|
|
|||||||||||
|
Furniture and Equipment Expense
|
3,478
|
|
3,393
|
|
3,264
|
|
85
|
|
2.5
|
|
129
|
|
4.0
|
|
|||||||||||
|
FDIC Special Assessment
|
—
|
|
—
|
|
787
|
|
—
|
|
—
|
|
(787
|
)
|
(100.0
|
)
|
|||||||||||
|
FDIC Regular Assessment
|
1,292
|
|
1,982
|
|
1,987
|
|
(690
|
)
|
(34.8
|
)
|
(5
|
)
|
(0.3
|
)
|
|||||||||||
|
Amortization of Intangible Assets
|
510
|
|
271
|
|
324
|
|
239
|
|
88.2
|
|
(53
|
)
|
(16.4
|
)
|
|||||||||||
|
Prepayment Penalty on FHLB Advances
|
1,638
|
|
—
|
|
—
|
|
1,638
|
|
—
|
|
—
|
|
—
|
|
|||||||||||
|
Other Operating Expense
|
10,534
|
|
10,764
|
|
9,872
|
|
(230
|
)
|
(2.1
|
)
|
892
|
|
9.0
|
|
|||||||||||
|
Total Noninterest Expense
|
$
|
51,548
|
|
$
|
47,418
|
|
$
|
46,592
|
|
$
|
4,130
|
|
8.7
|
|
$
|
826
|
|
1.8
|
|
||||||
#
34
2011 compared to 2010
: Noninterest expense for 2011 amounted to $51.5 million, an increase of $4.1 million, or 8.7%, from 2010. However, the 2011 period includes a $1.6 million prepayment penalty from our prepayment of $40 million of FHLB advances. For 2011, our efficiency ratio was 58.23%. This ratio, which is a commonly used non-GAAP financial measure in the banking industry, is a comparative measure of a financial institution's operating efficiency. The efficiency ratio (a ratio where lower is better), as we define it, is the ratio of operating noninterest expense (excluding intangible asset amortization and the FHLB prepayment penalty) to net interest income (on a tax-equivalent basis) plus operating noninterest income (excluding net securities gains or losses). See the discussion on page 4 of this Report under the heading “Use of Non-GAAP Financial Measures.” The efficiency ratio as defined by the Federal Reserve Board and reported for banks in its "Peer Holding Company Performance Reports" excludes net securities gains or losses from the denominator (as does our calculation), but unlike our ratio does not exclude intangible asset amortization from the numerator, and thus tends to result in higher ratios than our definition. Our efficiency ratios in recent periods compared favorably to the ratios of our peer group, even as adjusted to add intangible asset amortization back into the numerator of our ratio (i.e., into our operating noninterest expense). For 2011, our peer group ratio was 70.03%, and our ratio (not adjusted) was 60.76%.
The financial results for 2011 include (i) five months of operations for the McPhillips Agency, which we acquired on August 1, 2011, (ii) eleven months of operations for Upstate Agency, which we acquired on February 1, 2011, and (iii) a full year of operations for Loomis and LaPann, which we acquired on April 1, 2010. The results for the prior year 2010 do not reflect any expense or income attributable to either Upstate or McPhillips, and only nine months of operations for Loomis and LaPann. All categories of noninterest expense, including amortization, experienced increases from the acquisition of the agencies in 2011 (and in mid-year 2010) except for FDIC and FICO assessments and the FHLB prepayment penalty. Thus, both the increase in noninterest expense for 2011, as well as in noninterest income for the year, discussed above, reflect expenses and income attributable to the recently acquired agencies.
Salaries and employee benefits expense increased by $2.7 million, or 9.6%, from 2010 to 2011. All full-time equivalent employees of the agencies acquired in 2011 continued employment with us after the acquisitions and the related expense is included in the 2011 expense total, but not the 2010 expense total.
Occupancy expense increased from 2010 to 2011. The increase was primarily attributable to increases in net rental expense, including offices rented by the recently acquired agencies. The increase in furniture and equipment expense was primarily attributable to data processing and equipment maintenance expenses. Arrow's banks and its subsidiaries sustained little or no physical damage due to tropical storm Irene in August 2011 allowing us to provide uninterrupted banking and financial services to our customers.
Risk-based FDIC assessments have increased since 2008 in response to the current financial crisis. In the completed quarter, we continued to pay the lowest possible rate. Beginning with the second quarter of 2011, the risk-based calculation for the premium converted to the new FDIC method, a method based on adjusted assets rather than deposits. That resulted in a 48% decrease in our FDIC insurance expense from the first quarter of 2011 to the second quarter of 2011.
Other operating expense remained essentially unchanged from 2010. This was the result of offsetting increases and decreases among a variety of operating categories.
2010 compared to 2009
: Noninterest expense for 2010 amounted to $47.4 million, an increase of $826 thousand, or 1.8%, from 2009. For 2010, the efficiency ratio for Arrow was 57.28%, an increase from the 2009 ratio of 55.64%. A similar ratio (total overhead expense to adjusted tax equivalent operating income) is presented in the Federal Reserve Board's Bank Holding Company Performance Report for December 31, 2010. Our 2010 ratio, 57.61%, compared favorably to the ratio for our peer group of 69.87%. For information on the calculation of our efficiency ratios, see pages 21 and 22 of this Report.
Salaries and employee benefits expense increased $510 thousand, or 1.9%, from 2009 to 2010. Salary expense increased $602 thousand, or 3.3%, from 2009, due primarily to staff increases from our acquisition of Loomis (7.9 FTE
'
s) and to normal merit increases. Employee benefits actually decreased slightly from year to year due to a decrease in pension expenses resulting from an increase in the expected investment return on the pension plan assets. The ratio of total personnel expense (salaries and employee benefits) to average assets was 1.46% for 2010, 2 basis points lower than the annualized ratio for our peer group of 1.48% at December 31, 2010.
Occupancy expense increased $140 thousand, or 4.2%, from 2009 to 2010. The increase was primarily attributable to an increase in building maintenance costs. Furniture and equipment expense increased by $129 thousand, or 4.0%, from 2009 to 2010. The increase was primarily attributable to increases in data processing expenses.
Changes in our FDIC insurance assessment and the 2009 FDIC special assessment were discussed earlier on page 25. Other operating expense increased from 2009 to 2010, by $688 thousand, or 6.8%. The increase was spread across a variety of operating expenses, most notably, legal and professional fees, telephone and director fees.
#
35
V. INCOME TAXES
The following table sets forth our provision for income taxes and effective tax rates for the periods presented.
INCOME TAXES AND EFFECTIVE RATES
(Dollars In Thousands)
|
Years Ended December 31,
|
Change From Prior Year
|
||||||||||||||||||||||||
|
2010 to 2011
|
2009 to 2010
|
||||||||||||||||||||||||
|
2011
|
2010
|
2009
|
Amount
|
%
|
Amount
|
%
|
|||||||||||||||||||
|
Provision for Income Taxes
|
$
|
9,714
|
|
$
|
9,754
|
|
$
|
9,790
|
|
$
|
(40
|
)
|
(0.4
|
)%
|
$
|
(36
|
)
|
(0.4
|
)%
|
||||||
|
Effective Tax Rate
|
30.7
|
%
|
30.8
|
%
|
31.0
|
%
|
(0.1
|
)%
|
(0.3
|
)
|
(0.2
|
)%
|
(0.6
|
)
|
|||||||||||
The provisions for federal and state income taxes amounted to $9.7 million for
2011
and $9.8 million for both
2010
and
2009
. The effective income tax rates for
2011
,
2010
and
2009
were 30.7%, 30.8% and 31.0%, respectively, with primary change in the effective rates reflecting changes in ratio of tax-exempt income to total income before taxes.
C. FINANCIAL CONDITION
I. INVESTMENT PORTFOLIO
Investment securities are classified as held-to-maturity, trading, or available-for-sale, depending on the purposes for which such securities are acquired and thereafter held. Securities held-to-maturity are debt securities that we have both the positive intent and ability to hold to maturity; such securities are stated at amortized cost. Debt and equity securities that are bought and held principally for the purpose of sale in the near term are classified as trading securities and are reported at fair value with unrealized gains and losses included in earnings. Debt and equity securities not classified as either held-to-maturity or trading securities are classified as available-for-sale and are reported at fair value with unrealized gains and losses excluded from earnings and reported net of taxes in accumulated other comprehensive income or loss. During
2011
,
2010
and
2009
, we held no trading securities. Set forth below is certain information about our securities available-for-sale portfolio and securities held-to-maturity portfolio.
Securities Available-for-Sale
:
The following table sets forth the carrying value of our securities available-for-sale portfolio at year-end
2011
,
2010
and
2009
.
SECURITIES AVAILABLE-FOR-SALE
(In Thousands)
|
December 31,
|
|||||||||||
|
2011
|
2010
|
2009
|
|||||||||
|
U.S. Agency Obligations
|
$
|
116,393
|
|
$
|
98,173
|
|
$
|
123,331
|
|
||
|
State and Municipal Obligations
|
44,999
|
|
89,528
|
|
18,913
|
|
|||||
|
Collateralized Mortgage Obligations - Residential
|
149,669
|
|
166,964
|
|
199,781
|
|
|||||
|
Mortgage-Backed Securities - Residential
|
243,043
|
|
159,926
|
|
93,017
|
|
|||||
|
Corporate and Other Debt Securities
|
1,015
|
|
1,417
|
|
1,331
|
|
|||||
|
Mutual Funds and Equity Securities
|
1,419
|
|
1,356
|
|
1,333
|
|
|||||
|
Total
|
$
|
556,538
|
|
$
|
517,364
|
|
$
|
437,706
|
|
||
In all periods, Mortgage-Backed Securities-Residential consisted solely of mortgage pass-through securities issued or guaranteed by U.S. federal agencies. Pass-through securities provide to the investor monthly portions of principal and interest pursuant to the contractual obligations of the underlying mortgages. Collateralized Mortgage Obligations (
“
CMOs
”
) separate the repayments on mortgage-backed securities into two or more components (tranches), where each tranche has a separate estimated life and yield. Our practice has been to purchase only pass-through securities and CMOs that are issued or guaranteed by U.S. federal agencies, and the tranches of CMOs that we purchase generally are those having shorter maturities. Included in our Corporate and Other Debt Securities for each of the periods are corporate bonds that were highly rated at the time of purchase, although in some cases the securities had been downgraded before the reporting date.
#
36
The following table sets forth the maturities of our debt securities available-for-sale portfolio as of December 31, 2011. CMOs and other mortgage-backed securities are included in the table based on their expected average lives.
MATURITIES OF DEBT SECURITIES AVAILABLE-FOR-SALE
(In Thousands)
|
Within
One
Year
|
After
1 But
Within
5 Years
|
After
5 But
Within
10 Years
|
After
10 Years
|
Total
|
|||||||||||||||
|
U.S. Agency Obligations
|
$
|
34,058
|
|
$
|
82,335
|
|
$
|
—
|
|
$
|
—
|
|
$
|
116,393
|
|
||||
|
State and Municipal Obligations
|
10,962
|
|
30,378
|
|
1,115
|
|
2,544
|
|
44,999
|
|
|||||||||
|
Collateralized Mortgage Obligations - Residential
|
9,120
|
|
123,273
|
|
17,276
|
|
—
|
|
149,669
|
|
|||||||||
|
Mortgage-Backed Securities - Residential
|
2,423
|
|
208,441
|
|
23,308
|
|
8,871
|
|
243,043
|
|
|||||||||
|
Corporate and Other Debt Securities
|
—
|
|
15
|
|
—
|
|
1,000
|
|
1,015
|
|
|||||||||
|
Total
|
$
|
56,563
|
|
$
|
444,442
|
|
$
|
41,699
|
|
$
|
12,415
|
|
$
|
555,119
|
|
||||
The following table sets forth the tax-equivalent yields of our securities available-for-sale portfolio at December 31, 2011.
YIELDS ON SECURITIES AVAILABLE-FOR-SALE
(Fully Tax-Equivalent Basis)
|
Within
One
Year
|
After
1 But
Within
5 Years
|
After
5 But
Within
10 Years
|
After
10 Years
|
Total
|
|||||
|
U.S. Agency Obligations
|
0.85
|
0.77
|
—
|
—
|
0.79
|
||||
|
State and Municipal Obligations
|
1.72
|
2.00
|
5.95
|
7.58
|
2.34
|
||||
|
Collateralized Mortgage Obligations - Residential
|
3.68
|
2.88
|
3.79
|
—
|
3.04
|
||||
|
Mortgage-Backed Securities - Residential
|
4.09
|
2.20
|
3.46
|
4.18
|
2.41
|
||||
|
Corporate and Other Debt Securities
|
—
|
1.00
|
—
|
3.12
|
3.09
|
||||
|
Mutual Funds and Equity Securities
|
—
|
—
|
—
|
4.72
|
4.72
|
||||
|
Total
|
1.60
|
2.10
|
3.66
|
4.81
|
2.23
|
||||
The yields on obligations of states and municipalities exempt from federal taxation were computed on a fully tax-equivalent basis using a marginal tax rate of 35%. The yields on other debt securities shown in the table above are calculated by dividing annual interest, including accretion of discounts and amortization of premiums, by the amortized cost of the securities at December 31, 2011. Dividend earnings derived from equity securities were adjusted to reflect applicable federal income tax exclusions.
At December 31, 2011 and 2010, the weighted average maturity was 3.0 and 4.5 years, respectively, for debt securities in the available-for-sale portfolio.
At December 31, 2011, the net unrealized gains on securities available-for-sale amounted to $11.3 million. The net unrealized gain or loss on such securities, net of tax, is reflected in accumulated other comprehensive income/loss. The net unrealized gains on securities available-for-sale was $6.2 million at December 31, 2010. For both periods, the net unrealized gain was primarily attributable to a decrease in market rates between the date of purchase and the balance sheet date resulting in higher valuations of the portfolio securities.
For further information regarding our portfolio of securities available-for-sale, see Note 3 to the Consolidated Financial Statements contained in Part II, Item 8 of this Report.
Securities Held-to-Maturity
:
The following table sets forth the carrying value of our portfolio of securities held-to-maturity (consisting exclusively of state and municipal obligations) at December 31 of each of the last three years.
SECURITIES HELD-TO-MATURITY
(In Thousands)
|
December 31,
|
|||||||||||
|
2011
|
2010
|
2009
|
|||||||||
|
State and Municipal Obligations
|
$
|
149,688
|
|
$
|
158,938
|
|
$
|
167,931
|
|
||
|
Corporate and Other Debt Securities
|
1,000
|
|
1,000
|
|
1,000
|
|
|||||
|
Total
|
$
|
150,688
|
|
$
|
159,938
|
|
$
|
168,931
|
|
||
#
37
For information regarding the fair value of our portfolio of securities held-to-maturity at December 31, 2011, see Note 3 to the Consolidated Financial Statements contained in Part II, Item 8 of this Report.
The following table sets forth the maturities of our portfolio of securities held-to-maturity as of December 31, 2011.
MATURITIES OF DEBT SECURITIES HELD-TO-MATURITY
(In Thousands)
|
Within
One Year
|
After 1 But
Within 5 Years
|
After 5 But
Within 10 Years
|
After
10 Years
|
Total
|
|||||||||||||||
|
State and Municipal Obligations
|
$
|
13,814
|
|
$
|
64,168
|
|
$
|
63,352
|
|
$
|
8,354
|
|
$
|
149,688
|
|
||||
|
Corporate and Other Debt Securities
|
—
|
|
—
|
|
—
|
|
1,000
|
|
1,000
|
|
|||||||||
|
Total
|
$
|
13,814
|
|
$
|
64,168
|
|
$
|
63,352
|
|
$
|
9,354
|
|
$
|
150,688
|
|
||||
The following table sets forth the tax-equivalent yields of our portfolio of securities held-to-maturity at December 31, 2011.
YIELDS ON SECURITIES HELD-TO-MATURITY
(Fully Tax-Equivalent Basis)
|
Within
One Year
|
After 1 But
Within 5 Years
|
After 5 But
Within 10 Years
|
After
10 Years
|
Total
|
|||||
|
State and Municipal Obligations
|
4.20
|
3.81
|
5.11
|
6.11
|
4.53
|
||||
|
Corporate and Other Debt Securities
|
—
|
—
|
—
|
7.00
|
7.00
|
||||
|
Total
|
4.20
|
3.81
|
5.11
|
6.20
|
4.54
|
||||
The yields shown in the table above are calculated by dividing annual interest, including accretion of discounts and amortization of premiums, by the amortized cost of the securities at December 31, 2011. Yields on obligations of states and municipalities exempt from federal taxation (which constituted the entire portfolio) were computed on a fully tax-equivalent basis using a marginal tax rate of 35%.
During 2011, 2010 and 2009, we sold no securities from the held-to-maturity portfolio nor were there any transfers to or from the portfolio. The weighted-average maturity of the held-to-maturity portfolio was 4.2 and 5.3 years at year-end December 31, 2011 and 2010, respectively.
II. LOAN PORTFOLIO
The amounts and respective percentages of loans outstanding represented by each principal category on the dates indicated were as follows:
a. Types of Loans
(Dollars In Thousands)
|
December 31,
|
|||||||||||||||||||||||||||||
|
2011
|
2010
|
2009
|
2008
|
2007
|
|||||||||||||||||||||||||
|
Amount
|
%
|
Amount
|
%
|
Amount
|
%
|
Amount
|
%
|
Amount
|
%
|
||||||||||||||||||||
|
Commercial
|
$
|
99,791
|
|
9
|
$
|
97,621
|
|
8
|
$
|
89,222
|
|
8
|
$
|
86,872
|
|
8
|
$
|
79,128
|
|
8
|
|||||||||
|
Commercial Real Estate
–
Construction
|
11,083
|
|
1
|
7,090
|
|
1
|
15,336
|
|
1
|
22,525
|
|
2
|
30,305
|
|
3
|
||||||||||||||
|
Commercial Real Estate
–
Other
|
232,149
|
|
21
|
214,291
|
|
19
|
185,582
|
|
17
|
183,676
|
|
17
|
160,787
|
|
15
|
||||||||||||||
|
Consumer
–
Other
|
6,318
|
|
1
|
6,482
|
|
1
|
11,981
|
|
1
|
22,870
|
|
2
|
21,689
|
|
2
|
||||||||||||||
|
Consumer
–
Automobile
|
322,375
|
|
28
|
334,656
|
|
29
|
317,854
|
|
29
|
337,311
|
|
30
|
320,883
|
|
31
|
||||||||||||||
|
Residential Real Estate
|
459,741
|
|
40
|
485,368
|
|
42
|
492,175
|
|
44
|
456,558
|
|
41
|
426,052
|
|
41
|
||||||||||||||
|
Total Loans
|
1,131,457
|
|
100
|
1,145,508
|
|
100
|
1,112,150
|
|
100
|
1,109,812
|
|
100
|
1,038,844
|
|
100
|
||||||||||||||
|
Allowance for Loan Losses
|
(15,003
|
)
|
(14,689
|
)
|
(14,014
|
)
|
(13,272
|
)
|
(12,401
|
)
|
|||||||||||||||||||
|
Total Loans, Net
|
$
|
1,116,454
|
|
$
|
1,130,819
|
|
$
|
1,098,136
|
|
$
|
1,096,540
|
|
$
|
1,026,443
|
|
||||||||||||||
#
38
Maintenance of High Quality in the Loan Portfolio:
In the second half of 2008 and throughout most of 2009, the U.S. experienced significant disruption and volatility in its financial sector and capital markets. A major cause of the disruption was a significant decline in residential real estate values across much of the U.S., which, in turn, triggered widespread defaults on subprime mortgage loans and steep devaluations of portfolios containing these loans and securities collateralized by them. In mid-2009, as real estate values continued to fall in most areas of the U.S., problems spread from subprime loans to better quality mortgage portfolios, and in some cases prime mortgage loans, as well as home equity and credit card loans. In addition, in mid- to late-2009, commercial real estate values also began to decline and commercial real estate mortgage portfolios began to experience the same problems that previously beset residential mortgage portfolios. In 2010, the decline in residential and commercial property values eased in many markets, at least temporarily, due in part to federal tax incentive programs which encouraged home purchases. However, in late 2010 and through 2011, the general decline in residential property values resumed in many markets, which continues to the present. The continuing damage to asset portfolios remains a serious concern, which has been offset somewhat, particularly for larger diversified financial organizations, by the general stabilization in the equity markets following the sudden collapse of the markets in 2008-early 2009 and the subsequent sharp rebound in late 2009 and early 2010. Nevertheless, many lending institutions large and small have suffered sizable charge-offs and losses in their loan portfolios since 2008 as a result of their origination of or investment in residential and commercial real estate loans.
For a variety of reasons, we have largely been spared the negative impact on asset quality that many banks have suffered. Through the date of this Report, we have not experienced a significant deterioration in our loan portfolios. In general, we underwrite our residential real estate loans to secondary market standards for prime loans. We have never engaged in subprime mortgage lending as a business line and we do not extend or purchase any so-called “Alt-A,” “negative amortization,” “option ARM,” or “negative equity” mortgage loans. On occasion we have made loans to borrowers having a FICO score of 660 or below or have had extensions of credit outstanding to borrowers who have developed credit problems after origination resulting in deterioration of their FICO scores.
We also on occasion have extended community development loans to borrowers whose creditworthiness is below our normal standards as part of the community support program we have developed in fulfillment of our statutorily-mandated duty to support low- and moderate-income borrowers within our service area. However, we are a prime lender and apply prime lending standards and this, together with the fact that the service area in which we make most of our loans has not experienced as severe a decline in property values or economic conditions generally as other parts of the U.S., are the principal reasons that we have not to date experienced significant deterioration in our loan portfolio, including the real estate categories of our loan portfolio.
If, however, the current weakness in the U.S. economy persists or worsens, our region will continue to be negatively impacted from an economic and financial standpoint, and despite our conservative underwriting standards we may experience elevated charge-offs, higher provisions to our loan loss reserve, and increasing expense related to asset maintenance and supervision.
Residential Real Estate Loans
: In recent years, residential real estate and home equity loans have represented the largest single segment of our loan portfolio (comprising approximately 40% of the entire portfolio at year-end 2011), eclipsing both indirect loans (28% of the portfolio) and our commercial and commercial real estate loans (32%). Our gross originations for residential real estate loans were $75.0 million, $94.2 million and $91.9 million for the years 2011, 2010, and 2009, respectively. During the last quarter of 2008 and the first two quarters of 2009, as prevailing mortgage rates began to decline, we sold most of our mortgage originations in the secondary market. During the second half of 2009 and the first two quarters of 2010, for a variety of reasons, we once again began to retain most of the newly originated residential real estate loans in our loan portfolio, selling only a relatively small portion of the originations to Freddie Mac (with further reductions in the portfolio as a result of normal principal amortization and prepayments on pre-existing loans).
After April 2010, rates on conventional real estate mortgages continued to fall, even as demand for such mortgages (other than refinancings) remained relatively weak. In April 2010, the national average for 30-year conventional (fixed rate) mortgage loans was 5.21%, but by the last quarter of 2011 the national average had dropped below 4.00%, a relative decline of more than 20 percent
.
In response, we determined to resume selling most of our originations to Freddie Mac, amounting to $27.2 million for the last half of 2010 and $48.5 million for all of 2011. If the current low-rate environment for newly originated residential real estate loans persists, we may continue to sell a significant portion of our loan originations and, as a result, may even experience a decrease in our outstanding balances in this segment of our portfolio. Moreover, if our local economy or real estate market suffers further major downturns, the demand for residential real estate loans in our service area may decrease, which also may negatively impact our real estate portfolio and our financial performance.
Indirect Consumer Loans (primarily automobile loans)
: At December 31, 2011, indirect consumer loans (primarily automobile loans originated through dealerships located primarily in the eastern region of upstate New York) represented the third largest category of loans in our portfolio, but still a significant component of our business. In the early post-2000 years, indirect loans were the largest segment of our loan portfolio. For much of this period, these loans also were the fastest growing segment of our loan portfolio, both in terms of absolute dollar amount and as a percentage of the overall portfolio.
However, in the last quarter of 2007 and the first two quarters of 2008, we encountered enhanced rate competition on auto loans from other lenders, principally, the finance affiliates of the auto manufacturers who increased their offerings of heavily subsidized, low- or zero-rate loans. This increasingly competitive environment, combined with softening demand for vehicles, especially for SUVs and light trucks, had a tempering effect on our indirect originations, and we actually experienced decreases in these balances in the first two quarters of 2008. During the last two quarters of 2008, our share of the local indirect auto loan market increased somewhat as many of the major lenders in the indirect market, including the auto companies' financing affiliates, pulled back on their bargain rate lending programs. Our portfolio at December 31, 2008 exceeded the balance at December 31, 2007 by $19.5 million, or 5.7%. However, in 2009, despite the fact that automobile sales nationwide rose modestly (adjusting for the mid-year spike in sales under the federally subsidized “cash for clunkers” program), our outstanding balances of indirect loans steadily
#
39
declined from month-to-month. The reason was a combination of moderately competitive pressures on rates and a general weakening in the creditworthiness of loan applicants during the year. Our ending balance at December 31, 2009 was $28.1 million, or 7.8%, below the 2008 year-end balance. Originations of indirect loans for 2009 were approximately $127.8 million, a decrease of $50.0 million, or 36.7%, from 2008.
In the second quarter of 2010, we introduced more competitive financing rates and as a result experienced some growth in our indirect loan balances in both the second and third quarters of 2010, before balances declined again in the fourth quarter of 2010. Overall, our originations for 2010 were approximately $176.7 million. These indirect loan originations represented an increase of $48.9 million, or 38.3%, over the originations for 2009. During 2010, the borrowers on the newly originated indirect loans had an average credit score at origination of over 757
.
For 2011, our originations of indirect loans were $154.3 million, a decrease of $23.6 million, or 13.3%, from the total for 2010. Prepayments and normal amortization during the quarter exceeded our originations, and as a consequence the outstanding balance of our automobile loan portfolio decreased by $12.4 million, or 3.6%, during 2011.
In 2011, net charge-offs for our automobile loans were less than our net-charge offs for the 2010 period. Our experienced lending staff not only utilizes credit evaluation software tools but also reviews and evaluates each loan individually. We believe our disciplined approach to evaluating risk has contributed to maintaining our strong loan quality in this portfolio. However, if weakness in auto demand persists, our portfolio is likely to experience limited, if any, overall growth, either in real terms or as a percentage of the total portfolio, regardless of whether the auto company affiliates are offering highly-subsidized loans. Continuing weak demand for vehicle loans could negatively impact our financial performance.
Commercial, Commercial Real Estate and Construction and Land Development Loans:
Over the last several years, we have experienced moderate and occasionally strong demand for commercial and commercial real estate loans. These loan balances have generally increased, both in dollar amount and as a percentage of the overall loan portfolio. However, in response to the 2008-2009 crisis, demand for commercial loans began to ease and our outstanding balances at the end of 2009 were essentially unchanged from year-end 2008. During 2010, commercial loan demand began to revive in our market area and our balances increased by $28.9 million, or nearly 10.0%. In 2011 our balances grew at a respectable pace, increasing by $24.0 million, or at an annualized rate of 7.5%.
Substantially all commercial and commercial real estate loans in our portfolio are extended to businesses or borrowers located in our regional market. Many of the loans in the commercial portfolio have variable rates tied to prime, FHLBNY rates or U.S. Treasury indices. Although on a national scale the commercial real estate market suffered a major downturn in the 2008-2009 period from which it has not fully recovered, we have not experienced any significant weakening in the quality of our commercial loan portfolio in recent years.
It is entirely possible that we may yet experience a reduction in the demand for such loans and/or a weakening in the quality of our commercial and commercial real estate loan portfolio in upcoming periods. Generally, however, the corporate sector, at least in our service area, appears to be in reasonably good financial condition at present, except for the most highly leveraged business enterprises, to whom we normally do not extend credit of any sort.
Our greatest risk in our loan portfolio at present is not credit risk but interest rate risk, as rate compression for high-quality credits steadily erodes our ability to maintain healthy margins while protecting the strong quality of our loan portfolio.
The following table indicates the changing mix in our loan portfolio by including the quarterly average balances for our significant loan products for the past five quarters. The remaining quarter-by-quarter tables present the percentage of total loans represented by each category and the annualized tax-equivalent yield of each category.
LOAN PORTFOLIO
Quarterly Average Loan Balances
(Dollars In Thousands)
|
Quarter Ended
|
|||||||||||||||||||
|
Dec 2011
|
Sep 2011
|
Jun 2011
|
Mar 2011
|
Dec 2010
|
|||||||||||||||
|
Commercial and Commercial Real Estate
|
$
|
336,580
|
|
$
|
334,774
|
|
$
|
334,517
|
|
$
|
322,711
|
|
$
|
311,855
|
|
||||
|
Residential Real Estate
|
340,611
|
|
344,360
|
|
345,783
|
|
351,759
|
|
368,802
|
|
|||||||||
|
Home Equity
|
81,560
|
|
79,674
|
|
77,647
|
|
75,682
|
|
75,263
|
|
|||||||||
|
Consumer Loans - Automobile
|
334,561
|
|
326,287
|
|
334,518
|
|
343,329
|
|
353,758
|
|
|||||||||
|
Other Consumer Loans
1
|
33,140
|
|
34,289
|
|
35,541
|
|
37,058
|
|
38,211
|
|
|||||||||
|
Total Loans
|
$
|
1,126,452
|
|
$
|
1,119,384
|
|
$
|
1,128,006
|
|
$
|
1,130,539
|
|
$
|
1,147,889
|
|
||||
#
40
Percentage of Total Quarterly Average Loans
|
Quarter Ended
|
||||||||||||||
|
Dec 2011
|
Sep 2011
|
Jun 2011
|
Mar 2011
|
Dec 2010
|
||||||||||
|
Commercial and Commercial Real Estate
|
29.9
|
%
|
29.9
|
%
|
29.7
|
%
|
28.5
|
%
|
27.2
|
%
|
||||
|
Residential Real Estate
|
30.2
|
|
30.8
|
|
30.6
|
|
31.1
|
|
32.1
|
|
||||
|
Home Equity
|
7.3
|
|
7.1
|
|
6.9
|
|
6.7
|
|
6.6
|
|
||||
|
Consumer Loans - Automobile
|
29.7
|
|
29.2
|
|
29.6
|
|
30.4
|
|
30.8
|
|
||||
|
Other Consumer Loans
1
|
2.9
|
|
3.0
|
|
3.2
|
|
3.3
|
|
3.3
|
|
||||
|
Total Loans
|
100.0
|
%
|
100.0
|
%
|
100.0
|
%
|
100.0
|
%
|
100.0
|
%
|
||||
Quarterly Tax-Equivalent Yield on Loans
|
Quarter Ended
|
||||||||||||||
|
Dec 2011
|
Sep 2011
|
Jun 2011
|
Mar 2011
|
Dec 2010
|
||||||||||
|
Commercial and Commercial Real Estate
|
5.42
|
%
|
5.57
|
%
|
5.58
|
%
|
5.74
|
%
|
5.81
|
%
|
||||
|
Residential Real Estate
|
5.29
|
|
5.36
|
|
5.44
|
|
5.61
|
|
5.55
|
|
||||
|
Home Equity
|
2.96
|
|
2.97
|
|
2.96
|
|
3.00
|
|
3.04
|
|
||||
|
Consumer Loans - Automobile
|
4.83
|
|
4.95
|
|
5.10
|
|
5.25
|
|
5.41
|
|
||||
|
Other Consumer Loans
1
|
6.84
|
|
6.99
|
|
6.91
|
|
6.97
|
|
7.06
|
|
||||
|
Total Loans
|
5.07
|
|
5.18
|
|
5.26
|
|
5.41
|
|
5.46
|
|
||||
1
Other Consumer Loans includes certain home improvement loans secured by mortgages. However, these same loan balances are reported as
Residential Real Estate in the table of period-end balances on page 38, captioned
“
Types of Loans.
”
As the yield table above indicates, average rates across our portfolio have steadily declined over the last 5 quarters, in direct response to the Fed's maintaining historically low interest rates in its attempt to revive the economy, coupled with a general moderation of loan demand on the part of corporate and individual customers.
For the fourth quarter of 2011 the average yield on our loan portfolio declined by 39 basis points from the fourth quarter of 2010, from 5.46% to 5.07%. The decrease was exacerbated by extremely competitive pressures on rates for new commercial and commercial real estate loans as well as automobile loans and the decreasing rate environment generally. The yields on new 30 year fixed-rate residential real estate loans (the choice of most of our mortgage customers) remained very low during the quarter, so we continued to sell most of those originations to the secondary market, specifically, to Freddie Mac.
While average yields on the portfolio were dropping in 2011, our margins were also compressing. The decrease in average yield on our loan portfolio of 39 basis points was 19 basis points greater than the 20 basis point decline in our average cost of deposits from the last quarter of 2010 to the last quarter of 2011. We expect that average loan yields will continue to decline at a somewhat faster rate than our average cost of deposits, although further declines in yields for newly originated loans will likely be more limited, and represent a slower rate of decline in yields, than what we experienced in 2011.
In general, the yield (tax-equivalent interest income divided by average loans) on our loan portfolio and other earning assets has been impacted by changes in prevailing interest rates, as previously discussed in this Report beginning on page 29 under the heading "Impact of Interest Rate Changes." We expect that such will continue to be the case; that is, that loan yields will continue to rise and fall with changes in prevailing market rates, although the timing and degree of responsiveness will be influenced by a variety of other factors, including the extent of federal government and Federal Reserve participation in the home mortgage market, the makeup of our loan portfolio, the shape of the yield curve, consumer expectations and preferences, and the rate at which the portfolio expands. Additionally, there is a significant amount of cash flow from normal amortization and prepayments in all loan categories, and this cash flow reprices at current rates as new loans are generated at the current yields. Thus, even if prevailing rates do not fall significantly or at all in upcoming periods, our average rate on our portfolio may continue to decline as older credits in our portfolio mature and roll over or are redeployed into lower priced loans.
The following table indicates the respective maturities and interest rate structure of our commercial and commercial real estate - construction loans at December 31, 2011. For purposes of determining relevant maturities, loans are assumed to mature at (but not before) their scheduled repayment dates as required by contractual terms. Demand loans and overdrafts are included in the
“
Within 1 Year
”
maturity category. Most of the real estate - construction loans are made with a commitment for permanent financing, whether extended by us or unrelated third parties. The maturity distribution below reflects the final maturity of the permanent financing.
#
41
b. Maturities and Sensitivities of Loans to Changes in Interest Rates
(In Thousands)
|
Within
1 Year
|
After 1
But Within
5 Years
|
After
5 Years
|
Total
|
||||||||||||
|
Commercial
|
$
|
30,309
|
|
$
|
62,685
|
|
$
|
6,797
|
|
$
|
99,791
|
|
|||
|
Commercial Real Estate - Construction
|
7,444
|
|
3,428
|
|
211
|
|
11,083
|
|
|||||||
|
Total
|
$
|
37,753
|
|
$
|
66,113
|
|
$
|
7,008
|
|
$
|
110,874
|
|
|||
|
Fixed Interest Rates
|
$
|
9,028
|
|
$
|
32,440
|
|
$
|
5,837
|
|
$
|
47,305
|
|
|||
|
Variable Interest Rates
|
28,725
|
|
33,673
|
|
1,171
|
|
63,569
|
|
|||||||
|
Total
|
$
|
37,753
|
|
$
|
66,113
|
|
$
|
7,008
|
|
$
|
110,874
|
|
|||
COMMITMENTS AND LINES OF CREDIT
Stand-by letters of credit represent extensions of credit granted in the normal course of business, which are not reflected in the financial statements at a given date because the commitments are not funded at that time. As of December 31, 2011, our total contingent liability for standby letters of credit amounted to $11.6 million. In addition to these instruments, we also have issued lines of credit to customers, including home equity lines of credit, commitments for residential and commercial construction loans and other personal and commercial lines of credit, which also may be unfunded or only partially funded from time-to-time. Commercial lines, generally issued for a period of one year, are usually extended to provide for the working capital requirements of the borrower. At December 31, 2011, we had outstanding unfunded loan commitments in the aggregate amount of approximately $203.6 million.
c. Risk Elements
1. Nonaccrual, Past Due and Restructured Loans
The amounts of nonaccrual, past due and restructured loans for the past five years are presented in the table on page 32 under the heading
“
Summary of the Allowance and Provision for Loan Losses.
”
Loans are placed on nonaccrual status either due to the delinquency status of principal and/or interest or a judgment by management that the full repayment of principal and interest is unlikely. Loans secured by home equity lines of credit are put on nonaccrual status when 120 days past due; residential real estate loans when 150 days past due; commercial and commercial real estate loans are evaluated on a loan-by-loan basis and are placed on nonaccrual status when 90 days past due if the full collection of principal and interest is uncertain. Under the Uniform Retail Credit Classification and Account Management Policy established by banking regulators, fixed-maturity consumer loans not secured by real estate must generally be charged-off no later than when 120 days past due. Loans secured with non-real estate collateral in the process of collection are charged-down to the value of the collateral, less cost to sell. Open-end credits, residential real estate loans and commercial loans are evaluated for charge-off on a loan-by-loan basis when placed on nonaccrual status. We had no material commitments to lend additional funds on outstanding nonaccrual loans at December 31, 2011. Loans past due 90 days or more and still accruing interest are those loans which were contractually past due 90 days or more but because of expected repayments, were still accruing interest.
The balance of loans 30-89 days past due totaled $6.7 million at December 31, 2011 and represented 0.59% of loans outstanding at that date, as compared to approximately $8.6 million, or 0.73% of loans at December 31, 2010. These non-current loans at
December 31, 2011
were composed of approximately $4.2 million of consumer loans, principally indirect automobile loans, $1.7 million of residential real estate loans and $0.8 million of commercial and commercial real estate loans.
Prior to June 2011, banking regulators excluded modified consumer loans from the amount financial institutions were required to report as restructured loans. Beginning with the second quarter of 2011, all modified loans, as defined by generally accepted accounting principles, are reported as restructured loans in compliance with modified terms, unless the restructured loan is on nonaccrual status and is included with the reported amount of nonaccrual loans.
We evaluate nonaccrual loans over $250 thousand and all troubled debt restructured loans individually for impairment. All our impaired loans are measured based on either (i) the present value of expected future cash flows discounted at the loan's effective interest rate, (ii) the loan's observable market price or (iii) the fair value of the collateral, less cost to sell, if the loan is collateral dependent. We determine impairment for collateralized loans based on the fair value of the collateral less estimated cost to sell. For other loans, impairment is determined by comparing the recorded value of the loan to the present value of the expected cash flows, discounted at the loan's effective interest rate. We determine the interest income recognition method for impaired loans on a loan-by-loan basis. Based upon the borrowers' payment histories and cash flow projections, interest recognition methods include full accrual or cash basis. Our method for measuring all other loans is described in detail in Notes 1 and 4 to the consolidated financial statements.
Beginning in 2011, the loan note to the consolidated financial statements (beginning on page 69) now contains the detailed information on modified loans and impaired loans, that was formerly described in this section.
#
42
2. Potential Problem Loans
On at least a quarterly basis, we apply an internal credit quality rating system to commercial loans that are either past due or fully performing but exhibit certain characteristics that could reflect a potential weakness. Loans are placed on nonaccrual status when the likely amount of future principal and interest payments are expected to be less than the contractual amounts, even if such loans are not 90 days past due.
Periodically we review the loan portfolio for evidence of potential problem loans. Potential problem loans are loans that are currently performing in accordance with contractual terms, but where known information about possible credit problems of the borrower causes doubt about the ability of the borrower to comply with the loan payment terms and may result in disclosure of such loans as nonperforming at some time in the future. Through our on-going credit monitoring, we consider loans which, in our internal classification system, are classified as substandard but continue to accrue interest to be potential problem loans. At December 31, 2011, we identified 171 commercial relationships totaling $20.9 million as potential problem loans. At December 31, 2010, we identified 99 commercial relationships totaling $27.5 million as potential problem loans. Factors such as payment history, value of supporting collateral, and personal or government guarantees led us to conclude that the current risk exposure on these loans did not warrant accounting for the loans as nonperforming. Although in a performing status as of year-end, these loans exhibited certain risk factors, which have the potential to cause them to become nonperforming at some point in the future.
The overall level of our performing loans that demonstrate characteristics of potential weakness from time-to-time is for the most part dependent on economic conditions in northeastern New York State, which in turn are impacted at least in part by economic conditions in the U.S. generally. On both the regional and national level, economic conditions are much weaker at present than was the case in the 2007 and earlier periods. If weak economic conditions persist, potential problems loans likely will increase.
3
.
Foreign
Outstandings
- None
4. Loan Concentrations
The loan portfolio is well diversified. There are no concentrations of credit that exceed 10% of the portfolio, other than the general categories reported in the preceding Section C.II.a. of this Item 7. For further discussion, see Note 22 to the Consolidated Financial Statements in Part II, Item 8 of this Report.
5. Other Real Estate Owned and Repossessed Assets
Other real estate owned (
“
OREO
”
) primarily consists of real property acquired in foreclosure. OREO is carried at fair value less estimated cost to sell. We establish allowances for OREO losses, which are established and monitored on a property-by-property basis and reflect our ongoing estimate of the property's estimated fair value less costs to sell. For all periods, all OREO was held for sale. Repossessed assets for each of the five years in the table below consist of motor vehicles.
|
Distribution of OREO and Repossessed Assets
(In Thousands)
|
December 31,
|
||||||||||||||||||
|
2011
|
|
2010
|
|
2009
|
|
2008
|
|
2007
|
|
||||||||||
|
Single Family 1 - 4 Units
|
$
|
310
|
|
$
|
—
|
|
$
|
53
|
|
$
|
581
|
|
$
|
89
|
|
||||
|
Commercial Real Estate
|
150
|
|
—
|
|
—
|
|
—
|
|
—
|
|
|||||||||
|
Other Real Estate Owned, Net
|
460
|
|
—
|
|
53
|
|
581
|
|
89
|
|
|||||||||
|
Repossessed Assets
|
56
|
|
58
|
|
59
|
|
64
|
|
63
|
|
|||||||||
|
Total OREO and Repossessed Assets
|
$
|
516
|
|
$
|
58
|
|
$
|
112
|
|
$
|
645
|
|
$
|
152
|
|
||||
The following table summarizes changes in the net carrying amount of OREO for each of the periods presented.
|
Schedule of Changes in OREO
(In Thousands)
|
2011
|
|
2010
|
|
2009
|
|
2008
|
|
2007
|
|
|||||||||
|
Balance at Beginning of Year
|
$
|
—
|
|
$
|
53
|
|
$
|
581
|
|
$
|
89
|
|
$
|
248
|
|
||||
|
Properties Acquired Through Foreclosure
|
409
|
|
—
|
|
54
|
|
581
|
|
115
|
|
|||||||||
|
Transfer of Bank Property
|
150
|
|
—
|
|
—
|
|
—
|
|
—
|
|
|||||||||
|
Sales
|
(99
|
)
|
(53
|
)
|
(582
|
)
|
(89
|
)
|
(274
|
)
|
|||||||||
|
Balance at End of Year
|
$
|
460
|
|
$
|
—
|
|
$
|
53
|
|
$
|
581
|
|
$
|
89
|
|
||||
There was no allowance for OREO losses at year-end 2011, 2010 or 2009. For 2011, we started the year with no properties in OREO. During 2011, we acquired five new OREO properties as a result of foreclosure, transferred-in a former branch building owned by us, and sold one property, with the net result that we held five properties in OREO at year-end 2011, having an aggregate carrying amount as listed in the above table. During 2010, we did not acquire any properties through foreclosure and we sold the one property remaining at the end of 2009. We started 2009 with four properties in OREO. During the year we acquired one in 2009 and sold all four properties in inventory at the beginning of the year. We started 2008 with one property in OREO. During the year we acquired four more and sold one, ending the year with four properties. We started 2007 with two properties in OREO. During the year we acquired two more and sold three, ending the year with just one property.
#
43
III. SUMMARY OF LOAN LOSS EXPERIENCE
The information required in this section is presented in the discussion of the “Provision for Loan Losses and Allowance for Loan Losses” in Part II Item 7.B.II. beginning on page 32 of this Report, including:
|
•
|
Charge-offs and Recoveries by loan type
|
|
•
|
Factors that led to the amount of the Provision for Loan Losses
|
|
•
|
Allocation of the Allowance for Loan Losses by loan type
|
The percent of loans in each loan category is presented in the table of loan types in the preceding section on page 38 of this report.
IV. DEPOSITS
The following table sets forth the average balances of and average rates paid on deposits for the periods indicated.
AVERAGE DEPOSIT BALANCES
(Dollars In Thousands)
|
Years Ended December 31,
|
||||||||||||||||||||
|
2011
|
2010
|
2009
|
||||||||||||||||||
|
Average
Balance
|
Rate
|
Average
Balance
|
Rate
|
Average
Balance
|
Rate
|
|||||||||||||||
|
Demand Deposits
|
$
|
221,035
|
|
—
|
%
|
$
|
205,497
|
|
—
|
%
|
$
|
191,504
|
|
—
|
%
|
|||||
|
NOW Accounts
|
603,965
|
|
0.84
|
|
541,161
|
|
1.03
|
|
460,096
|
|
1.12
|
|
||||||||
|
Savings Deposits
|
409,398
|
|
0.46
|
|
361,949
|
|
0.59
|
|
307,133
|
|
0.68
|
|
||||||||
|
Time Deposits of $100,000 or More
|
122,897
|
|
2.14
|
|
133,770
|
|
2.17
|
|
155,378
|
|
2.39
|
|
||||||||
|
Other Time Deposits
|
238,865
|
|
2.15
|
|
249,192
|
|
2.37
|
|
249,575
|
|
2.94
|
|
||||||||
|
Total Deposits
|
$
|
1,596,160
|
|
1.07
|
|
$
|
1,491,569
|
|
1.28
|
|
$
|
1,363,686
|
|
1.34
|
|
|||||
During 2011 average deposit balances increased by $104.6 million, or 7.0%, over the average for 2010. The increase was generated from our pre-existing branch network.
During 2010 average deposit balances increased by $127.9 million, or 9.4%, over the average for 2009. The increase was generated from our pre-existing branch network, although we did open a new branch in Queensbury, New York during the year.
During 2009 average deposit balances increased by $109.8 million, or 8.8%, over the average for 2008. The increase was generated from our pre-existing branch network.
We did not sell or close any branches during the covered period, 2009-2011, although we did move our Salem branch to a better location. We did not hold any brokered deposits during 2011, 2010 and 2009.
The following table presents the quarterly average balance by deposit type for each of the most recent five quarters.
DEPOSIT PORTFOLIO
Quarterly Average Deposit Balances
(Dollars In Thousands)
|
Quarter Ended
|
|||||||||||||||||||
|
Dec 2011
|
|
Sep 2011
|
|
Jun 2011
|
|
Mar 2011
|
|
Dec 2010
|
|
||||||||||
|
Demand Deposits
|
$
|
222,988
|
|
$
|
231,276
|
|
$
|
217,851
|
|
$
|
211,788
|
|
$
|
212,126
|
|
||||
|
NOW Accounts
|
672,426
|
|
543,280
|
|
605,664
|
|
594,299
|
|
605,968
|
|
|||||||||
|
Savings Deposits
|
415,603
|
|
418,596
|
|
409,179
|
|
393,874
|
|
376,618
|
|
|||||||||
|
Time Deposits of $100,000 or More
|
125,679
|
|
124,055
|
|
123,179
|
|
118,583
|
|
124,284
|
|
|||||||||
|
Other Time Deposits
|
231,366
|
|
237,142
|
|
241,003
|
|
246,133
|
|
249,470
|
|
|||||||||
|
Total Deposits
|
$
|
1,668,062
|
|
$
|
1,554,349
|
|
$
|
1,596,876
|
|
$
|
1,564,677
|
|
$
|
1,568,466
|
|
||||
Fluctuations in balances of our NOW accounts and time deposits of $100,000 or more are largely the result of municipal deposit fluctuations. Municipal deposits on average represent 23% to 29% of our total deposits. Municipal deposits are typically placed in NOW accounts and time deposits of short duration. Many of our municipal deposit relationships are subject to annual renewal, by formal or informal agreements.
In general, there is a seasonal pattern to municipal deposits starting with a low point during July and August. Account balances tend to increase throughout the fall and into the winter months from tax deposits and receive an additional boost at the end of March from the electronic deposit of state funds. In addition to these seasonal fluctuations within types of accounts, the overall level of municipal deposit balances fluctuates from year-to-year as some municipalities move their accounts in and out of our banks due to competitive factors. Often, the balances of municipal deposits at the end of a quarter are not representative of the average
#
44
balances for that quarter.
For a variety of reasons, including the seasonality of municipal deposits, we typically experience little net growth or a small contraction in average deposit balances in the first quarter of each calendar year, versus significant growth in the second and fourth quarters. Deposit balances followed this general pattern for 2011, enhanced by the addition of new municipal account relationships throughout the year. We also experienced growth in our non-municipal account balances, primarily in NOW accounts and money market savings accounts.
We typically experience a shift within the mix of deposit categories during periods of significant interest rate increases or decreases. During periods of falling rates and very low rates, like the period from mid-2007 through the end of 2011, depositors tend to transfer maturing time deposits to nonmaturity interest-bearing deposit products. This continued during 2011. At December 31, 2011 time deposits represented 21.5% of total deposits, down from 24.0% at December 31, 2010. This was the lowest level since June 30, 2004 when it was 22.5% and compares to a high of 40.8% at June 30, 2000. We expect this shift from time deposits to nonmaturity deposit products to slow down or continue, if rates remain at their current low levels.
The total quarterly average balances as a percentage of total deposits are illustrated in the table below
|
Percentage of Total Quarterly Average Deposits
|
Quarter Ended
|
|||||||||||||
|
Dec 2011
|
|
Sep 2011
|
|
Jun 2011
|
|
Mar 2011
|
|
Dec 2010
|
|
|||||
|
Demand Deposits
|
13.4
|
%
|
14.9
|
%
|
13.7
|
%
|
13.5
|
%
|
13.5
|
%
|
||||
|
NOW Accounts
|
40.3
|
|
35.0
|
|
37.9
|
|
38.0
|
|
38.7
|
|
||||
|
Savings Deposits
|
24.9
|
|
26.9
|
|
25.6
|
|
25.2
|
|
24.0
|
|
||||
|
Time Deposits of $100,000 or More
|
7.5
|
|
8.0
|
|
7.7
|
|
7.6
|
|
7.9
|
|
||||
|
Other Time Deposits
|
13.9
|
|
15.2
|
|
15.1
|
|
15.7
|
|
15.9
|
|
||||
|
Total Deposits
|
100.0
|
%
|
100.0
|
%
|
100.0
|
%
|
100.0
|
%
|
100.0
|
%
|
||||
Time deposits of $100,000 or more are to a large extent comprised of municipal deposits and are typically obtained on a competitive bid basis.
|
Quarterly Cost of Deposits
|
Quarter Ended
|
|||||||||||||
|
Dec 2011
|
|
Sep 2011
|
|
Jun 2011
|
|
Mar 2011
|
|
Dec 2010
|
|
|||||
|
Demand Deposits
|
—
|
%
|
—
|
%
|
—
|
%
|
—
|
%
|
—
|
%
|
||||
|
NOW Accounts
|
0.76
|
|
0.78
|
|
0.90
|
|
0.91
|
|
0.97
|
|
||||
|
Savings Deposits
|
0.39
|
|
0.46
|
|
0.49
|
|
0.52
|
|
0.53
|
|
||||
|
Time Deposits of $100,000 or More
|
2.03
|
|
2.11
|
|
2.16
|
|
2.28
|
|
2.31
|
|
||||
|
Other Time Deposits
|
2.10
|
|
2.13
|
|
2.15
|
|
2.23
|
|
2.31
|
|
||||
|
Total Deposits
|
0.85
|
|
0.89
|
|
0.96
|
|
1.00
|
|
1.05
|
|
||||
In general, rates paid by us on various types of deposit accounts are influenced by the rates being offered or paid by our competitors, which in turn are influenced by prevailing interest rates in the economy as impacted from time to time by the actions of the Federal Reserve Bank. There typically is a time lag between the Federal Reserve
’
s actions undertaken to influence rates and the actual repricing of our deposit liabilities, although this lag is normally shorter than the lag between Federal Reserve rate actions and the repricing of our loans and other earning assets.
As demonstrated in the table above, we experienced a steady decrease in the cost of our deposits in each of the past 5 quarters following the period of falling interest rates from mid-2007 through the end of 2008. Although some maturing time deposits will continue to reprice at lower rates in forthcoming periods, the favorable reduction in the cost of deposits may not continue since most of our time deposits have already repriced to current rates and the rates on our nonmaturity deposit balances have already been reduced to (or nearly to) the lowest sustainable levels.
We do not use brokered deposits as a regular funding source and there were not any such balances carried during 2011, 2010 or 2009.
The maturities of time deposits of $100,000 or more at December 31, 2011 are presented below. (In Thousands)
|
Maturing in:
|
|||
|
Under Three Months
|
$
|
29,079
|
|
|
Three to Six Months
|
16,478
|
|
|
|
Six to Twelve Months
|
36,373
|
|
|
|
2013
|
14,248
|
|
|
|
2014
|
19,252
|
|
|
|
2015
|
5,285
|
|
|
|
2016
|
2,953
|
|
|
|
Total
|
$
|
123,668
|
|
#
45
D. LIQUIDITY
Our liquidity is measured by our ability to raise cash when we need it at a reasonable cost. We must be capable of meeting expected and unexpected obligations to our customers at any time. Given the uncertain nature of customer demands as well as the need to maximize earnings, we must have available reasonably priced sources of funds, on- and off-balance sheet, that can be accessed quickly in time of need.
Overnight investments in federal funds sold, interest bearing bank balances at the Federal Reserve Bank, and cash flow from investment securities and loans, both from normal repayment cash-flows and prepayments, and the ability to quickly pledge a substantial portion of our available marketable investment securities and loans to obtain funds, represent our primary sources of available liquidity. Certain investment securities are selected at purchase as available-for-sale based on their marketability and collateral value, as well as their yield and maturity. Our securities available-for-sale portfolio was $556.5 million at year-end 2011. Due to the potential for volatility in market values, we are not able to assume that large quantities of such securities could be sold at short notice at their carrying value to provide needed liquidity. But, if market conditions are favorable resulting in unrealized gains in the available-for-sale portfolio, we may pursue modest sales of such securities conducted in an orderly fashion to provide needed liquidity.
In addition to liquidity from short-term investments, investment securities and loans, we have supplemented available liquidity with additional off-balance sheet sources such as federal funds lines of credit and credit lines with the Federal Home Loan Bank of New York (
“
FHLBNY
”
). We have established federal funds lines of credit with three correspondent banks totaling $30 million, but did not draw on those lines during 2011.
Through our borrowing relationship with the FHLBNY, we have pledged collateral, including mortgage-backed securities and residential mortgage loans. Our unused borrowing capacity at the FHLBNY was $114.6 at December 31, 2011. During 2011, we used this facility for a short period. The average balance of these overnight advances was $5.3 million for 2011.
The average balance in other short-term borrowings for 2011 consisted entirely of treasury, tax and loan balances at the Federal Reserve Bank of New York, but by year-end 2011 the Federal Reserve had canceled this program.
In addition, we have identified brokered certificates of deposit as an appropriate off-balance sheet source of funding accessible in a relatively short time period. Also, our two bank subsidiaries have each established a borrowing facility with the Federal Reserve Bank of New York, pledging certain consumer loans as collateral for potential
“
discount window
”
advances. At December 31, 2011, the amount available under this facility was $244.7 million, but there were no advances then outstanding. We measure and monitor our basic liquidity as a ratio of liquid assets to short-term liabilities, both with and without the availability of borrowing arrangements. Based on the level of overnight funds investments, available liquidity from our investment securities portfolio, cash flow from our loan portfolio, our stable core deposit base and our significant borrowing capacity, we believe that our liquidity is sufficient to meet funding needs that may arise in connection with any reasonably likely events or occurrences.
During the past several quarters, our liquidity position has been strong, as depositors and investors in the wholesale funding markets have shown no hesitations on placing or maintaining their funds with our banks. In addition, management has consciously maintained a strong liquidity position by emphasizing its short maturity asset portfolios, including cash and due from banks, as opposed to investments in longer-term assets which might generate slightly higher rates but rates that are still historically low for the maturities in question. The financial markets have been challenging for many financial institutions, and in the view of many, lack of liquidity has been as great a problem as capital shortage. As a result, liquidity premiums have widened and many banks have experienced certain liquidity constraints, including substantially increased pricing to retain deposit balances. Because of Arrow's favorable credit quality and strong balance sheet, Arrow has not experienced any significant liquidity constraints through the date of this Report and has not been forced to pay premium rates to obtain retail deposits or other funds from any source.
Important Proposed Changes to Regulatory Capital and Liquidity Standards
In December, 2009, the Basel Committee on Banking Supervision (the “Basel Committee”) released a comprehensive list of proposals for changes to capital and liquidity requirements for banking institutions (commonly referred to as “Basel III”). In July 2010, the Basel Committee announced the design for its new capital and liquidity standards. These new Basel III capital and liquidity standards, when finalized, will affect our holding company and our banks, because they will be incorporated or reflected, directly or indirectly, in the new bank regulatory capital and liquidity requirements to be imposed in upcoming years by U.S. bank regulators on U.S. banks under U.S. banking law, specifically, under the provisions of the Dodd-Frank Act requiring enhanced bank capital and liquidity levels. That is, the Basel II capital and liquidity standards, when promulgated, will be important for us as well as for our banking competitors.
In September 2010, the oversight body of the Basel Committee announced minimum capital ratios and transition periods that provide for the following: (i) a new Tier 1 common equity standard requiring a minimum ratio of common equity to total risk-weighted assets of 4.5% (to be phased in by January 1, 2015), with common equity defined to include essentially only paid-in common stock amounts and retained earnings; (ii) an increased minimum Tier 1 capital ratio of 6.0%, up from 4.0% of risk-weighted assets (to be phased in by January 1, 2015); (iii) an additional minimum capital buffer of Tier 1 common equity equal to 2.5% of total risk-weighted assets (to be phased in between January 1, 2016 and January 1, 2019), which will bring the minimum Tier 1 common equity ratio to 7.0% and the minimum Tier 1 capital ratio to 8.5%); and (iv) a minimum leverage ratio of 3.0% (to be tested starting January 1, 2013). The proposals also narrow the definition of capital, excluding instruments that no longer qualify as Tier 1 common equity as of January 1, 2013, and phasing out from the definition of capital certain other instruments, including TRUPs, over several years.
The liquidity proposals under Basel III include: (i) a liquidity coverage ratio (to become effective January 1, 2015); and (ii) a net stable funding ratio (to become effective January 1, 2018). Each of these liquidity ratios, if implemented in accordance with the preliminary proposals disseminated by the bank regulatory authorities, may prove extremely challenging to banks generally, although the precise construction of the proposed liquidity measures remains very uncertain.
Many of the details of Basel III's new minimum capital ratios will remain uncertain until the Committee's proposals are ultimately
#
46
reviewed and ratified by the Group of 20 finance ministers. The final form of the liquidity measures is even more uncertain and subject to significant change in the rule promulgation process.
The final provisions of Basel III, as thus approved, must await final implementing regulations by U.S. regulators before they go into effect. The Dodd-Frank Act directs U.S. regulators to promulgate new capital and liquidity guidelines for banking institutions and implicitly directs that the new guidelines should comply at a minimum with the final Basel III standards. See the discussion of new capital standards in the “CAPITAL RESOURCES AND DIVIDENDS" section, below.
Because of the uncertainty surrounding these new capital and liquidity requirements, we are not able to predict at this time the content thereof or the impact that any changes in regulation may have on the Company.
E. CAPITAL RESOURCES AND DIVIDENDS
Stockholders' Equity:
Stockholders' equity was $166.4 million at December 31, 2011, an increase of $14.1 million, or 9.3%, from the prior year-end. The most significant positive changes to stockholders
'
equity included (a) net income of $21.9 million, (b) net unrealized gains in the valuation allowance for available-for-sale securities of $3.1 million, net of tax, (c) equity received from our various stock-based compensation plans of $2.5 million, offset, in part by (d) a net retirement plan losses reflected as a component of other comprehensive income of $3.3 million, (e) cash dividends of $11.4 million, and (f) purchases of our own common stock of $6.0 million.
Stock Repurchase Program
: At its annual meeting in April 2011, the Board of Directors approved a 12-month stock repurchase program authorizing the repurchase, at the discretion of senior management, of up to $5 million of Arrow's common stock over the ensuing one-year period in open market or privately negotiated transactions. This program replaced a similar $5 million stock repurchase program approved one year earlier, in April 2010, of which amount approximately $3.1 million was used to make repurchases prior to replacement of the 2010 program with the 2011 program. By December 31, 2011, nearly the entire $5.0 million of repurchases authorized under the April 2011 program had been expended, whereupon the Board of Directors authorized a new $5.0 million stock repurchase program, effective January 1, 2012, substantially identical to the April 2011 program, which would expire to the extent unused in 12 months, i.e., by year-end December 2012. As under the April 2011 program, management may affect stock repurchases under the January 2012 program from time-to-time in upcoming periods, to the extent that it believes the Company's stock is reasonably priced and such repurchases appear to be an attractive use of available capital and in the best interests of stockholders. At March 1, 2012, no shares had been acquired under the new 2012 program.
Regulatory Capital
: The following discussion of capital focuses on regulatory capital ratios, as defined and mandated for financial institutions by federal bank regulatory authorities. Regulatory capital, although a financial measure that is not provided for or governed by GAAP, nevertheless has been exempted by the SEC from the definition of "non-GAAP financial measures" in the SEC's Regulation G governing disclosure by registered companies of non-GAAP financial measures. Thus, certain information which is generally required to be presented in connection with our disclosure of non-GAAP financial measures need not be provided, and has not been provided, for the regulatory capital measures discussed below.
New Capital Standards to be Promulgated:
The discussion and disclosure below on regulatory capital is qualified in its entirety by reference to the fact that the Dodd-Frank Act, among other financial reforms, directed the federal bank regulatory authorities to promulgate new capital standards for all financial institutions, including banks like ours. These standards when adopted by regulators must be at least as strict (i.e., must establish minimum and target capital levels that are at least as high) as the preexisting regulatory capital standards for U.S. financial institutions or, if higher, any “commonly accepted capital standards” then in effect for financial institutions in the advanced economies generally, as defined in Dodd-Frank. The latter reference is generally understood as embracing the new, enhanced financial institution capital requirements that are currently being drafted and reviewed by the financial regulators for a consortium of the world's most advanced nations, including the U.S., and are expected to be implemented, in whole or in part, by those nations. These proposed new capital requirements, commonly known as Basel III, currently await final approval by the advanced nations (the Group of 20), but will be implemented by the participating nations, to the extent implemented, only over a relatively protracted time period. The Basel III standards, if approved and included in the new U.S. bank capital standards, ultimately may require significantly higher minimum levels of capital for U.S. financial institutions when fully implemented. See the discussion under “Important Proposed Changes to Regulatory Capital and Liquidity Standards,” above on page 46 of this Report.
Current Capital Standards:
Our holding company and our subsidiary banks are currently subject to two sets of regulatory capital measures, risk-based capital guidelines and a leverage ratio test. The risk-based guidelines assign risk weightings to all assets and certain off-balance sheet items of financial institutions, which generally results in a substantial discounting of low-risk or risk-free assets, that is, a significant dollar amount of such assets disappears from the balance sheet. The guidelines then establish an 8% minimum ratio of qualified total capital to risk-weighted assets. At least half of total capital must consist of "Tier 1" capital, which comprises common equity and common equity equivalents, retained earnings, a limited amount of permanent preferred stock and (for holding companies) a limited amount of trust preferred securities (see the discussion below on these securities), less intangible assets, net of associated deferred tax liabilities. Up to half of total capital may consist of so-called "Tier 2" capital, comprising a limited amount of subordinated debt, other preferred stock, certain other instruments and a limited amount of the allowance for loan losses.
The second regulatory capital measure, the leverage ratio test, establishes minimum limits on the ratio of Tier 1 capital to total tangible assets, without risk weighting (i.e, discounting). For top-rated companies, the minimum leverage ratio currently is 4%, but lower-rated or rapidly expanding companies may be required by bank regulators to meet substantially higher minimum leverage
#
47
ratios. Federal banking law mandates certain actions to be taken by banking regulators for financial institutions that are deemed undercapitalized as measured under regulatory capital guidelines. The law establishes five levels of capitalization for financial institutions ranging from "well-capitalized” (the highest ranking) to "critically undercapitalized" (the lowest ranking). Federal banking law also ties the ability of banking organizations to engage in certain types of non-banking financial activities to such organizations' continuing to qualify as "well-capitalized" under these standards.
Trust Preferred Securities Under Dodd-Frank:
In each of 2003 and 2004, we issued $10 million of trust preferred securities (TRUPs) in a private placement. Under the Federal Reserve Board's pre-existing rules on regulatory capital, TRUPs typically would qualify as Tier 1 capital for bank holding companies such as ours but only in amounts up to 25% of Tier 1 capital, net of goodwill less any associated deferred tax liability. Under the recently enacted Dodd-Frank Act, trust preferred securities issued by Arrow on or after the grandfathering sate set forth in Dodd-Frank (May 19, 2010) will no longer qualify as Tier 1 capital under the bank regulatory capital guidelines; however, our TRUPs outstanding immediately prior to the grandfathering cutoff date set forth in Dodd-Frank (May 19, 2010) may continue to qualify as Tier 1 capital, until the redemption or maturity thereof.
The table below sets forth the capital ratios of our holding company and subsidiary banks, Glens Falls National and Saratoga National, as of December 31, 2011:
|
Capital Ratios
:
|
Arrow
|
GFNB
|
SNB
|
|||||
|
Tier 1 Leverage Ratio
|
9.0
|
%
|
8.6
|
%
|
9.3
|
%
|
||
|
Tier 1 Risk-Based Capital Ratio
|
14.7
|
%
|
14.6
|
%
|
13.8
|
%
|
||
|
Total Risk-Based Capital Ratio
|
16.0
|
%
|
15.9
|
%
|
15.0
|
%
|
||
At December 31, 2011 our holding company and both banks exceeded the minimum capital ratios established by the regulatory guidelines, and qualified as "well-capitalized", the highest category, in the capital classification scheme set by federal bank regulatory agencies (see the further discussion under "Supervision and Regulation" in Part I Item 1.C. of this Report).
Although there is considerable current speculation in banking and financial circles that bank regulatory capital guidelines will likely be adjusted in forthcoming periods so as to require a greater degree of capital protection against sudden financial stress within banks, there is no consensus on what these enhanced capital standards will look like or over what period they will be imposed on the banking sectors.
The source of funds for the payment of stockholder dividends by our holding company consists primarily of dividends declared and paid to the holding company by our bank subsidiaries. In addition to regulatory constrictions on payments of dividends, there are statutory limitations applicable to the payment of dividends by our bank subsidiaries. As of December 31, 2011, under this statutory limitation, the maximum amount that could have been paid by the bank subsidiaries to the holding company, without special regulatory approval, was approximately $28.3 million. The ability of our holding company and our banks to pay dividends in the future is and will continue to be influenced by regulatory policies, capital guidelines and applicable laws.
See Part II, Item 5, "Market for the Registrant's Common Equity and Related Stockholder Matters and Issuer Purchases of Equity Securities" for a recent history of our cash dividend payments.
F. OFF-BALANCE SHEET ARRANGEMENTS
In the normal course of operations, we may engage in a variety of financial transactions or arrangements, including derivative transactions or arrangements, that in accordance with generally accepted accounting principles are not recorded in the financial statements, or are recorded in amounts that differ from the notional amounts. These transactions or arrangements involve, to varying degrees, elements of credit, interest rate, and liquidity risk. Such transactions or arrangements may be used by us or our customers for general corporate purposes, such as managing credit, interest rate, or liquidity risk or to optimize capital, or may be used by us or our customers to manage funding needs.
We have no off-balance sheet arrangements that are reasonably likely to have a material current or future effect on our financial condition, revenues or expenses, results of operations, liquidity or capital expenditures. As of December 31, 2011, we had no derivative securities, including interest rate swaps, credit default swaps, or equity puts or calls, in our investment portfolio.
#
48
G. CONTRACTUAL OBLIGATIONS (In Thousands)
|
Payments Due by Period
|
|||||||||||||||||||
|
Contractual Obligation
|
Total
|
Less Than
1 Year
|
1-3 Years
|
3-5 Years
|
More Than 5
Years
|
||||||||||||||
|
Long-Term Debt Obligations:
|
|||||||||||||||||||
|
Federal Home Loan Bank Advances
1
|
$
|
40,000
|
|
$
|
10,000
|
|
$
|
20,000
|
|
$
|
10,000
|
|
$
|
—
|
|
||||
|
Junior Subordinated Obligations
Issued to Unconsolidated
Subsidiary Trusts
2
|
20,000
|
|
—
|
|
—
|
|
—
|
|
20,000
|
|
|||||||||
|
Operating Lease Obligations
3
|
3,306
|
|
537
|
|
1,057
|
|
933
|
|
779
|
|
|||||||||
|
Obligations under Retirement Plans
4
|
30,891
|
|
2,821
|
|
5,741
|
|
6,165
|
|
16,164
|
|
|||||||||
|
Total
|
$
|
94,197
|
|
$
|
13,358
|
|
$
|
26,798
|
|
$
|
17,098
|
|
$
|
36,943
|
|
||||
1
See Note 9 to the Consolidated Financial Statements in Item 8 of this Report for additional information on Federal Home Loan Bank Advances, including call provisions.
2
See Note 10 to the Consolidated Financial Statements in Item 8 of this Report for additional information on Junior Subordinated Obligations Issued to Unconsolidated Subsidiary Trusts (trust preferred securities).
3
See Note 19 to the Consolidated Financial Statements in Item 8 of this Report for additional information on our Operating Lease Obligations.
4
See Note 14 to the Consolidated Financial Statements in Item 8 of this Report for additional information on our Retirement Plans
#
49
H. FOURTH QUARTER RESULTS
We reported net income of $5.4 million for the fourth quarter of 2011, an increase of $243 thousand, or 4.7%, from the fourth quarter of 2010. Diluted earnings per common share for the fourth quarter of 2011 were $.46, an increase of $.01, or 2.2%, from the $.45 amount for the fourth quarter of 2010. The net change in earnings was primarily affected by the following: (a) a $494 thousand decrease in tax-equivalent net interest income, (b) a $1.5 million increase in noninterest income, (c) a $103 thousand increase in the provision for loan losses, (d) a $685 thousand increase in noninterest expense, and (iii) a $12 thousand increase in the provision for income taxes. The factors contributing to these quarter-to-quarter changes are included in the discussion of the year-to-year changes elsewhere in this Report.
SELECTED FOURTH QUARTER FINANCIAL INFORMATION
(Dollars In Thousands, Except Per Share Amounts)
|
For the Quarters Ended
December 31,
|
|||||||
|
2011
|
2010
|
||||||
|
Interest and Dividend Income
|
$
|
18,347
|
|
$
|
20,646
|
|
|
|
Interest Expense
|
4,022
|
|
5,903
|
|
|||
|
Net Interest Income
|
14,325
|
|
14,743
|
|
|||
|
Provision for Loan Losses
|
280
|
|
177
|
|
|||
|
Net Interest Income after Provision for Loan Losses
|
14,045
|
|
14,566
|
|
|||
|
Noninterest Income
|
6,199
|
|
4,738
|
|
|||
|
Noninterest Expense
|
12,455
|
|
11,770
|
|
|||
|
Income Before Provision for Income Taxes
|
7,789
|
|
7,534
|
|
|||
|
Provision for Income Taxes
|
2,358
|
|
2,346
|
|
|||
|
Net Income
|
$
|
5,431
|
|
$
|
5,188
|
|
|
|
SHARE AND PER SHARE DATA:
|
|||||||
|
Weighted Average Number of Shares Outstanding:
|
|||||||
|
Basic
|
11,782
|
|
11,576
|
|
|||
|
Diluted
|
11,788
|
|
11,630
|
|
|||
|
Basic Earnings Per Common Share
|
$
|
0.46
|
|
0.45
|
|
||
|
Diluted Earnings Per Common Share
|
0.46
|
|
0.45
|
|
|||
|
Cash Dividends Per Common Share
|
0.25
|
|
0.24
|
|
|||
|
AVERAGE BALANCES:
|
|||||||
|
Assets
|
$
|
1,963,915
|
|
$
|
1,970,085
|
|
|
|
Earning Assets
|
1,849,891
|
|
1,884,402
|
|
|||
|
Loans
|
1,126,452
|
|
1,147,889
|
|
|||
|
Deposits
|
1,668,062
|
|
1,568,466
|
|
|||
|
Stockholders
’
Equity
|
168,293
|
|
154,677
|
|
|||
|
SELECTED RATIOS (Annualized):
|
|||||||
|
Return on Average Assets
|
1.10
|
%
|
1.04
|
%
|
|||
|
Return on Average Equity
|
12.80
|
%
|
13.31
|
%
|
|||
|
Net Interest Margin
1
|
3.25
|
%
|
3.30
|
%
|
|||
|
Net Charge-offs to Average Loans
|
0.07
|
%
|
0.04
|
%
|
|||
|
Provision for Loan Losses to Average Loans
|
0.10
|
%
|
0.06
|
%
|
|||
1
Net Interest Margin is the ratio of tax-equivalent net interest income to average earning assets. (See
“
Use of Non-GAAP Financial
Measures
”
on page 4).
#
50
SUMMARY OF QUARTERLY FINANCIAL DATA (Unaudited)
The following quarterly financial information for 2011 and 2010 is unaudited, but, in the opinion of management, fairly presents the results of Arrow.
SELECTED QUARTERLY FINANCIAL DATA
(In Thousands, Except Per Share Amounts)
|
2011
|
|||||||||||||||
|
First
Quarter
|
|
Second
Quarter
|
|
Third
Quarter
|
|
Fourth
Quarter
|
|
||||||||
|
Total Interest and Dividend Income
|
$
|
19,891
|
|
$
|
19,556
|
|
$
|
18,997
|
|
$
|
18,347
|
|
|||
|
Net Interest Income
|
14,554
|
|
14,581
|
|
14,652
|
|
14,325
|
|
|||||||
|
Provision for Loan Losses
|
220
|
|
170
|
|
175
|
|
280
|
|
|||||||
|
Net Securities Gains
|
542
|
|
482
|
|
1,771
|
|
—
|
|
|||||||
|
Income Before Provision for Income Taxes
|
7,635
|
|
8,468
|
|
7,755
|
|
7,789
|
|
|||||||
|
Net Income
|
5,281
|
|
5,849
|
|
5,372
|
|
5,431
|
|
|||||||
|
Basic Earnings Per Common Share
|
0.45
|
|
0.50
|
|
0.46
|
|
0.46
|
|
|||||||
|
Diluted Earnings Per Common Share
|
0.45
|
|
0.50
|
|
0.46
|
|
0.46
|
|
|||||||
|
2010
|
|||||||||||||||
|
First
Quarter
|
|
Second
Quarter
|
|
Third
Quarter
|
|
Fourth
Quarter
|
|
||||||||
|
Total Interest and Dividend Income
|
$
|
21,651
|
|
$
|
21,678
|
|
$
|
20,997
|
|
$
|
20,646
|
|
|||
|
Net Interest Income
|
15,711
|
|
15,655
|
|
15,168
|
|
14,743
|
|
|||||||
|
Provision for Loan Losses
|
375
|
|
375
|
|
375
|
|
177
|
|
|||||||
|
Net Securities Gains
|
—
|
|
878
|
|
618
|
|
11
|
|
|||||||
|
Income Before Provision for Income Taxes
|
7,814
|
|
8,306
|
|
7,992
|
|
7,534
|
|
|||||||
|
Net Income
|
5,415
|
|
5,714
|
|
5,575
|
|
5,188
|
|
|||||||
|
Basic Earnings Per Common Share
|
0.47
|
|
0.49
|
|
0.48
|
|
0.45
|
|
|||||||
|
Diluted Earnings Per Common Share
|
0.47
|
|
0.49
|
|
0.48
|
|
0.45
|
|
|||||||
Item 7A.
Quantitative and Qualitative Disclosures About Market Risk
In addition to credit risk in our loan portfolio and liquidity risk, discussed earlier, our business activities also generate market risk. Market risk is the possibility that changes in future market rates (interest rates) or prices (fees for products and services) will make our position less valuable. The ongoing monitoring and management of interest rate and market risk is an important component of our asset/liability management process, which is governed by policies that are reviewed and approved annually by the Board of Directors. The Board of Directors delegates responsibility for carrying out asset/liability oversight and control to management
'
s Asset/Liability Committee (
“
ALCO
”
). In this capacity ALCO develops guidelines and strategies impacting our asset/liability profile based upon estimated market risk sensitivity, policy limits and overall market interest rate levels and trends. We have not made use of derivatives, such as interest rate swaps, in our risk management process.
Interest rate risk is the most significant market risk affecting us. Interest rate risk is the exposure of our net interest income to changes in interest rates. Interest rate risk is directly related to the different maturities and repricing characteristics of interest-bearing assets and liabilities, as well as to the risk of prepayment of loans and early withdrawal of time deposits, and the fact that the speed and magnitude of responses to interest rate changes varies by product.
The ALCO utilizes the results of a detailed and dynamic simulation model to quantify the estimated exposure of net interest income to sustained interest rate changes. While ALCO routinely monitors simulated net interest income sensitivity over a rolling two-year horizon, it also utilizes additional tools to monitor potential longer-term interest rate risk.
The simulation model attempts to capture the impact of changing interest rates on the interest income received and interest expense paid on all interest-sensitive assets and liabilities reflected on our consolidated balance sheet. This sensitivity analysis is compared to ALCO policy limits which specify a maximum tolerance level for net interest income exposure over a one year horizon, assuming no balance sheet growth and a 200 basis point upward and a 100 basis point downward shift in interest rates, and a repricing of interest-bearing assets and liabilities at their earliest reasonably predictable repricing date. We normally apply a parallel and pro rata shift in rates over a 12 month period. However, at year-end 2011 the targeted federal funds rate remained where it had been since late 2009, a range of 0 to .25%, with assurances from the Fed that prevailing rates would remain at or near their current historically low rates at least through year-end 2014. Moreover, our average cost of deposits for 2011 had decreased to 1.07%. Thus, for purposes of our decreasing rate simulation, we applied a hypothetical 100 basis point downward shift in interest rates for the long end of the yield curve with hypothetical short-term rate decreases equal to the lesser of 100 basis points or such
#
51
lower rate decrease required to reach zero percent.
Applying the simulation model analysis as of December 31, 2011, a 200 basis point increase in interest rates demonstrated a 3.3% decrease in net interest income, and a 100 basis point/zero limit decrease in interest rates demonstrated a 1.1% decrease in net interest income. These amounts were well within our ALCO policy limits. Historically there has existed an inverse relationship between changes in prevailing rates and our net interest income, reflecting the fact that our liabilities and sources of funds generally reprice more quickly than our earning assets.
The preceding sensitivity analysis does not represent a forecast on our part and should not be relied upon as being indicative of expected operating results.
We continue to believe that any downturn in prevailing interest rates will generally have a short-term positive impact on our net interest margin and net interest income, which would be mitigated or perhaps reversed over the mid- to longer-term of ensuing rate decreases. We also believe an upturn in increases in prevailing rates will generally have a short-term negative impact on our margin and net interest income, which again would likely be mitigated or perhaps reversed as rates continue to rise over the medium- or long-term. We believe that, whether rates are generally increasing, decreasing or stable, changes in the slope of the yield curve will also affect net interest income and the net interest margin. Other things being equal, a more sharply sloping (upward) yield curve will generally have a positive impact on our net interest income and interest margin, whereas a flattening yield curve will generally have a negative impact. We are not able to predict with certainty what the magnitude of these effects taken together-that is, changes in rates, plus changes in the yield curve-would be in any particular case, especially if changes in rate and curve, taken independently, would normally work against each other (e.g., lower rates, combined with a flattening yield curve).
The hypothetical estimates underlying the sensitivity analysis are based upon numerous assumptions including: the nature and timing of changes in interest rates including yield curve shape, prepayments on loans and securities, deposit decay rates, pricing decisions on loans and deposits, reinvestment/replacement of asset and liability cash flows, and others. While assumptions are developed based upon current economic and local market conditions, we cannot make any assurance as to the predictive nature of these assumptions including how customer preferences or competitor influences might change.
Also, as market conditions vary from those assumed in the sensitivity analysis, actual results will differ due to: prepayment/refinancing levels likely deviating from those assumed, the varying impact of interest rate changes on caps or floors on adjustable rate assets, the potential effect of changing debt service levels on customers with adjustable rate loans, depositor early withdrawals and product preference changes, unanticipated shifts in the yield curve and other internal/external variables. Furthermore, the sensitivity analysis does not reflect actions that ALCO might take in responding to or anticipating changes in interest rates.
#
52
|
Item 8.
|
Financial Statements and Supplementary Data
|
The following audited consolidated financial statements and unaudited supplementary data are submitted herewith:
Reports of Independent Registered Public Accounting Firm
Financial Statements:
Consolidated Balance Sheets as of
December 31, 2011
and
2010
Consolidated Statements of Income for the Years Ended
December 31, 2011
,
2010
and
2009
Consolidated Statements of Comprehensive Income for the Years Ended
December 31, 2011
,
2010
and
2009
Consolidated Statements of Changes in Stockholders' Equity for the Years Ended
December 31, 2011
,
2010
and
2009
Consolidated Statements of Cash Flows for the Years Ended
December 31, 2011
,
2010
and
2009
Notes to Consolidated Financial Statements
Report of Independent Registered Public Accounting Firm
The Board of Directors and Stockholders
Arrow Financial Corporation:
We have audited the accompanying consolidated balance sheets of Arrow Financial Corporation and subsidiaries (the Company) as of
December 31, 2011
and
2010
, and the related consolidated statements of income, comprehensive income, changes in stockholders
’
equity and cash flows for each of the years in the three-year period ended
December 31, 2011
. These consolidated financial statements are the responsibility of the Company
’
s management. Our responsibility is to express an opinion on these consolidated financial statements based on our audits.
We conducted our audits in accordance with the standards of the Public Company Accounting Oversight Board (United States). Those standards require that we plan and perform the audit to obtain reasonable assurance about whether the financial statements are free of material misstatement. An audit includes examining, on a test basis, evidence supporting the amounts and disclosures in the financial statements. An audit also includes assessing the accounting principles used and significant estimates made by management, as well as evaluating the overall financial statement presentation. We believe that our audits provide a reasonable basis for our opinion.
In our opinion, the consolidated financial statements referred to above present fairly, in all material respects, the financial position of Arrow Financial Corporation and subsidiaries as of
December 31, 2011
and
2010
, and the results of their operations and their cash flows for each of the years in the three year period ended
December 31, 2011
, in conformity with U.S. generally accepted accounting principles.
We also have audited, in accordance with the standards of the Public Company Accounting Oversight Board (United States), the Company
’
s internal control over financial reporting as of
December 31, 2011
, based on criteria established in Internal Control
–
Integrated Framework issued by the Committee of Sponsoring Organizations of the Treadway Commission (COSO), and our report dated
March 13, 2012
, expressed an unqualified opinion on the effectiveness of the Company
’
s internal control over financial reporting.
/s/ KPMG LLP
Albany, New York
March 13, 2012
#
53
Report of Independent Registered Public Accounting Firm
The Board of Directors and Stockholders
Arrow Financial Corporation:
We have audited Arrow Financial Corporation and subsidiaries
’
(the Company) internal control over financial reporting as of
December 31, 2011
, based on criteria established in Internal Control
—
Integrated Framework issued by the Committee of Sponsoring Organizations of the Treadway Commission (COSO).The Company
’
s management is responsible for maintaining effective internal control over financial reporting and for its assessment of the effectiveness of internal control over financial reporting, included in the accompanying Management
’
s Report. Our responsibility is to express an opinion on the Company
’
s internal control over financial reporting based on our audit.
We conducted our audit in accordance with the standards of the Public Company Accounting Oversight Board (United States). Those standards require that we plan and perform the audit to obtain reasonable assurance about whether effective internal control over financial reporting was maintained in all material respects. Our audit included obtaining an understanding of internal control over financial reporting, assessing the risk that a material weakness exists, and testing and evaluating the design and operating effectiveness of internal control based on the assessed risk. Our audit also included performing such other procedures as we considered necessary in the circumstances. We believe that our audit provides a reasonable basis for our opinion.
A company's internal control over financial reporting is a process designed to provide reasonable assurance regarding the reliability of financial reporting and the preparation of financial statements for external purposes in accordance with generally accepted accounting principles. A company's internal control over financial reporting includes those policies and procedures that (1) pertain to the maintenance of records that, in reasonable detail, accurately and fairly reflect the transactions and dispositions of the assets of the company; (2) provide reasonable assurance that transactions are recorded as necessary to permit preparation of financial statements in accordance with generally accepted accounting principles, and that receipts and expenditures of the company are being made only in accordance with authorizations of management and directors of the company; and (3) provide reasonable assurance regarding prevention or timely detection of unauthorized acquisition, use, or disposition of the company
’
s assets that could have a material effect on the financial statements.
Because of its inherent limitations, internal control over financial reporting may not prevent or detect misstatements. Also, projections of any evaluation of effectiveness to future periods are subject to the risk that controls may become inadequate because of changes in conditions, or that the degree of compliance with the policies or procedures may deteriorate.
In our opinion, Arrow Financial Corporation and subsidiaries maintained, in all material respects, effective internal control over financial reporting as of
December 31, 2011
, based on criteria established in Internal Control
—
Integrated Framework issued by the Committee of Sponsoring Organizations of the Treadway Commission (COSO).
We also have audited, in accordance with the standards of the Public Company Accounting Oversight Board (United States), the consolidated balance sheets of Arrow Financial Corporation and subsidiaries as of
December 31, 2011
and
2010
, and the related consolidated statements of income, comprehensive income, changes in stockholders
’
equity, and cash flows for each of the years in the three-year period ended
December 31, 2011
, and our report dated
March 13, 2012
expressed an unqualified opinion on those consolidated financial statements.
/s/ KPMG LLP
Albany, New York
March 13, 2012
#
54
|
ARROW FINANCIAL CORPORATION AND SUBSIDIARIES
CONSOLIDATED BALANCE SHEETS
(In Thousands, Except Share and Per Share Amounts)
|
|||||||
|
|
December 31, 2011
|
December 31, 2010
|
|||||
|
ASSETS
|
|
|
|||||
|
Cash and Due From Banks
|
$
|
29,598
|
|
$
|
25,961
|
|
|
|
Interest-Bearing Deposits at Banks
|
14,138
|
|
5,118
|
|
|||
|
Investment Securities:
|
|
|
|||||
|
Available-for-Sale
|
556,538
|
|
517,364
|
|
|||
|
Held-to-Maturity (Approximate Fair Value of $159,059 at
December 31, 2011 and $162,713 at December 31, 2010)
|
150,688
|
|
159,938
|
|
|||
|
Other Investments
|
6,722
|
|
8,602
|
|
|||
|
Loans
|
1,131,457
|
|
1,145,508
|
|
|||
|
Allowance for Loan Losses
|
(15,003
|
)
|
(14,689
|
)
|
|||
|
Net Loans
|
1,116,454
|
|
1,130,819
|
|
|||
|
Premises and Equipment, Net
|
22,629
|
|
18,836
|
|
|||
|
Other Real Estate and Repossessed Assets, Net
|
516
|
|
58
|
|
|||
|
Goodwill
|
22,003
|
|
15,783
|
|
|||
|
Other Intangible Assets, Net
|
4,749
|
|
1,458
|
|
|||
|
Accrued Interest Receivable
|
6,082
|
|
6,512
|
|
|||
|
Other Assets
|
32,567
|
|
17,887
|
|
|||
|
Total Assets
|
$
|
1,962,684
|
|
$
|
1,908,336
|
|
|
|
LIABILITIES
|
|
|
|||||
|
Noninterest-Bearing Deposits
|
$
|
232,038
|
|
$
|
214,393
|
|
|
|
NOW Accounts
|
642,521
|
|
569,076
|
|
|||
|
Savings Deposits
|
416,829
|
|
382,130
|
|
|||
|
Time Deposits of $100,000 or More
|
123,668
|
|
120,330
|
|
|||
|
Other Time Deposits
|
228,990
|
|
248,075
|
|
|||
|
Total Deposits
|
1,644,046
|
|
1,534,004
|
|
|||
|
Federal Funds Purchased and
Securities Sold Under Agreements to Repurchase
|
26,293
|
|
51,581
|
|
|||
|
Other Short-Term Borrowings
|
—
|
|
1,633
|
|
|||
|
Federal Home Loan Bank Overnight Advances
|
42,000
|
|
—
|
|
|||
|
Federal Home Loan Bank Term Advances
|
40,000
|
|
130,000
|
|
|||
|
Junior Subordinated Obligations Issued to Unconsolidated Subsidiary Trusts
|
20,000
|
|
20,000
|
|
|||
|
Accrued Interest Payable
|
1,147
|
|
1,957
|
|
|||
|
Other Liabilities
|
22,813
|
|
16,902
|
|
|||
|
Total Liabilities
|
1,796,299
|
|
1,756,077
|
|
|||
|
STOCKHOLDERS’ EQUITY
|
|
|
|||||
|
Preferred Stock, $5 Par Value; 1,000,000 Shares Authorized
|
—
|
|
—
|
|
|||
|
Common Stock, $1 Par Value; 20,000,000 Shares Authorized
(16,094,277 Shares Issued at December 31, 2011 and
15,625,512 Shares Issued at December 31, 2010)
|
16,094
|
|
15,626
|
|
|||
|
Additional Paid-in Capital
|
207,600
|
|
191,068
|
|
|||
|
Retained Earnings
|
23,947
|
|
24,577
|
|
|||
|
Unallocated ESOP Shares (117,502 Shares at December 31, 2011 and
132,296 Shares at December 31, 2010)
|
(2,500
|
)
|
(2,876
|
)
|
|||
|
Accumulated Other Comprehensive Loss
|
(6,695
|
)
|
(6,423
|
)
|
|||
|
Treasury Stock, at Cost (4,213,470 Shares at December 31, 2011 and
4,237,435 shares at December 31, 2010)
|
(72,061
|
)
|
(69,713
|
)
|
|||
|
Total Stockholders’ Equity
|
166,385
|
|
152,259
|
|
|||
|
Total Liabilities and Stockholders’ Equity
|
$
|
1,962,684
|
|
$
|
1,908,336
|
|
|
See Notes to Consolidated Financial Statements.
#
55
|
ARROW FINANCIAL CORPORATION AND SUBSIDIARIES
CONSOLIDATED STATEMENTS OF INCOME
(In Thousands, Except Per Share Amounts)
|
||||||||||||
|
|
Years Ended December 31,
|
|||||||||||
|
|
2011
|
2010
|
2009
|
|||||||||
|
INTEREST AND DIVIDEND INCOME
|
|
|
||||||||||
|
Interest and Fees on Loans
|
$
|
58,599
|
|
$
|
64,283
|
|
$
|
66,427
|
|
|||
|
Interest on Deposits at Banks
|
99
|
|
157
|
|
149
|
|
||||||
|
Interest and Dividends on Investment Securities:
|
|
|
||||||||||
|
Fully Taxable
|
12,402
|
|
14,701
|
|
14,739
|
|
||||||
|
Exempt from Federal Taxes
|
5,691
|
|
5,831
|
|
5,542
|
|
||||||
|
Total Interest and Dividend Income
|
76,791
|
|
84,972
|
|
86,857
|
|
||||||
|
INTEREST EXPENSE
|
|
|
||||||||||
|
NOW Accounts
|
5,052
|
|
5,582
|
|
5,172
|
|
||||||
|
Savings Deposits
|
1,898
|
|
2,136
|
|
2,101
|
|
||||||
|
Time Deposits of $100,000 or More
|
2,633
|
|
2,903
|
|
3,718
|
|
||||||
|
Other Time Deposits
|
5,143
|
|
5,900
|
|
7,331
|
|
||||||
|
Federal Funds Purchased and
Securities Sold Under Agreements to Repurchase
|
74
|
|
124
|
|
129
|
|
||||||
|
Federal Home Loan Bank Advances
|
3,295
|
|
6,458
|
|
7,340
|
|
||||||
|
Junior Subordinated Obligations Issued to
Unconsolidated Subsidiary Trusts
|
584
|
|
592
|
|
701
|
|
||||||
|
Total Interest Expense
|
18,679
|
|
23,695
|
|
26,492
|
|
||||||
|
NET INTEREST INCOME
|
58,112
|
|
61,277
|
|
60,365
|
|
||||||
|
Provision for Loan Losses
|
845
|
|
1,302
|
|
1,783
|
|
||||||
|
NET INTEREST INCOME AFTER PROVISION FOR
LOAN LOSSES
|
57,267
|
|
59,975
|
|
58,582
|
|
||||||
|
NONINTEREST INCOME
|
|
|
||||||||||
|
Income From Fiduciary Activities
|
6,113
|
|
5,391
|
|
5,009
|
|
||||||
|
Fees for Other Services to Customers
|
8,034
|
|
7,864
|
|
8,051
|
|
||||||
|
Insurance Commissions
|
7,374
|
|
2,987
|
|
2,412
|
|
||||||
|
Net Gain on Securities Transactions
|
2,795
|
|
1,507
|
|
357
|
|
||||||
|
Net Gain on Sales of Loans
|
866
|
|
1,024
|
|
418
|
|
||||||
|
Other-Than-Temporary Impairment on Investment Securities
|
—
|
|
—
|
|
(375
|
)
|
||||||
|
Net Gain on Sale of Merchant Bank Card Processing
|
—
|
|
—
|
|
2,966
|
|
||||||
|
Other Operating Income
|
746
|
|
316
|
|
754
|
|
||||||
|
Total Noninterest Income
|
25,928
|
|
19,089
|
|
19,592
|
|
||||||
|
NONINTEREST EXPENSE
|
|
|
||||||||||
|
Salaries and Employee Benefits
|
30,205
|
|
27,552
|
|
27,042
|
|
||||||
|
Occupancy Expenses, Net
|
7,369
|
|
6,849
|
|
6,580
|
|
||||||
|
FDIC Assessments
|
1,292
|
|
1,982
|
|
2,774
|
|
||||||
|
Prepayment Penalty on FHLB Advances
|
1,638
|
|
—
|
|
—
|
|
||||||
|
Other Operating Expense
|
11,044
|
|
11,035
|
|
10,196
|
|
||||||
|
Total Noninterest Expense
|
51,548
|
|
47,418
|
|
46,592
|
|
||||||
|
INCOME BEFORE PROVISION FOR INCOME TAXES
|
31,647
|
|
31,646
|
|
31,582
|
|
||||||
|
Provision for Income Taxes
|
9,714
|
|
9,754
|
|
9,790
|
|
||||||
|
NET INCOME
|
$
|
21,933
|
|
$
|
21,892
|
|
$
|
21,792
|
|
|||
|
Average Shares Outstanding:
|
|
|
||||||||||
|
Basic
|
11,735
|
|
11,604
|
|
11,568
|
|
||||||
|
Diluted
|
11,747
|
|
11,639
|
|
11,620
|
|
||||||
|
Per Common Share:
|
|
|
||||||||||
|
Basic Earnings
|
$
|
1.87
|
|
$
|
1.89
|
|
$
|
1.88
|
|
|||
|
Diluted Earnings
|
1.87
|
|
1.88
|
|
1.88
|
|
||||||
Share and Per Share Amounts have been restated for the September 2011 3% stock dividend.
See Notes to Consolidated Financial Statements.
#
56
|
ARROW FINANCIAL CORPORATION AND SUBSIDIARIES
CONSOLIDATED STATEMENTS OF COMPREHENSIVE INCOME
(In Thousands)
|
|||||||||||
|
Years Ended December 31,
|
|||||||||||
|
2011
|
2010
|
2009
|
|||||||||
|
Net Income
|
$
|
21,933
|
|
$
|
21,892
|
|
$
|
21,792
|
|
||
|
Other Comprehensive Income (Loss), Net of Tax:
|
|||||||||||
|
Unrealized Securities Holding Gains Arising During the Period
|
4,741
|
|
1,514
|
|
707
|
|
|||||
|
Reclassification Adjustment for Net Securities Gains Included in Net Income
|
(1,688
|
)
|
(910
|
)
|
(215
|
)
|
|||||
|
Reclassification Adjustment for Other-Than-Temporary Impairment
|
—
|
|
—
|
|
226
|
|
|||||
|
Net Retirement Plan (Loss) Gain
|
(3,701
|
)
|
(1,093
|
)
|
1,483
|
|
|||||
|
Net Retirement Plan Prior Service (Cost) Credit
|
(161
|
)
|
146
|
|
(155
|
)
|
|||||
|
Amortization of Net Retirement Plan Actuarial Loss
|
602
|
|
672
|
|
827
|
|
|||||
|
Accretion of Net Retirement Plan Prior Service Credit
|
(65
|
)
|
(112
|
)
|
(109
|
)
|
|||||
|
Other Comprehensive (Loss) Income
|
(272
|
)
|
217
|
|
2,764
|
|
|||||
|
Comprehensive Income
|
$
|
21,661
|
|
$
|
22,109
|
|
$
|
24,556
|
|
||
See Notes to Consolidated Financial Statements.
#
57
ARROW FINANCIAL CORPORATION AND SUBSIDIARIES
CONSOLIDATED STATEMENTS OF CHANGES IN STOCKHOLDERS
’
EQUITY
(In Thousands, Except Share and Per Share Amounts)
|
|
|||||||||||||||||||||||||||
|
Common
Stock
|
Additional
Paid-In
Capital
|
Retained
Earnings
|
Unallo-cated ESOP
Shares
|
Accumu-lated
Other Com-
prehensive
Income
(Loss)
|
Treasury
Stock
|
Total
|
|||||||||||||||||||||
|
Balance at December 31, 2008
|
$
|
14,729
|
|
$
|
163,215
|
|
$
|
25,454
|
|
$
|
(2,572
|
)
|
$
|
(9,404
|
)
|
$
|
(65,620
|
)
|
$
|
125,802
|
|
||||||
|
Net Income
|
—
|
|
—
|
|
21,792
|
|
—
|
|
—
|
|
—
|
|
21,792
|
|
|||||||||||||
|
Other Comprehensive (Loss) Income
|
—
|
|
—
|
|
—
|
|
—
|
|
2,764
|
|
—
|
|
2,764
|
|
|||||||||||||
|
3% Stock Dividend (441,856 Shares)
|
441
|
|
12,065
|
|
(12,506
|
)
|
—
|
|
—
|
|
—
|
|
—
|
|
|||||||||||||
|
Cash Dividends Paid, $.92 per Share
1
|
—
|
|
—
|
|
(10,640
|
)
|
—
|
|
—
|
|
—
|
|
(10,640
|
)
|
|||||||||||||
|
Stock Options Exercised
(73,797 Shares)
|
—
|
|
545
|
|
—
|
|
—
|
|
—
|
|
633
|
|
1,178
|
|
|||||||||||||
|
Shares Issued Under the Directors’ Stock
Plan (4,603 Shares)
|
—
|
|
76
|
|
—
|
|
—
|
|
—
|
|
40
|
|
116
|
|
|||||||||||||
|
Shares Issued Under the Employee Stock
Purchase Plan (19,055 Shares)
|
—
|
|
302
|
|
—
|
|
—
|
|
—
|
|
164
|
|
466
|
|
|||||||||||||
|
Shares Issued for Dividend Reinvestment
Plans (66,924 Shares)
|
—
|
|
1,083
|
|
—
|
|
—
|
|
—
|
|
575
|
|
1,658
|
|
|||||||||||||
|
Stock-Based Compensation Expense
|
—
|
|
189
|
|
—
|
|
—
|
|
—
|
|
—
|
|
189
|
|
|||||||||||||
|
Tax Benefit for Disposition of
Stock Options
|
—
|
|
193
|
|
—
|
|
—
|
|
—
|
|
—
|
|
193
|
|
|||||||||||||
|
Purchase of Treasury Stock
(151,078 Shares)
|
—
|
|
—
|
|
—
|
|
—
|
|
—
|
|
(3,761
|
)
|
(3,761
|
)
|
|||||||||||||
|
Acquisition of Subsidiary (19,938 Shares)
|
—
|
|
373
|
|
—
|
|
—
|
|
—
|
|
169
|
|
542
|
|
|||||||||||||
|
Allocation of ESOP Stock (20,103 Shares)
|
—
|
|
151
|
|
—
|
|
368
|
|
—
|
|
—
|
|
519
|
|
|||||||||||||
|
Balance at December 31, 2009
|
$
|
15,170
|
|
$
|
178,192
|
|
$
|
24,100
|
|
$
|
(2,204
|
)
|
$
|
(6,640
|
)
|
$
|
(67,800
|
)
|
$
|
140,818
|
|
||||||
|
Balance at December 31, 2009
|
$
|
15,170
|
|
$
|
178,192
|
|
$
|
24,100
|
|
$
|
(2,204
|
)
|
$
|
(6,640
|
)
|
$
|
(67,800
|
)
|
$
|
140,818
|
|
||||||
|
Net Income
|
—
|
|
—
|
|
21,892
|
|
—
|
|
—
|
|
—
|
|
21,892
|
|
|||||||||||||
|
Other Comprehensive (Loss) Income
|
—
|
|
—
|
|
—
|
|
—
|
|
217
|
|
—
|
|
217
|
|
|||||||||||||
|
3% Stock Dividend (455,113 Shares)
|
456
|
|
9,962
|
|
(10,418
|
)
|
—
|
|
—
|
|
—
|
|
—
|
|
|||||||||||||
|
Cash Dividends Paid, $.95 per Share
1
|
—
|
|
—
|
|
(10,997
|
)
|
—
|
|
—
|
|
—
|
|
(10,997
|
)
|
|||||||||||||
|
Stock Options Exercised
(52,662 Shares)
|
—
|
|
352
|
|
—
|
|
—
|
|
—
|
|
446
|
|
798
|
|
|||||||||||||
|
Shares Issued Under the Directors’ Stock
Plan (5,587 Shares)
|
—
|
|
101
|
|
—
|
|
—
|
|
—
|
|
48
|
|
149
|
|
|||||||||||||
|
Shares Issued Under the Employee Stock
Purchase Plan (19,564 Shares)
|
—
|
|
310
|
|
—
|
|
—
|
|
—
|
|
165
|
|
475
|
|
|||||||||||||
|
Shares Issued for Dividend Reinvestment
Plans (66,177 Shares)
|
—
|
|
1,163
|
|
—
|
|
—
|
|
—
|
|
552
|
|
1,715
|
|
|||||||||||||
|
Stock-Based Compensation Expense
|
—
|
|
299
|
|
—
|
|
—
|
|
—
|
|
—
|
|
299
|
|
|||||||||||||
|
Tax Benefit for Disposition of
Stock Options
|
—
|
|
105
|
|
—
|
|
—
|
|
—
|
|
—
|
|
105
|
|
|||||||||||||
|
Purchase of Treasury Stock
(135,812 Shares)
|
—
|
|
—
|
|
—
|
|
—
|
|
—
|
|
(3,347
|
)
|
(3,347
|
)
|
|||||||||||||
|
Acquisition of Subsidiary (26,240 Shares)
|
—
|
|
459
|
|
—
|
|
—
|
|
—
|
|
223
|
|
682
|
|
|||||||||||||
|
Acquisition by ESOP of Arrow Stock
(40,890 Shares)
|
—
|
|
—
|
|
—
|
|
(1,000
|
)
|
—
|
|
—
|
|
(1,000
|
)
|
|||||||||||||
|
Allocation of ESOP Stock (17,616 Shares)
|
—
|
|
125
|
|
—
|
|
328
|
|
—
|
|
—
|
|
453
|
|
|||||||||||||
|
Balance at December 31, 2010
|
$
|
15,626
|
|
$
|
191,068
|
|
$
|
24,577
|
|
$
|
(2,876
|
)
|
$
|
(6,423
|
)
|
$
|
(69,713
|
)
|
$
|
152,259
|
|
||||||
#
58
|
ARROW FINANCIAL CORPORATION AND SUBSIDIARIES
CONSOLIDATED STATEMENTS OF CHANGES IN STOCKHOLDERS’ EQUITY, Continued
(In Thousand
s, Except Share and Per Share Amounts)
|
|||||||||||||||||||||||||||
|
Common
Stock
|
Additional
Paid-In
Capital
|
Retained
Earnings
|
Unallo-cated ESOP
Shares
|
Accumu-lated
Other Com-
prehensive
Income
(Loss)
|
Treasury
Stock
|
Total
|
|||||||||||||||||||||
|
Balance at December 31, 2010
|
$
|
15,626
|
|
$
|
191,068
|
|
$
|
24,577
|
|
$
|
(2,876
|
)
|
$
|
(6,423
|
)
|
$
|
(69,713
|
)
|
$
|
152,259
|
|
||||||
|
Net Income
|
—
|
|
—
|
|
21,933
|
|
—
|
|
—
|
|
—
|
|
21,933
|
|
|||||||||||||
|
Other Comprehensive (Loss) Income
|
—
|
|
—
|
|
—
|
|
—
|
|
(272
|
)
|
—
|
|
(272
|
)
|
|||||||||||||
|
3% Stock Dividend (468,765 Shares)
2
|
468
|
|
10,647
|
|
(11,115
|
)
|
—
|
|
—
|
|
—
|
|
—
|
|
|||||||||||||
|
Cash Dividends Paid, $.98 per Share
1
|
—
|
|
—
|
|
(11,448
|
)
|
—
|
|
—
|
|
—
|
|
(11,448
|
)
|
|||||||||||||
|
Stock Options Exercised
(72,802 Shares)
|
—
|
|
705
|
|
—
|
|
—
|
|
—
|
|
708
|
|
1,413
|
|
|||||||||||||
|
Shares Issued Under the Directors’ Stock
Plan (7,456 Shares)
|
—
|
|
104
|
|
—
|
|
—
|
|
—
|
|
71
|
|
175
|
|
|||||||||||||
|
Shares Issued Under the Employee Stock
Purchase Plan (20,484 Shares)
|
—
|
|
282
|
|
—
|
|
—
|
|
—
|
|
192
|
|
474
|
|
|||||||||||||
|
Shares Issued for Dividend Reinvestment
Plans (76,447 Shares)
|
—
|
|
1,062
|
|
—
|
|
—
|
|
—
|
|
734
|
|
1,796
|
|
|||||||||||||
|
Stock-Based Compensation Expense
|
—
|
|
354
|
|
—
|
|
—
|
|
—
|
|
—
|
|
354
|
|
|||||||||||||
|
Tax Benefit for Disposition of
Stock Options
|
—
|
|
51
|
|
—
|
|
—
|
|
—
|
|
—
|
|
51
|
|
|||||||||||||
|
Purchase of Treasury Stock
(251,962 Shares)
|
—
|
|
—
|
|
—
|
|
—
|
|
—
|
|
(6,039
|
)
|
(6,039
|
)
|
|||||||||||||
|
Acquisition of Subsidiaries (221,517 Shares)
|
—
|
|
3,275
|
|
—
|
|
—
|
|
—
|
|
1,986
|
|
5,261
|
|
|||||||||||||
|
Allocation of ESOP Stock (18,216 Shares)
|
—
|
|
52
|
|
—
|
|
376
|
|
—
|
|
—
|
|
428
|
|
|||||||||||||
|
Balance at December 31, 2011
|
$
|
16,094
|
|
$
|
207,600
|
|
$
|
23,947
|
|
$
|
(2,500
|
)
|
$
|
(6,695
|
)
|
$
|
(72,061
|
)
|
$
|
166,385
|
|
||||||
1
Cash
dividends paid per share have been adjusted for the September 2011
3% stock dividend.
2
Included in the shares issued for the 3% stock dividend in 2011 were treasury shares of 122,779 and unallocated ESOP shares of 3,422.
See Notes to Consolidated Financial Statements.
#
59
ARROW FINANCIAL CORPORATION AND SUBSIDIARIES
(Dollars in Thousands)
|
Years Ended December 31,
|
|||||||||||
|
Cash Flows from Operating Activities:
|
2011
|
2010
|
2009
|
||||||||
|
Net Income
|
$
|
21,933
|
|
$
|
21,892
|
|
$
|
21,792
|
|
||
|
Adjustments to Reconcile Net Income to Net Cash Provided by Operating Activities:
|
|||||||||||
|
Provision for Loan Losses
|
845
|
|
1,302
|
|
1,783
|
|
|||||
|
Depreciation and Amortization
|
6,509
|
|
3,563
|
|
2,813
|
|
|||||
|
Allocation of ESOP Stock
|
428
|
|
453
|
|
519
|
|
|||||
|
Gains on the Sale of Securities Available-for-Sale
|
(2,795
|
)
|
(1,507
|
)
|
(550
|
)
|
|||||
|
Losses on the Sale of Securities Available-for-Sale
|
—
|
|
—
|
|
193
|
|
|||||
|
Other-Than-Temporary Impairment
|
—
|
|
—
|
|
375
|
|
|||||
|
Loans Originated and Held-for-Sale
|
(39,111
|
)
|
(41,030
|
)
|
(24,490
|
)
|
|||||
|
Proceeds from the Sale of Loans Held-for-Sale
|
49,378
|
|
31,760
|
|
24,908
|
|
|||||
|
Net Gains on the Sale of Loans
|
(866
|
)
|
(1,024
|
)
|
(418
|
)
|
|||||
|
Net Loss (Gains) on the Sale of Premises and Equipment,
Other Real Estate Owned and Repossessed Assets
|
(32
|
)
|
10
|
|
(2
|
)
|
|||||
|
Contributions to Pension Plans
|
(5,319
|
)
|
(1,813
|
)
|
(2,304
|
)
|
|||||
|
Deferred Income Tax Expense
|
2,172
|
|
154
|
|
705
|
|
|||||
|
Shares Issued Under the Directors
’
Stock Plan
|
175
|
|
149
|
|
116
|
|
|||||
|
Stock-Based Compensation Expense
|
354
|
|
299
|
|
189
|
|
|||||
|
Net Decrease (Increase) in Other Assets
|
1,725
|
|
638
|
|
(5,672
|
)
|
|||||
|
Net (Decrease) Increase in Other Liabilities
|
689
|
|
(4,627
|
)
|
(625
|
)
|
|||||
|
Net Cash Provided By Operating Activities
|
36,085
|
|
10,219
|
|
19,332
|
|
|||||
|
Cash Flows from Investing Activities:
|
|||||||||||
|
Proceeds from the Sale of Securities Available-for-Sale
|
39,009
|
|
25,497
|
|
23,979
|
|
|||||
|
Proceeds from the Maturities and Calls of Securities Available-for-Sale
|
280,126
|
|
278,804
|
|
112,401
|
|
|||||
|
Purchases of Securities Available-for-Sale
|
(354,310
|
)
|
(382,614
|
)
|
(258,026
|
)
|
|||||
|
Proceeds from the Maturities and Calls of Securities Held-to-Maturity
|
40,692
|
|
15,227
|
|
26,772
|
|
|||||
|
Purchases of Securities Held-to-Maturity
|
(31,701
|
)
|
(6,532
|
)
|
(61,965
|
)
|
|||||
|
Net Decrease (Increase) in Loans
|
3,108
|
|
(24,259
|
)
|
(4,062
|
)
|
|||||
|
Proceeds from the Sales of Premises and Equipment, Other
Real Estate Owned and Repossessed Assets
|
770
|
|
612
|
|
1,299
|
|
|||||
|
Purchase of Premises and Equipment
|
(5,372
|
)
|
(1,081
|
)
|
(2,501
|
)
|
|||||
|
Cash Paid for Subsidiaries
|
(3,296
|
)
|
264
|
|
—
|
|
|||||
|
Net Decrease in Other Investments
|
1,880
|
|
333
|
|
—
|
|
|||||
|
Purchase of Bank Owned Life Insurance
|
(15,702
|
)
|
—
|
|
—
|
|
|||||
|
Net Cash Used In Investing Activities
|
(44,796
|
)
|
(93,749
|
)
|
(162,103
|
)
|
|||||
|
Cash Flows from Financing Activities:
|
|||||||||||
|
Net Increase in Deposits
|
110,042
|
|
90,438
|
|
168,503
|
|
|||||
|
Net (Decrease) Increase in Short-Term Borrowings
|
15,079
|
|
(20,694
|
)
|
13,952
|
|
|||||
|
Federal Home Loan Bank Advances
|
10,000
|
|
10,000
|
|
—
|
|
|||||
|
Federal Home Loan Bank Repayments
|
(100,000
|
)
|
(20,000
|
)
|
(20,000
|
)
|
|||||
|
Purchase of Treasury Stock
|
(6,039
|
)
|
(3,347
|
)
|
(3,761
|
)
|
|||||
|
Stock Options Exercised
|
1,413
|
|
798
|
|
1,178
|
|
|||||
|
Shares Issued Under the Employee Stock Purchase Plan
|
474
|
|
475
|
|
466
|
|
|||||
|
Tax Benefit from Exercise of Stock Options
|
51
|
|
105
|
|
193
|
|
|||||
|
Treasury Stock Issued for Dividend Reinvestment Plans
|
1,796
|
|
1,715
|
|
1,658
|
|
|||||
|
Acquisition by ESOP of Arrow Stock
|
—
|
|
(1,000
|
)
|
—
|
|
|||||
|
Cash Dividends Paid
|
(11,448
|
)
|
(10,997
|
)
|
(10,640
|
)
|
|||||
|
Net Cash Provided By Financing Activities
|
21,368
|
|
47,493
|
|
151,549
|
|
|||||
|
Net (Decrease) Increase in Cash and Cash Equivalents
|
12,657
|
|
(36,037
|
)
|
8,778
|
|
|||||
|
Cash and Cash Equivalents at Beginning of Year
|
31,079
|
|
67,116
|
|
58,338
|
|
|||||
|
Cash and Cash Equivalents at End of Year
|
$
|
43,736
|
|
$
|
31,079
|
|
$
|
67,116
|
|
||
|
Supplemental Disclosures to Statements of Cash Flow Information:
|
|||||||||||
|
Interest on Deposits and Borrowings
|
$
|
19,490
|
|
$
|
23,995
|
|
$
|
27,201
|
|
||
|
Income Taxes
|
7,952
|
|
15,223
|
|
10,301
|
|
|||||
|
Non-cash Investing and Financing Activity:
|
|||||||||||
|
Transfer of Loans to Other Real Estate Owned and Repossessed Assets
|
1,011
|
|
568
|
|
683
|
|
|||||
|
Shares Issued for Acquisition of Subsidiary
|
5,261
|
|
682
|
|
542
|
|
|||||
|
Fair Value of Assets from Acquisition of Subsidiary
|
10,638
|
|
882
|
|
—
|
|
|||||
|
Fair Value of Liabilities from Acquisition of Subsidiary
|
2,081
|
|
465
|
|
—
|
|
|||||
See Notes to Consolidated Financial Statements.
#
60
NOTES TO CONSOLIDATED FINANCIAL STATEMENTS
|
Note 1:
|
SUMMARY OF SIGNIFICANT ACCOUNTING POLICIES (Dollars In Thousands)
|
Arrow Financial Corporation is a bank holding company organized in 1983 under the laws of New York and registered under the Bank Holding Company Act of 1956. The accounting and reporting policies of Arrow Financial Corporation and Subsidiaries (collectively referred to herein as
“
Arrow
”
or the
“
Company
”
) conform to accounting principles generally accepted in the United States of America and general practices within the banking industry in all material respects.
Principles of Consolidation
- The financial statements of Arrow and its wholly owned subsidiaries are consolidated and all material inter-company transactions have been eliminated. In the
“
Parent Company Only
”
financial statements in Note 23, the investment in wholly owned subsidiaries is carried under the equity method of accounting. When necessary, prior years
’
consolidated financial statements have been reclassified to conform to the current-year financial statement presentation.
Segment Reporting -
Arrow operations are primarily in the community banking industry, which constitutes Arrow
’
s only segment for financial reporting purposes. Arrow provides other services, such as trust administration, retirement plan administration, advice to our proprietary mutual funds and insurance products, but these services do not rise to the quantitative thresholds for separate disclosure. Arrow operates primarily in the northeastern region of New York State in Warren, Washington, Saratoga, Essex and Clinton counties and surrounding areas.
Cash and Cash Equivalents
- Cash and cash equivalents include the following items: cash at branches, due from bank balances, cash items in the process of collection, interest-bearing bank balances and federal funds sold.
Securities
- Management determines the appropriate classification of securities at the time of purchase. Securities reported as held-to-maturity are those debt securities which Arrow has both the positive intent and ability to hold to maturity and are stated at amortized cost. Securities available-for-sale are reported at fair value, with unrealized gains and losses reported in accumulated other comprehensive income or loss, net of taxes. Realized gains and losses are based upon the amortized cost of the specific security sold. A decline in the fair value of any available-for-sale or held-to-maturity security below cost that is deemed to be other-than-temporary results in an impairment to reduce the carrying amount to fair value. To determine whether an impairment is other-than-temporary, we consider all available information relevant to the collectibility of the security, including past events, current conditions, and reasonable and supportable forecasts when developing an estimate of cash flows expected to be collected. Evidence considered in this assessment includes the reasons for impairment, the severity and duration of the impairment, changes in value subsequent to year-end, forecasted performance of the investee, and the general market condition in the geographic area or industry the investee operates in. When an other-than-temporary impairment has occurred on a debt security, the amount of the other-than-temporary impairment recognized in earnings depends on whether we intend to sell the debt security or more likely than not will be required to sell the debt security before recovery of its amortized cost basis less any current-period credit loss. If we intend to sell the debt security or it is more likely than not that we will be required to sell the debt security before recovery of its amortized cost basis less any current-period credit loss, the other-than-temporary impairment is recognized in earnings equal to the entire difference between the investment
’
s amortized cost basis and its fair value at the balance sheet date. If we do not intend to sell the debt security and it is not more likely than not that we will be required to sell the debt security before recovery of its amortized cost basis less any current-period credit loss, the other-than-temporary impairment is separated into the amount representing the credit loss and the amount related to all other factors. The amount of the total other-than-temporary impairment related to the credit loss is recognized in earnings. The amount of the total other-than-temporary impairment related to other factors is recognized in other comprehensive income, net of applicable income taxes.
Loans and Allowance for Loan Losses
- Interest income on loans is accrued and credited to income based upon the principal amount outstanding. Loan fees and costs directly associated with loan originations are deferred and amortized as an adjustment to yield over the lives of the loans originated.
From time-to-time, Arrow has sold (most with servicing retained) residential real estate loans at or shortly after origination. Any gain or loss on the sale of loans, along with the value of the servicing right, is recognized at the time of sale as the difference between the recorded basis in the loan and net proceeds from the sale. Loans held for sale are recorded at the lower of cost or fair value on an aggregate basis.
Loans are placed on nonaccrual status either due to the delinquency status of principal and/or interest or a judgment by management that the full repayment of principal and interest is unlikely. Loans secured by home equity lines of credit are put on nonaccrual status when 120 days past due; residential real estate loans when 150 days past due; commercial and commercial real estate loans are evaluated on a loan-by-loan basis and are placed on nonaccrual status when 90 days past due if the full collection of principal and interest is uncertain. The balance of any accrued interest deemed uncollectible at the date the loan is placed on nonaccrual status is reversed - against earnings for interest accrued during the calendar year and against the allowance for loan losses for interest accrued for the prior year. A loan is returned to accrual status at the later of the date when the past due status of the loan falls below the threshold for nonaccrual status or management deems that it is likely that the borrower will repay all interest and principal. For payments received while the loan is on nonaccrual status, we may recognize interest income on a cash basis if the repayment of the remaining principal and accrued interest is deemed likely. We had no material commitments to make additional advances to borrowers with nonperforming loans at December 31, 2011 or 2010.
#
61
The allowance for loan losses is maintained by charges to operations based upon our best estimate of the probable amount of loans that we will be unable to collect based on current information and events. Provisions to the allowance for loan losses are offset by actual loan charge-offs (net of any recoveries). We evaluate the loan portfolio for potential charge-offs on a monthly basis. In general, automobile and other consumer loans are charged-off when 120 days delinquent. Residential real estate loans are charged-off upon repossession based on a new appraisal. Commercial and commercial real estate loans loans are evaluated early in their delinquency status and are charged-off when it is apparent that not all principal will be repaid from on-going cash flows or liquidation of collateral. An evaluation of estimated proceeds from the liquidation of the loan
’
s collateral is compared to the loan carrying amount and a charge to the allowance for loan losses is taken for any deficiency. While management uses available information to recognize losses on loans, future additions to the allowance may be necessary based on changes in economic conditions in Arrow's market area. In addition, various Federal regulatory agencies, as an integral part of their examination process, review Arrow's allowance for loan losses. Such agencies may require Arrow to recognize additions to the allowance in future periods, based on their judgments about information available to them at the time of their examination, which may not be currently available to management.
We evaluate nonaccrual loans over $250 thousand and all troubled debt restructured loans individually for impairment. Impaired loans are measured based on either the present value of expected future cash flows discounted at the loan's effective interest rate, the loan's observable market price or the fair value of the collateral if the loan is collateral dependent. Arrow determines impairment for collateral dependent loans based on the fair value of the collateral less estimated costs to sell. For other loans, impairment is determined by comparing the recorded investment in the loan to the present value of the expected cash flows, discounted at the loan
’
s effective interest rate. If the measurement of the fair value of the impaired loan is less than the recorded investment in the loan, an impairment reserve is recognized as part of the allowance for loan losses. Any further impairment, over time, is also charged to the allowance for loan losses.
Allowance for loan losses on the remaining loans are primarily determined based on historical loss factors adjusted for current trends. Arrow determines the interest income recognition method for impaired loans on a loan-by-loan basis. Based upon the borrowers
’
payment histories and cash flow projections, interest recognition methods include full accrual or cash basis.
In management
’
s opinion, the balance of the allowance for loan losses, at each balance sheet date, is sufficient to provide for probable loan losses inherent in the corresponding loan portfolio.
Other Real Estate Owned and Repossessed Assets
- Real estate acquired by foreclosure and assets acquired by repossession are recorded at the fair value of the property less estimated costs to sell at the time of repossession. Subsequent declines in fair value, after transfer to other real estate owned and repossessed assets are recognized through a valuation allowance. Such declines in fair value along with related operating expenses to administer such properties or assets are charged directly to operating expense.
Premises and Equipment
- Premises and equipment are stated at cost, less accumulated depreciation and amortization. Depreciation and amortization included in operating expenses are computed largely on the straight-line method. Depreciation is based on the estimated useful lives of the assets (buildings and improvements 20-40 years; furniture and equipment 7-10 years; data processing equipment 5-7 years) and, in the case of leasehold improvements, amortization is computed over the terms of the respective leases or their estimated useful lives, whichever is shorter. Gains or losses on disposition are reflected in earnings.
Income Taxes
- Arrow accounts for income taxes under the asset and liability method. Deferred tax assets and liabilities are recognized for the future tax consequences attributable to differences between the financial statement carrying amounts of existing assets and liabilities and their respective tax bases. Deferred tax assets and liabilities are measured using enacted tax rates expected to apply to taxable income in the years in which those temporary differences are expected to be recovered or settled. The effect on deferred tax assets and liabilities of a change in tax rates is recognized in income tax expense in the period that includes the enactment date. Arrow
’
s policy is that deferred tax assets are reduced by a valuation allowance if, based on the weight of available evidence, it is more likely than not that some or all of the deferred tax assets will not be realized.
Goodwill and Other Intangible Assets
–
Identifiable intangible assets acquired in a business combination are capitalized and amortized. Any remaining unidentifiable intangible asset is classified as goodwill, for which amortization is not required but which must be evaluated for impairment. Arrow tests for impairment of goodwill on an annual basis, or when events and circumstances indicate potential impairment. In evaluating goodwill for impairment, Arrow first assesses certain qualitative factors to determine if it is more likely than not that the fair value of the reporting unit is less than its carrying value. If it is more likely than not that the fair value of a reporting unit exceeds its carrying amount, goodwill of the reporting unit is considered not impaired. If the carrying amount of a reporting unit exceeds its fair value, the second step of the goodwill impairment test is performed to measure the amount of impairment loss, if any.
On August 1, 2011, Arrow acquired all of the outstanding shares of common stock of W.Joseph McPhillips, Inc. and McPhillips Northern, Inc. in a tax-free exchange for Arrow
’
s common stock (90,744 shares, as restated for stock dividends). Arrow recorded the following intangible assets as a result of the acquisition (none of which are deductible for income tax purposes): goodwill ($1,137) and expirations ($720). The value of the expirations is being amortized over twenty years.
On February 1, 2011, Arrow acquired all of the outstanding shares of common stock of Upstate Agency, Inc. in a tax-free exchange for Arrow
’
s common stock (134,778 shares, as restated for stock dividends) and cash of $2.7 million. Arrow recorded the following intangible assets as a result of the acquisition (none of which are deductible for income tax purposes): goodwill ($5,040) and expirations ($2,854). The value of the expirations is being amortized over twenty years. The agreement provides for annual contingent post-closing payments of Company stock, based upon earnings and retention of certain customers, over a three-year period. The present value of these expected post-closing payments were included in the purchase price at the acquisition date.
#
62
On April 1, 2010, Arrow acquired all of the outstanding shares of common stock of Loomis & LaPann, Inc. in a tax-free exchange for Arrow
’
s common stock (27,838 shares, as restated for stock dividends). Arrow recorded the following intangible assets as a result of the acquisition (none of which are deductible for income tax purposes): goodwill ($514) and expirations ($126). The value of the expirations is being amortized over twenty years. The agreement provides for annual contingent post-closing payments of Company stock, based upon earnings and retention of certain customers, over a three-year period. The present value of these expected post-closing payments were included in the purchase price at the acquisition date.
The carrying amounts of other recognized intangible assets that meet recognition criteria and for which separate accounting records have been maintained (core deposit intangibles and mortgage servicing rights), have been included in the consolidated balance sheet as
“
Other Intangible Assets, Net.
”
Core deposit intangibles are being amortized on a straight-line basis over a period of ten to fifteen years.
Arrow has sold residential real estate loans, primarily to Freddie Mac, with servicing retained. Mortgage servicing rights are recognized as an asset when loans are sold with servicing retained, by allocating the cost of an originated mortgage loan between the loan and servicing right based on estimated relative fair values. The cost allocated to the servicing right is capitalized as a separate asset and amortized in proportion to, and over the period of, estimated net servicing income. Capitalized mortgage servicing rights are evaluated for impairment by comparing the asset
’
s carrying value to its current estimated fair value. Fair values are estimated using a discounted cash flow approach, which considers future servicing income and costs, current market interest rates, and anticipated prepayment, and default rates. Impairment losses are recognized through a valuation allowance for servicing rights having a current fair value that is less than amortized cost on an aggregate basis. Adjustments to increase or decrease the valuation allowance are charged or credited to income as a component of other operating income. There was no allowance for impairment losses at December 31, 2011 or 2010.
Pension and Postretirement Benefits -
Arrow maintains a non-contributory, defined benefit pension plan covering substantially all employees, a supplemental pension plan covering certain executive officers selected by the Board of Directors, and certain post-retirement medical, dental and life insurance benefits for employees and retirees. The costs of these plans, based on actuarial computations of current and future benefits for employees, are charged to current operating expenses. The cost of post-retirement benefits other than pensions is recognized on an accrual basis as employees perform services to earn the benefits. Arrow recognizes the overfunded or underfunded status of our single employer defined benefit pension plan as an asset or liability on its consolidated balance sheet and recognizes changes in the funded status in comprehensive income in the year in which the change occurred.
Stock-Based Compensation Plans
–
Arrow has two stock option plans, which are described more fully in Note 16. The Company expenses the grant date fair value of options granted. The expense is recognized over the vesting period of the grant, typically four years, on a straight-line basis. Shares are generally issued from treasury for the exercise of stock options.
Arrow sponsors an Employee Stock Purchase Plan (
“
ESPP
”
) under which employees may purchase Arrow
’
s common stock at a 5% discount below market price at the time of purchase. This stock purchase plan is not considered a compensatory plan.
Arrow sponsors an Employee Stock Ownership Plan (ESOP), a qualified defined contribution plan. The ESOP has borrowed funds from one of Arrow
’
s subsidiary banks to purchase Arrow common stock. The shares pledged as collateral are reported as a reduction of Arrow
’
s stockholders
’
equity. Compensation expense is recognized as shares are release for allocation to individual employee accounts equal to the current average market price.
Securities Sold Under Agreements to Repurchase -
In securities repurchase agreements, Arrow receives cash from a counterparty in exchange for the transfer of securities to a third party custodian
’
s account that explicitly recognizes Arrow
’
s interest in the securities. These agreements are accounted for by Arrow as secured financing transactions, since it maintains effective control over the transferred securities, and meets other criteria for such accounting. Accordingly, the cash proceeds are recorded as borrowed funds, and the underlying securities continue to be carried in Arrow
’
s securities available-for-sale portfolio.
Earnings Per Share (
“
EPS
”
)
- Basic EPS excludes dilution and is computed by dividing income available to common stockholders by the weighted average number of common shares outstanding for the period. Diluted EPS reflects the potential dilution that could occur if securities or other contracts to issue common stock were exercised or converted into common stock or resulted in the issuance of common stock that then shared in the earnings of the entity (such as Arrow
’
s stock options), computed using the treasury stock method. Unallocated common shares held by Arrow
’
s Employee Stock Ownership Plan are not included in the weighted average number of common shares outstanding for either the basic or diluted EPS calculation.
Financial Instruments
- Arrow is a party to certain financial instruments with off-balance sheet risk, such as: commercial lines of credit, construction lines of credit, overdraft protection, home equity lines of credit and standby letters of credit. Arrow's policy is to record such instruments when funded. Fair value estimates are made at a specific point in time, based on relevant market information and information about the financial instrument. These estimates do not reflect any premium or discount that could result from offering for sale at one time Arrow's entire holdings of a particular financial instrument. Because no market exists for a significant portion of Arrow's financial instruments, fair value estimates are based on judgments regarding future expected loss experience, current economic conditions, risk characteristics of various financial instruments, and other factors. These estimates are subjective in nature and involve uncertainties and matters of significant judgment and therefore cannot be determined with precision. Changes in assumptions could significantly affect the estimates.
Fair value estimates are based on existing on- and off-balance sheet financial instruments without attempting to estimate the value of anticipated future business and the value of assets and liabilities that are not considered financial instruments. For example, Arrow has a trust department that contributes net fee income annually. The value of trust department customer relationships is not considered a financial instrument of the Company, and therefore this value has not been incorporated into the fair value estimates.
#
63
Other significant assets and liabilities that are not considered financial assets or liabilities include deferred taxes, premises and equipment, the value of low-cost, long-term core deposits and goodwill. In addition, the tax ramifications related to the realization of the unrealized gains and losses can have a significant effect on fair value estimates and have not been considered in any of the estimates.
The carrying amount of the following short-term assets and liabilities is a reasonable estimate of fair value: cash and due from banks, federal funds sold and purchased, securities sold under agreements to repurchase, demand deposits, savings, N.O.W. and money market deposits, other short-term borrowings, accrued interest receivable and accrued interest payable. The fair value estimates of other on- and off-balance sheet financial instruments, as well as the method of arriving at fair value estimates, are included in the related footnotes and summarized in Note 21. As of December 31, 2011 and 2010, and during 2011, 2010 and 2009, Arrow had no derivative instruments, other than loans pending settlement and loan commitments on loans intended for sale, the amounts of which are not material.
Fair Value Measures
–
We determine the fair value of financial instruments under the following hierarchy:
|
•
|
Level 1
–
Unadjusted quoted prices in active markets that are accessible at the measurement date for identical, unrestricted assets or liabilities;
|
|
•
|
Level 2
–
Quoted prices for similar assets or liabilities in active markets, quoted prices for identical or similar assets or liabilities in markets that are not active, or inputs that are observable, either directly or indirectly, for substantially the full term of the asset or liability;
|
|
•
|
Level 3
–
Prices or valuation techniques that require inputs that are both significant to the fair value measurement and unobservable (i.e., supported by little or no market activity).
|
A financial instrument
’
s level within the fair value hierarchy is based on the lowest level of input that is significant to the fair value measurement.
Trust Assets and Fiduciary Income
- Assets held by Arrow in a fiduciary or agency capacity for its customers are not included in the consolidated balance sheets since these assets are not assets of Arrow. Income from fiduciary activities is reported on the accrual basis.
Management
’
s Use of Estimates
-The preparation of the consolidated financial statements in conformity with accounting principles generally accepted in the United States of America requires management to make estimates and assumptions that affect the reported amounts of assets and liabilities and disclosure of contingent assets and liabilities at the date of the consolidated financial statements and the reported amounts of income and expenses during the reporting period. Our most significant estimates are the allowance for loan losses, the evaluation of other-than-temporary impairment of investment securities, goodwill impairment, pension and other postretirement liabilities, analysis of a need for a valuation allowance for deferred tax assets and other fair value calculations. Actual results could differ from those estimates.
A material estimate that is particularly susceptible to significant change in the near term is the allowance for loan losses. In connection with the determination of the allowance for loan losses, management obtains appraisals for properties. The allowance for loan losses is management
’
s best estimate of probable loan losses incurred as of the balance sheet date. While management uses available information to recognize losses on loans, future adjustments to the allowance for loan losses may be necessary based on changes in economic conditions.
Recent Accounting Pronouncements
ASU 2011-08, Intangibles - Goodwill and Other (Topic 350) - Testing for Goodwill Impairment.
Under the amendments in this Update, an entity has the option to first assess qualitative factors to determine whether the existence of events or circumstances leads to a determination that it is more likely than not that the fair value of a reporting unit is less than its carrying amount. If, after assessing the totality of events or circumstances, an entity determines it is not more likely than not that the fair value of a reporting unit is less than its carrying amount, then performing the two-step impairment test is unnecessary. We elected to adopt the provision of this update beginning with the third quarter of 2011. The changes did not have any impact on our financial condition or results of operations.
ASU 2011-05, Comprehensive Income (Topic 220) - Presentation of Comprehensive Income.
ASU 2011-05 eliminates the option of presenting the components of comprehensive income as part of the statement of changes in stockholders' equity and provides an entity the option to present the total of comprehensive income, the components of net income and the components of other comprehensive income either in a single continuous statement of comprehensive income or in two but separate consecutive statements. The update is effective, retrospectively, for interim and annual periods beginning after December 15, 2011. However, the changes that relate to the presentation of reclassification adjustments out of accumulated other comprehensive income were deferred by ASU 2011-12. The changes are limited to matters of presentation and will not have an impact on our financial condition or results of operation.
#
64
ASU 2011-04, Fair Value Measurement (Topic 820) - Amendments to Achieve Common Fair Value Measurement and Disclosure Requirements in U.S. GAAP and IFRSs.
In 2006, the FASB and the International Accounting Standards Board (IASB) published a Memorandum of Understanding, which has served as the foundation of the Boards' efforts to create a common set of high quality global accounting standards. Consistent with the Memorandum of Understanding and the Boards' commitment to achieving that goal, the amendments in ASU 2011-04 are the result of the work by the FASB and the IASB to develop common requirements for measuring fair value and for disclosing information about fair value measurements in accordance with U.S. generally accepted accounting principles (GAAP) and International Financial Reporting Standards (IFRSs).The Boards worked together to ensure that fair value has the same meaning in U.S. GAAP and in IFRSs and that their respective fair value measurement and disclosure requirements are the same (except for minor differences in wording and style). The amendments in ASU 2011-04 explain how to measure fair value. They do not require additional fair value measurements and are not intended to establish valuation standards or affect valuation practices outside of financial reporting. We have determined that this pronouncement will not have a material impact on our financial condition or results of operations.
ASU 2011-03, Transfers and Servicing (Topic 860) - Reconsideration of Effective Control for Repurchase Agreements.
The amendments in ASU 2011-03 remove from the assessment of effective control (1) the criterion requiring the transferor to have the ability to repurchase or redeem the financial assets on substantially the agreed terms, even in the event of default by the transferee, and (2) the collateral maintenance implementation guidance related to that criterion. Other criteria applicable to the assessment of effective control are not changed by the amendments in this Update. Those criteria indicate that the transferor is deemed to have maintained effective control over the financial assets transferred (and thus must account for the transaction as a secured borrowing) for agreements that both entitle and obligate the transferor to repurchase or redeem the financial assets before their maturity if all of the following conditions are met: 1. The financial assets to be repurchased or redeemed are the same or substantially the same as those transferred. 2. The agreement is to repurchase or redeem them before maturity, at a fixed or determinable price. 3. The agreement is entered into contemporaneously with, or in contemplation of, the transfer. The update is effective, retrospectively, for interim and annual periods beginning after December 15, 2011. Currently, we report all of our repurchase agreements as secured borrowings and accordingly, we have determined that this pronouncement will not have a material impact on our financial condition or results of operations.
ASU 2011-02, Receivables (Topic 310) - A Creditor's determination of whether a Restructuring Is a Trouble Debt Restructuring.
ASU 2011-02 provides additional guidance in evaluating whether a restructuring constitutes a troubled debt restructuring. Under this guidance, a creditor must separately conclude that both of the following exist: 1. The restructuring constitutes a concession. 2. The debtor is experiencing financial difficulties. The amendments in this Update are effective for the first interim or annual period beginning on or after June 15, 2011, and should be applied retrospectively to the beginning of the annual period of adoption. We have determined that this pronouncement did not have a material impact on our financial condition or results of operations.
|
Note 2:
|
CASH AND CASH EQUIVALENTS (In Thousands)
|
|
2011
|
2010
|
||||||
|
Cash and Due From Banks
|
$
|
29,598
|
|
$
|
25,961
|
|
|
|
Interest-Bearing Deposits at Banks
|
14,138
|
|
5,118
|
|
|||
|
Total Cash and Cash Equivalents
|
$
|
43,736
|
|
$
|
31,079
|
|
|
|
Supplemental Information:
|
|||||||
|
Total required reserves, including vault cash and Federal Reserve Bank deposits
|
$
|
24,268
|
|
$
|
19,822
|
|
|
#
65
|
Note 3.
|
INVESTMENT SECURITIES (In Thousands)
|
A summary of the amortized costs and the approximate fair values of securities at
December 31, 2011
and
2010
is presented below. Amortized cost is reported net of other-than-temporary impairment charges.
Securities Available-for-Sale
|
Amortized
Cost
|
|
Fair
Value
|
|
Gross Unrealized Gains
|
|
Gross Unrealized Losses
|
|
||||||||
|
December 31, 2011
|
|||||||||||||||
|
U.S. Agency Obligations
|
$
|
116,055
|
|
$
|
116,393
|
|
$
|
342
|
|
$
|
4
|
|
|||
|
State and Municipal Obligations
|
44,712
|
|
44,999
|
|
305
|
|
18
|
|
|||||||
|
Collateralized Mortgage Obligations - Residential
|
144,362
|
|
149,669
|
|
5,526
|
|
219
|
|
|||||||
|
Mortgage-Backed Securities - Residential
|
237,756
|
|
243,043
|
|
5,287
|
|
—
|
|
|||||||
|
Corporate and Other Debt Securities
|
1,015
|
|
1,015
|
|
—
|
|
—
|
|
|||||||
|
Mutual Funds and Equity Securities
|
1,365
|
|
1,419
|
|
69
|
|
15
|
|
|||||||
|
Total Securities Available-for-Sale
|
$
|
545,265
|
|
$
|
556,538
|
|
$
|
11,529
|
|
$
|
256
|
|
|||
|
December 31, 2010
|
|||||||||||||||
|
U.S. Agency Obligations
|
$
|
97,943
|
|
$
|
98,173
|
|
$
|
326
|
|
$
|
96
|
|
|||
|
State and Municipal Obligations
|
89,471
|
|
89,528
|
|
72
|
|
15
|
|
|||||||
|
Collateralized Mortgage Obligations - Residential
|
161,247
|
|
166,964
|
|
6,692
|
|
975
|
|
|||||||
|
Mortgage-Backed Securities - Residential
|
159,636
|
|
159,926
|
|
2,532
|
|
2,242
|
|
|||||||
|
Corporate and Other Debt Securities
|
1,516
|
|
1,417
|
|
—
|
|
99
|
|
|||||||
|
Mutual Funds and Equity Securities
|
1,333
|
|
1,356
|
|
70
|
|
47
|
|
|||||||
|
Total Securities Available-for-Sale
|
$
|
511,146
|
|
$
|
517,364
|
|
$
|
9,692
|
|
$
|
3,474
|
|
|||
Securities Held-to-Maturity
:
|
Amortized
Cost
|
|
Fair
Value
|
|
Gross
Unrealized
Gains
|
|
Gross
Unrealized
Losses
|
|
||||||||
|
December 31, 2011
|
|||||||||||||||
|
State and Municipal Obligations
|
$
|
149,688
|
|
$
|
158,059
|
|
$
|
8,378
|
|
$
|
7
|
|
|||
|
Corporate and Other Debt Securities
|
1,000
|
|
1,000
|
|
—
|
|
—
|
|
|||||||
|
Total Securities Held-to-Maturity
|
$
|
150,688
|
|
$
|
159,059
|
|
$
|
8,378
|
|
$
|
7
|
|
|||
|
December 31, 2010
|
|||||||||||||||
|
State and Municipal Obligations
|
$
|
158,938
|
|
$
|
161,713
|
|
$
|
2,911
|
|
$
|
136
|
|
|||
|
Corporate and Other Debt Securities
|
1,000
|
|
1,000
|
|
—
|
|
—
|
|
|||||||
|
Total Securities Held-to-Maturity
|
$
|
159,938
|
|
$
|
162,713
|
|
$
|
2,911
|
|
$
|
136
|
|
|||
As reported in the Consolidated Balance Sheets, Other Investments include Federal Home Loan Bank of New York (
“
FHLBNY
”
) and Federal Reserve Bank (
“
FRB
”
) stock, which are reported at cost. FHLBNY and FRB stock are restricted investment securities and amounted to $5,691 and $1,031 at
December 31, 2011
, respectively and $7,743 and $859 at
December 31, 2010
, respectively. The required level of FHLBNY stock is based on the amount of FHLBNY borrowings (see Note 9) and is pledged to secure those borrowings. While some Federal Home Loan Banks have stopped paying dividends and repurchasing stock upon reductions in debt levels, the FHLBNY continues to pay dividends and repurchase its stock. Accordingly, we have not recognized any impairment on our holdings of FHLBNY common stock. However, the FHLBNY has reported impairment issues among its holdings of mortgage-backed securities.
A summary of the maturities of securities as of
December 31, 2011
is presented below. Mutual funds and equity securities, which have no stated maturity, are not included in the table below. Collateralized mortgage obligations and other mortgage-backed-securities are included in the schedule based on their expected average lives. Actual maturities will differ from the table below because issuers may have the right to call or prepay obligations with or without prepayment penalties.
#
66
|
Debt Securities:
|
Available-for-Sale
|
Held-to-Maturity
|
|||||||||||||
|
Amortized
Cost
|
|
Fair
Value
|
|
Amortized
Cost
|
|
Fair
Value
|
|
||||||||
|
Within One Year:
|
|||||||||||||||
|
U.S. Agency Obligations
|
$
|
34,041
|
|
$
|
34,058
|
|
$
|
—
|
|
$
|
—
|
|
|||
|
State and Municipal Obligations
|
10,937
|
|
10,962
|
|
13,814
|
|
13,940
|
|
|||||||
|
Collateralized Mortgage Obligations - Residential
|
8,931
|
|
9,120
|
|
—
|
|
—
|
|
|||||||
|
Mortgage-Backed Securities - Residential
|
2,347
|
|
2,423
|
|
—
|
|
—
|
|
|||||||
|
Total
|
56,256
|
|
56,563
|
|
13,814
|
|
13,940
|
|
|||||||
|
From 1 - 5 Years:
|
|||||||||||||||
|
U.S. Agency Obligations
|
82,014
|
|
82,335
|
|
—
|
|
—
|
|
|||||||
|
State and Municipal Obligations
|
30,171
|
|
30,378
|
|
64,168
|
|
66,046
|
|
|||||||
|
Collateralized Mortgage Obligations - Residential
|
119,298
|
|
123,273
|
|
—
|
|
—
|
|
|||||||
|
Mortgage-Backed Securities - Residential
|
204,382
|
|
208,441
|
|
—
|
|
—
|
|
|||||||
|
Corporate and Other Debt Securities
|
15
|
|
15
|
|
—
|
|
—
|
|
|||||||
|
Total
|
435,880
|
|
444,442
|
|
64,168
|
|
66,046
|
|
|||||||
|
From 5 - 10 Years
:
|
|||||||||||||||
|
State and Municipal Obligations
|
1,061
|
|
1,115
|
|
63,352
|
|
69,285
|
|
|||||||
|
Collateralized Mortgage Obligations - Residential
|
16,133
|
|
17,276
|
|
—
|
|
—
|
|
|||||||
|
Mortgage-Backed Securities - Residential
|
22,516
|
|
23,308
|
|
—
|
|
—
|
|
|||||||
|
Total
|
39,710
|
|
41,699
|
|
63,352
|
|
69,285
|
|
|||||||
|
Over 10 Years:
|
|||||||||||||||
|
State and Municipal Obligations
|
2,543
|
|
2,544
|
|
8,354
|
|
8,788
|
|
|||||||
|
Mortgage-Backed Securities - Residential
|
8,511
|
|
8,871
|
|
—
|
|
—
|
|
|||||||
|
Corporate and Other Debt Securities
|
1,000
|
|
1,000
|
|
1,000
|
|
1,000
|
|
|||||||
|
Total
|
12,054
|
|
12,415
|
|
9,354
|
|
9,788
|
|
|||||||
|
Total Debt Securities
|
$
|
543,900
|
|
$
|
555,119
|
|
$
|
150,688
|
|
$
|
159,059
|
|
|||
The following table sets forth the components of interest and dividend income on securities available-for-sale, securities held-to-maturity and other investments for the year ended December 31:
|
Components of Investment Securities Interest and Dividend Income
|
2011
|
|
2010
|
|
2009
|
|
|||||
|
Available-for-Sale:
|
|||||||||||
|
Taxable Interest Income
|
$
|
11,881
|
|
$
|
14,050
|
|
$
|
14,138
|
|
||
|
Nontaxable Interest Income
|
1,017
|
|
634
|
|
468
|
|
|||||
|
Dividend Income
|
54
|
|
54
|
|
47
|
|
|||||
|
Total Interest and Dividend Income, on Securities Available-for-Sale
|
$
|
12,952
|
|
$
|
14,738
|
|
$
|
14,653
|
|
||
|
Held-to-Maturity
|
|||||||||||
|
Taxable Interest Income
|
$
|
80
|
|
$
|
82
|
|
$
|
63
|
|
||
|
Nontaxable Interest Income
|
4,674
|
|
5,197
|
|
5,074
|
|
|||||
|
Total Interest Income, on Securities Held-to-Maturity
|
$
|
4,754
|
|
$
|
5,279
|
|
$
|
5,137
|
|
||
|
Other Investments
|
$
|
387
|
|
$
|
515
|
|
$
|
491
|
|
||
The fair value of securities pledged to secure repurchase agreements amounted to $26,293 and $51,581 at
December 31, 2011
and
2010
, respectively. The fair value of securities pledged to secure public and trust deposits and for other purposes totaled $415,542 and $382,142 at
December 31, 2011
and
2010
, respectively. Other mortgage-backed securities at
December 31, 2011
and
2010
included $873 and $1,598, respectively, of loans previously securitized by Arrow, which it continues to service.
#
67
Information on temporarily impaired securities at
December 31, 2011
and
2010
, segregated according to the length of time such securities had been in a continuous unrealized loss position, is summarized as follows:
|
December 31, 2011
|
Less than 12 Months
|
12 Months or Longer
|
Total
|
||||||||||||||||||||
|
Available-for-Sale Portfolio:
|
Fair
Value
|
|
Unrealized
Losses
|
|
Fair
Value
|
|
Unrealized
Losses
|
|
Fair
Value
|
|
Unrealized
Losses
|
|
|||||||||||
|
U.S. Agency Securities
|
$
|
25,956
|
|
$
|
4
|
|
—
|
|
—
|
|
$
|
25,956
|
|
$
|
4
|
|
|||||||
|
State & Municipal Obligations
|
4,505
|
|
18
|
|
—
|
|
—
|
|
4,505
|
|
18
|
|
|||||||||||
|
Collateralized Mortgage Obligations -
Residential
|
9,857
|
|
204
|
|
5,715
|
|
15
|
|
15,572
|
|
219
|
|
|||||||||||
|
Mutual Funds and Equity Securities
|
—
|
|
—
|
|
78
|
|
15
|
|
78
|
|
15
|
|
|||||||||||
|
Total Securities Available-for-Sale
|
$
|
40,318
|
|
$
|
226
|
|
$
|
5,793
|
|
$
|
30
|
|
$
|
46,111
|
|
$
|
256
|
|
|||||
|
Held-to-Maturity Portfolio
|
|||||||||||||||||||||||
|
State & Municipal Obligations
|
$
|
510
|
|
$
|
7
|
|
$
|
—
|
|
$
|
—
|
|
$
|
510
|
|
$
|
7
|
|
|||||
The table above for
December 31, 2011
consists of 27 securities where the current fair value is less than the related amortized cost. These unrealized losses do not reflect any deterioration of the credit worthiness of the issuing entities. Agency issues, including mortgage-backed securities, are all rated Aaa by Moody's and AA+ by Standards and Poor. The municipal obligations are general obligations supported by the general taxing authority of the issuer, and in some cases are insured. Obligations issued by school districts are supported by state aid. For any non-rated municipal securities, credit analysis is performed in-house based upon data that has been submitted by the issuers to the NY State Comptroller. That analysis shows no deterioration in the credit worthiness of the municipalities. Subsequent to
December 31, 2011
, there were no securities downgraded below investment grade.
The unrealized losses on these temporarily impaired securities are primarily the result of changes in interest rates for fixed rate securities where the interest rate received is less than the current rate available for new offerings of similar securities, changes in market spreads as a result of shifts in supply and demand, and/or changes in the level of prepayments for mortgage related securities. Because we do not currently intend to sell any of our temporarily impaired securities, and because it is not more likely-than-not we would be required to sell the securities prior to recovery, the impairment is considered temporary.
|
December 31, 2010
|
Less than 12 Months
|
12 Months or Longer
|
Total
|
||||||||||||||||||||
|
Available-for-Sale Portfolio:
|
Fair
Value
|
|
Unrealized
Losses
|
|
Fair
Value
|
|
Unrealized
Losses
|
|
Fair
Value
|
|
Unrealized
Losses
|
|
|||||||||||
|
U.S. Agency Securities
|
$
|
23,928
|
|
$
|
72
|
|
5,976
|
|
24
|
|
$
|
29,904
|
|
$
|
96
|
|
|||||||
|
State & Municipal Obligations
|
11,632
|
|
11
|
|
2,432
|
|
4
|
|
14,064
|
|
15
|
|
|||||||||||
|
Collateralized Mortgage Obligations - Residential
|
32,027
|
|
975
|
|
—
|
|
—
|
|
32,027
|
|
975
|
|
|||||||||||
|
Mortgage-Backed Securities - Residential
|
69,461
|
|
1,957
|
|
12,129
|
|
285
|
|
81,590
|
|
2,242
|
|
|||||||||||
|
Corporate & Other Debt Securities
|
283
|
|
48
|
|
949
|
|
51
|
|
1,232
|
|
99
|
|
|||||||||||
|
Mutual Funds and Equity Securities
|
1,095
|
|
47
|
|
—
|
|
—
|
|
1,095
|
|
47
|
|
|||||||||||
|
Total Securities Available-for-Sale
|
$
|
138,426
|
|
$
|
3,110
|
|
$
|
21,486
|
|
$
|
364
|
|
$
|
159,912
|
|
$
|
3,474
|
|
|||||
|
Held-to-Maturity Portfolio
|
|||||||||||||||||||||||
|
State & Municipal Obligations
|
$
|
6,449
|
|
$
|
73
|
|
$
|
4,552
|
|
$
|
63
|
|
$
|
11,001
|
|
$
|
136
|
|
|||||
The table above for
December 31, 2010
consists of 104 securities where the current fair value is less than the related amortized cost. These unrealized losses do not reflect any deterioration of the credit worthiness of the issuing entities. Agency-backed CMOs are all rated AAA, as are the mortgage-backed securities. The municipal obligations are general obligations supported by the general taxing authority of the issuer, and in some cases are insured. Obligations issued by school districts are supported by state aid. For any non-rated municipal securities, third party credit analysis shows no deterioration in the credit worthiness of the municipalities. Corporate and other debt securities consist of one private placement trust preferred, and one trust preferred pool. The private placement trust preferred is rated AAA by Standard & Poor
’
s; the trust preferred pool is rated investment grade, with the privately issued securities securing the note performing. Subsequent to
December 31, 2010
, there were no securities downgraded below investment grade.
The unrealized losses on these temporarily impaired securities are primarily the result of changes in interest rates for fixed rate securities where the interest rate received is less than the current rate available for new offerings of similar securities, changes in market spreads as a result of shifts in supply and demand, and/or changes in the level of prepayments for mortgage related securities. Because we do not currently intend to sell any of our temporarily impaired securities, and because it is not more likely-than-not we would be required to sell the securities prior to recovery, the impairment is considered temporary.
#
68
Other-Than-Temporary Impairment
At
December 31, 2011
and
2010
, mutual funds and equity securities included shares of one common stock that had been deemed to be other-than-temporarily impaired in 2009. The common stock had a book value of $1,094 after the recognition of $375 in losses charged to earnings for the year ended December 31, 2009. The approximate fair value for this security was $1,103 and $1,050 at
December 31, 2011
and
2010
.
|
Note 4:
|
LOANS (In Thousands)
|
Loan balances outstanding as of December 31, 2011 and 2010 consisted of the following:
|
2011
|
2010
|
||||||
|
Commercial
|
$
|
99,791
|
|
$
|
97,621
|
|
|
|
Commercial real estate:
|
|
||||||
|
Commercial real estate - construction
|
11,083
|
|
7,090
|
|
|||
|
Commercial real estate - other
|
232,149
|
|
214,291
|
|
|||
|
Consumer:
|
|
||||||
|
Consumer
–
other
|
6,318
|
|
6,482
|
|
|||
|
Consumer
–
automobile
|
322,375
|
|
334,656
|
|
|||
|
Residential
–
prime
|
459,741
|
|
485,368
|
|
|||
|
Total
|
$
|
1,131,457
|
|
$
|
1,145,508
|
|
|
|
Supplemental Information
:
|
|||||||
|
Unamortized deferred loan origination costs, net of deferred loan
origination fees, included in the above balances
|
$
|
1,445
|
|
$
|
1,118
|
|
|
|
Overdrawn deposit accounts, included in the above balances
|
390
|
|
417
|
|
|||
|
Pledged loans secured by one-to-four family residential mortgages
under a blanket collateral agreement to secure borrowings from
the Federal Home Loan Bank of New York
|
172,704
|
|
215,307
|
|
|||
|
Residential real estate loans serviced for Freddie Mac, not included
in the balances above
|
106,220
|
|
73,103
|
|
|||
|
Loans held for sale at period-end, included in the above balances
|
893
|
|
10,294
|
|
|||
|
Loans to Related Parties:
|
|||||||
|
Balance at beginning of year
|
14,987
|
|
15,345
|
|
|||
|
New Directors/Executive Officers
|
.
|
|
521
|
|
|||
|
New loans and renewals, during the year
|
3,016
|
|
1,052
|
|
|||
|
Repayments, during the year
|
(2,231
|
)
|
(1,931
|
)
|
|||
|
Balance at end of year
|
15,772
|
|
14,987
|
|
|||
Credit Quality Indicators
The following table provides information about loan credit quality at December 31, 2011 and 2010:
|
Credit Quality Indicators
|
||||||||||||
|
As of December 31, 2011
|
||||||||||||
|
Commercial Credit Exposure
|
||||||||||||
|
Credit Risk Profile by Creditworthiness Category
|
||||||||||||
|
Commercial Real
|
Commercial Real
|
|||||||||||
|
Indicator
|
Commercial
|
Estate - Construction
|
Estate - Other
|
|||||||||
|
Satisfactory
|
$
|
91,555
|
|
$
|
9,195
|
|
$
|
213,413
|
|
|||
|
Special Mention
|
3,975
|
|
—
|
|
458
|
|
||||||
|
Substandard
|
4,261
|
|
1,888
|
|
18,278
|
|
||||||
|
Doubtful
|
—
|
|
—
|
|
—
|
|
||||||
|
Total
|
$
|
99,791
|
|
$
|
11,083
|
|
$
|
232,149
|
|
|||
|
Consumer Credit Exposure
|
||||||||||||
|
Credit Risk Profile Based on Payment Activity
|
||||||||||||
|
Consumer-Other
|
Consumer-Automobile
|
Residential-Prime
|
||||||||||
|
Performing
|
$
|
6,312
|
|
$
|
321,888
|
|
$
|
456,254
|
|
|||
|
Nonperforming
|
6
|
|
487
|
|
3,487
|
|
||||||
|
Total
|
$
|
6,318
|
|
$
|
322,375
|
|
$
|
459,741
|
|
|||
#
69
|
Credit Quality Indicators
|
||||||||||||
|
As of December 31, 2010
|
||||||||||||
|
Commercial Credit Exposure
|
||||||||||||
|
Credit Risk Profile by Creditworthiness Category
|
||||||||||||
|
Commercial Real
|
Commercial Real
|
|||||||||||
|
Indicator
|
Commercial
|
Estate - Construction
|
Estate - Other
|
|||||||||
|
Satisfactory
|
$
|
94,290
|
|
$
|
5,117
|
|
$
|
187,070
|
|
|||
|
Special Mention
|
160
|
|
—
|
|
7,318
|
|
||||||
|
Substandard
|
3,171
|
|
1,973
|
|
19,903
|
|
||||||
|
Doubtful
|
—
|
|
—
|
|
—
|
|
||||||
|
Total
|
$
|
97,621
|
|
$
|
7,090
|
|
$
|
214,291
|
|
|||
|
Consumer Credit Exposure
|
||||||||||||
|
Credit Risk Profile Based on Payment Activity
|
||||||||||||
|
Consumer-Other
|
Consumer-Automobile
|
Residential-Prime
|
||||||||||
|
Performing
|
$
|
6,477
|
|
$
|
333,847
|
|
$
|
483,725
|
|
|||
|
Nonperforming
|
5
|
|
809
|
|
1,643
|
|
||||||
|
Total
|
$
|
6,482
|
|
$
|
334,656
|
|
$
|
485,368
|
|
|||
We use an internally developed system of five credit quality indicators to rate the credit worthiness of each commercial loan. The system has eight levels of credit quality (the first three have been combined in the preceding table), defined as follows: 1) Satisfactory - "Satisfactory" borrowers have acceptable financial condition with satisfactory record of earnings and sufficient historical and projected cash flow to service the debt. Borrowers have satisfactory repayment histories and primary and secondary sources of repayment can be clearly identified; 2) Special Mention - Loans in this category have potential weaknesses that deserve management
’
s close attention. If left uncorrected, these potential weaknesses may result in deterioration of the repayment prospects for the asset or in the institution
’
s credit position at some future date. "Special mention" assets are not adversely classified and do not expose an institution to sufficient risk to warrant adverse classification. Loans which might be assigned this risk rating include loans to borrowers with deteriorating financial strength and/or earnings record and loans with potential for problems due to weakening economic or market conditions; 3) Substandard - Loans classified as
“
substandard
”
are inadequately protected by the current sound net worth or paying capacity of the borrower or the collateral pledged, if any. Loans in this category have well defined weaknesses that jeopardize the repayment. They are characterized by the distinct possibility that the bank will sustain some loss if the deficiencies are not corrected.
“
Substandard
”
loans may include loans which are likely to require liquidation of collateral to effect repayment, and other loans where character or ability to repay has become suspect. Loss potential, while existing in the aggregate amount of substandard assets, does not have to exist in individual assets classified substandard; 4) Doubtful - Loans classified as
“
doubtful
”
have all of the weaknesses inherent in those classified as
“
substandard
”
with the added characteristic that the weaknesses make collection or liquidation in full, on the basis of current existing facts, conditions, and values highly questionable and improbable. Although possibility of loss is extremely high, classification of these loans as
“
loss
”
has been deferred due to specific pending factors or events which may strengthen the value (i.e. possibility of additional collateral, injection of capital, collateral liquidation, debt restructure, economic recovery, etc). Loans classified as
“
doubtful
”
need to be placed on non-accrual; and 5) Loss - Loans classified as
“
loss
”
are considered uncollectible and of such little value that their continuance as bankable assets is not warranted. As of the date of the balance sheet, all loans in this category have been charged-off to the allowance for loan losses. However, this classification does not mean that the asset has absolutely no recovery or salvage value, but rather it is not practical or desirable to defer writing off this basically worthless asset even though partial recovery may be effected in the future. Commercial loans are evaluated on an annual basis, unless the credit quality indicator falls to a level of "substandard" or below, when the loan is evaluated quarterly. The credit quality indicator is one of the factors used to determine any loss, as further described in this footnote.
#
70
Past Due Loans
The following table provides an analysis of the age of the recorded investment in loans that are past due at the end of the period. Consistent with regulatory instructions, Arrow considers an amortizing loan past due 30 or more days only if the borrower is two or more payments past due. Matured loans and all other loans are considered past due 30 or more days based on the payment due date. Nonaccrual loans are included in the first three columns, unless the loan is past due less than 30 days.
|
Age Analysis of Past Due Loans
|
|||||||||||||||||||||||
|
As of December 31, 2011
|
|||||||||||||||||||||||
|
30-59
|
60-89
|
90 Days
|
|||||||||||||||||||||
|
Days
|
Days
|
Or More
|
Total
|
Total
|
|||||||||||||||||||
|
Past Due
|
Past Due
|
Past Due
|
Past Due
|
Current
|
Loans
|
||||||||||||||||||
|
Commercial
|
$
|
538
|
|
$
|
197
|
|
$
|
17
|
|
$
|
752
|
|
$
|
99,039
|
|
$
|
99,791
|
|
|||||
|
Commercial Real Estate:
|
|||||||||||||||||||||||
|
Commercial Real Estate
–
construction
|
—
|
|
—
|
|
—
|
|
0
|
|
11,083
|
|
11,083
|
|
|||||||||||
|
Commercial Real Estate
–
other
|
284
|
|
—
|
|
1,825
|
|
2,109
|
|
230,040
|
|
232,149
|
|
|||||||||||
|
Consumer:
|
|||||||||||||||||||||||
|
Consumer-other
|
75
|
|
12
|
|
6
|
|
93
|
|
6,225
|
|
6,318
|
|
|||||||||||
|
Consumer-automobile
|
3,512
|
|
670
|
|
314
|
|
4,496
|
|
317,879
|
|
322,375
|
|
|||||||||||
|
Residential - Real Estate
|
1,544
|
|
226
|
|
3,056
|
|
4,826
|
|
454,915
|
|
459,741
|
|
|||||||||||
|
Total
|
$
|
5,953
|
|
$
|
1,105
|
|
$
|
5,218
|
|
$
|
12,276
|
|
$
|
1,119,181
|
|
$
|
1,131,457
|
|
|||||
|
Age Analysis of Past Due Loans
|
|||||||||||||||||||||||
|
As of December 31, 2010
|
|||||||||||||||||||||||
|
30-59
|
60-89
|
90 Days
|
|||||||||||||||||||||
|
Days
|
Days
|
Or More
|
Total
|
Total
|
|||||||||||||||||||
|
Past Due
|
Past Due
|
Past Due
|
Past Due
|
Current
|
Loans
|
||||||||||||||||||
|
Commercial
|
$
|
591
|
|
$
|
377
|
|
$
|
79
|
|
$
|
1,047
|
|
$
|
96,572
|
|
$
|
97,619
|
|
|||||
|
Commercial Real Estate:
|
|||||||||||||||||||||||
|
Commercial Real Estate
–
construction
|
—
|
|
—
|
|
—
|
|
—
|
|
7,090
|
|
7,090
|
|
|||||||||||
|
Commercial Real Estate
–
other
|
483
|
|
—
|
|
254
|
|
737
|
|
213,554
|
|
214,291
|
|
|||||||||||
|
Consumer:
|
|||||||||||||||||||||||
|
Consumer-other
|
5
|
|
—
|
|
—
|
|
5
|
|
6,477
|
|
6,482
|
|
|||||||||||
|
Consumer-automobile
|
3,542
|
|
1,547
|
|
508
|
|
5,597
|
|
329,061
|
|
334,658
|
|
|||||||||||
|
Residential - Real Estate
|
212
|
|
1,884
|
|
1,145
|
|
3,241
|
|
482,127
|
|
485,368
|
|
|||||||||||
|
Total
|
$
|
4,833
|
|
$
|
3,808
|
|
$
|
1,986
|
|
$
|
10,627
|
|
$
|
1,134,881
|
|
$
|
1,145,508
|
|
|||||
#
71
Nonaccrual Loans and Loans Past Due 90 or More Days and Still Accruing Interest
The following table presents information concerning loans on nonaccrual status and loans past due 90 or more days and still accruing interest at December 31:
|
Loans on Nonaccrual Status and Past Due 90 or More Days and Still Accruing Interest
|
|||||||||||||||
|
As of December 31, 2011 and 2010
|
|||||||||||||||
|
2011
|
2010
|
||||||||||||||
|
90 Days
|
90 Days
|
||||||||||||||
|
or More
|
or More
|
||||||||||||||
|
Nonaccrual
|
Past Due
|
Nonaccrual
|
Past Due
|
||||||||||||
|
Commercial
|
$
|
6
|
|
17
|
|
$
|
94
|
|
$ ---
|
|
|||||
|
Commercial real estate:
|
|||||||||||||||
|
Commercial real estate - construction
|
—
|
|
—
|
|
—
|
|
—
|
|
|||||||
|
Commercial real estate - other
|
1,503
|
|
684
|
|
2,237
|
|
83
|
|
|||||||
|
Consumer:
|
|||||||||||||||
|
Consumer
–
other
|
6
|
|
—
|
|
5
|
|
—
|
|
|||||||
|
Consumer
–
automobile
|
431
|
|
56
|
|
809
|
|
—
|
|
|||||||
|
Residential - Real Estate
|
2,582
|
|
905
|
|
916
|
|
727
|
|
|||||||
|
Total nonaccrual loans and loans past due 90 or
more days and still accruing interest
|
$
|
4,528
|
|
$
|
1,662
|
|
$
|
4,061
|
|
$
|
810
|
|
|||
|
Interest income on nonaccrual loans:
|
|||||||||||||||
|
Gross income that would have been earned
under original terms
|
$
|
311
|
|
$
|
314
|
|
|||||||||
|
Interest included in income
|
99
|
|
211
|
|
|||||||||||
Impaired Loans
At December 31, 2011, all impaired loans were evaluated for impairment based on the fair value of collateral less estimated cost to sell. There was no allowance for loan losses allocated to impaired loans at December 31, 2011 and 2010. Interest income recognized in the table below, represents income earned after the loans became impaired and includes restructured loans in compliance with their modified terms and nonaccrual loans where we have recognized interest income on a cash basis.
|
Impaired Loans
|
|||||||||||||||||||||||
|
As of and For the Years Ended December 31, 2011 and 2010
|
|||||||||||||||||||||||
|
Unpaid
|
Average
|
Interest
|
Cash
|
||||||||||||||||||||
|
Recorded
|
Principal
|
Related
|
Recorded
|
Income
|
Basis
|
||||||||||||||||||
|
Investment
|
Balance
|
Allowance
|
Investment
|
Recognized
|
Interest
|
||||||||||||||||||
|
2011
|
|||||||||||||||||||||||
|
With no related allowance recorded:
|
|||||||||||||||||||||||
|
Commercial
|
$
|
66
|
|
$
|
66
|
|
$
|
—
|
|
$
|
74
|
|
$
|
2
|
|
$
|
—
|
|
|||||
|
Commercial real estate
|
1,953
|
|
1,953
|
|
—
|
|
1,984
|
|
57
|
|
33
|
|
|||||||||||
|
Automobile
|
268
|
|
268
|
|
—
|
|
311
|
|
8
|
|
—
|
|
|||||||||||
|
Residential real estate
|
2,108
|
|
2,108
|
|
—
|
|
2,100
|
|
32
|
|
—
|
|
|||||||||||
|
Total
|
$
|
4,395
|
|
$
|
4,395
|
|
$
|
—
|
|
$
|
4,469
|
|
$
|
99
|
|
$
|
33
|
|
|||||
|
2010
|
|||||||||||||||||||||||
|
With no related allowance recorded:
|
|||||||||||||||||||||||
|
Commercial
|
$
|
13
|
|
$
|
13
|
|
$
|
—
|
|
$
|
13
|
|
$
|
4
|
|
$
|
—
|
|
|||||
|
Commercial real estate
|
2,032
|
|
2,032
|
|
—
|
|
1,983
|
|
123
|
|
57
|
|
|||||||||||
|
Consumer - other
|
11
|
|
11
|
|
—
|
|
11
|
|
1
|
|
—
|
|
|||||||||||
|
Automobile
|
280
|
|
280
|
|
—
|
|
280
|
|
16
|
|
—
|
|
|||||||||||
|
Residential real estate
|
548
|
|
548
|
|
—
|
|
550
|
|
17
|
|
—
|
|
|||||||||||
|
Total
|
$
|
2,871
|
|
$
|
2,871
|
|
$
|
—
|
|
$
|
2,824
|
|
$
|
157
|
|
$
|
57
|
|
|||||
#
72
Allowance for Loan Losses
Through the provision for loan losses, an allowance is maintained that reflects our best estimate of probable incurred loan losses related to specifically identified loans and losses for categories of loans in the remaining portfolio. Actual loan losses are charged against this allowance when loans are deemed uncollectible.
We use a two-step process to determine the provision for loans losses and the amount of the allowance for loan losses. We evaluate nonaccrual loans over $250 thousand and all troubled debt restructured loans individually for impairment as described in Note 1, while we evaluate the remainder of the portfolio on a pooled basis as described below.
Homogenous Loan Pools
: Under our pooled analysis, we group homogeneous loans as follows, each with its own estimated loss-rate:
|
i.)
|
Secured and unsecured commercial loans,
|
|
ii.)
|
Secured construction and development loans,
|
|
iii.)
|
Secured commercial loans
–
non-owner occupied,
|
|
iv.)
|
Secured commercial loans
–
owner occupied,
|
|
v.)
|
One to four family residential real estate loans,
|
|
vi.)
|
Home equity loans,
|
|
vii.)
|
Indirect loans
–
low risk tiers (based on credit scores),
|
|
viii.)
|
Indirect loans
–
high risk tiers, and
|
|
ix.)
|
Other consumer loans.
|
Within the group of other commercial and commercial real estate loans, we sub-group loans based on our internal system of risk-rating, which is applied to all commercial and commercial real estate loans. We establish loss rates for each of these pools.
Estimated losses reflect consideration of all significant factors that affect the collectability of the portfolio as of December 31, 2011. In our evaluation, we do both a quantitative and qualitative analysis of the homogeneous pools.
Quantitative Analysis
: Quantitatively, we determine the historical loss rate for each homogeneous loan pool. During the past five years we have had little charge-off activity on loans secured by residential real estate. Indirect consumer lending (principally automobile loans) represents a significant component of our total loan portfolio and is the only category of loans that has a history of losses that lends itself to a trend analysis. We have had one small loss on commercial real estate loans in the past five years. Losses on commercial loans (other than those secured by real estate) are also historically low, but can vary widely from year-to-year; this is the most complex category of loans in our loss analysis. Our net charge-offs for the past five years have been at or near historical lows for our Company. Annualized net charge-offs have ranged from .04% to .09% of average loans during this period.
Qualitative Analysis
: While historical loss experience provides a reasonable starting point for our analysis, historical losses, or even recent trends in losses, do not by themselves form a sufficient basis to determine the appropriate level for the allowance. Therefore, we have also considered and adjusted historical loss factors for qualitative and environmental factors that are likely to cause credit losses associated with our existing portfolio. These included:
|
•
|
Changes in the volume and severity of past due, nonaccrual and adversely classified loans
|
|
•
|
Changes in the nature and volume of the portfolio and in the terms of loans
|
|
•
|
Changes in the value of the underlying collateral for collateral dependent loans
|
|
•
|
Changes in lending policies and procedures, including changes in underwriting standards and collection, charge-off, and recovery practices not considered elsewhere in estimating credit losses
|
|
•
|
Changes in the quality of the loan review system
|
|
•
|
Changes in the experience, ability, and depth of lending management and other relevant staff
|
|
•
|
Changes in international, national, regional, and local economic and business conditions and developments that affect the collectibility of the portfolio
|
|
•
|
The existence and effect of any concentrations of credit, and changes in the level of such concentrations
|
|
•
|
The effect of other external factors such as competition and legal and regulatory requirements on the level of estimated credit losses in the existing portfolio or pool
|
For each homogeneous loan pool, we estimate a loss factor expressed in basis points for each of the qualitative factors above, and for historical credit losses. We update and change, if necessary, the loss-rates assigned to various pools based on the analysis of loss trends and the change in qualitative and environmental factors.
From June 2004 to June 2006, the Federal Reserve Bank increased prevailing short-term rates in an effort to slow down national economic growth and check potential increases in the inflation rate. However, from August 2007 through December 2008, the Federal Reserve Bank began to cut rates in response to the growing financial crisis in credit markets and evidence of a significant economic recession. In our market area there was little impact from these developments in credit markets and the national economy on unemployment rates, job growth and business failures until the last quarter of 2008; overall, our market area has not experienced in subsequent quarters the degree of negative impact on lending, credit and property values that the U.S. as a whole has experienced, although this may change in upcoming periods.
#
73
Due to the imprecise nature of the loan loss estimation process and ever changing economic conditions, the risk attributes of our portfolio may not be adequately captured in data related to the formula-based loan loss components used to determine allocations in our analysis of the adequacy of the allowance for loan losses. Management, therefore, has established and held an unallocated portion within the allowance for loan losses reflecting the uncertainty of future economic conditions within our market area. The unallocated portion of the allowance was $1.1 million, or 7.2% of the total allowance for loan losses, at December 31, 2011 and $1.3 million, or 8.7% of the total allowance for loan losses, at December 31, 2010.
The following summarizes the changes in the allowance for credit losses during the years and the period-end recorded investment in loans for the years ended December 31, 2011 and 2010:
|
Allowance for Loan Losses
|
|||||||||||||||||||||||||||||||
|
Commercial
|
Commercial
|
Other
|
|||||||||||||||||||||||||||||
|
Commercial
|
Construction
|
Real Estate
|
Consumer
|
Automobile
|
Residential
|
Unallocated
|
Total
|
||||||||||||||||||||||||
|
Balance
January 1, 2010
|
$
|
1,304
|
|
$
|
—
|
|
$
|
4,000
|
|
$
|
—
|
|
$
|
4,901
|
|
$
|
2,954
|
|
$
|
855
|
|
$
|
14,014
|
|
|||||||
|
Charge-offs
|
(30
|
)
|
—
|
|
—
|
|
—
|
|
(864
|
)
|
—
|
|
—
|
|
(894
|
)
|
|||||||||||||||
|
Recoveries
|
5
|
|
—
|
|
—
|
|
—
|
|
262
|
|
—
|
|
—
|
|
267
|
|
|||||||||||||||
|
Provision
|
758
|
|
135
|
|
(1,007
|
)
|
328
|
|
461
|
|
209
|
|
418
|
|
1,302
|
|
|||||||||||||||
|
Balance
December 31, 2010
|
$
|
2,037
|
|
$
|
135
|
|
$
|
2,993
|
|
$
|
328
|
|
$
|
4,760
|
|
$
|
3,163
|
|
$
|
1,273
|
|
$
|
14,689
|
|
|||||||
|
Charge-offs
|
(105
|
)
|
—
|
|
—
|
|
(42
|
)
|
(480
|
)
|
(147
|
)
|
—
|
|
(774
|
)
|
|||||||||||||||
|
Recoveries
|
17
|
|
—
|
|
—
|
|
28
|
|
198
|
|
—
|
|
—
|
|
243
|
|
|||||||||||||||
|
Provision
|
336
|
|
454
|
|
174
|
|
36
|
|
(9
|
)
|
49
|
|
(195
|
)
|
845
|
|
|||||||||||||||
|
Balance
December 31, 2011
|
$
|
2,285
|
|
$
|
589
|
|
$
|
3,167
|
|
$
|
350
|
|
$
|
4,469
|
|
$
|
3,065
|
|
$
|
1,078
|
|
$
|
15,003
|
|
|||||||
The following tables presents information on loans and allowance for loan losses collectively and individually evaluated for impairment:
|
Loans and Allowance for Loan Losses Individually and Collectively Evaluated for Impairment
|
|||||||||||||||||||||||||||
|
Commercial
|
Commercial
|
Other
|
|||||||||||||||||||||||||
|
Commercial
|
Construction
|
Real Estate
|
Consumer
|
Automobile
|
Residential
|
Total
|
|||||||||||||||||||||
|
December 31, 2011
|
|||||||||||||||||||||||||||
|
Loans:
|
|||||||||||||||||||||||||||
|
Ending loan balance:
Individually evaluated
for impairment
|
$
|
66
|
|
$
|
—
|
|
$
|
1,953
|
|
$
|
—
|
|
$
|
268
|
|
$
|
2,108
|
|
$
|
4,395
|
|
||||||
|
Ending loan balance:
Collectively evaluated
for impairment
|
99,725
|
|
11,083
|
|
230,196
|
|
6,318
|
|
322,107
|
|
457,633
|
|
1,127,062
|
|
|||||||||||||
|
Ending loan balance
|
$
|
99,791
|
|
$
|
11,083
|
|
$
|
232,149
|
|
$
|
6,318
|
|
$
|
322,375
|
|
$
|
459,741
|
|
$
|
1,131,457
|
|
||||||
|
Allowance for Loan Losses:
|
|||||||||||||||||||||||||||
|
Ending balance:
Collectively evaluated
for impairment
|
$
|
2,285
|
|
$
|
589
|
|
$
|
3,167
|
|
$
|
350
|
|
$
|
4,469
|
|
$
|
3,065
|
|
$
|
13,925
|
|
||||||
|
December 31, 2010
|
|||||||||||||||||||||||||||
|
Loans:
|
|||||||||||||||||||||||||||
|
Ending loan balance:
Individually evaluated
for impairment
|
$
|
13
|
|
$
|
—
|
|
$
|
2,032
|
|
$
|
11
|
|
$
|
280
|
|
$
|
548
|
|
$
|
2,884
|
|
||||||
|
Ending loan balance:
Collectively evaluated
for impairment
|
97,608
|
|
7,090
|
|
212,259
|
|
6,471
|
|
334,376
|
|
484,820
|
|
1,142,624
|
|
|||||||||||||
|
Ending loan balance
|
$
|
97,621
|
|
$
|
7,090
|
|
$
|
214,291
|
|
$
|
6,482
|
|
$
|
334,656
|
|
$
|
485,368
|
|
$
|
1,145,508
|
|
||||||
|
Allowance for Loan Losses:
|
|||||||||||||||||||||||||||
|
Ending balance:
Collectively evaluated
for impairment
|
$
|
2,037
|
|
$
|
135
|
|
$
|
2,993
|
|
$
|
328
|
|
$
|
4,760
|
|
$
|
3,163
|
|
$
|
13,416
|
|
||||||
#
74
In general, loans requiring modification are restructured to accommodate the projected cash-flows of the borrower. No loans modified during the preceding twelve months subsequently defaulted as of December 31, 2011. The following table presents information on loans that were modified during the year ending on December, 2011:
|
Loans Modified in Trouble Debt Restructurings During 2011
|
||||||||||
|
Number of
Loans
|
Pre-Modification
Outstanding
Recorded
Investment
|
Post-Modification
Outstanding
Recorded
Investment
|
||||||||
|
Commercial
|
1
|
|
$
|
63
|
|
$
|
63
|
|
||
|
Commercial Real Estate
|
1
|
|
917
|
|
917
|
|
||||
|
Automobile
|
14
|
|
121
|
|
121
|
|
||||
|
Residential Real Estate
|
1
|
|
242
|
|
242
|
|
||||
|
Total
|
17
|
|
$
|
1,343
|
|
$
|
1,343
|
|
||
There were no subsequent defaults on loans modified in trouble debt restructurings during 2011.
|
Note 5:
|
PREMISES AND EQUIPMENT (In Thousands)
|
A summary of premises and equipment at
December 31, 2011
and
2010
is presented below:
|
2011
|
2010
|
||||||
|
Land and Bank Premises
|
$
|
28,391
|
|
$
|
23,801
|
|
|
|
Equipment, Furniture and Fixtures
|
18,028
|
|
17,543
|
|
|||
|
Leasehold Improvements
|
932
|
|
916
|
|
|||
|
Total Cost
|
47,351
|
|
42,260
|
|
|||
|
Accumulated Depreciation and Amortization
|
(24,722
|
)
|
(23,424
|
)
|
|||
|
Net Premises and Equipment
|
$
|
22,629
|
|
$
|
18,836
|
|
|
Amounts charged to expense for depreciation totaled $1,382, $1,286 and $1,265 in
2011
,
2010
and
2009
, respectively. Amounts charged to expense for leasing office space totaled $570, $351 and $313 in
2011
,
2010
and
2009
, respectively.
|
Note 6:
|
OTHER INTANGIBLE ASSETS (In Thousands)
|
The following table presents information on Arrow
’
s intangible assets (other than goodwill) as of
December 31, 2011
,
2010
and
2009
:
|
Depositor
Intangibles
1
|
|
Mortgage
Servicing
Rights
2
|
|
Covenants
1
|
|
Expirations
1
|
|
Total
|
|
||||||||||
|
Gross Carrying Amount, December 31, 2011
|
$
|
2,247
|
|
$
|
834
|
|
$
|
117
|
|
$
|
4,451
|
|
$
|
7,649
|
|
||||
|
Accumulated Amortization
|
(1,961
|
)
|
(235
|
)
|
(117
|
)
|
(587
|
)
|
(2,900
|
)
|
|||||||||
|
Net Carrying Amount, December 31, 2011
|
$
|
286
|
|
$
|
599
|
|
—
|
|
$
|
3,864
|
|
$
|
4,749
|
|
|||||
|
Gross Carrying Amount, December 31, 2010
|
$
|
2,247
|
|
$
|
722
|
|
$
|
117
|
|
$
|
877
|
|
$
|
3,963
|
|
||||
|
Accumulated Amortization
|
(1,787
|
)
|
(351
|
)
|
(117
|
)
|
(250
|
)
|
(2,505
|
)
|
|||||||||
|
Net Carrying Amount, December 31, 2010
|
$ 460
|
|
$
|
371
|
|
—
|
|
$
|
627
|
|
$
|
1,458
|
|
||||||
|
Amortization Expense:
|
|||||||||||||||||||
|
2011
|
$
|
174
|
|
$
|
111
|
|
—
|
|
$
|
336
|
|
$
|
621
|
|
|||||
|
2010
|
214
|
|
67
|
|
—
|
|
56
|
|
337
|
|
|||||||||
|
2009
|
255
|
|
62
|
|
21
|
|
48
|
|
386
|
|
|||||||||
#
75
|
Depositor
Intangibles
1
|
|
Mortgage
Servicing
Rights
2
|
|
Expirations
1
|
|
Total
|
|
||||||||
|
Estimated Annual Amortization Expense:
|
|||||||||||||||
|
2012
|
$
|
133
|
|
$
|
128
|
|
$
|
385
|
|
$
|
646
|
|
|||
|
2013
|
92
|
|
127
|
|
361
|
|
580
|
|
|||||||
|
2014
|
51
|
|
127
|
|
336
|
|
514
|
|
|||||||
|
2015
|
10
|
|
106
|
|
319
|
|
435
|
|
|||||||
|
2016
|
—
|
|
85
|
|
299
|
|
384
|
|
|||||||
|
Later Years
|
---
|
|
26
|
|
2,164
|
|
2,190
|
|
|||||||
|
Total
|
$
|
286
|
|
$
|
599
|
|
$
|
3,864
|
|
$
|
4,749
|
|
|||
1
Reported in the income statement as a component of other operating expense.
2
Reported in the income statement as a reduction of servicing fee income.
During
2011
and
2010
, no impairment losses were recognized with respect to Arrow
’
s existing goodwill or intangible assets.
|
Note 7:
|
TIME DEPOSITS (In Thousands)
|
The following summarizes the contractual maturities of time deposits during years subsequent to
December 31, 2011
:
|
Time
Deposits
of $100,000
or More
|
|
Other
Time
Deposits
|
|
||||
|
2012
|
$
|
146,522
|
|
$
|
81,930
|
|
|
|
2013
|
31,689
|
|
14,248
|
|
|||
|
2014
|
29,503
|
|
19,252
|
|
|||
|
2015
|
12,100
|
|
5,285
|
|
|||
|
2016
|
8,028
|
|
2,953
|
|
|||
|
2017 and Beyond
|
1,148
|
|
—
|
|
|||
|
Total
|
$
|
228,990
|
|
$
|
123,668
|
|
|
|
Note 8:
|
SHORT-TERM BORROWINGS (Dollars in Thousands)
|
|
2011
|
2010
|
2009
|
|||||||||
|
Overnight Advances from the Federal Home Loan Bank of New York,
Federal Funds Purchased and Securities Sold Under Agreements to Repurchase:
|
|||||||||||
|
Balance at December 31
|
$
|
68,293
|
|
$
|
51,581
|
|
$
|
72,020
|
|
||
|
Maximum Month-End Balance
|
93,988
|
|
67,772
|
|
72,020
|
|
|||||
|
Average Balance During the Year
|
54,750
|
|
63,082
|
|
58,290
|
|
|||||
|
Average Rate During the Year
|
0.17
|
%
|
0.20
|
%
|
0.22
|
%
|
|||||
|
Rate at December 31
|
0.23
|
%
|
0.19
|
%
|
0.21
|
%
|
|||||
|
Other Short-Term Borrowings:
|
|||||||||||
|
Balance at December 31
|
$
|
—
|
|
$
|
1,633
|
|
$
|
1,888
|
|
||
|
Maximum Month-End Balance
|
2,211
|
|
2,077
|
|
3,224
|
|
|||||
|
Average Balance During the Year
|
1,456
|
|
1,399
|
|
1,276
|
|
|||||
|
Average Rate During the Year
|
—
|
%
|
—
|
%
|
—
|
%
|
|||||
|
Rate at December 31
|
—
|
%
|
—
|
%
|
—
|
%
|
|||||
|
Average Aggregate Short-Term Borrowing Rate During the Year
|
0.16
|
%
|
0.19
|
%
|
0.22
|
%
|
|||||
Securities sold under agreements to repurchase generally mature within ninety days. Arrow maintains effective control over the securities underlying the agreements. Federal funds purchased represent overnight transactions. Other short-term borrowings are comprised of demand notes issued to the U.S. Treasury.
Arrow has in place unsecured federal funds lines of credit with three correspondent banks totaling $30,000. There were no funds purchased at December 31, 2011. We participate in the Overnight Advance program with the FHLBNY, which allows for overnight advances up to the limit of pledged collateral, including mortgage-backed securities and loans. The additional amount available for overnight advances amounted to $114,588 at December 31, 2011. Our two bank subsidiaries have each established a borrowing facility with the Federal Reserve Bank of New York, pledging certain consumer loans as collateral for potential
“
discount
#
76
window
”
advances. At December 31, 2011, the amount available under this facility was $244,700, but there were no advances then outstanding.
|
Note 9:
|
FHLBNY
ADVANCES (Dollars in Thousands)
|
Through our borrowing relationship with the FHLBNY, we have pledged collateral, including mortgage-backed securities and residential mortgage loans. Our unused borrowing capacity at the FHLBNY was $114,588 at
December 31, 2011
. Participation in the FHLBNY program requires an investment in FHLBNY stock. The investment in FHLBNY stock, included in Other Investments on the Consolidated Balance Sheets, amounted to $5,691 and $7,743 at
December 31, 2011
and
2010
, respectively. Arrow also borrows longer-term funds from the FHLBNY. Certain borrowings are in the form of
“
convertible advances.
”
These advances have a set final maturity, but are callable by the FHLBNY at certain dates beginning no earlier than one year from the issuance date. If the advances are called, Arrow may elect to have the funds replaced by the FHLBNY at the then prevailing market rate of interest. The borrowings are secured by mortgage loans and/or mortgage-backed securities and/or FHLBNY stock held by Arrow. The total amount of assets pledged to the FHLBNY for borrowing arrangements at
December 31, 2011
and
2010
amounted to $177,762 and $220,563, respectively.
The table below presents information applicable to FHLBNY advances as of
December 31, 2011
and
2010
:
|
2011
|
2010
|
Effective Rate
|
Next Call Date
|
Call Frequency
|
Maturity Date
|
|||||||||
|
$
|
10,000
|
|
$
|
—
|
|
1.43%
|
5/24/2014
|
|||||||
|
10,000
|
|
10,000
|
|
3.88%
|
1/9/2012
|
Quarterly
|
10/6/2015
|
|||||||
|
10,000
|
|
10,000
|
|
4.70%
|
Quarterly
|
1/12/2012
|
||||||||
|
10,000
|
|
10,000
|
|
1.65%
|
7/1/2013
|
|||||||||
|
—
|
|
5,000
|
|
4.91%
|
1/28/2011
|
Quarterly
|
7/28/2011
|
|||||||
|
—
|
|
5,000
|
|
4.82%
|
1/28/2011
|
Quarterly
|
7/28/2011
|
|||||||
|
—
|
|
10,000
|
|
4.72%
|
1/27/2011
|
Quarterly
|
7/27/2012
|
|||||||
|
—
|
|
10,000
|
|
4.46%
|
2/28/2011
|
Quarterly
|
8/28/2012
|
|||||||
|
—
|
|
10,000
|
|
3.73%
|
3/20/2011
|
Quarterly
|
12/20/2012
|
|||||||
|
—
|
|
10,000
|
|
5.12%
|
One-Time
|
2/14/2011
|
||||||||
|
—
|
|
10,000
|
|
5.18%
|
One-Time
|
2/23/2011
|
||||||||
|
—
|
|
10,000
|
|
5.03%
|
One-Time
|
4/28/2011
|
||||||||
|
—
|
|
10,000
|
|
5.20%
|
One-Time
|
5/19/2011
|
||||||||
|
—
|
|
10,000
|
|
5.07%
|
One-Time
|
5/19/2011
|
||||||||
|
—
|
|
10,000
|
|
4.32%
|
One-Time
|
10/9/2012
|
||||||||
|
$
|
40,000
|
|
$
|
130,000
|
|
|||||||||
The table below presents the amounts of FHLBNY advances maturing in the next five years and beyond:
|
Final Maturity
|
Amount
|
|
|
|
2012
|
$
|
10,000
|
|
|
2013
|
10,000
|
|
|
|
2014
|
10,000
|
|
|
|
2015
|
10,000
|
|
|
|
2016
|
—
|
|
|
|
Total FHLBNY Advances
|
$
|
40,000
|
|
|
Note 10:
|
GUARANTEED PREFERRED BENEFICIAL INTERESTS IN CORPORATION
’
S JUNIOR SUBORDINATED
|
DEBENTURES
(In Thousands)
During
2011
, there were outstanding two classes of financial instruments issued by two separate subsidiary business trusts of Arrow, having an aggregate amount of $20,000, identified as
“
Junior Subordinated Obligations Issued to Unconsolidated Subsidiary Trusts
”
on the Consolidated Balance Sheets and the Consolidated Income Statements.
The first of the two classes of trust-issued instruments outstanding at year-end was issued by Arrow Capital Statutory Trust II ("ACST II"), a Delaware business trust established on July 16, 2003, upon the filing of a certificate of trust with the Delaware Secretary of State. In July 2003, ACST II issued all of its voting (common) stock to Arrow and issued and sold to an unaffiliated purchaser 30-year guaranteed preferred beneficial interests in the trust's assets ("ACST II trust preferred securities") in the aggregate amount of $10,000. The ACST II trust preferred securities bore a rate of 6.53% through September 30, 2008. After that date the rate became variable, adjusting quarterly to the 3-month LIBOR plus 3.15%. ACST II used the proceeds of the sale of its trust preferred securities to purchase an identical amount ($10,000) of junior subordinated debentures issued by Arrow that bear an
#
77
interest rate identical at all times to the rate payable on the ACST II trust preferred securities. The ACST II trust preferred securities became redeemable after July 23, 2008.
The second of the two classes of trust-issued instruments outstanding at year-end was issued by Arrow Capital Statutory Trust III ("ACST III"), a Delaware business trust established on December 23, 2004, upon the filing of a certificate of trust with the Delaware Secretary of State. On December 28, 2004, the ACST III issued all of its voting (common) stock to Arrow and issued and sold to an unaffiliated purchaser 30-year guaranteed preferred beneficial interests in the trust's assets ("ACST III trust preferred securities") in the aggregate amount of $10,000. The rate on the ACST III trust preferred securities is a variable rate, adjusted quarterly, equal to the 3-month LIBOR plus 2.00%. ACST III used the proceeds of the sale of its trust preferred securities to purchase an identical amount ($10,000) of junior subordinated debentures issued by Arrow that bear an interest rate identical at all times to the rate payable on the ACST III trust preferred securities. The ACST III trust preferred securities became redeemable on or after March 31, 2010.
The primary assets of the two subsidiary trusts having trust preferred securities outstanding at year-end, ACST II and ACST III (the
“
Trusts
”
), are Arrow's junior subordinated debentures discussed above, and the sole revenues of the Trusts are payments received by them from Arrow with respect to the junior subordinated debentures. The trust preferred securities issued by the Trusts are non-voting. All common voting securities of the Trusts are owned by Arrow. Arrow used the net proceeds from its sale of junior subordinated debentures to the Trusts, facilitated by the Trust
’
s sale of their trust preferred securities to the purchasers thereof, for general corporate purposes. The trust preferred securities and underlying junior subordinated debentures, with associated expense that is tax deductible, qualify as Tier I capital under regulatory definitions.
Arrow's primary source of funds to pay interest on the debentures that are held by the Trusts are current dividends received by Arrow from its subsidiary banks. Accordingly, Arrow's ability to make payments on the debentures, and the ability of the Trusts to make payments on their trust preferred securities, are dependent upon the continuing ability of Arrow's subsidiary banks to pay dividends to Arrow. Since the trust preferred securities issued by the subsidiary trusts and the underlying junior subordinated debentures issued by Arrow at
December 31, 2011
,
2010
and
2009
are classified as debt for financial statement purposes, the expense associated with these securities is recorded as interest expense in the consolidated statements of income for the three years.
|
Note 11:
|
COMPREHENSIVE INCOME (In Thousands)
|
The following table presents the components of other comprehensive income for the years ended
December 31, 2011
,
2010
and
2009
:
|
Tax
|
|||||||||||
|
Before-Tax
|
(Expense)
|
Net-of-Tax
|
|||||||||
|
Amount
|
Benefit
|
Amount
|
|||||||||
|
2011
|
|||||||||||
|
Unrealized Securities Holding Gains Arising During the Period
|
$
|
7,850
|
|
$
|
(3,109
|
)
|
$
|
4,741
|
|
||
|
Reclassification Adjustment for Net Securities Gains Included in Net Income
|
(2,795
|
)
|
1,107
|
|
(1,688
|
)
|
|||||
|
Net Retirement Plan Loss
|
(6,129
|
)
|
2,428
|
|
(3,701
|
)
|
|||||
|
Net Retirement Plan Prior Service Cost
|
(266
|
)
|
105
|
|
(161
|
)
|
|||||
|
Amortization of Net Retirement Plan Actuarial Loss
|
996
|
|
(394
|
)
|
602
|
|
|||||
|
Accretion of Net Retirement Plan Prior Service Credit
|
(108
|
)
|
43
|
|
(65
|
)
|
|||||
|
Other Comprehensive Income
|
$
|
(452
|
)
|
$
|
180
|
|
$
|
(272
|
)
|
||
|
2010
|
|||||||||||
|
Unrealized Securities Holding Gains Arising During the Period
|
$
|
2,507
|
|
$
|
(993
|
)
|
$
|
1,514
|
|
||
|
Reclassification Adjustment for Net Securities Gains Included in Net Income
|
(1,507
|
)
|
597
|
|
(910
|
)
|
|||||
|
Net Retirement Plan Loss
|
(1,811
|
)
|
718
|
|
(1,093
|
)
|
|||||
|
Net Retirement Plan Prior Service Credit
|
242
|
|
(96
|
)
|
146
|
|
|||||
|
Amortization of Net Retirement Plan Actuarial Loss
|
1,112
|
|
(440
|
)
|
672
|
|
|||||
|
Accretion of Net Retirement Plan Prior Service Credit
|
(186
|
)
|
74
|
|
(112
|
)
|
|||||
|
Other Comprehensive Income
|
$
|
357
|
|
$
|
(140
|
)
|
$
|
217
|
|
||
|
2009
|
|||||||||||
|
Unrealized Securities Holding Gains Arising During the Period
|
$
|
1,172
|
|
$
|
(465
|
)
|
$
|
707
|
|
||
|
Reclassification Adjustment for Net Securities Gains Included in Net Income
|
(357
|
)
|
142
|
|
(215
|
)
|
|||||
|
Reclassification Adjustment for Other-Than-Temporary Impairment
|
375
|
|
(149
|
)
|
226
|
|
|||||
|
Net Retirement Plan Gain
|
2,456
|
|
(973
|
)
|
1,483
|
|
|||||
|
Net Retirement Plan Prior Service Cost
|
(257
|
)
|
102
|
|
(155
|
)
|
|||||
|
Amortization of Net Retirement Plan Actuarial Loss
|
1,370
|
|
(543
|
)
|
827
|
|
|||||
|
Accretion of Net Retirement Plan Prior Service Credit
|
(181
|
)
|
72
|
|
(109
|
)
|
|||||
|
Other Comprehensive Income
|
$
|
4,578
|
|
$
|
(1,814
|
)
|
$
|
2,764
|
|
||
#
78
The following table presents the components, net of tax, of accumulated other comprehensive loss as of December 31:
|
2011
|
|
2010
|
|
||||
|
Retirement Plan Net Loss
|
$
|
(13,709
|
)
|
$
|
(10,610
|
)
|
|
|
Retirement Plan Prior Service Credit
|
206
|
|
432
|
|
|||
|
Net Unrealized Securities Holding Gains
|
6,808
|
|
3,755
|
|
|||
|
Total Accumulated Other Comprehensive Loss
|
$
|
(6,695
|
)
|
$
|
(6,423
|
)
|
|
|
Note 12:
|
EARNINGS PER COMMON SHARE (In Thousands, Except Per Share Amounts)
|
The following table presents a reconciliation of the numerator and denominator used in the calculation of basic and diluted earnings per common share (
“
EPS
”
) for each of the years in the three-year period ended
December 31, 2011
. All share and per share amounts have been adjusted for the
2011
3% stock dividend.
|
Net Income
(Numerator)
|
|
Weighted-Average Shares
(Denominator)
|
|
Per Share
Amount
|
|
|||||
|
For the Year Ended December 31, 2011:
|
||||||||||
|
Basic EPS
|
$
|
21,933
|
|
11,735
|
|
$
|
1.87
|
|
||
|
Dilutive Effect of Stock Options
|
—
|
|
12
|
|
||||||
|
Diluted EPS
|
$
|
21,933
|
|
11,747
|
|
$
|
1.87
|
|
||
|
For the Year Ended December 31, 2010:
|
||||||||||
|
Basic EPS
|
$
|
21,892
|
|
11,604
|
|
$
|
1.89
|
|
||
|
Dilutive Effect of Stock Options
|
—
|
|
35
|
|
||||||
|
Diluted EPS
|
$
|
21,892
|
|
11,639
|
|
$
|
1.88
|
|
||
|
For the Year Ended December 31, 2009:
|
||||||||||
|
Basic EPS
|
$
|
21,792
|
|
11,568
|
|
$
|
1.88
|
|
||
|
Dilutive Effect of Stock Options
|
—
|
|
52
|
|
||||||
|
Diluted EPS
|
$
|
21,792
|
|
11,620
|
|
$
|
1.88
|
|
||
During
2011
, options to purchase 136 shares of common stock at an average price of $25.63 per share were outstanding but were not included in the computation of diluted EPS because the options
’
exercise price was greater than the average market price of the common shares during that period. Anti-dilutive shares for 2009 were 73 shares at an average price of $26.77 per share.
|
Note 13:
|
REGULATORY MATTERS (Dollars in Thousands)
|
In the normal course of business, Arrow and its subsidiaries operate under certain regulatory restrictions, such as the extent and structure of covered inter-company borrowings and maintenance of reserve requirement balances.
The principal source of the funds for the payment of stockholder dividends by Arrow has been from dividends declared and paid to Arrow by its bank subsidiaries. As of
December 31, 2011
, the maximum amount that could have been paid by subsidiary banks to Arrow, without prior regulatory approval, was approximately $28,291.
Under current Federal Reserve regulations, Arrow is prohibited from borrowing from the subsidiary banks unless such borrowings are secured by specific obligations. Additionally, the maximum of any such borrowing is limited to 10% of an affiliate
’
s capital and surplus.
Arrow and its subsidiary banks are subject to various regulatory capital requirements administered by the federal banking agencies. Failure to meet minimum capital requirements can initiate certain mandatory--and possibly additional discretionary--actions by regulators that, if undertaken, could have a direct material effect on an institution
’
s financial statements. Under capital adequacy guidelines and the regulatory framework for prompt corrective action, Arrow and its subsidiary banks must meet specific capital guidelines that involve quantitative measures of assets, liabilities, and certain off-balance sheet items as calculated under regulatory accounting practices. Capital amounts and classification are also subject to qualitative judgments by the regulators about components, risk weightings, and other factors.
Quantitative measures established by regulation to ensure capital adequacy require Arrow and its subsidiary banks to maintain minimum capital amounts and ratios (set forth in the table below) of total and Tier I capital (as defined in the regulations) to risk-weighted assets (as defined), and of Tier I capital (as defined) to average assets (as defined). Management believes, as of
December 31, 2011
and
2010
, that Arrow and both subsidiary banks meet all capital adequacy requirements to which they are subject.
#
79
As of
December 31, 2011
, Arrow and both subsidiary banks qualified as well-capitalized under the regulatory framework for prompt corrective action. To be categorized as
“
well-capitalized,
”
Arrow and its subsidiary banks must maintain minimum total risk-based, Tier I risk-based, and Tier I leverage ratios as set forth in the table below. There are no conditions or events that management believes have changed Arrow
’
s or its subsidiary banks
’
categories.
Arrow
’
s and its subsidiary banks
’
, Glens Falls National Bank and Trust Company (
“
Glens Falls National
”
) and Saratoga National Bank and Trust Company (
“
Saratoga National
”
), actual capital amounts and ratios are presented in the table below as of
December 31, 2011
and
2010
:
|
Actual
|
Minimum Amounts For Capital Adequacy Purposes
|
Minimum Amounts To Be Well-Capitalized
|
||||||||||||||||||
|
Amount
|
Ratio
|
Amount
|
Ratio
|
Amount
|
Ratio
|
|||||||||||||||
|
As of December 31, 2011:
|
||||||||||||||||||||
|
Total Capital
(to Risk Weighted Assets):
|
||||||||||||||||||||
|
Arrow
|
$
|
187,681
|
|
16.0
|
%
|
$
|
93,841
|
|
8.0
|
%
|
$
|
117,301
|
|
10.0
|
%
|
|||||
|
Glens Falls National
|
155,209
|
|
15.9
|
%
|
78,093
|
|
8.0
|
%
|
97,616
|
|
10.0
|
%
|
||||||||
|
Saratoga National
|
29,853
|
|
15.0
|
%
|
15,922
|
|
8.0
|
%
|
19,902
|
|
10.0
|
%
|
||||||||
|
Tier I Capital
(to Risk Weighted Assets):
|
||||||||||||||||||||
|
Arrow
|
172,956
|
|
14.7
|
%
|
47,063
|
|
4.0
|
%
|
70,594
|
|
6.0
|
%
|
||||||||
|
Glens Falls National
|
142,998
|
|
14.6
|
%
|
39,178
|
|
4.0
|
%
|
58,766
|
|
6.0
|
%
|
||||||||
|
Saratoga National
|
27,365
|
|
13.8
|
%
|
7,932
|
|
4.0
|
%
|
11,898
|
|
6.0
|
%
|
||||||||
|
Tier I Capital
(to Average Assets):
|
||||||||||||||||||||
|
Arrow
|
172,956
|
|
9.0
|
%
|
76,869
|
|
4.0
|
%
|
76,869
|
|
4.0
|
%
|
||||||||
|
Glens Falls National
|
142,998
|
|
8.6
|
%
|
66,511
|
|
4.0
|
%
|
83,138
|
|
5.0
|
%
|
||||||||
|
Saratoga National
|
27,365
|
|
9.3
|
%
|
11,770
|
|
4.0
|
%
|
14,712
|
|
5.0
|
%
|
||||||||
|
Actual
|
Minimum Amounts For Capital
Adequacy Purposes
|
Minimum Amounts To Be Well-Capitalized
|
||||||||||||||||||
|
Amount
|
Ratio
|
Amount
|
Ratio
|
Amount
|
Ratio
|
|||||||||||||||
|
As of December 31, 2010:
|
||||||||||||||||||||
|
Total Capital
(to Risk Weighted Assets):
|
||||||||||||||||||||
|
Arrow
|
$
|
180,322
|
|
15.7
|
%
|
$
|
91,884
|
|
8.0
|
%
|
$
|
114,855
|
|
10.0
|
%
|
|||||
|
Glens Falls National
|
150,959
|
|
15.5
|
|
77,914
|
|
8.0
|
|
97,393
|
|
10.0
|
|
||||||||
|
Saratoga National
|
28,369
|
|
15.5
|
|
14,642
|
|
8.0
|
|
18,303
|
|
10.0
|
|
||||||||
|
Tier I Capital
(to Risk Weighted Assets):
|
||||||||||||||||||||
|
Arrow
|
165,944
|
|
14.4
|
|
46,096
|
|
4.0
|
|
69,143
|
|
6.0
|
|
||||||||
|
Glens Falls National
|
138,936
|
|
14.3
|
|
38,863
|
|
4.0
|
|
58,295
|
|
6.0
|
|
||||||||
|
Saratoga National
|
26,078
|
|
14.3
|
|
7,295
|
|
4.0
|
|
10,942
|
|
6.0
|
|
||||||||
|
Tier I Capital
(to Average Assets):
|
||||||||||||||||||||
|
Arrow
|
165,944
|
|
8.5
|
|
78,091
|
|
4.0
|
|
78,091
|
|
4.0
|
|
||||||||
|
Glens Falls National
|
138,944
|
|
8.3
|
|
66,957
|
|
4.0
|
|
83,696
|
|
5.0
|
|
||||||||
|
Saratoga National
|
26,078
|
|
8.9
|
|
11,720
|
|
4.0
|
|
14,651
|
|
5.0
|
|
||||||||
#
80
|
Note 14:
|
RETIREMENT PLANS (Dollars in Thousands)
|
Arrow sponsors qualified and nonqualified defined benefit pension plans and other postretirement benefit plans for its employees. Arrow maintains a non-contributory pension plan, which covers substantially all employees. Effective December 1, 2002, all active participants in the qualified defined benefit pension plan were given a one-time irrevocable election to continue participating in the traditional plan design, for which benefits were based on years of service and the participant
’
s final compensation (as defined), or to begin participating in the new cash balance plan design. All employees who participate in the plan after December 1, 2002 automatically participate in the cash balance plan design. The interest credits under the cash balance plan are based on the 30-year U.S. Treasury rate in effect for November of the prior year. The service credits under the cash balance plan are equal to 6.0% of eligible salaries for employees who become participants on or after January 1, 2003. For employees in the plan prior to January 1, 2003, the service credits are scaled based on the age of the participant, and range from 6.0% to 12.0%. The funding policy is to contribute up to the maximum amount that can be deducted for federal income tax purposes and to make all payments required under ERISA. Arrow also maintains a supplemental non-qualified unfunded retirement plan to provide eligible employees of Arrow and its subsidiaries with benefits in excess of qualified plan limits imposed by federal tax law.
Arrow has multiple non-pension postretirement benefit plans. The health care, dental and life insurance plans are contributory, with participants
’
contributions adjusted annually. Arrow
’
s policy is to fund the cost of postretirement benefits based on the current cost of the underlying policies. However, the health care plan provision for automatic increases of Company contributions each year is based on the increase in inflation and is limited to a maximum of 5%.
The following tables set forth changes in the plans
’
benefit obligations (projected benefit obligation for pension benefits and accumulated benefit obligation for postretirement benefits) and changes in the plans
’
assets and the funded status of the pension plans and other postretirement benefit plan at December 31:
|
Pension Plans:
|
2011
|
2010
|
|||||||||||||||||||||
|
Employees' Pension Plan
|
Select
Executive
Retirement
Plan
|
Total
Pension
Plan
|
Employees' Pension Plan
|
Select
Executive
Retirement
Plan
|
Total
Pension
Plan
|
||||||||||||||||||
|
Change in Benefit Obligation
:
|
|||||||||||||||||||||||
|
Benefit Obligation at
January 1
|
$
|
32,337
|
|
$
|
4,319
|
|
$
|
36,656
|
|
$
|
28,687
|
|
$
|
4,003
|
|
$
|
32,690
|
|
|||||
|
Service Cost
|
1,353
|
|
81
|
|
1,434
|
|
1,185
|
|
56
|
|
1,241
|
|
|||||||||||
|
Interest Cost
|
1,598
|
|
222
|
|
1,820
|
|
1,667
|
|
235
|
|
1,902
|
|
|||||||||||
|
Amendments
|
191
|
|
75
|
|
266
|
|
—
|
|
—
|
|
—
|
|
|||||||||||
|
Actuarial Loss
|
1,616
|
|
151
|
|
1,767
|
|
2,458
|
|
338
|
|
2,796
|
|
|||||||||||
|
Benefits Paid
|
(2,048
|
)
|
(319
|
)
|
(2,367
|
)
|
(1,660
|
)
|
(313
|
)
|
(1,973
|
)
|
|||||||||||
|
Benefit Obligation at
December 31
1
|
35,047
|
|
4,529
|
|
39,576
|
|
32,337
|
|
4,319
|
|
36,656
|
|
|||||||||||
|
Change in Plan Assets
:
|
|||||||||||||||||||||||
|
Fair Value of Plan Assets at
January 1
|
37,319
|
|
—
|
|
37,319
|
|
33,585
|
|
—
|
|
33,585
|
|
|||||||||||
|
Actual Return on Plan Assets
|
(1,065
|
)
|
—
|
|
(1,065
|
)
|
3,893
|
|
—
|
|
3,893
|
|
|||||||||||
|
Employer Contributions
|
5,000
|
|
319
|
|
5,319
|
|
1,500
|
|
313
|
|
1,813
|
|
|||||||||||
|
Benefits Paid
|
(2,048
|
)
|
(319
|
)
|
(2,367
|
)
|
(1,660
|
)
|
(313
|
)
|
(1,973
|
)
|
|||||||||||
|
Fair Value of Plan Assets at
December 31
|
39,206
|
|
—
|
|
39,206
|
|
37,318
|
|
—
|
|
37,318
|
|
|||||||||||
|
Funded Status
|
$
|
4,159
|
|
$
|
(4,529
|
)
|
$
|
(370
|
)
|
$
|
4,981
|
|
$
|
(4,319
|
)
|
$
|
662
|
|
|||||
|
Supplemental Information:
|
|||||||||||||||||||||||
|
Accumulated Benefit Obligation
2
|
$
|
34,410
|
|
$
|
4,529
|
|
$
|
38,939
|
|
$
|
31,533
|
|
$
|
4,319
|
|
$
|
35,852
|
|
|||||
#
81
|
Postretirement Benefits:
|
2011
|
|
2010
|
|
|||
|
Change in Benefit Obligation
:
|
|||||||
|
Benefit Obligation at January 1
|
$
|
7,873
|
|
$
|
7,442
|
|
|
|
Service Cost
|
174
|
|
163
|
|
|||
|
Interest Cost
|
373
|
|
421
|
|
|||
|
Plan Participants
’
Contributions
|
382
|
|
330
|
|
|||
|
Amendments
|
—
|
|
(241
|
)
|
|||
|
Actuarial (Gain) Loss
|
503
|
|
454
|
|
|||
|
Medicare Part D Prescription Drug Federal Subsidy
|
—
|
|
6
|
|
|||
|
Benefits Paid
|
(749
|
)
|
(702
|
)
|
|||
|
Benefit Obligation at December 31
1
|
8,556
|
|
7,873
|
|
|||
|
Change in Plan Assets
:
|
|||||||
|
Employer Contributions
|
367
|
|
366
|
|
|||
|
Plan Participants
’
Contributions
|
382
|
|
330
|
|
|||
|
Medicare Part D Prescription Drug Federal Subsidy
|
—
|
|
6
|
|
|||
|
Benefits Paid
|
(749
|
)
|
(702
|
)
|
|||
|
Fair Value of Plan Assets at December 31
|
—
|
|
—
|
|
|||
|
Funded Status
|
$
|
(8,556
|
)
|
$
|
(7,873
|
)
|
|
1
Represents the projected benefit obligation for pension benefits and the accumulated benefit obligation for postretirement benefits.
2
The actuarial present value of benefits, vested and non-vested, earned by employees based on current and past compensation levels
The following tables summarize the funded status of the pension and postretirement plans, reconciled to the amounts recognized in the consolidated balance sheets as of
December 31, 2011
and
2010
:
|
Pension Plans:
|
2011
|
2010
|
|||||||||||||||||||||
|
Employee
’
s Pension Plan
|
Select
Executive
Retirement
Plan
|
Total
Pension
Plan
|
Employee
’
s Pension Plan
|
Select
Executive
Retirement
Plan
|
Total
Pension
Plan
|
||||||||||||||||||
|
Prepaid Benefit Cost
|
$
|
4,159
|
|
$
|
—
|
|
$
|
4,159
|
|
$
|
4,981
|
|
$
|
—
|
|
$
|
4,981
|
|
|||||
|
Accrued Benefit Liability
|
—
|
|
(4,529
|
)
|
(4,529
|
)
|
—
|
|
(4,319
|
)
|
(4,319
|
)
|
|||||||||||
|
Net Benefit Cost Recognized
|
$
|
4,159
|
|
$
|
(4,529
|
)
|
$
|
(370
|
)
|
$
|
4,981
|
|
$
|
(4,319
|
)
|
$
|
662
|
|
|||||
|
Postretirement Benefits:
|
2011
|
|
2010
|
|
|||
|
Accrued Benefit Liability
|
$
|
(8,556
|
)
|
$
|
(7,873
|
)
|
|
|
Net Benefit Cost Recognized
|
$
|
(8,556
|
)
|
$
|
(7,873
|
)
|
|
The components of accumulated other comprehensive income related to pension plans and other postretirement benefits, on a pre-tax basis, at December 31 are summarized below.
|
Pension Plans:
|
2011
|
2010
|
|||||||||||||||||||||
|
Change in Benefit Obligation
:
|
Employee’s Pension
Plan
|
Select
Executive
Retirement
Plan
|
Total
Pension
Plan
|
Employee’s Pension
Plan
|
Select
Executive
Retirement
Plan
|
Total
Pension
Plan
|
|||||||||||||||||
|
Net Actuarial Loss
|
$
|
18,127
|
|
$
|
2,083
|
|
$
|
20,210
|
|
$
|
13,431
|
|
$
|
2,079
|
|
$
|
15,510
|
|
|||||
|
Prior Service (Credit) Cost
|
(177
|
)
|
369
|
|
192
|
|
(330
|
)
|
262
|
|
(68
|
)
|
|||||||||||
|
Total Pre-tax Amounts Recognized in
Accumulated Other Comprehensive
Loss
|
$
|
17,950
|
|
$
|
2,452
|
|
$
|
20,402
|
|
$
|
13,101
|
|
$
|
2,341
|
|
$
|
15,442
|
|
|||||
|
Amount expected to be recognized as
components of net periodic benefit
cost in 2012:
|
|||||||||||||||||||||||
|
Net Actuarial Loss
|
$
|
1,241
|
|
$
|
139
|
|
|||||||||||||||||
|
Prior Service Cost
|
41
|
|
43
|
|
|||||||||||||||||||
#
82
|
Postretirement Benefits:
|
2011
|
|
2010
|
|
|||
|
Net Actuarial Loss
|
$
|
2,493
|
|
$
|
2,060
|
|
|
|
Prior Service Credit
|
(533
|
)
|
(647
|
)
|
|||
|
Total Pre-tax Amounts Recognized in
Accumulated Other Comprehensive Loss
|
$
|
1,960
|
|
$
|
1,413
|
|
|
|
Amount expected to be recognized as components of net periodic benefit cost in 2012:
|
|||||||
|
Net Actuarial Loss
|
$
|
133
|
|
||||
|
Prior Service Credit
|
(114
|
)
|
|||||
The following table provides the components of net periodic benefit costs for the plans for the years ended December 31:
|
Pension Plans:
|
2011
|
2010
|
2009
|
||||||||||||||||||||||||||||||||
|
Employee
’
s
Pension
Plan
|
Select
Executive
Retirement
Plan
|
Total
Pension
Plan
|
Employee
’
s Pension Plan
|
Select
Executive
Retirement
Plan
|
Total
Pension
Plan
|
Employee
’
s Pension Plan
|
Select
Executive
Retirement
Plan
|
Total
Pension
Plan
|
|||||||||||||||||||||||||||
|
Net Periodic Benefit Cost
|
|||||||||||||||||||||||||||||||||||
|
Service Cost
|
$
|
1,353
|
|
$
|
81
|
|
$
|
1,434
|
|
$
|
1,185
|
|
$
|
56
|
|
$
|
1,241
|
|
$
|
1,042
|
|
$
|
55
|
|
$
|
1,097
|
|
||||||||
|
Interest Cost
|
1,598
|
|
222
|
|
1,820
|
|
1,667
|
|
235
|
|
1,902
|
|
1,532
|
|
218
|
|
1,750
|
|
|||||||||||||||||
|
Expected Return on Plan Assets
|
(2,793
|
)
|
—
|
|
(2,793
|
)
|
(2,454
|
)
|
—
|
|
(2,454
|
)
|
(2,072
|
)
|
—
|
|
(2,072
|
)
|
|||||||||||||||||
|
Amortization of Prior Service (Credit) Cost
|
38
|
|
(32
|
)
|
6
|
|
25
|
|
(105
|
)
|
(80
|
)
|
25
|
|
(108
|
)
|
(83
|
)
|
|||||||||||||||||
|
Amortization of Net Loss
|
778
|
|
147
|
|
925
|
|
899
|
|
128
|
|
1,027
|
|
1,195
|
|
112
|
|
1,307
|
|
|||||||||||||||||
|
Net Periodic Benefit Cost
|
974
|
|
418
|
|
1,392
|
|
1,322
|
|
314
|
|
1,636
|
|
1,722
|
|
277
|
|
1,999
|
|
|||||||||||||||||
|
Other Changes in Plan Assets and Benefit Obligations Recognized in Other Comprehensive Loss:
|
|||||||||||||||||||||||||||||||||||
|
Net Loss (Gain)
|
5,474
|
|
151
|
|
5,625
|
|
1,018
|
|
339
|
|
1,357
|
|
(2,425
|
)
|
318
|
|
(2,107
|
)
|
|||||||||||||||||
|
Prior Service Cost
|
191
|
|
75
|
|
266
|
|
—
|
|
—
|
|
—
|
|
—
|
|
70
|
|
70
|
|
|||||||||||||||||
|
Amortization of Net Loss
|
(778
|
)
|
(147
|
)
|
(925
|
)
|
(899
|
)
|
(128
|
)
|
(1,027
|
)
|
(1,195
|
)
|
(112
|
)
|
(1,307
|
)
|
|||||||||||||||||
|
Amortization of Prior Service (Cost) Credit
|
(38
|
)
|
32
|
|
(6
|
)
|
(25
|
)
|
105
|
|
80
|
|
(25
|
)
|
108
|
|
83
|
|
|||||||||||||||||
|
Total Recognized
in Other
Comprehensive
Loss (Income)
|
4,849
|
|
111
|
|
4,960
|
|
94
|
|
316
|
|
410
|
|
(3,645
|
)
|
384
|
|
(3,261
|
)
|
|||||||||||||||||
|
Total Recognized
in Net Periodic
Cost (Benefit)
and Other
Comprehensive
Loss (Income)
|
$
|
5,823
|
|
$
|
529
|
|
$
|
6,352
|
|
$
|
1,416
|
|
$
|
630
|
|
$
|
2,046
|
|
$
|
(1,923
|
)
|
$
|
661
|
|
$
|
(1,262
|
)
|
||||||||
#
83
|
Postretirement Benefits:
|
|||||||||||
|
Net Periodic Benefit Cost
|
2011
|
|
2010
|
|
2009
|
|
|||||
|
Service Cost
|
$
|
173
|
|
$
|
163
|
|
$
|
147
|
|
||
|
Interest Cost
|
372
|
|
421
|
|
415
|
|
|||||
|
Accretion of Prior Service Credit
|
(114
|
)
|
(105
|
)
|
(96
|
)
|
|||||
|
Amortization of Net Loss
|
71
|
|
85
|
|
62
|
|
|||||
|
Net Periodic Benefit Cost
|
502
|
|
564
|
|
528
|
|
|||||
|
Other Changes in Plan Assets and Benefit
Obligations Recognized in Other Comprehensive Loss (Income)
|
|||||||||||
|
Net Loss (Gain)
|
504
|
|
454
|
|
(345
|
)
|
|||||
|
Prior Service Cost (Credit)
|
—
|
|
(242
|
)
|
185
|
|
|||||
|
Amortization of Net Loss
|
(71
|
)
|
(85
|
)
|
(62
|
)
|
|||||
|
Accretion of Prior Service Credit
|
114
|
|
106
|
|
96
|
|
|||||
|
Total Recognized in Other Comprehensive Loss (Income)
|
547
|
|
233
|
|
(126
|
)
|
|||||
|
Total Recognized in Net Periodic Benefit Cost and
Other Comprehensive Loss (Income)
|
$
|
1,049
|
|
$
|
797
|
|
$
|
402
|
|
||
The prior service costs or credits are amortized on a straight-line basis over the average remaining service period of active participants. Gains and losses in excess of 10% of the greater of the benefit obligation or the fair value of assets are amortized over the average remaining service period of active participants.
|
Additional Information:
|
Employee Pension Plan and Select Executive Retirement Plan
|
Postretirement Benefits
|
|||||||||||||||
|
2011
|
|
2010
|
|
2009
|
|
2011
|
|
2010
|
|
2009
|
|
||||||
|
Weighted-Average Assumptions Used
To Determine Benefit Obligation at
December 31:
|
|||||||||||||||||
|
Discount Rate
|
4.05
|
%
|
5.15
|
%
|
5.80
|
%
|
4.05
|
%
|
5.15
|
%
|
5.80
|
%
|
|||||
|
Rate of Compensation Increase
|
3.50
|
%
|
3.50
|
%
|
3.50
|
%
|
3.50
|
%
|
3.50
|
%
|
3.50
|
%
|
|||||
|
Interest Rate Credit for Determining
Projected Cash Balance Account
|
3.25
|
%
|
4.25
|
%
|
4.50
|
%
|
—
|
|
—
|
|
—
|
|
|||||
|
Interest Rate to Annuitize Cash
Balance Account
|
5.00
|
%
|
5.50
|
%
|
6.00
|
%
|
—
|
|
—
|
|
—
|
|
|||||
|
Interest Rate to Convert Annuities
To Actuarially Equivalent Lump
Sum Amounts
|
5.00
|
%
|
5.50
|
%
|
6.00
|
%
|
—
|
|
—
|
|
—
|
|
|||||
|
Employee Pension Plan and Select Executive Retirement Plan
|
Postretirement Benefits
|
||||||||||||||||
|
2011
|
|
2010
|
|
2009
|
|
2011
|
|
2010
|
|
2009
|
|
||||||
|
Weighted-Average Assumptions Used
To Determine Net Periodic Benefit
Cost for Years Ended December 31:
|
|||||||||||||||||
|
Discount Rate
|
5.15
|
%
|
5.80
|
%
|
6.15
|
%
|
5.15
|
%
|
5.80
|
%
|
6.15
|
%
|
|||||
|
Expected Long-Term Return on
Plan Assets
|
7.50
|
%
|
7.50
|
%
|
7.50
|
%
|
—
|
|
—
|
|
—
|
|
|||||
|
Rate of Compensation Increase
|
3.50
|
%
|
3.50
|
%
|
3.50
|
%
|
3.50
|
%
|
3.50
|
%
|
3.50
|
%
|
|||||
|
Interest Rate Credit for Determining
Projected Cash Balance Account
|
4.25
|
%
|
4.50
|
%
|
4.50
|
%
|
—
|
|
—
|
|
—
|
|
|||||
|
Interest Rate to Annuitize Cash
Balance Account
|
5.50
|
%
|
6.00
|
%
|
6.00
|
%
|
—
|
|
—
|
|
—
|
|
|||||
|
Interest Rate to Convert Annuities
To Actuarially Equivalent Lump
Sum Amounts
|
5.50
|
%
|
6.00
|
%
|
6.00
|
%
|
—
|
|
—
|
|
—
|
|
|||||
#
84
The discount rate assumption is based on the Citigroup Pension Discount Curve as adjusted to provide the necessary cash flows for the payment of benefits when due.
The following table presents management
’
s estimated benefit payments for the next ten years:
|
Employee
|
Select Executive
|
Postretirement
|
|||||||||
|
Payment Period
|
Pension Plan
|
Retirement Plan
|
Plan
|
||||||||
|
2012
|
$
|
2,017
|
|
$
|
321
|
|
$
|
483
|
|
||
|
2013
|
1,955
|
|
404
|
|
495
|
|
|||||
|
2014
|
2,268
|
|
394
|
|
524
|
|
|||||
|
2015
|
2,284
|
|
384
|
|
534
|
|
|||||
|
2016
|
2,036
|
|
372
|
|
555
|
|
|||||
|
2017-2021
|
11,460
|
|
1,669
|
|
3,035
|
|
|||||
|
Assumed Health Care Cost Trend Rates at December 31,
|
||||||
|
2011
|
|
2010
|
|
|||
|
Health Care Cost Trend
Rate Assumed for Next Year
|
8.50
|
%
|
9.00
|
%
|
||
|
Rate to which the Cost Trend
Rate is Assumed to Decline
(the Ultimate Trend Rate)
|
5.00
|
%
|
5.00
|
%
|
||
|
Year that the Rate Reaches
the Ultimate Trend Rate
|
2019
|
|
2017
|
|
||
Assumed health care cost trend rates have a significant effect on the amounts reported for the health care plans. A one-percentage-point change in assumed health care cost trend rates would have the following effects:
|
1-Percentage-
Point Increase
|
1-Percentage-
Point Decrease
|
||||||
|
Effect on Total Service and Interest Cost Components of Net Periodic
Postretirement Benefit Cost For the Year Ended December 31, 2011
|
$
|
62
|
|
$
|
(51
|
)
|
|
|
Effect on the Accumulated Postretirement Benefit Obligation as of
December 31, 2011
|
686
|
|
(580
|
)
|
|||
Fair Value of Plan Assets (Defined Benefit Plan):
For information on fair value measurements, including descriptions of level 1, 2 and 3 of the fair value hierarchy and the valuation methods employed by Arrow, see Note 1 -
“
Summary of Significant Accounting Policies
”
and Note 21 -
“
Fair Value of Financial Instruments.
”
The fair value of level 1 financial instruments in the table below are based on unadjusted, quoted market prices from exchanges in active markets. The fair value of level 2 financial instruments are determined utilizing an independent pricing service for identical assets or significantly similar securities. The pricing service uses a variety of techniques to arrive at fair value including market maker bids, quotes and pricing models. Inputs to the pricing models include recent trades, benchmark interest rates, spreads, actual and projected cash flows relative credit information, and perceived market movements. There were no Level 3 assets at
December 31, 2011
or
2010
nor at any time during
2011
and
2010
.
#
85
Plan investment assets measured at fair value by level and in total at
December 31, 2011
and
2010
are summarized in the following table:
|
Fair Value Measurements Using:
|
|||||||||||||||||
|
Asset Category:
|
Quoted Prices
In Active
Markets for
Identical Assets
(Level 1)
|
Significant
Other
Observable
Inputs
(Level 2)
|
Significant
Unobservable
Inputs
(Level 3)
|
Total
|
Percent
of Total
|
||||||||||||
|
2011
|
|||||||||||||||||
|
Cash
|
$
|
7
|
|
—
|
|
—
|
|
$
|
7
|
|
—
|
%
|
|||||
|
Interest-Bearing
Money Market Fund
|
1,857
|
|
—
|
|
—
|
|
1,857
|
|
4.7
|
%
|
|||||||
|
Equity Securities
|
3,843
|
|
—
|
|
—
|
|
3,843
|
|
9.8
|
%
|
|||||||
|
Mutual Funds - Equity
|
28,167
|
|
—
|
|
—
|
|
28,167
|
|
71.9
|
%
|
|||||||
|
Mutual Funds
–
Fixed Income
|
5,332
|
|
—
|
|
—
|
|
5,332
|
|
13.6
|
%
|
|||||||
|
Total
|
$
|
39,206
|
|
$
|
—
|
|
—
|
|
$
|
39,206
|
|
100.0
|
%
|
||||
|
2010
|
|||||||||||||||||
|
Interest-Bearing
Money Market Fund
|
$
|
2,670
|
|
—
|
|
—
|
|
$
|
2,670
|
|
7.2
|
%
|
|||||
|
Mortgage-Backed Securities
|
—
|
|
2
|
|
—
|
|
2
|
|
—
|
%
|
|||||||
|
Equity Securities
|
3,438
|
|
—
|
|
—
|
|
3,438
|
|
9.2
|
%
|
|||||||
|
Mutual Funds - Equity
|
24,590
|
|
—
|
|
—
|
|
24,590
|
|
65.9
|
%
|
|||||||
|
Mutual Funds
–
Fixed Income
|
6,618
|
|
—
|
|
—
|
|
6,618
|
|
17.7
|
%
|
|||||||
|
Total
|
$
|
37,316
|
|
2
|
|
—
|
|
$
|
37,318
|
|
100.0
|
%
|
|||||
|
Supplemental Information on Plan Assets
|
||||||
|
At December 31,
|
||||||
|
2011
|
2010
|
|||||
|
Balance of shares of mutual funds advised by Arrow's subsidiary,
North Country Investment Advisers, Inc., at market value
|
$
|
17,411
|
|
$
|
17,995
|
|
|
Market value of Arrow common stock held by the plan
|
3,843
|
|
3,438
|
|
||
In accordance with ERISA guidelines, the Board authorized the purchase of Arrow common stock up to 10% of the fair market value of the plan's assets at the time of acquisition.
Pension Plan Investment Policies and Strategies
:
The Company maintains a non-contributory pension benefit plan covering substantially all employees for the purpose of rewarding long and loyal service to the Company. The pension assets are held in trust and are invested in a prudent manner for the exclusive purpose of providing benefits to participants. The investment objective is to achieve an inflation-protected rate of return that meets the actuarial assumption which is used for funding purposes. The investment strategy attempts to maximize the investment return on assets at a level of risk deemed appropriate by the Company while complying with ERISA and any applicable regulations and laws. The investment strategy utilizes asset allocation as a principal determinant for establishing the risk/reward profile of the assets. Asset allocation ranges are established, periodically reviewed, and adjusted as funding levels, and participant benefit characteristics change. Active and passive investment management is employed to help enhance the risk/return profile of the assets.
The Plan
’
s assets are invested in a diversified portfolio of equity securities comprised of companies with small, mid, and large capitalizations. Both domestic and international equities are allowed to provide further diversification and opportunity for return in potentially higher growth economies with lower correlation of returns. Growth and value styles of investment are employed to increase the diversification and offer varying opportunities for appreciation. The fixed income portion of the plan may be invested in U.S. dollar denominated debt securities that shall be rated within the top four ratings categories by nationally recognized ratings agencies. The fixed income portion will be invested without regard to industry or sector based on analysis of each target security
’
s structural and repayment features, current pricing and trading opportunities as well as credit quality of the issuer. Individual bonds with ratings that fall below the Plan
’
s rating requirements will be sold only when it is in the best interests of the Plan. Hybrid investments, such as convertible bonds, may be used to provide growth characteristics while offering some protection to declining equity markets by having a fixed income component. Alternative investments such as Treasury Inflation Protected Securities, commodities, and REITs may be used to further enhance diversification while offering opportunities for return. In accordance with
#
86
ERISA guidelines, common stock of the Company may be purchased up to 10% of the fair market value of the Plan
’
s assets at the time of acquisition. Derivative investments are prohibited in the plan.
The return on assets assumption was developed through review of historical market returns, historical asset class volatility and correlations, current market conditions, the Plan
’
s past experience, and expectations on potential future market returns. The assumption represents a long-term average view of the performance of the assets in the Plan, a return that may or may not be achieved during any one calendar year. The assumption is based on the return of the Plan using the historical fifteen year return adjusted for the potential for lower than historical returns due to low interest rates, and an expected modest recovery in global economic growth as a result of the deep recession.
The range of plan asset allocations as of
December 31, 2011
by asset category is as follows: Equity securities 65-85%; Fixed Income securities 10-30%; and Money market 0-5%.
Cash Flows - We were not required to make any contribution to our qualified pension plan in
2011
. We contributed $5.0 million to the plan in
2011
and, although not required, expect to contribute in the range of $1 to $3 million during
2012
. The expected
2012
contribution for the nonqualified plan is $321. Arrow makes contributions for its postretirement benefits in an amount equal to actual expenses for the year. The expected contribution is estimated to be $483 for
2012
.
|
Note 15:
|
OTHER EMPLOYEE BENEFIT PLANS (In Thousands)
|
Arrow maintains an employee stock ownership plan (
“
ESOP
”
). Substantially all employees of Arrow and its subsidiaries are eligible to participate upon satisfaction of applicable service requirements. The ESOP borrowed funds from one of Arrow
’
s subsidiary banks to purchase outstanding shares of Arrow
’
s common stock. The notes require annual payments of principal and interest through 2018.
|
2011
|
2010
|
2009
|
|||||||
|
Amount Borrowed by the Company's ESOP during the year
|
$
|
—
|
|
$
|
1,000
|
|
$
|
—
|
|
|
ESOP Expense
|
550
|
|
500
|
|
500
|
|
|||
As the debt is repaid, shares are released from collateral based on the proportion of debt paid to total debt outstanding for the year and allocated to active employees.
Shares pledged as collateral are reported as unallocated ESOP shares in stockholders
’
equity. As shares are released from collateral, Arrow reports compensation expense equal to the current average market price of the shares, and the shares become outstanding for earnings per share computations. The ESOP shares as of
December 31, 2011
were as follows:
|
Allocated Shares
|
715
|
|
|
|
Shares Released for Allocation During 2011
|
18
|
|
|
|
Unallocated Shares
|
118
|
|
|
|
Total ESOP Shares
|
851
|
|
|
|
Market Value of Unallocated Shares
|
$
|
2,987
|
|
Under the employee stock purchase plan (
“
ESPP
”
), employees may purchase shares of Arrow
’
s common stock, up to $24 annually, of which $12 annually can be purchased at a discount to the prevailing market price (currently a 5% discount). Under the ESPP, shares are issued by Arrow without a charge to earnings. Substantially all employees of Arrow and its subsidiaries are eligible to participate upon satisfaction of applicable service requirements. Arrow also sponsors a Long-Term Incentive Award Plan and a Short-Term Incentive Award Plan for senior management and a Profit Sharing Plan for substantially all employees.
|
2011
|
2010
|
2009
|
|||||||
|
Other Employee Benefit Plan Expense
|
$
|
1,244
|
|
$
|
1,087
|
|
$
|
999
|
|
|
Note 16:
|
STOCK OPTION PLANS
|
Arrow has established fixed Incentive Stock Option and Non-qualified Stock Option Plans. At
December 31, 2011
, approximately 112,229 shares remained available for grant under these plans. Options may be granted at a price no less than the greater of the par value or fair market value of such shares on the date on which such option is granted, and generally expire ten years from the date of grant. The options usually vest over a four-year period.
#
87
The following table presents information on the amounts expensed and remaining amounts to be expense for the years ended
December 31, 2011
,
2010
and
2009
:
|
2011
|
|
2010
|
|
2009
|
|
||||
|
Amount Expensed During the Year
|
354
|
|
299
|
|
189
|
|
|||
|
Compensation Costs for Non-vested Awards Not Yet Recognized
|
705
|
|
579
|
|
345
|
|
|||
|
Weighted Average Expected Vesting Period, In Years
|
1.8
|
|
1.8
|
|
1.9
|
|
|||
Grants were issued during
2011
,
2010
and 2009. During 2009, grants were made on two separate dates. The following table presents information on the grants (restated for the 3% September
2011
stock dividend):
|
Grants issued:
|
2011
|
2010
|
2009
|
2009
|
||||
|
Shares Granted
|
76,887
|
75,536
|
1,093
|
75,605
|
||||
|
Fair Value of Options Granted
|
$6.24
|
$6.24
|
$6.59
|
$4.22
|
||||
|
Assumptions:
|
||||||||
|
Dividend Yield
|
4.00%
|
3.80%
|
3.60%
|
4.70%
|
||||
|
Expected Volatility
|
36.5%
|
35.4%
|
33.2%
|
33.2%
|
||||
|
Risk Free Interest Rate
|
2.54%
|
3.14%
|
3.20%
|
2.10%
|
||||
|
Expected Lives (in years)
|
6.40
|
7.79
|
7.78
|
7.78
|
||||
A summary of the status of Arrow
’
s stock option plans as of
December 31, 2011
and changes during the year then ended is presented below.
|
Options:
|
Shares
|
Weighted
Average
Exercise
Price
|
Weighted
Average
Remaining
Contractual
Life (in years)
|
Aggregate
Intrinsic
Value
|
|||||||||
|
Outstanding at January 1, 2011
|
480,953
|
|
$
|
22.09
|
|
||||||||
|
Granted
|
76,891
|
|
24.73
|
|
|||||||||
|
Exercised
|
(74,034
|
)
|
19.08
|
|
|||||||||
|
Forfeited
|
(10,375
|
)
|
26.06
|
|
|||||||||
|
Outstanding at December 31, 2011
|
473,435
|
|
22.90
|
|
5.5
|
|
$
|
254
|
|
||||
|
Exercisable at December 31, 2011
|
302,812
|
|
22.66
|
|
3.9
|
|
236
|
|
|||||
|
Expected to Vest
|
170,623
|
|
23.34
|
|
8.3
|
|
18
|
|
|||||
Cash proceeds, tax benefits and intrinsic value related to total stock options exercised were as follows:
|
Years Ended
December 31,
|
|||||||||||
|
2011
|
|
2010
|
|
2009
|
|
||||||
|
Proceeds From Stock Options Exercised
|
$
|
1,413
|
|
$
|
798
|
|
$
|
1,178
|
|
||
|
Tax Benefits Related to Stock Options Exercised
|
51
|
|
105
|
|
193
|
|
|||||
|
Intrinsic Value of Stock Options Exercised
|
1,740
|
|
1,404
|
|
1,922
|
|
|||||
The following table summarizes information about Arrow
’
s stock options at
December 31, 2011
:
|
Options Outstanding
|
Options Exercisable
|
||||||||||||||||
|
Range of
Exercise
Prices
|
Number
Outstanding
At 12/31/11
|
|
Weighted-
Average
Remaining
Contractual
Life (Years)
|
|
Weighted-
Average
Exercise
Price
|
|
Number
Exercisable
at 12/31/11
|
|
Weighted-
Average
Exercise
Price
|
|
|||||||
|
$19.86-20.67
|
118,687
|
|
6.6
|
|
$
|
20.36
|
|
81,147
|
|
$
|
20.21
|
|
|||||
|
$22.06-22.63
|
144,588
|
|
2.4
|
|
22.27
|
|
144,588
|
|
22.27
|
|
|||||||
|
$23.17
|
74,881
|
|
8.1
|
|
23.17
|
|
18,689
|
|
23.17
|
|
|||||||
|
$24.73
|
76,891
|
|
9.1
|
|
24.73
|
|
—
|
|
—
|
|
|||||||
|
$26.82
|
58,388
|
|
3.0
|
|
26.82
|
|
58,388
|
|
26.82
|
|
|||||||
|
473,435
|
|
5.5
|
|
22.90
|
|
302,812
|
|
22.66
|
|
||||||||
#
88
|
Note 17:
|
OTHER OPERATING EXPENSE (In Thousands)
|
Other operating expenses included in the consolidated statements of income are as follows:
|
2011
|
2010
|
2009
|
|||||||||
|
Legal and Other Professional Fees
|
$
|
1,972
|
|
$
|
2,102
|
|
$
|
1,936
|
|
||
|
Computer Services
|
1,654
|
|
1,372
|
|
1,224
|
|
|||||
|
Postage and Courier
|
1,088
|
|
1,218
|
|
1,331
|
|
|||||
|
Advertising and Promotion
|
853
|
|
1,024
|
|
1,030
|
|
|||||
|
Stationery and Printing
|
891
|
|
980
|
|
980
|
|
|||||
|
Telephone and Communications
|
981
|
|
896
|
|
796
|
|
|||||
|
Intangible Asset Amortization
|
510
|
|
271
|
|
324
|
|
|||||
|
Charitable Contributions
|
144
|
|
162
|
|
138
|
|
|||||
|
All Other
|
2,951
|
|
3,010
|
|
2,437
|
|
|||||
|
Total Other Operating Expense
|
$
|
11,044
|
|
$
|
11,035
|
|
$
|
10,196
|
|
||
|
Note 18:
|
INCOME TAXES (In Thousands)
|
The provision for income taxes is summarized below:
|
Current Tax Expense:
|
2011
|
|
2010
|
|
2009
|
|
|||||
|
Federal
|
$
|
6,726
|
|
$
|
8,369
|
|
$
|
8,178
|
|
||
|
State
|
816
|
|
1,231
|
|
907
|
|
|||||
|
Total Current Tax Expense
|
7,542
|
|
9,600
|
|
9,085
|
|
|||||
|
Deferred Tax Expense
|
|||||||||||
|
Federal
|
1,775
|
|
273
|
|
579
|
|
|||||
|
State
|
397
|
|
(119
|
)
|
126
|
|
|||||
|
Total Deferred Tax Expense
|
2,172
|
|
154
|
|
705
|
|
|||||
|
Total Provision for Income Taxes
|
$
|
9,714
|
|
$9,754
|
|
$
|
9,790
|
|
|||
The provisions for income taxes differed from the amounts computed by applying the U.S. Federal Income Tax Rate of 35% for
2011
,
2010
and
2009
to pre-tax income as a result of the following:
|
2011
|
|
2010
|
|
2009
|
|
||||||
|
Computed Tax Expense at Statutory Rate
|
$
|
11,076
|
|
$
|
11,076
|
|
$
|
11,054
|
|
||
|
Increase (Decrease) in Income Taxes Resulting From:
|
|||||||||||
|
Tax-Exempt Income
|
(2,199
|
)
|
(2,236
|
)
|
(2,117
|
)
|
|||||
|
Nondeductible Interest Expense
|
152
|
|
176
|
|
178
|
|
|||||
|
State Taxes, Net of Federal Income Tax Benefit
|
788
|
|
723
|
|
671
|
|
|||||
|
Other Items, Net
|
(103
|
)
|
15
|
|
4
|
|
|||||
|
Total Provision for Income Taxes
|
$
|
9,714
|
|
$
|
9,754
|
|
$
|
9,790
|
|
||
#
89
The tax effects of temporary differences that give rise to significant portions of the deferred tax assets and deferred tax liabilities at
December 31, 2011
and
2010
are presented below:
|
Deferred Tax Assets:
|
2011
|
|
2010
|
|
|||
|
Allowance for Loan Losses
|
$
|
5,957
|
|
$
|
5,827
|
|
|
|
Pension and Deferred Compensation Plans
|
3,965
|
|
3,842
|
|
|||
|
Pension Liability (Included in Accumulated Other Comprehensive Income)
|
8,859
|
|
6,677
|
|
|||
|
Other
|
669
|
|
608
|
|
|||
|
Total Gross Deferred Tax Assets
|
19,450
|
|
16,954
|
|
|||
|
Deferred Tax Liabilities:
|
|||||||
|
Pension Plans
|
8,758
|
|
7,163
|
|
|||
|
Depreciation
|
1,347
|
|
997
|
|
|||
|
Deferred Income
|
3,017
|
|
2,872
|
|
|||
|
Net Unrealized Gains on Securities Available-for-Sale included in
Accumulated Other Comprehensive Income
|
4,465
|
|
2,463
|
|
|||
|
Goodwill
|
5,036
|
|
3,623
|
|
|||
|
Total Gross Deferred Tax Liabilities
|
22,623
|
|
17,118
|
|
|||
|
Net Deferred Tax Liabilities
|
$
|
(3,173
|
)
|
$
|
(164
|
)
|
|
Arrow recorded deferred tax assets of $44 thousand and deferred tax liabilities of $1.061 million during 2011 from the acquisition of subsidiaries. Management believes that the realization of the recognized net deferred tax assets at
December 31, 2011
and
2010
is more likely than not, based on existing loss carryback ability, available tax planning strategies and expectations as to future taxable income. Accordingly, there was no valuation allowance for deferred tax assets as of
December 31, 2011
and
2010
.
Arrow had no unrecognized tax benefits at
December 31, 2011
and
2010
. Interest and penalties are recorded as a component of the provision for income taxes, if any. Tax years 2008 through
2011
are subject to Federal and New York State examination.
|
Note 19:
|
LEASE COMMITMENTS (In Thousands)
|
At
December 31, 2011
, Arrow was obligated under a number of noncancellable operating leases for buildings and equipment. Certain of these leases provide for escalation clauses and contain renewal options calling for increased rentals if the lease is renewed.
Future minimum lease payments on operating leases at
December 31, 2011
were as follows:
|
Operating
Leases
|
|
||
|
2012
|
$
|
537
|
|
|
2013
|
528
|
|
|
|
2014
|
529
|
|
|
|
2015
|
536
|
|
|
|
2016
|
397
|
|
|
|
Later Years
|
779
|
|
|
|
Total Minimum Lease Payments
|
$
|
3,306
|
|
Arrow leases four of its branch offices, at market rates, from Stewart
’
s Shops Corp. Gary Dake, President of Stewart
’
s Shops Corp., serves on both the boards of Arrow and Saratoga National Bank and Trust Company.
|
Note 20:
|
FINANCIAL INSTRUMENTS WITH OFF-BALANCE SHEET RISK AND CONTINGENT LIABILITIES
|
(In Thousands)
|
Balance at December 31,
|
2011
|
2010
|
||||
|
Commitments to Extend Credit
|
$
|
203,556
|
|
$
|
191,520
|
|
|
Standby Letters of Credit
|
11,641
|
|
8,312
|
|
||
Arrow is party to financial instruments with off-balance sheet risk in the normal course of business to meet the financing needs of its customers. These financial instruments include commitments to extend credit and standby letters of credit. Commitments to extend credit include home equity lines of credit, commitments for residential and commercial construction loans and other personal and commercial lines of credit. Those instruments involve, to varying degrees, elements of credit and interest rate risk in excess of the amount recognized in the consolidated balance sheets. The contract or notional amounts of those instruments reflect the extent of the involvement Arrow has in particular classes of financial instruments.
#
90
Arrow's exposure to credit loss in the event of nonperformance by the other party to the financial instrument for commitments to extend credit and standby letters of credit is represented by the contractual notional amount of those instruments. Arrow uses the same credit policies in making commitments and conditional obligations as it does for on-balance sheet instruments.
Commitments to extend credit are agreements to lend to a customer as long as there is no violation of any condition established in the contract. Commitments generally have fixed expiration dates or other termination clauses and may require payment of a fee. Since many of the commitments are expected to expire without being drawn upon, the total commitment amounts do not necessarily represent future cash requirements. Arrow evaluates each customer's creditworthiness on a case-by-case basis. Home equity lines of credit are secured by residential real estate. Construction lines of credit are secured by underlying real estate. For other lines of credit, the amount of collateral obtained, if deemed necessary by Arrow upon extension of credit, is based on management's credit evaluation of the counterparty. Collateral held varies, but may include accounts receivable, inventory, property, plant and equipment, and income-producing commercial properties. Most of the commitments are variable rate instruments.
Arrow does not issue any guarantees that would require liability-recognition or disclosure, other than its standby letters of credit.
Arrow has issued conditional commitments in the form of standby letters of credit to guarantee payment on behalf of a customer and guarantee the performance of a customer to a third party. Standby letters of credit generally arise in connection with lending relationships. The credit risk involved in issuing these instruments is essentially the same as that involved in extending loans to customers. Contingent obligations under standby letters of credit at
December 31, 2011
and
2010
represent the maximum potential future payments Arrow could be required to make. Typically, these instruments have terms of 12 months or less and expire unused; therefore, the total amounts do not necessarily represent future cash requirements. Each customer is evaluated individually for creditworthiness under the same underwriting standards used for commitments to extend credit and on-balance sheet instruments. Company policies governing loan collateral apply to standby letters of credit at the time of credit extension. Loan-to-value ratios will generally range from 50% for movable assets, such as inventory, to 100% for liquid assets, such as bank CD's. Fees for standby letters of credit range from 1% to 3% of the notional amount. Fees are collected upfront and amortized over the life of the commitment. The carrying amount and fair value of Arrow's standby letters of credit at
December 31, 2011
and
2010
were insignificant. The fair value of standby letters of credit is based on the fees currently charged for similar agreements or the cost to terminate the arrangement with the counterparties.
The fair value of commitments to extend credit is determined by estimating the fees to enter into similar agreements, taking into account the remaining terms and present creditworthiness of the counterparties, and for fixed rate loan commitments, the difference between the current and committed interest rates. Arrow provides several types of commercial lines of credit and standby letters of credit to its commercial customers. The pricing of these services is not isolated as Arrow considers the customer's complete deposit and borrowing relationship in pricing individual products and services. The commitments to extend credit also include commitments under home equity lines of credit, for which Arrow charges no fee. The carrying value and fair value of commitments to extend credit are not material and Arrow does not expect to incur any material loss as a result of these commitments.
In the normal course of business, Arrow and its subsidiary banks become involved in a variety of routine legal proceedings. At present, there are no legal proceedings pending or threatened, which in the opinion of management and counsel, would result in a material loss to Arrow.
|
Note 21:
|
FAIR VALUE OF FINANCIAL INSTRUMENTS (In Thousands)
|
FASB ASC Subtopic 820-10 defines fair value, establishes a framework for measuring fair value in generally accepted accounting principles (GAAP) and requires certain disclosures about fair value measurements. We do not have any nonfinancial assets or liabilities measured at fair value. The only assets or liabilities that Arrow measured at fair value on a recurring basis at
December 31, 2011
and
2010
were securities available-for-sale. Arrow held no securities or liabilities for trading on such date. For information on fair value measurements, including descriptions of level 1, 2 and 3 of the fair value hierarchy and the valuation methods employed by Arrow, see Note 1 -
“
Summary of Significant Accounting Policies.
”
The fair value measurement of securities available-for-sale on such date was as follows:
#
91
|
Fair Value Measurements at Reporting Date Using:
|
|||||||||||||||
|
Description
|
Total
|
Quoted Prices
In Active Markets for Identical Assets
(Level 1)
|
Significant Other
Observable Inputs
(Level 2)
|
Significant Unobservable Inputs
(Level 3)
|
|||||||||||
|
December 31, 2011
|
|||||||||||||||
|
Securities Available-for Sale:
|
|||||||||||||||
|
U.S. Agency Obligations
|
$
|
116,393
|
|
$
|
—
|
|
$
|
116,393
|
|
$
|
—
|
|
|||
|
State and Municipal Obligations
|
44,999
|
|
—
|
|
44,999
|
|
—
|
|
|||||||
|
Collateralized Mortgage Obligations - Residential
|
149,669
|
|
—
|
|
149,669
|
|
—
|
|
|||||||
|
Mortgage-Backed Securities - Residential
|
243,043
|
|
—
|
|
243,043
|
|
—
|
|
|||||||
|
Corporate and Other Debt Securities
|
1,015
|
|
—
|
|
1,015
|
|
—
|
|
|||||||
|
Mutual Funds and Equity Securities
|
1,419
|
|
257
|
|
1,162
|
|
—
|
|
|||||||
|
Total Securities Available-for-Sale
|
$
|
556,538
|
|
$
|
257
|
|
$
|
556,281
|
|
$
|
—
|
|
|||
|
December 31, 2010
|
|||||||||||||||
|
Securities Available-for Sale:
|
|||||||||||||||
|
U.S. Agency Obligations
|
$
|
98,173
|
|
$
|
—
|
|
$
|
98,173
|
|
$
|
—
|
|
|||
|
State and Municipal Obligations
|
89,528
|
|
—
|
|
89,528
|
|
—
|
|
|||||||
|
Collateralized Mortgage Obligations - Residential
|
166,964
|
|
—
|
|
166,964
|
|
—
|
|
|||||||
|
Mortgage-Backed Securities - Residential
|
159,926
|
|
—
|
|
159,926
|
|
—
|
|
|||||||
|
Corporate and Other Debt Securities
|
1,417
|
|
—
|
|
1,134
|
|
283
|
|
|||||||
|
Mutual Funds and Equity Securities
|
1,356
|
|
421
|
|
935
|
|
—
|
|
|||||||
|
Total Securities Available-for Sale
|
$
|
517,364
|
|
$
|
421
|
|
$
|
516,660
|
|
$
|
283
|
|
|||
The fair value of level 1 securities available-for-sale are based on unadjusted, quoted market prices from exchanges in active markets. The fair value of level 2 securities available-for-sale are based on an independent bond and equity pricing service for identical assets or significantly similar securities and an independent equity pricing service for equity securities not actively traded at December 31, 2011. The pricing services use a variety of techniques to arrive at fair value including market maker bids, quotes and pricing models. Inputs to the pricing models include recent trades, benchmark interest rates, spreads and actual and projected cash flows. There were no assets or liabilities measured at fair value on a nonrecurring basis at
December 31, 2011
and
2010
.
The fair value of level 3 securities available-for-sale at
December 31, 2010
, in the table above, included one trust preferred pooled security. In our analysis of fair value, we determined that the market for this security was inactive. We reviewed the collateral within the pool and performed a discounted cash flow analysis using additional value estimates from unobservable inputs including expected cash flows after estimated deferrals and defaults. The discount rate used was based on a market based rate of return including an assumed risk premium for securities with similar credit characteristics plus a market price adjustment for the small size and lack of an established market for this type of security.
The following table is a reconciliation of the beginning and ending balances for
2011
and
2010
of the Level 3 assets of Arrow, i.e., as to which fair value is measured using significant unobservable inputs, all of which are securities available-for-sale:
|
2011
|
2010
|
||||||
|
Beginning Balance
|
$
|
283
|
|
$
|
305
|
|
|
|
Principal payment received
|
(331
|
)
|
(54
|
)
|
|||
|
Total net losses (realized/unrealized) included in other comprehensive income
|
48
|
|
32
|
|
|||
|
Ending Balance
|
$
|
—
|
|
$
|
283
|
|
|
#
92
There was no other-than-temporary impairment of the assets in the table above during
2011
or
2010
. The only assets or liabilities that Arrow measured at fair value on a nonrecurring basis on
December 31, 2011
and
2010
was other real estate owned:
|
Fair Value Measurements Using
:
|
|||||||||
|
Other Real Estate Owned and Repossessed Assets
|
Total
|
Quoted Prices
In Active
Markets for
Identical Assets
(Level 1)
|
Significant
Other
Observable
Inputs
(Level 2)
|
Significant
Unobservable
Inputs
(Level 3)
|
Total
Gains
(Losses)
|
||||
|
December 31, 2011
|
$
|
516
|
|
$—
|
$
|
516
|
|
$—
|
$—
|
|
December 31, 2010
|
58
|
|
—
|
58
|
|
—
|
—
|
||
Other assets which might have been included in this table include mortgage servicing rights, goodwill and other intangible assets. Arrow evaluates each of these assets for impairment on a quarterly basis, with no impairment recognized for these assets at
December 31, 2011
and
2010
.
The following table presents a summary at December 31 of the carrying amount and fair value of Arrow
’
s financial instruments not carried at fair value or an amount approximating fair value:
|
2011
|
2010
|
||||||||||||||
|
Carrying
Amount
|
|
Fair
Value
|
|
Carrying
Amount
|
|
Fair
Value
|
|
||||||||
|
Cash and Due from Banks
|
$
|
29,598
|
|
$
|
29,598
|
|
$
|
25,961
|
|
$
|
25,961
|
|
|||
|
Interest-Bearing Deposits at Banks
|
14,138
|
|
14,138
|
|
5,118
|
|
5,118
|
|
|||||||
|
Securities Available-for-Sale (Note 3)
|
556,538
|
|
556,538
|
|
517,364
|
|
517,364
|
|
|||||||
|
Securities Held-to-Maturity (Note 3)
|
150,688
|
|
159,059
|
|
159,938
|
|
162,713
|
|
|||||||
|
Other Investments
|
6,722
|
|
6,722
|
|
8,602
|
|
8,602
|
|
|||||||
|
Net Loans (Note 4)
|
1,116,454
|
|
1,141,310
|
|
1,130,819
|
|
1,158,129
|
|
|||||||
|
Non-Maturity Deposits
|
1,291,388
|
|
1,291,388
|
|
1,165,599
|
|
1,165,599
|
|
|||||||
|
Time Deposits (Note 7)
|
352,658
|
|
359,461
|
|
368,405
|
|
377,224
|
|
|||||||
|
Federal Funds Purchased and Securities Sold Under
Agreements to Repurchase
|
26,293
|
|
26,293
|
|
53,214
|
|
53,214
|
|
|||||||
|
FHLBNY Advances (Note 9)
|
82,000
|
|
83,553
|
|
130,000
|
|
134,676
|
|
|||||||
|
Junior Subordinated Obligations Issued to
Unconsolidated Subsidiary Trusts (Note 10)
|
20,000
|
|
20,000
|
|
20,000
|
|
20,000
|
|
|||||||
|
Accrued Interest Receivable
|
6,082
|
|
6,082
|
|
6,512
|
|
6,512
|
|
|||||||
|
Accrued Interest Payable
|
1,147
|
|
1,147
|
|
1,957
|
|
1,957
|
|
|||||||
Securities held-to-maturity are fair valued utilizing an independent bond pricing service for identical assets or significantly similar securities. The pricing service uses a variety of techniques to arrive at fair value including market maker bids, quotes and pricing models. Inputs to the pricing models include recent trades, benchmark interest rates, spreads and actual and projected cash flows.
Fair values for loans are estimated for portfolios of loans with similar financial characteristics. Loans are segregated by type such as commercial, commercial real estate, residential mortgage, indirect and other consumer loans. Each loan category is further segmented into fixed and adjustable interest rate terms and by performing and nonperforming categories. The fair value of performing loans is calculated by discounting scheduled cash flows through the estimated maturity using estimated market discount rates that reflect the credit and interest rate risk inherent in the loan. The estimate of maturity is based on historical experience with repayments for each loan classification, modified, as required, by an estimate of the effect of current economic and lending conditions. Fair value for nonperforming loans is generally based on recent external appraisals. If appraisals are not available, estimated cash flows are discounted using a rate commensurate with the risk associated with the estimated cash flows. Assumptions regarding credit risk, cash flows and discount rates are judgmentally determined using available market information and specific borrower information.
The fair value of time deposits is based on the discounted value of contractual cash flows, except that the fair value is limited to the extent that the customer could redeem the certificate after imposition of a premature withdrawal penalty. The discount rates are estimated using the FHLBNY yield curve, which is considered representative of Arrow
’
s time deposit rates.
The fair value of FHLBNY advances is estimated based on the discounted value of contractual cash flows. The discount rate is estimated using current rates on FHLBNY advances with similar maturities and call features.
Based on Arrow
’
s capital adequacy, the book value of the outstanding trust preferred securities (Junior Subordinated Obligations Issued to Unconsolidated Subsidiary Trusts) are considered to approximate fair value since the interest rates are variable (indexed to LIBOR) and Arrow is well-capitalized.
#
93
|
Note 22:
|
CONCENTRATIONS OF CREDIT RISK
|
Virtually all of Arrow's loans are with customers in northeastern New York. Although the loan portfolios of the subsidiary banks are well diversified, tourism has a substantial impact on the northeastern New York economy. The commitments to extend credit are fairly consistent with the distribution of loans presented in Note 4, generally have the same credit risk and are subject to normal credit policies. Generally, the loans are secured by assets and are expected to be repaid from cash flow or the sale of selected assets of the borrowers. Arrow evaluates each customer's creditworthiness on a case-by-case basis. The amount of collateral obtained, if deemed necessary by Arrow upon extension of credit, is based upon management's credit evaluation of the counterparty. The nature of the collateral varies with the type of loan and may include: residential real estate, cash and securities, inventory, accounts receivable, property, plant and equipment, income producing commercial properties and automobiles.
|
Note 23:
|
PARENT ONLY FINANCIAL INFORMATION (In Thousands)
|
Condensed financial information for Arrow Financial Corporation is as follows:
|
BALANCE SHEETS
|
December 31,
|
||||||
|
ASSETS
|
2011
|
2010
|
|||||
|
Interest-Bearing Deposits with Subsidiary Banks
|
$
|
2,395
|
|
$
|
1,558
|
|
|
|
Securities Available-for-Sale
|
1,433
|
|
1,542
|
|
|||
|
Securities Held-to-Maturity
|
1,000
|
|
1,000
|
|
|||
|
Investment in Subsidiaries at Equity
|
184,515
|
|
172,532
|
|
|||
|
Other Assets
|
3,915
|
|
3,691
|
|
|||
|
Total Assets
|
$
|
193,258
|
|
$
|
180,323
|
|
|
|
LIABILITIES
|
|||||||
|
Junior Subordinated Obligations Issued to Unconsolidated Subsidiary Trusts
|
$
|
20,000
|
|
$
|
20,000
|
|
|
|
Other Liabilities
|
6,873
|
|
8,064
|
|
|||
|
Total Liabilities
|
26,873
|
|
28,064
|
|
|||
|
STOCKHOLDERS
’
EQUITY
|
|||||||
|
Total Stockholders
’
Equity
|
166,385
|
|
152,259
|
|
|||
|
Total Liabilities and Stockholders
’
Equity
|
$
|
193,258
|
|
$
|
180,323
|
|
|
|
STATEMENTS OF INCOME
|
Years Ended December 31,
|
||||||||||
|
Income:
|
2011
|
2010
|
2009
|
||||||||
|
Dividends from Bank Subsidiaries
|
$
|
14,450
|
|
$
|
12,400
|
|
$
|
11,500
|
|
||
|
Interest and Dividends on Investments
|
127
|
|
129
|
|
100
|
|
|||||
|
Other Income (Including Management Fees)
|
596
|
|
720
|
|
1,305
|
|
|||||
|
Other-Than-Temporary Impairment on Securities Available-for-Sale
|
—
|
|
—
|
|
(375
|
)
|
|||||
|
Net Gains on the Sale of Securities Available-for-Sale
|
17
|
|
27
|
|
15
|
|
|||||
|
Total Income
|
15,190
|
|
13,276
|
|
12,545
|
|
|||||
|
Expense:
|
|||||||||||
|
Interest Expense
|
669
|
|
666
|
|
774
|
|
|||||
|
Salaries and Benefits
|
92
|
|
109
|
|
211
|
|
|||||
|
Other Expense
|
820
|
|
908
|
|
884
|
|
|||||
|
Total Expense
|
1,581
|
|
1,683
|
|
1,869
|
|
|||||
|
Income Before Income Tax Benefit and Equity
|
|||||||||||
|
in Undistributed Net Income of Subsidiaries
|
13,609
|
|
11,593
|
|
10,676
|
|
|||||
|
Income Tax Benefit
|
477
|
|
489
|
|
482
|
|
|||||
|
Income Before Equity in Undistributed
|
|||||||||||
|
Net Income of Subsidiaries
|
14,086
|
|
12,082
|
|
11,158
|
|
|||||
|
Equity in Undistributed Net Income of Subsidiaries
|
7,847
|
|
9,810
|
|
10,634
|
|
|||||
|
Net Income
|
$
|
21,933
|
|
$
|
21,892
|
|
$
|
21,792
|
|
||
The Statement of Changes in Stockholders
’
Equity is not reported because it is identical to the Consolidated Statement of Changes in Stockholders
’
Equity.
#
94
|
STATEMENTS OF CASH FLOWS
|
Years Ended December 31,
|
||||||||||
|
2011
|
2010
|
2009
|
|||||||||
|
Cash Flows from Operating Activities:
|
|||||||||||
|
Net Income
|
$
|
21,933
|
|
$
|
21,892
|
|
$
|
21,792
|
|
||
|
Adjustments to Reconcile Net Income to Net Cash Provided by Operating Activities:
|
|||||||||||
|
Undistributed Net Income of Subsidiaries
|
(7,847
|
)
|
(9,810
|
)
|
(10,634
|
)
|
|||||
|
Other-Than-Temporary Impairment
|
—
|
|
—
|
|
375
|
|
|||||
|
Net Gains on the Sale of Securities Available-for-Sale
|
(17
|
)
|
(27
|
)
|
(15
|
)
|
|||||
|
Shares Issued Under the Directors
’
Stock Plan
|
175
|
|
149
|
|
116
|
|
|||||
|
Stock-Based Compensation Expense
|
354
|
|
299
|
|
189
|
|
|||||
|
Changes in Other Assets and Other Liabilities
|
(165
|
)
|
(1,253
|
)
|
525
|
|
|||||
|
Net Cash Provided by Operating Activities
|
14,433
|
|
11,250
|
|
12,348
|
|
|||||
|
Cash Flows from Investing Activities:
|
|||||||||||
|
Proceeds from the Sale of Securities Available-for-Sale
|
410
|
|
270
|
|
109
|
|
|||||
|
Purchases of Securities Available-for-Sale
|
(253
|
)
|
(373
|
)
|
(1,278
|
)
|
|||||
|
Net Cash Used in Investing Activities
|
157
|
|
(103
|
)
|
(1,169
|
)
|
|||||
|
Cash Flows from Financing Activities:
|
|||||||||||
|
Treasury Stock Issued for Stock-Based Plans
|
1,887
|
|
1,273
|
|
1,644
|
|
|||||
|
Treasury Stock Issued for Dividend Reinvestment Plans
|
1,796
|
|
1,715
|
|
1,658
|
|
|||||
|
Tax Benefit from Exercise of Stock Options
|
51
|
|
105
|
|
193
|
|
|||||
|
Purchase of Treasury Stock
|
(6,039
|
)
|
(3,347
|
)
|
(3,761
|
)
|
|||||
|
Cash Dividends Paid
|
(11,448
|
)
|
(10,997
|
)
|
(10,640
|
)
|
|||||
|
Net Cash Used in Financing Activities
|
(13,753
|
)
|
(11,251
|
)
|
(10,906
|
)
|
|||||
|
Net Increase in Cash and Cash Equivalents
|
837
|
|
(104
|
)
|
273
|
|
|||||
|
Cash and Cash Equivalents at Beginning of the Year
|
1,558
|
|
1,662
|
|
1,389
|
|
|||||
|
Cash and Cash Equivalents at End of the Year
|
$
|
2,395
|
|
$
|
1,558
|
|
$
|
1,662
|
|
||
|
Supplemental Disclosures to Statements of
Cash Flow Information:
|
|||||||||||
|
Interest Paid
|
$
|
669
|
|
$
|
666
|
|
$
|
774
|
|
||
|
Non-cash Investing and Financing Activities:
|
|||||||||||
|
Shares Issued for Acquisition of Subsidiary
|
5,261
|
|
682
|
|
542
|
|
|||||
#
95
|
Item 9.
|
Changes in and Disagreements With Accountants on Accounting and Financial Disclosure -
None.
|
|
Item 9A.
|
Controls and Procedures
|
Senior management maintains disclosure controls and procedures that are designed to ensure that information required to be disclosed in our Exchange Act reports is recorded, processed, summarized and reported within the time periods provided in the SEC's rules and forms, and that such information is accumulated and communicated to our management, including the Chief Executive Officer and Chief Financial Officer, as appropriate, to allow timely decisions regarding required disclosure. In designing and evaluating the disclosure controls and procedures, senior management has recognized that any controls and procedures, no matter how well designed and operated, can provide only reasonable assurance of achieving the desired control objectives, and therefore has been required to apply its judgment in evaluating the cost-benefit relationship of possible controls and procedures.
Senior management, including the Chief Executive Officer and Chief Financial Officer, evaluated the effectiveness of the design and operation of our disclosure controls and procedures (as defined in Rule 13(a)-15(e) under the Exchange Act) as of
December 31, 2011
. Based upon that evaluation, senior management, including the Chief Executive Officer and Chief Financial Officer, concluded that our disclosure controls and procedures were effective on that date. There were no changes made in our internal controls or in other factors that could significantly affect these internal controls subsequent to the date of the evaluation performed by the Chief Executive Officer and Chief Financial Officer.
Management
’
s Report on Internal Control Over Financial Reporting
Our management is responsible for establishing and maintaining adequate internal control over financial reporting, as such term is defined in Exchange Act Rules 13a-15(f). Under the supervision and with the participation of our management, including our Chief Executive Officer and Chief Financial Officer, we conducted an assessment of the effectiveness of our internal control over financial reporting. Our evaluation is based on the framework set forth in
Internal Control
–
Integrated Framework
issued by the Committee of Sponsoring Organizations of the Treadway Commission. Based on our assessment
,
our management concluded that our internal control over financial reporting was effective as of
December 31, 2011
.
|
Item 9B.
|
Other Information
–
None.
|
#
96
|
Item 10.
|
Directors, Executive Officers and Corporate Governance
|
The information required by this item regarding directors and nominees for directors and the Company's committees is set forth under the captions "Election of Directors" and
“
Corporate Governance
”
of Arrow's Proxy Statement for its Annual Meeting of Shareholders to be held
April 25, 2012
(the Proxy Statement), which sections are incorporated herein by reference. Information regarding Compliance with Section 16(a) of the Exchange Act is set forth in the Company's Proxy Statement under the caption "Section 16(a) Beneficial Ownership Reporting
”
and is incorporated herein by reference. Certain required information regarding our Executive Officers is contained in Part I, Item 1.G., of this Report, "Executive Officers of the Registrant." Arrow has adopted a Financial Code of Ethics applicable to our principal executive officer, principal financial officer and principal accounting officer, a copy of which can be found on our website at www.arrowfinancial.com under the link "Corporate Governance."
|
Item 11.
|
Executive Compensation
|
The information required by this item is set forth under the captions "Compensation Discussion and Analysis,
”
“
Executive Compensation,
”
“
Agreements with Executive Officers,
”
“
Potential Payments to Executives Upon Termination or Change-In-Control,
”
“
Compensation Committee Report
”
and
“
Director Compensation
”
of the Proxy Statement, which sections are incorporated herein by reference.
|
Item 12.
|
Security Ownership of Certain Beneficial Owners and Management and Related Stockholder Matters
|
Certain information required by this item is set forth under the caption "Stock Ownership Information" of the Proxy Statement, which section is incorporated herein by reference, and under the caption "Equity Compensation Plan Information" in Part II of this Form 10-K on page 16.
|
Item 13.
|
Certain Relationships and Related Transactions, and Director Independence
|
The information required by this item is set forth under the captions "Compensation Committee Report," "Related Party Transactions
”
and "Audit Committee Report" of the Proxy Statement, which sections are incorporated herein by reference.
|
Item 14.
|
Principal Accounting Fees and Services
|
The information required by this item is set forth under the captions "Independent Registered Public Accounting Firm Fees" and "Voting Item 2 - Ratification of the Independent Registered Public Accounting Firm " of the Proxy Statement, which sections are incorporated herein by reference.
|
Item 15.
|
Exhibits, Financial Statement Schedules
|
1.
Financial Statements
The following financial statements, the notes thereto, and the independent auditors
’
report thereon are filed in Part II, Item 8 of this report. See the index to such financial statements at the beginning of Item 8.
Reports of Independent Registered Public Accounting Firm
Consolidated Balance Sheets as of
December 31, 2011
and
2010
Consolidated Statements of Income for the Years Ended
December 31, 2011
,
2010
and
2009
Consolidated Statements of Comprehensive Income for the Years Ended
December 31, 2011
,
2010
and
2009
Consolidated Statements of Changes in Stockholders
’
Equity for the Years Ended
December 31, 2011
,
2010
and
2009
Consolidated Statements of Cash Flows for the Years Ended
December 31, 2011
,
2010
and
2009
Notes to Consolidated Financial Statements
2.
Schedules
All schedules are omitted as the required information is either not applicable or not required or is contained in the respective financial statements or in the notes thereto.
3.
Exhibits
:
See Exhibit Index on page 99.
#
97
Pursuant to the requirements of Section 13 or 15(d) of the Securities Exchange Act of 1934, the Registrant has duly caused this report to be signed on its behalf by the undersigned, thereunto duly authorized.
ARROW FINANCIAL CORPORATION
|
Date: March 13, 2012
|
By
/s/ Thomas L. Hoy
Thomas L. Hoy
Chairman, President and Chief Executive Officer
|
|
Date: March 13, 2012
|
By:
/s/ Terry R. Goodemote
Terry R. Goodemote
Executive Vice President, Treasurer and
Chief Financial Officer
(Principal Financial and Accounting Officer)
|
Pursuant to the requirements of the Securities Exchange Act of 1934, this report has been signed below on
March 13, 2012
by the following persons in the capacities indicated.
|
/s/ Herbert O. Carpenter
Herbert O. Carpenter
Director
|
/s/ David G. Kruczlnicki
David G. Kruczlnicki
Director
|
|
/s/ John J. Carusone, Jr.
John J. Carusone, Jr.
Director
|
/s/ Elizabeth O
’
C. Little
Elizabeth O
’
C. Little
Director
|
|
/s/ Michael B. Clarke
Michael B. Clarke
Director
|
/s/ David L. Moynehan
David L. Moynehan
Director
|
|
/s/ Gary C. Dake
Gary C. Dake
Director
|
/s/ John J. Murphy
John J. Murphy
Director
|
|
/s/ Mary Elizabeth T. FitzGerald
Mary Elizabeth T. FitzGerald
Director
|
/s/ Richard J. Reisman, D.M.D.
Richard J. Reisman, D.M.D.
Director
|
|
/s/ Thomas L. Hoy
Thomas L. Hoy
Director and Chairman, President and CEO
|
|
|
|
|
#
98
EXHIBIT INDEX
The following exhibits are incorporated by reference herein.
|
Exhibit
Number
|
Exhibit
|
|
3.(i)
|
Certificate of Incorporation of the Registrant, incorporated herein by reference from the Registrant
’
s Annual Report filed on Form 10-K for the year ended December 31, 2007, Exhibit 3.(i)
|
|
3.(ii)
|
By-laws of the Registrant, as amended, incorporated herein by reference from the Registrant
’
s Current Report on Form 8-K filed on November 24, 2009, Exhibit 3.(ii)
|
|
4.1
|
Amended and Restated Declaration of the Trust by and among U.S. Bank National Association, as Institutional Trustee, the Registrant, as Sponsor and certain Administrators named therein, dated as of July 23, 2003, relating to Arrow Capital Statutory Trust II, incorporated herein by reference from the Registrant
’
s Quarterly Report on Form 10-Q for the quarter ended September 30, 2003, Exhibit 4.1
|
|
4.2
|
Indenture between the Registrant, as Issuer, and U.S. Bank National Association, as Trustee, dated as of July 23, 2003, incorporated herein by reference from the Registrant
’
s Quarterly Report on Form 10-Q for the quarter ended September 30, 2003, Exhibit 4.2
|
|
4.3
|
Placement Agreement by and among the Registrant, Arrow Capital Statutory Trust II and SunTrust Capital Markets, Inc., dated July 23, 2003, incorporated herein by reference from the Registrant
’
s Quarterly Report on Form 10-Q for the quarter ended September 30, 2003, Exhibit 4.3
|
|
4.4
|
Guarantee Agreement by and between the Registrant and U.S. Bank National Association, dated as of July 23, 2003, incorporated herein by reference from the Registrant
’
s Quarterly Report on Form 10-Q for the quarter ended September 30, 2003, Exhibit 4.4
|
|
4.5
|
Amended and Restated Trust Agreement among the Registrant, as Depositor, Wilmington Trust Company, as Property Trustee, Wilmington Trust Company, as Delaware trustee, and certain Administrators named therein, dated as of December 28, 2004, relating to Arrow Capital Statutory Trust III, incorporated herein by reference from the Registrant
’
s Annual Report on Form 10-K for the year ended December 31, 2004, Exhibit 4.6
|
|
4.6
|
Junior Subordinated Indenture between the Registrant, as Issuer, and Wilmington Trust Company, as Trustee, dated as of December 28, 2004, incorporated herein by reference from the Registrant
’
s Annual Report on Form 10-K for the year ended December 31, 2004, Exhibit 4.7
|
|
4.7
|
Placement Agreement among the Registrant, Arrow Capital Statutory Trust III and SunTrust Capital Markets, Inc., dated December 28, 2004, incorporated herein by reference from the Registrant
’
s Annual Report on Form 10-K for the year ended December 31, 2004, Exhibit 4.8
|
|
4.8
|
Guarantee Agreement between the Registrant and Wilmington Trust Company, dated as of December 28, 2004, incorporated herein by reference from the Registrant
’
s Annual Report on Form 10-K for the year ended December 31, 2004, Exhibit 4.9
|
|
10.1
|
2010 Dividend Reinvestment Plan of the Registrant, incorporated herein by reference from Registrant
’
s 1933 Act Registration Statement on Form S-3 (File number 333-169121; filed August 31, 2010 and effective September 10, 2010)
|
|
10.2
|
1998 Long Term Incentive Plan of the Registrant, incorporated herein by reference from Registrant
’
s 1933 Act Registration Statement on Form S-8, Exhibit 4.1 (File number 333-62719; filed on September 2, 1998)*
|
|
10.3
|
2008 Long Term Incentive Plan of the Registrant, incorporated herein by reference from the Registrant
’
s Current Report on Form 8-K filed on May 6, 2008, Exhibit 10.1*
|
|
10.4
|
2011 Employee Stock Purchase Plan of the Registrant, incorporated herein by reference from Registrant's 1933 Act Registration Statement on Form S-3 (File number 333-175236; filed on June 29, 2011)*
|
|
10.5
|
Award under Schedule A of Select Executive Retirement Plan to Thomas L. Hoy, dated May 2, 2001, incorporated herein by reference from the Registrant
’
s Annual Report on Form 10-K for the year ended December 31, 2001, Exhibit 10.15*
|
|
10.6
|
Profit Sharing Plan of the Registrant, as amended, incorporated herein by reference from the Registrant
’
s Annual Report filed on Form 10-K for the year ended December 31, 2008, Exhibit 10.6*
|
|
10.7
|
Directors
’
Deferred Compensation Plan of the Registrant, as amended and restated, incorporated herein by reference from the Registrant
’
s Annual Report filed on Form 10-K for the year ended December 31, 2008, Exhibit 10.7*
|
|
10.8
|
Directors
’
Stock Plan of the Registrant, as amended, incorporated herein by reference from the Registrant
’
s Annual Report filed on Form 10-K for the year ended December 31, 2008, Exhibit 10.8*
|
|
10.9
|
Select Executive Retirement Plan of the Registrant for benefits accrued or vested after December 31, 2004, as amended and restated, incorporated herein by reference from the Registrant
’
s Annual Report filed on Form 10-K for the year ended December 31, 2008, Exhibit 10.9*
|
#
99
|
Exhibit
Number
|
Exhibit
|
|
10.10
|
Select Executive Retirement Plan of the Registrant for benefits accrued or vested on or before December 31, 2004, as amended and restated, incorporated herein by reference from the Registrant
’
s Annual Report filed on Form 10-K for the year ended December 31, 2008, Exhibit 10.10*
|
|
10.11
|
Senior Officers Deferred Compensation Plan of the Registrant, as amended, incorporated herein by reference from the Registrant
’
s Annual Report filed on Form 10-K for the year ended December 31, 2008, Exhibit 10.11*
|
|
10.12
|
Short Term Incentive Plan of the Registrant, as amended, incorporated herein by reference from the Registrant
’
s Annual Report filed on Form 10-K for the year ended December 31, 2008, Exhibit 10.12*
|
|
10.13
|
Employment Agreement between the Registrant and Thomas L. Hoy, the Chief Executive Officer, effective February 1, 2012, incorporated herein by reference from the Registrant
’
s Current Report on Form 8-K filed on January 31, 2012, Exhibit 10.1*
|
|
10.14
|
Employment Agreement between the Registrant and Thomas J. Murphy, Senior Executive Vice President and Corporate Secretary and Cashier, effective February 1, 2012, incorporated herein by reference from the Registrant
’
s Current Report on Form 8-K filed on January 31, 2012, Exhibit 10.2*
|
|
10.15
|
Employment Agreement between the Registrant and Terry R. Goodemote, Executive Vice President, Treasurer and Chief Financial Officer, effective February 1, 2012, incorporated herein by reference from the Registrant
’
s Current Report on Form 8-K filed on January 31, 2012, Exhibit 10.3*
|
|
10.16
|
Employment Agreement between the Registrant and David S. DeMarco, Senior Vice President, effective February 1, 2012, incorporated herein by reference from the Registrant
’
s Current Report on Form 8-K filed on January 31, 2012, Exhibit 10.4*
|
|
10.17
|
Employment Agreement between the Registrant and Raymond F. O
’
Conor, Senior Vice President, effective February 1, 2012, incorporated herein by reference from the Registrant
’
s Current Report on Form 8-K filed on January 31, 2012, Exhibit 10.5*
|
|
10.18
|
Form of Incentive Stock Option Certificate (Employee Award) of the Registrant, incorporated herein by reference from the Registrant
’
s Quarterly Report filed on Form 10-Q for the quarter ended June 30, 2009, Exhibit 10.1*
|
|
10.19
|
Form of Non-Qualified Stock Option Certificate (Employee Award) of the Registrant, incorporated herein by reference from the Registrant
’
s Quarterly Report filed on Form 10-Q for the quarter ended June 30, 2009, Exhibit 10.2*
|
|
10.20
|
Form of Non-Qualified Stock Option Certificate (Director Award) of the Registrant, incorporated herein by reference from the Registrant
’
s Quarterly Report filed on Form 10-Q for the quarter ended June 30, 2009, Exhibit 10.3*
|
|
14
|
Financial Code of Ethics, incorporated herein by reference from the Registrant
’
s Annual Report on Form 10-K for the year ended December 31, 2003, Exhibit 14
|
|
* Management contracts or compensation plans required to be filed as an exhibit.
|
|
The following exhibits are submitted herewith:
|
Exhibit
Number
|
Exhibit
|
|
21
|
Subsidiaries of Arrow Financial Corporation
|
|
23
|
Consent of Independent Registered Public Accounting Firm
|
|
31.1
|
Certification of Chief Executive Officer under SEC Rule 13a-14(a)/15d-14(a)
|
|
31.2
|
Certification of Chief Financial Officer under SEC Rule 13a-14(a)/15d-14(a)
|
|
32
|
Certification of Chief Executive Officer under 18 U.S.C. Section 1350 and
Certification of Chief Financial Officer under 18 U.S.C. Section 1350
|
|
101.INS
|
XBRL Instance Document
|
|
101.SCH
|
XBRL Taxonomy Extension Schema Document
|
|
101.CAL
|
XBRL Taxonomy Extension Calculation Linkbase Document
|
|
101.DEF
|
XBRL Taxonomy Extension Definition Linkbase Document
|
|
101.LAB
|
XBRL Taxonomy Extension Labels Linkbase Document
|
|
101.PRE
|
XBRL Taxonomy Extension Presentation Linkbase Document
|
#
100
TABLE OF CONTENTS
Part IItem 1. BusinessPart Ii, Item 7. B.iPart Ii, Item 7. C.iPart Ii, Item 7. C.iiPart Ii, Item 7. C.iiiPart Ii, Item 7. C.ivPart Ii, Item 6Part Ii, Item 8. Note 8Item 1A. Risk FactorsItem 1B. Unresolved Staff Comments - NoneItem 2. PropertiesItem 3. Legal ProceedingsItem 4. Mine Safety Disclosures - NonePart IIItem 5. Market For The Registrant's Common Equity, Related Stockholder Matters and Issuer Purchases Of EquityItem 6. Selected Financial DataItem 7. Management's Discussion and Analysis Of Financial Condition and Results Of OperationsItem 7A. Quantitative and Qualitative Disclosures About Market RiskItem 8. Financial Statements and Supplementary DataNote 1:summary Of Significant Accounting Policies (dollars in Thousands)Note 2:cash and Cash Equivalents (in Thousands)Note 3. Investment Securities (in Thousands)Note 4:loans (in Thousands)Note 5:premises and Equipment (in Thousands)Note 6:other Intangible Assets (in Thousands)Note 7:time Deposits (in Thousands)Note 8:short-term Borrowings (dollars in Thousands)Note 9:fhlbny Advances (dollars in Thousands)Note 10:guaranteed Preferred Beneficial Interests in Corporation S Junior SubordinatedNote 11:comprehensive Income (in Thousands)Note 12:earnings Per Common Share (in Thousands, Except Per Share Amounts)Note 13:regulatory Matters (dollars in Thousands)Note 14:retirement Plans (dollars in Thousands)Note 15:other Employee Benefit Plans (in Thousands)Note 16:stock Option PlansNote 17:other Operating Expense (in Thousands)Note 18:income Taxes (in Thousands)Note 19:lease Commitments (in Thousands)Note 20:financial Instruments with Off-balance Sheet Risk and Contingent LiabilitiesNote 21:fair Value Of Financial Instruments (in Thousands)Note 22:concentrations Of Credit RiskNote 23:parent Only Financial Information (in Thousands)Item 9. Changes in and Disagreements with Accountants on Accounting and Financial Disclosure - NoneItem 9A. Controls and ProceduresItem 9B. Other Information NonePart IIIItem 10. Directors, Executive Officers and Corporate GovernanceItem 11. Executive CompensationItem 12. Security Ownership Of Certain Beneficial Owners and Management and Related Stockholder MattersItem 13. Certain Relationships and Related Transactions, and Director IndependenceItem 14. Principal Accounting Fees and ServicesPart IVItem 15. Exhibits, Financial Statement Schedules