ARROW FINANCIAL CORP
10-Ks and 10-Qs
|
|
|
|
|
|
|
|
|
|
|
|
|
|
|
|
|
|
|
|
|
|
|
|
|
|
|
|
|
|
|
|
|
|
|
|
|
|
|
|
|
|
|
|
|
|
|
|
|
|
UNITED STATES
SECURITIES AND EXCHANGE COMMISSION
Washington, D.C. 20549
FORM 10-K
Annual Report Pursuant to Section 13 or 15(d) of
The Securities Exchange Act of 1934
For the Fiscal Year Ended
December 31, 2017
Commission File Number: 0-12507
ARROW FINANCIAL CORPORATION
(Exact name of registrant as specified in its charter)
|
New York
|
22-2448962
|
|||
|
(State or other jurisdiction of incorporation or organization)
|
(I.R.S. Employer Identification No.)
|
|||
|
250 GLEN STREET, GLENS FALLS, NEW YORK 12801
|
||||
|
(Address of principal executive offices) (Zip Code)
|
||||
|
Registrant’s telephone number, including area code: (518) 745-1000
|
||||
|
SECURITIES REGISTERED PURSUANT TO SECTION 12(b) OF THE ACT: NONE
|
||||
|
SECURITIES REGISTERED PURSUANT TO SECTION 12(g) OF THE ACT:
|
||||
|
Common Stock, Par Value $1.00
|
||||
|
(Title of Class)
|
||||
I
ndicate by check mark if the registrant is a well-known seasoned issuer, as defined in Rule 405 of the Securities Act.
Yes
x
No
Indicate by check mark if the registrant is not required to file reports pursuant to Section 13 or Section 15(d) of the Act.
Yes
x
No
Indicate by check mark whether the registrant (1) has filed all reports required to be filed by Section 13 or 15(d) of the Securities Exchange Act of 1934 during the preceding 12 months (or for such shorter period that the registrant was required to file such reports), and (2) has been subject to such filing requirements for the past 90 days.
x
Yes
No
Indicate by check mark whether the registrant has submitted electronically and posted on its corporate Website, if any, every Interactive Data File required to be submitted and posted pursuant to Rule 405 of Regulation S-T (§ 232.405 of this chapter) during the preceding 12 months (or for such shorter period that the registrant was required to submit and post such files).
x
Yes
No
Indicate by check mark if disclosure of delinquent filers pursuant to Item 405 of Regulation S-K (§ 229.405 of this chapter) is not contained herein, and will not be contained, to the best of registrant's knowledge, in definitive proxy or information statements incorporated by reference in Part III of this Form 10-K or any amendment to this Form 10-K.
Indicate by check mark whether the registrant is a large accelerated filer, an accelerated filer, a non-accelerated filer, or a smaller reporting company. See the definitions of “large accelerated filer,” “accelerated filer” and “smaller reporting company” in Rule 12b-2 of the Exchange Act.
|
Large accelerated filer
|
Accelerated filer
X
|
Non-accelerated filer
|
Smaller reporting company
|
Emerging growth company
|
||||||||||||||||
If an emerging growth company, indicate by check mark if the registrant has elected not to use the extended transition period for complying with any new or revised financial accounting standards provided pursuant to Section 13(a) of the Exchange Act.
Yes
No
Indicate by check mark whether the registrant is a shell company (as defined in Rule 12b-2 of the Act).
Yes
x
No
State the aggregate market value of the voting and non-voting common equity held by non-affiliates computed by reference to the price at which the common equity was last sold, or the average bid and asked price of such common equity, as of the last business day of the registrant’s most recently completed second fiscal quarter:
$426,448,104
Indicate the number of shares outstanding of each of the registrant’s classes of common stock, as of the latest practicable date.
|
Class
|
Outstanding as of February 28, 2018
|
|
|
Common Stock, par value $1.00 per share
|
13,946,146
|
|
DOCUMENTS INCORPORATED BY REFERENCE
Portions of the Registrant’s Proxy Statement for the Annual Meeting of Stockholders to be held
April 25, 2018
(Part III).
ARROW FINANCIAL CORPORATION
FORM 10-K
TABLE OF CONTENTS
|
Page
|
|
|
|
Note on Terminology
|
3
|
|
|
The Company and Its Subsidiaries
|
3
|
|
|
Forward-Looking Statements
|
3
|
|
|
Use of Non-GAAP Financial Measures
|
4
|
|
|
PART I
|
||
|
|
||
|
|
||
|
|
||
|
|
||
|
|
||
|
|
||
|
PART II
|
||
|
|
||
|
|
||
|
|
||
|
|
||
|
|
||
|
|
||
|
|
||
|
|
||
|
PART III
|
||
|
|
||
|
|
||
|
|
||
|
|
||
|
|
||
|
PART IV
|
||
|
|
||
|
|
||
|
|
||
|
|
||
*These items are incorporated by reference to the Corporation’s Proxy Statement for the Annual Meeting of Stockholders to be held
April 25, 2018
.
#
2
NOTE ON TERMINOLOGY
In this Annual Report on Form 10-K, the terms “Arrow,” “the registrant,” “the Company,” “we,” “us,” and “our,” generally refer to Arrow Financial Corporation and subsidiaries as a group, except where the context indicates otherwise. At certain points in this Report, our performance is compared with that of our “peer group” of financial institutions. Unless otherwise specifically stated, this peer group is comprised of the group of
331
domestic (U.S.-based) bank holding companies with $1 to $3 billion in total consolidated assets as identified in the Federal Reserve Board’s most recent “Bank Holding Company Performance Report” (which is the Performance Report for the most recently available period ending
September 30, 2017
), and peer group data has been derived from such Report. This peer group is not, however, identical to either of the peer groups comprising the two bank indices included in the stock performance graphs on pages
19 and 20
of this Report.
THE COMPANY AND ITS SUBSIDIARIES
Arrow is a two-bank holding company headquartered in Glens Falls, New York. Our banking subsidiaries are Glens Falls National Bank and Trust Company (Glens Falls National/GFNB) whose main office is located in Glens Falls, New York, and Saratoga National Bank and Trust Company (Saratoga National/SNB) whose main office is located in Saratoga Springs, New York. Active subsidiaries of Glens Falls National include Capital Financial Group, Inc. (an insurance agency specializing in selling and servicing group health care policies and life insurance), Upstate Agency, LLC (a property and casualty insurance agency), North Country Investment Advisers, Inc. (a registered investment adviser that provides investment advice to our proprietary mutual funds) and Arrow Properties, Inc. (a real estate investment trust, or REIT). Arrow also owns directly two subsidiary business trusts, organized in 2003 and 2004 to issue trust preferred securities (TRUPs), which are still outstanding.
FORWARD-LOOKING STATEMENTS
The information contained in this Annual Report on Form 10-K contains statements that are not historical in nature but rather are based on our beliefs, assumptions, expectations, estimates and projections about the future. These statements are “forward-looking statements” within the meaning of Section 21E of the Securities Exchange Act of 1934, as amended (the "Exchange Act"), and involve a degree of uncertainty and attendant risk. Words such as “expects,” “believes,” “anticipates,” “estimates” and variations of such words and similar expressions often identify such forward-looking statements. Some of these statements, such as those included in the interest rate sensitivity analysis in Item 7A of this Report, entitled “Quantitative and Qualitative Disclosures About Market Risk,” are merely presentations of what future performance or changes in future performance would look like based on hypothetical assumptions and on simulation models. Other forward-looking statements are based on our general perceptions of market conditions and trends in activity, both locally and nationally, as well as current management strategies for future operations and development.
Forward-looking statements in this Report include the following:
|
Topic
|
Section
|
Page
|
Location
|
|
Dividend Capacity
|
Part I, Item 1.C.
|
8
|
First paragraph under "Dividend Restrictions; Other Regulatory Sanctions"
|
|
Part II, Item 7.E.
|
48
|
First paragraph under "Dividends"
|
|
|
Recent Legislative Developments
|
Part I, Item 1.D.
|
12
|
Last paragraph in Section D
|
|
Part II, Item 7.A.
|
11
|
Paragraph in "Health Care Reform"
|
|
|
Visa Stock
|
Part II, Item 7.A.
|
28
|
Paragraph under "Visa Class B Common Stock"
|
|
Impact of Changing Interest Rates on Earnings
|
Part II, Item 7.C.II.a.
|
41
|
Last paragraph under “Automobile Loans”
|
|
Part II, Item 7.C.II.a.
|
40
|
Last two paragraphs
|
|
|
Part II, Item 7A.
|
52
|
Last four paragraphs
|
|
|
Adequacy of the Allowance for Loan
Losses
|
Part II, Item 7.B.II.
|
33
|
First paragraph under “II. Provision For Loan Losses and Allowance For Loan Losses”
|
|
Noninterest Income
|
Part II, Item 7.C.III
|
34
|
Paragraphs four and five under "2017 Compared to 2016"
|
|
Expected Level of Real Estate Loans
|
Part II, Item 7.C.II.a.
|
40
|
Paragraphs under “Residential Real Estate Loans”
|
|
Expected Level of Commercial Loans
|
Part II, Item 7.C.II.a.
|
40
|
Paragraphs under “Commercial, Commercial Real Estate and Construction and Land Development Loans”
|
|
Expected Level of Nonperforming
Assets
|
Part II, Item 7.C.II.c.
|
43
|
Last two paragraphs under "Potential Problem Loans"
|
|
Liquidity
|
Part II, Item 7.D.
|
47
|
Last two paragraphs under "Liquidity"
|
|
Commitments to Extend Credit
|
Part II, Item 8
|
81
|
Last two paragraphs in Note 8
|
|
Pension plan return on assets
|
Part II, Item 8
|
90
|
Second to last paragraph in Note 13
|
|
Realization of recognized net
deferred tax assets
|
Part II, Item 8
|
97
|
Second to last paragraph in Note 15
|
#
3
These forward-looking statements may not be exhaustive, are not guarantees of future performance and involve certain risks and uncertainties that are difficult to quantify or, in some cases, to identify. You should not place undue reliance on any such forward-looking statements. In the case of all forward-looking statements, actual outcomes and results may differ materially from what the statements predict or forecast. Factors that could cause or contribute to such differences include, but are not limited to:
|
a.
|
rapid and dramatic changes in economic and market conditions
|
b.
sharp fluctuations in interest rates, economic activity, or consumer spending patterns;
c.
sudden changes in the market for products we provide, such as real estate loans;
|
d.
|
significant changes in banking or other laws and regulations, including both enactment of new legal or regulatory measures (e.g., the Dodd-Frank Wall Street Reform and Consumer Protection Act ("Dodd-Frank") and the Tax Cuts and Jobs Act of 2017 (the "Tax Act")) or the modification or elimination of pre-existing measures;
|
|
e.
|
significant changes in U.S. monetary or fiscal policy, including new or revised monetary programs or targets adopted or announced by the Federal Reserve ("monetary tightening or easing") or significant new federal legislation materially affecting the federal budget ("fiscal tightening or expansion");
|
|
f.
|
competition from other sources (e.g., so-called Fintech enterprises);
|
|
g.
|
similar uncertainties inherent in banking operations or business generally, including technological developments and changes; and
|
|
h.
|
other risks detailed from time to time within our filings with the Securities and Exchange Commission ("SEC").
|
We are under no duty to update any of the forward-looking statements after the date of this Annual Report on Form 10-K to conform such statements to actual results. All forward-looking statements, express or implied, included in this Report and the documents we incorporate by reference and that are attributable to the Company are expressly qualified in their entirety by this cautionary statement. This cautionary statement should also be considered in connection with any subsequent written or oral forward-looking statements that the Company or any persons acting on our behalf may issue.
USE OF NON-GAAP FINANCIAL MEASURES
The SEC has adopted Regulation G, which applies to all public disclosures, including earnings releases, made by registered companies that contain “non-GAAP financial measures.” GAAP is generally accepted accounting principles in the United States of America. Under Regulation G, companies making public disclosures containing non-GAAP financial measures must also disclose, along with each non-GAAP financial measure, certain additional information, including a reconciliation of the non-GAAP financial measure to the closest comparable GAAP financial measure and a statement of the Company’s reasons for utilizing the non-GAAP financial measure as part of its financial disclosures. The SEC has exempted from the definition of “non-GAAP financial measures” certain commonly used financial measures that are not based on GAAP. When these exempted measures are included in public disclosures, supplemental information is not required. The following measures used in this Report, which are commonly utilized by financial institutions, have not been specifically exempted by the SEC and may constitute "non-GAAP financial measures" within the meaning of the SEC's new rules, although we are unable to state with certainty that the SEC would so regard them.
Tax-Equivalent Net Interest Income and Net Interest Margin:
Net interest income, as a component of the tabular presentation by financial institutions of Selected Financial Information regarding their recently completed operations, as well as disclosures based on that tabular presentation, is commonly presented on a tax-equivalent basis. That is, to the extent that some component of the institution's net interest income, which is presented on a before-tax basis, is exempt from taxation (e.g., is received by the institution as a result of its holdings of state or municipal obligations), an amount equal to the tax benefit derived from that component is added to the actual before-tax net interest income total. This adjustment is considered helpful in comparing one financial institution's net interest income to that of another institution or in analyzing any institution’s net interest income trend line over time, to correct any analytical distortion that might otherwise arise from the fact that financial institutions vary widely in the proportions of their portfolios that are invested in tax-exempt securities, and from the fact that even a single institution may significantly alter over time the proportion of its own portfolio that is invested in tax-exempt obligations. Moreover, net interest income is itself a component of a second financial measure commonly used by financial institutions, net interest margin, which is the ratio of net interest income to average earning assets. For purposes of this measure as well, tax-equivalent net interest income is generally used by financial institutions, again to provide a better basis of comparison from institution to institution and to better demonstrate a single institution’s performance over time. We follow these practices.
The Efficiency Ratio:
Financial institutions often use an "efficiency ratio" as a measure of expense control. The efficiency ratio typically is defined as the ratio of noninterest expense to net interest income and noninterest income. Net interest income as utilized in calculating the efficiency ratio is typically the same as the net interest income presented in Selected Financial Information table discussed in the preceding paragraph, i.e., it is expressed on a tax-equivalent basis. Moreover, many financial institutions, in calculating the efficiency ratio, also adjust both noninterest expense and noninterest income to exclude from these items (as calculated under GAAP) certain recurring component elements of income and expense, such as intangible asset amortization (which is included in noninterest expense under GAAP but may not be included therein for purposes of calculating the efficiency ratio) and securities gains or losses (which are reflected in the calculation of noninterest income under GAAP but may be ignored for purposes of calculating the efficiency ratio). We make these adjustments.
Tangible Book Value per Share:
Tangible equity is total stockholders’ equity less intangible assets. Tangible book value per share is tangible equity divided by total shares issued and outstanding. Tangible book value per share is often regarded as a more meaningful comparative ratio than book value per share as calculated under GAAP, that is, total stockholders’ equity including intangible assets divided by total shares issued and outstanding. Intangible assets includes many items, but in our case, essentially represents goodwill.
#
4
Adjustments for Certain Items of Income or Expense:
In addition to our regular utilization in our public filings and disclosures of the various non-GAAP measures commonly utilized by financial institutions discussed above, we also may elect from time to time, in connection with our presentation of various financial measures prepared in accordance with GAAP, such as net income, earnings per share (i.e., EPS), return on average assets (i.e., ROA), and return on average equity (i.e., ROE), to provide as well certain comparative disclosures that adjust these GAAP financial measures, typically by removing therefrom the impact of certain transactions or other material items of income or expense that are unusual or unlikely to be repeated. We do so only if we believe that inclusion of the resulting non-GAAP financial measures may improve the average investor's understanding of our results of operations by separating out items that have a disproportional positive or negative impact on the particular period in question or by otherwise permitting a better comparison from period-to-period in our results of operations with respect to our fundamental lines of business, including the commercial banking business.
We believe that the non-GAAP financial measures disclosed by us from time-to-time are useful in evaluating our performance and that such information should be considered as supplemental in nature, and not as a substitute for or superior to, the related financial information prepared in accordance with GAAP. Our non-GAAP financial measures may differ from similar measures presented by other companies.
Item 1.
Business
A. GENERAL
Our holding company, Arrow Financial Corporation, a New York corporation, was incorporated on March 21, 1983 and is registered as a bank holding company within the meaning of the Bank Holding Company Act of 1956. Arrow owns two nationally- chartered banks in New York (Glens Falls National and Saratoga National), and through such banks indirectly owns various non-bank subsidiaries, including two insurance agencies, a registered investment adviser and a REIT. See "The Company and Its Subsidiaries," above.
|
Subsidiary Banks
(dollars in thousands)
|
|||||||
|
Glens Falls National
|
Saratoga National
|
||||||
|
Total Assets at Year-End
|
$
|
2,272,922
|
|
$
|
489,614
|
|
|
|
Trust Assets Under Administration and
Investment Management at Year-End
(Not Included in Total Assets)
|
$
|
1,356,389
|
|
$
|
96,605
|
|
|
|
Date Organized
|
1851
|
|
1988
|
|
|||
|
Employees (full-time equivalent)
|
477
|
|
56
|
|
|||
|
Offices
|
30
|
|
10
|
|
|||
|
Counties of Operation
|
Warren, Washington,
Saratoga, Essex &
Clinton
|
Saratoga, Albany,
Rensselaer, & Schenectady
|
|||||
|
Main Office
|
250 Glen Street
Glens Falls, NY
|
171 So. Broadway
Saratoga Springs, NY
|
|||||
The holding company
’
s business consists primarily of the ownership, supervision and control of our two banks, including the banks' subsidiaries. The holding company provides various advisory and administrative services and coordinates the general policies and operation of the banks. There were
533
full-time equivalent employees, including
65
employees within our insurance agency affiliates, at
December 31, 2017
.
We offer a broad range of commercial and consumer banking and financial products. Our deposit base consists of deposits derived principally from the communities we serve. We target our lending activities to consumers and small and mid-sized companies in our immediate geographic areas. Through our banks' trust operations, we provide retirement planning, trust and estate administration services for individuals, and pension, profit-sharing and employee benefit plan administration for corporations.
B. LENDING ACTIVITIES
Arrow engages in a wide range of lending activities, including commercial and industrial lending primarily to small and mid-sized companies; mortgage lending for residential and commercial properties; and consumer installment and home equity financing. We also maintain an active indirect lending program through our sponsorship of automobile dealer programs under which we purchase dealer paper, primarily from dealers that meet pre-established specifications. From time to time, we sell a portion of our residential real estate loan originations into the secondary market, primarily to the Federal Home Loan Mortgage Corporation ("Freddie Mac") and governmental agencies. Normally, we retain the servicing rights on mortgage loans originated and sold by us into the secondary markets, subject to our periodic determinations on the continuing profitability of such activity.
Generally, we continue to implement lending strategies and policies that are intended to protect the quality of the loan portfolio, including strong underwriting and collateral control procedures and credit review systems. Loans are placed on nonaccrual status either due to the delinquency status of principal and/or interest or a judgment by management that the full repayment of principal and interest is unlikely. Home equity lines of credit, secured by real property, are systematically placed on nonaccrual status when 120 days past due, and residential real estate loans when 150 days past due. Commercial and commercial real estate loans are evaluated on a loan-by-loan basis and are placed on nonaccrual status when 90 days past due if the full collection of principal and interest is uncertain. (See Part II, Item 7.C.II.c. "Risk Elements.") Subsequent cash payments on loans classified as nonaccrual may be applied all to principal, although income in some cases may be recognized on a cash basis.
#
5
We lend almost exclusively to borrowers within our normal retail service area in northeastern New York State, with the exception of our indirect consumer lending line of business, where we acquire retail paper from an extensive network of automobile dealers that operate in a larger area of upstate New York, and in central and southern Vermont. The loan portfolio does not include any foreign loans or any other significant risk concentrations. We do not generally participate in loan syndications, either as originator or as a participant. However, from time to time, we buy participations in individual loans, typically commercial loans, originated by other financial institutions in New York and adjacent states. In recent periods, the total dollar amount of such participations has fluctuated, but generally represents less than 20% of commercial loans outstanding. Most of the portfolio is fully collateralized, and many commercial loans are further supported by personal guarantees.
We do not engage in subprime mortgage lending as a business line and we do not extend or purchase so-called "Alt A," "negative amortization," "option ARM
'
s" or "negative equity" mortgage loans.
C. SUPERVISION AND REGULATION
The following generally describes the laws and regulations to which we are subject. Bank holding companies, banks and their affiliates are extensively regulated under both federal and state law. To the extent that the following information summarizes statutory or regulatory law, it is qualified in its entirety by reference to the particular provisions of the various statutes and regulations. Any change in applicable law may have a material effect on our business operations, customers, prospects and investors.
Bank Regulatory Authorities with Jurisdiction over Arrow and its Subsidiary Banks
Arrow is a registered bank holding company within the meaning of the Bank Holding Company Act of 1956 ("BHC Act") and as such is subject to regulation by the Board of Governors of the Federal Reserve System ("FRB"). As a "bank holding company" under New York State law, Arrow is also subject to regulation by the New York State Department of Financial Services. Our two subsidiary banks are both national banks and are subject to supervision and examination by the Office of the Comptroller of the Currency ("OCC"). The banks are members of the Federal Reserve System and the deposits of each bank are insured by the Deposit Insurance Fund of the Federal Deposit Insurance Corporation ("FDIC"). The BHC Act generally prohibits Arrow from engaging, directly or indirectly, in activities other than banking, activities closely related to banking, and certain other financial activities. Under the BHC Act, a bank holding company generally must obtain FRB approval before acquiring, directly or indirectly, voting shares of another bank or bank holding company, if after the acquisition the acquiror would own 5 percent or more of a class of the voting shares of that other bank or bank holding company. Bank holding companies are able to acquire banks or other bank holding companies located in all 50 states, subject to certain limitations. Bank holding companies that meet certain qualifications may choose to apply to the FRB for designation as "financial holding companies." If they obtain such designation, they will thereafter be eligible to acquire or otherwise affiliate with a much broader array of other financial institutions than "bank holding companies" are eligible to acquire or affiliate with, including insurance companies, investment banks and merchant banks. Arrow has not attempted to become, and has not been designated as, a financial holding company.
The FRB and the OCC have broad regulatory, examination and enforcement authority. The FRB and the OCC conduct regular examinations of the entities they regulate. In addition, banking organizations are subject to requirements for periodic reporting to the regulatory authorities. The FRB and OCC have the authority to implement various remedies if they determine that the financial condition, capital, asset quality, management, earnings, liquidity or other aspects of a banking organization's operations are unsatisfactory or if they determine the banking organization is violating or has violated any law or regulation. The authority of the FRB and the OCC over banking organizations includes, but is not limited to, prohibiting unsafe or unsound practices; requiring affirmative action to correct a violation or unsafe or unsound practice; issuing administrative orders; requiring the organization to increase capital; requiring the organization to sell subsidiaries or other assets; restricting dividends, distributions and repurchases of the organization's stock; restricting the growth of the organization; assessing civil money penalties; removing officers and directors; and terminating deposit insurance. The FDIC may terminate a depository institution's deposit insurance upon a finding that the institution's financial condition is unsafe or unsound or that the institution has engaged in unsafe or unsound practices for certain other reasons.
Regulatory Supervision of Other Arrow Subsidiaries
The insurance agency subsidiaries of Glens Falls National are subject to the licensing and other provisions of New York State Insurance Law and are regulated by the New York State Department of Financial Services. Arrow's investment adviser subsidiary is subject to the licensing and other provisions of the federal Investment Advisers Act of 1940 and is regulated by the SEC.
Regulation of Transactions between Banks and their Affiliates
Transactions between banks and their "affiliates" are regulated by Sections 23A and 23B of the Federal Reserve Act (FRA). Each of our organization's non-bank subsidiaries (other than the business trusts we formed to issue our TRUPs) is a subsidiary of one of our banks, and also is an "operating subsidiary" under Sections 23A and 23B. This means the non-bank subsidiary is considered to be part of the bank that owns it and thus is not an affiliate of the bank for purposes of Section 23A and 23B. However, each of our two banks is an affiliate of the other bank, under Section 23A, and Arrow, the holding company, is also an affiliate of each bank under both Sections 23A and 23B. Extensions of credit that a bank may make to affiliates, or to third parties secured by securities or obligations of the affiliates, are substantially limited by the FRA and the Federal Deposit Insurance Act (FDIA). Such acts further restrict the range of permissible transactions between a bank and any affiliate, including a bank affiliate. Furthermore, under the FRA, a bank may engage in certain transactions, including loans and purchases of assets, with a non-bank affiliate, only
#
6
if certain special conditions, including collateral requirements for loans, are met and if the other terms and conditions of the transaction, including interest rates and credit standards, are substantially the same as, or at least as favorable to the bank as, those prevailing at the time for comparable transactions by the bank with non-affiliated companies or, in the absence of comparable transactions, on terms and conditions that would be offered by the bank to non-affiliated companies.
Regulatory Capital Standards
An important area of banking regulation is the federal banking system's promulgation and enforcement of minimum capitalization standards for banks and bank holding companies.
Bank Capital Rules
.
Dodd-Frank, among other things, directed U.S. bank regulators to promulgate revised capital standards for U.S. banking organizations, which needed be at least as strict (i.e., must establish minimum capital levels that are at least as high) as the regulatory capital standards that were in effect for U.S. insured depository financial institutions at the time Dodd-Frank was enacted in 2010.
In July 2013, federal bank regulators, including the FRB and the OCC, approved their revised bank capital rules aimed at implementing these Dodd-Frank capital requirements. These rules were also intended to coordinate U.S. bank capital standards with the current drafts of the Basel III proposed bank capital standards for all of the developed world's banking organizations. The federal regulators' revised capital rules (the "Capital Rules"), which impose significantly higher minimum capital ratios on U.S. financial institutions than the rules they replaced, became effective for Arrow and its subsidiary banks on January 1, 2015, with full phase in by 2019.
The revised Capital Rules, like the rules they replaced, consist of two basic types of capital measures, a leverage ratio and set of risk-based capital measures. Within these two broad types of rules, however, significant changes were made in the revised Capital Rules, as discussed below.
Leverage Rule
.
The revised Capital Rules did not fundamentally alter the structure of the leverage rule that previously applied to banks and bank holding companies, except to increase the minimum required leverage ratio from 3.0% to 4.0%. The leverage ratio continues to be defined as the ratio of the institution's "Tier 1" capital (as defined under the new leverage rule) to total tangible assets (again, as defined under the revised leverage rule).
Risk-Based Capital Measures
.
The principal changes under the revised Capital Rules involve the other basic type of regulatory capital measures, the so-called risk-based capital measures. As a general matter, risk-based capital measures assign various risk weightings to all of the institution's assets, by asset type, and to certain off-balance sheet items, and then establish minimum levels of capital to the aggregate dollar amount of such risk-weighted assets. The general effect of the revised risk-based Capital Rules was to increase most of the pre-existing risk-based minimum capital ratios and to introduce several new minimum capital ratios and capital definitions. The basic result was to increase required capital for banks and their holding companies.
Under the revised risk-based Capital Rules, there are 8 major risk-weighted categories of assets (although there are several additional super-weighted categories for high-risk assets that are generally not held by community banking organizations like ours). The revised rules also are more restrictive in their definitions of what qualify as capital components. Most importantly, the revised rules, as required under Dodd-Frank, added several risk-based capital measures that also must be met. One such measure is the "common equity tier 1 capital ratio" (CET1). For this ratio, only common equity (basically, common stock plus surplus plus retained earnings) qualifies as capital (i.e., CET1). Preferred stock and trust preferred securities, which qualified as Tier 1 capital under the old Tier 1 risk-based capital measure (and continue to qualify as capital under the revised Tier 1 risk-based capital measure), are not included in CET1 capital. Technically, under the revised rules, CET1 capital also includes most elements of accumulated other comprehensive income (AOCI), including unrealized securities gains and losses, as part of both total regulatory capital (numerator) and total assets (denominator). However, smaller banking organizations like ours were given the opportunity to make a one-time irrevocable election to include or not to include certain elements of AOCI, most notably unrealized securities gains or losses. We made such an election, i.e., not to include unrealized securities gains and losses in calculating our CET1 ratio under the revised Capital Rules. The minimum CET1 ratio under the revised rules, effective January 1, 2015, is 4.50%, which will remain constant throughout the phase-in period.
Consistent with the general theme of higher capital levels, the revised Capital Rules also increased the minimum ratio for Tier 1 risk-based capital, which was 4.0%, to 6.0%, effective January 1, 2015. The minimum level for total risk-based capital under the revised Capital Rules remained at 8.0%, the same level as under the old rules.
The revised Capital Rules incorporate a capital concept, the so-called "capital conservation buffer" (set at 2.5%, after full phase-in), which must be added to each of the minimum required risk-based capital ratios (i.e., the minimum CET1 ratio, the minimum Tier 1 risk-based capital ratio and the minimum total risk-based capital ratio). The capital conservation buffer is being phased-in over four years beginning January 1, 2016 (see the table below). When, during economic downturns, an institution's capital begins to erode, the first deductions from a regulatory perspective would be taken against the conservation buffer. To the extent that such deductions should erode the buffer below the required level (2.5% of total risk-based assets after full phase-in), the institution will not necessarily be required to replace the buffer deficit immediately, but will face restrictions on paying dividends and other negative consequences until the buffer is fully replenished.
Also under the revised Capital Rules, and as required under Dodd-Frank, TRUPs issued by small- to medium-sized banking organizations (such as ours) that were outstanding on the Dodd-Frank grandfathering date for TRUPS (May 19, 2010) will continue to qualify as tier 1 capital, up to a limit of 25% of tier 1 capital, until the TRUPs mature or are redeemed. See the discussion of grandfathered TRUPs in section D of this item under "The Dodd-Frank Act."
#
7
The following is a summary of the revised definitions of capital under the various new risk-based measures in the revised Capital Rules:
Common Equity Tier 1 Capital (CET1):
Equals the sum of common stock instruments and related surplus (net of treasury stock), retained earnings, accumulated other comprehensive income (AOCI), and qualifying minority interests, minus applicable regulatory adjustments and deductions. Such deductions will include AOCI, if the organization has exercised its irrevocable option not to include AOCI in capital (we made such an election). Mortgage-servicing assets, deferred tax assets, and investments in financial institutions are limited to 15 percent of CET1 in the aggregate and 10 percent of CET1 for each such item individually.
Additional Tier 1 Capital:
Equals the sum of noncumulative perpetual preferred stock, tier 1 minority interests, grandfathered TRUPs, and Troubled Asset Relief Program instruments, minus applicable regulatory adjustments and deductions.
Tier 2 Capital:
Equals the sum of subordinated debt and preferred stock, total capital minority interests not included in Tier 1, and allowance for loan and lease losses (not exceeding 1.25 percent of risk-weighted assets) minus applicable regulatory adjustments and deductions.
The following table presents the transition schedule applicable to Arrow and its subsidiary banks under the revised Capital Rules:
|
Year, as of January 1
|
2016
|
2017
|
2018
|
2019
|
||||
|
Minimum CET1 Ratio
|
4.500
|
%
|
4.500
|
%
|
4.500
|
%
|
4.500
|
%
|
|
Capital Conservation Buffer ("Buffer")
|
0.625
|
%
|
1.250
|
%
|
1.875
|
%
|
2.500
|
%
|
|
Minimum CET1 Ratio Plus Buffer
|
5.125
|
%
|
5.750
|
%
|
6.375
|
%
|
7.000
|
%
|
|
Minimum Tier 1 Risk-Based Capital Ratio
|
6.000
|
%
|
6.000
|
%
|
6.000
|
%
|
6.000
|
%
|
|
Minimum Tier 1 Risk-Based Capital Ratio Plus Buffer
|
6.625
|
%
|
7.250
|
%
|
7.875
|
%
|
8.500
|
%
|
|
Minimum Total Risk-Based Capital Ratio
|
8.000
|
%
|
8.000
|
%
|
8.000
|
%
|
8.000
|
%
|
|
Minimum Total Risk-Based Capital Ratio Plus Buffer
|
8.625
|
%
|
9.250
|
%
|
9.875
|
%
|
10.500
|
%
|
|
Minimum Leverage Ratio
|
4.000
|
%
|
4.000
|
%
|
4.000
|
%
|
4.000
|
%
|
These minimum capital ratios, especially the CET1 ratio (4.5%) and the enhanced Tier 1 risk-based capital ratio (6.0%), which began to apply to our organization on January 1, 2015, represent a heightened and more restrictive capital regime than institutions like ours previously had to meet, and the four year phase-in of the regulatory capital buffer, which began January 1, 2016, will add to the stress on banks' profitability.
At
December 31, 2017
, Arrow and its two subsidiary banks exceeded by a substantial amount each of the applicable minimum capital ratios established under the revised Capital Rules, including the minimum CET1 Ratio, the minimum Tier 1 Risk-Based Capital Ratio, the minimum Total Risk-Based Capital Ratio, and the minimum Leverage Ratio, including in the case of each risk-based ratio, the phased-in portion of the capital buffer. See Note 19,
Regulatory Matters
, to the notes to our Consolidated Financial Statements for a presentation of our period-end ratios for
2017
and
2016
.
Regulatory Capital Classifications.
Under applicable banking law, federal banking regulators are required to take prompt corrective action with respect to depository institutions that do not meet minimum capital requirements. The regulators have established five capital classifications for banking institutions, ranging from the highest category of "well-capitalized" to the lowest category of "critically under-capitalized". As a result of the regulators' adoption of the revised Capital Rules, the definitions for determining which of the five capital classifications a particular banking organization will fall into were changed, effective as of January 1, 2015. Under the revised capital classifications, a banking institution is considered "well-capitalized" if it meets the following capitalization standards on the date of measurement: a CET1 risk-based capital ratio of 6.50% or greater, a Tier 1 risk-based capital ratio of 8.00% or greater, and a total risk-based capital ratio of 10.00% or greater, provided the institution is not subject to any regulatory order or written directive regarding capital maintenance.
As of
December 31, 2017
, Arrow and its two subsidiary banks qualified as "well-capitalized" under the revised capital classification scheme.
Dividend Restrictions; Other Regulatory Sanctions
A holding company's ability to pay dividends or repurchase its outstanding stock, as well as its ability to expand its business, including for example, through acquisitions of additional banking organizations or permitted non-bank companies, may be restricted if its capital falls below minimum regulatory capital ratios or fails to meet other informal capital guidelines that the regulators may apply from time to time to specific banking organizations. In addition to these potential regulatory limitations on payment of dividends, our holding company
'
s ability to pay dividends to our shareholders, and our subsidiary banks
'
ability to pay dividends to our holding company are also subject to various restrictions under applicable corporate laws, including banking laws (which affect our subsidiary banks) and the New York Business Corporation Law (which affects our holding company). The ability of our holding company and banks to pay dividends or repurchase shares in the future is, and is expected to continue to be, influenced by regulatory policies, the phase-in of the revised, more stringent bank capital guidelines and applicable law.
#
8
In cases where banking regulators have significant concerns regarding the financial condition, assets or operations of a bank holding company or one of its banks, the regulators may take enforcement action or impose enforcement orders, formal or informal, against the holding company or the particular bank. If the ratio of tangible equity to total assets of a bank falls to 2% or below, the bank will likely be closed and placed in receivership, with the FDIC as receiver.
Cybersecurity
In additional to the provisions in the Gramm-Leach-Bliley Act relating to data security (discussed below), Arrow and its subsidiaries are subject to many federal and state laws, regulations and regulatory interpretations which impose standards and requirements related to cybersecurity. For example, in March 2015, federal regulators issued two related statements regarding cybersecurity. One statement indicates that financial institutions should design multiple layers of security controls to establish lines of defense and to ensure that their risk management processes also address the risk posed by compromised customer credentials, including security measures to reliably authenticate customers accessing internet-based services of the financial institution. The other statement indicates that a financial institution’s management is expected to maintain sufficient business continuity planning processes to ensure the rapid recovery, resumption and maintenance of the institution’s operations after a cyber-attack involving destructive malware. A financial institution is also expected to develop appropriate processes to enable recovery of data and business operations and address rebuilding network capabilities and restoring data if the institution or its critical service providers fall victim to this type of cyber-attack. Financial institutions that fail to observe this regulatory guidance on cybersecurity may be subject to various regulatory sanctions, including financial penalties.
Anti-Money Laundering and OFAC
Under federal law, financial institutions must maintain anti-money laundering programs that include established internal policies, procedures, and controls. Financial institutions are also prohibited from entering into specified financial transactions and account relationships and must meet enhanced standards for due diligence and customer identification. Financial institutions must take reasonable steps to conduct enhanced scrutiny of account relationships to guard against money laundering and to report any suspicious transactions. Law enforcement authorities have been granted increased access to financial information maintained by financial institutions. Bank regulators routinely examine institutions for compliance with these obligations and they must consider an institution's compliance in connection with the regulatory review of applications, including applications for banking mergers and acquisitions. The U.S. Department of the Treasury's Office of Foreign Assets Control, or "OFAC," is responsible for helping to insure that U.S. entities do not engage in transactions with certain prohibited parties, as defined by various Executive Orders and Acts of Congress. OFAC publishes lists of persons, organizations, and countries suspected of aiding, harboring or engaging in terrorist acts, known as Specially Designated Nationals and Blocked Persons. If Arrow finds a name on any transaction, account or wire transfer that is on an OFAC list, Arrow must freeze or block such account or transaction, file a suspicious activity report and notify the appropriate authorities. The U.S. Treasury Department's Financial Crises Enforcement Network ("FinCEN") issued a final rule in 2016 increasing customer due diligence requirements for banks, including adding a requirement to identify and verify the identity of beneficial owners of customers that are legal entities, subject to certain exclusions and exemptions. Compliance with this rule is required in May 2018.
Reserve Requirements
Pursuant to regulations of the FRB, all banking organizations are required to maintain average daily reserves at mandated ratios against their transaction accounts and certain other types of deposit accounts. These reserves must be maintained in the form of vault cash or in an account at a Federal Reserve Bank.
Community Reinvestment Act
Arrow's subsidiary banks are subject to the Community Reinvestment Act ("CRA") and implementing regulations. CRA regulations establish the framework and criteria by which the bank regulatory agencies assess an institution's record of helping to meet the credit needs of its community, including low and moderate-income individuals. CRA ratings are taken into account by regulators in reviewing certain applications made by Arrow and its bank subsidiaries.
Privacy and Confidentiality Laws
Arrow and its subsidiaries are subject to a variety of laws that regulate customer privacy and confidentiality. The Gramm-Leach-Bliley Act requires financial institutions to adopt privacy policies, to restrict the sharing of nonpublic customer information with nonaffiliated parties upon the request of the customer, and to implement data security measures to protect customer information. The Fair Credit Reporting Act, as amended by the Fair and Accurate Credit Transactions Act of 2003, regulates use of credit reports, providing of information to credit reporting agencies and sharing of customer information with affiliates, and sets identity theft prevention standards.
#
9
The Dodd-Frank Act
As a result of the 2008-2009 financial crisis, Dodd-Frank was enacted on July 21, 2010. While some of the Act's provisions have not had, and likely will not have, any direct impact on Arrow, other provisions have impacted or likely will impact our business operations and financial results in a significant way. These include the establishment of a new regulatory body known as the Consumer Financial Protection Bureau (CFPB), which operates as an independent entity within the Federal Reserve System and is authorized to issue rules for consumer protection, some of which have increased, and likely will continue to increase banks' compliance expenses, thereby negatively impacting profitability. For depository institutions with $10 billion or less in assets (such as Arrow's banks), the banks' traditional regulatory agencies (for our banks, the OCC), and not the CFPB, will have primary examination and enforcement authority over the banks' compliance with new CFPB rules as well as all other consumer protection rules and regulations. However, the CFPB has the right to include its examiners on a "sampling" basis in examinations conducted by the traditional regulators and is authorized to give those agencies input and recommendations with respect to consumer protection laws and to require reports and other examination documents. The CFPB has broad authority to curb practices it finds to be unfair, deceptive and abusive. What constitutes "abusive" behavior has been broadly defined and is very likely to create an environment conducive to increased litigation. This is likely to be exacerbated by the fact that, in addition to the federal authorities charged with enforcing the CFPB's rules, state attorneys general are also authorized to enforce certain of the Federal consumer laws transferred to the jurisdiction of the CFPB and the rules issued by the CFPB thereunder. Recent changes in CFPB leadership have resulted in indications that the CFPB may be less aggressive in certain ways than under prior leadership. However, the impact of these changes on the regulation of the banking and financial services industry is still uncertain.
Dodd-Frank also directed the federal banking authorities to issue new capital requirements for banks and holding companies. See the discussion under “Regulatory Capital Standards” on pages
7 and 8
of this Report. Dodd-Frank also provided that any new issuances of trust preferred securities (TRUPs) by bank holding companies having between $500 million and $15 billion in assets (such as Arrow) will no longer be able to qualify as Tier 1 capital, although previously issued TRUPs of such bank holding companies that were outstanding on the Dodd-Frank grandfathering date (May 19, 2010), including the $20 million of TRUPs issued by Arrow before that date, will continue to qualify as Tier 1 capital until maturity or earlier redemption, subject to certain limitations. The new bank Capital Rules, in their final form, preserve this "grandfathered" status of TRUPs previously issued by small- to mid-sized financial institutions like Arrow before the grandfathering date. Generally, however, TRUPs, which were an important financing tool for community banks such as ours, can no longer be counted on as a viable source of new capital for banks, unless the U.S. Congress passes legislation that specifically accords regulatory capital status to newly-issued TRUPs.
Bank regulators have not finished promulgating all the rules required to be issued by them under Dodd-Frank. To date, implementation of Dodd-Frank provisions has resulted in many new mandatory and discretionary rule-makings by regulatory authorities, a process that is still not completed, almost eight years after Dodd-Frank's enactment. As a result, bank holding companies and their bank and non-bank operating subsidiaries have faced thousands of pages of new regulations and associated regulatory burdens still being formulated, several of which are highly controversial and the implementation of which has proven to be very costly and time consuming.
Various legislative proposals have been advanced for consideration or possible consideration by the U.S. Congress that would rescind or substantially modify certain provisions of Dodd-Frank, including potential modifications to the Capital Rules. At present, we are not able to estimate the likelihood of adoption of any such provisions or the potential impact thereof if adopted.
Sarbanes-Oxley Act
The Sarbanes-Oxley Act of 2002 implemented a broad range of corporate governance, accounting and reporting requirements for companies that have securities registered under the Exchange Act. These requirements included: (1) requirements for audit committees, including independence and financial expertise; (2) certification of financial statements by the chief executive officer and chief financial officer of the reporting company; (3) standards for auditors and regulation of audits; (4) disclosure and reporting requirements for the reporting company and directors and executive officers; and (5) a range of civil and criminal penalties for fraud and other violations of securities laws.
The USA Patriot Act
The USA Patriot Act initially adopted in 2001 and re-adopted by the U.S. Congress in 2006 with certain changes (the "Patriot Act"), imposes substantial record-keeping and due diligence obligations on banks and other financial institutions, with a particular focus on detecting and reporting money-laundering transactions involving domestic or international customers. The U.S. Treasury Department has issued and will continue to issue regulations clarifying the Patriot Act's requirements. The Patriot Act requires all financial institutions, including banks, to maintain certain anti-money laundering compliance, customer identification and due diligence programs. The provisions of the Patriot Act impose substantial costs on all financial institutions.
Incentive Compensation
Dodd-Frank required the federal bank regulatory agencies and the SEC to establish joint regulations or guidelines prohibiting incentive-based payment arrangements at specified regulated entities, such as the Company, having at least $1 billion in total assets that encourage inappropriate risks by providing an executive officer, employee, director or principal shareholder with excessive compensation, fees, or benefits or that could lead to material financial loss to the entity. In addition, these regulators must establish regulations or guidelines requiring enhanced disclosure to regulators of incentive-based compensation arrangements.
#
10
The federal bank regulators issued proposed rules to address incentive-based compensation arrangements in June 2016. Final rules have not yet been issued by the federal bank regulatory agencies under this Dodd-Frank provision.
In 2010, the FRB, OCC and FDIC issued comprehensive final guidance on incentive compensation policies intended to ensure that the incentive compensation policies of banking organizations do not undermine the safety and soundness of such organizations by encouraging excessive risk-taking. The guidance, which covers all employees that have the ability to materially affect the risk profile of an organization, either individually or as part of a group, is based upon the key principles that a banking organization’s incentive compensation arrangements should (i) provide incentives that do not encourage risk-taking beyond the organization’s ability to effectively identify and manage risks, (ii) be compatible with effective internal controls and risk management, and (iii) be supported by strong corporate governance, including active and effective oversight by the organization’s board of directors. Management believes the current and past compensation practices of the Company do not encourage excessive risk taking or undermine the safety and soundness of the organization.
The FRB will review, as part of the regular, risk-focused examination process, the incentive compensation arrangements of banking organizations, such as the Company, that are not “large, complex banking organizations.” These reviews will be tailored to each organization based on the scope and complexity of the organization’s activities and the prevalence of incentive compensation arrangements. The findings of the supervisory initiatives will be included in reports of examination. Deficiencies will be incorporated into the organization’s supervisory ratings, which can affect the organization’s ability to make acquisitions and take other actions. Enforcement actions may be taken against a banking organization if its incentive compensation arrangements, or related risk-management control or governance processes, pose a risk to the organization’s safety and soundness and the organization is not taking prompt and effective measures to correct the deficiencies.
Deposit Insurance Laws and Regulations
In February 2011, the FDIC finalized a new assessment system that took effect in the second quarter of 2011. The final rule changed the assessment base from domestic deposits to average assets minus average tangible equity, adopted a new large-bank pricing assessment scheme, and set a target size for the Deposit Insurance Fund. The changes went into effect in the second quarter of 2011. The rule (as mandated by Dodd-Frank) finalizes a target size for the Deposit Insurance Fund Reserve Ratio at 2% of insured deposits. It also implements a lower assessment rate schedule when the ratio reaches 1.15% (so that the average rate over time should be about 8.5 basis points) and, in lieu of dividends, provides for a lower rate schedule when the reserve ratio reaches 2% and 2.5%. Also as mandated by Dodd-Frank, the rule changes the assessment base from adjusted domestic deposits to a bank
'
s average consolidated total assets minus average tangible equity.
In August 2016, the FDIC announced that the reserve ratio reached 1.17% at the end of June, 2016. This represents the highest level the ratio has reached in more than eight years. The reduction in assessment rates went into effect in the third quarter of 2016. We are unable to predict whether or to what extent the FDIC may elect to impose additional special assessments on insured institutions in upcoming years, if bank failures should once again become a significant problem.
D. RECENT LEGISLATIVE DEVELOPMENTS
Health Care Reform
Various proposals have been discussed for consideration that would substantially modify various health care laws. At present, we are not able to estimate the likelihood of adoption of any such provisions or the potential impact thereof if adopted.
The Tax Cuts and Jobs Act of 2017 ("Tax Act")
On December 22, 2017, Tax Act was enacted. A number of provisions will impact us including the following:
Tax Rate. The Tax Act replaces the graduated corporate tax rates applicable under prior law, which imposed a maximum tax rate of 35%, with a reduced 21% flat tax rate. This reduction will generally result in future increased earnings and capital as well as reducing our net deferred tax liability. Generally accepted accounting principles ("GAAP") requires that the impact of the provisions of the Tax Act be accounted for in the period of enactment. Accordingly, a benefit of $1.1 million was recorded in the fourth quarter of 2017 which represents the impact of the re-measurement of net deferred tax liabilities.
Employee Compensation. A publicly held corporation is not permitted to deduct compensation in excess of $1 million per year paid to certain employees. The Tax Act eliminates certain exceptions to the $1 million limit applicable under prior law related to performance-based compensation, such as equity grants and cash bonuses that are paid only on the attainment of performance goals. Based on our current compensation plans, we do not expect to be impacted by this limitation.
Business Asset Expensing. The Tax Act allows taxpayers to immediately expense the entire cost of certain depreciable tangible property and real property improvements acquired and placed in service after September 27, 2017 and before January 1, 2023 (with an additional year for certain property.) This 100% bonus depreciation is phased out proportionately for property placed in service on or after January 1, 2023 and before January 1, 2027 (with an additional year for certain property).
Interest Expense. The Tax Act limits a taxpayer's annual deduction of business interest expense to the sum of (i) business interest income and (ii) 30% of "adjusted taxable income," defined as business's taxable income without taking into account business interest income or expense, net operating losses, and, for 2018 through 2021, depreciation, amortization and depletion. Because we generate significant amounts of net interest income, we do not expect to be impacted by this limitation.
#
11
The foregoing description of the impact of the Tax Act on us should be read in conjunction with Note 15, Income Taxes, of the notes to our Consolidated Financial Statements.
Other Legislative Initiatives
From time to time, various legislative and regulatory initiatives are introduced in Congress and state legislatures, as well as by regulatory authorities. These initiatives may include proposals to expand or contract the powers of bank holding companies and depository institutions or proposals to change the financial institution regulatory environment. Such legislation could change banking laws and the operating environment of our Company in substantial, but unpredictable ways. We cannot predict whether any such legislation will be enacted, and, if enacted, the effect that it, or any implementing regulations would have on our financial condition or results of operations.
E. STATISTICAL DISCLOSURE
–
(GUIDE 3)
Set forth below is an index identifying the location in this Report of various items of statistical information required to be included in this Report by the SEC
’
s industry guide for Bank Holding Companies.
|
Required Information
|
Location in Report
|
|
Distribution of Assets, Liabilities and Stockholders' Equity; Interest Rates and Interest Differential
|
|
|
Investment Portfolio
|
|
|
Loan Portfolio
|
|
|
Summary of Loan Loss Experience
|
|
|
Deposits
|
|
|
Return on Equity and Assets
|
|
|
Short-Term Borrowings
|
|
F. COMPETITION
We face intense competition in all markets we serve. Competitors include traditional local commercial banks, savings banks and credit unions, non-traditional internet-based lending alternatives, as well as local offices of major regional and money center banks. Like all banks, we encounter strong competition in the mortgage lending space from a wide variety of other mortgage originators, all of whom are principally affected in this business by the rate and terms set, and the lending practices established from time-to-time by the very large government sponsored enterprises ("GSEs") engaged in residential mortgage lending, most importantly, “Fannie Mae” and “Freddie Mac.” For many years, these GSEs have purchased and/or guaranteed a very substantial percentage of all newly-originated mortgage loans in the U.S., and in recent years, a large majority of such originations. Additionally, non-banking financial organizations, such as consumer finance companies, insurance companies, securities firms, money market funds, mutual funds, credit card companies, wealth management enterprises, and Fintech companies offer substantive equivalents of the various other types of loan and financial products and services and transactional accounts that we offer, even though these non-banking organizations are not subject to the same regulatory restrictions and capital requirements that apply to us. Under federal banking laws, such non-banking financial organizations not only may offer products and services comparable to those offered by commercial banks, but also may establish or acquire their own commercial banks.
#
12
G. EXECUTIVE OFFICERS OF THE REGISTRANT
The names and ages of the executive officers of Arrow and positions held by each are presented in the following table. Officers are elected annually by the Board of Directors.
|
Name
|
Age
|
Positions Held and Years from Which Held
|
|
Thomas J. Murphy
|
59
|
President and Chief Executive Officer of Arrow since January 1, 2013. Mr. Murphy has been a Director of Arrow since July 2012. In addition to his executive leadership role at Arrow, he has been the President of GFNB since July 1, 2011 and Chief Executive Officer of GFNB since January 1, 2013. Prior positions in the Company include: Senior Executive Vice President of Arrow (2011-2012), Vice President of Arrow (2009-2011), Senior Trust Officer of GFNB (2010-2011), Corporate Secretary (2009-2012), Assistant Corporate Secretary of Arrow (2008-2009), Senior Vice President of GFNB (2008-2011) and Manager of the Personal Trust Department of GFNB (2004-2011). Mr. Murphy started with the Company in 2004.
|
|
Edward J. Campanella
|
50
|
Senior Vice President, Treasurer and Chief Financial Officer of Arrow since September 5, 2017. Mr. Campanella also serves as Executive Vice President, Treasurer and Chief Financial Officer for GFNB. Mr. Campanella joined the Company in 2017. Previously, he served as Chief Financial Officer for National Union Bank of Kinderhook in Kinderhook, NY (2016-2017). He was Senior Vice President, Treasurer and Director of Finance at Opus Bank in Irvine, CA (2013-2016). Prior to that he served as First Vice President and Treasurer of Cambridge Savings Bank in Cambridge, MA (2006-2013).
|
|
David S. DeMarco
|
56
|
Senior Vice President and Chief Banking Officer of Arrow since February 1, 2018. Mr. DeMarco has been a Senior Vice President of Arrow since May 1, 2009. Additionally, Mr. DeMarco has been President and Chief Executive Officer of SNB since January 1, 2013. He is also Executive Vice President and Chief Banking Officer of GFNB. Previously, Mr. DeMarco served as Executive Vice President and Head of the Branch, Corporate Development, Financial Services & Marketing Division of GFNB (2003-2012). Mr. DeMarco started with the Company as a commercial lender in 1987.
|
|
David D. Kaiser
|
57
|
Senior Vice President of Arrow since February 1, 2015. Mr. Kaiser has also served as Executive Vice President of GFNB since 2012 and as Chief Credit Officer of GFNB since 2011. Previously, he served as the Corporate Banking Manager for GFNB from 2005 to 2011. Mr. Kaiser started with the Company in 2000.
|
|
Andrew J. Wise
|
51
|
Senior Vice President and Chief Operating Officer of Arrow Financial Corporation since February 1, 2018. Mr. Wise has also served as Executive Vice President and Chief Operating Officer of GFNB since October 2017. Previously, Mr. Wise served as Chief Administrative Officer of GFNB. He joined GFNB in May 2016 as Senior Vice President of Administration. Prior to that, he worked at Adirondack Trust Company for 12 years where he was Executive Vice President and Chief Operating Officer of the company’s insurance subsidiary.
|
H. AVAILABLE INFORMATION
Our Internet address is
www.arrowfinancial.com
. We make available, free of charge on or through our internet website, our annual report on Form 10-K, quarterly reports on Form 10-Q, current reports on Form 8-K, and amendments to those reports as soon as practicable after we file or furnish them with the SEC pursuant to the Exchange Act. We also make available on our website various other documents related to corporate operations, including our Corporate Governance Guidelines, the charters of our principal board committees, and our codes of ethics. We have adopted a financial code of ethics that applies to Arrow
’
s chief executive officer, chief financial officer and principal accounting officer and a business code of ethics that applies to all directors, officers and employees of our holding company and its subsidiaries.
#
13
Item 1A.
Risk Factors
Our financial results and the market price of our stock are subject to risks arising from many factors, including the risks listed below, as well as other risks and uncertainties. Any of these risks could materially and adversely affect our business, financial condition or results of operations. (Please note that the discussion below regarding the potential impact on Arrow of certain of these factors that may develop in the future is not meant to provide predictions by Arrow's management that such factors will develop, but to acknowledge the possible negative consequences to our Company and business if certain conditions materialize.)
Market conditions could present significant challenges to the U.S. commercial banking industry and its core business of making and servicing loans and any substantial downturn in the regional markets in which we operate or in the U.S. economy generally could adversely affect our ability to maintain steady growth in our loan portfolio and our earnings.
Our business is highly dependent on the business environment in the markets in which we operate as well as the United States as a whole. Our business is dependent upon the financial stability of our borrowers, including their ability to pay interest on and repay the principal amount of outstanding loans, the value of the collateral securing those loans, and the overall demand for loans and our other products and services, all of which impact our stability and future growth. Although our market area has experienced a stabilizing of economic conditions in recent years and even periods of modest growth, if unpredictable or unfavorable economic conditions unique to our market area should occur in upcoming periods, these conditions will likely have an adverse effect on the quality of our loan portfolio and financial performance. As a community bank, we are less able than our larger regional competitors to spread the risk of unfavorable local economic conditions over a larger market area. Further, if the overall U.S. economy deteriorates, then our business, results of operations, financial condition and prospects could be adversely affected. In particular, our financial performance may be adversely affected by short-term and long-term interest rates, the prevailing yield curve, inflation, monetary supply, fluctuations in the debt and equity capital markets, and the strength of the domestic economy and the local economies in the markets in which we operate, all of which are beyond our control.
We are subject to interest rate risk, which could adversely affect our profitability.
Our profitability, like that of most financial institutions, depends to a large extent on our net interest income, which is the difference between our interest income on interest-earning assets, such as loans and investment securities, and our interest expense on interest-bearing liabilities, such as deposits and borrowings. Changes in monetary policy, including changes in interest rates, could influence not only the interest we receive on loans and securities and the amount of interest we pay on deposits and borrowings, but also (1) our ability to originate loans and obtain deposits, (2) the fair value of our financial assets and liabilities, and (3) the average duration of our mortgage-backed securities portfolio. If the interest rates we pay on deposits and other borrowings increase at a faster rate than the interest rates received on loans, securities and other interest-earning investments, our net interest income, and therefore our earnings, could be adversely affected. Earnings could also be adversely affected if the interest rates received on loans and other investments fall more quickly than the interest rates paid on deposits and other borrowings. Changes in interest rates, whether they are increases or decreases, can also trigger repricing and changes in the pace of payments for both assets and liabilities.
In addition, an increase in interest rates could have a negative impact on our results of operations by reducing the ability of borrowers to repay their current loan obligations. These circumstances could not only result in increased loan defaults, foreclosures and charge-offs, but also necessitate further increases to the allowance for loan losses which may materially and adversely affect our business, results of operations, financial condition and prospects.
Capital and liquidity standards require banks and bank holding companies to maintain more and higher quality capital and greater liquidity than has historically been the case.
Capital standards, particularly those adopted as a result of Dodd-Frank, continue to have a significant effect on banks and bank holding companies, including Arrow. Certain of the remedial measures contained in Dodd-Frank, and the regulations promulgated thereunder, may be reconsidered at the federal legislative and regulatory levels as a result of the political environment and developments. Certain legislation being considered proposes changes to the revised and enhanced regulatory capital standards mandated by Dodd-Frank. However, the likelihood of such potential changes becoming law and any potential impact of such changes on Arrow is uncertain. Thus, the enhanced bank capital standards promulgated under Dodd-Frank will remain in effect (absent such changes), requiring bank holding companies and their bank subsidiaries to maintain substantially higher levels of capital as a percentage of their assets, with a greater emphasis on common equity as opposed to other components of capital. The need to maintain more and higher quality capital, as well as greater liquidity, and generally increased regulatory scrutiny with respect to capital levels, may at some point limit our business activities, including lending, and our ability to expand. It could also result in our being required to take steps to increase our regulatory capital and may dilute shareholder value or limit our ability to pay dividends or otherwise return capital to our investors through stock repurchases.
Any future economic or financial downturn, including any significant correction in the equity markets, may negatively affect the volume of income attributable to, and demand for, fee-based services of banks such as ours, including our fiduciary business, which could negatively impact our financial condition and results of operation.
Revenues from our trust and wealth management business are dependent on the level of assets under management. Any significant downturn in the equity markets may lead our trust and wealth management customers to liquidate their investments, or may diminish account values for those customers who elect to leave their portfolios with us, in either case reducing our assets under management and thereby decreasing our revenues from this important sector of our business. Our other fee-based businesses are also susceptible to a sudden economic or financial downturn.
In addition, our loan quality is affected by the condition of the economy. Like all financial institutions, we maintain an allowance for loan losses to provide for probable loan losses at the balance sheet date. Our allowance for loan losses is based on our historical loss experience as well as an evaluation of the risks associated with our loan portfolio, including the size and composition of the
#
14
portfolio, current economic conditions and geographic concentrations within the portfolio and other factors. While we have continued to enjoy a very high level of quality in our loan portfolio generally and very low levels of loan charge-offs and non-performing loans, if the economy in our geographic market area should deteriorate to the point that recessionary conditions return, or if the regional or national economy experiences a protracted period of stagnation, the quality of our loan portfolio may weaken so significantly that our allowance for loan losses may not be adequate to cover actual or expected loan losses. In such events, we may be required to increase our provisions for loan losses could materially and adversely affect financial results. Moreover, weak or worsening economic conditions often lead to difficulties in other areas of our business, including growth of our business generally, thereby compounding the negative effects on earnings.
We face continuing and growing security risks to our information base including the information we maintain relating to our customers, and any breaches in the security systems we have implemented to protect this information could have a material negative effect on our business operations and financial condition.
In the ordinary course of business, Arrow relies on electronic communications and information systems to conduct our operations and to store sensitive data. Arrow employs an in-depth, layered, defensive approach that leverages people, processes and technology to manage and maintain cybersecurity controls. Arrow employs a variety of preventative and detective tools to monitor, block, and provide alerts regarding suspicious activity, as well as to report on any suspected advanced persistent threats. We have implemented and regularly review and update extensive systems of internal controls and procedures as well as corporate governance policies and procedures intended to protect our business operations, including the security and privacy of all confidential customer information. In addition, we rely on the services of a variety of vendors to meet our data processing and communication needs. No matter how well designed or implemented our controls are, we cannot provide an absolute guarantee to protect our business operations from every type of cybersecurity or other security problem in every situation. A failure or circumvention of these controls could have a material adverse effect on our business operations and financial condition. Notwithstanding the strength of our defensive measures, the threat from cyber attacks is severe, attacks are sophisticated and increasing in volume, and attackers respond rapidly to changes in defensive measures. While to date, Arrow has not experienced a significant compromise, significant data loss or any material financial losses related to cybersecurity attacks, our systems and those of our customers and third-party service providers are under constant threat. Risks and exposures related to cybersecurity attacks are expected to remain high for the foreseeable future due to the rapidly evolving nature and sophistication of these threats, as well as due to the expanding use of Internet banking, mobile banking and other technology-based products and services by us and our customers.
The computer systems and network infrastructure that we use are always vulnerable to unforeseen disruptions, including theft of confidential customer information (“identity theft”) and interruption of service as a result of fire, natural disasters, explosion, general infrastructure failure or cyber attacks. These disruptions may arise in our internally developed systems, or the systems of our third-party service providers or may originate from the actions of our consumer and business customers who access our systems from their own networks or digital devices to process transactions. Information security and cyber security risks have increased significantly in recent years because of consumer demand to use the Internet and other electronic delivery channels to conduct financial transactions. Cybersecurity risk is a major concern to financial services regulators and all financial service providers, including our company. These risks are further exacerbated due to the increased sophistication and activities of organized crime, hackers, terrorists and other disreputable parties. We regularly assess and test our security systems and disaster preparedness, including back-up systems, but the risks are substantially escalating. As a result, cybersecurity and the continued enhancement of our controls and processes to protect our systems, data and networks from attacks or unauthorized access remain a priority. Accordingly, we may be required to expend additional resources to enhance our protective measures or to investigate and remediate any information security vulnerabilities or exposures. Any breach of our system security could result in disruption of our operations, unauthorized access to confidential customer information, significant regulatory costs, litigation exposure and other possible damages, loss or liability. Such costs or losses could exceed the amount of available insurance coverage, if any, and would adversely affect our earnings. Also, any failure to prevent a security breach or to quickly and effectively deal with such a breach could negatively impact customer confidence, damaging our reputation and undermining our ability to attract and keep customers. In addition, if we fail to observe any of the cybersecurity requirements in federal or state laws, regulations or regulatory guidance, we could be subject to various sanctions, including financial penalties.
The Company relies on the operations of our banking subsidiaries to provide liquidity which, if limited, could impact our ability to pay dividends to our shareholders or to repurchase our common stock.
We are a bank holding company, a separate legal entity from our subsidiaries. Our bank holding company does not have significant operations of its own. The ability of our subsidiaries, including our bank and insurance subsidiaries, to pay dividends is limited by various statutes and regulations. It is possible, depending upon the financial condition of our subsidiaries and other factors, that our subsidiaries might be restricted at some point in their ability to pay dividends to the holding company, including by a bank regulator asserting that the payment of such dividends or other payments would constitute an unsafe or unsound practice. In addition, under Dodd-Frank, we are subject to consolidated capital requirements at the holding company level. If our holding company or its bank subsidiaries are required to retain or increase capital, we may not be able to maintain our cash dividends or pay dividends at all, or to repurchase shares of our common stock.
#
15
Changes in federal, state or local tax laws may negatively impact our financial performance.
As in the case of the Tax Act, we are subject to changes in tax law that could impact our effective tax rates. These law changes may be retroactive to previous periods and as a result could negatively affect our current and future financial performance. Similarly, the bank's customers are likely to experience varying effects from both the individual and business tax provisions of changes in tax law and such effects, whether positive or negative, may have a corresponding impact on our business and the economy as a whole.
Changes in accounting standards may materially and negatively impact our financial statements.
From time-to-time, the Financial Accounting Standards Board (“FASB”) changes the financial accounting and reporting standards that govern the preparation of our financial statements. These changes can be hard to predict and can materially impact how we record and report our financial condition and results of operations. In some cases, we may be required to apply a new or revised standard retroactively, resulting in changes to previously reported financial statements. Specifically, changes in the fair value of our financial assets could have a significant negative impact on our asset portfolios and indirectly on our capital levels.
We rely on other companies to provide key components of our business infrastructure.
Third-party vendors provide key components of our business infrastructure such as Internet connections, network access and mutual fund distribution. The financial health and operational capabilities of these third parties are for the most part beyond our control, and any problems experienced by these third parties, such that they may not be able to continue to provide services to us or to perform such services consistent with our expectations, could adversely affect our ability to deliver products and services to our customers and to conduct our business.
We operate in a highly competitive industry and market areas that could negatively affect our growth and profitability.
Competition for commercial banking and other financial services is fierce in our market areas. In one or more aspects of business, our subsidiaries compete with other commercial banks, savings and loan associations, credit unions, finance companies, Internet-based financial services companies, mutual funds, insurance companies, brokerage and investment banking companies, and other financial intermediaries. Additionally, due to their size and other factors, many competitors may be able to achieve economies of scale and, as a result, may offer a broader range of products and services, as well as better pricing for those products and services, than we can. Technology has lowered barriers to entry and made it possible for non-banks to offer products and services traditionally provided by banks, such as automatic transfer and automatic payment systems. In addition, many of our competitors are not subject to the same extensive Federal regulations that govern bank holding companies and Federally insured banks. Failure to offer competitive services in our market areas could significantly weaken our market position, adversely affecting our growth, which, in turn, could have a material adverse effect on our financial condition and results of operations.
If economic conditions worsen and the U.S. financial markets should suffer a downturn, we may experience limited access to credit markets.
As discussed under Part I, Item 7.D. “Liquidity,” we maintain borrowing relationships with various third parties that enable us to obtain from them, on relatively short notice, overnight and longer-term funds sufficient to enable us to fulfill our obligations to customers, including deposit withdrawals. If, in the context of a downturn in the U.S. economy or financial markets, these third parties should encounter difficulty in accessing their own credit markets, we may, in turn, experience a decrease in our capacity to borrow funds from them or other third parties traditionally relied upon by banks for liquidity.
Rulemaking under Dodd-Frank could change in the future; these and other regulations being promulgated may adversely affect our Company and certain players in the financial industry as a whole.
We are subject to extensive Federal and state banking regulations and supervision. Banking laws and regulations are intended primarily to protect bank depositors’ funds (and indirectly the Federal deposit insurance funds) as well as bank retail customers, who may lack the sophistication to understand or appreciate bank products and services. These laws and regulations generally are not, however, aimed at protecting or enhancing the returns on investment enjoyed by bank shareholders.
Our depositor/customer awareness of the changing regulatory environment is particularly true of the set of laws and regulations under Dodd-Frank, which were passed in the aftermath of the 2008-2009 financial crisis and in large part were intended to better protect bank customers (and to some degree, banks) against a wide variety of lending products and aggressive lending practices that pre-dated the crisis and are seen as having contributed to its severity. Although not all banks offered such products or engaged in such practices, all banks are affected by these laws and regulations to some degree.
Dodd-Frank restricts our lending practices, requires us to expend substantial additional resources to safeguard customers, significantly increases our regulatory burden, and subjects us to significantly higher minimum capital requirements which, in the long run, may serve as a drag on our earnings, growth and ultimately on our dividends and stock price (the new capital standards are separately addressed in a previous risk factor).
#
16
Our business could suffer if we lose key personnel unexpectedly or if employee wages increase significantly.
Our success depends, in large part, on our ability to retain our key personnel for the duration of their expected terms of service. On an ongoing basis, we prepare and review back-up plans, in the event key personnel are unexpectedly rendered incapable of performing or depart or resign from their positions. However, any sudden unexpected change at the senior management level may adversely affect our business. In addition, should our industry begin to experience a shortage of qualified employees, we like other financial institutions may have difficulty attracting and retaining entry level or higher bracket personnel and also may experience, as a result of such shortages or the enactment of higher minimum wage laws locally or nationwide, increased salary expense, which would likely negatively impact our results of operations.
Problems encountered by other financial institutions could adversely affect us.
Our ability to engage in routine funding transactions could be adversely affected by financial or commercial problems confronting other financial institutions. Financial services institutions are interrelated as a result of trading, clearing, counterparty and other relationships. We have exposure to many different counterparties in the normal course of our business, and we routinely execute transactions with counterparties in the financial services industry, including brokers and dealers, other commercial banks, investment banks, mutual and hedge funds, and other financial institutions. As a result, defaults by, or even rumors or questions about, one or more financial services institutions, or the financial services industry generally, could lead to market-wide liquidity problems and losses or defaults by us or by other financial institutions on whom we rely or with whom we interact. Some of these transactions expose us to credit and other potential risks in the event of default of our counterparty or client. In addition, credit risk may be exacerbated when the collateral held by us cannot be liquidated or only may be liquidated at prices not sufficient to recover the full amount due us under the underlying financial instrument, held by us. There is no assurance that any such losses would not materially and adversely affect our results of operations.
Our industry is faced with technological advances and changes on a continuing basis, and failure to adapt to these advances and changes could have a material adverse impact on our business.
Technological advances and changes in the financial services industry are pervasive and constant. The retail financial services sector, like many other retail goods and services sectors, is constantly evolving, involving new delivery and communications systems and technologies that are extraordinarily far-reaching and impactful. For us to remain competitive, we must comprehend and adapt to these systems and technologies . Proper implementation of new technologies can increase efficiency, decrease costs and help to meet customer demand. However, many of our competitors have greater resources to invest in technological advances and changes. We may not always be successful in utilizing the latest technological advances in offering our products and services or in otherwise conducting our business. Failure to identify, consider, adapt to and implement technological advances and changes could have a material adverse effect on our business.
|
Item 1B.
|
Unresolved Staff Comments
- None
|
Item 2.
Properties
Our main office is at 250 Glen Street, Glens Falls, New York. The building is owned by us and serves as the main office for Arrow and Glens Falls National, our principal subsidiary bank. The main office of our other banking subsidiary, Saratoga National, is in Saratoga Springs, New York. We own twenty-nine branch banking offices, lease eleven branch banking offices and lease two residential loan origination offices, all at market rates. Our insurance agencies are co-located in eight bank-owned branches, as well as three leased insurance branches and two owned stand-alone buildings. We also lease office space in buildings and parking lots near our main office in Glens Falls as well as a back-up site for business continuity purposes.
In the opinion of management, the physical properties of our holding company and our various subsidiaries are suitable and adequate. For more information on our properties, see Notes 2,
Summary of Significant Accounting Policies
, 6,
Premises and Equipment
, and 18,
Leases
, in the notes to our Consolidated Financial Statements contained in Part II, Item 8 of this Report.
Item 3.
Legal Proceedings
We are not the subject of any material pending legal proceedings, other than ordinary routine litigation occurring in the normal course of our business. On an ongoing basis, we typically are the subject of or a party to various legal claims, which arise in the normal course of our business. Although the outcome of the lawsuits or other proceedings cannot be predicated with certainty and the amount of any liability that may arise therefrom cannot be predicted accurately, in the opinion of management based upon consultation with counsel, the various legal claims currently pending against us will not result in a material adverse effect to our financial condition.
Item 4.
Mine Safety Disclosures
- None
#
17
Item 5.
Market for the Registrant's Common Equity,
Related Stockholder Matters and Issuer Purchases of Equity Securities
Our common stock is traded on the Global Select Market of the National Association of Securities Dealers, Inc. ("NASDAQ
®
")Stock Market under the symbol AROW.
The high and low prices listed below represent actual sales transactions, as reported by NASDAQ
®
. All stock prices and cash dividends per share have been restated to reflect subsequent stock dividends. On
September 28, 2017
, we distributed a
3
% stock dividend on our outstanding shares of common stock.
|
2017
|
2016
|
||||||||||||||||||
|
Market Price
|
Cash Dividends Declared
|
Market Price
|
Cash Dividends Declared
|
||||||||||||||||
|
Low
|
High
|
Low
|
High
|
||||||||||||||||
|
First Quarter
|
$
|
31.80
|
|
$
|
39.76
|
|
$
|
0.243
|
|
$23.13
|
$25.96
|
$
|
0.236
|
|
|||||
|
Second Quarter
|
30.15
|
|
34.95
|
|
0.243
|
|
24.42
|
28.65
|
0.236
|
||||||||||
|
Third Quarter
|
29.81
|
|
35.00
|
|
0.243
|
|
27.79
|
33.08
|
0.236
|
||||||||||
|
Fourth Quarter
|
33.50
|
|
38.60
|
|
0.250
|
|
29.67
|
40.49
|
0.243
|
|
|||||||||
The payment of cash dividends by Arrow is determined at the discretion of our Board of Directors and is dependent upon, among other things, our earnings, financial condition and other factors, including applicable legal and regulatory restrictions. See "Capital Resources and Dividends" in Part II, Item 7.E. of this Report.
Based on information received from our transfer agent and various brokers, custodians and agents, we estimate there were approximately
7,000
beneficial owners
of Arrow
’
s common stock at
December 31, 2017
. Arrow has no other class of stock outstanding.
Equity Compensation Plan Information
The following table sets forth certain information regarding Arrow's equity compensation plans as of
December 31, 2017
. These equity compensation plans were (i) our 2013 Long-Term Incentive Plan ("LTIP"), and its predecessors, our 2008 Long-Term Incentive Plan and our 1998 Long-Term Incentive Plan; (ii) our 2014 Employee Stock Purchase Plan ("ESPP"); and (iii) our 2013 Directors' Stock Plan ("DSP"). All of these plans have been approved by Arrow's shareholders.
|
Plan Category
|
(a)
Number of Securities to be Issued Upon Exercise of Outstanding Options, Warrants and Rights
|
(b)
Weighted-Average
Exercise Price of Outstanding Options, Warrants and Rights
|
(c)
Number of Securities Remaining Available for Future Issuance Under Equity Compensation Plans (Excluding Securities Reflected in Column (a)
|
||||||
|
Equity Compensation Plans Approved by Security Holders
(1)(2)
|
346,155
|
|
$
|
24.12
|
|
465,737
|
|
||
|
Equity Compensation Plans Not Approved by Security Holders
|
—
|
|
—
|
|
|||||
|
Total
|
346,155
|
|
465,737
|
|
|||||
|
(1)
|
All
346,155
shares of common stock listed in column (a) are issuable pursuant to outstanding stock options granted under the LTIP or its predecessor plans.
|
|
(2)
|
The total of
465,737
shares listed in column (c) includes (i)
340,178
shares of common stock available for future award grants under the LTIP, (ii) 103,702 shares of common stock available for future issuance under the ESPP, and (iii) 21,857 shares of common stock available for future issuance under the DSP.
|
#
18
STOCK PERFORMANCE GRAPHS
The following two graphs provide a comparison of the total cumulative return (assuming reinvestment of dividends) for the common stock of Arrow as compared to the Russell 2000 Index, the NASDAQ Banks Index and the Zacks $1B-$5B Bank Assets Index.
The first graph presents comparative stock performance for the five-year period from December 31,
2012
to
December 31, 2017
and the second graph presents comparative stock performance for the fifteen-year period from December 31,
2002
to
December 31, 2017
.
The historical information in the graphs and accompanying tables may not be indicative of future performance of Arrow stock on the various stock indices.
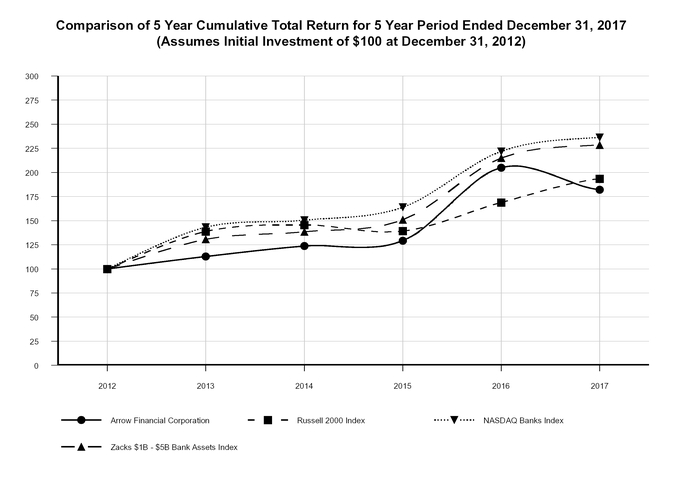
|
TOTAL RETURN PERFORMANCE
Period Ending
|
|||||||||||||||||
|
Index
|
2012
|
2013
|
2014
|
2015
|
2016
|
2017
|
|||||||||||
|
Arrow Financial Corporation
|
100.00
|
|
112.83
|
|
123.65
|
|
129.28
|
|
204.86
|
|
182.13
|
|
|||||
|
Russell 2000 Index
|
100.00
|
|
138.82
|
|
145.62
|
|
139.19
|
|
168.85
|
|
193.58
|
|
|||||
|
NASDAQ Banks Index
|
100.00
|
|
143.13
|
|
150.40
|
|
163.81
|
|
221.79
|
|
236.29
|
|
|||||
|
Zacks $1B - $5B Bank Assets Index
|
100.00
|
|
130.65
|
|
138.51
|
|
150.87
|
|
214.90
|
|
228.54
|
|
|||||
Source: Prepared by Zacks Investment Research, Inc. Used with permission. All rights reserved. Copyright 1980-2018.
#
19
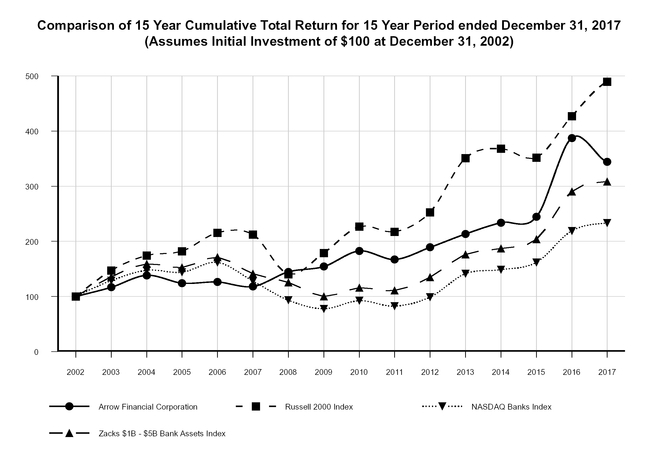
|
TOTAL RETURN PERFORMANCE
Period Ending |
|||||||||||||||||||||||
|
Index
|
2002
|
2003
|
2004
|
2005
|
2006
|
2007
|
2008
|
2009
|
|||||||||||||||
|
Arrow Financial
Corporation |
100.00
|
|
116.64
|
|
138.31
|
|
124.30
|
|
126.20
|
|
118.13
|
|
144.56
|
|
154.31
|
|
|||||||
|
Russell 2000 Index
|
100.00
|
|
147.25
|
|
174.40
|
|
182.27
|
|
215.75
|
|
212.37
|
|
140.62
|
|
178.82
|
|
|||||||
|
NASDAQ Banks
Index |
100.00
|
|
128.64
|
|
147.32
|
|
143.90
|
|
161.58
|
|
127.88
|
|
93.23
|
|
77.58
|
|
|||||||
|
Zacks $1B - $5B Bank
Assets Index |
100.00
|
|
135.63
|
|
158.83
|
|
152.55
|
|
171.18
|
|
141.30
|
|
125.61
|
|
100.29
|
|
|||||||
|
TOTAL RETURN PERFORMANCE (Cont'd.)
Period Ending |
|||||||||||||||||||||||
|
Index
|
2010
|
2011
|
2012
|
2013
|
2014
|
2015
|
2016
|
2017
|
|||||||||||||||
|
Arrow Financial
Corporation |
182.46
|
|
167.25
|
|
189.09
|
|
213.35
|
|
233.81
|
|
244.45
|
|
387.37
|
|
344.38
|
|
|||||||
|
Russell 2000 Index
|
226.85
|
|
217.37
|
|
252.91
|
|
351.10
|
|
368.29
|
|
352.03
|
|
427.04
|
|
489.59
|
|
|||||||
|
NASDAQ Banks
Index |
92.25
|
|
82.51
|
|
98.71
|
|
141.28
|
|
148.46
|
|
161.69
|
|
218.92
|
|
233.24
|
|
|||||||
|
Zacks $1B - $5B Bank
Assets Index |
115.98
|
|
110.87
|
|
134.99
|
|
176.37
|
|
186.98
|
|
203.66
|
|
290.10
|
|
308.52
|
|
|||||||
Source: Prepared by Zacks Investment Research, Inc. Used with permission. All rights reserved. Copyright 1980-2018.
The preceding stock performance graphs and tables shall not be deemed incorporated by reference, by virtue of any general statement contained herein or in any other filing incorporated by reference herein, into any other SEC filing by the Company under the Securities Act of 1933, as amended, or the Securities Exchange Act of 1934, as amended, except to the extent the Company specifically incorporates this information by reference into such filing, and shall not otherwise be deemed filed as part of any such other filing.
#
20
Unregistered Sales of Equity Securities
None.
Issuer Purchases of Equity Securities
The following table presents information about repurchases by Arrow during the three months ended
December 31, 2017
of our common stock (our only class of equity securities registered pursuant to Section 12 of the Securities Exchange Act of 1934):
|
Fourth Quarter 2017
Calendar Month
|
(a) Total Number of
Shares Purchased
1
|
(b) Average Price Paid Per Share
1
|
(c) Total Number of
Shares Purchased as
Part of Publicly
Announced
Plans or Programs
2
|
(d) Maximum
Approximate Dollar
Value of Shares that
May Yet be
Purchased Under the
Plans or Programs
2
|
|||||||||
|
October
|
4,918
|
|
$
|
35.29
|
|
—
|
|
$
|
2,856,516
|
|
|||
|
November
|
6,225
|
|
36.20
|
|
—
|
|
2,856,516
|
|
|||||
|
December
|
17,483
|
|
35.63
|
|
5,000
|
|
2,673,016
|
|
|||||
|
Total
|
28,626
|
|
35.71
|
|
5,000
|
|
|||||||
1
The total number of shares purchased and the average price paid per share listed in columns (a) and (b) consist of (i) any shares purchased in such periods in open market or private transactions under the Arrow Financial Corporation Automatic Dividend Reinvestment Plan (the "DRIP") by the administrator of the DRIP, (ii) shares surrendered or deemed surrendered to Arrow in such periods by holders of options to acquire Arrow common stock received by them under Arrow's long-term incentive plans ("LTIPs") in connection with their stock-for-stock exercise of such options, and shares repurchased by Arrow pursuant to its publicly-announced stock repurchase program. In the months indicated, the listed number of shares purchased included the following numbers of shares purchased by Arrow through such methods: October - DRIP purchases (898 shares), stock-for-stock option exercises (4,020 shares); November
-
DRIP purchases (2,005 shares), stock-for-stock option exercises (4,220 shares); and December
-
DRIP purchases (12,483 shares), repurchase program (5,000 shares).
2
Includes only those shares acquired by Arrow pursuant to its publicly-announced stock repurchase programs. Our only publicly-announced stock repurchase program in effect for the fourth quarter of 2017 was the program approved by the Board of Directors and announced in October 2016, under which the Board authorized management, in its discretion, to repurchase from time to time during 2017, in the open market or in privately negotiated transactions, up to $5 million of Arrow common stock subject to certain exceptions (the "2017 Program"). Arrow repurchased 5,000 of its shares in the fourth quarter of 2017 under the 2017 Program. In October 2017, the Board authorized a repurchase program for 2018 similar to its 2017 program, which also authorizes management to repurchase up to $5 million of stock in the ensuing year (2018).
#
21
Item 6.
Selected Financial Data
FIVE YEAR SUMMARY OF SELECTED DATA
Arrow Financial Corporation and Subsidiaries
(Dollars In Thousands, Except Per Share Data)
|
|
2017
|
2016
|
2015
|
2014
|
2013
|
||||||||||||||
|
Interest and Dividend Income
|
$
|
84,657
|
|
$
|
76,915
|
|
$
|
70,738
|
|
$
|
66,861
|
|
$
|
64,138
|
|
||||
|
Interest Expense
|
7,006
|
|
5,356
|
|
4,813
|
|
5,767
|
|
7,922
|
|
|||||||||
|
Net Interest Income
|
77,651
|
|
71,559
|
|
65,925
|
|
61,094
|
|
56,216
|
|
|||||||||
|
Provision for Loan Losses
|
2,736
|
|
2,033
|
|
1,347
|
|
1,848
|
|
200
|
|
|||||||||
|
Net Interest Income After Provision
for Loan Losses
|
74,915
|
|
69,526
|
|
64,578
|
|
59,246
|
|
56,016
|
|
|||||||||
|
Noninterest Income
|
28,093
|
|
27,854
|
|
27,995
|
|
28,206
|
|
27,521
|
|
|||||||||
|
Net (Losses) Gains on Securities Transactions
|
(448
|
)
|
(22
|
)
|
129
|
|
110
|
|
540
|
|
|||||||||
|
Noninterest Expense
|
(62,705
|
)
|
(59,609
|
)
|
(57,430
|
)
|
(54,028
|
)
|
(53,203
|
)
|
|||||||||
|
Income Before Provision for Income Taxes
|
39,855
|
|
37,749
|
|
35,272
|
|
33,534
|
|
30,874
|
|
|||||||||
|
Provision for Income Taxes
|
10,529
|
|
11,215
|
|
10,610
|
|
10,174
|
|
9,079
|
|
|||||||||
|
Net Income
|
$
|
29,326
|
|
$
|
26,534
|
|
$
|
24,662
|
|
$
|
23,360
|
|
$
|
21,795
|
|
||||
|
Per Common Share:
1
|
|||||||||||||||||||
|
Basic Earnings
|
$
|
2.11
|
|
$
|
1.92
|
|
$
|
1.80
|
|
$
|
1.71
|
|
$
|
1.61
|
|
||||
|
Diluted Earnings
|
2.10
|
|
1.91
|
|
1.80
|
|
1.71
|
|
1.60
|
|
|||||||||
|
Per Common Share:
1
|
|||||||||||||||||||
|
Cash Dividends
|
$
|
0.98
|
|
$
|
0.95
|
|
$
|
0.93
|
|
$
|
0.91
|
|
$
|
0.89
|
|
||||
|
Book Value
|
17.92
|
|
17.27
|
|
16.05
|
|
15.16
|
|
14.50
|
|
|||||||||
|
Tangible Book Value
2
|
16.18
|
|
15.45
|
|
14.18
|
|
13.22
|
|
12.53
|
|
|||||||||
|
|
|||||||||||||||||||
|
Total Assets
|
$
|
2,760,465
|
|
$
|
2,605,242
|
|
$
|
2,446,188
|
|
$
|
2,217,420
|
|
$
|
2,163,698
|
|
||||
|
Securities Available-for-Sale
|
300,200
|
|
346,996
|
|
402,309
|
|
366,139
|
|
457,606
|
|
|||||||||
|
Securities Held-to-Maturity
|
335,907
|
|
345,427
|
|
320,611
|
|
302,024
|
|
299,261
|
|
|||||||||
|
Loans
|
1,950,770
|
|
1,753,268
|
|
1,573,952
|
|
1,413,268
|
|
1,266,472
|
|
|||||||||
|
Nonperforming Assets
3
|
7,797
|
|
7,186
|
|
8,924
|
|
8,162
|
|
7,916
|
|
|||||||||
|
Deposits
|
2,245,116
|
|
2,116,546
|
|
2,030,423
|
|
1,902,948
|
|
1,842,330
|
|
|||||||||
|
Federal Home Loan Bank Advances
|
160,000
|
|
178,000
|
|
137,000
|
|
51,000
|
|
73,000
|
|
|||||||||
|
Other Borrowed Funds
|
84,966
|
|
55,836
|
|
43,173
|
|
39,421
|
|
31,777
|
|
|||||||||
|
Stockholders
’
Equity
|
249,603
|
|
232,852
|
|
213,971
|
|
200,926
|
|
192,154
|
|
|||||||||
|
Selected Key Ratios:
|
|||||||||||||||||||
|
Return on Average Assets
|
1.09
|
%
|
1.06
|
%
|
1.05
|
%
|
1.07
|
%
|
1.04
|
%
|
|||||||||
|
Return on Average Equity
|
12.14
|
|
11.79
|
|
11.86
|
|
11.79
|
|
12.11
|
|
|||||||||
|
Dividend Payout Ratio
4
|
46.67
|
|
49.74
|
|
51.67
|
|
53.22
|
|
55.63
|
|
|||||||||
|
Average Equity to Average Assets
|
8.96
|
|
8.95
|
|
8.88
|
|
9.05
|
|
8.56
|
|
|||||||||
1
Share and per share amounts have been adjusted for subsequent stock splits and dividends, including the most recent
September 28, 2017
3
% stock dividend.
2
Tangible book value excludes goodwill and other intangible assets from total equity.
3
Nonperforming assets consist of nonaccrual loans, loans past due 90 or more days but still accruing interest, repossessed assets, restructured loans, other real estate owned and nonaccrual investments.
4
Dividend Payout Ratio – cash dividends per share to fully diluted earnings per share.
#
22
Item 7.
Management's Discussion and Analysis of Financial Condition and Results of Operations
|
Selected Quarterly Information
Dollars in thousands, except per share amounts
Share and per share amounts have been restated for the September 2017 3% stock dividend
|
|||||||||||||||||||
|
Quarter Ended
|
12/31/2017
|
|
9/30/2017
|
|
6/30/2017
|
|
3/31/2017
|
|
12/31/2016
|
|
|||||||||
|
Net Income
|
$
|
8,071
|
|
$
|
7,416
|
|
$
|
7,208
|
|
$
|
6,631
|
|
$
|
6,600
|
|
||||
|
Transactions Recorded in Net Income (Net of Tax):
|
|
|
|
|
|
||||||||||||||
|
Net (Loss) Gain on Securities Transactions
|
(281
|
)
|
6
|
|
—
|
|
—
|
|
(101
|
)
|
|||||||||
|
Tax Benefit from Net Deferred Tax Liability Revaluation
|
1,116
|
|
—
|
|
—
|
|
—
|
|
—
|
|
|||||||||
|
Period End Shares Outstanding
1
|
13,930
|
|
13,891
|
|
13,900
|
|
13,886
|
|
13,887
|
|
|||||||||
|
Basic Average Shares Outstanding
1
|
13,905
|
|
13,889
|
|
13,890
|
|
13,889
|
|
13,844
|
|
|||||||||
|
Diluted Average Shares Outstanding
1
|
14,006
|
|
13,966
|
|
13,975
|
|
14,001
|
|
13,972
|
|
|||||||||
|
Basic Earnings Per Share
1
|
$
|
0.58
|
|
$
|
0.53
|
|
$
|
0.52
|
|
$
|
0.48
|
|
$
|
0.48
|
|
||||
|
Diluted Earnings Per Share
1
|
0.58
|
|
0.53
|
|
0.52
|
|
0.47
|
|
0.47
|
|
|||||||||
|
Cash Dividend Per Share
1
|
0.250
|
|
0.243
|
|
0.243
|
|
0.243
|
|
0.243
|
|
|||||||||
|
Selected Quarterly Average Balances
:
|
|
|
|
|
|
|
|
|
|
|
|||||||||
|
Interest-Bearing Deposits at Banks
|
$
|
27,047
|
|
$
|
27,143
|
|
$
|
24,480
|
|
$
|
23,565
|
|
$
|
34,731
|
|
||||
|
Investment Securities
|
660,043
|
|
677,368
|
|
684,570
|
|
695,615
|
|
684,906
|
|
|||||||||
|
Loans
|
1,930,590
|
|
1,892,766
|
|
1,842,543
|
|
1,781,113
|
|
1,726,738
|
|
|||||||||
|
Deposits
|
2,284,206
|
|
2,193,778
|
|
2,206,365
|
|
2,161,798
|
|
2,160,156
|
|
|||||||||
|
Other Borrowed Funds
|
187,366
|
|
262,864
|
|
207,270
|
|
205,436
|
|
157,044
|
|
|||||||||
|
Shareholders’ Equity
|
247,253
|
|
243,801
|
|
239,396
|
|
235,257
|
|
230,198
|
|
|||||||||
|
Total Assets
|
2,744,180
|
|
2,725,653
|
|
2,677,843
|
|
2,626,470
|
|
2,572,425
|
|
|||||||||
|
Return on Average Assets
|
1.17
|
%
|
1.08
|
%
|
1.08
|
%
|
1.02
|
%
|
1.02
|
%
|
|||||||||
|
Return on Average Equity
|
12.95
|
%
|
12.07
|
%
|
12.08
|
%
|
11.43
|
%
|
11.41
|
%
|
|||||||||
|
Return on Average Tangible Equity
2
|
14.36
|
%
|
13.40
|
%
|
13.45
|
%
|
12.76
|
%
|
12.77
|
%
|
|||||||||
|
Average Earning Assets
|
$
|
2,617,680
|
|
$
|
2,597,277
|
|
$
|
2,551,593
|
|
$
|
2,500,293
|
|
$
|
2,446,375
|
|
||||
|
Average Paying Liabilities
|
2,029,811
|
|
2,012,802
|
|
2,005,421
|
|
1,977,628
|
|
1,933,974
|
|
|||||||||
|
Interest Income, Tax-Equivalent*
|
23,115
|
|
22,565
|
|
21,875
|
|
20,945
|
|
20,709
|
|
|||||||||
|
Interest Expense
|
1,821
|
|
1,949
|
|
1,699
|
|
1,536
|
|
1,404
|
|
|||||||||
|
Net Interest Income, Tax-Equivalent*
|
21,294
|
|
20,616
|
|
20,176
|
|
19,409
|
|
19,305
|
|
|||||||||
|
Tax-Equivalent Adjustment*
|
980
|
|
966
|
|
949
|
|
948
|
|
939
|
|
|||||||||
|
Net Interest Margin*
3
|
3.23
|
%
|
3.15
|
%
|
3.17
|
%
|
3.15
|
%
|
3.14
|
%
|
|||||||||
|
Efficiency Ratio Calculation
:*
4
|
|
|
|
|
|
||||||||||||||
|
Noninterest Expense
|
$
|
16,045
|
|
$
|
15,548
|
|
$
|
15,637
|
|
$
|
15,475
|
|
$
|
15,272
|
|
||||
|
Less: Intangible Asset Amortization
|
69
|
|
69
|
|
70
|
|
71
|
|
73
|
|
|||||||||
|
Net Noninterest Expense
|
$
|
15,976
|
|
$
|
15,479
|
|
$
|
15,567
|
|
$
|
15,404
|
|
$
|
15,199
|
|
||||
|
Net Interest Income, Tax-Equivalent
|
$
|
21,294
|
|
$
|
20,616
|
|
$
|
20,176
|
|
$
|
19,409
|
|
$
|
19,305
|
|
||||
|
Noninterest Income
|
6,752
|
|
7,141
|
|
7,057
|
|
6,695
|
|
6,648
|
|
|||||||||
|
Less: Net Securities (Losses) Gains
|
(458
|
)
|
10
|
|
—
|
|
—
|
|
(166
|
)
|
|||||||||
|
Net Gross Income
|
$
|
28,504
|
|
$
|
27,747
|
|
$
|
27,233
|
|
$
|
26,104
|
|
$
|
26,119
|
|
||||
|
Efficiency Ratio
|
56.05
|
%
|
55.79
|
%
|
57.16
|
%
|
59.01
|
%
|
58.19
|
%
|
|||||||||
|
Period-End Capital Information
:
|
|
|
|
|
|
||||||||||||||
|
Total Stockholders’ Equity (i.e. Book Value)
|
$
|
249,603
|
|
$
|
244,648
|
|
$
|
240,752
|
|
$
|
236,111
|
|
$
|
232,852
|
|
||||
|
Book Value per Share
|
17.92
|
|
17.61
|
|
17.32
|
|
17.00
|
|
16.77
|
|
|||||||||
|
Intangible Assets
|
24,162
|
|
24,268
|
|
24,355
|
|
24,448
|
|
24,569
|
|
|||||||||
|
Tangible Book Value per Share
2
|
16.18
|
|
15.86
|
|
15.57
|
|
15.24
|
|
15.00
|
|
|||||||||
|
Capital Ratios:
|
|
|
|
|
|
||||||||||||||
|
Tier 1 Leverage Ratio
|
9.49
|
%
|
9.30
|
%
|
9.35
|
%
|
9.37
|
%
|
9.47
|
%
|
|||||||||
|
Common Equity Tier 1 Capital Ratio
|
12.89
|
%
|
12.70
|
%
|
12.68
|
%
|
12.84
|
%
|
12.97
|
%
|
|||||||||
|
Tier 1 Risk-Based Capital Ratio
|
13.97
|
%
|
13.79
|
%
|
13.79
|
%
|
13.99
|
%
|
14.14
|
%
|
|||||||||
|
Total Risk-Based Capital Ratio
|
14.99
|
%
|
14.77
|
%
|
14.77
|
%
|
14.98
|
%
|
15.15
|
%
|
|||||||||
|
Assets Under Trust Administration
and Investment Management |
$
|
1,452,994
|
|
$
|
1,411,608
|
|
$
|
1,356,262
|
|
$
|
1,333,690
|
|
$
|
1,301,408
|
|
||||
*See "Use of Non-GAAP Financial Measures" on page
4
.
#
23
|
Selected Twelve-Month Information
Dollars in thousands, except per share amounts
Share and per share amounts have been restated for the September 2017 3% stock dividend
|
|||||||||||
|
2017
|
2016
|
2015
|
|||||||||
|
Net Income
|
$
|
29,326
|
|
$
|
26,534
|
|
$
|
24,662
|
|
||
|
Transactions Recorded in Net Income (Net of Tax):
|
|||||||||||
|
Net Securities (Losses) Gains
|
$
|
(275
|
)
|
$
|
(13
|
)
|
$
|
78
|
|
||
|
Period End Shares Outstanding
1
|
13,930
|
|
13,887
|
|
13,727
|
|
|||||
|
Basic Average Shares Outstanding
1
|
13,893
|
|
13,792
|
|
13,680
|
|
|||||
|
Diluted Average Shares Outstanding
1
|
13,986
|
|
13,880
|
|
13,730
|
|
|||||
|
Basic Earnings Per Share
1
|
$
|
2.11
|
|
$
|
1.92
|
|
$
|
1.80
|
|
||
|
Diluted Earnings Per Share
1
|
2.10
|
|
1.91
|
|
1.80
|
|
|||||
|
Cash Dividends Per Share
1
|
0.98
|
|
0.95
|
|
0.93
|
|
|||||
|
Average Assets
|
$
|
2,693,946
|
|
$
|
2,513,645
|
|
$
|
2,341,467
|
|
||
|
Average Equity
|
241,466
|
|
224,969
|
|
208,017
|
|
|||||
|
Return on Average Assets
|
1.09
|
%
|
1.06
|
%
|
1.05
|
%
|
|||||
|
Return on Average Equity
|
12.14
|
|
11.79
|
|
11.86
|
|
|||||
|
Average Earning Assets
|
$
|
2,567,116
|
|
$
|
2,388,042
|
|
$
|
2,218,440
|
|
||
|
Average Interest-Bearing Liabilities
|
2,006,575
|
|
1,896,351
|
|
1,777,867
|
|
|||||
|
Interest Income, Tax-Equivalent*
|
88,501
|
|
80,636
|
|
74,227
|
|
|||||
|
Interest Expense
|
7,006
|
|
5,356
|
|
4,813
|
|
|||||
|
Net Interest Income, Tax-Equivalent*
|
81,495
|
|
75,280
|
|
69,414
|
|
|||||
|
Tax-Equivalent Adjustment*
|
3,844
|
|
3,721
|
|
3,489
|
|
|||||
|
Net Interest Margin*
|
3.17
|
%
|
3.15
|
%
|
3.13
|
%
|
|||||
|
Efficiency Ratio Calculation
*
4
|
|||||||||||
|
Noninterest Expense
|
$
|
62,705
|
|
$
|
59,609
|
|
$
|
57,430
|
|
||
|
Less: Intangible Asset Amortization
|
279
|
|
297
|
|
327
|
|
|||||
|
Net Noninterest Expense
|
$
|
62,426
|
|
$
|
59,312
|
|
$
|
57,103
|
|
||
|
Net Interest Income, Tax-Equivalent
|
$
|
81,495
|
|
$
|
75,280
|
|
$
|
69,414
|
|
||
|
Noninterest Income
|
27,645
|
|
27,832
|
|
28,124
|
|
|||||
|
Less: Net Securities (Losses) Gains
|
(448
|
)
|
(22
|
)
|
129
|
|
|||||
|
Net Gross Income, Adjusted
|
$
|
109,588
|
|
$
|
103,134
|
|
$
|
97,409
|
|
||
|
Efficiency Ratio*
|
56.96
|
%
|
57.51
|
%
|
58.62
|
%
|
|||||
|
Period-End Capital Information
:
|
|||||||||||
|
Tier 1 Leverage Ratio
|
9.49
|
%
|
9.47
|
%
|
9.25
|
%
|
|||||
|
Total Stockholders
’
Equity (i.e. Book Value)
|
$
|
249,603
|
|
$
|
232,852
|
|
$
|
213,971
|
|
||
|
Book Value per Share
|
17.92
|
|
16.77
|
|
15.59
|
|
|||||
|
Intangible Assets
|
24,162
|
|
24,569
|
|
24,980
|
|
|||||
|
Tangible Book Value per Share
2
|
16.18
|
|
15.00
|
|
13.77
|
|
|||||
|
Asset Quality Information:
|
|||||||||||
|
Net Loans Charged-off as a Percentage of Average Loans
|
0.06
|
%
|
0.06
|
%
|
0.06
|
%
|
|||||
|
Provision for Loan Losses as a Percentage of Average Loans
|
0.15
|
%
|
0.12
|
%
|
0.09
|
%
|
|||||
|
Allowance for Loan Losses as a Percentage of Period-End Loans
|
0.95
|
%
|
0.97
|
%
|
1.02
|
%
|
|||||
|
Allowance for Loan Losses as a Percentage of Nonperforming Loans
|
312.37
|
%
|
309.31
|
%
|
232.24
|
%
|
|||||
|
Nonperforming Loans as a Percentage of Period-End Loans
|
0.31
|
%
|
0.31
|
%
|
0.44
|
%
|
|||||
|
Nonperforming Assets as a Percentage of Total Assets
|
0.28
|
%
|
0.28
|
%
|
0.36
|
%
|
|||||
*See "Use of Non-GAAP Financial Measures" on page
4
.
#
24
Arrow Financial Corporation
Reconciliation of Non-GAAP Financial Information
(Dollars In Thousands, Except Per Share Amounts
)
|
Footnotes:
|
||||||||||||||||||||
|
1.
|
Share and per share data have been restated for the September 28, 2017, 3% stock dividend.
|
|||||||||||||||||||
|
2.
|
Tangible Book Value, Tangible Equity, and Return on Tangible Equity exclude goodwill and other intangible assets, net from total equity. These are non-GAAP financial measures which we believe provide investors with information that is useful in understanding our financial performance.
|
|||||||||||||||||||
|
12/31/2017
|
9/30/2017
|
6/30/2017
|
3/31/2017
|
12/31/2016
|
||||||||||||||||
|
Total Stockholders' Equity (GAAP)
|
$
|
249,603
|
|
$
|
244,648
|
|
$
|
240,752
|
|
$
|
236,111
|
|
$
|
232,852
|
|
|||||
|
Less: Goodwill and Other Intangible assets, net
|
24,162
|
|
24,268
|
|
24,355
|
|
24,448
|
|
24,569
|
|
||||||||||
|
Tangible Equity (Non-GAAP)
|
$
|
225,441
|
|
$
|
220,380
|
|
$
|
216,397
|
|
$
|
211,663
|
|
$
|
208,283
|
|
|||||
|
Period End Shares Outstanding
|
13,930
|
|
13,891
|
|
13,900
|
|
13,886
|
|
13,887
|
|
||||||||||
|
Tangible Book Value per Share (Non-GAAP)
|
$
|
16.18
|
|
$
|
15.86
|
|
$
|
15.57
|
|
$
|
15.24
|
|
$
|
15.00
|
|
|||||
|
Net Income
|
8,071
|
|
7,416
|
|
7,208
|
|
6,631
|
|
6,600
|
|
||||||||||
|
Return on Tangible Equity (Net Income/Tangible Equity - Annualized)
|
14.36
|
%
|
13.40
|
%
|
13.45
|
%
|
12.76
|
%
|
12.77
|
%
|
||||||||||
|
3.
|
Net Interest Margin is the ratio of our annualized tax-equivalent net interest income to average earning assets. This is also a non-GAAP financial measure which we believe provides investors with information that is useful in understanding our financial performance.
|
|||||||||||||||||||
|
12/31/2017
|
9/30/2017
|
6/30/2017
|
3/31/2017
|
12/31/2016
|
||||||||||||||||
|
Interest Income (GAAP)
|
$
|
22,135
|
|
$
|
21,599
|
|
$
|
20,926
|
|
$
|
19,997
|
|
$
|
19,770
|
|
|||||
|
Add: Tax Equivalent Adjustment (Non-GAAP)
|
980
|
|
966
|
|
949
|
|
948
|
|
939
|
|
||||||||||
|
Interest Income - Tax Equivalent (Non-GAAP)
|
$
|
23,115
|
|
$
|
22,565
|
|
$
|
21,875
|
|
$
|
20,945
|
|
$
|
20,709
|
|
|||||
|
Net Interest Income (GAAP)
|
$
|
20,314
|
|
$
|
19,650
|
|
$
|
19,227
|
|
$
|
18,461
|
|
$
|
18,366
|
|
|||||
|
Add: Tax-Equivalent adjustment (Non-GAAP)
|
980
|
|
966
|
|
949
|
|
948
|
|
939
|
|
||||||||||
|
Net Interest Income - Tax Equivalent (Non-GAAP)
|
$
|
21,294
|
|
$
|
20,616
|
|
$
|
20,176
|
|
$
|
19,409
|
|
$
|
19,305
|
|
|||||
|
Average Earning Assets
|
2,617,680
|
|
2,597,277
|
|
2,551,593
|
|
2,500,293
|
|
2,446,375
|
|
||||||||||
|
Net Interest Margin (Non-GAAP)
|
3.23
|
%
|
3.15
|
%
|
3.17
|
%
|
3.15
|
%
|
3.14
|
%
|
||||||||||
|
4.
|
Financial Institutions often use the "efficiency ratio", a non-GAAP ratio, as a measure of expense control. We believe the efficiency ratio provides investors with information that is useful in understanding our financial performance. We define our efficiency ratio as the ratio of our noninterest expense to our net gross income (which equals our tax-equivalent net interest income plus noninterest income, as adjusted).
|
|||||||||||||||||||
|
5.
|
For the current quarter, all of the regulatory capital ratios in the table above, as well as the Total Risk-Weighted Assets and Common Equity Tier 1 Capital amounts listed in the table below, are estimates based on, and calculated in accordance with bank regulatory capital rules. All prior quarters reflect actual results. The December 31, 2017 CET1 ratio listed in the tables (i.e., 12.89%) exceeds the sum of the required minimum CET1 ratio plus the fully phased-in Capital Conservation Buffer (i.e., 7.00%).
|
|||||||||||||||||||
|
12/31/2017
|
9/30/2017
|
6/30/2017
|
3/31/2017
|
12/31/2016
|
||||||||||||||||
|
Total Risk Weighted Assets
|
1,856,242
|
|
1,830,730
|
|
1,802,455
|
|
1,747,318
|
|
1,707,829
|
|
||||||||||
|
Common Equity Tier 1 Capital
|
259,378
|
|
232,473
|
|
228,586
|
|
224,369
|
|
221,472
|
|
||||||||||
|
Common Equity Tier 1 Ratio
|
12.89
|
%
|
12.70
|
%
|
12.68
|
%
|
12.84
|
%
|
12.97
|
%
|
||||||||||
#
25
CRITICAL ACCOUNTING ESTIMATES
Our significant accounting policies, as described in Note 2
- Summary of Significant Accounting Policies
to the notes to our Consolidated Financial Statements are essential in understanding the Management Discussion and Analysis. Many of our significant accounting policies require complex judgments to estimate the values of assets and liabilities. We have procedures and processes in place to facilitate making these judgments. The more judgmental estimates are summarized in the following discussion. In many cases, there are numerous alternative judgments that could be used in the process of determining the inputs to the models. Where alternatives exist, we have used the factors that we believe represent the most reasonable value in developing the inputs. Actual performance that differs from our estimates of the key variables could impact our results of operations.
Allowance for loan losses:
The allowance for loan losses represents management’s estimate of probable losses inherent in the Company’s loan portfolio. Our process for determining the allowance for loan losses is discussed in Note 2,
Summary of Significant Accounting Policies
and Note 5,
Loans
, to the notes to our Consolidated Financial Statements. We evaluate our allowance at the portfolio segment level and our portfolio segments are commercial, commercial real estate, residential real estate, and consumer loans. Due to the variability in the drivers of the assumptions used in this process, estimates of the portfolio’s inherent risks and overall collectability change with changes in the economy, individual industries, and borrowers’ ability and willingness to repay their obligations. The degree to which any particular assumption affects the allowance for loan losses depends on the severity of the change and its relationship to the other assumptions. Key judgments used in determining the allowance for loan losses for individual commercial loans include credit quality indicators, collateral values and estimated cash flows for impaired loans. For pools of loans we consider our historical net loss experience, and as necessary, adjustments to address current events and conditions, considerations regarding economic uncertainty, and overall credit conditions. The historical loss factors incorporate a rolling twelve quarter look-back period for each loan segment in order to reduce the volatility associated with improperly weighting short-term fluctuations. The process of determining the level of the allowance for loan losses requires a high degree of judgment. Any downward trend in the economy, regional or national, may require us to increase the allowance for loan losses resulting in a negative impact on our results of operations and financial condition.
#
26
A. OVERVIEW
The following discussion and analysis focuses on and reviews our results of operations for each of the years in the three-year period ended
December 31, 2017
and our financial condition as of
December 31, 2017
and
2016
. The discussion below should be read in conjunction with the selected quarterly and annual information set forth above and the consolidated financial statements and other financial data presented elsewhere in this Report. When necessary, prior-year financial information has been reclassified to conform to the current-year presentation.
Summary of
2017
Financial Results:
Net income for
2017
of
$29.3 million
, represented
an increase
of
$2.8 million
or
10.5%
over the
2016
total. Diluted earnings per share ("EPS") for
2017
was
$2.10
,
an increase
of
$0.19
, or
9.9%
from EPS in
2016
. Return on average equity ("ROE") for the
2017
year continued to be strong at
12.14%
,
up
from ROE of
11.79%
for the
2016
year. Return on average assets ("ROA") for
2017
also continued to be strong at
1.09%
,
an increase
from an ROA of
1.06%
for
2016
.
The main component of the increase in net income was a significant year-over-year increase in net interest income, which increased to
$77.7 million
in
2017
from
$71.6 million
in
2016
, an
8.5%
increase
. Tax-equivalent net interest income (a non-GAAP measure, see p. 4) was
$81.5 million
for
2017
, an increase of
$6.2 million
or
8.3%
over the
$75.3 million
total for
2016
. This increase in net interest income was primarily attributable to the significant amount of loan growth we experienced during the year and slight increase in rates. See the analysis of changes in the loan portfolio beginning on page
40
. Noninterest income, including net gains (losses) on securities transactions,
decreased
in
2017
by
$187 thousand
, or
0.7%
, while noninterest expense
increased
by
$3.1 million
, or
5.2%
. The provision for loan losses
increased
by
$703 thousand
in
2017
over
2016
and was primarily due to the significant growth in the loan portfolio. Asset quality measures remained strong throughout the year.
Total assets were
$2.8 billion
at
December 31, 2017
, which represented
an increase
of
$155.2 million
, or
6.0%
, above the
$2.6 billion
level at
December 31, 2016
. Nearly all asset growth was the result of strategic growth from our existing branch network. The Company opened one new branch in Schenectady, NY in October. The Company did not acquire any new branches from other organizations.
Total Stockholders' equity was
$249.6 million
at
December 31, 2017
,
an increase
of
$16.8 million
, or
7.2%
, from the year earlier level. The components of the change in stockholders' equity since year-end
2016
are presented in the Consolidated Statement of Changes in Stockholders' Equity on page
58
. Total book value per share
increased
by
6.9%
over the prior year level. At
December 31, 2017
, tangible book value per share, a non-GAAP financial measure calculated based on tangible book value (total stockholders' equity minus intangible assets including goodwill) was
$16.18
,
an increase
of
$1.18
, or
7.9%
, over the
December 31, 2016
amount. This increase in total stockholders' equity during
2017
principally reflected the following factors: (i)
$29.3 million
of net income for the period, plus (ii)
$2.6 million
of equity received from various stock-based compensation plans, plus (iii)
$1.7 million
of equity resulting from the dividend reinvestment plan, reduced by (iv) cash dividends of
$13.6 million
; and (v) repurchases of our common stock of
$3.2 million
. As of
December 31, 2017
, our closing stock price was
$33.95
, resulting in a trading multiple of 2.10 to our tangible book value. The Board of Directors declared and the Company paid a cash dividend of
$0.243
per share for each of the first three quarters of
2017
, as adjusted for a
3
% stock dividend distributed
September 28, 2017
, a cash dividend of
$0.25
per share for the fourth quarter of
2017
, and has declared a $0.25 per share cash dividend for the first quarter of
2018
.
The Tax Act was enacted on December 22, 2017. The Company has recorded and reported the effects of the law’s impacts in its financial statements for the period ended December 31, 2017. See Note 15,
Income Taxes
to the notes to our Consolidated Financial Statements for more information.
Regulatory capital:
As of
December 31, 2017
, we continued to exceed all regulatory minimum capital requirements at both the holding company and bank levels, by a substantial amount. As of January 1, 2015, we became subject to revised bank regulatory capital standards adopted in 2013 by federal bank regulatory agencies pursuant to Dodd-Frank. These revised regulatory standards generally require financial institutions to meet higher minimum capital levels, measured in new ways. The standards are being phased in over a 5-year time period ending in 2019. See "Regulatory Capital Standards" on pages
7 and 8
.
Economic trends and loan quality:
During the past five years, economic activity in our market area has been generally positive, but employment growth and average hourly wages have been less than the national average. Single family home values in upstate New York have generally increased at a lower rate than the national average over the same period. Our nonperforming loans were
$6.0 million
at
December 31, 2017
,
an increase
of
$0.5 million
, or
8.2%
, from year-end
2016
. The ratio of nonperforming loans to period-end loans at
December 31, 2017
was unchanged
from
0.31%
at
December 31, 2016
. By way of comparison, this ratio for our peer group was
0.73%
at
September 30, 2017
. Loans charged-off (net of recoveries) against our allowance for loan losses amounted to
$1.2 million
for
2017
,
an increase
of
$103 thousand
from
2016
. Our ratio of net charge-offs to average loans was
0.06%
for
2017
, compared to our peer group ratio of
0.08%
for the period ended
September 30, 2017
.
At
December 31, 2017
, our allowance for loan losses was
$18.6 million
, representing
0.95%
of total loans,
a decrease
of
2
basis points from the
December 31, 2016
ratio.
Our major loan segments are:
|
◦
|
Commercial Loans:
These loans comprise approximately
7%
of our loan portfolio. The business sector in our service area, including small- and mid-sized businesses with headquarters in the area, continued to be in reasonably good financial condition at
2017
year-end, and some lines of business appear to be experiencing modest improvement during the year.
|
|
◦
|
Commercial Real Estate Loans:
These loans comprise approximately
23%
of our loan portfolio. Commercial property values in our region have remained stable in recent periods. We update the appraisals on our nonperforming and watched commercial properties as deemed necessary, usually when the loan was downgraded or when we perceive significant market deterioration since our last appraisal.
|
#
27
|
◦
|
Residential Real Estate Loans:
These loans, including home equity loans, make up approximately
40%
of our portfolio. We have not experienced any significant increase in our delinquency and foreclosure rates, primarily due to the fact that we do not, as a line of business, originate or participate in underwriting high-risk mortgage loans, such as so called "Alt A," "negative amortization," "option ARM's" or "negative equity" loans. We originate all of the residential real estate loans held in our portfolio and apply relatively conservative underwriting standards to all of our originations. The residential real estate market in our service area has been stable in recent periods. If long-term interest rates, which had recently been at historically low levels before rebounding slightly throughout 2017, do not increase significantly above their period-end levels, we may continue to experience a modest volume of mortgage refinancings. We typically sell a portion, sometimes a significant portion, of our residential real estate mortgage originations in the secondary market, although our sales of originations as a portion of our total originations diminished significantly from 2016 to 2017.
|
|
◦
|
Consumer Loans (Primarily Indirect Automobile Loans):
These loans comprise approximately
31%
of our loan portfolio. Throughout the past three years we did not experience any significant change in our level of charge-offs on these loans or in our overall average delinquency rate for automobile loans.
|
Liquidity and access to credit markets:
We did not experience any liquidity problems or special concerns during
2017
, nor during the prior two years. The terms of our lines of credit with our correspondent banks, the FHLBNY and the Federal Reserve Bank have not changed (see our general liquidity discussion on page
47
). In general, we principally rely on asset-based liquidity (i.e., funds in overnight investments and cash flow from maturing investments and loans) with liability-based liquidity as a secondary source. Our main liability-based sources are overnight borrowing arrangements with our correspondent banks, an arrangement for overnight borrowing and term credit advances from the FHLBNY, and an additional arrangement for short-term advances at the Federal Reserve Bank discount window). We regularly perform a liquidity stress test and periodically test our contingent liquidity plan to ensure that we can generate an adequate amount of available funds to meet a wide variety of potential liquidity crises, including a severe crisis.
Visa Class B Common Stock:
We, like other former Visa member banks, bear some indirect contingent liability for Visa's direct liability arising out of certain antitrust claims involving merchant discounts to the extent that Visa's liability might exceed the remaining litigation escrow account amount. In light of the current state of covered litigation at Visa, which is winding down, as well as the substantial remaining dollar amounts in Visa's escrow fund, we determined that the balance that Visa maintains in its escrow fund is substantially sufficient to satisfy Visa's remaining direct liability to such claims without further resort to the contingent liability of the former Visa member banks such as ours. At
December 31, 2017
, the Company held 27,771 shares of Visa Class B common stock. A potential future conversion of these shares could result in our receiving approximately 46,000 shares of Visa Class A common. There continue to be restrictions remaining on Visa Class B shares held by us. We continue not to recognize any economic value for these shares.
B. RESULTS OF OPERATIONS
The following analysis of net interest income, the provision for loan losses, noninterest income, noninterest expense and income taxes, highlights the factors that had the greatest impact on our results of operations for
December 31, 2017
and the prior two years.
I. NET INTEREST INCOME
(Tax-equivalent Basis)
Net interest income represents the difference between interest, dividends and fees earned on loans, securities and other earning assets and interest paid on deposits and other sources of funds. Changes in net interest income result from changes in the level and mix of earning assets and sources of funds (volume) and changes in the yields earned and interest rates paid (rate). Net interest margin is the ratio of net interest income to average earning assets. Net interest income may also be described as the product of average earning assets and the net interest margin. As described in the section entitled “Use of Non-GAAP Financial Measures” on page
4
of this Report, for purposes of our presentation of Selected Financial Information in this Report, including in this Item 7, "Management's Discussion and Analysis of Financial Conditions and Results of Operations," we calculate net interest income on a tax-equivalent basis, producing a non-GAAP financial measure. For our
2017
adjustment, we used a marginal tax rate of 35%. See the discussion and calculation of our
2017
tax equivalent net interest income and net interest margin on page
4
of this Report.
CHANGE IN NET INTEREST INCOME
(Dollars In Thousands) (Tax-equivalent Basis)
|
Years Ended December 31,
|
Change From Prior Year
|
||||||||||||||||||||||||
|
2016 to 2017
|
2015 to 2016
|
||||||||||||||||||||||||
|
2017
|
2016
|
2015
|
Amount
|
%
|
Amount
|
%
|
|||||||||||||||||||
|
Interest and Dividend Income
|
$
|
88,501
|
|
$
|
80,636
|
|
$
|
74,227
|
|
$
|
7,865
|
|
9.8
|
%
|
$
|
6,409
|
|
8.6
|
%
|
||||||
|
Interest Expense
|
7,006
|
|
5,356
|
|
4,813
|
|
1,650
|
|
30.8
|
|
543
|
|
11.3
|
|
|||||||||||
|
Net Interest Income
|
$
|
81,495
|
|
$
|
75,280
|
|
$
|
69,414
|
|
$
|
6,215
|
|
8.3
|
|
$
|
5,866
|
|
8.5
|
|
||||||
#
28
On a tax-equivalent basis, net interest income was
$81.5 million
in
2017
, an increase of
$6.2 million
, or
8.3%
, from
$75.3 million
in
2016
. This compared to an increase of $
5.9 million
, or
8.5%
, from
2015
to
2016
. Factors contributing to the year-to-year changes in net interest income over the three-year period are discussed in the following portions of this Section B.I.
In the following table, net interest income components are presented on a tax-equivalent basis. Changes between periods are attributed to movement in either the average daily balances or average rates for both earning assets and interest-bearing liabilities. Changes attributable to both volume and rate have been allocated proportionately between the categories.
|
2017 Compared to 2016 Change in Net Interest Income Due to:
|
2016 Compared to 2015 Change in Net Interest Income Due to:
|
||||||||||||||||||||||
|
Interest and Dividend Income:
|
Volume
|
Rate
|
Total
|
Volume
|
Rate
|
Total
|
|||||||||||||||||
|
Interest-Bearing Bank Balances
|
$
|
4
|
|
$
|
191
|
|
$
|
195
|
|
$
|
(26
|
)
|
$
|
85
|
|
$
|
59
|
|
|||||
|
Investment Securities:
|
|||||||||||||||||||||||
|
Fully Taxable
|
(592
|
)
|
542
|
|
(50
|
)
|
(199
|
)
|
88
|
|
(111
|
)
|
|||||||||||
|
Exempt from Federal Taxes
|
318
|
|
2
|
|
320
|
|
306
|
|
91
|
|
397
|
|
|||||||||||
|
Loans
|
7,563
|
|
(163
|
)
|
7,400
|
|
6,808
|
|
(744
|
)
|
6,064
|
|
|||||||||||
|
Total Interest and Dividend Income
|
7,293
|
|
572
|
|
7,865
|
|
6,889
|
|
(480
|
)
|
6,409
|
|
|||||||||||
|
Interest Expense:
|
|||||||||||||||||||||||
|
Deposits:
|
|||||||||||||||||||||||
|
Interest-Bearing Checking Accounts
|
(8
|
)
|
239
|
|
231
|
|
3
|
|
—
|
|
3
|
|
|||||||||||
|
Savings Deposits
|
113
|
|
327
|
|
440
|
|
86
|
|
104
|
|
190
|
|
|||||||||||
|
Time Deposits of $250,000 or More
|
(295
|
)
|
124
|
|
(171
|
)
|
60
|
|
37
|
|
97
|
|
|||||||||||
|
Other Time Deposits
|
203
|
|
89
|
|
292
|
|
(38
|
)
|
(46
|
)
|
(84
|
)
|
|||||||||||
|
Total Deposits
|
13
|
|
779
|
|
792
|
|
111
|
|
95
|
|
206
|
|
|||||||||||
|
Short-Term Borrowings
|
260
|
|
496
|
|
756
|
|
182
|
|
83
|
|
265
|
|
|||||||||||
|
Long-Term Debt
|
—
|
|
103
|
|
103
|
|
203
|
|
(131
|
)
|
72
|
|
|||||||||||
|
Total Interest Expense
|
273
|
|
1,378
|
|
1,651
|
|
496
|
|
47
|
|
543
|
|
|||||||||||
|
Net Interest Income
|
$
|
7,020
|
|
$
|
(806
|
)
|
$
|
6,214
|
|
$
|
6,393
|
|
$
|
(527
|
)
|
$
|
5,866
|
|
|||||
#
29
The following table reflects the components of our net interest income, setting forth, for years ended
December 31, 2017
,
2016
and
2015
: (i) average balances of assets, liabilities and stockholders' equity, (ii) interest and dividend income earned on earning assets and interest expense incurred on interest-bearing liabilities, (iii) average yields earned on earning assets and average rates paid on interest-bearing liabilities, (iv) the net interest spread (average yield less average cost) and (v) the net interest margin (yield) on earning assets. Interest income, net interest income and interest rate information is presented on a tax-equivalent basis, using a marginal tax rate of 35% (see the discussion under "Use of Non-GAAP Financial Measures" on page
4
of this Report). The yield on securities available-for-sale is based on the amortized cost of the securities. Nonaccrual loans are included in average loans.
Average Consolidated Balance Sheets and Net Interest Income Analysis
(Tax-equivalent basis using a marginal tax rate of 35%)
(Dollars in Thousands)
|
Years Ended:
|
2017
|
2016
|
2015
|
|||||||||||||||||||||||||||||
|
Interest
|
Rate
|
Interest
|
Rate
|
Interest
|
Rate
|
|||||||||||||||||||||||||||
|
Average
|
Income/
|
Earned/
|
Average
|
Income/
|
Earned/
|
Average
|
Income/
|
Earned/
|
||||||||||||||||||||||||
|
Balance
|
Expense
|
Paid
|
Balance
|
Expense
|
Paid
|
Balance
|
Expense
|
Paid
|
||||||||||||||||||||||||
|
Interest-Bearing Deposits at
Banks
|
$
|
25,573
|
|
$
|
348
|
|
1.36
|
%
|
$
|
24,950
|
|
$
|
153
|
|
0.61
|
%
|
$
|
32,562
|
|
$
|
94
|
|
0.29
|
%
|
||||||||
|
Investment Securities:
|
||||||||||||||||||||||||||||||||
|
Fully Taxable
|
390,641
|
|
7,900
|
|
2.02
|
%
|
420,885
|
|
7,950
|
|
1.89
|
%
|
431,445
|
|
8,061
|
|
1.87
|
%
|
||||||||||||||
|
Exempt from Federal
Taxes
|
288,655
|
|
9,507
|
|
3.29
|
%
|
278,982
|
|
9,187
|
|
3.29
|
%
|
269,667
|
|
8,790
|
|
3.26
|
%
|
||||||||||||||
|
Loans
|
1,862,247
|
|
70,746
|
|
3.80
|
%
|
1,663,225
|
|
63,346
|
|
3.81
|
%
|
1,484,766
|
|
57,282
|
|
3.86
|
%
|
||||||||||||||
|
Total Earning Assets
|
2,567,116
|
|
88,501
|
|
3.45
|
%
|
2,388,042
|
|
80,636
|
|
3.38
|
%
|
2,218,440
|
|
74,227
|
|
3.35
|
%
|
||||||||||||||
|
Allowance for Loan Losses
|
(17,303
|
)
|
(16,449
|
)
|
(15,595
|
)
|
||||||||||||||||||||||||||
|
Cash and Due From Banks
|
36,175
|
|
33,207
|
|
31,007
|
|
||||||||||||||||||||||||||
|
Other Assets
|
107,958
|
|
108,845
|
|
107,615
|
|
||||||||||||||||||||||||||
|
Total Assets
|
$
|
2,693,946
|
|
$
|
2,513,645
|
|
$
|
2,341,467
|
|
|||||||||||||||||||||||
|
Deposits:
|
||||||||||||||||||||||||||||||||
|
Interest-Bearing Checking Accounts
|
$
|
907,113
|
|
1,510
|
|
0.17
|
%
|
$
|
912,461
|
|
1,279
|
|
0.14
|
%
|
$
|
915,565
|
|
1,276
|
|
0.14
|
%
|
|||||||||||
|
Savings Deposits
|
685,782
|
|
1,371
|
|
0.20
|
%
|
616,208
|
|
931
|
|
0.15
|
%
|
554,330
|
|
741
|
|
0.13
|
%
|
||||||||||||||
|
Time Deposits of $250,000
Or More
|
32,089
|
|
282
|
|
0.88
|
%
|
69,489
|
|
453
|
|
0.65
|
%
|
59,967
|
|
356
|
|
0.59
|
%
|
||||||||||||||
|
Other Time Deposits
|
165,778
|
|
950
|
|
0.57
|
%
|
129,084
|
|
658
|
|
0.51
|
%
|
136,396
|
|
742
|
|
0.54
|
%
|
||||||||||||||
|
Total Interest-
Bearing Deposits
|
1,790,762
|
|
4,113
|
|
0.23
|
%
|
1,727,242
|
|
3,321
|
|
0.19
|
%
|
1,666,258
|
|
3,115
|
|
0.19
|
%
|
||||||||||||||
|
Short-Term Borrowings
|
140,813
|
|
1,148
|
|
0.82
|
%
|
94,109
|
|
393
|
|
0.42
|
%
|
45,595
|
|
128
|
|
0.28
|
%
|
||||||||||||||
|
FHLBNY Term Advances and
Other Long-Term Debt
|
75,000
|
|
1,745
|
|
2.33
|
%
|
75,000
|
|
1,642
|
|
2.19
|
%
|
66,014
|
|
1,570
|
|
2.38
|
%
|
||||||||||||||
|
Total Interest-
Bearing Liabilities
|
2,006,575
|
|
7,006
|
|
0.35
|
%
|
1,896,351
|
|
5,356
|
|
0.28
|
%
|
1,777,867
|
|
4,813
|
|
0.27
|
%
|
||||||||||||||
|
Demand Deposits
|
421,061
|
|
366,956
|
|
329,017
|
|
||||||||||||||||||||||||||
|
Other Liabilities
|
24,844
|
|
25,369
|
|
26,566
|
|
||||||||||||||||||||||||||
|
Total Liabilities
|
2,452,480
|
|
2,288,676
|
|
2,133,450
|
|
||||||||||||||||||||||||||
|
Stockholders’ Equity
|
241,466
|
|
224,969
|
|
208,017
|
|
||||||||||||||||||||||||||
|
Total Liabilities and
Stockholders’ Equity
|
$
|
2,693,946
|
|
$
|
2,513,645
|
|
$
|
2,341,467
|
|
|||||||||||||||||||||||
|
Net Interest Income
(Tax-equivalent Basis)
|
81,495
|
|
75,280
|
|
69,414
|
|
||||||||||||||||||||||||||
|
Reversal of Tax
Equivalent Adjustment
|
(3,844
|
)
|
0.15
|
%
|
(3,721
|
)
|
0.16
|
%
|
(3,489
|
)
|
0.16
|
%
|
||||||||||||||||||||
|
Net Interest Income
|
$
|
77,651
|
|
$
|
71,559
|
|
$
|
65,925
|
|
|||||||||||||||||||||||
|
Net Interest Spread
|
3.10
|
%
|
3.10
|
%
|
3.08
|
%
|
||||||||||||||||||||||||||
|
Net Interest Margin
|
3.17
|
%
|
3.15
|
%
|
3.13
|
%
|
||||||||||||||||||||||||||
#
30
CHANGES IN NET INTEREST INCOME DUE TO RATE
|
YIELD ANALYSIS (Tax-equivalent basis)
|
December 31,
|
|||||||
|
2017
|
2016
|
2015
|
||||||
|
Yield on Earning Assets
|
3.45
|
%
|
3.38
|
%
|
3.35
|
%
|
||
|
Cost of Interest-Bearing Liabilities
|
0.35
|
|
0.28
|
|
0.27
|
|
||
|
Net Interest Spread
|
3.10
|
%
|
3.10
|
%
|
3.08
|
%
|
||
|
Net Interest Margin
|
3.17
|
%
|
3.15
|
%
|
3.13
|
%
|
||
Our increase in net interest income on a tax-equivalent basis (a non-GAAP measure, see discussion on p.
4
) from
2016
to
2017
was
$6.2 million
, or
8.3%
, which continued the trend of increasing net interest income experienced by us in
2016
and
2015
. These increases were similar to increases in our average earning assets during the respective year aided in
2017
by a continued slight increase in our net interest margin ("NIM").
During
2017
, our NIM increased two basis points, as our yield on earning assets increased at the same pace as our cost of interest bearing liabilities. While our continued loan growth has been the primary driver for maintaining a stable NIM for the past three years, our increased ratio of non-interest-bearing demand deposits to total deposits has helped limit the increase in our cost of funds. We can give no assurances regarding our NIM in 2018 or following periods, even though the Fed has raised short term rates in four of the last five quarters and has signaled the markets that additional rate increases are likely in 2018.
A discussion of the models we use in projecting the impact on net interest income resulting from possible changes in interest rates vis-à-vis the repricing patterns of our earning assets and interest-bearing liabilities is included later in this Report under Item 7.A., "Quantitative and Qualitative Disclosures About Market Risk."
CHANGES IN NET INTEREST INCOME DUE TO VOLUME
AVERAGE BALANCES
(Dollars In Thousands)
|
Years Ended December 31,
|
Change From Prior Year
|
||||||||||||||||||||||||
|
2016 to 2017
|
2015 to 2016
|
||||||||||||||||||||||||
|
2017
|
2016
|
2015
|
Amount
|
%
|
Amount
|
%
|
|||||||||||||||||||
|
Earning Assets
|
$
|
2,567,116
|
|
$
|
2,388,042
|
|
$
|
2,218,440
|
|
$
|
179,074
|
|
7.5
|
%
|
$
|
169,602
|
|
7.6
|
%
|
||||||
|
Interest-Bearing Liabilities
|
2,006,575
|
|
1,896,351
|
|
1,777,867
|
|
110,224
|
|
5.8
|
|
118,484
|
|
6.7
|
|
|||||||||||
|
Demand Deposits
|
421,061
|
|
366,956
|
|
329,017
|
|
54,105
|
|
14.7
|
|
37,939
|
|
11.5
|
|
|||||||||||
|
Total Assets
|
2,693,946
|
|
2,513,645
|
|
2,341,467
|
|
180,301
|
|
7.2
|
|
172,178
|
|
7.4
|
|
|||||||||||
|
Earning Assets to Total Assets
|
95.29
|
%
|
95.00
|
%
|
94.75
|
%
|
|||||||||||||||||||
2017
Compared to
2016
:
In general, an increase in average earning assets has a positive impact on net interest income. For
2017
, average earning assets increased
$179.1 million
or
7.5%
over
2016
, while average interest-bearing liabilities increased
$110.2 million
, or
5.8%
, and non-interest bearing demand deposits increased
$54.1 million
or
14.7%
. The growth in our net earning assets and demand deposits were the primary factors in the
$6.2 million
, or
8.3%
, increase in our net interest income in
2017
(on a tax-equivalent basis).
An underlying factor in our net asset growth in
2017
, and the resulting increase in our net interest income, was a positive change in the mix of our earning assets. The
$179.1 million
increase in average earning assets from
2016
to
2017
was primarily the result of a substantial increase in the average balance of our total loans. Within the loan portfolio, our three principal segments are residential real estate loans, automobile loans (primarily through our indirect lending program) and commercial loans. In
2017
, we sold approximately
10%
of our residential real estate loan originations into the secondary market. Additionally, we originated a higher volume of residential mortgages in
2017
than in the prior two years and as a result, we experienced a significant increase in the average balance of this segment of the portfolio in
2017
. The average balance of our automobile loan portfolio also increased in
2017
, reflecting continuing strong demand in automobile sales and our determination to remain competitive on our pricing of these loans with respect to other commercial banks (although we remained at a disadvantage compared to the subsidized, below-market loan rates offered by the financing affiliates of the automobile manufacturers). Our high credit standards have enabled us to achieve high yields in this portfolio. Our commercial and commercial real estate loan portfolio also experienced growth during
2017
. In addition to balance sheet growth, the composition of our average earning assets during 2017 included more higher yielding loans and slightly less lower yielding investment securities as a result of our decision to hold more loans in this period. As a result, the yield on average earning assets increased 7 basis points for the year ended December 31, 2017.
The $
110.2 million
increase in average interest-bearing liabilities during
2017
was primarily attributable to an increase in deposits from our existing branch network and secondarily to a
$18 million
increase in our FHLBNY advances.
2016 Compared to 2015:
For 2016, average earning assets increased $169.6 million or 7.6% over 2015, while average interest-bearing liabilities increased $118.5 million, or 6.7%, and non-interest bearing demand deposits increased $37.9 million or 11.5%. The growth in our net earning assets and demand deposits were the primary factors in the $5.9 million, or 7.8%, increase in our net interest income in 2016 (on a tax-equivalent basis).
#
31
An underlying factor in our net asset growth in 2016, and the resulting increase in our net interest income, was a positive change in the mix of our earning assets. The $169.6 million increase in average earning assets from 2015 to 2016 resulted from the average balance of our securities portfolio remaining virtually unchanged, while the average balance of our total loans increased substantially. Within the loan portfolio, our three principal segments are residential real estate loans, automobile loans (primarily through our indirect lending program) and commercial loans. We continued to sell a portion of our residential real estate loan originations into the secondary market in 2016, approximately 16% of our originations. Additionally, we originated a higher volume of residential mortgages in 2016 than in the prior two years and as a result, we experienced a significant increase in the average balance of this segment of the portfolio in 2016. The average balance of our automobile loan portfolio also increased in 2016, reflecting continuing strong demand in automobile sales and our determination to remain competitive on our pricing of these loans with respect to other commercial banks (although we remained at a disadvantage compared to the subsidized, below-market loan rates offered by the financing affiliates of the automobile manufacturers). Our commercial and commercial real estate loan portfolio also experienced growth during 2016.
The $118.5 million increase in average interest-bearing liabilities during 2016 was primarily attributable to an increase in deposits from our existing branch network and secondarily to a $41 million increase in our FHLBNY advances.
#
32
II.
PROVISION FOR LOAN LOSSES AND ALLOWANCE FOR LOAN LOSSES
We consider our accounting policy relating to the allowance for loan losses to be a critical accounting policy, given the uncertainty involved in evaluating the level of the allowance required to cover credit losses inherent in the loan portfolio, and the material effect that such judgments may have on our results of operations. We recorded a
$2.7 million
provision for loan losses for
2017
, compared to the
$2.0 million
provision for
2016
. The level of the
2017
provision was impacted primarily by the significant growth in loan balances during
2017
. Our analysis of the method we employ for determining the amount of the loan loss provision is explained in detail in Notes 2,
Summary of Significant Accounting Policies
, and 5,
Loans,
to the notes to our Consolidated Financial Statements.
SUMMARY OF THE ALLOWANCE AND PROVISION FOR LOAN LOSSES
(Dollars In Thousands) (Loans, Net of Unearned Income)
|
Years-Ended December 31,
|
2017
|
2016
|
2015
|
2014
|
2013
|
||||||||||||||
|
Period-End Loans
|
$
|
1,950,770
|
|
$
|
1,753,268
|
|
$
|
1,573,952
|
|
$
|
1,413,268
|
|
$
|
1,266,472
|
|
||||
|
Average Loans
|
1,862,247
|
|
1,663,225
|
|
1,484,766
|
|
1,344,427
|
|
1,208,954
|
|
|||||||||
|
Period-End Assets
|
2,760,465
|
|
2,605,242
|
|
2,446,188
|
|
2,217,420
|
|
2,163,698
|
|
|||||||||
|
Nonperforming Assets, at Period-End:
|
|||||||||||||||||||
|
Nonaccrual Loans:
|
|||||||||||||||||||
|
Commercial Real Estate
|
1,530
|
|
875
|
|
2,402
|
|
2,071
|
|
2,048
|
|
|||||||||
|
Commercial Loans
|
588
|
|
155
|
|
387
|
|
473
|
|
352
|
|
|||||||||
|
Residential Real Estate Loans
|
2,755
|
|
2,574
|
|
3,195
|
|
3,940
|
|
3,860
|
|
|||||||||
|
Consumer Loans
|
653
|
|
589
|
|
449
|
|
415
|
|
219
|
|
|||||||||
|
Total Nonaccrual Loans
|
5,526
|
|
4,193
|
|
6,433
|
|
6,899
|
|
6,479
|
|
|||||||||
|
Loans Past Due 90 or More Days and
|
|||||||||||||||||||
|
Still Accruing Interest
|
319
|
|
1,201
|
|
187
|
|
537
|
|
652
|
|
|||||||||
|
Restructured
|
105
|
|
106
|
|
286
|
|
333
|
|
641
|
|
|||||||||
|
Total Nonperforming Loans
|
5,950
|
|
5,500
|
|
6,906
|
|
7,769
|
|
7,772
|
|
|||||||||
|
Repossessed Assets
|
109
|
|
101
|
|
140
|
|
81
|
|
63
|
|
|||||||||
|
Other Real Estate Owned
|
1,738
|
|
1,585
|
|
1,878
|
|
312
|
|
81
|
|
|||||||||
|
Total Nonperforming Assets
|
$
|
7,797
|
|
$
|
7,186
|
|
$
|
8,924
|
|
$
|
8,162
|
|
$
|
7,916
|
|
||||
|
Allowance for Loan Losses:
|
|||||||||||||||||||
|
Balance at Beginning of Period
|
$
|
17,012
|
|
$
|
16,038
|
|
$
|
15,570
|
|
$
|
14,434
|
|
$
|
15,298
|
|
||||
|
Loans Charged-off:
|
|||||||||||||||||||
|
Commercial Loans
|
(2
|
)
|
(97
|
)
|
(62
|
)
|
(212
|
)
|
(926
|
)
|
|||||||||
|
Real Estate - Commercial
|
(380
|
)
|
(195
|
)
|
(7
|
)
|
—
|
|
(11
|
)
|
|||||||||
|
Real Estate - Residential
|
(76
|
)
|
(107
|
)
|
(326
|
)
|
(91
|
)
|
(15
|
)
|
|||||||||
|
Consumer Loans
|
(1,101
|
)
|
(871
|
)
|
(711
|
)
|
(718
|
)
|
(459
|
)
|
|||||||||
|
Total Loans Charged-off
|
(1,559
|
)
|
(1,270
|
)
|
(1,106
|
)
|
(1,021
|
)
|
(1,411
|
)
|
|||||||||
|
Recoveries of Loans Previously Charged-off:
|
|||||||||||||||||||
|
Commercial Loans
|
8
|
|
23
|
|
33
|
|
86
|
|
88
|
|
|||||||||
|
Real Estate – Commercial
|
—
|
|
—
|
|
—
|
|
—
|
|
—
|
|
|||||||||
|
Real Estate – Residential
|
—
|
|
6
|
|
—
|
|
—
|
|
—
|
|
|||||||||
|
Consumer Loans
|
389
|
|
182
|
|
194
|
|
223
|
|
259
|
|
|||||||||
|
Total Recoveries of Loans Previously Charged-off
|
397
|
|
211
|
|
227
|
|
309
|
|
347
|
|
|||||||||
|
Net Loans Charged-off
|
(1,162
|
)
|
(1,059
|
)
|
(879
|
)
|
(712
|
)
|
(1,064
|
)
|
|||||||||
|
Provision for Loan Losses
|
|||||||||||||||||||
|
Charged to Expense
|
2,736
|
|
2,033
|
|
1,347
|
|
1,848
|
|
200
|
|
|||||||||
|
Balance at End of Period
|
$
|
18,586
|
|
$
|
17,012
|
|
$
|
16,038
|
|
$
|
15,570
|
|
$
|
14,434
|
|
||||
|
Asset Quality Ratios:
|
|||||||||||||||||||
|
Net Charge-offs to Average Loans
|
0.06
|
%
|
0.06
|
%
|
0.06
|
%
|
0.05
|
%
|
0.09
|
%
|
|||||||||
|
Provision for Loan Losses to Average Loans
|
0.15
|
%
|
0.12
|
%
|
0.09
|
%
|
0.14
|
%
|
0.02
|
%
|
|||||||||
|
Allowance for Loan Losses to Period-end Loans
|
0.95
|
%
|
0.97
|
%
|
1.02
|
%
|
1.10
|
%
|
1.14
|
%
|
|||||||||
|
Allowance for Loan Losses to Nonperforming Loans
|
312.37
|
%
|
309.31
|
%
|
232.24
|
%
|
200.41
|
%
|
185.71
|
%
|
|||||||||
|
Nonperforming Loans to Period-end Loans
|
0.31
|
%
|
0.31
|
%
|
0.44
|
%
|
0.55
|
%
|
0.61
|
%
|
|||||||||
|
Nonperforming Assets to Period-end Assets
|
0.28
|
%
|
0.28
|
%
|
0.36
|
%
|
0.37
|
%
|
0.37
|
%
|
|||||||||
#
33
ALLOCATION OF THE ALLOWANCE FOR LOAN LOSSES
(Dollars in Thousands)
|
2017
|
2016
|
2015
|
2014
|
2013
|
|||||||||||||||
|
Commercial Loans
|
$
|
1,873
|
|
$
|
1,017
|
|
$
|
1,827
|
|
$
|
2,382
|
|
$
|
2,303
|
|
||||
|
Real Estate-Commercial
|
4,504
|
|
5,677
|
|
4,520
|
|
3,846
|
|
3,545
|
|
|||||||||
|
Real Estate-Residential
|
4,605
|
|
4,198
|
|
3,790
|
|
3,369
|
|
3,026
|
|
|||||||||
|
Consumer Loans
|
7,604
|
|
6,120
|
|
5,554
|
|
5,210
|
|
4,478
|
|
|||||||||
|
Unallocated
|
—
|
|
—
|
|
347
|
|
763
|
|
1,082
|
|
|||||||||
|
Total
|
$
|
18,586
|
|
$
|
17,012
|
|
$
|
16,038
|
|
$
|
15,570
|
|
$
|
14,434
|
|
||||
The allowance for loan losses increased to
$18.6 million
at year-end
2017
from
$17.0 million
at year-end
2016
,
an increase
of
9.3%
. However, the loan portfolio increased at an even faster rate during
2017
(the portfolio at year-end
2017
was
up
by
11.3%
compared to year-end
2016
), with the result that the allowance for loan losses as a percentage of period-end total loans declined to
0.95%
at year-end
2017
from
0.97%
at year-end
2016
,
a decrease
of
2.06%
.
A variety of factors were considered in evaluating the adequacy of the allowance for loan losses at
December 31, 2017
and the provision for loan losses for the year, including:
Factors leading to an increase in the provision for loan losses:
|
•
|
Loan growth in all portfolio segments
|
|
•
|
A small increase in classified construction loans
|
|
•
|
A slight increase in the historical loss factor for commercial and commercial real estate loans
|
|
•
|
Modest increases in the qualitative factors for residential real estate
|
Factors leading to a decrease in the provision for loan losses:
|
•
|
A slight decrease in the historical loss factor for automobile loans
|
|
•
|
A decrease in classified commercial and commercial real estate loans
|
|
•
|
An overall decrease in the allowance as a percentage of total loan balance due to portfolio mix
|
See Note 5,
Loans
, to the notes to our Consolidated Financial Statements for a complete list of all the factors used to calculate the provision for loan losses, including the factors that did not change during the year.
Most of our adversely classified loans (special mention and substandard - see our definition for these classifications in Note 5,
Loans
, to the notes to our Consolidated Financial Statements) continued to perform under their contractual terms. The increase in nonaccrual and impaired loans from
2016
to
2017
was due to several large commercial and residential real estate loans moving into nonaccrual status due to a lack of performance.
III. NONINTEREST INCOME
The majority of our noninterest income constitutes fee income from services, principally fees and commissions from fiduciary services, deposit account service charges, insurance commissions, net gains (losses) on securities transactions and other recurring fee income.
ANALYSIS OF NONINTEREST INCOME
(Dollars In Thousands)
|
Years Ended December 31,
|
Change From Prior Year
|
||||||||||||||||||||||||
|
2016 to 2017
|
2015 to 2016
|
||||||||||||||||||||||||
|
2017
|
2016
|
2015
|
Amount
|
%
|
Amount
|
%
|
|||||||||||||||||||
|
Income from Fiduciary Activities
|
$
|
8,417
|
|
$
|
7,783
|
|
$
|
7,762
|
|
$
|
634
|
|
8.1
|
%
|
$
|
21
|
|
0.3
|
%
|
||||||
|
Fees for Other Services to Customers
|
9,591
|
|
9,469
|
|
9,220
|
|
122
|
|
1.3
|
|
249
|
|
2.7
|
|
|||||||||||
|
Insurance Commissions
|
8,612
|
|
8,668
|
|
8,967
|
|
(56
|
)
|
(0.6
|
)
|
(299
|
)
|
(3.3
|
)
|
|||||||||||
|
Net (Loss) Gain on Securities Transactions
|
(448
|
)
|
(22
|
)
|
129
|
|
(426
|
)
|
1,936.4
|
|
(151
|
)
|
(117.1
|
)
|
|||||||||||
|
Net Gain on Sales of Loans
|
546
|
|
821
|
|
692
|
|
(275
|
)
|
(33.5
|
)
|
129
|
|
18.6
|
|
|||||||||||
|
Other Operating Income
|
927
|
|
1,113
|
|
1,354
|
|
(186
|
)
|
(16.7
|
)
|
(241
|
)
|
(17.8
|
)
|
|||||||||||
|
Total Noninterest Income
|
$
|
27,645
|
|
$
|
27,832
|
|
$
|
28,124
|
|
$
|
(187
|
)
|
(0.7
|
)
|
$
|
(292
|
)
|
(1.0
|
)
|
||||||
2017
Compared to
2016
:
Total noninterest income in
2017
was
$27.6 million
,
a decrease
of
$187 thousand
, or
0.7%
, from total noninterest income of
$27.8 million
for
2016
. Sales of securities resulted in a loss of
$448 thousand
in
2017
compared to a loss of
$22 thousand
in
2016
, resulting in a
$426 thousand
larger loss. Net gains on the sales of loans
decreased
in
2017
to
$546 thousand
, from
$821 thousand
in
2016
,
a decrease
of
$275 thousand
, or
33.5%
. Income from fiduciary activities increased from
2016
to
2017
by
$634 thousand
and insurance commissions
decreased
by
$56 thousand
, or
0.6%
from
2016
to
2017
. Other operating income decreased by
$186 thousand
, or
16.7%
between the two years.
#
34
Assets under trust administration and investment management at
December 31, 2017
were
$1.453 billion
,
an increase
of
$151.6 million
, or
11.6%
, from the prior year-end balance of
$1.301 billion
. Income from fiduciary services for
2017
increased by
$634 thousand
, or
8.1%
above the total for
2016
. Much of the increase in balance of assets under trust administration and investment management was attributable to market performance.
Fees for other services to customers (primarily service charges on deposit accounts, revenues related to the sale of mutual funds to our customers by third party providers, income from debit card transactions, and servicing income on sold loans) were
$9.6 million
for
2017
, an increase of $
122 thousand
, or
1.3%
, from
2016
. The principal cause of the increase was an increase in income from debit card transactions, offset in part by a decline in fee income from service charges on deposit accounts and overdraft fee income. In 2011, VISA reduced its debit interchange rates to comply with new Debit Charges Regulatory Requirements issued by the Federal Reserve Board. In subsequent years, this reduced rate structure imposed on large banks has resulted in smaller banks like ours reducing rates as well, for competitive reasons, which has negatively impacted our fee income. However, debit card usage by our customers continues to grow, which has had (and if such growth persists, will continue to have) a positive impact on our debit card fee income that has, in most subsequent periods offset, in full or in large part, the negative impact of lower rates.
Net gains on sales of loans amounted to
$546 thousand
during
2017
a decrease of
$275 thousand
or
33.5%
from the
2016
level. The reduced gain is consistent with the amount of total loans sold between the two years, which decreased from
$25.0 million
in
2016
to
$17.2 million
in
2017
, a
31.0%
decrease. The rate at which we sell mortgage loan originations in future periods will depend on various circumstances, including prevailing mortgage rates, other lending opportunities, capital and liquidity needs, and the ready availability of a market for such sales. We are unable to predict what our retention rate of such loans in future periods may be, although our retention rates have increased in each of the last 3 years, as the long-term decline in mortgage rates has bottomed out and rates have stabilized. We generally retain servicing rights for loans originated and sold by us, which also generates additional noninterest income in subsequent periods (fees for other services to customers). Other operating income includes net gains on the sale of other real estate owned as well as other miscellaneous revenues, which tend to fluctuate from year to year.
2016 Compared to 2015:
Total noninterest income in 2016 was $27.8 million, a decrease of $292 thousand, or 1.0%, from total noninterest income of $28.1 million for 2015. Sales of securities resulted in a loss of $22 thousand in 2016 compared to a gain of $129 thousand in 2015, a net decrease of $151 thousand. Net gains on the sales of loans increased in 2016 to $821 thousand, from $692 thousand in 2015, an increase of $129 thousand, or 18.6%. Income from fiduciary activities increased from 2015 to 2016, by $21 thousand and insurance commissions decreased by $299 thousand, or 3.3% from 2015 to 2016, and other operating income decreased by $241 thousand, or 17.8% between the two years.
Assets under trust administration and investment management at December 31, 2016 were $1.301 billion, an increase of $68.5 million, or 5.6%, from the prior year-end balance of $1.233 billion. Income from fiduciary services for 2016 increased by $21 thousand, or 0.3% above the total for 2015. Much of the increase in balance of assets under trust administration and investment management was attributable to activity late in the third quarter, primarily in response to market performance. In addition, a significant portion of the current year's growth was derived from increased custodial accounts which are business lines that generate lower fee income as a percentage of assets under management.
Fees for other services to customers (primarily service charges on deposit accounts, revenues related to the sale of mutual funds to our customers by third party providers, income from debit card transactions, and servicing income on sold loans) were $9.5 million for 2016, an increase of $249 thousand, or 2.7%, from 2015. The principal cause of the increase was an increase in income from debit card transactions, offset in part by a decline in fee income from service charges on deposit accounts and overdraft fee income. In 2011, VISA reduced its debit interchange rates to comply with new Debit Charges Regulatory Requirements issued by the Federal Reserve Board. In subsequent years, this reduced rate structure imposed on large banks has resulted in smaller banks like ours reducing rates as well, for competitive reasons, which has negatively impacted our fee income. However, debit card usage by our customers continues to grow, which has had (and if such growth persists, will continue to have) a positive impact on our debit card fee income that in most subsequent periods has largely offset or more than offset the negative impact of lower rates.
Noninterest income from insurance commissions decreased by $299 thousand, or 3.3%, between the two periods. This net decrease was primarily attributable to our sale in October 2015 of a specialty line of insurance business previously maintained by one of our insurance agency subsidiaries, specifically, insurance services to out-of-market amateur sports management associations (see "Sale of Loomis Agency" below) which was partially offset by an increase in the contingent annual payments we receive based on the loss experience of our property and casualty insurance clients. We expect that income from insurance commissions will continue to constitute a significant and stable source of noninterest income for us in upcoming periods. We may continue in the future to expand our market profile in this line of business, including through suitable acquisitions, if favorable opportunities should arise.
Net gains on sales of loans amounted to $821 thousand during 2016 an increase of $129 thousand or 18.6% over the 2015 level. This reflects a similar percentage increase in total loans sold between the two years, which increased from $21.1 million in 2015 to $25.0 million in 2016, an 18.7% increase. The rate at which we sell mortgage loan originations in future periods will depend on various circumstances, including prevailing mortgage rates, other lending opportunities, capital and liquidity needs, and the ready availability of a market for such sales. We are unable to predict what our retention rate of such loans in future periods may be, although our retention rates have increased in each of the last 3 years, as the long-term decline in mortgage rates has bottomed out and rates have stabilized. We generally retain servicing rights for loans originated and sold by us, which also generates additional noninterest income in subsequent periods (fees for other services to customers). Other operating income includes net gains on the sale of other real estate owned as well as other miscellaneous revenues, which tend to fluctuate from year to year.
#
35
IV. NONINTEREST EXPENSE
Noninterest expense is the measure of the delivery cost of services, products and business activities of a company. The key components of noninterest expense are presented in the following table.
ANALYSIS OF NONINTEREST EXPENSE
(Dollars In Thousands)
|
Years Ended December 31,
|
Change From Prior Year
|
||||||||||||||||||||||||
|
2016 to 2017
|
2015 to 2016
|
||||||||||||||||||||||||
|
2017
|
2016
|
2015
|
Amount
|
%
|
Amount
|
%
|
|||||||||||||||||||
|
Salaries and Employee Benefits
|
$
|
37,166
|
|
$
|
34,330
|
|
$
|
33,064
|
|
$
|
2,836
|
|
8.3
|
%
|
$
|
1,266
|
|
3.8
|
%
|
||||||
|
Occupancy Expense of Premises, Net
|
4,911
|
|
4,983
|
|
5,005
|
|
(72
|
)
|
(1.4
|
)
|
(22
|
)
|
(0.4
|
)
|
|||||||||||
|
Furniture and Equipment Expense
|
4,650
|
|
4,419
|
|
4,262
|
|
231
|
|
5.2
|
|
157
|
|
3.7
|
|
|||||||||||
|
FDIC Regular Assessment
|
891
|
|
1,076
|
|
1,186
|
|
(185
|
)
|
(17.2
|
)
|
(110
|
)
|
(9.3
|
)
|
|||||||||||
|
Amortization of Intangible Assets
|
279
|
|
297
|
|
327
|
|
(18
|
)
|
(6.1
|
)
|
(30
|
)
|
(9.2
|
)
|
|||||||||||
|
Other Operating Expense
|
14,810
|
|
14,504
|
|
13,586
|
|
306
|
|
2.1
|
|
918
|
|
6.8
|
|
|||||||||||
|
Total Noninterest Expense
|
$
|
62,707
|
|
$
|
59,609
|
|
$
|
57,430
|
|
$
|
3,098
|
|
5.2
|
|
$
|
2,179
|
|
3.8
|
|
||||||
|
Efficiency Ratio
|
56.96
|
%
|
57.51
|
%
|
58.62
|
%
|
(0.55
|
)%
|
(1.0
|
)
|
(1.11
|
)%
|
(1.9
|
)
|
|||||||||||
2017
compared to
2016
:
Noninterest expense for
2017
amounted to
$62.7 million
, an increase of
$3.1 million
, or
5.2%
, from
2016
. For
2017
, our efficiency ratio was
56.96%
. This ratio, which is a commonly used non-GAAP financial measure in the banking industry, is a comparative measure of a financial institution's operating efficiency. The efficiency ratio (a ratio where lower is better), as we define it, is the ratio of operating noninterest expense (excluding intangible asset amortization and any FHLB prepayment penalties) to net interest income (on a tax-equivalent basis) plus operating noninterest income (excluding net securities gains or losses). See the discussion of the efficiency ratio on page
4
of this Report under the heading “Use of Non-GAAP Financial Measures.” Our efficiency ratios in recent periods compared favorably to the ratios of our peer group. For the nine month period ended
September 30, 2017
, our peer group ratio (as calculated by the Federal Reserve Bank's most recently available report) was
65.29%
, compared to our ratio for such period (not adjusted) of
55.79%
.
Salaries and employee benefits expense, which typically represents between 55% and 60% of total noninterest expense, increased by
$2.8 million
, or
8.3%
, from
2016
to
2017
. The net increase reflects a
7.4%
increase in employee benefits, including increases in expenses related to our defined benefit pension and post retirement plans, health benefit plans and incentive compensation plans. Salary expenses increased by
8.6%
and were attributable to increased staffing levels as well as normal salary increases.
Occupancy expense reduced slightly due to large repair expenses recorded in 2016 and fewer rented insurance locations while furniture and equipment expenses increased modestly from
2016
to
2017
. The increase in equipment expense was primarily attributable to increased data processing costs.
Other operating expense increased
$306.0 thousand
, or
2.1%
, from
2016
. This was primarily the result of an increase in the cost of providing our customers with a wide and more complex variety of electronic banking products and services.
2016 compared to 2015:
Noninterest expense for 2016 amounted to $59.6 million, an increase of $2.2 million, or 3.8%, from 2015. For 2016, our efficiency ratio was 57.51%. This ratio, which is a commonly used non-GAAP financial measure in the banking industry, is a comparative measure of a financial institution's operating efficiency. The efficiency ratio (a ratio where lower is better), as we define it, is the ratio of operating noninterest expense (excluding intangible asset amortization and any FHLB prepayment penalties) to net interest income (on a tax-equivalent basis) plus operating noninterest income (excluding net securities gains or losses). See the discussion of the efficiency ratio on page 4 of this Report under the heading “Use of Non-GAAP Financial Measures.” Our efficiency ratios in recent periods compared favorably to the ratios of our peer group. For the nine month period ended September 30, 2016, our peer group ratio (as calculated by the Federal Reserve Bank's most recently available report) was 67.14%, compared to our ratio for such period (not adjusted) of 57.15%.
Salaries and employee benefits expense, which typically represents between 55% and 60% of total noninterest expense, increased by $1.3 million, or 3.8%, from 2015 to 2016. The net increase reflects a 2.9% increase in employee benefits, including increases in expenses related to our defined benefit pension and post retirement plans, health benefit plans and incentive compensation plans. Salary expenses increased by 4.2% and were attributable to increased staffing levels as we expanded in our southern market area and to normal salary increases.
Occupancy expense remained consistent while furniture and equipment expenses increased modestly from 2015 to 2016. The increase in equipment expense was primarily attributable to increased data processing costs.
Other operating expense increased $918.0 thousand, or 6.8%, from 2015. This was primarily the result of an increase in the cost of providing our customers with a wide and more complex variety of electronic banking products and services.
#
36
V. INCOME TAXES
The following table sets forth our provision for income taxes and effective tax rates for the periods presented.
INCOME TAXES AND EFFECTIVE RATES
(Dollars In Thousands)
|
Years Ended December 31,
|
Change From Prior Year
|
||||||||||||||||||||||||
|
2016 to 2017
|
2015 to 2016
|
||||||||||||||||||||||||
|
2017
|
2016
|
2015
|
Amount
|
%
|
Amount
|
%
|
|||||||||||||||||||
|
Provision for Income Taxes
|
$
|
10,529
|
|
$
|
11,215
|
|
$
|
10,610
|
|
$
|
(686
|
)
|
(6.1
|
)%
|
$
|
605
|
|
5.7
|
%
|
||||||
|
Effective Tax Rate
|
26.4
|
%
|
29.7
|
%
|
30.1
|
%
|
(3.3
|
)%
|
(11.1
|
)%
|
(0.4
|
)%
|
(1.3
|
)%
|
|||||||||||
The provisions for federal and state income taxes amounted to
$10.5 million
for
2017
,
$11.2 million
for
2016
, and
$10.6 million
for
2015
. The effective income tax rates for
2017
,
2016
and
2015
were
26.4%
,
29.7%
and
30.1%
, respectively. The 2017 rate was benefited by
2.80%
as a result of the revaluing of our net deferred tax liability pursuant to the Tax Act.
The Tax Act was enacted on December 22, 2017 and required the Company to reflect changes associated with the law's provisions in its 2017 fourth quarter. The law is complex and has extensive implications for the Company's federal and state current and deferred taxes and income tax expense. The Company has recorded and reported the effects of the law's impacts in its financial statements for the period ended December 31, 2017. These effects include the remeasurement of our net deferred tax liability to the lower rate that will apply in future periods. See Note 15,
Income Taxes,
of the notes to our Consolidated Financial Statements for more information.
C. FINANCIAL CONDITION
I. INVESTMENT PORTFOLIO
Investment securities are classified as held-to-maturity, trading, or available-for-sale, depending on the purposes for which such securities are acquired and thereafter held. Securities held-to-maturity are debt securities that we have both the positive intent and ability to hold to maturity; such securities are stated at amortized cost. Debt and equity securities that are bought and held principally for the purpose of sale in the near term are classified as trading securities and are reported at fair value with unrealized gains and losses included in earnings. Debt and equity securities not classified as either held-to-maturity or trading securities are classified as available-for-sale and are reported at fair value with unrealized gains and losses excluded from earnings and reported net of taxes in accumulated other comprehensive income or loss. During
2017
,
2016
and
2015
, we held no trading securities. Set forth below is certain information about our securities available-for-sale portfolio and securities held-to-maturity portfolio as of recent year-ends.
Securities Available-for-Sale
:
The following table sets forth the carrying value of our securities available-for-sale portfolio at year-end
December 31, 2017
,
December 31, 2016
and
December 31, 2015
.
SECURITIES AVAILABLE-FOR-SALE
(Dollars In Thousands)
|
December 31,
|
|||||||||||
|
2017
|
2016
|
2015
|
|||||||||
|
U.S. Government & Agency Obligations
|
$
|
59,894
|
|
$
|
147,377
|
|
$
|
155,782
|
|
||
|
State and Municipal Obligations
|
10,349
|
|
27,690
|
|
52,408
|
|
|||||
|
Mortgage-Backed Securities
|
227,596
|
|
167,239
|
|
178,588
|
|
|||||
|
Corporate and Other Debt Securities
|
800
|
|
3,308
|
|
14,299
|
|
|||||
|
Mutual Funds and Equity Securities
|
1,561
|
|
1,382
|
|
1,232
|
|
|||||
|
Total
|
$
|
300,200
|
|
$
|
346,996
|
|
$
|
402,309
|
|
||
In all periods, Mortgage-Backed Securities consisted solely of mortgage pass-through securities and Collateralized Mortgage Obligations ("CMOs") issued or guaranteed by U.S. federal agencies. Mortgage pass-through securities provide to the investor monthly portions of principal and interest pursuant to the contractual obligations of the underlying mortgages. CMOs are pools of mortgage-backed securities, the repayments on which have been separated into two or more components (tranches), where each tranche has a separate estimated life and yield. Our practice has been to purchase only pass-through securities and CMOs that are issued or guaranteed by U.S. federal agencies, and the tranches of CMOs that we purchase generally are those having shorter maturities.
#
37
The following table sets forth the maturities of the debt securities in our available-for-sale portfolio as of
December 31, 2017
. CMOs and other mortgage-backed securities are included in the table based on their expected average lives.
MATURITIES OF DEBT SECURITIES AVAILABLE-FOR-SALE
(Dollars In Thousands)
|
Within
One
Year
|
After
1 But
Within
5 Years
|
After
5 But
Within
10 Years
|
After
10 Years
|
Total
|
||||||||||
|
U.S. Government & Agency Obligations
|
12,956
|
|
46,938
|
|
—
|
|
—
|
|
59,894
|
|
||||
|
State and Municipal Obligations
|
8,896
|
|
683
|
|
250
|
|
520
|
|
10,349
|
|
||||
|
Mortgage-Backed Securities
|
2,642
|
|
102,126
|
|
75,044
|
|
47,784
|
|
227,596
|
|
||||
|
Corporate and Other Debt Securities
|
—
|
|
—
|
|
—
|
|
800
|
|
800
|
|
||||
|
Total
|
24,494
|
|
149,747
|
|
75,294
|
|
49,104
|
|
298,639
|
|
||||
The following table sets forth the tax-equivalent yields of the debt securities in our available-for-sale portfolio at
December 31, 2017
.
YIELDS ON SECURITIES AVAILABLE-FOR-SALE
(Fully Tax-Equivalent Basis)
|
Within
One
Year
|
After
1 But
Within
5 Years
|
After
5 But
Within
10 Years
|
After
10 Years
|
Total
|
||||||||||
|
U.S. Government & Agency Obligations
|
1.18
|
%
|
1.44
|
%
|
—
|
%
|
—
|
%
|
1.38
|
%
|
||||
|
State and Municipal Obligations
|
1.83
|
|
6.76
|
|
7.37
|
|
8.14
|
|
2.60
|
|
||||
|
Mortgage-Backed Securities
|
3.17
|
|
2.11
|
|
2.36
|
|
1.84
|
|
2.15
|
|
||||
|
Corporate and Other Debt Securities
|
2.89
|
|
2.10
|
|
—
|
|
4.08
|
|
4.08
|
|
||||
|
Total
|
1.63
|
|
1.92
|
|
2.37
|
|
1.95
|
|
2.02
|
|
||||
The yields on obligations of states and municipalities exempt from federal taxation were computed on a fully tax-equivalent basis using a marginal tax rate of 35%. The yields on other debt securities shown in the table above are calculated by dividing annual interest, including accretion of discounts and amortization of premiums, by the amortized cost of the securities at
December 31, 2017
.
At
December 31, 2017
and
2016
, the weighted average maturity was
5.9
and
3.4
years, respectively, for debt securities in the available-for-sale portfolio.
At
December 31, 2017
, the net unrealized
losses
on securities available-for-sale amounted to
$1.7 million
. The net unrealized gain or loss on such securities, net of tax, is reflected in accumulated other comprehensive income/loss. The net unrealized
losses
on securities available-for-sale was
$619 thousand
at
December 31, 2016
. For both periods, the net unrealized losses were primarily attributable to an average increase in market rates between the date of purchase and the balance sheet date resulting in higher valuations of the portfolio securities.
As part of the Company's balance sheet management process, the Company executed securities transactions, primarily late in the fourth quarter, pursuant to which the Company sold U.S. Treasury Notes, U.S. Agency debentures and U.S. Agency issued mortgage-backed securities from its available-for-sale portfolio, realizing a
$458 thousand
net loss on sale. Utilizing the sale proceeds, Arrow purchased U.S. Agency issued mortgage-backed securities and U.S. Agency collateralized mortgage obligations with fixed rate and floating rate coupon structures, which were allocated to the available-for-sale portfolio.
For further information regarding our portfolio of securities available-for-sale, see Note 4,
Investment Securities
, to the notes to our Consolidated Financial Statements.
#
38
Securities Held-to-Maturity
:
The following table sets forth the carrying value of our portfolio of securities held-to-maturity at December 31 of each of the last three years.
SECURITIES HELD-TO-MATURITY
(Dollars In Thousands)
|
December 31,
|
|||||||||||
|
2017
|
2016
|
2015
|
|||||||||
|
State and Municipal Obligations
|
$
|
275,530
|
|
$
|
268,892
|
|
$
|
226,053
|
|
||
|
Mortgage Backed Securities - Residential
|
60,377
|
|
75,535
|
|
93,558
|
|
|||||
|
Corporate and Other Debt Securities
|
—
|
|
1,000
|
|
1,000
|
|
|||||
|
Total
|
$
|
335,907
|
|
$
|
345,427
|
|
$
|
320,611
|
|
||
For a description of certain categories of securities held in the securities held-to-maturity portfolio on the reporting dates, as listed in the table above, specifically, "Mortgage-Backed Securities--Residential" and "Corporate and Other Debt Securities," see the paragraph under "SECURITIES AVAILABLE-FOR-SALE" table, above.
For information regarding the fair value of our portfolio of securities held-to-maturity at
December 31, 2017
, see Note 4,
Investment Securities
, to the notes to our Consolidated Financial Statements.
The following table sets forth the maturities of our portfolio of securities held-to-maturity as of
December 31, 2017
.
MATURITIES OF DEBT SECURITIES HELD-TO-MATURITY
(Dollars In Thousands)
|
Within
One Year
|
After 1 But
Within 5 Years
|
After 5 But
Within 10 Years
|
After
10 Years
|
Total
|
|||||||||||||||
|
State and Municipal Obligations
|
$
|
38,422
|
|
$
|
80,789
|
|
$
|
152,918
|
|
$
|
3,401
|
|
$
|
275,530
|
|
||||
|
Mortgage Backed Securities - Residential
|
—
|
|
54,212
|
|
6,165
|
|
—
|
|
60,377
|
|
|||||||||
|
Corporate and Other Debt Securities
|
—
|
|
—
|
|
—
|
|
—
|
|
—
|
|
|||||||||
|
Total
|
$
|
38,422
|
|
$
|
135,001
|
|
$
|
159,083
|
|
$
|
3,401
|
|
$
|
335,907
|
|
||||
The following table sets forth the tax-equivalent yields of our portfolio of securities held-to-maturity at
December 31, 2017
.
YIELDS ON SECURITIES HELD-TO-MATURITY
(Fully Tax-Equivalent Basis)
|
Within
One Year
|
After 1 But
Within 5 Years
|
After 5 But
Within 10 Years
|
After
10 Years
|
Total
|
||||||||||
|
State and Municipal Obligations
|
3.45
|
%
|
3.90
|
%
|
2.82
|
%
|
4.43
|
%
|
3.24
|
%
|
||||
|
Mortgage Backed Securities - Residential
|
—
|
|
2.32
|
|
2.51
|
|
—
|
|
2.34
|
%
|
||||
|
Corporate and Other Debt Securities
|
—
|
|
—
|
|
—
|
|
—
|
|
—
|
%
|
||||
|
Total
|
3.45
|
%
|
2.33
|
%
|
2.71
|
%
|
4.43
|
%
|
2.66
|
%
|
||||
The yields shown in the table above are calculated by dividing annual interest, including accretion of discounts and amortization of premiums, by the amortized cost of the securities at
December 31, 2017
. Yields on obligations of states and municipalities exempt from federal taxation were computed on a fully tax-equivalent basis using a marginal tax rate of 35%.
At
December 31, 2017
and
2016
, the weighted average maturity was
4.2
and
4.3
years, respectively, for the debt securities in the held-to-maturity portfolio.
#
39
II. LOAN PORTFOLIO
The amounts and respective percentages of loans outstanding represented by each principal category on the dates indicated were as follows:
a. Types of Loans
(Dollars In Thousands)
|
December 31,
|
|||||||||||||||||||||||||||||
|
2017
|
2016
|
2015
|
2014
|
2013
|
|||||||||||||||||||||||||
|
Amount
|
%
|
Amount
|
%
|
Amount
|
%
|
Amount
|
%
|
Amount
|
%
|
||||||||||||||||||||
|
Commercial
|
$
|
129,249
|
|
7
|
$
|
105,155
|
|
6
|
$
|
102,587
|
|
7
|
$
|
99,511
|
|
7
|
$
|
87,893
|
|
7
|
|||||||||
|
Commercial Real Estate –
Construction
|
21,972
|
|
1
|
36,948
|
|
2
|
31,018
|
|
2
|
18,815
|
|
1
|
27,815
|
|
2
|
||||||||||||||
|
Commercial Real Estate –
Other
|
422,276
|
|
22
|
394,698
|
|
23
|
353,921
|
|
22
|
321,297
|
|
23
|
288,119
|
|
23
|
||||||||||||||
|
Consumer
|
602,827
|
|
31
|
537,361
|
|
30
|
464,523
|
|
31
|
437,041
|
|
31
|
401,853
|
|
32
|
||||||||||||||
|
Residential Real Estate
|
774,446
|
|
39
|
679,106
|
|
39
|
621,903
|
|
38
|
536,604
|
|
38
|
460,792
|
|
36
|
||||||||||||||
|
Total Loans
|
1,950,770
|
|
100
|
1,753,268
|
|
100
|
1,573,952
|
|
100
|
1,413,268
|
|
100
|
1,266,472
|
|
100
|
||||||||||||||
|
Allowance for Loan Losses
|
(18,586
|
)
|
(17,012
|
)
|
(16,038
|
)
|
(15,570
|
)
|
(14,434
|
)
|
|||||||||||||||||||
|
Total Loans, Net
|
$
|
1,932,184
|
|
$
|
1,736,256
|
|
$
|
1,557,914
|
|
$
|
1,397,698
|
|
$
|
1,252,038
|
|
||||||||||||||
Maintenance of High Quality in the Loan Portfolio:
For many reasons, including our credit underwriting standards and our market stability, we maintain a high level of asset quality. In general, we underwrite our residential real estate loans to secondary market standards for prime loans. We have never engaged in subprime mortgage lending as a business line. We have not extended or purchased any so-called "Alt-A", "negative amortization", "option ARM", or "negative equity" mortgage loans. On occasion we have made loans to borrowers having a FICO score of 650 or below, where special circumstances justified doing so, or have had extensions of credit outstanding to borrowers who developed credit problems after origination resulting in deterioration of their FICO scores.
We also on occasion have extended community development loans to borrowers whose creditworthiness is below our normal standards as part of the community support program we have developed in fulfillment of our statutorily-mandated duty to support low- and moderate-income borrowers within our service area. However, we are a prime lender and apply prime lending standards and this, together with the fact that the service area in which we make most of our loans did not experience as severe a decline in property values or economic conditions generally as many other areas of the U.S. do, are the principal reasons that we have not experienced significant deterioration in our loan portfolio, including the real estate categories of our loan portfolio.
However, like all other banks, we operate in an environment in which identifying opportunities for secure and profitable expansion of our loan portfolio remains challenging, competition is intense, and margins are very tight. If the U.S. economy and our regional economy continue to experience only very modest growth, our individual borrowers will presumably continue to proceed cautiously in taking on new or additional debt. Many small businesses are operating on very narrow margins and many families continue to live on very tight budgets. If the U.S. economy or our regional economy worsens in upcoming periods, which we think unlikely but possible, we may experience elevated charge-offs, higher provisions to our loan loss reserve, and increasing expense related to asset maintenance and supervision.
Residential Real Estate Loans
: In recent years, residential real estate and home equity loans have represented the largest single segment of our loan portfolio (comprising approximately
40%
of the entire portfolio at
December 31, 2017
), eclipsing both other consumer loans (
31%
of the portfolio) and our commercial and commercial real estate loans (
29%
). Our gross originations for residential real estate loans (including refinancings of mortgage loans) were
$202.9 million
,
$176.5 million
and
$166.6 million
for the years
2017
,
2016
, and
2015
, respectively. During each of these years, these gross origination totals have significantly exceeded the sum of repayments and prepayments of such loans previously in the portfolio, but we have also sold significant portions of these originations in the secondary market, primarily to Freddie Mac, particularly when rates on conventional 30-year fixed rate real estate mortgages reached historically low levels in the 2013-2014 period. Sales of originations amounted to
$17.2 million
for
2017
,
$25.0 million
for
2016
and
$21.1 million
for
2015
, which represented a significant percentage of the gross originations in each year (
9.6%
,
16.3%
and
14.6%
, respectively). We expect to continue to sell a portion of our mortgage loan originations in upcoming periods, although perhaps a decreasing percentage of overall originations if rates continue their slow rise across longer maturities. At the same time, if prevailing rates rise substantially, we may see a slowdown in loan growth and perhaps decreasing total originations, particularly if the general economy also falters. At some point, it is possible that we may experience a decrease in our outstanding balances in this largest segment of our portfolio. Additionally, if our local economy or real estate market should suffer a major downturn, the quality of our real estate portfolio may also be negatively impacted.
Commercial, Commercial Real Estate and Construction and Land Development Loans:
Over the last decade, we have experienced moderate and occasionally strong demand for commercial and commercial real estate loans. These loan balances have generally increased, both in dollar amount and as a percentage of the overall loan portfolio. Particularly over the last three years, commercial and commercial real estate loan growth was significant as outstanding balances increased by
$36.7 million
,
#
40
$49.3 million, and $47.9 million in
2017
,
2016
and
2015
, respectively. Growth was restrained somewhat by heightened competition for credits in an extremely low rate environment.
Substantially all commercial and commercial real estate loans in our portfolio were extended to businesses or borrowers located in our regional markets. Many of the loans in the commercial portfolio have variable rates tied to prime or FHLBNY rates. Although on a national scale the commercial real estate market suffered a major downturn in the 2008-2009 period (from which it has largely recovered), we did not experience any significant weakening in the quality of our commercial loan portfolio, nor have we in the subsequent years.
However, it is entirely possible that we may experience a reduction in the demand for commercial and commercial real estate loans and/or a weakening in the quality of our portfolio in upcoming periods. But at period-end
2017
, the business sector, at least in our service area, appeared to be in reasonably good financial condition.
Automobile Loans (primarily through indirect lending):
At
December 31, 2017
, our automobile loans (primarily loans originated through dealerships located primarily in upstate New York and Vermont) represented nearly a third of loans in our portfolio, and continue to be a significant component of our business.
During recent years, including 2017, automobile sales have remained strong, due initially to an aging fleet but more recently to a modest growth in consumer optimism. Our automobile loan origination volume for the last three years was very strong at
$306.6 million
, $286.7 million and $228.8 million for
2017
,
2016
and
2015
, respectively.
Our indirect automobile loan portfolio reflects a modest shift to a slightly larger (but still very small in absolute terms) percentage of such loans that have been extended to individuals with lower credit scores matching a well-known trend in the auto lending market. In addition, our average maturity for automobile loan originations has expanded in recent years as well, again reflective of a larger market development. In
2017
, net charge-offs on our automobile loans remained very low at
0.10%
of average balances. Net charge-offs were
$586 thousand
for
2017
compared to net charge-offs of $662 thousand for
2016
, a slight decrease, despite this modest shift in the quality of the portfolio noted above. Our experienced lending staff not only utilizes credit evaluation software tools but also reviews and evaluates each loan individually prior to the loan being funded. We believe our disciplined approach to evaluating risk has contributed to maintaining our strong loan quality in this portfolio. However, if weakness in auto demand returns, our portfolio is likely to experience limited, if any, overall growth, either in absolute amounts or as a percentage of the total portfolio, regardless of whether the auto company affiliates are offering highly-subsidized loans. If demand levels off, or slackens, so will our financial performance in this important loan category.
The following table indicates the changing mix in our loan portfolio by including the quarterly average balances for our significant loan products for the past five quarters. The remaining quarter-by-quarter tables present the percentage of total loans represented by each category and the annualized tax-equivalent yield of each category.
LOAN PORTFOLIO
Quarterly Average Loan Balances
(Dollars In Thousands)
|
Quarters Ended
|
|||||||||||||||||||
|
12/31/2017
|
9/30/2017
|
6/30/2017
|
3/31/2017
|
12/31/2016
|
|||||||||||||||
|
Commercial and Commercial Real Estate
|
$
|
564,073
|
|
$
|
561,260
|
|
$
|
556,014
|
|
$
|
541,187
|
|
$
|
532,456
|
|
||||
|
Residential Real Estate
|
584,981
|
|
563,793
|
|
538,884
|
|
518,263
|
|
490,427
|
|
|||||||||
|
Home Equity
|
137,975
|
|
137,251
|
|
138,125
|
|
135,910
|
|
135,939
|
|
|||||||||
|
Consumer Loans
1
|
643,562
|
|
630,462
|
|
609,520
|
|
585,753
|
|
567,916
|
|
|||||||||
|
Total Loans
|
$
|
1,930,590
|
|
$
|
1,892,766
|
|
$
|
1,842,543
|
|
$
|
1,781,113
|
|
$
|
1,726,738
|
|
||||
Percentage of Total Quarterly Average Loans
|
Quarters Ended
|
||||||||||||||
|
12/31/2017
|
9/30/2017
|
6/30/2017
|
3/31/2017
|
12/31/2016
|
||||||||||
|
Commercial and Commercial Real Estate
|
29.2
|
%
|
29.7
|
%
|
30.2
|
%
|
30.4
|
%
|
30.8
|
%
|
||||
|
Residential Real Estate
|
30.3
|
|
29.8
|
|
29.2
|
|
29.1
|
|
28.4
|
|
||||
|
Home Equity
|
7.1
|
|
7.3
|
|
7.5
|
|
7.6
|
|
7.9
|
|
||||
|
Consumer Loans
1
|
33.4
|
|
33.2
|
|
33.1
|
|
32.9
|
|
32.9
|
|
||||
|
Total Loans
|
100.0
|
%
|
100.0
|
%
|
100.0
|
%
|
100.0
|
%
|
100.0
|
%
|
||||
#
41
Quarterly Tax-Equivalent Yield on Loans
|
Quarters Ended
|
||||||||||||||
|
12/31/2017
|
9/30/2017
|
6/30/2017
|
3/31/2017
|
12/31/2016
|
||||||||||
|
Commercial and Commercial Real Estate
|
4.36
|
%
|
4.32
|
%
|
4.30
|
%
|
4.25
|
%
|
4.29
|
%
|
||||
|
Residential Real Estate
|
3.99
|
|
3.98
|
|
4.03
|
|
4.10
|
|
4.09
|
|
||||
|
Home Equity
|
3.57
|
|
3.55
|
|
3.41
|
|
3.28
|
|
3.11
|
|
||||
|
Consumer Loans
1
|
3.29
|
|
3.23
|
|
3.21
|
|
3.14
|
|
3.18
|
|
||||
|
Total Loans
|
3.83
|
%
|
3.80
|
%
|
3.79
|
%
|
3.76
|
%
|
3.78
|
%
|
||||
1
Other Consumer Loans includes certain home improvement loans secured by mortgages. However, these same loan balances are reported as
Residential Real Estate in the table of period-end balances on page
40
, captioned “Types of Loans.”
During the fourth quarter of
2017
, the average yield on our loan portfolio from the average yield during the fourth quarter of
2016
, increased from
3.78%
to
3.83%
. The yields on new 30 year fixed-rate residential real estate loans (the choice of most of our mortgage customers) increased during
2017
. We continued to sell a portion of our originations into the secondary market, specifically, to Freddie Mac, although we retained a higher proportion of our gross originations in
2017
than in
2016
, continuing a multi-year trend of expanding our retention rate versus our sale rate.
In
2017
, the average yield on the loan portfolio continued to rise at a slightly faster pace than the cost of our deposits, although our net interest margin held steady during the year. We expect that average loan yields will continue to rise as the current rate environment continues, enhancing our ability to improve our average yield on loans.
In general, the yield (tax-equivalent interest income divided by average loans) on our loan portfolio and other earning assets has historically been impacted by changes in prevailing interest rates. We expect that such will continue to be the case; that is, that loan yields will continue to rise and fall with changes in prevailing market rates, although the timing and degree of responsiveness will be influenced by a variety of other factors, including the extent of federal government and Federal Reserve participation in the home mortgage market, the makeup of our loan portfolio, the shape of the yield curve, consumer expectations and preferences, and the rate at which the portfolio expands. Additionally, there is a significant amount of cash flow from normal amortization and prepayments in all loan categories, and this cash flow reprices at current rates as new loans are generated at the current yields.
The following table indicates the respective maturities and interest rate structure of our commercial and commercial real estate construction loans at
December 31, 2017
. For purposes of determining relevant maturities, loans are assumed to mature at (but not before) their scheduled repayment dates as required by contractual terms. Demand loans and overdrafts are included in the “Within 1 Year” maturity category. Most of the commercial construction loans are made with a commitment for permanent financing, whether extended by us or unrelated third parties. The maturity distribution below reflects the final maturity of the permanent financing.
b. Maturities and Sensitivities of Loans to Changes in Interest Rates
(In Thousands)
|
Within
1 Year
|
After 1
But Within
5 Years
|
After
5 Years
|
Total
|
||||||||||||
|
Commercial
|
$
|
33,000
|
|
$
|
65,727
|
|
$
|
30,522
|
|
$
|
129,249
|
|
|||
|
Commercial Real Estate - Construction
|
3,908
|
|
16,186
|
|
1,878
|
|
21,972
|
|
|||||||
|
Total
|
$
|
36,908
|
|
$
|
81,913
|
|
$
|
32,400
|
|
$
|
151,221
|
|
|||
|
Fixed Interest Rates
|
$
|
3,633
|
|
$
|
41,313
|
|
$
|
22,813
|
|
$
|
67,759
|
|
|||
|
Variable Interest Rates
|
33,275
|
|
40,599
|
|
9,588
|
|
83,462
|
|
|||||||
|
Total
|
$
|
36,908
|
|
$
|
81,912
|
|
$
|
32,401
|
|
$
|
151,221
|
|
|||
COMMITMENTS AND LINES OF CREDIT
Stand-by letters of credit represent extensions of credit granted in the normal course of business, which are not reflected in the financial statements at a given date because the commitments are not funded at that time. As of
December 31, 2017
, our total contingent liability for standby letters of credit amounted to
$3.5 million
. In addition to these instruments, we also have issued lines of credit to customers, including home equity lines of credit, commitments for residential and commercial construction loans and other personal and commercial lines of credit, which also may be unfunded or only partially funded from time-to-time. Commercial lines, generally issued for a period of one year, are usually extended to provide for the working capital requirements of the borrower. At
December 31, 2017
, we had outstanding unfunded loan commitments in the aggregate amount of approximately
$315.3 million
.
#
42
c. Risk Elements
1. Nonaccrual, Past Due and Restructured Loans
The amounts of nonaccrual, past due and restructured loans at year-end for each of the past five years are presented in the table on page
33
under the heading "Summary of the Allowance and Provision for Loan Losses."
Loans are placed on nonaccrual status either due to the delinquency status of principal and/or interest or a judgment by management that the full repayment of principal and interest is unlikely. Unless already placed on nonaccrual status, loans secured by home equity lines of credit are put on nonaccrual status when 120 days past due and residential real estate loans are put on nonaccrual status when 150 days past due. Commercial and commercial real estate loans are evaluated on a loan-by-loan basis and are placed on nonaccrual status when 90 days past due if the full collection of principal and interest is uncertain. Under the Uniform Retail Credit Classification and Account Management Policy established by banking regulators, fixed-maturity consumer loans not secured by real estate must generally be charged-off no later than when 120 days past due. Loans secured with non-real estate collateral in the process of collection are charged-down to the value of the collateral, less cost to sell. Open-end credits, residential real estate loans and commercial loans are evaluated for charge-off on a loan-by-loan basis when placed on nonaccrual status. We had no material commitments to lend additional funds on outstanding nonaccrual loans at
December 31, 2017
. Loans past due 90 days or more and still accruing interest are those loans which were contractually past due 90 days or more but because of expected repayments, were still accruing interest.
The balance of loans 30-89 days past due totaled
$8.9 million
at
December 31, 2017
and represented
0.46%
of loans outstanding at that date, as compared to approximately
$9.1 million
, or
0.52%
of loans outstanding at
December 31, 2016
. These non-current loans at
December 31, 2017
were composed of approximately
$7.1 million
of consumer loans (principally indirect automobile loans),
$1.7 million
of residential real estate loans and
$0.2 million
of commercial and commercial real estate loans.
We evaluate nonaccrual loans over $250 thousand and all troubled debt restructured loans individually for impairment. All our impaired loans are measured based on either (i) the present value of expected future cash flows discounted at the loan's effective interest rate, (ii) the loan's observable market price or (iii) the fair value of the collateral, less cost to sell, if the loan is collateral dependent. We determine impairment for collateralized loans based on the fair value of the collateral less estimated cost to sell. For other impaired loans, impairment is determined by comparing the recorded value of the loan to the present value of the expected cash flows, discounted at the loan's effective interest rate. We determine the interest income recognition method for impaired loans on a loan-by-loan basis. Based upon the borrowers' payment histories and cash flow projections, interest recognition methods include full accrual or cash basis. Our method for measuring all other loans is described in detail in Notes 2,
Summary of Significant Accounting Policies
, and 5,
Loans,
to the notes to our Consolidated Financial Statements.
Note 5,
Loans,
to the notes to our Consolidated Financial Statements contains detailed information on modified loans and impaired loans.
2. Potential Problem Loans
On at least a quarterly basis, we re-evaluate our internal credit quality rating for commercial loans that are either past due or fully performing but exhibit certain characteristics that could reflect a potential weakness. Loans are placed on nonaccrual status when the likely amount of future principal and interest payments are expected to be less than the contractual amounts, even if such loans are not past due.
Periodically we review the loan portfolio for evidence of potential problem loans. Potential problem loans are loans that are currently performing in accordance with contractual terms, but where known information about possible credit problems of the borrower causes doubt about the ability of the borrower to comply with the loan payment terms and may result in disclosure of such loans as nonperforming at some time in the future. In our credit monitoring program, we treat loans that are classified as substandard but continue to accrue interest as potential problem loans. At
December 31, 2017
, we identified
86
commercial loans totaling
$27.6 million
as potential problem loans. At
December 31, 2016
, we identified 101 commercial loans totaling $34.8 million as potential problem loans. For these loans, although positive factors such as payment history, value of supporting collateral, and/or personal or government guarantees led us to conclude that accounting for them as non-performing at year-end was not warranted, other factors, specifically, certain risk factors related to the loan or the borrower justified concerns that they may become nonperforming at some point in the future.
The overall level of our performing loans that demonstrate characteristics of potential weakness from time-to-time is for the most part dependent on economic conditions in northeastern New York State, which in turn are generally impacted at least in part by economic conditions in the U.S. On both the regional and national levels, economic conditions have been healthy in recent periods, although growth in the economy remained slow by comparison to previous historical post-recession recoveries. If growth remains weak , potential problem loans likely will continue at or near their present levels or may even increase.
3
.
Foreign
Outstandings
- None
4. Loan Concentrations
The loan portfolio is well diversified. There are no concentrations of credit that exceed 10% of the portfolio, other than the general categories reported in the preceding Section C.II.a. of this Item 7, beginning on page
40
. For further discussion, see Note 1,
Risks and Uncertainties
, to the notes to our Consolidated Financial Statements.
#
43
5. Other Real Estate Owned and Repossessed Assets
Other real estate owned ("OREO") primarily consists of real property acquired in foreclosure. OREO is carried at fair value less estimated cost to sell. We establish allowances for OREO losses, which are determined and monitored on a property-by-property basis and reflect our ongoing estimate of the property's estimated fair value less costs to sell. For all periods, all OREO was held for sale. All Repossessed Assets for each of the five years in the table below consist of motor vehicles.
|
Distribution of OREO and Repossessed Assets
(Dollars In Thousands)
|
December 31,
|
||||||||||||||||||
|
2017
|
2016
|
2015
|
2014
|
2013
|
|||||||||||||||
|
Single Family 1 - 4 Units
|
$
|
523
|
|
$
|
795
|
|
$
|
1,357
|
|
$
|
—
|
|
$
|
41
|
|
||||
|
Commercial Real Estate
|
1,215
|
|
790
|
|
521
|
|
312
|
|
40
|
|
|||||||||
|
Other Real Estate Owned, Net
|
1,738
|
|
1,585
|
|
1,878
|
|
312
|
|
81
|
|
|||||||||
|
Repossessed Assets
|
109
|
|
101
|
|
140
|
|
81
|
|
63
|
|
|||||||||
|
Total OREO and Repossessed Assets
|
$
|
1,847
|
|
$
|
1,686
|
|
$
|
2,018
|
|
$
|
393
|
|
$
|
144
|
|
||||
The following table summarizes changes in the net carrying amount of OREO and the number of properties for each of the periods presented.
|
Schedule of Changes in OREO
(Dollars In Thousands)
|
2017
|
2016
|
2015
|
2014
|
2013
|
||||||||||||||
|
Balance at Beginning of Year
|
$
|
1,585
|
|
$
|
1,878
|
|
$
|
312
|
|
$
|
81
|
|
$
|
970
|
|
||||
|
Properties Acquired Through Foreclosure
|
778
|
|
1,009
|
|
1,889
|
|
469
|
|
392
|
|
|||||||||
|
Transfer of Bank Property
|
—
|
|
—
|
|
270
|
|
—
|
|
—
|
|
|||||||||
|
Subsequent Write-downs to Fair Value
|
(160
|
)
|
(162
|
)
|
(9
|
)
|
—
|
|
—
|
|
|||||||||
|
Sales
|
(465
|
)
|
(1,140
|
)
|
(584
|
)
|
(238
|
)
|
(1,281
|
)
|
|||||||||
|
Balance at End of Year
|
$
|
1,738
|
|
$
|
1,585
|
|
$
|
1,878
|
|
$
|
312
|
|
$
|
81
|
|
||||
|
Number of Properties, Beginning of Year
|
5
|
|
6
|
|
1
|
|
2
|
|
7
|
|
|||||||||
|
Properties Acquired During the Year
|
4
|
|
3
|
|
8
|
|
2
|
|
1
|
|
|||||||||
|
Properties Sold During the Year
|
(3
|
)
|
(4
|
)
|
(3
|
)
|
(3
|
)
|
(6
|
)
|
|||||||||
|
Number of Properties, End of Year
|
6
|
|
5
|
|
6
|
|
1
|
|
2
|
|
|||||||||
#
44
III. SUMMARY OF LOAN LOSS EXPERIENCE
The information required in this section is presented in the discussion of the "Provision for Loan Losses and Allowance for Loan Losses" in Part II Item 7.B.II. beginning on page
33
of this Report, including:
|
•
|
Charge-offs and Recoveries by loan type
|
|
•
|
Factors that led to the amount of the Provision for Loan Losses
|
|
•
|
Allocation of the Allowance for Loan Losses by loan type
|
The percent of loans in each loan category is presented in the table of loan types in the preceding section on page
40
of this Report.
IV. DEPOSITS
The following table sets forth the average balances of and average rates paid on deposits for the periods indicated.
AVERAGE DEPOSIT BALANCES
(Dollars In Thousands)
|
Years Ended December 31,
|
||||||||||||||||||||
|
12/31/2017
|
12/31/2016
|
12/31/2015
|
||||||||||||||||||
|
Average
Balance
|
Rate
|
Average
Balance
|
Rate
|
Average
Balance
|
Rate
|
|||||||||||||||
|
Demand Deposits
|
$
|
421,061
|
|
—
|
%
|
$
|
366,956
|
|
—
|
%
|
$
|
329,017
|
|
—
|
%
|
|||||
|
Interest-Bearing Checking Accounts
|
907,113
|
|
0.17
|
%
|
912,461
|
|
0.14
|
|
915,565
|
|
0.14
|
|
||||||||
|
Savings Deposits
|
685,782
|
|
0.20
|
%
|
616,208
|
|
0.15
|
|
554,330
|
|
0.13
|
|
||||||||
|
Time Deposits of $250,000 or More
|
32,089
|
|
0.88
|
%
|
69,489
|
|
0.65
|
|
59,967
|
|
0.59
|
|
||||||||
|
Other Time Deposits
|
165,778
|
|
0.57
|
%
|
129,084
|
|
0.51
|
|
136,396
|
|
0.54
|
|
||||||||
|
Total Deposits
|
$
|
2,211,823
|
|
0.19
|
%
|
$
|
2,094,198
|
|
0.16
|
|
$
|
1,995,275
|
|
0.16
|
|
|||||
During
2017
, average total deposit balances increased by $117.6 million, or 5.6%, over the average for
2016
. Most of this growth occurred in the fourth quarter of
2017
, which is the result of typical seasonal fluctuations primarily in our municipal deposit balances and was largely generated from our pre-existing branch network, although we did open one new branch, in Schenectady, New York, in October 2017.
During 2016, average total deposit balances increased by $99 million, or 5.0%, over the average for 2015. Most of this growth occurred in the fourth quarter of 2016, which is the result of typical seasonal fluctuations primarily in our municipal deposit balances and was largely generated from our pre-existing branch network, although we did open one new branch in Troy, New York, in September 2015.
During 2015, average total deposit balances increased by $92.2 million, or 4.8%, over the average for 2014. Most of this growth occurred in the fourth quarter of 2015, which is the result of typical seasonal fluctuations primarily in our municipal deposit balances and was largely generated from our pre-existing branch network, although we did open two new branches: in Troy, New York, in September 2015, and in Colonie, New York, in June 2014.
We did not sell or close any branches during the covered period, 2015-2017. In 2015, we began to use reciprocal brokered deposits for a select group of municipalities to reduce the amount of investment securities required to be pledged as collateral for municipal deposits where through a well-established brokerage program, we transferred amounts in municipal deposits in excess of our FDIC insurance coverage limits to other participating banks, divided into portions so as to qualify such transferred deposits for FDIC insurance coverage at each transferee bank, in return for reciprocal transfers to us of equal amounts of deposits from the participant banks. Our balances of reciprocal broker deposits were $44.0 million and $57.1 million at
December 31, 2017
and
2016
, respectively.
#
45
The following table presents the quarterly average balance by deposit type for each of the most recent five quarters.
DEPOSIT PORTFOLIO
Quarterly Average Deposit Balances
(Dollars In Thousands)
|
Quarters Ended
|
|||||||||||||||||||
|
12/31/2017
|
9/30/2017
|
6/30/2017
|
3/31/2017
|
12/31/2016
|
|||||||||||||||
|
Demand Deposits
|
$
|
441,761
|
|
$
|
443,840
|
|
$
|
408,214
|
|
$
|
389,606
|
|
$
|
383,226
|
|
||||
|
Interest-Bearing Checking Accounts
|
945,414
|
|
869,748
|
|
918,235
|
|
894,911
|
|
921,971
|
|
|||||||||
|
Savings Deposits
|
701,694
|
|
682,347
|
|
681,197
|
|
677,662
|
|
649,928
|
|
|||||||||
|
Time Deposits of $250,000 or More
|
32,430
|
|
31,067
|
|
31,126
|
|
33,758
|
|
39,058
|
|
|||||||||
|
Other Time Deposits
|
162,907
|
|
166,776
|
|
167,593
|
|
165,861
|
|
165,973
|
|
|||||||||
|
Total Deposits
|
$
|
2,284,206
|
|
$
|
2,193,778
|
|
$
|
2,206,365
|
|
$
|
2,161,798
|
|
$
|
2,160,156
|
|
||||
Fluctuations in balances of our interest-bearing checking and savings accounts and time deposits of $250,000 or more are largely the result of municipal deposit fluctuations. Municipal deposits on average represent 28% to 34% of our total deposits. Municipal deposits are typically placed in interest-bearing checking and savings accounts, as well as time deposits of short duration.
In general, there is a seasonal pattern to municipal deposits which dip to a low point in August each year. Account balances tend to increase throughout the fall and into the winter months from tax deposits and increase again at the end of March from the electronic deposit of NYS Aid payments to school districts. In addition to these seasonal fluctuations within types of accounts, the overall level of municipal deposit balances fluctuates from year-to-year as some municipalities move their accounts in and out of our banks due to competitive factors. Often, the balances of municipal deposits at the end of a quarter are not representative of the average balances for that quarter. We expect that this shift from time deposits to nonmaturity deposit products may continue to occur in upcoming periods. If deposit rates begin to climb, we anticipate the movement of time deposits to nonmaturity interest bearing deposits to halt altogether, and likely to reverse itself if the rate rise is continuing or significant.
For a variety of reasons, including the seasonality of municipal deposits, we typically experience little net growth or a small contraction in average deposit balances in the first quarter of each calendar year, some growth in the second quarter, contraction in the third quarter and substantial growth in the fourth quarter. Deposit balances followed this seasonal pattern during
2017
, as in the prior two years. From
2016
to
2017
, growth occurred in both municipal accounts (
9.0%
) as well as other deposit accounts (
6.1%
). The growth in our non-municipal account balances during
2017
was distributed among all our deposit categories.
The total quarterly average balances as a percentage of total deposits are illustrated in the table below.
|
Percentage of Total Quarterly Average Deposits
|
Quarters Ended
|
|||||||||||||
|
12/31/2017
|
9/30/2017
|
6/30/2017
|
3/31/2017
|
12/31/2016
|
||||||||||
|
Demand Deposits
|
19.3
|
%
|
20.2
|
%
|
18.5
|
%
|
18.0
|
%
|
17.7
|
%
|
||||
|
Interest-Bearing Checking Accounts
|
41.5
|
|
39.6
|
|
41.6
|
|
41.4
|
|
42.7
|
|
||||
|
Savings Deposits
|
30.7
|
|
31.2
|
|
30.9
|
|
31.3
|
|
30.1
|
|
||||
|
Time Deposits of $250,000 or More
|
1.4
|
|
1.4
|
|
1.4
|
|
1.6
|
|
1.8
|
|
||||
|
Other Time Deposits
|
7.1
|
|
7.6
|
|
7.6
|
|
7.7
|
|
7.7
|
|
||||
|
Total Deposits
|
100.0
|
%
|
100.0
|
%
|
100.0
|
%
|
100.0
|
%
|
100.0
|
%
|
||||
Time deposits, including time deposits of $250,000 or more, remained consistent from
2016
to
2017
, after decreasing in prior years, as deposit rates generally fell during those years. A portion of our time deposits of $250,000 or more are comprised of municipal deposits and are typically obtained on a competitive bid basis. We, like virtually all insured depository institutions, experienced a steady decrease in the cost of our deposits extending from mid-2007 through the end of 2015. Fed funds rate increases have consistently increased our cost of deposits in the most recent five quarters, as demonstrated below.
The total quarterly interest cost of our deposits, by type of deposit and in total, for each of the most recent five quarters is set forth in the table below:
|
Quarterly Cost of Deposits
|
Quarters Ended
|
|||||||||||||
|
12/31/2017
|
9/30/2017
|
6/30/2017
|
3/31/2017
|
12/31/2016
|
||||||||||
|
Demand Deposits
|
—
|
%
|
—
|
%
|
—
|
%
|
—
|
%
|
—
|
%
|
||||
|
Interest-Bearing Checking Accounts
|
0.18
|
%
|
0.17
|
|
0.17
|
|
0.15
|
|
0.15
|
|
||||
|
Savings Deposits
|
0.23
|
%
|
0.21
|
|
0.19
|
|
0.17
|
|
0.16
|
|
||||
|
Time Deposits of $250,000 or More
|
1.17
|
%
|
0.84
|
|
0.85
|
|
0.66
|
|
0.55
|
|
||||
|
Other Time Deposits
|
0.60
|
%
|
0.57
|
|
0.56
|
|
0.56
|
|
0.60
|
|
||||
|
Total Deposits
|
0.20
|
%
|
0.19
|
|
0.18
|
|
0.17
|
|
0.16
|
|
||||
#
46
In general, rates paid by us on various types of deposit accounts are influenced by the rates being offered or paid by our competitors, which in turn are influenced by prevailing interest rates in the economy as impacted from time-to-time by the actions of the Federal Reserve Bank. There typically is a time lag between the Federal Reserve’s actions undertaken to influence rates, upward or downward, and the actual repricing of our deposit liabilities up or down, although this lag may be shorter or longer than the lag between Federal Reserve rate actions and the repricing of our loans and other earning assets, depending upon the particular circumstances.
The maturities of time deposits of $250,000 or more at
December 31, 2017
are presented below. (Dollars In Thousands)
|
Maturing in:
|
|||
|
Under Three Months
|
$
|
10,249
|
|
|
Three to Six Months
|
11,586
|
|
|
|
Six to Twelve Months
|
8,569
|
|
|
|
2018
|
1,138
|
|
|
|
2019
|
3,683
|
|
|
|
2020
|
2,390
|
|
|
|
2021
|
532
|
|
|
|
Later
|
—
|
|
|
|
Total
|
$
|
38,147
|
|
V. SHORT-TERM BORROWINGS
(Dollars in Thousands)
|
12/31/2017
|
12/31/2016
|
12/31/2015
|
|||||||||
|
Overnight Advances from the Federal Home Loan Bank of New York,
Federal Funds Purchased and Securities Sold Under Agreements to Repurchase:
|
|||||||||||
|
Balance at December 31
|
$
|
169,966
|
|
$
|
158,836
|
|
$
|
105,173
|
|
||
|
Maximum Month-End Balance
|
198,382
|
|
158,836
|
|
105,173
|
|
|||||
|
Average Balance During the Year
|
140,808
|
|
94,103
|
|
45,595
|
|
|||||
|
Average Rate During the Year
|
0.81
|
%
|
0.42
|
%
|
0.29
|
%
|
|||||
|
Rate at December 31
|
0.98
|
%
|
0.59
|
%
|
0.27
|
%
|
|||||
D. LIQUIDITY
The objective of effective liquidity management is to ensure that we have the ability to raise cash when we need it at a reasonable cost. We must be capable of meeting expected and unexpected obligations to our customers at any time. Given the uncertain nature of customer demands as well as the need to maximize earnings, we must have available reasonably priced sources of funds, both on- and off-balance sheet, that can be accessed quickly in time of need.
Our primary sources of available liquidity are overnight investments in federal funds sold, interest bearing bank balances at the Federal Reserve Bank, and cash flow from investment securities and loans. Certain investment securities are selected at purchase as available-for-sale based on their marketability and collateral value, as well as their yield and maturity. Our securities available-for-sale portfolio was
$300.2 million
at year-end
2017
,
a decrease
of
$46.8 million
from the year-end
2016
level. Due to the potential for volatility in market values, we are not always able to assume that securities may be sold on short notice at their carrying value, even to provide needed liquidity.
In addition to liquidity from short-term investments, investment securities and loans, we have supplemented available operating liquidity with additional off-balance sheet sources such as federal funds lines of credit with correspondent banks and credit lines with the Federal Home Loan Bank of New York ("FHLBNY"). Our federal funds lines of credit are with two correspondent banks totaling $35 million; we did not draw on these lines during
2017
, other than to test the facilities.
To support our borrowing relationship with the FHLBNY, we have pledged collateral, including residential mortgage and home equity loans. At
December 31, 2017
, we had outstanding collateral obligations with the FHLBNY of $285 million; on such date, our unused borrowing capacity at the FHLBNY was approximately $226 million. In addition we have identified brokered certificates of deposit as an appropriate off-balance sheet source of funding accessible in a relatively short time period. Also, our two bank subsidiaries have each established a borrowing facility with the Federal Reserve Bank of New York, pledging certain consumer loans as collateral for potential "discount window" advances, which we maintain for contingency liquidity purposes. At
December 31, 2017
, the amount available under this facility was approximately $425 million, and there were no advances then outstanding.
We measure and monitor our basic liquidity as a ratio of liquid assets to total short-term liabilities, both with and without the availability of borrowing arrangements. Based on the level of overnight funds investments, available liquidity from our investment securities portfolio, cash flows from our loan portfolio, our stable core deposit base and our significant borrowing capacity, we believe that our liquidity is sufficient to meet all funding needs that may arise in connection with any reasonably likely events or occurrences. At
December 31, 2017
, our basic liquidity ratio, including our FHLB collateralized borrowing capacity, was 10.5% of total assets, or $179 million in excess of our internally-set minimum target ratio of 4%.
#
47
Because of our consistently favorable credit quality and strong balance sheet, we did not experience any significant liquidity constraints in
2017
and did not experience any such constraints in any prior year. We have not at any time during such period been forced to pay premium rates to obtain retail deposits or other funds from any source.
E. CAPITAL RESOURCES AND DIVIDENDS
Important Regulatory Capital Standards
Revised Bank Capital Rules.
The Dodd-Frank Act enacted in 2010 directed U.S. bank regulators to promulgate revised bank organization capital standards, which were required to be at least as strict as the regulatory capital standards for banks then in effect. The revised bank regulatory capital standards were adopted by the Federal bank regulatory agencies in 2013 and became effective for Arrow and its subsidiary banks on January 1, 2015. These revised capital rules are summarized in an earlier section of this Report, "Regulatory Capital Standards," on pages
7 and 8
.
The table below sets forth the various capital ratios achieved by Arrow and its subsidiary banks, Glens Falls National and Saratoga National, as of
December 31, 2017
, as determined under the revised bank regulatory capital standards in effect on that date, as well as the minimum levels for such capital ratios that bank holding companies and banks are required to maintain under the revised rules. As demonstrated in the table, all of Arrow's and the banks' capital ratios at year-end were well in excess of the minimum required levels for such ratios, as established by the regulators under these revised rules. In addition, on
December 31, 2017
, Arrow and each of our banks qualified as "well-capitalized", the highest capital classification category under the revised capital classification scheme recently established by the federal bank regulators, as in effect on that date.
|
Capital Ratios
:
|
Arrow
|
GFNB
|
SNB
|
Minimum
Required
Ratio
|
||
|
Tier 1 Leverage Ratio
|
9.5%
|
9.1%
|
9.4%
|
4.0%
|
||
|
Common Equity Tier 1 Capital Ratio
|
12.9%
|
13.6%
|
13.0%
|
4.5%
|
||
|
Tier 1 Risk-Based Capital Ratio
|
14.0%
|
13.6%
|
13.0%
|
6.0%
|
||
|
Total Risk-Based Capital Ratio
|
15.0%
|
14.6%
|
14.0%
|
8.0%
|
||
Stockholders' Equity at Year-end 2017:
Stockholders' equity was
$249.6 million
at
December 31, 2017
, an increase of
$16.8 million
, or
7.2%
, from the prior year-end. During
2017
stockholders' equity was positively impacted by (a) net income of
$29.3 million
for the period, (b)
$2.6 million
of equity received from various stock-based compensation plans, (c)
$1.7 million
of equity resulting from the dividend reinvestment plan, while stockholders' equity was reduced by (d) cash dividends of
$13.6 million
, and (e) repurchases of common stock of
$3.2 million
.
Trust Preferred Securities:
In each of 2003 and 2004, we issued $10 million of trust preferred securities (TRUPs) in a private placement. Under the Federal Reserve Board's regulatory capital rules then in effect, TRUPs proceeds typically qualified as Tier 1 capital for bank holding companies such as ours, but only in amounts up to 25% of Tier 1 capital, net of goodwill less any associated deferred tax liability. Under Dodd-Frank, any trust preferred securities that Arrow might issue on or after the grandfathering date set forth in Dodd-Frank (May 19, 2010) would no longer qualify as Tier 1 capital under bank regulatory capital guidelines, whereas TRUPs outstanding prior to the grandfathering cutoff date set forth in Dodd-Frank (May 19, 2010) would continue to qualify as Tier 1 capital until maturity or redemption, subject to limitations. Thus, our outstanding TRUPs continue to qualify as Tier 1 regulatory capital, subject to such limitations.
Dividends:
The source of funds for the payment by Arrow of cash dividends to stockholders consists primarily of dividends declared and paid to it by our bank subsidiaries. In addition to legal and regulatory limitations on payments of dividends by Arrow (i.e., the need to maintain adequate regulatory capital), there are also legal and regulatory limitations applicable to the payment of dividends by our bank subsidiaries to Arrow. As of
December 31, 2017
, under the statutory limitations in national banking law, the maximum amount that could have been paid by the bank subsidiaries to Arrow, without special regulatory approval, was approximately
$44.1 million
The ability of Arrow and our banks to pay dividends in the future is and will continue to be influenced by regulatory policies, capital guidelines and applicable laws.
See Part II, Item 5, "Market for the Registrant's Common Equity, Related Stockholder Matters and Issuer Purchases of Equity Securities" for a recent history of our cash dividend payments.
Stock Repurchase Program
:
In October 2017, the Board of Directors approved a $5.0 million stock repurchase program, effective January 1, 2018 (the 2018 program), under which management is authorized, in its discretion, to cause the Company to repurchase from time-to-time during 2018, in the open market or in privately negotiated transactions, up to $5 million of shares of Arrow's common stock, to the extent management believes the Company's stock is reasonably priced and such repurchases appear to be an attractive use of available capital and in the best interests of stockholders. This 2018 program replaced a similar repurchase program which was in effect during 2017 (the 2017 program), which also authorized the repurchase of up to $5.0 million of shares of Arrow's common stock. As of
December 31, 2017
approximately $2.3 million had been used under the 2017 program to repurchase
#
48
Arrow shares. This total does not include approximately $3.2 million of Arrow's Common Stock that the Company repurchased during 2017 other than through its repurchase program, i.e., repurchases of Arrow shares on the market utilizing funds accumulated under Arrow's Dividend Reinvestment Plan and the surrender or deemed surrender of Arrow stock to the Company in connection with employees' stock-for-stock exercises of compensatory stock options to buy Arrow stock.
F. OFF-BALANCE SHEET ARRANGEMENTS
In the normal course of operations, we may engage in a variety of financial transactions or arrangements, including derivative transactions or arrangements, that in accordance with generally accepted accounting principles are not recorded in the financial statements, or are recorded in amounts that differ from the notional amounts. These transactions or arrangements involve, to varying degrees, elements of credit, interest rate, and liquidity risk. Such transactions or arrangements may be used by us or our customers for general corporate purposes, such as managing credit, interest rate, or liquidity risk or to optimize capital, or may be used by us or our customers to manage funding needs.
We have no off-balance sheet arrangements that are reasonably likely to have a material current or future effect on our financial condition, revenues or expenses, results of operations, liquidity or capital expenditures. As of
December 31, 2017
, we had no derivative securities, including interest rate swaps, credit default swaps, or equity puts or calls, in our investment portfolio.
G. CONTRACTUAL OBLIGATIONS (Dollars In Thousands)
|
Payments Due by Period
|
|||||||||||||||||||
|
Contractual Obligation
|
Total
|
Less Than
1 Year
|
1-3 Years
|
3-5 Years
|
More Than
5 Years
|
||||||||||||||
|
Long-Term Debt Obligations:
|
|||||||||||||||||||
|
Federal Home Loan Bank Advances
1
|
$
|
55,000
|
|
$
|
10,000
|
|
$
|
45,000
|
|
$
|
—
|
|
$
|
—
|
|
||||
|
Junior Subordinated Obligations
Issued to Unconsolidated
Subsidiary Trusts
2
|
20,000
|
|
—
|
|
—
|
|
—
|
|
20,000
|
|
|||||||||
|
Operating Lease Obligations
3
|
2,210
|
|
690
|
|
877
|
|
459
|
|
184
|
|
|||||||||
|
Obligations under Retirement Plans
4
|
37,299
|
|
4,397
|
|
7,150
|
|
6,976
|
|
18,776
|
|
|||||||||
|
Total
|
$
|
114,509
|
|
$
|
15,087
|
|
$
|
53,027
|
|
$
|
7,435
|
|
$
|
38,960
|
|
||||
1
See Note 10,
Debt
, to the Consolidated Financial Statements for additional information on Federal Home Loan Bank Advances, including call provisions.
2
See Note 10,
Debt
, to the Consolidated Financial Statements for additional information on Junior Subordinated Obligations Issued to Unconsolidated Subsidiary Trusts (trust preferred securities).
3
See Note 18,
Leases
, to the Consolidated Financial Statements for additional information on our Operating Lease Obligations.
4
See Note 13,
Retirement Benefit Plans
, to the Consolidated Financial Statements for additional information on our Retirement Benefit Plans.
#
49
H. FOURTH QUARTER RESULTS
We reported net income of
$8.1 million
for the fourth quarter of
2017
,
an increase
of
$1,471 thousand
, or
22.3%
, from the net income of
$6.60 million
we reported for the fourth quarter of
2016
. Diluted earnings per common share for the fourth quarter of
2017
were
$0.58
,
up
from
$0.47
during the fourth quarter of
2016
. The net change in earnings between the two quarters was primarily affected by the following: (a) a
$1.3 million
increase
in tax-equivalent net interest income, (b) a
$104 thousand
increase
in noninterest income, (c) an
$674 thousand
increase
in the provision for loan losses, (d) a
$0.8 million
increase
in noninterest expense, and (e) a
$866 thousand
decrease
in the provision for income taxes. The principal factors contributing to these quarter-to-quarter changes are included in the discussion of the year-to-year changes in net income set forth elsewhere in this Item 7, specifically, in Section B, "Results of Operations," above, as well as in the Company's Current Report on Form 8-K, as filed with the SEC on
January 30, 2018
, incorporating by reference the Company's earnings release for the year ended
December 31, 2017
.
SELECTED FOURTH QUARTER FINANCIAL INFORMATION
(Dollars In Thousands, Except Per Share Amounts)
|
For the Quarters Ended
December 31,
|
|||||||
|
12/31/2017
|
12/31/2016
|
||||||
|
Interest and Dividend Income
|
$
|
22,135
|
|
$
|
19,770
|
|
|
|
Interest Expense
|
1,821
|
|
1,404
|
|
|||
|
Net Interest Income
|
20,314
|
|
18,366
|
|
|||
|
Provision for Loan Losses
|
1,157
|
|
483
|
|
|||
|
Net Interest Income after Provision for Loan Losses
|
19,157
|
|
17,883
|
|
|||
|
Noninterest Income
|
6,752
|
|
6,648
|
|
|||
|
Noninterest Expense
|
16,045
|
|
15,272
|
|
|||
|
Income Before Provision for Income Taxes
|
9,864
|
|
9,259
|
|
|||
|
Provision for Income Taxes
|
1,793
|
|
2,659
|
|
|||
|
Net Income
|
$
|
8,071
|
|
$
|
6,600
|
|
|
|
SHARE AND PER SHARE DATA:
|
|||||||
|
Weighted Average Number of Shares Outstanding:
|
|||||||
|
Basic
|
13,905
|
|
13,844
|
|
|||
|
Diluted
|
14,006
|
|
13,972
|
|
|||
|
Basic Earnings Per Common Share
|
$
|
0.58
|
|
0.48
|
|
||
|
Diluted Earnings Per Common Share
|
0.58
|
|
0.47
|
|
|||
|
Cash Dividends Per Common Share
|
0.250
|
|
0.243
|
|
|||
|
AVERAGE BALANCES:
|
|||||||
|
Assets
|
$
|
2,744,180
|
|
$
|
2,572,425
|
|
|
|
Earning Assets
|
2,617,680
|
|
2,446,375
|
|
|||
|
Loans
|
1,930,590
|
|
1,726,738
|
|
|||
|
Deposits
|
2,284,206
|
|
2,160,156
|
|
|||
|
Stockholders
’
Equity
|
247,253
|
|
230,198
|
|
|||
|
SELECTED RATIOS (Annualized):
|
|||||||
|
Return on Average Assets
|
1.17
|
%
|
1.02
|
%
|
|||
|
Return on Average Equity
|
12.95
|
%
|
11.41
|
%
|
|||
|
Net Interest Margin
1
|
3.23
|
%
|
3.14
|
%
|
|||
|
Net Charge-offs to Average Loans
|
0.05
|
%
|
0.10
|
%
|
|||
|
Provision for Loan Losses to Average Loans
|
0.24
|
%
|
0.11
|
%
|
|||
1
Net Interest Margin is the ratio of tax-equivalent net interest income to average earning assets. (See “Use of Non-GAAP Financial
Measures” on page
4
).
#
50
SUMMARY OF QUARTERLY FINANCIAL DATA (Unaudited)
The following quarterly financial information for
2017
and
2016
is unaudited, but, in the opinion of management, fairly presents the results of Arrow.
SELECTED QUARTERLY FINANCIAL DATA
(Dollars In Thousands, Except Per Share Amounts)
|
2017
|
|||||||||||||||
|
First
Quarter
|
Second
Quarter
|
Third
Quarter
|
Fourth
Quarter
|
||||||||||||
|
Total Interest and Dividend Income
|
$
|
19,997
|
|
$
|
20,926
|
|
$
|
21,599
|
|
$
|
22,135
|
|
|||
|
Net Interest Income
|
18,461
|
|
19,227
|
|
19,650
|
|
20,314
|
|
|||||||
|
Provision for Loan Losses
|
358
|
|
422
|
|
800
|
|
1,157
|
|
|||||||
|
Net Securities Gains (Losses)
|
—
|
|
—
|
|
10
|
|
(458
|
)
|
|||||||
|
Income Before Provision for Income Taxes
|
9,323
|
|
10,225
|
|
10,443
|
|
9,864
|
|
|||||||
|
Net Income
|
6,631
|
|
7,208
|
|
7,416
|
|
8,071
|
|
|||||||
|
Basic Earnings Per Common Share
|
0.48
|
|
0.52
|
|
0.53
|
|
0.58
|
|
|||||||
|
Diluted Earnings Per Common Share
|
0.47
|
|
0.52
|
|
0.53
|
|
0.58
|
|
|||||||
|
2016
|
|||||||||||||||
|
First
Quarter
|
Second
Quarter
|
Third
Quarter
|
Fourth
Quarter
|
||||||||||||
|
Total Interest and Dividend Income
|
$
|
18,626
|
|
$
|
19,237
|
|
$
|
19,282
|
|
$
|
19,770
|
|
|||
|
Net Interest Income
|
17,363
|
|
17,953
|
|
17,877
|
|
18,366
|
|
|||||||
|
Provision for Loan Losses
|
401
|
|
669
|
|
480
|
|
483
|
|
|||||||
|
Net Securities Gains (Losses)
|
—
|
|
144
|
|
—
|
|
(166
|
)
|
|||||||
|
Income Before Provision for Income Taxes
|
9,467
|
|
9,594
|
|
9,429
|
|
9,259
|
|
|||||||
|
Net Income
|
6,549
|
|
6,647
|
|
6,738
|
|
6,600
|
|
|||||||
|
Basic Earnings Per Common Share
|
0.48
|
|
0.48
|
|
0.49
|
|
0.48
|
|
|||||||
|
Diluted Earnings Per Common Share
|
0.48
|
|
0.48
|
|
0.48
|
|
0.47
|
|
|||||||
#
51
Item 7A.
Quantitative and Qualitative Disclosures About Market Risk
In addition to credit risk in our loan portfolio and liquidity risk, discussed earlier, our business activities also generate market risk. Market risk is the possibility that changes in future market rates (interest rates) or prices (fees for products and services) will make our position (i.e., our assets and operations) less valuable. The ongoing monitoring and management of interest rate and market risk is an important component of our asset/liability management process, which is governed by policies that are reviewed and approved annually by the Board of Directors. The Board of Directors delegates responsibility for carrying out asset/liability oversight and control to management
'
s Asset/Liability Committee ("ALCO"). In this capacity ALCO develops guidelines and strategies impacting our asset/liability profile based upon estimated market risk sensitivity, policy limits and overall market interest rate levels and trends. We have not made use of derivatives, such as interest rate swaps, in our risk management process.
Interest rate risk is the most significant market risk affecting us. Interest rate risk is the exposure of our net interest income to changes in interest rates. Interest rate risk is directly related to the different maturities and repricing characteristics of interest-bearing assets and liabilities, as well as to the risk of prepayment of loans and early withdrawal of time deposits, and the fact that the speed and magnitude of responses to interest rate changes varies by product.
ALCO utilizes the results of a detailed and dynamic simulation model to quantify the estimated exposure of net interest income to sustained interest rate changes. While ALCO routinely monitors simulated net interest income sensitivity over a rolling two-year horizon, it also utilizes additional tools to monitor potential longer-term interest rate risk, including periodic stress testing involving hypothetical sudden and significant interest rate spikes.
Our standard simulation model attempts to capture the impact of changing interest rates on the interest income received and interest expense paid on all interest-sensitive assets and liabilities reflected on our consolidated balance sheet. This sensitivity analysis is compared to ALCO policy limits which specify a maximum tolerance level for net interest income exposure over a one- year horizon, assuming no balance sheet growth and a 200 basis point upward and a 100 basis point downward shift in interest rates, and a repricing of interest-bearing assets and liabilities at their earliest reasonably predictable repricing date. We normally apply a parallel and pro rata shift in rates over a 12-month period.
Applying the simulation model analysis as of
December 31, 2017
, a 200 basis point increase in interest rates demonstrated a 1.6% decrease in net interest income, and a 100 basis point decrease in interest rates demonstrated a 0.0% decrease in net interest income. These amounts were within our ALCO policy limits. Historically, there has existed an inverse relationship between changes in prevailing rates and our net interest income, reflecting the fact that our liabilities and sources of funds generally reprice more quickly than our earning assets. However, when current prevailing interest rates are already low, a decline in prevailing rates may not produce the otherwise expected increase in net interest income, even over a relatively short time horizon, because as noted above, further decreases in rates with respect to liabilities (deposits) may be significantly impeded by the assumed boundary of a zero rate, whereas further decreases in asset rates are not as likely to run up against the assumed boundary of zero, and thus may be experienced in full or nearly full, across the asset portfolio, even if assets reprice more slowly than liabilities. Thus, even in the short run, rate decreases in the current environment may not be beneficial to income.
If the impact of rate change on our income is projected over a longer time horizon, e.g., two years or longer, it might be expected that a decrease in prevailing rates would have a greater negative impact on our income, as compared to the short-term result, as assets continue to reprice downward in full response, while liabilities do not further reprice but remain trapped by the assumed zero rate boundary. On the other hand, an increase in prevailing rates would have a much less negative impact over the longer term, and perhaps even a neutral or positive impact on our net interest income, as our asset portfolios eventually reprice upward. However, other factors may play a significant role in any analysis of the impact of rising rates on our income, including a possible softening of loan demand and/or slowing of the economy that might be expected to accompany any general rate rise.The preceding sensitivity analysis does not represent a forecast on our part and should not be relied upon as being indicative of expected operating results.
The hypothetical estimates underlying the sensitivity analysis are based upon numerous assumptions including: the nature and timing of changes in interest rates including yield curve shape, prepayments on loans and securities, deposit decay rates, pricing decisions on loans and deposits, reinvestment/replacement of asset and liability cash flows, and others. While assumptions are developed based upon current economic and local market conditions, we cannot make any assurance as to the predictive nature of these assumptions including how customer preferences or competitor influences might change.
Also, as market conditions vary from those assumed in the sensitivity analysis, actual results will differ due to: prepayment/refinancing levels likely deviating from those assumed, the varying impact of interest rate changes on caps or floors on adjustable rate assets, the potential effect of changing debt service levels on customers with adjustable rate loans, depositor early withdrawals and product preference changes, unanticipated shifts in the yield curve and other internal/external variables. Furthermore, the sensitivity analysis does not reflect actions that ALCO might take in responding to or anticipating changes in interest rates.
#
52
Item 8.
Financial Statements and Supplementary Data
The following audited consolidated financial statements and unaudited supplementary data are submitted herewith:
Reports of Independent Registered Public Accounting Firm
Consolidated Balance Sheets as of
December 31, 2017
and
2016
Consolidated Statements of Income for the Years Ended
December 31, 2017
,
2016
and
2015
Consolidated Statements of Comprehensive Income for the Years Ended
December 31, 2017
,
2016
and
2015
Consolidated Statements of Changes in Stockholders' Equity for the Years Ended
December 31, 2017
,
2016
and
2015
Consolidated Statements of Cash Flows for the Years Ended
December 31, 2017
,
2016
and
2015
Notes to Consolidated Financial Statements
Report of Independent Registered Public Accounting Firm
To the Stockholders and Board of Directors
Arrow Financial Corporation:
Opinion on the Consolidated Financial Statements
We have audited the accompanying consolidated balance sheets of Arrow Financial Corporation and subsidiaries (the Company) as of December 31, 2017 and 2016, the related consolidated statements of income, comprehensive income, changes in stockholders’ equity, and cash flows for each of the years in the three‑year period ended December 31, 2017, and the related notes (collectively, the consolidated financial statements). In our opinion, the consolidated financial statements present fairly, in all material respects, the financial position of the Company as of December 31, 2017 and 2016, and the results of its operations and its cash flows for each of the years in the three‑year period ended December 31, 2017, in conformity with U.S. generally accepted accounting principles.
We also have audited, in accordance with the standards of the Public Company Accounting Oversight Board (United States) (PCAOB), the Company’s internal control over financial reporting as of December 31, 2017, based on criteria established in
Internal Control - Integrated Framework (2013)
issued by the Committee of Sponsoring Organizations of the Treadway Commission, and our report dated March 12, 2018 expressed an unqualified opinion on the effectiveness of the Company’s internal control over financial reporting.
Basis for Opinion
These consolidated financial statements are the responsibility of the Company’s management. Our responsibility is to express an opinion on these consolidated financial statements based on our audits. We are a public accounting firm registered with the PCAOB and are required to be independent with respect to the Company in accordance with the U.S. federal securities laws and the applicable rules and regulations of the Securities and Exchange Commission and the PCAOB.
We conducted our audits in accordance with the standards of the PCAOB. Those standards require that we plan and perform the audit to obtain reasonable assurance about whether the consolidated financial statements are free of material misstatement, whether due to error or fraud. Our audits included performing procedures to assess the risks of material misstatement of the consolidated financial statements, whether due to error or fraud, and performing procedures that respond to those risks. Such procedures included examining, on a test basis, evidence regarding the amounts and disclosures in the consolidated financial statements. Our audits also included evaluating the accounting principles used and significant estimates made by management, as well as evaluating the overall presentation of the consolidated financial statements. We believe that our audits provide a reasonable basis for our opinion.
/s/ KPMG LLP
We have served as the Company’s auditor since 1990.
Albany, New York
March 12, 2018
#
53
Report of Independent Registered Public Accounting Firm
The Stockholders and Board of Directors
Arrow Financial Corporation:
Opinion on Internal Control Over Financial Reporting
We have audited Arrow Financial Corporation’s and subsidiaries’ (the Company) internal control over financial reporting as of December 31, 2017, based on criteria established in
Internal Control - Integrated Framework (2013)
issued by the Committee of Sponsoring Organizations of the Treadway Commission. In our opinion, the Company maintained, in all material respects, effective internal control over financial reporting as of December 31, 2017, based on criteria established in
Internal Control - Integrated Framework (2013)
issued by the Committee of Sponsoring Organizations of the Treadway Commission.
We also have audited, in accordance with the standards of the Public Company Accounting Oversight Board (United States) (PCAOB), the consolidated balance sheets of the Company as of December 31, 2017 and 2016, the related consolidated statements of income, comprehensive income, changes in stockholders’ equity, and cash flows for each of the years in the three-year period ended December 31, 2017, and the related notes (collectively, the consolidated financial statements), and our report dated March 12, 2018 expressed an unqualified opinion on those consolidated financial statements.
Basis for Opinion
The Company’s management is responsible for maintaining effective internal control over financial reporting and for its assessment of the effectiveness of internal control over financial reporting, included in the accompanying
Management’s Report on Internal Control Over Financial Reporting
. Our responsibility is to express an opinion on the Company’s internal control over financial reporting based on our audit. We are a public accounting firm registered with the PCAOB and are required to be independent with respect to the Company in accordance with the U.S. federal securities laws and the applicable rules and regulations of the Securities and Exchange Commission and the PCAOB.
We conducted our audit in accordance with the standards of the PCAOB. Those standards require that we plan and perform the audit to obtain reasonable assurance about whether effective internal control over financial reporting was maintained in all material respects. Our audit of internal control over financial reporting included obtaining an understanding of internal control over financial reporting, assessing the risk that a material weakness exists, and testing and evaluating the design and operating effectiveness of internal control based on the assessed risk. Our audit also included performing such other procedures as we considered necessary in the circumstances. We believe that our audit provides a reasonable basis for our opinion.
Definition and Limitations of Internal Control Over Financial Reporting
A company’s internal control over financial reporting is a process designed to provide reasonable assurance regarding the reliability of financial reporting and the preparation of financial statements for external purposes in accordance with generally accepted accounting principles. A company’s internal control over financial reporting includes those policies and procedures that (1) pertain to the maintenance of records that, in reasonable detail, accurately and fairly reflect the transactions and dispositions of the assets of the company; (2) provide reasonable assurance that transactions are recorded as necessary to permit preparation of financial statements in accordance with generally accepted accounting principles, and that receipts and expenditures of the company are being made only in accordance with authorizations of management and directors of the company; and (3) provide reasonable assurance regarding prevention or timely detection of unauthorized acquisition, use, or disposition of the company’s assets that could have a material effect on the financial statements.
Because of its inherent limitations, internal control over financial reporting may not prevent or detect misstatements. Also, projections of any evaluation of effectiveness to future periods are subject to the risk that controls may become inadequate because of changes in conditions, or that the degree of compliance with the policies or procedures may deteriorate.
/s/ KPMG LLP
Albany, New York
March 12, 2018
#
54
|
ARROW FINANCIAL CORPORATION AND SUBSIDIARIES
CONSOLIDATED BALANCE SHEETS
(Dollars In Thousands, Except Share and Per Share Amounts)
|
|||||||
|
|
December 31, 2017
|
December 31, 2016
|
|||||
|
ASSETS
|
|
|
|||||
|
Cash and Due From Banks
|
$
|
42,562
|
|
$
|
43,024
|
|
|
|
Interest-Bearing Deposits at Banks
|
30,276
|
|
14,331
|
|
|||
|
Investment Securities:
|
|||||||
|
Available-for-Sale
|
300,200
|
|
346,996
|
|
|||
|
Held-to-Maturity (Approximate Fair Value of $335,901 at
December 31, 2017, and $343,751 at December 31, 2016) |
335,907
|
|
345,427
|
|
|||
|
Other Investments
|
9,949
|
|
10,912
|
|
|||
|
Loans
|
1,950,770
|
|
1,753,268
|
|
|||
|
Allowance for Loan Losses
|
(18,586
|
)
|
(17,012
|
)
|
|||
|
Net Loans
|
1,932,184
|
|
1,736,256
|
|
|||
|
Premises and Equipment, Net
|
27,619
|
|
26,938
|
|
|||
|
Goodwill
|
21,873
|
|
21,873
|
|
|||
|
Other Intangible Assets, Net
|
2,289
|
|
2,696
|
|
|||
|
Other Assets
|
57,606
|
|
56,789
|
|
|||
|
Total Assets
|
$
|
2,760,465
|
|
$
|
2,605,242
|
|
|
|
LIABILITIES
|
|||||||
|
Noninterest-Bearing Deposits
|
$
|
441,945
|
|
$
|
387,280
|
|
|
|
Interest-Bearing Checking Accounts
|
907,315
|
|
877,988
|
|
|||
|
Savings Deposits
|
694,573
|
|
651,965
|
|
|||
|
Time Deposits over $250,000
|
38,147
|
|
32,878
|
|
|||
|
Other Time Deposits
|
163,136
|
|
166,435
|
|
|||
|
Total Deposits
|
2,245,116
|
|
2,116,546
|
|
|||
|
Federal Funds Purchased and
Securities Sold Under Agreements to Repurchase |
64,966
|
|
35,836
|
|
|||
|
Federal Home Loan Bank Overnight Advances
|
105,000
|
|
123,000
|
|
|||
|
Federal Home Loan Bank Term Advances
|
55,000
|
|
55,000
|
|
|||
|
Junior Subordinated Obligations Issued to Unconsolidated Subsidiary Trusts
|
20,000
|
|
20,000
|
|
|||
|
Other Liabilities
|
20,780
|
|
22,008
|
|
|||
|
Total Liabilities
|
2,510,862
|
|
2,372,390
|
|
|||
|
STOCKHOLDERS’ EQUITY
|
|||||||
|
Preferred Stock, $5 Par Value; 1,000,000 Shares Authorized
|
—
|
|
—
|
|
|||
|
Common Stock, $1 Par Value; 20,000,000 Shares Authorized
(18,481,301 Shares Issued at December 31, 2017, and 17,943,201 Shares Issued at December 31, 2016) |
18,481
|
|
17,943
|
|
|||
|
Additional Paid-in Capital
|
290,219
|
|
270,880
|
|
|||
|
Retained Earnings
|
28,818
|
|
28,644
|
|
|||
|
Unallocated ESOP Shares (9,643 Shares at December 31, 2017, and
19,466 Shares at December 31, 2016) |
(200
|
)
|
(400
|
)
|
|||
|
Accumulated Other Comprehensive Loss
|
(8,514
|
)
|
(6,834
|
)
|
|||
|
Treasury Stock, at Cost (4,541,524 Shares at December 31, 2017, and
4,441,093 Shares at December 31, 2016) |
(79,201
|
)
|
(77,381
|
)
|
|||
|
Total Stockholders’ Equity
|
249,603
|
|
232,852
|
|
|||
|
Total Liabilities and Stockholders’ Equity
|
$
|
2,760,465
|
|
$
|
2,605,242
|
|
|
See Notes to Consolidated Financial Statements.
#
55
|
ARROW FINANCIAL CORPORATION AND SUBSIDIARIES
CONSOLIDATED STATEMENTS OF INCOME
(Dollars In Thousands, Except Per Share Amounts)
|
||||||||||||
|
|
Years Ended December 31,
|
|||||||||||
|
|
2017
|
2016
|
2015
|
|||||||||
|
INTEREST AND DIVIDEND INCOME
|
|
|
||||||||||
|
Interest and Fees on Loans
|
$
|
70,202
|
|
$
|
62,823
|
|
$
|
56,856
|
|
|||
|
Interest on Deposits at Banks
|
348
|
|
152
|
|
94
|
|
||||||
|
Interest and Dividends on Investment Securities:
|
||||||||||||
|
Fully Taxable
|
7,884
|
|
7,934
|
|
8,043
|
|
||||||
|
Exempt from Federal Taxes
|
6,223
|
|
6,006
|
|
5,745
|
|
||||||
|
Total Interest and Dividend Income
|
84,657
|
|
76,915
|
|
70,738
|
|
||||||
|
INTEREST EXPENSE
|
|
|
||||||||||
|
Interest-Bearing Checking Accounts
|
1,510
|
|
1,280
|
|
1,276
|
|
||||||
|
Savings Deposits
|
1,371
|
|
932
|
|
741
|
|
||||||
|
Time Deposits over $250,000
|
282
|
|
187
|
|
76
|
|
||||||
|
Other Time Deposits
|
950
|
|
924
|
|
1,022
|
|
||||||
|
Federal Funds Purchased and
Securities Sold Under Agreements to Repurchase
|
44
|
|
33
|
|
20
|
|
||||||
|
Federal Home Loan Bank Advances
|
2,083
|
|
1,340
|
|
1,097
|
|
||||||
|
Junior Subordinated Obligations Issued to
Unconsolidated Subsidiary Trusts
|
766
|
|
660
|
|
581
|
|
||||||
|
Total Interest Expense
|
7,006
|
|
5,356
|
|
4,813
|
|
||||||
|
NET INTEREST INCOME
|
77,651
|
|
71,559
|
|
65,925
|
|
||||||
|
Provision for Loan Losses
|
2,736
|
|
2,033
|
|
1,347
|
|
||||||
|
NET INTEREST INCOME AFTER PROVISION FOR
LOAN LOSSES
|
74,915
|
|
69,526
|
|
64,578
|
|
||||||
|
NONINTEREST INCOME
|
|
|
||||||||||
|
Income From Fiduciary Activities
|
8,417
|
|
7,783
|
|
7,762
|
|
||||||
|
Fees for Other Services to Customers
|
9,591
|
|
9,469
|
|
9,220
|
|
||||||
|
Net (Loss) Gain on Securities Transactions
|
(448
|
)
|
(22
|
)
|
129
|
|
||||||
|
Insurance Commissions
|
8,612
|
|
8,668
|
|
8,967
|
|
||||||
|
Net Gain on Sales of Loans
|
546
|
|
821
|
|
692
|
|
||||||
|
Other Operating Income
|
927
|
|
1,113
|
|
1,354
|
|
||||||
|
Total Noninterest Income
|
27,645
|
|
27,832
|
|
28,124
|
|
||||||
|
NONINTEREST EXPENSE
|
|
|
||||||||||
|
Salaries and Employee Benefits
|
37,166
|
|
34,330
|
|
33,064
|
|
||||||
|
Occupancy Expenses, Net
|
9,560
|
|
9,402
|
|
9,267
|
|
||||||
|
FDIC Assessments
|
891
|
|
1,076
|
|
1,186
|
|
||||||
|
Other Operating Expense
|
15,088
|
|
14,801
|
|
13,913
|
|
||||||
|
Total Noninterest Expense
|
62,705
|
|
59,609
|
|
57,430
|
|
||||||
|
INCOME BEFORE PROVISION FOR INCOME TAXES
|
39,855
|
|
37,749
|
|
35,272
|
|
||||||
|
Provision for Income Taxes
|
10,529
|
|
11,215
|
|
10,610
|
|
||||||
|
NET INCOME
|
$
|
29,326
|
|
$
|
26,534
|
|
$
|
24,662
|
|
|||
|
Average Shares Outstanding:
|
|
|
||||||||||
|
Basic
|
13,893
|
|
13,792
|
|
13,680
|
|
||||||
|
Diluted
|
13,986
|
|
13,880
|
|
13,730
|
|
||||||
|
Per Common Share:
|
|
|
||||||||||
|
Basic Earnings
|
$
|
2.11
|
|
$
|
1.92
|
|
$
|
1.80
|
|
|||
|
Diluted Earnings
|
2.10
|
|
1.91
|
|
1.80
|
|
||||||
Share and Per Share Amounts have been restated for the
September 28, 2017
3
% stock dividend.
See Notes to Consolidated Financial Statements.
#
56
|
ARROW FINANCIAL CORPORATION AND SUBSIDIARIES
CONSOLIDATED STATEMENTS OF COMPREHENSIVE INCOME
(Dollars In Thousands)
|
|||||||||||
|
Years Ended December 31,
|
|||||||||||
|
2017
|
2016
|
2015
|
|||||||||
|
Net Income
|
$
|
29,326
|
|
$
|
26,534
|
|
$
|
24,662
|
|
||
|
Other Comprehensive Income (Loss), Net of Tax:
|
|||||||||||
|
Unrealized Net Securities Holding Losses Arising During the Year
|
(940
|
)
|
(1,024
|
)
|
(1,832
|
)
|
|||||
|
Reclassification Adjustment for Net Securities Losses (Gains) Included in Net Income
|
337
|
|
13
|
|
(78
|
)
|
|||||
|
Net Retirement Plan Gain
|
214
|
|
1,721
|
|
848
|
|
|||||
|
Net Retirement Plan Prior Service (Cost) Credit
|
—
|
|
—
|
|
(224
|
)
|
|||||
|
Amortization of Net Retirement Plan Actuarial Loss
|
362
|
|
435
|
|
514
|
|
|||||
|
Accretion of Net Retirement Plan Prior Service Credit
|
(8
|
)
|
(7
|
)
|
(34
|
)
|
|||||
|
Other Comprehensive Income (Loss)
|
(35
|
)
|
1,138
|
|
(806
|
)
|
|||||
|
Comprehensive Income
|
$
|
29,291
|
|
$
|
27,672
|
|
$
|
23,856
|
|
||
See Notes to Consolidated Financial Statements.
#
57
ARROW FINANCIAL CORPORATION AND SUBSIDIARIES
CONSOLIDATED STATEMENTS OF CHANGES IN STOCKHOLDERS’ EQUITY
(Dollars In Thousands, Except Share and Per Share Amounts)
|
|
|||||||||||||||||||||||||||
|
Common
Stock
|
Additional
Paid-In
Capital
|
Retained
Earnings
|
Unallocated ESOP
Shares
|
Accumul
ated
Other Com
prehensive
Income
(Loss)
|
Treasury
Stock
|
Total
|
|||||||||||||||||||||
|
Balance at December 31, 2014
|
$
|
17,079
|
|
$
|
239,721
|
|
$
|
29,458
|
|
$
|
(1,450
|
)
|
$
|
(7,166
|
)
|
$
|
(76,716
|
)
|
$
|
200,926
|
|
||||||
|
Net Income
|
—
|
|
—
|
|
24,662
|
|
—
|
|
—
|
|
—
|
|
24,662
|
|
|||||||||||||
|
Other Comprehensive Loss
|
—
|
|
—
|
|
—
|
|
—
|
|
(806
|
)
|
—
|
|
(806
|
)
|
|||||||||||||
|
2% Stock Dividend (341,400 Shares)
|
342
|
|
8,939
|
|
(9,281
|
)
|
—
|
|
—
|
|
—
|
|
—
|
|
|||||||||||||
|
Cash Dividends Paid, $.93 per Share
1
|
—
|
|
—
|
|
(12,700
|
)
|
—
|
|
—
|
|
—
|
|
(12,700
|
)
|
|||||||||||||
|
Shares Issued for Stock Option Exercises, net
(43,096 Shares) |
—
|
|
489
|
|
—
|
|
—
|
|
—
|
|
429
|
|
918
|
|
|||||||||||||
|
Shares Issued Under the Directors’ Stock
Plan (8,480 Shares) |
—
|
|
143
|
|
—
|
|
—
|
|
—
|
|
84
|
|
227
|
|
|||||||||||||
|
Shares Issued Under the Employee Stock
Purchase Plan (19,036 Shares) |
—
|
|
306
|
|
—
|
|
—
|
|
—
|
|
188
|
|
494
|
|
|||||||||||||
|
Shares Issued for Dividend Reinvestment
Plans (32,171 Shares) |
—
|
|
570
|
|
—
|
|
—
|
|
—
|
|
316
|
|
886
|
|
|||||||||||||
|
Stock-Based Compensation Expense
|
—
|
|
308
|
|
—
|
|
—
|
|
—
|
|
—
|
|
308
|
|
|||||||||||||
|
Tax Benefit for Exercises of
Stock Options |
—
|
|
59
|
|
—
|
|
—
|
|
—
|
|
—
|
|
59
|
|
|||||||||||||
|
Purchase of Treasury Stock
(55,368 Shares) |
—
|
|
—
|
|
—
|
|
—
|
|
—
|
|
(1,498
|
)
|
(1,498
|
)
|
|||||||||||||
|
Allocation of ESOP Stock (17,645 Shares)
|
—
|
|
145
|
|
—
|
|
350
|
|
—
|
|
—
|
|
495
|
|
|||||||||||||
|
Balance at December 31, 2015
|
$
|
17,421
|
|
$
|
250,680
|
|
$
|
32,139
|
|
$
|
(1,100
|
)
|
$
|
(7,972
|
)
|
$
|
(77,197
|
)
|
$
|
213,971
|
|
||||||
|
Balance at December 31, 2015
|
$
|
17,421
|
|
$
|
250,680
|
|
$
|
32,139
|
|
$
|
(1,100
|
)
|
$
|
(7,972
|
)
|
$
|
(77,197
|
)
|
$
|
213,971
|
|
||||||
|
Net Income
|
—
|
|
—
|
|
26,534
|
|
—
|
|
—
|
|
—
|
|
26,534
|
|
|||||||||||||
|
Other Comprehensive (Loss) Income
|
—
|
|
—
|
|
—
|
|
—
|
|
1,138
|
|
—
|
|
1,138
|
|
|||||||||||||
|
3% Stock Dividend (522,425 Shares)
|
522
|
|
16,415
|
|
(16,937
|
)
|
—
|
|
—
|
|
—
|
|
—
|
|
|||||||||||||
|
Cash Dividends Paid, $.95 per Share
1
|
—
|
|
—
|
|
(13,092
|
)
|
—
|
|
—
|
|
—
|
|
(13,092
|
)
|
|||||||||||||
|
Shares Issued for Stock Option Exercises, net
(109,651 Shares)
|
—
|
|
1,265
|
|
—
|
|
—
|
|
—
|
|
1,139
|
|
2,404
|
|
|||||||||||||
|
Shares Issued Under the Directors’ Stock
Plan (6,005 Shares)
|
—
|
|
138
|
|
—
|
|
—
|
|
—
|
|
67
|
|
205
|
|
|||||||||||||
|
Shares Issued Under the Employee Stock
Purchase Plan (17,113 Shares)
|
—
|
|
318
|
|
—
|
|
—
|
|
—
|
|
175
|
|
493
|
|
|||||||||||||
|
Shares Issued for Dividend Reinvestment
Plans (55,432 Shares) |
—
|
|
1,167
|
|
—
|
|
—
|
|
—
|
|
576
|
|
1,743
|
|
|||||||||||||
|
Stock-Based Compensation Expense
|
—
|
|
287
|
|
—
|
|
—
|
|
—
|
|
—
|
|
287
|
|
|||||||||||||
|
Tax Benefit for Exercises of
Stock Options |
—
|
|
188
|
|
—
|
|
—
|
|
—
|
|
—
|
|
188
|
|
|||||||||||||
|
Purchase of Treasury Stock
(72,723 Shares)
|
—
|
|
—
|
|
—
|
|
—
|
|
—
|
|
(2,141
|
)
|
(2,141
|
)
|
|||||||||||||
|
Allocation of ESOP Stock (36,927 Shares)
|
—
|
|
422
|
|
—
|
|
700
|
|
—
|
|
—
|
|
1,122
|
|
|||||||||||||
|
Balance at December 30, 2016
|
$
|
17,943
|
|
$
|
270,880
|
|
$
|
28,644
|
|
$
|
(400
|
)
|
$
|
(6,834
|
)
|
$
|
(77,381
|
)
|
$
|
232,852
|
|
||||||
#
58
|
ARROW FINANCIAL CORPORATION AND SUBSIDIARIES
CONSOLIDATED STATEMENTS OF CHANGES IN STOCKHOLDERS’ EQUITY, Continued
(Dollars In Thousands, Except Share and Per Share Amounts)
|
|||||||||||||||||||||||||||
|
Common
Stock
|
Additional
Paid-In
Capital
|
Retained
Earnings
|
Unallocated ESOP
Shares
|
Accumul
ated
Other Com
prehensive
Income
(Loss)
|
Treasury
Stock
|
Total
|
|||||||||||||||||||||
|
Balance at December 30, 2016
|
$
|
17,943
|
|
$
|
270,880
|
|
$
|
28,644
|
|
$
|
(400
|
)
|
$
|
(6,834
|
)
|
$
|
(77,381
|
)
|
$
|
232,852
|
|
||||||
|
Net Income
|
—
|
|
—
|
|
29,326
|
|
—
|
|
—
|
|
—
|
|
29,326
|
|
|||||||||||||
|
Other Comprehensive (Loss) Income
|
—
|
|
—
|
|
—
|
|
—
|
|
(35
|
)
|
—
|
|
(35
|
)
|
|||||||||||||
|
Reclassification due to the adoption of ASU No.
2018-02
|
—
|
|
—
|
|
1,645
|
|
—
|
|
(1,645
|
)
|
—
|
|
—
|
|
|||||||||||||
|
3% Stock Dividend (538,100 Shares)
2
|
538
|
|
16,660
|
|
(17,198
|
)
|
—
|
|
—
|
|
—
|
|
—
|
|
|||||||||||||
|
Cash Dividends Paid, $.98 per Share
1
|
—
|
|
—
|
|
(13,599
|
)
|
—
|
|
—
|
|
—
|
|
(13,599
|
)
|
|||||||||||||
|
Shares Issued for Stock Option Exercises, net
(57,756 Shares)
|
—
|
|
544
|
|
—
|
|
—
|
|
—
|
|
646
|
|
1,190
|
|
|||||||||||||
|
Shares Issued Under the Directors’ Stock
Plan (6,828 Shares)
|
—
|
|
160
|
|
—
|
|
—
|
|
—
|
|
73
|
|
233
|
|
|||||||||||||
|
Shares Issued Under the Employee Stock
Purchase Plan (15,028 Shares)
|
—
|
|
331
|
|
—
|
|
—
|
|
—
|
|
165
|
|
496
|
|
|||||||||||||
|
Shares Issued for Dividend Reinvestment
Plans (49,605 Shares)
|
—
|
|
1,140
|
|
—
|
|
—
|
|
—
|
|
544
|
|
1,684
|
|
|||||||||||||
|
Stock-Based Compensation Expense
|
—
|
|
351
|
|
—
|
|
—
|
|
—
|
|
—
|
|
351
|
|
|||||||||||||
|
Purchase of Treasury Stock
(96,496 Shares)
|
—
|
|
—
|
|
—
|
|
—
|
|
—
|
|
(3,248
|
)
|
(3,248
|
)
|
|||||||||||||
|
Allocation of ESOP Stock (10,407 Shares)
|
—
|
|
153
|
|
—
|
|
200
|
|
—
|
|
—
|
|
353
|
|
|||||||||||||
|
Balance at December 31, 2017
|
$
|
18,481
|
|
$
|
290,219
|
|
$
|
28,818
|
|
$
|
(200
|
)
|
$
|
(8,514
|
)
|
$
|
(79,201
|
)
|
$
|
249,603
|
|
||||||
1
Cash dividends paid per share have been adjusted for the
September 28, 2017
3
% stock dividend.
2
Included in the shares issued for the
3
% stock dividend in
2017
were treasury shares of 133,152 and unallocated ESOP shares of 584.
See Notes to Consolidated Financial Statements.
#
59
ARROW FINANCIAL CORPORATION AND SUBSIDIARIES
(Dollars in Thousands)
|
December 31,
|
|||||||||||
|
Cash Flows from Operating Activities:
|
2017
|
2016
|
2015
|
||||||||
|
Net Income
|
$
|
29,326
|
|
$
|
26,534
|
|
$
|
24,662
|
|
||
|
Adjustments to Reconcile Net Income to Net Cash Provided by Operating Activities:
|
|||||||||||
|
Provision for Loan Losses
|
2,736
|
|
2,033
|
|
1,347
|
|
|||||
|
Depreciation and Amortization
|
5,398
|
|
5,940
|
|
6,293
|
|
|||||
|
Allocation of ESOP Stock
|
353
|
|
1,122
|
|
495
|
|
|||||
|
Gains on the Sale of Securities Available-for-Sale
|
(134
|
)
|
(317
|
)
|
(172
|
)
|
|||||
|
Losses on the Sale of Securities Available-for-Sale
|
582
|
|
339
|
|
43
|
|
|||||
|
Loans Originated and Held-for-Sale
|
(17,468
|
)
|
(23,787
|
)
|
(20,731
|
)
|
|||||
|
Proceeds from the Sale of Loans Held-for-Sale
|
18,171
|
|
24,422
|
|
21,524
|
|
|||||
|
Net Gains on the Sale of Loans
|
(546
|
)
|
(821
|
)
|
(692
|
)
|
|||||
|
Net Losses on the Sale or Write-down of Premises and Equipment,
Other Real Estate Owned and Repossessed Assets
|
210
|
|
232
|
|
297
|
|
|||||
|
Net Gain on the Sale of a Subsidiary
|
—
|
|
—
|
|
(204
|
)
|
|||||
|
Contributions to Pension & Postretirement Plans
|
(792
|
)
|
(690
|
)
|
(3,858
|
)
|
|||||
|
Deferred Income Tax (Benefit) Expense
|
(1,530
|
)
|
(283
|
)
|
1,036
|
|
|||||
|
Shares Issued Under the Directors
’
Stock Plan
|
233
|
|
205
|
|
227
|
|
|||||
|
Stock-Based Compensation Expense
|
351
|
|
287
|
|
308
|
|
|||||
|
Tax Benefit from Exercise of Stock Options
|
112
|
|
—
|
|
—
|
|
|||||
|
Net (Increase) in Other Assets
|
(157
|
)
|
(1,598
|
)
|
(1,147
|
)
|
|||||
|
Net Increase (Decrease) in Other Liabilities
|
982
|
|
1,077
|
|
(502
|
)
|
|||||
|
Net Cash Provided By Operating Activities
|
37,827
|
|
34,695
|
|
28,926
|
|
|||||
|
Cash Flows from Investing Activities:
|
|||||||||||
|
Proceeds from the Sale of Securities Available-for-Sale
|
107,175
|
|
97,930
|
|
66,551
|
|
|||||
|
Proceeds from the Maturities and Calls of Securities Available-for-Sale
|
53,863
|
|
88,719
|
|
93,817
|
|
|||||
|
Purchases of Securities Available-for-Sale
|
(117,262
|
)
|
(134,950
|
)
|
(201,820
|
)
|
|||||
|
Proceeds from the Maturities and Calls of Securities Held-to-Maturity
|
49,244
|
|
56,461
|
|
48,409
|
|
|||||
|
Purchases of Securities Held-to-Maturity
|
(40,851
|
)
|
(82,433
|
)
|
(68,210
|
)
|
|||||
|
Net Increase in Loans
|
(200,600
|
)
|
(182,065
|
)
|
(164,710
|
)
|
|||||
|
Proceeds from the Sales or Write-down of Premises and Equipment, Other
Real Estate Owned and Repossessed Assets
|
1,408
|
|
1,991
|
|
1,901
|
|
|||||
|
Purchase of Premises and Equipment
|
(2,602
|
)
|
(1,441
|
)
|
(1,621
|
)
|
|||||
|
Proceeds from the Sale of a Subsidiary, Net
|
96
|
|
72
|
|
132
|
|
|||||
|
Net (Increase) Decrease in Federal Home Loan Bank Stock
|
963
|
|
(2,073
|
)
|
(3,988
|
)
|
|||||
|
Purchase of Bank Owned Life Insurance
|
—
|
|
—
|
|
—
|
|
|||||
|
Net Cash Used In Investing Activities
|
(148,566
|
)
|
(157,789
|
)
|
(229,539
|
)
|
|||||
|
Cash Flows from Financing Activities:
|
|||||||||||
|
Net Increase in Deposits
|
128,569
|
|
86,123
|
|
127,475
|
|
|||||
|
Net Increase (Decrease) in Short-Term Federal Home Loan Bank Borrowings
|
(18,000
|
)
|
41,000
|
|
41,000
|
|
|||||
|
Net Increase in Short-Term Borrowings
|
29,130
|
|
12,663
|
|
3,752
|
|
|||||
|
Federal Home Loan Bank Advances
|
—
|
|
—
|
|
55,000
|
|
|||||
|
Repayments of Federal Home Loan Bank Advances
|
—
|
|
—
|
|
(10,000
|
)
|
|||||
|
Purchase of Treasury Stock
|
(3,248
|
)
|
(2,141
|
)
|
(1,498
|
)
|
|||||
|
Shares Issued for Stock Option Exercises, net
|
1,190
|
|
2,404
|
|
918
|
|
|||||
|
Shares Issued Under the Employee Stock Purchase Plan
|
496
|
|
493
|
|
494
|
|
|||||
|
Tax Benefit for Exercises of Stock Options
|
—
|
|
188
|
|
59
|
|
|||||
|
Shares Issued for Dividend Reinvestment Plans
|
1,684
|
|
1,743
|
|
886
|
|
|||||
|
Cash Dividends Paid
|
(13,599
|
)
|
(13,092
|
)
|
(12,700
|
)
|
|||||
|
Net Cash Provided By Financing Activities
|
126,222
|
|
129,381
|
|
205,386
|
|
|||||
|
Net Increase (Decrease) in Cash and Cash Equivalents
|
15,483
|
|
6,287
|
|
4,773
|
|
|||||
|
Cash and Cash Equivalents at Beginning of Year
|
57,355
|
|
51,068
|
|
46,295
|
|
|||||
|
Cash and Cash Equivalents at End of Year
|
$
|
72,838
|
|
$
|
57,355
|
|
$
|
51,068
|
|
||
|
Supplemental Disclosures to Statements of Cash Flow Information:
|
|||||||||||
|
Interest on Deposits and Borrowings
|
$
|
6,957
|
|
$
|
5,341
|
|
$
|
4,856
|
|
||
|
Income Taxes
|
11,454
|
|
11,961
|
|
9,357
|
|
|||||
|
Non-cash Investing and Financing Activity:
|
|||||||||||
|
Transfer of Loans to Other Real Estate Owned and Repossessed Assets
|
1,779
|
|
1,876
|
|
3,046
|
|
|||||
See Notes to Consolidated Financial Statements.
#
60
NOTES TO CONSOLIDATED FINANCIAL STATEMENTS
|
Note 1:
|
RISKS AND UNCERTAINTIES
|
Nature of Operations -
Arrow Financial Corporation, a New York corporation, was incorporated on March 21, 1983 and is registered as a bank holding company within the meaning of the Bank Holding Company Act of 1956. Our banking subsidiaries are Glens Falls National Bank and Trust Company (Glens Falls National/GFNB) whose main office is located in Glens Falls, New York, and Saratoga National Bank and Trust Company (Saratoga National/SNB) whose main office is located in Saratoga Springs, New York. The two banks provide a full range of services to individuals and small to mid-size businesses in northeastern New York State from Albany, the State's capitol, to the Canadian border. Both banks have trust departments which provide investment management and administrative services. The insurance agencies specialize in property and casualty insurance, group health insurance and individual life insurance. Active subsidiaries of Glens Falls National include Capital Financial Group, Inc. (an insurance agency specializing in selling and servicing group health care policies and life insurance), Upstate Agency, LLC (a property and casualty insurance agency), North Country Investment Advisers, Inc. (a registered investment adviser that provides investment advice to our proprietary mutual funds) and Arrow Properties, Inc. (a real estate investment trust, or REIT). Arrow also owns directly two subsidiary business trusts, organized in 2003 and 2004 to issue trust preferred securities (TRUPs), which are still outstanding.
Concentrations of Credit -
Virtually all of Arrow's loans are with borrowers in upstate New York. Although the loan portfolios of the subsidiary banks are well diversified, tourism has a substantial impact on the northeastern New York economy. The commitments to extend credit are fairly consistent with the distribution of loans presented in Note 5, generally have the same credit risk and are subject to normal credit policies. Generally, the loans are secured by assets and are expected to be repaid from cash flow or the sale of selected assets of the borrowers. Arrow evaluates each customer's creditworthiness on a case-by-case basis. The amount of collateral obtained, if deemed necessary by Arrow upon extension of credit, is based upon management's credit evaluation of the counterparty. The nature of the collateral varies with the type of loan and may include: residential real estate, cash and securities, inventory, accounts receivable, property, plant and equipment, income producing commercial properties and automobiles.
|
Note 2:
|
SUMMARY OF SIGNIFICANT ACCOUNTING POLICIES
|
Principles of Consolidation -
The financial statements of Arrow and its wholly owned subsidiaries are consolidated and all material inter-company transactions have been eliminated. In the
“
Parent Company Only
”
financial statements in Note 20, the investment in wholly owned subsidiaries is carried under the equity method of accounting. When necessary, prior years
’
consolidated financial statements have been reclassified to conform to the current-year financial statement presentation.
The Company determines whether it has a controlling financial interest in an entity by first evaluating whether the entity is a voting interest entity or a variable interest entity under GAAP. Voting interest entities are entities in which the total equity investment at risk is sufficient to enable the entity to finance itself independently and provides the equity holders with the obligation to absorb losses, the right to receive residual returns and the right to make decisions about the entity’s activities. The Company consolidates voting interest entities in which it has all, or at least a majority of, the voting interest. As defined in applicable accounting standards, variable interest entities (VIE) are entities that lack one or more of the characteristics of a voting interest entity. A controlling financial interest in a VIE is present when the Company has both the power and ability to direct the activities of the VIE that most significantly impact the VIE's economic performance and an obligation to absorb losses or the right to receive benefits that could potentially be significant to the VIE. The Company’s wholly owned subsidiaries Arrow Capital Statutory Trust II and Arrow Capital Statutory Trust III are VIEs for which the Company is not the primary beneficiary. Accordingly, the accounts of these entities are not included in the Company’s consolidated financial statements.
Segment Reporting -
Arrow operations are primarily in the community banking industry, which constitutes Arrow
’
s only segment for financial reporting purposes. Arrow provides other services, such as trust administration, retirement plan administration, advice to our proprietary mutual funds and insurance products, but these services do not rise to the quantitative thresholds for separate disclosure. Arrow operates primarily in the northeastern region of New York State in Warren, Washington, Saratoga, Essex, Clinton, Rensselaer, Albany, and Schenectady counties and surrounding areas.
Cash and Cash Equivalents -
Cash and cash equivalents include the following items: cash at branches, due from bank balances, cash items in the process of collection, interest-bearing bank balances and federal funds sold.
Securities -
Management determines the appropriate classification of securities at the time of purchase. Securities reported as held-to-maturity are those debt securities which Arrow has both the positive intent and ability to hold to maturity and are stated at amortized cost. Securities available-for-sale are reported at fair value, with unrealized gains and losses reported in accumulated other comprehensive income or loss, net of taxes. Realized gains and losses are based upon the amortized cost of the specific security sold. A decline in the fair value of any available-for-sale or held-to-maturity security below cost that is deemed to be other-than-temporary results in an impairment to reduce the carrying amount to fair value. To determine whether an impairment is other-than-temporary, we consider all available information relevant to the collectability of the security, including past events, current conditions, and reasonable and supportable forecasts when developing an estimate of cash flows expected to be collected. Evidence considered in this assessment includes the reasons for impairment, the severity and duration of the impairment, changes in value
#
61
subsequent to year-end, forecasted performance of the investee, and the general market condition in the geographic area or industry the investee operates in. When an other-than-temporary impairment has occurred on a debt security, the amount of the other-than-temporary impairment recognized in earnings depends on whether we intend to sell the debt security or more likely than not will be required to sell the debt security before recovery of its amortized cost basis less any current-period credit loss. If we intend to sell the debt security or it is more likely than not that we will be required to sell the debt security before recovery of its amortized cost basis less any current-period credit loss, the other-than-temporary impairment is recognized in earnings equal to the entire difference between the investment
’
s amortized cost basis and its fair value at the balance sheet date. If we do not intend to sell the debt security and it is not more likely than not that we will be required to sell the debt security before recovery of its amortized cost basis, the other-than-temporary impairment is separated into the amount representing the credit loss and the amount related to all other factors. The amount of the total other-than-temporary impairment related to the credit loss is recognized in earnings. The amount of the total other-than-temporary impairment related to other factors is recognized in other comprehensive income, net of applicable income taxes.
Loans and Allowance for Loan Losses -
Interest income on loans is accrued and credited to income based upon the principal amount outstanding. Loan fees and costs directly associated with loan originations are deferred and amortized/accreted as an adjustment to yield over the lives of the loans originated.
From time-to-time, Arrow has sold (most with servicing retained) residential real estate loans at or shortly after origination. Any gain or loss on the sale of loans, along with the value of the servicing right, is recognized at the time of sale as the difference between the recorded basis in the loan and net proceeds from the sale. Loans held for sale are recorded at the lower of cost or fair value on an aggregate basis.
Loans are placed on nonaccrual status either due to the delinquency status of principal and/or interest or a judgment by management that the full repayment of principal and interest is unlikely. Unless already placed on nonaccrual status, loans secured by home equity lines of credit are put on nonaccrual status when 120 days past due; residential real estate loans when 150 days past due; commercial and commercial real estate loans are evaluated on a loan-by-loan basis and are placed on nonaccrual status when 90 days past due if the full collection of principal and interest is uncertain; all other loans are to be moved to non-accrual status upon the earliest occurrence of repossession, bankruptcy, delinquency of 90 days or more unless the loan is secured and in the process of collection with no loss anticipated or when full collection of principal and interest is in doubt.
The balance of any accrued interest deemed uncollectible at the date the loan is placed on nonaccrual status is reversed, generally against interest income. A loan is returned to accrual status at the later of the date when the past due status of the loan falls below the threshold for nonaccrual status or management deems that it is likely that the borrower will repay all interest and principal. For payments received while the loan is on nonaccrual status, we may recognize interest income on a cash basis if the repayment of the remaining principal and accrued interest is deemed likely.
The allowance for loan losses is maintained by charges to operations based upon our best estimate of the probable amount of loans that we will be unable to collect based on current information and events. Provisions to the allowance for loan losses are offset by actual loan charge-offs (net of any recoveries). We evaluate the loan portfolio for potential charge-offs on a monthly basis. In general, automobile and other consumer loans are charged-off when 120 days delinquent. Residential real estate loans are charged-off when a loss becomes known or based on a new appraisal at the earlier of 180 days past due or repossession. Commercial and commercial real estate loans are evaluated early in their delinquency status and are charged-off when management concludes that not all principal will be repaid from on-going cash flows or liquidation of collateral. An evaluation of estimated proceeds from the liquidation of the loan
’
s collateral is compared to the loan carrying amount and a charge to the allowance for loan losses is taken for any deficiency. While management uses available information to recognize losses on loans, future additions to the allowance may be necessary based on changes in economic conditions in Arrow's market area. In addition, various Federal regulatory agencies, as an integral part of their examination process, review Arrow's allowance for loan losses. Such agencies may require Arrow to recognize additions to the allowance in future periods, based on their judgments about information available to them at the time of their examination, which may not be currently available to management.
We consider nonaccrual loans over $250 thousand and all troubled debt restructured loans to be impaired loans and we evaluate these loans individually to determine the amount of impairment, if any. The amount of impairment, if any, related to individual impaired loans is measured based on either the present value of expected future cash flows discounted at the loan's effective interest rate, the loan's observable market price or the fair value of the collateral if the loan is collateral dependent. Arrow determines impairment for collateral dependent loans based on the fair value of the collateral less estimated costs to sell. Any excess of the recorded investment in the collateral dependent impaired loan over the estimated collateral value, less costs to sell, is typically charged off. For impaired loans which are not collateral dependent, impairment is measured by comparing the recorded investment in the loan to the present value of the expected cash flows, discounted at the loan
’
s effective interest rate. If this amount is less than the recorded investment in the loan, an impairment reserve is recognized as part of the allowance for loan losses, or based upon the judgment of management all or a portion of the excess of the recorded investment in the loan over the present value of the estimated future cash flow may be charged off.
The allowance for loan losses on the remaining loans is primarily determined based upon consideration of the historical loss factor incorporating a rolling twelve quarter look-back period of the respective segment that have occurred within each pool of loans over the loss emergence period (LEP), adjusted as necessary based upon consideration of qualitative considerations impacting the inherent risk of loss in the respective loan portfolios. The LEP is an estimate of the average amount of time from the point at which a loss is incurred on a loan to the point at which the loss is recognized in the financial statements. Since the LEP may change under various economic environments, we update the LEP calculation on an annual basis. We also consider and adjust historical net loss factors for qualitative factors that impact the inherent risk of loss associated with our loan categories within our total loan portfolio. These include:
|
•
|
Changes in the volume and severity of past due, nonaccrual and adversely classified loans
|
#
62
|
•
|
Changes in the nature and volume of the portfolio and in the terms of loans
|
|
•
|
Changes in the value of the underlying collateral for collateral dependent loans
|
|
•
|
Changes in lending policies and procedures, including changes in underwriting standards and collection, charge-off, and recovery practices not considered elsewhere in estimating credit losses
|
|
•
|
Changes in the quality of the loan review system
|
|
•
|
Changes in the experience, ability, and depth of lending management and other relevant staff
|
|
•
|
Changes in international, national, regional, and local economic and business conditions and developments that affect the collectability of the portfolio
|
|
•
|
The existence and effect of any concentrations of credit, and changes in the level of such concentrations
|
|
•
|
The effect of other external factors such as competition and legal and regulatory requirements on the level of estimated credit losses in the existing portfolio or pool
|
In management
’
s opinion, the balance of the allowance for loan losses, at each balance sheet date, is sufficient to provide for probable loan losses inherent in the corresponding loan portfolio.
Other Real Estate Owned and Repossessed Assets -
Real estate acquired by foreclosure and assets acquired by repossession are recorded at the fair value of the property less estimated costs to sell at the time of repossession. Subsequent declines in fair value, after transfer to other real estate owned and repossessed assets are recognized through a valuation allowance. Such declines in fair value along with related operating expenses to administer such properties or assets are charged directly to operating expense.
Premises and Equipment -
Premises and equipment are stated at cost, less accumulated depreciation and amortization. Depreciation and amortization included in operating expenses are computed largely on the straight-line method. Depreciation is based on the estimated useful lives of the assets (buildings and improvements
20
-
40
years; furniture and equipment
7
-
10
years; data processing equipment
5
-
7
years) and, in the case of leasehold improvements, amortization is computed over the terms of the respective leases or their estimated useful lives, whichever is shorter. Gains or losses on disposition are reflected in earnings.
Investments in Real Estate Limited Partnerships -
These limited partnerships acquire, develop and operate low and moderate-income housing. As a limited partner in these projects, we receive low income housing tax credits and tax deductions for losses incurred by the underlying properties. We apply the proportional amortization method allowed in Accounting Standards Update 2014-01 "Investments - Equity Method and Joint Ventures (Topic 323): Accounting for Investments in Qualified Affordable Housing Projects." The proportional amortization method permits an entity to amortize the initial cost of the investment in proportion to the amount of the tax credits and other tax benefits received and to recognize the net investment performance in the income statement as a component of income tax expense.
Income Taxes
-
T
he Tax Act was enacted on December 22, 2017 and requires the Company to reflect the changes associated with the law’s provisions in its 2017 fourth quarter. The law is complex and has extensive implications for the Company’s federal and state current and deferred taxes and income tax expense. The Company has recorded and reported the effects of the law’s impacts in its financial statements for the period ended December 31, 2017. See Note 15,
Income Taxes
, to the notes to our Consolidated Financial Statements for more information.
Arrow accounts for income taxes under the asset and liability method. Deferred tax assets and liabilities are recognized for the future tax consequences attributable to differences between the financial statement carrying amounts of existing assets and liabilities and their respective tax bases. Deferred tax assets and liabilities are measured using enacted tax rates expected to apply to taxable income in the years in which those temporary differences are expected to be recovered or settled. The effect on deferred tax assets and liabilities of a change in tax rates is recognized in income tax expense in the period that includes the enactment date. Arrow
’
s policy is that deferred tax assets are reduced by a valuation allowance if, based on the weight of available evidence, it is more likely than not that some or all of the deferred tax assets will not be realized.
Goodwill and Other Intangible Assets -
Identifiable intangible assets acquired in a business combination are capitalized and amortized. Any remaining unidentifiable intangible asset is classified as goodwill, for which amortization is not required but which must be evaluated for impairment. Arrow tests for impairment of goodwill on an annual basis, or when events and circumstances indicate potential impairment. In evaluating goodwill for impairment, Arrow first assesses certain qualitative factors to determine if it is more likely than not that the fair value of the reporting unit is less than its carrying value. If it is more likely than not that the fair value of a reporting unit exceeds its carrying amount, goodwill of the reporting unit is considered not impaired. If the carrying amount of a reporting unit exceeds its fair value, the second step of the goodwill impairment test is performed to measure the amount of impairment loss, if any.
The carrying amounts of other recognized intangible assets that meet recognition criteria and for which separate accounting records have been maintained (depositor intangibles, mortgage servicing rights and customer intangibles), have been included in the consolidated balance sheet as
“
Other Intangible Assets, Net.
”
Depositor intangibles are being amortized on a straight-line basis over a period of
ten
to
fifteen
years.
Arrow has sold residential real estate loans, primarily to Freddie Mac, with servicing retained. Mortgage servicing rights are recognized as an asset when loans are sold with servicing retained, by allocating the cost of an originated mortgage loan between the loan and servicing right based on estimated relative fair values. The cost allocated to the servicing right is capitalized as a separate asset and amortized in proportion to, and over the period of, estimated net servicing income. Capitalized mortgage servicing rights are evaluated for impairment by comparing the asset
’
s carrying value to its current estimated fair value. Fair values
#
63
are estimated using a discounted cash flow approach, which considers future servicing income and costs, current market interest rates, and anticipated prepayment, and default rates. Impairment losses are recognized through a valuation allowance for servicing rights having a current fair value that is less than amortized cost on an aggregate basis. Adjustments to increase or decrease the valuation allowance are charged or credited to income as a component of other operating income.
Pension and Postretirement Benefits -
Arrow maintains a non-contributory, defined benefit pension plan covering substantially all employees, a supplemental pension plan covering certain executive officers selected by the Board of Directors, and certain post-retirement medical, dental and life insurance benefits for employees and retirees. The costs of these plans, based on actuarial computations of current and future benefits for employees, are charged to current operating expenses. The cost of post-retirement benefits other than pensions is recognized on an accrual basis as employees perform services to earn the benefits. Arrow recognizes the overfunded or underfunded status of our single employer defined benefit pension plan as an asset or liability on its consolidated balance sheet and recognizes changes in the funded status in comprehensive income in the year in which the change occurred.
Prior service costs or credits are amortized on a straight-line basis over the average remaining service period of active participants. Gains and losses in excess of 10% of the greater of the benefit obligation or the fair value of assets are amortized over the average remaining service period of active participants.
The discount rate assumption is determined by preparing an analysis of the respective plan’s expected future cash flows and high-quality fixed-income investments currently available and expected to be available during the period to maturity of the pension benefits.
Stock-Based Compensation Plans -
Arrow has
two
stock option plans, which are described more fully in Note 12. The Company expenses the grant date fair value of options granted. The expense is recognized over the vesting period of the grant, typically
four
years, on a straight-line basis. Shares are generally issued from treasury for the exercise of stock options.
Arrow sponsors an Employee Stock Purchase Plan ("ESPP") under which employees may purchase Arrow
’
s common stock at a
5%
discount below market price at the time of purchase. This stock purchase plan is not considered a compensatory plan.
Arrow maintains an employee stock ownership plan (
“
ESOP
”
). Substantially all employees of Arrow and its subsidiaries are eligible to participate upon satisfaction of applicable service requirements. The ESOP borrowed funds from one of Arrow
’
s subsidiary banks to purchase outstanding shares of Arrow
’
s common stock. The notes require annual payments of principal and interest through 2018. As the debt is repaid, shares are released from collateral based on the proportion of debt paid to total debt outstanding for the year and allocated to active employees. In addition, the Company makes additional cash contributions to the Plan each year.
Securities Sold Under Agreements to Repurchase -
In securities repurchase agreements, Arrow receives cash from a counterparty in exchange for the transfer of securities to a third party custodian
’
s account that explicitly recognizes Arrow
’
s interest in the securities. These agreements are accounted for by Arrow as secured financing transactions, since it maintains effective control over the transferred securities, and meets other criteria for such accounting. Accordingly, the cash proceeds are recorded as borrowed funds, and the underlying securities continue to be carried in Arrow
’
s securities available-for-sale portfolio.
Earnings Per Share (
“
EPS
”
) -
Basic EPS excludes dilution and is computed by dividing income available to common stockholders by the weighted average number of common shares outstanding for the period. Diluted EPS reflects the potential dilution that could occur if securities or other contracts to issue common stock were exercised or converted into common stock or resulted in the issuance of common stock that then shared in the earnings of the entity (such as Arrow
’
s stock options), computed using the treasury stock method. Unallocated common shares held by Arrow
’
s Employee Stock Ownership Plan are not included in the weighted average number of common shares outstanding for either the basic or diluted EPS calculation.
Financial Instruments -
Arrow is a party to certain financial instruments with off-balance sheet risk, such as: commercial lines of credit, construction lines of credit, overdraft protection, home equity lines of credit and standby letters of credit. Arrow's policy is to record such instruments when funded. Fair value estimates are made at a specific point in time, based on relevant market information and information about the financial instrument. These estimates do not reflect any premium or discount that could result from offering for sale at one time Arrow's entire holdings of a particular financial instrument. Because no market exists for a significant portion of Arrow's financial instruments, fair value estimates are based on judgments regarding future expected loss experience, current economic conditions, risk characteristics of various financial instruments, and other factors. These estimates are subjective in nature and involve uncertainties and matters of significant judgment and therefore cannot be determined with precision. Changes in assumptions could significantly affect the estimates.
Fair value estimates are based on existing on- and off-balance sheet financial instruments without attempting to estimate the value of anticipated future business and the value of assets and liabilities that are not considered financial instruments. For example, Arrow has a trust department that contributes net fee income annually. The value of trust department customer relationships is not considered a financial instrument of the Company, and therefore this value has not been incorporated into the fair value estimates. Other significant assets and liabilities that are not considered financial assets or liabilities include deferred taxes, premises and equipment, the value of low-cost, long-term core deposits and goodwill. In addition, the tax ramifications related to the realization of the unrealized gains and losses can have a significant effect on fair value estimates and have not been considered in any of the estimates.
The carrying amount of the following short-term assets and liabilities is a reasonable estimate of fair value: cash and due from banks, federal funds sold and purchased, securities sold under agreements to repurchase, demand deposits, savings, N.O.W. and money market deposits, other short-term borrowings, accrued interest receivable and accrued interest payable. The fair value
#
64
estimates of other on- and off-balance sheet financial instruments, as well as the method of arriving at fair value estimates, are included in the related footnotes and summarized in Note 17.
Fair Value Measures -
We determine the fair value of financial instruments under the following hierarchy:
|
•
|
Level 1
–
Unadjusted quoted prices in active markets that are accessible at the measurement date for identical, unrestricted assets or liabilities;
|
|
•
|
Level 2
–
Quoted prices for similar assets or liabilities in active markets, quoted prices for identical or similar assets or liabilities in markets that are not active, or inputs that are observable, either directly or indirectly, for substantially the full term of the asset or liability;
|
|
•
|
Level 3
–
Prices or valuation techniques that require inputs that are both significant to the fair value measurement and unobservable (i.e., supported by little or no market activity).
|
A financial instrument
’
s level within the fair value hierarchy is based on the lowest level of input that is significant to the fair value measurement.
Management
’
s Use of Estimates
-The preparation of the consolidated financial statements in conformity with accounting principles generally accepted in the United States of America requires management to make estimates and assumptions that affect the reported amounts of assets and liabilities and disclosure of contingent assets and liabilities at the date of the consolidated financial statements and the reported amounts of income and expenses during the reporting period. Our most significant estimates are the allowance for loan losses, the evaluation of other-than-temporary impairment of investment securities, goodwill impairment, pension and other postretirement liabilities and an analysis of a need for a valuation allowance for deferred tax assets. Actual results could differ from those estimates.
A material estimate that is particularly susceptible to significant change in the near term is the allowance for loan losses. In connection with the determination of the allowance for loan losses, management obtains appraisals for properties. The allowance for loan losses is management
’
s best estimate of probable loan losses incurred as of the balance sheet date. While management uses available information to recognize losses on loans, future adjustments to the allowance for loan losses may be necessary based on changes in economic conditions.
Recently Adopted and Recently Issued Accounting Standards
The following accounting standard has been adopted in 2017:
Effective January 1, 2017, Arrow adopted FASB accounting standard ASU 2016-09 "Improvements to Employee Share-Based Payment Accounting," which makes several revisions to equity compensation accounting. Under the new guidance all excess tax benefits and deficiencies that occur when an award is exercised or expires are recognized in income tax expense as discrete period items. Previously, these transactions were typically recorded directly within equity. Excess tax benefits are also recognized at the time an award is exercised compared to the previous requirement to delay recognition until the deduction reduces taxes payable. All tax related cash flows recognized on stock-based compensation expense are classified as an operating activity in our Consolidated Statements of Cash Flows on a prospective basis. Accordingly, prior periods have not been adjusted. ASU 2016-09 also provides an accounting policy election to recognize forfeitures of awards as they occur when estimating stock-based compensation expense rather than the previous requirement to estimate forfeitures from inception. Further, ASU 2016-09 permits employers to use a net-settlement feature to withhold taxes on equity compensation awards up to the maximum statutory tax rate without affecting the equity classification of the award. Under previous guidance, withholding of equity awards in excess of the minimum statutory requirement resulted in liability classification for the entire award. The related cash remittance by the employer for employee taxes is treated as a financing activity in the statement of cash flows.
Income tax benefits from stock options exercised in the period reduced our effective tax rate for the year ended
December 31, 2017
, which resulted in an increase in earnings of approximately
$148 thousand
, representing earnings per share of approximately
$0.01
.
In February 2018, the FASB issued ASU 2018-02, "Income Statement-Reporting Comprehensive Income (Topic 220)." This ASU allows for the option to reclassify from accumulated other comprehensive income ("AOCI") to retained earnings for stranded tax effects resulting from the newly enacted federal corporate income tax rate in the Tax Cuts and Jobs Act of 2017, which was enacted on December 22, 2017. The legislation included a reduction to the corporate income tax rate from 35 percent to 21 percent effective January 1, 2018. The amount of the reclassification would be the difference between the historical corporate income tax rate and the newly enacted 21 percent corporate income tax rate. The amendments in this ASU are effective for fiscal years beginning after December 15, 2018, including interim periods within those fiscal years. Early adoption is permitted for public businesses for reporting periods for which financial statements have not yet been issued. Arrow adopted the guidance as of December 31, 2017. The adoption of this ASU was accounted for as a cumulative-effect adjustment to the balance sheet resulting in a
$1.6 million
increase to retained earnings and a corresponding decrease to AOCI on December 31, 2017.
The following accounting standards have been issued and become effective for the Company at a future date:
ASU 2014-09 - Revenue from Contracts with Customers clarifies the principles for recognizing revenue and supersedes most current revenue recognition guidance. The core principle of the revenue standard is that an entity recognizes revenue to depict the transfer of promised goods or services to customers in an amount that reflects the consideration to which the entity expects to be entitled in exchange for those goods or services. The ASU is intended to clarify and converge the revenue recognition principles under GAAP to streamline revenue recognition requirements in addition to expanding required revenue recognition disclosures.
#
65
In August 2015, the FASB issued ASU 2015-14, Deferral of the Effective Date, which provides a one year deferral to the effective date, therefore, ASU 2014-09 is effective for public companies for annual periods, and interim periods within those annual periods, beginning on or after December 15, 2017. As such, we adopted ASU 2014-09 as of January 1, 2018 and will be using the modified retrospective approach. A significant amount of our revenues are derived from net interest income on financial assets and liabilities, which are excluded from the scope of the amended guidance. We have identified the recognition of revenue related to specific types of Fiduciary activities to be in the scope of this amended guidance. The cumulative effect of the January 1, 2018 adoption was a decrease to retained earnings of
$330 thousand
.
ASU 2016-01 "Recognition and Measurement of Financial Assets and Financial Liabilities" will significantly change the income statement impact of equity investments. For Arrow, the standard became effective for the first quarter of 2018, and will require that equity investments be measured at fair value, with changes in fair value measured in net income. As of
December 31, 2017
, we held
$1.6 million
of fair value in equity investments and we do not expect that the adoption of this change in accounting for equity investments will have a material impact on our financial position or the results of operations in periods subsequent to its adoption.
ASU 2016-02 "Leases" will require the recognition of operating leases. For Arrow, the standard becomes effective in the first quarter of 2019. We do not expect that the adoption of this change in accounting for operating leases will have a material impact on our financial position or the results of operations in periods subsequent to its adoption. As of
December 31, 2017
, we have less than
$2.2 million
in minimum lease payments for existing operating leases of branch and insurance locations with varying expiration dates from 2018 to 2031.
ASU 2016-13 "Financial Instruments - Credit Losses" will change the way we and other financial entities recognize losses on credit instruments, primarily loans and available-for-sale securities. Currently, loan losses are recognized using an "incurred loss" methodology that delays recognition until it is probable a loss has been incurred. Under the ASU, the incurred loss model will be replaced with a methodology that reflects current expected credit losses (CECL) over the life of the instrument and requires consideration of a broader range of reasonable and supportable information to inform credit loss estimates. Currently, credit losses on available-for-sale securities reduce the carrying value of the instrument and cannot be reversed. Under the ASU, the amount of the credit loss is carried as a valuation allowance and can be reversed. For Arrow, the standard is effective for the first quarter of 2020 and early adoption is allowed in 2019. We plan on adopting the standard in the first quarter of 2020, in order to maximize the accumulation of data needed to calculate the new CECL methodologies. The ASU describes several acceptable methodologies for calculating expected losses on a loan or a pool of loans. Although other methodologies are allowed, we plan on only using the methodologies described in the ASU. Arrow is still evaluating criteria for loan segments and the appropriate methodology for each segment. It is logically presumable that a CECL methodology will result in higher levels of the allowance for loan losses than an incurred loss model. The initial adjustment will not be reported in earnings, but as the cumulative effect of a change in accounting principle. We expect that the adoption of the new standard will have a material impact on the level of the allowance for loan losses, but we do not expect that the periodic provision for loan losses to be materially higher than our historic amounts. The adoption of the standard will have an impact on shareholders’ equity, but we expect that we will remain well-capitalized under current regulatory calculations. The standard also requires new disclosures about the loan portfolio. Both the FASB and banking regulators have made estimates of the range of percentage increases in the allowance for loan losses. One FASB board member has determined that the initial range of 30% to 50% for increases in bank allowances to be overestimated, with the most likely range being in the single digits, although some institutions will experience higher increases. Due to our historical low level of loan losses and our current conservative underwriting standards, we believe that our increase will be in the single digits. The FASB’s Transition Research Group for credit losses still has several outstanding unresolved questions, some of which may have a significant impact on CECL calculations. In 2016 we selected a third-party software product to calculate our CECL methodologies. We also began to accumulate a database of monthly loan data, beginning with June 2015, of the fields needed to make the loss calculations under the new CECL methodologies. During 2018, we plan on refining our loan segment criteria and, for most segments, we will calculate expected losses (for an expanding database) using two or more of the applicable methodologies before determining the most appropriate methodology for each loan segment or sub-segment.
ASU 2016-15, "Statement of Cash Flows (Topic 230) - Classification of Certain Cash Receipts and Cash Payments" will existing diversity in practice with respect to eight specific cash flow issues. The amendment is effective for fiscal years beginning after December 15, 2017, including interim periods within those fiscal years. Early adoption is permitted, including adoption in an interim period. If an entity early adopts the amendments in an interim period, any adjustments should be reflected as of the beginning of the fiscal year that includes the interim period. An entity that elects early adoption must adopt all of the amendments in the same period. The amendments in this update should be applied using a retrospective transition method to each period presented. Arrow intends to adopt this ASU in 2018, as required, and determined the adoption of these amendments will not have a material impact on Arrow's results of operations, financial position or liquidity.
ASU 2017-01 "Business Combinations" defines when a set of assets and activities constitutes a business for the purposes of determining whether transactions should be accounted for as acquisitions (or disposals) of assets or businesses. Previously, the three elements required to be present in a business are inputs, processes, and outputs. The amendments in this update allow for a business to consist of inputs, processes, and the ability to create output. For Arrow, the standard became effective in the first quarter of 2018. This update had no effect on our accounting for acquisitions and dispositions of businesses.
ASU 2017-04 "Intangibles-Goodwill and Other" changes the procedures for evaluating impairment of goodwill. Prior to this Update, entities were required to perform procedures to determine the fair value of the underlying assets and liabilities following the guidance for determining the fair value of assets and liabilities in a business combination. This additional step to impairment testing has been eliminated. Under the amendments in this Update, entities should perform goodwill impairment testing by comparing the fair value of a reporting unit to its carrying value. This amendment should reduce the cost and complexity of evaluating goodwill for impairment. For Arrow, the standard becomes effective in the first quarter of 2019, however, early adoption is permitted. This amendment will not affect our assessment of goodwill impairment since we currently perform the analysis of comparing carrying value to fair value of our reporting units that have goodwill and we have not had to perform a Step 2 Impairment Test to date.
#
66
ASU 2017-07 "Compensation-Retirement Benefits" improves the presentation of net periodic pension cost and net periodic post-retirement benefit cost by requiring that an employer disaggregate the service cost component from the other components of net benefit cost. The amendments also provide explicit guidance on how to present the service cost component and the other components of net benefit cost in the income statement and allow only the service cost component of net benefit cost to be eligible for capitalization. For Arrow, the standard became effective in the first quarter of 2018. The adoption of this change in accounting for pension costs will not have a material impact on our financial position or the results of operations in periods subsequent to its adoption.
ASU 2017-08 "Receivables-Nonrefundable Fees and Other Costs" amends the amortization period for certain purchased callable debt securities held at a premium. This shortens the amortization period for the premium to the earliest call date. Under current generally accepted accounting principles (GAAP), entities generally amortize the premium as an adjustment of yield over the contractual life of the instrument. For Arrow, the standard becomes effective in the first quarter of 2019, however, early adoption is permitted as early as the first quarter of 2017. We do not expect that the adoption of this change in accounting for certain callable debt securities will have a material impact on our financial position or the results of operations in periods subsequent to its adoption.
ASU 2017-09 "Compensation-Stock Compensation" provides guidance about which changes to the terms and conditions of a share-based payment award require an entity to apply modification accounting in Topic 718. The guidance highlights the requirements for applying modification accounting and the exception criteria relating to changes in share-based payment terms. For Arrow, the standard became effective in the first quarter of 2018. The adoption of this change in accounting for share-based payment awards will have a material impact on our financial position or the results of operations in periods subsequent to its adoption.
|
Note 3:
|
CASH AND CASH EQUIVALENTS (Dollars In Thousands)
(
at
December 31, 2017
and
2016
)
|
|
2017
|
2016
|
||||||
|
Cash and Due From Banks
|
$
|
42,562
|
|
$
|
43,024
|
|
|
|
Interest-Bearing Deposits at Banks
|
30,276
|
|
14,331
|
|
|||
|
Total Cash and Cash Equivalents
|
$
|
72,838
|
|
$
|
57,355
|
|
|
|
Supplemental Information:
|
|||||||
|
Total required reserves, including vault cash and Federal Reserve Bank deposits
|
$
|
30,771
|
|
$
|
28,610
|
|
|
The Company is required to maintain reserve balances with the Federal Reserve Bank of New York. The required reserve is calculated on a fourteen day average and the amounts presented in the table above represent the average for the period that includes December 31.
#
67
|
Note 4.
|
INVESTMENT SECURITIES (Dollars In Thousands)
|
The following table is the schedule of Available-For-Sale Securities at
December 31, 2017
and
2016
:
|
Available-For-Sale Securities
|
||||||||||||||||||||||||
|
U.S. Government & Agency
Obligations
|
State and
Municipal
Obligations
|
Mortgage-
Backed
Securities
|
Corporate
and Other
Debt
Securities
|
Mutual Funds
and Equity
Securities
|
Total
Available-
For-Sale
Securities
|
|||||||||||||||||||
|
December 31, 2017
|
||||||||||||||||||||||||
|
Available-For-Sale Securities,
at Amortized Cost
|
$
|
60,328
|
|
$
|
10,351
|
|
$
|
229,077
|
|
$
|
1,000
|
|
$
|
1,120
|
|
$
|
301,876
|
|
||||||
|
Available-For-Sale Securities,
at Fair Value
|
59,894
|
|
10,349
|
|
227,596
|
|
800
|
|
1,561
|
|
300,200
|
|
||||||||||||
|
Gross Unrealized Gains
|
—
|
|
9
|
|
485
|
|
—
|
|
441
|
|
935
|
|
||||||||||||
|
Gross Unrealized Losses
|
434
|
|
11
|
|
1,966
|
|
200
|
|
—
|
|
2,611
|
|
||||||||||||
|
Available-For-Sale Securities,
Pledged as Collateral,
at Fair Value
|
183,052
|
|
||||||||||||||||||||||
|
Maturities of Debt Securities,
at Amortized Cost:
|
||||||||||||||||||||||||
|
Within One Year
|
13,025
|
|
8,902
|
|
2,619
|
|
—
|
|
|
24,546
|
|
|||||||||||||
|
From 1 - 5 Years
|
47,303
|
|
679
|
|
103,078
|
|
—
|
|
|
151,060
|
|
|||||||||||||
|
From 5 - 10 Years
|
—
|
|
250
|
|
75,570
|
|
—
|
|
|
75,820
|
|
|||||||||||||
|
Over 10 Years
|
—
|
|
520
|
|
47,810
|
|
1,000
|
|
|
49,330
|
|
|||||||||||||
|
Maturities of Debt Securities,
at Fair Value:
|
||||||||||||||||||||||||
|
Within One Year
|
12,956
|
|
8,896
|
|
2,642
|
|
—
|
|
|
24,494
|
|
|||||||||||||
|
From 1 - 5 Years
|
46,938
|
|
683
|
|
102,126
|
|
—
|
|
|
149,747
|
|
|||||||||||||
|
From 5 - 10 Years
|
—
|
|
250
|
|
75,044
|
|
—
|
|
|
75,294
|
|
|||||||||||||
|
Over 10 Years
|
—
|
|
520
|
|
47,784
|
|
800
|
|
|
49,104
|
|
|||||||||||||
|
Securities in a Continuous
Loss Position, at Fair Value:
|
||||||||||||||||||||||||
|
Less than 12 Months
|
$
|
20,348
|
|
$
|
8,498
|
|
$
|
70,930
|
|
$
|
—
|
|
$
|
—
|
|
$
|
99,776
|
|
||||||
|
12 Months or Longer
|
39,546
|
|
—
|
|
80,759
|
|
800
|
|
—
|
|
121,105
|
|
||||||||||||
|
Total
|
$
|
59,894
|
|
$
|
8,498
|
|
$
|
151,689
|
|
$
|
800
|
|
$
|
—
|
|
$
|
220,881
|
|
||||||
|
Number of Securities in a
Continuous Loss Position
|
14
|
|
36
|
|
55
|
|
1
|
|
—
|
|
106
|
|
||||||||||||
|
Unrealized Losses on
Securities in a Continuous
Loss Position:
|
||||||||||||||||||||||||
|
Less than 12 Months
|
$
|
172
|
|
$
|
11
|
|
$
|
363
|
|
$
|
—
|
|
$
|
—
|
|
$
|
546
|
|
||||||
|
12 Months or Longer
|
262
|
|
—
|
|
1,603
|
|
200
|
|
—
|
|
2,065
|
|
||||||||||||
|
Total
|
$
|
434
|
|
$
|
11
|
|
$
|
1,966
|
|
$
|
200
|
|
$
|
—
|
|
$
|
2,611
|
|
||||||
|
Disaggregated Details:
|
||||||||||||||||||||||||
|
US Treasury Obligations,
at Amortized Cost
|
$
|
—
|
|
|||||||||||||||||||||
|
US Treasury Obligations,
at Fair Value |
—
|
|
||||||||||||||||||||||
|
US Agency Obligations,
at Amortized Cost |
60,328
|
|
||||||||||||||||||||||
|
US Agency Obligations,
at Fair Value |
59,894
|
|
||||||||||||||||||||||
|
US Government Agency
Securities, at Amortized Cost
|
$
|
40,832
|
|
|||||||||||||||||||||
|
US Government Agency
Securities, at Fair Value
|
40,832
|
|
||||||||||||||||||||||
|
Government Sponsored Entity
Securities, at Amortized Cost
|
188,245
|
|
||||||||||||||||||||||
|
Government Sponsored Entity
Securities, at Fair Value |
186,764
|
|
||||||||||||||||||||||
#
68
|
Available-For-Sale Securities
|
||||||||||||||||||||||||
|
U.S. Government & Agency
Obligations
|
State and
Municipal
Obligations
|
Mortgage-
Backed
Securities
|
Corporate
and Other
Debt
Securities
|
Mutual Funds
and Equity
Securities
|
Total
Available-
For-Sale
Securities
|
|||||||||||||||||||
|
December 31, 2016
|
||||||||||||||||||||||||
|
Available-For-Sale Securities,
at Amortized Cost
|
$
|
147,110
|
|
$
|
27,684
|
|
$
|
168,189
|
|
$
|
3,512
|
|
$
|
1,120
|
|
$
|
347,615
|
|
||||||
|
Available-For-Sale Securities,
at Fair Value
|
147,377
|
|
27,690
|
|
167,239
|
|
3,308
|
|
1,382
|
|
346,996
|
|
||||||||||||
|
Gross Unrealized Gains
|
304
|
|
24
|
|
986
|
|
—
|
|
262
|
|
1,576
|
|
||||||||||||
|
Gross Unrealized Losses
|
37
|
|
18
|
|
1,936
|
|
204
|
|
—
|
|
2,195
|
|
||||||||||||
|
Available-For-Sale Securities,
Pledged as Collateral,
at Fair Value
|
262,852
|
|
||||||||||||||||||||||
|
Securities in a Continuous
Loss Position, at Fair Value:
|
||||||||||||||||||||||||
|
Less than 12 Months
|
$
|
70,605
|
|
$
|
12,165
|
|
$
|
126,825
|
|
$
|
500
|
|
$
|
—
|
|
$
|
210,095
|
|
||||||
|
12 Months or Longer
|
—
|
|
7,377
|
|
—
|
|
2,809
|
|
—
|
|
10,186
|
|
||||||||||||
|
Total
|
$
|
70,605
|
|
$
|
19,542
|
|
$
|
126,825
|
|
$
|
3,309
|
|
$
|
—
|
|
$
|
220,281
|
|
||||||
|
Number of Securities in a
Continuous Loss Position
|
19
|
|
84
|
|
40
|
|
4
|
|
—
|
|
147
|
|
||||||||||||
|
Unrealized Losses on
Securities in a Continuous
Loss Position:
|
||||||||||||||||||||||||
|
Less than 12 Months
|
$
|
37
|
|
$
|
13
|
|
$
|
1,936
|
|
$
|
1
|
|
$
|
—
|
|
$
|
1,987
|
|
||||||
|
12 Months or Longer
|
—
|
|
5
|
|
—
|
|
203
|
|
—
|
|
208
|
|
||||||||||||
|
Total
|
$
|
37
|
|
$
|
18
|
|
$
|
1,936
|
|
$
|
204
|
|
$
|
—
|
|
$
|
2,195
|
|
||||||
|
Disaggregated Details:
|
||||||||||||||||||||||||
|
US Treasury Obligations,
at Amortized Cost |
$
|
54,701
|
|
|||||||||||||||||||||
|
US Treasury Obligations,
at Fair Value |
54,706
|
|
||||||||||||||||||||||
|
US Agency Obligations,
at Amortized Cost |
92,409
|
|
||||||||||||||||||||||
|
US Agency Obligations,
at Fair Value |
92,671
|
|
||||||||||||||||||||||
|
US Government Agency
Securities, at Amortized Cost |
$
|
3,694
|
|
|||||||||||||||||||||
|
US Government Agency
Securities, at Fair Value |
3,724
|
|
||||||||||||||||||||||
|
Government Sponsored Entity
Securities, at Amortized Cost |
164,495
|
|
||||||||||||||||||||||
|
Government Sponsored Entity
Securities, at Fair Value |
163,515
|
|
||||||||||||||||||||||
#
69
The following table is the schedule of Held-To-Maturity Securities at
December 31, 2017
and
2016
:
|
Held-To-Maturity Securities
|
||||||||||||||||
|
State and
Municipal
Obligations
|
Mortgage-
Backed
Securities
|
Corporate
and Other
Debt
Securities
|
Total
Held-To
Maturity
Securities
|
|||||||||||||
|
December 31, 2017
|
||||||||||||||||
|
Held-To-Maturity Securities,
at Amortized Cost
|
$
|
275,530
|
|
$
|
60,377
|
|
$
|
—
|
|
$
|
335,907
|
|
||||
|
Held-To-Maturity Securities,
at Fair Value
|
275,353
|
|
60,548
|
|
—
|
|
335,901
|
|
||||||||
|
Gross Unrealized Gains
|
1,691
|
|
269
|
|
—
|
|
1,960
|
|
||||||||
|
Gross Unrealized Losses
|
1,868
|
|
98
|
|
—
|
|
1,966
|
|
||||||||
|
Held-To-Maturity Securities,
Pledged as Collateral, at Fair Value
|
318,622
|
|
||||||||||||||
|
Maturities of Debt Securities,
at Amortized Cost:
|
||||||||||||||||
|
Within One Year
|
38,422
|
|
—
|
|
—
|
|
38,422
|
|
||||||||
|
From 1 - 5 Years
|
80,789
|
|
54,212
|
|
—
|
|
135,001
|
|
||||||||
|
From 5 - 10 Years
|
152,918
|
|
6,165
|
|
—
|
|
159,083
|
|
||||||||
|
Over 10 Years
|
3,401
|
|
—
|
|
—
|
|
3,401
|
|
||||||||
|
Maturities of Debt Securities,
at Fair Value:
|
||||||||||||||||
|
Within One Year
|
38,506
|
|
—
|
|
—
|
|
38,506
|
|
||||||||
|
From 1 - 5 Years
|
81,499
|
|
54,370
|
|
—
|
|
135,869
|
|
||||||||
|
From 5 - 10 Years
|
151,904
|
|
6,178
|
|
—
|
|
158,082
|
|
||||||||
|
Over 10 Years
|
3,444
|
|
—
|
|
—
|
|
3,444
|
|
||||||||
|
Securities in a Continuous
Loss Position, at Fair Value:
|
||||||||||||||||
|
Less than 12 Months
|
$
|
55,648
|
|
$
|
13,764
|
|
$
|
—
|
|
$
|
69,412
|
|
||||
|
12 Months or Longer
|
65,152
|
|
3,257
|
|
—
|
|
68,409
|
|
||||||||
|
Total
|
$
|
120,800
|
|
$
|
17,021
|
|
$
|
—
|
|
$
|
137,821
|
|
||||
|
Number of Securities in a
Continuous Loss Position
|
352
|
|
14
|
|
—
|
|
366
|
|
||||||||
|
Unrealized Losses on Securities
in a Continuous Loss Position:
|
||||||||||||||||
|
Less than 12 Months
|
$
|
442
|
|
$
|
56
|
|
$
|
—
|
|
$
|
498
|
|
||||
|
12 Months or Longer
|
1,425
|
|
43
|
|
—
|
|
1,468
|
|
||||||||
|
Total
|
$
|
1,867
|
|
$
|
99
|
|
$
|
—
|
|
$
|
1,966
|
|
||||
|
Disaggregated Details:
|
||||||||||||||||
|
US Government Agency
Securities, at Amortized Cost |
$
|
2,680
|
|
|||||||||||||
|
US Government Agency
Securities, at Fair Value |
2,661
|
|
||||||||||||||
|
Government Sponsored Entity
Securities, at Amortized Cost |
57,697
|
|
||||||||||||||
|
Government Sponsored Entity
Securities, at Fair Value |
57,887
|
|
||||||||||||||
#
70
|
Held-To-Maturity Securities
|
||||||||||||||||
|
State and
Municipal
Obligations
|
Mortgage-
Backed
Securities
|
Corporate
and Other
Debt
Securities
|
Total
Held-To
Maturity
Securities
|
|||||||||||||
|
December 31, 2016
|
||||||||||||||||
|
Held-To-Maturity Securities,
at Amortized Cost
|
$
|
268,892
|
|
$
|
75,535
|
|
$
|
1,000
|
|
$
|
345,427
|
|
||||
|
Held-To-Maturity Securities,
at Fair Value
|
267,127
|
|
75,624
|
|
1,000
|
|
343,751
|
|
||||||||
|
Gross Unrealized Gains
|
2,058
|
|
258
|
|
—
|
|
2,316
|
|
||||||||
|
Gross Unrealized Losses
|
3,823
|
|
169
|
|
—
|
|
3,992
|
|
||||||||
|
Held-To-Maturity Securities,
Pledged as Collateral, at Fair Value
|
321,202
|
|
||||||||||||||
|
Securities in a Continuous
Loss Position, at Fair Value:
|
||||||||||||||||
|
Less than 12 Months
|
$
|
107,255
|
|
$
|
13,306
|
|
$
|
—
|
|
$
|
120,561
|
|
||||
|
12 Months or Longer
|
12,363
|
|
—
|
|
—
|
|
12,363
|
|
||||||||
|
Total
|
$
|
119,618
|
|
$
|
13,306
|
|
$
|
—
|
|
$
|
132,924
|
|
||||
|
Number of Securities in a
Continuous Loss Position
|
347
|
|
13
|
|
—
|
|
360
|
|
||||||||
|
Unrealized Losses on Securities
in a Continuous Loss Position:
|
||||||||||||||||
|
Less than 12 Months
|
$
|
3,129
|
|
$
|
169
|
|
$
|
—
|
|
$
|
3,298
|
|
||||
|
12 Months or Longer
|
694
|
|
—
|
|
—
|
|
694
|
|
||||||||
|
Total
|
$
|
3,823
|
|
$
|
169
|
|
$
|
—
|
|
$
|
3,992
|
|
||||
|
Disaggregated Details:
|
||||||||||||||||
|
US Government Agency
Securities, at Amortized Cost |
$
|
3,206
|
|
|||||||||||||
|
US Government Agency
Securities, at Fair Value |
3,222
|
|
||||||||||||||
|
Government Sponsored Entity
Securities, at Amortized Cost |
72,329
|
|
||||||||||||||
|
Government Sponsored Entity
Securities, at Fair Value |
72,402
|
|
||||||||||||||
In the tables above, maturities of mortgage-backed-securities are included based on their expected average lives. Actual maturities will differ from the table below because issuers may have the right to call or prepay obligations with or without prepayment penalties.
Securities in a continuous loss position, in the tables above for
December 31, 2017
and
December 31, 2016
do not reflect any deterioration of the credit worthiness of the issuing entities. U.S. agency issues, including mortgage-backed securities, are all rated AAA by Moody's and AA+ by Standard and Poor's. The state and municipal obligations are general obligations supported by the general taxing authority of the issuer, and in some cases are insured. Obligations issued by school districts are supported by state aid. For any non-rated municipal securities, credit analysis is performed in-house based upon data that has been submitted by the issuers to the NY State Comptroller. That analysis shows no deterioration in the credit worthiness of the municipalities. Subsequent to
December 31, 2017
, there were no securities downgraded below investment grade.
The unrealized losses on these temporarily impaired securities are primarily the result of changes in interest rates for fixed rate securities where the interest rate received is less than the current rate available for new offerings of similar securities, changes in market spreads as a result of shifts in supply and demand, and/or changes in the level of prepayments for mortgage related securities. Because we do not currently intend to sell any of our temporarily impaired securities, and because it is not more likely-than-not we would be required to sell the securities prior to recovery, the impairment is considered temporary.
Pledged securities, in the tables above, are primarily used to collateralize state and municipal deposits, as required under New York State law. A small portion of the pledged securities are used to collateralize repurchase agreements and pooled deposits of our trust customers.
Schedule of Federal Reserve Bank and Federal Home Loan Bank Stock (at cost)
|
December 31,
|
|||||||
|
2017
|
2016
|
||||||
|
Federal Reserve Bank Stock
|
$
|
1,120
|
|
$
|
1,071
|
|
|
|
Federal Home Loan Bank Stock
|
8,829
|
|
9,841
|
|
|||
|
Total Federal Reserve Bank and Federal Home Loan Bank Stock
|
$
|
9,949
|
|
$
|
10,912
|
|
|
#
71
|
Note 5:
|
LOANS (Dollars In Thousands)
|
Loan Categories and Past Due Loans
The following table presents loan balances outstanding as of
December 31, 2017
and
December 31, 2016
and an analysis of the recorded investment in loans that are past due at these dates. Generally, Arrow considers a loan past due 30 or more days if the borrower is two or more payments past due.
|
Schedule of Past Due Loans by Loan Category
|
|||||||||||||||||||
|
Commercial
|
|||||||||||||||||||
|
Commercial
|
Real Estate
|
Consumer
|
Residential
|
Total
|
|||||||||||||||
|
December 31, 2017
|
|||||||||||||||||||
|
Loans Past Due 30-59 Days
|
$
|
139
|
|
$
|
—
|
|
$
|
5,891
|
|
$
|
2,094
|
|
$
|
8,124
|
|
||||
|
Loans Past Due 60-89 Days
|
19
|
|
—
|
|
1,215
|
|
509
|
|
1,743
|
|
|||||||||
|
Loans Past Due 90 or More Days
|
99
|
|
807
|
|
513
|
|
1,422
|
|
2,841
|
|
|||||||||
|
Total Loans Past Due
|
257
|
|
807
|
|
7,619
|
|
4,025
|
|
12,708
|
|
|||||||||
|
Current Loans
|
128,992
|
|
443,441
|
|
595,208
|
|
770,421
|
|
1,938,062
|
|
|||||||||
|
Total Loans
|
$
|
129,249
|
|
$
|
444,248
|
|
$
|
602,827
|
|
$
|
774,446
|
|
$
|
1,950,770
|
|
||||
|
Loans 90 or More Days Past Due and Still Accruing Interest
|
$
|
—
|
|
$
|
—
|
|
$
|
6
|
|
$
|
313
|
|
$
|
319
|
|
||||
|
Nonaccrual Loans
|
588
|
|
1,530
|
|
653
|
|
2,755
|
|
5,526
|
|
|||||||||
|
December 31, 2016
|
|||||||||||||||||||
|
Loans Past Due 30-59 Days
|
$
|
112
|
|
$
|
121
|
|
$
|
5,593
|
|
$
|
2,368
|
|
$
|
8,194
|
|
||||
|
Loans Past Due 60-89 Days
|
29
|
|
—
|
|
898
|
|
142
|
|
1,069
|
|
|||||||||
|
Loans Past Due 90 or more Days
|
148
|
|
—
|
|
513
|
|
1,975
|
|
2,636
|
|
|||||||||
|
Total Loans Past Due
|
289
|
|
121
|
|
7,004
|
|
4,485
|
|
11,899
|
|
|||||||||
|
Current Loans
|
104,866
|
|
431,525
|
|
530,357
|
|
674,621
|
|
1,741,369
|
|
|||||||||
|
Total Loans
|
$
|
105,155
|
|
$
|
431,646
|
|
$
|
537,361
|
|
$
|
679,106
|
|
$
|
1,753,268
|
|
||||
|
Loans 90 or More Days Past Due and Still Accruing Interest
|
$
|
—
|
|
$
|
—
|
|
$
|
158
|
|
$
|
1,043
|
|
$
|
1,201
|
|
||||
|
Nonaccrual Loans
|
$
|
155
|
|
$
|
875
|
|
$
|
589
|
|
$
|
2,574
|
|
$
|
4,193
|
|
||||
The Company disaggregates its loan portfolio into the following four categories:
Commercial - The Company offers a variety of loan options to meet the specific needs of our commercial customers including term loans, time notes and lines of credit. Such loans are made available to businesses for working capital needs such as inventory and receivables, business expansion and equipment purchases. Generally, a collateral lien is placed on equipment or other assets owned by the borrower. These loans carry a higher risk than commercial real estate loans due to the nature of the underlying collateral, which can be business assets such as equipment and accounts receivable and generally have a lower liquidation value than real estate. In the event of default by the borrower, the Company may be required to liquidate collateral at deeply discounted values. To reduce the risk, management usually obtains personal guarantees of the borrowers.
Commercial Real Estate - The Company offers commercial real estate loans to finance real estate purchases, refinancings, expansions and improvements to commercial properties. Commercial real estate loans are made to finance the purchases of real property which generally consists of real estate with completed structures. These commercial real estate loans are secured by first liens on the real estate, which may include apartments, commercial structures, housing businesses, healthcare facilities, and both owner and non owner-occupied facilities. These loans are typically less risky than commercial loans, since they are secured by real estate and buildings, and are generally originated in amounts of no more than 80% of the appraised value of the property. However, the Company also offers commercial construction and land development loans to finance projects, primarily within the communities that we serve. Many projects will ultimately be used by the borrowers' businesses, while others are developed for resale. These real estate loans are also secured by first liens on the real estate, which may include apartments, commercial structures, housing business, healthcare facilities and both owner-occupied and non-owner-occupied facilities. There is enhanced risk during the construction period, since the loan is secured by an incomplete project.
Consumer Loans - The Company offers a variety of consumer installment loans to finance personal expenditures. Most of these loans carry a fixed rate of interest with principal repayment terms typically ranging from
one
to
five
years, based upon the nature of the collateral and the size of the loan. In addition to installment loans, the Company also offers personal lines of credit and
#
72
overdraft protection. Several loans are unsecured, which carry a higher risk of loss. Also included in this category are automobile loans. The Company primarily finances the purchases of automobiles indirectly through dealer relationships located throughout upstate New York and Vermont. Most of these loans carry a fixed rate of interest with principal repayment terms typically ranging from
three
to
seven
years. Indirect consumer loans are underwritten on a secured basis using the underlying collateral being financed.
Residential
-
Residential real estate loans consist primarily of loans secured by first or second mortgages on primary residences. We originate adjustable-rate and fixed-rate one-to-four-family residential real estate loans for the construction, purchase or refinancing of an existing mortgage. These loans are collateralized primarily by owner-occupied properties generally located in the Company’s market area. Loans on one-to-four-family residential real estate are generally originated in amounts of no more than 80% of the purchase price or appraised value (whichever is lower), or have private mortgage insurance. The Company’s underwriting analysis for residential mortgage loans typically includes credit verification, independent appraisals, and a review of the borrower’s financial condition. Mortgage title insurance and hazard insurance are normally required. It is our general practice to underwrite our residential real estate loans to secondary market standards. Construction loans have a unique risk, because they are secured by an incomplete dwelling. This risk is reduced through periodic site inspections, including one at each loan draw period. In addition, the Company offers fixed home equity loans as well as home equity lines of credit to consumers to finance home improvements, debt consolidation, education and other uses. Our policy allows for a maximum loan to value ratio of 80%, although periodically higher advances are allowed. The Company originates home equity lines of credit and second mortgage loans (loans secured by a second junior lien position on one-to-four-family residential real estate). Risk is generally reduced through underwriting criteria, which include credit verification, appraisals, a review of the borrower's financial condition, and personal cash flows. A security interest, with title insurance when necessary, is taken in the underlying real estate.
Schedule of Supplemental Loan Information
|
2017
|
2016
|
||||||
|
Supplemental Information
:
|
|||||||
|
Unamortized deferred loan origination costs, net of deferred loan
origination fees, included in the above balances
|
$
|
4,055
|
|
$
|
3,717
|
|
|
|
Overdrawn deposit accounts, included in the above balances
|
473
|
|
1,009
|
|
|||
|
Pledged loans secured by one-to-four family residential mortgages
under a blanket collateral agreement to secure borrowings from
the Federal Home Loan Bank of New York
|
511,301
|
|
445,805
|
|
|||
|
Residential real estate loans serviced for Freddie Mac, not included
in the balances above
|
149,377
|
|
153,617
|
|
|||
|
Loans held for sale at period-end, included in the above balances
|
327
|
|
483
|
|
|||
Allowance for Loan Losses
The following table presents a roll forward of the allowance for loan losses and other information pertaining to the allowance for loan losses:
|
Allowance for Loan Losses
|
|||||||||||||||||||||||
|
Commercial
|
|||||||||||||||||||||||
|
Commercial
|
Real Estate
|
Consumer
|
Residential
|
Unallocated
|
Total
|
||||||||||||||||||
|
Rollfoward of the Allowance for Loan Losses for the Year Ended:
|
|||||||||||||||||||||||
|
December 31, 2016
|
$
|
1,017
|
|
$
|
5,677
|
|
$
|
6,120
|
|
$
|
4,198
|
|
$
|
—
|
|
$
|
17,012
|
|
|||||
|
Charge-offs
|
(2
|
)
|
(380
|
)
|
(1,101
|
)
|
(76
|
)
|
—
|
|
(1,559
|
)
|
|||||||||||
|
Recoveries
|
9
|
|
—
|
|
388
|
|
—
|
|
—
|
|
397
|
|
|||||||||||
|
Provision
|
849
|
|
(793
|
)
|
2,197
|
|
483
|
|
—
|
|
2,736
|
|
|||||||||||
|
December 31, 2017
|
$
|
1,873
|
|
$
|
4,504
|
|
$
|
7,604
|
|
$
|
4,605
|
|
$
|
—
|
|
$
|
18,586
|
|
|||||
|
December 31, 2015
|
$
|
1,827
|
|
$
|
4,520
|
|
$
|
5,554
|
|
$
|
3,790
|
|
$
|
347
|
|
$
|
16,038
|
|
|||||
|
Charge-offs
|
(97
|
)
|
(195
|
)
|
(871
|
)
|
(107
|
)
|
—
|
|
(1,270
|
)
|
|||||||||||
|
Recoveries
|
23
|
|
—
|
|
182
|
|
6
|
|
—
|
|
211
|
|
|||||||||||
|
Provision
|
(736
|
)
|
1,352
|
|
1,255
|
|
509
|
|
(347
|
)
|
2,033
|
|
|||||||||||
|
December 31, 2016
|
$
|
1,017
|
|
$
|
5,677
|
|
$
|
6,120
|
|
$
|
4,198
|
|
$
|
—
|
|
$
|
17,012
|
|
|||||
#
73
|
Allowance for Loan Losses
|
|||||||||||||||||||||||
|
Commercial
|
|||||||||||||||||||||||
|
Commercial
|
Real Estate
|
Consumer
|
Residential
|
Unallocated
|
Total
|
||||||||||||||||||
|
December 31, 2014
|
$
|
2,100
|
|
$
|
4,128
|
|
$
|
5,210
|
|
$
|
3,369
|
|
$
|
763
|
|
$
|
15,570
|
|
|||||
|
Charge-offs
|
(62
|
)
|
(7
|
)
|
(711
|
)
|
(326
|
)
|
—
|
|
(1,106
|
)
|
|||||||||||
|
Recoveries
|
34
|
|
—
|
|
193
|
|
—
|
|
—
|
|
227
|
|
|||||||||||
|
Provision
|
(245
|
)
|
399
|
|
862
|
|
747
|
|
(416
|
)
|
1,347
|
|
|||||||||||
|
December 31, 2015
|
$
|
1,827
|
|
$
|
4,520
|
|
$
|
5,554
|
|
$
|
3,790
|
|
$
|
347
|
|
$
|
16,038
|
|
|||||
|
December 31, 2017
|
|||||||||||||||||||||||
|
Allowance for loan losses - Loans Individually Evaluated for Impairment
|
$
|
94
|
|
$
|
2
|
|
$
|
—
|
|
$
|
10
|
|
$
|
—
|
|
$
|
106
|
|
|||||
|
Allowance for loan losses - Loans Collectively Evaluated for Impairment
|
$
|
1,779
|
|
$
|
4,502
|
|
$
|
7,604
|
|
$
|
4,595
|
|
$
|
—
|
|
$
|
18,480
|
|
|||||
|
Ending Loan Balance - Individually Evaluated for Impairment
|
$
|
489
|
|
$
|
1,537
|
|
$
|
95
|
|
$
|
1,562
|
|
$
|
—
|
|
$
|
3,683
|
|
|||||
|
Ending Loan Balance - Collectively Evaluated for Impairment
|
$
|
128,760
|
|
$
|
442,711
|
|
$
|
602,732
|
|
$
|
772,884
|
|
$
|
—
|
|
$
|
1,947,087
|
|
|||||
|
December 31, 2016
|
|||||||||||||||||||||||
|
Allowance for loan losses - Loans Individually Evaluated for Impairment
|
$
|
—
|
|
$
|
—
|
|
$
|
—
|
|
$
|
—
|
|
$
|
—
|
|
$
|
—
|
|
|||||
|
Allowance for loan losses - Loans Collectively Evaluated for Impairment
|
$
|
1,017
|
|
|
$
|
5,677
|
|
|
$
|
6,120
|
|
|
$
|
4,198
|
|
|
$
|
—
|
|
$
|
17,012
|
|
|
|
Ending Loan Balance - Individually Evaluated for Impairment
|
$
|
—
|
|
$
|
890
|
|
$
|
91
|
|
$
|
1,098
|
|
$
|
—
|
|
$
|
2,079
|
|
|||||
|
Ending Loan Balance - Collectively Evaluated for Impairment
|
$
|
105,155
|
|
$
|
430,756
|
|
$
|
537,270
|
|
$
|
678,008
|
|
$
|
—
|
|
$
|
1,751,189
|
|
|||||
Through the provision for loan losses, an allowance for loan losses is maintained that reflects our best estimate of the inherent risk of loss in the Company’s loan portfolio as of the balance sheet date. Additions are made to the allowance for loan losses through a periodic provision for loan losses. Actual loan losses are charged against the allowance for loan losses when loans are deemed uncollectible and recoveries of amounts previously charged off are recorded as credits to the allowance for loan losses.
Our loan officers and risk managers meet at least quarterly to discuss and review the conditions and risks associated with certain criticized and classified commercial-related relationships. In addition, our independent internal loan review department performs periodic reviews of the credit quality indicators on individual loans in our commercial loan portfolio.
We use a two-step process to determine the provision for loan losses and the amount of the allowance for loan losses. We measure impairment on our impaired loans on a quarterly basis. Our impaired loans are generally nonaccrual loans over $250 thousand and all troubled debt restructured loans. Our impaired loans are generally considered to be collateral dependent with the specific reserve, if any, determined based on the value of the collateral less estimated costs to sell.
The remainder of the portfolio is evaluated on a pooled basis, as described below. For each homogeneous loan pool, we estimate a total loss factor based on the historical net loss rates adjusted for applicable qualitative factors. We update the total
#
74
loss factors assigned to each loan category on a quarterly basis. For the commercial, commercial construction, and commercial real estate categories, we further segregate the loan categories by credit risk profile (pools of loans graded pass, special mention and accruing substandard). Additional description of the credit risk classifications is detailed in the Credit Quality Indicators section of this note.
We determine the historical net loss rate for each loan category using a trailing three-year net charge-off average. While historical net loss experience provides a reasonable starting point for our analysis, historical net losses, or even recent trends in net losses, do not by themselves form a sufficient basis to determine the appropriate level of the allowance for loan losses. Therefore, we also consider and adjust historical net loss factors for qualitative factors that impact the inherent risk of loss associated with our loan categories within our total loan portfolio. These include:
|
•
|
Changes in the volume and severity of past due, nonaccrual and adversely classified loans
|
|
•
|
Changes in the nature and volume of the portfolio and in the terms of loans
|
|
•
|
Changes in the value of the underlying collateral for collateral dependent loans
|
|
•
|
Changes in lending policies and procedures, including changes in underwriting standards and collection, charge-off, and recovery practices not considered elsewhere in estimating credit losses
|
|
•
|
Changes in the quality of the loan review system
|
|
•
|
Changes in the experience, ability, and depth of lending management and other relevant staff
|
|
•
|
Changes in international, national, regional, and local economic and business conditions and developments that affect the collectability of the portfolio
|
|
•
|
The existence and effect of any concentrations of credit, and changes in the level of such concentrations
|
|
•
|
The effect of other external factors such as competition and legal and regulatory requirements on the level of estimated credit losses in the existing portfolio or pool
|
While not a significant part of the allowance for loan losses methodology, we also maintain an unallocated portion of the total allowance for loan losses related to the overall level of imprecision inherent in the estimation of the appropriate level of allowance for loan losses.
Loan Credit Quality Indicators
The following table presents the credit quality indicators by loan category at
December 31, 2017
and
December 31, 2016
:
|
Loan Credit Quality Indicators
|
|||||||||||||||||||
|
Commercial
|
|||||||||||||||||||
|
Commercial
|
Real Estate
|
Consumer
|
Residential
|
Total
|
|||||||||||||||
|
December 31, 2017
|
|||||||||||||||||||
|
Credit Risk Profile by Creditworthiness Category:
|
|||||||||||||||||||
|
Satisfactory
|
$
|
124,961
|
|
$
|
417,362
|
|
$
|
542,323
|
|
||||||||||
|
Special Mention
|
1,341
|
|
177
|
|
1,518
|
|
|||||||||||||
|
Substandard
|
2,947
|
|
25,902
|
|
28,849
|
|
|||||||||||||
|
Doubtful
|
—
|
|
807
|
|
807
|
|
|||||||||||||
|
Credit Risk Profile Based on Payment Activity:
|
|||||||||||||||||||
|
Performing
|
$
|
602,168
|
|
$
|
771,584
|
|
1,373,752
|
|
|||||||||||
|
Nonperforming
|
659
|
|
3,068
|
|
3,727
|
|
|||||||||||||
|
December 31, 2016
|
|||||||||||||||||||
|
Credit Risk Profile by Creditworthiness Category:
|
|||||||||||||||||||
|
Satisfactory
|
$
|
95,722
|
|
$
|
396,907
|
|
$
|
492,629
|
|
||||||||||
|
Special Mention
|
1,359
|
|
7,008
|
|
8,367
|
|
|||||||||||||
|
Substandard
|
8,074
|
|
27,731
|
|
35,805
|
|
|||||||||||||
|
Doubtful
|
—
|
|
—
|
|
—
|
|
|||||||||||||
|
Credit Risk Profile Based on Payment Activity:
|
|||||||||||||||||||
|
Performing
|
$
|
536,614
|
|
$
|
675,489
|
|
1,212,103
|
|
|||||||||||
|
Nonperforming
|
747
|
|
3,617
|
|
4,364
|
|
|||||||||||||
For the purposes of the table above, nonperforming automobile, residential and other consumer loans are those loans on nonaccrual status or are 90 days or more past due and still accruing interest.
#
75
For the allowance calculation, we use an internally developed system of five credit quality indicators to rate the credit worthiness of each commercial loan defined as follows:
1) Satisfactory - "Satisfactory" borrowers have acceptable financial condition with satisfactory record of earnings and sufficient historical and projected cash flow to service the debt. Borrowers have satisfactory repayment histories and primary and secondary sources of repayment can be clearly identified;
2) Special Mention - Loans in this category have potential weaknesses that deserve management
’
s close attention. If left uncorrected, these potential weaknesses may result in deterioration of the repayment prospects for the asset or in the institution
’
s credit position at some future date. "Special mention" assets are not adversely classified and do not expose an institution to sufficient risk to warrant adverse classification. Loans which might be assigned this credit quality indicator include loans to borrowers with deteriorating financial strength and/or earnings record and loans with potential for problems due to weakening economic or market conditions;
3) Substandard - Loans classified as
“
substandard
”
are inadequately protected by the current sound net worth or paying capacity of the borrower or the collateral pledged, if any. Loans in this category have well defined weaknesses that jeopardize the repayment. They are characterized by the distinct possibility that the bank will sustain some loss if the deficiencies are not corrected.
“
Substandard
”
loans may include loans which are likely to require liquidation of collateral to effect repayment, and other loans where character or ability to repay has become suspect. Loss potential, while existing in the aggregate amount of substandard assets, does not have to exist in individual assets classified substandard;
4) Doubtful - Loans classified as
“
doubtful
”
have all of the weaknesses inherent in those classified as
“
substandard
”
with the added characteristic that the weaknesses make collection or liquidation in full, on the basis of current existing facts, conditions, and values highly questionable and improbable. Although possibility of loss is extremely high, classification of these loans as
“
loss
”
has been deferred due to specific pending factors or events which may strengthen the value (i.e. possibility of additional collateral, injection of capital, collateral liquidation, debt restructure, economic recovery, etc). Loans classified as
“
doubtful
”
need to be placed on non-accrual; and
5) Loss - Loans classified as
“
loss
”
are considered uncollectible and of such little value that their continuance as bankable assets is not warranted. As of the date of the balance sheet, all loans in this category have been charged-off to the allowance for loan losses.
Commercial loans are generally evaluated on an annual basis depending on the size and complexity of the loan relationship, unless the credit related quality indicator falls to a level of "special mention" or below, when the loan is evaluated quarterly. The credit quality indicator is one of the factors used in assessing the level of inherent risk of loss in our commercial related loan portfolios.
#
76
Impaired Loans
The following table presents information on impaired loans based on whether the impaired loan has a recorded allowance or no recorded allowance:
|
Impaired Loans
|
|||||||||||||||||||
|
Commercial
|
|||||||||||||||||||
|
Commercial
|
Real Estate
|
Consumer
|
Residential
|
Total
|
|||||||||||||||
|
December 31, 2017
|
|||||||||||||||||||
|
Recorded Investment:
|
|||||||||||||||||||
|
With No Related Allowance
|
$
|
—
|
|
$
|
781
|
|
$
|
94
|
|
$
|
1,269
|
|
$
|
2,144
|
|
||||
|
With a Related Allowance
|
485
|
|
725
|
|
—
|
|
333
|
|
1,543
|
|
|||||||||
|
Unpaid Principal Balance:
|
|||||||||||||||||||
|
With No Related Allowance
|
$
|
—
|
|
$
|
816
|
|
$
|
95
|
|
$
|
1,274
|
|
$
|
2,185
|
|
||||
|
With a Related Allowance
|
489
|
|
721
|
|
—
|
|
288
|
|
1,498
|
|
|||||||||
|
December 31, 2016
|
|||||||||||||||||||
|
Recorded Investment:
|
|||||||||||||||||||
|
With No Related Allowance
|
$
|
—
|
|
$
|
890
|
|
$
|
91
|
|
$
|
1,098
|
|
$
|
2,079
|
|
||||
|
With a Related Allowance
|
—
|
|
—
|
|
—
|
|
—
|
|
—
|
|
|||||||||
|
Unpaid Principal Balance:
|
|||||||||||||||||||
|
With No Related Allowance
|
$
|
—
|
|
$
|
890
|
|
$
|
91
|
|
$
|
1,098
|
|
$
|
2,079
|
|
||||
|
With a Related Allowance
|
—
|
|
—
|
|
—
|
|
—
|
|
—
|
|
|||||||||
|
For the Year-To-Date Period Ended:
|
|||||||||||||||||||
|
December 31, 2017
|
|||||||||||||||||||
|
Average Recorded Balance:
|
|
|
|
|
|
|
|||||||||||||
|
With No Related Allowance
|
$
|
—
|
|
$
|
836
|
|
$
|
93
|
|
$
|
1,184
|
|
$
|
2,113
|
|
||||
|
With a Related Allowance
|
243
|
|
363
|
|
—
|
|
167
|
|
773
|
|
|||||||||
|
Interest Income Recognized:
|
|||||||||||||||||||
|
With No Related Allowance
|
$
|
—
|
|
$
|
34
|
|
$
|
—
|
|
$
|
23
|
|
$
|
57
|
|
||||
|
With a Related Allowance
|
1
|
|
2
|
|
—
|
|
23
|
|
26
|
|
|||||||||
|
Cash Basis Income:
|
|||||||||||||||||||
|
With No Related Allowance
|
$
|
—
|
|
$
|
—
|
|
$
|
—
|
|
$
|
—
|
|
$
|
—
|
|
||||
|
With a Related Allowance
|
—
|
|
—
|
|
—
|
|
—
|
|
—
|
|
|||||||||
|
December 31, 2016
|
|||||||||||||||||||
|
Average Recorded Balance:
|
|||||||||||||||||||
|
With No Related Allowance
|
$
|
78
|
|
$
|
1,631
|
|
$
|
103
|
|
$
|
872
|
|
$
|
2,684
|
|
||||
|
With a Related Allowance
|
—
|
|
—
|
|
—
|
|
—
|
|
$
|
—
|
|
||||||||
|
Interest Income Recognized:
|
|||||||||||||||||||
|
With No Related Allowance
|
$
|
—
|
|
$
|
29
|
|
$
|
6
|
|
$
|
1
|
|
$
|
36
|
|
||||
|
With a Related Allowance
|
—
|
|
—
|
|
—
|
|
—
|
|
—
|
|
|||||||||
|
Cash Basis Income:
|
|||||||||||||||||||
|
With No Related Allowance
|
$
|
—
|
|
$
|
—
|
|
$
|
—
|
|
$
|
—
|
|
$
|
—
|
|
||||
|
With a Related Allowance
|
—
|
|
—
|
|
—
|
|
—
|
|
—
|
|
|||||||||
|
—
|
|
—
|
|
—
|
|
—
|
|
|
|
||||||||||
|
December 31, 2015
|
|||||||||||||||||||
|
Average Recorded Balance:
|
|||||||||||||||||||
|
With No Related Allowance
|
$
|
325
|
|
$
|
1,932
|
|
$
|
116
|
|
$
|
1,162
|
|
$
|
3,535
|
|
||||
|
With a Related Allowance
|
—
|
|
—
|
|
—
|
|
280
|
|
$
|
280
|
|
||||||||
|
Interest Income Recognized:
|
|||||||||||||||||||
|
With No Related Allowance
|
$
|
—
|
|
$
|
9
|
|
$
|
14
|
|
$
|
—
|
|
$
|
23
|
|
||||
|
With a Related Allowance
|
—
|
|
—
|
|
—
|
|
—
|
|
—
|
|
|||||||||
|
Cash Basis Income:
|
|||||||||||||||||||
|
With No Related Allowance
|
$
|
—
|
|
$
|
—
|
|
$
|
—
|
|
$
|
—
|
|
$
|
—
|
|
||||
|
With a Related Allowance
|
—
|
|
—
|
|
—
|
|
—
|
|
—
|
|
|||||||||
#
77
At
December 31, 2017
and
December 31, 2016
, all impaired loans were considered to be collateral dependent and were therefore evaluated for impairment based on the fair value of collateral less estimated cost to sell. Interest income recognized in the table above, represents income earned after the loans became impaired and includes restructured loans in compliance with their modified terms and nonaccrual loans where we have recognized interest income on a cash basis.
Loans Modified in Trouble Debt Restructurings
The following table presents information on loans modified in trouble debt restructurings during the periods indicated:
|
Loans Modified in Trouble Debt Restructurings During the Period
|
|||||||||||||||||||
|
Commercial
|
|||||||||||||||||||
|
Commercial
|
Real Estate
|
Consumer
|
Residential
|
Total
|
|||||||||||||||
|
For the Year Ended:
|
|||||||||||||||||||
|
December 31, 2017
|
|||||||||||||||||||
|
Number of Loans
|
1
|
|
1
|
|
6
|
|
—
|
|
8
|
|
|||||||||
|
Pre-Modification Outstanding Recorded Investment
|
$
|
503
|
|
$
|
725
|
|
$
|
51
|
|
$
|
—
|
|
$
|
1,279
|
|
||||
|
Post-Modification Outstanding Recorded Investment
|
$
|
503
|
|
$
|
725
|
|
$
|
51
|
|
$
|
—
|
|
$
|
1,279
|
|
||||
|
Subsequent Default, Number of Contracts
|
—
|
|
—
|
|
—
|
|
—
|
|
—
|
|
|||||||||
|
Subsequent Default, Recorded Investment
|
—
|
|
—
|
|
—
|
|
—
|
|
—
|
|
|||||||||
|
Commitments to lend additional funds to modified loans
|
—
|
|
—
|
|
—
|
|
—
|
|
—
|
|
|||||||||
|
December 31, 2016
|
|||||||||||||||||||
|
Number of Loans
|
—
|
|
—
|
|
4
|
|
—
|
|
4
|
|
|||||||||
|
Pre-Modification Outstanding Recorded Investment
|
$
|
—
|
|
$
|
—
|
|
$
|
39
|
|
$
|
—
|
|
$
|
39
|
|
||||
|
Post-Modification Outstanding Recorded Investment
|
$
|
—
|
|
$
|
—
|
|
$
|
39
|
|
$
|
—
|
|
$
|
39
|
|
||||
|
Subsequent Default, Number of Contracts
|
—
|
|
—
|
|
—
|
|
—
|
|
—
|
|
|||||||||
|
Subsequent Default, Recorded Investment
|
—
|
|
—
|
|
—
|
|
—
|
|
—
|
|
|||||||||
|
Commitments to lend additional funds to modified loans
|
—
|
|
—
|
|
—
|
|
—
|
|
—
|
|
|||||||||
|
December 31, 2015
|
|||||||||||||||||||
|
Number of Loans
|
—
|
|
1
|
|
4
|
|
—
|
|
5
|
|
|||||||||
|
Pre-Modification Outstanding Recorded Investment
|
$
|
—
|
|
$
|
883
|
|
$
|
51
|
|
$
|
—
|
|
$
|
934
|
|
||||
|
Post-Modification Outstanding Recorded Investment
|
$
|
—
|
|
$
|
883
|
|
$
|
51
|
|
$
|
—
|
|
$
|
934
|
|
||||
|
Subsequent Default, Number of Contracts
|
—
|
|
—
|
|
—
|
|
—
|
|
—
|
|
|||||||||
|
Subsequent Default, Recorded Investment
|
—
|
|
—
|
|
—
|
|
—
|
|
—
|
|
|||||||||
|
Commitments to lend additional funds to modified loans
|
—
|
|
—
|
|
—
|
|
—
|
|
—
|
|
|||||||||
In general, loans requiring modification are restructured to accommodate the projected cash-flows of the borrower. Such modifications may involve a reduction of the interest rate, a significant deferral of payments or forgiveness of a portion of the outstanding principal balance. As indicated in the table above, no loans modified during the preceding twelve months subsequently defaulted as of
December 31, 2017
or
December 31, 2016
.
#
78
|
Note 6:
|
PREMISES AND EQUIPMENT (Dollars In Thousands)
|
A summary of premises and equipment at
December 31, 2017
and
2016
is presented below:
|
2017
|
2016
|
||||||
|
Land and Bank Premises
|
$
|
35,254
|
|
$
|
35,017
|
|
|
|
Equipment, Furniture and Fixtures
|
25,662
|
|
23,604
|
|
|||
|
Leasehold Improvements
|
1,901
|
|
1,604
|
|
|||
|
Total Cost
|
62,817
|
|
60,225
|
|
|||
|
Accumulated Depreciation and Amortization
|
(35,198
|
)
|
(33,287
|
)
|
|||
|
Net Premises and Equipment
|
$
|
27,619
|
|
$
|
26,938
|
|
|
Amounts charged to expense for depreciation totaled $
1,921
, $
1,928
and $
1,892
in
2017
,
2016
and
2015
, respectively.
#
79
|
Note 7:
|
OTHER INTANGIBLE ASSETS (Dollars In Thousands)
|
The following table presents information on Arrow
’
s other intangible assets (other than goodwill) as of
December 31, 2017
,
2016
and
2015
:
|
Depositor
Intangibles
1
|
Mortgage
Servicing
Rights
2
|
Customer Intangibles
1
|
Total
|
||||||||||||
|
Gross Carrying Amount, December 31, 2017
|
$
|
2,247
|
|
$
|
2,061
|
|
$
|
4,382
|
|
$
|
8,690
|
|
|||
|
Accumulated Amortization
|
(2,247
|
)
|
(1,624
|
)
|
(2,530
|
)
|
(6,401
|
)
|
|||||||
|
Net Carrying Amount, December 31, 2017
|
$
|
—
|
|
$
|
437
|
|
$
|
1,852
|
|
$
|
2,289
|
|
|||
|
Gross Carrying Amount, December 31, 2016
|
$
|
2,247
|
|
$
|
1,968
|
|
$
|
4,382
|
|
$
|
8,597
|
|
|||
|
Accumulated Amortization
|
(2,247
|
)
|
(1,403
|
)
|
(2,251
|
)
|
(5,901
|
)
|
|||||||
|
Net Carrying Amount, December 31, 2016
|
$
|
—
|
|
$
|
565
|
|
$
|
2,131
|
|
$
|
2,696
|
|
|||
|
Rollforward of Intangible Assets:
|
|||||||||||||||
|
Balance, December 31, 2014
|
$
|
10
|
|
$
|
832
|
|
$
|
2,783
|
|
$
|
3,625
|
|
|||
|
Intangible Assets Acquired
|
—
|
|
107
|
|
—
|
|
107
|
|
|||||||
|
Intangible Assets Disposed
|
—
|
|
—
|
|
(38
|
)
|
(38
|
)
|
|||||||
|
Amortization of Intangible Assets
|
(10
|
)
|
(260
|
)
|
(317
|
)
|
(587
|
)
|
|||||||
|
Balance, December 31, 2015
|
—
|
|
679
|
|
2,428
|
|
3,107
|
|
|||||||
|
Intangible Assets Acquired
|
—
|
|
146
|
|
—
|
|
146
|
|
|||||||
|
Intangible Assets Disposed
|
—
|
|
—
|
|
—
|
|
—
|
|
|||||||
|
Amortization of Intangible Assets
|
—
|
|
(260
|
)
|
(297
|
)
|
(557
|
)
|
|||||||
|
Balance, December 31, 2016
|
—
|
|
565
|
|
2,131
|
|
2,696
|
|
|||||||
|
Intangible Assets Acquired
|
—
|
|
93
|
|
—
|
|
93
|
|
|||||||
|
Intangible Assets Disposed
|
—
|
|
—
|
|
—
|
|
—
|
|
|||||||
|
Amortization of Intangible Assets
|
—
|
|
(221
|
)
|
(279
|
)
|
(500
|
)
|
|||||||
|
Balance, December 31, 2017
|
$
|
—
|
|
$
|
437
|
|
$
|
1,852
|
|
$
|
2,289
|
|
|||
1
Amortization of depositor intangibles and customer intangibles are reported in the Consolidated Statements of Income as a component of other operating expense.
2
Amortization of mortgage servicing rights is reported in the Consolidated Statements of Income as a reduction of mortgage servicing fee income, which is included with fees for other services to customers.
The following table presents the remaining estimated annual amortization expense for Arrow's intangible assets as of
December 31, 2017
:
|
Mortgage
Servicing
Rights
|
Customer Intangibles
|
Total
|
||||||||||
|
Estimated Annual Amortization Expense:
|
||||||||||||
|
2018
|
$
|
176
|
|
$
|
262
|
|
$
|
438
|
|
|||
|
2019
|
102
|
|
245
|
|
347
|
|
||||||
|
2020
|
71
|
|
227
|
|
298
|
|
||||||
|
2021
|
50
|
|
210
|
|
260
|
|
||||||
|
2022
|
29
|
|
193
|
|
222
|
|
||||||
|
2023 and beyond
|
9
|
|
715
|
|
724
|
|
||||||
|
Total
|
$
|
437
|
|
$
|
1,852
|
|
$
|
2,289
|
|
|||
#
80
|
Note 8:
|
GUARANTEES (Dollars In Thousands)
|
The following table presents the notional amount and fair value of Arrow's off-balance sheet commitments to extend credit and commitments under standby letters of credit as of
December 31, 2017
and
2016
:
|
Balance at December 31,
|
2017
|
2016
|
|||||
|
Notional Amount:
|
|||||||
|
Commitments to Extend Credit
|
$
|
315,256
|
|
$
|
296,442
|
|
|
|
Standby Letters of Credit
|
3,526
|
|
3,445
|
|
|||
|
Fair Value:
|
|||||||
|
Commitments to Extend Credit
|
$
|
—
|
|
$
|
—
|
|
|
|
Standby Letters of Credit
|
23
|
|
30
|
|
|||
Arrow is party to financial instruments with off-balance sheet risk in the normal course of business to meet the financing needs of its customers. These financial instruments include commitments to extend credit and standby letters of credit. Commitments to extend credit include home equity lines of credit, commitments for residential and commercial construction loans and other personal and commercial lines of credit. Those instruments involve, to varying degrees, elements of credit and interest rate risk in excess of the amount recognized in the consolidated balance sheets. The contract or notional amounts of those instruments reflect the extent of the involvement Arrow has in particular classes of financial instruments.
Arrow's exposure to credit loss in the event of nonperformance by the other party to the financial instrument for commitments to extend credit and standby letters of credit is represented by the contractual notional amount of those instruments. Arrow uses the same credit policies in making commitments and conditional obligations as it does for on-balance sheet instruments.
Commitments to extend credit are agreements to lend to a customer as long as there is no violation of any condition established in the contract. Commitments generally have fixed expiration dates or other termination clauses and may require payment of a fee. Since many of the commitments are expected to expire without being drawn upon, the total commitment amounts do not necessarily represent future cash requirements. Arrow evaluates each customer's creditworthiness on a case-by-case basis. Home equity lines of credit are secured by residential real estate. Construction lines of credit are secured by underlying real estate. For other lines of credit, the amount of collateral obtained, if deemed necessary by Arrow upon extension of credit, is based on management's credit evaluation of the counterparty. Collateral held varies, but may include accounts receivable, inventory, property, plant and equipment, and income-producing commercial properties. Most of the commitments are variable rate instruments.
Arrow does not issue any guarantees that would require liability-recognition or disclosure, other than its standby letters of credit.
Arrow has issued conditional commitments in the form of standby letters of credit to guarantee payment on behalf of a customer and guarantee the performance of a customer to a third party. Standby letters of credit generally arise in connection with lending relationships. The credit risk involved in issuing these instruments is essentially the same as that involved in extending loans to customers. Contingent obligations under standby letters of credit at
December 31, 2017
and
2016
represent the maximum potential future payments Arrow could be required to make. Typically, these instruments have terms of 12 months or less and expire unused; therefore, the total amounts do not necessarily represent future cash requirements. Each customer is evaluated individually for creditworthiness under the same underwriting standards used for commitments to extend credit and on-balance sheet instruments. Company policies governing loan collateral apply to standby letters of credit at the time of credit extension. Loan-to-value ratios will generally range from 50% for movable assets, such as inventory, to 100% for liquid assets, such as bank CD's. Fees for standby letters of credit range from
1%
to
3%
of the notional amount. Fees are collected upfront and amortized over the life of the commitment. The carrying amount and fair value of Arrow's standby letters of credit at
December 31, 2017
and
2016
were insignificant. The fair value of standby letters of credit is based on the fees currently charged for similar agreements or the cost to terminate the arrangement with the counterparties.
The fair value of commitments to extend credit is determined by estimating the fees to enter into similar agreements, taking into account the remaining terms and present creditworthiness of the counterparties, and for fixed rate loan commitments, the difference between the current and committed interest rates. Arrow provides several types of commercial lines of credit and standby letters of credit to its commercial customers. The pricing of these services is not isolated as Arrow considers the customer's complete deposit and borrowing relationship in pricing individual products and services. The commitments to extend credit also include commitments under home equity lines of credit, for which Arrow charges no fee. The carrying value and fair value of commitments to extend credit are not material and Arrow does not expect to incur any material loss as a result of these commitments.
In the normal course of business, Arrow and its subsidiary banks become involved in a variety of routine legal proceedings. At present, there are no legal proceedings pending or threatened, which in the opinion of management and counsel, would result in a material loss to Arrow.
#
81
|
Note 9:
|
TIME DEPOSITS (Dollars In Thousands)
|
The following summarizes the contractual maturities of time deposits during years subsequent to
December 31, 2017
:
|
Year of Maturity
|
Total Time
Deposits
|
||
|
2018
|
$
|
120,733
|
|
|
2019
|
29,821
|
|
|
|
2020
|
16,063
|
|
|
|
2021
|
11,533
|
|
|
|
2022
|
10,123
|
|
|
|
2023 and beyond
|
13,010
|
|
|
|
Total
|
$
|
201,283
|
|
|
Note 10:
|
DEBT (Dollars in Thousands)
|
Schedule of Short-Term Borrowings:
|
2017
|
2016
|
||||||
|
Balances at December 31:
|
|||||||
|
Overnight Advances from the Federal Home Loan Bank of New York
|
$
|
105,000
|
|
$
|
123,000
|
|
|
|
Securities Sold Under Agreements to Repurchase
|
64,966
|
|
35,836
|
|
|||
|
Total Short-Term Borrowings
|
$
|
169,966
|
|
$
|
158,836
|
|
|
|
Maximum Borrowing Capacity at December 31:
|
|||||||
|
Federal Funds Purchased
|
$
|
35,000
|
|
$
|
35,000
|
|
|
|
Federal Home Loan Bank of New York
|
511,301
|
|
445,805
|
|
|||
|
Federal Reserve Bank of New York
|
424,724
|
|
370,136
|
|
|||
The securities sold under agreements to repurchase ("repo accounts") shown above represent collateralized borrowings with certain commercial customers located primarily within the Company's service area. All repos at
December 31, 2017
and
2016
have overnight maturities. Repo accounts are not covered by federal deposit insurance and are secured by our own qualified investment securities. The Company retains the right to substitute similar type securities and has the right to withdraw all excess collateral applicable to repo accounts whenever the collateral values are in excess of the related repurchase liabilities. However, as a means of mitigating market risk, the Company maintains excess collateral to cover normal changes in the repurchase liability by monitoring daily usage. At
December 31, 2017
, there were no material amounts of securities at risk with any one customer. The Company maintains control of these securities through the use of third-party safekeeping arrangements. Investment securities with a fair value of
$66.6 million
and
$42.3 million
were pledged as collateral for the securities sold under agreements to repurchase at
December 31, 2017
and
2016
, respectively.
Arrow's subsidiary banks have in place unsecured federal funds lines of credit with two correspondent banks. As a member of the FHLBNY, we participate in the advance program which allows for overnight and term advances up to the limit of pledged collateral, including FHLBNY stock, residential real estate and home equity loans (see Note 4. "Investment Securities" and Note 5. "Loans"). Our investment in FHLBNY stock is proportional to the total of our overnight and term advances (see the Schedule of Federal Reserve Bank and Federal Home Loan Bank Stock in Note 4,
Investment Securities
, to the notes to our Consolidated Financial Statements). Our bank subsidiaries have also established borrowing facilities with the Federal Reserve Bank of New York for potential “discount window” advances, pledging certain consumer loans as collateral (see Note 5,
Loans
, to the notes to our Consolidated Financial Statements).
In addition to overnight advances, Arrow also borrows longer-term funds from the FHLBNY.
#
82
Maturity Schedule of FHBLNY Term Advances
:
|
Balances
|
Weighted Average Rate
|
|||||||||||||
|
Final Maturity
|
2017
|
2016
|
2017
|
2016
|
||||||||||
|
First Year
|
$
|
10,000
|
|
$
|
—
|
|
1.50
|
%
|
—
|
%
|
||||
|
Second Year
|
20,000
|
|
10,000
|
|
1.70
|
%
|
1.50
|
%
|
||||||
|
Third Year
|
25,000
|
|
20,000
|
|
2.02
|
%
|
1.70
|
%
|
||||||
|
Fourth Year
|
—
|
|
25,000
|
|
—
|
%
|
2.02
|
%
|
||||||
|
Fifth Year
|
—
|
|
—
|
|
—
|
%
|
—
|
%
|
||||||
|
Total
|
$
|
55,000
|
|
$
|
55,000
|
|
1.81
|
%
|
1.81
|
%
|
||||
Long Term Debt - Guaranteed Preferred Beneficial Interests in Corporation's Junior Subordinated Debentures
During
2017
, there were outstanding two classes of financial instruments issued by two separate subsidiary business trusts of Arrow, identified as “Junior Subordinated Obligations Issued to Unconsolidated Subsidiary Trusts” on the Consolidated Balance Sheets and the Consolidated Statements of Income.
The first of the two classes of trust-issued instruments outstanding at year-end was issued by Arrow Capital Statutory Trust II ("ACST II"), a Delaware business trust established on July 16, 2003, upon the filing of a certificate of trust with the Delaware Secretary of State. In July 2003, ACST II issued all of its voting (common) stock to Arrow and issued and sold to an unaffiliated purchaser 30-year guaranteed preferred beneficial interests in the trust's assets ("ACST II trust preferred securities"). The rate on the securities is variable, adjusting quarterly to the 3-month LIBOR plus 3.15%. ACST II used the proceeds of the sale of its trust preferred securities to purchase an identical amount of junior subordinated debentures issued by Arrow that bear an interest rate identical at all times to the rate payable on the ACST II trust preferred securities. The ACST II trust preferred securities became redeemable after July 23, 2008 and mature on July 23, 2033.
The second of the two classes of trust-issued instruments outstanding at year-end was issued by Arrow Capital Statutory Trust III ("ACST III"), a Delaware business trust established on December 23, 2004, upon the filing of a certificate of trust with the Delaware Secretary of State. On December 28, 2004, the ACST III issued all of its voting (common) stock to Arrow and issued and sold to an unaffiliated purchaser 30-year guaranteed preferred beneficial interests in the trust's assets ("ACST III"). The rate on the ACST III trust preferred securities is a variable rate, adjusted quarterly, equal to the 3-month LIBOR plus 2.00%. ACST III used the proceeds of the sale of its trust preferred securities to purchase an identical amount of junior subordinated debentures issued by Arrow that bear an interest rate identical at all times to the rate payable on the ACST III trust preferred securities. The ACST III trust preferred securities became redeemable on or after March 31, 2010 and mature on December 28, 2034.
The primary assets of the two subsidiary trusts having trust preferred securities outstanding at year-end, ACST II and ACST III (the “Trusts”), are Arrow's junior subordinated debentures discussed above, and the sole revenues of the Trusts are payments received by them from Arrow with respect to the junior subordinated debentures. The trust preferred securities issued by the Trusts are non-voting. All common voting securities of the Trusts are owned by Arrow. Arrow used the net proceeds from its sale of junior subordinated debentures to the Trusts, facilitated by the Trust’s sale of their trust preferred securities to the purchasers thereof, for general corporate purposes. The trust preferred securities and underlying junior subordinated debentures, with associated expense that is tax deductible, qualify as Tier I capital under regulatory definitions.
Arrow's primary source of funds to pay interest on the debentures that are held by the Trusts are current dividends received by Arrow from its subsidiary banks. Accordingly, Arrow's ability to make payments on the debentures, and the ability of the Trusts to make payments on their trust preferred securities, are dependent upon the continuing ability of Arrow's subsidiary banks to pay dividends to Arrow. Since the trust preferred securities issued by the subsidiary trusts and the underlying junior subordinated debentures issued by Arrow at
December 31, 2017
,
2016
and
2015
are classified as debt for financial statement purposes, the expense associated with these securities is recorded as interest expense in the Consolidated Statements of Income for the three years.
Schedule of Guaranteed Preferred Beneficial Interests in Corporation's Junior Subordinated Debentures
|
2017
|
2016
|
||||||
|
ACST II
|
|||||||
|
Balance at December 31,
|
$
|
10,000
|
|
$
|
10,000
|
|
|
|
Period-End Interest Rate
|
4.49
|
%
|
3.99
|
%
|
|||
|
ACST III
|
|||||||
|
Balance at December 31,
|
$
|
10,000
|
|
$
|
10,000
|
|
|
|
Period-End Interest Rate
|
3.34
|
%
|
2.84
|
%
|
|||
#
83
|
Note 11:
|
COMPREHENSIVE INCOME (Dollars In Thousands)
|
The following table presents the components of other comprehensive income for the years ended
December 31, 2017
,
2016
and
2015
:
|
Schedule of Comprehensive Income
|
|||||||||||
|
Before-Tax
Amount
|
Tax
Expense
(Benefit)
|
Net-of-Tax
Amount
|
|||||||||
|
2017
|
|||||||||||
|
Net Unrealized Securities Holding Losses Arising During the Period
|
$
|
(1,505
|
)
|
$
|
565
|
|
$
|
(940
|
)
|
||
|
Reclassification Adjustment for Securities Losses Included in Net Income
|
448
|
|
(111
|
)
|
337
|
|
|||||
|
Net Retirement Plan Loss
|
287
|
|
(73
|
)
|
214
|
|
|||||
|
Amortization of Net Retirement Plan Actuarial Loss
|
411
|
|
(49
|
)
|
362
|
|
|||||
|
Accretion of Net Retirement Plan Prior Service Credit
|
(11
|
)
|
3
|
|
(8
|
)
|
|||||
|
Other Comprehensive Income (Loss)
|
$
|
(370
|
)
|
$
|
335
|
|
$
|
(35
|
)
|
||
|
2016
|
|||||||||||
|
Net Unrealized Securities Holding Losses Arising During the Period
|
$
|
(1,672
|
)
|
$
|
648
|
|
$
|
(1,024
|
)
|
||
|
Reclassification Adjustment for Securities Losses Included in Net Income
|
22
|
|
(9
|
)
|
13
|
|
|||||
|
Net Retirement Plan Loss
|
3,017
|
|
(1,296
|
)
|
1,721
|
|
|||||
|
Amortization of Net Retirement Plan Actuarial Loss
|
716
|
|
(281
|
)
|
435
|
|
|||||
|
Accretion of Net Retirement Plan Prior Service Credit
|
(12
|
)
|
5
|
|
(7
|
)
|
|||||
|
Other Comprehensive Income
|
$
|
2,071
|
|
$
|
(933
|
)
|
$
|
1,138
|
|
||
|
2015
|
|||||||||||
|
Net Unrealized Securities Holding Losses Arising During the Period
|
$
|
(3,017
|
)
|
$
|
1,185
|
|
$
|
(1,832
|
)
|
||
|
Reclassification Adjustment for Securities Gains Included in Net Income
|
(129
|
)
|
51
|
|
(78
|
)
|
|||||
|
Net Retirement Plan Losses
|
1,395
|
|
(547
|
)
|
848
|
|
|||||
|
Net Retirement Plan Prior Service Credit
|
(368
|
)
|
144
|
|
(224
|
)
|
|||||
|
Amortization of Net Retirement Plan Actuarial Loss
|
846
|
|
(332
|
)
|
514
|
|
|||||
|
Accretion of Net Retirement Plan Prior Service Credit
|
(56
|
)
|
22
|
|
(34
|
)
|
|||||
|
Other Comprehensive Loss
|
$
|
(1,329
|
)
|
$
|
523
|
|
$
|
(806
|
)
|
||
#
84
The following table presents the changes in accumulated other comprehensive income by component:
|
Changes in Accumulated Other Comprehensive Income (Loss) by Component
(1)
|
|||||||||||||||
|
Unrealized
|
Defined Benefit Plan Items
|
||||||||||||||
|
Gains and
|
|||||||||||||||
|
Losses on
|
Net Prior
|
||||||||||||||
|
Available-for-
|
Net Gain
|
Service
|
|||||||||||||
|
Sale Securities
|
(Loss)
|
(Cost ) Credit
|
Total
|
||||||||||||
|
For the Year-To-Date periods ended:
|
|||||||||||||||
|
December 31, 2016
|
$
|
(382
|
)
|
$
|
(5,737
|
)
|
$
|
(715
|
)
|
$
|
(6,834
|
)
|
|||
|
Other comprehensive income (loss) before reclassifications
|
(940
|
)
|
214
|
|
—
|
|
(726
|
)
|
|||||||
|
Amounts reclassified from accumulated other comprehensive income (loss)
|
337
|
|
362
|
|
(8
|
)
|
691
|
|
|||||||
|
Net current-period other comprehensive loss
|
(603
|
)
|
576
|
|
(8
|
)
|
(35
|
)
|
|||||||
|
Reclassification due to the adoption of ASU No. 2018-02
|
(265
|
)
|
(1,219
|
)
|
(161
|
)
|
(1,645
|
)
|
|||||||
|
December 31, 2017
|
$
|
(1,250
|
)
|
$
|
(6,380
|
)
|
$
|
(884
|
)
|
$
|
(8,514
|
)
|
|||
|
December 31, 2015
|
$
|
629
|
|
$
|
(7,893
|
)
|
$
|
(708
|
)
|
$
|
(7,972
|
)
|
|||
|
Other comprehensive income (loss) before reclassifications
|
(1,024
|
)
|
1,721
|
|
—
|
|
697
|
|
|||||||
|
Amounts reclassified from accumulated other comprehensive income (loss)
|
13
|
|
435
|
|
(7
|
)
|
441
|
|
|||||||
|
Net current-period other comprehensive income
|
(1,011
|
)
|
2,156
|
|
(7
|
)
|
1,138
|
|
|||||||
|
December 31, 2016
|
$
|
(382
|
)
|
$
|
(5,737
|
)
|
$
|
(715
|
)
|
$
|
(6,834
|
)
|
|||
|
December 31, 2014
|
$
|
2,539
|
|
$
|
(9,255
|
)
|
$
|
(450
|
)
|
$
|
(7,166
|
)
|
|||
|
Other comprehensive income (loss) before reclassifications
|
(1,832
|
)
|
848
|
|
(224
|
)
|
(1,208
|
)
|
|||||||
|
Amounts reclassified from accumulated other comprehensive income (loss)
|
(78
|
)
|
514
|
|
(34
|
)
|
402
|
|
|||||||
|
Net current-period other comprehensive income (loss)
|
(1,910
|
)
|
1,362
|
|
(258
|
)
|
(806
|
)
|
|||||||
|
December 31, 2015
|
$
|
629
|
|
$
|
(7,893
|
)
|
$
|
(708
|
)
|
$
|
(7,972
|
)
|
|||
(1) All amounts are net of tax. Amounts in parentheses indicate debits.
#
85
The following table presents the reclassifications out of accumulated other comprehensive income:
|
Reclassifications Out of Accumulated Other Comprehensive Income
(1)
|
||||||
|
Amounts Reclassified
|
||||||
|
Details about Accumulated Other
|
from Accumulated Other
|
Affected Line Item in the Statement
|
||||
|
Comprehensive Income Components
|
Comprehensive Income
|
Where Net Income Is Presented
|
||||
|
For the Year-to-date periods ended:
|
||||||
|
December 31, 2017
|
||||||
|
Unrealized gains and losses on available-for-sale securities
|
||||||
|
$
|
(448
|
)
|
Loss on Securities Transactions, Net
|
|||
|
(448
|
)
|
Total before tax
|
||||
|
111
|
|
Provision for Income Taxes
|
||||
|
$
|
(337
|
)
|
Net of tax
|
|||
|
Amortization of defined benefit pension items
|
||||||
|
Prior-service costs
|
$
|
11
|
|
(2)
|
Salaries and Employee Benefits
|
|
|
Actuarial gains/(losses)
|
(411
|
)
|
(2)
|
Salaries and Employee Benefits
|
||
|
(400
|
)
|
Total before tax
|
||||
|
46
|
|
Provision for Income Taxes
|
||||
|
$
|
(354
|
)
|
Net of tax
|
|||
|
Total reclassifications for the period
|
$
|
(691
|
)
|
Net of tax
|
||
|
December 31, 2016
|
||||||
|
Unrealized gains and losses on available-for-sale securities
|
||||||
|
$
|
(22
|
)
|
Loss on Securities Transactions, Net
|
|||
|
(22
|
)
|
Total before tax
|
||||
|
9
|
|
Provision for Income Taxes
|
||||
|
$
|
(13
|
)
|
Net of tax
|
|||
|
Amortization of defined benefit pension items
|
||||||
|
Prior-service costs
|
12
|
|
(2)
|
Salaries and Employee Benefits
|
||
|
Actuarial gains/(losses)
|
$
|
(716
|
)
|
(2)
|
Salaries and Employee Benefits
|
|
|
(704
|
)
|
Total before tax
|
||||
|
276
|
|
Provision for Income Taxes
|
||||
|
$
|
(428
|
)
|
Net of tax
|
|||
|
Total reclassifications for the period
|
$
|
(441
|
)
|
Net of tax
|
||
#
86
|
Reclassifications Out of Accumulated Other Comprehensive Income
(1)
|
||||||
|
Amounts Reclassified
|
||||||
|
Details about Accumulated Other
|
from Accumulated Other
|
Affected Line Item in the Statement
|
||||
|
Comprehensive Income Components
|
Comprehensive Income
|
Where Net Income Is Presented
|
||||
|
December 31, 2015
|
||||||
|
Unrealized gains and losses on available-for-sale securities
|
||||||
|
$
|
129
|
|
Gain on Securities Transactions, Net
|
|||
|
129
|
|
Total before tax
|
||||
|
(51
|
)
|
Provision for Income Taxes
|
||||
|
$
|
78
|
|
Net of tax
|
|||
|
Amortization of defined benefit pension items
|
||||||
|
Prior-service costs
|
56
|
|
(2)
|
Salaries and Employee Benefits
|
||
|
Actuarial gains/(losses)
|
$
|
(846
|
)
|
(2)
|
Salaries and Employee Benefits
|
|
|
(790
|
)
|
Total before tax
|
||||
|
310
|
|
Provision for Income Taxes
|
||||
|
$
|
(480
|
)
|
Net of tax
|
|||
|
Total reclassifications for the period
|
$
|
(402
|
)
|
Net of tax
|
||
(1) Amounts in parentheses indicate debits to profit/loss.
(2) These accumulated other comprehensive income components are included in the computation of net periodic pension cost (see pension footnote for additional details).
#
87
|
Note 12:
|
STOCK BASED COMPENSATION (Dollars In Thousands, Except Share and Per Share Amounts)
|
Arrow has established
two
stock based compensation plans: an Incentive and Non-qualified Stock Option Plan (Long Term Incentive Plan) and an Employee Stock Ownership Plan (ESOP). All share and per share data have been adjusted for the
September 28, 2017
3
% stock dividend.
Long Term Incentive Plan
Options may be granted at a price no less than the greater of the par value or fair market value of such shares on the date on which such option is granted, and generally expire
ten
years from the date of grant. The options usually vest over a
four
-year period.
Roll Forward Schedule of Long Term Incentive Plan by Shares and Weighted Average Exercise Prices
|
Long Term Incentive Plan
|
|||
|
Roll Forward of Shares Outstanding:
|
|||
|
Outstanding at January 1, 2017
|
366,329
|
|
|
|
Granted
|
55,621
|
|
|
|
Exercised
|
(58,804
|
)
|
|
|
Forfeited
|
(16,991
|
)
|
|
|
Outstanding at December 31, 2017
|
346,155
|
|
|
|
Exercisable at Period-End
|
225,694
|
|
|
|
Vested and Expected to Vest
|
120,461
|
|
|
|
Roll Forward of Shares Outstanding - Weighted Average Exercise Price:
|
|||
|
Outstanding at January 1, 2017
|
$
|
21.86
|
|
|
Granted
|
36.12
|
|
|
|
Exercised
|
20.25
|
|
|
|
Forfeited
|
28.27
|
|
|
|
Outstanding at December 31, 2017
|
24.12
|
|
|
|
Exercisable at Period-End
|
21.61
|
|
|
|
Vested and Expected to Vest
|
28.80
|
|
|
|
Weighted Average Remaining Contractual Life (in years):
|
|||
|
Outstanding at December 31, 2017
|
5.11
|
|
|
|
Exercisable at December 31, 2017
|
3.54
|
|
|
|
Vested and Expected to Vest
|
8.05
|
|
|
|
Aggregate Intrinsic Value:
|
|||
|
Outstanding at December 31, 2017
|
$
|
3,403
|
|
|
Exercisable at December 31, 2017
|
2,785
|
|
|
|
Vested and Expected to Vest
|
618
|
|
|
|
Shares Available for Grant at Period-End
|
340,178
|
|
|
#
88
Schedule of Shares Authorized Under the Long Term Incentive Plan by Exercise Price Range
|
Exercise Price Ranges
|
||||||||||||||||||
|
$18.00
|
$20.17 to $21.56
|
$22.14 to $22.65
|
$23.89 to $24.37
|
$36.12
|
Total
|
|||||||||||||
|
Outstanding at December 31, 2017
|
||||||||||||||||||
|
Number of Shares Outstanding
|
27,999
|
|
85,068
|
|
94,111
|
|
89,536
|
|
49,441
|
|
346,155
|
|
||||||
|
Weighted-Average Remaining Contractual Life (in years)
|
1.06
|
|
2.58
|
|
4.49
|
|
7.27
|
|
9.07
|
|
5.11
|
|
||||||
|
Weighted-Average Exercise Price
|
$
|
18.00
|
|
$
|
20.98
|
|
$
|
22.43
|
|
$
|
24.15
|
|
$
|
36.12
|
|
$
|
24.12
|
|
|
Exercisable at December 31, 2017
|
||||||||||||||||||
|
Number of Shares Outstanding
|
27,999
|
|
85,068
|
|
79,797
|
|
31,800
|
|
1,030
|
|
225,694
|
|
||||||
|
Weighted-Average Remaining Contractual Life (in years)
|
1.06
|
|
2.58
|
|
4.20
|
|
6.49
|
|
9.07
|
|
3.54
|
|
||||||
|
Weighted-Average Exercise Price
|
$
|
18.00
|
|
$
|
20.98
|
|
$
|
22.39
|
|
$
|
24.08
|
|
$
|
36.12
|
|
$
|
21.61
|
|
Schedule of Other Long Term Incentive Plan Information
|
2017
|
2016
|
2015
|
||||||||||
|
Shares Granted
|
55,621
|
|
58,350
|
|
58,975
|
|
||||||
|
Weighted Average Grant Date Information:
|
||||||||||||
|
Fair Value of Options Granted
|
$
|
6.25
|
|
$
|
5.44
|
|
$
|
5.34
|
|
|||
|
Fair Value Assumptions:
|
||||||||||||
|
Dividend Yield
|
2.72
|
%
|
3.88
|
%
|
3.90
|
%
|
||||||
|
Expected Volatility
|
21.40
|
%
|
32.95
|
%
|
33.55
|
%
|
||||||
|
Risk Free Interest Rate
|
2.25
|
%
|
1.80
|
%
|
1.57
|
%
|
||||||
|
Expected Lives (in years)
|
6.88
|
|
7.56
|
|
7.66
|
|
||||||
|
Amount Expensed During the Year
|
$
|
351
|
|
$
|
287
|
|
$
|
308
|
|
|||
|
Compensation Costs for Non-vested Awards Not Yet Recognized
|
528
|
|
521
|
|
500
|
|
||||||
|
Weighted Average Expected Vesting Period, In Years
|
2.59
|
|
2.71
|
|
2.12
|
|
||||||
|
Proceeds From Stock Options Exercised
|
$
|
1,190
|
|
$
|
2,404
|
|
$
|
918
|
|
|||
|
Tax Benefits Related to Stock Options Exercised
|
168
|
|
188
|
|
59
|
|
||||||
|
Intrinsic Value of Stock Options Exercised
|
825
|
|
1,010
|
|
250
|
|
||||||
Employee Stock Ownership Plan
Arrow maintains an employee stock ownership plan (
“
ESOP
”
). Substantially all employees of Arrow and its subsidiaries are eligible to participate upon satisfaction of applicable service requirements. The ESOP borrowed funds from one of Arrow
’
s subsidiary banks to purchase outstanding shares of Arrow
’
s common stock. The notes require annual payments of principal and interest through 2018. As the debt is repaid, shares are released from collateral based on the proportion of debt paid to total debt outstanding for the year and allocated to active employees. In addition, the Company makes additional cash contributions to the Plan each year.
Schedule of ESOP Compensation Expense
|
2017
|
2016
|
2015
|
||||||||||
|
ESOP Compensation Expense
|
$
|
1,400
|
|
$
|
1,200
|
|
$
|
900
|
|
|||
#
89
Shares pledged as collateral are reported as unallocated ESOP shares in stockholders
’
equity. As shares are released from collateral, Arrow reports compensation expense equal to the current average market price of the shares, and the shares become outstanding for earnings per share computations. The ESOP shares as of
December 31, 2017
were as follows:
Schedule of Shares in ESOP Plan
|
ESOP Plan Shares:
|
2017
|
||
|
Allocated Shares
|
759,081
|
|
|
|
Shares Released for Allocation During 2017
|
10,407
|
|
|
|
Unallocated Shares
|
9,643
|
|
|
|
Total ESOP Shares
|
779,131
|
|
|
|
Market Value of Unallocated Shares
|
$
|
327
|
|
|
Note 13:
|
RETIREMENT BENEFIT PLANS (Dollars in Thousands)
|
Arrow sponsors qualified and nonqualified defined benefit pension plans and other postretirement benefit plans for its employees. Arrow maintains a non-contributory pension plan, which covers substantially all employees. Effective December 1, 2002, all active participants in the qualified defined benefit pension plan were given a one-time irrevocable election to continue participating in the traditional plan design, for which benefits were based on years of service and the participant
’
s final compensation (as defined), or to begin participating in the new cash balance plan design. All employees who participate in the plan after December 1, 2002 automatically participate in the cash balance plan design. The interest credits under the cash balance plan are based on the 30-year U.S. Treasury rate in effect for November of the prior year. The service credits under the cash balance plan are equal to
6.0%
of eligible salaries for employees who become participants on or after January 1, 2003. For employees in the plan prior to January 1, 2003, the service credits are scaled based on the age of the participant, and range from
6.0%
to
12.0%
. The funding policy is to contribute up to the maximum amount that can be deducted for federal income tax purposes and to make all payments required under ERISA. Arrow also maintains a supplemental non-qualified unfunded retirement plan to provide eligible employees of Arrow and its subsidiaries with benefits in excess of qualified plan limits imposed by federal tax law.
Arrow has multiple non-pension postretirement benefit plans. The health care, dental and life insurance plans are contributory, with participants
’
contributions adjusted annually. Arrow
’
s policy is to fund the cost of postretirement benefits based on the current cost of the underlying policies. However, the health care plan provision for automatic increases of Company contributions each year is based on the increase in inflation and is limited to a maximum of
5%
.
As of December 31, 2016, Arrow updated its mortality assumption to the RP-2014 Mortality Table for annuitants and non-annuitants with projected generational mortality improvements using Scale MP-2016. The revised assumption resulted in a decrease in postretirement liabilities.
The following tables set forth changes in the plans
’
benefit obligations (projected benefit obligation for pension benefits and accumulated benefit obligation for postretirement benefits) and changes in the plans
’
assets and the funded status of the pension plans and other postretirement benefit plan at December 31:
|
Schedule of Defined Benefit Plan Disclosures
|
|||||||||||
|
Employees'
Pension
Plan
|
Select
Executive
Retirement
Plan
|
Postretirement
Benefit
Plans
|
|||||||||
|
Defined Benefit Plan Funded Status
|
|||||||||||
|
December 31, 2017
|
|||||||||||
|
Fair Value of Plan Assets
|
$
|
53,571
|
|
$
|
—
|
|
$
|
—
|
|
||
|
Benefit Obligation
|
38,921
|
|
4,586
|
|
7,727
|
|
|||||
|
Funded Status of Plan
|
$
|
14,650
|
|
$
|
(4,586
|
)
|
$
|
(7,727
|
)
|
||
|
December 31, 2016
|
|||||||||||
|
Fair Value of Plan Assets
|
$
|
50,220
|
|
$
|
—
|
|
$
|
—
|
|
||
|
Benefit Obligation
|
36,154
|
|
4,547
|
|
7,623
|
|
|||||
|
Funded Status of Plan
|
$
|
14,066
|
|
$
|
(4,547
|
)
|
$
|
(7,623
|
)
|
||
|
Change in Benefit Obligation
|
|||||||||||
|
Benefit Obligation, at January 1, 2017
|
$
|
36,154
|
|
$
|
4,547
|
|
$
|
7,623
|
|
||
|
Service Cost
|
1,392
|
|
45
|
|
130
|
|
|||||
|
Interest Cost
|
1,682
|
|
209
|
|
339
|
|
|||||
|
Plan Participants' Contributions
|
—
|
|
—
|
|
492
|
|
|||||
|
Amendments
|
—
|
|
—
|
|
—
|
|
|||||
|
Actuarial (Gain) Loss
|
2,440
|
|
245
|
|
(14
|
)
|
|||||
|
Benefits Paid
|
(2,747
|
)
|
(460
|
)
|
(843
|
)
|
|||||
|
Benefit Obligation, at December 31, 2017
|
$
|
38,921
|
|
$
|
4,586
|
|
$
|
7,727
|
|
||
#
90
|
Schedule of Defined Benefit Plan Disclosures
|
|||||||||||
|
Employees'
Pension
Plan
|
Select
Executive
Retirement
Plan
|
Postretirement
Benefit
Plans
|
|||||||||
|
Benefit Obligation, at January 1, 2016
|
$
|
35,982
|
|
$
|
4,784
|
|
$
|
7,701
|
|
||
|
Service Cost
|
1,400
|
|
40
|
|
147
|
|
|||||
|
Interest Cost
|
1,641
|
|
206
|
|
340
|
|
|||||
|
Plan Participants' Contributions
|
—
|
|
—
|
|
402
|
|
|||||
|
Amendments
|
—
|
|
—
|
|
—
|
|
|||||
|
Actuarial Gain
|
(738
|
)
|
(31
|
)
|
(327
|
)
|
|||||
|
Benefits Paid
|
(2,131
|
)
|
(452
|
)
|
(640
|
)
|
|||||
|
Benefit Obligation, at December 31, 2016
|
$
|
36,154
|
|
$
|
4,547
|
|
$
|
7,623
|
|
||
|
Change in Fair Value of Plan Assets
|
|||||||||||
|
Fair Value of Plan Assets, at January 1, 2017
|
$
|
50,220
|
|
$
|
—
|
|
$
|
—
|
|
||
|
Actual Return on Plan Assets
|
6,098
|
|
—
|
|
—
|
|
|||||
|
Employer Contributions
|
—
|
|
460
|
|
351
|
|
|||||
|
Plan Participants' Contributions
|
—
|
|
—
|
|
492
|
|
|||||
|
Benefits Paid
|
(2,747
|
)
|
(460
|
)
|
(843
|
)
|
|||||
|
Fair Value of Plan Assets, at December 31, 2017
|
$
|
53,571
|
|
$
|
—
|
|
$
|
—
|
|
||
|
Fair Value of Plan Assets, at January 1, 2016
|
$
|
47,234
|
|
$
|
—
|
|
$
|
—
|
|
||
|
Actual Return on Plan Assets
|
5,117
|
|
—
|
|
—
|
|
|||||
|
Employer Contributions
|
—
|
|
452
|
|
238
|
|
|||||
|
Plan Participants' Contributions
|
—
|
|
—
|
|
402
|
|
|||||
|
Benefits Paid
|
(2,131
|
)
|
(452
|
)
|
(640
|
)
|
|||||
|
Fair Value of Plan Assets, at December 31, 2016
|
$
|
50,220
|
|
$
|
—
|
|
$
|
—
|
|
||
|
Accumulated Benefit Obligation at December 31, 2017
|
$
|
38,557
|
|
$
|
4,586
|
|
$
|
7,727
|
|
||
|
Amounts Recognized in the Consolidated Balance Sheets
|
|||||||||||
|
December 31, 2017
|
|||||||||||
|
Prepaid Pension Asset
|
$
|
14,650
|
|
$
|
—
|
|
—
|
|
|||
|
Accrued Benefit Liability
|
—
|
|
(4,586
|
)
|
(7,727
|
)
|
|||||
|
Net Benefit Recognized
|
$
|
14,650
|
|
$
|
(4,586
|
)
|
$
|
(7,727
|
)
|
||
|
December 31, 2016
|
|||||||||||
|
Prepaid Pension Asset
|
$
|
14,066
|
|
$
|
—
|
|
—
|
|
|||
|
Accrued Benefit Liability
|
—
|
|
(4,547
|
)
|
(7,623
|
)
|
|||||
|
Net Benefit Recognized
|
$
|
14,066
|
|
$
|
(4,547
|
)
|
$
|
(7,623
|
)
|
||
|
Amounts Recognized in Other Comprehensive Income (Loss)
|
|||||||||||
|
For the Year Ended December 31, 2017
|
|||||||||||
|
Net Unamortized Gain Arising During the Period
|
$
|
(517
|
)
|
$
|
244
|
|
$
|
(14
|
)
|
||
|
Net Prior Service Cost Arising During the Period
|
—
|
|
—
|
|
—
|
|
|||||
|
Amortization of Net Loss
|
(306
|
)
|
(129
|
)
|
24
|
|
|||||
|
Amortization of Prior Service Credit (Cost)
|
57
|
|
(57
|
)
|
11
|
|
|||||
|
Total Other Comprehensive (Loss) for Pension and
Other Postretirement Benefit Plans
|
$
|
(766
|
)
|
$
|
58
|
|
$
|
21
|
|
||
|
For the Year Ended December 31, 2016
|
|||||||||||
|
Net Unamortized Loss Arising During the Period
|
$
|
(2,657
|
)
|
$
|
(32
|
)
|
$
|
(328
|
)
|
||
|
Net Prior Service Cost Arising During the Period
|
—
|
|
—
|
|
—
|
|
|||||
|
Amortization of Net Loss
|
(591
|
)
|
(125
|
)
|
—
|
|
|||||
|
Amortization of Prior Service Credit (Cost)
|
57
|
|
(57
|
)
|
12
|
|
|||||
|
Total Other Comprehensive Income (Loss) for Pension and
Other Postretirement Benefit Plans
|
$
|
(3,191
|
)
|
$
|
(214
|
)
|
$
|
(316
|
)
|
||
#
91
|
Schedule of Defined Benefit Plan Disclosures
|
|||||||||||
|
Employees'
Pension
Plan
|
Select
Executive
Retirement
Plan
|
Postretirement
Benefit
Plans
|
|||||||||
|
For the Year Ended December 31, 2015
|
|||||||||||
|
Net Unamortized Loss Arising During the Period
|
$
|
472
|
|
$
|
(152
|
)
|
$
|
(1,715
|
)
|
||
|
Net Prior Service Cost Arising During the Period
|
277
|
|
91
|
|
—
|
|
|||||
|
Amortization of Net Loss
|
(601
|
)
|
(131
|
)
|
(114
|
)
|
|||||
|
Amortization of Prior Service (Cost) Credit
|
83
|
|
(58
|
)
|
31
|
|
|||||
|
Total Other Comprehensive (Loss) Income for Pension and
Other Postretirement Benefit Plans
|
$
|
231
|
|
$
|
(250
|
)
|
$
|
(1,798
|
)
|
||
|
Accumulated Other Comprehensive Income
|
|||||||||||
|
December 31, 2017
|
|||||||||||
|
Net Actuarial Loss
|
$
|
6,656
|
|
$
|
2,127
|
|
$
|
(228
|
)
|
||
|
Prior Service (Credit) Cost
|
264
|
|
489
|
|
433
|
|
|||||
|
Total Accumulated Other Comprehensive Income, Before Tax
|
$
|
6,920
|
|
$
|
2,616
|
|
$
|
205
|
|
||
|
December 31, 2016
|
|||||||||||
|
Net Actuarial Loss
|
$
|
7,479
|
|
$
|
2,012
|
|
$
|
(238
|
)
|
||
|
Prior Service (Credit) Cost
|
207
|
|
546
|
|
422
|
|
|||||
|
Total Accumulated Other Comprehensive Income, Before Tax
|
$
|
7,686
|
|
$
|
2,558
|
|
$
|
184
|
|
||
|
Amounts that will be Amortized from Accumulated
Other Comprehensive Income the Next Year
|
|||||||||||
|
Net Actuarial Loss
|
$
|
131
|
|
$
|
133
|
|
$
|
(2
|
)
|
||
|
Prior Service (Credit) Cost
|
$
|
(49
|
)
|
$
|
57
|
|
$
|
48
|
|
||
|
Net Periodic Benefit Cost
|
|||||||||||
|
For the Year Ended December 31, 2017
|
|||||||||||
|
Service Cost
|
$
|
1,392
|
|
$
|
45
|
|
$
|
130
|
|
||
|
Interest Cost
|
1,682
|
|
209
|
|
339
|
|
|||||
|
Expected Return on Plan Assets
|
(3,141
|
)
|
—
|
|
—
|
|
|||||
|
Amortization of Prior Service (Credit) Cost
|
(57
|
)
|
57
|
|
(11
|
)
|
|||||
|
Amortization of Net Loss
|
306
|
|
129
|
|
(24
|
)
|
|||||
|
Net Periodic Benefit Cost
|
$
|
182
|
|
$
|
440
|
|
$
|
434
|
|
||
|
For the Year Ended December 31, 2016
|
|||||||||||
|
Service Cost
|
$
|
1,400
|
|
$
|
40
|
|
$
|
147
|
|
||
|
Interest Cost
|
1,641
|
|
206
|
|
340
|
|
|||||
|
Expected Return on Plan Assets
|
(3,198
|
)
|
—
|
|
—
|
|
|||||
|
Amortization of Prior Service (Credit) Cost
|
(57
|
)
|
57
|
|
(12
|
)
|
|||||
|
Amortization of Net Loss
|
591
|
|
125
|
|
—
|
|
|||||
|
Net Periodic Benefit Cost
|
$
|
377
|
|
$
|
428
|
|
$
|
475
|
|
||
|
For the Year Ended December 31, 2015
|
|||||||||||
|
Service Cost
|
$
|
1,503
|
|
$
|
32
|
|
$
|
250
|
|
||
|
Interest Cost
|
1,545
|
|
211
|
|
394
|
|
|||||
|
Expected Return on Plan Assets
|
(3,311
|
)
|
—
|
|
—
|
|
|||||
|
Amortization of Prior Service (Credit) Cost
|
(83
|
)
|
58
|
|
(31
|
)
|
|||||
|
Amortization of Net Loss
|
601
|
|
131
|
|
114
|
|
|||||
|
Net Periodic Benefit Cost
|
$
|
255
|
|
$
|
432
|
|
$
|
727
|
|
||
#
92
|
Schedule of Defined Benefit Plan Disclosures
|
|||||||||||
|
Employees'
Pension
Plan
|
Select
Executive
Retirement
Plan
|
Postretirement
Benefit
Plans
|
|||||||||
|
Weighted-Average Assumptions Used in
Calculating Benefit Obligation
|
|||||||||||
|
December 31, 2017
|
|||||||||||
|
Discount Rate
|
4.24
|
%
|
4.18
|
%
|
4.22
|
%
|
|||||
|
Rate of Compensation Increase
|
3.50
|
%
|
3.50
|
%
|
3.50
|
%
|
|||||
|
Interest Rate Credit for Determining
Projected Cash Balance Account
|
3.00
|
%
|
3.00
|
%
|
|||||||
|
Interest Rate to Annuitize Cash
Balance Account
|
4.25
|
%
|
4.25
|
%
|
|||||||
|
Interest Rate to Convert Annuities to Actuarially
Equivalent Lump Sum Amounts
|
4.25
|
%
|
4.25
|
%
|
|||||||
|
December 31, 2016
|
|||||||||||
|
Discount Rate
|
4.83
|
%
|
4.73
|
%
|
4.80
|
%
|
|||||
|
Rate of Compensation Increase
|
3.50
|
%
|
3.50
|
%
|
3.50
|
%
|
|||||
|
Interest Rate Credit for Determining
Projected Cash Balance Account
|
3.00
|
%
|
3.00
|
%
|
|||||||
|
Interest Rate to Annuitize Cash
Balance Account
|
4.50
|
%
|
4.50
|
%
|
|||||||
|
Interest Rate to Convert Annuities to Actuarially
Equivalent Lump Sum Amounts
|
4.50
|
%
|
4.50
|
%
|
|||||||
|
Weighted-Average Assumptions Used in
Calculating Net Periodic Benefit Cost
|
|||||||||||
|
December 31, 2017
|
|||||||||||
|
Discount Rate
|
4.83
|
%
|
4.73
|
%
|
4.80
|
%
|
|||||
|
Expected Long-Term Return on Plan Assets
|
6.50
|
%
|
|
|
|||||||
|
Rate of Compensation Increase
|
3.50
|
%
|
3.50
|
%
|
3.50
|
%
|
|||||
|
Interest Rate Credit for Determining
Projected Cash Balance Account
|
3.00
|
%
|
3.00
|
%
|
|||||||
|
Interest Rate to Annuitize Cash
Balance Account
|
4.50
|
%
|
4.50
|
%
|
|||||||
|
Interest Rate to Convert Annuities to Actuarially
Equivalent Lump Sum Amounts
|
4.50
|
%
|
4.50
|
%
|
|||||||
|
December 31, 2016
|
|||||||||||
|
Discount Rate
|
4.73
|
%
|
4.61
|
%
|
4.69
|
%
|
|||||
|
Expected Long-Term Return on Plan Assets
|
7.00
|
%
|
|
|
|||||||
|
Rate of Compensation Increase
|
3.50
|
%
|
3.50
|
%
|
3.50
|
%
|
|||||
|
Interest Rate Credit for Determining
Projected Cash Balance Account
|
3.03
|
%
|
3.03
|
%
|
|||||||
|
Interest Rate to Annuitize Cash
Balance Account
|
5.00
|
%
|
5.00
|
%
|
|||||||
|
Interest Rate to Convert Annuities to Actuarially
Equivalent Lump Sum Amounts
|
5.00
|
%
|
5.00
|
%
|
|||||||
|
December 31, 2015
|
|||||||||||
|
Discount Rate
|
4.31
|
%
|
4.26
|
%
|
4.31
|
%
|
|||||
|
Expected Long-Term Return on Plan Assets
|
7.50
|
%
|
|
|
|||||||
|
Rate of Compensation Increase
|
3.50
|
%
|
3.50
|
%
|
3.50
|
%
|
|||||
|
Interest Rate Credit for Determining
Projected Cash Balance Account
|
3.04
|
%
|
|
|
|||||||
|
Interest Rate to Annuitize Cash
Balance Account
|
4.75
|
%
|
|
|
|||||||
|
Interest Rate to Convert Annuities to Actuarially
Equivalent Lump Sum Amounts
|
4.75
|
%
|
4.75
|
%
|
|||||||
#
93
|
Schedule of Defined Benefit Plan Disclosures
Information about Defined Benefit Plan Assets - Employees' Pension Plan
|
||||||||||||||||||||||||
|
Fair Value Measurements Using:
|
||||||||||||||||||||||||
|
Asset Category
|
Quoted Prices
in Active Markets
for Identical Assets
(Level 1)
|
Significant Other Observable Inputs
(Level 2)
|
Significant Unobservable Inputs
(Level 3)
|
Total
|
Percent of Total
|
Target Allocation Minimum
|
Target Allocation Maximum
|
|||||||||||||||||
|
December 31, 2017
|
||||||||||||||||||||||||
|
Cash
|
$
|
22
|
|
$
|
—
|
|
$
|
—
|
|
$
|
22
|
|
—
|
%
|
—
|
%
|
15.0
|
%
|
||||||
|
Interest-Bearing Money Market Fund
|
2,682
|
|
—
|
|
—
|
|
2,682
|
|
5.0
|
%
|
—
|
%
|
15.0
|
%
|
||||||||||
|
Arrow Common Stock
1
|
5,657
|
|
—
|
|
—
|
|
5,657
|
|
10.6
|
%
|
—
|
%
|
10.0
|
%
|
||||||||||
|
North Country Funds - Equity
2
|
19,680
|
|
—
|
|
—
|
|
19,680
|
|
36.7
|
%
|
|
|
|
|
||||||||||
|
Other Mutual Funds - Equity
|
15,168
|
|
—
|
|
—
|
|
15,168
|
|
28.3
|
%
|
|
|
|
|
||||||||||
|
Total Equity Funds
|
34,848
|
|
—
|
|
—
|
|
34,848
|
|
65.0
|
%
|
55.0
|
%
|
85.0
|
%
|
||||||||||
|
North Country Funds - Fixed income
2
|
8,388
|
|
—
|
|
—
|
|
8,388
|
|
15.7
|
%
|
|
|
|
|
||||||||||
|
Other Mutual Funds - Fixed Income
|
1,974
|
|
—
|
|
—
|
|
1,974
|
|
3.7
|
%
|
|
|
|
|
||||||||||
|
Total Fixed Income Funds
|
10,362
|
|
—
|
|
—
|
|
10,362
|
|
19.4
|
%
|
10.0
|
%
|
30.0
|
%
|
||||||||||
|
Total
|
$
|
53,571
|
|
$
|
—
|
|
$
|
—
|
|
$
|
53,571
|
|
100.0
|
%
|
|
|
|
|||||||
|
December 31, 2016
|
||||||||||||||||||||||||
|
Cash
|
$
|
40
|
|
$
|
—
|
|
$
|
—
|
|
$
|
40
|
|
0.1
|
%
|
—
|
%
|
15.0
|
%
|
||||||
|
Interest-Bearing Money Market Fund
|
3,080
|
|
—
|
|
—
|
|
3,080
|
|
6.1
|
%
|
—
|
%
|
15.0
|
%
|
||||||||||
|
Arrow Common Stock
1
|
6,592
|
|
—
|
|
—
|
|
6,592
|
|
13.1
|
%
|
—
|
%
|
10.0
|
%
|
||||||||||
|
North Country Funds - Equity
2
|
18,640
|
|
—
|
|
—
|
|
18,640
|
|
37.2
|
%
|
|
|
|
|
||||||||||
|
Other Mutual Funds - Equity
|
13,560
|
|
—
|
|
—
|
|
13,560
|
|
27.0
|
%
|
|
|
|
|
||||||||||
|
Total Equity Funds
|
32,200
|
|
—
|
|
—
|
|
32,200
|
|
64.2
|
%
|
55.0
|
%
|
85.0
|
%
|
||||||||||
|
North Country Funds - Fixed income
2
|
7,332
|
|
—
|
|
—
|
|
7,332
|
|
14.6
|
%
|
|
|
|
|
||||||||||
|
Other Mutual Funds - Fixed Income
|
976
|
|
—
|
|
—
|
|
976
|
|
1.9
|
%
|
|
|
|
|
||||||||||
|
Total Fixed Income Funds
|
8,308
|
|
—
|
|
—
|
|
8,308
|
|
16.5
|
%
|
10.0
|
%
|
30.0
|
%
|
||||||||||
|
Total
|
$
|
50,220
|
|
$
|
—
|
|
$
|
—
|
|
$
|
50,220
|
|
100.0
|
%
|
|
|
|
|||||||
1
Acquisition of Arrow Financial Corporation common stock was under 10% of the total fair value of the employee's pension plan assets at the time of acquisition.
2
The North Country Funds - Equity and the North Country Funds - Fixed Income are publicly traded mutual funds advised by Arrow's subsidiary, North Country Investment Advisers, Inc.
#
94
|
Schedule of Defined Benefit Plan Disclosures
|
|||||||||||
|
Employees'
Pension
Plan
|
Select
Executive
Retirement
Plan
|
Postretirement
Benefit
Plans
|
|||||||||
|
Expected Future Benefit Payments
|
|||||||||||
|
2018
|
$
|
3,434
|
|
$
|
439
|
|
$
|
524
|
|
||
|
2019
|
2,345
|
|
426
|
|
543
|
|
|||||
|
2020
|
2,885
|
|
411
|
|
540
|
|
|||||
|
2021
|
2,456
|
|
396
|
|
581
|
|
|||||
|
2022
|
2,589
|
|
380
|
|
574
|
|
|||||
|
2022 - 2026
|
14,107
|
|
1,752
|
|
2,917
|
|
|||||
|
|
|
||||||||||
|
Estimated Contributions During 2018
|
$
|
—
|
|
$
|
439
|
|
$
|
524
|
|
||
|
Assumed Health Care Cost Trend Rates
|
|||||||||||
|
December 31, 2017
|
|||||||||||
|
Health Care Cost Trend
Rate Assumed for Next Year
|
7.25
|
%
|
|||||||||
|
Rate to which the Cost Trend
Rate is Assumed to Decline
(the Ultimate Trend Rate)
|
3.89
|
%
|
|||||||||
|
Year that the Rate Reaches
the Ultimate Trend Rate
|
2075
|
|
|||||||||
|
December 31, 2016
|
|||||||||||
|
Health Care Cost Trend
Rate Assumed for Next Year
|
7.50
|
%
|
|||||||||
|
Rate to which the Cost Trend
Rate is Assumed to Decline
(the Ultimate Trend Rate)
|
3.89
|
%
|
|||||||||
|
Year that the Rate Reaches
the Ultimate Trend Rate
|
2075
|
|
|||||||||
|
Effect of a One-Percentage Point Change in Assumed
Health Care Cost Trend Rates
|
|||||||||||
|
Effect of a One Percentage Point Increase on
Service and Interest Cost Components
|
$
|
44
|
|
||||||||
|
Effect of a One Percentage Point Decrease on
Service and Interest Cost Components
|
(37
|
)
|
|||||||||
|
Effect of a One Percentage Point Increase on
Accumulated Postretirement Benefit Obligation
|
516
|
|
|||||||||
|
Effect of a One Percentage Point Decrease on
Accumulated Postretirement Benefit Obligation
|
(445
|
)
|
|||||||||
Fair Value of Plan Assets (Defined Benefit Plan):
For information on fair value measurements, including descriptions of level 1, 2 and 3 of the fair value hierarchy and the valuation methods employed by Arrow, see Note 2,
Summary of Significant Accounting Policies,
and Note 17,
Fair Values
.
The fair value of level 1 financial instruments in the table above are based on unadjusted, quoted market prices from exchanges in active markets.
In accordance with ERISA guidelines, the Board authorized the purchase of Arrow common stock up to 10% of the fair market value of the plan's assets at the time of acquisition.
#
95
Pension Plan Investment Policies and Strategies
:
The Company maintains a non-contributory pension benefit plan covering substantially all employees for the purpose of rewarding long and loyal service to the Company. The pension assets are held in trust and are invested in a prudent manner for the exclusive purpose of providing benefits to participants. The investment objective is to achieve an inflation-protected rate of return that meets the actuarial assumption which is used for funding purposes. The investment strategy attempts to maximize the investment return on assets at a level of risk deemed appropriate by the Company while complying with ERISA and any applicable regulations and laws. The investment strategy utilizes asset allocation as a principal determinant for establishing the risk/reward profile of the assets. Asset allocation ranges are established, periodically reviewed, and adjusted as funding levels, and participant benefit characteristics change. Active and passive investment management is employed to help enhance the risk/return profile of the assets.
The plan
’
s assets are invested in a diversified portfolio of equity securities comprised of companies with small, mid, and large capitalizations. Both domestic and international equities are allowed to provide further diversification and opportunity for return in potentially higher growth economies with lower correlation of returns. Growth and value styles of investment are employed to increase the diversification and offer varying opportunities for appreciation. The fixed income portion of the plan may be invested in U.S. dollar denominated debt securities that shall be rated within the top four ratings categories by nationally recognized ratings agencies. The fixed income portion will be invested without regard to industry or sector based on analysis of each target security
’
s structural and repayment features, current pricing and trading opportunities as well as credit quality of the issuer. Individual bonds with ratings that fall below the Plan
’
s rating requirements will be sold only when it is in the best interests of the Plan. Hybrid investments, such as convertible bonds, may be used to provide growth characteristics while offering some protection to declining equity markets by having a fixed income component. Alternative investments such as Treasury Inflation Protected Securities, commodities, and REITs may be used to further enhance diversification while offering opportunities for return. In accordance with ERISA guidelines, common stock of the Company may be purchased up to 10% of the fair market value of the Plan
’
s assets at the time of acquisition. Derivative investments are prohibited in the plan.
The return on assets assumption was developed through review of historical market returns, historical asset class volatility and correlations, current market conditions, the Plan
’
s past experience, and expectations on potential future market returns. The assumption represents a long-term average view of the performance of the assets in the Plan, a return that may or may not be achieved during any one calendar year. The assumption is based on the return of the Plan using the historical 15 year return adjusted for the potential for lower than historical returns due to low interest rates.
Cash Flows - We were not required to and we did not make any contribution to our qualified pension plan in
2017
. Arrow makes contributions for its postretirement benefits in an amount equal to actual expenses for the year.
|
Note 14:
|
OTHER EXPENSES (Dollars In Thousands)
|
Other operating expenses included in the Consolidated Statements of Income are as follows:
|
2017
|
2016
|
2015
|
|||||||||
|
Information Technology Services
|
$
|
5,028
|
|
$
|
4,706
|
|
$
|
3,909
|
|
||
|
Legal and Other Professional Fees
|
2,194
|
|
2,119
|
|
2,188
|
|
|||||
|
Postage and Courier
|
947
|
|
1,087
|
|
1,050
|
|
|||||
|
Advertising and Promotion
|
1,035
|
|
1,084
|
|
965
|
|
|||||
|
Stationery and Printing
|
841
|
|
892
|
|
796
|
|
|||||
|
Telephone and Communications
|
797
|
|
840
|
|
832
|
|
|||||
|
Intangible Asset Amortization
|
279
|
|
297
|
|
327
|
|
|||||
|
All Other
|
3,967
|
|
3,776
|
|
3,846
|
|
|||||
|
Total Other Operating Expense
|
$
|
15,088
|
|
$
|
14,801
|
|
$
|
13,913
|
|
||
#
96
|
Note 15:
|
INCOME TAXES (Dollars In Thousands)
|
The provision for income taxes is summarized below:
|
Current Tax Expense:
|
2017
|
2016
|
2015
|
||||||||
|
Federal
|
$
|
11,142
|
|
$
|
10,496
|
|
$
|
8,570
|
|
||
|
State
|
917
|
|
1,002
|
|
1,004
|
|
|||||
|
Total Current Tax Expense
|
12,059
|
|
11,498
|
|
9,574
|
|
|||||
|
Deferred Tax Expense (Benefit):
|
|||||||||||
|
Federal
|
(1,453
|
)
|
(69
|
)
|
860
|
|
|||||
|
State
|
(77
|
)
|
(214
|
)
|
176
|
|
|||||
|
Total Deferred Tax Expense (Benefit)
|
(1,530
|
)
|
(283
|
)
|
1,036
|
|
|||||
|
Total Provision for Income Taxes
|
$
|
10,529
|
|
$
|
11,215
|
|
$
|
10,610
|
|
||
The provisions for income taxes differed from the amounts computed by applying the U.S. Federal Income Tax Rate of 35% for
2017
,
2016
and
2015
to pre-tax income as a result of the following:
|
2017
|
2016
|
2015
|
|||||||||
|
Computed Tax Expense at Statutory Rate
|
$
|
13,949
|
|
$
|
13,212
|
|
$
|
12,345
|
|
||
|
Increase (Decrease) in Income Taxes Resulting From:
|
|||||||||||
|
Tax Cuts and Jobs Act impact on deferred remeasurement
|
(1,116
|
)
|
—
|
|
—
|
|
|||||
|
Tax-Exempt Income
|
(2,537
|
)
|
(2,437
|
)
|
(2,292
|
)
|
|||||
|
Nondeductible Interest Expense
|
52
|
|
40
|
|
36
|
|
|||||
|
State Taxes, Net of Federal Income Tax Benefit
|
698
|
|
554
|
|
805
|
|
|||||
|
Tax benefit from stock based compensation
|
(134
|
)
|
—
|
|
—
|
|
|||||
|
Other Items, Net
|
(383
|
)
|
(154
|
)
|
(284
|
)
|
|||||
|
Total Provision for Income Taxes
|
$
|
10,529
|
|
$
|
11,215
|
|
$
|
10,610
|
|
||
The Tax Act was enacted on December 22, 2017 and introduces significant changes to U.S. income tax law. Effective in 2018, the Tax Act reduces the U.S. statutory tax rate from 35% to 21%, among other changes. Accordingly, we have remeasured our deferred taxes as of December 22, 2017 to reflect the reduced rate that will apply in future periods when these deferred taxes are settled or realized, which resulted in a deferred tax benefit of
$1.1 million
to reflect the reduced U.S. tax rate.
Interest and penalties are recorded as a component of the provision for income taxes, if any. There are no current examinations of our Federal or state income tax returns, nor have we been notified of any up-coming examinations. Tax years
2014
through
2017
are subject to Federal and New York State examination. Management annually conducts an analysis of its tax positions and has concluded that it has no uncertain tax positions as of
December 31, 2017
.
#
97
The tax effects of temporary differences that give rise to significant portions of the deferred tax assets and deferred tax liabilities are calculated using the U.S. Federal Income Tax Rate of 21% and 35% at
December 31, 2017
and
2016
, respectively and are presented below:
|
2017
|
|
2016
|
|||||
|
Deferred Tax Assets:
|
|||||||
|
Allowance for Loan Losses
|
$
|
4,730
|
|
$
|
6,609
|
|
|
|
Pension and Deferred Compensation Plans
|
2,595
|
|
3,961
|
|
|||
|
Pension Liability Included in Accumulated Other Comprehensive Income
|
2,475
|
|
4,023
|
|
|||
|
Other
|
357
|
|
502
|
|
|||
|
Net Unrealized Losses on Securities Available-for-Sale Included in
Accumulated Other Comprehensive Income
|
426
|
|
239
|
|
|||
|
Total Gross Deferred Tax Assets
|
10,583
|
|
15,334
|
|
|||
|
Valuation Allowance for Deferred Tax Assets
|
—
|
|
—
|
|
|||
|
Total Gross Deferred Tax Assets, Net of Valuation Allowance
|
$
|
10,583
|
|
$
|
15,334
|
|
|
|
Deferred Tax Liabilities:
|
|||||||
|
Pension Plans
|
$
|
5,487
|
|
$
|
8,399
|
|
|
|
Depreciation
|
955
|
|
1,430
|
|
|||
|
Deferred Income
|
2,779
|
|
4,199
|
|
|||
|
Goodwill
|
3,566
|
|
5,324
|
|
|||
|
Total Gross Deferred Tax Liabilities
|
$
|
12,787
|
|
$
|
19,352
|
|
|
Management believes that the realization of the recognized gross deferred tax assets at
December 31, 2017
and
2016
is more likely than not, based on historic earnings and expectations as to future taxable income.
Interest and penalties are recorded as a component of the provision for income taxes, if any. There are no current examinations of our Federal or state income tax returns, nor have we been notified of any up-coming examinations. Tax years
2014
through
2017
are subject to Federal and New York State examination. Management annually conducts an analysis of its tax positions and has concluded that it has no uncertain tax positions as of
December 31, 2017
.
|
Note 16:
|
EARNINGS PER SHARE (Dollars In Thousands, Except Per Share Amounts)
|
The following table presents a reconciliation of the numerator and denominator used in the calculation of basic and diluted earnings per common share ("EPS") for each of the years in the three-year period ended
December 31, 2017
. All share and per share amounts have been adjusted for the
September 28, 2017
3
% stock dividend.
|
Earnings Per Share
|
|||||||||||
|
Year-to-Date Period Ended:
|
|||||||||||
|
12/31/2017
|
12/31/2016
|
12/31/2015
|
|||||||||
|
Earnings Per Share - Basic:
|
|||||||||||
|
Net Income
|
$
|
29,326
|
|
$
|
26,534
|
|
$
|
24,662
|
|
||
|
Weighted Average Shares - Basic
|
13,893
|
|
13,792
|
|
13,680
|
|
|||||
|
Earnings Per Share - Basic
|
$
|
2.11
|
|
$
|
1.92
|
|
$
|
1.80
|
|
||
|
Earnings Per Share - Diluted:
|
|
|
|
|
|||||||
|
Net Income
|
$
|
29,326
|
|
$
|
26,534
|
|
$
|
24,662
|
|
||
|
Weighted Average Shares - Basic
|
13,893
|
|
13,792
|
|
13,680
|
|
|||||
|
Dilutive Average Shares Attributable to Stock Options
|
93
|
|
88
|
|
50
|
|
|||||
|
Weighted Average Shares - Diluted
|
13,986
|
|
13,880
|
|
13,730
|
|
|||||
|
Earnings Per Share - Diluted
|
$
|
2.10
|
|
$
|
1.91
|
|
$
|
1.80
|
|
||
#
98
|
Note 17:
|
FAIR VALUES (Dollars In Thousands)
|
FASB ASC Subtopic 820-10 defines fair value, establishes a framework for measuring fair value in generally accepted accounting principles (GAAP) and requires certain disclosures about fair value measurements. We do not have any nonfinancial assets or liabilities measured at fair value on a recurring basis. The only assets or liabilities that Arrow measured at fair value on a recurring basis at
December 31, 2017
and
2016
were securities available-for-sale. Arrow held no securities or liabilities for trading on such date. For information on fair value measurements, including descriptions of level 1, 2 and 3 of the fair value hierarchy and the valuation methods employed by Arrow, see Note 2,
Summary of Significant Accounting Policies
.
The table below presents the financial instrument's fair value and the amounts within the fair value hierarchy based on the lowest level of input that is significant to the fair value measurement:
|
Fair Value of Assets and Liabilities Measured on a Recurring and Nonrecurring Basis
|
|||||||||||||||||||
|
Fair Value Measurements at Reporting Date Using:
|
|||||||||||||||||||
|
Fair Value of Assets and Liabilities Measured on a Recurring Basis:
|
Fair Value
|
Quoted Prices
In Active Markets for Identical Assets
(Level 1)
|
Significant Other
Observable Inputs
(Level 2)
|
Significant Unobservable Inputs
(Level 3)
|
Total Gains (Losses)
|
||||||||||||||
|
December 31, 2017
|
|||||||||||||||||||
|
Securities Available-for Sale:
|
|||||||||||||||||||
|
U.S. Government & Agency Obligations
|
$
|
59,894
|
|
$
|
59,894
|
|
$
|
—
|
|
$
|
—
|
|
|||||||
|
State and Municipal Obligations
|
10,349
|
|
—
|
|
10,349
|
|
—
|
|
|||||||||||
|
Mortgage-Backed Securities
|
227,596
|
|
—
|
|
227,596
|
|
—
|
|
|||||||||||
|
Corporate and Other Debt Securities
|
800
|
|
—
|
|
800
|
|
—
|
|
|||||||||||
|
Mutual Funds and Equity Securities
|
1,561
|
|
—
|
|
1,561
|
|
—
|
|
|||||||||||
|
Total Securities Available-for-Sale
|
$
|
300,200
|
|
$
|
59,894
|
|
$
|
240,306
|
|
$
|
—
|
|
|
|
|||||
|
December 31, 2016
|
|||||||||||||||||||
|
Securities Available-for Sale:
|
|||||||||||||||||||
|
U.S. Government & Agency Obligations
|
$
|
147,377
|
|
$
|
54,706
|
|
$
|
92,671
|
|
$
|
—
|
|
|||||||
|
State and Municipal Obligations
|
27,690
|
|
—
|
|
27,690
|
|
—
|
|
|||||||||||
|
Mortgage-Backed Securities
|
167,239
|
|
—
|
|
167,239
|
|
—
|
|
|||||||||||
|
Corporate and Other Debt Securities
|
3,308
|
|
—
|
|
3,308
|
|
—
|
|
|||||||||||
|
Mutual Funds and Equity Securities
|
1,382
|
|
—
|
|
1,382
|
|
—
|
|
|||||||||||
|
Total Securities Available-for Sale
|
$
|
346,996
|
|
$
|
54,706
|
|
$
|
292,290
|
|
$
|
—
|
|
|
|
|||||
|
Fair Value of Assets and Liabilities Measured on a Nonrecurring Basis:
|
|||||||||||||||||||
|
December 31, 2017
|
|||||||||||||||||||
|
Collateral Dependent Impaired Loans
|
$
|
—
|
|
$
|
—
|
|
$
|
—
|
|
$
|
—
|
|
$
|
—
|
|
||||
|
Other Real Estate Owned and Repossessed Assets, Net
|
$
|
1,847
|
|
$
|
—
|
|
$
|
—
|
|
$
|
1,847
|
|
$
|
(569
|
)
|
||||
|
December 31, 2016
|
|||||||||||||||||||
|
Collateral Dependent Impaired Loans
|
$
|
—
|
|
$
|
—
|
|
$
|
—
|
|
$
|
—
|
|
$
|
—
|
|
||||
|
Other Real Estate Owned and Repossessed Assets, Net
|
$
|
1,686
|
|
$
|
—
|
|
$
|
—
|
|
$
|
1,686
|
|
$
|
(587
|
)
|
||||
We determine the fair value of financial instruments under the following hierarchy:
|
•
|
Level 1 - Unadjusted quoted prices in active markets that are accessible at the measurement date for identical, unrestricted assets or liabilities;
|
|
•
|
Level 2 - Quoted prices for similar assets or liabilities in active markets, quoted prices for identical or similar assets or liabilities in markets that are not active, or inputs that are observable, either directly or indirectly, for substantially the full term of the asset or liability;
|
|
•
|
Level 3 - Prices or valuation techniques that require inputs that are both significant to the fair value measurement and unobservable (i.e., supported by little or no market activity).
|
#
99
Fair Value Methodology for Assets and Liabilities Measured on a Recurring Basis
The fair value of level 1 securities available-for-sale are based on unadjusted, quoted market prices from exchanges in active markets. The fair value of level 2 securities available-for-sale are based on an independent bond and equity pricing service for identical assets or significantly similar securities and an independent equity pricing service for equity securities not actively traded. The pricing services use a variety of techniques to arrive at fair value including market maker bids, quotes and pricing models. Inputs to the pricing models include recent trades, benchmark interest rates, spreads and actual and projected cash flows.
Fair Value Methodology for Assets and Liabilities Measured on a Nonrecurring Basis
The fair value of collateral dependent impaired loans and other real estate owned was based on third-party appraisals less estimated cost to sell. The appraisals may be adjusted by management for qualitative factors such as economic conditions and estimated liquidation expenses.
Other assets which might have been included in this table include mortgage servicing rights, goodwill and other intangible assets. Arrow evaluates each of these assets for impairment on an annual basis, with no impairment recognized for these assets at
December 31, 2017
and
2016
.
Fair Value Methodology for Financial Instruments Not Measured on a Recurring or Nonrecurring Basis
Securities held-to-maturity are fair valued utilizing an independent bond pricing service for identical assets or significantly similar securities. The pricing service uses a variety of techniques to arrive at fair value including market maker bids, quotes and pricing models. Inputs to the pricing models include recent trades, benchmark interest rates, spreads and actual and projected cash flows.
Fair values for loans are estimated for portfolios of loans with similar financial characteristics. Loans are segregated by type such as commercial, commercial real estate, residential mortgage, indirect and other consumer loans. Each loan category is further segmented into fixed and adjustable interest rate terms and by performing and nonperforming categories. The fair value methodology does not use an exit price methodology. The fair value of performing loans is calculated by discounting scheduled cash flows through the estimated maturity using estimated market discount rates that reflect the credit and interest rate risk inherent in the loan. The estimate of maturity is based on historical experience with repayments for each loan classification, modified, as required, by an estimate of the effect of current economic and lending conditions. Fair value for nonperforming loans is generally based on recent external appraisals. If appraisals are not available, estimated cash flows are discounted using a rate commensurate with the risk associated with the estimated cash flows. Assumptions regarding credit risk, cash flows and discount rates are judgmentally determined using available market information and specific borrower information.
The fair value of time deposits is based on the discounted value of contractual cash flows, except that the fair value is limited to the extent that the customer could redeem the certificate after imposition of a premature withdrawal penalty. The discount rates are estimated using the FHLBNY yield curve, which is considered representative of Arrow
’
s time deposit rates. The fair value of all other deposits is equal to the carrying value.
The fair value of FHLBNY advances is estimated based on the discounted value of contractual cash flows. The discount rate is estimated using current rates on FHLBNY advances with similar maturities and call features.
Based on Arrow
’
s capital adequacy, the book value of the outstanding trust preferred securities (Junior Subordinated Obligations Issued to Unconsolidated Subsidiary Trusts) are considered to approximate fair value since the interest rates are variable (indexed to LIBOR) and Arrow is well-capitalized. In addition, these instruments do not trade in the open markets since Dodd-Frank deemed new issuances ineligible for treatment as Tier-1 capital.
#
100
Fair Value by Balance Sheet Grouping
The following table presents a summary of the carrying amount, the fair value or an amount approximating fair value and the fair value hierarchy of Arrow
’
s financial instruments:
|
Schedule of Fair Values by Balance Sheet Grouping
|
|||||||||||||||||||
|
Fair Value Hierarchy
|
|||||||||||||||||||
|
Carrying
Amount
|
Fair
Value
|
Level 1
|
Level 2
|
Level 3
|
|||||||||||||||
|
December 31, 2017
|
|||||||||||||||||||
|
Cash and Cash Equivalents
|
$
|
72,838
|
|
$
|
72,838
|
|
$
|
72,838
|
|
$
|
—
|
|
$
|
—
|
|
||||
|
Securities Available-for-Sale
|
300,200
|
|
300,200
|
|
59,894
|
|
240,306
|
|
—
|
|
|||||||||
|
Securities Held-to-Maturity
|
335,907
|
|
335,901
|
|
—
|
|
335,901
|
|
—
|
|
|||||||||
|
Federal Home Loan Bank and Federal Reserve Bank Stock
|
9,949
|
|
9,949
|
|
—
|
|
9,949
|
|
—
|
|
|||||||||
|
Net Loans
|
1,932,184
|
|
1,901,046
|
|
—
|
|
—
|
|
1,901,046
|
|
|||||||||
|
Accrued Interest Receivable
|
6,753
|
|
6,753
|
|
—
|
|
6,753
|
|
—
|
|
|||||||||
|
Deposits
|
2,245,116
|
|
2,236,548
|
|
—
|
|
2,236,548
|
|
—
|
|
|||||||||
|
Federal Funds Purchased and Securities Sold Under Agreements to Repurchase
|
64,966
|
|
64,966
|
|
—
|
|
64,966
|
|
—
|
|
|||||||||
|
Federal Home Loan Bank Overnight Advances
|
105,000
|
|
105,000
|
|
—
|
|
105,000
|
|
—
|
|
|||||||||
|
Federal Home Loan Bank Term Advances
|
55,000
|
|
54,781
|
|
—
|
|
54,781
|
|
—
|
|
|||||||||
|
Junior Subordinated Obligations Issued
to Unconsolidated Subsidiary Trusts
|
20,000
|
|
20,000
|
|
—
|
|
20,000
|
|
—
|
|
|||||||||
|
Accrued Interest Payable
|
410
|
|
410
|
|
—
|
|
410
|
|
—
|
|
|||||||||
|
December 31, 2016
|
|||||||||||||||||||
|
Cash and Cash Equivalents
|
$
|
57,355
|
|
$
|
57,355
|
|
$
|
57,355
|
|
$
|
—
|
|
$
|
—
|
|
||||
|
Securities Available-for-Sale
|
346,996
|
|
346,996
|
|
54,706
|
|
292,290
|
|
—
|
|
|||||||||
|
Securities Held-to-Maturity
|
345,427
|
|
343,751
|
|
—
|
|
343,751
|
|
—
|
|
|||||||||
|
Federal Home Loan Bank and Federal Reserve Bank Stock
|
10,912
|
|
10,912
|
|
—
|
|
10,912
|
|
—
|
|
|||||||||
|
Net Loans
|
1,736,256
|
|
1,720,078
|
|
—
|
|
—
|
|
1,720,078
|
|
|||||||||
|
Accrued Interest Receivable
|
6,684
|
|
6,684
|
|
—
|
|
6,684
|
|
—
|
|
|||||||||
|
Deposits
|
2,116,546
|
|
2,109,557
|
|
—
|
|
2,109,557
|
|
—
|
|
|||||||||
|
Federal Funds Purchased and Securities Sold Under Agreements to Repurchase
|
35,836
|
|
35,836
|
|
—
|
|
35,836
|
|
—
|
|
|||||||||
|
Federal Home Loan Bank Overnight Advances
|
123,000
|
|
123,000
|
|
—
|
|
123,000
|
|
—
|
|
|||||||||
|
Federal Home Loan Bank Term Advances
|
55,000
|
|
55,118
|
|
—
|
|
55,118
|
|
—
|
|
|||||||||
|
Junior Subordinated Obligations Issued
to Unconsolidated Subsidiary Trusts
|
20,000
|
|
20,000
|
|
—
|
|
20,000
|
|
—
|
|
|||||||||
|
Accrued Interest Payable
|
247
|
|
247
|
|
—
|
|
247
|
|
—
|
|
|||||||||
#
101
|
Note 18:
|
LEASES (Dollars In Thousands)
|
At
December 31, 2017
, Arrow was obligated under a number of noncancellable operating leases for buildings and equipment. Certain of these leases provide for escalation clauses and contain renewal options calling for increased rentals if the lease is renewed.
Net rental expense for the years ended
December 31, 2017
,
2016
and
2015
was as follows:
|
2017
|
|
2016
|
|
2015
|
|
||||
|
Net Rental Expense
|
$
|
746
|
|
$
|
822
|
|
$
|
862
|
|
Future minimum lease payments on operating leases at
December 31, 2017
were as follows:
|
Operating
Leases
|
|
||
|
2018
|
$
|
690
|
|
|
2019
|
504
|
|
|
|
2020
|
373
|
|
|
|
2021
|
290
|
|
|
|
2022
|
169
|
|
|
|
2023 and beyond
|
184
|
|
|
|
Total Minimum Lease Payments
|
$
|
2,210
|
|
Arrow leases five of its branch offices, at market rates, from Stewart
’
s Shops Corp. Mr. Gary C. Dake, President of Stewart
’
s Shops Corp., serves on both the boards of Arrow and Saratoga National Bank and Trust Company.
|
Note 19:
|
REGULATORY MATTERS (Dollars in Thousands)
|
In the normal course of business, Arrow and its subsidiaries operate under certain regulatory restrictions, such as the extent and structure of covered inter-company borrowings and maintenance of reserve requirement balances.
The principal source of the funds for the payment of stockholder dividends by Arrow has been from dividends declared and paid to Arrow by its bank subsidiaries. As of
December 31, 2017
, the maximum amount that could have been paid by subsidiary banks to Arrow, without prior regulatory approval, was approximately
$44.1 million
.
Under current Federal Reserve regulations, Arrow is prohibited from borrowing from the subsidiary banks unless such borrowings are secured by specific obligations. Additionally, the maximum of any such borrowings from any one subsidiary bank(aggregated with all other "covered transactions between the bank and Arrow) is limited to 10% of that bank
’
s capital and surplus. Loans and other covered transactions between any one subsidiary bank and all of its affiliates cannot exceed 20% of that bank's capital and surplus.
Arrow and its subsidiary banks are subject to various regulatory capital requirements administered by the federal banking agencies. Failure to meet minimum capital requirements can initiate certain mandatory--and possibly additional discretionary--actions by regulators that, if undertaken, could have a direct material effect on an institution
’
s financial statements. Under capital adequacy guidelines and the regulatory framework for prompt corrective action, Arrow and its subsidiary banks must meet specific capital guidelines that involve quantitative measures of assets, liabilities, and certain off-balance sheet items as calculated under regulatory accounting practices. Capital amounts and classification are also subject to qualitative judgments by the regulators about components, risk weightings, and other factors.
Quantitative measures established by regulation to ensure capital adequacy require Arrow and its subsidiary banks to maintain minimum capital amounts and ratios (set forth in the table below) of total and Tier I capital (as defined in the regulations) to risk-weighted assets (as defined), and of Tier I capital (as defined) to average assets (as defined). Management believes, as of
December 31, 2017
and
2016
, that Arrow and both subsidiary banks meet all capital adequacy requirements to which they are subject.
#
102
As of
December 31, 2017
, Arrow and both subsidiary banks qualified as well-capitalized under the regulatory framework for prompt corrective action. To be categorized as
“
well-capitalized,
”
Arrow and its subsidiary banks must maintain minimum total risk-based, Tier I risk-based, Tier I leverage, and CET1 risk-based ratios as set forth in the table below. There are no conditions or events that management believes have changed Arrow
’
s or its subsidiary banks
’
categories. The actual capital amounts and ratios for Arrow and its subsidiary banks, Glens Falls National Bank and Trust Company (
“
Glens Falls National
”
) and Saratoga National Bank and Trust Company (
“
Saratoga National
”
), are presented in the table below as of
December 31, 2017
and
2016
:
|
Actual
|
Minimum Amounts For Capital Adequacy Purposes
|
Minimum Amounts To Be Well-Capitalized
|
||||||||||||||||||
|
Amount
|
Ratio
|
Amount
|
Ratio
|
Amount
|
Ratio
|
|||||||||||||||
|
As of December 31, 2017
|
||||||||||||||||||||
|
Total Capital
(to Risk Weighted Assets):
|
||||||||||||||||||||
|
Arrow
|
$
|
278,163
|
|
15.0
|
%
|
$
|
172,461
|
|
9.3
|
%
|
$
|
185,442
|
|
10.0
|
%
|
|||||
|
Glens Falls National
|
220,275
|
|
14.6
|
%
|
140,312
|
|
9.3
|
%
|
150,873
|
|
10.0
|
%
|
||||||||
|
Saratoga National
|
48,822
|
|
14.0
|
%
|
32,432
|
|
9.3
|
%
|
34,873
|
|
10.0
|
%
|
||||||||
|
Tier I Capital
(to Risk Weighted Assets):
|
||||||||||||||||||||
|
Arrow
|
259,378
|
|
14.0
|
%
|
135,247
|
|
7.3
|
%
|
148,216
|
|
8.0
|
%
|
||||||||
|
Glens Falls National
|
205,200
|
|
13.6
|
%
|
110,144
|
|
7.3
|
%
|
120,706
|
|
8.0
|
%
|
||||||||
|
Saratoga National
|
45,311
|
|
13.0
|
%
|
25,444
|
|
7.3
|
%
|
27,884
|
|
8.0
|
%
|
||||||||
|
Tier I Capital
(to Average Assets):
|
||||||||||||||||||||
|
Arrow
|
259,378
|
|
9.5
|
%
|
109,212
|
|
4.0
|
%
|
136,515
|
|
5.0
|
%
|
||||||||
|
Glens Falls National
|
205,200
|
|
9.1
|
%
|
90,198
|
|
4.0
|
%
|
112,747
|
|
5.0
|
%
|
||||||||
|
Saratoga National
|
45,311
|
|
9.4
|
%
|
19,281
|
|
4.0
|
%
|
24,102
|
|
5.0
|
%
|
||||||||
|
Common Equity Tier 1 Capital
(to Risk Weighted Assets):
|
||||||||||||||||||||
|
Arrow
|
239,326
|
|
12.9
|
%
|
107,604
|
|
5.8
|
%
|
120,591
|
|
6.5
|
%
|
||||||||
|
Glens Falls National
|
205,148
|
|
13.6
|
%
|
87,490
|
|
5.8
|
%
|
98,049
|
|
6.5
|
%
|
||||||||
|
Saratoga National
|
45,311
|
|
13.0
|
%
|
20,216
|
|
5.8
|
%
|
22,656
|
|
6.5
|
%
|
||||||||
|
As of December 31, 2016
|
||||||||||||||||||||
|
Total Capital
(to Risk Weighted Assets):
|
||||||||||||||||||||
|
Arrow
|
258,653
|
|
15.2
|
%
|
146,343
|
|
8.6
|
%
|
170,166
|
|
10.0
|
%
|
||||||||
|
Glens Falls National
|
205,573
|
|
15.0
|
%
|
117,862
|
|
8.6
|
%
|
137,049
|
|
10.0
|
%
|
||||||||
|
Saratoga National
|
42,168
|
|
12.8
|
%
|
28,332
|
|
8.6
|
%
|
32,944
|
|
10.0
|
%
|
||||||||
|
Tier I Capital
(to Risk Weighted Assets):
|
||||||||||||||||||||
|
Arrow
|
241,523
|
|
14.1
|
%
|
113,053
|
|
6.6
|
%
|
137,034
|
|
8.0
|
%
|
||||||||
|
Glens Falls National
|
191,679
|
|
14.0
|
%
|
90,363
|
|
6.6
|
%
|
109,531
|
|
8.0
|
%
|
||||||||
|
Saratoga National
|
39,050
|
|
11.9
|
%
|
21,658
|
|
6.6
|
%
|
26,252
|
|
8.0
|
%
|
||||||||
|
Tier I Capital
(to Average Assets):
|
||||||||||||||||||||
|
Arrow
|
241,523
|
|
9.5
|
%
|
101,694
|
|
4.0
|
%
|
127,117
|
|
5.0
|
%
|
||||||||
|
Glens Falls National
|
191,679
|
|
9.1
|
%
|
84,255
|
|
4.0
|
%
|
105,318
|
|
5.0
|
%
|
||||||||
|
Saratoga National
|
39,050
|
|
8.9
|
%
|
17,551
|
|
4.0
|
%
|
21,938
|
|
5.0
|
%
|
||||||||
|
Common Equity Tier 1 Capital
(to Risk Weighted Assets):
|
||||||||||||||||||||
|
Arrow
|
221,472
|
|
13.0
|
%
|
86,885
|
|
5.1
|
%
|
110,736
|
|
6.5
|
%
|
||||||||
|
Glens Falls National
|
191,628
|
|
13.9
|
%
|
70,310
|
|
5.1
|
%
|
89,610
|
|
6.5
|
%
|
||||||||
|
Saratoga National
|
39,050
|
|
11.9
|
%
|
16,736
|
|
5.1
|
%
|
21,330
|
|
6.5
|
%
|
||||||||
#
103
|
Note 20:
|
PARENT ONLY FINANCIAL INFORMATION (Dollars In Thousands)
|
Condensed financial information for Arrow Financial Corporation is as follows:
|
BALANCE SHEETS
|
December 31,
|
||||||
|
ASSETS
|
2017
|
2016
|
|||||
|
Interest-Bearing Deposits with Subsidiary Banks
|
$
|
2,186
|
|
$
|
3,593
|
|
|
|
Available-for-Sale Securities
|
1,562
|
|
1,382
|
|
|||
|
Held-to-Maturity Securities
|
—
|
|
1,000
|
|
|||
|
Investment in Subsidiaries at Equity
|
261,622
|
|
243,031
|
|
|||
|
Other Assets
|
7,987
|
|
7,951
|
|
|||
|
Total Assets
|
$
|
273,357
|
|
$
|
256,957
|
|
|
|
LIABILITIES
|
|||||||
|
Junior Subordinated Obligations Issued to
Unconsolidated Subsidiary Trusts
|
$
|
20,000
|
|
$
|
20,000
|
|
|
|
Other Liabilities
|
3,754
|
|
4,105
|
|
|||
|
Total Liabilities
|
23,754
|
|
24,105
|
|
|||
|
STOCKHOLDERS’ EQUITY
|
|||||||
|
Total Stockholders’ Equity
|
249,603
|
|
232,852
|
|
|||
|
Total Liabilities and Stockholders’ Equity
|
$
|
273,357
|
|
$
|
256,957
|
|
|
|
STATEMENTS OF INCOME
|
Years Ended December 31,
|
||||||||||
|
Income:
|
2017
|
2016
|
2015
|
||||||||
|
Dividends from Bank Subsidiaries
|
$
|
12,800
|
|
$
|
11,650
|
|
$
|
13,400
|
|
||
|
Interest and Dividends on Investments
|
53
|
|
117
|
|
118
|
|
|||||
|
Other Income (Including Management Fees)
|
677
|
|
635
|
|
847
|
|
|||||
|
Total Income
|
13,530
|
|
12,402
|
|
14,365
|
|
|||||
|
Expense:
|
|||||||||||
|
Interest Expense
|
781
|
|
691
|
|
619
|
|
|||||
|
Salaries and Employee Benefits
|
76
|
|
77
|
|
80
|
|
|||||
|
Other Expense
|
882
|
|
865
|
|
885
|
|
|||||
|
Total Expense
|
1,739
|
|
1,633
|
|
1,584
|
|
|||||
|
Income Before Income Tax Benefit and Equity
|
|||||||||||
|
in Undistributed Net Income of Subsidiaries
|
11,791
|
|
10,769
|
|
12,781
|
|
|||||
|
Income Tax Benefit
|
225
|
|
482
|
|
372
|
|
|||||
|
Equity in Undistributed Net Income of Subsidiaries
|
17,310
|
|
15,283
|
|
11,509
|
|
|||||
|
Net Income
|
$
|
29,326
|
|
$
|
26,534
|
|
$
|
24,662
|
|
||
The Statement of Changes in Stockholders
’
Equity is not reported because it is identical to the Consolidated Statement of Changes in Stockholders
’
Equity.
#
104
|
STATEMENTS OF CASH FLOWS
|
Years Ended December 31,
|
||||||||||
|
2017
|
2016
|
2015
|
|||||||||
|
Cash Flows from Operating Activities:
|
|||||||||||
|
Net Income
|
$
|
29,326
|
|
$
|
26,534
|
|
$
|
24,662
|
|
||
|
Adjustments to Reconcile Net Income to Net Cash Provided by Operating Activities:
|
|||||||||||
|
Undistributed Net Income of Subsidiaries
|
(17,310
|
)
|
(15,283
|
)
|
(11,509
|
)
|
|||||
|
Shares Issued Under the Directors’ Stock Plan
|
233
|
|
196
|
|
227
|
|
|||||
|
Stock-Based Compensation Expense
|
351
|
|
287
|
|
308
|
|
|||||
|
Changes in Other Assets and Other Liabilities
|
(1,530
|
)
|
(1,177
|
)
|
(1,419
|
)
|
|||||
|
Net Cash Provided by Operating Activities
|
11,070
|
|
10,557
|
|
12,269
|
|
|||||
|
Cash Flows from Investing Activities:
|
|||||||||||
|
Proceeds from the Sale of Securities Available-for-Sale
|
—
|
|
—
|
|
47
|
|
|||||
|
Purchases of Securities Available-for-Sale
|
—
|
|
—
|
|
(47
|
)
|
|||||
|
Proceeds of Securities Held-to-Maturity
|
1,000
|
|
—
|
|
—
|
|
|||||
|
Net Cash Provided by Investing Activities
|
1,000
|
|
—
|
|
—
|
|
|||||
|
Cash Flows from Financing Activities:
|
|||||||||||
|
Stock Options Exercised
|
1,190
|
|
2,404
|
|
918
|
|
|||||
|
Shares Issued Under the Employee Stock Purchase Plan
|
496
|
|
493
|
|
494
|
|
|||||
|
Shares Issued for Dividend Reinvestment Plans
|
1,684
|
|
1,743
|
|
886
|
|
|||||
|
Tax Benefit for Exercises of Stock Options
|
—
|
|
188
|
|
59
|
|
|||||
|
Purchase of Treasury Stock
|
(3,248
|
)
|
(2,141
|
)
|
(1,498
|
)
|
|||||
|
Cash Dividends Paid
|
(13,599
|
)
|
(13,092
|
)
|
(12,700
|
)
|
|||||
|
Net Cash Used in Financing Activities
|
(13,477
|
)
|
(10,405
|
)
|
(11,841
|
)
|
|||||
|
Net Increase (Decrease) in Cash and Cash Equivalents
|
(1,407
|
)
|
152
|
|
428
|
|
|||||
|
Cash and Cash Equivalents at Beginning of the Year
|
3,593
|
|
3,441
|
|
3,013
|
|
|||||
|
Cash and Cash Equivalents at End of the Year
|
$
|
2,186
|
|
$
|
3,593
|
|
$
|
3,441
|
|
||
|
Supplemental Disclosures to Statements of
Cash Flow Information:
|
|||||||||||
|
Interest Paid
|
$
|
781
|
|
$
|
691
|
|
$
|
619
|
|
||
#
105
Item 9.
Changes in and Disagreements with Accountants on Accounting and Financial Disclosure -
None.
|
Item 9A.
|
Controls and Procedures
|
Senior management maintains disclosure controls and procedures that are designed to ensure that information required to be disclosed in our Exchange Act reports is recorded, processed, summarized and reported within the time periods provided in the SEC's rules and forms, and that such information is accumulated and communicated to our management, including the Chief Executive Officer and Chief Financial Officer, as appropriate, to allow timely decisions regarding required disclosure. In designing and evaluating the disclosure controls and procedures, senior management has recognized that any controls and procedures, no matter how well designed and operated, can provide only reasonable assurance of achieving the desired control objectives, and therefore has been required to apply its judgment in evaluating the cost-benefit relationship of possible controls and procedures.
Senior management, including the Chief Executive Officer and Chief Financial Officer, evaluated the effectiveness of the design and operation of our disclosure controls and procedures (as defined in Rule 13(a)-15(e) under the Exchange Act) as of
December 31, 2017
. Based upon that evaluation, senior management, including the Chief Executive Officer and Chief Financial Officer, concluded that our disclosure controls and procedures were effective on that date. There were no changes made in our internal controls or in other factors that could significantly affect these internal controls subsequent to the date of the evaluation performed by the Chief Executive Officer and Chief Financial Officer.
Management
’
s Report on Internal Control Over Financial Reporting
Our management assessed the effectiveness of our internal control over financial reporting as of
December 31, 2017
. In May 2013, the Committee of Sponsoring Organizations of the Treadway Commission (COSO) published an updated Internal Control-Integrated Framework and related illustrative documents. We adopted the 2013 framework in 2015. Accordingly, in making its assessment of the effectiveness of our internal control over financial reporting as of
December 31, 2017
, management used the criteria established in the 2013 framework. Based on our assessment
,
our management concluded that our internal control over financial reporting was effective as of
December 31, 2017
.
|
Item 9B.
|
Other Information
–
None.
|
#
106
Item 10.
Directors, Executive Officers and Corporate Governance
The information required by this item regarding directors, nominees for director, and the committees of the Company's Board is set forth under the captions "Voting Item 1: Election of Directors" and “Corporate Governance” of Arrow's Proxy Statement for its Annual Meeting of Shareholders to be held
April 25, 2018
(the Proxy Statement), which sections are incorporated herein by reference. Information regarding Compliance with Section 16(a) of the Exchange Act is set forth in the Company's Proxy Statement under the caption "Section 16(a) Beneficial Ownership Reporting” and is incorporated herein by reference. Certain required information regarding our Executive Officers is contained in Part I, Item 1.G. of this Report, "Executive Officers of the Registrant." Arrow has adopted a Financial Code of Ethics applicable to our principal executive officer, principal financial officer and principal accounting officer, a copy of which can be found on our website at
www.arrowfinancial.com
under the link "Corporate Governance" on the header tab "Corporate."
Item 11.
Executive Compensation
The information required by this item is set forth under the captions “Corporate Governance - Director Independence,” "Compensation Discussion and Analysis” including the “Compensation Committee Report” thereof, “Executive Compensation,” “Agreements with Named Executive Officers” including the "Potential Payments Upon Termination or Change of Control” and “Potential Payments Table” sections thereof, and “Voting Item 1: Election of Directors - Director Compensation” of the Proxy Statement, which sections are incorporated herein by reference.
Item 12.
Security Ownership of Certain Beneficial Owners and Management and Related Stockholder Matters
Certain information required by this item is set forth under the caption "Stock Ownership Information" of the Proxy Statement, which section is incorporated herein by reference, and under the caption "Equity Compensation Plan Information" in Part II, item 5 of this Report.
Item 13.
Certain Relationships and Related Transactions, and Director Independence
The information required by this item is set forth under the captions “Corporate Governance - Related Party Transactions” and “Corporate Governance - Director Independence” of the Proxy Statement, which sections are incorporated herein by reference.
Item 14.
Principal Accounting Fees and Services
The information required by this item is set forth under the captions "Voting Item 2, Ratification of Independent Registered Public Accounting Firm - Independent Registered Public Accounting Firm Fees," and “Corporate Governance - Board Committees” of the Proxy Statement, which sections are incorporated herein by reference.
Item 15.
Exhibits, Financial Statement Schedules
1.
Financial Statements
The following financial statements, the notes thereto, and the independent auditors
’
report thereon are filed in Part II, Item 8 of this Report. See the index to such financial statements at the beginning of Item 8.
Reports of Independent Registered Public Accounting Firm
Consolidated Balance Sheets as of
December 31, 2017
and
2016
Consolidated Statements of Income for the Years Ended
December 31, 2017
,
2016
and
2015
Consolidated Statements of Comprehensive Income for the Years Ended
December 31, 2017
,
2016
and
2015
Consolidated Statements of Changes in Stockholders
’
Equity for the Years Ended
December 31, 2017
,
2016
and
2015
Consolidated Statements of Cash Flows for the Years Ended
December 31, 2017
,
2016
and
2015
Notes to Consolidated Financial Statements
2.
Schedules
#
107
All schedules are omitted as the required information is either not applicable or not required or is contained in the respective financial statements or in the notes thereto.
3.
Exhibits
:
See Exhibit Index on page
109
.
Item 16.
Form 10-K Summary
- None
EXHIBIT INDEX
The following exhibits are incorporated by reference herein.
|
Exhibit
Number
|
Exhibit
|
|
3.(i)
|
|
|
3.(ii)
|
|
|
4.1
|
|
|
4.2
|
|
|
4.3
|
|
|
4.4
|
|
|
4.5
|
|
|
4.6
|
|
|
4.7
|
|
|
4.8
|
|
|
10.1
|
|
|
10.2
|
|
|
10.3
|
|
|
10.4
|
|
|
10.5
|
|
|
10.6
|
|
#
108
|
Exhibit
Number
|
Exhibit
|
|
10.7
|
|
|
10.8
|
|
|
10.9
|
|
|
10.10
|
|
|
10.11
|
|
|
10.12
|
|
|
10.13
|
|
|
10.14
|
|
|
10.16
|
|
|
10.17
|
|
|
10.18
|
|
|
10.19
|
|
|
10.20
|
|
|
10.21
|
|
|
10.22
|
|
|
10.23
|
|
|
10.24
|
|
|
14
|
|
The following exhibits are submitted herewith:
#
109
|
Exhibit
Number
|
Exhibit
|
|
21
|
|
|
23
|
|
|
31.1
|
|
|
31.2
|
|
|
32
|
|
|
101.INS
|
XBRL Instance Document
|
|
101.SCH
|
XBRL Taxonomy Extension Schema Document
|
|
101.CAL
|
XBRL Taxonomy Extension Calculation Linkbase Document
|
|
101.DEF
|
XBRL Taxonomy Extension Definition Linkbase Document
|
|
101.LAB
|
XBRL Taxonomy Extension Labels Linkbase Document
|
|
101.PRE
|
XBRL Taxonomy Extension Presentation Linkbase Document
|
* Management contracts or compensation plans required to be filed as an exhibit.
#
110
Pursuant to the requirements of Section 13 or 15(d) of the Securities Exchange Act of 1934, the Registrant has duly caused this Report to be signed on its behalf by the undersigned, thereunto duly authorized.
ARROW FINANCIAL CORPORATION
|
Date: March 12, 2018
|
By:
/s/ Thomas J. Murphy
Thomas J. Murphy
President and Chief Executive Officer
(Principal Executive Officer)
|
|
Date: March 12, 2018
|
By:
/s/ Edward J. Campanella
Edward J. Campanella
Senior Vice President, Treasurer and
Chief Financial Officer
(Principal Financial and Accounting Officer)
|
Pursuant to the requirements of the Securities Exchange Act of 1934, this Report has been signed below on
March 12, 2018
by the following persons in the capacities indicated.
|
/s/ Mark L. Behan
Mark L. Behan
Director
|
/s/ David L. Moynehan
David L. Moynehan
Director
|
|
/s/ Tenée R. Casaccio
Tenée R. Casaccio
Director
|
/s/ Thomas J. Murphy
Thomas J. Murphy
Director
|
|
/s/ Michael B. Clarke
Michael B. Clarke
Director
|
/s/ Raymond F. O'Conor
Raymond F. O'Conor
Director
|
|
/s/ Gary C. Dake
Gary C. Dake
Director
|
/s/ William L. Owens
William L. Owens
Director
|
|
/s/ Thomas L. Hoy
Thomas L. Hoy
Director and Chairman
|
/s/ Colin L. Read
Colin L. Read
Director
|
|
/s/ David G. Kruczlnicki
David G. Kruczlnicki
Director
|
/s/ Richard J. Reisman, D.M.D.
Richard J. Reisman, D.M.D.
Director
|
|
/s/ Elizabeth A. Miller
Elizabeth A. Miller
Director
|
|
#
111
TABLE OF CONTENTS
Part IItem 1. BusinessPart Ii, Item 7. B.iPart Ii, Item 7. C.iPart Ii, Item 7. C.iiPart Ii, Item 7. C.iiiPart Ii, Item 7. C.ivPart Ii, Item 6Part Ii, Item 7. C.vItem 1A. Risk FactorsItem 1B. Unresolved Staff Comments - NoneItem 2. PropertiesItem 3. Legal ProceedingsItem 4. Mine Safety Disclosures - NonePart IIItem 5. Market For The Registrant's Common Equity, Related Stockholder Matters and Issuer Purchases Of Equity SecuritiesItem 6. Selected Financial DataItem 7. Management's Discussion and Analysis Of Financial Condition and Results Of OperationsNote 5, Loans, To The Notes To Our Consolidated Financial Statements Contains Detailed Information on Modified Loans and Impaired LoansItem 7A. Quantitative and Qualitative Disclosures About Market RiskItem 8. Financial Statements and Supplementary DataNote 1:risks and UncertaintiesNote 2:summary Of Significant Accounting PoliciesNote 3:cash and Cash Equivalents (dollars in Thousands) (at December 31, 2017 and 2016)Note 4. Investment Securities (dollars in Thousands)Note 5:loans (dollars in Thousands)Note 6:premises and Equipment (dollars in Thousands)Note 7:other Intangible Assets (dollars in Thousands)Note 8:guarantees (dollars in Thousands)Note 9:time Deposits (dollars in Thousands)Note 10:debt (dollars in Thousands)Note 11:comprehensive Income (dollars in Thousands)Note 12:stock Based Compensation (dollars in Thousands, Except Share and Per Share Amounts)Note 13:retirement Benefit Plans (dollars in Thousands)Note 14:other Expenses (dollars in Thousands)Note 15:income Taxes (dollars in Thousands)Note 16: Earnings Per Share (dollars in Thousands, Except Per Share Amounts)Note 17:fair Values (dollars in Thousands)Note 18:leases (dollars in Thousands)Note 19:regulatory Matters (dollars in Thousands)Note 20:parent Only Financial Information (dollars in Thousands)Item 9. Changes in and Disagreements with Accountants on Accounting and Financial Disclosure - NoneItem 9A. Controls and ProceduresItem 9B. Other Information NonePart IIIItem 10. Directors, Executive Officers and Corporate GovernanceItem 11. Executive CompensationItem 12. Security Ownership Of Certain Beneficial Owners and Management and Related Stockholder MattersItem 13. Certain Relationships and Related Transactions, and Director IndependenceItem 14. Principal Accounting Fees and ServicesPart IVItem 15. Exhibits, Financial Statement SchedulesItem 16. Form 10-k Summary - None