ADVANCED EMISSIONS SOLUTIONS, INC.
10-Ks and 10-Qs
|
|
|
|
|
|
|
|
|
|
|
|
|
|
|
|
|
|
|
|
|
|
|
|
|
|
|
|
|
|
|
|
|
|
|
|
|
|
United States
SECURITIES AND EXCHANGE COMMISSION
Washington, D.C. 20549
______________________________________
FORM 10-K
______________________________________
|
x
|
ANNUAL REPORT PURSUANT TO SECTION 13 OR 15(d) OF THE SECURITIES EXCHANGE ACT OF 1934
|
For the fiscal year ended
December 31, 2018
or
|
¨
|
TRANSITION REPORT PURSUANT TO SECTION 13 OR 15(d) OF THE SECURITIES EXCHANGE ACT OF 1934
|
Commission File Number:
001-37822
Advanced Emissions Solutions, Inc.
(Name of registrant as specified in its charter)
|
Delaware
|
|
27-5472457
|
|
(State of incorporation)
|
|
(IRS Employer
Identification No.)
|
640 Plaza Drive, Suite 270, Highlands Ranch, CO,
80129
(Address of principal executive offices) (Zip Code)
(Registrant’s telephone number, including area code):
(720) 598-3500
Securities registered under Section 12(b) of the Act:
|
Title of each class
|
|
Name of each exchange on which registered
|
|
Common Stock, $0.001 par value
|
|
NASDAQ Global Market
|
Securities registered under Section 12(g) of the Act: None
Indicate by check mark if the registrant is a well-known seasoned issuer, as defined in Rule 405 of the Securities Act.
¨
Yes
x
No
Indicate by check mark if the registrant is not required to file reports pursuant to Section 13 or 15(d) of the Act.
¨
Yes
x
No
Indicate by check mark whether the registrant (1) has filed all reports required to be filed by Section 13 or 15(d) of the Securities Exchange Act of 1934 during the preceding 12 months (or for such shorter period that the registrant was required to file such reports), and (2) has been subject to such filing requirements for the past 90 days.
x
Yes
¨
No
Indicate by check mark whether the registrant has submitted electronically and posted on its corporate Web site, if any, every Interactive Data File required to be submitted and posted pursuant to Rule 405 of Regulation S-T during the preceding 12 months (or for such shorter period that the registrant was required to submit and post such files).
x
Yes
¨
No
Indicate by check mark if disclosure of delinquent filers in response to Item 405 of Regulation S-K is not contained herein, and will not be contained, to the best of registrant’s knowledge, in definitive proxy or information statements incorporated by reference in Part III of this Form 10-K or any amendment to this Form 10-K.
¨
Indicate by check mark whether the registrant is a large accelerated filer, an accelerated filer, a non-accelerated filer or a smaller reporting company. See definition of “large accelerated filer,” “accelerated filer” and “smaller reporting company” in Rule 12b-2 of the Exchange Act.
|
Large accelerated filer
|
¨
|
Accelerated filer
|
x
|
|
Non-accelerated filer
|
¨
|
Smaller Reporting Company
|
x
|
|
Emerging growth company
|
¨
|
||
If an emerging growth company, indicate by check mark if the registrant has elected not to use the extended transition period for complying with any new or revised financial accounting standards provided pursuant to Section 13(a) of the Exchange Act.
¨
Indicate by check mark whether the registrant is a shell company (as defined in Rule 12b-2 of the Act.)
¨
Yes
x
No
The aggregate market value of the voting stock held by non-affiliates of the registrant was approximately
$181.9 million
based on the last reported bid price of the Common Stock on the NASDAQ Global Market on
June 30, 2018
. The number of shares outstanding of the registrant’s Common Stock, par value $0.001 per share, as of
March 8, 2019
was
18,514,078
.
Indicate the number of shares outstanding of each of the registrant’s classes of common stock, as of the latest practicable date.
Documents Incorporated By Reference
Portions of Part III of this Form 10-K are incorporated by reference from the Registrant's definitive proxy statement to be filed with the Securities and Exchange Commission no later than 120 days after the end of the Registrant's fiscal year.
1
ADVANCED EMISSIONS SOLUTIONS, INC.
ANNUAL REPORT ON FORM 10-K
FOR THE FISCAL YEAR ENDED DECEMBER 31,
2018
TABLE OF CONTENTS
|
Page
|
||||
PART I
Item 1. Business
General
ADA-ES, Inc. (“ADA”), a Colorado corporation, was incorporated in 1997. Pursuant to an Agreement and Plan of Merger ("Reorganization"), effective July 1, 2013, Advanced Emissions Solutions, Inc. (“ADES”), a Delaware company incorporated in 2011, replaced ADA as the publicly-held corporation and ADA became a wholly-owned subsidiary of ADES. ADES’s common stock became listed on the NASDAQ Global Market under the symbol, "ADES." ADA’s stock ceased trading on the NASDAQ Capital Market on July 1, 2013. This Annual Report on Form 10-K is referred to as the "Form 10-K" or the "Report." As used in this Report, the terms the "Company," "we," "us" and "our" means ADES and its consolidated subsidiaries.
We provide environmental solutions to customers in coal-fired power generation, municipal water and other industries primarily through emissions and water purification control technologies of our subsidiaries and joint ventures. Our proprietary technologies and associated product offerings provide pollutant control solutions to enable coal-fired power generators, municipal water and industrials to meet applicable regulations.
As of December 31, 2018 and 2017, we held equity interests of 42.50% and 50.00% in Tinuum Group, LLC ("Tinuum Group") and Tinuum Services, LLC ("Tinuum Services"), respectively, and each of their operations significantly impacted our financial position and results of operations for the years ended December 31, 2018, 2017 and 2016. We account for Tinuum Group and Tinuum Services under the equity method of accounting.
We operate two segments: Refined Coal (“RC”) and Power Generation and Industrials (“PGI”) (f/k/a "Emissions Control" or "EC"). The segments are discussed in more detail later under this Item 1. Our products are currently used for the removal of mercury and other air pollutants and for the purification of water.
Carbon Solutions Acquisition
On December 7, 2018 (the "Acquisition Date"), ADES entered into the Purchase and Sale Agreement (the "Purchase Agreement") pursuant to which the Company agreed to purchase from Energy Capital Partners I, LP, Energy Capital Partners I-A, LP, Energy Capital Partners I-B IP, LP, Energy Capital Partners I (Crowfoot IP), LP, and Carbon Solutions Management, LLC 100% of the membership interests of ADA Carbon Solutions, LLC ("Carbon Solutions") for a total purchase price of
$75.0 million
(the "Carbon Solutions Acquisition") plus transaction fees of
$4.5 million
. The fair value of the purchase consideration ("Purchase Consideration") was
$66.5 million
and consisted of cash consideration of
$65.8 million
and an additional purchase adjustment amount payable to Carbon Solutions' secured lender of
$0.7 million
. The Company acquired Carbon Solutions to enter into the broader activated carbon market and to expand the Company's product offerings within the mercury control industry and other complementary activated carbon markets. Carbon Solutions owns and operates an activated carbon manufacturing and processing facility and owns an associated lignite mine, which supplies the raw material for the powdered activated carbon plant (“Five Forks Mine”).
The Company primarily funded the cash consideration in the Carbon Solutions Acquisition from a
$70.0 million
senior term loan facility, less original issue discount of
$2.1 million
(the "Senior Term Loan"), which is detailed below in Item 7 - Management's Discussion and Analysis of Financial Condition and Results of Operations ("Item 7").
Markets
Activated carbon ("AC") is a specialized sorbent material that is used widely in a host of industrial and consumer applications to remove impurities, contaminants or pollutants from gas, water and other product or waste streams. ACs are prepared by thermally and/or chemically treating carbonaceous raw materials, including wood, coal, nut shells, resins and petroleum pitch. They are engineered specifically to meet the end-use application. Properties, such as pore and surface features, can be modified to be highly selective to targeted contaminants. The form of the AC, whether as a powdered activated carbon ("PAC"), granular activated carbon ("GAC"), pellets, honeycombs, blocks or cloths, also is important for the application.
Key markets include removal of heavy metal pollutants from coal-burning electrical generation processes, treatment of drinking and waste waters, industrial acid gas and odor removal, automotive gasoline emission control, soil and ground water remediation and food and beverage process and product purifications.
The AC market has been and is expected to continue to be driven by environmental regulations, principally water and air purification, especially in the mature and more industrialized areas of the world. Additionally, we believe environmental issues will continue to be the predominant force in the AC markets of rapidly developing countries.
3
Power Generation and Industrials
We expect the share of coal-fired power generation as a percentage of U.S. electricity generation to be more stable compared to previous years when many coal-fired generating units were shut down in response to low gas prices and increasingly stringent environmental regulations. Further, we believe that coal-fired power generation will remain a significant component of the U.S. power generation mix for many years, given coal's abundance, affordability, reliability and availability as a domestic fuel source. In 2018, the Energy Information Administration ("EIA") estimates coal made up 28% of the U.S. electricity generation. In its Annual Energy Outlook for 2019, the EIA projects that coal will provide approximately 17% of U.S. electricity generation in 2050. The primary drivers for many of our products and services are environmental laws and regulations impacting the electric power generation industry and other coal users. These regulations include the Mercury and Air Toxics Standards ("MATS"), a U.S. federal regulation requiring all existing and any new coal-fired electricity generating units to control mercury emissions, acid gases, and particulate matter, as well as various state regulations and permitting requirements for coal-fired electricity generating units. In addition to the federal MATS rule, many states have their own mercury rules that are similar to, or more stringent than, MATS, and many coal-fired electricity generating units around the country have agreed to consent decrees, which require pollution controls that, in some cases, are more restrictive than the existing regulations. We continue to believe the MATS regulation as well as certain state regulations creates a market for our RC and PGI products.
In general, coal is a low cost, stable and reliable source of domestic energy that, unlike many other forms of energy, can be easily stored in large quantities. We believe coal is critical to ensuring the U.S. has a secure and stable source of energy.
While the long-term future for coal as a fuel source for electricity generation is uncertain, and as coal assets continue to age, we expect a continued purchasing trend towards variable cost products and integrated solutions with low capital expenditure requirements and a move away from large capital equipment and other fixed cost solutions that are less likely to have costs recovered.
We believe it is likely that many U.S. coal mines, coal-fired electricity generating units, coal-centric large equipment providers and other coal-related businesses will have difficulty adapting to industry changes expected in the coming years. However, we see opportunities for companies that can offer their customers creative and cost-effective solutions that help U.S. coal-related businesses meet regulatory compliance, improve efficiency, lower costs and maintain reliability.
Water
AC, particularly PAC, has been used in the treatment of drinking water, wastewater, contaminated soil and groundwater to absorb compounds causing unpleasant taste and odor and other contaminants. Both industrial and municipal wastewater treatment plants consume AC in their processes.
Groundwater contamination has become a matter of increasing concern to federal and state governments as well as to the public, especially within the last 10 years. The U.S may see significant growth from water purification markets, especially if future regulations are passed controlling certain chemicals in drinking water. At present, individual states are primarily responsible for the protection of groundwater. Worldwide, water treatment accounts for 41% of the total consumption of AC, and continues to be the largest application for AC.
We see opportunities in the water market for our products that will provide cost-effective solutions to help industrial and municipal wastewater treatment plants meet water purification standards.
Segments
Refined Coal
Tinuum Group, an unconsolidated entity, provides reduction of mercury and nitrogen oxide ("NO
X
")
emissions at select coal-fired power generators through the production and sale of Refined Coal ("RC") that qualifies for tax credits under the Internal Revenue Code ("IRC")
Section 45 - Production Tax Credit
("Section 45 tax credits"). We benefit from Tinuum Group's production and sale of RC, which generates tax credits, as well as the revenue from selling or leasing RC facilities to tax equity investors. See the separately filed financial statements of Tinuum Group included in Item 15 - "Exhibits, Financial Statement Schedules" ("Item 15") of this Report.
Products
Our patented CyClean
TM
("CyClean") technology, a pre-combustion coal treatment process provides electric power generators the ability to enhance combustion and reduce emissions of nitrogen oxides ("NO
X
") and mercury from coals burned in cyclone boilers.
Our patented M-45
TM
and M-45-PC
TM
technologies (collectively, the "M-45 Technology") are proprietary pre-combustion coal treatment technologies used to control emissions from circulating fluidized bed boilers and pulverized coal boilers, respectively.
4
Sales and Customers
Our RC segment derives its earnings from equity method investments as well as royalty payment streams and other revenues related to reduced emissions of both NO
X
and mercury from coal treated with our proprietary chemicals and burned at coal-fired electricity generating units. Our equity method investments in the RC segment include Tinuum Group, Tinuum Services and GWN Manager, LLC.
As of December 31, 2018, Tinuum Group has built and placed into service a total of 28 RC facilities designed to produce RC for sale to coal-fired electricity generating units. Coal-fired electricity generating units use RC as one of a portfolio of tools to help comply with MATS and other environmental regulations. These RC facilities produce and sell RC that qualifies for Section 45 tax credits, including meeting the "placed in service" requirements (referred to as "placed in service"). The IRS has issued guidance regarding emissions reductions in the production of electricity by coal-fired electric generating units, including measurement and certification criteria necessary to qualify for the Section 45 tax credits. The ability to produce and sell RC, which generates Section 45 tax credits, expires 10 years after each RC facility was placed in service, but not later than December 31, 2021. Two of Tinuum Group's RC facilities were placed in service in 2009 and related Section 45 tax credits for these facilities expire in December 2019. The Section 45 tax credits related to the remaining RC facilities expire in 2021.
Once an RC facility is in operation, Tinuum Group may lease or sell it to a tax equity investor, which we refer to as an "invested" RC facility. The tax equity investor subsequently operates the RC facility to produce and sell RC to a utility. It is financially advantageous for Tinuum Group to lease or sell an RC facility as the tax equity investor assumes the operating expenses for the RC facility and remits to Tinuum Group either payments to purchase or lease payments to lease the RC facility. We benefit from equity income and cash distributions through our investment in Tinuum Group. Tax equity investors may benefit from their investment in RC facilities through the realization of tax assets and credits from the production and sale of RC.
RC facilities that are producing and selling RC and have not been leased or sold, are referred to as "retained" RC facilities, whereby the RC is produced and sold by Tinuum Group and, as an owner, we benefit from the related Section 45 tax benefits. As of
December 31, 2018
and
2017
, respectively, the Section 45 tax credits were $7.03 and $6.91 per ton of RC produced and sold to a utility. The value of the Section 45 tax credits is adjusted annually based on inflation adjustment factors published in the Federal Register. As of
December 31, 2018
, we have received, but have not been able to fully utilize, substantial tax credits and benefits from certain retained RC facilities that previously produced and sold RC for the benefit of Tinuum Group. See
Note 13
to our Consolidated Financial Statements included in Item 8 - "Financial Statements and Supplementary Data" ("Item 8") of this Report for additional information regarding our net operating losses, tax credits and other deferred tax assets.
As of
December 31, 2018
, Tinuum Group had 19 invested RC facilities producing RC at utility sites. The remaining 9 RC facilities, although placed in service, were either installed but not operating, awaiting site selection or in various other stages of contract negotiation or permanent installation.
Tinuum Services operates and maintains RC facilities under operating and maintenance agreements with Tinuum Group and owners or lessees of RC facilities. Tinuum Group or the owners or lessees of the RC facilities pay Tinuum Services, subject to certain limitations, the costs of operating and maintaining the RC facilities plus various fees. Tinuum Services also arranges for the purchase and delivery of certain chemical additives under chemical agency agreements, which include the chemicals required for our CyClean, and M-45 Technologies that are necessary for the production of RC. The term of each chemical agency agreement runs concurrently with the respective RC facility's operating and maintenance agreement.
We also earn royalty revenues from the licensing of our M-45 Technology ("M-45 License") to Tinuum Group. License royalties are recognized based upon a percentage of the per-ton, pre-tax margin as defined in the M-45 License.
The following table provides summary information related to the Company's investment in Tinuum Group and the related RC facilities as of
December 31, 2018
and tons of RC produced and sold for the year ended December 31, 2018:
|
Operating
|
||||||||||||
|
# of RC Facilities
|
Not Operating
|
Invested
|
Retained
|
|||||||||
|
RC Facilities
|
28
|
|
9
|
|
19
|
|
(1)
|
—
|
|
|||
|
RC tons produced and sold (000's)
|
59,737
|
|
2,302
|
|
||||||||
(1) One RC facility is approximately 50% invested with an independent third party. The remaining approximate 50% is retained by Tinuum Group, the Company and another member of Tinuum Group.
5
Competition
We believe Chem-Mod, LLC ("Chem-Mod") and licensees of the Chem-Mod technology are Tinuum Group's principal competitors. Competition within the RC market is based primarily on price, the number of tons of coal burned at the coal-fired electric generating unit where the RC facilities are operating and the tax compliance facts associated with each RC facility. Additionally, competition for tax equity investors extends into other investment opportunities, including opportunities related to potential tax incentive transactions.
Raw Materials
The principal raw materials used in our RC products are comprised of non-bromine based halogens.
Operations
Tinuum RC facilities are located at coal-fired power plants in the U.S. As of
December 31, 2018
, Tinuum Group and Tinuum Services had operations in 13 and 11 states, respectively.
Power Generation and Industrials
Products
Our products provide mercury control and other air and water contaminants control to coal-fired power generators and other industrial companies. Most of the North American coal-fired power generators have installed equipment to control air pollutants, like mercury, over the last several years. However, many power generators need consumable products on a recurring basis to chemically and physically capture mercury and other contaminants. There are three primary consumable products, working in conjunction with the installed equipment, to control mercury: PAC, coal additives and scrubber additives. In many cases these three consumable products can be used together or in many circumstances substituted for each other. However, activated carbon is typically the most efficient and effective way to capture mercury and currently accounts for over 50% of the mercury control consumables North American market. We offer all three mercury control solutions and continually work with customers to implement the most effective and efficient consumables solutions that fit with their unique operating and pollutions control configuration.
Power generators must stay in compliance with the various regulatory emissions requirements. As such, we believe power generators’ top priority is to find a vendor that can consistently and reliably provide a consumables solution. However, as the market has matured since 2016 and coal-fired power continues to be under pricing pressure from natural gas, wind and solar, cost of compliance is also important. Our current products and services provide solutions across the entire spectrum of coal-fired power generators' needs.
Historically, our PGI segment included revenues and related expenses from the sale of activated carbon injection ("ACI") and dry sorbent injection ("DSI") equipment systems, consulting services and other sales related to the reduction of emissions in the coal-fired electricity generation process and the electric utility industry. Demand for ACI and DSI system contracts historically was driven by coal-fired power plants that needed to comply with MATS and Maximum Achievable Control Technology ("MACT") Standards. As the deadline for these standards has passed, and customers have now implemented ACI, DSI and other large equipment systems as a component of their strategies to comply with applicable regulations, we do not anticipate entering into future long-term fixed price contracts for ACI or DSI systems. However, we may continue to provide smaller scale equipment products or other consulting services that may be needed by coal-fired electricity generating units, industrial broiler or other power generation units as part of their ongoing operations.
Sales and Customers
Sales of AC and chemical technologies are made by the Company’s employees and through distributors and sales representatives to coal-fired utilities and industrials. Some of our sales of AC are made under annual requirements-based contracts or longer-term agreements.
Competition
Our primary competitors for PAC products include Cabot Norit America, Inc., a division of Cabot Corporation (CBT), Calgon Carbon, a subsidiary of Tokyo Stock Exchange listed Kuraray Co., Ltd., Nalco Holding Company, a subsidiary of Ecolab Inc. (ECL) and Midwest Energy Emissions Corp (MEEC).
Raw Materials
The principal raw material we use in the manufacturing of AC is lignite coal, which is, in general, readily available and we believe we have an adequate supply. We own a lignite mine, which is operated by Demery Resources Company, LLC, a subsidiary of the North American Coal Company, that supplies lignite to our AC plant.
6
We purchase our proprietary chemicals through negotiated blending contracts that include confidentiality agreements with chemical suppliers. These arrangements attempt to assure continuous supply of our proprietary chemical blends. The manufacturing of our chemical products is dependent upon certain discrete chemicals that are subject to price fluctuations and supply constraints. In addition, the number of chemical suppliers who provide the necessary additives needed to manufacture our proprietary chemicals is limited. Supply agreements are generally renewed on an annual basis.
Operations
We own and operate an AC plant that is located in Louisiana. We also have sales, product development and administrative operations located in Colorado.
Revenue by Type
The following table shows the amount of total revenue by type:
|
Years Ended December 31,
|
||||||||
|
(in thousands)
|
2018
|
2017
|
||||||
|
Revenues:
|
||||||||
|
Consumables
|
$
|
8,733
|
|
$
|
4,246
|
|
||
|
License royalties, related party
|
15,140
|
|
9,672
|
|
||||
|
Equipment sales
|
72
|
|
31,446
|
|
||||
|
Total revenues
|
$
|
23,945
|
|
$
|
45,364
|
|
||
Legislation and Environmental Regulations
Our products and services, as well as Tinuum Group’s production and sale of RC, are for the reduction of pollutants and other contaminants in the coal-burning electrical generation and water treatment processes. To the extent that legislation and regulation limit the amount of pollutants and other contaminants permitted, the need for our products increases. Below is a summary of the primary legislation and regulation that affects the market for our products.
U.S. Federal Mercury and Air Toxic Standards (“MATS”) Affecting Electric Utility Steam Generating Units
On December 16, 2011, the U.S. Environmental Protection Agency ("EPA") issued the final "MATS Rule" that went into effect in April 2012. The EPA structured the MATS Rule as a MACT-based hazardous pollutant regulation applicable to coal and oil-fired Electric Utility Steam Generating Units (“EGU”), which generate electricity through steam turbines and have a capacity of 25 megawatts or greater, and provide for, among other provisions, control of mercury and particulate matter and control of acid gases such as hydrochloric acid ("HCl"), sulfuric acid ("H2SO4") and other Hazardous Air Pollutants ("HAPs"). Approximately 1,260 units were coal-fired EGUs. According to our estimates, the MATS Rule sets a limit that we believe requires the capture of up to 80-90% of the mercury in the coal burned in electric power generation boilers as measured at the exhaust stack outlet for most plants. The MACT standards are also known as National Emission Standards for Hazardous Air Pollutants ("NESHAP"). Plants generally had four years to comply with the MATS Rule, and we estimate that, based on data reported to the EPA and conversations with plant operators, most plants were required to comply by April 2016 and implementation of the MATS Rule is now largely complete. We estimate that 48% of the coal-fired EGUs that were operating in December 2011 when the MATS rule was finalized have been permanently shut down, leaving approximately 642 EGUs in operation at the end of 2018.
In April 2017, a review by the U.S. Court of Appeals for the D.C. Circuit of a 2016 “supplemental finding” associated with the cost benefit analysis of the MATS Rule conducted by the EPA was stayed at the request of the current Administration. The court case continues to be stayed indefinitely. In February 2019, the EPA published a reconsideration of its 2016 "supplemental finding" associated with the cost benefit analysis of the MATS Rule. This reconsideration proposes that it is not 'appropriate or necessary' to regulate HAPs emissions from coal- and oil-filed EGUs. However, the EPA expressly states that the reconsideration is not removing coal- and oil-fired EGUs from the list of sources that must comply with the MATS rule, but does, in the reconsideration, solicit comments on whether the EPA has the authority to remove coal- and oil-fired EGUs from the list of sources that must comply with the MATS Rule or whether it can rescind the MATS Rule.
State Mercury and Air Toxics Regulations Affecting EGUs
In addition, certain states have their own mercury rules that are similar to or more stringent than the MATS Rule, and coal-fired electricity generating units in the U.S are subject to consent decrees that require the control of acid gases and particulate matter, in addition to mercury emissions.
7
Effluent Limitation Guidelines
On September 30, 2015, the EPA set the first federal limits on the levels of toxic metals in wastewater that can be discharged from power plants. The final rule requires, among other things, zero discharge for fly ash transport water, and limits on mercury, arsenic, selenium, and nitrate from flue gas desulfurization ("FGD") wastewater (also known as "legacy wastewater"). In April 2017 the EPA Administrator announced his decision to reconsider the Effluent Limitations Guidelines ("ELG") Rule, and the U.S. Court of Appeals Fifth Circuit granted the motion to reconsider and placed the case in abeyance, which delayed the earliest compliance date from November 2018 to November 2020. In September 2017, the EPA indicated that plants would not need to comply before November 2020, with a possible extension of up to five years with state approval. Although halogens are not directly regulated in the effluent guidelines, some halogens may impact the effectiveness of biological wastewater treatment systems that are often used for the removal of selenium. We are evaluating whether the potential market opportunity supports our development of new products to help plants comply with these rules, as well as how these rules may affect our current product offerings.
Additional U.S. Legislation and Regulations
On August 3, 2015, the EPA finalized rules to reduce greenhouse gases ("GHGs") in the form of the Clean Power Plan ("CPP"), which established guidelines for states to follow in developing plans to reduce GHG emissions. Under the CPP, states are required to prepare State Implementation Plans to meet state targets established based on emission reductions from affected sources. The CPP requires that the Best System of Emission Reduction ("BSER") be implemented and establishes three building blocks that include heat rate improvements at affected coal-fired electric generating units, substituting coal-fired generation with less carbon-intensive EGUs such as natural gas combined cycle plants, and substituting renewable generation. The CPP has been challenged by multiple states in the U.S. Court of Appeals for the District of Columbia Circuit ("DC Circuit"). The CPP is currently stayed by the Supreme Court, and a panel of 10 judges on the DC Circuit are reviewing the CPP following a hearing in September 2016. On October 10, 2017, the EPA announced a proposal to repeal the CPP. The DC Circuit has been holding CPP litigation in abeyance since April 28, 2017.
Anti-Dumping
Regulators in the U.S. have imposed an anti-dumping duty on Chinese steam activated carbon products. In 2018, this anti-dumping duty was extended for an additional five-years. The International Trade Administration, a part of the U.S. Commerce Department, reviews the amount of the anti-dumping duty on an annual basis.
International Regulations
There are various international regulations related to mercury control. In Canada, the Canada-Wide Standard ("CWS") was initially implemented in 2010, with increasingly stringent limits through 2020 and with varying mercury emissions caps for each province. China and Germany both have limits for mercury emissions that are less stringent than U.S. limits and are typically met using co-benefits from other installed air pollution control equipment designed to control other pollutants. In May 2017, the EU ratified the Minimata Convention on Mercury, triggering mercury control regulations with implementation starting in 2021. Specific emissions limits are currently being developed guided by the best available technologies reference ("BREF") document for limiting stack emissions and liquid effluents from industrial processes. The BREF conclusions for large coal-fired electricity generating units were adopted by the European Commission in July 2017.
Based upon the existing and potential regulations, we believe the international market for mercury control products may expand in the coming years, and we are positioning our patent portfolio and existing commercial products accordingly to be prepared if an international market for our products develops.
Patents
As of
December 31, 2018
, we held
53
U.S. patents and
seven
international patents that were issued or allowed,
27
additional U.S. provisional patents or applications that were pending, and
seven
international patent applications that were either pending or filed relating to different aspects of our technology. Our existing patents generally have terms of
20
years from the date of filing, with our next patents expiring beginning in 2021. We consider many of our patents and pending patents to be critical to the ongoing conduct of our business.
Seasonality of Activities
The sale of our consumable products and RC facility operation levels depends on the operations of the coal-fired electricity generating units to which the applicable consumables are provided and the location of the RC facilities, respectively. Power generation is weather dependent, with electricity and steam production varying in response to heating and cooling needs. Additionally, coal-fired electricity generating units routinely schedule maintenance outages in the spring and/or fall depending
8
upon the operation of the boilers. During the period in which an outage may occur, which may range from one week to over a month, no consumables are used or RC produced and sold, and our revenues may be correspondingly reduced.
The sale of our activated carbon products for water purification depends on demand from municipal water treatment facilities where these products are utilized. Depending on weather conditions and other environmental factors the summer months historically have the highest demand for powdered AC, as one of the major uses for powdered AC is for the treatment of taste and odor problems caused by increased degradation of organic contaminants and natural materials in water during the summer.
Safety, Health and Environment
Our operations are subject to numerous federal, state, and local laws, regulations, rules and ordinances relating to safety, health, and environmental matters (“SH&E Regulations”). These SH&E Regulations include requirements to maintain and comply with various environmental permits related to the operation of many of our facilities, including mine health and safety laws required for continued operation of the Five Forks Mine.
Dependence on Major Customers
We depend on our customer relationships with owners and operators of coal-fired power electricity generating units and industrial companies as well as general market demand for coal-fueled power generation. Additional information related to major customers is disclosed in
Note 15
of the Consolidated Financial Statements included in Item 8 of this Report.
Through our investment in Tinuum Group, we depend on our relationships with owners and operators of coal-fired power generation facilities, including various electric utilities and tax equity investors. Tinuum Group is the exclusive licensee for purposes of producing RC using the CyClean
and M-45 Technologies. Tinuum Group depends on tax equity investors, with significant concentration within affiliates of The Goldman Sachs Group, Inc. These investors could renegotiate or terminate their leases, or the utilities where the RC facilities are installed could materially reduce their use of RC.
Employees
As of
December 31, 2018
, we employed
128
full-time and part-time personnel;
45
employees were employed at our offices in Colorado and
83
employees were employed at our facilities in Louisiana.
Available Information
Our periodic and current reports are filed with the Securities and Exchange Commission ("SEC') pursuant to Section 13(a) of the Securities Exchange Act of 1934, as amended (the "Exchange Act") and are available free of charge within 24 hours after they are filed with, or furnished to, the SEC at the Company’s website at
www.advancedemissionssolutions.com
. The filings are also available through the SEC at the SEC's Public Reference Room at 100 F Street, N.E., Washington, D.C. 20549 or by calling 1-800-SEC-0330. Alternatively, these reports can be accessed at the SEC’s website at www.sec.gov. The information contained on our web site shall not be deemed incorporated by reference in any filing under the Securities Act of 1933, as amended (the "Securities Act") or the Exchange Act.
Copies of Corporate Governance Documents
The following Company corporate governance documents are available free of charge at our website at
www.advancedemissionssolutions.com
and such information is available in print to any stockholder who requests it by contacting the Secretary of the Company at
640 Plaza Drive, Suite 270, Highlands Ranch CO, 80129
.
|
•
|
Certificate of Incorporation
|
|
•
|
Bylaws
|
|
•
|
Code of Ethics and Business Conduct
|
|
•
|
Insider Trading Policy
|
|
•
|
Whistleblower Protection Policy
|
|
•
|
Board of Directors Responsibilities
|
|
•
|
Audit Committee Charter
|
|
•
|
Compensation Committee Charter
|
|
•
|
Nominating and Governance Committee Charter
|
9
Forward-Looking Statements Found in this Report
This Report contains forward-looking statements within the meaning of Section 27A of the Securities Act and Section 21E of the Exchange Act that involve risks and uncertainties. In particular such forward-looking statements are found in this Part I and under the heading in Part II, Item 7 below. Words or phrases such as "anticipates," "believes," "expects," "intends," "plans," "estimates," "predicts," the negative expressions of such words, or similar expressions are used in this Report to identify forward-looking statements, and such forward-looking statements include, but are not limited to, statements or expectations regarding:
|
(a)
|
the scope and impact of mercury and other regulations or pollution control requirements, including the impact of the final MATS;
|
|
(b)
|
the production and sale of RC that the RC facilities will qualify for Section 45 tax credits;
|
|
(c)
|
expected growth or contraction in and potential size of our target markets;
|
|
(d)
|
expected supply and demand for our products and services;
|
|
(e)
|
increasing competition in the emission control market;
|
|
(f)
|
future level of research and development activities;
|
|
(g)
|
the effectiveness of our technologies and the benefits they provide;
|
|
(h)
|
Tinuum Group’s ability to profitably sell and/or lease additional RC facilities and/or RC facilities that may be returned to Tinuum Group, or recognize the tax benefits from production and sale of RC on retained RC facilities;
|
|
(i)
|
probability of any loss occurring with respect to certain guarantees made by Tinuum Group ("Party Guarantees");
|
|
(j)
|
the timing of awards of, and work and related testing under, our contracts and agreements and their value;
|
|
(k)
|
the timing and amounts of or changes in future revenues, royalties earned, backlog, funding for our business and projects, margins, expenses, earnings, tax rate, cash flow, royalty payment obligations, working capital, liquidity and other financial and accounting measures;
|
|
(l)
|
the outcome of current and pending legal proceedings;
|
|
(m)
|
awards of patents designed to protect our proprietary technologies both in the U.S. and other countries; and
|
|
(n)
|
whether any legal challenges or EPA actions will have a material impact on the implementation of the MATS or other regulations and on our ongoing business.
|
Our expectations are based on certain assumptions, including without limitation, that:
|
(a)
|
coal will continue to be a major source of fuel for electrical generation in the U.S.;
|
|
(b)
|
the IRS will allow the production and sale of RC to qualify for Section 45 tax credits;
|
|
(c)
|
we will continue as a key supplier of consumables to the coal-fired power generation industry as it seeks to implement reduction of mercury emissions;
|
|
(d)
|
current environmental laws and regulations requiring reduction of mercury from coal-fired boiler flue gases will not be materially weakened or repealed by courts or legislation in the future;
|
|
(e)
|
we will be able to obtain adequate capital and personnel resources to meet our operating needs and to fund anticipated growth and our indemnity obligations;
|
|
(f)
|
we will be able to establish and retain key business relationships with current and other companies;
|
|
(g)
|
orders we anticipate receiving will be received;
|
|
(h)
|
we will be able to formulate new consumables that will be useful to, and accepted by, the power generation and industrial business;
|
|
(i)
|
we will be able to effectively compete against others;
|
|
(j)
|
we will be able to meet any technical requirements of projects we undertake;
|
|
(k)
|
Tinuum Group will be able to sell or lease additional RC facilities, including RC facilities that may be returned to Tinuum Group, to third party investors; and
|
|
(l)
|
we will be able to utilize our portion of the Section 45 tax credits generated by production and sale of RC from retained facilities.
|
10
The forward-looking statements included in this Report involve risks and uncertainties. Actual events or results could differ materially from those discussed in the forward-looking statements as a result of various factors including, but not limited to, timing of new and pending regulations and any legal challenges to or extensions of compliance dates of them; the U.S. government’s failure to promulgate regulations or appropriate funds that benefit our business; changes in laws and regulations, accounting rules, prices, economic conditions and market demand; impact of competition; availability, cost of and demand for alternative energy sources and other technologies; technical, start up and operational difficulties; failure of the RC facilities to produce RC; termination of or amendments to the contracts for sale or lease of RC facilities; decreases in the production of RC; our inability to commercialize our technologies on favorable terms; our inability to ramp up our operations to effectively address recent and expected growth in our business; loss of key personnel; potential claims from any terminated employees, customers or vendors; availability of materials and equipment for our businesses; intellectual property infringement claims from third parties; pending litigation; as well as other factors relating to our business, as described in our filings with the SEC, with particular emphasis on the risk factor disclosures contained in those filings and in Item 1A - "Risk Factors" of this Report. You are cautioned not to place undue reliance on the forward-looking statements made in this Report and to consult filings we have made and will make with the SEC for additional discussion concerning risks and uncertainties that may apply to our business and the ownership of our securities. The forward-looking statements contained in this Report are presented as of the date hereof, and we disclaim any duty to update such statements unless required by law to do so.
11
Item 1A. Risk Factors
The following risks relate to us as of the date this Report is filed with the SEC. This list of risks is not intended to be exhaustive, but reflects what we believe are the material risks inherent in our business and the ownership of our securities as of the specified dates. A statement to the effect that the occurrence of a specified event may have a negative impact on our business, results of operations, profitability, financial condition, or the like, is intended to reflect the fact that such an event would be likely to have a negative impact on your investment in ADES, but should not imply the likelihood of the occurrence of such specified event. The order in which the following risk factors are presented is not intended as an indication of the relative seriousness of any given risk.
Risks relating to our business
Demand for our products and services depends significantly on environmental laws and regulations. Uncertainty as to the future of such laws and regulations, as well as changes to such laws and regulations, or granting of extensions of compliance deadlines has had, and will likely continue to have a material effect on our business.
A significant market driver for our existing products and services, and those planned in the future, are present and expected environmental laws and regulations, particularly those addressing the reduction of mercury and other emissions from coal-fired electricity generating units. If such laws and regulations are delayed, or are not enacted or are repealed or amended to be less strict, or include prolonged phase-in periods, or are not enforced, our business would be adversely affected by declining demand for such products and services. For example:
|
•
|
The implementation of environmental regulations regarding certain pollution control and permitting requirements has been delayed from time to time due to various lawsuits. The uncertainty created by litigation and reconsiderations of rule-making by the EPA has negatively impacted our business, results of operations and financial condition and will likely continue to do so.
|
|
•
|
To the extent federal, state, and local legislation mandating that electric power generating companies serving a state or region purchase a minimum amount of power from renewable energy sources such as wind, hydroelectric, solar and geothermal, and such amount lessens demand for electricity from coal-fired plants, the demand for our products and services would likely decrease.
|
Federal, state, and international laws or regulations addressing emissions from coal-fired electricity generating units, climate change or other actions to limit emissions, including public opposition to new coal-fired electricity generating units, has caused and could continue to cause electricity generators to transition from coal to other fuel and power sources, such as natural gas, nuclear, wind, hydroelectric and solar. The potential financial impact on us of future laws or regulations or public pressure will depend upon the degree to which electricity generators diminish their reliance on coal as a fuel source. That, in turn, will depend on a number of factors, including the specific requirements imposed by any such laws or regulations, the periods over which those laws or regulations are or will be phased in, the amount of public opposition, and the state and cost of commercial development of related technologies and processes. In addition, Public Utility Commissions ("PUCs") may not allow utilities to charge consumers for, and pass on the cost of, emissions control technologies without federal or state mandate. We cannot reasonably predict the impact that any such future laws or regulations or public opposition may have on our results of operations, financial condition or cash flows.
Action by the EPA related to MATS that decreases demand for our mercury removal products could have a material adverse effect on our PGI segment.
Growth in our PGI segment depends on stable demand for mercury removal related product, which is largely dependent on the amount of coal-based power generation used in the U.S. and the continued regulation of utilities under MATS. In August 2018, the EPA announced that it intends to reconsider the MATS rule and in September 2018 submitted its proposal to the White House Office of Management and Budget. In February 2019, the EPA published a reconsideration of its 2016 "supplemental finding" associated with the cost benefit analysis of the MATS Rule. This reconsideration proposes that it is not 'appropriate or necessary' to regulate HAPs emissions from coal- and oil-filed EGUs. However, the EPA expressly states that the reconsideration is not removing coal- and oil-fired EGUs from the list of sources that must comply with the MATS rule, but does, in the reconsideration, solicit comments on whether the EPA has the authority to remove coal- and oil-fired EGUs from the list of sources that must comply with the MATS Rule or whether it can rescind the MATS Rule. Any final action taken by the EPA related to MATS that decreases demand for our products for mercury removal will have a negative effect on the financial results of our PGI segment.
12
The failure of tariffs placed on U.S. imports of Chinese activated carbon to adequately address the impact of low-priced imports from China could have a material adverse effect on the competitiveness and financial performance of our PGI segment.
Our PGI segment faces competition in the U.S. from low-priced imports of activated carbon products. If the amounts of these low-priced imports increase, especially if they are sold at less than fair value, our sales of competing products could decline, which could have an adverse effect on the earnings of our PGI segment. In addition, sales of these low-priced imports may negatively impact our pricing. To limit these activities, regulators in the U.S. have enacted an anti-dumping duty order on steam activated carbon products from China. In 2018, the order was extended for an additional five years. The amount of anti-dumping duties collected on imports of steam activated carbon from China is reviewed annually by the U.S. Department of Commerce. To the extent the anti-dumping margins do not adequately address the degree to which imports are unfairly traded, the anti-dumping order may be less effective in reducing the volume of these low-priced activated carbon imports in the U.S., which could negatively affect demand and/or pricing for our AC products.
The market for consumables and other products that provide pollutant reduction is highly competitive and some of our competitors are significantly larger and more established than we are, which could adversely impede our growth opportunities and financial results.
We operate in a highly competitive marketplace. Our ability to compete successfully depends in part upon our ability to maintain a cost of production advantage, competitive technological capabilities and to continue to identify, develop and commercialize new and innovative products for existing and future customers. Increased competition from existing or newly developed products offered by our competitors or companies whose products offer a similar functionality as our products and could be substituted for our products, may negatively affect demand for our products. In addition, market competition could negatively impact our ability to maintain or raise prices or maintain or grow our market position.
We compete against certain significantly larger and/or more established companies in the market for consumables and other products that provide mercury emissions reduction and water treatment.
Reduction of coal consumption by U.S. electricity power generators could result in less demand for our products and services. If utilities significantly reduce the number of coal-fired electricity generating units or the amount of coal burned, without a corresponding increase in the services required at the remaining units, this could reduce our revenues and materially and adversely affect our business, financial condition and results of operations.
The amount of coal consumed for U.S. electricity power generation is affected by, among other things, (1) the location, availability, quality and price of alternative energy sources for power generation, such as natural gas, fuel oil, nuclear, hydroelectric, wind, biomass and solar power; and (2) technological developments, including those related to competing alternative energy sources.
Natural gas-fueled generation has been displacing and may continue to displace coal-fueled generation, particularly from older, less efficient coal-powered generators. We expect that many of the new power plants needed to meet increasing demand for electricity generation will be fueled by natural gas because the price of natural gas has remained at relatively low levels after a period of sharp decline, and use of natural gas is perceived as having a lower environmental impact than burning coal. Natural gas-fired plants are cheaper to construct, and permits to construct these plants are easier to obtain, and ongoing costs of natural gas-fired plants associated with meeting environmental compliance are lower. Possible advances in technologies and incentives, such as tax credits, to enhance the economics of renewable energy sources could make those sources more competitive with coal. Any reduction in the amount of coal consumed by domestic electricity power generators, whether as a result of new power plants utilizing alternative energy sources or as a result of technological advances, could reduce the demand for our current products and services, thereby reducing our revenues and materially and adversely affecting our business and results of operations.
Additionally, long-term changes in environmental regulation that threaten or preclude the use of coal or other fossil fuels as a primary fuel source for electricity production, and result in the reduction or closure of a significant number of coal-fired electric generating units, may adversely affect our business, financial condition and results of operations.
We face operational risks inherent in mining operations and our mining operations have the potential to cause safety issues, including those that could result in significant personal injury.
We own a lignite coal mine located in Louisiana that is operated for us by Demery Resources Company, LLC. Mining operations by their nature involve a high level of uncertainty and are often affected by risks and hazards outside of our control.
13
At our lignite mine, the risks are primarily operational risks associated with the maintenance and operation of the heavy equipment required to dig and haul the lignite, and risks relating to lower than expected lignite quality or recovery rates. The failure to adequately manage these risks could result in significant personal injury, loss of life, damage to mineral properties, production facilities or mining equipment, damage to the environment, delays in or reduced production, and potential legal liabilities.
Our operations and products are subject to extensive safety, health and environmental requirements that could increase our costs and/or impair our ability to manufacture and sell certain products.
Our ongoing operations are subject to extensive federal, state and local laws, regulations, rules and ordinances relating to safety, health and environmental matters, many of which provide for substantial monetary fines and criminal sanctions for violations. These include requirements to obtain and comply with various environmental-related permits for constructing any new facilities and operating all of our existing facilities. In addition, our AC manufacturing facility may become subject to greenhouse gas emission trading schemes under which we may be required to purchase emission credits if our emission levels exceed our allocations. Greenhouse gas regulatory programs that have been adopted, such as cap-and-trade programs, have not had a significant impact on our business to date. Costs of complying with regulations could increase as concerns related to greenhouse gases and climate change continue to emerge. The enactment of new environmental laws and regulations and/or the more aggressive interpretation of existing requirements could require us to incur significant costs for compliance or capital improvements or limit our current or planned operations, any of which could have a material adverse effect on our earnings or cash flow. We attempt to offset the effects of these compliance costs through price increases, productivity improvements and cost reduction efforts, and our success in offsetting any such increased regulatory costs is largely influenced by competitive and economic conditions and could vary significantly depending on the segment served. Such increases may not be accepted by our customers, may not be sufficient to compensate for increased regulatory costs or may decrease demand for our products and our volume of sales.
If we are unable to timely and successfully integrate the Carbon Solutions Acquisition, our future financial performance may suffer and we may fail to realize all of the anticipated benefits of the transaction.
We acquired Carbon Solutions primarily to expand our market share in the mercury emissions control market, as well as to gain access to the water treatment market through Carbon Solutions' specific products for this market. Our future growth may depend in part on our ability to successfully integrate Carbon Solutions into our business and we cannot guarantee that we will successfully integrate Carbon Solutions into our existing operations, or that we will achieve the desired profitability and anticipated results from the Carbon Solutions Acquisition. Failure to achieve such planned results could adversely affect our operations and cash available to make debt principal and interest payments, dividends and stock repurchases.
The Carbon Solutions Acquisition presents potential risks to us, including:
|
•
|
operating a significantly larger combined organization and integrating additional operations into ours;
|
|
•
|
difficulties in the assimilation of the assets and operations of Carbon Solutions;
|
|
•
|
the loss of customers or key employees from Carbon Solutions;
|
|
•
|
the diversion of management’s attention from other existing business concerns;
|
|
•
|
the failure to realize expected synergies and cost savings;
|
|
•
|
coordinating geographically disparate organizations, systems and facilities;
|
|
•
|
integrating personnel from diverse business backgrounds and organizational cultures; and
|
|
•
|
consolidating corporate and administrative functions.
|
We may make future acquisitions or form partnerships and joint ventures that may involve numerous risks that could impact our financial condition, results of operations and cash flows.
Our strategy may include expanding our scope of products and services organically or through selective acquisitions, investments or creating partnerships and joint ventures. We have acquired, and may selectively acquire, other businesses, product or service lines, assets or technologies that are complementary to our business. We may be unable to find or consummate future acquisitions at acceptable prices and terms, or we may be unable to integrate existing or future acquisitions effectively and efficiently and may need to divest those acquisitions. We continually evaluate potential acquisition opportunities in the ordinary course of business. Acquisitions involve numerous risks, including among others:
14
|
•
|
our evaluation of the synergies and/or long-term benefits of an acquired business;
|
|
•
|
integration difficulties, including challenges and costs associated with implementing systems and processes to comply with requirements of being part of a publicly-traded company;
|
|
•
|
diverting management’s attention;
|
|
•
|
litigation arising from acquisition activity;
|
|
•
|
potential increased debt leverage;
|
|
•
|
potential issuance of dilutive equity securities;
|
|
•
|
entering markets in which we have no or limited direct prior experience and where competitors in such markets have stronger market positions;
|
|
•
|
unanticipated costs and exposure to undisclosed or unforeseen liabilities or operating challenges;
|
|
•
|
potential goodwill or other intangible asset impairments;
|
|
•
|
potential loss of key employees and customers of the acquired businesses, product or service lines, assets or technologies;
|
|
•
|
our ability to properly establish and maintain effective internal controls over an acquired company; and
|
|
•
|
increasing demands on our operational and IT systems.
|
The success of acquisitions of businesses, new technologies and products, or arrangements with third parties is not always predictable and we may not be successful in realizing our objectives as anticipated. The Senior Term Loan and Line of Credit contain certain covenants that limit, or that may have the effect of limiting, among other things, the payment of dividends, acquisitions, capital expenditures, the sale of assets and the incurrence of additional indebtedness.
Information technology vulnerabilities and cyberattacks on our networks could have a material adverse impact on our business.
We rely upon information technology ("IT") to manage and conduct business, both internally and externally, with our customers, suppliers and other third parties. Internet transactions involve the transmission and storage of data including, in certain instances, customer and supplier business information. Therefore, maintaining the security of computers and other electronic devices, computer networks and data storage resources is a critical issue for us and our customers and suppliers because security breaches could result in reduced or lost ability to carry on our business and loss of and/or unauthorized access to confidential information. We have limited personnel and other resources to address information technology reliability and security of our computer networks and to respond to known security incidents to minimize potential adverse impact. Experienced hackers, cybercriminals and perpetrators of threats may be able to penetrate our network security and misappropriate or compromise our confidential information or that of third parties, create system disruptions or cause shutdowns. These perpetrators of cyberattacks also may be able to develop and deploy viruses, worms, malware and other malicious software programs that attack our information and networks or otherwise exploit any security vulnerabilities of our information and networks. Techniques used to obtain unauthorized access to or sabotage systems change frequently and often are not recognized until long after being launched against a target, and we may be unable to anticipate these techniques or to implement adequate preventative measures. A breach of our IT systems and security measures as a result of third-party action, malware, employee error, malfeasance or otherwise could materially adversely impact our business and results of operations and expose us to customer, supplier and other third-party liabilities.
Natural disasters could affect our operations and financial results.
We operate facilities that are exposed to natural hazards, such as floods, windstorms and hurricanes. Extreme weather events present physical risks that may become more frequent as a result of factors related to climate change. Such events could disrupt our supply of raw materials or otherwise affect production, transportation and delivery of our products or affect demand for our products.
15
Risks relating to Refined Coal
The ability of Tinuum Group to generate revenues from the sale or lease of RC facilities to tax equity investors is not assured, and the inability to sell, lease or operate RC facilities to produce and sell RC and generate Section 45 production tax credits could adversely affect our future growth and profitability.
Tinuum Group is attempting to sell or lease its remaining RC facilities to third-party investors. The inability of Tinuum Group to successfully lease or sell additional RC facilities to third-party tax equity investors, who may receive the benefit of the Section 45 tax credits that are expected to be generated from those RC facilities, as well as RC facilities that may be returned to Tinuum Group over time, would likely have an adverse effect on our future growth and profitability.
Furthermore, if, in the future, electricity power generators decide to limit coal-fired generation for economic reasons and/or do not burn and use RC and instead switch to another power or fuel source, Tinuum Group would likely be unable to fully produce and sell the RC and the associated Section 45 production tax credits potentially available from RC facilities over the anticipated term of the Section 45 tax credit program.
The ability to generate Section 45 tax credits from existing operating RC facilities ends in 2021, which could eliminate the desire for investors to further lease RC facilities beyond this date, which would effectively eliminate Tinuum Group’s and Tinuum Services' operations and significantly impact our financial condition and results of operations beyond 2021.
A substantial amount of our earnings and cash flows in
2018
and
2017
are comprised of equity method earnings and license royalties generated from Tinuum Group’s invested RC facilities. For the year ended
December 31, 2018
, our RC segment generated segment operating income of
$65.5 million
. As of
December 31, 2018
, Tinuum Group has
19
invested facilities and zero retained facilities. Of the
19
invested facilities, one is currently generating Section 45 tax credits that will no longer generate Section 45 tax credits beyond 2019 and the remaining 18 are generating Section 45 tax credits that will no longer generate Section 45 tax credits beyond 2021. As a result, we believe that substantially all of the invested RC facilities will be returned to Tinuum Group upon the expiration of the Section 45 tax credit program. If Tinuum Group elects to continue operating these RC facilities, their earnings will be significantly reduced and accordingly, our pro rata share will also be substantially reduced.
Additionally, our RC segment is the largest of our segments and the remainder of our business must grow substantially, either organically or acquisitively, in order to replace earnings from Tinuum Group that will substantially end during the 2020 to 2022-time frame. There can be no assurance that we will be able to increase our PGI segment earnings during this time frame to cover our current operating expenses or to provide a return to shareholders that is comparable to the return currently provided by our RC segment. If we are not able to cover operating expenses, we could be forced to raise additional capital, significantly reduce our operating expenses or take other alternative actions.
The 2017 Tax Act introduced changes in income tax rates and other specific provisions that may make Section 45 production tax credits less attractive, which, in turn, could adversely affect our results of operations or financial condition.
On December 22, 2017, the Tax Cuts and Jobs Act of 2017 (the “2017 Tax Act”) became law. The 2017 Tax Act, among other things, lowered the federal income tax rate on corporations from 35% to 21%, effective for the year beginning January 1, 2018 and created certain new tax provisions, including the Base Erosion and Anti-Abuse tax (“BEAT”). In December 2018, the U.S. Treasury Department released proposed regulations addressing BEAT. The regulations are proposed to apply retroactively to tax years beginning after December 31, 2017. The changes to previously higher tax rates and provisions such as BEAT could negatively impact tax capacity of current or potential tax equity investors and result in Section 45 production tax credits being less attractive.
Presently, a group of related tax equity investors accounts for a substantial portion of our earnings from Tinuum Group and any lease renegotiation or termination by these investors or any failure to continue to produce and sell RC at the related investors' RC facilities would have a material adverse effect on our business.
As of
December 31, 2018
,
11
of Tinuum Group’s
28
RC facilities are leased to various affiliated entities. Significant components of our total cash flows come from Tinuum Group's distributions relating to payments received under these leases. These leases have an initial fixed period and then automatically renew, unless terminated at the option of the lessee, for successive one-year terms through 2019 or 2021. If these affiliated entities renegotiate or terminate their leases, or if the utilities where the RC facilities are installed materially reduce their use of RC, these events would have a material adverse
16
effect on our business, results of operations or financial condition. Certain of these affiliated entities have amended their leases from time to time, with some of the amended leases including less favorable terms to Tinuum Group.
Our RC businesses are joint ventures and managed under operating agreements where we do not have sole control of the decision making process, and we cannot mandate decisions or ensure outcomes.
We oversee our joint ventures under the terms of their respective operating agreements by participating in the following activities: (1) representation on the respective governing boards of directors, (2) regular oversight of financial and operational performance and controls and establishing audit and reporting requirements, (3) hiring of management personnel, (4) technical support of RC facilities, and (5) other regular and routine involvement with our joint venture partners. Notwithstanding this regular participation and oversight, our joint venture partners also participate in the management of these businesses and they may have business or economic interests that divert their attention from the joint venture, or they may prefer to operate the business, make decisions or invest resources in a manner that is contrary to our preferences. Since material business decisions must be made jointly with our joint venture partners, we cannot mandate decisions or ensure outcomes.
The financial effects of Tinuum Group providing indemnification under performance guarantees of its RC facilities are largely unknown and could adversely affect our financial condition.
Tinuum Group indemnifies certain utilities and lessees of RC facilities for particular risks associated with the operations of those facilities. We have provided limited, joint and several guarantees of Tinuum Group’s obligations under those leases. Any substantial payments made under such guarantees could have a material adverse effect on our financial condition, results of operations and cash flows.
Risks related to intellectual property
Failure to protect our intellectual property or infringement of our intellectual property by a third party could have an adverse impact on our financial condition.
We rely on a combination of patent, copyright and trademark laws, trade secrets, confidentiality procedures and contractual provisions to protect our proprietary rights. Such means of protecting our proprietary rights may not be adequate because they provide only limited protection or such protection may be prohibitively expensive to enforce. We also enter into confidentiality and non-disclosure agreements with our employees, consultants, and many of our customers and vendors, and generally control access to and distribution of our proprietary information. Notwithstanding these measures, a third party could copy or otherwise obtain and use our proprietary information without authorization. We cannot provide assurance that the steps we have taken will prevent misappropriation of our technology and intellectual property, which could negatively impact our business and financial condition. In addition, such actions by third parties could divert the attention of our management from the operation of our business.
We may be subject to intellectual property infringement claims from third parties that are costly to defend and that may limit our ability to use the disputed technologies.
If our technologies are alleged to infringe the intellectual property rights of others, we may be prevented from marketing and selling existing products or services and from pursuing research, development or commercialization of new or complimentary products or services. Further, we may be required to obtain licenses to third-party intellectual property, or be forced to develop or obtain alternative technologies. Our failure to obtain a license to a technology that we may require, or the need to develop or obtain alternative technologies, could significantly and negatively affect our business.
Indemnification of third-party licensees of our technologies against intellectual property infringement claims concerning our licensed technology and our products could be financially significant to us.
We have agreed to indemnify licensees of our technologies (including Tinuum Group) and purchasers of our products and we may enter into additional agreements with others under which we agree to indemnify and hold them harmless from losses they may incur as a result of the infringement of third-party rights caused by the use of our technologies and products. Infringement claims, which are expensive and time-consuming to defend, could have a material adverse effect on our business, operating results and financial condition, even if we are successful in defending ourselves (and the indemnified parties) against them.
17
Our future success depends in part on our ongoing identification and development of intellectual property and our ability to invest in and deploy new products, services and technologies into the marketplace efficiently and cost effectively.
The process of identifying customer needs and developing and enhancing products, services and solutions for our business segments is complex, costly and uncertain. Any failure by us to identify and anticipate changing needs, emerging trends and new regulations could significantly harm our future market share and results of operations.
Risk related to tax matters
An “ownership change” could limit our ability to utilize tax loss and credit carryforwards to offset future taxable income.
We have certain general business credit tax credits (“Tax Attributes”). As of
December 31, 2018
, we had
$104.6 million
of Tax Attributes, equaling
87%
of our total gross deferred tax assets. Our ability to use these Tax Attributes to offset future taxable income may be significantly limited if we experience an “ownership change” as discussed below. Under the Internal Revenue Code ("IRC') and regulations promulgated by the U.S. Treasury Department, we may carry forward or otherwise utilize the Tax Attributes in certain circumstances to offset any current and future taxable income and thus reduce our federal income tax liability, subject to certain requirements and restrictions. To the extent that the Tax Attributes do not otherwise become limited, we believe that we will have available a significant amount of Tax Attributes in future years, and therefore the Tax Attributes could be a substantial asset to us. However, if we experience an “ownership change,” as defined in Section 382 of the IRC, our ability to use the Tax Attributes may be substantially limited, and the timing of the usage of the Tax Attributes could be substantially delayed, which could therefore significantly impair the value of that asset.
In general, an “ownership change” under Section 382 occurs if the percentage of stock owned by an entity’s 5% stockholders (as defined for tax purposes) increases by more than 50 percentage points over a rolling three-year period. An entity that experiences an ownership change generally will be subject to an annual limitation on its pre-ownership change tax loss and credit carryforwards equal to the equity value of the entity immediately before the ownership change, multiplied by the long-term, tax-exempt rate posted monthly by the IRS (subject to certain adjustments). The annual limitation would be increased each year to the extent that there is an unused limitation in a prior year. The limitation on our ability to utilize the Tax Attributes arising from an ownership change under Section 382 of the IRC would depend on the value of our equity at the time of any ownership change. If we were to experience an “ownership change,” it is possible that a significant portion of our tax loss and credit carryforwards could expire before we would be able to use them to offset future taxable income.
On May 5, 2017, our Board of Directors (the "Board") approved the Tax Asset Protection Plan (the “Protection Plan”) and declared a dividend of one preferred share purchase right (each, a “Right”) for each outstanding share of our common stock. The Protection Plan was adopted in an effort to protect stockholder value by attempting to diminish the risk that our ability to use the Tax Attributes to reduce potential future federal income tax obligations may become substantially limited.
On April 6, 2018, the Board approved the First Amendment to the Tax Asset Protection Plan (the "Amendment") that amends the Protection Plan dated May 5, 2017. The Amendment amends the definition of "Final Expiration Date" under the Protection Plan to extend its duration and makes associated changes in connection therewith. At the Company's 2018 annual meeting, the Company's stockholders approved the Amendment, thus the Final Expiration Date will be the close of business on December 31, 2019.
The Protection Plan, as amended, is intended to act as a deterrent to any person acquiring beneficial ownership of 4.99% or more of our outstanding common stock without the approval of the Board. Stockholders who beneficially owned 4.99% or more of our outstanding common stock upon execution of the Plan will not trigger the Protection Plan so long as they do not acquire beneficial ownership of additional shares of our common stock. The Board may, in its sole discretion, also exempt any person from triggering the Protection Plan.
Risks relating to our common stock
Our stock price is subject to volatility.
The market price of our common stock has experienced substantial price volatility in the past and may continue to do so. The market price of our common stock may continue to be affected by numerous factors, including:
|
•
|
actual or anticipated fluctuations in our operating results and financial condition;
|
|
•
|
changes in laws or regulations and court rulings and trends in our industry;
|
18
|
•
|
Tinuum Group’s ability to lease or sell RC facilities;
|
|
•
|
announcements of sales awards;
|
|
•
|
changes in supply and demand of components and materials;
|
|
•
|
adoption of new tax regulations or accounting standards affecting our industry;
|
|
•
|
changes in financial estimates by securities analysts;
|
|
•
|
perceptions of the value of corporate transactions;
|
|
•
|
our ability to continue to be able to pay cash dividends;
|
|
•
|
the number of shares of common stock repurchased under stock repurchase programs; and
|
|
•
|
the degree of trading liquidity in our common stock and general market conditions.
|
From January 1, 2017 to
December 31, 2018
, the closing price of our common stock ranged from
$6.98
to
$12.08
per share. In June 2017, we commenced a quarterly cash dividend program and have paid out cash dividends in each succeeding quarter through
December 31, 2018
. In 2017 and 2018, we executed stock repurchases in various forms that included a modified Dutch Auction tender offer in May 2017 and two stock repurchase programs in December 2017 and October 2018. During 2017 and 2018, we repurchased a total of
4,064,188
shares of our common stock for cash of
$41.7 million
.
Stock price volatility over a given period may cause the average price at which we repurchase shares of our common stock to exceed the stock’s price at a given point in time. We believe our stock price should reflect expectations of future growth and profitability. Future dividends are subject to declaration by the Board, and under our current stock repurchase program, we are not obligated to acquire any specific number of shares. If we fail to meet expectations related to future growth, profitability, dividends, stock repurchases or other market expectations, our stock price may decline significantly, which could have a material adverse impact on our ability to obtain additional capital, investor confidence and employee retention, and could reduce the liquidity of our common stock.
There can be no assurance that we will continue to declare cash dividends at all or in any particular amounts.
The Board first approved a $0.25 per share of common stock quarterly dividend in June 2017. During 2017 and 2018, we declared quarterly dividends in the aggregate amount of
$36.1 million
. We intend to continue to pay quarterly dividends subject to capital availability, compliance with debt covenants and periodic determinations by the Board that cash dividends are in the best interest of our stockholders and are in compliance with all laws and agreements applicable to the declaration and payment of cash dividends by us.
The payment of future dividends may also be affected by, among other factors, compliance with debt covenants, our views on potential future capital requirements for investments in acquisitions; legal risks; stock repurchase programs; changes in federal and state income tax laws or corporate laws; changes to our business model; and our increased interest and principal payments required by the Senior Term Loan and any additional indebtedness that we may incur in the future.
Under covenants in the Senior Term Loan, annual collective dividends and repurchases of our common stock in the aggregate may not exceed $30 million, and shall be permitted so long as (a) no default or event of default exists under the Senior Term Loan and (b) expected future net cash flows from the refined coal business as of the end of the most recent fiscal quarter exceed $100 million. Based on our current forecasts, we anticipate that future net cash flows from the refined coal business will be below the $100 million minimum requirement as of the third fiscal quarter of 2020, which would preclude us from paying dividends or repurchasing our common stock at that time.
Our dividend payments may change from time to time, and we cannot provide assurance that we will continue to declare dividends at all or in any particular amounts. A reduction in our dividend payments could have a negative effect on our stock price.
Our certificate of incorporation and bylaws contain provisions that may delay or prevent an otherwise beneficial takeover attempt of us.
Certain provisions of our certificate of incorporation and bylaws could make it more difficult for a third party to acquire us, even if doing so would be beneficial to our stockholders. These include provisions that:
|
•
|
Limit the business at special meetings to the purpose stated in the notice of the meeting;
|
19
|
•
|
Authorize the issuance of “blank check” preferred stock, which is preferred stock with voting or other rights or preferences that could impede a takeover attempt and that the Board can create and issue without prior stockholder approval;
|
|
•
|
Establish advance notice requirements for submitting nominations for election to the Board and for proposing matters that can be acted upon by stockholders at a meeting; and
|
|
•
|
Require the affirmative vote of the "disinterested" holders of a majority of our common stock to approve certain business combinations involving an "interested stockholder" or its affiliates, unless either minimum price criteria or procedural requirements are met, or the transaction is approved by a majority of our "continuing directors" (known as "fair price provisions").
|
These provisions, alone or in combination with each other, may discourage transactions involving actual or potential changes of control, including transactions that otherwise could involve payment of a premium over prevailing market prices to holders of our common stock, or could limit the ability of our stockholders to approve transactions that they may deem to be in their best interest.
We may require additional funding for our growth plans, and such funding may require us to issue additional shares of our common stock, resulting in a dilution of your investment.
We estimate our funding requirements in order to implement our growth plans. If the funding requirements required to implement growth plans should exceed these estimates significantly or if we come across opportunities to grow through expansion plans which cannot be predicted at this time, and our funds generated from our operations prove insufficient for such purposes, we may need to raise additional funds to meet these funding requirements.
These additional funds may be raised by issuing equity or debt securities or by borrowing from banks or other resources. We cannot assure you that we will be able to obtain any additional financing on terms that are acceptable to us, or at all. If we fail to obtain additional financing on terms that are acceptable to us, we will not be able to implement such plans fully. Such financing even if obtained, may be accompanied by conditions that limit our ability to pay dividends or require us to seek lenders’ consent for payment of dividends, or restrict our freedom to operate our business by requiring lender’s consent for certain corporate actions. Further, if we raise additional funds through the issuance of new shares of our common stock, any shareholders who are unable or unwilling to participate in such an additional round of fund raising may suffer dilution of their investment.
Item 1B. Unresolved Staff Comments
None.
Item 2. Properties
Offices and Facilities
We lease office space in Highlands Ranch, Colorado for our corporate headquarters. Also in Colorado, we lease additional office, warehouse and laboratory space. Total combined leased space for these facilities is approximately 32,000 square feet. We also lease or own manufacturing, storage and distribution facilities in Louisiana. The manufacturing plant sits on approximately 59 acres and the remaining facilities are comprised of a total of approximately 310,000 square feet.
Mining
As of
December 31, 2018
, we owned or controlled, primarily through long-term leases, approximately 1,750 acres of coal land for surface mining located in the Gulf Coast Lignite Region, in Natchitoches Parish, Louisiana ("Five Forks"). The majority of the Five Forks land is leased for mineral rights and right-of-use purposes that expire at varying dates over the next 30 years and contain options to renew. The remaining land is owned by us.
Under our current mining plans, substantially all leased reserves will be mined out within the period of existing leases or within the time period of assured lease renewals. Royalties are paid to lessors either as a fixed price per ton or as a percentage of the gross sales price of the mined coal. The majority of the significant leases are on a percentage royalty basis. In some cases, a payment is required, payable either at the time of execution of the lease or in annual installments. In most cases, the prepaid royalty amount is applied to reduce future production royalties.
On October 31, 2018, the SEC issued new rules for disclosures under this Item for mining registrants. These rules amend Item 102 of Regulation S-K under the Securities Act and the Exchange Act and rescind Industry Guide 7 to direct mining registrants, and create a new subpart of Regulation S-K, which contains all of the requirements for property disclosures by mining
20
registrants from and after January 1, 2021 (the "Mining Disclosures"). The Mining Disclosures became effective on February 25, 2019 and allow mining registrants a transition period through January 1, 2021 to comply. We have elected to adopt the Mining Disclosures effective February 25, 2019 and are subject to the requirements effective with this Report. Based on the materiality and the vertically-integrated company guidelines contained in the Mining Disclosures, we have concluded that no additional disclosures related to our mining operations are required under this Item.
Item 3. Legal Proceedings
From time to time, we are involved in various litigation matters arising in the ordinary course of our business. Information with respect to this item may be found in
Note 8
“Commitments and Contingencies” to the consolidated financial statements included in Item 8 of this Report.
Item 4. Mine Safety Disclosures
The statement concerning mine safety violations or other regulatory matters required by Section 1503(a) of the Dodd-Frank Wall Street Reform and Consumer Protection Act and Item 104 of Regulation S-K is included in Exhibit 95 to this Report.
21
PART II
Item 5. Market for Registrant’s Common Equity, Related Stockholder Matters and Issuer Purchases of Equity Securities
Market for Our Common Stock
As of
December 31, 2018
, our common stock was quoted on the
NASDAQ Global Market
under the symbol "ADES." The trading volume for our common stock is relatively limited. There is no assurance that an active trading market will provide adequate liquidity for our existing stockholders or for persons who may acquire our common stock in the future.
Dividends
In June 2017, we commenced a quarterly cash dividend program of $0.25 per common share. Our ability to pay dividends in the future will be dependent upon earnings, financial condition, compliance with loan covenants and other factors considered relevant by the Board and will be subject to limitations imposed under Delaware law.
We intend to continue to declare and pay a cash dividend on shares of our common stock on a quarterly basis. Whether we do, however, and the timing and amounts of dividends will be subject to approval and declaration by the Board and will depend on a variety of factors including, but not limited to, our financial results, cash requirements, financial condition, compliance with loan covenants and other contractual restrictions and other factors considered relevant by the Board.
Performance Graph
The following performance graph illustrates a five-year comparison of cumulative total return of our common stock, the Russell 3000 Index and a select industry peer group ("Peer Group") for the period beginning on December 31, 2013 and ending on
December 31, 2018
. The graph assumes an investment of $100 on December 31, 2013 and assumes the reinvestment of all dividends.
The performance graph is not intended to be indicative of future performance. The performance graph shall not be deemed "soliciting material" or to be "filed" with the SEC for purposes of Section 18 of the Exchange Act, or otherwise subject to the liabilities under that Section, and shall not be deemed to be incorporated by reference into any of the Company’s filings under the Securities Act or the Exchange Act.
22
Five Year Cumulative Total Shareholder Return Comparison
Advanced Emissions Solutions Return Relative to the Russell 3000 Index and Select Industry Peer Group
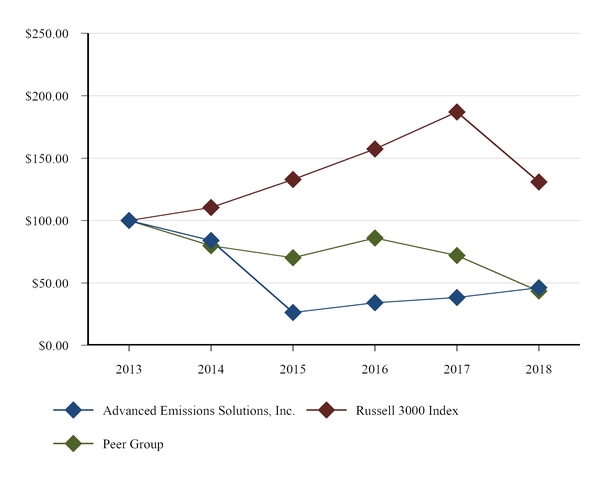
The select industry Peer group includes the following: American Vanguard Corp., Calgon Carbon Corporation, CECO Environmental Corp., Clean Energy Fuels Corp., FutureFuel Corp., Fuel-Tech, Inc., Flotek Industries Inc., Hawkins Inc., KMG Chemicals Inc., Lydall Inc., Rentech, Inc., and TerraVia Holdings, Inc.
Holders
The number of holders of record of our common stock as of
March 8, 2019
was approximately
700
. The approximate number of beneficial stockholders is estimated at
4,600
.
Purchases of Equity Securities by the Company and Affiliated Purchasers
In November 2018, the Board authorized a program for us to repurchase up to $20.0 million of shares of our common stock through open market transactions at prevailing market prices. This stock repurchase program will remain in effect until December 31, 2019 unless otherwise modified by the Board. The following table summarizes the common stock repurchase activity for the three months ended
December 31, 2018
:
|
Period
|
(a) Total number of shares (or units) purchased
|
(b) Average price paid per share (or unit)
|
(c) Total number of shares (or units) purchased as part of publicly announced programs
|
(d) Maximum number (or approximate dollar value) of shares (or units) that may yet be purchased under the plans or programs (in thousands)
|
||||||||||
|
October 1 to 31, 2018
|
—
|
|
$
|
—
|
|
—
|
|
$
|
—
|
|
||||
|
November 1 to 30, 2018
|
145,688
|
|
10.13
|
|
145,688
|
|
—
|
|
||||||
|
December 1 to 31, 2018
|
(1)
|
1,193,104
|
|
10.34
|
|
1,193,104
|
|
5,826
|
|
|||||
|
Total
|
1,338,792
|
|
1,338,792
|
|
$
|
5,826
|
|
|||||||
(1) Included within this month, approximately 1,000,000 shares at a total price of $11.3 million were purchased in two blocks through privately negotiated transactions as part of this stock repurchase program.
23
Item 6. Selected Financial Data
Five-year Summary of Selected Financial Data
The following selected financial data are derived from the audited Consolidated Financial Statements for the years ended
December 31, 2018
,
2017
,
2016
,
2015
and
2014
and should be read in conjunction with Item 1A, Item 7 and our Consolidated Financial Statements and the related notes included in Item 8 of this Report.
|
Years Ended December 31,
|
||||||||||||||||||||
|
(in thousands, except per share amounts)
|
2018
|
2017
|
2016
|
2015
|
2014
|
|||||||||||||||
|
Statement of operations data:
|
|
|
|
|
|
|||||||||||||||
|
Revenues (1)
|
$
|
23,945
|
|
$
|
45,364
|
|
$
|
56,747
|
|
$
|
73,381
|
|
$
|
23,333
|
|
|||||
|
Earnings from equity method investments
|
$
|
54,208
|
|
$
|
53,843
|
|
$
|
45,584
|
|
$
|
8,921
|
|
$
|
42,712
|
|
|||||
|
Income tax expense (benefit) (2)
|
$
|
10,423
|
|
$
|
24,152
|
|
$
|
(60,938
|
)
|
$
|
20
|
|
$
|
296
|
|
|||||
|
Net income (loss) (1) (3) (4)
|
$
|
35,454
|
|
$
|
27,873
|
|
$
|
97,678
|
|
$
|
(30,141
|
)
|
$
|
1,387
|
|
|||||
|
Net income (loss), per common share, basic
|
$
|
1.78
|
|
$
|
1.30
|
|
$
|
4.40
|
|
$
|
(1.37
|
)
|
$
|
0.06
|
|
|||||
|
Net income (loss), per common share, diluted (5)
|
$
|
1.76
|
|
$
|
1.29
|
|
$
|
4.34
|
|
$
|
(1.37
|
)
|
$
|
0.06
|
|
|||||
|
Dividends declared per common share
|
$
|
1.00
|
|
$
|
0.75
|
|
$
|
—
|
|
$
|
—
|
|
$
|
—
|
|
|||||
|
|
As of December 31,
|
|||||||||||||||||||
|
(in thousands)
|
2018
|
2017
|
2016
|
2015
|
2014
|
|||||||||||||||
|
Balance sheet data:
|
|
|
|
|
|
|||||||||||||||
|
Total assets (1)
|
$
|
159,664
|
|
$
|
82,618
|
|
$
|
107,296
|
|
$
|
60,775
|
|
$
|
93,699
|
|
|||||
|
Total borrowings (6)
|
$
|
74,125
|
|
$
|
—
|
|
$
|
—
|
|
$
|
28,025
|
|
$
|
15,910
|
|
|||||
|
Stockholders’ equity (deficit) (1)
|
$
|
67,947
|
|
$
|
73,455
|
|
$
|
76,165
|
|
$
|
(24,978
|
)
|
$
|
(697
|
)
|
|||||
(1) On December 7, 2018, we completed the Carbon Solutions Acquisition. Carbon Solutions' operating results for the period from December 7 through
December 31, 2018
are reflected in our operating results for the year ended
December 31, 2018
. Carbon Solutions revenues and net loss for this period were
$5.6 million
and
$0.4 million
, respectively. Carbon Solutions' total assets and net assets as of
December 31, 2018
were
$86.3 million
and
$66.1 million
, respectively.
(2) During the year ended
December 31, 2018
, we increased the valuation allowance related to its deferred tax assets by
$4.5 million
, which contributed to total income tax expense during
2018
of
$10.4 million
. During 2017, we recorded income tax expense of
$24.2 million
, inclusive of the impact of the Tax Act, which increased income tax expense by
$5.8 million
. During the fourth quarter of 2016, we released $61.4 million of the valuation allowance related to the deferred tax assets, which resulted in an income tax benefit during 2016 of
$60.9 million
.
(3) During the years ended
December 31, 2018
, 2017, 2016 and 2015, we recorded restructuring charges of
$3.1 million
,
zero
, $1.6 million and $10.4 million, respectively. The restructuring charges were recorded in connection with a reduction in force, the departure of executive officers and management's further alignment of the business with strategic objectives.
(4) During the year ended December 31, 2017, we recognized certain Other income (expense) items, which included a gain of
$3.5 million
from a settlement agreement with a former third party service provider, a gain of
$3.3 million
from a settlement agreement of a royalty indemnity agreement, a charge of
$1.0 million
related to a Department of Labor investigation of our Profit Sharing Retirement Plan, and an impairment charge of
$0.5 million
of a cost method investment. During the year ended December 31, 2016, we recognized certain Other income (expense) items, which included a gain of
$2.1 million
from the sale of an equity method investment, a gain of
$1.0 million
from a settlement of a note payable and licensed technology and an impairment charge of
$1.8 million
of a cost method investment.
(5) For the year ended December 31, 2015, the computation of diluted net loss per common share was the same as basic net loss per common share as the inclusion of potentially dilutive securities for those years would have been anti-dilutive.
(6) On December 7, 2018, we entered into a senior term loan facility (the "Senior Term Loan") with a related party in the principal amount of
$70.0 million
, less original issue discount of
$2.1 million
. In addition, we also incurred debt issuance costs associated with the Senior Term Loan of
$2.0 million
. The Senior Term Loan was the primary funding source for the Carbon Solutions Acquisition.
The Notes to the Consolidated Financial Statements included in Item 8 of this Report contain additional information about charges resulting from other operating expenses and other income (expense) which affects the comparability of information presented.
24
Item 7. Management’s Discussion and Analysis of Financial Condition and Results of Operations
Overview
This Form 10-K for the year ended
December 31, 2018
is filed by Advanced Emissions Solutions, Inc. together with its consolidated subsidiaries (collectively, "ADES," the "Company," "we," "us," or "our" unless the context indicates otherwise).
We are a leader in emissions reductions technologies through consumables that utilize powdered activated carbon (“PAC”) and chemical based technologies, primarily serving the coal-fired power generation and industrial boiler industries. Our proprietary environmental technologies and specialty chemicals enable our customers to reduce emissions of mercury and other pollutants, maximize utilization levels and improve operating efficiencies to meet the challenges of existing and potential emissions control regulations. See further discussion of our business included in Item 1 -
"Business" ("Item 1") of this Report. Discussion regarding segment information is included within the discussion of our consolidated results under this Item 7. Additionally, discussion related to our reportable segments is included in Item 1 and
Note 14
of the Consolidated Financial Statements included in Item 8 of this Report.
On December 7, 2018 (the “Acquisition Date”), we acquired all of the outstanding equity interests (the "Carbon Solutions Acquisition”) of ADA Carbon Solutions, LLC (“CS” or “Carbon Solutions”). Carbon Solutions is an activated carbon company and the North American leader in mercury capture using powdered activated carbon for the coal-fired power plant, industrial and water treatment markets. Carbon Solutions owns and operates an activated carbon (“AC”) manufacturing and processing facility. It also owns an associated lignite mine that supplies the raw material for the powdered activated carbon plant (“Five Forks Mine”). Our operating results for 2018 include the operating results of Carbon Solutions for the period from December 7, 2018 to December 31, 2018.
On December 7, 2018, ADES and ADA-ES, Inc. ("ADA"), a wholly-owned subsidiary, and certain other subsidiaries of the Company as guarantors, The Bank of New York Mellon as administrative agent, and Apollo Credit Strategies Master Fund Ltd. and Apollo A-N Credit Fund (Delaware) L.P. (collectively "Apollo”), affiliates of a beneficial owner of greater than
five
percent of the Company's common stock and related parties, entered into the Term Loan and Security Agreement (the "Senior Term Loan") in the principal amount of
$70.0 million
, less original issue discount of
$2.1 million
. Proceeds from the Senior Term Loan were used to fund the Carbon Solutions Acquisition.
Components of Revenue, Expenses and Equity Method Investees
The following briefly describes the components of revenues and expenses as presented in the Consolidated Statements of Operations. Descriptions of the revenue recognition policies are included in
Note 1
to the Consolidated Financial Statements included in Item 8 of this Report.
Revenues and costs of revenue
Consumables
We sell PAC and proprietary chemical blends to coal-fired utilities and other industrial boilers that allow the respective utilities to comply with the regulatory emissions standards. Additionally, we also sell PAC to water treatment plants to remove contaminants from the water. Revenue is generally recorded upon delivery of our product.
Certain customer contracts are comprised of evaluation tests ("Evaluation Tests") of the Company's chemicals' effectiveness and efficiency in reducing emissions and entail the delivery of products to the customer and the Company evaluating results of emissions reduction over the term of the contract. The Company generally recognizes revenue from Evaluation Tests over the duration of the contract based on the cost of product consumed by the customer.
License royalties, related party
We license our M-45
TM
and M-45-PC
TM
emission control technologies ("M-45 License") to Tinuum Group and realize royalty income based upon a percentage of the per-ton, pre-tax margin as defined in the M-45 License.
Equipment sales
Equipment sales represent the sale of activated carbon injection ("ACI") systems to control mercury, dry sorbent injection ("DSI") systems to control sulfur dioxide (SO
2)
, sulfur trioxide (SO
3)
, and hydrogen chloride (HCl) and electrostatic precipitator ("ESP") liquid flue gas conditioning systems. Revenue from extended equipment contracts was recorded using the completed contract method of accounting.
We also may enter into other non-extended equipment contracts for which we generally recognize revenues on a time and material basis as services to build equipment systems are performed or as equipment is delivered.
25
Other Operating Expenses
Payroll and benefits
Payroll and benefits costs include personnel related fringe benefits, sales and administrative staff labor costs and stock compensation expenses. Payroll and benefits costs exclude direct labor included in Cost of revenue.
Rent and occupancy
Rent and occupancy costs include rent, insurance, and other occupancy-related expenses.
Legal and professional fees
Legal and professional costs include external legal, audit and consulting expenses.
General and administrative
General and administrative costs include director fees and expenses, bad debt expense, research and development expense and other general costs of conducting business. Research and development costs, net of reimbursements from cost-sharing arrangements, are charged to expense in the period incurred and are reported in the
General and administrative
line item in the
Consolidated Statements of Operations
.
Depreciation, amortization, depletion, and accretion
Depreciation and amortization expense consists of depreciation expense related to property, plant and equipment and the amortization of long-lived intangibles. Depletion and accretion expense consists of depletion expense related to the depletion of mine development costs and the accretion of a mine reclamation liability.
Other Income (Expense), net
Earnings from equity method investments
Earnings from equity method investments relates to our share of earnings (losses) related to our equity method investments.
Our equity method earnings in Tinuum Group, LLC ("Tinuum Group"), a related party in which we own a
42.5%
equity interest and a 50% voting interest, are positively impacted when Tinuum Group obtains an investor in a refined coal ("RC") facility and receives lease payments from the lessee, or purchase payments from the sale, of the RC facility. If Tinuum Group operates a retained RC facility, the Company's equity method earnings will be negatively impacted as operating retained RC facilities generate operating losses. However, we benefit on an after-tax basis if we are able to utilize tax credits associated with the production and sale of RC from operation of retained RC facilities by Tinuum Group. These benefits, if utilized, will increase our consolidated net income as a result of a reduction in income tax expense.
Tinuum Services, LLC ("Tinuum Services"), a related party in which we own both a 50% equity and voting interest, operates and maintains RC facilities under operating and maintenance agreements. Tinuum Group or the lessee/owner of the RC facilities pays Tinuum Services, subject to certain limitations, the costs of operating and maintaining the RC facilities plus certain fees. Tinuum Services also arranges for the purchase and delivery of certain chemical additives under chemical agency agreements necessary for the production of RC. Tinuum Services consolidates certain RC facilities leased or owned by tax equity investors that are deemed to be variable interest entities ("VIE's). All net income (loss) associated with these VIE's is allocated to the noncontrolling equity holders of Tinuum Services and therefore does not impact our equity earnings (loss) from Tinuum Services.
Other income (expense)
The remaining components of other income (expense) include interest income, interest expense and other miscellaneous items. For
2017
, miscellaneous items included an adjustment to a litigation loss accrual and changes in estimate related to royalty indemnity expense.
We record interest expense related to our Senior Term Loan and capital leases, as well as through our share of Tinuum Group's equity method earnings for RC facility leases or sales that are treated as installment sales for tax purposes. IRC Section 453A ("Section 453A") requires taxpayers using the installment method to pay an interest charge on the portion of the tax liability that is deferred under the installment method. We refer to this as "453A interest."
Results of Operations
For comparison purposes, the following tables set forth our results of operations for the years presented in the Consolidated Financial Statements included in Item 8 of this Report. The results for the year ended December 31, 2018 include the results of operations of Carbon Solutions from the Acquisition Date through December 31. The year-to-year comparison of financial results is not necessarily indicative of financial results that may be achieved in future years.
26
Year ended December 31, 2018
Compared to
Year ended December 31, 2017
Total Revenue and Cost of Revenue
A summary of the components of revenues and cost of revenue for the years ended
December 31, 2018
and
2017
is as follows:
|
Years Ended December 31,
|
Change
|
||||||||||||||
|
(
Amounts in thousands except percentages
)
|
2018
|
2017
|
($)
|
(%)
|
|||||||||||
|
Revenues:
|
|||||||||||||||
|
Consumables
|
$
|
8,733
|
|
$
|
4,246
|
|
$
|
4,487
|
|
106
|
%
|
||||
|
License royalties, related party
|
15,140
|
|
9,672
|
|
5,468
|
|
57
|
%
|
|||||||
|
Equipment sales
|
72
|
|
31,446
|
|
(31,374
|
)
|
(100
|
)%
|
|||||||
|
Total revenues
|
$
|
23,945
|
|
$
|
45,364
|
|
$
|
(21,419
|
)
|
(47
|
)%
|
||||
|
Operating expenses:
|
|||||||||||||||
|
Consumables cost of revenue, exclusive of depreciation and amortization
|
$
|
6,606
|
|
$
|
3,434
|
|
$
|
3,172
|
|
92
|
%
|
||||
|
Equipment cost of revenue, exclusive of depreciation and amortization
|
$
|
(353
|
)
|
$
|
28,451
|
|
$
|
(28,804
|
)
|
(101
|
)%
|
||||
Consumables
and consumables cost of revenue
For the years ended
December 31, 2018
and
2017
, consumables revenue
increased
year over year primarily due to the Carbon Solutions Acquisition on December 7, 2018. Carbon Solutions contributed consumables revenue of
$5.6 million
of the total consumables revenue for the
year ended December 31, 2018
. Excluding Carbon Solutions' consumables revenues, consumables revenues decreased year over year primarily due to a significant decrease in sales to two customers, partially offset by increased sales to new customers in
2018
. The total pounds of our chemicals sold decreased year over year and gross margins decreased year over year primarily due to ongoing price compression. During the
year ended December 31, 2018
, revenues from Evaluation Tests increased year over year primarily from two significant customer contracts that were completed in
2018
. Cost of consumables revenue for Carbon Solutions for 2018 was
$3.4 million
and excluding this amount cost of consumables revenue increased year over year. This increase was primarily due to significant costs incurred that exceeded revenues by $0.5 million on one of the Evaluation Test contracts, which was the primary negative impact on our overall consumables gross margin for
2018
.
Consumables cost of revenue will be negatively impacted in 2019 due to the amortization of a step-up in inventory fair value of approximately $5.0 million related to the Carbon Solutions Acquisition.
License royalties, related party
Royalty income increased in
2018
compared to
2017
primarily due to Tinuum Group obtaining tax equity investors for
two
incremental RC facilities during
2018
and to the full year of operations in
2018
of the four incremental RC facilities sold or leased to tax equity investors in
2017
, all of which use our M-45 License. The total facilities that use our M-45 License increased from
10
facilities in
2017
to
12
facilities in
2018
. The increase in facilities resulted in an increase in rental and sales payments to Tinuum Group and an increase in the related tons produced and sold subject to the M-45 License. During the years ended
December 31, 2018
and
2017
, there were
37.3 million
tons and
22.6 million
tons, respectively, of RC produced using the M-45 License.
Equipment sales
and Equipment sales cost of revenue
During the years ended
December 31, 2018
and
2017
, we did not enter into any long-term (6 months or longer) fixed price contracts to supply ACI systems. As of
December 31, 2017
, all ACI system contracts were completed. During the year ended
December 31, 2017
, we completed
four
ACI systems, recognizing revenues of
$3.4 million
and cost of revenue of
$2.4 million
.
During the years ended
December 31, 2018
and
2017
, we did not enter into any long term (6 months or longer) fixed price contracts to supply DSI systems. During the year ended
December 31, 2017
, we completed
five
DSI systems, recognizing revenues of
$27.8 million
and cost of revenue of
$26.0 million
. As of January 1, 2018, all revenues and costs of revenues were recognized on the three DSI system uncompleted contracts as of December 31, 2017 upon the adoption of the new revenue accounting standard,
ASC 606 - Revenue from Contracts with Customers
.
The remaining changes were due to other equipment sales.
Demand for ACI and DSI system contracts historically was driven by coal-fired power plant utilities that need to comply with Federal Mercury and Air Toxics Standards ("MATS") and Maximum Achievable Control Technology Standards ("MACT"). As
27
the deadline for these standards has passed, we do not expect to enter into any future long-term fixed price contracts for ACI and DSI systems.
Additional information related to revenue concentrations and contributions by class and reportable segment can be found within the segment discussion below and in
Note 6
and
Note 15
to the Consolidated Financial Statements included in Item 8 of this Report.
Other Operating Expenses
A summary of the components of our operating expenses, exclusive of cost of revenue items (presented above), for the years ended
December 31, 2018
and
2017
is as follows:
|
Years Ended December 31,
|
Change
|
||||||||||||||
|
(in thousands, except percentages)
|
2018
|
2017
|
($)
|
(%)
|
|||||||||||
|
Operating expenses:
|
|||||||||||||||
|
Payroll and benefits
|
$
|
10,639
|
|
$
|
7,669
|
|
$
|
2,970
|
|
39
|
%
|
||||
|
Rent and occupancy
|
1,141
|
|
795
|
|
346
|
|
44
|
%
|
|||||||
|
Legal and professional fees
|
8,230
|
|
4,354
|
|
3,876
|
|
89
|
%
|
|||||||
|
General and administrative
|
3,359
|
|
4,014
|
|
(655
|
)
|
(16
|
)%
|
|||||||
|
Depreciation, amortization, depletion, and accretion
|
723
|
|
789
|
|
(66
|
)
|
(8
|
)%
|
|||||||
|
$
|
24,092
|
|
$
|
17,621
|
|
$
|
6,471
|
|
37
|
%
|
|||||
Payroll and benefits
Payroll and benefits expenses
increased
in
2018
compared to
2017
primarily due to restructuring expenses in connection with the departure of certain executive officers and management's alignment of the business with strategic objectives during 2018, as well as the elimination of certain duplicative positions in connection with the Carbon Solutions Acquisition. During the year ended
December 31, 2018
, we recorded net restructuring charges of
$3.1 million
. As of December 31, 2018,
$2.2 million
of this expense remained accrued. Payment of accrued amounts is expected to occur during 2019 from cash on hand. There were no material restructuring expenses recorded in
2017
. Additionally, payroll-related expenses increased due to the increase in headcount of personnel from the Carbon Solutions Acquisition, which resulted in an increase in average headcount of
10%
for
2018
compared to
2017
. We expect an increase in future recurring payroll-related expense due to the Carbon Solutions Acquisition.
Rent and occupancy
Rent and occupancy expenses
increased
in
2018
compared to
2017
primarily due to lower rent and occupancy expense in
2017
as a result of the relocation of our corporate headquarters in the first quarter of
2017
and the acceleration of deferred rent and tenant improvement allowances recorded in
2017
associated with the termination of the lease agreement of our former corporate headquarters.
Legal and professional fees
Legal and professional fees expenses
increased
in
2018
compared to
2017
as a result of costs incurred related to the Carbon Solutions Acquisition of approximately
$4.5 million
as well as an increase in consulting fees related to ongoing clarification of federal income tax reform of
$0.5 million
. These costs were partially offset by a decrease in costs related to outsourced shared service costs, including legal and audit fees.
General and administrative
General and administrative expenses decreased in
2018
compared to
2017
primarily due to a $0.4 million reserve on an asset related to a letter of credit drawn by a former customer that was recorded during the year ended December 31, 2017. Additional decreases included a reduction in general operating expenses of approximately $0.4 million, which included decreases in outsourced IT costs and outside director expenses. Offsetting these decreases was an increase in bad debt expense incurred of $0.2 million.
Depreciation, amortization, depletion, and accretion
Depreciation and amortization expense
decreased
in
2018
compared to
2017
primarily due to higher depreciation recorded in 2017 related to the acceleration of depreciation on certain fixed assets that were disposed of in connection with our corporate office relocation, which was completed in the first quarter of
2017
. This decrease is offset by the addition of long-lived assets
28
acquired as part of the Carbon Solutions Acquisition, which contributed approximately $0.4 million of depreciation expense for the period between Acquisition Date and December 31, 2018.
Other Income (Expense), net
A summary of the components of our other income (expense), net for the years ended
December 31, 2018
and
2017
is as follows:
|
Years Ended December 31,
|
Change
|
||||||||||||||
|
(Amounts in thousands, except percentages)
|
2018
|
2017
|
($)
|
(%)
|
|||||||||||
|
Other income (expense):
|
|||||||||||||||
|
Earnings from equity method investments
|
$
|
54,208
|
|
$
|
53,843
|
|
$
|
365
|
|
1
|
%
|
||||
|
Interest income
|
239
|
|
54
|
|
185
|
|
343
|
%
|
|||||||
|
Interest expense
|
(2,151
|
)
|
(3,024
|
)
|
873
|
|
(29
|
)%
|
|||||||
|
Litigation settlement and royalty indemnity expense, net
|
—
|
|
3,269
|
|
(3,269
|
)
|
(100
|
)%
|
|||||||
|
Other
|
(19
|
)
|
2,025
|
|
(2,044
|
)
|
(101
|
)%
|
|||||||
|
Total other income
|
$
|
52,277
|
|
$
|
56,167
|
|
$
|
(3,890
|
)
|
(7
|
)%
|
||||
Earnings in equity method investments
The following table presents the equity method earnings, by investee, for the years ended
December 31, 2018
and
2017
:
|
Years Ended December 31,
|
Change
|
||||||||||||||
|
(in thousands)
|
2018
|
2017
|
($)
|
(%)
|
|||||||||||
|
Earnings from Tinuum Group
|
$
|
47,175
|
|
$
|
48,875
|
|
$
|
(1,700
|
)
|
(3
|
)%
|
||||
|
Earnings from Tinuum Services
|
7,033
|
|
4,963
|
|
2,070
|
|
42
|
%
|
|||||||
|
Earnings from other
|
—
|
|
5
|
|
(5
|
)
|
(100
|
)%
|
|||||||
|
Earnings from equity method investments
|
$
|
54,208
|
|
$
|
53,843
|
|
$
|
365
|
|
1
|
%
|
||||
Earnings from equity method investments, and changes related thereto, are impacted by our most significant equity method investees: Tinuum Group and Tinuum Services. Earnings from equity method investments
increased
during the year ended
December 31, 2018
compared to
2017
primarily as a result of the addition of
two
invested facilities during
2018
. However, cash distributions to us from Tinuum Group, and related equity earnings, during
2018
were negatively impacted as a result of $17.6 million of capital expenditures incurred by Tinuum Group related to the engineering and installation of RC facilities. See the discussion below regarding the accounting of earnings from Tinuum Group.
During the year ended
December 31, 2018
, we recognized
$47.2 million
in equity earnings from Tinuum Group compared to our proportionate share of Tinuum Group's net income of
$57.7 million
for the year. During the year ended
December 31, 2017
, we recognized
$48.9 million
in equity earnings from Tinuum Group compared to our proportionate share of Tinuum Group's net income of
$46.6 million
for the year. The difference between our pro-rata share of Tinuum Group's net income and our earnings from our Tinuum Group equity method investment as reported on the Consolidated Statements of Operations relates to us receiving cumulative distributions in excess of the carrying value of the investment, and therefore recognizing such excess distributions as equity method earnings in the period the distributions occur, as discussed in more detail below.
As a result of cash flows from invested RC facilities, Tinuum Group distributions to us during the year ended
December 31, 2018
were
$47.2 million
, which resulted in us continuing to have cumulative cash distributions that exceeded our cumulative pro-rata share of Tinuum Group's net income as of
December 31, 2018
.
29
The following table for Tinuum Group presents our investment balance, equity earnings, cash distributions received and cash distributions in excess of the investment balance for the years ended
December 31, 2018
and
2017
(
in thousands
):
|
Description
|
Date(s)
|
Investment balance
|
ADES equity earnings (loss)
|
Cash distributions
|
Memorandum Account: Cash distributions and equity loss in (excess) of investment balance
|
|||||||||||||
|
Beginning balance
|
12/31/2016
|
$
|
—
|
|
$
|
—
|
|
$
|
—
|
|
$
|
(9,894
|
)
|
|||||
|
ADES proportionate share of net income from Tinuum Group (1)
|
2017 activity
|
46,551
|
|
46,551
|
|
—
|
|
—
|
|
|||||||||
|
Recovery of cash distributions in excess of investment balance (prior to cash distributions)
|
2017 activity
|
(9,894
|
)
|
(9,894
|
)
|
—
|
|
9,894
|
|
|||||||||
|
Cash distributions from Tinuum Group
|
2017 activity
|
(48,875
|
)
|
—
|
|
48,875
|
|
—
|
|
|||||||||
|
Adjustment for current year cash distributions in excess of investment balance
|
2017 activity
|
12,218
|
|
12,218
|
|
—
|
|
(12,218
|
)
|
|||||||||
|
Total investment balance, equity earnings (loss) and cash distributions
|
12/31/2017
|
—
|
|
48,875
|
|
48,875
|
|
(12,218
|
)
|
|||||||||
|
ADES proportionate share of net income from Tinuum Group (1)
|
2018 activity
|
57,721
|
|
57,721
|
|
—
|
|
—
|
|
|||||||||
|
Recovery of cash distributions in excess of investment balance (prior to cash distributions)
|
2018 activity
|
(12,218
|
)
|
(12,218
|
)
|
—
|
|
12,218
|
|
|||||||||
|
Cash distributions from Tinuum Group
|
2018 activity
|
(47,175
|
)
|
—
|
|
47,175
|
|
—
|
|
|||||||||
|
Adjustment for current year cash distributions in excess of investment balance
|
2018 activity
|
1,672
|
|
1,672
|
|
—
|
|
(1,672
|
)
|
|||||||||
|
Total investment balance, equity earnings and cash distributions
|
12/31/2018
|
$
|
—
|
|
$
|
47,175
|
|
$
|
47,175
|
|
$
|
(1,672
|
)
|
|||||
(1) The amounts of our
42.5%
proportionate share of net income as shown in the table above differ from mathematical calculations of the Company’s
42.5%
equity interest in Tinuum Group multiplied by the amounts of Net Income available to Class A members as shown in the table above of Tinuum Group results of operations due to adjustments related to the Class B preferred return.
Tinuum Group plans to adopt Accounting Standard Update (“ASU”) No. 2014-09 (Topic 606),
Revenue from Contracts with Customers
(“ASU 2014-09”) and ASU 2016-02 (Topic 842),
Leases
(“ASU 2016-02”) as of January 1, 2019. As a result of Tinuum Group’s adoption, we expect to record a cumulative adjustment of $37.2 million related to our portion of Tinuum Group's cumulative effect adjustment that will increase our Retained Earnings as of January 1, 2019. We expect that this adjustment will result in us no longer having cumulative cash distributions that exceed our cumulative pro-rata share of Tinuum Group's net income. Additionally, we expect that we will recognize equity earnings by recording our pro-rata share of Tinuum Group’s net income rather than based upon cash distributions on a go-forward basis. Upon adoption, we will assess the impact of the adjustment to our income tax position.
Tinuum Group's consolidated financial statements as of
December 31, 2018
and
2017
and for the years ended
December 31, 2018
and
2017
are included in Item 15 of this Report.
Equity earnings from our interest in Tinuum Services
increased
by
$2.1 million
in
2018
compared to
2017
. As of
December 31, 2018
and
2017
, Tinuum Services provided operating and maintenance services to
18
and 16 RC facilities, respectively. Tinuum Services derives earnings from both fixed-fee arrangements as well as fees that are tied to actual RC production, depending upon the specific RC facility operating and maintenance agreement.
Additional information related to equity method investments can be found in
Note 5
to the Consolidated Financial Statements included in Item 8 of this Report.
30
Tax Credits
We earned the following tax credits that may be available for future benefit related to the production of RC from the operation of retained RC facilities under the Internal Revenue Code ("IRC")
Section 45 - Production Tax Credit
("Section 45 tax credits"):
|
Years Ended December 31,
|
||||||||
|
(in thousands)
|
2018
|
2017
|
||||||
|
Section 45 tax credits earned
|
$
|
7,031
|
|
$
|
3,496
|
|
||
The increase in the Section 45 tax credits earned during the year ended
December 31, 2018
compared to
December 31, 2017
was due to our direct ownership and Tinuum Group's ownership in an RC facility that generated tax credits for the entirety of 2018 compared to a six-month period in 2017.
As discussed in Item 1 of this Report, Tinuum Group operates and leases or sells facilities used in the production and sale of RC to third party tax equity investors. All dispositions of such facilities are treated as installment sales for federal income tax purposes at Tinuum Group. The resulting gain from these sales is reported by Tinuum Group pursuant to the installment method under IRC Section 453. Under Section 453A taxpayers using the installment method for income tax purposes are required to pay 453A interest that is calculated on the portion of the tax liability that is deferred under the installment method. As of
December 31, 2018
, ADES’s allocable share of the gross deferred installment sale gain from Tinuum Group to be recognized in future years was approximately
$170 million
.
Due to the production and sale of RC from the operation of retained RC facilities, Tinuum Group has generated Section 45 tax credits ("GBC's"). These GBC's are allocated to the owners of Tinuum Group, including us, who may benefit to the extent that the GBC's are realized from the operation of retained RC facilities. As of
December 31, 2018
, we had approximately $104.6 million in GBC carryforwards.
In the hypothetical event of an ownership change, as defined by IRC Section 382, utilization of the GBC's generated prior to the change would be subject to an annual limitation imposed by IRC Section 383 for GBC's. The results of a recent analysis indicated that we had not experienced an ownership change as of
December 31, 2018
, as defined by IRC Section 382. Such analysis for the period from January 1, 2019 through the date of this Report has not been completed. Therefore, it is possible that we experienced an ownership change between January 1, 2019 and the date of this filing, thus subjecting our GBC carryforwards to limitation. Should a limitation exist, however, we would likely be in a position to substantially increase the limitation amount by virtue of our approximately
$170 million
deferred installment sale gain at Tinuum Group.
Specifically, IRC Section 382 provides that a corporation with a net unrealized built-in gain ("NUBIG") immediately before an ownership change may increase its limitation by the amount of recognized built-in gain ("RBIG") arising from the sale of a built-in gain asset during a recognition period, which is generally the five-year period immediately following an ownership change. Built-in gain reported on the installment sale method that is attributable to assets sold by the corporation before or during the recognition period may increase the corporation’s limitation during and after the recognition period. Therefore, it is likely that any IRC Section 382 limitation imposed upon an ownership change may be increased by our share of RBIG from Tinuum Group’s installment sale gain attributable to RC facilities sold before or during the period in which the change in ownership occurred.
There are numerous assumptions, listed below, that must be considered in calculating the RBIG related to Tinuum Group and the increase to our IRC Section 383 limitation. Assuming these assumptions, we may be able to increase the total limitation by approximately
$170 million
over the duration of the installment sale. As of
December 31, 2018
, after increasing the total hypothetical limitation, we would likely not have been able to utilize approximately $43.0 million of tax credits.
|
•
|
The Tinuum Group RBIG is a result of the sale of RC facilities by Tinuum Group and its election to utilize the installment sale method for tax purposes;
|
|
•
|
Investors in RC facilities will not terminate existing contracts as completion of an installment sale transaction is necessary to realize RBIG;
|
|
•
|
We have no net unrealized built-in loss to offset the NUBIG from Tinuum Group;
|
|
•
|
Our RBIG is equal to the deferred gain allocated from Tinuum Group, which is approximately
$170 million
;
|
|
•
|
We will have a NUBIG immediately before a hypothetical ownership change such that the Tinuum Group RBIG is available to increase the IRC Section 382 limitation;
|
|
•
|
We will continue our historic business operations for at least two years following a hypothetical ownership change; and
|
|
•
|
A second ownership change does not occur.
|
The annual limitation will be increased by the amount of RBIG that is included in taxable income each year.
31
Interest expense
453A interest expense
decreased
in
2018
compared to
2017
by
$1.0 million
. This reduction was driven by a lower tax rate of 21% in
2018
compared to 35% in
2017
as well as fewer principal payments remaining, partially offset by an increase in invested RC facilities in which Tinuum Group recognized as installment sales for tax purposes from
17
as of
December 31, 2017
to
19
as of
December 31, 2018
.
The following table shows the balance of the tax liability that has been deferred and the applicable interest rate to calculate 453A interest:
|
As of December 31,
|
||||||||
|
(in thousands)
|
2018
|
2017
|
||||||
|
Tax liability deferred on installment sales (1)
|
$
|
35,703
|
|
$
|
70,739
|
|
||
|
Interest rate
|
5.00
|
%
|
4.00
|
%
|
||||
(1) Represents the approximate tax effected liability utilizing the federal tax rate in effect for the applicable years ended related to the deferred gain on installment sales (approximately
$170 million
as of
December 31, 2018
).
Based on the interest rate in effect as of the date of this filing, the 453A interest rate for the year ended December 31, 2019 is expected to be 6%.
Offsetting the decrease in 453A interest expense was an increase due to $0.5 million in interest related to the Senior Term Loan entered into on December 7, 2018 to fund the Carbon Solutions Acquisition.
Other
The components of Other income (expense) include the following significant items:
Indemnity Settlement Agreement
In December 2017, prior to the Carbon Solutions Acquisition, we, Carbon Solutions and the former parent company of Carbon Solutions agreed to terminate certain provisions of the Indemnity Settlement Agreement (the " Indemnity Termination Agreement"). Pursuant to an agreement executed concurrently with the Indemnity Termination Agreement, the Company, Norit International B.V. and one of its an affiliates (collectively referred to as “Norit”) agreed to a final payment in the amount of
$3.3 million
(the "Settlement Payment") to settle all outstanding royalty obligations (the "Royalty Award") owed under the terms of a settlement agreement executed in 2011 between the Company and Norit. We paid this amount on December 29, 2017.
Under the Indemnity Termination Agreement, and upon payment of the Settlement Payment, we were relieved of certain financial and indemnity obligations required by the terms of the settlement agreement with Norit, including the obligation to maintain LC's securing future royalty payment obligations. As of December 31, 2017,
$3.5 million
in LC's related to the Royalty Award were outstanding, but were canceled by all parties in January 2018, pursuant to the Indemnity Termination Agreement.
Settlement with service provider
In November 2017, we entered into a settlement agreement with a former third-party service provider and as part of the settlement we received cash in the amount of
$3.5 million
. Cash from this settlement was received in December 2017.
Advanced Emission Solutions, Inc. Profit Sharing Retirement Plan
In 2016, the DOL opened an investigation into the Advanced Emissions Solutions, Inc. Profit Sharing Retirement Plan (the “401(k) Plan”), and we, as Plan Sponsor, cooperated with that investigation. In February 2018, as part of ongoing discussions, we and the DOL came to an agreement whereby we would make a restorative payment to the 401(k) Plan in the amount of $1.0 million as an estimate of lost earnings for 401(k) Plan participants as of January 1, 2015. Thereafter, the DOL would close the investigation with no further action against the 401(k) Plan or its fiduciaries, including any further investigation. We determined this contingency to be both probable and reasonably estimable and accrued $1.0 million as of December 31, 2017. The liability was recorded in the Other current liabilities line item on the Consolidated Balance Sheet. The expense recognized related to this accrual was included in the Other line item in the Consolidated Statements of Operations for the year ended December 31, 2017. We made a payment of $1.0 million to the 401(k) Plan on June 1, 2018 and no liability existed as of December 31, 2018. On September 7, 2018, we received notification that the DOL had closed its investigation and no further action is required by us.
32
Impairment of cost method investment
In November 2014, we acquired an 8% ownership interest in the common stock of Highview ("Highview"), a London, England based development stage company specializing in power storage. We accounted for our investment in Highview (the "Highview Investment") in accordance with U.S. GAAP applicable to equity investments that do not qualify for the equity method of accounting. As of
December 31, 2017
, we recorded an impairment charge of
$0.5 million
for the Highview Investment based on an estimated fair value of
£1.00
per share compared to the estimated carrying value prior to the impairment charge of
£2.00
per share. The impairment charge was included in the
Other
line item in the
Consolidated Statements of Operations
for the year ended
December 31, 2017
.
Income tax expense
On December 22, 2017 (the "Enactment Date"), the U.S. government enacted comprehensive tax legislation commonly referred to as the Tax Cuts and Jobs Act (the "Tax Act"). The Tax Act made broad and complex changes to the U.S. tax code and key provisions applicable to the Company, or certain of Tinuum Group's existing or potential customers, for 2018 included the following: (1) reduction of the U.S. federal corporate tax rate from 35 percent to 21 percent; (2) elimination of the corporate alternative minimum tax (AMT); (3) a new limitation on deductible interest expense; (4) limitations on the deductibility of certain executive compensation; (5) limitations on the use of federal tax credits ("FTCs") to reduce the U.S. income tax liability; (6) limitations on net operating losses ("NOL’s") generated after December 31, 2017, to 80 percent of taxable income; and the introduction of the Base Erosion Anti-Abuse Tax (“BEAT”) for tax years beginning after December 31, 2017.
As a result of the reduction of the U.S. federal corporate rate from 35 percent to 21 percent, we recorded an adjustment to our recorded deferred tax assets and deferred tax liabilities as of the Enactment Date for those temporary differences expected to reverse after the Enactment Date. During 2018, we did not make any accounting adjustments related to the Tax Act.
For the year ended December 31, 2018, our reported income tax expense of
$10.4 million
differed from income tax expense computed by applying the U.S. statutory federal income tax rate (the "Federal Rate") of
$9.6 million
primarily due to a reduction in income tax expense from tax credits realized of
$7.0 million
, offset by increases in income tax expense from state income tax expense, net of federal benefit of
$3.6 million
and an increase in the valuation adjustment on our deferred tax assets of
$4.5 million
. For the year ended December 31, 2017, our reported income tax expense of
$24.2 million
differed from income tax expense computed using the Federal Rate of
$18.2 million
primarily due to increases in income tax expense from state income tax expense, net of federal benefit of
$1.7 million
and from a reduction in our net deferred tax assets of
$5.8 million
from the change in federal tax rates from 35% to 21%, offset by a decrease in income tax expense from tax credits realized of
$1.9 million
.
Accounting for income taxes requires that companies assess whether a valuation allowance should be recorded against their deferred tax asset based on an assessment of the amount of the deferred tax asset that is “more likely than not” to be realized. Valuation allowances are established, when necessary, to reduce deferred tax assets to the amount that is more likely than not to be realized.
We assess the valuation allowance recorded against deferred tax assets at each reporting date. The determination of whether a valuation allowance for deferred tax assets is appropriate requires the evaluation of positive and negative evidence that can be objectively verified. Consideration must be given to all sources of taxable income available to realize the deferred tax asset, including, as applicable, the future reversal of existing temporary differences, future taxable income forecasts exclusive of the reversal of temporary differences and carryforwards, taxable income in carryback years and tax planning strategies. In estimating taxes, we assess the relative merits and risks of the appropriate tax treatment of transactions taking into account statutory, judicial, and regulatory guidance.
As of
December 31, 2018
, we concluded it is more likely than not we will generate sufficient taxable income within the applicable NOL and tax credit carry-forward periods to realize
$32.5 million
of our net deferred tax assets, and therefore, reversed
$4.5 million
of the valuation allowance. In reaching this conclusion, we most significantly considered: (1) forecasts of continued future taxable income and (2) impacts of additional RC invested facilities during 2018. As of
December 31, 2018
and
2017
, we had a valuation allowance recorded of
$79.9 million
and
$75.4 million
, respectively, against our deferred tax assets.
During 2019, due to the impact of Tinuum Group selling an additional RC facility during the three months ended March 31, 2019, as well as the impacts of Tinuum Group’s adoption of ASU 2014-09 and ASU 2016-02, we expect that we will record an adjustment to our valuation allowance against our net deferred tax assets.
The ability to recognize the remaining deferred tax assets that continue to be subject to a valuation allowance is evaluated on a quarterly basis to determine if there are any significant events that would affect the ability to utilize those deferred tax assets.
Our estimate of future taxable income is based on internal projections that consider historical performance, multiple internal scenarios and assumptions, as well as external data that we believe is reasonable. If events are identified that affect our ability to utilize our deferred tax assets, or if additional deferred tax assets are generated, the analysis will be updated to determine if any
33
adjustments to the valuation allowance are required. If actual results differ negatively from the current estimates of future taxable income, even if caused by adverse macro-economic conditions, the remaining valuation allowance may need to be increased. Such an increase could have a material adverse effect on our financial condition and results of operations. Conversely, better than expected results and continued positive results and trends could result in further releases to the deferred tax valuation allowance, and any such decreases could have a material positive effect on our financial condition and results of operations.
See additional discussion in
Note 13
of the Consolidated Financial Statements included in Item 8 of this Report.
Business Segments
As of
December 31, 2018
, we have
two
reportable segments: (1) Refined Coal ("RC'); and (2) Power Generation and Industrials ("PGI") (f/k/a "Emissions Control").
The business segment measurements provided to and evaluated by our chief operating decision maker are computed in accordance with the principles listed below:
|
•
|
The accounting policies of the operating segments are the same as those described in the summary of significant accounting policies except as described below.
|
|
•
|
Segment revenues include equity method earnings and losses from our equity method investments.
|
|
•
|
Segment operating income (loss) includes segment revenues, gains related to sales of equity method investments and allocation of certain "Corporate general and administrative expenses," which include
Payroll and benefits
,
Rent and occupancy
,
Legal and professional fees
, and
General and administrative
.
|
|
•
|
RC segment operating income includes interest expense directly attributable to the RC segment.
|
The principal products and services of our segments are:
|
1.
|
RC - Our RC segment derives its earnings from equity method investments as well as royalty payment streams and other revenues related to enhanced combustion of and reduced emissions of both NO
X
and mercury from the burning of RC. Our equity method investments related to the RC segment include Tinuum Group, Tinuum Services as well as other immaterial equity method investments. Segment revenues include equity method earnings (losses) from our equity method investments and royalty earnings from Tinuum Group. These earnings are included within the
Earnings from equity method investments
and
License royalties, related party
line items in the
Consolidated Statements of Operations
included in Item 8 of this Report. Key drivers to RC segment performance are the produced and sold RC from both operating and retained RC facilities, royalty-bearing tonnage, and the number of operating (leased or sold) and retained RC facilities. These key drivers impact our earnings and cash distributions from equity method investments.
|
|
2.
|
PGI - Our PGI segment includes revenues and related expenses from the sale of consumable products that utilize PAC and chemical technologies as well as historically the sale of ACI and DSI equipment systems. These options provide coal-powered utilities and industrial boilers with mercury control solutions working in conjunction with ACI and DSI systems and other pollution control equipment, generally without the requirement for significant ongoing capital outlays. These amounts are included within the respective revenue and cost of revenue line items in the
Consolidated Statements of Operations
included in Item 8 of this Report.
|
34
The following table presents our operating segment results for the years ended
December 31, 2018
and
2017
:
|
|
Years Ended December 31,
|
Change
|
||||||||||
|
(in thousands)
|
2018
|
2017
|
($)
|
|||||||||
|
Revenues:
|
||||||||||||
|
Refined Coal:
|
||||||||||||
|
Earnings in equity method investments
|
$
|
54,208
|
|
$
|
53,843
|
|
$
|
365
|
|
|||
|
Royalties, related party
|
15,140
|
|
9,672
|
|
5,468
|
|
||||||
|
69,348
|
|
63,515
|
|
5,833
|
|
|||||||
|
Power Generation and Industrials:
|
||||||||||||
|
Equipment sales
|
72
|
|
31,446
|
|
(31,374
|
)
|
||||||
|
Consumables
|
8,628
|
|
4,246
|
|
4,382
|
|
||||||
|
8,700
|
|
35,692
|
|
(26,992
|
)
|
|||||||
|
Total segment reporting revenues
|
78,048
|
|
99,207
|
|
(21,159
|
)
|
||||||
|
Adjustments to reconcile to reported revenues:
|
||||||||||||
|
Earnings in equity method investments
|
(54,208
|
)
|
(53,843
|
)
|
(365
|
)
|
||||||
|
Corporate and other
|
105
|
|
—
|
|
105
|
|
||||||
|
Total reported revenues
|
$
|
23,945
|
|
$
|
45,364
|
|
$
|
(21,419
|
)
|
|||
|
Segment operating income (loss)
|
||||||||||||
|
Refined Coal (1)
|
$
|
65,454
|
|
$
|
59,908
|
|
$
|
5,546
|
|
|||
|
Power Generation and Industrials (2)
|
(2,621
|
)
|
379
|
|
(3,000
|
)
|
||||||
|
Total segment operating income
|
$
|
62,833
|
|
$
|
60,287
|
|
$
|
2,546
|
|
|||
(1) Included within the RC segment operating income for the years ended
December 31, 2018
and
2017
is 453A interest expense of
$1.6 million
and
$2.6 million
, respectively. Also included within the RC segment operating income for the year ended
December 31, 2018
was
$0.4 million
of severance expense.
(2) Included within the PGI segment operating income for the year ended
December 31, 2018
was approximately $1.0 million of amortization related to a step up in basis of the fair value of inventory. Also included within the PGI segment operating income for the year ended
December 31, 2018
was
$1.0 million
of severance expense.
A reconciliation of segment operating income to consolidated net income is included in
Note 14
of the Consolidated Financial Statements included in Item 8 of this Report.
RC
The following table details the segment revenues of our respective equity method investments for the years ended
December 31, 2018
and
2017
:
|
Year ended December 31,
|
||||||||
|
(in thousands)
|
2018
|
2017
|
||||||
|
Earnings from Tinuum Group
|
$
|
47,175
|
|
$
|
48,875
|
|
||
|
Earnings from Tinuum Services
|
7,033
|
|
4,963
|
|
||||
|
Earnings from other
|
—
|
|
5
|
|
||||
|
Earnings from equity method investments
|
$
|
54,208
|
|
$
|
53,843
|
|
||
RC earnings increased primarily due to increased equity earnings from Tinuum Services during the year ended
December 31, 2018
compared to the year ended
December 31, 2017
, as presented above. Our equity earnings increased primarily due to an increase in Tinuum Services' earnings as a result of the addition of two invested facilities. Cash distributions decreased year over year as a result of incurred costs related to the engineering and installation phases of RC facilities, which have reduced distributions to Tinuum Group's equity members even though Tinuum Group did obtain two additional invested facilities. For the year ended
December 31, 2018
, Tinuum Group's consolidated earnings
increased
$26.0 million
from the comparable
December 31, 2017
period due to an increase in lease revenues driven by increased sales of facilities to third-party investors.
35
As discussed above and in
Note 5
of the Consolidated Financial Statements included in Item 8 of this Report, our earnings in Tinuum Group may not equal our pro-rata share due to the accounting related to our equity method investment.
RC operating income in
2018
was also positively impacted for the following:
|
•
|
An increase in earnings from Tinuum Services, which was primarily due to an increase in the number of RC facilities operated by Tinuum Services during
2018
;
|
|
•
|
An increase in M-45 royalties earned as a result of increased tonnage; and
|
|
•
|
A decrease in 453A interest expense as a result of the decreased federal tax rate and the declining deferred tax liability.
|
PGI
PGI segment operating income
decreased
during the year ended
December 31, 2018
compared to
2017
primarily due to a decrease in revenues year over year, as discussed within the consolidated results. The decrease in PGI segment operating income was driven by a decrease in Equipment sales revenue, less equipment sales cost of revenue, as no further revenue from equipment sales is expected. Additionally, PGI operating income was positively impacted by incremental Carbon Solutions revenues of
$5.6 million
, offset by cost of revenues of
$3.4 million
, inclusive of $1.0 million related to the amortization of a step up in basis of acquired finished goods inventory related to Carbon Solutions Acquisition. The decrease in operating income is also due to an increase in restructuring expense of
$0.9 million
during the year ended
December 31, 2018
compared to
2017
.
36
Liquidity and Capital Resources
Overview of Factors Affecting Our Liquidity
During
2018
, our liquidity position was positively affected primarily from distributions from Tinuum Group and Tinuum Services, royalty payments from Tinuum Group and borrowing availability under our bank ("Lender") line of credit (the "Line of Credit").
Our principal sources of liquidity currently include:
|
•
|
cash and cash equivalents on hand;
|
|
•
|
distributions from Tinuum Group and Tinuum Services;
|
|
•
|
royalty payments from Tinuum Group;
|
|
•
|
the Line of Credit; and
|
|
•
|
operations in the PGI segment.
|
Our principal uses of liquidity during the year ended
December 31, 2018
included:
|
•
|
acquisition of Carbon Solutions
|
|
•
|
payment of dividends;
|
|
•
|
repurchases of shares of our common stock pursuant to a stock repurchase program by which we may repurchase up to
$20.0 million
of our outstanding common stock, from time to time;
|
|
•
|
our business operating expenses, including federal and state tax payments; and
|
|
•
|
delivering on our existing contracts and customer commitments.
|
Our ability to continue to generate sufficient cash flow required to meet ongoing operational needs and obligations, as well as future expected dividend payments and potential future share repurchases, depends upon several factors, including executing on our contracts and initiatives, receiving royalty payments from Tinuum Group and distributions from Tinuum Group and Tinuum Services, and increasing our share of the market for PGI consumables as well as expansion of our overall PAC business into additional adjacent markets. Increased distributions from Tinuum Group will likely be dependent upon both preserving existing contractual relationships and the securing of additional tax equity investors for those Tinuum Group facilities that are currently not operating.
Our use of liquidity for capital expenditures has not been significant for the periods presented. Due to the acquisition of Carbon Solutions, we expect that use of liquidity for capital expenditures will increase in future periods. Carbon Solutions has historically incurred costs for capital expenditures related to the PAC manufacturing facility under normal operations and planned outages and for mine development at the Five Forks. Certain of Carbon Solutions' recent historical planned capital expenditures were delayed due to the sales process. During due diligence and validated upon acquisition, we evaluated capital expenditure needs and anticipate additional material capital resources will be needed to maintain or improve capital assets.
Tinuum Group and Tinuum Services Distributions
The following table summarizes the cash distributions from our equity method investments, which most significantly affected our consolidated cash flow results, for the years ended
December 31, 2018
and
2017
:
|
Year ended December 31,
|
||||||||
|
(in thousands)
|
2018
|
2017
|
||||||
|
|
||||||||
|
Tinuum Group
|
$
|
47,175
|
|
$
|
48,875
|
|
||
|
Tinuum Services
|
5,500
|
|
4,638
|
|
||||
|
Distributions from equity method investees
|
$
|
52,675
|
|
$
|
53,513
|
|
||
Future cash flows from Tinuum through 2021 are expected to range from $200 to $225 million, and key drivers in achieving these future cash flows are based on the following:
|
•
|
19 invested facilities as of
December 31, 2018
and inclusive of all net Tinuum cash flows (distributions and license royalties), offset by estimated federal and state income tax payments and 453A interest payments.
|
Expected future cash flows from Tinuum Group are based on the following key assumptions:
|
•
|
Tinuum Group continues to not operate retained facilities;
|
|
•
|
Tinuum Group does not have material capital expenditures or unusual operating expenses;
|
37
|
•
|
Tax equity lease renewals on invested facilities are not terminated or repriced; and
|
|
•
|
Coal-fired power generation remains constant.
|
Future incremental invested RC facilities would positively impact our expectation of future cash flows.
Senior Term Loan
On December 7, 2018, we executed the Senior Term Loan with Apollo in the principal amount of
$70.0 million
, less original issue discount of
$2.1 million
. We also paid debt issuance costs of
$2.0 million
related to the Senior Term Loan. The Senior Term Loan has a term of
36
months and bears interest at a rate equal to 3-month LIBOR (subject to a
1.5%
floor) +
4.75%
per annum, which is adjusted quarterly to the current 3-month LIBOR rate, and interest is payable quarterly in arrears. Quarterly principal payments of
$6.0 million
are required beginning in March 2019, and we may prepay the Senior Term Loan at any time without penalty. The Senior Term Loan is secured by substantially all of our assets, including the cash flows from Tinuum Group and Tinuum Services, but excluding our equity interests in those Tinuum entities.
The Senior Term Loan includes, among others, the following covenants: (1) Beginning December 31, 2018 and as of the end of each fiscal quarter thereafter, we must maintain a minimum cash balance of
$5.0 million
and shall not permit "expected future net cash flows from the refined coal business" (as defined in the Senior Term Loan) to be less than
1.75
times the outstanding principal amount of the Senior Term Loan; (2) Beginning in January 2019, annual collective dividends and buybacks of shares of our common stock in an aggregate amount, not to exceed
$30.0 million
, are permitted so long as (a) no default or event of default exists under the Senior Term Loan and (b) expected future net cash flows from the refined coal business as of the end of the most recent fiscal quarter exceed
$100.0 million
.
Stock Repurchases and Dividends
In November 2018, the Board authorized us to purchase up to
$20.0 million
of our outstanding common stock. This stock repurchase program will remain in effect until December 31, 2019 unless otherwise modified by the Board. Previously, in December 2017, the Board had authorized us to purchase up to
$20.0 million
of our outstanding common stock under a separate repurchase program that was in effect until July 31, 2018. During the year ended
December 31, 2018
, under these two stock repurchase programs, we purchased
2,350,422
shares of our common stock for cash of
$25.3 million
, inclusive of commissions and fees.
During the year ended
December 31, 2018
, we declared and paid quarterly cash dividends to stockholders of
$20.2 million
, which were paid on
March 8, 2018
,
June 8, 2018
,
September 6, 2018
and
December 6, 2018
.
Line of Credit
As of
December 31, 2018
, there were
no
outstanding borrowings under the Line of Credit.
On September 30, 2018, ADA, as borrower, ADES, as guarantor, and the Lender entered into an amendment (the "Twelfth Amendment") to the Line of Credit. The Twelfth Amendment decreased the Line of Credit to
$5.0 million
due to decreased collateral requirements, extended the maturity date of the Line of Credit to September 30, 2020 and permitted the Line of Credit to be used as collateral (in place of restricted cash) for letters of credit ("LC's") up to
$5.0 million
related to equipment projects and certain other agreements. Under the Twelfth Amendment, there was no minimum cash balance requirement based on us meeting certain conditions and maintaining minimum trailing twelve-month EBITDA (earnings before interest, taxes, depreciation and amortization), as previously defined in the "Eleventh Amendment" to the Line of Credit, of
$24.0 million
.
On December 7, 2018, ADA, as borrower, ADES as guarantor, and the Lender entered into an amendment to the Line of Credit, which provided, among other things, for ADA to be able to enter into the Senior Term Loan as a guarantor so long as the principal amount of the Senior Term Loan does not exceed
$70 million
. Additionally, the financial covenants in the Line of Credit were amended and restated to be consistent with the aforementioned Senior Term Loan covenants, including maintaining a minimum cash balance of
$5.0 million
.
38
Sources and Uses of Cash
Cash, cash equivalents and restricted cash
decreased
from
$30.7 million
as of
December 31, 2017
to
$23.8 million
as of
December 31, 2018
,
a decrease
of
$6.9 million
. The following table summarizes our cash flows for the years ended
December 31, 2018
and
2017
, respectively:
|
Years Ended December 31,
|
||||||||||||
|
(in thousands)
|
2018
|
2017
|
Change
|
|||||||||
|
Cash provided by (used in):
|
||||||||||||
|
Operating activities
|
$
|
(9,889
|
)
|
$
|
(11,748
|
)
|
$
|
1,859
|
|
|||
|
Investing activities
|
(16,543
|
)
|
48,386
|
|
(64,929
|
)
|
||||||
|
Financing activities
|
19,511
|
|
(32,889
|
)
|
52,400
|
|
||||||
|
Net change in Cash and Cash Equivalents and Restricted Cash
|
$
|
(6,921
|
)
|
$
|
3,749
|
|
$
|
(10,670
|
)
|
|||
Cash flows from operating activities
Cash flows from operating activities for the year ended
December 31, 2018
increased by
$1.9 million
compared to the year ended
December 31, 2017
and were positively impacted primarily by the following: (1) an increase in net income of
$7.6 million
; (2) a change in
Legal settlements and accruals
due to settlement of obligation results in cash outflow of
$16.1 million
in 2017; and (3) an increase in
Distributions from equity method investees, return on investment
of
$0.9 million
. Offsetting these increases to operating cash flows were primarily the following: (1) a decrease of
$17.5 million
due to the change in deferred tax assets as a result of utilization to offset taxable income in 2017 and changes to the valuation allowance in 2018; and (2) a net increase in working capital and other liabilities of $4.6 million, primarily due to an increase in receivables from Tinuum Group related to revenues from license royalties and an increase in receivables from customers as a result of the addition of new customers from the Carbons Solutions Acquisition.
Cash flows from investing activities
Distributions from equity method investees
Our cash flows from investing activities are significantly impacted by cash distributions from equity method investees that represent a return in excess of cumulative earnings, which
decreased
from
$48.9 million
in
2017
to
$47.2 million
in
2018
. All of these cash distributions were received from Tinuum Group.
Acquisition of business, net of cash acquired
The Carbon Solutions Acquisition completed in 2018 resulted in total cash consideration paid of
$65.8 million
less cash acquired of
$3.3 million
. In addition, the total purchase consideration included
$0.7 million
payable to Carbon Solutions' previous debt holder, which was paid in March 2019. Also as part of the Carbon Solutions Acquisition, we also assumed capital leases and other contractual commitments of
$11.8 million
.
Purchase of and contribution to equity method investee
During the year ended
December 31, 2018
we made a contribution to Tinuum Services of $0.8 million due to a capital call.
Cash flows from financing activities
Borrowings on long-term debt, related party and debt issuance costs paid
We funded the Carbon Solutions Acquisition through cash on hand and the proceeds of the Senior Term Loan in the principal amount of
$70.0 million
, net of original issue discount of
$2.1 million
. In addition, we paid debt issuance costs of
$2.0 million
.
Dividends Paid and Stock Repurchases
During the years ended
December 31, 2018
and
2017
, we made payments of
$20.2 million
and
$15.7 million
, respectively, related to dividends declared on our common stock.
Stock Repurchases
As described under this Item 7 and in
Note 9
of the Consolidated Financial Statements, during the years ended
December 31, 2018
and
2017
, under stock repurchase programs authorized by the Board, we purchased
2,350,422
shares and
1,713,766
shares of our common stock for cash of
$25.3 million
and
$16.4 million
, respectively, inclusive of commissions and fees. The total shares of common stock repurchased for the year ended
December 31, 2017
is inclusive of a dutch tender offer completed in June 2017 in which we acquired
1,370,891
shares of common stock for
$13.0 million
.
39
Equity Award Activity
During the years ended
December 31, 2018
and
2017
, we used cash of
$0.8 million
and
$0.6 million
, respectively, for the repurchase of shares to satisfy tax withholdings upon the vesting of equity-based awards.
Borrowings and repayments on Line of Credit
In March 2017, a customer drew on an LC related to an equipment system in the amount of $0.8 million, which was funded by borrowing availability under the Line of Credit. We subsequently repaid this amount to the Lender as of March 31, 2017.
40
Contractual Obligations
Our contractual obligations as of
December 31, 2018
are as follows:
|
Payment Due by Period
|
||||||||||||||||||||
|
(in thousands)
|
Total
|
Less than 1 year
|
1-3 years
|
4-5 years
|
After 5 years
|
|||||||||||||||
|
Senior Term Note
|
$
|
70,000
|
|
$
|
24,000
|
|
$
|
46,000
|
|
$
|
—
|
|
$
|
—
|
|
|||||
|
Capital lease obligations
|
9,642
|
|
1,749
|
|
3,509
|
|
1,902
|
|
2,482
|
|
||||||||||
|
Operating leases
|
8,055
|
|
3,619
|
|
3,905
|
|
531
|
|
—
|
|
||||||||||
|
$
|
87,697
|
|
$
|
29,368
|
|
$
|
53,414
|
|
$
|
2,433
|
|
$
|
2,482
|
|
||||||
We have not included obligations related to 453A interest payments due to uncertainty of amounts payable in future periods relating to matters impacting future obligations such as the deferred tax liability balance under the installment method at each future balance sheet date and changes in interest rates. If no additional RC facilities become invested in the future, the deferred liability balance would decrease and interest payments, assuming no changes in the applicable tax and interest rates, would also decrease throughout the periods in the table above.
Outstanding letters of credit were historically issued in connection with equipment sales agreements, collateral support for future obligations due under the Royalty Award and other items. There were no outstanding letters of credit as of
December 31, 2018
.
Off-Balance Sheet Arrangements
During
2018
and
2017
, we did not engage in any off-balance sheet financing activities other than those included in the “Contractual Obligations” discussion above and those reflected in
Note 8
to the Consolidated Financial Statements included in Item 8 of this Report.
Critical Accounting Policies and Estimates
Our significant accounting policies are discussed in
Note 1
to the Consolidated Financial Statements included in Item 8 of this Report. In presenting our financial statements in conformity with accounting principles generally accepted in the United States ("U.S. GAAP"), we are required to make estimates and assumptions that affect the amounts reported therein. Several of the estimates and assumptions we are required to make relate to matters that are inherently uncertain as they pertain to future events. Our estimates are based on historical experience and other assumptions believed to be reasonable under the circumstances, and we evaluate these estimates on an ongoing basis. Actual results may differ from these estimates under different assumptions or conditions.
We believe that the accounting estimates discussed below are critical to understanding our historical and future performance, as these estimates relate to the more significant areas involving management’s judgments and estimates.
Business Combinations
We allocate the purchase price of acquired companies to the tangible and intangible assets acquired and liabilities assumed based on their estimated fair values at the acquisition date. The purchase price allocation process requires us to make significant estimates and assumptions with respect to property, plant and equipment, intangible assets and certain obligations. Although we believe the assumptions and estimates we have made are reasonable, they are based in part on historical experience, market conditions and information obtained from management of the acquired companies and are inherently uncertain. Examples of critical estimates in valuing certain of the intangible assets we have acquired or may acquire in the future include but are not limited to:
|
•
|
future expected cash flows from revenues;
|
|
•
|
historical and expected customer attrition rates and anticipated growth in revenues from acquired customers;
|
|
•
|
the acquired company’s developed technology as well as assumptions about the period of time the acquired developed technology will continue to be used in the combined company's product portfolio;
|
|
•
|
the expected use and useful lives of the acquired assets; and
|
|
•
|
valuation methods and discount rates used in estimating the values of the assets acquired and liabilities assumed.
|
Carrying value of long-lived assets;
We review and evaluate our long-lived assets for impairment at least annually, or more frequently when events or changes in circumstances indicate that the related carrying amounts may not be recoverable. An impairment loss is measured and recorded based on the estimated fair value of the long-lived assets being tested for impairment and their carrying amounts. Fair value is
41
typically determined through the use of an income approach utilizing estimates of discounted pre-tax future cash flows or a market approach utilizing recent transaction activity for comparable properties.
Stock-Based Compensation Expense
We grant certain executives stock options that generally vest based on performance measures and the grantee's continuous service with us. Compensation expense is recognized for these options on a straight-line basis over the estimated service period based on the estimated fair value at the date of grant using a Black-Scholes model. Different estimates of key inputs in the Black-Scholes model such as the expected term of an option and the expected volatility of our stock price, the estimate of dividends, as well as the estimate of the service period, could impact the share-based compensation expense we would recognize over the award period in our
Consolidated Statements of Operations
. Refer to
Note 10
of our Consolidated Financial Statements included in Item 8 of this Report for additional information regarding our stock option awards.
Asset Retirement Obligation
Reclamation costs are allocated to expense over the life of the related mine assets and are periodically adjusted to reflect changes in the estimated present value resulting from the passage of time and revisions to the estimates of either the timing or amount of the reclamation costs. Reclamation obligations are based on when the spending for an existing environmental disturbance will occur. We review, on at least an annual basis, the reclamation obligation at the mine.
Remediation costs are accrued based on management’s best estimate at the end of each period of the costs expected to be incurred at the mine site. Such cost estimates may include ongoing care, maintenance and monitoring costs.
Accounting for reclamation and remediation obligations requires management to make estimates unique to the mining operation of the future costs we will incur to complete the reclamation and remediation work required to comply with existing laws and regulations. Any such changes in future costs, the timing of reclamation activities, scope, or the exclusion of certain costs not considered reclamation and remediation costs, could materially impact the amounts charged to earnings for reclamation and remediation. Additionally, future changes to environmental laws and regulations could increase the extent of reclamation and remediation work required.
Income Taxes
We account for income taxes as required by U.S. GAAP, under which management judgment is required in determining income tax expense and the related balance sheet amounts. This judgment includes estimating and analyzing historical and projected future operating results, the reversal of taxable temporary differences, tax planning strategies, and the ultimate outcome of uncertain income tax positions. Actual income taxes paid may vary from estimates, depending upon changes in income tax laws, actual results of operations, and the final audit of tax returns by taxing authorities. Tax assessments may arise several years after tax returns have been filed. Changes in the estimates and assumptions used for calculating income tax expense and potential differences in actual results from estimates could have a material impact on our results of operations and financial condition.
We recognize deferred tax assets to the extent that we believe these assets are more likely than not to be realized. In making such a determination, we consider all available positive and negative evidence, including future reversals of existing taxable temporary differences, projected future taxable income, tax-planning strategies and results of recent operations.
We establish a valuation allowance against our deferred tax assets when, based upon the weight of all available evidence, we believe it is more likely than not that some portion or all of the deferred tax assets will not be realized. As of
December 31, 2018
and
2017
, we have established valuation allowances for our deferred tax assets that, in our judgment, will not be realized. In making this determination, we have considered the relative impact of all of the available positive and negative evidence regarding future sources of taxable income and tax planning strategies. However, there could be a material impact to our effective tax rate if there is a significant change in our estimates of future taxable income and tax planning strategies. If and when our estimates change, or there is a change in the gross balance of deferred tax assets or liabilities causing the need to reassess the realizability of deferred tax assets, then the valuation allowances are adjusted through the provision for income taxes in the period in which this determination is made. Refer to
Note 13
of our Consolidated Financial Statements included in Item 8 of this Report for additional information regarding our net deferred tax assets and related income tax expense (benefit).
Recently Issued Accounting Standards
Refer to
Note 1
of the Consolidated Financial Statements included in Item 8 of this Report for information regarding recently issued accounting standards.
42
Item 7A. Quantitative and Qualitative Disclosures About Market Risk
The information under this Item is not required to be provided by smaller reporting companies.
43
Item 8. Financial Statements and Supplementary Data
Advanced Emissions Solutions, Inc.
Index to Financial Statements
|
Advanced Emissions Solutions, Inc.
|
|
|
Consolidated Financial Statements:
|
|
44
Report of Independent Registered Public Accounting Firm
To the Stockholders and the Board of Directors of
Advanced Emissions Solutions, Inc. and Subsidiaries
Opinion on the Financial Statements
We have audited the accompanying consolidated balance sheets of Advanced Emissions Solutions, Inc. and subsidiaries (the “Company”) as of December 31, 2018 and 2017, the related consolidated statements of operations, stockholders’ equity and cash flows for the years then ended, and the related notes (collectively referred to as the “consolidated financial statements”). In our opinion, the consolidated financial statements present fairly, in all material respects, the consolidated financial position of the Company as of December 31, 2018 and 2017, and the consolidated results of its operations and its cash flows for the two years then ended, in conformity with accounting principles generally accepted in the United States of America.
We also have audited, in accordance with the standards of the Public Company Accounting Oversight Board (United States) (“PCAOB”), the Company’s internal control over financial reporting as of December 31, 2018, based on criteria established in
Internal Control - Integrated Framework (2013)
issued by the Committee of Sponsoring Organizations of the Treadway Commission, and our report dated March 18, 2019 expressed an unqualified opinion on the Company’s internal control over financial reporting.
Change in Accounting Principle
As discussed in Note 1 to the consolidated financial statements, the Company changed its method of accounting for revenues from contracts with customers in 2018 due to the adoption of Accounting Standards Codification (ASC) 606.
Basis for Opinion
These consolidated financial statements are the responsibility of the Company’s management. Our responsibility is to express an opinion on the Company’s consolidated financial statements based on our audit
s
. We are a public accounting firm registered with the PCAOB and are required to be independent with respect to the Company in accordance with the U.S. federal securities laws and the applicable rules and regulations of the Securities and Exchange Commission and the PCAOB.
We conducted our audits in accordance with the standards of the PCAOB. Those standards require that we plan and perform the audit to obtain reasonable assurance about whether the consolidated financial statements are free of material misstatement, whether due to error or fraud. Our audits included performing procedures to assess the risks of material misstatement of the consolidated financial statements, whether due to error or fraud, and performing procedures to respond to those risks. Such procedures included examining, on a test basis, evidence regarding the amounts and disclosures in the consolidated financial statements. Our audits also included evaluating the accounting principles used and significant estimates made by management, as well as evaluating the overall presentation of the consolidated financial statements. We believe that our audits provide a reasonable basis for our opinion.
/s/ Moss Adams LLP
Denver, Colorado
March 18, 2019
We have served as the Company’s auditor since 2017.
45
Advanced Emissions Solutions, Inc. and Subsidiaries
Consolidated Balance Sheets
|
As of December 31,
|
||||||||
|
(in thousands, except share data)
|
2018
|
2017
|
||||||
|
ASSETS
|
||||||||
|
Current assets:
|
||||||||
|
Cash, cash equivalents and restricted cash
|
$
|
18,577
|
|
$
|
30,693
|
|
||
|
Receivables, net
|
9,554
|
|
1,113
|
|
||||
|
Receivables, related party
|
4,284
|
|
3,247
|
|
||||
|
Inventories
|
21,791
|
|
74
|
|
||||
|
Prepaid expenses and other assets
|
5,570
|
|
1,761
|
|
||||
|
Total current assets
|
59,776
|
|
36,888
|
|
||||
|
Restricted cash, long-term
|
5,195
|
|
—
|
|
||||
|
Property and equipment, net of accumulated depreciation of $1,499 and $1,486, respectively
|
42,697
|
|
410
|
|
||||
|
Intangible assets, net
|
4,830
|
|
805
|
|
||||
|
Equity method investments
|
6,634
|
|
4,351
|
|
||||
|
Deferred tax assets
|
32,539
|
|
38,661
|
|
||||
|
Other long-term assets
|
7,993
|
|
1,503
|
|
||||
|
Total Assets
|
$
|
159,664
|
|
$
|
82,618
|
|
||
|
LIABILITIES AND STOCKHOLDERS’ EQUITY
|
||||||||
|
Current liabilities:
|
||||||||
|
Accounts payable
|
$
|
6,235
|
|
$
|
1,000
|
|
||
|
Accrued payroll and related liabilities
|
8,279
|
|
1,384
|
|
||||
|
Current portion of borrowings
|
24,067
|
|
—
|
|
||||
|
Other current liabilities
|
2,138
|
|
4,494
|
|
||||
|
Total current liabilities
|
40,719
|
|
6,878
|
|
||||
|
Long-term portion of borrowings
|
50,058
|
|
—
|
|
||||
|
Other long-term liabilities
|
940
|
|
2,285
|
|
||||
|
Total Liabilities
|
91,717
|
|
9,163
|
|
||||
|
Commitments and contingencies (Notes 7 and 8)
|
|
|
||||||
|
Stockholders’ equity:
|
||||||||
|
Preferred stock: par value of $.001 per share, 50,000,000 shares authorized, none outstanding
|
—
|
|
—
|
|
||||
|
Common stock: par value of $.001 per share, 100,000,000 shares authorized, 22,640,677 and 22,465,821 shares issued and 18,576,489 and 20,752,055 shares outstanding at December 31, 2018 and 2017, respectively
|
23
|
|
22
|
|
||||
|
Treasury stock, at cost: 4,064,188 and 1,713,766 shares as of December 31, 2018 and 2017, respectively
|
(41,740
|
)
|
(16,397
|
)
|
||||
|
Additional paid-in capital
|
96,750
|
|
105,308
|
|
||||
|
Retained earnings (accumulated deficit)
|
12,914
|
|
(15,478
|
)
|
||||
|
Total stockholders’ equity
|
67,947
|
|
73,455
|
|
||||
|
Total Liabilities and Stockholders’ equity
|
$
|
159,664
|
|
$
|
82,618
|
|
||
See Notes to the Consolidated Financial Statements.
46
Advanced Emissions Solutions, Inc. and Subsidiaries
Consolidated Statements of Operations
|
Years Ended December 31,
|
||||||||
|
(in thousands, except per share data)
|
2018
|
2017
|
||||||
|
Revenues:
|
||||||||
|
Consumables
|
$
|
8,733
|
|
$
|
4,246
|
|
||
|
License royalties, related party
|
15,140
|
|
9,672
|
|
||||
|
Equipment sales
|
72
|
|
31,446
|
|
||||
|
Total revenues
|
23,945
|
|
45,364
|
|
||||
|
Operating expenses:
|
||||||||
|
Consumables cost of revenue, exclusive of depreciation and amortization
|
6,606
|
|
3,434
|
|
||||
|
Equipment cost of revenue, exclusive of depreciation and amortization
|
(353
|
)
|
28,451
|
|
||||
|
Payroll and benefits
|
10,639
|
|
7,669
|
|
||||
|
Rent and occupancy
|
1,141
|
|
795
|
|
||||
|
Legal and professional fees
|
8,230
|
|
4,354
|
|
||||
|
General and administrative
|
3,359
|
|
4,014
|
|
||||
|
Depreciation, amortization, depletion, and accretion
|
723
|
|
789
|
|
||||
|
Total operating expenses
|
30,345
|
|
49,506
|
|
||||
|
Operating loss
|
(6,400
|
)
|
(4,142
|
)
|
||||
|
Other income (expense):
|
||||||||
|
Earnings from equity method investments
|
54,208
|
|
53,843
|
|
||||
|
Interest income
|
239
|
|
54
|
|
||||
|
Interest expense
|
(2,151
|
)
|
(3,024
|
)
|
||||
|
Litigation settlement and royalty indemnity expense, net
|
—
|
|
3,269
|
|
||||
|
Other
|
(19
|
)
|
2,025
|
|
||||
|
Total other income
|
52,277
|
|
56,167
|
|
||||
|
Income before income tax expense
|
45,877
|
|
52,025
|
|
||||
|
Income tax expense
|
10,423
|
|
24,152
|
|
||||
|
Net income
|
$
|
35,454
|
|
$
|
27,873
|
|
||
|
Earnings per common share (Note 1):
|
||||||||
|
Basic
|
$
|
1.78
|
|
$
|
1.30
|
|
||
|
Diluted
|
$
|
1.76
|
|
$
|
1.29
|
|
||
|
Weighted-average number of common shares outstanding:
|
||||||||
|
Basic
|
19,901
|
|
21,367
|
|
||||
|
Diluted
|
20,033
|
|
21,413
|
|
||||
|
Cash dividends declared per common share outstanding:
|
$
|
1.00
|
|
$
|
0.75
|
|
||
See Notes to the Consolidated Financial Statements.
47
Advanced Emissions Solutions, Inc. and Subsidiaries
Consolidated Statements of Changes in Stockholders’ Equity
|
Common Stock
|
Treasury Stock
|
|||||||||||||||||||||||||
|
(in thousands, except share data)
|
Shares
|
Amount
|
Shares
|
Amount
|
Additional Paid-in Capital
|
Retained Earnings/(Accumulated Deficit)
|
Total Stockholders’
Equity (Deficit) |
|||||||||||||||||||
|
Balances, January 1, 2017
|
22,322,022
|
|
$
|
22
|
|
—
|
|
$
|
—
|
|
$
|
119,494
|
|
$
|
(43,351
|
)
|
$
|
76,165
|
|
|||||||
|
Stock-based compensation
|
199,734
|
|
—
|
|
—
|
|
—
|
|
2,209
|
|
—
|
|
2,209
|
|
||||||||||||
|
Repurchase of shares to satisfy tax withholdings
|
(55,935
|
)
|
—
|
|
—
|
|
—
|
|
(566
|
)
|
—
|
|
(566
|
)
|
||||||||||||
|
Dividends declared on common stock
|
—
|
|
—
|
|
—
|
|
—
|
|
(15,829
|
)
|
—
|
|
(15,829
|
)
|
||||||||||||
|
Repurchase of common shares
|
—
|
|
—
|
|
(1,713,766
|
)
|
(16,397
|
)
|
—
|
|
—
|
|
(16,397
|
)
|
||||||||||||
|
Net income
|
—
|
|
—
|
|
—
|
|
—
|
|
—
|
|
27,873
|
|
27,873
|
|
||||||||||||
|
Balances, December 31, 2017
|
22,465,821
|
|
$
|
22
|
|
(1,713,766
|
)
|
$
|
(16,397
|
)
|
$
|
105,308
|
|
$
|
(15,478
|
)
|
$
|
73,455
|
|
|||||||
|
Cumulative effect of change in accounting principle (Note 6)
|
—
|
|
—
|
|
—
|
|
—
|
|
—
|
|
2,950
|
|
2,950
|
|
||||||||||||
|
Stock-based compensation
|
217,174
|
|
1
|
|
—
|
|
—
|
|
2,489
|
|
—
|
|
2,490
|
|
||||||||||||
|
Issuance of stock upon exercise of options, net
|
18,667
|
|
—
|
|
—
|
|
—
|
|
—
|
|
—
|
|
—
|
|
||||||||||||
|
Repurchase of shares to satisfy tax withholdings
|
(60,985
|
)
|
—
|
|
—
|
|
—
|
|
(769
|
)
|
—
|
|
(769
|
)
|
||||||||||||
|
Dividends declared on common stock
|
—
|
|
—
|
|
—
|
|
—
|
|
(10,278
|
)
|
(10,012
|
)
|
(20,290
|
)
|
||||||||||||
|
Repurchase of common shares
|
—
|
|
—
|
|
(2,350,422
|
)
|
(25,343
|
)
|
—
|
|
—
|
|
(25,343
|
)
|
||||||||||||
|
Net income
|
—
|
|
—
|
|
—
|
|
—
|
|
—
|
|
35,454
|
|
35,454
|
|
||||||||||||
|
Balances, December 31, 2018
|
22,640,677
|
|
$
|
23
|
|
(4,064,188
|
)
|
$
|
(41,740
|
)
|
$
|
96,750
|
|
$
|
12,914
|
|
$
|
67,947
|
|
|||||||
See Notes to the Consolidated Financial Statements.
48
Advanced Emissions Solutions, Inc. and Subsidiaries
Consolidated Statements of Cash Flows
|
Years Ended December 31,
|
||||||||
|
(in thousands)
|
2018
|
2017
|
||||||
|
Cash flows from operating activities
|
||||||||
|
Net income
|
$
|
35,454
|
|
$
|
27,873
|
|
||
|
Adjustments to reconcile net income to net cash used in operating activities:
|
||||||||
|
Increase (decrease) in valuation allowance on deferred tax assets
|
4,462
|
|
(474
|
)
|
||||
|
Depreciation, amortization, depletion, and accretion
|
723
|
|
789
|
|
||||
|
Amortization of debt issuance costs
|
94
|
|
109
|
|
||||
|
Provision for accounts receivable and other receivables
|
153
|
|
385
|
|
||||
|
Share-based compensation expense, net
|
2,490
|
|
2,209
|
|
||||
|
Earnings from equity method investments
|
(54,208
|
)
|
(53,843
|
)
|
||||
|
Other non-cash items, net
|
136
|
|
508
|
|
||||
|
Changes in operating assets and liabilities, net of effects of acquired businesses:
|
||||||||
|
Receivables
|
(1,847
|
)
|
6,743
|
|
||||
|
Related party receivables
|
(1,037
|
)
|
(1,313
|
)
|
||||
|
Prepaid expenses and other assets
|
(757
|
)
|
(351
|
)
|
||||
|
Costs incurred on uncompleted contracts
|
15,945
|
|
27,048
|
|
||||
|
Inventories
|
237
|
|
—
|
|
||||
|
Deferred tax asset, net
|
771
|
|
23,208
|
|
||||
|
Other long-term assets
|
(753
|
)
|
41
|
|
||||
|
Accounts payable
|
(197
|
)
|
(920
|
)
|
||||
|
Accrued payroll and related liabilities
|
(59
|
)
|
(738
|
)
|
||||
|
Other current liabilities
|
(869
|
)
|
(1,586
|
)
|
||||
|
Billings on uncompleted contracts
|
(15,945
|
)
|
(30,140
|
)
|
||||
|
Other long-term liabilities
|
(182
|
)
|
154
|
|
||||
|
Legal settlements and accruals
|
—
|
|
(16,088
|
)
|
||||
|
Distributions from equity method investees, return on investment
|
5,500
|
|
4,638
|
|
||||
|
Net cash used in operating activities
|
(9,889
|
)
|
(11,748
|
)
|
||||
49
|
Years Ended December 31,
|
||||||||
|
(in thousands)
|
2018
|
2017
|
||||||
|
Cash flows from investing activities
|
||||||||
|
Distributions from equity method investees in excess of cumulative earnings
|
$
|
47,175
|
|
$
|
48,875
|
|
||
|
Acquisition of business, net of cash acquired
|
(62,501
|
)
|
—
|
|
||||
|
Acquisition of property, equipment, and intangible assets, net
|
(467
|
)
|
(428
|
)
|
||||
|
Purchase of and contributions to equity method investee
|
(750
|
)
|
(61
|
)
|
||||
|
Net cash (used in) provided by investing activities
|
(16,543
|
)
|
48,386
|
|
||||
|
Cash flows from financing activities
|
||||||||
|
Borrowings, net of debt discount - related party
|
67,900
|
|
—
|
|
||||
|
Debt issuance costs paid
|
(2,036
|
)
|
—
|
|
||||
|
Dividends paid
|
(20,165
|
)
|
(15,690
|
)
|
||||
|
Repurchase of common shares
|
(25,343
|
)
|
(16,397
|
)
|
||||
|
Repurchase of shares to satisfy tax withholdings
|
(769
|
)
|
(566
|
)
|
||||
|
Borrowings on Line of Credit
|
—
|
|
808
|
|
||||
|
Repayments on Line of Credit
|
—
|
|
(808
|
)
|
||||
|
Short-term borrowing loan costs
|
—
|
|
(236
|
)
|
||||
|
Other
|
(76
|
)
|
—
|
|
||||
|
Net cash provided by (used in) financing activities
|
19,511
|
|
(32,889
|
)
|
||||
|
Increase (Decrease) in Cash, Cash Equivalents and Restricted Cash
|
(6,921
|
)
|
3,749
|
|
||||
|
Cash, Cash Equivalents and Restricted Cash, beginning of year
|
30,693
|
|
26,944
|
|
||||
|
Cash, Cash Equivalents and Restricted Cash, end of year
|
$
|
23,772
|
|
$
|
30,693
|
|
||
|
Supplemental disclosure of cash flow information:
|
||||||||
|
Cash paid for interest
|
$
|
1,400
|
|
$
|
3,644
|
|
||
|
Cash paid for income taxes, net of refunds received
|
$
|
7,460
|
|
$
|
1,672
|
|
||
|
Supplemental disclosure of non-cash investing and financing activities:
|
||||||||
|
Acquisition consideration payable
|
$
|
661
|
|
$
|
—
|
|
||
|
Dividends payable
|
$
|
125
|
|
$
|
139
|
|
||
See Notes to the Consolidated Financial Statements.
50
Advanced Emissions Solutions, Inc. and Subsidiaries
Notes to Consolidated Financial Statements
Note 1
- Summary of Operations and Significant Accounting Policies
Nature of Operations
Advanced Emissions Solutions, Inc. ("ADES" or the "Company") is a Delaware corporation with its principal office located in Highlands Ranch, Colorado and operations located in Louisiana. The Company is principally engaged in consumable mercury control options including powdered activated carbon (“PAC”) and chemical technologies. The Company's proprietary environmental technologies in the power generation and industrial ("PGI") market enable customers to reduce emissions of mercury and other pollutants, maximize utilization levels and improve operating efficiencies to meet the challenges of existing and pending emission control regulations. The Company generates substantial earnings and tax credits under Section 45 ("Section 45 tax credits") of the Internal Revenue Code ("IRC") from its equity investments in certain entities and earns royalties for technologies that are licensed to Tinuum Group, LLC, a Colorado limited liability company ("Tinuum Group"). Such technologies allow Tinuum Group to provide their customers with various solutions to enhance combustion and reduced emissions of nitrogen oxide ("NO
x
") and mercury from coal burned to generate electrical power. The Company’s sales occur principally throughout the United States. See
Note 14
for additional information regarding the Company's operating segments.
On
December 7, 2018
(the "Acquisition Date"), the Company acquired (the "Carbon Solutions Acquisition")
100%
of the equity interests of ADA Carbon Solutions, LLC (“Carbon Solutions”). Carbon Solutions is a manufacturer and seller of activated carbon ("AC") and the North American leader in mercury capture using PAC for the coal-fired power plant, industrial and water treatment markets. Carbon Solutions also owns an associated lignite mine that supplies the raw material for the powdered activated carbon plant. Carbon Solutions was formed in 2008 as a 50/50 joint venture by the Company and Energy Capital Partners LLC. The Company relinquished its ownership in 2011 as part of a legal settlement agreement as described in the Company's Annual Report on Form 10-K for the fiscal year ended December 31, 2017. The Company acquired Carbon Solutions primarily to expand the Company's product offerings within the mercury control industry and other complimentary AC markets.
Principles of Consolidation
The Consolidated Financial Statements include accounts of wholly-owned subsidiaries. All significant intercompany balances and transactions have been eliminated in consolidation.
All investments in partially owned entities for which the Company has greater-than-20% ownership are accounted for using the equity method based on the legal form of the Company's ownership percentage and the applicable ownership percentage of the entity and are included in the
Equity method investments
line item in the
Consolidated Balance Sheets
. As of
December 31, 2018
, the Company holds equity interests of
42.5%
and
50.0%
in Tinuum Group and Tinuum Services, LLC ("Tinuum Services"), respectively. Tinuum Group is deemed to be variable interest entity ("VIE") under the VIE model of consolidation, but the Company does not consolidate Tinuum Group as it is not deemed to be its primary beneficiary.
Cash, cash equivalents and restricted cash
Cash, cash equivalents include bank deposits and other highly liquid investments purchased with an original maturity of three months or less.
As of
December 31, 2018
, restricted cash primarily consisted of minimum cash balance requirements under the Term Loan and Security Agreement (the "Senior Term Loan") and is classified according to the period at which it will no longer be restricted. As of
December 31, 2017
, all cash and cash equivalents were unrestricted and all cash requirements for contractual performance guarantees and payments were satisfied under the borrowing availability of the 2013 Loan and Security Agreement (the "Line of Credit").
Inventories
Inventories are stated at the lower of average cost or net realizable value and consist principally of raw materials and finished goods related to the Company's PAC and chemical product offerings. The cost of inventory is determined using the average cost method. Inventory acquired was measured at fair value as of the Acquisition Date.
Inventories are periodically reviewed for both potential obsolescence and potential declines in anticipated selling prices. In this review, the Company makes assumptions about the future demand for and market value of the inventory, and based on these assumptions estimates the amount of any obsolete, unmarketable, slow moving or overvalued inventory. The Company will write down the value of inventories by an amount equal to the difference between the cost of the inventory and its estimated net realizable value.
Additional details regarding Inventory balances are included in
Note 3
.
51
Advanced Emissions Solutions, Inc. and Subsidiaries
Notes to Consolidated Financial Statements
Intangible Assets
Intangible assets consist of patents, licensed technology, customer relationships, developed technologies and trade names.
The Company has developed technologies resulting in patents being granted by the U.S. Patent and Trademark Office. Legal costs associated with securing the patent are capitalized and amortized over the legal or useful life beginning on the patent filing date. The remaining intangible assets were recorded at fair value in connection with the Carbon Solutions Acquisition.
The following table details the components of the Company's intangible assets:
|
As of December 31,
|
||||||||||||||||||
|
2018
|
2017
|
|||||||||||||||||
|
(in thousands, except years)
|
Weighted average amortization (in years)
|
Initial Cost
|
Net of Accumulated Amortization
|
Initial Cost
|
Net of Accumulated Amortization
|
|||||||||||||
|
Customer relationships
|
5
|
$
|
2,100
|
|
$
|
2,071
|
|
$
|
—
|
|
$
|
—
|
|
|||||
|
Patents
|
16
|
1,244
|
|
891
|
|
1,079
|
|
805
|
|
|||||||||
|
Developed technology
|
5
|
1,600
|
|
1,578
|
|
—
|
|
—
|
|
|||||||||
|
Trade name
|
2
|
300
|
|
290
|
|
—
|
|
—
|
|
|||||||||
|
Total
|
$
|
5,244
|
|
$
|
4,830
|
|
$
|
1,079
|
|
$
|
805
|
|
||||||
Included in the
Consolidated Statements of Operations
is amortization expense related to intangible assets of
$0.2 million
and
$0.1 million
for the years ended
December 31, 2018
and
2017
, respectively. The estimated future amortization expense for existing intangible assets as of
December 31, 2018
is expected to be
$0.9 million
for each of the five succeeding fiscal years.
Investments
The investments in entities in which the Company does not have a controlling interest (financial or operating), but where it has the ability to exercise significant influence over operating and financial policies, are accounted for using the equity method of accounting. Whether or not the Company exercises significant influence with respect to an investee depends on an evaluation of several factors including, among others, representation on the investee company’s board of directors and the Company's ownership level. Under the equity method of accounting, an investee company’s accounts are not reflected within the Company’s
Consolidated Balance Sheets
and
Consolidated Statements of Operations
; however, the Company’s share of the earnings or losses of the investee company is reported in the
Earnings from equity method investments
line item in the
Consolidated Statements of Operations
, and the Company’s carrying value in an equity method investee company is reported in the
Equity method investments
line in the
Consolidated Balance Sheets
.
When the Company receives distributions in excess of the carrying value of the investment and has not guaranteed any obligations of the investee, nor is it required to provide additional funding to the investee, the Company recognizes such excess distributions as equity method earnings in the period the distributions occur. When the investee subsequently reports income, the Company does not record its share of such income until it equals the amount of distributions in excess of carrying value that were previously recognized in income. During the years ended
December 31, 2018
and
2017
, the Company had no guarantees or requirements to provide additional funding to investees.
Additionally, when the Company's carrying value in an equity method investment is zero and the Company has not guaranteed any obligations of the investee, nor is it required to provide additional funding to the investee, the Company will not recognize its share of any reported losses by the investee until future earnings are generated to offset previously unrecognized losses. As a result, equity income or loss reported on the Company's Consolidated Statements of Operations for certain equity method investees may differ from a mathematical calculation of net income or loss attributable to its equity interest based upon the percentage ownership of the Company's equity interest and the net income or loss attributable to equity owners as shown on the investee company's statements of operations. Likewise, distributions from equity method investees are reported on the
Consolidated Statements of Cash Flows
as “return on investment” within Operating cash flows until such time as the carrying value in an equity method investee company is reduced to zero; thereafter, such distributions are reported as “distributions in excess of cumulative earnings” within Investing cash flows. See
Note 5
for additional information regarding the Company's equity method investments.
Investments in partially-owned subsidiaries for which the Company has less-than-20% ownership are accounted for in accordance with accounting principles generally accepted in the United States ("U.S. GAAP") applicable to equity investments that do not qualify for the equity method of accounting. The Company evaluates these types of investments for changes in fair value and, if there is change, recognizes the change in the Consolidated Statement of Operations. If no such events or changes in circumstances have occurred related to these types of investments, the fair value is estimated only if practicable to do so.
52
Advanced Emissions Solutions, Inc. and Subsidiaries
Notes to Consolidated Financial Statements
Property, Plant and Equipment
Property, plant and equipment is stated at cost less accumulated depreciation and includes leasehold improvements. Depreciation on assets is computed using the straight-line method over the lesser of the estimated useful lives of the related assets or the lease term (ranging from
1
to
31
years). Maintenance and repairs that do not extend the useful life of the respective asset are charged to Operating expenses as incurred. When assets are retired, or otherwise disposed of, the property accounts are relieved of costs and accumulated depreciation and any resulting gain or loss is credited or charged to income. The Company performs an evaluation of the recoverability of the carrying value of its property, plant and equipment to determine if facts and circumstances indicate that their carrying value may be impaired and if any adjustment is warranted. Amortization of capital leased assets is included in depreciation expense and is calculated using the straight-line method over the term of the lease.
Other Assets
Mine Development Costs
Mine development costs are stated at cost less accumulated depletion and include acquisition costs, the cost of other development work and mitigation costs. Costs are amortized over the estimated life of the related mine reserves, which is
18
years. The Company performs an evaluation of the recoverability of the carrying value of mine development costs to determine if facts and circumstances indicate that their carrying value may be impaired and if any adjustment is warranted. Mine development costs acquired in the Carbon Solutions Acquisition were measured at fair value as of the Acquisition Date. Mine development costs are reported in the "Other assets" line item on the Consolidated Balance Sheet.
Spare Parts
Spare parts include critical spares required to support plant operations. Parts and supply costs are determined using the lower of cost or estimated replacement cost. Parts are recorded as maintenance expenses in the period in which they are consumed. Spare parts acquired in the Carbon Solutions Acquisition were measured at fair value as of the Acquisition Date. Spare parts are reported in the "Other assets" line item on the Consolidated Balance Sheet.
Revenue Recognition
On January 1, 2018, the Company adopted ASC 606 -
Revenue from Contracts with Customers
("ASC 606") using the modified retrospective method applied to those contracts that were not completed as of January 1, 2018. The Company recognized the cumulative effect of initially applying ASC 606 to the opening balance of the Accumulated deficit. The comparative information has not been restated and continues to be reported under the accounting standards in effect for those periods. See further discussion of the impact of the adoption of ASC 606 in
Note 6
.
Effective with the Acquisition Date, Carbon Solutions adopted ASC 606 using the modified retrospective method applied to those contracts that were not completed as of December 7, 2018. There was no impact to the consolidated financial statements of the Company upon Carbon Solutions’ adoption of ASC 606, except for a reclassification from revenues to cost of revenue for Carbon Solutions for freight costs billed to its customers in conjunction with product sales, which historically were recorded as revenues. This reclassification of freight costs billed to customers to cost of revenue results in an offset to Carbon Solutions' actual freight costs recorded in cost of revenue and has no impact to Carbon Solutions' operating results. This presentation is consistent with ADES' policy of reporting freight costs, net of freight costs billed to customers, under cost of revenue. ADES adopted this policy effective with its adoption of ASC 606 on January 1, 2018.
The Company recognizes revenue from a contract with a customer when a performance obligation under the terms of a contract with a customer is satisfied, which is when the customer controls the promised goods or services that are transferred in satisfaction of the performance obligation. Revenue is measured as the amount of consideration that is expected to be received in exchange for transferring goods or providing services, and the transaction price is generally fixed and generally does not contain variable or noncash consideration. In addition, the Company’s contracts with customers generally do not contain customer refund or return provisions or other similar obligations. Transfer of control and satisfaction of performance obligations are further discussed in each of the revenue components listed below.
The Company uses estimates and judgments in determining the nature and timing of satisfaction of performance obligations, the standalone selling price ("SSP") of performance obligations and the allocation of the transaction price to multiple performance obligations.
The Company’s principal revenue components are Consumables sales and License royalties.
Consumables
Consumables are comprised of the sale of AC and chemicals for mercury capture for the coal-fired power plant, industrial and water treatment markets. Customer contracts for consumables are short duration and performance obligations generally do not extend beyond one year. Certain customer contracts for consumables are comprised of evaluation tests of the Company's
53
Advanced Emissions Solutions, Inc. and Subsidiaries
Notes to Consolidated Financial Statements
consumables' effectiveness and efficiency in reducing emissions. These contracts entail the delivery of consumables to the customer and the Company's evaluation of results of emissions reduction over the term of the contract. Under these types of arrangements, which are generally for durations that are short term, the Company has determined that the customer is simultaneously receiving benefits of emissions reduction from the consumption of the consumables over the testing period and this represents a single performance obligation that is satisfied over time. This determination may require significant judgment. The Company recognizes revenue over time using an input model that is generally based on the cost of consumables used by the customer during the testing period. The use of an input model and the use of total costs as the measure of progress in the satisfaction of the performance obligations may require significant judgment. In addition, under these types of contracts, the Company has determined that the services performed and related costs incurred by the Company during the testing period represent costs to fulfill a contract.
License royalties, related party
The Company generates revenues from royalties ("M-45 Royalties") earned under a licensing arrangement ("M-45 License") of its M-45
TM
and M-45-PC
TM
emissions control technologies ("M-45 Technology") between the Company and Tinuum Group. The Company recognizes M-45 Royalties at a point in time based on the use of the M-45 Technology at certain RC facilities or through Tinuum Group’s use of licensed technology for rates in excess of amounts allowed for RC application. The amount of M-45 Royalties recognized is generally based on a percentage of pre-tax margins (as defined in the M-45 License) of the RC facilities using the M-45 Technology.
Equipment sales
Prior to 2017, the Company entered into construction-type contracts that entailed the design and construction of emissions control systems ("extended equipment contracts"). Revenues from such extended equipment contracts were recorded using the percentage of completion, cost to cost method based on costs incurred to date compared with total estimated contract costs. However, if the Company did not have sufficient information to estimate either costs incurred or total estimated costs for extended equipment contracts at the time contracts were entered into, the completed contract method was used. Under the completed contract method, revenues and costs from extended equipment contracts are deferred and recognized when contract obligations are substantially complete. The Company defined substantially complete as delivery of equipment and start-up at the customer site or, as applicable to dry sorbent injection (“DSI”) systems contracts, the completion of any major warranty service period. Provisions for estimated losses on uncompleted contracts were recognized when it was determined that a loss was probable.
For the year ended December 31, 2017, the Company did not have sufficient information to measure ongoing performance for its extended equipment contracts and accounted for these contracts under the completed contract method. For uncompleted contracts as of December 31, 2017, the Company reported deferred revenue and related costs in the
Costs in excess of billings on uncompleted contracts
or
Billings in excess of costs on uncompleted contracts
in the
Consolidated Balance Sheets
.
Historically, the Company also entered into other non-extended equipment contracts for which the Company recognized revenues as services to build equipment systems were performed or as equipment was delivered.
Arrangements with Multiple Performance Obligations
Contracts with customers may include multiple performance obligations, which are comprised of the sale of chemicals, equipment and services performed as part of an emissions reduction arrangement. For such arrangements, the Company allocates revenue to each performance obligation based on its relative SSP. When a directly observable SSP for a performance obligation is not available, the Company primarily estimates SSPs based on the expected cost plus a margin method. These estimates as well as the timing of the satisfaction of performance obligations associated with the services component represent significant judgments made by the Company. These arrangements are generally short duration and performance obligations generally do not extend beyond one year.
Contract Assets and Liabilities
Contract assets are comprised of unbilled receivables and are included in Receivables, net in the Condensed Consolidated Balance Sheet. Unbilled receivables represent a conditional right to consideration in exchange for goods or services transferred to a customer.
Trade receivables represent an unconditional right to consideration in exchange for goods or services transferred to a customer. The Company invoices its customers in accordance with the terms of the contract. Credit terms are generally net 30 from the date of invoice. The timing between the satisfaction of performance obligations and when payment is due from the customer is generally not significant. The Company records allowances for doubtful trade receivables when it is probable that the balances will not be collected. Bad debt expense is included within the General and administrative line item in the Consolidated Statements of Operations.
54
Advanced Emissions Solutions, Inc. and Subsidiaries
Notes to Consolidated Financial Statements
Contract liabilities are comprised of deferred revenue, which represents an obligation to transfer goods or services to a customer for which the Company has received consideration from the customer and, if deliverable within one year or less, is included in Other current liabilities in the Condensed Consolidated Balance Sheet and, if deliverable outside of one year, is included in Other long-term liabilities in the Condensed Consolidated Balance Sheet.
Practical Expedients and Exemptions
The Company does not disclose the value of unsatisfied performance obligations for contracts with an original expected length of one year or less.
Sales and other taxes that are collected concurrently with revenue-producing activities are excluded from revenue.
The Company has elected to account for freight costs as activities to fulfill the promise to transfer the goods, and therefore these activities are also not assessed as a separate service to customers.
The Company accounts for all shipping and handling activities that occur after control of the related good transfers as fulfillment activities. These activities are included in Cost of Revenue line items of the Condensed Consolidated Statement of Operations.
The Company generally expenses sales commissions when incurred because the amortization period of the asset that the Company would have recognized is one year or less. These costs are recorded within sales and marketing expenses within the
General and administrative
line item of the Condensed Consolidated Statement of Operations.
Cost of Revenue
Costs of revenue include all labor, fringe benefits, subcontract labor, additive and coal costs, materials, equipment, supplies, travel costs and any other costs and expenses directly related to the Company’s production of revenues. The Company records estimated contract losses, if any, in the period they are determined.
Payroll and Benefits
Payroll and benefits costs include direct payroll, personnel related fringe benefits, sales and administrative staff labor costs and stock compensation expense. Payroll and benefits costs exclude direct labor included in Cost of revenue.
Rent and Occupancy
Rent and occupancy costs include rent, insurance and other occupancy-related expenses.
Legal and Professional
Legal and professional costs include external legal, audit and consulting expenses.
General and Administrative
General and administrative costs include director fees and expenses, bad debt expense, impairments and other general costs of conducting business.
Research and development costs, net of reimbursements from cost-sharing arrangements, are charged to expense in the period incurred and are reported in the
General and administrative
line item in the
Consolidated Statements of Operations
.
Asset Retirement Obligations
Reclamation obligations are recognized when incurred and recorded as liabilities at fair value. The liability is accreted over time through periodic charges to earnings. In addition, the asset retirement cost is capitalized as part of the asset’s carrying value and amortized over the life of the related asset. Reclamation costs are periodically adjusted to reflect changes in the estimated present value resulting from the passage of time and revisions to the estimates of either the timing or amount of the reclamation costs. The estimated reclamation obligation is based on when spending for an existing disturbance is expected to occur. The Company reviews, on an annual basis, unless otherwise deemed necessary, the reclamation obligation at the mine site in accordance with ASC guidance for asset retirement obligations.
Income Taxes
The Company accounts for income taxes under the asset and liability method, which requires the recognition of deferred tax assets and liabilities for the expected future tax consequences of events that have been included in the financial statements. Under this method, deferred tax assets and liabilities are determined on the basis of the differences between the financial statements and tax basis of assets and liabilities using enacted tax rates in effect for the year in which the differences are expected to reverse. The effect of a change in tax rates on deferred tax assets and liabilities is recognized in operations in the period that includes the enactment date.
55
Advanced Emissions Solutions, Inc. and Subsidiaries
Notes to Consolidated Financial Statements
The Company recognizes deferred tax assets and liabilities and maintains valuation allowances where it is more likely than not that all or a portion of deferred tax assets will not be realized. In making such a determination, the Company considers all available positive and negative evidence, including future reversals of existing taxable temporary differences, projected future taxable income, tax-planning strategies, and results of recent operations.
The Company records uncertain tax positions on the basis of a two-step process whereby (1) the Company determines whether it is more-likely-than-not that the tax positions will be sustained on the basis of the technical merits of the position and (2) for those tax positions that meet the more-likely-than-not recognition threshold, the Company recognizes the amount of tax benefit that is more than 50 percent likely to be realized upon ultimate settlement with the related tax authority.
The Company records interest expense due to the Company's share of Tinuum Group's equity method earnings for Refined Coal ("RC") facilities, in which the lease income or sale is treated as installment sales for tax purposes. IRS section 453A requires taxpayers using the installment method to pay an interest charge on the portion of the tax liability that is deferred under the installment method. The Company recognizes IRS section 453A interest ("453A interest") and other interest and penalties related to unrecognized tax benefits in the
Interest expense
line item in the
Consolidated Statements of Operations
.
Stock-Based Compensation
Stock-based compensation expense is measured at the grant date based on the estimated fair value of the stock-based award and is generally expensed on a straight-line basis over the requisite service period and/or performance period of the award. Forfeitures are recognized when incurred. These costs are recorded in the
Payroll and benefits
or
General and administrative
, for director related expense, line items in the
Consolidated Statements of Operations
.
Dividends
When a sufficient amount of available earnings exists at the time of declaration, dividends are charged as a reduction to Retained earnings in the
Consolidated Balance Sheets
when declared. If sufficient Retained earnings is not available, dividends declared are charged as a reduction to
Additional paid-in capital
in the
Consolidated Balance Sheets
.
Earnings (Loss) Per Share
Basic earnings (loss) per share is computed using the two-class method, which is an earnings allocation formula that determines earnings (loss) per share for common stock and any participating securities according to dividend and participating rights in undistributed earnings. The Company's restricted stock awards ("RSA's") granted prior to December 31, 2016 contain non-forfeitable rights to dividends or dividend equivalents and are deemed to be participating securities. RSA's granted subsequent to December 31, 2016 do not contain non-forfeitable rights to dividends and are not deemed to be participating securities.
Under the two-class method, net income (loss) for the period is allocated between common stockholders and the holders of the participating securities based on the weighted-average of common shares outstanding during the period, excluding participating, unvested RSA's ("common shares"), and the weighted-average number of participating, unvested RSA's outstanding during the period, respectively. The allocated, undistributed income for the period is then divided by the weighted-average number of common shares and participating, unvested RSA's outstanding during the period to determine basic earnings per common share and participating security for the period, respectively. Pursuant to U.S. GAAP, the Company has elected not to separately present basic or diluted earnings per share attributable to participating securities in the Consolidated Statements of Operations.
Diluted earnings per share is computed in a manner consistent with that of basic earnings per share, while considering other potentially dilutive securities. Potentially dilutive securities consist of both unvested, participating and non-participating RSA's, as well as outstanding options to purchase common stock ("Stock Options") and contingent performance stock units ("PSU's") (collectively, "Potential dilutive shares"). The dilutive effect, if any, for non-participating RSA's, Stock Options and PSU's is determined using the greater of dilution as calculated under the treasury stock method or the two-class method. Potential dilutive shares are excluded from diluted earnings (loss) per share when their effect is anti-dilutive. When there is a net loss for a period, all Potential dilutive shares are anti-dilutive and are excluded from the calculation of diluted loss per share for that period.
Each PSU represents a contingent right to receive shares of the Company’s common stock, and the number of shares may range from zero to two times the number of PSU's granted on the award date depending upon the price performance of the Company's common stock as measured against a general index and a specific peer group index over requisite performance periods. The number of Potential dilutive shares related to PSU's is based on the number of shares of the Company's common stock, if any, that would be issuable at the end of the respective reporting period, assuming that the end of the reporting period is the end of the contingency period applicable to such PSU's. See
Note 10
for additional information related to PSU's.
56
Advanced Emissions Solutions, Inc. and Subsidiaries
Notes to Consolidated Financial Statements
The following table sets forth the calculations of basic and diluted earnings (loss) per common share:
|
|
Years Ended December 31,
|
|||||||
|
(in thousands, except per share amounts)
|
2018
|
2017
|
||||||
|
Net income
|
$
|
35,454
|
|
$
|
27,873
|
|
||
|
Less: Dividends and undistributed income allocated to participating securities
|
112
|
|
171
|
|
||||
|
Income attributable to common stockholders
|
$
|
35,342
|
|
$
|
27,702
|
|
||
|
|
|
|
|
|
||||
|
Basic weighted-average number of common shares outstanding
|
19,901
|
|
21,367
|
|
||||
|
Add: dilutive effect of equity instruments
|
132
|
|
46
|
|
||||
|
Diluted weighted-average shares outstanding
|
20,033
|
|
21,413
|
|
||||
|
Earnings per share - basic
|
$
|
1.78
|
|
$
|
1.30
|
|
||
|
Earnings per share - diluted
|
$
|
1.76
|
|
$
|
1.29
|
|
||
For the years ended
December 31, 2018
and
2017
, options to purchase
0.3 million
and
0.3 million
shares of common stock for each of the years presented were outstanding, however were not included in the computation of diluted net income per share because the exercise price exceeded the average price of the underlying shares and the effect would have been anti-dilutive. For the years ended
December 31, 2018
and
2017
, options to purchase of
zero
and
0.2 million
shares of common stock, respectively, which vest based on the Company achieving specified performance targets, were outstanding, but not included in the computation of diluted net income per share because they were determined not to be contingently issuable.
Use of Estimates
The preparation of the Company’s consolidated financial statements in conformity with U.S. GAAP requires the Company’s management to make estimates and assumptions that affect the amounts reported in these financial statements and accompanying notes. Actual results could differ from those estimates. The Company makes assumptions on the following significant financial statement components including:
|
•
|
business combinations;
|
|
•
|
the carrying value of its long-lived assets;
|
|
•
|
stock compensation costs;
|
|
•
|
asset retirement obligation; and
|
|
•
|
income taxes, including the valuation allowance for deferred tax assets and uncertain tax positions.
|
Risks and Uncertainties
The Company’s earnings are significantly affected by equity earnings it receives from Tinuum Group. Tinuum Group has
19
invested RC facilities of which
11
are leased to a single customer. A majority of these leases are periodically renewed and the loss of this customer by Tinuum Group would have a significant adverse impact on its financial position, results of operations and cash flows, which in turn would have material adverse impact on the Company’s financial position, results of operations and cash flows.
Reclassifications
Certain balances have been reclassified from prior years to conform to the current year presentation.
New Accounting Guidance
In February 2016, the Financial Accounting Standards Board ("FASB") issued ASU 2016-02,
Leases (Topic 842)
("ASU 2016-02"), which requires lessees to recognize a right of use asset and related lease liability for those leases classified as operating leases at the commencement date and have lease terms of more than 12 months. This topic retains the distinction between finance leases and operating leases. ASU 2016-02 is effective for fiscal years beginning after December 15, 2018, and interim periods within those years, and must be applied under a modified retrospective transition approach for leases existing at, or entered into after, the beginning of the earliest comparative period presented in the financial statements. In July 2018, the FASB issued ASU 2018-11,
Leases (Topic 842)
: Targeted Improvements ("ASU 2018-11"). The amendments in ASU 2018-11 provide entities with an additional (and optional) transition method to adopt the new lease requirements by allowing entities to initially apply the requirements by recognizing a cumulative effect adjustment to the opening balance of retained earnings in the period of adoption. Consequently, an entity’s reporting for the comparative periods presented in the financial statements in which the entity adopts the new lease requirements would continue to be in accordance with current U.S. GAAP (Topic 840). An entity electing this additional (and optional) transition method must provide the required Topic 840 disclosures for all periods that continue to be in accordance with Topic 840. The amendments do not change the existing disclosure requirements
57
Advanced Emissions Solutions, Inc. and Subsidiaries
Notes to Consolidated Financial Statements
in Topic 840. The Company intends to adopt ASC 2016-02 effective January 1, 2019 using the additional (and optional) transition method provided under ASU 2018-11.
As of the date of this filing, the Company has materially completed its assessment of ASU 2016-02 and related amendments for the impact to the financial statements as of the adoption date, completed a detailed review of existing lease agreements, continued its review of controls and procedures that may need to be revised or added from the adoption of ASU 2016-02 and completed the documentation of the standard's financial statement impact at adoption and financial statement disclosure changes. Based on the Company's current assessment of ASU 2016-02, it has determined that at adoption it will record approximately
$6.9 million
of "right of use" assets and
$7.0 million
of incremental lease liabilities with no impact to the opening balance of Retained earnings; however, the Company is continuing to evaluate ASU 2016-02's potential additional impact to the opening balance sheet as of January 1, 2019.
Additionally, Tinuum Group plans to adopt ASU 2014-09 (Topic 606),
Revenue from Contracts with Customers
(“ASU 2014-09”) and ASU 2016-02 as of January 1, 2019. As a result of Tinuum Group’s adoption, the Company expects to record a cumulative adjustment of
$37.2 million
related to the Company's percentage of Tinuum Group's cumulative effect adjustment that will increase the Company's Retained earnings as of January 1, 2019. The Company expects that this adjustment will result in no longer having cumulative cash distributions that exceed our cumulative pro-rata share of Tinuum Group's net income. Additionally, the Company expects that we will recognize equity earnings by recording our pro-rata share of Tinuum Group’s net income rather than based upon cash distributions on a go-forward basis. Upon adoption, the Company will assess the impact of the adjustment to its income tax position.
In June 2016, the FASB issued ASU 2016-13,
Financial Instruments - Credit Losses (Topic 326) Measurement of Credit Losses on Financial Instruments
("ASU 2016-13"). The main objective of ASU 2016-13 is to provide financial statement users with more decision-useful information about the expected credit losses on financial instruments and other commitments to extend credit held by a reporting entity at each reporting date. To achieve this objective, the amendments in ASU 2016-13 replace the incurred loss impairment methodology in current U.S. GAAP with a methodology that reflects expected credit losses and requires consideration of a broader range of reasonable and supportable information to inform credit loss estimates. ASU 2016-13 is effective for fiscal years beginning after December 15, 2019, including interim periods within those years, and must be adopted under a modified retrospective method approach. Entities may adopt ASU 2016-13 earlier as of the fiscal years beginning after December 15, 2018, including interim periods within those years. The Company is currently evaluating the provisions of this guidance and assessing its impact on the Company's financial statements and disclosures. The Company does not believe this standard will have a material impact on the Company's financial statements and disclosures.
In August 2018, the FASB issued ASU 2018-13,
Fair Value Measurement (Topic 820) Disclosure Framework - Changes to the Disclosure Requirements for Fair Value Measurement
("ASU 2018-13"). The amendments in ASU 2018-13 improve the effectiveness of fair value measurement disclosures and modify the disclosure requirements on fair value measurements in Topic 820, Fair Value Measurement ("Topic 820"), based on the concepts in FASB Concepts Statement, Conceptual Framework for Financial Reporting - Chapter 8: Notes to Financial Statements, including the consideration of costs and benefits. ASU 2018-13 is effective for fiscal years, and interim periods within those fiscal years, beginning after December 15, 2019. The amendments on changes in unrealized gains and losses, the range and weighted average of significant unobservable inputs used to develop Level 3 fair value measurements, and the narrative description of measurement uncertainty should be applied prospectively for only the most recent interim or annual period presented in the initial fiscal year of adoption. All other amendments should be applied retrospectively to all periods presented upon their effective date. Early adoption is permitted upon issuance of this Update. An entity is permitted to early adopt any removed or modified disclosures upon issuance of this Update and delay adoption of the additional disclosures until their effective date. The Company is currently evaluating the provisions of this Update and assessing its impact on the Company's financial statement disclosures. The Company does not believe this standard will have a material impact on the Company's financial statement disclosures.
Note 2
- Acquisition
As described in
Note 1
, on the Acquisition Date, the Company completed the Carbon Solutions Acquisition for a total purchase price of
$75.0 million
(the "Purchase Price"). The results of Carbon Solutions have been included in the Company’s consolidated financial statements since the Acquisition Date. The fair value of the purchase consideration totaled
$66.5 million
and consisted of cash of
$65.8 million
and an additional purchase adjustment amount payable to Carbon Solutions' secured lender of
$0.7 million
, which was paid in March 2019. The Purchase Price was adjusted by assumed debt and contractual commitments of
$11.8 million
, and less cash acquired of
$3.3 million
. The Company also paid
$4.5 million
in acquisition-related costs (or transaction costs) during the year ended December 31, 2018 that are included in
Legal and professional fees
line item in the Consolidated Statement of Operations. The Company funded the cash consideration from cash on hand and the proceeds from the Senior Term Loan in the principal amount of
$70.0 million
, as more fully described in
Note 7
.
58
Advanced Emissions Solutions, Inc. and Subsidiaries
Notes to Consolidated Financial Statements
The following table summarizes the estimated fair values of the assets acquired and liabilities assumed as of the Acquisition Date:
|
Fair value of assets acquired:
|
Purchase Price Allocation
|
|||
|
Cash
|
$
|
3,284
|
|
|
|
Receivables
|
6,409
|
|
||
|
Inventories
|
22,100
|
|
||
|
Prepaid expenses and other current assets
|
2,992
|
|
||
|
Spare parts
|
3,359
|
|
||
|
Property, plant and equipment
|
43,033
|
|
||
|
Mine leases and development
|
2,500
|
|
||
|
Intangible assets
|
4,000
|
|
||
|
Other assets
|
168
|
|
||
|
Amount attributable to assets acquired
|
87,845
|
|
||
|
Fair value of liabilities assumed:
|
||||
|
Accounts payable
|
4,771
|
|
||
|
Accrued liabilities
|
7,354
|
|
||
|
Equipment leases payable
|
8,211
|
|
||
|
Mine reclamation liability
|
626
|
|
||
|
Other liabilities
|
437
|
|
||
|
Amount attributable to liabilities assumed
|
21,399
|
|
||
|
Net assets acquired
|
$
|
66,446
|
|
|
The following table represents the intangible assets identified as part of the Carbon Solutions Acquisition:
|
(in thousands)
|
Amount
|
Weighted Average Useful Life (years)
|
||||
|
Customer relationships
|
$
|
2,100
|
|
5
|
||
|
Developed technology
|
1,600
|
|
5
|
|||
|
Trade name
|
300
|
|
2
|
|||
|
Total intangibles acquired
|
$
|
4,000
|
|
|||
The amounts of revenues and income before income taxes for the period from the Acquisition Date to December 31, 2018 for Carbon Solutions are as follows:
|
(in thousands)
|
Year ended December 31, 2018
|
|||
|
Revenues
|
$
|
5,580
|
|
|
|
Net loss
|
$
|
(391
|
)
|
|
Unaudited Pro Forma Financial Information
The following represents the pro forma effects of the Carbon Solutions Acquisition as if it had occurred on January 1, 2017. The pro forma pre-tax income for each of the two years presented has been calculated after applying the Company’s accounting policies in effect for those years. In addition, pro forma net income for each of the two years presented includes: (1) the impact on Carbon Solutions of the adoption of ASC 606 effective January 1, 2018, which resulted in a reclassification of
$5.9 million
from Revenues to Cost of Revenue for freight costs billed to customers, with no impact to income from operations; (2) the reduction in depletion, depreciation and amortization resulting from the purchase price adjustments to Property, plant and equipment and Mine development costs; (3) the adjustment to interest expense from the combination of the Senior Term Loan that was used to fund the Carbon Solutions Acquisition and the elimination of certain debt of Carbon Solutions as a result of pay-offs by the Company as of the Acquisition Date; and (4) the removal of
$9.7 million
and
$0.9 million
in transaction costs incurred in 2018 and 2017, respectively, together with the income tax effect on (1) through (4). The pro forma results do not
59
Advanced Emissions Solutions, Inc. and Subsidiaries
Notes to Consolidated Financial Statements
include any anticipated synergies or other expected benefits of the Carbon Solutions Acquisition. The unaudited pro forma financial information below is not necessarily indicative of either future results of operations or results that might have been achieved had the Carbon Solutions Acquisition been consummated as of January 1, 2017.
|
Years ended December 31,
|
||||||||
|
(in thousands)
|
2018
|
2017
|
||||||
|
Revenues
|
$
|
78,591
|
|
$
|
110,663
|
|
||
|
Net income
|
$
|
31,562
|
|
$
|
32,524
|
|
||
Note 3
- Inventories
The following table summarizes the Company's inventories recorded at the lower of average cost or net realizable value as of
December 31, 2018
and
2017
:
|
As of December 31,
|
||||||||
|
(in thousands)
|
2018
|
2017
|
||||||
|
Product inventory
(1)
|
$
|
19,523
|
|
$
|
74
|
|
||
|
Raw material inventory
|
2,388
|
|
—
|
|
||||
|
Reserves
|
(120
|
)
|
—
|
|
||||
|
$
|
21,791
|
|
$
|
74
|
|
|||
(1) As of December 31, 2018, this amount includes
$5.0 million
attributed to the increase in fair value of inventory acquired.
Note 4
- Property, Plant and Equipment
The carrying basis and accumulated depreciation of property, plant and equipment at
December 31, 2018
and
2017
are:
|
Life in Years
|
As of December 31,
|
|||||||||
|
(in thousands)
|
2018
|
2017
|
||||||||
|
Land and land improvements
|
0-31
|
$
|
2,302
|
|
$
|
—
|
|
|||
|
Plant and operating equipment
|
2-31
|
32,999
|
|
—
|
|
|||||
|
Furniture and fixtures
|
1-7
|
701
|
|
262
|
|
|||||
|
Machinery and equipment
|
1-31
|
1,277
|
|
1,429
|
|
|||||
|
Leasehold improvements
|
1-3
|
249
|
|
205
|
|
|||||
|
Construction in progress
|
6,668
|
|
—
|
|
||||||
|
44,196
|
|
1,896
|
|
|||||||
|
Less accumulated depreciation
|
(1,499
|
)
|
(1,486
|
)
|
||||||
|
Total property, plant and equipment, net
|
$
|
42,697
|
|
$
|
410
|
|
||||
Included in plant and operating equipment as of December 31, 2018 is mining equipment financed under various lease facilities, and obligations due under these facilities are included in capital lease obligations in the Consolidated Balance Sheet. The total amount recorded as capital lease mining assets as of
December 31, 2018
was
$8.1 million
, net of accumulated depreciation of
$0.1 million
.
Depreciation expense for the years ended
December 31, 2018
and
2017
was
$0.5 million
and
$0.7 million
, respectively.
Note 5
- Equity Method Investments
Tinuum Group, LLC
As of
December 31, 2018
and
2017
, the Company’s ownership in Tinuum Group was
42.5%
. Tinuum Group supplies technology, equipment and technical services to cyclone-fired and other boiler users, but its primary purpose is to place into operation facilities that produce and sell RC that lower emissions and therefore qualifies for Section 45 tax credits. NexGen Refined Coal, LLC ("NexGen") and GSFS Investments I Corp. (“GSFS”), an affiliate of The Goldman Sachs Group, Inc. ("GS"), own the remaining
42.5%
and
15.0%
, respectively of Tinuum Group. GSFS' ownership interest is in the form of Class B units that do not have voting rights but provide certain preferences over ADA and NexGen as to liquidation and profit distribution, including a guaranteed
15%
annual return on GSFS' unrecovered investment balance, which is calculated as the original GSFS investment, plus a
15%
annual return thereon, less any distributions, including the allocation of Section 45 tax
60
Advanced Emissions Solutions, Inc. and Subsidiaries
Notes to Consolidated Financial Statements
credits to the members. In February 2018, the unrecovered investment balance associated with the Class B units was repaid in full.
The Company has determined that Tinuum Group is a VIE, however, the Company does not have the power to direct the activities that most significantly impact Tinuum Group's economic performance and has therefore accounted for the investment under the equity method of accounting. The Company determined the voting partners of Tinuum Group have identical voting rights, equity control interests and board control interests, and therefore, concluded that the power to direct the activities that most significantly impact Tinuum Group's economic performance was shared.
The following tables summarize the assets, liabilities and results of operations of Tinuum Group:
|
As of December 31,
|
||||||||
|
(in thousands)
|
2018
|
2017
|
||||||
|
Current assets
|
$
|
54,958
|
|
$
|
31,605
|
|
||
|
Non-current assets
|
$
|
92,991
|
|
$
|
75,055
|
|
||
|
Current liabilities
|
$
|
50,908
|
|
$
|
48,280
|
|
||
|
Non-current liabilities
|
$
|
14,446
|
|
$
|
8,350
|
|
||
|
Redeemable Class B equity
|
$
|
—
|
|
$
|
821
|
|
||
|
Members equity attributable to Class A members
|
$
|
49,102
|
|
$
|
40,452
|
|
||
|
Members equity attributable to Class B members
|
$
|
16,983
|
|
$
|
—
|
|
||
|
Noncontrolling interests
|
$
|
16,510
|
|
$
|
8,757
|
|
||
|
Years Ended December 31,
|
||||||||
|
(in thousands)
|
2018
|
2017
|
||||||
|
Gross profit
|
$
|
107,135
|
|
$
|
95,552
|
|
||
|
Operating, selling, general and administrative expenses
|
23,662
|
|
22,958
|
|
||||
|
Income from operations
|
83,473
|
|
72,594
|
|
||||
|
Other expenses
|
(5,674
|
)
|
(4,520
|
)
|
||||
|
Class B preferred return
|
(12
|
)
|
(1,712
|
)
|
||||
|
Loss attributable to noncontrolling interest
|
58,013
|
|
43,474
|
|
||||
|
Net income available to Class A and B members
|
$
|
135,800
|
|
$
|
109,836
|
|
||
|
ADES equity earnings from Tinuum Group
|
$
|
47,175
|
|
$
|
48,875
|
|
||
As shown above, the Company reported earnings from its equity investment in Tinuum Group of
$47.2 million
and
$48.9 million
for the years ended
December 31, 2018
and
2017
, respectively.
As shown in the table below, the Company’s carrying value in Tinuum Group was reduced to
zero
for all years presented as cumulative cash distributions received from Tinuum Group exceeded the Company's pro-rata share of cumulative earnings in Tinuum Group. The carrying value of the Company's investment in Tinuum Group shall remain
zero
as long as the cumulative amount of distributions received from Tinuum Group continues to exceed the Company's cumulative pro-rata share of Tinuum Group's net income available to Class A members. For periods during which the ending balance of the Company's investment in Tinuum Group is
zero
, the Company only recognizes equity earnings from Tinuum Group to the extent that cash distributions are received from Tinuum Group during the period. For periods during which the ending balance of the Company's investment is greater than
zero
(e.g., when the cumulative earnings in Tinuum Group exceeds cumulative cash distributions received), the Company recognizes its pro-rata share of Tinuum Group's net income available to Class A members for the period, less any amount necessary to recover the cumulative earnings short-fall balance as of the end of the immediately preceding period. As of
December 31, 2018
, the Company's carrying value in Tinuum Group has been reduced to
zero
, as the cumulative cash distributions received from Tinuum Group have exceeded the Company's pro-rata share of cumulative earnings in Tinuum Group. If Tinuum Group subsequently reports net income, the Company will not record its pro-rata share of such net income until the cumulative share of pro-rata income equals or exceeds the amount of its cumulative income recognized due to the receipt of cash distributions. Until such time, the Company will only report income from Tinuum Group to the extent of cash distributions received during the period.
Thus, the amount of equity earnings or loss reported on the Consolidated Statement of Operations may differ from a mathematical calculation of earnings or loss attributable to the equity interest based upon the factor of the equity interest and the net income or loss available to Class A members as shown on Tinuum Group’s statement of operations. Additionally, for periods during which the carrying value of the Company's investment in Tinuum Group is greater than zero, distributions from
61
Advanced Emissions Solutions, Inc. and Subsidiaries
Notes to Consolidated Financial Statements
Tinuum Group are reported on the Consolidated Statements of Cash Flows as "Distributions from equity method investees, return on investment" within Operating cash flows. For periods during which the carrying value of the Company's investment in Tinuum Group is zero, such cash distributions are reported on the Consolidated Statements of Cash Flows as "Distributions from equity method investees in excess of investment basis" within Investing cash flows.
The following table presents the Company's investment balance, equity earnings, cash distributions and cash distributions in excess of the investment balance for the years ended
December 31, 2017
and
December 31, 2018
(
in thousands
):
|
Description
|
Date(s)
|
Investment balance
|
ADES equity earnings (loss)
|
Cash distributions
|
Memorandum Account: Cash distributions and equity loss in (excess) of investment balance
|
|||||||||||||
|
Beginning balance
|
12/31/2016
|
$
|
—
|
|
$
|
—
|
|
$
|
—
|
|
$
|
(9,894
|
)
|
|||||
|
ADES proportionate share of net income from Tinuum Group (1)
|
2017 activity
|
$
|
46,551
|
|
$
|
46,551
|
|
$
|
—
|
|
$
|
—
|
|
|||||
|
Recovery of cash distributions in excess of investment balance (prior to cash distributions)
|
2017 activity
|
(9,894
|
)
|
(9,894
|
)
|
—
|
|
9,894
|
|
|||||||||
|
Cash distributions from Tinuum Group
|
2017 activity
|
(48,875
|
)
|
—
|
|
48,875
|
|
—
|
|
|||||||||
|
Adjustment for current year cash distributions in excess of investment balance
|
2017 activity
|
12,218
|
|
12,218
|
|
—
|
|
(12,218
|
)
|
|||||||||
|
Total investment balance, equity earnings (loss) and cash distributions
|
12/31/2017
|
$
|
—
|
|
$
|
48,875
|
|
$
|
48,875
|
|
$
|
(12,218
|
)
|
|||||
|
ADES proportionate share of net income from Tinuum Group (1)
|
2018 activity
|
$
|
57,721
|
|
$
|
57,721
|
|
$
|
—
|
|
$
|
—
|
|
|||||
|
Recovery of cash distributions in excess of investment balance (prior to cash distributions)
|
2018 activity
|
(12,218
|
)
|
(12,218
|
)
|
—
|
|
12,218
|
|
|||||||||
|
Cash distributions from Tinuum Group
|
2018 activity
|
(47,175
|
)
|
—
|
|
47,175
|
|
—
|
|
|||||||||
|
Adjustment for current year cash distributions in excess of investment balance
|
2018 activity
|
1,672
|
|
1,672
|
|
—
|
|
(1,672
|
)
|
|||||||||
|
Total investment balance, equity earnings and cash distributions
|
12/31/2018
|
$
|
—
|
|
$
|
47,175
|
|
$
|
47,175
|
|
$
|
(1,672
|
)
|
|||||
(1) The amounts of the Company's
42.5%
proportionate share of net income as shown in the table above differ from mathematical calculations of the Company’s
42.5%
equity interest in Tinuum Group multiplied by the amounts of Net Income available to Class A members as shown in the table above of Tinuum Group's results of operations due to adjustments related to the Class B preferred return.
Additional information related to Tinuum Group pursuant to Regulation S-X Rule 3-09 ("Rule 3-09") of the Securities and Exchange Act of 1934 (the "Exchange Act") is included within Item 15 - "Exhibits and Financial Statement Schedules" ("Item 15") of this Report.
Tinuum Services, LLC
In 2010, the Company, together with NexGen, formed Tinuum Services for the purpose of operating and maintaining RC facilities, including those RC facilities leased or sold to third parties. The Company has determined that Tinuum Services is not a VIE and has evaluated the consolidation analysis under the Voting Interest Model. The Company has a
50%
voting and economic interest in Tinuum Services, which is equivalent to the voting and economic interest of NexGen. Therefore, as the Company does not hold greater than
50%
of the outstanding voting interests, either directly or indirectly, it has accounted for the investment under the equity method of accounting.
As of
December 31, 2018
and
2017
, the Company’s
50%
investment in Tinuum Services was
$6.6 million
and
$4.3 million
, respectively.
62
Advanced Emissions Solutions, Inc. and Subsidiaries
Notes to Consolidated Financial Statements
The following tables summarize the assets, liabilities and results of operations of Tinuum Services:
|
|
As of December 31,
|
|||||||
|
(in thousands)
|
2018
|
2017
|
||||||
|
Current assets
|
$
|
300,288
|
|
$
|
546,681
|
|
||
|
Non-current assets
|
$
|
100,233
|
|
$
|
98,640
|
|
||
|
Current liabilities
|
$
|
219,959
|
|
$
|
178,376
|
|
||
|
Non-current liabilities
|
$
|
66,760
|
|
$
|
75,717
|
|
||
|
Equity
|
$
|
13,134
|
|
$
|
8,569
|
|
||
|
Noncontrolling interests
|
$
|
100,668
|
|
$
|
382,659
|
|
||
|
|
Years Ended December 31,
|
|||||||
|
(in thousands)
|
2018
|
2017
|
||||||
|
Gross loss
|
$
|
(85,377
|
)
|
$
|
(64,796
|
)
|
||
|
Operating, selling, general and administrative expenses
|
173,500
|
|
147,917
|
|
||||
|
Loss from operations
|
(258,877
|
)
|
(212,713
|
)
|
||||
|
Other expenses
|
37
|
|
(68
|
)
|
||||
|
Loss attributable to noncontrolling interest
|
272,905
|
|
222,707
|
|
||||
|
Net income
|
$
|
14,065
|
|
$
|
9,926
|
|
||
|
ADES equity earnings from Tinuum Services
|
$
|
7,033
|
|
$
|
4,963
|
|
||
Included within the Consolidated Statement of Operations of Tinuum Services for the years ended
December 31, 2018
and
2017
were losses related to VIE entities that are consolidated within Tinuum Services of
$272.9 million
and
$222.7 million
, respectively. These losses do not impact the Company's equity earnings from Tinuum Services as
100%
of those losses are attributable to a noncontrolling interest and eliminated in the calculations of Tinuum Services' net income attributable to the Company's interest.
The following table details the carrying value of the Company's respective equity method investments included within the
Equity method investments
line item on the
Consolidated Balance Sheets
and indicates the Company's maximum exposure to loss:
|
|
As of December 31,
|
|||||||
|
(in thousands)
|
2018
|
2017
|
||||||
|
Equity method investment in Tinuum Group
|
$
|
—
|
|
$
|
—
|
|
||
|
Equity method investment in Tinuum Services
|
6,567
|
|
4,284
|
|
||||
|
Equity method investment in other
|
67
|
|
67
|
|
||||
|
Total equity method investments
|
$
|
6,634
|
|
$
|
4,351
|
|
||
The Company evaluates the investments for impairment whenever events or changes in circumstances indicate that the carrying amount of the investment might not be recoverable.
No
impairments were recorded during the years ended
December 31, 2018
and
2017
.
The following table details the components of the Company's respective earnings or loss from equity method investments included within the
Earnings from equity method investments
line item on the
Consolidated Statements of Operations
:
|
Year ended December 31,
|
||||||||
|
(in thousands)
|
2018
|
2017
|
||||||
|
Earnings from Tinuum Group
|
$
|
47,175
|
|
$
|
48,875
|
|
||
|
Earnings from Tinuum Services
|
7,033
|
|
4,963
|
|
||||
|
Earnings from other
|
—
|
|
5
|
|
||||
|
Earnings from equity method investments
|
$
|
54,208
|
|
$
|
53,843
|
|
||
The following table details the components of the cash distributions from the Company's respective equity method investments included within the
Consolidated Statements of Cash Flows
. Distributions from equity method investees are reported on the
63
Advanced Emissions Solutions, Inc. and Subsidiaries
Notes to Consolidated Financial Statements
Consolidated Statements of Cash Flows
as “return on investment” within Operating cash flows until such time as the carrying value in an equity method investee company is reduced to
zero
; thereafter, such distributions are reported as “distributions in excess of cumulative earnings” within Investing cash flows.
|
Year ended December 31,
|
||||||||
|
(in thousands)
|
2018
|
2017
|
||||||
|
Distributions from equity method investees, return on investment
|
||||||||
|
Tinuum Services
|
$
|
5,500
|
|
$
|
4,638
|
|
||
|
Included in Operating Cash Flows
|
$
|
5,500
|
|
$
|
4,638
|
|
||
|
Distributions from equity method investees in excess of cumulative earnings
|
||||||||
|
Tinuum Group
|
$
|
47,175
|
|
$
|
48,875
|
|
||
|
Included in Investing Cash Flows
|
$
|
47,175
|
|
$
|
48,875
|
|
||
During the years ended
December 31, 2018
and
2017
, the Company, in the aggregate, made purchases of and contributions to equity method investments of
$0.8 million
and
$0.1 million
, respectively.
Note 6
- Revenues
Adoption of ASC 606
The financial statement impact from the adoption of ASC 606 as of January 1, 2018 was due to the following:
|
•
|
The recognition of revenues and related cost of revenue from Equipment Sales for three uncompleted DSI systems contracts as of December 31, 2017, which were accounted for under the guidance in ASC 605-35,
Revenue Recognition - Construction-Type and Production-Type Contracts
("ASC 605-35"). Under ASC 605-35, the Company accounted for revenues and associated cost of revenue for equipment systems from inception of the contract under the completed contract method and recognized revenue and cost of revenue when the equipment systems were deemed substantially complete. As of December 31, 2017, none of the DSI systems had met the revenue recognition criteria under the completed contract method. As of January 1, 2018, the Company determined that the performance obligation associated with each DSI system has been satisfied under ASC 606 guidance.
|
|
•
|
The recognition of revenues and related cost of revenue for a licensing arrangement with a related party (the "Licensing Arrangement") in which the Company satisfied its performance obligation under ASC 606 as of January 1, 2018.
|
As a result, the Company’s deferred revenue and related deferred project costs on the three DSI systems and the Licensing Arrangement, and the resultant income tax effects, were recognized through a cumulative effect adjustment to the Accumulated deficit as of January 1, 2018. In addition, the Company recorded a contract asset in the amount of
$0.3 million
related to one DSI system contract for which the Company completed its performance obligations but was not contractually able to bill the customer until the end of the warranty period.
The cumulative effect of the change from the adoption of ASC 606 to the Consolidated Balance Sheet as of January 1, 2018 is shown in the table that follows:
|
Balance as of
|
Impact of
|
Balance as of
|
||||||||||
|
(in thousands)
|
December 31, 2017
|
Adoption
|
January 1, 2018
|
|||||||||
|
Balance Sheet
|
||||||||||||
|
Receivables, net
|
$
|
1,113
|
|
$
|
339
|
|
$
|
1,452
|
|
|||
|
Deferred tax assets
|
$
|
38,661
|
|
$
|
(889
|
)
|
$
|
37,772
|
|
|||
|
Other long-term assets
|
$
|
1,503
|
|
$
|
(322
|
)
|
$
|
1,181
|
|
|||
|
Other current liabilities
|
$
|
4,494
|
|
$
|
(1,821
|
)
|
$
|
2,673
|
|
|||
|
Other long-term liabilities
|
$
|
2,285
|
|
$
|
(2,000
|
)
|
$
|
285
|
|
|||
|
Accumulated deficit
|
$
|
(15,478
|
)
|
$
|
2,950
|
|
$
|
(12,528
|
)
|
|||
64
Advanced Emissions Solutions, Inc. and Subsidiaries
Notes to Consolidated Financial Statements
The following tables show the impact of the adoption of ASC 606 on the Consolidated Balance Sheet and Consolidated Statement of Operations as of and for the
year ended December 31, 2018
, respectively:
|
Balance as Reported
|
Impact of
|
Balance as Adjusted
|
||||||||||
|
(in thousands)
|
December 31, 2018
|
Adoption
|
December 31, 2018
|
|||||||||
|
Balance Sheet
|
||||||||||||
|
Receivables, net
|
$
|
9,554
|
|
$
|
—
|
|
$
|
9,554
|
|
|||
|
Deferred tax assets
|
$
|
32,539
|
|
$
|
425
|
|
$
|
32,964
|
|
|||
|
Other long-term assets
|
$
|
7,993
|
|
$
|
322
|
|
$
|
8,315
|
|
|||
|
Other current liabilities
|
$
|
2,138
|
|
$
|
—
|
|
$
|
2,138
|
|
|||
|
Other long-term liabilities
|
$
|
940
|
|
$
|
2,000
|
|
$
|
2,940
|
|
|||
|
Retained earnings
|
$
|
12,914
|
|
$
|
(1,253
|
)
|
$
|
11,661
|
|
|||
|
For the year ended
|
||||||||||||
|
As Reported
|
Impact of
|
As Adjusted
|
||||||||||
|
(in thousands)
|
December 31, 2018
|
Adoption
|
December 31, 2018
|
|||||||||
|
Statement of Operations
|
||||||||||||
|
Revenues:
|
||||||||||||
|
Equipment sales
|
$
|
72
|
|
$
|
18,115
|
|
$
|
18,187
|
|
|||
|
License royalties, related party
|
$
|
15,140
|
|
$
|
(15,140
|
)
|
$
|
—
|
|
|||
|
Total revenues
|
$
|
23,945
|
|
$
|
2,975
|
|
$
|
26,920
|
|
|||
|
Operating expenses:
|
||||||||||||
|
Equipment sales cost of revenue
|
$
|
(353
|
)
|
$
|
15,945
|
|
$
|
15,592
|
|
|||
|
Total operating expenses
|
$
|
30,345
|
|
$
|
15,945
|
|
$
|
46,290
|
|
|||
|
Operating loss
|
$
|
(6,400
|
)
|
$
|
(12,970
|
)
|
$
|
(19,370
|
)
|
|||
|
Other income (expense)
|
||||||||||||
|
Royalties, related party
|
$
|
—
|
|
$
|
15,140
|
|
$
|
15,140
|
|
|||
|
Total other income (expense)
|
$
|
52,277
|
|
$
|
15,140
|
|
$
|
67,417
|
|
|||
|
Income before income tax expense
|
$
|
45,877
|
|
$
|
2,170
|
|
$
|
48,047
|
|
|||
|
Income tax expense
|
10,423
|
|
464
|
|
10,887
|
|
||||||
|
Net income
|
$
|
35,454
|
|
$
|
1,706
|
|
$
|
37,160
|
|
|||
As of and for the
year ended December 31, 2018
, the significant difference between the financial statement balances reported compared to the financial statement balances without the adoption of ASC 606 were as follows:
|
•
|
Equipment sales
-As of adoption, the Company derecognized contract assets of
$15.9 million
and contract liabilities of
$17.8 million
and recorded a contract asset of
$0.3 million
related to the three DSI systems contracts that met the revenue recognition requirements under ASC 606. After tax, the net adjustment for the three DSI systems was
$1.7 million
. Under revenue recognition guidance in effect prior to the adoption of ASC 606, all three of the DSI systems contracts would have met revenue recognition criteria as of
December 31, 2018
, and for the year ended
December 31, 2018
, the Company would have recognized
$18.1 million
of Equipment sales and
$15.9 million
of Equipment sales cost of revenue, respectively.
|
|
•
|
Licensing Arrangement
- As of adoption, the Company derecognized a contract liability of
$2.0 million
and a contract asset of
$0.3 million
related to the Licensing Arrangement, which met the revenue recognition requirements under ASC 606. After tax, the net adjustment for this contract was
$1.3 million
. Under revenue recognition guidance in effect prior to the adoption of ASC 606, this contract would not have met revenue recognition criteria as of
December 31, 2018
.
|
|
•
|
Royalties, related party
- As of adoption, and based on guidance provided in ASC 606 related to licensing arrangements where royalties are earned on a usage-based royalty arrangement, for the
year ended December 31, 2018
, as well as the corresponding periods from the prior year, the Company has reported the M-45 Royalties earned from Tinuum Group as revenues rather than as non-operating income under financial statement presentation guidance in effect prior to the adoption of ASC 606. This reclassification had no impact to the Company’s income before income tax expense or net income for all periods presented.
|
65
Advanced Emissions Solutions, Inc. and Subsidiaries
Notes to Consolidated Financial Statements
Trade receivables, net
The following table shows the components of Trade receivables, net:
|
|
As of December 31,
|
|||||||
|
(in thousands)
|
2018
|
2017
|
||||||
|
Trade receivables
|
$
|
10,121
|
|
$
|
1,240
|
|
||
|
Less: Allowance for doubtful accounts
|
(567
|
)
|
(127
|
)
|
||||
|
Trade receivables, net
|
$
|
9,554
|
|
$
|
1,113
|
|
||
During the years ended
December 31, 2018
and
2017
, the Company recognized
$0.2 million
and
zero
, respectively, related to specific accounts whose ultimate collection was in doubt. During the first quarter of 2018, the Company settled a previously recorded commitment for additional work related to a contract with a customer, which resulted in a reduction to Equipment sales cost of revenue, exclusive of depreciation and amortization of
$0.3 million
and bad debt expense of
$0.2 million
. Bad debt expense is included within the
General and administrative
line item in the
Consolidated Statements of Operations
.
Disaggregation of Revenue
During the
year ended December 31, 2018
, all performance obligations related to revenues recognized were satisfied at a point in time. The Company disaggregates its revenues by its major components as well as between its
two
operating segments, which are further discussed in
Note 14
to the consolidated financial statements. The following tables disaggregate revenues by major source for the
year ended December 31, 2018
(in thousands):
|
Year ended December 31, 2018
|
||||||||||||||||
|
Segment
|
||||||||||||||||
|
PGI
|
RC
|
Other
|
Total
|
|||||||||||||
|
Revenue component
|
—
|
|
||||||||||||||
|
Consumables
|
$
|
8,628
|
|
$
|
—
|
|
105
|
|
$
|
8,733
|
|
|||||
|
License royalties, related party
|
—
|
|
15,140
|
|
—
|
|
15,140
|
|
||||||||
|
Equipment sales
|
72
|
|
—
|
|
—
|
|
72
|
|
||||||||
|
Revenues from customers
|
8,700
|
|
15,140
|
|
105
|
|
23,945
|
|
||||||||
|
Earnings from equity method investments
|
—
|
|
54,208
|
|
—
|
|
54,208
|
|
||||||||
|
Total revenues and earnings from equity method investments
|
$
|
8,700
|
|
$
|
69,348
|
|
$
|
105
|
|
$
|
78,153
|
|
||||
Note 7
- Borrowings
|
Years ended December 31,
|
||||
|
(in thousands)
|
2018
|
|||
|
Senior Term Loan due December 2021, related party
|
$
|
70,000
|
|
|
|
Less net unamortized debt issuance costs
|
(1,990
|
)
|
||
|
Less net unamortized debt discount
|
(2,052
|
)
|
||
|
Senior Term Loan due December 2021, net
|
65,958
|
|
||
|
Capital lease obligations
|
8,167
|
|
||
|
Line of Credit
|
—
|
|
||
|
74,125
|
|
|||
|
Less: Current maturities
|
(24,067
|
)
|
||
|
Total long-term borrowings
|
$
|
50,058
|
|
|
Senior Term Loan
In December 2018, the Company, and ADA-ES, Inc. ("ADA"), a wholly-owned subsidiary, and certain other subsidiaries of the Company as guarantors, The Bank of New York Mellon as administrative agent, and Apollo Credit Strategies Master Fund Ltd and Apollo A-N Credit Fund (Delaware) L.P. (collectively "Apollo”), affiliates of a beneficial owner of greater than
five
66
Advanced Emissions Solutions, Inc. and Subsidiaries
Notes to Consolidated Financial Statements
percent of the Company's common stock and a related party, entered into the Senior Term Loan in the amount of
$70.0 million
, less original issue discount of
$2.1 million
. Proceeds from the Senior Term Loan were used to fund the Carbon Solutions Acquisition as disclosed in
Note 2
. The Company also paid debt issuance costs of
$2.0 million
related to the Senior Term Loan. The Senior Term Loan has a term of
36
months and bears interest at a rate equal to 3-month LIBOR (subject to a
1.5%
floor) +
4.75%
per annum, which is adjusted quarterly to the current 3-month LIBOR rate, and interest is payable quarterly in arrears. Quarterly principal payments of
$6 million
are required beginning in March 2019, and the Company may prepay the Senior Term Loan at any time without penalty. The Senior Term Loan is secured by substantially all of the assets of the Company, including the cash flows from Tinuum Group and Tinuum Services (collectively, the "Tinuum Entities"), but excluding the Company's equity interests in the Tinuum entities.
The Senior Term Loan includes, among others, the following covenants: (1) Beginning December 31, 2018 and as of the end of each fiscal quarter thereafter, the Company must maintain a minimum cash balance of
$5.0 million
and shall not permit "expected future net cash flows from the refined coal business" (as defined in the Senior Term Loan) to be less than
1.75
times the outstanding principal amount of the Senior Term Loan; (2) Beginning in January 2019, annual collective dividends and buybacks of Company shares in an aggregate amount, not to exceed
$30 million
, is permitted so long as (a) no default or event of default exists under the Senior Term Loan and (b) expected future net cash flows from the refined coal business as of the end of the most recent fiscal quarter exceed
$100 million
.
The following table presents the future aggregate annual maturities of the Company’s Senior Term Loan excluding unamortized discounts and deferred financing cost:
|
Year ended December 31,
|
||||
|
(in thousands)
|
Principal Amount
|
|||
|
2019
|
$
|
24,000
|
|
|
|
2020
|
24,000
|
|
||
|
2021
|
22,000
|
|
||
|
2022
|
—
|
|
||
|
2023
|
—
|
|
||
|
Thereafter
|
—
|
|
||
|
Total
|
$
|
70,000
|
|
|
Line of Credit
In September 2013, ADA, as borrower, and the Company, as guarantor, entered into the Line of Credit with a bank (the "Lender") for an aggregate principal amount of
$10 million
that was secured by certain amounts due to the Company from certain Tinuum Group RC leases. The Line of Credit has been amended 13 times from the period from December 2, 2013 through December 31, 2018, including two amendments executed in 2018.
On September 30, 2018, ADA, as borrower, the Company, as guarantor, and the Lender entered into an amendment (the "Twelfth Amendment") to the Line of Credit. The Twelfth Amendment decreased the Line of Credit to
$5.0 million
due to decreased collateral requirements, extended the maturity date of the Line of Credit to September 30, 2020 and permitted the Line of Credit to be used as collateral (in place of restricted cash) for letters of credit ("LC's") up to
$5.0 million
related to equipment projects and certain other agreements. Under the Twelfth Amendment, there was no minimum cash balance requirement based on the Company meeting certain conditions and maintaining minimum trailing twelve-month EBITDA (earnings before interest, taxes, depreciation and amortization), as previously defined in the "Eleventh Amendment" to the Line of Credit, of
$24.0 million
.
On December 7, 2018, ADA, as borrower, the Company, as guarantor, and the Lender entered into an amendment to the Line of Credit, which provided, among other things, for ADA to be able to enter into the Senior Term Loan as a guarantor so long as the principal amount of the Senior Term Loan does not exceed
$70.0 million
. Additionally, the financial covenants in the Line of Credit were amended and restated to be consistent with the aforementioned Senior Term Loan covenants, including maintaining a minimum cash balance of
$5.0 million
.
As of
December 31, 2018
, there were
no
outstanding borrowings under the Line of Credit.
67
Advanced Emissions Solutions, Inc. and Subsidiaries
Notes to Consolidated Financial Statements
Other
During March 2017, a customer drew on a letter of credit ("LC") related to an equipment system in the amount of
$0.8 million
("LC Draw"), which was funded by borrowing availability under the Line of Credit. The Company subsequently repaid the LC Draw to the Lender as of March 31, 2017. The Company is contesting the LC Draw and is pursuing legal actions to recover the entire amount of the LC Draw from the customer. The Company recorded an asset for the LC Draw net of estimated allowance of
$0.4 million
, which is included in
Other long-term assets
on the Consolidated Balance Sheets.
As of
December 31, 2018
, there were
no
outstanding borrowings under LC's. As of December 31, 2017, there was one LC outstanding in the amount of
$3.5 million
related to an obligation under a settlement agreement as further discussed in
Note 8
. In January 2018, this LC was terminated by all parties to the LC as a result of the full the settlement of the obligation on December 29, 2017.
Note 8
- Commitments and Contingencies
Legal Proceedings
The Company is from time to time subject to, and is presently involved in, various pending or threatened legal actions and proceedings, including those that arise in the ordinary course of its business. Such matters are subject to many uncertainties and outcomes, the financial impacts of which are not predictable with assurance and that may not be known for extended periods of time. The Company records a liability in its consolidated financial statements for costs related to claims, settlements, and judgments where management has assessed that a loss is probable, and an amount can be reasonably estimated. The Company’s significant legal proceedings are discussed below.
Indemnity Settlement Agreement
In December 2017, prior to the Carbon Solutions Acquisition, the Company, Carbon Solutions and the former parent company of Carbon Solutions agreed to terminate certain provisions of the Indemnity Settlement Agreement (the " Indemnity Termination Agreement"). Pursuant to an agreement executed concurrently with the Indemnity Termination Agreement, the Company, Norit International B.V. ("Norit") and an affiliate of Norit (collectively referred to as “Norit”) agreed to a final payment in the amount of
$3.3 million
(the "Settlement Payment") to settle all outstanding royalty obligations (the "Royalty Award") owed under the terms of a settlement agreement executed in 2011 between the Company and Norit (the "Norit Settlement Agreement"). This amount was paid by the Company on December 29, 2017.
Under the Indemnity Termination Agreement, and upon payment of the Settlement Payment, the Company was relieved of certain financial and indemnity obligations required by the terms of the Norit Settlement Agreement, including the obligation to maintain LC's securing future royalty payment obligations. As of December 31, 2017,
$3.5 million
in LC's related to the Royalty Award were outstanding, but were canceled by all parties in January 2018, pursuant to the Indemnity Termination Agreement.
Advanced Emission Solutions, Inc. Profit Sharing Retirement Plan
The Advanced Emissions Solutions, Inc. Profit Sharing Retirement Plan (the “401(k) Plan”) is subject to the jurisdiction of the Internal Revenue Service ("IRS") and the Department of Labor ("DOL").
In February 2018, as part of an agreement reached with the DOL from its investigation, which had commenced in 2016, in the 401(k) Plan and the Company as the Plan Sponsor, the Company agreed to make a restorative payment to the 401(k) Plan in the amount of
$1.0 million
as an estimate of lost earnings for 401(k) Plan participants as of January 1, 2015. The Company determined this contingency to be both probable and reasonably estimable and accrued
$1.0 million
as of
December 31, 2017
. The liability and related charge were recorded in the Other current liabilities line item on the Consolidated Balance Sheet and in the Other line item in the Consolidated Statements of Operations for the year ended
December 31, 2017
, respectively. On June 1, 2018, the Company made the restorative payment of
$1.0 million
to the 401(k) Plan. On September 7, 2018, the Company received notification that the DOL had closed its investigation and no further action was required by the Company.
Other Commitments and Contingencies
Tinuum Group
The Company also has certain limited obligations contingent upon future events in connection with the activities of Tinuum Group. The Company, NexGen and two entities affiliated with NexGen have provided GSFS with limited guaranties (the “Tinuum Group Party Guaranties”) related to certain losses it may suffer as a result of inaccuracies or breach of representations and covenants. The Company also is a party to a contribution agreement with NexGen under which any party called upon to pay on a Tinuum Group Party Guaranty is entitled to receive contribution from the other party equal to
50%
of the amount paid. No liability or expense provision has been recorded by the Company related to this contingent obligation as the Company believes that it is not probable that a loss will occur with respect to Tinuum Group Party Guaranties.
68
Advanced Emissions Solutions, Inc. and Subsidiaries
Notes to Consolidated Financial Statements
Purchase Obligations
The Company does not have any future purchase obligations as of
December 31, 2018
.
U.S. Department of Energy ("DOE") Audits
Certain of the Company's completed and current contracts awarded by the DOE and related industry participants remain subject to adjustments as a result of future government audits. The Company's historical experience with these audits has not resulted in significant adverse adjustments to amounts previously received; however, the Company currently remains subject to audits for the years 2014 and later.
Lease Obligations
The Company leases certain of its mining, plant and operating equipment, as well as office equipment and vehicles under capital and operating lease agreements, of which original lease terms ranged from
one
to
seven
years. Certain of these leases have options permitting renewals for additional periods and buy-out options. In addition to minimum fixed payments, a number of leases contain annual escalation clauses that are related to increases in the inflation index.
Annual minimum commitments under the leases as of
December 31, 2018
are as follows:
|
Years Ending December 31,
|
Operating
Lease
Commitments
(in thousands)
|
Capital
Lease Commitments (in thousands) |
||||||
|
2019
|
$
|
3,619
|
|
$
|
1,749
|
|
||
|
2020
|
2,273
|
|
1,707
|
|
||||
|
2021
|
1,632
|
|
1,802
|
|
||||
|
2022
|
310
|
|
951
|
|
||||
|
2023
|
221
|
|
951
|
|
||||
|
Thereafter
|
—
|
|
2,482
|
|
||||
|
Total minimum lease payments
|
$
|
8,055
|
|
9,642
|
|
|||
|
Less amounts representing interest
|
(1,475
|
)
|
||||||
|
Present value of minimum capital lease payments
|
$
|
8,167
|
|
|||||
Rent expense incurred for the years ended is as follows:
|
|
Years Ended December 31,
|
|||||||
|
(in thousands)
|
2018
|
2017
|
||||||
|
Rent expense
(1)
|
$
|
302
|
|
$
|
(60
|
)
|
||
(1) During the year ended
December 31, 2017
, the Company accelerated deferred rent and tenant improvement allowances in connection with the termination of the lease agreement of its former corporate office.
Note 9
- Stockholders Equity
The Company has two classes of capital stock authorized, common stock and preferred stock, which are described as follows:
Preferred Stock
The Company's Board of Directors (the "Board') is authorized to provide out of the unissued shares of Preferred Stock and to fix the number of shares constituting a series of Preferred Stock and, with respect to each series, to fix the number of shares and designation of such series, the voting powers, if any, the preferences and relative, participating, option or other special rights, if any, and any qualifications, limitations or restrictions thereof, of the shares of such series. As of
December 31, 2018
and
2017
, there were
no
shares of Preferred Stock designated or outstanding.
Common Stock
Holders of common stock are entitled to one vote for each share held of record on all matters submitted to a vote of the stockholders. Additionally, holders of common stock are entitled to receive dividends when and if declared by the Board, subject to any statutory or contractual restrictions on payment of dividends and to any restrictions on the payment of dividends imposed by the terms of any outstanding shares of preferred stock.
Upon dissolution, liquidation or the sale of all or substantially all of the Company's assets, after payment in full of any amounts required to be paid to creditors and to the holders of preferred stock having liquidation preferences, if any, the holders of shares of common stock will be entitled to receive the Company's remaining assets for distribution on a pro rata basis.
69
Advanced Emissions Solutions, Inc. and Subsidiaries
Notes to Consolidated Financial Statements
Stock Repurchase
Tender Offer
On
May 5, 2017
, the Board authorized the commencement of a modified Dutch Auction tender offer ("Tender Offer") to purchase for cash up to
925,000
shares of the Company's common stock at a price per share of not less than
$9.40
nor greater than
$10.80
, for a maximum aggregate purchase price of
$10.0 million
, with an option to purchase an additional
2%
of the outstanding shares of common stock if the Tender Offer was oversubscribed. The Tender Offer expired on
June 6, 2017
and a total of
2,858,425
shares were validly tendered and not properly withdrawn at or below the final purchase price of
$9.40
per share.
Because the Tender Offer was oversubscribed, the Company purchased a prorated portion of the shares properly tendered by each tendering stockholder (other than "odd lot" holders whose shares were purchased on a priority basis) at the final per share purchase price. Accordingly, the Company acquired
1,370,891
shares of its common stock ("Tendered Shares") at a price of
$9.40
per share, for a total cost of approximately
$12.9 million
, excluding fees and other expenses related to the Tender Offer. The Tendered Shares represented approximately
6.2%
of the Company's outstanding shares prior to the Tender Offer. The Tendered Shares included the
925,000
shares the Company initially offered to purchase and
445,891
additional shares that the Company elected to purchase pursuant to its right to purchase up to an additional
2%
of its outstanding shares of common stock. The Company recorded the Tendered Shares at cost, which included fees and expenses related to the Tender Offer, and reported the Tendered Shares as Treasury Stock on the Condensed Consolidated Balance Sheet as of
December 31, 2018
.
The Company’s Board and executive officers did not participate in the Tender Offer, except for one director of the Board, who is a manager of a financial institution and holds dispositive powers over the shares of the Company's common stock held by the financial institution that tendered
70,178
of its shares of the Company's common stock.
Stock Repurchase Programs
In November 2018, the Board authorized the Company to purchase up to
$20.0 million
of its outstanding common stock. This stock repurchase program will remain in effect until December 31, 2019 unless otherwise modified by the Board. Previously, the Board had authorized the Company to purchase up to
$20.0 million
of its outstanding common stock under a separate repurchase program that was in effect until July 31, 2018.
During the years ended
December 31, 2018
and
2017
, under the collective stock repurchase programs authorized by the Board, the Company purchased
2,350,422
and
342,875
shares of its common stock for cash of
$25.3 million
and
$3.4 million
, inclusive of commissions and fees, respectively. Of these amounts,
$15.6 million
was purchased in single blocks through privately negotiated transactions.
Quarterly Cash Dividend
Dividends declared to holders of the Company's common shares during the years ended
December 31, 2018
and
December 31, 2017
were
$20.3 million
and
$15.8 million
, respectively. A portion of the dividends remains accrued subsequent to the payment dates and represents dividends accumulated on nonvested shares of common stock held by employees of the Company that contain forfeitable dividend rights that are not payable until the underlying shares of common stock vest. These amounts are included in both Other current liabilities and Other long-term liabilities on the Consolidated Balance Sheet as of
December 31, 2018
and
2017
.
Dividends declared and paid quarterly per share on all outstanding shares of common stock during the years ended
December 31, 2018
and
2017
were as follows:
|
2018
|
2017
|
||||||||||||
|
Per share
|
Date paid
|
Per share
|
Date paid
|
||||||||||
|
Dividends declared during quarter ended:
|
|||||||||||||
|
March 31
|
$
|
0.25
|
|
March 8, 2018
|
$
|
—
|
|
—
|
|
||||
|
June 30
|
0.25
|
|
June 8, 2018
|
0.25
|
|
July 17, 2017
|
|
||||||
|
September 30
|
0.25
|
|
September 6, 2018
|
0.25
|
|
September 7, 2017
|
|
||||||
|
December 31
|
0.25
|
|
December 6, 2018
|
0.25
|
|
December 6, 2017
|
|
||||||
|
$
|
1.00
|
|
$
|
0.75
|
|
||||||||
70
Advanced Emissions Solutions, Inc. and Subsidiaries
Notes to Consolidated Financial Statements
Tax Asset Protection Plan
United States federal income tax rules, and Section 382 of the Internal Revenue Code in particular, could substantially limit the use of net operating losses and other tax assets if ADES experiences an "ownership change" (as defined in the Internal Revenue Code). In general, an ownership change occurs if there is a cumulative change in the ownership of ADES by "5 percent stockholders" that exceeds 50 percentage points over a rolling three-year period.
On May 5, 2017, the Board approved the declaration of a dividend of rights to purchase Series B Junior Participating Preferred Stock for each outstanding share of common stock as part of a tax asset protection plan (the "Tax Asset Protection Plan") designed to protect the Company’s ability to utilize its net operating losses and tax credits. The Tax Asset Protection Plan is intended to act as a deterrent to any person acquiring beneficial ownership of
4.99%
or more of the Company’s outstanding common stock.
On April 6, 2018, the Board approved the First Amendment to the Tax Asset Protection Plan (the "Amendment") that amends the Tax Asset Protection Plan dated May 5, 2017 (the "TAPP"). The Amendment amends the definition of "Final Expiration Date" under the TAPP to extend the duration of the TAPP and makes associated changes in connection therewith. At the Company's 2018 annual meeting, the Company's stockholders approved the Amendment, thus the Final Expiration Date will be the close of business on December 31, 2019.
Note 10
- Stock-Based Compensation
The Plans
The Company currently has incentive plans, including the Amended and Restated 2010 Non-Management Compensation and Incentive Plan, as amended (the “2010 Plan”) and the 2017 Omnibus Incentive Plan (the “2017 Plan”) as described below. Collectively, these plans are called the “Stock Plans" and permit the Company to issue stock-based awards, including common stock, restricted stock, stock options and other rights and benefits under the plans to employees, directors and non-employees.
The 2010 Plan
- During 2010, the Company adopted the 2010 Plan which permits grants of stock awards to employees, which may be shares, rights to purchase restricted stock, bonuses of restricted stock, or other rights or benefits under the plan. The Company reserved
600,000
shares of its common stock for these purposes. The Plan was amended and restated as of July 19, 2012 to make non-material changes to assure Internal Revenue Code Section 409A compliance. Upon the adoption of the 2017 Plan in June 2017, the Company no longer grants any awards from the 2010 Plan.
The 2017 Plan
- During 2017, the Company adopted the 2017 Plan which permits grants of awards to employees, directors and non-employees, which may be shares, rights to purchase restricted stock, bonuses of restricted stock, or other rights or benefits under the plan. The Company reserved
2,000,000
shares of its common stock under the 2017 Plan.
Expense
RSA's
- Restricted Stock Awards ("RSA's") are typically granted with vesting terms of
three
years. The fair value of RSA's is determined based on the closing price of the Company’s common stock on the authorization date of the grant multiplied by the number of shares subject to the stock award. Compensation expense for RSA's is generally recognized over the vesting term on a straight-line basis.
Stock Options
- Stock options generally vest over
three
years or upon satisfaction of performance-based conditions and have a contractual limit of
five
years from the date of grant to exercise. The fair value of stock options granted is determined on the date of grant using the Black-Scholes option pricing model and the related expense is recognized on a straight-line basis over the entire vesting period.
No
stock options were granted during the years ended
December 31, 2018
and
2017
.
When options are granted, the Company uses historical data to estimate inputs used in the Black-Scholes option pricing model.
Risk-free interest rate
- The risk-free interest rate for stock options granted during the period was determined by using a zero-coupon U.S. Treasury rate for the periods that coincided with the expected terms listed above.
Dividends
- As historically no dividends had been paid as of the date by which grants occurred, no dividend yield was included in the calculations when the outstanding options were granted.
Expected volatility
- To calculate expected volatility, the historical volatility of the Company's common stock was used.
Expected term
- The Company’s expected term of options was based upon historical exercise behavior and consideration of the options' vesting and contractual terms.
RSU's
- Restricted Stock Units ("RSU's") are typically granted with vesting terms of
one
year. The fair value of RSU's is determined based on the closing price of the Company’s common stock on the authorization date of the grant multiplied by the number of shares subject to the stock award. Compensation expense is generally recognized over the service period of the award on a straight-line basis.
71
Advanced Emissions Solutions, Inc. and Subsidiaries
Notes to Consolidated Financial Statements
PSU's
-
Performance share units ("PSU's") vest based on the grantee’s continuous service with the Company, performance measures or a combination of both. Each PSU represents a contingent right to receive shares of the Company’s common stock if the Company meets certain performance measures over the requisite period. Vesting of the PSU's, if at all, occurs no later than January 2 after the conclusion of the third year of the performance period, subject to the grantee’s continuous service and the achievement of certain pre-established performance goals. Amounts vested are measured as of December 31, immediately prior to the end of the service period, unless the PSU's vest sooner at the target amount as a result of certain transactions pursuant to Section 11 of the Amended and Restated 2007 Equity Incentive Plan, as amended ("2007 Plan").
The number of shares of common stock a participant receives will be increased (up to
200 percent
of target levels) or reduced (down to
zero
) based on the level of achievement of performance goals. The number of PSU's that may be earned by a participant is determined at the end of the performance period based on the relative placement of the Company’s total stockholder return (“TSR”) for that period with approximately
75%
of the award based on the relative performance of the Company’s TSR performance compared to the respective TSRs of a specified group of peer companies and the remaining portion of the award based on the Company’s TSR performance compared to the Russell 3000 Index.
Compensation expense is recognized for PSU awards on a straight-line basis over a
3
-year service period based on the estimated fair value at the date of grant using a Monte Carlo simulation model.
No
PSU's were granted during the years ended
December 31, 2018
or
2017
.
When PSU's are granted, the Company uses historical data to estimate inputs used in the Monte Carlo pricing model.
Risk-free interest rate
- The risk-free interest rate for PSU's granted during the period was determined by using a zero-coupon U.S. Treasury rate for the periods that coincided with the expected terms listed above.
Dividends
- As historically no dividends had been paid as of the date by which grants occurred, no dividend yield was included in the calculations.
Expected volatility
- To calculate expected volatility, the historical volatility of the Company's common stock was used.
Performance period
- The Company’s performance period is based upon the vesting term of the Company’s PSU awards.
The Company recorded the following compensation expense related to the Stock Plans and the 2007 Plan:
|
|
Years Ended December 31,
|
|||||||
|
(in thousands)
|
2018
|
2017
|
||||||
|
RSA expense
|
$
|
2,222
|
|
$
|
1,400
|
|
||
|
Stock option expense
|
58
|
|
672
|
|
||||
|
RSU expense
|
210
|
|
—
|
|
||||
|
PSU expense
|
—
|
|
137
|
|
||||
|
Total stock-based compensation expense
|
$
|
2,490
|
|
$
|
2,209
|
|
||
The Company recorded stock-based compensation expense related to awards granted to the Board in the General and administrative expense line and all other awards within the Payroll and benefit expense line in the Consolidated Statements of Operations.
During the year ended
December 31, 2018
, the Company modified the terms of awards granted to
13
employees in connection with its restructuring plans and termination of the impacted employees discussed in
Note 18
. These modifications resulted in the accelerated vesting and incremental expense related to certain performance-based awards and restricted stock awards. As a result, during
2018
, the Company recognized incremental stock-based compensation of
$0.8 million
, which was included in the Payroll and benefits line item in the Consolidated Statements of Operations. There were no material modifications to awards during the year ended
December 31, 2017
.
The amount of unrecognized compensation cost as of
December 31, 2018
, and the expected weighted-average period over which the cost will be recognized is as follows:
|
As of December 31, 2018
|
||||||
|
(in thousands)
|
Unrecognized Compensation Cost
|
Expected Weighted-Average Period of Recognition (in years)
|
||||
|
RSA expense
|
$
|
1,767
|
|
1.58
|
||
|
Total unrecognized stock-based compensation expense
|
$
|
1,767
|
|
1.58
|
||
72
Advanced Emissions Solutions, Inc. and Subsidiaries
Notes to Consolidated Financial Statements
Activity
Restricted Stock
A summary of the status and activity of RSA's and RSU's is presented in the following table:
|
Restricted Stock
|
Weighted-Average Grant Date Fair Value
|
|||||||||||||
|
(in thousands, except for share and per share amounts)
|
Awards
|
Units
|
RSA's
|
RSU's
|
||||||||||
|
For the year ended December 31, 2018
|
||||||||||||||
|
Non-vested at January 1, 2018
|
276,607
|
|
—
|
|
$
|
9.03
|
|
$
|
—
|
|
||||
|
Granted
|
205,998
|
|
20,000
|
|
$
|
11.00
|
|
$
|
10.52
|
|
||||
|
Vested
|
(200,618
|
)
|
—
|
|
$
|
9.79
|
|
$
|
—
|
|
||||
|
Forfeited
|
(1,135
|
)
|
—
|
|
$
|
10.44
|
|
$
|
—
|
|
||||
|
Non-vested at December 31, 2018
|
280,852
|
|
20,000
|
|
$
|
9.92
|
|
$
|
10.52
|
|
||||
The weighted-average grant date fair value of RSA's granted or modified during the years ended
December 31, 2018
and
2017
was
$11.00
and
$9.50
, respectively. The weighted-average grant date fair value of RSU's granted or modified during the years ended
December 31, 2018
and
2017
was
$10.52
and
zero
, respectively. The total grant-date fair value of RSA's vested during the years ended
December 31, 2018
and
2017
was
$2.0 million
and
$1.7 million
, respectively. There were
no
RSU's vested during the years ended
December 31, 2018
and
2017
. The aggregate intrinsic value of non-vested RSA's and RSU's outstanding as of
December 31, 2018
was
$3.0 million
and
$0.2 million
, respectively.
Stock Options
A summary of option activity under the Stock Plans is presented below:
|
(in thousands, except for share and per share amounts)
|
Number of
Options Outstanding and Exercisable |
Weighted-
Average Exercise Price |
Aggregate Intrinsic Value
|
Weighted-
Average Remaining Contractual Term (in years) |
|||||||||
|
For the year ended December 31, 2018
|
|||||||||||||
|
Options outstanding at January 1, 2018
|
622,446
|
|
$
|
11.64
|
|
||||||||
|
Options granted
|
—
|
|
$
|
—
|
|
||||||||
|
Options exercised
|
(92,666
|
)
|
$
|
8.25
|
|
||||||||
|
Options expired / forfeited
|
—
|
|
$
|
—
|
|
||||||||
|
Options outstanding at December 31, 2018
|
529,780
|
|
$
|
12.23
|
|
$
|
296
|
|
1.46
|
||||
|
Options vested and exercisable at December 31, 2018
|
529,780
|
|
$
|
12.23
|
|
$
|
296
|
|
1.46
|
||||
The weighted-average grant-date fair value of options vesting during the years ended
December 31, 2018
and
2017
was
$0.3 million
and
$0.7 million
, respectively. The weighted-average grant-date fair value of options exercised during the year ended
December 31, 2018
was
$0.3 million
. The Company did not receive cash from the exercise of stock options during the year ended
December 31, 2018
as
67,715
shares were withheld as payment of the exercise price. There were
no
options exercised during the year ended
December 31, 2017
.
Cash flows resulting from excess tax benefits, if any, are classified as part of cash flows from financing activities. Excess tax benefits are realized tax benefits from tax deductions for vested RSA's, settled PSU's and exercised options in excess of the deferred tax asset attributable to stock compensation costs for such equity awards. The Company recorded
no
excess tax benefits for the years ended
December 31, 2018
and
2017
.
73
Advanced Emissions Solutions, Inc. and Subsidiaries
Notes to Consolidated Financial Statements
PSU's
A summary of the status and activity of non-vested PSU's is presented in the following table:
(1) The number of units shown in the table above are based on target performance. The final number of shares of common stock issued may vary depending on the achievement of market conditions established within the awards, which could result in the actual number of shares issued ranging from zero to a maximum of two times the number of units shown in the above table.
|
(in thousands, except for per share amounts)
|
Units
|
Weighted-Average
Grant-Date Fair Value |
|||||
|
For year ended December 31, 2018
|
|||||||
|
Non-vested at beginning of year
|
19,406
|
|
$
|
25.20
|
|
||
|
Granted (1)
|
—
|
|
$
|
—
|
|
||
|
Vested (1)
|
(19,406
|
)
|
$
|
25.20
|
|
||
|
Forfeited / Canceled (1)
|
—
|
|
$
|
—
|
|
||
|
Non-vested at end of year
|
—
|
|
$
|
—
|
|
||
There were
no
PSU's granted during the years ended
December 31, 2018
and
2017
. PSU's outstanding remained unvested until the third anniversary date of their issuance, at which time the actual number of vested shares was determined based upon the actual price performances of the Company’s common stock relative to a broad stock index and a peer group performance index.
The following table shows the PSU's that were settled by issuing the Company's common stock relative to a peer group performance index and broad stock index.
|
Year of Grant
|
Net Number of Issued Shares upon Vesting
|
Shares Withheld to Settle Tax Withholding Obligations
|
TSR Multiple Range
|
Russell 3000 Multiple
|
||||||||||||||||
|
Low
|
High
|
Low
|
High
|
|||||||||||||||||
|
For the year ended December 31, 2018
|
||||||||||||||||||||
|
2015
|
12,311
|
|
4,061
|
|
112.50
|
|
112.50
|
|
—
|
|
—
|
|
||||||||
|
For the year ended December 31, 2017
|
||||||||||||||||||||
|
2014
|
6,476
|
|
3,573
|
|
0.75
|
|
1.00
|
|
—
|
|
—
|
|
||||||||
|
2015
|
3,869
|
|
2,310
|
|
0.60
|
|
0.60
|
|
—
|
|
—
|
|
||||||||
74
Advanced Emissions Solutions, Inc. and Subsidiaries
Notes to Consolidated Financial Statements
Note 11
- Supplemental Financial Information
Supplemental Balance Sheet Information
The following table summarizes the components of
Prepaid expenses and other assets
and
Other long-term assets
as presented in the
Consolidated Balance Sheets
:
|
|
As of December 31,
|
|||||||
|
(in thousands)
|
2018
|
2017
|
||||||
|
Other current assets:
|
||||||||
|
Prepaid expenses
|
$
|
1,233
|
|
$
|
1,678
|
|
||
|
Prepaid income taxes
|
2,940
|
|
—
|
|
||||
|
Other
|
1,397
|
|
83
|
|
||||
|
$
|
5,570
|
|
$
|
1,761
|
|
|||
|
Other long-term assets:
|
||||||||
|
Spare parts
|
$
|
3,278
|
|
$
|
—
|
|
||
|
Mine development costs, net
|
2,531
|
|
—
|
|
||||
|
Long-term receivable, net
|
408
|
|
—
|
|
||||
|
Deposits
|
269
|
|
223
|
|
||||
|
Highview investment
|
552
|
|
552
|
|
||||
|
Other long-term assets
|
955
|
|
728
|
|
||||
|
$
|
7,993
|
|
$
|
1,503
|
|
|||
Included within Other long-term assets is the Company's investment ("Highview Investment") in Highview Enterprises Limited ("Highview"). In November 2014, the Company acquired an
8%
ownership interest in the common stock of Highview for
$2.8 million
in cash. The Company accounts for the Highview Investment as an investment recorded at cost, less impairment, plus or minus observable changes in price for identical or similar investments of the same issuer.
The Highview Investment is evaluated for impairment upon an indicator of impairment such as an event or change in circumstances that may have a significant adverse effect on the fair value of the investment. As of
December 31, 2017
, the Company recorded an impairment charge of
$0.5 million
based on an estimated fair value of
£1.00
per share, compared to the carrying value prior to the impairment charge of
£2.00
per share. The estimated fair value as of
December 31, 2017
was based on an equity raise that was completed during the first quarter of 2017 at a price of
£1.00
per share.
There were no changes to the carrying value of the Highview Investment during the year ended
December 31, 2018
, as there were no indicators of impairment or observable price changes for equity issued by Highview.
75
Advanced Emissions Solutions, Inc. and Subsidiaries
Notes to Consolidated Financial Statements
The following table details the components of
Other current liabilities
and
Other long-term liabilities
as presented in the
Consolidated Balance Sheets
:
|
|
As of December 31,
|
|||||||
|
(in thousands)
|
2018
|
2017
|
||||||
|
Other current liabilities:
|
||||||||
|
Accrued interest
|
$
|
407
|
|
$
|
—
|
|
||
|
Sales and other taxes payable
|
479
|
|
207
|
|
||||
|
Estimated Company contribution to 401(k) Plan
|
—
|
|
1,000
|
|
||||
|
Accrued losses on equipment contracts
|
—
|
|
69
|
|
||||
|
Billings in excess of costs on uncompleted contracts
|
—
|
|
1,830
|
|
||||
|
Warranty liabilities
|
12
|
|
316
|
|
||||
|
Other
|
1,240
|
|
1,072
|
|
||||
|
$
|
2,138
|
|
$
|
4,494
|
|
|||
|
Other long-term liabilities:
|
||||||||
|
Deferred revenue, related party
|
$
|
—
|
|
$
|
2,000
|
|
||
|
Deferred rent
|
106
|
|
192
|
|
||||
|
Mine reclamation liability
|
624
|
|
—
|
|
||||
|
Other long-term liabilities
|
210
|
|
93
|
|
||||
|
$
|
940
|
|
$
|
2,285
|
|
|||
The tables below detail components of
Other current liabilities
as presented above:
Included within
Other current liabilities
is the Company's asset retirement obligation. Changes in the Company's asset retirement obligation were as follows:
|
As of December 31,
|
||||||||
|
(in thousands)
|
2018
|
2017
|
||||||
|
Asset retirement obligation, beginning of year
|
$
|
—
|
|
$
|
1,312
|
|
||
|
Asset retirement obligation assumed in Carbon Solutions Acquisition
|
626
|
|
—
|
|
||||
|
Accretion
|
2
|
|
|
37
|
|
|||
|
Liabilities settled
|
(4
|
)
|
|
(527
|
)
|
|||
|
Changes due to scope and timing of reclamation
|
—
|
|
|
(822
|
)
|
|||
|
Asset retirement obligations, end of year
|
$
|
624
|
|
|
$
|
—
|
|
|
As part of the Carbon Solutions Acquisition, the Company assumed an asset retirement obligation related to the Company's lignite mine, the Five Forks Mine. The Company recorded the liability at its estimated the fair value and periodically adjusts to reflect changes in the estimated present value resulting from the passage of time and revisions to the estimates of either the timing or amount of the reclamation costs.
The Company’s mining activities are subject to various domestic laws and regulations governing the protection of the environment. The Company conducts its operations to protect public health and the environment and believes its operations are in compliance with applicable laws and regulations in all material respects. The Company has made, and expects to make in the future, expenditures to comply with such laws and regulations, but cannot predict the full amount of such future expenditures. Estimated future reclamation costs are based principally on current legal and regulatory requirements.
The Company previously had recorded an asset retirement obligation related to a pilot facility it installed for conducting research activities. The Company settled its asset retirement obligation during the year ended
December 31, 2017
for less than its estimate as the scope of the asset retirement obligation was reduced. The change in estimate was recorded within the Research and development, net line item of the Consolidated Statements of Operations as the asset retirement obligation related to a research project of which expenses were originally recorded within the same line item.
76
Advanced Emissions Solutions, Inc. and Subsidiaries
Notes to Consolidated Financial Statements
Prior to the adoption of ASC 606 on January 1, 2018, costs incurred on uncompleted contracts represented the gross costs as of the balance sheet dates. Billings on uncompleted contracts represented the gross billings as of the balance sheet dates. Costs and billings are netted on an individual contract basis, with contracts that were in a net cost position aggregated and presented as
Prepaid expenses and other assets
in the
Consolidated Balance Sheets
, and contracts that were in a net billing position aggregated and presented as Billing in excess of costs on uncompleted contracts in the
Consolidated Balance Sheets
. The below table shows the components of these items:
|
As of December 31,
|
||||
|
(in thousands)
|
2017
|
|||
|
Costs incurred on uncompleted contracts (gross)
|
$
|
15,945
|
|
|
|
Billings on uncompleted contracts (gross)
|
(17,775
|
)
|
||
|
$
|
(1,830
|
)
|
||
|
Included in the accompanying balance sheets under the following captions (1):
|
||||
|
Costs in excess of billings on uncompleted contracts
(2)
|
$
|
—
|
|
|
|
Billings in excess of costs on uncompleted contracts
(3)
|
(1,830
|
)
|
||
|
|
$
|
(1,830
|
)
|
|
(1)
Amounts presented after netting of costs and billings on an individual contract basis.
(2)
Costs in excess of billings on uncompleted contracts was included in the
Prepaid expenses and other assets
caption on the Consolidated Balance Sheets.
(3)
Billings in excess of costs on uncompleted contracts was included in the Other current liabilities caption on the Consolidated Balance Sheets.
For discussion on the impact of adopting ASC 606, see
Note 6
.
Supplemental Consolidated Statements of Operations Information
The following table details the components of
Interest expense
in the
Consolidated Statements of Operations
:
|
Years Ended December 31,
|
||||||||
|
(in thousands)
|
2018
|
2017
|
||||||
|
453A interest
|
$
|
1,585
|
|
$
|
2,555
|
|
||
|
Interest on Senior Term Loan
|
460
|
|
—
|
|
||||
|
Line of Credit interest and letters of credit fees
|
—
|
|
417
|
|
||||
|
Other
|
106
|
|
52
|
|
||||
|
$
|
2,151
|
|
$
|
3,024
|
|
|||
The following table details the components of
Other
in the
Consolidated Statements of Operations
:
|
Years Ended December 31,
|
||||||||
|
(in thousands)
|
2018
|
2017
|
||||||
|
Impairment of Highview investment
|
$
|
—
|
|
$
|
(464
|
)
|
||
|
Settlement agreement (1)
|
—
|
|
3,500
|
|
||||
|
Company contribution to 401(k) Plan
|
—
|
|
(1,000
|
)
|
||||
|
Other
|
(19
|
)
|
(11
|
)
|
||||
|
$
|
(19
|
)
|
$
|
2,025
|
|
|||
(1) On November 6, 2017, the Company entered into a settlement agreement with a former third-party service provider and as part of the settlement the Company received cash in the amount of $
3.5 million
. This amount was paid to the Company during the fourth quarter of 2017.
77
Advanced Emissions Solutions, Inc. and Subsidiaries
Notes to Consolidated Financial Statements
Note 12
- Fair Value Measurements
Fair Value of Financial Instruments
The carrying amounts of financial instruments, including cash and cash equivalents, accounts receivable, accounts payable, deposits and accrued expenses, approximate fair value due to the short maturity of these instruments. Accordingly, these instruments are not presented in the table below. The following table provides the estimated fair values of the remaining financial instruments:
|
|
||||||||||||||||
|
As of December 31, 2018
|
As of December 31, 2017
|
|||||||||||||||
|
(in thousands)
|
Carrying Value
|
Fair Value
|
Carrying Value
|
Fair Value
|
||||||||||||
|
Financial Instruments:
|
||||||||||||||||
|
Highview Investment
|
$
|
552
|
|
$
|
552
|
|
$
|
552
|
|
$
|
552
|
|
||||
|
Highview Obligation
|
$
|
213
|
|
$
|
213
|
|
$
|
210
|
|
$
|
210
|
|
||||
Concentration of credit risk
As of
December 31, 2018
, the Company’s financial instruments that are exposed to concentrations of credit risk consist primarily of cash and cash equivalents. The Company holds cash and cash equivalents at five financial institutions as of December 31, 2018. If those institutions were to be unable to perform its obligations, the Company would be at risk regarding the amount of investment in excess of the federal deposit insurance corporation limits (
$250 thousand
) that would be returned to the Company.
Assets and Liabilities Measured at Fair Value on a Recurring Basis
As of
December 31, 2018
and
December 31, 2017
, the Company had no material financial instruments carried and measured at fair value on a recurring basis.
Assets and Liabilities Measured at Fair Value on a Non-Recurring Basis
The Company completed the Carbon Solutions Acquisition, in which the fair value of the purchase consideration totaled
$66.5 million
. The Company's estimated fair values of the assets acquired and liabilities assumed are disclosed in
Note 2
.
As discussed in
Note 11
, during the year ended
December 31, 2017
, the Company recorded impairment charges of approximately
$0.5 million
, to reduce the carrying value of the Highview Investment to its estimated fair value.
The fair value measurements represent Level 3 measurements as they are based on significant inputs not observable in the market.
Note 13
- Income Taxes
On December 22, 2017 (the "Enactment Date"), the U.S. government enacted comprehensive tax legislation commonly referred to as the Tax Cuts and Jobs Act (the "Tax Act"). The Tax Act made broad and complex changes to the U.S. tax code and key provisions applicable to the Company, or certain of Tinuum Group's existing or potential customers, for 2018 included the following: (1) reduction of the U.S. federal corporate tax rate from 35 percent to 21 percent; (2) elimination of the corporate alternative minimum tax (AMT); (3) a new limitation on deductible interest expense; (4) limitations on the deductibility of certain executive compensation; (5) limitations on the use of federal tax credits ("FTCs") to reduce the U.S. income tax liability; (6) limitations on net operating losses (“NOL’s”) generated after December 31, 2017, to
80 percent
of taxable income; and the introduction of the Base Erosion Anti-Abuse Tax (“BEAT”) for tax years beginning after December 31, 2017.
As of the Enactment Date, the Company recorded an adjustment to its recorded deferred tax assets and deferred tax liabilities as a result of the reduction of the U.S. federal corporate rate from 35 percent to 21 percent, which resulted in a reduction of
$5.8 million
to net deferred tax assets as of the Enactment Date for those temporary differences expected to reverse after the Enactment Date. The reduction in the net deferred assets resulted in the recognition of
$5.8 million
of deferred tax expense for the year ended
December 31, 2017
. During 2018, the Company did not make any accounting adjustments related to the Tax Act.
78
Advanced Emissions Solutions, Inc. and Subsidiaries
Notes to Consolidated Financial Statements
The provision for income taxes consists of the following:
|
|
Years Ended December 31,
|
|||||||
|
(in thousands, except for rate)
|
2018
|
2017
|
||||||
|
Current portion of income tax expense:
|
||||||||
|
Federal
|
$
|
882
|
|
$
|
519
|
|
||
|
State and other
|
4,308
|
|
894
|
|
||||
|
5,190
|
|
1,413
|
|
|||||
|
Deferred portion of income tax expense (benefit):
|
||||||||
|
Federal
|
4,766
|
|
23,003
|
|
||||
|
State and other
|
467
|
|
(264
|
)
|
||||
|
|
5,233
|
|
22,739
|
|
||||
|
Total income tax expense
|
$
|
10,423
|
|
$
|
24,152
|
|
||
|
Effective tax rate
|
23
|
%
|
46
|
%
|
||||
For the year ended
December 31, 2018
, the Company recorded income tax expense of
$10.4 million
compared to income tax expense of
$24.2 million
for
2017
. The income tax expense for the year ended
December 31, 2018
includes
$4.5 million
due to an increase in the valuation allowance recorded against deferred tax assets. Income tax expense during the year ended December 31, 2017 included
$5.8 million
associated with the reduction of the net deferred tax assets as of the Enactment Date of the Tax Act. Excluding the impact of the Tax Act, the Company would have recorded a tax benefit of approximately
$14.0 million
during the fourth quarter of 2017 due to a reduction in the valuation allowance recorded against the deferred tax assets. However, after the impact of the Tax Act, the Company recorded tax expense of
$11.5 million
.
Income tax expense differs from the amount that would be computed by applying the U.S. statutory federal income tax rates of 21% and 35% for the years ended
December 31, 2018
and
2017
, respectively, to income before income taxes as a result of the following:
|
|
Years Ended December 31,
|
|||||||
|
(in thousands)
|
2018
|
2017
|
||||||
|
Federal statutory rate
|
$
|
9,634
|
|
$
|
18,209
|
|
||
|
State income taxes, net of federal benefit
|
3,625
|
|
1,721
|
|
||||
|
Permanent differences
|
130
|
|
777
|
|
||||
|
Tax credits
|
(7,031
|
)
|
(1,949
|
)
|
||||
|
Valuation allowances
|
4,462
|
|
(474
|
)
|
||||
|
Changes in tax rates
|
(464
|
)
|
5,818
|
|
||||
|
Stock-based compensation
|
(216
|
)
|
303
|
|
||||
|
Other
|
283
|
|
(253
|
)
|
||||
|
Expense for the provision for income taxes
|
$
|
10,423
|
|
$
|
24,152
|
|
||
Deferred income taxes are provided for the effects of temporary differences between the tax basis of an asset or liability and their reported amounts in the accompanying Consolidated Balance Sheets. These temporary differences result in taxable or deductible amounts in future years. Details of the Company’s deferred tax assets and liabilities are summarized as
79
Advanced Emissions Solutions, Inc. and Subsidiaries
Notes to Consolidated Financial Statements
follows:
|
|
As of December 31,
|
|||||||
|
(in thousands)
|
2018
|
2017
|
||||||
|
Deferred tax assets
|
||||||||
|
Tax credits
|
$
|
104,553
|
|
$
|
100,367
|
|
||
|
Deferred revenues and loss contract provisions
|
—
|
|
906
|
|
||||
|
Employee related liabilities
|
1,515
|
|
393
|
|
||||
|
Intangible assets
|
1,623
|
|
914
|
|
||||
|
Equity method investments
|
9,588
|
|
8,457
|
|
||||
|
Net operating loss carryforwards
|
2,479
|
|
2,004
|
|
||||
|
Other investments
|
583
|
|
563
|
|
||||
|
Other
|
380
|
|
648
|
|
||||
|
Total deferred tax assets
|
120,721
|
|
114,252
|
|
||||
|
Less valuation allowance
|
(79,898
|
)
|
(75,436
|
)
|
||||
|
Deferred tax assets
|
40,823
|
|
38,816
|
|
||||
|
Less: Deferred tax liabilities
|
||||||||
|
Property and equipment and other
|
(8,284
|
)
|
(155
|
)
|
||||
|
Total deferred tax liabilities
|
(8,284
|
)
|
(155
|
)
|
||||
|
Net deferred tax assets
|
$
|
32,539
|
|
$
|
38,661
|
|
||
Accounting for income taxes requires that companies assess whether a valuation allowance should be recorded against their deferred tax asset based on an assessment of the amount of the deferred tax asset that is “more likely than not” to be realized. Valuation allowances are established, when necessary, to reduce deferred tax assets to the amount that is more likely than not to be realized.
The Company assesses the valuation allowance recorded against deferred tax assets at each reporting date. The determination of whether a valuation allowance for deferred tax assets is appropriate requires the evaluation of positive and negative evidence that can be objectively verified. Consideration must be given to all sources of taxable income available to realize a deferred tax asset, including, as applicable, the future reversal of existing temporary differences, future taxable income forecasts exclusive of the reversal of temporary differences and carryforwards, taxable income in carryback years and tax planning strategies. In estimating taxes, the Company assesses the relative merits and risks of the appropriate tax treatment of transactions taking into account statutory, judicial, and regulatory guidance.
As of
December 31, 2018
, the Company concluded it is more likely than not the Company will generate sufficient taxable income within the applicable NOL and tax credit carry-forward periods to realize
$32.5 million
of its net deferred tax assets, and therefore, increased its valuation allowance by
$4.5 million
. In reaching this conclusion, the Company most significantly considered: (1) forecasts of continued future taxable income, (2) changes to forecasts of future utilization of DTA's and (3) impacts of additional RC invested facilities during
2018
.
The following table presents the approximate amount of state net operating loss carryforwards and federal tax credit carryforwards available to reduce future taxable income, along with the respective range of years that the net operating loss and tax credit carryforwards would expire if not utilized:
|
As of December 31,
|
||||||||
|
(in thousands)
|
2018
|
Beginning expiration year
|
Ending expiration year
|
|||||
|
State net operating loss carryforwards
|
$
|
52,126
|
|
2032
|
2038
|
|||
|
Federal tax credit carryforwards
|
$
|
104,553
|
|
2032
|
2038
|
|||
80
Advanced Emissions Solutions, Inc. and Subsidiaries
Notes to Consolidated Financial Statements
The following table sets forth a reconciliation of the beginning and ending unrecognized tax benefits on a gross basis for the years ended
December 31, 2018
and
2017
:
|
|
Years Ended December 31,
|
|||||||
|
(in thousands)
|
2018
|
2017
|
||||||
|
Balance as of January 1
|
$
|
54
|
|
$
|
54
|
|
||
|
Increases for tax positions of current year
|
—
|
|
—
|
|
||||
|
Balance as of December 31
|
$
|
54
|
|
$
|
54
|
|
||
The Company did not record any adjustments or recognize interest expense for uncertain tax positions for the years ended
December 31, 2018
and
2017
. Interest and penalties related to uncertain tax positions are accrued and included in the
Interest expense
line item in the
Consolidated Statements of Operations
. Additionally, the Company recognizes interest expense related to the tax treatment of RC facilities at Tinuum Group in the
Interest expense
line item in the Consolidated Statements of Operations. Additional information related to these interest amounts is included in
Note 11
.
The Company files income tax returns in the U.S. and in various states. The Company is no longer subject to U.S. federal examinations by tax authorities for years before
2014
. The Company is generally no longer subject to state examinations by tax authorities for years before
2013
.
Note 14
- Business Segment Information
Operating segments are defined as components of an enterprise about which separate financial information is available that is evaluated regularly by a company's chief operating decision maker ("CODM"), or a decision making group, in deciding how to allocate resources and in assessing financial performance. As of
December 31, 2018
, the Company's CODM was the Company's CEO. The Company's operating and reportable segments are organized by products and services provided.
As of December 31, 2018, the Company has
two
reportable segments: (1) Refined Coal ("RC"); and (2) Power Generation and Industrials ("PGI"). The majority of Carbon Solutions operations has been included within the PGI segment; whereas a portion has been included within All Other and Corporate.
The business segment measurements provided to and evaluated by the CODM are computed in accordance with the principles listed below:
|
•
|
The accounting policies of the operating segments are the same as those described in the summary of significant accounting policies except as described below.
|
|
•
|
Segment revenues include equity method earnings and losses from the Company's equity method investments.
|
|
•
|
Segment operating income (loss) includes segment revenues and allocation of certain "Corporate general and administrative expenses," which includes
Payroll and benefits
,
Rent and occupancy
,
Legal and professional fees
, and
General and administrative
.
|
|
•
|
RC segment operating income includes interest expense directly attributable to the RC segment.
|
81
Advanced Emissions Solutions, Inc. and Subsidiaries
Notes to Consolidated Financial Statements
As of
December 31, 2018
and
December 31, 2017
, substantially all of the Company's material assets are located in the U.S. and all significant customers are U.S. companies. The following table presents the Company's operating segment results for the years ended
December 31, 2018
and
2017
:
|
|
Years Ended December 31,
|
|||||||
|
(in thousands)
|
2018
|
2017
|
||||||
|
Revenues:
|
||||||||
|
Refined Coal:
|
||||||||
|
Earnings in equity method investments
|
$
|
54,208
|
|
$
|
53,843
|
|
||
|
Royalties, related party
|
15,140
|
|
9,672
|
|
||||
|
69,348
|
|
63,515
|
|
|||||
|
Power Generation and Industrials:
|
||||||||
|
Equipment sales
|
72
|
|
31,446
|
|
||||
|
Consumables
|
8,628
|
|
4,246
|
|
||||
|
8,700
|
|
35,692
|
|
|||||
|
Total segment reporting revenues
|
78,048
|
|
99,207
|
|
||||
|
Adjustments to reconcile to reported revenues:
|
||||||||
|
Earnings in equity method investments
|
(54,208
|
)
|
(53,843
|
)
|
||||
|
Corporate and other
|
105
|
|
—
|
|
||||
|
Total reported revenues
|
$
|
23,945
|
|
$
|
45,364
|
|
||
|
Segment operating income (loss)
|
||||||||
|
Refined Coal (1)
|
$
|
65,454
|
|
$
|
59,908
|
|
||
|
Power Generation and Industrials (2)
|
(2,621
|
)
|
379
|
|
||||
|
Total segment operating income
|
$
|
62,833
|
|
$
|
60,287
|
|
||
(1) Included within the RC segment operating income for the years ended
December 31, 2018
and
2017
is 453A interest expense of
$1.6 million
and
$2.6 million
, respectively. Also included within the RC segment operating income for the year ended
December 31, 2018
was
$0.4 million
of severance expense.
(2) Included within the PGI segment operating income for the year ended
December 31, 2018
was approximately
$1.0 million
of amortization expense related to the fair value of inventory. Also included within the PGI segment operating income for the year ended
December 31, 2018
was
$1.0 million
of severance expense.
82
Advanced Emissions Solutions, Inc. and Subsidiaries
Notes to Consolidated Financial Statements
A reconciliation of reportable segment operating income to the Company's consolidated net income is as follows:
|
|
Years Ended December 31,
|
|||||||
|
(in thousands)
|
2018
|
2017
|
||||||
|
Segment operating income
|
||||||||
|
Total reported segment operating income
|
$
|
62,833
|
|
$
|
60,287
|
|
||
|
Corporate and other operating income
|
2
|
|
—
|
|
||||
|
Consolidated operating income
|
62,835
|
|
60,287
|
|
||||
|
Adjustments to reconcile to net income attributable to the Company
|
||||||||
|
Corporate payroll and benefits
|
(4,970
|
)
|
(5,565
|
)
|
||||
|
Corporate rent and occupancy
|
(616
|
)
|
(293
|
)
|
||||
|
Corporate legal and professional fees
|
(7,978
|
)
|
(4,010
|
)
|
||||
|
Corporate general and administrative
|
(3,011
|
)
|
(3,400
|
)
|
||||
|
Corporate depreciation and amortization
|
(134
|
)
|
(342
|
)
|
||||
|
Corporate interest (expense) income, net
|
(521
|
)
|
(432
|
)
|
||||
|
Other income (expense), net
|
272
|
|
5,780
|
|
||||
|
Income tax expense
|
(10,423
|
)
|
(24,152
|
)
|
||||
|
Net income
|
$
|
35,454
|
|
$
|
27,873
|
|
||
Corporate general and administrative expenses include certain costs that benefit the business as a whole but are not directly related to one of the Company's segments. Such costs include, but are not limited to, accounting and human resources staff, information systems costs, legal fees, facility costs, audit fees and corporate governance expenses.
A reconciliation of reportable segment assets to the Company's consolidated assets is as follows:
|
As of December 31,
|
||||||||
|
(in thousands)
|
2018
|
2017
|
||||||
|
Assets:
|
||||||||
|
Refined Coal
(1)
|
$
|
11,468
|
|
$
|
8,092
|
|
||
|
Power Generation and Industrial
|
85,786
|
|
3,755
|
|
||||
|
Total segment assets
|
97,254
|
|
11,847
|
|
||||
|
All Other and Corporate
(2)
|
62,410
|
|
70,771
|
|
||||
|
Consolidated
|
$
|
159,664
|
|
$
|
82,618
|
|
||
(1) Includes
$6.6 million
of investments in equity method investees.
(2) Includes the Company's net deferred tax assets of
$32.5 million
.
Note 15
- Major Customers
Revenues from external customers who represent
10%
or more of the Company’s revenues for the years ended
December 31, 2018
and
2017
were as follows:
|
|
Years ended December 31,
|
|||||||
|
Customer
|
Revenue Type
|
Segment(s)
|
2018
|
2017
|
||||
|
A
|
License royalties, related party
|
RC
|
63%
|
21%
|
||||
|
B
|
Equipment sales
|
PGI
|
—%
|
48%
|
||||
83
Advanced Emissions Solutions, Inc. and Subsidiaries
Notes to Consolidated Financial Statements
Note 16
- Related Party Transactions
Accounts Receivable
The following table shows the Company's receivable balance associated with related parties as of
December 31, 2018
and
2017
:
|
|
As of December 31,
|
|||||||
|
(in thousands)
|
2018
|
2017
|
||||||
|
Receivable from related party - Tinuum Group
|
$
|
4,284
|
|
$
|
3,247
|
|
||
Revenues
The following table shows the other income recognized with related parties during the years ended
December 31, 2018
and
2017
:
|
|
Years Ended December 31,
|
|||||||
|
(in thousands)
|
2018
|
2017
|
||||||
|
Royalties, related party - Tinuum Group
|
$
|
15,140
|
|
$
|
9,672
|
|
||
The above Tinuum Group royalties are included within the
License royalties, related party
line in the
Consolidated Statements of Operations
.
Note 17
- Defined Contribution Savings Plans
The Company sponsors two qualified defined contribution savings plans (collectively the "401(k) Plans") that allow participation by eligible employees who may defer a portion of their gross pay. The Company makes contributions to the 401(k) Plans based on percentages of an employee's eligible compensation as specified in the 401(k) Plans, and such employer contributions are in the form of cash.
The following table presents the amount of the Company's contributions made to the 401(k) Plan, which is reflected within the
Payroll and benefits
line item in the
Consolidated Statements of Operations
:
|
Years Ended December 31,
|
||||||||
|
(in thousands)
|
2018
|
2017
|
||||||
|
401(k) Plans employer contributions
|
$
|
139
|
|
$
|
56
|
|
||
Due to the usage of forfeitures within the 401(k) Plan to offset the Company's contribution related to the year ended December 31, 2017, there was an increase in employer contributions made to the 401(k) Plan for the
year ended December 31, 2018
.
As discussed in
Note 8
, the Company made an additional employer contribution of
$1.0 million
in June 2018 to one of its 401(k) Plans as part of an agreement with the DOL that required a restorative payment to be made to that 401(k) Plan. The Company had accrued this amount as of December 31, 2017 and the liability was included in
Other current liabilities
on the Consolidated Balance Sheet as of December 31, 2017 and the related expense was reflected within the
Other income (expense):
Other
line item in the Consolidated Statement of Operations for the year ended December 31, 2017.
Note 18
- Restructuring
In December 2018, the Company recorded restructuring charges in connection with the departures of certain executives of Carbon Solutions in conjunction with the Carbon Solutions Acquisition. As part of the Carbon Solutions Acquisition, the Company also assumed a salary severance liability for an additional executive of Carbon Solutions in the amount of
$0.6 million
. Additionally, the Company recorded restructuring charges in 2018 in connection with a reduction in force that commenced in May 2018 as part of the Company's further alignment of the business with strategic objectives, which included the departure of certain executive officers. These charges related to cash severance arrangements with departing employees and executives, as well as stock-based compensation charges related to the acceleration of vesting of certain stock awards.
During the year ended
December 31, 2017
, the Company did not record material restructuring charges.
84
Advanced Emissions Solutions, Inc. and Subsidiaries
Notes to Consolidated Financial Statements
A summary of the net pretax charges incurred by segment is as follows:
|
Pretax Charge
|
|||||||||||||||||||
|
(in thousands, except employee data)
|
Approximate Number of Employees
|
Refined Coal
|
PGI
|
All Other and Corporate
|
Total
|
||||||||||||||
|
Year ended December 31, 2018
|
|||||||||||||||||||
|
Restructuring charges
|
16
|
|
$
|
448
|
|
$
|
996
|
|
$
|
1,685
|
|
$
|
3,129
|
|
|||||
|
Changes in estimates
|
—
|
|
—
|
|
—
|
|
—
|
|
|||||||||||
|
Total pretax charge, net of reversals
|
$
|
448
|
|
$
|
996
|
|
$
|
1,685
|
|
$
|
3,129
|
|
|||||||
The following table summarizes the Company's utilization of restructuring accruals for the years ended
December 31, 2018
and
2017
:
|
(in thousands)
|
Employee Severance
|
Facility Closures
|
||||||
|
Beginning accrual as of January 1, 2017
|
$
|
452
|
|
$
|
247
|
|
||
|
Expense provision (1)
|
56
|
|
—
|
|
||||
|
Cash payments and other (1)
|
(508
|
)
|
(250
|
)
|
||||
|
Change in estimates (1)
|
—
|
|
3
|
|
||||
|
Accrual as of December 31, 2017
|
—
|
|
—
|
|
||||
|
Expense provision (1)
|
3,129
|
|
—
|
|
||||
|
Cash payments and other (1)
|
(1,491
|
)
|
—
|
|
||||
|
Severance liability acquired
|
570
|
|
—
|
|
||||
|
Accrual as of December 31, 2018
|
$
|
2,208
|
|
$
|
—
|
|
||
(1) For the year ended
December 31, 2018
, included within the Expense provision and Cash payments and other line items in the above table is stock-based compensation of
$0.8 million
resulting from the accelerated vesting of modified equity-based compensation awards for certain terminated employees.
Restructuring accruals related to personnel are included within the
Accrued payroll and related liabilities
line item in the
Consolidated Balance Sheets
. Restructuring expenses related to personnel are included within the
Payroll and benefits
and
Research and development, net
line items in the
Consolidated Statements of Operations
. Restructuring accruals related to facilities are included within the
Other current liabilities
line item in the
Consolidated Balance Sheets
. Restructuring expenses related to facilities are included within the
Rent and occupancy
line item in the
Consolidated Statements of Operations
.
85
Advanced Emissions Solutions, Inc. and Subsidiaries
Notes to Consolidated Financial Statements
Note 19
- Quarterly Financial Results (unaudited)
Summarized quarterly results for the two years ended
December 31, 2018
and
December 31, 2017
are as follows:
|
For the Quarter Ended
|
||||||||||||||||
|
(in thousands, except per share data)
|
December 31, 2018
|
September 30, 2018
|
June 30, 2018
|
March 31, 2018
|
||||||||||||
|
Revenues
|
$
|
10,626
|
|
(1)
|
$
|
5,147
|
|
$
|
4,273
|
|
$
|
3,899
|
|
|||
|
Cost of revenues, exclusive of operating expenses shown below
|
4,032
|
|
(1)
|
954
|
|
704
|
|
563
|
|
|||||||
|
Other operating expenses
|
9,745
|
|
(1), (2)
|
4,161
|
|
5,138
|
|
5,048
|
|
|||||||
|
Operating (loss) income
|
(3,151
|
)
|
32
|
|
(1,569
|
)
|
(1,712
|
)
|
||||||||
|
Earnings from equity method investments
|
16,351
|
|
9,715
|
|
15,889
|
|
12,253
|
|
||||||||
|
Other income (expenses), net
|
(930
|
)
|
(313
|
)
|
(378
|
)
|
(310
|
)
|
||||||||
|
Income before income tax expense
|
12,270
|
|
(1), (2)
|
9,434
|
|
13,942
|
|
10,231
|
|
|||||||
|
Income tax expense (benefit)
|
5,272
|
|
(3)
|
3,931
|
|
(1,349
|
)
|
2,569
|
|
|||||||
|
Net income
|
$
|
6,998
|
|
$
|
5,503
|
|
$
|
15,291
|
|
$
|
7,662
|
|
||||
|
Earnings per common share – basic
|
$
|
0.36
|
|
$
|
0.28
|
|
$
|
0.76
|
|
$
|
0.37
|
|
||||
|
Earnings per common share – diluted
|
$
|
0.36
|
|
$
|
0.28
|
|
$
|
0.75
|
|
$
|
0.37
|
|
||||
|
Weighted-average number of common shares outstanding
|
||||||||||||||||
|
Basic
|
19,339
|
|
19,726
|
|
20,062
|
|
20,502
|
|
||||||||
|
Diluted
|
19,439
|
|
19,876
|
|
20,195
|
|
20,584
|
|
||||||||
|
For the Quarter Ended
|
||||||||||||||||
|
(in thousands, except per share data)
|
December 31, 2017
|
September 30, 2017
|
June 30, 2017
|
March 31, 2017
|
||||||||||||
|
Revenues
|
$
|
3,791
|
|
$
|
5,098
|
|
$
|
27,331
|
|
$
|
9,144
|
|
||||
|
Cost of revenues, exclusive of operating expenses shown below
|
648
|
|
2,041
|
|
23,295
|
|
5,901
|
|
||||||||
|
Other operating expenses
|
4,205
|
|
4,197
|
|
4,020
|
|
5,199
|
|
||||||||
|
Operating (loss) income
|
(1,062
|
)
|
(1,140
|
)
|
16
|
|
(1,956
|
)
|
||||||||
|
Earnings from equity method investments
|
17,754
|
|
12,120
|
|
10,155
|
|
13,814
|
|
||||||||
|
Other income (expenses), net
|
1,831
|
|
(1,602
|
)
|
(121
|
)
|
2,216
|
|
||||||||
|
Income before income tax expense
|
18,523
|
|
9,378
|
|
10,050
|
|
14,074
|
|
||||||||
|
Income tax expense
|
11,538
|
|
(4)
|
3,586
|
|
3,642
|
|
5,386
|
|
|||||||
|
Net income
|
$
|
6,985
|
|
$
|
5,792
|
|
$
|
6,408
|
|
$
|
8,688
|
|
||||
|
Earnings per common share – basic
|
$
|
0.34
|
|
$
|
0.28
|
|
$
|
0.29
|
|
$
|
0.39
|
|
||||
|
Earnings per common share – diluted
|
$
|
0.33
|
|
$
|
0.28
|
|
$
|
0.29
|
|
$
|
0.39
|
|
||||
|
Weighted-average number of common shares outstanding
|
||||||||||||||||
|
Basic
|
20,767
|
|
20,808
|
|
21,866
|
|
22,056
|
|
||||||||
|
Diluted
|
20,864
|
|
20,854
|
|
21,880
|
|
22,243
|
|
||||||||
(1) During the fourth quarter of 2018, the Company completed the Carbon Solutions Acquisition and the operating results for the fourth quarter of 2018 include the operations of Carbon Solutions for the period from December 7 to December 31, 2018. For this period, Carbon Solutions contributed
$5.6 million
to Revenues,
$3.4 million
to Cost of Revenue,
$2.6 million
to Other Operating Expenses and
$0.4 million
to Loss before income tax expense.
(2) During the fourth quarter of 2018, the Company incurred
$3.4 million
in transaction costs and
$1.1 million
in severance charges for executives related to the Carbon Solutions Acquisition that were recorded in Other Operating Expenses.
(3) During the fourth quarter of 2018, the Company recorded income tax expense of
$5.3 million
primarily due to an increase of
$4.5 million
to the valuation allowance on its deferred tax assets.
86
Advanced Emissions Solutions, Inc. and Subsidiaries
Notes to Consolidated Financial Statements
(4) During the fourth quarter of 2017, the Company recorded income tax expense of
$11.5 million
primarily related to statutory federal and state taxes of
$5.7 million
at the statutory rates, and the impact of the Tax Act, which increased the Company's income tax expense by $
5.8 million
.
Note 20
- Subsequent Events
Unless disclosed elsewhere within the notes to the Consolidated Financial Statements, the following are the significant matters that occurred subsequent to December 31, 2018.
Invested RC Facility
On January 16, 2019, the Company announced that Tinuum Group completed a transaction for an additional RC facility. The RC facility is located at a coal plant that has historically burned in excess of
3.5 million
tons of coal per year and is royalty bearing to ADES. With this addition, Tinuum Group has
20
invested facilities in full-time operation.
Dividends
On February 5, 2019, the Board declared a quarterly dividend of
$0.25
per share of common stock, which was paid on March 7, 2019 to stockholders of record at the close of business on February 19, 2019.
87
Item 9. Changes in and Disagreements with Accountants on Accounting and Financial Disclosure
None.
Item 9A. Controls and Procedures
Evaluation of Disclosure Controls and Procedures
As required by Rule 13a‑15(b) under the Securities Exchange Act of 1934, as amended (the “Exchange Act”), we have evaluated, under the supervision of and with the participation of our management, including our principal executive officer and principal financial officer, the effectiveness of the design and operation of our disclosure controls and procedures (as defined in Rules 13a‑15(e) and 15d‑15(e) under the Exchange Act) as of the end of the period covered by this annual report. Our disclosure controls and procedures are designed to ensure that information required to be disclosed in the reports that we file or submit under the Exchange Act is recorded, processed, summarized and reported, within the time periods specified in the SEC’s rules and forms. Based upon this evaluation, our principal executive officer and principal financial officer concluded that our disclosure controls and procedures were effective as of
December 31, 2018
.
Management’s Report on Internal Control over Financial Reporting
Management is responsible for establishing and maintaining adequate internal control over financial reporting as defined in Rules 13a-15(f) and 15d-15(f) under the Exchange Act. Internal control over financial reporting is designed to provide reasonable assurance regarding the reliability of financial reporting and the preparation of consolidated financial statements for external purposes in accordance with generally accepted accounting principles. The Company's internal control over financial reporting includes those policies and procedures that:
|
1.
|
Pertain to the maintenance of records that, in reasonable detail, accurately and fairly reflect the transactions and dispositions of our assets;
|
|
2.
|
Provide reasonable assurance that transactions are recorded as necessary to permit preparation of financial statements in accordance with generally accepted accounting principles, and that receipts and expenditures of the Company are being made only in accordance with authorizations of our management and directors; and
|
|
3.
|
Provide reasonable assurance regarding prevention or timely detection of unauthorized acquisition, use or disposition of the Company’s assets that could have a material effect on our financial statements.
|
Because of its inherent limitations, internal control over financial reporting may not prevent or detect misstatements. Also, projections of any evaluation of effectiveness to future periods are subject to the risk that controls may become inadequate because of changes in conditions, or that the degree of compliance with the policies or procedures may deteriorate.
Under the supervision of, and with the participation of our management, including the principal executive officer and principal financial officer, we conducted an evaluation of the effectiveness of our internal control over financial reporting based on the framework and criteria established in
Internal Control-Integrated Framework
in 2013, issued by the Committee of Sponsoring Organizations of the Treadway Commission. Based on this evaluation, our management concluded that our internal control over financial reporting was effective as of
December 31, 2018
.
On December 7, 2018, we acquired Carbon Solutions and have excluded their business from our assessment of internal control over financial reporting as of December 31, 2018, as allowed under general guidance issued by the Staff of the Securities and Exchange Commission. The total assets and total revenues of Carbon Solutions represent 54% and 23%, respectively, of the consolidated financial statement amounts as of and for the year ended December 31, 2018, respectively.
Moss Adams LLP, an independent registered public accounting firm, has issued an attestation report on our internal control over financial reporting as of
December 31, 2018
and its report is included herein.
Changes in Internal Control Over Financial Reporting
Except for the addition of merger and acquisition controls related to the acquisition of Carbon Solutions, there has been no change in our internal control over financial reporting (as defined in Rules 13a‑15(f) and 15d‑15(f) under the Exchange Act) during the fourth quarter of
2018
that has materially affected, or is reasonably likely to materially affect, our internal control over financial reporting.
88
Report of Independent Registered Public Accounting Firm
To the Stockholders and the Board of Directors of
Advanced Emissions Solutions, Inc. and Subsidiaries
Opinion on Internal Control over Financial Reporting
We have audited Advanced Emissions Solutions, Inc. and subsidiaries’ (the "Company") internal control over financial reporting as of December 31, 2018, based on criteria established in
Internal Control - Integrated Framework (2013)
issued by the Committee of Sponsoring Organizations of the Treadway Commission ("COSO"). In our opinion, the Company maintained, in all material respects, effective control over financial reporting as of December 31, 2018, based on criteria established in
Internal Control - Integrated Framework (2013)
issued by COSO.
We also have audited, in accordance with the standards of the Public Company Accounting Oversight Board (United States) ("PCAOB"), the consolidated balance sheets of Advanced Emissions Solutions, Inc. as of December 31, 2018 and 2017, the related consolidated statements of operations, stockholders’ equity and cash flows for the years then ended, and the related notes (collectively referred to as the “consolidated financial statements”) and our report dated March 18, 2019 expressed an unqualified opinion on those consolidated financial statements and included an explanatory paragraph relating to the adoption of ASC 606 - Revenue from Contracts with Customers.
Basis for Opinion
The Company’s management is responsible for maintaining effective internal control over financial reporting and for its assessment of the effectiveness of internal control over financial reporting, included in the accompanying Management Report on Internal Control over Financial Reporting. Our responsibility is to express an opinion on the Company’s internal control over financial reporting based on our audit. We are a public accounting firm registered with the PCAOB and are required to be independent with respect to the Company in accordance with the U.S. federal securities laws and the applicable rules and regulations of the Securities and Exchange Commission and the PCAOB.
We conducted our audit in accordance with the standards of the PCAOB. Those standards require that we plan and perform the audit to obtain reasonable assurance about whether effective internal control over financial reporting was maintained in all material respects. Our audit included obtaining an understanding of internal control over financial reporting, assessing the risk that a material weakness exists, and testing and evaluating the design and operating effectiveness of internal control based on the assessed risk. Our audit also included performing such other procedures as we considered necessary in the circumstances. We believe that our audit provides a reasonable basis for our opinion.
As discussed in Management’s Report on Internal Control Over Financial Reporting, on December 7, 2018, the Company acquired ADA Carbon Solutions, LLC (“Carbon Solutions”). For the purposes of assessing internal control over financial reporting, management excluded Carbon Solutions, whose financial statements constitute 54% of the Company’s consolidated total assets and 23% of consolidated net revenues as of and for the year ended December 31, 2018. Accordingly, our audit did not include the internal control over financial reporting of Carbon Solutions.
Definition and Limitations of Internal Control Over Financial Reporting
A company’s internal control over financial reporting is a process designed to provide reasonable assurance regarding the reliability of financial reporting and the preparation of financial statements for external purposes in accordance with generally accepted accounting principles. A company’s internal control over financial reporting includes those policies and procedures that (1) pertain to the maintenance of records that, in reasonable detail, accurately and fairly reflect the transactions and dispositions of the assets of the company; (2) provide reasonable assurance that transactions are recorded as necessary to permit preparation of financial statements in accordance with generally accepted accounting principles, and that receipts and expenditures of the company are being made only in accordance with authorizations of management and directors of the company; and (3) provide reasonable assurance regarding prevention or timely detection of unauthorized acquisition, use, or disposition of the company’s assets that could have a material effect on the financial statements.
89
Because of its inherent limitations, internal control over financial reporting may not prevent or detect misstatements. Also, projections of any evaluation of effectiveness to future periods are subject to the risk that controls may become inadequate because of changes in conditions, or that the degree of compliance with the policies or procedures may deteriorate.
/s/ Moss Adams LLP
Denver, Colorado
March 18, 2019
90
Item 9B. Other Information
None.
91
PART III
Item 10. Directors, Executive Officers, and Corporate Governance
The information required by this Item is incorporated by reference to our definitive proxy statement for the Annual Meeting of Stockholders to be filed within 120 days from
December 31, 2018
.
Item 11. Executive Compensation
The information required by this Item is incorporated by reference to our definitive proxy statement for the Annual Meeting of Stockholders to be filed within 120 days from
December 31, 2018
.
Item 12. Security Ownership of Certain Beneficial Owners and Management and Related Stockholder Matters
The information required by this Item concerning security ownership of certain beneficial owners and management is incorporated by reference to our definitive proxy statement for the Annual Meeting of Stockholders to be filed within 120 days from
December 31, 2018
, with the exception of the following information.
Securities Authorized for Issuance under Equity Compensation Plans
We have plans under which equity awards are authorized for grant or issuance as compensation to eligible employees, consultants, and members of the Board. Our stockholders have approved these plans. See
Note 10
Stock-Based Compensation included in Item 8 of this Report for further information about the material terms of our equity compensation plans. The following table is a summary of the shares of our common stock authorized for issuance under the equity compensation plans as of
December 31, 2018
:
|
Plan Category
|
Number of securities to be issued upon exercise of outstanding options, warrants and rights
|
Weighted-average exercise price of outstanding options, warrants and rights (2)
|
Number of securities remaining available for future issuance under equity compensation plans (excluding securities reflected in the first column) (3)
|
|||||||
|
Equity compensation plans approved by security holders (1)
|
549,780
|
|
$
|
12.23
|
|
2,376,111
|
|
|||
|
Equity compensation plans not approved by security holders
|
—
|
|
$
|
—
|
|
—
|
|
|||
|
Total
|
549,780
|
|
2,376,111
|
|
||||||
(1) Includes the Amended and Restated 2007 Equity Incentive Plan, as amended, the Amended and Restated 2010 Non-Management Compensation and Incentive Plan, as amended, and the 2017 Omnibus Incentive Plan.
(2) The weighted-average price pertains only to
529,780
shares of common stock issuable upon the exercise of outstanding options.
(3) The number of securities is reduced by
280,852
shares of restricted common stock for which restrictions have not lapsed.
Item 13. Certain Relationships and Related Transactions and Director Independence
The information required by this Item is incorporated by reference to our definitive proxy statement for the Annual Meeting of Stockholders to be filed within 120 days from
December 31, 2018
.
Item 14. Principal Accountant Fees and Services
The information required by this Item is incorporated by reference to our definitive proxy statement for the Annual Meeting of Stockholders to be filed within 120 days from
December 31, 2018
.
92
Item 15. Exhibits and Financial Statement Schedules
|
(a)
|
The following consolidated financial statements of Advanced Emissions Solutions, Inc. are filed as part of this Report under Item 8:
|
|
(1)
|
Financial Statements – see Index to Consolidated Financial Statements in Item 8;
|
|
(2)
|
Financial Statement Schedules – All schedules are omitted because the required information is not applicable or is not present in amounts sufficient to require submission of the schedule or because the information required is included in the Consolidated Financial Statements and Notes thereto; and
|
|
(3)
|
Exhibits – Those exhibits required by Item 601 of Regulation S-K and by paragraph (b) below.
|
|
(b)
|
The following exhibits are filed as part of this Report or, where indicated, were heretofore filed and are hereby incorporated by reference:
|
|
Exhibit No.
|
Description
|
Form
|
File No.
|
Incorporated by Reference
Exhibit |
Filing Date
|
|||||
|
3.1
|
10-Q
|
000-54992
|
3.1
|
August 9, 2013
|
||||||
|
3.2
|
10-K
|
001-37822
|
3.2
|
March 12, 2018
|
||||||
|
3.3
|
8-K
|
001-37822
|
3.1
|
May 8, 2017
|
||||||
|
4.1
|
10-Q
|
000-54992
|
4.1
|
August 9, 2013
|
||||||
|
4.2
|
8-K
|
001-37822
|
3.2
|
May 8, 2017
|
||||||
|
4.3
|
8-K
|
001-37822
|
4.2
|
April 11, 2018
|
||||||
|
10.1
|
8-K
|
001-37822
|
10.1
|
June 22, 2017
|
||||||
|
10.2
|
10-K
|
000-54992
|
10.19
|
February 29, 2016
|
||||||
|
10.3
|
8-K
|
000-54992
|
10.66
|
September 2, 2014
|
||||||
|
10.4
|
10-K
|
000-50216
|
10.34
|
March 27, 2007
|
||||||
|
10.5
|
8-K
|
000-54992
|
10.67
|
September 2, 2014
|
||||||
|
10.6
|
10-Q/A
|
000-50216
|
10.33
|
September 28, 2011
|
||||||
|
10.7
|
10-Q
|
000-50216
|
10.89
|
November 14, 2011
|
||||||
|
10.8
|
10-Q
|
000-50216
|
10.59
|
November 9, 2012
|
||||||
|
10.9
|
10-Q
|
000-50216
|
10.87
|
August 12, 2011
|
||||||
|
10.10
|
10-K
|
000-54992
|
10.38
|
February 29, 2016
|
||||||
93
|
Exhibit No.
|
Description
|
Form
|
File No.
|
Incorporated by Reference
Exhibit |
Filing Date
|
|||||
|
10.11
|
10-Q
|
000-50216
|
10.77
|
August 16, 2010
|
||||||
|
10.12
|
10-K
|
000-50216
|
10.81
|
March 28, 2011
|
||||||
|
10.13
|
10-Q
|
000-54992
|
10.63
|
November 12, 2013
|
||||||
|
10.14
|
10-Q
|
000-50216
|
10.74
|
August 16, 2010
|
||||||
|
10.15
|
10-K
|
000-54992
|
10.44
|
February 29, 2016
|
||||||
|
10.16
|
10-K
|
000-50216
|
10.49
|
March 15, 2012
|
||||||
|
10.17
|
10-Q/A
|
000-50216
|
10.84
|
September 28, 2011
|
||||||
|
10.18
|
10-Q
|
000-50216
|
10.86
|
August 12, 2011
|
||||||
|
10.19
|
10-K
|
000-50216
|
10.44
|
March 15, 2012
|
||||||
|
10.20
|
10-K
|
000-50216
|
10.50
|
March 15, 2012
|
||||||
|
10.21
|
10-Q
|
000-50216
|
10.58
|
November 9, 2012
|
||||||
|
10.22
|
10-Q
|
000-54992
|
10.62
|
November 12, 2013
|
||||||
|
10.23
|
10-K
|
000-54992
|
10.69
|
February 29, 2016
|
||||||
|
10.24
|
10-K
|
000-54992
|
10.70
|
February 29, 2016
|
||||||
|
10.25
|
10-K
|
000-54992
|
10.71
|
February 29, 2016
|
||||||
|
10.26
|
10-K
|
000-54992
|
10.72
|
February 29, 2016
|
||||||
|
10.27
|
10-K
|
000-54992
|
10.73
|
February 29, 2016
|
||||||
|
10.28
|
10-K
|
000-54992
|
10.74
|
February 29, 2016
|
||||||
|
10.29
|
10-K
|
000-54992
|
10.75
|
February 29, 2016
|
||||||
94
|
Exhibit No.
|
Description
|
Form
|
File No.
|
Incorporated by Reference
Exhibit |
Filing Date
|
|||||
|
10.30
|
10-K
|
000-54992
|
10.76
|
February 29, 2016
|
||||||
|
10.31
|
10-K
|
000-54992
|
10.77
|
February 29, 2016
|
||||||
|
10.32
|
10-Q
|
001-37822
|
10.3
|
August 9, 2016
|
||||||
|
10.33
|
8-K
|
001-37822
|
10.1
|
September 1, 2016
|
||||||
|
10.34
|
10-K
|
001-37822
|
10.50
|
March 13, 2017
|
||||||
|
10.35
|
10-K
|
001-37822
|
10.51
|
March 13, 2017
|
||||||
|
10.36
|
10-Q
|
001-37822
|
10.1
|
November 6, 2017
|
||||||
|
10.37
|
10-Q
|
001-37822
|
10.1
|
August 6, 2018
|
||||||
|
10.38
|
10-Q
|
001-37822
|
10.2
|
August 6, 2018
|
||||||
|
10.39
|
10-Q
|
001-37822
|
10.1
|
November 6, 2018
|
||||||
|
10.40
|
8-K
|
001-37822
|
2.1
|
November 15, 2018
|
||||||
|
10.41
|
8-K
|
001-37822
|
10.1
|
December 13, 2018
|
||||||
|
10.42
|
8-K
|
001-37822
|
10.2
|
December 13, 2018
|
||||||
|
10.43
|
||||||||||
95
|
Exhibit No.
|
Description
|
Form
|
File No.
|
Incorporated by Reference
Exhibit |
Filing Date
|
|||||
|
10.44
|
||||||||||
|
21.1
|
||||||||||
|
23.1
|
||||||||||
|
23.2
|
||||||||||
|
31.1
|
||||||||||
|
31.2
|
||||||||||
|
32.1
|
||||||||||
|
95
|
||||||||||
|
101
|
The following financial statements, formatted in XBRL: (i) Consolidated Balance Sheets as of December 31, 2018 and 2017, (ii) Consolidated Statements of Operations for the Years ended December 31, 2018 and 2017, (iii) Consolidated Statements of Changes in Stockholders’ Equity for the Years ended December 31, 2018 and 2017, (iv) Consolidated Statements of Cash Flows for the Years ended December 31, 2018 and 2017; and (v) Notes to the Consolidated Financial Statements. The information in Exhibit 101 is “furnished” and not “filed” as provided in Rule 401 of Regulation S-T.
|
|||||||||
Notes:
|
*
|
– Filed herewith.
|
|
**
|
– Management contract or compensatory plan or arrangement.
|
|
***
|
– Portions of this exhibit have been omitted pursuant to a request for confidential treatment. The non-public information has been separately filed with the Securities and Exchange Commission.
|
Filings for the Company were made under the name ADA-ES, Inc. (File No. 000-50216) prior to July 1, 2013, the effective date of our reorganization, and under the name Advanced Emissions Solutions, Inc. (File No. 000-54992) starting on July 1, 2013. Filings for the Company were made under the name Advanced Emissions Solutions, Inc. (File No. 001-37822) starting on July 6, 2016.
|
(c)
|
The following financial statements are included in this report pursuant to Regulation S-X Rule 3-09:
|
|
(1)
|
Tinuum Group, LLC and Subsidiaries;
|
a. Consolidated Financial Statements, December 31, 2018 and 2017 (With Independent Auditors' Reports Thereon);
96
TINUUM GROUP, LLC AND SUBSIDIARIES
CONSOLIDATED FINANCIAL STATEMENTS
As of and for the Years Ended
December 31, 2018 and 2017
97
TABLE OF CONTENTS
98
Report of Independent Registered Public Accounting Firm
To the Board of Managers of
Tinuum Group, LLC
Opinion on the Financial Statements
We have audited the accompanying consolidated balance sheets of Tinuum Group, LLC and subsidiaries (the “Company”) as of December 31, 2018 and 2017, the related consolidated statements of operations, members’ equity, and cash flows for the years then ended, and the related notes (collectively referred to as the “consolidated financial statements”). In our opinion, the consolidated financial statements present fairly, in all material respects, the consolidated financial position of the Company as of December 31, 2018 and 2017, and the consolidated results of their operations and their cash flows for the years then ended, in conformity with accounting principles generally accepted in the United States of America.
Basis for Opinion
These consolidated financial statements are the responsibility of the Company’s management. Our responsibility is to express an opinion on the Company’s consolidated financial statements based on our audits. We are a public accounting firm registered with the Public Company Accounting Oversight Board (United States) (“PCAOB”) and are required to be independent with respect to the Company in accordance with the U.S. federal securities laws and the applicable rules and regulations of the Securities and Exchange Commission and the PCAOB.
We conducted our audits in accordance with the standards of the PCAOB. Those standards require that we plan and perform the audit to obtain reasonable assurance about whether the consolidated financial statements are free of material misstatement, whether due to error or fraud. The Company is not required to have, nor were we engaged to perform, an audit of its internal control over financial reporting. As part of our audits, we are required to obtain an understanding of internal control over financial reporting but not for the purpose of expressing an opinion on the effectiveness of the Company’s internal control over financial reporting. Accordingly, we express no such opinion.
Our audits included performing procedures to assess the risks of material misstatement of the consolidated financial statements, whether due to error or fraud, and performing procedures to respond to those risks. Such procedures included examining, on a test basis, evidence regarding the amounts and disclosures in the consolidated financial statements. Our audits also included evaluating the accounting principles used and significant estimates made by management, as well as evaluating the overall presentation of the consolidated financial statements. We believe that our audits provide a reasonable basis for our opinion.
/s/ Moss Adams LLP
Denver, Colorado
March 15, 2019
We have served as the Company’s auditor since 2017.
99
TINUUM GROUP, LLC AND SUBSIDIARIES
CONSOLIDATED BALANCE SHEETS
As of December 31, 2018 and 2017
(in thousands)
|
ASSETS
|
|||||||
|
2018
|
2017
|
||||||
|
CURRENT ASSETS
|
|||||||
|
Cash
|
$
|
26,211
|
|
$
|
13,309
|
|
|
|
Accounts receivable
|
7,218
|
|
5,720
|
|
|||
|
Related party receivables
|
6,350
|
|
969
|
|
|||
|
Prepaid expenses
|
547
|
|
537
|
|
|||
|
Inventory
|
14,632
|
|
11,070
|
|
|||
|
Total current assets
|
54,958
|
|
31,605
|
|
|||
|
Fixed assets, net
|
75,206
|
|
65,228
|
|
|||
|
Deferred tax assets
|
—
|
|
224
|
|
|||
|
Other assets, net
|
17,785
|
|
9,603
|
|
|||
|
TOTAL ASSETS
|
$
|
147,949
|
|
$
|
106,660
|
|
|
The following table presents certain assets of the consolidated variable interest entities ("VIEs"), which are included in the Consolidated Balance Sheets above. The assets in the table below include those assets that can only be used to settle obligations of consolidated VIEs, presented on the following page, and are in excess of those obligations. Additionally, the assets in the table below include third-party assets of consolidated VIEs only and exclude intercompany balances that eliminate in consolidation.
Assets of Consolidated VIEs to be Used to Settle Obligations of Consolidated VIEs
|
2018
|
2017
|
||||||
|
ASSETS
|
|||||||
|
Cash
|
$
|
10,939
|
|
$
|
6,919
|
|
|
|
Accounts receivable
|
1,574
|
|
1,093
|
|
|||
|
Inventory
|
14,632
|
|
11,017
|
|
|||
|
Prepaid expenses
|
379
|
|
149
|
|
|||
|
Non-current assets
|
11,981
|
|
7,043
|
|
|||
|
TOTAL ASSETS
|
$
|
39,505
|
|
$
|
26,221
|
|
|
Statement continues on the next page
The accompanying notes are an integral part of the consolidated financial statements.
100
TINUUM GROUP, LLC AND SUBSIDIARIES
CONSOLIDATED BALANCE SHEETS
As of December 31, 2018 and 2017
(in thousands)
|
LIABILITIES AND MEMBERS' EQUITY
|
|||||||
|
2018
|
2017
|
||||||
|
CURRENT LIABILITIES
|
|||||||
|
Accounts payable
|
$
|
5,828
|
|
$
|
2,431
|
|
|
|
Accrued liabilities
|
3,169
|
|
3,345
|
|
|||
|
Related party payables
|
10,705
|
|
7,498
|
|
|||
|
Deferred revenue
|
31,206
|
|
35,006
|
|
|||
|
Total current liabilities
|
50,908
|
|
48,280
|
|
|||
|
Secured promissory notes
|
9,722
|
|
7,284
|
|
|||
|
Deferred revenue - long-term
|
3,420
|
|
—
|
|
|||
|
Asset retirement obligation
|
1,304
|
|
1,066
|
|
|||
|
TOTAL LIABILITIES
|
65,354
|
|
56,630
|
|
|||
|
TEMPORARY CLASS B PREFERRED EQUITY
|
—
|
|
821
|
|
|||
|
OTHER MEMBERS' EQUITY
|
|||||||
|
Members' equity attributable to Class A Members
|
49,102
|
|
40,452
|
|
|||
|
Members' equity attributable to Class B Member
|
16,983
|
|
—
|
|
|||
|
Noncontrolling interests
|
16,510
|
|
8,757
|
|
|||
|
Total members' equity
|
82,595
|
|
49,209
|
|
|||
|
TOTAL LIABILITIES AND MEMBERS' EQUITY
|
$
|
147,949
|
|
$
|
106,660
|
|
|
The following table presents certain liabilities of consolidated VIEs, which are included in the Consolidated Balance Sheets above. The liabilities in the table below include third-party liabilities of consolidated VIEs only and exclude intercompany balances that eliminate in consolidation. The liabilities also exclude intercompany amounts where creditors have recourse against the general credit of Tinuum Group, LLC.
Liabilities of Consolidated VIEs for Which Creditors Do Not Have Recourse Against the General Credit of Tinuum Group, LLC
|
|
|||||||
|
2018
|
2017
|
||||||
|
LIABILITIES
|
|||||||
|
Accounts payable and accrued liabilities
|
$
|
9,401
|
|
$
|
6,592
|
|
|
|
Secured promissory notes
|
9,722
|
|
7,284
|
|
|||
|
Non-current liabilities
|
795
|
|
575
|
|
|||
|
TOTAL LIABILITIES
|
$
|
19,918
|
|
$
|
14,451
|
|
|
The accompanying notes are an integral part of the consolidated financial statements.
101
TINUUM GROUP, LLC AND SUBSIDIARIES
CONSOLIDATED STATEMENTS OF OPERATIONS
For the Years Ended December 31, 2018 and 2017
(in thousands)
|
2018
|
2017
|
||||||
|
REVENUES
|
|||||||
|
Reduced emissions and unrefined fuel
|
$
|
451,273
|
|
$
|
263,673
|
|
|
|
Lease
|
162,684
|
|
129,378
|
|
|||
|
Other
|
1,103
|
|
346
|
|
|||
|
TOTAL REVENUES
|
615,060
|
|
393,397
|
|
|||
|
COST OF SALES (exclusive of depreciation shown separately below)
|
|||||||
|
Feedstock purchases
|
451,273
|
|
263,662
|
|
|||
|
Chemicals
|
18,648
|
|
10,079
|
|
|||
|
Site and production fees
|
20,849
|
|
13,727
|
|
|||
|
Royalties and broker fees
|
17,155
|
|
10,377
|
|
|||
|
TOTAL COST OF SALES
|
507,925
|
|
297,845
|
|
|||
|
GROSS PROFIT
|
107,135
|
|
95,552
|
|
|||
|
OPERATING EXPENSES
|
7,935
|
|
9,057
|
|
|||
|
SELLING, GENERAL AND ADMINISTRATIVE EXPENSES
|
10,688
|
|
8,935
|
|
|||
|
DEPRECIATION AND AMORTIZATON EXPENSE
|
5,039
|
|
4,966
|
|
|||
|
INCOME FROM OPERATIONS
|
83,473
|
|
72,594
|
|
|||
|
OTHER EXPENSE
|
|||||||
|
Other expense, net
|
3,947
|
|
2,644
|
|
|||
|
Interest expense
|
368
|
|
482
|
|
|||
|
TOTAL OTHER EXPENSE
|
4,315
|
|
3,126
|
|
|||
|
INCOME BEFORE STATE INCOME TAXES
|
79,158
|
|
69,468
|
|
|||
|
State income tax expense
|
1,359
|
|
1,394
|
|
|||
|
NET INCOME
|
77,799
|
|
68,074
|
|
|||
|
Class B holders preferred return
|
(12
|
)
|
(1,712
|
)
|
|||
|
Loss attributable to noncontrolling interests
|
58,013
|
|
43,474
|
|
|||
|
|
|||||||
|
NET INCOME AVAILABLE TO CLASS A and B MEMBERS
|
$
|
135,800
|
|
$
|
109,836
|
|
|
The accompanying notes are an integral part of the consolidated financial statements.
102
TINUUM GROUP, LLC AND SUBSIDIARIES
CONSOLIDATED STATEMENTS OF MEMBERS' EQUITY
Years Ended December 31, 2018 and 2017
(in thousands)
|
Temporary Class B Member
|
Class A Members
|
Class B Member
|
Noncontrolling Interest
|
Total Other Members' Equity (Deficit)
|
|||||||||||||||
|
BALANCES, JANUARY 1, 2017
|
$
|
18,250
|
|
$
|
26,475
|
|
$
|
—
|
|
8,907
|
|
$
|
53,632
|
|
|||||
|
Class B holders preferred return
|
1,712
|
|
—
|
|
—
|
|
—
|
|
1,712
|
|
|||||||||
|
Member contributions
|
—
|
|
—
|
|
—
|
|
43,324
|
|
43,324
|
|
|||||||||
|
Member distributions
|
(17,250
|
)
|
(97,750
|
)
|
—
|
|
—
|
|
(115,000
|
)
|
|||||||||
|
Reclassification of member equity
|
(1,891
|
)
|
1,891
|
|
—
|
|
—
|
|
—
|
|
|||||||||
|
Net income available to Class A Members
|
—
|
|
109,836
|
|
—
|
|
—
|
|
109,836
|
|
|||||||||
|
Net loss attributable to noncontrolling interest
|
—
|
|
—
|
|
—
|
|
(43,474
|
)
|
(43,474
|
)
|
|||||||||
|
BALANCES, DECEMBER 31, 2017
|
$
|
821
|
|
$
|
40,452
|
|
$
|
—
|
|
8,757
|
|
$
|
50,030
|
|
|||||
|
Class B holders preferred return
|
12
|
|
—
|
|
—
|
|
—
|
|
12
|
|
|||||||||
|
Member contributions
|
—
|
|
—
|
|
—
|
|
65,766
|
|
65,766
|
|
|||||||||
|
Member distributions
|
(513
|
)
|
(107,100
|
)
|
(3,387
|
)
|
—
|
|
(111,000
|
)
|
|||||||||
|
Reclassification of member equity
|
(320
|
)
|
320
|
|
—
|
|
—
|
|
—
|
|
|||||||||
|
Net income
|
—
|
|
115,430
|
|
20,370
|
|
—
|
|
135,800
|
|
|||||||||
|
Net loss attributable to noncontrolling interest
|
—
|
|
—
|
|
—
|
|
(58,013
|
)
|
(58,013
|
)
|
|||||||||
|
BALANCES, DECEMBER 31, 2018
|
$
|
—
|
|
$
|
49,102
|
|
$
|
16,983
|
|
$
|
16,510
|
|
$
|
82,595
|
|
||||
The accompanying notes are an integral part of the consolidated financial statements.
103
TINUUM GROUP, LLC AND SUBSIDIARIES
CONSOLIDATED STATEMENTS OF CASH FLOWS
For the Years Ended December 31, 2018 and 2017
(in thousands)
|
2018
|
2017
|
|||||||
|
CASH, BEGINNING OF YEAR
|
$
|
13,309
|
|
$
|
10,897
|
|
||
|
CASH FLOWS FROM OPERATING ACTIVITIES
|
||||||||
|
Net income
|
77,799
|
|
68,074
|
|
||||
|
Adjustments to reconcile net income to net cash provided by operating activities:
|
||||||||
|
Depreciation and amortization
|
5,039
|
|
4,966
|
|
||||
|
Loss on sale of assets
|
3,996
|
|
2,663
|
|
||||
|
Accretion of asset retirement obligation
|
115
|
|
139
|
|
||||
|
Deferred state taxes
|
224
|
|
965
|
|
||||
|
Effects of changes in operating assets and liabilities:
|
||||||||
|
Accounts receivable
|
(1,498
|
)
|
(1,930
|
)
|
||||
|
Related party receivables
|
(5,381
|
)
|
(969
|
)
|
||||
|
Inventory
|
(3,562
|
)
|
(1,213
|
)
|
||||
|
Receipts (payments) on inventory purchase contract
|
(8,187
|
)
|
4,339
|
|
||||
|
Prepaid expenses and other assets
|
(10
|
)
|
(481
|
)
|
||||
|
Accounts payable and accrued liabilities
|
3,221
|
|
(1,388
|
)
|
||||
|
Related party payables
|
1,230
|
|
1,721
|
|
||||
|
Settlement of asset retirement obligation
|
(30
|
)
|
(348
|
)
|
||||
|
Deferred revenue
|
(380
|
)
|
1,599
|
|
||||
|
Net cash provided by operating activities
|
72,576
|
|
78,137
|
|
||||
|
CASH FLOWS FROM INVESTING ACTIVITIES
|
||||||||
|
Capital expenditures for fixed assets
|
(16,914
|
)
|
(4,539
|
)
|
||||
|
Proceeds from sale of fixed assets
|
36
|
|
—
|
|
||||
|
Net cash used in investing activities
|
(16,878
|
)
|
(4,539
|
)
|
||||
|
CASH FLOWS FROM FINANCING ACTIVITIES
|
||||||||
|
Borrowings (repayments) under secured promissory notes, net
|
2,438
|
|
490
|
|
||||
|
Borrowings under line of credit
|
4,000
|
|
5,000
|
|
||||
|
Repayments under line of credit
|
(4,000
|
)
|
(5,000
|
)
|
||||
|
Noncontrolling member contributions
|
65,766
|
|
43,324
|
|
||||
|
Members' distributions
|
(111,000
|
)
|
(115,000
|
)
|
||||
|
Net cash used in financing activities
|
(42,796
|
)
|
(71,186
|
)
|
||||
|
NET INCREASE IN CASH
|
12,902
|
|
2,412
|
|
||||
|
CASH, END OF YEAR
|
$
|
26,211
|
|
$
|
13,309
|
|
||
|
SUPPLEMENTAL DISCLOSURE
|
||||||||
|
Cash paid for interest
|
$
|
342
|
|
$
|
479
|
|
||
|
Cash paid for taxes
|
$
|
808
|
|
$
|
1,200
|
|
||
|
NON-CASH TRANSACTIONS
|
||||||||
|
Capital expenditures included in current liabilities
|
$
|
1,977
|
|
$
|
43
|
|
||
|
Asset retirement obligation recorded (removed)
|
$
|
153
|
|
$
|
(199
|
)
|
||
The accompanying notes are an integral part of the consolidated financial statements.
104
TINUUM GROUP, LLC AND SUBSIDIARIES
NOTES TO CONSOLIDATED FINANCIAL STATEMENTS
DECEMBER 31, 2018 and 2017
(in thousands)
NOTE 1 - SIGNIFICANT ACCOUNTING POLICIES
Tinuum Group, LLC (together with its subsidiaries, “Tinuum” or the “Company”) develops, manages, sells and leases facilities used in the production and sale of reduced emissions fuel (“REF Facilities”). The production and sale of reduced emissions fuel (a/k/a refined coal) via these REF Facilities qualifies for production tax credits that are available under Section 45 of the Internal Revenue Code (“PTCs”). The value of the PTC is adjusted annually based on inflation adjustment factors published in the Federal Register. The 2018 and 2017 PTC rates were $7.030 and $6.909, per ton of reduced emissions fuel produced, respectively.
Tinuum is owned 42.5% by ADA-ES, Inc. (“ADA”), 42.5% by NexGen Refined Coal, LLC (“NexGen”) (collectively, Class A Members), and 15% by GSFS Investments I Corp. (“GSFS” or the “Class B Member”). ADA, NexGen, and GSFS are collectively referred to herein as the “Members”.
Tinuum placed in service two REF Facilities prior to January 1, 2010 and 26 additional REF Facilities prior to January 1, 2012. Each REF Facility has demonstrated the required emissions reductions from the production of reduced emissions fuel to qualify for PTCs. The reduced emissions fuel produced at these REF Facilities is burned at coal-fired generation stations (the owner of which is a “Generator”) and is expected to continue to qualify for PTCs for a period of ten years following the applicable placed in service date (expiring at certain dates in 2019 and 2021).
At December 31, 2018 and 2017, respectively, 19 and 17 REF Facilities had been sold to or were under lease with third party investors (“TP Investors”) who utilize the REF Facilities to produce reduced emissions fuel (each of these REF Facilities is owned or leased by a “Producer Entity”). Some of the Producer Entities are owned or leased exclusively by a TP Investor and some are owned or leased by a TP Investor with some ownership percentage retained by the Company. The REF Facilities are located at coal-fired generation stations throughout the United States.
Tinuum has also at times produced reduced emissions fuel from REF Facilities for the benefit of its Members. As of December 31, 2018 and 2017 none of the REF Facilities were retained to produce reduced emissions fuel for the Members. In instances where Tinuum retains certain membership interests in a Producer Entity, PTCs generated are allocated to Tinuum in proportion to its member interests and are therefore available for the benefit of Tinuum’s Members.
Tinuum Services, LLC (“TS”), operates and maintains the REF Facilities under respective operating and maintenance agreements. TS is owned 50% each by ADA and NexGen and is not consolidated with the accounts of Tinuum. TP Investors of REF Facilities, and Tinuum for retained REF Facilities, pay TS, subject to certain limitations, a fee for procuring certain patented and proprietary chemical additives, an operating fee for the production of reduced emissions fuel, and for the other operating and maintenance costs associated with running the REF Facilities.
Basis of Presentation
The accompanying consolidated financial statements are presented in accordance with accounting principles generally accepted in the United States (“GAAP”). The accompanying consolidated financial statements include the accounts of the Company and several variable interest entities (“VIEs”), for which Tinuum is the primary beneficiary. An entity is referred to as a VIE if it meets any of the following criteria outlined in Accounting Standard Codification (“ASC”) 810 -
Consolidation
, (“ASC 810”) which are: (i) the entity has equity that is insufficient to permit the entity to finance its activities without additional subordinated financial support from other parties, (ii) the entity has equity investors that, as a group, lack the characteristics of a controlling financial interest, or (iii) the entity is structured with non-substantive voting rights.
The Company consolidates a VIE when it has both the power to direct the activities that most significantly impact the VIE’s economic performance and the obligation to absorb losses of the entity that could be potentially significant to the VIE (i.e., it is the primary beneficiary).
All intercompany balances and transactions have been eliminated in consolidation.
Use of Estimates
The preparation of financial statements in conformity with GAAP requires management to make estimates and assumptions that affect the reported amounts of assets and liabilities and disclosure of contingent assets and liabilities at the date of the financial statements and the reported amounts of revenue and expenses during the reporting period. Management bases its estimates on historical experience and on various other assumptions that are believed to be reasonable under the circumstances. Significant estimates include the assumption that the Company’s REF Facilities can be utilized after the expiration of the Section 45 PTC period. Ultimate realization of assets and settlement of liabilities in the future could differ from those estimates.
105
TINUUM GROUP, LLC AND SUBSIDIARIES
NOTES TO CONSOLIDATED FINANCIAL STATEMENTS
DECEMBER 31, 2018 and 2017
(in thousands)
Cash
The carrying value of cash approximates fair value due to its short-term nature. The Company maintains its cash in accounts with a financial institution. These accounts at times may exceed federally insured limits. The Company has not experienced any losses in these accounts. The Company believes it is not exposed to any significant credit risk related to cash.
Accounts Receivable
Accounts receivable consist primarily of payments due from TP Investors that own or lease the REF Facilities. The carrying amount of accounts receivable may be reduced by a valuation allowance that reflects management's best estimate of amounts that will not be collected. Under the Company’s agreements, interest can accrue on delinquent balances. No interest on delinquent balances was recorded for the years ended December 31, 2018 and 2017. Any allowance for doubtful accounts is based on management’s assessment of the collectability of specific customer accounts and the aging of the accounts receivable. If there is a deterioration of a major customer’s credit worthiness or actual defaults are higher than the historical experience, management’s estimates of the recoverability of amounts due to the Company could be adversely affected. As of December 31, 2018 and 2017, no allowance for doubtful accounts was considered necessary.
Inventory
Inventory is comprised primarily of feedstock coal and chemicals used in the production and sale of reduced emissions fuel at REF Facilities. Inventory is valued at the lower of cost or net realizable value using the average cost method.
Fixed Assets
Fixed assets are stated at historical cost and consist of major additions and improvements less accumulated depreciation. Expenditures for major improvements are capitalized, while maintenance and repair costs that do not significantly improve the related asset or extend its useful life are charged to expense as incurred. For financial reporting purposes, depreciation is calculated using the straight-line method over the estimated useful lives of the assets ranging from 3 to 20 years. Depreciation expense was $5,034 and $4,961, for the years ended December 31, 2018 and 2017, respectively.
The Company records a liability for asset retirement obligations (“ARO”) equal to the fair value of the estimated cost to retire a REF Facility. The ARO liability is initially recorded in the period in which the obligation meets the definition of a liability, which is generally when a REF Facility is installed at a generation station. The ARO liability is estimated by the Company based on legal removal requirements, historical removal experience, and anticipated future inflation rates. When the liability is initially recorded, the Company increases the carrying amount of the related long-lived asset by an amount equal to the original liability. The liability is increased over time to reflect the change in its present value, and the capitalized cost is depreciated over the useful life of the related long-lived asset. The ARO liability is removed when the Company is relieved of its removal obligation due to either completion of the removal activities at a generation station or a transfer of the responsibility for the REF Facility removal to a third party. The Company reevaluates the adequacy of its recorded ARO liability at least annually. Actual costs of asset retirements such as removing the REF Facility from a generation station and related site restoration, are charged against the related liability. Any difference between costs incurred upon settlement of an ARO and the recorded liability is recognized in other expense as a gain or loss in the Company’s consolidated statements of operations.
Intangible Assets
Tinuum has two exclusive licenses from ADA for the patented and proprietary “CyClean™” and “M-45™” technologies related to the production of reduced emissions fuel. The patents underlying the CyClean™ technology license expire beginning in 2021; however, the license agreement includes potential future patents related to the technology. The costs associated with the exclusive CyClean™ license are included in other assets, net and are being amortized over the useful economic life of the technology, or approximately 14 years, using the straight-line method. Amortization expense was $5 for each of the years ended December 31, 2018 and 2017.
Impairment of Long-Lived Assets
The Company reviews long-lived assets for impairment whenever events or changes in circumstances indicate the carrying amount of an asset may not be recoverable. Recoverability of assets to be held and used is measured by a comparison of the carrying amount of an asset to future undiscounted net cash flows expected to be generated by the asset. If such assets are considered to be impaired, the impairment to be recognized is measured by the amount by which the carrying amount of the assets exceeds the fair value of the assets. Assets to be disposed of are reported at the lower of carrying amount or fair value less costs to sell. At December 31, 2018 and 2017, there were no such impairments.
106
TINUUM GROUP, LLC AND SUBSIDIARIES
NOTES TO CONSOLIDATED FINANCIAL STATEMENTS
DECEMBER 31, 2018 and 2017
(in thousands)
Revenue Recognition
Reduced Emissions and Unrefined Fuel Revenues
The Company’s consolidated VIEs, which are Producer Entities, purchase and take title to feedstock coal under purchase agreements with each respective Generator or other supplier of feedstock coal. Each Producer Entity purchases chemicals from third party vendors and applies them to the feedstock fuel to produce reduced emissions fuel utilizing REF Facilities. The reduced emissions fuel is sold by the Producer Entities, under reduced emissions fuel sale agreements, to a Generator or to another third party at the discretion of the Manager of each Producer Entity, as permitted under the applicable Generator agreements. The Company performs reduced emissions fuel recertification or redetermination testing periodically as required by Section 45 with respect to production and sale of reduced emissions fuel at each of its REF Facilities. During the years ended December 31, 2018 and 2017, each of the Producer Entities sold all of its reduced emissions fuel and unrefined fuel (coal untreated but part of the reduced emissions fuel process) to third parties that used the fuel to generate electricity and recorded such amounts as reduced emissions fuel and unrefined fuel revenues.
Lease Revenues
Lease revenues are recognized based on the earning of purchase or lease payments under the terms of the respective REF Facilities’ TP Investor agreements. Depending on the agreement, the Company may receive fixed payments or a combination of fixed and contingent payments. Contingent payments are determined based on the actual amount of reduced emissions fuel production during the defined period. Certain prepayments are received upon execution of TP Investor agreements and are recorded as deferred revenue. Deferred revenue is amortized into revenue in accordance with the amortization period of the respective TP Investor agreement.
Other Revenues
Other revenues are comprised primarily of technology sublicense fees and chemical sales to third parties. Producer Entities sublicense Tinuum’s licensed technology for an annual fee. The sublicensed patented technology is necessary for each Producer Entity to produce reduced emissions fuel utilizing the REF Facility.
Income Taxes
The Company, with the consent of its Members, has elected to be taxed under applicable sections of federal and state income tax law as a limited liability company treated as a partnership for income tax purposes. As a result of this election, no federal income taxes are incurred by the Company. Instead, the Members are liable for income taxes on their pro rata share of the Company's income, deductions, losses, and credits.
In certain states, the Company is taxed based upon shareholder equity or other enterprise considerations. In these instances, the Company records and pays the applicable tax directly to the state agency. Deferred income taxes are provided for temporary differences arising from differences between the financial statement amount and tax basis of assets and liabilities existing at each balance sheet date, using enacted tax rates anticipated to be in effect when the related taxes are expected to be paid. A valuation allowance is established if it is more likely than not that a deferred tax asset will not be realized. The Company includes interest and penalties related to state tax as a component of income tax expense.
The Company applies the requirement of ASC 740,
Income Taxes,
related to accounting for uncertain tax positions.
In December 2017, legislation known as the Tax Cuts and Jobs Act was signed into law. While this reduced the overall U.S. federal income tax rates, since the Company is taxed as a partnership, the legislation did not impact the Company’s consolidated financial statements.
Reclassifications
Certain reclassifications have been made to the prior years’ financial statements to conform to the current year presentation. These reclassifications had no effect on previously reported results of operations or Member’s equity.
Recent Accounting Pronouncements
In May 2014, the FASB issued Accounting Standards Update (“ASU”) 2014-09,
Revenue from Contracts with Customers
(ASC 606). As amended by ASU 2015-14, the ASU is effective for private companies for annual reporting periods beginning after December 15, 2018. The FASB has issued several amendments to the standard, including clarification on accounting for licenses of intellectual property and identification of performance obligations. Under ASC 606, revenue is recognized when a customer obtains control of promised goods or services and is recognized in an amount that reflects the consideration which the entity expects to receive in exchange for those goods and services. In addition, the standard requires disclosure of the nature, amount, timing, and uncertainty of revenue and cash flows arising from contracts with customers.
107
TINUUM GROUP, LLC AND SUBSIDIARIES
NOTES TO CONSOLIDATED FINANCIAL STATEMENTS
DECEMBER 31, 2018 and 2017
(in thousands)
The guidance permits two methods of adoption to meet the new standard: retrospectively to each prior reporting period presented (full retrospective method), or retrospectively with the cumulative effect of initially applying the guidance recognized at the date of initial application (modified retrospective method). The Company is adopting the standard effective January 1, 2019 using the modified retrospective method. See Note 10 for more detail on the performance obligations identified by the Company and the estimated financial impact upon adoption.
In February 2016, the FASB issued ASU 2016-02
Leases
(ASC 842), which is intended to increase transparency and comparability of accounting for lease transactions. The ASU will require lessees to recognize a right-of-use ("ROU") asset and related lease liability for those leases classified as operating leases as of the adoption date. Lessor accounting remains similar to the current model but is updated to align with certain changes to the lessee model (i.e., certain definitions, such as initial direct costs, have been updated). Lease classifications by lessors are similar and include operating, direct financing, or sales-type. Lessees will need to recognize a ROU asset and a lease liability for virtually all of their leases. The lease liability will be equal to the present value of the lease payments. The ROU asset value will be based on the lease liability, subject to adjustment, such as for initial direct costs. For income statement purposes, the FASB retained a dual model, requiring leases to be classified as either operating or finance. The standard is effective for the Company for fiscal years, and interim periods within those fiscal years, beginning after December 15, 2019. Early adoption is permitted. The new standard must be adopted either retrospectively to each prior period presented or retrospectively at the beginning of the period of adoption.
Lease classification will be based on criteria that are largely similar to those applied in current lease accounting, but without explicit thresholds. The ASU will require both quantitative and qualitative disclosures regarding key information about leasing arrangements. The Company has elected to early adopt this standard beginning January 1, 2019. See Note 10 for the estimated impact on the Company’s consolidated financial statements.
In June 2016, ASU 2016-13,
Financial Instruments-Credit Losses,
was issued. The ASU introduces new accounting models for expected credit losses on financial instruments and applies to: (1) loans, accounts receivable, trade receivables and other financial assets measured at amortized cost, (2) loan commitments and certain other off-balance sheet credit exposures, (3) debt securities and other financial assets measured at fair value and (4) beneficial interests in securitized financial assets. The standard is effective for the Company for fiscal years beginning after December 15, 2020. The Company does not expect this standard to have a material impact on the Company’s consolidated financial statements.
In August 2016, the FASB issued Accounting Standard Update 2016-15,
Classification of Certain Cash Receipts and Cash Payments
. The new standard is intended to reduce statement of cash flows diversity in practice in how certain cash receipts and cash payments are presented and classified in the statement of cash flows. ASU 2016-15 is effective for fiscal years beginning after December 15, 2018 and should use the retrospective transition method. The Company does not anticipate any material impact from the adoption of this standard.
In January 2017, the FASB issued ASU 2017-01,
Business Combination: Clarifying the Definition of a Business
. The amendments in this ASU change the definition of a business to assist with evaluating when a set of transferred assets and activities is a business. The Company is required to adopt the guidance January 1, 2019; however early adoption on an individual transaction basis is permitted. The Company has early adopted this standard for its 2017 and future transactions. As a result, any 2017 or 2018 transactions with TP Investors have been evaluated utilizing the updated definition of a group of assets or a business as defined in the accounting standard.
In February 2017, the FASB issued ASU 2017-05,
Other Income - Gains and Losses from the Derecognition of Nonfinancial Assets (Subtopic 610-20): Clarifying the Scope of Asset Derecognition Guidance and Accounting for Partial Sales of Nonfinancial Assets
. ASU 2017-05 clarifies the scope of Subtopic 610-20,
Other Income-Gains and Losses from the Derecognition of Nonfinancial Assets
, which provides guidance for recognizing gains and losses from the transfer of nonfinancial assets in contracts with noncustomers. The amendments in ASU 2017-05 are effective for annual reporting periods beginning after December 15, 2018. The Company does not anticipate any material impact from the adoption of this standard.
In August 2018, the FASB issued
Intangibles-Goodwill and Other-Internal-Use Software: Customer’s Accounting for Implementation Costs Incurred in a Cloud Computing Arrangement (CCA) That is a Service Contract
. The guidance amends the definition of a hosting arrangement and requires that the customer in a hosting arrangement that is a service contract capitalize certain implementation costs as if the arrangement was an internal-use software project. Additionally, capitalized implementation costs are to be amortized over the term of the hosting arrangement on a straight-line basis, unless another systematic and rational basis is more representative of the pattern in which the entity expects to benefit from access to the hosted software. The guidance is effective for annual reporting periods beginning after December 15, 2020. Early adoption of the amendment is permitted. The Company does not expect this standard to have a material impact on the Company’s consolidated financial statements.
108
TINUUM GROUP, LLC AND SUBSIDIARIES
NOTES TO CONSOLIDATED FINANCIAL STATEMENTS
DECEMBER 31, 2018 and 2017
(in thousands)
In October 2018, the FASB issued ASU 2018-17,
Consolidation: Targeted Improvements to Related Party Guidance for Variable Interest Entities
, which modifies the guidance related to indirect interests held through related parties under common control for determining whether fees paid to decision makers and service providers are variable interests. The guidance is effective for annual reporting periods beginning after December 15, 2019 and early adoption is permitted. The Company is still evaluating the impact that this standard may have on the Company’s consolidated financial statements.
NOTE 2 - FIXED ASSETS
Fixed assets are comprised of the REF Facilities and ancillary REF Facility equipment, furniture, fixtures and related equipment and the assets associated with the ultimate REF Facility removal obligations. These assets are recorded at cost and depreciated using the straight-line method with an estimated useful life ranging from 3 to 20 years.
Reduced Emissions Fuel Facilities
Each of the 28 REF Facilities and related components that were placed in service by the Company in 2009 and 2011 have demonstrated the qualified emissions reductions to qualify for PTCs. REF Facilities are stated at historical cost. Depreciation is calculated using the straight-line method over a 20-year period, commencing with the original placed in service date in 2009 or 2011, as appropriate.
Under the site license agreements between the Producer Entities or Tinuum and the Generators, Tinuum may be required to return the site upon which the REF Facility is located at a generation station (“Site”) to its original condition at the end of the applicable contract period. In instances where the applicable agreements place this responsibility on the Company, the Company has recorded a liability for an ARO equal to the fair value of the estimated cost to retire the REF Facility and return each Site to its original condition. The ARO liability was estimated by the Company using estimated and historical facility removal costs and anticipated future inflation rates. This estimated future value was discounted to its present value using the Company’s credit-adjusted risk-free rate. The carrying value of the asset is depreciated on a straight-line basis over the remaining estimated life of the REF Facility asset group. The ARO liability is increased over time to reflect the change in its present value, and the capitalized cost is depreciated over the useful life of the site license. In subsequent periods, the Company is required to make adjustments to AROs based on changes in the estimated fair values of the obligations. Corresponding increases in asset book values are depreciated over the remaining useful life of the related site license. Uncertainties as to the probability, timing, or amount of cash flows associated with AROs may affect management’s estimates of fair value. For the years ended December 31, 2018 and 2017, the Company recorded $115 and $139 of accretion expense, respectively.
The following table describes changes to the Company’s ARO liability for the years ended December 31,
2018
and
2017
:
|
2018
|
2017
|
|||||||
|
Beginning balance
|
$
|
1,066
|
|
$
|
1,474
|
|
||
|
Liabilities incurred (removed)
|
153
|
|
(199)
|
|
||||
|
Accretion
|
115
|
|
139
|
|
||||
|
Settlement of obligations
|
(30)
|
|
(348)
|
|
||||
|
Ending balance
|
$
|
1,304
|
|
$
|
1,066
|
|
||
Furniture, Fixtures and Equipment
Furniture, fixtures, and equipment is comprised of office furniture, fixtures and office equipment, including those under capital lease. These assets are recorded at cost and depreciated using the straight-line method with estimated useful lives ranging from 3 to 8 years.
The following table summarizes the components of gross and net carrying amounts for fixed assets as of December 31,
2018
and
2017
:
|
2018
|
2017
|
|||||||
|
REF Facilities and related equipment
|
$
|
102,863
|
|
$
|
88,527
|
|
||
|
Furniture, fixtures and equipment
|
1,091
|
|
898
|
|
||||
|
Other
|
348
|
|
348
|
|
||||
|
Accumulated depreciation
|
(29,096)
|
|
(24,545)
|
|
||||
|
Fixed assets, net
|
$
|
75,206
|
|
$
|
65,228
|
|
||
109
TINUUM GROUP, LLC AND SUBSIDIARIES
NOTES TO CONSOLIDATED FINANCIAL STATEMENTS
DECEMBER 31, 2018 and 2017
(in thousands)
NOTE 3 - INVENTORY
Inventory is comprised primarily of feedstock coal and chemicals used in the production and sale of reduced emissions fuel at REF Facilities. Inventory is valued at the lower of cost or net realizable value using an average cost method. The Company assesses the inventory valuation on a monthly basis and reduces the value for any obsolete inventory. No valuation allowance was considered necessary as of December 31, 2018 and 2017.
|
2018
|
2017
|
|||||||
|
Feedstock coal
|
$
|
14,150
|
|
$
|
10,750
|
|
||
|
Chemicals
|
482
|
|
320
|
|
||||
|
Total inventory
|
$
|
14,632
|
|
$
|
11,070
|
|
||
NOTE 4 - REF FACILITY ACTIVITIES
The Company has entered into several types of transaction structures with TP Investors. Each of the agreements contains terms such that the payments received are recognized by the Company as lease revenues as they are earned. Payments under the agreements may include both fixed and contingent components and may represent rents, member interest purchase payments, or asset purchase payments, depending on the particular transaction structure.
Eleven of the REF Facility transactions with TP Investors are transactions with a related party as of December 31, 2018 and 2017. These transactions generally have terms that extend to the date ten years after the placed in service date for the particular REF Facility, subject to earlier termination by the TP Investor at periodic intervals or upon the occurrence of specified events.
Under certain REF Facility transactions, an initial deposit or prepayment may be received. Any prepayments received are recorded as deferred revenue and are amortized into revenue under the straight-line method over the amortization period defined in the respective agreement. As of December 31, 2018 and 2017, the Company has recorded $34,626 and $35,006, respectively, of deferred revenue related to prepayments.
In July 2017, the Company sold 50.1% of the member interests of one of its subsidiaries, GWN-REF, LLC (“GWN-REF”). GWN-REF owns a single REF Facility. A portion (0.2%) of the member interests was purchased by GWN Manager, LLC which is owned by parties related to or controlled by ADA and NexGen. Tinuum has been appointed as the Manager of GWN Manager, LLC. Another 49.9% of the member interest of GWN-REF were purchased by a TP Investor. The remaining 49.9% member interest in GWN-REF was retained by Tinuum and GWN-REF is included in Tinuum’s consolidated financial statements as Tinuum remains the primary beneficiary of GWN-REF.
Under the GWN-REF Member Interest Purchase Agreements (“GWN-REF MIPA”), the Company received a prepayment which is to be amortized through July of 2018. The agreement calls for additional installment payments through 2021 to be made quarterly by the TP Investor which owns 49.9% of the member interests of GWN-REF. These payments are recorded as lease revenues in the Company’s consolidated financial statements.
Simultaneously with the sale by the Company of the member interests, the Company entered into a guarantee agreement whereby the Company guaranteed, on behalf of GWN-REF, payment for any amounts due under certain GWN-REF Agreements (“GWN-REF Guarantee Agreement”), including obligations to indemnify the Generator. The GWN-REF Guarantee Agreement expires after final payments are made after the termination of the applicable GWN-REF Agreements. No liabilities have been recorded related to the GWN-REF Guarantee Agreement by the Company as of December 31, 2018 or 2017. TS does not operate and maintain the REF Facility on behalf of GWN-REF.
In November 2017, the Company sold two REF Facilities to a TP Investor in exchange for $19,161 of cash, net of closing costs, and installment payments to be recognized over time. Under the Asset Purchase Agreements (each an “APA”) for these two REF Facilities, both fixed and contingent payments are required to be made quarterly. Contingent payments are based upon production volumes achieved by the specific REF Facilities. The Company recorded the down payment as deferred revenue that is being amortized over the term specified in the APA. Due to the Company’s continuing involvement with the REF Facilities, the gain on sale is being recognized as lease revenues over the installment payment period. Any contingent payments received under the APAs will be recorded as production is achieved and will be recorded as lease revenues within the Company’s consolidated statements of operations.
In June 2018, the Company sold 99.8% of the member interests of one of its subsidiaries to two TP Investors through a Member Interest Purchase Agreement (“MIPA”). A portion (0.2%) of the member interests was also contributed to CCS-AE, LLC (“CCS-AE”) which is a wholly owned subsidiary of the Company. CCS-AE was appointed Manager of the Producer Entity. Under the
110
TINUUM GROUP, LLC AND SUBSIDIARIES
NOTES TO CONSOLIDATED FINANCIAL STATEMENTS
DECEMBER 31, 2018 and 2017
(in thousands)
MIPA, the Company received a prepayment of $7,984, which is to be amortized through June of 2020. The agreement calls for additional quarterly installment payments through 2021 to be made by the TP Investors which own 99.8% of the member interests of the subsidiary. These payments are recorded as lease revenues in the Company’s consolidated statements of operations.
In October 2018, the Company sold a REF Facility to TP Investors in exchange for $6,000 of cash, net of closing costs, and installment payments to be received over time. Under the APA for this REF Facility, fixed payments are required to be made quarterly, in arrears. The Company recorded the down payment as deferred revenue that is being amortized over a two-year term as specified in the APA. The installment payments are recorded as lease revenues in the Company’s consolidated statements of operations. The Company also entered into a limited guarantee agreement, pursuant to which the Company guaranteed the performance obligations of the Producer Entity to the Generator and certain indemnification obligations of the Producer Entity to the Generator to the extent such obligations arise from the acts of TS (the “Guarantee Agreement”). The Guarantee Agreement expires after the final purchase payments are made. No liabilities have been recorded related to the Guarantee Agreement by the Company as of December 31, 2018.
The following is a schedule of periodically renewable fixed payments to be paid by TP Investors to the Company through December 31, 2021, assuming no postponement of scheduled payments, no modifications of payments, non-renewals or early terminations. Certain TP Investor agreements include provisions for modification of future payments. Accordingly, it is possible that future payments from TP Investors may be modified or reduced. Only known payment changes have been included below. Future REF Facility payments, including those indicated in Note 13 and any eliminated in consolidation, do not include contingent amounts which are based on the levels of reduced emissions fuel production:
|
2019
|
$
|
190,447
|
|
|
|
2020
|
183,682
|
|
||
|
2021
|
134,491
|
|
||
|
Thereafter
|
5,461
|
|
||
|
$
|
514,081
|
|
||
NOTE 5 - VARIABLE INTEREST ENTITIES
The Company consolidates five entities (the “TG VIEs”) that were created as reduced emissions fuel production companies. The operations include the purchase of feedstock coal from a Generator, application of chemicals utilizing that Producer Entity’s REF Facility, and the subsequent sale of reduced emissions fuel to the Generator. In four of the TG VIEs, CCS-AE is the Managing Member and holds a 0.2% or 1.0% member interest, depending on the transaction. In the remaining TG VIE, TG has retained a 49.9% member interest and Tinuum is the manager. As the Managing Member of the TG VIEs, CCS-AE or Tinuum directs the activities that are considered most significant to the entities. Based upon the criteria set forth in ASC 810, the Company has determined that it is the primary beneficiary in the TG VIEs for the years ended December 31, 2018 and 2017. As such, the financial results of the TG VIEs are consolidated with the results of the Company, and the results attributable to the other owners are presented as “Noncontrolling Interests” within the consolidated financial statements.
Creditors of the TG VIEs have no recourse against the general credit of the Company (outside of its member interest or specific guarantee obligations), and the assets of the Company are not collateral for any TG VIE obligations. The operations of all five entities are financed through capital calls of the respective members in proportion to their member interests. In the event that a member defaults on a capital call request made by the Manager, the Manager may (i) withhold distributions payable to the defaulting member or sue for the amount due, and/or (ii) elect to transfer the defaulting member’s interest to a separate legal entity controlled by the Manager or (iii) suspend operations of the REF Facility. In certain instances, the TP Investor has the ability to put, and Tinuum has the ability to call, the other member interests at a purchase price equal to fair market value.
Under the provisions of certain of the TG VIE’s various agreements, including the leases of REF Facilities or the partnership operations of the TG VIEs, the agreements terminate during time periods ranging from the fourth quarter of 2021 through December 31, 2022, unless terminated earlier by written consent of the members.
Under certain of the TG VIE agreements, capital call limitations exist, limiting the amount of capital calls if certain operational costs are exceeded.
111
TINUUM GROUP, LLC AND SUBSIDIARIES
NOTES TO CONSOLIDATED FINANCIAL STATEMENTS
DECEMBER 31, 2018 and 2017
(in thousands)
NOTE 6 - NOTES PAYABLE
Line of Credit
In December 2017, the 2013 Revolver (“Revolver”) with Colorado Business Bank (“CBB”) was amended and replaced with the Fourth Amendment to the Revolver (“Fourth Amendment”). Under the Fourth Amendment, the maturity date was extended until December 31, 2020, and the maximum available borrowing limits were modified as follows:
|
Date
|
Available Borrowing Limit
|
|||
|
For the period ending December 30, 2019
|
$
|
17,000
|
|
|
|
For the period commencing December 31, 2019 through March 30, 2020
|
$
|
13,600
|
|
|
|
For the period commencing March 31, 2020 through June 29, 2020
|
$
|
10,200
|
|
|
|
For the period commencing June 30, 2020 through September 29, 2020
|
$
|
6,800
|
|
|
|
For the period commencing September 30, 2020 through December 30, 2020
|
$
|
3,400
|
|
|
|
For the period after December 31, 2020
|
$
|
—
|
|
|
The Fourth Amendment requires any outstanding borrowings annually to be fully repaid for a period of fifteen consecutive days during two non-consecutive calendar quarters.
Amounts outstanding under the Fourth Amendment may be repaid at the option of the Company. Any undrawn balance is subject to a quarterly unused facility fee in the amount of 0.826% annually. Interest on outstanding balances is payable monthly and is accrued at the greater of 5.5% per annum or the prime rate (as defined in the agreement) plus 1.0%.
The Fourth Amendment is collateralized by the assets of the Company and the equity interests and proceeds related to such equity interests of each material subsidiary owned by the Company. The Fourth Amendment is also collateralized by the Company’s deposit accounts held at CBB. These accounts are not restricted by the Fourth Amendment.
Tinuum is required to be in compliance with certain loan covenants under the Company’s Revolver, including tangible net worth as defined in the agreement. As of December 31, 2018 and 2017, the Company was in compliance with the loan covenants. No amounts were outstanding as of December 31, 2018 and 2017.
Secured promissory note
In February 2014, a VIE consolidated into the consolidated financial statements of the Company, entered into an $11,000 secured promissory note (the “Note”) with a Generator from which it purchases feedstock coal, and to which it sells reduced emissions and unrefined fuel on a monthly basis. The purpose of the Note is to finance the purchases of feedstock coal from the Generator. The amount of principal and interest owed is dependent upon the amount of feedstock coal purchased and reduced emissions and unrefined coal sold between the two parties and is net settled on a monthly basis. The Note is collateralized by the feedstock coal inventory.
The Note bears interest at a per annum rate equal to the short-term applicable federal rate announced by the IRS in December of each year. The interest rate for the years ended December 31, 2018 and 2017 was 1.68% and 0.96% per annum, respectively. Interest is payable quarterly in arrears.
All outstanding amounts owed under the Note are due and payable on the earlier of December 31, 2021 or the termination or expiration of the Feedstock Coal Purchase Agreement between the TG VIE and the Generator.
As of December 31, 2018 and 2017, respectively, the outstanding balance on the Note was $7,736 and $7,284 with interest payable of $40 and $17.
In June 2018, a second VIE consolidated into the consolidated financial statements of the Company, entered into an $1,986 secured promissory note (“2018 Note”) with a Generator to fund the initial purchase of feedstock coal. The 2018 Note bears interest at a per annum rate equal to the mid-term applicable federal rate announced by the IRS in December of each year. The rate was 2.82% for 2018. Interest is payable quarterly in arrears. The 2018 Note is collateralized by the feedstock coal inventory.
All outstanding amounts owed under the 2018 Note are due and payable on the earlier of December 31, 2025, or the termination or expiration of the Feedstock Coal Purchase Agreement between the Company and the Generator.
At December 31, 2018, the outstanding balance on the 2018 Note was $1,986. Interest payable of $5 was recorded at December 31, 2018.
112
TINUUM GROUP, LLC AND SUBSIDIARIES
NOTES TO CONSOLIDATED FINANCIAL STATEMENTS
DECEMBER 31, 2018 and 2017
(in thousands)
NOTE 7 - MEMBERS’ EQUITY
Under the Class B Unit Purchase Agreement (“Class B Agreement”) with GSFS, which was entered into upon the amendment and restatement of the Tinuum Operating Agreement in 2011, ADA and NexGen each entered into a limited guarantee agreement under which the parties are obligated to guarantee performance by Tinuum of its obligations to indemnify GSFS against certain losses it may suffer as a result of inaccuracies or breach in representations and covenants related to the Class B Agreement or REF Facilities’ lease agreements with GSFS affiliates. ADA and NexGen entered into a contribution agreement where, in the event of such a breach, they have agreed to contribute their pro rata share of any amounts under the limited guarantee.
The Class B units are considered conditionally redeemable. As specified in the Second Amended and Restated Operating Agreement and the Class B Agreement, on or after the earlier of (i) a breach of any material provision of the Class B Agreement or Tinuum’s organizational documents that is not cured and that results in damages to GSFS of at least $10,000 and (ii) the 10-year anniversary of the date the last REF Facility was placed in service by Tinuum, but in no event later than December 31, 2021, and if GSFS’ unrecovered investment balance in its Class B units has not been reduced to zero, GSFS may require its Class B units to be redeemed for an amount equal to its unrecovered investment balance. No triggering redemption events have occurred as of December 31, 2018 and 2017, respectively. GSFS’ Class B units include a guaranteed 15% annual return calculated monthly based upon the outstanding balance as of that date. The outstanding balance over time is based on the original investment, increased by the guaranteed return, and reduced by any distributions of cash or PTCs. In February 2018, the unrecovered investment balance in the Class B units was reduced to zero.
The U.S. Securities and Exchange Commission (the “SEC”) requires conditionally redeemable equity to be classified outside of permanent equity. Because the financial statements of the Company are expected to be furnished to the SEC as part of a filing by one of the Company’s Members, the conditionally redeemable amount has been classified out of permanent equity and into temporary equity in these consolidated financial statements. As a result of the repayment of the guaranteed return and the unrecovered investment balance in February 2018, the Class B units are no longer considered conditionally redeemable and are now considered to be a non-voting class of Members’ equity. GSFS continues to own Class B units which have no further capital call requirements and have limited voting rights.
The Company had the following classes and percentages of Member units issued and outstanding at December 31, 2018 and 2017.
|
Class A Units (voting)
|
85
|
%
|
|
|
Class B Units (non-voting)
|
15
|
%
|
|
NOTE 8 - INCOME TAXES
During the years ended December 31, 2018 and 2017, the Company has concluded that there are no significant uncertain tax positions that would require recognition or disclosure in the financial statements. As of December 31, 2018 and 2017, the Company made no provision for interest or penalties related to uncertain positions.
For the years ended December 31, 2018 and 2017, state income tax expense (benefit) consisted of the following:
|
2018
|
2017
|
|||||||
|
Current
|
$
|
1,135
|
|
$
|
429
|
|
||
|
Deferred
|
224
|
|
965
|
|
||||
|
Total state income tax expense
|
$
|
1,359
|
|
$
|
1,394
|
|
||
The following represents the approximate tax effect of each significant type of temporary difference and classification of net deferred income taxes as of December 31, 2018 and 2017:
|
2018
|
2017
|
|||||||
|
Deferred tax assets
|
$
|
—
|
|
$
|
275
|
|
||
|
Deferred tax liabilities
|
—
|
|
(51
|
)
|
||||
|
Net deferred tax asset
|
$
|
—
|
|
$
|
224
|
|
||
113
Deferred income taxes reflect the net tax effects of temporary differences between the carrying amounts of non-current assets and liabilities for financial reporting purposes and the amounts used for income tax purposes. Long term deferred tax assets are comprised of deferred revenue and the deferred tax liabilities are associated with depreciation for the year ending December 31, 2017. No liability related to uncertain tax positions was recorded at December 31, 2018 and 2017.
NOTE 9 - RELATED PARTY TRANSACTIONS
During 2018 and 2017, the Company incurred expenses and capital expenditures and had amounts payable (excluding capital distributions) to and revenues recognized from the following related party entities:
|
ADA
|
TS
|
GSFS affiliates
|
NexGen and affiliates
|
|||||||||||||
|
(a)
|
(b)
|
(c)
|
(d)
|
|||||||||||||
|
As of December 31, 2018
|
||||||||||||||||
|
Accounts receivable
|
$
|
—
|
|
$
|
2,486
|
|
$
|
—
|
|
$
|
—
|
|
||||
|
Accounts payable
|
4,284
|
|
6,397
|
|
—
|
|
24
|
|
||||||||
|
Prepaid expenses
|
—
|
|
71
|
|
—
|
|
—
|
|
||||||||
|
As of December 31, 2017
|
||||||||||||||||
|
Accounts receivable
|
$
|
—
|
|
$
|
934
|
|
$
|
20
|
|
$
|
15
|
|
||||
|
Accounts payable
|
3,249
|
|
4,204
|
|
—
|
|
45
|
|
||||||||
|
Prepaid expenses
|
—
|
|
—
|
|
—
|
|
—
|
|
||||||||
|
Revenues Recognized During the Year Ended
|
||||||||||||||||
|
December 31, 2018
|
$
|
—
|
|
$
|
23,968
|
|
$
|
121,229
|
|
$
|
—
|
|
||||
|
December 31, 2017
|
—
|
|
3,489
|
|
117,376
|
|
—
|
|
||||||||
|
Expenses Incurred During the Year Ended
|
||||||||||||||||
|
December 31, 2018
|
$
|
15,144
|
|
$
|
11,222
|
|
$
|
—
|
|
$
|
551
|
|
||||
|
December 31, 2017
|
9,677
|
|
9,856
|
|
2
|
|
767
|
|
||||||||
|
(a)
ADA expenses include expenditures for royalties.
|
|
(b)
TS expenses include operating expenses associated with the operations of retained REF Facilities. TS revenues include Asset Purchase Agreement payments from TP Investors included within the TS consolidated financial statements.
|
|
(c)
GSFS affiliates expenses include chemical expenses at certain REF Facilities. Revenues relate to REF Facility lease revenues recognized.
|
|
(d)
NexGen and affiliates expenses include management fees and labor costs.
|
The Company acquires substantial amounts of fixed assets from TS. For the years ended December 31, 2018 and 2017, the Company acquired $18,651 and $4,692, respectively, of capital assets from its related party, TS.
NOTE 10 - ADOPTION OF NEW ACCOUNTING STANDARDS
Leases
As mentioned in Note 1, the Company has elected to early adopt ASC 842, the lease standard, effective January 1, 2019, concurrent with our adoption of the new standard related to revenue recognition (ASC 606). The Company is required to recognize and measure leases existing as of the implementation date of January 1, 2019 on a modified retrospective basis, with certain practical expedients available. The practical expedients known as the “package of practical expedients or Group of 3,” permit companies to retain prior conclusions about lease identification, lease classification and initial direct costs. The Company does not expect to elect the "package of practical expedients" and thus has reassessed its contracts (both as lessee and
114
lessor) under the updated ASC 842 criteria. Tinuum does expect to elect the use-of hindsight practical expedient as it relates to the assessment of lease or contract terms.
Lessor contracts
Under ASC 842, the definition of a lease was modified to include the right to control the use of an identified asset. Under the revised definition of a lease, the Company elected to reassess its existing revenue generating leases, MIPAs and APAs. These contracts have historically been accounted for as leases under ASC 840,
Leases
(ASC 840), or via analogy based upon other accounting guidance that was superseded by the issuance of the ASC 606 guidance. As a result of this reassessment, the Company determined that the contracts previously accounted for as leases under ASC 840 no longer meet the criteria of a lease, and the MIPAs and APAs, previously accounted for via analogy to ASC 840, are required to be analyzed and recorded utilizing the guidance in ASC 606. Accordingly, the impact of the new accounting standards related to revenue producing contracts for the Company is significant and is described below.
Lessee contracts
With regards to contracts where the Company is a lessee, these contracts were also reassessed using the new lease criteria and the Company identified operating and financing leases primarily related to its office space and office equipment. TG does not expect the application of the standard to lessee contracts to have a material impact on the Company’s consolidated statements of operations. The most significant impact will be the recognition of ROU assets and lease liabilities for operating leases. Tinuum’s accounting for finance leases remained substantially unchanged. Tinuum expects to recognize a ROU asset of $719 and a lease liability of $832 for operating leases and derecognize $66 of deferred rents.
Revenue from Contracts with Customers
The most significant impact of adopting ASC 606 relates to contracts previously recorded as lease revenues. Commencing January 1, 2019, Tinuum will recognize revenues as it satisfies a performance obligation by transferring control over the product and/or services to a customer. The Company has identified its primary performance obligation, regardless of contract type, to be the provision of the use of the REF Facility combined with the related technology license required to produce reduced emissions fuel.
In most of the Company’s contracts the completion of the identified performance obligation will be recognized over time, as the use of the equipment and the licensed technology occurs (output method), based upon REF production volumes. This revenue recognition pattern will not be materially different from the historical method of the recognition of revenues. However, in certain instances where Tinuum sells the REF Facility and licenses the technology to TP Investors, the completion of the performance obligation will be the date of the commencement of the contract and the transfer of ownership to the customer. In those instances, revenue, including any contingent consideration, will be estimated and will be recognized at a point-in time which will result in revenue being recognized on a more accelerated basis than what has historically been presented. The contracts also include provisions to allow the customer to make installment payments to Tinuum over a pre-determined time period. As a result, a significant financing component will exist.
The Company estimates that the acceleration of revenues will result in approximately $87,506 of contract revenues to be recorded as a beginning balance adjustment to Members’ equity and a reduction of deferred revenues and fixed assets, net of $11,021 and $11,910, respectively. As a result, future cash flows will be received according to the contractual payment schedules, but no future revenues will be recognized for these contracts.
In certain instances, a commission or fee may be paid to a broker that assisted in the consummation of a transaction. In these instances the applicable commission or fee will be capitalized and amortized over the expected period of benefit.
Taxes assessed by a governmental agency that are imposed on and concurrent with a specific revenue producing transaction collected by the Company from a customer will be excluded from revenues.
Shipping and handling costs are not associated with TG’s products and services and therefore will not be included in revenues or costs of revenues.
NOTE 11 - COMMITMENTS
Purchase Commitments
On November 3, 2011, Tinuum entered into a technology licensing agreement with ADA whereby Tinuum agreed to pay ADA royalties based on a percentage of operating income from reduced emissions fuel production at REF Facilities that utilize the M-45™ technology. During the years ended December 31, 2018 and 2017, respectively, the Company recognized royalty expense under cost of sales in the amounts of $15,141 and $9,677, respectively.
115
In December 2015 the Company was assigned, by TS, a Master Supply Agreement with a chemical vendor. Under the agreement the Company had a commitment commencing January 1, 2015, for minimum purchase quantities of the specified chemical that if not achieved would require a shortfall payment amount (“Shortfall”) to be paid to the vendor on a monthly basis. Any Shortfall payment required would be applied to future chemical purchases once certain minimum volume levels were achieved. The Company was able to achieve a large enough usage level of the chemicals and therefore reduce the prepaid balance by $4,339 for the year ended December 31, 2017. In 2018 an agreement was reached to further amend the Master Supply Agreement and the Company made an additional prepayment of $8,187 resulting in a total prepaid amount of $17,755 on deposit with the vendor as of December 31, 2018. This amount is included within other assets, net in the Company's consolidated balance sheet. The Company anticipates utilizing the prepaid deposit balance through ongoing chemical usage by the end of 2021.
401k Profit Sharing Plan and Other Benefits
The Company offers a defined contribution and profit sharing plan (the “Plan”) to employees who are over 18 years of age and have been employed by the Company for more than 30 days. Employees can deposit up to 80% of their eligible pay up to the statutory limit in the Plan. The Company contributes 3.0% of employees’ eligible pay to the Plan as safe harbor contributions. Commencing January 1, 2018, the Company began providing an additional matching contribution equivalent to 50% of the first 6% of employee contributions. Company contributions charged to benefits expense were $221 and $90 for the years ended December 31, 2018 and 2017, respectively.
Office Lease
In March 2014, the Company entered into an eight-year lease agreement for office space. Rent expense under the lease for the years ended December 31, 2018 and 2017 was $201 and $192, respectively.
Future minimum lease payments under lease agreements through December 31, 2022 are as follows:
|
2019
|
$
|
207
|
|
|
|
2020
|
214
|
|
||
|
2021
|
221
|
|
||
|
2022
|
229
|
|
||
|
Total
|
$
|
871
|
|
|
NOTE 12 - CONCENTRATIONS
The Company’s operations are currently dependent upon TP Investors leasing REF Facilities. Further, under the terms of the various TP Investor agreements, the agreements may be subject to termination or modification by the TP Investor at periodic intervals or upon the occurrence of specified events which include amendments to Section 45 of the Internal Revenue Code. The termination or modification of all or a material portion of any TP Investor agreements would have a significant adverse impact on the Company’s future operations and financial condition.
Additionally, the production and sale of reduced emissions fuel is dependent upon the plant operations of specific generating stations where the REF Facilities are located. Production at these locations could be impacted by the demand for electricity, the amount of coal burned as compared to other electricity generation fuel sources utilized by the utility to produce electricity, disruptions due to foreseen or unforeseen plant outages, or changes in government regulations related to electricity generation or coal burning activities.
Certain of the chemicals utilized by the Company to produce reduced emissions fuel are available from a limited number of vendors in the United States. The Company's future operations may be materially and adversely affected if the Company encounters difficulty procuring these chemicals, the quality of available chemicals deteriorates, or there are significant price increases for the chemicals.
116
TINUUM GROUP, LLC AND SUBSIDIARIES
NOTES TO CONSOLIDATED FINANCIAL STATEMENTS
DECEMBER 31, 2018 and 2017
(in thousands)
NOTE 13 - SUBSEQUENT EVENTS
In January 2019, the Company sold a REF Facility to a TP Investor in exchange for $6,400 of cash, net of closing costs, and installment payments to be received over time. Under the APA for the REF Facility, fixed payments are required to be made quarterly, in arrears. The Company recorded the down payment as well as the estimated stream of fixed payments associated with the performance obligation for the provision of the REF Facility and the technology license fee on a net present value basis of approximately $25,000, recognized as of the point in time, under ASC 606 upon the date the REF Facility was delivered, and title was transferred to the TP Investor.
Additionally, for the 2019 transaction, the Company also entered into a limited guarantee agreement, pursuant to which the Company guaranteed the performance obligations of the Producer Entity to the Generator and certain indemnification obligations of the Producer Entity to the Generator to the extent such obligations arise from the acts of TS. The limited guarantee expires after the final purchase payments are made.
Management evaluated subsequent events through March 15, 2019, the date financial statements were available to be issued.
117
Item 16. Form 10-K Summary
None.
SIGNATURES
Pursuant to the requirements of Section 13 or 15(d) of the Exchange Act, the Registrant has duly caused this report to be signed on its behalf by the undersigned, thereunto duly authorized.
Advanced Emissions Solutions, Inc.
(Registrant)
|
By
|
/s/ L. Heath Sampson
|
By
|
/s/ Greg P. Marken
|
|
|
L. Heath Sampson
|
Greg P. Marken
|
|||
|
Chief Executive Officer (Principal Executive Officer)
|
Chief Financial Officer (Principal Financial and Accounting Officer)
|
|||
|
Date: March 18, 2019
|
Date: March 18, 2019
|
|||
Pursuant to the requirements of the Exchange Act, this report has been signed below by the following persons on behalf of the Registrant and in the capacities and on the dates indicated.
|
By
|
/s/ Gilbert Li
|
By
|
/s/ R. Carter Pate
|
|
|
Gilbert Li, Director
|
R. Carter Pate, Director
|
|||
|
Date: March 18, 2019
|
Date: March 18, 2019
|
|||
|
By
|
/s/ L. Heath Sampson
|
By
|
/s/ J. Taylor Simonton
|
|
|
L. Heath Sampson, Director and Chief Executive Officer
|
J. Taylor Simonton, Director
|
|||
|
Date: March 18, 2019
|
Date: March 18, 2019
|
|||
|
By
|
/s/ L. Spencer Wells
|
|||
|
L. Spencer Wells, Director
|
||||
|
Date: March 18, 2019
|
||||
118
TABLE OF CONTENTS
Part IItem 1. BusinessItem 1A. Risk FactorsItem 1B. Unresolved Staff CommentsItem 2. PropertiesItem 3. Legal ProceedingsItem 4. Mine Safety DisclosuresPart IIItem 5. Market For Registrant S Common Equity, Related Stockholder Matters and Issuer Purchases Of Equity SecuritiesItem 6. Selected Financial DataItem 7. Management S Discussion and Analysis Of Financial Condition and Results Of OperationsItem 7A. Quantitative and Qualitative Disclosures About Market RiskItem 8. Financial Statements and Supplementary DataNote 1 - Summary Of Operations and Significant Accounting PoliciesNote 2 - AcquisitionNote 3 - InventoriesNote 4 - Property, Plant and EquipmentNote 5 - Equity Method InvestmentsNote 6 - RevenuesNote 7 - BorrowingsNote 8 - Commitments and ContingenciesNote 9 - Stockholders EquityNote 10 - Stock-based CompensationNote 11 - Supplemental Financial InformationNote 12 - Fair Value MeasurementsNote 13 - Income TaxesNote 14 - Business Segment InformationNote 15 - Major CustomersNote 16 - Related Party TransactionsNote 17 - Defined Contribution Savings PlansNote 18 - RestructuringNote 19 - Quarterly Financial Results (unaudited)Note 20 - Subsequent EventsItem 9. Changes in and Disagreements with Accountants on Accounting and Financial DisclosureItem 9A. Controls and ProceduresItem 9B. Other InformationPart IIIItem 10. Directors, Executive Officers, and Corporate GovernanceItem 11. Executive CompensationItem 12. Security Ownership Of Certain Beneficial Owners and Management and Related Stockholder MattersItem 13. Certain Relationships and Related Transactions and Director IndependenceItem 14. Principal Accountant Fees and ServicesItem 15. Exhibits and Financial Statement SchedulesNote 1 - Significant Accounting PoliciesNote 2 - Fixed AssetsNote 3 - InventoryNote 4 - Ref Facility ActivitiesNote 5 - Variable Interest EntitiesNote 6 - Notes PayableNote 7 - Members EquityNote 8 - Income TaxesNote 9 - Related Party TransactionsNote 10 - Adoption Of New Accounting StandardsNote 11 - CommitmentsNote 12 - ConcentrationsNote 13 - Subsequent EventsItem 16. Form 10-k Summary