ARMOUR RESIDENTIAL REIT, INC.
10-Ks and 10-Qs
|
|
|
|
|
|
|
|
|
|
|
|
|
|
|
|
|
|
|
|
|
|
|
|
|
|
|
|
|
|
|
|
|
|
|
|
|
|
|
|
|
|
|
|
|
|
|
|
|
|
|
|
|
|
|
|
UNITED STATES
SECURITIES AND EXCHANGE COMMISSION
WASHINGTON, D.C. 20549
FORM 10-K
|
ý
|
ANNUAL REPORT PURSUANT TO SECTION 13 OR 15(d) OF THE SECURITIES EXCHANGE ACT OF 1934
|
For the Fiscal Year Ended
December 31, 2015
OR
|
o
|
TRANSITION REPORT PURSUANT TO SECTION 13 OR 15(d) OF THE SECURITIES EXCHANGE ACT OF 1934
|
For the transition period from
to
Commission File Number 001-34766
ARMOUR RESIDENTIAL REIT, INC.
(Exact name of registrant as specified in its charter)
|
Maryland
|
26-1908763
|
|
|
(State or other jurisdiction of incorporation or organization)
|
(I.R.S. Employer Identification No.)
|
|
3001 Ocean Drive, Suite 201, Vero Beach, FL 32963
(Address of principal executive offices)(zip code)
(772) 617-4340
(Registrant’s telephone number, including area code)
Securities registered pursuant to Section 12(b) of the Act:
|
Title of Class
|
Name of Exchange on which registered
|
|
|
Preferred Stock, 8.250% Series A Cumulative Redeemable
|
New York Stock Exchange
|
|
|
Preferred Stock, 7.875% Series B Cumulative Redeemable
|
New York Stock Exchange
|
|
|
Common Stock, $0.001 par value
|
New York Stock Exchange
|
|
Securities registered pursuant to Section 12(g) of the Act:
None.
Indicate by check mark if the registrant is a well-known seasoned issuer, as defined in Rule 405 of the Securities Act. YES
ý
NO
o
Indicate by check mark if the registrant is not required to file reports pursuant to Section 13 or Section 15(d) of the Act. YES
o
NO
ý
Indicate by check mark whether the registrant (1) has filed all reports required to be filed by Section 13 or 15(d) of the Securities Exchange Act of 1934 during the preceding twelve months (or for such shorter period that the registrant was required to file such reports) and (2) has been subject to such filing requirements for the past 90 days. YES
ý
NO
o
Indicate by check mark whether the registrant has submitted electronically and posted on its corporate Web site, if any, every Interactive Data File required to be submitted and posted pursuant to Rule 405 of Regulation S-T (§232.405 of this chapter) during the preceding twelve months (or for such shorter period that the registrant was required to submit and post such files). YES
ý
NO
o
Indicate by check mark if disclosure of delinquent filers pursuant to Item 405 of Regulation S-K(§229.405 of this chapter) is not contained herein and will not be contained, to the best of registrant’s knowledge, in definitive proxy or information statements incorporated by reference in Part III of this Form 10-K or any amendment to this Form 10-K.
ý
Indicate by check mark whether the registrant is a large accelerated filer, an accelerated filer, a non-accelerated filer or a smaller reporting company. See the definitions of “larger accelerated filer,” “accelerated filer” and “smaller reporting company” in Rule 12b-2 of the Exchange Act.
Large accelerated filer
ý
Accelerated filer
o
Non-accelerated filer
o
Smaller reporting company
o
Indicate by check mark whether the registrant is a shell company (as defined in Rule 12b-2 of the Act). YES
o
NO
ý
On June 30, 2015, the aggregate value of the registrant's common stock held by non-affiliates of the registrant was approximately
$975,011,052
, based on the closing sales price of our common stock on such date as reported on the NYSE.
The number of outstanding shares of the Registrant’s common stock as of
February 17, 2016
was
36,682,436
.
Documents Incorporated By Reference
Certain portions of the registrant’s definitive proxy statement pursuant to Regulation 14A of the Securities Exchange Act of 1934 for its 2016 annual meeting of stockholders are incorporated by reference into Part III of this Form 10-K.
ARMOUR Residential REIT, Inc. and Subsidiary
TABLE OF CONTENTS
|
Glossary of Terms
|
|
References to “we,” “us,” “our,” “ARMOUR” or the “Company” are to ARMOUR Residential REIT, Inc. References to “ACM” are to ARMOUR Capital Management LP, a Delaware limited partnership. Refer to the Glossary of Terms for definitions of capitalized terms and abbreviations used in this report.
All per share amounts, common shares outstanding and stock-based compensation amounts for all periods presented reflect our one-for-eight reverse stock split (the “Reverse Stock Split”), which was effective July 31, 2015. U.S. dollar amounts are presented in thousands, except per share amounts or as otherwise noted.
Our Company
We are an externally managed Maryland corporation incorporated in 2008, managed by ACM, an investment advisor registered with the SEC (see
Note 9
and
Note 14
to the consolidated financial statements). We invest in residential mortgage backed securities issued or guaranteed by a U.S. GSE, such as the Fannie Mae, Freddie Mac or guaranteed by Ginnie Mae (collectively, Agency Securities). We also may invest in other securities backed by residential mortgages for which the payment of principal and interest is not guaranteed by a GSE or government agency (collectively, Non-Agency Securities). While we remain committed to investing in Agency Securities for so long as an adequate supply and pricing exists, we have the flexibility to invest in Non-Agency Securities and respond to changes in GSE policy as needed. At
December 31, 2015
and
December 31, 2014
, Agency Securities accounted for
100%
of our securities portfolio. Our securities portfolio consists primarily of Agency Securities backed by fixed rate home loans. From time to time, a portion of our assets may be invested in Agency Securities backed by hybrid adjustable rate and adjustable rate home loans as well as unsecured notes and bonds issued by GSEs, U.S. Treasuries and money market instruments, subject to certain income tests we must satisfy for our qualification as a REIT.
We have elected to be taxed as a REIT under the Code. Our qualification as a REIT depends on our ability to meet, on a continuing basis, various complex requirements under the Code relating to, among other things, the sources of our gross income, the composition and values of our assets, our distribution levels and the concentration of ownership of our capital stock. We believe that we are organized in conformity with the requirements for qualification as a REIT under the Code and our manner of operations enables us to meet the requirements for taxation as a REIT for federal income tax purposes.
As a REIT, we will generally not be subject to federal income tax on the REIT taxable income that we currently distribute to our stockholders. If we fail to qualify as a REIT in any taxable year and do not qualify for certain statutory relief provisions, we will be subject to federal income tax at regular corporate rates. Even if we qualify as a REIT for federal income tax purposes, we may still be subject to some federal, state and local taxes on our income.
Our Strategies
Our primary goal is to provide an attractive risk adjusted return on stockholders’ equity by acquiring Agency Securities, financing our acquisitions in the capital markets, using targeted leverage ratios and employing risk management. We seek to achieve this goal through the thoughtful and opportunistic application of our asset acquisition, leverage and interest rate management strategies.
Our Assets
Since our formation, our assets have been invested in Agency Securities or money market instruments, primarily deposits at federally chartered banks.
Our Borrowings
We borrow against our Agency Securities using repurchase agreements. Our borrowings generally have maturities that may range from one month or less, up to one year, although occasionally we may enter into longer dated borrowing agreements to more closely match the rate adjustment period of our Agency Securities. At
December 31, 2015
and
December 31, 2014
, our total repurchase indebtedness was approximately
$11,570,481
and
$13,881,921
, respectively, with a weighted average maturity of
38 days
and
60 days
, respectively. Depending on market conditions, we may enter into additional repurchase arrangements with similar maturities or a committed borrowing facility. Our borrowings are generally between six and ten times the amount of our total stockholders’ equity, but we are not limited to that range. The level of our borrowings may vary periodically depending on
1
market conditions. In addition, certain of our MRAs and master swap agreements contain a restriction that prohibits our leverage from exceeding twelve times our stockholders’ equity as well as termination events in the case of significant reductions in equity capital.
Our Hedging
We use derivatives to reduce the impact of interest rate fluctuations on our cost of funding consistent with our REIT tax requirements. These techniques primarily consist of entering into interest rate swap contracts, swaptions, basis swaps and purchasing or selling Futures Contracts and may also include entering into interest rate cap or floor agreements, purchasing put and call options on securities or securities underlying Futures Contracts, or entering into forward rate agreements. Although we are not legally limited to our use of hedging, we intend to limit our use of derivative instruments to only those techniques described above and to enter into derivative transactions only with counterparties that we believe have a strong credit rating to help limit the risk of counterparty default or insolvency. These transactions are not entered into for speculative purposes.
To the extent that changes in the swap and futures rates correlate with changes in mortgage rates, changes in the fair values of our derivatives will tend to offset changes in the fair values of our Agency Securities. The actual extent of such offset will depend on the relative size of our portfolios of derivatives and Agency Securities and the actual correlation of rate changes. However, changes in the fair value of our derivatives are reported in net income, while changes in the fair values of our Agency Securities are reported directly in our total stockholders’ equity. Therefore, earnings reported in accordance with GAAP will fluctuate even in situations where our derivatives are operating as intended. As a result of this mark-to-market accounting treatment, our reported results of operations are likely to fluctuate far more than if we used cash flow hedge accounting. Comparisons with companies that use cash flow hedge accounting for all or part of their derivative activities may not be meaningful.
Our Manager
We are externally managed by ACM, pursuant to the Management Agreement (see
Note 9
and
Note 14
to the consolidated financial statements). ACM manages our day-to-day operations, subject to the direction and oversight of the Board. The Management Agreement runs through June 18, 2022 and is thereafter automatically renewed for an additional five-year term unless terminated under certain circumstances. Either party must provide 180 days prior written notice of any such termination.
Pursuant to the Management Agreement, ACM is entitled to receive a management fee payable monthly in arrears. Currently, the monthly management fee is 1/12th of the sum of (a) 1.5% of gross equity raised up to $1.0 billion plus (b) 0.75% of gross equity raised in excess of $1.0 billion. The cost of repurchased stock and any dividend representing a return of capital for tax purposes will reduce the amount of gross equity raised used to calculate the monthly management fee. At
December 31, 2015
,
December 31, 2014
and
December 31, 2013
, the effective management fee was
1.049%
,
1.028%
and
1.026%
based on gross equity raised of
$2,507,505
,
$2,697,223
and
$2,769,661
, respectively. The ACM monthly management fee is not calculated based on the performance of our assets. Accordingly, the payment of our monthly management fee may not decline in the event of a decline in our earnings and may cause us to incur losses. We are also responsible for any costs and expenses that ACM incurred solely on behalf of ARMOUR other than the various overhead expenses specified in the terms of the Management Agreement. ACM is further entitled to receive a termination fee from us under certain circumstances. Our total management fee expense for the
year ended
December 31, 2015
, was
$27,292
compared to
$27,857
for the
year ended
December 31, 2014
and
$28,141
for the
year ended
December 31, 2013
, respectively.
We are required to take actions as may be reasonably required to permit and enable ACM to carry out its duties and obligations. We are also responsible for any costs and expenses that ACM incurred solely on our behalf other than the various overhead expenses specified in the terms of the Management Agreement. For the years ended
December 31, 2015
,
December 31, 2014
and
December 31, 2013
, we reimbursed ACM
$1,921
,
$2,204
and
$1,550
, respectively, for other expenses incurred on our behalf. In consideration of our 2012 results, in 2013, we also elected to make a restricted stock award to our executive officers and other ACM employees through ACM. The award vests through 2017 and resulted in our recognizing stock based compensation expense of
$623
,
$900
and
$1,097
for the years ended
December 31, 2015
,
December 31, 2014
and
December 31, 2013
.
Other Activities
If, when applicable, ACM and the Board determine that additional funding is required, we may raise such funds through equity offerings (including preferred equity), unsecured debt securities, convertible securities (including warrants, preferred equity and debt) or the retention of cash flow (subject to provisions in the Code concerning taxability of undistributed REIT taxable income) or a combination of these methods.
2
In the event that ACM and the Board determine that we should raise additional equity capital, we have the authority, without stockholder approval, to issue additional stock in any manner and on such terms and for such consideration as we deem appropriate, at any time.
On March 5, 2014, our Board increased the authorization under our common stock repurchase program (the “Repurchase Program”) to
50,000
shares of our common stock outstanding (on a pre-reverse stock split basis). On July 28, 2015, our Board of Directors increased the number of shares of common stock authorized for repurchase under our Repurchase Program to an aggregate of
9,000
shares on a post-reverse stock split basis, effective August 3, 2015. Under the Repurchase Program, shares may be purchased in the open market, including block trades, through privately negotiated transactions, or pursuant to a trading plan separately adopted in the future. The timing, manner, price and amount of any repurchases will be at our discretion, subject to the requirements of the Securities Exchange Act of 1934, as amended, and related rules. We are not required to repurchase any shares under the Repurchase Program and it may be modified, suspended or terminated at any time for any reason. We do not intend to purchase shares from our Board or other affiliates. Under Maryland law, such repurchased shares are treated as authorized but unissued. During the
years
ended
December 31, 2015
,
December 31, 2014
and
December 31, 2013
, we repurchased
7,510
shares,
600
shares and
2,096
shares of our common stock under the Repurchase Program for an aggregate cost of
$159,600
,
$18,362
and
$72,694
, respectively. At
December 31, 2015
, there were
1,874
authorized shares remaining under the Repurchase Program.
Real Estate Investment Trust Requirements
We have elected to be taxed as a REIT under the Code. As a REIT, we will generally not be subject to federal income tax on the REIT taxable income that we currently distribute to our stockholders. We also must satisfy other ongoing REIT requirements under the Code, including meeting certain asset, income and stock ownership tests. If we fail to qualify as a REIT in any taxable year and do not qualify for certain statutory relief provisions, we will be subject to federal income tax at regular corporate rates. Even if we qualify as a REIT for federal income tax purposes, we may still be subject to some federal, state and local taxes on our income.
Distributions
In order to maintain our qualification as a REIT for U.S. federal income tax purposes, we are required to timely distribute, with respect to each year at least 90% of our REIT taxable income, determined without regard to the deduction for dividends paid and excluding any net capital gain. To satisfy these requirements, we presently intend to continue to make regular cash distributions of all or substantially all of our taxable income to holders of our stock out of assets legally available for such purposes. We are not restricted from using the proceeds of equity or debt offerings to pay dividends, but we do not intend to do so. The timing and amount of any dividends we pay to holders of our stock will be at the discretion of our Board and will depend upon various factors, including our earnings and financial condition, maintenance of REIT status, applicable provisions of MGCL and such other factors as our Board deems relevant. Dividends in excess of REIT taxable income for the year (including taxable income carried forward from the previous year) will generally not be taxable to common stockholders.
Investment Company Act of 1940 Exclusion
We conduct our business so as not to become regulated as an investment company under the 1940 Act. We rely on the exclusion provided by Section 3(c)(5)(C) of the 1940 Act as interpreted by the staff of the SEC. To qualify for this exclusion we must invest at least 55% of our assets in “mortgages and other liens on and interest in real estate” or “qualifying real estate interests” and at least 80% of our assets in qualifying real estate interests and “real estate related assets.” In satisfying this 55% requirement we treat Agency Securities issued with respect to an underlying pool of mortgage loans in which we hold all of the certificates issued by the pool (“whole pool” securities) as qualifying real estate interests. We currently treat Agency Securities in which we hold less than all of the certificates issued by the pool (“partial pool” securities) as real estate related assets and not qualifying real estate interests.
There can be no assurance that the laws and regulations governing the 1940 Act status of REITs, including guidance and interpretations from the SEC staff regarding the Section 3(c)(5)(C) exclusion, will not change in a manner that adversely affects our operations or business. For example, such changes might require us to employ less leverage in financing certain of our mortgage related investments and we may be precluded from acquiring certain types of higher yielding securities. The net effect of these factors would be to lower our net interest income. If we fail to qualify for an exclusion from registration as an investment company or an exclusion from the definition of an investment company, our ability to use leverage would be substantially reduced. Our business will be materially and adversely affected if we fail to qualify for an exclusion from regulation under the 1940 Act.
3
Compliance with NYSE Corporate Governance Standards
We comply with the corporate governance standards of the NYSE. Our Audit Committee, Compensation Committee and Nominating and Corporate Governance Committee are comprised entirely of independent directors and a majority of our directors are “independent” in accordance with the rules of the NYSE.
Competition
Our success depends, in large part, on our ability to acquire assets with favorable margins over our borrowing costs. In acquiring Agency Securities, we compete with mortgage REITs, mortgage finance and specialty finance companies, savings and loan associations, banks, mortgage bankers, insurance companies, mutual funds, institutional investors, investment banking firms, other lenders, governmental bodies and other entities. Many of these organizations have greater financial resources and access to lower costs of capital than we do. Some of these entities may not be subject to the same regulatory constraints that we are (i.e., REIT compliance or maintaining an exclusion under the 1940 Act). In addition, there are numerous mortgage REITs with similar asset acquisition objectives, including Agency Securities and others may be organized in the future. The effect of the existence of additional REITs may be to increase competition for the available supply of mortgage assets suitable for purchase. An increase in competition for financing could adversely affect the availability and cost of our financing.
Employees
We are managed by ACM pursuant to the Management Agreement between us and ACM. We do not have any employees. As of
December 31, 2015
, ACM had
19
employees.
Facilities
Our principal offices are located at:
ARMOUR Residential REIT, Inc.
3001 Ocean Drive, Suite 201
Vero Beach, FL 32963
Phone Number
Our phone number is (772) 617-4340.
Website
Our website is
www.armourreit.com
. Our investor relations website can be found under the “Investor Relations” tab at
www.armourreit.com
. We make available on our website under “SEC filings,” free of charge, our Annual Reports on Form 10-K, Quarterly Reports on Form 10-Q, Current Reports on Form 8-K and amendments to those reports as soon as reasonably practicable after we electronically file or furnish such materials to the SEC. We also make available on our website, our corporate governance documents, including our code of business conduct and ethics and whistleblower policy. Any amendments or waivers thereto will be provided on our website within four business days following the date of the amendment or waiver. Information provided on our website is not part of this Annual Report on Form 10-K and not incorporated herein.
Available Information
We are required to file Annual Reports on Form 10-K and Quarterly Reports on Form 10-Q with the SEC on a regular basis and are required to disclose certain material events in a Current Report on Form 8-K. The public may read and copy any materials we file with the SEC at the SEC’s Public Reference Room at 100 F Street, N.E., Washington, D.C. 20549. The public may obtain information on the operation of the Public Reference Room by calling the SEC at 1-800-SEC-0330. The SEC also maintains an Internet website that contains reports, proxy and information statements and other information regarding issuers that file electronically with the SEC. The SEC’s Internet website is located at
http://www.sec.gov
.
4
An investment in our securities involves a high degree of risk. You should consider carefully the material risks described below together with the other information contained in this Annual Report on Form 10-K, before making a decision to invest in our securities. If any of the following events occur, our business, financial condition and operating results may be materially adversely affected. In that event, the trading price of our securities could decline and you could lose all or part of your investment. This Annual Report on Form 10-K also contains forward-looking statements that involve risks and uncertainties. Our actual results could differ materially from those anticipated in the forward-looking statements as a result of specific factors, including the risks described below.
Risks Related to Our Business
Our lenders may insist on financing terms that could result in reducing the availability and/or increasing the cost of our financing or may terminate our financing
.
In order to achieve a competitive return for our investors, we use financial leverage to hold a portfolio of Agency Securities that is several times larger than our total stockholders’ equity. Our borrowings are essentially all in the form of repurchase agreements where we nominally sell Agency Securities to counterparties with an agreement to repurchase them at a later date. The sale and purchase prices are set several percentage points below the current fair value of the Agency Securities. This “haircut” percentage provides the counterparty with excess collateral to secure their loan and provides us with an incentive to complete the repurchase transaction on schedule.
There is a risk that our counterparties might be unwilling to continue to extend repurchase financing to us. Changes in regulation, market conditions or the financial position or business strategy of our counterparties could cause them to reduce or terminate our repurchase financing facilities. There is also a risk that counterparties could insist on higher haircut percentages, interest rates or other terms that have the practical effect of reducing the availability and/or increasing the cost of our financing. If we were unable to maintain adequate levels of funding, we would be required to reduce the size of our Agency Securities portfolio and our net interest income would decline.
We attempt to mitigate our funding risk by maintaining repurchase funding relationships with a variety of counterparties that are diversified as to size, character and primary regulatory jurisdiction. We also monitor our borrowing levels with each counterparty, attempt to establish appropriate additional business relationships beyond our borrowing and regularly communicate with their credit and business officers responsible for our relationship. From time to time, we explore new funding structures and opportunities, but there can be no assurance that any such additional funding will become available on attractive terms.
Our ability to buy or sell our securities and derivatives may be severely limited or not profitable and we may be required to post additional collateral in connection with our financing and derivatives
.
Our Agency Securities and our hedging derivatives are traded in the over-the-counter market. Therefore, we must buy and sell our securities and derivatives in privately negotiated transactions with banks, brokers, dealers, or principal counter parties such as originators, the GSEs and other investors. Without the benefit of a securities exchange, there may be times when the supply of or demand for the Agency Securities and derivatives we wish to buy or sell is severely limited. The bid-ask spread between the prices at which we can purchase and sell Agency Securities and derivatives may also become temporarily wide relative to historical levels. This could exacerbate our losses or limit our opportunities to profit during times of market stress or dislocation. We attempt to mitigate this risk by concentrating our investments in Agency Securities that have more widespread trading interest resulting in deeper and more liquid trading.
All of our repurchase financing and our hedging derivatives have daily collateral maintenance requirements and a substantial portion of our Agency Securities are pledged as collateral. These collateral requirements are monitored by our counterparties and we may be required to post additional collateral when the value of our posted collateral declines and/or the fair value of our net liability under a derivative increases. We attempt to mitigate this risk by moderating the amount of our financial leverage, monitoring collateral maintenance requirements and timely calling for collateral (or a return of collateral) from our counterparties on financing positions and derivatives, and maintaining reserve liquidity in the form of cash or unpledged Agency Securities that are widely acceptable as collateral. By concentrating our investments in more liquid Agency Securities, we also seek to be able to quickly sell positions and reduce our financial leverage if necessary.
The daily collateral maintenance required for our repurchase financing and our hedging derivatives, generally move in opposite directions as market interest rates change. However, because market yields on our Agency Securities are not perfectly correlated with interest rate swap market yields, it is likely that our daily requirements to post collateral to our counterparties will
5
not equal the collateral our counterparties are required to post to us. In times of higher market volatility, those differences can become more significant.
Changes in interest rates may impact our level of net interest income and stockholders' equity and we may not be able to successfully mitigate such interest rate risks
.
We invest predominately in Agency Securities backed by loans with fixed interest rates, and to a lesser extent from time to time, in Agency Securities backed by loans with interest rates that adjust no more frequently than annually. The interest rates on our repurchase financing generally adjust quarterly or more frequently. This mismatch in the interest rate terms between our assets and our liabilities is the primary source of our ability to generate positive net income because long-term interest rates tend to be higher than short-term rates.
Short-term and long-term interest rates do not always move together. Changes in short-term rates will most significantly impact our level of net interest income, with rising interest rates likely to reduce our net interest income. Changes in long-term rates will initially impact the fair value of our Agency Securities, with rising interest rates reducing their fair value. Changes in the fair values of our Agency Securities are generally not reflected in our net income or our earnings per share, but rather are reflected directly in our stockholders’ equity. Over longer periods of time, rising long-term interest rates will provide us the opportunity to reinvest principal receipts and otherwise acquire additional Agency Securities with higher yields.
We attempt to mitigate interest rate risk by moderating the amount of our financial leverage, diversifying our portfolio of Agency Securities across both maturities and interest rate coupons, and economic hedging with derivatives. For example, we enter into interest rate swaps that require us to pay fixed rates and receive variable rates. These swaps are designed to offset the fluctuations in the interest costs of our repurchase financing due to movements in short-term interest rates. We record our derivatives at fair value and periodic changes in fair value are reflected in our net income and earnings per share. To the extent that fair value changes on derivatives offset fair value changes in our Agency Securities, the fluctuation in our stockholders’ equity will be lower. However, our income statement volatility will not be reduced, because the fair value changes in our Agency Securities are reflected directly in stockholders’ equity. Rising interest rates may tend to result in an overall increase in our reported net income even while our total stockholders’ equity declines.
Factors beyond our control may increase the prepayment speeds on our Agency Securities, thereby reducing our interest income
.
At
December 31, 2015
and
December 31, 2014
, approximately
82.68%
and
91.75%
of our single family Agency Securities were backed by loans where the underlying borrowers may prepay their loans without premium or penalty. Also, when borrowers default on their loans, the GSE that issued or guaranteed our Agency Securities (including Agency Securities backed by multi-family loans) pay off the remaining loan balance. Those prepayments are passed through to us, reducing the balance of the Agency Security. We generally purchase Agency Securities at premium prices, and the premium amortization associated with prepayments reduces our interest income.
We experience prepayments on our Agency Security every month and the speed of prepayments can vary widely from month to month and across individual Agency securities. Factors driving prepayment speeds include the rate of new and existing home sales, the level of borrower refinancing activities and the frequency of borrower defaults. Such factors are themselves influenced by government monetary, fiscal and regulatory policies and general economic conditions such as the level of and trends in interest rates, GDP, employment and consumer confidence. Prepayment expectations are an integral part of pricing Agency Securities in the marketplace. Volatility in actual prepayment speeds will create volatility in the amount of premium amortization we recognize. Higher speeds will reduce our interest income and lower speeds will increase our interest income.
We consider our expectations of future prepayments when evaluating the prices at which we purchase and sell Agency Securities. We attempt to mitigate the risk of unexpected prepayments by identifying characteristics of the underlying loans, such as the loan size, coupon rate, loan age and maturity, geographic location, borrower credit scores and originator/servicer that might predict relatively faster or slower prepayment speed tendencies for a particular Agency Security. Agency Securities with characteristics expected to be favorable often command marginally higher prices, or “pay ups.” We seek to purchase Agency Securities with favorable prepayment characteristics when the required pay ups are relatively lower and may sell our Agency Securities when their pay ups are relatively higher.
Volatility in the relationships between the market prices and yields for our securities and certain benchmark prices and interest rates can adversely affect our net income, earnings per share and stockholders' equity
.
The market prices and yields for Agency Securities and interest rate derivatives like those we hold are generally correlated over time to each other and to certain benchmark prices and interest rates, such as those for U.S. Treasury Securities. Those
6
correlations are never perfect, and can vary widely on occasion, particularly in times of market stress. This variation in the “spread” relationship among the market yields, and therefore prices, of different instruments can result in our hedging positions being not as effective than normally would be expected, exposing us to the risk of unexpected volatility in our net income, earnings per share, and total stockholders’ equity.
Spread risk is difficult and expensive to hedge effectively. Avoiding holding Agency Securities with interest rate spread risk would severely limit our opportunity to generate net interest income because low spread risk investments, such as U.S. Treasury Securities, usually have substantially lower yields. Our efforts to mitigate spread risk are limited to attempting to identify characteristics that might cause particular Agency Securities to have relatively higher or lower spread risk under potential future market conditions. Such characteristics include characteristics of the underlying loans and current market premium levels. All other things being equal, we attempt to overweight our securities portfolio with Agency Securities that have marginally lower spread risk. However, other investment considerations, such as prepayment risk, tend to overshadow spread risk in our selection of Agency Securities.
We may not be able to minimize potential credit risks that could arise in the event of bankruptcy of one or more of our counterparties
.
Substantially all of our Agency Securities are issued or guaranteed by GSEs, which we consider the functional equivalent of the full faith and credit of the U.S Government. Our primary credit risk relates to our exposure to our counterparties for the amount of the excess collateral they hold to secure our repurchase financing and derivative obligations. We would typically become a general unsecured creditor for that amount in the event of the bankruptcy of a counterparty.
We mitigate our credit risk by evaluating the credit quality of our counterparties on an ongoing basis, reducing or closing positions with counterparties where we have credit concerns, monitoring our collateral positions to minimize excess collateral balances and diversifying our repurchase financing and derivatives positions among numerous counterparties. At
December 31, 2015
and
December 31, 2014
, we did not have any repurchase counterparties that the amount at risk, or aggregate haircut, individually accounted for 5% or greater of our stockholders' equity.
Changes in laws and regulations affecting the relationship between Fannie Mae and Freddie Mac and the U.S. Government, may adversely affect our business.
The payments we receive on the Agency Securities in which we invest depend upon a steady stream of payments by borrowers on the underlying mortgages and the fulfillment of guarantees by GSEs. There can be no assurance that the U.S. Government's intervention in Fannie Mae and Freddie Mac will continue to be adequate for the longer-term viability of these GSEs. These uncertainties may lead to concerns about the availability of and trading market for Agency Securities in the long term. Accordingly, if the GSEs defaulted on their guaranteed obligations, suffered losses or ceased to exist, the value of our Agency Securities and our business, operations and financial condition could be materially and adversely affected.
The passage of any new federal legislation affecting Fannie Mae and Freddie Mac may create market uncertainty and reduce the actual or perceived credit quality of securities issued or guaranteed by them. If Fannie Mae and Freddie Mac were reformed or wound down, it is unclear what effect, if any, this would have on the value of the existing Fannie Mae and Freddie Mac Agency Securities. The foregoing could materially adversely affect the pricing, supply, liquidity and value of the Agency Securities in which we invest and otherwise materially adversely affect our business, operations and financial condition.
The adoption of derivatives legislation by Congress could have an adverse impact on our ability to hedge risks associated with our business.
The Dodd-Frank Act regulates derivative transactions, which include certain instruments used in our risk management activities. Under the Dodd-Frank Act, most swaps will eventually be required to clear through a registered clearing facility and traded on a designated exchange or swap execution facility. There are some exceptions to these requirements for entities that use swaps to hedge or mitigate commercial risk. However, we do not currently anticipate qualifying for an exception. Among the other provisions of the Dodd-Frank Act that may affect derivative transactions are those relating to establishment of capital and margin requirements for certain derivative participants, establishment of business conduct standards, record keeping and reporting requirements, and imposition of position limits. Although the Dodd-Frank Act includes significant new provisions regarding the regulation of derivatives, the impact of those requirements will not be known definitively until regulations have been adopted by the SEC and the CFTC. The new legislation and any new regulations could increase the operational and transactional cost of derivatives contracts and affect the number and/or creditworthiness of available hedge counterparties to us. We have established an account with a futures commission merchant for this purpose. To date, we have not entered into any cleared interest rate swap contracts.
7
We cannot predict the impact of future Fed monetary policy on the prices and liquidity of Agency Securities or other securities in which we invest, although Fed action could increase the prices of our target assets and reduce the spread on our investments, or decrease our book value.
Since 2008, the Fed has conducted various quantitative easing programs of buying Agency and U.S. Treasury Securities intended to expedite an economic recovery, stabilize prices, reduce unemployment and improve business and household spending. The Fed's most recent round of this quantitative easing ended in September 2014. On December 16, 2015, the Fed raised its target range for the Federal Funds Rate to between 0.25% and 0.50%. On January 27, 2016, the Fed announced their decision to hold the same target range. Changes in Fed policy affect our financial results, since our cost of funds is largely dependent on short-term rates. An increase in our cost of funds without a corresponding increase in interest income earned on our Agency Securities would cause our net income to decline. We cannot predict the impact of any future actions by the Fed on the prices and liquidity of Agency Securities or other securities in which we invest, although future Fed action could increase the prices of our target assets and reduce the spread on our investments or decrease our book value. Future securities purchase programs or other monetary policy enacted by the Fed could materially adversely affect our business, financial condition and results of operations and our ability to pay distributions to our stockholders.
Risks Related to Our Corporate Structure
Maintenance of our exclusion from the 1940 Act will impose limits on our business.
We conduct our business so as not to become regulated as an investment company under the 1940 Act. If we were to fall within the definition of investment company, we would be unable to conduct our business as described in this Annual Report on Form 10-K. Section 3(a)(1)(A) of the 1940 Act defines an investment company as any issuer that is or holds itself out as being engaged primarily in the business of investing, reinvesting or trading in securities. Section 3(a)(1)(C) of the 1940 Act also defines an investment company as any issuer that is engaged or proposes to engage in the business of investing, reinvesting, owning, holding or trading in securities and owns or proposes to acquire investment securities having a value exceeding 40% of the value of the issuer’s total assets (exclusive of U.S. Government securities and cash items) on an unconsolidated basis. Excluded from the term “investment securities,” among other things, in Section 3(a)(1)(C) of the 1940 Act, as defined above, are GSEs and securities issued by majority-owned subsidiaries that are not themselves investment companies and are not relying on the exclusion from the definition of investment company set forth in Section 3(c)(1) or Section 3(c)(7) of the 1940 Act.
We rely on the exclusion from the definition of “investment company” provided by Section 3(c)(5)(C) of the 1940 Act. To qualify for the exclusion, we make investments so that at least 55% of the assets we own consist of “qualifying assets” and so that at least 80% of the assets we own consist of qualifying assets and other real estate related assets. We generally expect that our investments in our target assets will be treated as either qualifying assets or real estate related assets under Section 3(c)(5)(C) of the 1940 Act in a manner consistent with SEC staff no-action letters. Qualifying assets for this purpose include mortgage loans and other assets, such as whole pool Agency Securities that are considered the functional equivalent of mortgage loans for purposes of the 1940 Act. The SEC staff has not issued guidance with respect to whole pool Non-Agency Securities. Accordingly, based on our own judgment and analysis of the SEC’s pronouncements with respect to agency whole pool certificates, we may also treat Non-Agency Securities issued with respect to an underlying pool of mortgage loans in which we hold all of the certificates issued by the pool as qualifying assets. We invest at least 55% of our assets in whole pool Agency Securities and Non-Agency Securities that constitute qualifying assets in accordance with SEC staff guidance and at least 80% of our assets in qualifying assets plus other real estate related assets. Other real estate related assets would consist primarily of Agency Securities and Non-Agency Securities that are not whole pools, such as CMOs and CMBS. As a result of the foregoing restrictions, we are limited in our ability to make or dispose of certain investments. To the extent that the SEC staff publishes new or different guidance with respect to these matters, we may be required to adjust our strategy accordingly. These restrictions could also result in our holding assets we might wish to sell or selling assets we might wish to hold. Although we monitor our portfolio for compliance with the Section 3(c)(5)(C) exclusion periodically and prior to each acquisition and disposition, there can be no assurance that we will be able to maintain this exclusion.
To the extent that we elect in the future to conduct our operations through majority-owned subsidiaries, such business will be conducted in such a manner as to ensure that we do not meet the definition of investment company under either Section 3(a)(1)(A) or Section 3(a)(1)(C) of the 1940 Act, because less than 40% of the value of our total assets on an unconsolidated basis would consist of investment securities. We intend to monitor our portfolio periodically to insure compliance with the 40% test. In such case, we would be a holding company which conducts business exclusively through majority-owned subsidiaries and we would be engaged in the non-investment company business of our subsidiaries.
8
Loss of the 1940 Act exclusion would adversely affect us, the market price of shares of our stock and our ability to distribute dividends.
As described above, we conduct our operations so as not to become required to register as an investment company under the 1940 Act based on current laws, regulations and guidance. Although we monitor our portfolio, we may not be able to maintain this exclusion under the 1940 Act. If we were to fail to qualify for this exclusion in the future, we could be required to restructure our activities or the activities of our subsidiaries, if any, including effecting sales of assets in a manner that, or at a time when we would not otherwise choose, which could negatively affect the value of our stock, the sustainability of our business model and our ability to make distributions. The sale could occur during adverse market conditions and we could be forced to accept a price below that which we believe is appropriate.
There can be no assurance that the laws and regulations governing the 1940 Act status of REITs, including guidance and interpretations from the SEC and its staff regarding the Section 3(c)(5)(C) exclusion, will not change in a manner that adversely affects our operations or business. The SEC or its staff may issue new interpretations of the Section 3(c)(5)(C) exclusion causing us to change the way we conduct our business, including changes that may adversely affect our ability to achieve our investment objective. We may be required at times to adopt less efficient methods of financing certain of our mortgage related investments and we may be precluded from acquiring certain types of higher yielding securities. The net effect of these factors would be to lower our net interest income. If we fail to qualify for an exclusion from registration as an investment company or an exclusion from the definition of an investment company, our ability to use leverage would be substantially reduced. Our business will be materially and adversely affected if we fail to qualify for an exclusion from regulation under the 1940 Act.
Failure to maintain an exemption from being regulated as a CPO could subject us to additional regulation and compliance requirements and may result in fines and other penalties which could materially adversely affect our business and financial condition.
Rules adopted under the Dodd-Frank Act establish a comprehensive new regulatory framework for derivative contracts commonly referred to as swaps. Under these rules, any investment fund that trades in swaps may be considered a “commodity pool,” which would cause its directors to be regulated as CPOs. Under the rules, which became effective on October 12, 2012 for those who became CPOs solely because of their use of swaps, CPOs must register with the NFA, which requires compliance with NFA's rules, and are subject to regulation by the CFTC including with respect to disclosure, reporting, record keeping and business conduct.
On December 7, 2012, the CFTC staff issued a no-action letter (CFTC Staff Letter 12-44) to provide exemptive relief to mortgage REITs that claim such relief. On December 11, 2012, we submitted our claim and our directors do not intend to register as CPOs with the NFA. To comply with CFTC Staff Letter 12-44, we are restricted to operating within certain parameters discussed in the no-action letter. For example, the exemptive relief limits our ability to enter into interest rate hedging transactions such that the initial margin and premiums for such hedges will not exceed five percent of the fair market value of our total assets.
Our hedging strategies are designed to reduce the impact on our earnings caused by the potential adverse effects of changes in interest rates on our target assets and liabilities. Subject to complying with REIT requirements, we use hedging techniques to limit the risk of adverse changes in interest rates on the value of our target assets as well as the differences between the interest rate adjustments on our target assets and borrowings. These techniques primarily consist of entering into interest rate swap contracts and purchasing or selling Futures Contracts and may also include entering into interest rate cap or floor agreements, purchasing put and call options on securities or securities underlying Futures Contracts, or entering into forward rate agreements. Although we are not legally limited to our use of hedging, we limit our use of derivative instruments to only those techniques described above and enter into derivative transactions only with counterparties that we believe have a strong credit rating to help limit the risk of counterparty default or insolvency. These transactions are not entered into for speculative purposes. We do not use these instruments for the purpose of trading in commodity interests, and we do not consider our company or its operations to be a commodity pool as to which CPO regulation or compliance is required.
The CFTC has substantial enforcement power with respect to violations of the laws over which it has jurisdiction, including their anti-fraud and anti-manipulation provisions. Among other things, the CFTC may suspend or revoke the registration of a person who fails to comply, prohibit such a person from trading or doing business with registered entities, impose civil money penalties, require restitution and seek fines or imprisonment for criminal violations. Additionally, a private right of action exists against those who violate the laws over which the CFTC has jurisdiction or who willfully aid, abet, counsel, induce or procure a violation of those laws. In the event we fail to maintain exemptive relief from the CFTC on this matter and our directors fail to comply with the regulatory requirements of these new rules, we may be subject to significant fines, penalties and other civil or governmental actions or proceedings, any of which could have a materially adverse effect on our business, financial condition and results of operations.
9
We are highly dependent on information and communications systems. System failures, security breaches or cyber-attacks of networks or systems could significantly disrupt our business and negatively affect the market price of our common stock and our ability to distribute dividends.
Our business is highly dependent on communications and information systems that allow us to monitor, value, buy, sell, finance and hedge our investments. These systems are primarily operated by third-parties and, as a result, we have limited ability to ensure their continued operation. In the event of systems failure or interruption, we will have limited ability to affect the timing and success of systems restoration. Any failure or interruption of our systems could cause delays or other problems in our securities trading activities, including Agency RMBS trading activities, which could have a material adverse effect on our operating results and negatively affect the market price of our common stock and our ability to make distributions to our stockholders.
We rely on sophisticated information technology systems, networks and infrastructure in managing our day-to-day operations. Despite cyber-security measures already in place, our information technology systems, networks and infrastructure may be vulnerable to deliberate attacks or unintentional events that could interrupt or interfere with their functionality or the confidentiality of our information. Our inability to effectively utilize our information technology systems, networks and infrastructure, and protect our information could adversely affect our business.
We have not established a minimum dividend payment level and there are no guarantees of our ability to pay dividends in the future.
We expect to continue to make regular cash distributions to our stockholders in amounts such that all or substantially all of our taxable income in each year, subject to certain adjustments, is distributed. This, along with other factors, should enable us to qualify for the tax benefits accorded to a REIT under the Code. However, we have not established a minimum dividend payment level and our ability to pay dividends may be adversely affected by the risk factors described in this report. Future distributions are made at the discretion of our Board and will depend on our earnings, our financial condition, maintenance of our REIT status, restrictions on making distributions under the MGCL and such other factors as our Board may deem relevant from time to time. There are no guarantees of our ability to pay dividends in the future. In addition, some of our distributions may include a return of capital.
Although we have no intention to do so, we may use proceeds from equity and debt offerings and other financings to fund distributions, which will decrease the amount of capital available for purchasing our target assets.
We presently have no intention of using the proceeds of any offering of our equity or debt or other financings to fund distributions to stockholders. However, there are no restrictions in our charter or in any agreement to which we are a party that prohibits us from doing so. In the event that we elect to fund any distribution to our stockholders from sources other than our earnings, the amount of capital available to us to purchase our target assets would decrease, which could have an adverse effect on our overall financial results and performance.
We have, and may continue to, return capital to shareholders by repurchasing shares and/or paying dividends in excess of our taxable income.
Share repurchases and dividends paid in excess of taxable income will reduce our capital base and our ability to invest in Agency Securities without increasing financial leverage. We will be more likely to consider future returns of capital to shareholders when the market trading price for our common stock represents a significant discount to our book value. For the
year
ended
December 31, 2015
, we returned capital to shareholders of
$159,600
through stock repurchases and
$38,137
through dividends in excess of taxable income. For the year ended 2014, we returned capital to shareholders of
$18,362
through stock repurchases and
$30,641
through dividends in excess of taxable income. For the year ended 2013, we returned capital to shareholders of
$72,694
and
$54,491
through dividends in excess of taxable income. At
December 31, 2015
, there were
1,874
shares remaining authorized for repurchase under the Repurchase Program.
We are subject to financial reporting and other requirements for which our accounting, internal audit and other management systems and resources may not be adequately prepared.
We are subject to reporting and other obligations under the Securities Act and the Exchange Act, including the requirements of Section 404 of the Sarbanes-Oxley Act. These reporting and other obligations, may place significant demands on our management, administrative, operational, internal audit and accounting resources and cause us to incur significant expenses. We may need to upgrade our systems or create new systems; implement additional financial and management controls, reporting systems and procedures; expand or outsource our internal audit function; and hire additional accounting, internal audit and finance
10
staff. If we are unable to accomplish these objectives in a timely and effective fashion, our ability to comply with the financial reporting requirements and other rules that apply to reporting companies could be impaired. Any failure to maintain effective internal controls could have a material adverse effect on our business, operating results and stock price.
Future issuances or sales of stock could cause our stock price to decline.
Sales of substantial amounts of our stock in the public market, or the perception that such sales might occur, could adversely affect the market price of our stock. In addition, the sale of these shares could impair our ability to raise capital through a sale of additional equity securities.
Other issuances of our stock could have an adverse effect on the market price of our stock. In addition, future issuances of our stock may be dilutive to existing stockholders.
Provisions of Maryland law and other provisions of our organizational documents may limit the ability of a third-party to acquire control of the company.
Certain provisions of the MGCL may have the effect of delaying, deferring or preventing a transaction or a change in control of the company that might involve a premium price for holders of our common stock or otherwise be in their best interests. Additionally, our charter and bylaws contain other provisions that may delay or prevent a change of control of the company.
If we have a class of equity securities registered under the Securities Exchange Act and meet certain other requirements, Title 3, Subtitle 8 of the MGCL permits us without stockholder approval and regardless of what is currently provided in our charter or bylaws, to elect to be subject to statutory provisions that may have the effect of delaying, deferring or preventing a transaction or a change in control of the company that might involve a premium price for holders of our common stock or otherwise be in their best interest. Pursuant to Title 3, Subtitle 8 of the MGCL, once we meet the applicable requirements, our charter provides that our Board will have the exclusive power to fill vacancies on our Board. As a result, unless all of the directorships are vacant, our stockholders will not be able to fill vacancies with nominees of their own choosing. We may elect to opt in to additional provisions of Title 3, Subtitle 8 of the MGCL without stockholder approval at any time that we have a class of equity securities registered under the Securities Exchange Act and satisfy certain other requirements.
We have very broad investment guidelines and our Board will not approve each investment and financing decision made by ACM.
We are authorized to invest in Agency Securities and Non-Agency Securities backed by fixed rate, hybrid adjustable rate and adjustable rate home loans as well as unsecured notes and bonds issued by GSEs, U.S. Treasuries and money market instruments, subject to certain income tests we must satisfy for our qualification as a REIT. ACM is authorized to invest and obtain financing on our behalf within these guidelines. Our Board periodically reviews our investment guidelines and our investment portfolio but does not, and is not required to, review all of our investments on an individual basis or in advance. In conducting periodic reviews, our Board relies primarily on information provided to it by ACM. Furthermore, ACM may use complex strategies and transactions that may be costly, difficult or impossible to unwind if our Board determines that they are not consistent with our investment guidelines. In addition, because ACM has a certain amount of discretion in investment, financing and hedging decisions, ACM’s decisions could result in investment returns that are substantially below expectations or that result in losses, which would materially and adversely affect our business, financial condition and results of operations.
We may change our target assets, financing and investment strategy and other operational policies without stockholder consent, which may adversely affect the market price of our common stock and our ability to make distributions to stockholders.
Within our overall investment guidelines, we may change our target assets financing strategy, and investment guidelines at any time without the consent of our stockholders, which could result in our making investments that are different from, and possibly riskier than, the investments described in this Annual Report on Form 10-K. Our Board also determines our other operational policies and may amend or revise such policies, including our policies with respect to our REIT qualification, acquisitions, dispositions, operations, indebtedness and distributions, or approve transactions that deviate from these policies, without a vote of, or notice to, our stockholders. A change in our targeted investments, financing strategy, investment guidelines and other operational policies may increase our exposure to interest rate risk, default risk and real estate market fluctuations, all of which could adversely affect the market price of our common stock and our ability to make distributions to our stockholders.
11
We operate in a highly competitive market for investment opportunities and related financing and competition may limit our ability and financing to acquire desirable investments in our target assets, obtain necessary financing and could also affect the pricing of these assets and cost of funds.
We operate in a highly competitive market for investment opportunities and borrowing facilities. Our profitability depends, in large part, on our ability to acquire our target assets at attractive prices and finance them economically. In acquiring and financing our target assets, we will compete with a variety of institutional investors, including other REITs, specialty finance companies, public and private funds, government entities, commercial and investment banks, commercial finance and insurance companies and other financial institutions. Many of our competitors are substantially larger and have considerably greater financial, technical, marketing and other resources than we do. Several other REITs may have investment objectives that overlap with ours, which may create additional competition for investment opportunities and financing. Some competitors may have a lower cost of funds and access to funding sources that may not be available to us, such as funding from the U.S. or foreign governments. Many of our competitors are not subject to the operating constraints associated with REIT tax compliance or maintenance of an exemption from the Investment Company Act. In addition, some of our competitors may have higher risk tolerances or different risk assessments, which could allow them to consider a wider variety of investments and establish more relationships than us. Furthermore, competition for investments in our target assets may lead to the price of such assets increasing, which may further limit our ability to generate desired returns. We cannot provide assurance that the competitive pressures we face will not have a material adverse effect on our business, financial condition and results of operations. Also, as a result of this competition, desirable investments in our target assets may be limited in the future and we may not be able to take advantage of attractive investment opportunities from time to time, as we can provide no assurance that we will be able to identify, finance and make investments that are consistent with our investment objectives.
Risks Related to Our Management and Conflicts of Interest
We depend on ACM and particularly key personnel. The loss of those key personnel could severely and detrimentally affect our operations.
As an externally managed company, we depend on the diligence, experience and skill of ACM for the selection, acquisition, structuring, hedging and monitoring of our MBS and associated borrowings. We depend on the efforts and expertise of our operating officers to manage our day-to-day operations and strategic business direction. If any of our key personnel were to leave the Company, locating individuals with specialized industry knowledge and skills similar to that of our key personnel may not be possible or could take months. Because we have no employees, the loss of ACM could harm our business, financial condition, cash flow and results of operations.
We have a contract with AVM to administer clearing and settlement services for our securities and derivative transactions. We have also entered into a second contract with AVM to assist us with financing transaction services such as repurchase financings and managing the margin arrangement between us and our lenders for each of our repurchase agreements. We use the services of AVM for these aspects of our business so our executive officers can focus on our daily operations and strategic direction. Further, as our business expands, reliance on AVM to provide us with timely, effective services will increase. In the future, as we expand our staff, we may absorb internally some or all of the services provided by AVM. Until we elect to move those services in-house, we continue to use AVM or other third-parties that provide similar services. If we are unable to maintain a relationship with AVM or are unable to establish a successful relationship with other third-parties providing similar services at comparable pricing, we may have to reduce or delay our operations and/or increase our expenditures and undertake the repurchase agreement and trading and administrative activities on our own, which could have a material adverse effect on our business operations and financial condition. However, we believe that the breadth and scope of ACM’s experience will enable them to fill any needs created by discontinuing a relationship with AVM.
There are conflicts of interest in our relationship with ACM and its affiliates, which could result in decisions that are not in the best interests of our stockholders.
We are subject to conflicts of interest arising out of our relationship with ACM and its affiliates. Each of our executive officers and our non-independent directors are also affiliated with JAVELIN and such officers and directors will not be exclusively dedicated to our business. Entities affiliated with Mr. Ulm and Mr. Zimmer are the general partners of ACM and each of Mr. Ulm, Mr. Zimmer, Mr. Staton and Mr. Bell is a limited partner in ACM and a stockholder of JAVELIN.
The Management Agreement with ACM may create a conflict of interest and its terms, including fees payable to ACM, may not be as favorable to us as if they had been negotiated with an unaffiliated third-party. In addition, we may choose not to enforce, or to enforce less vigorously, our rights under the Management Agreement because of our desire to maintain our ongoing relationship with ACM. ACM maintains a contractual and fiduciary relationship with us. The Management Agreement with ACM
12
does not prevent ACM and its affiliates from engaging in additional management or investment opportunities some of which will compete with us. ACM and its affiliates may engage in additional management or investment opportunities that have overlapping objectives with ours and may thus face conflicts in the allocation of investment opportunities to these other investments. Such allocation is at the discretion of ACM and there is no guarantee that this allocation would be made in the best interest of our stockholders. We are not entitled to receive preferential treatment as compared with the treatment given by ACM or its affiliates to any investment company, fund or advisory account other than any fund or advisory account which contains only funds invested by ACM (and not of any of its clients or customers) or its officers and directors. Additionally, the ability of ACM and its respective officers and employees to engage in other business activities, including their activities related to JAVELIN, may reduce the time spent managing our activities.
We compete with current and future investment entities affiliated with ACM.
There are conflicts of interest in allocating investment opportunities among us and other funds, investment vehicles and ventures managed by ACM. There is a significant overlap in the assets and investment strategies of us and JAVELIN. Although ACM may dedicate certain trading and investment personnel to serve us only, in most cases the same trading and investment personnel may provide services to both entities. ACM and its affiliates may in the future form additional funds or sponsor additional investment vehicles and ventures that have overlapping objectives with us and therefore may compete with us for investment opportunities and ACM resources. ACM has an allocation policy that addresses the manner in which investment opportunities are allocated among the various entities and strategies for which they provide investment management services. However, we cannot assure you that ACM will always allocate every investment opportunity in a manner that is advantageous for us; indeed, we may expect that the allocation of investment opportunities will at times result in our receiving only a portion of, or none of, certain investment opportunities.
Resolution of potential conflicts of interest in allocation of investment opportunities.
In allocating investment opportunities among us and any other funds or accounts managed by them, ACM's personnel are guided by the principles that they will treat all entities fairly and equitably, they will not arbitrarily distinguish among entities and they will not favor one entity over another.
In allocating a specific investment opportunity among us and JAVELIN, ACM will make a determination, exercising their judgment in good faith, as to whether the opportunity is appropriate for each entity. Factors in making such a determination may include an evaluation of each entity's liquidity, overall investment strategy and objectives, the composition of the existing portfolio, the size or amount of the available opportunity, the characteristics of the securities involved, the liquidity of the markets in which the securities trade, the risks involved, and other factors relating to the entity and the investment opportunity. ACM is not required to provide every opportunity to each entity.
If ACM determines that an investment opportunity is appropriate for both us and JAVELIN, then ACM will allocate that opportunity in a manner that they determine, exercising their judgment in good faith, to be fair and equitable, taking into consideration all allocations among us and JAVELIN taken as a whole. ACM has broad discretion in making that determination, and in amending that determination over time.
In the future, ACM may adopt additional conflicts of interest resolution policies and procedures designed to support the equitable allocation and to prevent the preferential allocation of investment opportunities among entities with overlapping investment objectives.
If ACM ceases to be our investment manager, financial institutions providing any financing arrangements to us may not provide future financing to us.
Financial institutions that finance our investments may require that ACM continue to act in such capacity. If ACM ceases to be our manager, it may constitute an event of default and the financial institution providing the arrangement may have acceleration rights with respect to outstanding borrowings and termination rights with respect to our ability to finance our future investments with that institution. If we are unable to obtain financing for our accelerated borrowings and for our future investments under such circumstances, it is likely that we would be materially and adversely affected.
ACM’s failure to make investments on favorable terms that satisfy our investment strategy and otherwise generate attractive risk adjusted returns initially and consistently from time to time in the future would materially and adversely affect us.
Our ability to achieve our investment objective depends on ACM’s personnel and their ability to make investments on favorable terms that satisfy our investment strategy and otherwise generate attractive risk adjusted returns initially and consistently
13
from time to time in the future. Accomplishing this result is also a function of ACM’s ability to execute our financing strategy on favorable terms.
The manner of determining the management fee may not provide sufficient incentive to ACM to maximize risk adjusted returns on our investment portfolio since it is based on our gross equity raised and not on our performance.
ACM is entitled to receive a monthly management fee that is based on the total of all gross equity raised (see Note 9 and Note 14 to the consolidated financial statements), as measured as of the date of determination (i.e., each month), regardless of our performance. Accordingly, the possibility exists that significant management fees could be payable to ACM for a given month despite the fact that we could experience a net loss during that month. ACM’s entitlement to such significant nonperformance-based compensation may not provide sufficient incentive to ACM to devote its time and effort to source and maximize risk adjusted returns on our investment portfolio, which could, in turn, adversely affect our ability to pay dividends to our stockholders and the market price of our common stock. Further, the management fee structure gives ACM the incentive to maximize gross equity raised by the issuance of new equity securities or the retention of existing equity, regardless of the effect of these actions on existing stockholders. In other words, the management fee structure will reward ACM primarily based on the size of our equity raised and not on our financial returns to stockholders.
The termination of the Management Agreement may be difficult and costly, which may adversely affect our inclination to end our relationship with ACM.
Termination of the Management Agreement with ACM without cause may be difficult and costly. The term “cause” is limited to those circumstances described in the Management Agreement with ACM. We may not terminate the Management Agreement during the New Initial Term, as defined therein, except for cause or in connection with a Corporate Event, as defined therein. Upon a termination by us without cause, which shall include a Corporate Event, the Management Agreement provides that we will pay ACM a termination payment equal to the greater of (a) the base management fee as calculated immediately prior to the effective date of the termination of the Management Agreement pursuant to Section 10.2 of the Management Agreement for the remainder of the then current term, or (b) three times the base management fee paid to ACM in the preceding twelve-month period before such termination, calculated as of the effective date of the termination. This provision increases the effective cost to us of electing to terminate the Management Agreement, thereby adversely affecting our inclination to end our relationship with ACM, even if we believe ACM’s performance is not satisfactory.
ACM may terminate the Management Agreement at any time and for any reason upon 180 days prior notice. If the Management Agreement is terminated and no suitable replacement is found to manage us, we may not be able to execute our business plan.
Additionally, following the initial term, the Management Agreement will automatically renew for successive five-year renewal terms unless either we or ACM give advance notice to the other of our intent not to renew the agreement prior to the expiration of the initial term or any renewal term. However, our right to give such a notice of non-renewal is limited and requires our independent directors to agree that certain conditions are met.
ACM’s liability is limited under the Management Agreement and we have agreed to indemnify ACM and its affiliates against certain liabilities. As a result, we could experience poor performance or losses for which ACM would not be liable.
The Management Agreement limits the liability of ACM and any directors and officers of ACM for money damages, except for liability resulting from actual receipt of an improper benefit or profit in money, property or services, or a final judgment based upon a finding of active and deliberate dishonesty by the director or officer that was material to the cause of action adjudicated.
Pursuant to the Management Agreement, ACM will not assume any responsibility other than to render the services called for thereunder and will not be responsible for any action of our Board in following or declining to follow its advice or recommendations. ACM and its affiliates, directors, officers, stockholders, equity holders, employees, representatives and agents and any affiliates thereof, will not be liable to us, our stockholders, any subsidiary of ours, the stockholders of any subsidiary of ours, our Board, any issuer of mortgage securities, any credit-party, any counterparty under any agreement, or any other person for any acts or omissions, errors of judgment or mistakes of law by ACM or its affiliates, directors, officers, stockholders, equity holders, employees, representatives or agents, or any affiliates thereof, under or in connection with the Management Agreement, except if ACM was grossly negligent, acted with reckless disregard or engaged in willful misconduct or fraud while discharging its duties under the Management Agreement. We have agreed to indemnify ACM and its affiliates, directors, officers, stockholders, equity holders, employees, representatives and agents and any affiliates thereof, with respect to all expenses, losses, costs, damages, liabilities, demands, charges and claims of any nature, actual or threatened (including reasonable attorneys’ fees), arising from or in respect of any acts or omissions, errors of judgment or mistakes of law (or any alleged acts or omissions, errors of judgment or
14
mistakes of law) performed or made while acting in any capacity contemplated under the Management Agreement or pursuant to any underwriting or similar agreement to which ACM is a party that is related to our activities, unless ACM was grossly negligent, acted with reckless disregard or engaged in willful misconduct or fraud while discharging its duties under the Management Agreement. As a result, we could experience poor performance or losses for which ACM would not be liable.
In addition, our articles of incorporation provide that no director or officer of ours shall be personally liable to us or our stockholders for money damages. Furthermore, our articles of incorporation permit and our by-laws require, us to indemnify, pay or reimburse any present or former director or officer of ours who is made or threatened to be made a party to a proceeding by reason of his or her service to us in such capacity. Officers and directors of ours who are also officers and board members of ACM will therefore benefit from the exculpation and indemnification provisions of our articles of incorporation and by-laws and accordingly may not be liable to us in such circumstances.
The Management Agreement was not negotiated on an arm’s-length basis and the terms, including fees payable, may not be as favorable to us as if they were negotiated with an unaffiliated third-party.
The Management Agreement that we entered into with ACM was negotiated between related parties, and we did not have the benefit of arm’s-length negotiations of the type normally conducted with an unaffiliated third-party. The terms of the Management Agreement, including fees payable, may not reflect the terms that we may have received if it were negotiated with an unrelated third-party. In addition, we may choose not to enforce, or to enforce less vigorously, our rights under the Management Agreement because of our desire to maintain our ongoing relationship with ACM.
Members of our management team have competing duties to other entities, which could result in decisions that are not in the best interests of our stockholders.
Our executive officers and the employees of ACM do not spend all of their time managing our activities and our investment portfolio. Our executive officers and the employees of ACM allocate some, or a material portion, of their time to other businesses and activities. For example, each of our executive officers is also an officer of JAVELIN and an employee of ACM. None of these individuals is required to devote a specific amount of time to our affairs. As a result of these overlapping responsibilities, there may be conflicts of interest among and reduced time commitments from our officers and the officers of JAVELIN and employees of ACM that we will face in making investment decisions on our behalf. Accordingly, we will compete with JAVELIN and ACM, and their existing activities, other ventures and possibly other entities in the future for the time and attention of these officers.
In the future, we may enter, or ACM may cause us to enter, into additional transactions with ACM or its affiliates. In particular, we may purchase, or ACM may cause us to purchase, assets from ACM or its affiliates or make co-purchases alongside ACM or its affiliates. These transactions may not be the result of arm’s length negotiations and may involve conflicts between our interests and the interests of ACM and/or its affiliates in obtaining favorable terms and conditions.
Federal Income Tax Risks
Rapid changes in the values of our target assets may make it more difficult for us to maintain our qualification as a REIT or our exemption from the 1940 Act.
If the market value or income potential of our Agency Securities declines as a result of increased interest rates, prepayment rates, general market conditions, government actions or other factors, we may need to increase certain types of our assets and income or liquidate our non-qualifying assets to maintain our REIT qualifications or our exemption from the 1940 Act. If the decline in real estate asset values or income occurs quickly, this may be especially difficult to accomplish. We may have to make decisions that we otherwise would not make absent the REIT and the 1940 Act considerations.
Our qualification as a REIT subjects us to a broad array of financial and operating parameters that may influence our business and investment decisions and limit our flexibility in reacting to market developments.
In order to qualify and maintain our qualification as a REIT, we must, among other things, ensure:
|
•
|
that at least 75% of our gross income each year is derived from certain real estate related sources;
|
|
•
|
that at least 75% of the value of our assets consists of cash, cash items, government securities and qualified REIT real estate assets at the end of each calendar quarter;
|
|
•
|
that the remainder of our investment in securities generally cannot include more than 10% of the outstanding voting securities of any one issuer, or more than 10% of the total value of the outstanding securities of any one issuer; and
|
|
•
|
that no more than 5% of the value of our assets can consist of securities of any one issuer.
|
15
If we fail to comply with these requirements, we must dispose of a portion of our assets within 30 days after the end of the calendar quarter in order to avoid losing our REIT status and suffering adverse tax consequences. If we fail to qualify as a REIT, we will be subject to federal income tax as a regular corporation and may face substantial tax liability.
Qualification as a REIT involves the satisfaction of numerous requirements (some on an annual or quarterly basis) established under highly technical and complex provisions of the Code for which only a limited number of judicial or administrative interpretations exist. We believe we currently satisfy all the requirements of a REIT. However, the determination that we satisfy all REIT requirements requires an analysis of various factual matters and circumstances that may not be totally within our control. We have not requested and do not intend to request, a ruling from the IRS, that we qualify as a REIT. Accordingly, we are not certain we will be able to qualify and remain qualified as a REIT for federal income tax purposes. Even a technical or inadvertent mistake could jeopardize our REIT status. Furthermore, the U.S. Congress or the IRS might change tax laws or regulations and the courts might issue new rulings, in each case potentially having retroactive effect, which could make it more difficult or impossible for us to qualify as a REIT.
If we fail to qualify as a REIT in any tax year, then:
|
•
|
we would be taxed as a regular domestic corporation, which, among other things, means that we would be unable to deduct distributions to stockholders in computing taxable income and would be subject to federal income tax on our taxable income at regular corporate rates;
|
|
•
|
any resulting tax liability could be substantial and would reduce the amount of cash available for distribution to stockholders and could force us to liquidate assets at inopportune times, causing lower income or higher losses than would result if these assets were not liquidated; and
|
|
•
|
unless we were entitled to relief under applicable statutory provisions, we would be disqualified from treatment as a REIT for the subsequent four taxable years following the year during which we lost our qualification and thus, our cash available for distribution to our stockholders would be reduced for each of the years during which we do not qualify as a REIT.
|
Even if we qualify and remain qualified as a REIT, we may face other tax liabilities that reduce our cash flow.
Even if we qualify and remain qualified for taxation as a REIT, we may be subject to certain federal, state and local taxes on our income and assets, including taxes on any undistributed income, tax on income from some activities conducted as a result of a foreclosure, excise taxes, state or local income, property and transfer taxes, such as mortgage recording taxes, and other taxes. In addition, in order to meet the REIT qualification requirements, prevent the recognition of certain types of non-cash income, or to avert the imposition of a 100% tax that applies to certain gains derived by a REIT from dealer property or inventory, we may hold some of our assets through a TRS or other subsidiary corporations that will be subject to corporate level income tax at regular rates. In addition, if we lend money to a TRS, the TRS may be unable to deduct all or a portion of the interest paid to us, which could result in an even higher corporate level tax liability. Any of these taxes would decrease cash available for distribution to our stockholders.
REIT distribution requirements could adversely affect our ability to execute our business plan.
We generally must distribute annually at least 90% of our taxable income, subject to certain adjustments and excluding any net capital gain, in order for federal corporate income tax not to apply to earnings that we distribute. To the extent that we satisfy this distribution requirement, but distribute less than 100% of our taxable income, we will be subject to federal corporate income tax on our undistributed taxable income. In addition, we will be subject to a non-deductible 4% excise tax if the actual amount that we pay out to our stockholders in a calendar year is less than 85% of our taxable income. We intend to make distributions to our stockholders to comply with the REIT requirements of the Code.
From time to time, we may generate taxable income greater than our income for financial reporting purposes prepared in accordance with GAAP, or differences in timing between the recognition of taxable income and the actual receipt of cash may occur. For example, we may be required to accrue income from MBS and other types of debt securities or interests in debt securities before we receive any payments of interest or principal on such assets. We may also acquire discounted debt investments that are subsequently modified by agreement with the borrower. If such arrangements constitute “significant modifications” of such debt under the applicable Treasury regulations, the modified debt may be considered to have been reissued to us in a debt-for-debt exchange with the borrower, with gain recognized by us to the extent that the principal amount of the modified debt exceeds our cost of purchasing it prior to modification.
16
As a result, we may find it difficult or impossible to meet distribution requirements in certain circumstances. In particular, where we experience differences in timing between the recognition of taxable income and the actual receipt of cash, the requirement to distribute a substantial portion of our taxable income could cause us to: (i) sell assets in adverse market conditions, (ii) borrow on unfavorable terms, (iii) distribute amounts that would otherwise be invested in future acquisitions, capital expenditures or repayment of debt, in order to comply with REIT requirements, or (iv) make taxable distributions of our capital stock or debt securities. These alternatives could increase our costs or reduce our equity. Thus, compliance with the REIT requirements may hinder our ability to grow, which could adversely affect the value of our common stock.
Complying with REIT requirements may cause us to forgo otherwise attractive opportunities.
To qualify as a REIT for federal income tax purposes, we must continually satisfy tests concerning, among other things, the sources of our income, the nature and diversification of our assets, the amounts that we distribute to our stockholders and the ownership of our stock. We may be required to make distributions to stockholders at disadvantageous times or when we do not have funds readily available for distribution, and may be unable to pursue investments that would be otherwise advantageous to us in order to satisfy the source-of-income or asset-diversification requirements for qualifying as a REIT. In addition, in certain cases, the modification of a debt instrument or, potentially, an increase in the value of a debt instrument that we acquired at a significant discount, could result in the conversion of the instrument from a qualifying real estate asset to a wholly or partially non-qualifying asset that must be contributed to a TRS or disposed of in order for us to qualify or maintain our qualification as a REIT. Thus, compliance with the REIT requirements may hinder our ability to make and, in certain cases, to maintain ownership of, certain attractive investments.
Complying with REIT requirements may force us to liquidate otherwise attractive investments.
To qualify as a REIT, we must ensure that at the end of each calendar quarter, at least 75% of the value of our assets consists of cash, cash items, government securities and qualified REIT real estate assets, including certain mortgage loans and certain kinds of MBS. The remainder of our investment in securities (other than government securities, TRSs and qualified real estate assets) generally cannot include more than 10% of the outstanding voting securities of any one issuer or more than 10% of the total value of the outstanding securities of any one issuer. In addition, in general, no more than 5% of the value of our assets (other than government securities, TRSs and qualified real estate assets) can consist of the securities of any one issuer, and no more than 25% (20% for taxable years beginning after December 31, 2017) of the value of our total securities can be represented by securities of one or more TRSs. If we fail to comply with these requirements at the end of any calendar quarter, we must correct the failure within 30 days after the end of the calendar quarter or qualify for certain statutory relief provisions to avoid losing our REIT qualification and suffering adverse tax consequences. As a result, we may be required to liquidate from our investment portfolio otherwise attractive investments. For example, in certain cases, the modification of a debt instrument or, potentially, an increase in the value of a debt instrument that we acquired at a significant discount, could result in the conversion of the instrument from a qualifying real estate asset to a wholly or partially non-qualifying asset that must be liquidated in order for us to qualify or maintain our qualification as a REIT. These actions could have the effect of reducing our income and amounts available for distribution to our stockholders.
The failure of assets subject to repurchase agreements to qualify as real estate assets could adversely affect our ability to qualify as a REIT.
In order to finance some of our assets that we hold or acquire, we may enter into repurchase agreements, including with persons who sell us those assets. Under a repurchase agreement, we will nominally sell certain of our assets to a counterparty and simultaneously enter into an agreement to repurchase those sold assets. Although the tax treatment of repurchase transactions is unclear, we take the position that we are treated for U.S. federal income tax purposes as the owner of those assets that are the subject of any such repurchase agreement notwithstanding that we may transfer record ownership of those assets to the counterparty during the term of any such agreement. Because we enter into repurchase agreements the tax treatment of which is unclear, the IRS could assert, particularly in respect of our repurchase agreements with persons who sell us the assets that we wish to finance by way of repurchase agreements, that we did not own those assets during the term of the repurchase agreements, in which case we could fail to qualify as a REIT.
Our capital loss carry forward for tax purposes may expire before we can fully use it to offset otherwise taxable income or gains.
For U.S. federal income tax purposes, we have incurred a net capital loss during our taxable year ending on
December 31, 2015
. Such net capital loss may be carried forward for five taxable years and generally used to offset taxable net capital gains realized during the carry forward period. Net capital losses realized in 2013, 2014 and 2015 totaling
$(579,322)
,
$(341,850)
and
$(5,175)
, respectively, will be available to offset future capital gains realized through 2018, 2019 and 2020, respectively. Any capital loss carry forward that we have not used to offset otherwise taxable net capital gains will expire after the end of such five-
17
year period, and will no longer be available to us. Our capital loss carry forward may expire before we can fully use it because, for example, we do not generate enough taxable net capital gains during that period. In the absence of offsetting net capital loss carry forward amounts, we will be required to make timely distributions of future net capital gains realized, or alternatively, pay U.S. federal income tax on such realized net capital gains not distributed.
We may be required to report taxable income for certain investments in excess of the economic income we ultimately realize from them.
We may acquire debt instruments in the secondary market for less than their face amount. The discount at which such debt instruments are acquired may reflect doubts about their ultimate collectability rather than current market interest rates. The amount of such discount will nevertheless generally be treated as “market discount” for federal income tax purposes. Accrued market discount is reported as income when, and to the extent that, any payment of principal of the debt instrument is made. If we collect less on the debt instrument than our purchase price plus the market discount we had previously reported as income, we may not be able to benefit from any offsetting loss deductions. Some of the debt instruments that we acquire may have been issued with original issue discount. We are required to report such original issue discount based on a constant yield method and will be taxed based on the assumption that all future projected payments due on such debt instruments will be made. If such debt instruments or MBS turn out not to be fully collectible, an offsetting loss deduction will become available only in the later year that uncollectability is provable.
In addition, we may acquire debt instruments that are subsequently modified by agreement with the borrower. If the amendments to the outstanding instrument are “significant modifications” under the applicable Treasury regulations, the modified instrument is considered to have been reissued to us in a debt-for-debt exchange with the borrower. In that event, we may be required to recognize taxable gain to the extent the principal amount of the modified instrument exceeds our adjusted tax basis in the unmodified instrument, even if the value of the instrument or the payment expectations have not changed. Following such a taxable modification, we would hold the modified loan with a cost basis equal to its principal amount for federal tax purposes.
Finally, in the event that any debt instruments acquired by us are delinquent as to mandatory principal and interest payments, or in the event payments with respect to a particular instrument are not made when due, we may nonetheless be required to continue to recognize the unpaid interest as taxable income as it accrues, despite doubt as to its ultimate collectability. Similarly, we may be required to accrue interest income with respect to debt instruments at its stated rate regardless of whether corresponding cash payments are received or are ultimately collectible. In each case, while we would in general ultimately have an offsetting loss deduction available to us when such interest was determined to be uncollectible, the utility of that deduction could depend on our having taxable income in that later year or thereafter.
Distributions to tax-exempt investors may be classified as unrelated business taxable income.
Neither ordinary nor capital gain distributions with respect to our common stock nor gain from the sale of common stock should generally constitute unrelated business taxable income to a tax-exempt investor. However, there are certain exceptions to this rule, including: (i) part of the income and gain recognized by certain qualified employee pension trusts with respect to our common stock may be treated as unrelated business taxable income if shares of our common stock are predominantly held by qualified employee pension trusts, and we are required to rely on a special look-through rule for purposes of meeting one of the REIT ownership tests, and we are not operated in a manner to avoid treatment of such income or gain as unrelated business taxable income; (ii) part of the income and gain recognized by a tax-exempt investor with respect to our common stock would constitute unrelated business taxable income if the investor incurs debt in order to acquire the common stock; (iii) part or all of the income or gain recognized with respect to our common stock by social clubs, voluntary employee benefit associations, supplemental unemployment benefit trusts and qualified group legal services plans which are exempt from federal income taxation under the Code may be treated as unrelated business taxable income; and (iv) to the extent that we are (or a part of us, or a disregarded subsidiary of ours, is) a “taxable mortgage pool,” or if we hold residual interests in a real estate mortgage investment conduit (“REMIC”), a portion of the distributions paid to a tax-exempt stockholder that is allocable to excess inclusion income may be treated as unrelated business taxable income.
The “taxable mortgage pool” rules may increase the taxes that we or our stockholders may incur, and may limit the manner in which we effect future securitizations.
Securitizations could result in the creation of taxable mortgage pools for federal income tax purposes. As a REIT, so long as we own 100% of the equity interests in a taxable mortgage pool, we generally would not be adversely affected by the characterization of the securitization as a taxable mortgage pool. Certain categories of stockholders, however, such as foreign stockholders eligible for treaty or other benefits, stockholders with net operating losses and certain tax-exempt stockholders that are subject to unrelated business income tax, could be subject to increased taxes on a portion of their distribution income from us
18
that is attributable to the taxable mortgage pool. In addition, to the extent that our stock is owned by tax-exempt “disqualified organizations,” such as certain government-related entities and charitable remainder trusts that are not subject to tax on unrelated business income, we may incur a corporate level tax on a portion of our income from the taxable mortgage pool. In that case, we will reduce the amount of our distributions to any disqualified organization whose stock ownership gave rise to the tax. Moreover, we would be precluded from selling equity interests in these securitizations to outside investors, or selling any debt securities issued in connection with these securitizations that might be considered to be equity interests for tax purposes. These limitations may prevent us from using certain techniques to maximize our returns from securitization transactions.
We may incur excess inclusion income that would increase the tax liability of our stockholders or the Company.
In general, dividend income that a tax-exempt entity receives from us should not constitute unrelated business taxable income as defined in Section 512 of the Code. If we realize excess inclusion income and allocate it to stockholders, however, then this income would be fully taxable as unrelated business taxable income under Section 512 of the Code. If the stockholder is foreign, it would generally be subject to U.S. federal income tax withholding on this income without reduction pursuant to any otherwise applicable income tax treaty. U.S. stockholders would not be able to offset such income with their operating losses. If our stock is held in record name by “disqualified organizations” (generally government entities and certain tax-exempt investors, such as certain state pension plans and charitable remainder trusts, that are not subject to the tax on unrelated business taxable income), the Company must pay tax at the highest corporate rate on any excess inclusion income attributable to such disqualified organization investors. That tax would reduce our taxable REIT income.
We generally structure our borrowing arrangements in a manner designed to avoid generating significant amounts of excess inclusion income. However, excess inclusion income could result if we held a residual interest in a REMIC. Excess inclusion income also may be generated if we were to issue debt obligations with two or more maturities and the terms of the payments on these obligations bore a relationship to the payments that we received on our Agency Securities securing those debt obligations. For example, we may engage in non-REMIC CMO securitizations. We also enter into various repurchase agreements that have differing maturity dates and afford the lender the right to sell any pledged mortgage securities if we default on our obligations. These transactions may give rise to excess inclusion income that requires allocation among our stockholders. We may invest in equity securities of other REITs and it is possible that we might receive excess inclusion income from those investments. Some types of entities, including, without limitation, voluntarily employee benefit associations and entities that have borrowed funds to acquire their shares of our stock, may be required to treat a portion of or all of the dividends they receive from us as unrelated business taxable income.
To the extent we invest in construction loans, we may fail to qualify as a REIT if the IRS successfully challenges our estimates of the fair market value of land improvements that will secure those loans.
We may invest in construction loans, the interest from which will be qualifying income for purposes of the REIT income tests, provided that the loan value of the real property securing the construction loan is equal to or greater than the highest outstanding principal amount of the construction loan during any taxable year. For purposes of construction loans, the loan value of the real property is the fair market value of the land plus the reasonably estimated cost of the improvements or developments (other than personal property), which will secure the loan and which are to be constructed from the proceeds of the loan. There can be no assurance that the IRS would not successfully challenge our estimate of the loan value of the real property and our treatment of the construction loans for purposes of the REIT income and assets tests, which may cause us to fail to qualify as a REIT.
Liquidation of assets may jeopardize our REIT qualification or create additional tax liability for us.
To qualify as a REIT, we must comply with requirements regarding the composition of our assets and our sources of income. If we are compelled to liquidate our investments to repay obligations to our lenders, we may be unable to comply with these requirements, ultimately jeopardizing our qualification as a REIT, or we may be subject to a 100% tax on any resultant gain if we sell assets that are treated as dealer property or inventory.
The tax on prohibited transactions limits our ability to engage in transactions, including certain methods of securitizing mortgage loans, which would be treated as prohibited transactions for federal income tax purposes.
Net income that we derive from a prohibited transaction is subject to a 100% tax. The term “prohibited transaction” generally includes a sale or other disposition of property (including mortgage loans, but other than foreclosure property, as discussed below) that is held primarily for sale to customers in the ordinary course of a trade or business by us or by a borrower that has issued a shared appreciation mortgage or similar debt instrument to us. We might be subject to this tax if we were to dispose of or securitize loans in a manner that was treated as a prohibited transaction for federal income tax purposes.
19
We conduct our operations so that no asset that we own (or are treated as owning) will be treated as, or as having been, held for sale to customers, and that a sale of any such asset will not be treated as having been in the ordinary course of our business. As a result, we may choose not to engage in certain sales of loans at the REIT level, and may limit the structures we utilize for our securitization transactions, even though the sales or structures might otherwise be beneficial to us. In addition, whether property is held “primarily for sale to customers in the ordinary course of a trade or business” depends on the particular facts and circumstances. No assurance can be given that any property that we sell will not be treated as property held for sale to customers, or that we can comply with certain safe-harbor provisions of the Code that would prevent such treatment. The 100% tax does not apply to gains from the sale of property that is held through a TRS or other taxable corporation, although such income will be subject to tax in the hands of the corporation at regular corporate rates. We structure our activities to avoid prohibited transaction characterization.
Complying with REIT requirements may force us to borrow to make distributions to our stockholders.
As a REIT, we must distribute at least 90% of our annual REIT taxable income (excluding net capital gains) to our stockholders. From time to time, we may generate taxable income greater than our net income for financial reporting purposes from, among other things, the non-taxable unrealized changes in the value of our derivatives, or our taxable income may be greater than our cash flow available for distribution to our stockholders. If we do not have other funds available in these situations, we may be unable to distribute 90% of our taxable income as required by the REIT rules. Thus, we could be required to borrow funds, sell a portion of our assets at disadvantageous prices or find another alternative source of funds. These alternatives could increase our costs or reduce our equity and reduce amounts available to invest in Agency Securities.
ERISA Tax Risks
Plans should consider ERISA risks of investing in our common stock.
Investment in our common stock may not be appropriate for a pension, profit-sharing, employee benefit, or retirement plan, considering the plan’s particular circumstances, under the fiduciary standards of ERISA, or other applicable similar laws including standards with respect to prudence, diversification and delegation of control and the prohibited transaction provisions of ERISA, the Code and any applicable similar laws.
ERISA and Section 4975 of the Code prohibit certain transactions that involve (i) certain pension, profit-sharing, employee benefit, or retirement plans or individual retirement accounts and (ii) any person who is a “party in interest” or “disqualified person” with respect to such plan. Consequently, the fiduciary of a plan contemplating an investment in our common stock should consider whether its company, any other person associated with the issuance of its common stock or any affiliate of the foregoing is or may become a “party in interest” or “disqualified person” with respect to the plan and, if so, whether an exemption from such prohibited transaction rules is applicable.
ERISA may limit our ability to attract capital from Benefit Plan Investors.
It is unlikely that we will qualify as an operating company for purposes of ERISA. Consequently, in order to avoid our assets being deemed to include so-called “plan assets” under ERISA, we will initially limit equity ownership in us by Benefit Plan Investors to less than 25% of the value of each class or series of capital stock issued by us and to prohibit transfers of our common stock to Benefit Plan Investors. Our charter prohibits Benefit Plan Investors from holding any interest in any shares of our capital stock that are not publicly traded. These restrictions on investments in us by Benefit Plan Investors (and certain similar investors) may adversely affect the ability of our stockholders to transfer their shares of our common stock and our ability to attract private equity capital in the future.
Risks Related to Our Common Stock
The performance of our common stock correlates to the performance of our REIT investments, which may be speculative and aggressive compared to other types of investments.
The investments we make in accordance with our investment objectives may result in a greater amount of risk as compared to alternative investment options, including relatively higher risk of volatility or loss of principal. Our investments may be speculative and aggressive, and therefore an investment in our common stock may not be suitable for someone with lower risk tolerance.
One of the factors that investors may consider in deciding whether to buy or sell shares of our common stock is our distribution rate as a percentage of the trading price of our common stock relative to market interest rates. If the market price of
20
our common stock is based primarily on the earnings and return that we derive from our investments and income with respect to our investments and our related distributions to stockholders, and not from the market value of the investments themselves, then interest rate fluctuations and capital market conditions are likely to affect adversely the market price of our common stock. For instance, if market rates rise without an increase in our distribution rate, the market price of our common stock could decrease as potential investors may require a higher distribution yield on our common stock or seek other securities paying higher distributions or interest. In addition, rising interest rates would result in increased interest expense on our variable rate debt, thereby reducing cash flow and our ability to service our indebtedness and pay distributions.
Future offerings of debt securities, which would rank senior to our common stock upon our liquidation, and future offerings of equity securities, which would dilute our existing stockholders and may be senior to our common stock for the purposes of dividend and liquidating distributions, may adversely affect the market price of our common stock.
In the future, we may raise capital through the issuance of debt or equity securities. Upon liquidation, holders of our debt securities and preferred stock, if any, and lenders with respect to other borrowings will be entitled to our available assets prior to the holders of our common stock. Additional equity offerings may dilute the holdings of our existing stockholders or reduce the market price of our common stock, or both. Additional series of preferred stock, if issued, could have a preference on liquidating distributions or a preference on dividend payments that could limit our ability to pay dividends to the holders of our common stock. Sales of substantial amounts of our common stock (including shares of our common stock issued pursuant to our 2009 Stock Incentive Plan), or the perception that these sales could occur, could have a material adverse effect on the price of our common stock. Because our decision to issue debt or equity securities in any future offering will depend on market conditions and other factors beyond our control, we cannot predict or estimate the amount, timing or nature of our future offerings. Thus holders of our common stock bear the risk of our future offerings reducing the market price of our common stock and diluting the value of their stock holdings in us.
There are significant restrictions on ownership of our common stock.
In order for us to maintain our qualification as a REIT under the Code, not more than 50% in value of the issued and outstanding shares of our capital stock may be owned, actually or constructively, by five or fewer individuals (as defined in the Code to include certain entities) at any time during the last half of each taxable year (other than our first year as a REIT). This test is known as the “5/50 test.” Attribution rules in the Code apply to determine if any individual actually or constructively owns our capital stock for purposes of this requirement, including, without limitation, a rule that deems, in certain cases, a certain holder of a warrant or option to purchase stock as owning the shares underlying such warrant or option and a rule that treats shares owned (or treated as owned, including shares underlying warrants) by entities in which an individual has a direct or indirect interest as if they were owned by such individual. Additionally, at least 100 persons must beneficially own our capital stock during at least 335 days of each taxable year (other than our first year as a REIT). While we believe that we meet the 5/50 test, no assurance can be given that we will continue to meet this test.
Our charter prohibits beneficial or constructive ownership by any person of more than 9.8% in value or in number of shares, whichever is more restrictive, of the outstanding shares of our common stock or all classes of our capital stock. Additionally, our charter prohibits beneficial or constructive ownership of our stock that would otherwise result in our failure to qualify as a REIT. In each case, such prohibition includes a prohibition on owning warrants or options to purchase stock if ownership of the underlying stock would cause the holder or beneficial owner to exceed the prohibited thresholds. The ownership rules in our charter are complex and may cause the outstanding stock owned by a group of related individuals or entities to be deemed to be owned by one individual or entity. As a result, these ownership rules could cause an individual or entity to unintentionally own shares beneficially or constructively in excess of our ownership limits. Any attempt to own or transfer shares of our common or preferred stock, in excess of our ownership limits without the consent of our board of directors shall be void, and will result in the shares being transferred to a charitable trust. These provisions may inhibit market activity and the resulting opportunity for our stockholders to receive a premium for their shares that might otherwise exist if any person were to attempt to assemble a block of shares of our stock in excess of the number of shares permitted under our charter and which may be in the best interests of our stockholders. We may grant waivers from the 9.8% charter restriction for holders where, based on representations, covenants and agreements received from certain equity holders, we determine that such waivers would not jeopardize our status as a REIT.
None.
21
We do not own or lease any real estate or other physical properties. Pursuant to the Management Agreement, ACM maintains our executive offices at 3001 Ocean Drive, Suite 201, Vero Beach, Florida 32963. We consider our current office space adequate for our current operations.
Our company and ACM are not currently subject to any legal proceedings, as described in Item 103 of Regulation S-K.
Not applicable.
22
Our Series A Preferred Stock, Series B Preferred Stock and our common stock are currently listed on the NYSE under the symbols “ARR-PA,” “ARR-PB” and “ARR,” respectively. On
February 17, 2016
, the per share price of our common stock as reported on the NYSE was
$18.88
. All per share amounts, common shares outstanding and stock-based compensation amounts for all periods presented reflect our Reverse Stock Split, which was effective July 31, 2015.
The following table sets forth the range of high and low closing prices for our securities for the periods indicated as reported by the NYSE.
|
Quarter ended
|
Series A Preferred Stock
|
Series B Preferred Stock
|
Common Stock
|
|||||||||||||||||||||
|
|
High
|
Low
|
High
|
Low
|
High
|
Low
|
||||||||||||||||||
|
December 31, 2015
|
$
|
23.12
|
|
$
|
22.02
|
|
$
|
21.99
|
|
$
|
20.08
|
|
$
|
21.84
|
|
$
|
19.61
|
|
||||||
|
September 30, 2015
|
$
|
23.48
|
|
$
|
21.58
|
|
$
|
22.83
|
|
$
|
21.30
|
|
$
|
23.28
|
|
$
|
19.69
|
|
||||||
|
June 30, 2015
|
$
|
24.95
|
|
$
|
23.00
|
|
$
|
24.08
|
|
$
|
22.29
|
|
$
|
25.68
|
|
$
|
22.48
|
|
||||||
|
March 31, 2015
|
$
|
25.25
|
|
$
|
24.45
|
|
$
|
24.20
|
|
$
|
23.65
|
|
$
|
29.84
|
|
$
|
24.72
|
|
||||||
|
December 31, 2014
|
$
|
25.50
|
|
$
|
24.40
|
|
$
|
24.43
|
|
$
|
23.60
|
|
$
|
32.56
|
|
$
|
28.96
|
|
||||||
|
September 30, 2014
|
$
|
25.66
|
|
$
|
25.07
|
|
$
|
24.64
|
|
$
|
23.93
|
|
$
|
24.80
|
|
$
|
30.80
|
|
||||||
|
June 30, 2014
|
$
|
25.51
|
|
$
|
24.87
|
|
$
|
24.65
|
|
$
|
23.83
|
|
$
|
35.44
|
|
$
|
33.04
|
|
||||||
|
March 31, 2014
|
$
|
25.26
|
|
$
|
22.06
|
|
$
|
24.49
|
|
$
|
20.54
|
|
$
|
34.88
|
|
$
|
31.84
|
|
||||||
Holders of Common Equity
As of
February 17, 2016
, we had
156
stockholders of record of our outstanding common stock. We believe that there are more beneficial owners of shares of our common stock.
Dividend Policy
We intend to continue to make regular cash distributions to holders of shares of common stock. Future dividends will be at the discretion of the Board and will depend on our earnings and financial condition, maintenance of our REIT qualification, restrictions on making distributions under MGCL and such other factors as our Board deems relevant. Dividends cannot be paid on our common stock unless we have paid full cumulative dividends on both classes of our preferred stock. For the year ended
December 31, 2015
, we paid full cumulative dividends on our Series A Preferred Stock and our Series B Preferred Stock.
For historical information on the frequency and amount of cash dividends paid to the holders of shares of our common stock and preferred stock, see
Note 11
to the consolidated financial statements.
Our REIT taxable income and dividend requirements are determined on an annual basis. Total dividend payments to common stockholders were
$167,142
and dividend payments to preferred stockholders were
$15,622
, respectively, for the year ended
December 31, 2015
. Our estimated REIT taxable income available to pay dividends was
$144,192
for the year ended
December 31, 2015
. Dividends in excess of REIT taxable income for the year (including taxable income carried forward from the previous year) will generally not be taxable to common stockholders. The portion of the dividends on our common stock which represented non-taxable return of capital was approximately
22.88%
in 2015,
14.29%
in 2014 and
19.39%
in 2013.
Stock Repurchase Program
The following table presents information regarding our common stock repurchases made during the year ended
December 31, 2015
.
23
|
Total Number of Shares Purchased (1)
|
Per Share Price (2)
|
Total Number of Shares Purchased as Part of Publicly Announced Plans or Programs
|
Maximum Number of Shares That May Yet Be Purchased Under the Publicly Announced Plans or Programs
|
|||||||||
|
March 5, 2015 through March 13, 2015
|
109
|
|
$
|
25.60
|
|
109
|
|
5,540
|
||||
|
May 1, 2015 through May 29, 2015
|
170
|
|
$
|
24.56
|
|
170
|
|
5,370
|
||||
|
June 1, 2015 through June 9, 2015
|
105
|
|
$
|
23.92
|
|
105
|
|
5,265
|
||||
|
August 11, 2015 through August 31, 2015
|
273
|
|
$
|
21.40
|
|
273
|
|
8,727
|
||||
|
September 17, 2015 through September 30, 2015
|
1,495
|
|
$
|
20.48
|
|
1,495
|
|
7,232
|
||||
|
October 1, 2015 through October 16, 2015
|
2,191
|
|
$
|
21.01
|
|
2,191
|
|
5,041
|
||||
|
December 1, 2015 through December 31, 2015
|
3,167
|
|
$
|
21.34
|
|
3,167
|
|
1,874
|
||||
|
Total
|
7,510
|
|
$
|
21.25
|
|
7,510
|
|
|||||
(1) All shares were repurchased pursuant to our Repurchase Program (see
Note 11
to the consolidated financial statements).
(2) Weighted average price.
Performance Graph
The following graph compares the stockholder’s cumulative total return, assuming $100 invested at December 31, 2010, with all reinvestment of dividends, such as if such amounts had been invested in: (i) our common stock; (ii) the stocks included in the S&P 500 and (iii) the stocks included in the NAREIT Mortgage REIT Index.

24
|
Period Ending
|
||||||||||||||||||||||||
|
Index
|
12/31/10
|
12/30/11
|
12/31/12
|
12/31/13
|
12/31/14
|
12/31/15
|
||||||||||||||||||
|
FTSE NAREIT Mortgage Total Return Index
|
$
|
100.00
|
|
$
|
97.58
|
|
$
|
116.99
|
|
$
|
114.70
|
|
$
|
135.21
|
|
$
|
123.21
|
|
||||||
|
S&P 500 Total Return Index
|
$
|
100.00
|
|
$
|
102.11
|
|
$
|
118.45
|
|
$
|
156.82
|
|
$
|
178.28
|
|
$
|
180.75
|
|
||||||
|
ARMOUR Residential REIT
|
$
|
100.00
|
|
$
|
109.25
|
|
$
|
118.60
|
|
$
|
86.19
|
|
$
|
91.44
|
|
$
|
80.00
|
|
||||||
The information in the performance graph and table has been obtained from sources believed to be reliable, but neither its accuracy nor its completeness can be guaranteed. The historical information set forth above is not necessarily indicative of future performance. Accordingly, we do not make or endorse any predictions as to future performance.
25
The following table sets forth selected historical financial information derived from our audited consolidated financial statements for the years listed. The following data should be read in conjunction with “Management’s Discussion and Analysis of Financial Condition and Results of Operations” and our consolidated financial statements including the notes thereto, included elsewhere in this Annual Report on Form 10-K and in our previous Annual Reports on Form 10-K. All per share amounts, common shares outstanding and stock-based compensation amounts for all periods presented reflect our Reverse Stock Split, which was effective July 31, 2015.
|
|
December
31, 2015
|
December 31, 2014
|
December 31, 2013
|
December 31, 2012
|
December 31, 2011
|
||||||||||||||
|
Balance Sheet Data:
|
|
|
|
|
|
|
|||||||||||||
|
Agency Securities, available for sale
|
$
|
12,461,556
|
|
$
|
15,297,529
|
|
$
|
14,648,178
|
|
$
|
19,096,562
|
|
$
|
5,393,675
|
|
||||
|
Total Assets
|
$
|
13,055,277
|
|
$
|
16,285,798
|
|
$
|
15,732,517
|
|
$
|
20,878,878
|
|
$
|
6,207,747
|
|
||||
|
Repurchase agreements
|
$
|
11,570,481
|
|
$
|
13,881,921
|
|
$
|
13,151,504
|
|
$
|
18,366,095
|
|
$
|
5,335,962
|
|
||||
|
Total Stockholders' Equity
|
$
|
1,225,166
|
|
$
|
1,749,291
|
|
$
|
1,901,228
|
|
$
|
2,307,775
|
|
$
|
626,606
|
|
||||
|
Statement of Operations Data:
|
|
|
|
|
|
|
|||||||||||||
|
Interest income, net of amortization of premium on Agency Securities
|
$
|
365,300
|
|
$
|
450,927
|
|
$
|
505,443
|
|
$
|
388,994
|
|
$
|
117,638
|
|
||||
|
Interest expense-repurchase agreements
|
(59,278
|
)
|
(59,562
|
)
|
(83,113
|
)
|
(61,195
|
)
|
(11,856
|
)
|
|||||||||
|
Interest expense-U.S. Treasury Securities sold short
|
—
|
|
(5,551
|
)
|
(1,437
|
)
|
—
|
|
—
|
|
|||||||||
|
Net Interest Income
|
$
|
306,022
|
|
$
|
385,814
|
|
$
|
420,893
|
|
$
|
327,799
|
|
$
|
105,782
|
|
||||
|
Total Other Loss
|
(300,278
|
)
|
(527,264
|
)
|
(570,796
|
)
|
(80,143
|
)
|
(105,462
|
)
|
|||||||||
|
Total Expenses
|
(36,949
|
)
|
(37,598
|
)
|
(37,151
|
)
|
(25,374
|
)
|
(9,711
|
)
|
|||||||||
|
Income tax benefit (expense)
|
—
|
|
—
|
|
10
|
|
24
|
|
(51
|
)
|
|||||||||
|
Net Income (Loss)
|
$
|
(31,205
|
)
|
$
|
(179,048
|
)
|
$
|
(187,044
|
)
|
$
|
222,306
|
|
$
|
(9,442
|
)
|
||||
|
Dividends declared on preferred stock
|
(15,622
|
)
|
(15,620
|
)
|
(14,213
|
)
|
(1,964
|
)
|
—
|
|
|||||||||
|
Net Income (Loss) available (related) to common stockholders
|
$
|
(46,827
|
)
|
$
|
(194,668
|
)
|
$
|
(201,257
|
)
|
$
|
220,342
|
|
$
|
(9,442
|
)
|
||||
|
Net Income (loss) per share – common stock, Basic
|
$
|
(1.09
|
)
|
$
|
(4.32
|
)
|
$
|
(4.40
|
)
|
$
|
7.92
|
|
$
|
(1.20
|
)
|
||||
|
Net Income (loss) per share- common stock, Diluted
|
$
|
(1.09
|
)
|
$
|
(4.32
|
)
|
$
|
(4.40
|
)
|
$
|
7.84
|
|
$
|
(1.20
|
)
|
||||
|
Weighted average common shares outstanding- Basic
|
42,780
|
|
44,654
|
|
45,354
|
|
27,953
|
|
7,678
|
|
|||||||||
|
Weighted average common shares outstanding- Diluted
|
42,780
|
|
44,654
|
|
45,354
|
|
28,033
|
|
7,678
|
|
|||||||||
|
Cash dividends paid per common share
|
$
|
3.89
|
|
$
|
4.80
|
|
$
|
6.48
|
|
$
|
9.60
|
|
$
|
11.28
|
|
||||
|
Key Portfolio Statistics *
|
|
|
|
|
|
|
|||||||||||||
|
Average Agency Securities (1)
|
$13,756,536
|
$
|
15,784,528
|
|
$
|
19,593,311
|
|
$
|
14,270,813
|
|
$
|
3,927,434
|
|
||||||
|
Average Repurchase Agreements (2)
|
$13,509,622
|
$
|
15,206,938
|
|
$
|
19,106,669
|
|
$
|
12,922,455
|
|
$
|
3,902,680
|
|
||||||
|
Average Portfolio Yield (3)
|
2.65
|
%
|
2.86
|
%
|
2.58
|
%
|
2.73
|
%
|
3.00
|
%
|
|||||||||
|
Average Cost of Funds (4)
|
1.26
|
%
|
1.36
|
%
|
1.19
|
%
|
0.96
|
%
|
0.94
|
%
|
|||||||||
|
Interest Rate Spread (5)
|
1.39
|
%
|
1.49
|
%
|
1.39
|
%
|
1.76
|
%
|
2.05
|
%
|
|||||||||
|
Return on Equity (6)
|
(2.55
|
)%
|
(10.24
|
)%
|
(9.84
|
)%
|
9.60
|
%
|
(2.00
|
)%
|
|||||||||
|
Average Annual Portfolio Repayment Rate (7)
|
8.51
|
%
|
6.16
|
%
|
10.03
|
%
|
11.90
|
%
|
13.20
|
%
|
|||||||||
|
Debt to Stockholders' Equity (8)
|
9.44:1
|
|
7.94:1
|
|
6.92:1
|
|
7.96:1
|
|
8.52:1
|
|
|||||||||
*All percentages represent daily weighted averages annualized.
26
|
(1)
|
Our daily average investment in Agency Securities was calculated by dividing the sum of our daily Agency Securities investments during the year by the number of days in the period.
|
|
(2)
|
Our daily average balance outstanding under our repurchase agreements was calculated by dividing the sum of our daily outstanding balances under our repurchase agreements during the year by the number of days in the period.
|
|
(3)
|
Our average portfolio yield was calculated by dividing our interest income by our average Agency Securities.
|
|
(4)
|
Our average cost of funds was calculated by dividing our total interest expense (including derivatives) by our average repurchase agreement borrowings.
|
|
(5)
|
Our interest rate spread was calculated by subtracting our average cost of funds from our average portfolio yield.
|
|
(6)
|
Our return on equity was calculated by dividing net income (loss) by equity.
|
|
(7)
|
Our average annual portfolio repayment rate is calculated by taking the actual CPR for a month and averaging it with the other CPRs from the same year.
|
|
(8)
|
Our debt-to-equity ratio was calculated by dividing the amount outstanding under our repurchase agreements at period end by total stockholders’ equity at period end.
|
You should read the following discussion and analysis of our financial condition and results of operations together with “Risk Factors,” and “Special Note Regarding Forward-Looking Statements,” that appear elsewhere in this Form 10-K. This discussion and analysis contains forward-looking statements that involve risks, uncertainties, and assumptions. Actual results may differ materially from those anticipated in these forward-looking statements as a result of various factors, including, but not limited to, those presented under “Risk Factors” included in this Form 10-K.
References to “we,” “us,” “our,” “ARMOUR” or the “Company” are to ARMOUR Residential REIT, Inc. References to “ACM” are to ARMOUR Capital Management LP, a Delaware limited partnership. Refer to the Glossary of Terms for definitions of capitalized terms and abbreviations used in this report.
All per share amounts, common shares outstanding and stock-based compensation amounts for all periods presented reflect our Reverse Stock Split, which was effective July 31, 2015.
U.S. dollar amounts are presented in thousands, except per share amounts or as otherwise noted.
Overview
We are a Maryland corporation formed to invest in and manage a leveraged portfolio of MBS and mortgage loans. The securities we invest in are issued or guaranteed by a GSE, such as Fannie Mae, Freddie Mac, or guaranteed by Ginnie Mae (collectively, “Agency Securities”). Our securities portfolio consists primarily of Agency Securities backed by fixed rate home loans. From time to time, a portion of our assets may be invested in Agency Securities backed by hybrid adjustable rate and adjustable rate home loans as well as unsecured notes and bonds issued by GSEs, U.S. Treasuries and money market instruments, subject to certain income tests we must satisfy for our qualification as a REIT. Our charter permits us to invest in Agency Securities and Non-Agency Securities.
We are externally managed by ACM, pursuant to the Management Agreement, which was most recently amended on February 23, 2015. ACM is an investment advisor registered with the SEC. ACM is also the external manager of JAVELIN, a publicly traded REIT, which invests in and manages a leveraged portfolio of Agency Securities and Non-Agency Securities. Our executive officers also serve as the executive officers of JAVELIN. Certain of our members of our Board also serve as members of the JAVELIN Board.
We seek attractive long-term investment returns by investing our equity capital and borrowed funds in our targeted asset class of Agency Securities. We earn returns on the spread between the yield on our assets and our costs, including the interest cost of the funds we borrow, after giving effect to our hedges. We identify and acquire Agency Securities, finance our acquisitions with borrowings under a series of short-term repurchase agreements at the most competitive interest rates available to us and then cost-effectively hedge our interest rate and other risks based on our entire portfolio of assets, liabilities and derivatives and our management’s view of the market. Successful implementation of this approach requires us to address interest rate risk, maintain adequate liquidity and effectively hedge interest rate risks. We believe that the residential mortgage market will undergo significant changes in the coming years as the role of GSEs, such as Fannie Mae and Freddie Mac, is diminished, which we expect will create attractive investment opportunities for us. We execute our business plan in a manner consistent with our intention of qualifying as a REIT under the Code and avoiding regulation as an investment company under the 1940 Act.
We have elected to be taxed as a REIT under the Code. We will generally not be subject to federal income tax to the extent that we distribute our taxable income to our stockholders and as long as we satisfy the ongoing REIT requirements under the Code including meeting certain asset, income and stock ownership tests.
27
Factors that Affect our Results of Operations and Financial Condition
Our results of operations and financial condition are affected by various factors, many of which are beyond our control, including, among other things, our net interest income, the market value of our assets and the supply of and demand for such assets. We invest in financial assets and markets. Recent events, such as those discussed below, can affect our business in ways that are difficult to predict and may produce results outside of typical operating variances. Our net interest income varies primarily as a result of changes in interest rates, borrowing costs and prepayment speeds, the behavior of which involves various risks and uncertainties. Prepayment rates, as reflected by the rate of principal pay downs and interest rates vary according to the type of investment, conditions in financial markets, government actions, competition and other factors, none of which can be predicted with any certainty. In general, as prepayment rates on our Agency Securities that are purchased at a premium increase, related purchase premium amortization increases, thereby reducing the net yield on such assets. Because changes in interest rates may significantly affect our activities, our operating results depend, in large part, upon our ability to manage interest rate risks and prepayment risks effectively while maintaining our status as a REIT.
For any period during which changes in the interest rates earned on our assets do not coincide with interest rate changes on our borrowings, such assets will tend to reprice more slowly than the corresponding liabilities. Consequently, changes in interest rates, particularly short-term interest rates, may significantly influence our net interest income. With the maturities of our assets generally of a longer term than those of our liabilities, interest rate increases will tend to decrease our net interest income and the market value of our assets (and therefore our book value). Such rate increases could possibly result in operating losses or adversely affect our ability to make distributions to our stockholders.
Prepayments on Agency Securities and the underlying mortgage loans may be influenced by changes in market interest rates and a variety of economic and geographic factors, policy decisions by regulators, as well as other factors beyond our control. Consequently, prepayment rates cannot be predicted with certainty. To the extent we hold Agency Securities acquired at a premium or discount to par, or face value, changes in prepayment rates may impact our anticipated yield. In periods of declining interest rates, prepayments on our Agency Securities will likely increase. If we are unable to reinvest the proceeds of such prepayments at comparable yields, our net interest income may decline. The recent climate of government intervention in the mortgage markets significantly increases the risk associated with prepayments.
While we use strategies to economically hedge some of our interest rate risk, we do not hedge all of our exposure to changes in interest rates and prepayment rates, as there are practical limitations on our ability to insulate our securities portfolio from all potential negative consequences associated with changes in short-term interest rates in a manner that will allow us to seek attractive net spreads on our securities portfolio. Also, since we have not elected to use cash flow hedge accounting, earnings reported in accordance with GAAP will fluctuate even in situations where our derivatives are operating as intended. As a result of this mark-to-market accounting treatment, our results of operations are likely to fluctuate far more than if we were to designate our derivative activities as cash flow hedges. Comparisons with companies that use cash flow hedge accounting for all or part of their derivative activities may not be meaningful. For these and other reasons more fully described under the section captioned “Derivative Instruments” below, no assurance can be given that our derivatives will have the desired beneficial impact on our results of operations or financial condition.
In addition to the use of derivatives to hedge interest rate risk, a variety of other factors relating to our business may also impact our financial condition and operating performance; these factors include
|
•
|
our degree of leverage;
|
|
•
|
our access to funding and borrowing capacity;
|
|
•
|
the REIT requirements under the Code; and
|
|
•
|
the requirements to qualify for an exemption under the 1940 Act and other regulatory and accounting policies related to our business.
|
Our Manager
See
Note 9
and
Note 14
to the consolidated financial statements.
28
Market and Interest Rate Trends and the Effect on our Securities Portfolio
Developments at Fannie Mae and Freddie Mac
The payments we receive on the Agency Securities in which we invest depend upon a steady stream of payments by borrowers on the underlying mortgages and the fulfillment of guarantees by GSEs. There can be no assurance that the U.S. Government's intervention in Fannie Mae and Freddie Mac will continue to be adequate for the longer-term viability of these GSEs. These uncertainties may lead to concerns about the availability of and trading market for Agency Securities in the long term. Accordingly, if the GSEs defaulted on their guaranteed obligations, suffered losses or ceased to exist, the value of our Agency Securities and our business, operations and financial condition could be materially and adversely affected.
The passage of any new federal legislation affecting Fannie Mae and Freddie Mac may create market uncertainty and reduce the actual or perceived credit quality of securities issued or guaranteed by them. If Fannie Mae and Freddie Mac were reformed or wound down, it is unclear what effect, if any, this would have on the value of the existing Fannie Mae and Freddie Mac Agency Securities. The foregoing could materially adversely affect the pricing, supply, liquidity and value of the Agency Securities in which we invest and otherwise materially adversely affect our business, operations and financial condition.
Short-term Interest Rates and Funding Costs
On December 16, 2015, the Fed raised its target range for the Federal Funds Rate to between 0.25% and 0.50%. On January 27, 2016, the Fed announced their decision to hold the same target range. Changes in Fed policy affect our financial results, since our cost of funds is largely dependent on short-term rates. An increase in our cost of funds without a corresponding increase in interest income earned on our Agency Securities would cause our net income to decline.
Historically, 30-day LIBOR has closely tracked movements in the Federal Funds Rate and the Effective Federal Funds Rate. The Effective Federal Funds Rate can differ from the Federal Funds Rate in that the Effective Federal Funds Rate represents the volume weighted average of interest rates at which depository institutions lend balances at the Fed to other depository institutions overnight (actual transactions, rather than target rate).
Our borrowings in the repurchase market have also historically closely tracked the Federal Funds Rate and LIBOR. Traditionally, a lower Federal Funds Rate has indicated a time of increased net interest margin and higher asset values. The difference between 30-day LIBOR and the Effective Federal Funds Rate can be quite volatile, with the spread alternately returning to more normal levels and then widening out again. Volatility in these rates and divergence from the historical relationship among these rates could negatively impact our ability to manage our securities portfolio. If rates were to increase as a result, our net interest margin and the value of our securities portfolio might suffer as a result.
29
The following graph shows 30-day LIBOR as compared to the Effective Federal Funds Rate on a monthly basis from
December 31, 2013
to
December 31, 2015
.

Long-term Interest Rates and Mortgage Spreads
Our Agency Securities are valued at an interest rate spread versus long-term interest rates (mortgage spread). This mortgage spread varies over time and can be above or below long-term averages, depending upon market participants' current desire to own Agency Securities over other investment alternatives. When the mortgage spread gets smaller (or negative) versus long-term interest rates, our book value will be positively affected. When this spread gets larger (or positive), our book value will be negatively affected.
Mortgage spreads can vary due to movements in Agency Securities valuations, movements in long-term interest rates or a combination of both. During the year ended December 31, 2015, interest rate swap rates declined more than U.S. Treasury interest rates, causing the interest rate swap spread to be negative to U.S. Treasury interest rates for certain longer tenors, an inversion of longstanding market norms. We mainly use interest rate swap contracts (including swaptions) to hedge against changes in the valuation of our Agency Securities. Therefore, this larger decline in interest rate swap rates, versus the increase in the valuation our Agency Securities, negatively impacted our book value for the year ended December 31, 2015. As of December 31, 2015, we have not entered into any contract or purchased any asset specifically designed to offset the impact of mortgage spreads on our book value.
30
Results of Operations
Net Income (Loss) Summary
The following is a summary of our consolidated results of operations:
|
For the Year Ended
|
Change vs. Prior Year
|
|||||||||||||||
|
December 31, 2015
|
December 31, 2014
|
December 31, 2013
|
2015
|
2014
|
||||||||||||
|
Net Interest Income
|
$
|
306,022
|
|
$
|
385,814
|
|
$
|
420,893
|
|
(20.68)%
|
|
(8.33)%
|
||||
|
Total Other Loss
|
(300,278
|
)
|
(527,264
|
)
|
(570,796
|
)
|
43.05%
|
7.63%
|
||||||||
|
Total Expenses
|
36,949
|
|
37,598
|
|
37,151
|
|
(1.73)%
|
1.20%
|
||||||||
|
Income tax benefit
|
—
|
|
—
|
|
10
|
|
||||||||||
|
Net Loss
|
$
|
(31,205
|
)
|
|
$
|
(179,048
|
)
|
|
$
|
(187,044
|
)
|
82.57%
|
4.27%
|
|||
|
Dividends declared on preferred stock
|
$
|
(15,622
|
)
|
$
|
(15,620
|
)
|
(14,213
|
)
|
(0.01)%
|
(9.90)%
|
||||||
|
Net Loss related to common stockholders
|
$
|
(46,827
|
)
|
$
|
(194,668
|
)
|
$
|
(201,257
|
)
|
75.95%
|
3.27%
|
|||||
|
Net Loss related per share to common, basic
|
$
|
(1.09
|
)
|
$
|
(4.32
|
)
|
$
|
(4.40
|
)
|
74.77%
|
1.82%
|
|||||
|
Net Loss related per share to common, diluted
|
$
|
(1.09
|
)
|
$
|
(4.32
|
)
|
$
|
(4.40
|
)
|
74.77%
|
1.82%
|
|||||
The main factors for the change in net loss for the year ended
December 31, 2015
, as compared to the year ended
December 31, 2014
, were the larger unrealized losses on derivatives in 2014 and the decrease in our securities portfolio in 2015 which lead to a decline in net interest income.
The decline in net loss in the year ended December 31, 2014 compared to the year ended 2013 was the result of the realized gains on Agency Security sales, which represented partial recoveries of other than temporary impairments recognized in 2014, which were largely offset by unrealized losses on derivatives in 2014 as compared to unrealized gains in 2013. Declining net interest income in 2014 was also a factor. These factors result largely from the trend of generally falling interest rates in 2014 compared to the trend of generally rising interest rates beginning in the second quarter of 2013. See also the graph of interest rates at the end of the following discussion of Net Interest Income (Loss).
Net Interest Income (Loss)
|
For the Year Ended
|
Change vs. Prior Year
|
|||||||||||||||
|
December 31, 2015
|
December 31, 2014
|
December 31, 2013
|
2015
|
2014
|
||||||||||||
|
Interest income, net of amortization of premium on Agency Securities
|
$
|
365,300
|
|
$
|
450,927
|
|
$
|
505,443
|
|
(18.99)%
|
(10.79)%
|
|||||
|
Interest expense- repurchase agreements
|
(59,278
|
)
|
(59,562
|
)
|
(83,113
|
)
|
0.48%
|
28.34%
|
||||||||
|
Interest expense- U.S. Treasury Securities sold short
|
—
|
|
(5,551
|
)
|
(1,437
|
)
|
100.00%
|
(286.29)%
|
||||||||
|
Net Interest Income
|
$
|
306,022
|
|
$
|
385,814
|
|
$
|
420,893
|
|
(20.68)%
|
(8.33)%
|
|||||
31
Net interest income is a function of both our securities portfolio size and net interest rate spread.
2015 vs.
2014
|
•
|
Our average securities portfolio decreased
12.8%
from
$15,784,528
at
December 31, 2014
to
$13,756,536
at
December 31, 2015
.
|
|
•
|
Our net interest rate spread decreased 10 basis points from
1.49%
at
December 31, 2014
to
1.39%
at
December 31, 2015
. Our average portfolio yield decreased
(0.21)%
and our cost of funds decreased
(0.10)%
year over year. The decrease in the interest rate spread from 2014 to 2015 combined with the decrease in our securities portfolio resulted in decreased net interest income.
|
|
•
|
There were no U.S. Treasury Securities sold short in 2015.
|
2014
vs.
2013
|
•
|
Our average securities portfolio decreased
19.4%
from
$19,593,311
at
December 31, 2013
to
$15,784,528
at
December 31, 2014
.
|
|
•
|
Our net interest rate spread increased from
1.39%
at
December 31, 2013
to
1.49%
at
December 31, 2014
. Our average portfolio yield increased
0.28%
while our cost of funds increased
0.17%
year over year. The increase in the interest rate spread from
2013
to
2014
was not not enough to offset the decrease in our securities portfolio.
|
|
•
|
Our interest expense on U.S. Treasury Securities sold short increased from
2013
to
2014
due to higher average coupon rates in
2014
of
2.37%
versus
1.75%
in
2013
for the particular U.S Treasury Securities we sold short, paired with higher average daily balances of
$233,562
in
2014
versus
$76,712
in
2013
.
|
At
December 31, 2015
and
December 31, 2014
, our Agency Securities in our securities portfolio were carried at a net premium to par value with a weighted average amortized cost of
104.9%
and
105.1%
, respectively, due to the average interest rates on these securities being higher than prevailing market rates.
The following table presents the components of the yield earned on our Agency Security portfolio for the quarterly periods presented.
|
Quarter Ended
|
Asset Yield
|
Cost of
Funds
|
Net Interest
Margin
|
Interest Expense on Repurchase Agreements
|
||||||||
|
December 31, 2015
|
2.71
|
%
|
1.13
|
%
|
1.58
|
%
|
0.52
|
%
|
||||
|
September 30, 2015
|
2.56
|
%
|
1.12
|
%
|
1.44
|
%
|
0.44
|
%
|
||||
|
June 30, 2015
|
2.60
|
%
|
1.24
|
%
|
1.36
|
%
|
0.40
|
%
|
||||
|
March 31, 2015
|
2.72
|
%
|
1.52
|
%
|
1.20
|
%
|
0.39
|
%
|
||||
|
December 31, 2014
|
2.71
|
%
|
1.44
|
%
|
1.27
|
%
|
0.40
|
%
|
||||
|
September 30, 2014
|
2.68
|
%
|
1.25
|
%
|
1.43
|
%
|
0.38
|
%
|
||||
|
June 30, 2014
|
2.86
|
%
|
1.40
|
%
|
1.46
|
%
|
0.39
|
%
|
||||
|
March 31, 2014
|
3.19
|
%
|
1.37
|
%
|
1.82
|
%
|
0.41
|
%
|
||||
|
December 31, 2013
|
2.98
|
%
|
1.38
|
%
|
1.60
|
%
|
0.43
|
%
|
||||
|
September 30, 2013
|
2.60
|
%
|
1.36
|
%
|
1.24
|
%
|
0.41
|
%
|
||||
|
June 30, 2013
|
2.52
|
%
|
1.14
|
%
|
1.38
|
%
|
0.43
|
%
|
||||
|
March 31, 2013
|
2.33
|
%
|
0.98
|
%
|
1.35
|
%
|
0.46
|
%
|
||||
32
The yield on our assets is most significantly affected by the rate of repayments on our Agency Securities. The following graph shows the annualized CPR on a monthly basis.
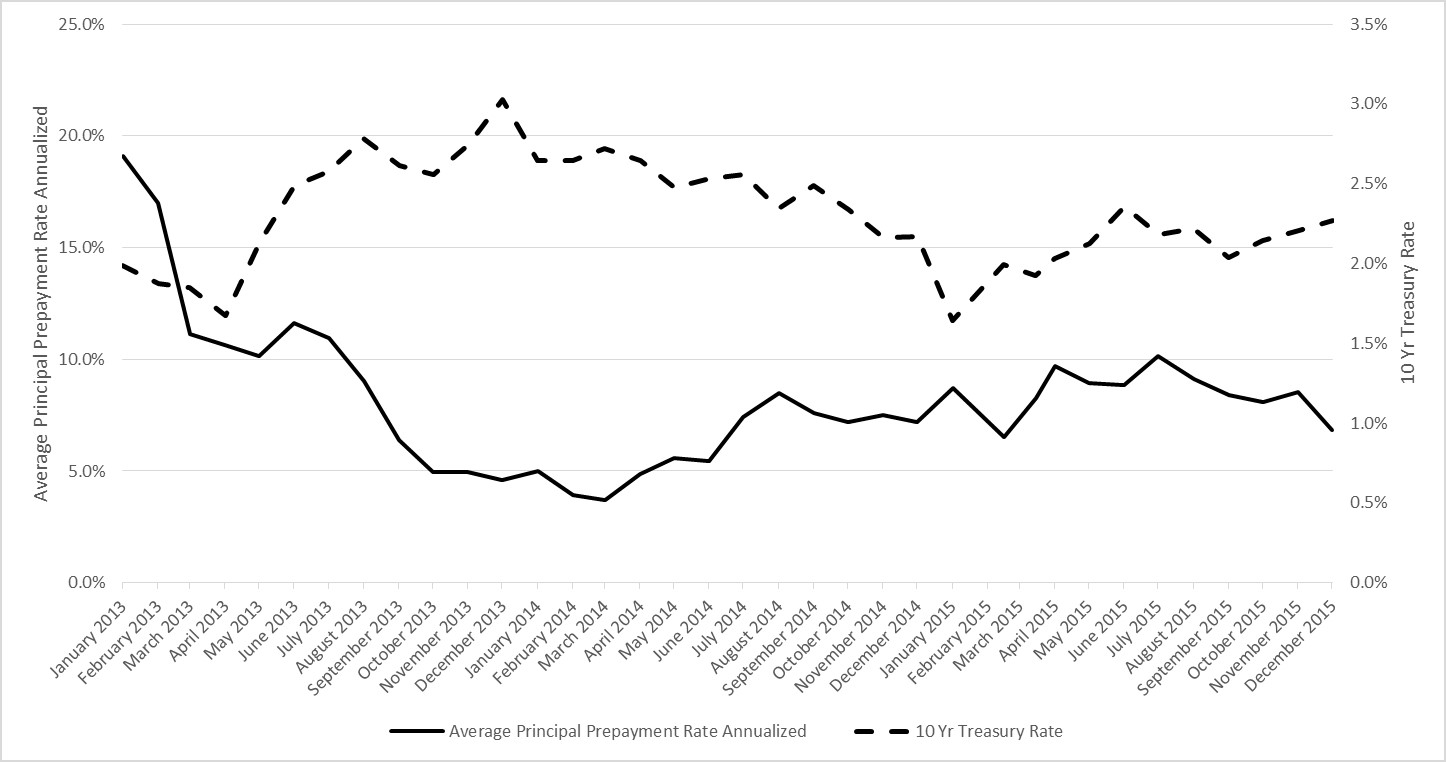
33
Other Income (Loss)
|
For the Year Ended
|
Change vs. Prior Year
|
|||||||||||||||
|
December 31, 2015
|
December 31, 2014
|
December 31, 2013
|
2015
|
2014
|
||||||||||||
|
Realized gain (loss) on sale of Agency Securities (reclassified from Other comprehensive income (loss))
|
$
|
(11,546
|
)
|
$
|
68,770
|
|
$
|
(593,498
|
)
|
(116.79)%
|
111.59%
|
|||||
|
Other than temporary impairment of Agency Securities (reclassified from Other comprehensive income (loss))
|
—
|
|
—
|
|
(401,541
|
)
|
—%
|
100.00%
|
||||||||
|
Gain (loss) on short sale of U.S. Treasury Securities
|
—
|
|
(14,688
|
)
|
15,508
|
|
100.00%
|
(194.71)%
|
||||||||
|
Subtotal
|
$
|
(11,546
|
)
|
$
|
54,082
|
|
$
|
(979,531
|
)
|
(121.35)%
|
105.52%
|
|||||
|
Realized loss on derivatives
|
(107,070
|
)
|
(118,716
|
)
|
(135,908
|
)
|
9.81%
|
12.65%
|
||||||||
|
Unrealized gain (loss) on derivatives
|
(181,662
|
)
|
(462,630
|
)
|
544,643
|
|
60.73%
|
(184.94)%
|
||||||||
|
Subtotal
|
$
|
(288,732
|
)
|
$
|
(581,346
|
)
|
$
|
408,735
|
|
50.33%
|
(242.23)%
|
|||||
|
Total Other Loss
|
$
|
(300,278
|
)
|
$
|
(527,264
|
)
|
$
|
(570,796
|
)
|
43.05%
|
7.63%
|
|||||
2015
vs.
2014
|
•
|
Gains (losses) on Agency Securities resulted from the sales of Agency Securities during the
year ended
December 31, 2015
of
$5,367,123
compared to
$10,595,518
during the year ended
December 31, 2014
. At
December 31, 2015
and
December 31, 2014
, we also considered whether we intended to sell Agency Securities and whether it was more likely than not that we could meet our liquidity requirements and contractual obligations without selling Agency Securities. As a result of this evaluation, no other than temporary impairment was recognized for the years ended
December 31, 2015
and
December 31, 2014
, respectively, because we determined that we 1) did not have the intent to sell the Agency Securities in an unrealized loss position, 2) did not believe it more likely than not that we were required to sell the securities before recovery (for example, because of liquidity requirements or contractual obligations), and/or (3) determined that a credit loss did not exist.
|
|
•
|
We did not sell short or purchase U.S. Treasury Securities during the year ended
December 31, 2015
. Gains (losses) on U.S. Treasury Securities in 2014 resulted from U.S. Treasury Securities sold short during the
year
ended
December 31, 2014
of
$2,005,363
, which were repurchased at a cost of
$2,020,051
. In 2014, our short positions were outstanding for a total of 86 days, when U.S Treasury interest rates were generally declining.
|
|
•
|
Gains (losses) on Derivatives resulted from a combination of the following: We decreased our total interest rate swap contracts aggregate notional balance from
$13,020,000
at
December 31, 2014
to
$8,800,000
at
December 31, 2015
, respectively. Our total Futures Contracts notional amount decreased from
$10,000
at
December 31, 2014
to
$0
at
December 31, 2015
, respectively, due to the maturity of contracts. We also entered into
$2,000,000
notional of basis swap contracts during the year ended
December 31, 2015
.
|
2014
vs.
2013
|
•
|
Gains (losses) on Agency Securities resulted from the sales of Agency Securities during the year ended
December 31, 2014
of
$10,595,518
compared to $14,965,888 during the year ended December 31, 2013. The decline in value of our Agency Securities in 2013 was solely due to market conditions and not the credit quality of the assets. At December 31, 2014 and December 31, 2013, we also considered whether we intended to sell Agency Securities and whether it was more likely than not that we could meet our liquidity requirements and contractual obligations without selling Agency Securities. We recognized other than temporary impairments in 2013 on Agency Securities identified for sale in 2014.
|
|
•
|
Gains (losses) on U.S. Treasury Securities resulted from U.S. Treasury Securities sold short during the year ended
December 31, 2014
of
$2,005,363
, which were repurchased at a cost of
$2,020,051
. This compares to U.S. Treasury Securities sold short during the year ended December 31, 2013 of
$2,783,711
, which were repurchased at a cost of
$2,768,203
, respectively. In 2014, our short positions were outstanding for a total of 86 days, when U.S Treasury interest rates were generally declining, as compared to 14 days in 2013, when U.S. Treasury interest rates increased sharply.
|
|
•
|
Gains (losses) on Derivatives resulted from a combination of the following: We increased our total interest rate swap contracts aggregate notional balance from $10,220,000 at December 31, 2013 to $13,020,000 at December 31, 2014, respectively. We decreased our total interest rate swaptions notional balance from $5,750,000 at December 31, 2013 to $0 at December 31, 2014. Our total Futures Contracts notional amount decreased from $55,000 at December 31, 2013
|
34
to $10,000 at December 31, 2014, respectively, due to the maturity of contracts. The net loss for the year ended December 31, 2014 was the result of more gradual and sustained declines of interest rates.
Expenses
|
For the Year Ended
|
Change vs. Prior Year
|
|||||||||||||||||
|
December 31, 2015
|
December 31, 2014
|
December 31, 2013
|
2015
|
2014
|
||||||||||||||
|
Management fee
|
$
|
27,292
|
|
$
|
27,857
|
|
$
|
28,141
|
|
(2.03
|
)%
|
(1.01
|
)%
|
|||||
|
Professional fees
|
3,117
|
|
3,735
|
|
3,311
|
|
(16.55
|
)%
|
12.81
|
%
|
||||||||
|
Insurance
|
690
|
|
726
|
|
543
|
|
(4.96
|
)%
|
33.70
|
%
|
||||||||
|
Compensation
|
2,291
|
|
2,796
|
|
3,047
|
|
(18.06
|
)%
|
(8.24
|
)%
|
||||||||
|
Other
|
3,559
|
|
2,484
|
|
2,109
|
|
43.28
|
%
|
17.78
|
%
|
||||||||
|
Total Expenses
|
$
|
36,949
|
|
$
|
37,598
|
|
$
|
37,151
|
|
(1.73
|
)%
|
1.20
|
%
|
|||||
Management fees are determined based on gross equity raised. Therefore, our management fee increases when we raise capital and declines when we repurchase previously issued stock or pay dividends in excess of taxable income. However, because the management fee rate decreased to 0.75% per annum for gross equity raised in excess of $1.0 billion pursuant to the Management Agreement, the effective average management fee rate declines as equity is raised. Gross equity raised was
$2,507,505
at
December 31, 2015
, compared to
$2,697,223
and
$2,769,661
at
December 31, 2014
and
December 31, 2013
, respectively.
Professional fees include securities clearing, legal, audit and consulting costs and are generally driven by the size and complexity of our securities portfolio, the volume of transactions we execute and the extent of research and due diligence activities we undertake on potential transactions.
Insurance includes premiums for both general business and directors and officers liability coverage. The decrease in cost from 2014 to 2015 was due to a decrease in insurance premiums. The increase in costs from 2013 to 2014 related primarily to increases in coverage levels associated with our growth. Insurance policy periods do not correspond to calendar years.
Compensation includes both non-executive director compensation as well as the restricted stock awarded to our executive officers and other ACM employees through ACM. The decline in 2015 is primarily the result of lower stock based compensation due to a decline in our stock price and award vesting to our executive officers and other ACM employees. No new awards have been granted since 2013.
Other expenses include fees for market and pricing data, analytics and risk management systems and portfolio related data processing costs as well as stock exchange listing fees and similar shareholder related expenses.
Taxable Income
As a REIT we are generally not subject to taxation. See
Note 13
to the consolidated financial statements.
Other Comprehensive Income (Loss)
Comprehensive income (loss) includes all changes in equity during a period, except those resulting from investments by owners and distributions to owners. For years ended
December 31, 2015
,
December 31, 2014
and
December 31, 2013
, other comprehensive income (loss) totaled
$(151,656)
,
$274,834
and
$(421,044)
, respectively, reflecting net unrealized gains or losses on available for sale Agency Securities net of amounts reclassified upon sale. The 2014 other comprehensive income amounts reflect recoveries from the closing 2013 price levels. The 2013 other comprehensive loss resulted from significant price declines in our Agency Securities.
35
Financial Condition
Agency Securities and TBA Agency Securities
Security purchase and sale transactions, including purchases and sales for forward settlement, are recorded on the trade date to the extent it is probable that we will take or make timely physical delivery of the related securities. Gains or losses realized from the sale of securities are included in income and are determined using the specific identification method. We typically purchase Agency Securities at premium prices. The premium price paid over par value on those assets is expensed as the underlying mortgages experience repayment or prepayment. The lower the constant prepayment rate, the lower the amount of amortization expense for a particular period. Accordingly, the yield on an asset and earnings, are higher. If prepayment rates increase, the amount of amortization expense for a particular period will go up. These increased prepayment rates would act to decrease the yield on an asset and would decrease earnings.
We account for TBA Agency Securities as derivative instruments if it is reasonably possible that we will not take or make physical delivery of the Agency Security upon settlement of the contract. TBA Agency Securities are forward contracts for the purchase (“long position”) or sale (“short position”) of Agency Securities at a predetermined price, face amount, issuer, coupon and stated maturity on an agreed-upon future date. The specific Agency Securities delivered into the contract upon the settlement date, published each month by the Securities Industry and Financial Markets Association, are not known at the time of the transaction. We estimate the fair value of TBA Agency Securities based on similar methods used to value our Agency Securities. TBA Agency Securities are included in the table below on a gross basis as they can be used to establish and finance portfolio positions in Agency Securities. We did not have any TBA Agency Securities outstanding at
December 31, 2015
and
December 31, 2014
.
The tables below summarize certain characteristics of our Agency Securities at
December 31, 2015
and
December 31, 2014
.
December 31, 2015
|
Asset Type
|
Principal Amount
|
Fair Value
|
Weighted Average Coupon
|
CPR (1)
|
Weighted Average Month to Reset or Maturity
|
% of Total Agency Securities
|
|||||||||||||
|
ARMs & Hybrids
|
$
|
114,000
|
|
$
|
119,013
|
|
2.53
|
%
|
11.51
|
%
|
12
|
0.95
|
%
|
||||||
|
Multi-Family MBS
|
2,126,155
|
|
2,158,589
|
|
3.09
|
%
|
0.00
|
%
|
105
|
17.80
|
|
||||||||
|
10 Year Fixed
|
124,035
|
|
130,546
|
|
3.88
|
%
|
14.25
|
%
|
116
|
1.04
|
|
||||||||
|
15 Year Fixed
|
4,295,880
|
|
4,489,918
|
|
3.33
|
%
|
8.92
|
%
|
150
|
35.97
|
|
||||||||
|
20 Year Fixed
|
3,900,738
|
|
4,103,449
|
|
3.64
|
%
|
11.70
|
%
|
193
|
32.66
|
|
||||||||
|
25 Year Fixed
|
16,960
|
|
18,359
|
|
4.50
|
%
|
14.15
|
%
|
279
|
0.14
|
|
||||||||
|
30 Year Fixed
|
1,366,748
|
|
1,441,682
|
|
3.86
|
%
|
5.89
|
%
|
347
|
11.44
|
|
||||||||
|
Total or Weighted Average
|
$
|
11,944,516
|
|
$
|
12,461,556
|
|
3.45
|
%
|
7.98
|
%
|
178
|
100.00
|
%
|
||||||
(1) Weighted average for all prepayments during the quarter ended
December 31, 2015
, including prepayments related to Agency Securities purchased during the quarter.
36
December 31, 2014
|
Asset Type
|
Principal Amount
|
Fair Value
|
Weighted Average Coupon
|
CPR (1)
|
Weighted Average Month to Reset or Maturity
|
% of Total Agency Securities
|
|||||||||||||
|
ARMs & Hybrids
|
$
|
124,680
|
|
$
|
131,722
|
|
3.38
|
%
|
15.13
|
%
|
7
|
0.86
|
%
|
||||||
|
Multi-Family MBS
|
1,206,290
|
|
1,261,903
|
|
3.26
|
%
|
—
|
%
|
114
|
8.33
|
|
||||||||
|
10 Year Fixed
|
5,671
|
|
6,140
|
|
4.53
|
%
|
8.00
|
%
|
108
|
0.04
|
|
||||||||
|
15 Year Fixed
|
7,295,657
|
|
7,690,241
|
|
3.33
|
%
|
6.97
|
%
|
163
|
50.38
|
|
||||||||
|
20 Year Fixed
|
4,659,352
|
|
4,931,150
|
|
3.60
|
%
|
8.50
|
%
|
205
|
32.18
|
|
||||||||
|
25 Year Fixed
|
19,386
|
|
21,139
|
|
4.50
|
%
|
—
|
%
|
254
|
0.13
|
|
||||||||
|
30 Year Fixed
|
1,170,133
|
|
1,255,234
|
|
4.01
|
%
|
0.91
|
%
|
356
|
8.08
|
|
||||||||
|
Total or Weighted Average
|
$
|
14,481,169
|
|
$
|
15,297,529
|
|
3.47
|
%
|
6.45
|
%
|
187
|
100.00
|
%
|
||||||
(1) Weighted average for all prepayments during the quarter ended
December 31, 2014
, including prepayments related to Agency Securities purchased or sold during the quarter.
Recognition of interest income commences on the settlement date of the purchase transaction and continues through the settlement date of the sale transaction. At
December 31, 2015
, we did not have any investment related receivables or payables. At
December 31, 2014
, we had investment related receivables of
$260,598
and investment related payables of
$445,292
with respect to unsettled sales and purchases of Agency Securities.
Our net interest income is primarily a function of the difference between the yield on our assets and the financing cost of owning those assets. Since we tend to purchase Agency Securities at a premium to par, the main item that can affect the yield on our Agency Securities after they are purchased is the rate at which the mortgage borrowers repay the loan. While the scheduled repayments, which are the principal portion of the homeowners’ regular monthly payments, are fairly predictable, the unscheduled repayments, which are generally refinancing of the mortgage but can also result from repurchases of delinquent, defaulted, or modified loans, are less so. Being able to accurately estimate and manage these repayment rates is a critical portion of the management of our securities portfolio, not only for estimating current yield but also for considering the rate of reinvestment of those proceeds into new securities, the yields which those new securities may add to our securities portfolio and our hedging strategy.
At
December 31, 2015
and
December 31, 2014
, the adjustable and hybrid adjustable rate mortgage loans underlying our Agency Securities have fixed-interest rates for an average period of approximately
12
months and
7
months, respectively, after which time the interest rates reset and become adjustable. After a reset date, interest rates on our adjustable and hybrid adjustable Agency Securities float based on spreads over various indices, typically LIBOR or the one-year constant maturity treasury rate. These interest rates are subject to caps that limit the amount the applicable interest rate can increase during any year, known as an annual cap and through the maturity of the security, known as a lifetime cap.
Repurchase Agreements
We have entered into repurchase agreements to finance most of our Agency Securities. Our repurchase agreements are secured by our Agency Securities and bear interest at rates that have historically moved in close relationship to the Federal Funds Rate and LIBOR. We have established borrowing relationships with numerous investment banking firms and other lenders,
26
of which had open repurchase agreements with us at
December 31, 2015
and
28
of which had open repurchases agreements with us at
December 31, 2014
. We had outstanding balances under our repurchase agreements at
December 31, 2015
and
December 31, 2014
of
$11,570,481
and
$13,881,921
, respectively, consistent with the decrease in our Agency Securities in our securities portfolio.
Our repurchase agreements require excess collateral, known as a “hair cut.” At
December 31, 2015
, the average haircut percentage was
4.79%
compared to
4.81%
at
December 31, 2014
. No counterparty held collateral in excess of 5% of our total stockholders' equity at
December 31, 2015
or at
December 31, 2014
.
37
In January 2016, the Federal Housing Financing Authority issued a Final Rule revising its regulations governing FHLB bank membership. The Final Rule changes the definition of “insurance company” to exclude captives, thereby making them ineligible for membership. The Final Rule contains a transition provision to give captives admitted to membership on or after the date of the publication of the proposed rule, which includes SABRE, until February 2017 to terminate its membership in the FHLB Des Moines.
Under the Final Rule, SABRE is prohibited from taking new advances or renewing its existing
$100,000
advance, which matures in December 2016. The Final Rule does not directly affect ARMOUR's MRA agreement or related repurchase financing with another FHLB.
Derivative Instruments
We use various interest rate contracts to manage our interest rate risk as we deem prudent in light of market conditions and the associated costs with counterparties that have a high quality credit rating and with futures exchanges. We generally pay a fixed rate and receive a floating rate with the objective of fixing a portion of our borrowing costs and hedging the change in our book value to some degree. The floating rate we receive is generally the Federal Funds Rate or LIBOR. While our policies do not contain specific requirements as to the percentages or amount of interest rate risk that we are required to hedge, we maintain an overall target of hedging at least 40% of our non-adjustable rate mortgages. At
December 31, 2015
and
December 31, 2014
, the notional value of our derivatives was
87.50%
and
85.92%
, respectively, of the fair market value of our non-adjustable rate mortgages. For interest rate risk mitigation purposes, we consider Agency Securities to be ARMs if their interest rate is either currently subject to adjustment according to prevailing rates or if they are within 18 months of the period where such adjustments will occur. No assurance can be given that our derivatives will have the desired beneficial impact on our results of operations or financial condition. We have not elected cash flow hedge accounting treatment as allowed by GAAP. Since we do not designate our derivative activities as cash flow hedges, realized as well as unrealized gains/losses from these transactions will impact our GAAP earnings.
Use of derivative instruments may fail to protect or could adversely affect us because, among other things:
|
•
|
available derivatives may not correspond directly with the interest rate risk for which protection is sought (e.g., the difference in interest rate movements for long-term U.S. Treasury Securities compared to Agency Securities);
|
|
•
|
the duration of the derivatives may not match the duration of the related liability;
|
|
•
|
the counterparty to a derivative agreement with us may default on its obligation to pay or not perform under the terms of the agreement and the collateral posted may not be sufficient to protect against any consequent loss;
|
|
•
|
we may lose collateral we have pledged to secure our obligations under a derivative agreement if the associated counterparty becomes insolvent or files for bankruptcy;
|
|
•
|
we may experience a termination event under one or more of our derivative agreements related to our REIT status, equity levels and performance, which could result in a payout to the associated counterparty and a taxable loss to us;
|
|
•
|
the credit-quality of the party owing money on the derivatives may be downgraded to such an extent that it impairs our ability to sell or assign our side of the hedging transaction; and
|
|
•
|
the value of derivatives may be adjusted from time to time in accordance with GAAP to reflect changes in fair value; downward adjustments, or “mark-to-market losses,” would reduce our net income or increase any net loss.
|
At
December 31, 2015
and
December 31, 2014
, we had derivatives with a net fair value of
$(232,302)
and
(76,875)
, respectively. At
December 31, 2015
and
December 31, 2014
, we had interest rate swap contracts with an aggregate notional balance of
$8,800,000
and
$13,020,000
, respectively. At
December 31, 2015
, all of our Futures Contracts had expired. At
December 31, 2014
, we had purchased or sold Futures Contracts with an aggregate notional balance of
$10,000
. Futures Contracts are traded on the CME. Counterparty risk of interest rate swap contracts, interest rate swaptions and Futures Contracts are limited to some degree because of daily mark-to-market and collateral requirements. In addition, substantial credit support for the Futures Contracts is provided by the CME. These derivative transactions are designed to lock in a portion of funding costs for financing activities associated with our assets in such a way as to help assure the realization of attractive net interest margins and to vary inversely in value with our Agency Securities. Such contracts are based on assumptions about prepayments which, if not realized, will cause results to differ from expectations.We also entered into
$2,000,000
notional of basis swap contracts during the year ended
December 31, 2015
. We did not enter into any basis swap contracts during the year ended
December 31, 2014
.
Although we attempt to structure our derivatives to offset the changes in asset prices, the complexity of the actual and expected pre-payment characteristics of the underlying mortgages as well as the volatility in mortgage interest rates relative to U.S. Treasury and interest rate swap contract rates makes achieving high levels of off-set difficult.We recognized net gains (losses) of
$(288,732)
,
$(581,346)
and
$408,735
, respectively, for the
years
ended
December 31, 2015
,
December 31, 2014
, and
December 31, 2013
related to our derivatives. For the
year ended
December 31, 2015
, the net unrealized gain (loss) of our Agency
38
Securities decreased by
$(163,202)
. This compares to an increase of
$343,604
and an decrease of
$(1,416,083)
respectively, for the
years
ended
December 31, 2014
and
December 31, 2013
. The net unrealized gain (loss) on Agency Securities is due to market price fluctuations.
As required by the Dodd-Frank Act, the Commodity Futures Trading Commission has adopted rules requiring certain interest rate swap contracts to be cleared through a derivatives clearing organization. We are required to clear certain new interest rate swap contracts. Cleared interest rate swaps may have higher margin requirements than un-cleared interest rate swaps we previously had. We have established an account with a futures commission merchant for this purpose. To date, we have not entered into any cleared interest rate swap contracts.
We are required to account for our TBA Agency Securities as derivatives when it is reasonably possible that we will not take or make timely physical delivery of the related securities. However, from time to time, we use TBA Agency Securities primarily to effectively establish and finance portfolio positions. See the section, Financial Condition-Agency Securities and TBA Agency Securities above.
Contractual Obligations and Commitments
We had the following contractual obligations at
December 31, 2015
:
|
|
Payments Due By Period
|
|||||||||||||||||||
|
Obligations
|
Total
|
Less Than
1 Year
|
2-3 Years
|
4-5 Years
|
Greater Than 5 Years
|
|||||||||||||||
|
Repurchase agreements
|
$
|
11,570,481
|
|
$
|
11,570,481
|
|
$
|
—
|
|
$
|
—
|
|
$
|
—
|
|
|||||
|
Interest expense on repurchase agreements
|
12,464
|
|
12,464
|
|
—
|
|
—
|
|
—
|
|
||||||||||
|
Related Party Fees (1)
|
184,145
|
|
26,306
|
|
52,613
|
|
52,613
|
|
52,613
|
|
||||||||||
|
Board of Directors fees (2)
|
7,553
|
|
1,079
|
|
2,158
|
|
2,158
|
|
2,158
|
|
||||||||||
|
Total
|
$
|
11,774,643
|
|
$
|
11,610,330
|
|
$
|
54,771
|
|
$
|
54,771
|
|
$
|
54,771
|
|
|||||
(1) Represents fees to be paid to ACM under the terms of the Management Agreement (Refer to Note 9 and Note 14 to the consolidated financial statements).
(2) Represents fees to be paid to the Board.
We had contractual commitments under derivatives at
December 31, 2015
. We had interest rate swap contracts with an aggregate notional balance of
$8,800,000
, a weighted average swap rate of
1.90%
and a weighted average term of
78
months at
December 31, 2015
. Our total Basis swaps notional amount at
December 31, 2015
, was
$2,000,000
, with a weighted average swap rate of
0.22%
and weighted average term of
22
months.
Liquidity and Capital Resources
Cash provided by operating activities was
$238,255
,
$315,100
and
$369,106
, respectively, for the years ended
December 31, 2015
,
December 31, 2014
and
December 31, 2013
. The decline in cash related to operating activities is primarily related to the overall decline in the size of our securities portfolio. Our average securities portfolio was
$13,756,536
,
$15,784,528
and
$19,593,311
, respectively, for the years ended
December 31, 2015
,
December 31, 2014
and
December 31, 2013
.
During the
year
ended
December 31, 2015
, we issued
6
shares of common stock under our Common Stock DRIP and raised additional net proceeds of approximately
$147
. During the
years
ended
December 31, 2015
,
December 31, 2014
and
December 31, 2013
, we repurchased
7,510
shares,
600
shares and
2,096
shares of our common stock under the Repurchase Program for an aggregate cost of
$159,600
,
$18,362
and
$72,694
, respectively. At
December 31, 2015
, there were
1,874
authorized shares remaining under the Repurchase Program.
From time to time, we purchase or sell assets for forward settlement up to 90 days in the future to lock in purchase prices or sales proceeds.
At
December 31, 2015
, we financed our securities portfolio with
$11,570,481
of borrowings under repurchase agreements. Our leverage ratio at
December 31, 2015
, was
9.44
to 1. At
December 31, 2015
, our liquidity totaled
$641,613
, consisting of
$289,925
of cash plus
$351,688
of unpledged Agency Securities (including securities received as collateral). Our primary sources of funds are borrowings under repurchase arrangements, monthly principal and interest payments on our Agency Securities and
39
cash generated from our operating results. Other sources of funds may include proceeds from equity and debt offerings and asset sales. We generally maintain liquidity to pay down borrowings under repurchase arrangements to reduce borrowing costs and otherwise efficiently manage our long-term investment capital. Because the level of our borrowings can be adjusted on a daily basis, the level of cash carried on our consolidated balance sheet is significantly less important than our potential liquidity available under our borrowing arrangements.
In addition to the repurchase agreement financing discussed above, from time to time we have entered into reverse repurchase agreements with certain of our repurchase agreement counterparties. Under a typical reverse repurchase agreement, we purchase U.S. Treasury Securities from a borrower in exchange for cash and agree to sell the same securities back in the future. We then sell such U.S. Treasury Securities to third parties and recognize a liability to return the securities to the original borrower. Reverse repurchase agreement receivables and repurchase agreement liabilities are presented net when they meet certain criteria, including being with the same counterparty, being governed by the same MRA, settlement through the same brokerage or clearing account and maturing on the same day. The practical effect of these transactions is to replace a portion of our repurchase agreement financing of our Agency Securities in our securities portfolio with short positions in U.S. Treasury Securities. We believe that this helps to reduce interest rate risk, and therefore counterparty credit and liquidity risk. We did not have any reverse repurchase agreements outstanding at
December 31, 2015
and
December 31, 2014
.
Both parties to the repurchase and reverse repurchase transactions have the right to make daily margin calls based on changes in the value of the collateral obtained and/or pledged.
We currently believe that we have sufficient liquidity and capital resources available for the acquisition of additional investments, repayments on repurchase borrowings, reacquisition of securities to be returned to borrowers and the payment of cash dividends as required for continued qualification as a REIT.
Our primary uses of cash are to purchase Agency Securities, pay interest and principal on our borrowings, fund our operations and pay dividends.
During the
year
ended
December 31, 2015
, we purchased
$5,145,847
of Agency Securities using proceeds from repurchase agreements and principal repayments. During the
year
ended
December 31, 2015
, we received cash of
$1,910,795
from prepayments and scheduled principal payments on our Agency Securities. We received net proceeds of
$147
from common equity issuances under our common stock DRIP. We had a net cash increase from our repurchase agreements of
$2,311,440
for the
year
ended
December 31, 2015
and made cash interest payments of approximately
$218,503
on our liabilities for the
year
ended
December 31, 2015
. Part of funding our operations includes providing margin cash to offset liability balances on our derivatives. We recovered
$134,795
of cash collateral posted to counterparties and decreased our liability by
$48,240
for cash collateral posted by counterparties at
December 31, 2015
.
During the year ended December 31, 2014, we purchased $12,505,285 of Agency Securities using proceeds from repurchase agreements and principal repayments. During the year ended December 31, 2014, we received cash of $1,806,581 from prepayments and scheduled principal payments on our Agency Securities. We received net proceeds of $269 from common equity issuances under our common stock DRIP. We had a net cash increase from our repurchase agreements of $730,417 for the year ended December 31, 2014 and made cash interest payments of approximately $215,573 on our liabilities for the year ended December 31, 2014. Part of funding our operations includes providing margin cash to offset liability balances on our derivatives. We recovered $93,087 of cash collateral posted to counterparties and decreased our liability by $339,605 for cash collateral posted by counterparties at December 31, 2014.
During the year ended December 31, 2013, we purchased $15,029,408 of Agency Securities using proceeds from equity raises, repurchase agreements and principal repayments. During the year ended December 31, 2013, we received cash of $3,135,502 from prepayments and scheduled principal payments on our Agency Securities. We received net proceeds of $438,582 from common equity issuances, including our common stock DRIP and $4,380 of proceeds from the issuance of 175 shares of Series A Preferred Stock and $136,553 of proceeds from the issuance of 5,650 shares of Series B Preferred Stock during the year ended December 31, 2013. We had a net cash decrease from our repurchase agreements of $5,214,591 for the year ended December 31, 2013 and made cash interest payments of approximately $226,549 on our liabilities for the year ended December 31, 2013. Part of funding our operations includes providing margin cash to offset liability balances on our derivatives. We recovered $229,635 of cash collateral posted with counterparties and increased our liability by $387,845 for cash collateral held as of December 31, 2013
We have continued to pursue additional lending counterparties in order to help increase our financial flexibility and ability to withstand periods of contracting liquidity in the credit markets.
40
Repurchase Agreements
Declines in the value of our Agency Securities portfolio can trigger margin calls by our lenders under our repurchase agreements. An event of default or termination event under the standard MRA would give our counterparty the option to terminate all repurchase transactions existing with us and require any amount due to be payable immediately.
Changing capital or other financial market regulatory requirements may cause our lenders to exit the repurchase market, increase financing rates, tighten lending standards or increase the amount of required equity capital or haircut we post, any of which could make it more difficult or costly for us to obtain financing.
Financial sector volatility can also lead to increased demand and prices for high quality debt securities, including Agency Securities. While increased prices may increase the value of our Agency Securities, higher values may also reduce the return on reinvestment of capital, thereby lowering our future profitability.
The following graph represents the month-end outstanding balances of our repurchase agreements (before the effect of netting reverse repurchase agreements), which finance most of our Agency Securities. Our repurchase agreements balance will fluctuate based on our change in capital, leverage targets and the market prices of our assets. The balance of repurchase agreements outstanding will fluctuate within any given month based on changes in the market value of the particular Agency Security pledged as collateral (including the effects of principal paydowns) and the level and timing of investment and reinvestment activity.

41
See
Note 7
to the consolidated financial statements for more information.
Effects of Margin Requirements, Leverage and Credit Spreads
Our Agency Securities have values that fluctuate according to market conditions and, as discussed above, the market value of our Agency Securities will decrease as prevailing interest rates or credit spreads increase. When the value of the securities pledged to secure a repurchase agreement decreases to the point where the positive difference between the collateral value and the loan amount is less than the haircut, our lenders may issue a margin call, which means that the lender will require us to pay the margin call in cash or pledge additional collateral to meet that margin call. Under our repurchase facilities, our lenders have full discretion to determine the value of the Agency Securities we pledge to them. Most of our lenders will value securities based on recent trades in the market. Lenders also issue margin calls as the published current principal balance factors change on the pool of mortgages underlying the securities pledged as collateral when scheduled and unscheduled principal repayments are announced monthly.
We experience margin calls in the ordinary course of our business and under certain conditions, such as during a period of declining market value for Agency Securities and we may experience margin calls as frequently as daily. In seeking to effectively manage the margin requirements established by our lenders, we maintain a position of cash and unpledged securities. We refer to this position as our liquidity. The level of liquidity we have available to meet margin calls is directly affected by our leverage levels, our haircuts and the price changes on our securities. If interest rates increase as a result of a yield curve shift or for another reason or if credit spreads widen, the prices of our collateral (and our unpledged assets that constitute our liquidity) will decline and we may experience margin calls. We will use our liquidity to meet such margin calls. There can be no assurance that we will maintain sufficient levels of liquidity to meet any margin calls. If our haircuts increase, our liquidity will proportionately decrease. If we increase our borrowings, our liquidity will decrease by the amount of additional haircut on the increased level of indebtedness. In addition, certain of our MRAs contain a restriction that prohibits our leverage from exceeding twelve times our stockholders’ equity as well as termination events in the case of significant reductions in equity capital.
We intend to maintain a level of liquidity in relation to our assets that enables us to meet reasonably anticipated margin calls but that also allows us to be substantially invested in Agency Securities. We may misjudge the appropriate amount of our liquidity by maintaining excessive liquidity, which would lower our investment returns, or by maintaining insufficient liquidity, which would force us to involuntarily liquidate assets into unfavorable market conditions and harm our results of operations and financial condition.
We generally seek to borrow (on a recourse basis) between six and ten times the amount of our total stockholders’ equity. At
December 31, 2015
and
December 31, 2014
, our total borrowings were
$11,570,481
and
$13,881,921
(excluding accrued interest), respectively. At
December 31, 2015
and
December 31, 2014
, we had a leverage ratio of approximately
9.44
:1 and
7.94:1
, respectively.
Forward-Looking Statements Regarding Liquidity
Based on our current portfolio, leverage rate and available borrowing arrangements, we believe that our cash flow from operations and our ability to make timely portfolio adjustments, will be sufficient to enable us to meet anticipated short-term (one year or less) liquidity requirements such as to fund our investment activities, meet our financing obligations, pay fees under the Management Agreement and fund our distributions to stockholders and pay general corporate expenses.
We may increase our capital resources by obtaining long-term credit facilities or making public or private offerings of equity or debt securities, including classes of preferred stock, common stock and senior or subordinated notes to meet our long-term (greater than one year) liquidity. Such financing will depend on market conditions for capital raises and for the investment of any proceeds and there can be no assurances that we will successfully obtain any such financing.
Stockholders’ Equity
See
Note 11
to the consolidated financial statements.
42
Off-Balance Sheet Arrangements
At
December 31, 2015
and
December 31, 2014
, we had not maintained any relationships with unconsolidated entities or financial partnerships, such as entities often referred to as structured finance, or special purpose or variable interest entities, established for the purpose of facilitating off-balance sheet arrangements or other contractually narrow or limited purposes. Furthermore, at
December 31, 2015
and
December 31, 2014
, we had not guaranteed any obligations of any unconsolidated entities or entered into any commitment or intent to provide funding to any such entities.
Critical Accounting Policies
See
Note 3
to the consolidated financial statements for our significant accounting policies.
Valuation of Agency Securities and Derivatives
We carry our Agency Securities and derivatives at fair value. Our Agency Securities are classified as available for sale, and therefore unrealized changes in fair value are reflected directly in total stockholders' equity as accumulated other comprehensive income or loss. We do not use hedge accounting for our derivatives for financial reporting purposes and therefore changes in fair value are reflected in net income as other gain or loss. To the extent that fair value changes on derivatives offset fair value changes in our Agency Securities, the fluctuation in our stockholders’ equity will be lower. For example, rising interest rates may tend to result in an overall increase in our reported net income even while our total stockholders’ equity declines.
Fair value for the Agency Securities in our securities portfolio is based on obtaining a valuation for each Agency Security from third party pricing services and/or dealer quotes. The third party pricing services use common market pricing methods that may include pricing models that may incorporate such factors as coupons, prepayment speeds, spread to the Treasury curves and interest rate swap curves, duration, periodic and life caps and credit enhancement. If the fair value of an Agency Security is not available from the third party pricing services or such data appears unreliable, we obtain pricing indications from up to three dealers who make markets in similar Agency Securities. Management reviews pricing used to ensure that current market conditions are properly reflected. This review includes, but is not limited to, comparisons of similar market transactions or alternative third party pricing services, dealer pricing indications and comparisons to a third party pricing model.
The fair values of our derivatives are valued using information provided by third party pricing services that incorporate common market pricing methods that may include current interest rate curves, forward interest rate curves and market spreads to interest rate curves. Management compares pricing information received to dealer quotes to ensure that the current market conditions are properly reflected.
Realized Gains and Losses on Agency Securities
Security purchase and sale transactions, including purchases and sales for forward settlement, are recorded on the trade date to the extent it is probable that we will take or make timely physical delivery of the related securities. Gains or losses realized from the sale of securities are included in income and are determined using the specific identification method. We realize gains and losses on our Agency Securities upon their sale. At that time, previously unrealized amounts included in accumulated other comprehensive income are reclassified and reported in net income as other gain or loss. To the extent that we sell Agency Securities in later periods after changes in the fair value of those Agency Securities have occurred, we may report significant net income or net loss without a corresponding change in our total stockholders' equity.
Declines in the fair values of our Agency Securities that represent other than temporary impairments are also treated as realized losses and reported in net income as other loss. We evaluate Agency Securities for other than temporary impairment at least on a quarterly basis and more frequently when economic or market concerns warrant such evaluation. We consider an impairment to be other than temporary if we (1) have the intent to sell the Agency Securities, (2) believe it is more likely than not that we will be required to sell the securities before recovery (for example, because of liquidity requirements or contractual obligations), or (3) a credit loss exists. Impairment losses recognized establish a new cost basis for the related Agency Securities. Gains or losses on subsequent sales are determined by reference to such new cost basis.
Inflation
Virtually all of our assets and liabilities are interest rate-sensitive in nature. As a result, interest rates and other factors influence our performance far more than inflation. Changes in interest rates do not necessarily correlate with inflation rates or changes in inflation rates. Our financial statements are prepared in accordance with GAAP and any distributions we may make
43
will be determined by our Board based in part on our REIT taxable income as calculated according to the requirements of the Code; in each case, our activities and balance sheet are measured with reference to fair value without considering inflation.
Subsequent Events
See
Note 16
to the consolidated financial statements.
CAUTIONARY NOTE REGARDING FORWARD-LOOKING STATEMENTS
This report contains various “forward-looking statements.” Forward-looking statements relate to expectations, beliefs, projections, future plans and strategies, anticipated events or trends and similar expressions concerning matters that are not historical facts. In some cases, you can identify forward-looking statements by the use of forward-looking terminology such as “believes,” “expects,” “may,” “will,” “would,” “could,” “should,” “seeks,” “approximately,” “intends,” “plans,” “projects,” “estimates” or “anticipates” or the negative of these words and phrases or similar words or phrases. All forward-looking statements may be impacted by a number of risks and uncertainties, including statements regarding the following subjects:
|
•
|
our business and investment strategy;
|
|
•
|
our anticipated results of operations;
|
|
•
|
statements about future dividends;
|
|
•
|
our ability to obtain financing arrangements;
|
|
•
|
our understanding of our competition and ability to compete effectively;
|
|
•
|
market, industry and economic trends; and
|
|
•
|
interest rates.
|
The forward-looking statements in this report are based on our beliefs, assumptions and expectations of our future performance, taking into account all information currently available to us. These beliefs, assumptions and expectations are subject to risks and uncertainties and can change as a result of many possible events or factors, not all of which are known to us. If a change occurs, our business, financial condition, liquidity and results of operations may vary materially from those expressed in our forward-looking statements. You should carefully consider these risks before you make an investment decision with respect to our stock, along with the following factors that could cause actual results to vary from our forward-looking statements:
|
•
|
the impact of the federal conservatorship of Fannie Mae and Freddie Mac and related efforts, along with any changes in laws and regulations affecting the relationship between Fannie Mae and Freddie Mac and the federal government and the Fed system;
|
|
•
|
the possible material adverse effect on our business if the U.S. Congress passed legislation reforming or winding down Fannie Mae or Freddie Mac;
|
|
•
|
mortgage loan modification programs and future legislative action;
|
|
•
|
the impact of the delay or failure of the U.S. Government in reaching an agreement on the national debt ceiling;
|
|
•
|
availability, terms and deployment of capital;
|
|
•
|
changes in economic conditions generally;
|
|
•
|
changes in interest rates, interest rate spreads and the yield curve or prepayment rates;
|
|
•
|
general volatility of the financial markets, including markets for mortgage securities;
|
|
•
|
inflation or deflation;
|
|
•
|
availability of suitable investment opportunities;
|
|
•
|
the degree and nature of our competition, including competition for Agency Securities from the U.S. Treasury;
|
|
•
|
changes in our business and investment strategy;
|
|
•
|
our dependence on ACM and ability to find a suitable replacement if ACM was to terminate its management relationship with us;
|
|
•
|
the existence of conflicts of interest in our relationship with ACM, certain of our directors and our officers, which could result in decisions that are not in the best interest of our stockholders;
|
|
•
|
changes in personnel at ACM or the availability of qualified personnel at ACM;
|
|
•
|
limitations imposed on our business by our status as a REIT under the Code;
|
|
•
|
changes in GAAP, including interpretations thereof; and
|
|
•
|
changes in applicable laws and regulations.
|
We cannot guarantee future results, levels of activity, performance or achievements. You should not place undue reliance on forward-looking statements, which apply only as of the date of this report. We do not intend and disclaim any duty or obligation
44
to update or revise any industry information or forward-looking statements set forth in this report to reflect new information, future events or otherwise, except as required under the U.S. Federal securities laws.
45
We seek to manage our risks related to the credit-quality of our assets, interest rates, liquidity, prepayment speeds and market value while, at the same time, seeking to provide an opportunity to stockholders to realize attractive risk adjusted returns through ownership of our capital stock. While we do not seek to avoid risk completely, we believe the risk can be quantified from historical experience and seek to actively manage that risk, to earn sufficient compensation to justify taking those risks and to maintain capital levels consistent with the risks we undertake. See also Item 1A. Risk Factors - Risks Related to our Business.
Interest Rate, Cap and Mismatch Risk
A portion of our securities portfolio consists of hybrid adjustable rate and adjustable rate Agency Securities. Hybrid mortgages are ARMs that have a fixed-interest rate for an initial period of time (typically three years or greater) and then convert to an adjustable rate for the remaining loan term. Our debt obligations are generally repurchase agreements of limited duration that are periodically refinanced at current market rates.
ARMs are typically subject to periodic and lifetime interest rate caps that limit the amount the interest rate can change during any given period. ARMs are also typically subject to a minimum interest rate payable. Our borrowings are not subject to similar restrictions. Hence, in a period of increasing interest rates, interest rates on our borrowings could increase without limitation, while the interest rates on our mortgage related assets could be limited. This exposure would be magnified to the extent we acquire fixed rate Agency Securities or ARMs that are not fully indexed. Furthermore, some ARMs may be subject to periodic payment caps that result in some portion of the interest being deferred and added to the principal outstanding. These factors could lower our net interest income or cause a net loss during periods of rising interest rates, which would negatively impact our liquidity, net income and our ability to make distributions to stockholders.
We fund the purchase of a substantial portion of our ARMs with borrowings that have interest rates based on indices and repricing terms similar to, but of shorter maturities than, the interest rate indices and repricing terms of our mortgage assets. Thus, we anticipate that in most cases the interest rate indices and repricing terms of our mortgage assets and our funding sources will not be identical, thereby creating an interest rate mismatch between assets and liabilities. During periods of changing interest rates, such interest rate mismatches could negatively impact our net interest income, dividend yield and the market price of our stock. Most of our adjustable rate assets are based on the one-year constant maturity treasury rate and the one-year LIBOR rate and our debt obligations are generally based on LIBOR. These indices generally move in the same direction, but there can be no assurance that this will continue to occur.
Our ARMs and borrowings reset at various different dates for the specific asset or obligation. In general, the repricing of our debt obligations occurs more quickly than on our assets. Therefore, on average, our cost of funds may rise or fall more quickly than our earnings rate on our assets.
Furthermore, our net income may vary somewhat as the spread between one-month interest rates, the typical term for our repurchase agreements and six-month and twelve-month interest rates, the typical reset term of ARMs, varies.
Prepayment Risk
As we receive repayments of principal on our Agency Securities from prepayments and scheduled payments, premiums paid on such securities are amortized against interest income and discounts are accreted to interest income as realized. Premiums arise when we acquire Agency Securities at prices in excess of the principal balance of the mortgage loans underlying such Agency Securities. Conversely, discounts arise when we acquire Agency Securities at prices below the principal balance of the mortgage loans underlying such Agency Securities. Volatility in actual prepayment speeds will create volatility in the amount of premium amortization we recognize. Higher speeds will reduce our interest income and lower speeds will increase our interest income. At
December 31, 2015
, substantially all of our Agency Securities were purchased at a premium.
Interest Rate Risk and Effect on Market Value Risk
Another component of interest rate risk is the effect changes in interest rates will have on the market value of our Agency Securities. We face the risk that the market value of our Agency Securities will increase or decrease at different rates than that of our liabilities, including our derivative instruments and obligations to return securities received as collateral.
We primarily assess our interest rate risk by estimating the effective duration of our assets and the effective duration of our liabilities and by estimating the time difference between the interest rate adjustment of our assets and the interest rate adjustment of our liabilities. Effective duration essentially measures the market price volatility of financial instruments as interest rates change.
46
We generally estimate effective duration using various financial models and empirical data. Different models and methodologies can produce different effective duration estimates for the same securities.
The sensitivity analysis tables presented below reflect the estimated impact of an instantaneous parallel shift in the yield curve, up and down 50 and 100 basis points, on the market value of our interest rate-sensitive investments and net interest income, at
December 31, 2015
and
December 31, 2014
. It assumes that the spread between the interest rates on Agency Securities and long term U.S. Treasury Securities remains constant. Actual interest rate movements over time will likely be different, and such differences may be material. When evaluating the impact of changes in interest rates, prepayment assumptions and principal reinvestment rates are adjusted based on ACM’s expectations. The analysis presented utilized assumptions, models and estimates of ACM based on ACM's judgment and experience.
December 31, 2015
|
Change in Interest Rates
|
Percentage Change in
Projected Net
Interest Income
|
Percentage Change in
Projected Portfolio
Value Including
Derivatives
|
||
|
1.00%
|
(16.79)%
|
(0.08)%
|
||
|
0.50%
|
(8.22)%
|
0.16%
|
||
|
(0.50)%
|
15.27%
|
0.27%
|
||
|
(1.00)%
|
16.46%
|
(0.03)%
|
||
December 31, 2014
|
Change in Interest Rates
|
Percentage Change in
Projected Net
Interest Income
|
Percentage Change in
Projected Portfolio
Value Including
Derivatives
|
||
|
1.00%
|
31.23%
|
(0.07)%
|
||
|
0.50%
|
15.70%
|
0.06%
|
||
|
(0.50)%
|
7.20%
|
(0.30)%
|
||
|
(1.00)%
|
1.83%
|
(1.12)%
|
||
While the tables above reflect the estimated immediate impact of interest rate increases and decreases on a static securities portfolio, we rebalance our securities portfolio from time to time either to seek to take advantage of or reduce the impact of changes in interest rates. It is important to note that the impact of changing interest rates on market value and net interest income can change significantly when interest rates change beyond 100 basis points from current levels. Therefore, the volatility in the market value of our assets could increase significantly when interest rates change beyond amounts shown in the tables above. In addition, other factors impact the market value of and net interest income from our interest rate-sensitive investments and derivative instruments, such as the shape of the yield curve, market expectations as to future interest rate changes and other market conditions. Accordingly, interest income would likely differ from that shown above and such difference might be material and adverse to our stockholders.
The above tables quantify the potential changes in net interest income and securities portfolio value, which includes the value of our derivatives, should interest rates immediately change. Given the low level of interest rates at
December 31, 2015
and
December 31, 2014
, we applied a floor of 0% for all anticipated interest rates included in our assumptions. Due to the presence of this floor, it is anticipated that any hypothetical interest rate decrease would have a limited positive impact on our funding costs beyond a certain level; however, because prepayments speeds are unaffected by this floor, it is expected that any increase in our prepayment speeds (occurring as a result of any interest rate decrease or otherwise) could result in an acceleration of our premium amortization and the reinvestment of such prepaid principal in lower yielding assets. As a result, the presence of this floor limits the positive impact of any interest rate decrease on our funding costs. Therefore, at some point, hypothetical interest rate decreases could cause the fair value of our financial instruments and our net interest income to decline.
47
Market Value Risk
All of our Agency Securities are classified as available for sale assets. As such, they are reflected at fair value with the periodic adjustment to fair value (that is not considered to be an other than temporary impairment) reported as part of “Accumulated other comprehensive income (loss)” that is included in the stockholders’ equity section of our consolidated balance sheets. The market value of our assets can fluctuate due to changes in interest rates and other factors. Weakness in the mortgage market may adversely affect the performance and market value of our investments. This could negatively impact our book value. Furthermore,
if our lenders are unwilling or unable to provide additional financing, we could be forced to sell our Agency Securities at an inopportune time when prices are depressed. The principal and interest payments on our Agency Securities are guaranteed by Freddie Mac, Fannie Mae, or Ginnie Mae.
Credit Risk
We have limited our exposure to credit losses on our securities portfolio of Agency Securities. The payment of principal and interest on the Freddie Mac and Fannie Mae Agency Securities are guaranteed by those respective agencies and the payment of principal and interest on the Agency Securities guaranteed by Ginnie Mae are backed by the full faith and credit of the U.S. Government.
Fannie Mae and Freddie Mac remain in conservatorship of the U.S. Government. There can be no assurances as to how or when the U.S. Government will end these conservatorships or how the future profitability of Fannie Mae and Freddie Mac and any future credit rating actions may impact the credit risk associated with Agency Securities and, therefore, the value of the Agency Securities in our securities portfolio.
Liquidity Risk
Our primary liquidity risk arises from financing long-maturity Agency Securities with short-term debt. The interest rates on our borrowings generally adjust more frequently than the interest rates on our ARMs. Accordingly, in a period of rising interest rates, our borrowing costs will usually increase faster than our interest earnings from Agency Securities.
Reference is made to the Index to Consolidated Financial Statements that appears on page F-1 of this Annual Report on Form 10-K. The Report of Independent Registered Public Accounting Firm, the Consolidated Financial Statements and the Notes to the Consolidated Financial Statements, listed in the Index to Consolidated Financial Statements, which appear beginning on page F-2 of this Annual Report on Form 10-K, are incorporated by reference to this Item 8.
None.
Evaluation of Disclosure Controls and Procedures
Our Co-CEOs and CFO participated in an evaluation by our management of the effectiveness of our disclosure controls and procedures (as defined in Rules 13a-15(e) and 15d-15(e) under the Exchange Act) as of the end of our fiscal year that ended on
December 31, 2015
. Based on their participation in that evaluation, our Co-CEOs and CFO concluded that our disclosure controls and procedures were effective as of
December 31, 2015
to ensure that information required to be disclosed in our reports filed or submitted under the Exchange Act, is recorded, processed, summarized and reported within the time periods specified in the SEC’s rules and forms, and to ensure that information required to be disclosed in our reports filed or furnished under the Exchange Act, is accumulated and communicated to our management, including our Co-CEOs and CFO, as appropriate, to allow timely decisions regarding required disclosures.
48
Internal Control Over Financial Reporting
Our Co-CEOs and CFO also participated in an evaluation by our management of any changes in our internal control over financial reporting (as defined in Rules 13a-15(f) and 15d-15(f) under the Exchange Act) that occurred during the quarter ended
December 31, 2015
. That evaluation did not identify any changes that have materially affected, or are reasonably likely to materially affect, our internal control over financial reporting.
Management Report On Internal Control Over Financial Reporting
Management is responsible for establishing and maintaining adequate internal control over financial reporting for the Company. Internal control over financial reporting is defined in Rules 13a-15(f) and 15d-15(f) under the Securities Exchange Act as a process designed by, or under the supervision of, our principal executive and principal financial officers and effected by our Board, management and other personnel to provide reasonable assurance regarding the reliability of financial reporting and the preparation of financial statements for external purposes in accordance with GAAP and includes those policies and procedures that:
|
•
|
pertain to the maintenance of records that in reasonable detail accurately and fairly reflect the transactions and dispositions of our assets;
|
|
•
|
provide reasonable assurance that transactions are recorded as necessary to permit preparation of financial statements in accordance with GAAP and that our receipts and expenditures are being made only in accordance with authorizations of our management and directors; and
|
|
•
|
provide reasonable assurance regarding prevention or timely detection of unauthorized acquisition, use or disposition of our assets that could have a material effect on the financial statements.
|
Because of its inherent limitations, internal control over financial reporting may not prevent or detect misstatements. As a result, even systems determined to be effective can provide only reasonable assurance regarding the preparation and presentation of financial statements. Moreover, projections of any evaluation of effectiveness to future periods are subject to the risks that controls may become inadequate because of changes in conditions or that the degree of compliance with the policies or procedures may deteriorate.
There have been no changes in our internal controls over financial reporting that occurred during the quarter ended
December 31, 2015
, that have materially affected, or are reasonably likely to affect our internal control over financial reporting.
Management assessed the effectiveness of the Company’s internal control over financial reporting as of
December 31, 2015
. Management used criteria set forth by the Committee of Sponsoring Organizations of the Treadway Commission (“COSO”) in Internal Control-Integrated Framework (2013) when making this assessment.
Based on management’s assessment, management concluded that, as of
December 31, 2015
, the Company’s internal control over financial reporting was effective. The Company’s independent registered public accounting firm, Deloitte & Touche LLP, has issued its attestation report on the Company’s internal control over financial reporting. This report appears on page F-3 of this Annual Report on Form 10-K.
None.
The information required by Item 10 of this Annual Report on Form 10-K will be contained in and is hereby incorporated by reference to, the proxy statement for our
2016
annual meeting of stockholders, which will be filed with the SEC pursuant to Regulation 14A within 120 days after the end of the fiscal year covered by this report.
The information required by Item 11 of this Annual Report on Form 10-K will be contained in and is hereby incorporated by reference to, the proxy statement for our
2016
annual meeting of stockholders, which will be filed with the SEC pursuant to Regulation 14A within 120 days after the end of the fiscal year covered by this report.
49
The information required by Item 12 of this Annual Report on Form 10-K will be contained in and is hereby incorporated by reference to, the proxy statement for our
2016
annual meeting of stockholders, which will be filed with the SEC pursuant to Regulation 14A within 120 days after the end of the fiscal year covered by this report.
The information required by Item 13 of this Annual Report on Form 10-K will be contained in and is hereby incorporated by reference to, the proxy statement for our
2016
annual meeting of stockholders, which will be filed with the SEC pursuant to Regulation 14A within 120 days after the end of the fiscal year covered by this report.
The information required by Item 14 of this Annual Report on Form 10-K will be contained in and is hereby incorporated by reference to, the proxy statement for our
2016
annual meeting of stockholders, which will be filed with the SEC pursuant to Regulation 14A within 120 days after the end of the fiscal year covered by this report.
50
GLOSSARY OF TERMS
“Agency Securities” means securities issued or guaranteed by Fannie Mae, Freddie Mac and Ginnie Mae; interests in or obligations backed by pools of fixed rate, hybrid adjustable rate and adjustable rate mortgage loans.
“ARMs” means Adjustable Rate Mortgage backed securities.
“AVM” means AVM L.P, a securities broker dealer, which we contract with for administering clearing and settlement services for our securities and derivative transactions, as well as assistance with financing transaction services such as repurchase financing.
“Basis swap contracts” means derivative contracts that allow us to exchange one floating interest rate basis for another, for example, 3 month LIBOR and Fed Funds Rates, thereby allowing us to diversify our floating rate basis exposures.
“Board” means ARMOUR’s Board of Directors.
“CFO” means Chief Financial Officer, James Mountain.
“CFTC” means the U.S. Commodity Futures Trading Commission.
“Co-CEOs” means our Co-Chief Executive Officers, Jeffrey Zimmer and Scott Ulm.
“Common Stock DRIP” means the Company's dividend reinvestment and stock purchase plan.
“CPOs” means commodity pool operators.
“CMBS” means commercial mortgage backed securities.
“CME” means the Chicago Mercantile Exchange.
“CMOs” means collateralized mortgage obligations.
“Code” means the Internal Revenue Code of 1986.
“CPR” means constant prepayment rate.
“Dodd-Frank Act” means the Dodd-Frank Wall Street Reform and Consumer Protection Act.
“ERISA” means Employee Retirement Income Security Act.
“Exchange Act” means the Securities Exchange Act of 1934.
“Fannie Mae” means the Federal National Mortgage Association.
“Fed” means the U.S. Federal Reserve.
“FHFA” means the Federal Housing Finance Agency.
“FHLB” means Federal Home Loan Bank.
“Freddie Mac” means the Federal Home Loan Mortgage Corporation.
“Futures Contracts” means Eurodollar Futures Contracts.
“GAAP” means accounting principles generally accepted in the United States of America.
“GDP” means gross domestic product.
“Ginnie Mae” means the Government National Mortgage Administration.
“GSE” means U.S. Government Sponsored Entity. Obligations of agencies originally established or chartered by the U.S. government to serve public purposes as specified by the U.S. Congress; these obligations are not explicitly guaranteed as to the timely payment of principal and interest by the full faith and credit of the U.S. government.
“Haircut” means the weighted average margin requirement, or the percentage amount by which the collateral value must exceed the loan amount. Among other things, it is a measure of our unsecured credit risk to our lenders.
“Hybrid” means a mortgage that has a fixed rate for an initial term after which the rate becomes adjustable according to a specific schedule.
51
GLOSSARY OF TERMS
“IRS” means Internal Revenue Service.
“JAVELIN” means JAVELIN Mortgage Investment Corp., a publicly traded REIT managed by ACM.
“LIBOR” means the London Interbank Offered Rate.
“Management Agreement” means the management agreement between ARR and ACM whereby ACM performs certain services for ARR in exchange for a specified fee.
“MBS” means mortgage backed securities, a security representing a direct interest in a pool of mortgage loans. The pass-through issuer or servicer collects the payments on the loans in the pool and “passes through” the principal and interest to the security holders on a pro rata basis.
“MGCL” means Maryland General Corporation Law.
“MRA” means master repurchase agreement. A document that outlines standard terms between the Company and counterparties for repurchase agreement transactions.
“Multi-Family MBS” means MBS issued under Fannie Mae's Delegated Underwriting System (DUS) program.
“NFA” means National Futures Association.
“Non-Agency Securities” means securities backed by residential mortgages in which we may invest, for which the payment of principal and interest is not guaranteed by a GSE or government agency.
“NYSE” means New York Stock Exchange.
“REIT” means Real Estate Investment Trust. A special purpose investment vehicle that provides investors with the ability to participate directly in the ownership or financing of real-estate related assets by pooling their capital to purchase and manage mortgage loans and/or income property.
“Repurchase Program” means the Company's common stock repurchase program authorized by our Board.
“Reverse Stock Split” means the one-for-eight reverse stock split, which was effective July 31, 2015.
“RMBS” means residential mortgage backed securities.
“SABRE” means SABRE Business Insurance LLC, a wholly owned subsidiary of ARMOUR and a captive insurance company.
“Sarbanes-Oxley Act” means a U.S. federal law that set new or enhanced standards for all U.S. public company boards, management and public accounting firms. Section 302 requires senior management to certify the accuracy of the financial statements. Section 404 requires that management and auditors establish internal controls and reporting methods on the adequacy of those controls.
“SEC” means the Securities and Exchange Commission.
“S&P 500” means Standard and Poor's 500 Stock Index
“TBA Agency Securities” means forward contracts for the purchase (“long position”) or sale (“short position”) of Agency Securities at a predetermined price, face amount, issuer, coupon and stated maturity on an agreed-upon future date.
“TRS” means taxable REIT subsidiary.
“U.S.” means United States.
“1940 Act” means the Investment Company Act of 1940.
52
(1) Financial Statements
See Item 8 – Financial Statements and Supplementary Data.
(2) Financial Statement Schedules
All supplemental schedules have been omitted since the required information is not present in amounts sufficient to require submission of the schedule, or because the required information is included in the consolidated financial statements or notes thereto.
|
(3)
|
Exhibits
|
See Exhibit Index.
53
EXHIBIT INDEX
|
Exhibit Number
|
|
Description
|
|
3.1
|
|
Amended and Restated Articles of Incorporation (Incorporated by reference to Exhibit 3.4 to ARMOUR's Current Report on Form 8-K filed with the SEC on November 12, 2009)
|
|
3.2
|
|
Articles of amendment to Amended and Restated Articles of Incorporation (Incorporated by reference to Exhibit 3.1 to ARMOUR's Current Report on Form 8-K filed with the SEC on August 8, 2011)
|
|
3.3
|
|
Articles of amendment to Amended and Restated Articles of Incorporation (Incorporated by reference to Exhibit 3.1 to ARMOUR's Current Report on Form 8-K filed with the SEC on December 1, 2011)
|
|
3.4
|
|
Articles Supplementary of 8.250% Series A Cumulative Redeemable Preferred Stock (Incorporated by reference to Exhibit 3.1 to ARMOUR's Current Report on Form 8-K filed with the SEC on June 6, 2012)
|
|
3.5
|
|
Articles Supplementary Classifying 6,000,000 shares of ARMOUR Residential REIT, Inc.'s preferred stock into additional shares of Series A Cumulative Redeemable Preferred Stock (Incorporated by reference to Exhibit 3.1 to ARMOUR's Current Report on Form 8-K filed with the SEC on July 13, 2012)
|
|
3.6
|
|
Articles Supplementary Classifying 2,000,000 shares of ARMOUR Residential REIT, Inc.'s preferred stock into additional shares of Series A Cumulative Redeemable Preferred Stock (Incorporated by reference to Exhibit 3.1 to ARMOUR's Current Report on Form 8-K filed with the SEC on July 27, 2012)
|
|
3.7
|
|
Articles of Amendment to the Charter of ARMOUR Residential REIT, Inc. (Incorporated by reference to Exhibit 3.3 to ARMOUR's Quarterly Report on Form 10-Q filed with the SEC on November 1, 2012)
|
|
3.8
|
Articles Supplementary of 7.875% Series B Cumulative Redeemable Preferred Stock (incorporated by reference to Exhibit 3.1 to ARMOUR's Current Report on Form 8-K filed with the SEC on February 12, 2013)
|
|
|
3.9
|
Articles of Amendment to the Company's Articles of Amendment and Restatement, effective July 31, 2015(Incorporated by reference to Exhibit 3.1 to ARMOUR's Current Report on Form 8-K filed with the SEC on August 3, 2015)
|
|
|
3.10
|
Articles of Amendment to the Company's Articles of Amendment and Restatement, effective July 31, 2015(Incorporated by reference to Exhibit 3.2 to ARMOUR's Current Report on Form 8-K filed with the SEC on August 3, 2015)
|
|
|
3.11
|
|
Amended and Restated Bylaws, as amended on October 28, 2014 (Incorporated by reference to Exhibit 3.1 to ARMOUR's Quarterly Report on Form 10-Q filed with the SEC on October 29, 2014)
|
|
4.1
|
|
Specimen Common Stock Certificate of ARMOUR Residential REIT, Inc. (incorporated by reference to Exhibit 4.2 of ARMOUR's Registration Statement on Form S-4 (Reg. No. 333-160870))
|
|
4.2
|
Specimen 8.250% Series A Cumulative Redeemable Preferred Stock Certificate of ARMOUR Residential REIT, Inc. (incorporated by reference to Exhibit 4.1 to the ARMOUR's Registration Statement of Form 8-A (Reg. No. 001-34766) filed with the SEC on June 7, 2012)
|
|
|
4.3
|
|
Specimen 7.875% Series B Cumulative Redeemable Preferred Stock Certificate of ARMOUR Residential REIT, Inc. (incorporated by reference to Exhibit 4.2 of ARMOUR's Registration Statement on Form 8-A (Reg. No. 001-34766) filed with the SEC on February 12, 2013)
|
|
10.1
|
|
ARMOUR Residential REIT, Inc. Second Amended and Restated 2009 Stock Incentive Plan (Incorporated by reference to Exhibit 10.1 to ARMOUR's Current Report on Form 8-K filed with the SEC on May 9, 2014) †††
|
|
10.2
|
|
Second Amended and Restated Management Agreement, dated June 18, 2012, between ARMOUR and ARMOUR Residential Management LLC (Incorporated by reference to Exhibit 10.1 to ARMOUR's Current Report on Form 8-K filed with the SEC on June 22, 2012)
|
|
10.3
|
Third Amended and Restated Management Agreement, dated February 25, 2014, between ARMOUR and ARRM (incorporated by reference to Exhibit 10.3 to ARMOUR's Annual Report on Form 10-K filed with the SEC on February 27, 2014)
|
|
|
10.4
|
Fourth Amended and Restated Management Agreement, dated February 23, 2015 between ARMOUR Residential REIT, Inc. and ARMOUR Capital Management LP (Incorporated by reference to Exhibit 10.4 to ARMOUR's Annual Report on Form 10-K filed with the SEC on February 24, 2015)
|
|
|
10.5
|
|
Sub-Management Agreement, dated November 6, 2009, by and among Staton Bell Blank Check LLC, ARMOUR Residential Management LLC, ARMOUR Residential REIT, Inc. and certain individuals (Incorporated by reference to Exhibit 4.4 to ARMOUR's Current Report on Form 8-K filed with the SEC on November 12, 2009)
|
|
10.6
|
First Amended and Restated Sub-Management Agreement, dated February 23, 2015 by and among Staton Bell Blank Check LLC, ARMOUR Capital Management LP and ARMOUR Residential REIT, Inc. (Incorporated by reference to Exhibit 10.6 to ARMOUR's Annual Report on Form 10-K filed with the SEC on February 24, 2015)
|
|
|
10.7
|
|
Distribution Agreement, dated February 18, 2011, by and among the Company, Ladenburg Thalmann & Co. Inc. and JMP Securities LLC (Incorporated by reference to Exhibit 1.1 to ARMOUR's Current Report on Form 8-K filed with the SEC on February 18, 2011)
|
|
10.8
|
|
Equity Distribution Agreement, dated October 11, 2011, by and among the Company, Deutsche Bank Securities Inc., JMP Securities LLC and Ladenburg Thalmann & Co. Inc. (Incorporated by reference to Exhibit 1.1 to ARMOUR's Current Report on Form 8-K filed with the SEC on October 12, 2011)
|
|
10.9
|
|
At Market Issuance Sales Agreement, dated July 13, 2012, among ARMOUR Residential REIT, Inc., ARMOUR Residential Management LLC and MLV & Co. LLC.(Incorporated by reference to Exhibit 1.1 to ARMOUR's Current Report on Form 8-K filed with the SEC on July 13, 2012)
|
|
10.10
|
|
Equity Distribution Agreement, dated July 27, 2012, among ARMOUR Residential REIT, Inc., ARMOUR Residential Management LLC and Citadel Securities LLC.(Incorporated by reference to Exhibit 1.1 to ARMOUR's Current Report on Form 8-K filed with the SEC on July 27, 2012)
|
|
12.1
|
|
Statement of computation of ratio of earnings to fixed charges and ratio of earnings to combined fixed charges and preferred stock dividends †
|
|
23.1
|
|
Consent of Deloitte & Touche LLP †
|
|
31.1
|
|
Certification of Chief Executive Officer Pursuant to SEC Rule 13a-14(a)/15d-14(a) †
|
|
31.2
|
|
Certification of Chief Executive Officer Pursuant to SEC Rule 13a-14(a)/15d-14(a) †
|
|
31.3
|
|
Certification of Chief Financial Officer Pursuant to SEC Rule 13a14(a)/15d-14(a) †
|
|
32.1
|
|
Certification of Chief Executive Officer Pursuant to 18 U.S.C. §1350 ††
|
|
32.2
|
|
Certification of Chief Executive Officer Pursuant to 18 U.S.C. §1350 ††
|
|
32.3
|
|
Certification of Chief Financial Officer Pursuant to 18 U.S.C. §1350 ††
|
|
101.INS
|
|
XBRL Instance Document
|
|
101.SCH
|
|
XBRL Taxonomy Extension Schema Document
|
|
101.CAL
|
|
XBRL Taxonomy Extension Calculation Linkbase Document
|
|
101.DEF
|
|
XBRL Taxonomy Extension Definition Linkbase Document
|
|
101.LAB
|
|
XBRL Taxonomy Extension Label Linkbase Document
|
|
101.PRE
|
|
XBRL Taxonomy Extension Presentation Linkbase Document
|
|
†
|
Filed herewith.
|
|
|
††
|
Furnished herewith.
|
|
|
†††
|
Management contract or compensatory plan, contract or arrangement.
|
|
Index to Consolidated Financial Statements
|
|
|
|
|
|
|
|
|
|
|
|
|
|
|
|
|
|
|
|
|
F- 1
REPORT OF INDEPENDENT REGISTERED PUBLIC ACCOUNTING FIRM
To the Board of Directors and Stockholders of
ARMOUR Residential REIT, Inc.
Vero Beach, Florida
We have audited the accompanying consolidated balance sheets of ARMOUR
Residential REIT, Inc
.
and subsidiary (the “Company”) as of December 31, 2015 and 2014, and the related consolidated statements of operations, comprehensive income, stockholders' equity, and cash flows for each of the three years in the period ended December 31, 2015. These financial statements are the responsibility of the Company's management. Our responsibility is to express an opinion on these financial statements based on our audits.
We conducted our audits in accordance with the standards of the Public Company Accounting Oversight Board (United States). Those standards require that we plan and perform the audit to obtain reasonable assurance about whether the financial statements are free of material misstatement. An audit includes examining, on a test basis, evidence supporting the amounts and disclosures in the financial statements. An audit also includes assessing the accounting principles used and significant estimates made by management, as well as evaluating the overall financial statement presentation. We believe that our audits provide a reasonable basis for our opinion.
In our opinion, such consolidated financial statements present fairly, in all material respects, the financial position of ARMOUR Residential REIT, Inc. and subsidiary as of December 31, 2015 and 2014, and the results of their operations and their cash flows for each of the three years in the period ended December 31, 2015, in conformity with accounting principles generally accepted in the United States of America.
We have also audited, in accordance with the standards of the Public Company Accounting Oversight Board (United States), the Company's internal control over financial reporting as of December 31, 2015, based on the criteria established in
Internal Control-Integrated Framework (2013)
issued by the Committee of Sponsoring Organizations of the Treadway Commission and our report dated February 18, 2016 expressed an unqualified opinion on the Company's internal control over financial reporting.
/s/ Deloitte & Touche LLP
Certified Public Accountants
Miami, Florida
February 18, 2016
F- 2
REPORT OF INDEPENDENT REGISTERED PUBLIC ACCOUNTING FIRM
To the Board of Directors and Stockholders of
ARMOUR Residential REIT, Inc.
Vero Beach, Florida
We have audited the internal control over financial reporting of ARMOUR Residential REIT, Inc. and subsidiary (the “Company”) as of December 31, 2015, based on the criteria established in
Internal Control - Integrated Framework (2013)
issued by the Committee of Sponsoring Organizations of the Treadway Commission. The Company's management is responsible for maintaining effective internal control over financial reporting and for its assessment of the effectiveness of internal control over financial reporting, included in the accompanying Management Report On Internal Control Over Financial Reporting. Our responsibility is to express an opinion on the Company's internal control over financial reporting based on our audit.
We conducted our audit in accordance with the standards of the Public Company Accounting Oversight Board (United States). Those standards require that we plan and perform the audit to obtain reasonable assurance about whether effective internal control over financial reporting was maintained in all material respects. Our audit included obtaining an understanding of internal control over financial reporting, assessing the risk that a material weakness exists, testing and evaluating the design and operating effectiveness of internal control based on the assessed risk, and performing such other procedures as we considered necessary in the circumstances. We believe that our audit provides a reasonable basis for our opinion.
A company's internal control over financial reporting is a process designed by, or under the supervision of, the company's principal executive and principal financial officers, or persons performing similar functions, and effected by the company's board of directors, management, and other personnel to provide reasonable assurance regarding the reliability of financial reporting and the preparation of financial statements for external purposes in accordance with generally accepted accounting principles. A company's internal control over financial reporting includes those policies and procedures that (1) pertain to the maintenance of records that, in reasonable detail, accurately and fairly reflect the transactions and dispositions of the assets of the company; (2) provide reasonable assurance that transactions are recorded as necessary to permit preparation of financial statements in accordance with generally accepted accounting principles, and that receipts and expenditures of the company are being made only in accordance with authorizations of management and directors of the company; and (3) provide reasonable assurance regarding prevention or timely detection of unauthorized acquisition, use, or disposition of the company's assets that could have a material effect on the financial statements
Because of the inherent limitations of internal control over financial reporting, including the possibility of collusion or improper management override of controls, material misstatements due to error or fraud may not be prevented or detected on a timely basis. Also, projections of any evaluation of the effectiveness of the internal control over financial reporting to future periods are subject to the risk that the controls may become inadequate because of changes in conditions, or that the degree of compliance with the policies or procedures may deteriorate.
In our opinion, the Company maintained, in all material respects, effective internal control over financial reporting as of December 31, 2015, based on the criteria established in
Internal Control - Integrated Framework (2013)
issued by the Committee of Sponsoring Organizations of the Treadway Commission.
We have also audited, in accordance with the standards of the Public Company Accounting Oversight Board (United States), the consolidated financial statements as of and for the year ended December 31, 2015 of the Company and our report dated February 18, 2016 expressed an unqualified opinion on those financial statements.
/s/ Deloitte & Touche LLP
Certified Public Accountants
Miami, Florida
February 18, 2016
F- 3
ARMOUR Residential REIT, Inc. and Subsidiary
(in thousands, except per share amounts)
|
|
December 31, 2015
|
December 31, 2014
|
||||||
|
Assets
|
|
|
||||||
|
Cash
|
$
|
289,925
|
|
$
|
494,561
|
|
||
|
Cash collateral posted to counterparties
|
263,799
|
|
129,004
|
|
||||
|
Agency Securities, available for sale, at fair value (including pledged securities of $12,109,868 and $14,370,847)
|
12,461,556
|
|
15,297,529
|
|
||||
|
Receivable for unsettled sales (including pledged securities of $251,251 in 2014)
|
—
|
|
260,598
|
|
||||
|
Derivatives, at fair value
|
999
|
|
60,518
|
|
||||
|
Principal payments receivable
|
37
|
|
93
|
|
||||
|
Accrued interest receivable
|
34,500
|
|
41,915
|
|
||||
|
Prepaid and other assets
|
4,461
|
|
1,580
|
|
||||
|
Total Assets
|
$
|
13,055,277
|
|
$
|
16,285,798
|
|
||
|
Liabilities and Stockholders’ Equity
|
|
|
||||||
|
Liabilities:
|
|
|
||||||
|
Repurchase agreements
|
$
|
11,570,481
|
|
$
|
13,881,921
|
|
||
|
Cash collateral posted by counterparties
|
—
|
|
48,240
|
|
||||
|
Payable for unsettled purchases
|
—
|
|
445,292
|
|
||||
|
Derivatives, at fair value
|
233,301
|
|
137,393
|
|
||||
|
Accrued interest payable- repurchase agreements
|
7,724
|
|
7,012
|
|
||||
|
Accounts payable and other accrued expenses
|
18,605
|
|
16,649
|
|
||||
|
Total Liabilities
|
$
|
11,830,111
|
|
$
|
14,536,507
|
|
||
|
Commitments and contingencies (Note 9)
|
|
|
||||||
|
Stockholders’ Equity:
|
|
|
||||||
|
Preferred stock, $0.001 par value, 50,000 shares authorized;
|
|
|
||||||
|
8.250% Series A Cumulative Preferred Stock; 2,181 issued and outstanding ($54,514 aggregate liquidation preference)
|
2
|
|
2
|
|
||||
|
7.875% Series B Cumulative Preferred Stock; 5,650 issued and outstanding ($141,250 aggregate liquidation preference)
|
6
|
|
6
|
|
||||
|
Common stock, $0.001 par value, 125,000 shares authorized, 36,682 and 44,145 shares issued and outstanding at December 31, 2015 and December 31, 2014
|
37
|
|
44
|
|
||||
|
Additional paid-in capital
|
2,559,361
|
|
2,717,854
|
|
||||
|
Accumulated deficit
|
(1,266,938
|
)
|
(1,052,969
|
)
|
||||
|
Accumulated other comprehensive income (loss)
|
(67,302
|
)
|
84,354
|
|
||||
|
Total Stockholders’ Equity
|
$
|
1,225,166
|
|
$
|
1,749,291
|
|
||
|
Total Liabilities and Stockholders’ Equity
|
$
|
13,055,277
|
|
$
|
16,285,798
|
|
||
See notes to consolidated financial statements.
F- 4
ARMOUR Residential REIT, Inc. and Subsidiary
(in thousands, except per share amounts)
|
|
For the Year Ended
|
|||||||||||
|
|
December 31, 2015
|
December 31, 2014
|
December 31, 2013
|
|||||||||
|
Interest income, net of amortization of premium on Agency Securities
|
$
|
365,300
|
|
$
|
450,927
|
|
$
|
505,443
|
|
|||
|
Interest expense- repurchase agreements
|
(59,278
|
)
|
(59,562
|
)
|
(83,113
|
)
|
||||||
|
Interest expense- U.S. Treasury Securities sold short
|
—
|
|
(5,551
|
)
|
(1,437
|
)
|
||||||
|
Net Interest Income
|
$
|
306,022
|
|
$
|
385,814
|
|
|
$
|
420,893
|
|
||
|
Other Income (Loss):
|
|
|
||||||||||
|
Realized gain (loss) on sale of Agency Securities (reclassified from Other comprehensive income (loss))
|
(11,546
|
)
|
68,770
|
|
(593,498
|
)
|
||||||
|
Other than temporary impairment of Agency Securities (reclassified from Other comprehensive income (loss))
|
—
|
|
—
|
|
(401,541
|
)
|
||||||
|
Gain (loss) on short sale of U.S. Treasury Securities
|
—
|
|
(14,688
|
)
|
15,508
|
|
||||||
|
Subtotal
|
$
|
(11,546
|
)
|
$
|
54,082
|
|
|
$
|
(979,531
|
)
|
||
|
Realized loss on derivatives (1)
|
(107,070
|
)
|
(118,716
|
)
|
(135,908
|
)
|
||||||
|
Unrealized gain (loss) on derivatives
|
(181,662
|
)
|
(462,630
|
)
|
544,643
|
|
||||||
|
Subtotal
|
$
|
(288,732
|
)
|
$
|
(581,346
|
)
|
|
$
|
408,735
|
|
||
|
Total Other Loss
|
$
|
(300,278
|
)
|
$
|
(527,264
|
)
|
$
|
(570,796
|
)
|
|||
|
Expenses:
|
|
|
||||||||||
|
Management fee
|
27,292
|
|
27,857
|
|
28,141
|
|
||||||
|
Professional fees
|
3,117
|
|
3,735
|
|
3,311
|
|
||||||
|
Insurance
|
690
|
|
726
|
|
543
|
|
||||||
|
Compensation
|
2,291
|
|
2,796
|
|
3,047
|
|
||||||
|
Other
|
3,559
|
|
2,484
|
|
2,109
|
|
||||||
|
Total Expenses
|
$
|
36,949
|
|
$
|
37,598
|
|
|
$
|
37,151
|
|
||
|
Loss before taxes
|
(31,205
|
)
|
(179,048
|
)
|
(187,054
|
)
|
||||||
|
Income tax benefit
|
—
|
|
—
|
|
10
|
|
||||||
|
Net Loss
|
$
|
(31,205
|
)
|
$
|
(179,048
|
)
|
|
$
|
(187,044
|
)
|
||
|
Dividends declared on preferred stock
|
(15,622
|
)
|
(15,620
|
)
|
(14,213
|
)
|
||||||
|
Net Loss related to common stockholders
|
$
|
(46,827
|
)
|
$
|
(194,668
|
)
|
|
$
|
(201,257
|
)
|
||
|
Net loss related per share to common stockholders (Note 12):
|
|
|
||||||||||
|
Basic
|
$
|
(1.09
|
)
|
$
|
(4.32
|
)
|
$
|
(4.40
|
)
|
|||
|
Diluted
|
$
|
(1.09
|
)
|
$
|
(4.32
|
)
|
$
|
(4.40
|
)
|
|||
|
Dividends declared per common share
|
$
|
3.89
|
|
$
|
4.80
|
|
$
|
6.48
|
|
|||
|
Weighted average common shares outstanding:
|
|
|
||||||||||
|
Basic
|
42,780
|
|
44,654
|
|
45,354
|
|
||||||
|
Diluted
|
42,780
|
|
44,654
|
|
45,354
|
|
||||||
(1) Interest expense related to our interest rate swap contracts is recorded as realized loss on derivatives on the consolidated statements of operations. For additional information, see Note 8 to the consolidated financial statements.
See notes to consolidated financial statements.
F- 5
ARMOUR Residential REIT, Inc. and Subsidiary
CONSOLIDATED STATEMENTS OF COMPREHENSIVE INCOME (LOSS)
(in thousands)
|
|
For the Year Ended
|
|||||||||||
|
|
December 31, 2015
|
December 31, 2014
|
December 31, 2013
|
|||||||||
|
Net Loss
|
$
|
(31,205
|
)
|
$
|
(179,048
|
)
|
$
|
(187,044
|
)
|
|||
|
Other comprehensive income (loss):
|
|
|
||||||||||
|
Reclassification adjustment for realized (gain) loss on sale of available for sale Agency Securities
|
11,546
|
|
(68,770
|
)
|
593,498
|
|
||||||
|
Reclassification adjustment for other than temporary impairment of available for sale Agency Securities
|
—
|
|
—
|
|
401,541
|
|
||||||
|
Net unrealized gain (loss) on available for sale Agency Securities
|
(163,202
|
)
|
343,604
|
|
(1,416,083
|
)
|
||||||
|
Other comprehensive income (loss)
|
$
|
(151,656
|
)
|
$
|
274,834
|
|
|
$
|
(421,044
|
)
|
||
|
Comprehensive Income (Loss)
|
$
|
(182,861
|
)
|
$
|
95,786
|
|
|
$
|
(608,088
|
)
|
||
See notes to the consolidated financial statements.
F- 6
ARMOUR Residential REIT, Inc. and Subsidiary
CONSOLIDATED STATEMENT OF STOCKHOLDERS’ EQUITY
(in thousands, except per share amounts)
|
|
Preferred Stock
|
Common Stock
|
|
|
|
|
||||||||||||||||||||||||||||||||||||||||||
|
|
8.250% Series A
|
7.875% Series B
|
|
|
|
|
|
|
|
|||||||||||||||||||||||||||||||||||||||
|
|
Shares
|
Par Amount
|
Additional Paid-in Capital
|
Shares
|
Par Amount
|
Additional Paid-in Capital
|
Shares
|
Par Amount
|
Additional Paid-in Capital
|
Total
Additional Paid-in
Capital
|
Accumulated
Deficit
|
Accumulated
Other
Comprehensive Income (Loss)
|
Total
|
|||||||||||||||||||||||||||||||||||
|
Balance January 1, 2013
|
2,006
|
|
$
|
2
|
|
$
|
48,792
|
|
—
|
|
$
|
—
|
|
$
|
—
|
|
38,627
|
|
$
|
39
|
|
$
|
2,177,676
|
|
$
|
2,226,468
|
|
$
|
(149,298
|
)
|
$
|
230,564
|
|
$
|
2,307,775
|
|
||||||||||||
|
Series A Preferred dividends
|
—
|
|
$
|
—
|
|
$
|
—
|
|
—
|
|
$
|
—
|
|
$
|
—
|
|
—
|
|
—
|
|
—
|
|
—
|
|
(4,480
|
)
|
—
|
|
(4,480
|
)
|
||||||||||||||||||
|
Series B Preferred dividends
|
—
|
|
$
|
—
|
|
$
|
—
|
|
—
|
|
$
|
—
|
|
$
|
—
|
|
—
|
|
—
|
|
—
|
|
—
|
|
(9,733
|
)
|
—
|
|
(9,733
|
)
|
||||||||||||||||||
|
Common stock dividends
|
—
|
|
$
|
—
|
|
$
|
—
|
|
—
|
|
$
|
—
|
|
$
|
—
|
|
—
|
|
—
|
|
—
|
|
—
|
|
(292,583
|
)
|
—
|
|
(292,583
|
)
|
||||||||||||||||||
|
Issuance of Series A Preferred stock, net
|
175
|
|
$
|
—
|
|
$
|
4,380
|
|
—
|
|
$
|
—
|
|
$
|
—
|
|
—
|
|
—
|
|
—
|
|
4,380
|
|
—
|
|
—
|
|
4,380
|
|
||||||||||||||||||
|
Issuance of Series B Preferred stock, net
|
—
|
|
$
|
—
|
|
$
|
—
|
|
5,650
|
|
$
|
6
|
|
$
|
136,547
|
|
—
|
|
—
|
|
—
|
|
136,547
|
|
—
|
|
—
|
|
136,553
|
|
||||||||||||||||||
|
Issuance of common stock, net
|
—
|
|
$
|
—
|
|
$
|
—
|
|
—
|
|
$
|
—
|
|
$
|
—
|
|
8,133
|
|
8
|
|
438,574
|
|
438,574
|
|
—
|
|
—
|
|
438,582
|
|
||||||||||||||||||
|
Stock based compensation, net of withholding requirements
|
—
|
|
$
|
—
|
|
$
|
—
|
|
—
|
|
$
|
—
|
|
$
|
—
|
|
38
|
|
—
|
|
1,516
|
|
1,516
|
|
—
|
|
—
|
|
1,516
|
|
||||||||||||||||||
|
Common stock repurchased
|
—
|
|
$
|
—
|
|
$
|
—
|
|
—
|
|
$
|
—
|
|
$
|
—
|
|
(2,096
|
)
|
(2
|
)
|
(72,692
|
)
|
(72,692
|
)
|
—
|
|
—
|
|
(72,694
|
)
|
||||||||||||||||||
|
Net loss
|
—
|
|
$
|
—
|
|
$
|
—
|
|
—
|
|
$
|
—
|
|
$
|
—
|
|
—
|
|
—
|
|
—
|
|
—
|
|
(187,044
|
)
|
—
|
|
(187,044
|
)
|
||||||||||||||||||
|
Other comprehensive loss
|
—
|
|
$
|
—
|
|
$
|
—
|
|
—
|
|
$
|
—
|
|
$
|
—
|
|
—
|
|
—
|
|
—
|
|
—
|
|
—
|
|
(421,044
|
)
|
(421,044
|
)
|
||||||||||||||||||
|
Balance, December 31, 2013
|
2,181
|
|
|
$
|
2
|
|
|
$
|
53,172
|
|
|
5,650
|
|
|
$
|
6
|
|
|
$
|
136,547
|
|
|
44,702
|
|
|
$
|
45
|
|
|
$
|
2,545,074
|
|
|
$
|
2,734,793
|
|
|
$
|
(643,138
|
)
|
|
$
|
(190,480
|
)
|
|
$
|
1,901,228
|
|
|
Series A Preferred dividends
|
—
|
|
$
|
—
|
|
$
|
—
|
|
—
|
|
$
|
—
|
|
$
|
—
|
|
—
|
|
—
|
|
—
|
|
—
|
|
(4,497
|
)
|
—
|
|
(4,497
|
)
|
||||||||||||||||||
|
Series B Preferred dividends
|
—
|
|
$
|
—
|
|
$
|
—
|
|
—
|
|
$
|
—
|
|
$
|
—
|
|
—
|
|
—
|
|
—
|
|
—
|
|
(11,123
|
)
|
—
|
|
(11,123
|
)
|
||||||||||||||||||
|
Common stock dividends
|
—
|
|
$
|
—
|
|
$
|
—
|
|
—
|
|
$
|
—
|
|
$
|
—
|
|
—
|
|
—
|
|
—
|
|
—
|
|
(215,163
|
)
|
—
|
|
(215,163
|
)
|
||||||||||||||||||
|
Issuance of common stock, net
|
—
|
|
$
|
—
|
|
$
|
—
|
|
—
|
|
$
|
—
|
|
$
|
—
|
|
8
|
|
—
|
|
269
|
|
269
|
|
—
|
|
—
|
|
269
|
|
||||||||||||||||||
|
Stock based compensation, net of withholding requirements
|
—
|
|
$
|
—
|
|
$
|
—
|
|
—
|
|
$
|
—
|
|
$
|
—
|
|
35
|
|
—
|
|
1,153
|
|
1,153
|
|
—
|
|
—
|
|
1,153
|
|
||||||||||||||||||
|
Common stock repurchased
|
—
|
|
$
|
—
|
|
$
|
—
|
|
—
|
|
$
|
—
|
|
$
|
—
|
|
(600
|
)
|
(1
|
)
|
(18,361
|
)
|
(18,361
|
)
|
—
|
|
—
|
|
(18,362
|
)
|
||||||||||||||||||
|
Net loss
|
—
|
|
$
|
—
|
|
$
|
—
|
|
—
|
|
$
|
—
|
|
$
|
—
|
|
—
|
|
—
|
|
—
|
|
—
|
|
(179,048
|
)
|
—
|
|
(179,048
|
)
|
||||||||||||||||||
|
Other comprehensive income
|
—
|
|
$
|
—
|
|
$
|
—
|
|
—
|
|
$
|
—
|
|
$
|
—
|
|
—
|
|
—
|
|
—
|
|
—
|
|
—
|
|
274,834
|
|
274,834
|
|
||||||||||||||||||
|
Balance, December 31, 2014
|
2,181
|
|
|
$
|
2
|
|
|
$
|
53,172
|
|
|
5,650
|
|
|
$
|
6
|
|
|
$
|
136,547
|
|
|
44,145
|
|
|
$
|
44
|
|
|
$
|
2,528,135
|
|
|
$
|
2,717,854
|
|
|
$
|
(1,052,969
|
)
|
|
$
|
84,354
|
|
|
$
|
1,749,291
|
|
|
Series A Preferred dividends
|
—
|
|
—
|
|
—
|
|
—
|
|
—
|
|
—
|
|
—
|
|
—
|
|
—
|
|
—
|
|
(4,498
|
)
|
—
|
|
(4,498
|
)
|
||||||||||||||||||||||
|
Series B Preferred dividends
|
—
|
|
—
|
|
—
|
|
—
|
|
—
|
|
—
|
|
—
|
|
—
|
|
—
|
|
—
|
|
(11,124
|
)
|
—
|
|
(11,124
|
)
|
||||||||||||||||||||||
|
Common stock dividends
|
—
|
|
—
|
|
—
|
|
—
|
|
—
|
|
—
|
|
—
|
|
—
|
|
—
|
|
—
|
|
(167,142
|
)
|
—
|
|
(167,142
|
)
|
||||||||||||||||||||||
|
Issuance of common stock, net
|
—
|
|
—
|
|
—
|
|
—
|
|
—
|
|
—
|
|
6
|
|
—
|
|
147
|
|
147
|
|
—
|
|
—
|
|
147
|
|
||||||||||||||||||||||
|
Stock based compensation, net of withholding requirements
|
—
|
|
—
|
|
—
|
|
—
|
|
—
|
|
—
|
|
41
|
|
1
|
|
952
|
|
952
|
|
—
|
|
—
|
|
953
|
|
||||||||||||||||||||||
|
Common stock repurchased
|
—
|
|
—
|
|
—
|
|
—
|
|
—
|
|
—
|
|
(7,510
|
)
|
(8
|
)
|
(159,592
|
)
|
(159,592
|
)
|
—
|
|
—
|
|
(159,600
|
)
|
||||||||||||||||||||||
|
Net loss
|
—
|
|
—
|
|
—
|
|
—
|
|
—
|
|
—
|
|
—
|
|
—
|
|
—
|
|
—
|
|
(31,205
|
)
|
—
|
|
(31,205
|
)
|
||||||||||||||||||||||
|
Other comprehensive loss
|
—
|
|
—
|
|
—
|
|
—
|
|
—
|
|
—
|
|
—
|
|
—
|
|
—
|
|
—
|
|
—
|
|
(151,656
|
)
|
(151,656
|
)
|
||||||||||||||||||||||
|
Balance, December 31, 2015
|
2,181
|
|
$
|
2
|
|
$
|
53,172
|
|
5,650
|
|
$
|
6
|
|
$
|
136,547
|
|
36,682
|
|
$
|
37
|
|
$
|
2,369,642
|
|
$
|
2,559,361
|
|
$
|
(1,266,938
|
)
|
$
|
(67,302
|
)
|
$
|
1,225,166
|
|
||||||||||||
See notes to consolidated financial statements.
F- 7
ARMOUR Residential REIT, Inc. and Subsidiary
(in thousands)
|
|
For the Year Ended
|
|||||||||||
|
|
December 31, 2015
|
December 31, 2014
|
December 31, 2013
|
|||||||||
|
Cash Flows From Operating Activities:
|
|
|
||||||||||
|
Net loss
|
$
|
(31,205
|
)
|
$
|
(179,048
|
)
|
$
|
(187,044
|
)
|
|||
|
Adjustments to reconcile net income (loss) to net cash provided by operating activities:
|
|
|
||||||||||
|
Net amortization of premium on Agency Securities
|
109,589
|
|
82,965
|
|
157,645
|
|
||||||
|
Realized (gain) loss on sale of Agency Securities
|
11,546
|
|
(68,770
|
)
|
593,498
|
|
||||||
|
Other than temporary impairment of Agency Securities
|
—
|
|
—
|
|
401,541
|
|
||||||
|
(Gain) Loss on short sale of U.S. Treasury Securities
|
—
|
|
14,688
|
|
(15,508
|
)
|
||||||
|
Stock based compensation
|
953
|
|
1,153
|
|
1,516
|
|
||||||
|
Changes in operating assets and liabilities:
|
||||||||||||
|
Decrease in accrued interest receivable
|
6,816
|
|
703
|
|
13,411
|
|
||||||
|
Increase in prepaid and other assets
|
(2,881
|
)
|
(728
|
)
|
(448
|
)
|
||||||
|
(Increase) decrease in derivatives, at fair value
|
155,427
|
|
483,068
|
|
(591,366
|
)
|
||||||
|
Increase (decrease) in accrued interest payable- repurchase agreements
|
712
|
|
383
|
|
(3,435
|
)
|
||||||
|
Decrease in accounts payable and other accrued expenses
|
(12,702
|
)
|
(19,314
|
)
|
(704
|
)
|
||||||
|
Net cash provided by operating activities
|
$
|
238,255
|
|
$
|
315,100
|
|
|
$
|
369,106
|
|
||
|
Cash Flows From Investing Activities:
|
|
|
||||||||||
|
Purchases of Agency Securities
|
(5,145,847
|
)
|
(12,505,285
|
)
|
(15,029,408
|
)
|
||||||
|
Principal repayments of Agency Securities
|
1,910,795
|
|
1,806,581
|
|
3,135,502
|
|
||||||
|
Proceeds from sales of Agency Securities
|
5,614,195
|
|
10,334,920
|
|
15,611,917
|
|
||||||
|
Disbursements on reverse repurchase agreements
|
—
|
|
(18,076,531
|
)
|
(11,239,305
|
)
|
||||||
|
Receipts from reverse repurchase agreements
|
—
|
|
18,076,531
|
|
11,239,305
|
|
||||||
|
(Increase) decrease in cash collateral
|
(183,035
|
)
|
(432,692
|
)
|
617,480
|
|
||||||
|
Net cash provided by (used in) investing activities
|
$
|
2,196,108
|
|
$
|
(796,476
|
)
|
|
$
|
4,335,491
|
|
||
|
Cash Flows From Financing Activities:
|
|
|
||||||||||
|
Issuance of Series A Preferred stock, net of expenses
|
—
|
|
—
|
|
4,380
|
|
||||||
|
Issuance of Series B Preferred stock, net of expenses
|
—
|
|
—
|
|
136,553
|
|
||||||
|
Issuance of common stock, net of expenses
|
147
|
|
263
|
|
438,566
|
|
||||||
|
Proceeds from repurchase agreements
|
90,941,440
|
|
80,982,646
|
|
122,761,377
|
|
||||||
|
Principal repayments on repurchase agreements
|
(93,252,880
|
)
|
(80,252,229
|
)
|
(127,975,968
|
)
|
||||||
|
Proceeds from short sales of U.S. Treasury Securities
|
—
|
|
2,005,363
|
|
2,783,711
|
|
||||||
|
Purchases of U.S. Treasury Securities
|
—
|
|
(2,020,051
|
)
|
(2,768,203
|
)
|
||||||
|
Series A Preferred stock dividends paid
|
(4,498
|
)
|
(4,497
|
)
|
(4,480
|
)
|
||||||
|
Series B Preferred stock dividends paid
|
(11,124
|
)
|
(11,123
|
)
|
(9,733
|
)
|
||||||
|
Common stock dividends paid
|
(167,142
|
)
|
(215,163
|
)
|
(292,592
|
)
|
||||||
|
Common stock repurchased
|
(144,942
|
)
|
(5,750
|
)
|
(53,012
|
)
|
||||||
|
Net cash provided by (used in) financing activities
|
$
|
(2,638,999
|
)
|
$
|
479,459
|
|
|
$
|
(4,979,401
|
)
|
||
|
Net decrease in cash
|
(204,636
|
)
|
(1,917
|
)
|
(274,804
|
)
|
||||||
|
Cash - beginning of year
|
494,561
|
|
496,478
|
|
771,282
|
|
||||||
|
Cash - end of year
|
$
|
289,925
|
|
$
|
494,561
|
|
|
$
|
496,478
|
|
||
|
Supplemental Disclosure:
|
|
|
||||||||||
|
Cash paid during the year for interest
|
$
|
218,503
|
|
$
|
215,573
|
|
$
|
226,549
|
|
|||
|
Non-Cash Investing and Financing Activities:
|
|
|
||||||||||
|
Receivable for unsettled sales
|
$
|
—
|
|
$
|
260,598
|
|
$
|
—
|
|
|||
|
Payable for unsettled purchases
|
$
|
—
|
|
$
|
445,292
|
|
$
|
159,159
|
|
|||
|
Net unrealized gain (loss) on available for sale Agency Securities
|
$
|
(163,202
|
)
|
$
|
343,604
|
|
$
|
(1,416,083
|
)
|
|||
|
Amounts receivable for issuance of common stock
|
$
|
—
|
|
$
|
6
|
|
$
|
16
|
|
|||
|
Amounts payable for common stock repurchased
|
$
|
(14,658
|
)
|
$
|
(12,612
|
)
|
$
|
(19,682
|
)
|
|||
See notes to consolidated financial statements
F- 8
ARMOUR Residential REIT, Inc. and Subsidiary
NOTES TO CONSOLIDATED FINANCIAL STATEMENTS
(in thousands, except per share amounts)
The accompanying consolidated financial statements have been prepared in accordance with generally accepted accounting principles in the U.S. (“GAAP”). The consolidated financial statements include the accounts of ARMOUR Residential REIT, Inc. and its subsidiary. All intercompany accounts and transactions have been eliminated. The preparation of financial statements in conformity with GAAP requires management to make estimates and assumptions that affect the reported amounts of assets and liabilities and disclosure of contingent assets and liabilities at the date of the financial statements and the reported amounts of revenues and expenses during the reporting period. Actual results could differ from those estimates. Significant estimates affecting the accompanying consolidated financial statements include the valuation of Agency Securities (as defined below), including an assessment of whether other-than-temporary impairment (“OTTI”) exists, and derivative instruments. All per share amounts, common shares outstanding and stock-based compensation amounts for all periods presented reflect our one-for-eight reverse stock split (the “Reverse Stock Split”), which was effective July 31, 2015.
References to “we,” “us,” “our,” “ARMOUR” or the “Company” are to ARMOUR Residential REIT, Inc. References to “ACM” are to ARMOUR Capital Management LP, a Delaware limited partnership.
We are an externally managed Maryland corporation incorporated in 2008, managed by ACM, an investment advisor registered with the SEC (see
Note 9 -Commitments and Contingencies
and
Note 14 -Related Party Transactions
for additional discussion). We invest in residential mortgage backed securities issued or guaranteed by a United States (“U.S.”) Government-sponsored entity (“GSE”), such as the Federal National Mortgage Association (Fannie Mae), the Federal Home Loan Mortgage Corporation (Freddie Mac) or guaranteed by the Government National Mortgage Administration (Ginnie Mae) (collectively, “Agency Securities”). We also may invest in other securities backed by residential mortgages for which the payment of principal and interest is not guaranteed by a GSE or government agency (collectively, “Non-Agency Securities”). While we remain committed to investing in Agency Securities for so long as an adequate supply and pricing exists, we have the flexibility to invest in Non-Agency Securities and respond to changes in GSE policy as needed. At
December 31, 2015
and
December 31, 2014
, Agency Securities accounted for
100%
of our securities portfolio. Our securities portfolio consists primarily of Agency Securities backed by fixed rate home loans. From time to time, a portion of our assets may be invested in Agency Securities backed by hybrid adjustable rate and adjustable rate home loans as well as unsecured notes and bonds issued by GSEs, U.S. Treasuries and money market instruments, subject to certain income tests we must satisfy for our qualification as a real estate investment trust (“REIT”).
We have elected to be taxed as a REIT under the Internal Revenue Code (“the Code”). Our qualification as a REIT depends on our ability to meet, on a continuing basis, various complex requirements under the Code relating to, among other things, the sources of our gross income, the composition and values of our assets, our distribution levels and the concentration of ownership of our capital stock. We believe that we are organized in conformity with the requirements for qualification as a REIT under the Code and our manner of operations enables us to meet the requirements for taxation as a REIT for federal income tax purposes.
As a REIT, we will generally not be subject to federal income tax on the REIT taxable income that we currently distribute to our stockholders. If we fail to qualify as a REIT in any taxable year and do not qualify for certain statutory relief provisions, we will be subject to federal income tax at regular corporate rates. Even if we qualify as a REIT for federal income tax purposes, we may still be subject to some federal, state and local taxes on our income.
Cash
Cash includes cash on deposit with financial institutions. We may maintain deposits in federally insured financial institutions in excess of federally insured limits. However, management believes we are not exposed to significant credit risk due to the financial position and creditworthiness of the depository institutions in which those deposits are held.
F- 9
ARMOUR Residential REIT, Inc. and Subsidiary
NOTES TO CONSOLIDATED FINANCIAL STATEMENTS
(in thousands, except per share amounts)
Cash Collateral Posted To/By Counterparties
Cash collateral posted to/by counterparties represents cash posted by us to counterparties or posted by counterparties to us as collateral for our interest rate swap contracts (including swaptions and basis swap contracts), Eurodollar Futures Contracts (“Futures Contracts”) and repurchase agreements on our Agency Securities and our Agency Securities purchased or sold on a to-be-announced basis (“TBA Agency Securities”).
Agency Securities, Available For Sale
We generally intend to hold most of our Agency Securities for extended periods of time. We may, from time to time, sell any of our Agency Securities as part of the overall management of our securities portfolio. Management determines the appropriate classifications of the securities at the time they are acquired and evaluates the appropriateness of such classifications at each balance sheet date. At
December 31, 2015
and
December 31, 2014
, all of our Agency Securities were classified as available for sale securities. Agency Securities classified as available for sale are reported at their estimated fair values with unrealized gains and losses excluded from earnings and reported as part of the consolidated statements of comprehensive income (loss).
Receivables and Payables for Unsettled Sales and Purchases
We account for purchases and sales of securities on the trade date, including purchases and sales for forward settlement. Receivables and payables for unsettled trades represent the agreed trade price multiplied by the outstanding balance of the securities at the balance sheet date.
Accrued Interest Receivable and Payable
Accrued interest receivable includes interest accrued between payment dates on Agency Securities. Accrued interest payable includes interest payable on our repurchase agreements and may, at certain times, contain interest payable on U.S. Treasury Securities sold short.
Repurchase Agreements
We finance the acquisition of our Agency Securities through the use of repurchase agreements. Our repurchase agreements are secured by our Agency Securities and bear interest rates that have historically moved in close relationship to the Federal Funds Rate and the London Interbank Offered Rate (“LIBOR”). Under these repurchase agreements, we sell Agency Securities to a lender and agree to repurchase the same Agency Securities in the future for a price that is higher than the original sales price. The difference between the sales price that we receive and the repurchase price that we pay represents interest paid to the lender. A repurchase agreement operates as a financing arrangement under which we pledge our Agency Securities as collateral to secure a loan which is equal in value to a specified percentage of the estimated fair value of the pledged collateral. We retain beneficial ownership of the pledged collateral. At the maturity of a repurchase agreement, we are required to repay the loan and concurrently receive back our pledged collateral from the lender or, with the consent of the lender, we may renew such agreement at the then prevailing interest rate. The repurchase agreements may require us to pledge additional assets to the lender in the event the estimated fair value of the existing pledged collateral declines.
In addition to the repurchase agreement financing discussed above, at certain times we have entered into reverse repurchase agreements with certain of our repurchase agreement counterparties. Under a typical reverse repurchase agreement, we purchase U.S. Treasury Securities from a borrower in exchange for cash and agree to sell the same securities in the future in exchange for a price that is higher than the original purchase price. The difference between the purchase price originally paid and the sale price represents interest received from the borrower. Reverse repurchase agreement receivables and repurchase agreement liabilities are presented net when they meet certain criteria, including being with the same counterparty, being governed by the same master repurchase agreement (“MRA”), settlement through the same brokerage or clearing account and maturing on the same day. We did not have any reverse repurchase agreements outstanding during or at the years ended
December 31, 2015
and
December 31, 2014
.
F- 10
ARMOUR Residential REIT, Inc. and Subsidiary
NOTES TO CONSOLIDATED FINANCIAL STATEMENTS
(in thousands, except per share amounts)
Obligations to Return Securities Received as Collateral, at Fair Value
At certain times, we also sell to third parties the U.S. Treasury Securities received as collateral for reverse repurchase agreements and recognize the resulting obligation to return said U.S. Treasury Securities as a liability on our consolidated balance sheets. Interest is recorded on the repurchase agreements, reverse repurchase agreements and U.S. Treasury Securities sold short on an accrual basis and presented as interest expense. Both parties to the transaction have the right to make daily margin calls based on changes in the fair value of the collateral received and/or pledged. We did not have any obligations to return securities received as collateral at
December 31, 2015
and
December 31, 2014
.
Derivatives, at Fair Value
We recognize all derivatives as either assets or liabilities at fair value on our consolidated balance sheets. All changes in the fair values of our derivatives are reflected in our consolidated statements of operations. We designate derivatives as hedges for tax purposes and any unrealized derivative gains or losses would not affect our distributable net taxable income. These transactions include interest rate swap contracts, interest rate swaptions and basis swap contracts. We also may utilize forward contracts for the purchase or sale of TBA Agency Securities. We account for TBA Agency Securities as derivative instruments if it is reasonably possible that we will not take or make physical delivery of the Agency Security upon settlement of the contract. We account for TBA dollar roll transactions as a series of derivative transactions.
We may also purchase and sell TBA Agency Securities as a means of investing in and financing Agency Securities (thereby increasing our “at risk” leverage) or as a means of disposing of or reducing our exposure to Agency Securities (thereby reducing our “at risk” leverage). Pursuant to TBA Agency Securities, we agree to purchase or sell, for future delivery, Agency Securities with certain principal and interest terms and certain types of collateral, but the particular Agency Securities to be delivered are not identified until shortly before the TBA settlement date. We may also choose, prior to settlement, to move the settlement of these securities out to a later date by entering into an offsetting short or long position (referred to as a “pair off”), net settling the paired off positions for cash, and simultaneously purchasing or selling a similar TBA Agency Security for a later settlement date. This transaction is commonly referred to as a “dollar roll.” When it is reasonably possible that we will pair off a TBA Agency Security, we account for that contract as a derivative. We did not have any TBA Agency Securities outstanding at
December 31, 2015
and
December 31, 2014
.
Revenue Recognition
Interest income is earned and recognized on Agency Securities based on their unpaid principal amounts and their contractual terms. Recognition of interest income commences on the settlement date of the purchase transaction and continues through the settlement date of the sale transaction. Premiums and discounts associated with the purchase of Multi-Family mortgage backed securities (“MBS”), which are generally not subject to prepayment, are amortized or accreted into interest income over the contractual lives of the securities using a level yield method. Premiums and discounts associated with the purchase of other Agency Securities are amortized or accreted into interest income over the actual lives of the securities, reflecting actual prepayments as they occur.
Fair Value of Agency Securities: We invest in Agency Securities representing interests in or obligations backed by pools of fixed rate, hybrid adjustable rate and adjustable rate mortgage loans. The authoritative literature requires us to classify our investments as either trading, available for sale or held to maturity securities. Management determines the appropriate classifications of the securities at the time they are acquired and evaluates the appropriateness of such classifications at each balance sheet date. We currently classify all of our Agency Securities as available for sale. Agency Securities classified as available for sale are reported at their estimated fair values with unrealized gains and losses excluded from earnings and reported as part of the statements of comprehensive income (loss).
Security purchase and sale transactions, including purchase of TBA Agency Securities, are recorded on the trade date to the extent it is probable that we will take or make timely physical delivery of the related securities. Gains or losses realized from the sale of securities are included in income and are determined using the specific identification method.
Impairment of Assets: We evaluate Agency Securities for other than temporary impairment at least on a quarterly basis and more frequently when economic or market concerns warrant such evaluation. We consider an impairment to be other than temporary if we (1) have the intent to sell the Agency Securities, (2) believe it is more likely than not that we will be required to sell the securities before recovery (for example, because of liquidity requirements or contractual obligations) or (3) a credit loss exists. Impairment losses recognized establish a new cost basis for the related Agency Securities.
F- 11
ARMOUR Residential REIT, Inc. and Subsidiary
NOTES TO CONSOLIDATED FINANCIAL STATEMENTS
(in thousands, except per share amounts)
Comprehensive Income (Loss)
Comprehensive income (loss) refers to changes in equity during a period from transactions and other events and circumstances from non-owner sources. It includes all changes in equity during a period, except those resulting from investments by owners and distributions to owners.
Reclassification
Interest expense amounts on U.S. Treasury Securities sold short have been presented separately in the December 31, 2013 consolidated statements of operations to conform to the current presentation. Gain (loss) on short sale of U.S. Treasury Securities have been adjusted for this change in the consolidated statements of operations and the consolidated statements of cash flows to conform to current presentation. All per share amounts, common shares outstanding and stock-based compensation amounts for all periods presented reflect our one-for-eight reverse stock split (the “Reverse Stock Split”), which was effective July 31, 2015.
No other reclassifications have been made to previously reported amounts.
In June 2014, the Financial Accounting Standards Board issued
ASU 2014-11, Repurchase-to Maturity Transactions, Repurchase Financing, and Disclosures, Transfers and Servicing (Topic 860).
We do not have repurchase-to-maturity transactions or repurchase financing arrangements of the type covered by ASU 2014-11, therefore this amendment to the accounting standards will not affect our consolidated balance sheets or statements of operations. The amendment also required certain additional disclosures about repurchase agreements beginning with the second quarter 2015 financial statements. See
Note 7
“
Repurchase Agreements
”.
Our valuation techniques for financial instruments use observable and unobservable inputs. Observable inputs reflect readily obtainable data from third party sources, while unobservable inputs reflect management’s market assumptions. The Accounting Standards Codification Topic No. 820,
“Fair Value Measurement,”
classifies these inputs into the following hierarchy:
Level 1
Input
s - Quoted prices for identical instruments in active markets.
Level 2
Inputs
- Quoted prices for similar instruments in active markets; quoted prices for identical or similar instruments in markets that are not active; and model-derived valuations whose inputs are observable or whose significant value drivers are observable.
Level 3
Inputs
- Prices determined using significant unobservable inputs. Unobservable inputs may be used in situations where quoted prices or observable inputs are unavailable (for example, when there is little or no market activity for an investment at the end of the period). Unobservable inputs reflect management’s assumptions about the factors that market participants would use in pricing an asset or liability, and would be based on the best information available.
The following describes the valuation methodologies used for our assets and liabilities measured at fair value, as well as the general classification of such instruments pursuant to the valuation hierarchy. Any transfers between levels are assumed to occur at the beginning of the reporting period.
Cash
- Cash includes cash on deposit with financial institutions. The carrying amount of cash is deemed to be its fair value and is classified as Level 1. Cash balances posted by us to counterparties or posted by counterparties to us as collateral are classified as Level 2 because they are integrally related to the Company's repurchase financing and interest rate swap agreements, which are classified as Level 2.
F- 12
ARMOUR Residential REIT, Inc. and Subsidiary
NOTES TO CONSOLIDATED FINANCIAL STATEMENTS
(in thousands, except per share amounts)
Agency Securities, Available for Sale
- Fair value for the Agency Securities in our securities portfolio is based on obtaining a valuation for each Agency Security from third party pricing services and/or dealer quotes. The third party pricing services use common market pricing methods that may include pricing models that may incorporate such factors as coupons, prepayment speeds, spread to the Treasury curves and interest rate swap curves, duration, periodic and life caps and credit enhancement. If the fair value of an Agency Security is not available from the third party pricing services or such data appears unreliable, we obtain pricing indications from up to
three
dealers who make markets in similar Agency Securities. Management reviews pricing used to ensure that current market conditions are properly reflected. This review includes, but is not limited to, comparisons of similar market transactions or alternative third party pricing services, dealer pricing indications and comparisons to a third party pricing model. Fair values obtained from the third party pricing services for similar instruments are classified as Level 2 securities if the inputs to the pricing models used are consistent with the Level 2 definition. If quoted prices for a security are not reasonably available from the third party pricing service, but dealer pricing indications are, the security will be classified as a Level 2 security. If neither is available, management will determine the fair value based on characteristics of the security that we receive from the issuer and based on available market information and classify it as a Level 3 security. At
December 31, 2015
and
December 31, 2014
, all of our Agency Security fair values are classified as Level 2 based on the inputs used by our third party pricing services and dealer quotes.
Receivables and Payables for Unsettled Sales and Purchases
- The carrying amount is generally deemed to be fair value because of the relatively short time to settlement. Such receivables and payables are classified as Level 2 because they are effectively secured by the related securities and could potentially be subject to counterparty credit considerations.
Repurchase Agreements -
The fair value of repurchase agreements reflects the present value of the contractual cash flows discounted at the estimated LIBOR based market interest rates at the valuation date for repurchase agreements with a term equivalent to the remaining term to interest rate repricing, which may be at maturity, of our repurchase agreements. The fair value of the repurchase agreements approximates their carrying amount due to the short-term nature of these financial instruments. Our repurchase agreements are classified as Level 2.
Obligations to Return Securities Received as Collateral -
The fair value of the obligations to return securities received as collateral are based upon the prices of the related U.S. Treasury Securities obtained from a third party pricing service. Such obligations are classified as Level 1.
Derivative Transactions
-
Our Futures Contracts are traded on the Chicago Mercantile Exchange (“CME”) and are classified as Level 1. The fair values of our interest rate swap contracts, interest rate swaptions and basis swaps are valued using third party pricing services that incorporate common market pricing methods that may include current interest rate curves, forward interest rate curves and market spreads to interest rate curves. We estimate the fair value of TBA Agency Securities based on similar methods used to value our Agency Securities. Management compares pricing used to dealer quotes to ensure that the current market conditions are properly reflected. The fair values of our interest rate swap contracts, interest rate swaptions, basis swap contracts and TBA Agency Securities are classified as Level 2.
The following tables provide a summary of our assets and liabilities that are measured at fair value on a recurring basis at
December 31, 2015
and
December 31, 2014
.
|
|
Quoted Prices
in Active
Markets for
Identical Assets
(Level 1)
|
Significant
Observable
Inputs
(Level 2)
|
Significant
Unobservable
Inputs
(Level 3)
|
Balance at December 31, 2015
|
||||||||||||
|
Assets at Fair Value:
|
|
|
|
|
||||||||||||
|
Agency Securities, available for sale
|
$
|
—
|
|
$
|
12,461,556
|
|
$
|
—
|
|
$
|
12,461,556
|
|
||||
|
Derivatives
|
$
|
—
|
|
$
|
999
|
|
$
|
—
|
|
$
|
999
|
|
||||
|
Liabilities at Fair Value:
|
|
|
|
|
||||||||||||
|
Derivatives
|
$
|
—
|
|
$
|
233,301
|
|
$
|
—
|
|
$
|
233,301
|
|
||||
There were no transfers of assets or liabilities between the levels of the fair value hierarchy during the
year
ended
December 31, 2015
.
F- 13
ARMOUR Residential REIT, Inc. and Subsidiary
NOTES TO CONSOLIDATED FINANCIAL STATEMENTS
(in thousands, except per share amounts)
|
|
Quoted Prices
in Active
Markets for
Identical Assets
(Level 1)
|
Significant
Observable
Inputs
(Level 2)
|
Significant
Unobservable
Inputs
(Level 3)
|
Balance at December 31, 2014
|
||||||||||||
|
Assets at Fair Value:
|
|
|
|
|
||||||||||||
|
Agency Securities, available for sale
|
$
|
—
|
|
$
|
15,297,529
|
|
$
|
—
|
|
$
|
15,297,529
|
|
||||
|
Derivatives
|
$
|
—
|
|
$
|
60,518
|
|
$
|
—
|
|
$
|
60,518
|
|
||||
|
Liabilities at Fair Value:
|
|
|
|
|
||||||||||||
|
Derivatives
|
$
|
180
|
|
$
|
137,213
|
|
$
|
—
|
|
$
|
137,393
|
|
||||
There were no transfers of assets or liabilities between the levels of the fair value hierarchy during the
year
ended
December 31, 2014
.
The following tables provide a summary of the carrying values and fair values of our financial assets and liabilities not carried at fair value but for which fair value is required to be disclosed at
December 31, 2015
and
December 31, 2014
.
|
December 31, 2015
|
Fair Value Measurements using:
|
|||||||||||||||||||
|
|
Carrying Value
|
Fair
Value
|
Quoted Prices
in Active
Markets for
Identical Assets
(Level 1)
|
Significant
Observable
Inputs
(Level 2)
|
Significant
Unobservable
Inputs
(Level 3)
|
|||||||||||||||
|
Financial Assets:
|
|
|
|
|
|
|||||||||||||||
|
Cash
|
$
|
289,925
|
|
$
|
289,925
|
|
$
|
289,925
|
|
$
|
—
|
|
$
|
—
|
|
|||||
|
Cash collateral posted to counterparties
|
$
|
263,799
|
|
$
|
263,799
|
|
$
|
—
|
|
$
|
263,799
|
|
$
|
—
|
|
|||||
|
Principal payments receivable
|
$
|
37
|
|
$
|
37
|
|
$
|
—
|
|
$
|
37
|
|
$
|
—
|
|
|||||
|
Accrued interest receivable
|
$
|
34,500
|
|
$
|
34,500
|
|
$
|
—
|
|
$
|
34,500
|
|
$
|
—
|
|
|||||
|
Financial Liabilities:
|
|
|
|
|
|
|||||||||||||||
|
Repurchase agreements
|
$
|
11,570,481
|
|
$
|
11,570,481
|
|
$
|
—
|
|
$
|
11,570,481
|
|
$
|
—
|
|
|||||
|
Accrued interest payable- repurchase agreements
|
$
|
7,724
|
|
$
|
7,724
|
|
$
|
—
|
|
$
|
7,724
|
|
$
|
—
|
|
|||||
|
December 31, 2014
|
Fair Value Measurements using:
|
|||||||||||||||||||
|
|
Carrying Value
|
Fair
Value
|
Quoted Prices
in Active
Markets for
Identical Assets
(Level 1)
|
Significant
Observable
Inputs
(Level 2)
|
Significant
Unobservable
Inputs
(Level 3)
|
|||||||||||||||
|
Financial Assets:
|
|
|
|
|
|
|||||||||||||||
|
Cash
|
$
|
494,561
|
|
$
|
494,561
|
|
$
|
494,561
|
|
$
|
—
|
|
$
|
—
|
|
|||||
|
Cash collateral posted to counterparties
|
$
|
129,004
|
|
$
|
129,004
|
|
$
|
—
|
|
$
|
129,004
|
|
$
|
—
|
|
|||||
|
Receivable for unsettled sales
|
$
|
260,598
|
|
$
|
260,598
|
|
$
|
—
|
|
$
|
260,598
|
|
$
|
—
|
|
|||||
|
Principal payments receivable
|
$
|
93
|
|
$
|
93
|
|
$
|
—
|
|
$
|
93
|
|
$
|
—
|
|
|||||
|
Accrued interest receivable
|
$
|
41,915
|
|
$
|
41,915
|
|
$
|
—
|
|
$
|
41,915
|
|
$
|
—
|
|
|||||
|
Financial Liabilities:
|
|
|
|
|
|
|
|
|||||||||||||
|
Repurchase agreements
|
$
|
13,881,921
|
|
$
|
13,881,921
|
|
$
|
—
|
|
$
|
13,881,921
|
|
$
|
—
|
|
|||||
|
Cash collateral posted by counterparties
|
$
|
48,240
|
|
$
|
48,240
|
|
$
|
—
|
|
$
|
48,240
|
|
$
|
—
|
|
|||||
|
Payable for unsettled purchases
|
$
|
445,292
|
|
$
|
445,292
|
|
$
|
—
|
|
$
|
445,292
|
|
$
|
—
|
|
|||||
|
Accrued interest payable- repurchase agreements
|
$
|
7,012
|
|
$
|
7,012
|
|
$
|
—
|
|
$
|
7,012
|
|
$
|
—
|
|
|||||
F- 14
ARMOUR Residential REIT, Inc. and Subsidiary
NOTES TO CONSOLIDATED FINANCIAL STATEMENTS
(in thousands, except per share amounts)
All of our Agency Securities are classified as available for sale and, as such, are reported at their estimated fair value and changes in fair value reported as part of the statements of comprehensive income (loss). At
December 31, 2015
and
December 31, 2014
, investments in Agency Securities accounted for
100%
of our securities portfolio.
We evaluated our Agency Securities with unrealized losses at
December 31, 2015
,
December 31, 2014
and
December 31, 2013
, to determine whether there was an other than temporary impairment. All of our Agency Securities are issued and guaranteed by GSEs or Ginnie Mae. The GSEs have a long term credit rating of AA+. At
December 31, 2015
,
December 31, 2014
and
December 31, 2013
, we also considered whether we intended to sell Agency Securities and whether it was more likely than not that we could meet our liquidity requirements and contractual obligations without selling Agency Securities. There was
no
other than temporary impairment recognized for the years ended
December 31, 2015
and
December 31, 2014
. At
December 31, 2013
, anticipating portfolio repositioning sales in the first quarter of 2014, we concluded that the
December 31, 2013
unrealized losses on our 25-year and 30-year fixed rate Agency Securities represented an other than temporary impairment. Accordingly, at
December 31, 2013
, we recognized losses totaling
$401,541
in our 2013 consolidated statements of operations, thereby establishing a new cost basis for those Agency Securities with aggregate fair value of
$6,800,000
at
December 31, 2013
. We also determined that at
December 31, 2013
, there was
no
other than temporary impairment of our other Agency Securities, which are primarily 20-year and 15-year fixed rate securities.
At
December 31, 2015
, we had the following Agency Securities in an unrealized gain or loss position as presented below. The components of the carrying value of our Agency Securities at
December 31, 2015
are also presented below. Our Agency Securities had a weighted average coupon of
3.45%
at
December 31, 2015
.
|
December 31, 2015
|
Amortized Cost
|
Gross Unrealized Loss
|
Gross Unrealized Gain
|
Fair Value
|
Percent of Total
|
||||||||||||||
|
Fannie Mae
|
|||||||||||||||||||
|
ARMs & Hybrids
|
$
|
46,512
|
|
$
|
(210
|
)
|
$
|
486
|
|
$
|
46,788
|
|
0.38
|
%
|
|||||
|
Multi-Family MBS
|
2,182,156
|
|
(30,879
|
)
|
7,312
|
|
2,158,589
|
|
17.32
|
|
|||||||||
|
10 Year Fixed
|
91,752
|
|
(362
|
)
|
605
|
|
91,995
|
|
0.74
|
|
|||||||||
|
15 Year Fixed
|
4,302,585
|
|
(10,462
|
)
|
5,498
|
|
4,297,621
|
|
34.49
|
|
|||||||||
|
20 Year Fixed
|
2,692,310
|
|
(25,429
|
)
|
5,289
|
|
2,672,170
|
|
21.44
|
|
|||||||||
|
25 Year Fixed
|
18,488
|
|
(128
|
)
|
—
|
|
18,360
|
|
0.15
|
|
|||||||||
|
30 Year Fixed
|
1,447,835
|
|
(6,645
|
)
|
492
|
|
1,441,682
|
|
11.56
|
|
|||||||||
|
Total Fannie Mae
|
$
|
10,781,638
|
|
$
|
(74,115
|
)
|
$
|
19,682
|
|
$
|
10,727,205
|
|
86.08
|
%
|
|||||
|
Freddie Mac
|
|||||||||||||||||||
|
ARMs & Hybrids
|
12,738
|
|
(46
|
)
|
197
|
|
12,889
|
|
0.10
|
|
|||||||||
|
10 Year Fixed
|
37,657
|
|
(92
|
)
|
652
|
|
38,217
|
|
0.31
|
|
|||||||||
|
15 Year Fixed
|
192,982
|
|
(995
|
)
|
310
|
|
192,297
|
|
1.54
|
|
|||||||||
|
20 Year Fixed
|
1,443,652
|
|
(16,380
|
)
|
4,006
|
|
1,431,278
|
|
11.49
|
|
|||||||||
|
Total Freddie Mac
|
$
|
1,687,029
|
|
$
|
(17,513
|
)
|
$
|
5,165
|
|
$
|
1,674,681
|
|
13.44
|
%
|
|||||
|
Ginnie Mae
|
|||||||||||||||||||
|
ARMs & Hybrids
|
59,877
|
|
(610
|
)
|
69
|
|
59,336
|
|
0.48
|
|
|||||||||
|
15 Year Fixed
|
314
|
|
—
|
|
20
|
|
334
|
|
0.00
|
|
|||||||||
|
Total Ginnie Mae
|
$
|
60,191
|
|
$
|
(610
|
)
|
$
|
89
|
|
$
|
59,670
|
|
0.48
|
%
|
|||||
|
Total Agency Securities
|
$
|
12,528,858
|
|
$
|
(92,238
|
)
|
$
|
24,936
|
|
$
|
12,461,556
|
|
100.00
|
%
|
|||||
We did not have any unsettled purchases at
December 31, 2015
.
F- 15
ARMOUR Residential REIT, Inc. and Subsidiary
NOTES TO CONSOLIDATED FINANCIAL STATEMENTS
(in thousands, except per share amounts)
At
December 31, 2014
, we had the following securities in an unrealized gain or loss position as presented below. The components of the carrying value of our Agency Securities at
December 31, 2014
are also presented below. Our Agency Securities had a weighted average coupon of
3.47%
at
December 31, 2014
.
|
December 31, 2014
|
Amortized Cost
|
Gross Unrealized Loss
|
Gross Unrealized Gain
|
Fair Value
|
Percent of Total
|
|||||||||||||
|
Fannie Mae
|
||||||||||||||||||
|
ARMs&Hybrids
|
$
|
40,410
|
|
$
|
(119
|
)
|
$
|
729
|
|
$
|
41,020
|
|
0.27
|
%
|
||||
|
Multi-Family MBS
|
1,239,227
|
|
—
|
|
22,676
|
|
1,261,903
|
|
8.25
|
|
||||||||
|
10 Year Fixed
|
5,336
|
|
(3
|
)
|
201
|
|
5,534
|
|
0.04
|
|
||||||||
|
15 Year Fixed
|
7,394,694
|
|
(539
|
)
|
54,041
|
|
7,448,196
|
|
48.69
|
|
||||||||
|
20 Year Fixed
|
3,050,676
|
|
(13,867
|
)
|
16,756
|
|
3,053,565
|
|
19.96
|
|
||||||||
|
25 Year Fixed
|
21,194
|
|
(55
|
)
|
—
|
|
21,139
|
|
0.14
|
|
||||||||
|
30 Year Fixed
|
1,249,696
|
|
(227
|
)
|
5,765
|
|
1,255,234
|
|
8.21
|
|
||||||||
|
Total Fannie Mae
|
$
|
13,001,233
|
|
$
|
(14,810
|
)
|
$
|
100,168
|
|
$
|
13,086,591
|
|
85.56
|
%
|
||||
|
Freddie Mac
|
||||||||||||||||||
|
ARMs&Hybrids
|
14,049
|
|
(33
|
)
|
246
|
|
14,262
|
|
0.09
|
|
||||||||
|
10 Year Fixed
|
600
|
|
(3
|
)
|
8
|
|
605
|
|
0.00
|
|
||||||||
|
15 Year Fixed
|
239,438
|
|
(315
|
)
|
2,499
|
|
241,622
|
|
1.58
|
|
||||||||
|
20 Year Fixed
|
1,881,496
|
|
(12,258
|
)
|
8,346
|
|
1,877,584
|
|
12.27
|
|
||||||||
|
Total Freddie Mac
|
$
|
2,135,583
|
|
$
|
(12,609
|
)
|
$
|
11,099
|
|
$
|
2,134,073
|
|
13.94
|
%
|
||||
|
Ginnie Mae
|
||||||||||||||||||
|
ARMs&Hybrids
|
75,962
|
|
(187
|
)
|
665
|
|
76,440
|
|
0.50
|
|
||||||||
|
15 Year Fixed
|
397
|
|
—
|
|
28
|
|
425
|
|
0.00
|
|
||||||||
|
Total Ginnie Mae
|
$
|
76,359
|
|
$
|
(187
|
)
|
$
|
693
|
|
$
|
76,865
|
|
0.50
|
%
|
||||
|
Total Agency Securities
|
$
|
15,213,175
|
|
$
|
(27,606
|
)
|
$
|
111,960
|
|
$
|
15,297,529
|
|
100.00
|
%
|
||||
Included in the table above are unsettled purchases with an aggregate cost of
$445,292
and estimated fair value of
$445,527
at
December 31, 2014
.
Actual maturities of Agency Securities are generally shorter than stated contractual maturities because actual maturities of Agency Securities are affected by the contractual lives of the underlying mortgages, periodic payments of principal and prepayments of principal.
The following table summarizes the weighted average lives of our Agency Securities at
December 31, 2015
and
December 31, 2014
.
|
|
December 31, 2015
|
December 31, 2014
|
||||||||||||||
|
Weighted Average Life of all Agency Securities
|
Fair Value
|
Amortized
Cost
|
Fair Value
|
Amortized
Cost
|
||||||||||||
|
Less than one year
|
$
|
19
|
|
$
|
19
|
|
$
|
—
|
|
$
|
—
|
|
||||
|
Greater than or equal to one year and less than three years
|
30,189
|
|
30,375
|
|
48,298
|
|
47,929
|
|
||||||||
|
Greater than or equal to three years and less than five years
|
6,037,851
|
|
6,039,218
|
|
10,712,331
|
|
10,667,135
|
|
||||||||
|
Greater than or equal to five years
|
6,393,497
|
|
6,459,246
|
|
4,536,900
|
|
4,498,111
|
|
||||||||
|
Total Agency Securities
|
$
|
12,461,556
|
|
$
|
12,528,858
|
|
$
|
15,297,529
|
|
$
|
15,213,175
|
|
||||
F- 16
ARMOUR Residential REIT, Inc. and Subsidiary
NOTES TO CONSOLIDATED FINANCIAL STATEMENTS
(in thousands, except per share amounts)
We use a third party model to calculate the weighted average lives of our Agency Securities. Weighted average life is calculated based on expectations for estimated prepayments for the underlying mortgage loans of our Agency Securities. These estimated prepayments are based on assumptions such as interest rates, current and future home prices, housing policy and borrower incentives. The weighted average lives of our Agency Securities at
December 31, 2015
and
December 31, 2014
in the table above are based upon market factors, assumptions, models and estimates from the third party model and also incorporate management’s judgment and experience. The actual weighted average lives of our Agency Securities could be longer or shorter than estimated.
The following table presents the unrealized losses and estimated fair value of our Agency Securities by length of time that such securities have been in a continuous unrealized loss position at
December 31, 2015
and
December 31, 2014
.
|
|
Unrealized Loss Position For:
|
|||||||||||||||||||||||
|
|
Less than 12 Months
|
12 Months or More
|
Total
|
|||||||||||||||||||||
|
Fair Value
|
Unrealized
Losses
|
Fair Value
|
Unrealized
Losses
|
Fair Value
|
Unrealized
Losses
|
|||||||||||||||||||
|
December 31, 2015
|
$
|
7,105,363
|
|
$
|
(58,799
|
)
|
$
|
1,861,211
|
|
$
|
(33,439
|
)
|
$
|
8,966,574
|
|
$
|
(92,238
|
)
|
||||||
|
December 31, 2014
|
$
|
895,382
|
|
$
|
(2,324
|
)
|
$
|
2,463,523
|
|
$
|
(25,282
|
)
|
$
|
3,358,905
|
|
$
|
(27,606
|
)
|
||||||
During the years ended
December 31, 2015
,
December 31, 2014
and
December 31, 2013
we sold
$5,367,123
,
$10,595,518
and
$14,965,888
of Agency Securities, which resulted in realized gains (losses) of
$(11,546)
,
$68,770
, and
$(593,498)
, respectively. Sales of Agency Securities are done to reposition our securities portfolio and to reach our target level of liquidity.
The following table represents the contractual repricing regarding our repurchase agreements to finance Agency Security purchases at
December 31, 2015
and
December 31, 2014
. No amounts below are subject to offsetting.
|
December 31, 2015
|
December 31, 2014
|
|||||||||||||
|
|
Repurchase Agreements
|
Weighted Average Contractual Rate
|
Repurchase Agreements
|
Weighted Average Contractual Rate
|
||||||||||
|
Within 30 days
|
$
|
8,089,403
|
|
0.55
|
%
|
$
|
3,994,656
|
|
0.36
|
%
|
||||
|
31 days to 60 days
|
2,487,174
|
|
0.57
|
%
|
5,631,858
|
|
0.37
|
%
|
||||||
|
61 days to 90 days
|
343,904
|
|
0.71
|
%
|
2,348,839
|
|
0.39
|
%
|
||||||
|
Greater than 90 days
|
650,000
|
|
0.67
|
%
|
1,906,568
|
|
0.44
|
%
|
||||||
|
Total or Weighted Average
|
$
|
11,570,481
|
|
0.57
|
%
|
$
|
13,881,921
|
|
0.38
|
%
|
||||
Our repurchase agreements require that we maintain adequate pledged collateral. A decline in the value of the Agency Securities pledged as collateral for borrowings under repurchase agreements could result in the counterparties demanding additional collateral pledges or liquidation of some of the existing collateral to reduce borrowing levels. We manage this risk by maintaining an adequate balance of available cash and unpledged securities. An event of default or termination event under the standard MRA would give our counterparty the option to terminate all repurchase transactions existing with us and require any amount due to be payable immediately. In addition, certain of our MRAs contain a restriction that prohibits our leverage from exceeding
twelve
times our stockholders’ equity as well as termination events in the case of significant reductions in equity capital. We also may receive cash or securities as collateral from our derivative counterparties which we may use as additional collateral for repurchase agreements. Certain interest rate swap contracts provide for cross collateralization and cross default with repurchase agreements and other contracts with the same counterparty.
The following table represents the MRAs and other information regarding our repurchase agreements to finance Agency Security purchases at
December 31, 2015
and
December 31, 2014
.
F- 17
ARMOUR Residential REIT, Inc. and Subsidiary
NOTES TO CONSOLIDATED FINANCIAL STATEMENTS
(in thousands, except per share amounts)
|
|
December 31, 2015
|
December 31, 2014
|
||||
|
Number of MRAs
|
38
|
|
40
|
|
||
|
Number of counterparties with repurchase agreements outstanding
|
26
|
|
28
|
|
||
|
Weighted average maturity in days
|
38
|
|
60
|
|
||
|
Haircut for repurchase agreements (1)
|
4.79
|
%
|
4.81
|
%
|
||
|
(1)
|
The Haircut represents the weighted average margin requirement, or the percentage amount by which the collateral value must exceed the loan amount. Among other things, it is a measure of our unsecured credit risk to our lenders.
|
At
December 31, 2015
,
8
repurchase agreement counterparties individually accounted for between
5%
and
10%
of our aggregate borrowings. In total, these counterparties accounted for approximately
53.48%
of our repurchase agreement borrowings outstanding at
December 31, 2015
. At
December 31, 2014
, we had
7
repurchase agreement counterparties that individually accounted for between
5%
and
10%
of our aggregate borrowings. In total, these counterparties accounted for
48.11%
of our repurchase agreement borrowings at
December 31, 2014
. At
December 31, 2015
and
December 31, 2014
, we did not have any repurchase counterparties that individually account for
5%
or greater of our stockholders' equity.
We did not sell short or purchase U.S. Treasury Securities during the year ended
December 31, 2015
. During the
year
ended
December 31, 2014
, we sold short
$2,005,363
of U.S. Treasury Securities which were repurchased at a cost of
$2,020,051
, resulting in a realized loss of
$(14,688)
. During the
year
ended
December 31, 2013
, we sold short
$2,783,711
of U.S. Treasury Securities which we repurchased at a cost of
$2,768,203
, resulting in a realized gain of
$15,508
.
We enter into derivative transactions to manage our interest rate risk exposure. These transactions include entering into interest rate swap contracts and interest rate swaptions as well as purchasing or selling Futures Contracts. These transactions are designed to lock in funding costs for repurchase agreements associated with our assets in such a way to help assure the realization of net interest margins. Such transactions are based on assumptions about prepayments which, if not realized, will cause transaction results to differ from expectations. Basis swap contracts allow us to exchange one floating interest rate basis for another, for example, 3 month LIBOR and Fed Funds Rates, thereby allowing us to diversify our floating rate basis exposures. We also utilize forward contracts for the purchase or sale of TBA Agency Securities.
We have agreements with our derivative counterparties that provide for the posting of collateral based on the fair values of our interest rate swap contracts, swaptions, basis swap contracts and TBA Agency Securities. Through this margin process, either we or our swap counterparty may be required to pledge cash or Agency Securities as collateral. Collateral requirements vary by counterparty and change over time based on the fair value, notional amount and remaining term of the contracts. Certain interest rate swap contracts provide for cross collateralization and cross default with repurchase agreements and other contracts with the same counterparty.
Interest rate swaptions generally provide us the option to enter into an interest rate swap agreement at a certain point of time in the future with a predetermined notional amount, stated term and stated rate of interest in the fixed leg and interest rate index on the floating leg.
Our Futures Contracts are traded on the CME which requires the use of daily mark-to-market collateral and the CME provides substantial credit support. The collateral requirements of the CME require us to pledge assets under a bi-lateral margin arrangement, including either cash or Agency Securities and these requirements may vary and change over time based on the market value, notional amount and remaining term of the Futures Contracts. In the event we are unable to meet a margin call under one of our Futures Contracts, the counterparty to such agreement may have the option to terminate or close-out all of the outstanding Futures Contracts with us. In addition, any close-out amount due to the counterparty upon termination of the counterparty’s transactions would be immediately payable by us pursuant to the applicable agreement.
TBA Agency Securities are forward contracts for the purchase (“long position”) or sale (“short position”) of Agency Securities at a predetermined price, face amount, issuer, coupon and stated maturity on an agreed-upon future date. The specific Agency Securities delivered into the contract upon the settlement date, published each month by the Securities Industry and Financial Markets Association, are not known at the time of the transaction. We may enter into TBA Agency Securities as a means of hedging against short-term changes in interest rates. We may also enter into TBA Agency Securities as a means of acquiring or
F- 18
ARMOUR Residential REIT, Inc. and Subsidiary
NOTES TO CONSOLIDATED FINANCIAL STATEMENTS
(in thousands, except per share amounts)
disposing of Agency Securities and we may from time to time utilize TBA dollar roll transactions to finance Agency Security purchases. We estimate the fair value of TBA Agency Securities based on similar methods used to value our Agency Securities.
We did not have any TBA Agency Securities outstanding at
December 31, 2015
and
December 31, 2014
.
The following tables present information about our derivatives at
December 31, 2015
and
December 31, 2014
.
December 31, 2015
|
Derivative Type
|
Remaining / Underlying Term
|
Weighted Average Remaining Swap / Option Term (Months)
|
Weighted Average Rate
|
Notional Amount (3)
|
Asset Fair Value (1)
|
Liability Fair Value (1)
|
|||||||||||||
|
Interest rate swap contracts
|
13-24 Months
|
19
|
0.63
|
%
|
$
|
350,000
|
|
$
|
265
|
|
$
|
(87
|
)
|
||||||
|
Interest rate swap contracts
|
25-36 Months
|
27
|
1.16
|
%
|
700,000
|
|
192
|
|
(1,633
|
)
|
|||||||||
|
Interest rate swap contracts
|
37-48 Months
|
47
|
1.46
|
%
|
2,000,000
|
|
—
|
|
(18,120
|
)
|
|||||||||
|
Interest rate swap contracts
|
49-60 Months
|
49
|
1.53
|
%
|
350,000
|
|
—
|
|
(3,085
|
)
|
|||||||||
|
Interest rate swap contracts
|
73-84 Months
|
75
|
2.05
|
%
|
1,025,000
|
|
—
|
|
(26,047
|
)
|
|||||||||
|
Interest rate swap contracts
|
85-96 Months
|
86
|
2.11
|
%
|
1,375,000
|
|
—
|
|
(23,543
|
)
|
|||||||||
|
Interest rate swap contracts
|
109-120 Months
|
108
|
2.66
|
%
|
1,000,000
|
|
—
|
|
(92,927
|
)
|
|||||||||
|
Interest rate swap contracts
|
121-132 Months
|
123
|
2.30
|
%
|
2,000,000
|
|
—
|
|
(67,858
|
)
|
|||||||||
|
Basis swap contracts (2)
|
0-60 Months
|
22
|
0.22
|
%
|
2,000,000
|
|
542
|
|
(1
|
)
|
|||||||||
|
Total or Weighted Average
|
$
|
10,800,000
|
|
$
|
999
|
|
$
|
(233,301
|
)
|
||||||||||
|
(1)
|
See
Note 5
,
“
Fair Value of Financial Instruments
”
for additional discussion.
|
|
(2)
|
Weighted average rate is the spread over the pay index.
|
|
(3)
|
Notional amount includes
$3,775,000
of forward starting interest rate swap contracts which become effective within
6 months
.
|
December 31, 2014
|
Derivative Type
|
Remaining / Underlying Term
|
Weighted Average Remaining Swap / Option Term (Months)
|
Weighted Average Rate
|
Notional Amount
|
Asset Fair Value (1)
|
Liability Fair Value (1)
|
|||||||||||||
|
Interest rate swap contracts
|
0-12 Months
|
5
|
1.13
|
%
|
$
|
920,000
|
|
$
|
—
|
|
$
|
(9,349
|
)
|
||||||
|
Interest rate swap contracts
|
13-24 Months
|
16
|
1.23
|
%
|
2,900,000
|
|
—
|
|
(54,396
|
)
|
|||||||||
|
Interest rate swap contracts
|
25-36 Months
|
31
|
0.63
|
%
|
350,000
|
|
2,083
|
|
—
|
|
|||||||||
|
Interest rate swap contracts
|
37-48 Months
|
37
|
1.00
|
%
|
300,000
|
|
2,090
|
|
—
|
|
|||||||||
|
Interest rate swap contracts
|
49-60 Months
|
59
|
1.56
|
%
|
2,000,000
|
|
—
|
|
(7,414
|
)
|
|||||||||
|
Interest rate swap contracts
|
61-72 Months
|
61
|
1.48
|
%
|
300,000
|
|
2,921
|
|
—
|
|
|||||||||
|
Interest rate swap contracts
|
85-96 Months
|
91
|
1.47
|
%
|
2,450,000
|
|
50,650
|
|
—
|
|
|||||||||
|
Interest rate swap contracts
|
97-108 Months
|
98
|
2.08
|
%
|
2,800,000
|
|
2,774
|
|
(7,534
|
)
|
|||||||||
|
Interest rate swap contracts
|
121-132 Months
|
120
|
2.66
|
%
|
1,000,000
|
|
—
|
|
(58,520
|
)
|
|||||||||
|
Futures Contracts
|
0-15 Months
|
9
|
2.11
|
%
|
10,000
|
|
—
|
|
(180
|
)
|
|||||||||
|
Total or Weighted Average
|
63
|
1.60
|
%
|
$
|
13,030,000
|
|
$
|
60,518
|
|
$
|
(137,393
|
)
|
|||||||
|
(1)
|
See Note 5,
“Fair Value of Financial Instruments”
for additional discussion.
|
We have netting arrangements in place with all derivative counterparties pursuant to standard documentation developed by the International Swap and Derivatives Association. We are also required to post or hold cash collateral based upon the net underlying market value of our open positions with the counterparty.
F- 19
ARMOUR Residential REIT, Inc. and Subsidiary
NOTES TO CONSOLIDATED FINANCIAL STATEMENTS
(in thousands, except per share amounts)
The following tables present information about interest rate swap contracts and basis swap contracts and the potential effects of netting if we were to offset the assets and liabilities of these financial instruments on the accompanying consolidated balance sheets. Currently, we present these financial instruments at their gross amounts and they are included in derivatives, at fair value on the accompanying consolidated balance sheet at
December 31, 2015
.
|
December 31, 2015
|
|
Gross Amounts Not Offset in the Consolidated Balance Sheet
|
|
|||||||||||||
|
Assets
|
Gross and Net Amounts of Assets Presented in the Consolidated Balance Sheet
|
Financial
Instruments
|
Cash Collateral
|
Net Amount
|
||||||||||||
|
Interest rate swap contracts
|
$
|
457
|
|
$
|
(233,301
|
)
|
$
|
241,604
|
|
$
|
8,760
|
|
||||
|
Basis swap contracts
|
542
|
|
—
|
|
—
|
|
542
|
|
||||||||
|
Totals
|
$
|
999
|
|
$
|
(233,301
|
)
|
$
|
241,604
|
|
$
|
9,302
|
|
||||
|
December 31, 2015
|
|
Gross Amounts Not Offset in the Consolidated Balance Sheet
|
|
|||||||||||||
|
Liabilities
|
Gross and Net Amounts of Liabilities Presented in the Consolidated Balance Sheet
|
Financial
Instruments
|
Cash Collateral
|
Net Amount
|
||||||||||||
|
Interest rate swap contracts
|
$
|
(233,301
|
)
|
$
|
233,301
|
|
$
|
—
|
|
$
|
—
|
|
||||
|
Totals
|
$
|
(233,301
|
)
|
$
|
233,301
|
|
$
|
—
|
|
$
|
—
|
|
||||
The following tables present information about interest rate swap contracts and Futures Contracts and the potential effects of netting if we were to offset the assets and liabilities of these financial instruments on the accompanying consolidated balance sheets. Currently, we present these financial instruments at their gross amounts and they are included in derivatives, at fair value on the accompanying consolidated balance sheet at
December 31, 2014
.
|
December 31, 2014
|
|
Gross Amounts Not Offset in the Consolidated Balance Sheet
|
|
|||||||||||||
|
Assets
|
Gross and Net Amounts of Assets Presented in the Consolidated
Balance Sheet
|
Financial
Instruments
|
Cash Collateral
|
Net Amount
|
||||||||||||
|
Interest rate swap contracts
|
$
|
60,518
|
|
$
|
(137,213
|
)
|
$
|
119,561
|
|
$
|
42,866
|
|
||||
|
Totals
|
$
|
60,518
|
|
$
|
(137,213
|
)
|
$
|
119,561
|
|
$
|
42,866
|
|
||||
F- 20
ARMOUR Residential REIT, Inc. and Subsidiary
NOTES TO CONSOLIDATED FINANCIAL STATEMENTS
(in thousands, except per share amounts)
|
December 31, 2014
|
|
Gross Amounts Not Offset in the Consolidated Balance Sheet
|
|
|||||||||||||
|
Liabilities
|
Gross and Net Amounts of Liabilities Presented in the Consolidated Balance Sheet
|
Financial
Instruments
|
Cash Collateral
|
Net Amount
|
||||||||||||
|
Interest rate swap contracts
|
$
|
(137,213
|
)
|
$
|
137,213
|
|
$
|
—
|
|
$
|
—
|
|
||||
|
Futures Contracts
|
(180
|
)
|
—
|
|
227
|
|
47
|
|
||||||||
|
Totals
|
$
|
(137,393
|
)
|
$
|
137,213
|
|
$
|
227
|
|
$
|
47
|
|
||||
The following table represents the location and information regarding our derivatives which are included in Other Income (Loss) in the accompanying consolidated statements of operations for the years ended
December 31, 2015
,
December 31, 2014
and
December 31, 2013
.
|
|
|
Income (Loss) Recognized
|
||||||||||||
|
|
|
For the Year Ended
|
||||||||||||
|
Derivatives
|
Location on consolidated statements of operations
|
December 31, 2015
|
December 31, 2014
|
December 31, 2013
|
||||||||||
|
Interest rate swap contracts:
|
|
|
|
|
||||||||||
|
Realized gain (loss)
|
Realized loss on derivatives
|
$
|
(2,274
|
)
|
$
|
—
|
|
$
|
25,686
|
|
||||
|
Interest income
|
Realized loss on derivatives
|
13,066
|
|
14,213
|
|
17,180
|
|
|||||||
|
Interest expense
|
Realized loss on derivatives
|
(123,929
|
)
|
(154,874
|
)
|
(158,465
|
)
|
|||||||
|
Changes in fair value
|
Unrealized gain (loss) on derivatives
|
(182,503
|
)
|
(371,266
|
)
|
499,193
|
|
|||||||
|
|
|
$
|
(295,640
|
)
|
$
|
(511,927
|
)
|
$
|
383,594
|
|
||||
|
Interest rate swaptions:
|
|
|
|
|
||||||||||
|
Realized gain (loss)
|
Realized loss on derivatives
|
—
|
|
23,318
|
|
(17,778
|
)
|
|||||||
|
Changes in fair value
|
Unrealized gain (loss) on derivatives
|
—
|
|
(92,687
|
)
|
43,034
|
|
|||||||
|
|
|
$
|
—
|
|
$
|
(69,369
|
)
|
$
|
25,256
|
|
||||
|
Futures Contracts:
|
|
|
|
|
||||||||||
|
Realized loss
|
Realized loss on derivatives
|
(184
|
)
|
(1,373
|
)
|
(2,531
|
)
|
|||||||
|
Changes in fair value
|
Unrealized gain (loss) on derivatives
|
180
|
|
1,323
|
|
2,416
|
|
|||||||
|
|
|
$
|
(4
|
)
|
$
|
(50
|
)
|
$
|
(115
|
)
|
||||
|
Basis swap contracts:
|
||||||||||||||
|
Interest income
|
Realized loss on derivatives
|
803
|
|
—
|
|
—
|
|
|||||||
|
Interest expense
|
Realized loss on derivatives
|
(922
|
)
|
—
|
|
—
|
|
|||||||
|
Changes in fair value
|
Unrealized gain (loss) on derivatives
|
661
|
|
—
|
|
—
|
|
|||||||
|
$
|
542
|
|
$
|
—
|
|
$
|
—
|
|
||||||
|
TBA Agency Securities:
|
||||||||||||||
|
Realized gain
|
Realized loss on derivatives
|
6,370
|
|
—
|
|
—
|
|
|||||||
|
$
|
6,370
|
|
$
|
—
|
|
$
|
—
|
|
||||||
|
Totals
|
$
|
(288,732
|
)
|
$
|
(581,346
|
)
|
$
|
408,735
|
|
|||||
F- 21
ARMOUR Residential REIT, Inc. and Subsidiary
NOTES TO CONSOLIDATED FINANCIAL STATEMENTS
(in thousands, except per share amounts)
Management Agreement with ACM
We are externally managed by ACM pursuant to a management agreement (the “Management Agreement”) see also
Note 14
, “
Related Party Transactions
”.
The Management Agreement entitles ACM to receive a management fee payable monthly in arrears. Currently, the monthly management fee is 1/12th of the sum of (a)
1.5%
of gross equity raised up to
$1.0 billion
plus (b)
0.75%
of gross equity raised in excess of
$1.0 billion
. The cost of repurchased stock and any dividend representing a return of capital for tax purposes will reduce the amount of gross equity raised used to calculate the monthly management fee. At
December 31, 2015
,
December 31, 2014
and
December 31, 2013
, the effective management fee was
1.049%
,
1.028%
and
1.026%
based on gross equity raised of
$2,507,505
,
$2,697,223
and
$2,769,661
, respectively. The ACM monthly management fee is not calculated based on the performance of our assets. Accordingly, the payment of our monthly management fee may not decline in the event of a decline in our earnings and may cause us to incur losses. We are also responsible for any costs and expenses that ACM incurred solely on behalf of ARMOUR other than the various overhead expenses specified in the terms of the Management Agreement. ACM is further entitled to receive a termination fee from us under certain circumstances.
Indemnifications and Litigation
We enter into certain contracts that contain a variety of indemnifications, principally with ACM and underwriters, against third party claims for errors and omissions in connection with their services to us. We have not incurred any costs to defend lawsuits or settle claims related to these indemnification agreements. As a result, the estimated fair value of these agreements, as well as the maximum amount attributable to past events, is not material. Accordingly, we have no liabilities recorded for these agreements at
December 31, 2015
and
December 31, 2014
.
We are not party to any pending, threatened or contemplated litigation.
We adopted the 2009 Stock Incentive Plan as amended, (the “Plan”) to attract, retain and reward directors and other persons who provide services to us in the course of operations. The Plan authorizes the Board to grant awards including common stock, restricted shares of common stock (“RSUs”), stock options, performance shares, performance units, stock appreciation rights and other equity and cash-based awards (collectively “Awards”), subject to terms as provided in the Plan.
On May 8, 2014, our stockholders approved an amendment to the Plan to increase the number of shares issuable thereunder from
2,000
to
15,000
shares and the Plan was amended accordingly. In connection with the Reverse Stock Split, the number of shares of common stock issuable under the Plan was properly adjusted to
1,875
shares to reflect the Reverse Stock Split.
Transactions related to awards for the
year
s ended
December 31, 2015
,
December 31, 2014
and
December 31, 2013
are summarized below:
|
|
December 31, 2015
|
December 31, 2014
|
December 31, 2013
|
||||||||||||||||||
|
|
Number of
Awards
|
Weighted
Average Grant
Date Fair Value
per Award
|
Number of
Awards
|
Weighted
Average Grant
Date Fair Value
per Award
|
Number of
Awards
|
Weighted
Average Grant
Date Fair Value
per Award
|
|||||||||||||||
|
Unvested RSU Awards Outstanding beginning of period
|
132
|
|
$
|
51.76
|
|
166
|
|
$
|
55.52
|
|
79
|
|
$
|
58.24
|
|
||||||
|
Granted
|
—
|
|
$
|
—
|
|
—
|
|
$
|
—
|
|
141
|
|
$
|
54.24
|
|
||||||
|
Awards issued upon stockholders' approval of Plan amendment
|
—
|
|
$
|
—
|
|
19
|
|
$
|
29.92
|
|
—
|
|
$
|
—
|
|
||||||
|
Vested
|
(53
|
)
|
$
|
56.40
|
|
(53
|
)
|
$
|
56.56
|
|
(53
|
)
|
$
|
57.04
|
|
||||||
|
Forfeited
|
(1
|
)
|
$
|
58.90
|
|
—
|
|
$
|
—
|
|
(1
|
)
|
$
|
61.52
|
|
||||||
|
Unvested RSU Awards Outstanding end of period
|
78
|
|
$
|
48.85
|
|
132
|
|
$
|
51.76
|
|
166
|
|
$
|
55.52
|
|
||||||
F- 22
ARMOUR Residential REIT, Inc. and Subsidiary
NOTES TO CONSOLIDATED FINANCIAL STATEMENTS
(in thousands, except per share amounts)
At
December 31, 2015
, there was approximately
$1,700
of unvested stock based compensation related to the Awards (based on the
December 31, 2015
stock price of
$21.76
per share), that we expect to recognize as an expense over the remaining average service period of
0.8 years
. We also pay our non-executive Board quarterly fees of
$33
, which is payable in cash, common stock, or a combination of common stock and cash at the option of the director.
Preferred Stock
At
December 31, 2015
and
December 31, 2014
, we were authorized to issue up to
50,000
shares of preferred stock, par value
$0.001
per share, with such designations, voting and other rights and preferences as may be determined from time to time by our Board of Directors (“Board”) or a committee thereof. We have designated
9,610
shares as
8.250%
Series A Preferred Stock and
6,210
shares as
7.875%
Series B Preferred Stock. At
December 31, 2015
, a total of
34,180
shares of our authorized preferred stock remain available for designation as future series.
Series A Cumulative Preferred Shares (“Series A Preferred Stock”)
At
December 31, 2015
and
December 31, 2014
, we had
2,181
shares of Series A Preferred Stock issued and outstanding with a par value of
$0.001
per share and a liquidation preference of
$25.00
per share, or
$54,514
in the aggregate. Shares designated as Series A Preferred Stock but unissued totaled
7,429
at
December 31, 2015
. At
December 31, 2015
and
December 31, 2014
, there were no accrued or unpaid dividends on the Series A Preferred Stock. The Series A Preferred Stock is entitled to a dividend at a rate of
8.250%
per year based on the
$25.00
per share liquidation preference before the common stock is entitled to receive any dividends. The Series A Preferred Stock is redeemable at
$25.00
per share plus accrued and unpaid dividends exclusively at our option commencing on June 7, 2017 (subject to our right under limited circumstances to redeem the Series A Preferred Stock earlier in order to preserve our qualification as a REIT). The Series A Preferred Stock is senior to our common stock and therefore in the event of liquidation, dissolution or winding up, the Series A Preferred Stock will receive a liquidation preference of
$25.00
per share plus accumulated and unpaid dividends before distributions are paid to holders of our common stock, with no right or claim to any of our remaining assets thereafter. The Series A Preferred Stock generally does not have voting rights, except if we fail to pay dividends on the Series A Preferred Stock for
eighteen
months, whether or not consecutive. Under such circumstances, the Series A Preferred Stock will be entitled to vote to elect
two
additional directors to the Board, until all unpaid dividends have been paid or declared and set aside for payment. The Series A Preferred Stock has no stated maturity, is not subject to any sinking fund or mandatory redemption and will remain outstanding indefinitely unless repurchased or redeemed by us or converted into our common stock in connection with a change of control by the holders of Series A Preferred Stock.
Series B Cumulative Preferred Shares (“Series B Preferred Stock”)
At
December 31, 2015
and
December 31, 2014
, we had
5,650
shares of Series B Preferred Stock issued and outstanding with a par value of
$0.001
per share and a liquidation preference of
$25.00
per share, or
$141,250
in the aggregate. Shares designated as Series B Preferred Stock but unissued totaled
560
at
December 31, 2015
. At
December 31, 2015
and
December 31, 2014
, there were no accrued or unpaid dividends on the Series B Preferred Stock. The Series B Preferred Stock is entitled to a dividend at a rate of
7.875%
per year based on the
$25.00
per share liquidation preference before the common stock is entitled to receive any dividends. The Series B Preferred Stock is redeemable at
$25.00
per share plus accrued and unpaid dividends exclusively at our option commencing on February 12, 2018 (subject to our right under limited circumstances to redeem the Series A Preferred Stock earlier in order to preserve our qualification as a REIT). The Series B Preferred Stock is senior to our common stock and rank on parity with the Series A Preferred Stock. In the event of liquidation, dissolution or winding up, the Series B Preferred Stock will receive a liquidation preference of
$25.00
per share plus accumulated and unpaid dividends before distributions are paid to holders of our common stock, with no right or claim to any of our remaining assets thereafter. The Series B Preferred Stock generally does not have voting rights, except if we fail to pay dividends on the Series B Preferred Stock for
eighteen
months, whether or not consecutive. Under such circumstances, the Series B Preferred Stock will be entitled to vote to elect
two
additional directors to the Board, until all unpaid dividends have been paid or declared and set aside for payment. The Series B Preferred Stock has no stated maturity, is not subject to any sinking fund or mandatory redemption and will remain outstanding indefinitely unless repurchased or redeemed by us or converted into our common stock in connection with a change of control by the holders of Series B Preferred Stock.
F- 23
ARMOUR Residential REIT, Inc. and Subsidiary
NOTES TO CONSOLIDATED FINANCIAL STATEMENTS
(in thousands, except per share amounts)
Common Stock
Common Stock
On June 18, 2015, we announced that our Board of Directors had approved a Reverse Stock Split. The Reverse Stock Split took effect at approximately 5:00 p.m. Eastern Time on July 31, 2015 (the “Effective Time”). At the Effective Time, every
eight
issued and outstanding shares of common stock was converted into one share of common stock, and as a result, the number of outstanding shares of common stock was reduced from approximately
350,000
to approximately
43,750
. At the Effective Time, the number of authorized shares of common stock was also reduced, on a one-for-
eight
basis, from
1,000,000
to
125,000
. The par value of each share of common stock remained unchanged. No fractional shares were issued in connection with the Reverse Stock Split.
At
December 31, 2015
and
December 31, 2014
, we were authorized to issue up to
125,000
shares of common stock, par value
$0.001
per share, with such designations, voting and other rights and preferences as may be determined from time to time by our Board. We had
36,682
shares of common stock issued and outstanding at
December 31, 2015
and
44,145
shares of common stock issued and outstanding at
December 31, 2014
.
Common Stock Repurchased
On March 5, 2014, our Board increased the authorization under our common stock repurchase program (the “Repurchase Program”) to
50,000
shares of our common stock outstanding (on a pre-reverse stock split basis). On July 28, 2015, our Board of Directors increased the number of shares of common stock authorized for repurchase under our Repurchase Program to an aggregate of
9,000
shares on a post-reverse stock split basis, effective August 3, 2015. Under the Repurchase Program, shares may be purchased in the open market, including block trades, through privately negotiated transactions, or pursuant to a trading plan separately adopted in the future. The timing, manner, price and amount of any repurchases will be at our discretion, subject to the requirements of the Securities Exchange Act of 1934, as amended, and related rules. We are not required to repurchase any shares under the Repurchase Program and it may be modified, suspended or terminated at any time for any reason. We do not intend to purchase shares from our Board or other affiliates. Under Maryland law, such repurchased shares are treated as authorized but unissued. At
December 31, 2015
, there were
1,874
authorized shares remaining under the Repurchase Program.
F- 24
ARMOUR Residential REIT, Inc. and Subsidiary
NOTES TO CONSOLIDATED FINANCIAL STATEMENTS
(in thousands, except per share amounts)
Dividends
The following tables present our common stock dividend transactions for the
years
ended
December 31, 2015
,
December 31, 2014
and
December 31, 2013
.
December 31, 2015
|
Record Date
|
Payment Date
|
Rate per common share
|
Aggregate
amount paid
to holders of record
|
|||||||
|
January 15, 2015
|
January 27, 2015
|
$
|
0.32
|
|
$
|
14,168
|
|
|||
|
February 13, 2015
|
February 27, 2015
|
$
|
0.32
|
|
14,169
|
|
||||
|
March 13, 2015
|
March 27, 2015
|
$
|
0.32
|
|
14,149
|
|
||||
|
April 15, 2015
|
April 27, 2015
|
$
|
0.32
|
|
14,133
|
|
||||
|
May 15, 2015
|
May 27, 2015
|
$
|
0.32
|
|
14,089
|
|
||||
|
June 15, 2015
|
June 29, 2015
|
$
|
0.32
|
|
14,045
|
|
||||
|
July 15, 2015
|
July 27, 2015
|
$
|
0.32
|
|
14,045
|
|
||||
|
August 17, 2015
|
August 27, 2015
|
$
|
0.33
|
|
14,477
|
|
||||
|
September 15, 2015
|
September 28, 2015
|
$
|
0.33
|
|
14,394
|
|
||||
|
October 15, 2015
|
October 27, 2015
|
$
|
0.33
|
|
13,438
|
|
||||
|
November 16, 2015
|
November 27, 2015
|
$
|
0.33
|
|
13,176
|
|
||||
|
December 16, 2015
|
December 30, 2015
|
$
|
0.33
|
|
12,859
|
|
||||
|
Total dividends paid
|
$
|
167,142
|
|
|||||||
December 31, 2014
|
Record Date
|
Payment Date
|
Rate per common share
|
Aggregate
amount paid to
holders of record
|
|||||||
|
January 15, 2014
|
January 30, 2014
|
$
|
0.40
|
|
$
|
17,954
|
|
|||
|
February 14, 2014
|
February 27, 2014
|
$
|
0.40
|
|
17,954
|
|
||||
|
March 17, 2014
|
March 28, 2014
|
$
|
0.40
|
|
17,945
|
|
||||
|
April 15, 2014
|
April 29, 2014
|
$
|
0.40
|
|
17,925
|
|
||||
|
May 15, 2014
|
May 29, 2014
|
$
|
0.40
|
|
17,924
|
|
||||
|
June 16, 2014
|
June 27, 2014
|
$
|
0.40
|
|
17,924
|
|
||||
|
July 15, 2014
|
July 30, 2014
|
$
|
0.40
|
|
17,923
|
|
||||
|
August 15, 2014
|
August 29, 2014
|
$
|
0.40
|
|
17,923
|
|
||||
|
September 15, 2014
|
September 29, 2014
|
$
|
0.40
|
|
17,923
|
|
||||
|
October 15, 2014
|
October 30, 2014
|
$
|
0.40
|
|
17,923
|
|
||||
|
November 17, 2014
|
November 26, 2014
|
$
|
0.40
|
|
17,923
|
|
||||
|
December 15, 2014
|
December 30, 2014
|
$
|
0.40
|
|
17,922
|
|
||||
|
Total dividends paid
|
$
|
215,163
|
|
|||||||
F- 25
ARMOUR Residential REIT, Inc. and Subsidiary
NOTES TO CONSOLIDATED FINANCIAL STATEMENTS
(in thousands, except per share amounts)
December 31, 2013
|
Record Date
|
Payment Date
|
Rate per common share
|
Aggregate amount paid to holders of record
|
|||||||
|
January 15, 2013
|
January 30, 2013
|
$
|
0.64
|
|
$
|
24,772
|
|
|||
|
February 15, 2013
|
February 27, 2013
|
$
|
0.64
|
|
24,773
|
|
||||
|
March 15, 2013
|
March 27, 2013
|
$
|
0.64
|
|
30,284
|
|
||||
|
April 15, 2013
|
April 29, 2013
|
$
|
0.56
|
|
26,313
|
|
||||
|
May 15, 2013
|
May 30, 2013
|
$
|
0.56
|
|
26,313
|
|
||||
|
June 14, 2013
|
June 27, 2013
|
$
|
0.56
|
|
26,088
|
|
||||
|
July 15, 2013
|
July 30, 2013
|
$
|
0.56
|
|
26,074
|
|
||||
|
August 15, 2013
|
August 29, 2013
|
$
|
0.56
|
|
26,074
|
|
||||
|
September 16, 2013
|
September 27, 2013
|
$
|
0.56
|
|
26,079
|
|
||||
|
October 15, 2013
|
October 28, 2013
|
$
|
0.40
|
|
18,624
|
|
||||
|
November 15, 2013
|
November 27, 2013
|
$
|
0.40
|
|
18,624
|
|
||||
|
December 16, 2013
|
December 27, 2013
|
$
|
0.40
|
|
18,574
|
|
||||
|
Total dividends paid
|
$
|
292,592
|
|
|||||||
The following tables present our Series A Preferred Stock dividend transactions for the
years
ended
December 31, 2015
,
December 31, 2014
and
December 31, 2013
.
December 31, 2015
|
Record Date
|
Payment Date
|
Rate per
Series A
Preferred
Share
|
Aggregate
amount paid
to holders of record
|
|||||||
|
January 15, 2015
|
January 27, 2015
|
$
|
0.17
|
|
$
|
374.8
|
|
|||
|
February 15, 2015
|
February 27, 2015
|
$
|
0.17
|
|
374.8
|
|
||||
|
March 15, 2015
|
March 27, 2015
|
$
|
0.17
|
|
374.8
|
|
||||
|
April 15, 2015
|
April 27, 2015
|
$
|
0.17
|
|
374.8
|
|
||||
|
May 15, 2015
|
May 27, 2015
|
$
|
0.17
|
|
374.8
|
|
||||
|
June 15, 2015
|
June 29, 2015
|
$
|
0.17
|
|
374.8
|
|
||||
|
July 15, 2015
|
July 27, 2015
|
$
|
0.17
|
|
374.8
|
|
||||
|
August 15, 2015
|
August 27, 2015
|
$
|
0.17
|
|
374.8
|
|
||||
|
September 15, 2015
|
September 28, 2015
|
$
|
0.17
|
|
374.8
|
|
||||
|
October 15, 2015
|
October 27, 2015
|
$
|
0.17
|
|
374.8
|
|
||||
|
November 15, 2015
|
November 27, 2015
|
$
|
0.17
|
|
374.8
|
|
||||
|
December 15, 2015
|
December 28, 2015
|
$
|
0.17
|
|
374.8
|
|
||||
|
Total dividends paid
|
$
|
4,497.6
|
|
|||||||
F- 26
ARMOUR Residential REIT, Inc. and Subsidiary
NOTES TO CONSOLIDATED FINANCIAL STATEMENTS
(in thousands, except per share amounts)
December 31, 2014
|
Record Date
|
Payment Date
|
Rate per
Series A
Preferred
Share
|
Aggregate
amount paid to
holders of record
|
|||||||
|
January 15, 2014
|
January 27, 2014
|
$
|
0.17
|
|
$
|
374.8
|
|
|||
|
February 15, 2014
|
February 27, 2014
|
$
|
0.17
|
|
374.8
|
|
||||
|
March 15, 2014
|
March 27, 2014
|
$
|
0.17
|
|
374.8
|
|
||||
|
April 15, 2014
|
April 28, 2014
|
$
|
0.17
|
|
374.8
|
|
||||
|
May 15, 2014
|
May 27, 2014
|
$
|
0.17
|
|
374.8
|
|
||||
|
June 15, 2014
|
June 27, 2014
|
$
|
0.17
|
|
374.8
|
|
||||
|
July 15, 2014
|
July 28, 2014
|
$
|
0.17
|
|
374.8
|
|
||||
|
August 15, 2014
|
August 27, 2014
|
$
|
0.17
|
|
374.8
|
|
||||
|
September 15, 2014
|
September 29, 2014
|
$
|
0.17
|
|
374.8
|
|
||||
|
October 15, 2014
|
October 27, 2014
|
$
|
0.17
|
|
374.8
|
|
||||
|
November 15, 2014
|
November 28, 2014
|
$
|
0.17
|
|
374.8
|
|
||||
|
December 15, 2014
|
December 29, 2014
|
$
|
0.17
|
|
374.8
|
|
||||
|
Total dividends paid
|
$
|
4,497.6
|
|
|||||||
December 31, 2013
|
Record Date
|
Payment Date
|
Rate per Series A Preferred share
|
Aggregate amount paid to holders of record
|
|||||||
|
January 15, 2013
|
January 28, 2013
|
$
|
0.17
|
|
$
|
357.6
|
|
|||
|
February 15, 2013
|
February 26, 2013
|
$
|
0.17
|
|
374.8
|
|
||||
|
March 15, 2013
|
March 26, 2013
|
$
|
0.17
|
|
374.8
|
|
||||
|
April 15, 2013
|
April 29, 2013
|
$
|
0.17
|
|
374.8
|
|
||||
|
May 15, 2013
|
May 27, 2013
|
$
|
0.17
|
|
374.8
|
|
||||
|
June 14, 2013
|
June 27, 2013
|
$
|
0.17
|
|
374.8
|
|
||||
|
July 15, 2013
|
July 29, 2013
|
$
|
0.17
|
|
374.8
|
|
||||
|
August 15, 2013
|
August 27, 2013
|
$
|
0.17
|
|
374.8
|
|
||||
|
September 15, 2013
|
September 27, 2013
|
$
|
0.17
|
|
374.8
|
|
||||
|
October 15, 2013
|
October 28, 2013
|
$
|
0.17
|
|
374.8
|
|
||||
|
November 15, 2013
|
November 27, 2013
|
$
|
0.17
|
|
374.8
|
|
||||
|
December 15, 2013
|
December 27, 2013
|
$
|
0.17
|
|
374.8
|
|
||||
|
Total dividends paid
|
|
$
|
4,480.4
|
|
||||||
The following tables present our Series B Preferred Stock dividend transactions for the
years
ended
December 31, 2015
,
December 31, 2014
and
December 31, 2013
.
F- 27
ARMOUR Residential REIT, Inc. and Subsidiary
NOTES TO CONSOLIDATED FINANCIAL STATEMENTS
(in thousands, except per share amounts)
December 31, 2015
|
Record Date
|
Payment Date
|
Rate per
Series B
Preferred
Share
|
Aggregate
amount paid
to holders of record
|
|||||||
|
January 15, 2015
|
January 27, 2015
|
$
|
0.16
|
|
$
|
927.0
|
|
|||
|
February 15, 2015
|
February 27, 2015
|
$
|
0.16
|
|
927.0
|
|
||||
|
March 15, 2015
|
March 27, 2015
|
$
|
0.16
|
|
927.0
|
|
||||
|
April 15, 2015
|
April 27, 2015
|
$
|
0.16
|
|
927.0
|
|
||||
|
May 15, 2015
|
May 27, 2015
|
$
|
0.16
|
|
927.0
|
|
||||
|
June 15, 2015
|
June 29, 2015
|
$
|
0.16
|
|
927.0
|
|
||||
|
July 15, 2015
|
July 27, 2015
|
$
|
0.16
|
|
927.0
|
|
||||
|
August 15, 2015
|
August 27, 2015
|
$
|
0.16
|
|
927.0
|
|
||||
|
September 15, 2015
|
September 28, 2015
|
$
|
0.16
|
|
927.0
|
|
||||
|
October 15, 2015
|
October 27, 2015
|
$
|
0.16
|
|
927.0
|
|
||||
|
November 15, 2015
|
November 27, 2015
|
$
|
0.16
|
|
927.0
|
|
||||
|
December 15, 2015
|
December 28, 2015
|
$
|
0.16
|
|
927.0
|
|
||||
|
Total dividends paid
|
$
|
11,124.0
|
|
|||||||
December 31, 2014
|
Record Date
|
Payment Date
|
Rate per
Series B
Preferred
Share
|
Aggregate
amount paid to
holders of record
|
|||||||
|
January 15, 2014
|
January 27, 2014
|
$
|
0.16
|
|
$
|
926.9
|
|
|||
|
February 15, 2014
|
February 27, 2014
|
$
|
0.16
|
|
$
|
926.9
|
|
|||
|
March 15, 2014
|
March 27, 2014
|
$
|
0.16
|
|
$
|
926.9
|
|
|||
|
April 15, 2014
|
April 28, 2014
|
$
|
0.16
|
|
$
|
926.9
|
|
|||
|
May 15, 2014
|
May 27, 2014
|
$
|
0.16
|
|
$
|
926.9
|
|
|||
|
June 15, 2014
|
June 27, 2014
|
$
|
0.16
|
|
$
|
926.9
|
|
|||
|
July 15, 2014
|
July 28, 2014
|
$
|
0.16
|
|
$
|
926.9
|
|
|||
|
August 15, 2014
|
August 27, 2014
|
$
|
0.16
|
|
$
|
926.9
|
|
|||
|
September 15, 2014
|
September 29, 2014
|
$
|
0.16
|
|
$
|
926.9
|
|
|||
|
October 15, 2014
|
October 27, 2014
|
$
|
0.16
|
|
$
|
926.9
|
|
|||
|
November 15, 2014
|
November 28, 2014
|
$
|
0.16
|
|
$
|
926.9
|
|
|||
|
December 15, 2014
|
December 29, 2014
|
$
|
0.16
|
|
$
|
926.9
|
|
|||
|
Total dividends paid
|
$
|
11,122.8
|
|
|||||||
F- 28
ARMOUR Residential REIT, Inc. and Subsidiary
NOTES TO CONSOLIDATED FINANCIAL STATEMENTS
(in thousands, except per share amounts)
December 31, 2013
|
Record Date
|
Payment Date
|
Rate per Series B Preferred share
|
Aggregate amount paid to holders of record
|
|||||||
|
March 15, 2013
|
March 27, 2013
|
$
|
0.25
|
|
$
|
1,391.0
|
|
|||
|
April 15, 2013
|
April 29, 2013
|
$
|
0.16
|
|
926.9
|
|
||||
|
May 15, 2013
|
May 27, 2013
|
$
|
0.16
|
|
926.9
|
|
||||
|
June 14, 2013
|
June 27, 2013
|
$
|
0.16
|
|
926.9
|
|
||||
|
July 15, 2013
|
July 29, 2013
|
$
|
0.16
|
|
926.9
|
|
||||
|
August 15, 2013
|
August 27, 2013
|
$
|
0.16
|
|
926.9
|
|
||||
|
September 15, 2013
|
September 27, 2013
|
$
|
0.16
|
|
926.9
|
|
||||
|
October 15, 2013
|
October 28, 2013
|
$
|
0.16
|
|
926.9
|
|
||||
|
November 15, 2013
|
November 27, 2013
|
$
|
0.16
|
|
926.9
|
|
||||
|
December 15, 2013
|
December 27, 2013
|
$
|
0.16
|
|
926.9
|
|
||||
|
Total dividends paid
|
$
|
9,733.1
|
|
|||||||
Equity Capital Raising Activities
The following tables present our equity transactions for the
years
ended
December 31, 2015
,
December 31, 2014
and
December 31, 2013
.
December 31, 2015
|
Transaction Type
|
Completion Date
|
Number of
Shares
|
Per Share
price (1)
|
|
Net Proceeds
|
||||||||
|
Common stock dividend reinvestment program
|
January 26, 2015 through November 27, 2015
|
6
|
|
$
|
23.21
|
|
$
|
147
|
|
||||
|
(1)
|
Weighted average price
|
December 31, 2014
|
Transaction Type
|
Completion Date
|
Number of
Shares
|
Per Share
price (1)
|
|
Net Proceeds
|
||||||||
|
Common stock dividend reinvestment program
|
January 27, 2014 through December 30, 2014
|
8
|
|
$
|
32.96
|
|
$
|
269
|
|
||||
|
(1)
|
Weighted average price
|
December 31, 2013
|
Transaction Type
|
Completion Date
|
Number of
Shares
|
Per Share price (1)
|
Net Proceeds
|
|||||||||
|
Series A Preferred equity distribution agreements
|
January 2, 2013 to January 30, 2013
|
175
|
|
$
|
25.51
|
|
$
|
4,380
|
|
||||
|
Common stock dividend reinvestment program
|
January 25, 2013 to December 27, 2013
|
8
|
|
$
|
38.64
|
|
$
|
—
|
|
||||
|
Series B Preferred initial offering
|
February 20, 2013
|
5,650
|
|
$
|
25.00
|
|
$
|
136,553
|
|
||||
|
Common stock follow-on public offering
|
February 20, 2013
|
8,125
|
|
$
|
54.00
|
|
$
|
438,582
|
|
||||
(1) Weighted average price
F- 29
ARMOUR Residential REIT, Inc. and Subsidiary
NOTES TO CONSOLIDATED FINANCIAL STATEMENTS
(in thousands, except per share amounts)
Common Stock Repurchases
The following tables present our common stock repurchases for the
years
ended
December 31, 2015
,
December 31, 2014
and
December 31, 2013
.
December 31, 2015
|
Transaction Type
|
Completion Date
|
Number of
Shares |
Per Share price (1)
|
|
Net Cost
|
||||||||
|
Repurchased common shares
|
March 5, 2015 through December 31, 2015
|
7,510
|
|
$
|
21.25
|
|
$
|
159,600
|
|
||||
|
(1)
|
Weighted average price
|
December 31, 2014
|
Transaction Type
|
Completion Date
|
Number of
Shares |
Per Share price (1)
|
|
Net Cost
|
||||||||
|
Repurchased common shares
|
March 12, 2014 through December 31, 2014
|
600
|
|
$
|
30.56
|
|
$
|
18,362
|
|
||||
|
(1)
|
Weighted average price
|
December 31, 2013
|
Transaction Type
|
Completion Date
|
Number of
Shares
|
Per Share price (1)
|
Net Cost
|
|||||||||
|
Repurchased common shares
|
May 15, 2013 to May 17, 2013
|
424
|
|
$
|
47.52
|
|
$
|
20,259
|
|
||||
|
Repurchased common shares
|
December 11, 2013 to December 31, 2013
|
1,672
|
|
$
|
31.12
|
|
$
|
52,435
|
|
||||
(1) Weighted average price
The following table presents a reconciliation of net loss and the shares used in calculating weighted average basic and diluted earnings per common share for the years ended
December 31, 2015
,
December 31, 2014
and
December 31, 2013
.
|
|
For the Year Ended
|
||||||||||
|
|
December 31, 2015
|
December 31, 2014
|
December 31, 2013
|
||||||||
|
Net Loss
|
$
|
(31,205
|
)
|
$
|
(179,048
|
)
|
$
|
(187,044
|
)
|
||
|
Less: Preferred dividends
|
(15,622
|
)
|
(15,620
|
)
|
(14,213
|
)
|
|||||
|
Net loss related to common stockholders
|
$
|
(46,827
|
)
|
$
|
(194,668
|
)
|
$
|
(201,257
|
)
|
||
|
Weighted average common shares outstanding – basic
|
42,780
|
|
44,654
|
|
45,354
|
|
|||||
|
Add: Effect of dilutive non-vested awards, assumed vested
|
—
|
|
—
|
|
—
|
|
|||||
|
Weighted average common shares outstanding – diluted
|
42,780
|
|
44,654
|
|
45,354
|
|
|||||
F- 30
ARMOUR Residential REIT, Inc. and Subsidiary
NOTES TO CONSOLIDATED FINANCIAL STATEMENTS
(in thousands, except per share amounts)
The following table reconciles our GAAP net income to estimated REIT taxable income for the
years
ended
December 31, 2015
,
December 31, 2014
and
December 31, 2013
.
|
|
For the Year Ended
|
||||||||||
|
|
December 31, 2015
|
December 31, 2014
|
December 31, 2013
|
||||||||
|
GAAP net loss
|
$
|
(31,205
|
)
|
$
|
(179,048
|
)
|
$
|
(187,044
|
)
|
||
|
Book to tax differences:
|
|
|
|
||||||||
|
Changes in interest rate contracts
|
177,565
|
|
439,312
|
|
(551,359
|
)
|
|||||
|
(Gains) Losses on Security Sales
|
11,546
|
|
(54,082
|
)
|
579,322
|
|
|||||
|
Other than temporary loss on Agency Securities
|
—
|
|
—
|
|
401,541
|
|
|||||
|
Amortization of deferred hedging costs
|
(13,731
|
)
|
(1,174
|
)
|
(2,030
|
)
|
|||||
|
Net premium amortization differences
|
—
|
|
(5,609
|
)
|
—
|
|
|||||
|
Other
|
17
|
|
21
|
|
18
|
|
|||||
|
Estimated taxable income
|
$
|
144,192
|
|
$
|
199,420
|
|
$
|
240,448
|
|
||
Interest rate contracts are treated as hedging transactions for tax purposes. Unrealized gains and losses on open interest rate contracts are not included in the determination of taxable income. Realized gains and losses on interest rate contracts terminated before their maturity are deferred and amortized over the remainder of the original term of the contract.
Net capital losses realized in 2013, 2014 and 2015 totaling
$(579,322)
,
$(341,850)
and
$(5,175)
will be available to offset future capital gains realized through 2018, 2019 and 2020, respectively.
The aggregate tax basis of our assets and liabilities was less than our total Stockholders’ Equity at
December 31, 2015
by approximately
$(223,217)
, or approximately
$(6.09)
per common share (based on the
36,682
common shares then outstanding).
We are required and intend to timely distribute substantially all of our REIT taxable income in order to maintain our REIT status under the Code. Total dividend payments to stockholders were
$182,764
,
$230,783
and
$306,805
for the years ended
December 31, 2015
,
December 31, 2014
and
December 31, 2013
, respectively. Our estimated REIT taxable income available to pay dividends was
$144,192
,
$199,420
and
$240,448
for the
year ended
December 31, 2015
,
December 31, 2014
and
December 31, 2013
, respectively. Our taxable REIT income and dividend requirements to maintain our REIT status are determined on an annual basis. Dividends paid in excess of taxable REIT income for the year (including amounts carried forward from prior years) will generally not be taxable to common stockholders. The portion of the dividends on our common stock which represented non-taxable return of capital was approximately
22.88%
in 2015,
14.29%
in 2014 and
19.39%
in 2013.
Our management is responsible for determining whether tax positions taken by us are more likely than not to be sustained on their merits. We have no material unrecognized tax benefits or material uncertain tax positions.
We are externally managed by ACM pursuant to the Management Agreement. All of our executive officers are also employees of ACM. ACM manages our day-to-day operations, subject to the direction and oversight of the Board. The Management Agreement runs through June 18, 2022 and is thereafter automatically renewed for an additional
five
-year term unless terminated under certain circumstances. Either party must provide
180 days
prior written notice of any such termination.
Under the terms of the Management Agreement, ACM is responsible for costs incident to the performance of its duties, such as compensation of its employees and various overhead expenses. ACM is responsible for the following primary roles:
|
•
|
Advising us with respect to, arranging for and managing the acquisition, financing, management and disposition of, elements of our investment portfolio;
|
|
•
|
Evaluating the duration risk and prepayment risk within the investment portfolio and arranging borrowing and hedging strategies;
|
F- 31
ARMOUR Residential REIT, Inc. and Subsidiary
NOTES TO CONSOLIDATED FINANCIAL STATEMENTS
(in thousands, except per share amounts)
|
•
|
Coordinating capital raising activities;
|
|
•
|
Advising us on the formulation and implementation of operating strategies and policies, arranging for the acquisition of assets, monitoring the performance of those assets and providing administrative and managerial services in connection with our day-to-day operations; and
|
|
•
|
Providing executive and administrative personnel, office space and other appropriate services required in rendering management services to us.
|
In accordance with the Management Agreement, we incurred
$27,292
,
$27,857
and
$28,141
in management fees for the
year ended
December 31, 2015
,
December 31, 2014
and
December 31, 2013
.
We are required to take actions as may be reasonably required to permit and enable ACM to carry out its duties and obligations. We are also responsible for any costs and expenses that ACM incurred solely on our behalf other than the various overhead expenses specified in the terms of the Management Agreement. For the years ended
December 31, 2015
,
December 31, 2014
and
December 31, 2013
we reimbursed ACM
$1,921
$2,204
and
$1,550
, respectively for other expenses incurred on our behalf. In consideration of our 2012 results, in 2013, we also elected to make a restricted stock award to our executive officers and other ACM employees through ACM. The award vests through 2017 and resulted in our recognizing stock based compensation expense of
$623
,
$900
and
$1,097
for the years ended
December 31, 2015
,
December 31, 2014
and
December 31, 2013
.
Our primary market risk is interest rate risk. Interest rates are highly sensitive to many factors, including governmental monetary and tax policies, domestic and international economic and political considerations and other factors beyond our control. Changes in the general level of interest rates can affect net interest income, which is the difference between the interest income earned and the interest expense incurred in connection with the liabilities, by affecting the spread between the interest-earning assets and interest-bearing liabilities. Changes in the level of interest rates also can affect the value of Agency Securities and our ability to realize gains from the sale of these assets. A decline in the value of the Agency Securities pledged as collateral for borrowings under repurchase agreements could result in the counterparties demanding additional collateral pledges or liquidation of some of the existing collateral to reduce borrowing levels.
On January 27, 2016, a cash dividend of
$0.17
per outstanding share of Series A Preferred Stock, or
$375
in the aggregate, and
$0.16
per outstanding share of Series B Preferred Stock, or
$927
in the aggregate, was paid to holders of record on January 15, 2016. We have also declared cash dividends of
$0.17
and
$0.16
per outstanding share of Series A Preferred Stock and Series B Preferred Stock, respectively, payable February 26, 2016 to holders of record on February 15, 2016 and payable March 28, 2016 to holders of record on March 15, 2016.
On January 27, 2016, a cash dividend of
$0.33
per outstanding common share, or
$12,105
in the aggregate, was paid to holders of record on January 15, 2016. We have also declared cash dividends of
$0.33
per outstanding common share payable February 26, 2016 to holders of record on February 15, 2016.
In January 2016, the Federal Housing Financing Authority issued a Final Rule revising its regulations governing FHLB bank membership. The Final Rule changes the definition of “insurance company” to exclude captives, thereby making them ineligible for membership. The Final Rule contains a transition provision to give captives admitted to membership on or after the date of the publication of the proposed rule, which includes SABRE, until February 2017 to terminate its membership in the FHLB Des Moines.
Under the Final Rule, SABRE is prohibited from taking new advances or renewing its existing
$100,000
advance, which matures in December 2016. The Final Rule does not directly affect ARMOUR's MRA agreement or reported repurchase financing with another FHLB.
F- 32
ARMOUR Residential REIT, Inc. and Subsidiary
NOTES TO CONSOLIDATED FINANCIAL STATEMENTS
(in thousands, except per share amounts)
The following tables are a comparative breakdown of our unaudited quarterly financial results for the immediately preceding
eight
quarters.
|
|
Quarter Ended
|
||||||||||||||
|
|
March 31,
2015 |
June 30,
2015 |
September 30,
2015 |
December 31,
2015 |
|||||||||||
|
Interest income, net of premium amortization
|
$
|
99,550
|
|
$
|
91,702
|
|
$
|
85,643
|
|
$
|
88,405
|
|
|||
|
Interest expense- repurchase agreements
|
(14,192
|
)
|
(13,917
|
)
|
(14,430
|
)
|
(16,739
|
)
|
|||||||
|
Net Interest Income
|
$
|
85,358
|
|
$
|
77,785
|
|
$
|
71,213
|
|
$
|
71,666
|
|
|||
|
Realized gain (loss) on sale of Agency Securities (reclassified from Other comprehensive income (loss))
|
6,544
|
|
(5,051
|
)
|
69
|
|
(13,108
|
)
|
|||||||
|
Realized loss on derivatives (1)
|
8,099
|
|
(59,978
|
)
|
(17,400
|
)
|
(37,791
|
)
|
|||||||
|
Unrealized gain (loss) on derivatives
|
(216,338
|
)
|
194,507
|
|
(266,074
|
)
|
106,243
|
|
|||||||
|
Expenses
|
(9,132
|
)
|
(9,246
|
)
|
(9,360
|
)
|
(9,211
|
)
|
|||||||
|
Net Income (Loss)
|
$
|
(125,469
|
)
|
$
|
198,017
|
|
$
|
(221,552
|
)
|
$
|
117,799
|
|
|||
|
Dividends declared on preferred stock
|
(3,905
|
)
|
(3,905
|
)
|
(3,905
|
)
|
(3,907
|
)
|
|||||||
|
Net Income (Loss) available (related) to common stockholders
|
$
|
(129,374
|
)
|
$
|
194,112
|
|
$
|
(225,457
|
)
|
$
|
113,892
|
|
|||
|
Net income (loss) available (related) per share to common stockholders – Basic
|
$
|
(2.93
|
)
|
$
|
4.42
|
|
$
|
(5.18
|
)
|
$
|
2.88
|
|
|||
|
Net income (loss) available (related) per share to common stockholders – Diluted
|
$
|
(2.93
|
)
|
$
|
4.41
|
|
$
|
(5.18
|
)
|
$
|
2.87
|
|
|||
|
Dividends declared per common share
|
$
|
0.96
|
|
$
|
0.96
|
|
$
|
0.98
|
|
$
|
0.99
|
|
|||
|
Weighted average common shares outstanding – Basic
|
44,118
|
|
43,916
|
|
43,561
|
|
39,567
|
|
|||||||
|
Weighted average common shares outstanding – Diluted
|
44,118
|
|
44,022
|
|
43,561
|
|
39,645
|
|
|||||||
(1) Interest expense related to our interest rate swap contracts is recorded in realized loss on derivatives on the consolidated statements of operations.
F- 33
ARMOUR Residential REIT, Inc. and Subsidiary
NOTES TO CONSOLIDATED FINANCIAL STATEMENTS
(in thousands, except per share amounts)
|
|
Quarter Ended
|
||||||||||||||
|
|
March 31,
2014 |
June 30,
2014 |
September 30,
2014 |
December 31,
2014 |
|||||||||||
|
Interest income, net of premium amortization
|
$
|
123,082
|
|
$
|
113,892
|
|
$
|
107,481
|
|
$
|
106,472
|
|
|||
|
Interest expense- repurchase agreements
|
(14,747
|
)
|
(14,979
|
)
|
(15,006
|
)
|
(14,830
|
)
|
|||||||
|
Interest expense- U.S. Treasury Securities sold short
|
—
|
|
(4,263
|
)
|
(160
|
)
|
(1,128
|
)
|
|||||||
|
Net Interest Income
|
$
|
108,335
|
|
$
|
94,650
|
|
$
|
92,315
|
|
$
|
90,514
|
|
|||
|
Realized gain (loss) on sale of Agency Securities (reclassified from Other comprehensive income (loss))
|
69,869
|
|
11,167
|
|
(12,390
|
)
|
124
|
|
|||||||
|
Gain (loss) on short sale of U.S. Treasury Securities
|
—
|
|
(15,781
|
)
|
3,086
|
|
(1,993
|
)
|
|||||||
|
Realized loss on derivatives (1)
|
(11,739
|
)
|
(34,498
|
)
|
(34,655
|
)
|
(37,824
|
)
|
|||||||
|
Unrealized gain (loss) on derivatives
|
(176,355
|
)
|
(116,273
|
)
|
14,708
|
|
(184,710
|
)
|
|||||||
|
Expenses
|
(9,888
|
)
|
(9,455
|
)
|
(8,972
|
)
|
(9,283
|
)
|
|||||||
|
Net Income (Loss)
|
$
|
(19,778
|
)
|
$
|
(70,190
|
)
|
$
|
54,092
|
|
$
|
(143,172
|
)
|
|||
|
Dividends declared on preferred stock
|
(3,905
|
)
|
(3,905
|
)
|
(3,905
|
)
|
(3,905
|
)
|
|||||||
|
Net Income (Loss) available (related) to common stockholders
|
$
|
(23,683
|
)
|
$
|
(74,095
|
)
|
$
|
50,187
|
|
$
|
(147,077
|
)
|
|||
|
Net income (loss) available (related) per share to common stockholders – Basic
|
$
|
(0.56
|
)
|
$
|
(1.68
|
)
|
$
|
1.12
|
|
$
|
(3.29
|
)
|
|||
|
Net income (loss) available (related) per share to common stockholders – Diluted
|
$
|
(0.56
|
)
|
$
|
(1.68
|
)
|
$
|
1.12
|
|
$
|
(3.29
|
)
|
|||
|
Dividends declared per common share
|
$
|
1.20
|
|
$
|
1.20
|
|
$
|
1.20
|
|
$
|
1.20
|
|
|||
|
Weighted average common shares outstanding – Basic
|
44,687
|
|
44,639
|
|
44,650
|
|
44,642
|
|
|||||||
|
Weighted average common shares outstanding – Diluted
|
44,687
|
|
44,639
|
|
44,795
|
|
44,642
|
|
|||||||
(1) Interest expense related to our interest rate swap contracts is recorded in realized loss on derivatives on the consolidated statements of operations.
F- 34
SIGNATURES
Pursuant to the requirements of Section 13 or 15(d) of the Securities and Exchange Act of 1934, the registrant has duly caused this report to be signed on its behalf by the undersigned thereunto duly authorized.
|
Date: February 18, 2016
|
ARMOUR RESIDENTIAL REIT, INC.
|
|
|
|
||
|
/s/ James R. Mountain
|
||
|
James R. Mountain
Chief Financial Officer, Duly Authorized Officer, Treasurer, Secretary and Principal Financial and Accounting Officer
|
||
Pursuant to the requirements of the Securities Exchange Act of 1934, this report has been signed below by the following persons on behalf of the registrant and in the capacities and on the dates indicated:
|
Signature
|
Title
|
Date
|
||
|
|
|
|
||
|
/s/ Scott J. Ulm
|
Co-Chief Executive Officer, Chief Investment Officer, Head of
|
February 18, 2016
|
||
|
Scott J. Ulm
|
Risk Management and Co-Vice Chairman (Principal Executive Officer)
|
|
||
|
|
|
|
||
|
/s/ Jeffrey J. Zimmer
|
Co-Chief Executive Officer, President, Co-Vice Chairman
|
February 18, 2016
|
||
|
Jeffrey J. Zimmer
|
(Principal Executive Officer)
|
|
||
|
|
|
|
||
|
/s/ James R. Mountain
|
Chief Financial Officer, Treasurer and Secretary
|
February 18, 2016
|
||
|
James R. Mountain
|
(Principal Financial and Accounting Officer)
|
|
||
|
|
|
|
||
|
/s/ Daniel C. Staton
|
Chairman
|
February 17, 2016
|
||
|
Daniel C. Staton
|
|
|
||
|
|
|
|
||
|
/s/ Marc H. Bell
|
Director
|
February 17, 2016
|
||
|
Marc H. Bell
|
|
|
||
|
|
|
|
||
|
/s/ Thomas K. Guba
|
Director
|
February 17, 2016
|
||
|
Thomas K. Guba
|
|
|
||
|
|
|
|
||
|
/s/ Stewart J. Paperin
|
Director
|
February 17, 2016
|
||
|
Stewart J. Paperin
|
|
|
||
|
|
|
|
||
|
/s/ John P. Hollihan, III
|
Director
|
February 17, 2016
|
||
|
John P. Hollihan, III
|
|
|
||
|
|
|
|
||
|
/s/ Robert C. Hain
|
Director
|
February 18, 2016
|
||
|
Robert C. Hain
|
|
|
||
|
|
|
|
||
|
/s/ Carolyn Downey
|
Director
|
February 18, 2016
|
||
|
Carolyn Downey
|
|
|
||
TABLE OF CONTENTS
Part IItem 1. BusinessItem 1A. Risk FactorsItem 1B. Unresolved Staff CommentsItem 2. PropertiesItem 3. Legal ProceedingsItem 4. Mine Safety DisclosuresPart IIItem 5. Market For Registrant S Common Equity, Related Stockholder Matters and Issuer Purchases Of Equity SecuritiesItem 6. Selected Financial DataItem 7. Management S Discussion and Analysis Of Financial Condition and Results Of OperationsItem 7A. Quantitative and Qualitative Disclosures About Market RiskItem 8. Financial Statements and Supplementary DataItem 9. Changes in and Disagreements with Accountants on Accounting and Financial DisclosureItem 9A. Controls and ProceduresItem 9B. Other InformationPart IIIItem 10. Directors, Executive Officers and Corporate GovernanceItem 11. Executive CompensationItem 12. Security Ownership Of Certain Beneficial Owners and Management and Related Stockholder MattersItem 13. Certain Relationships and Related Transactions, and Director IndependenceItem 14. Principal Accounting Fees and ServicesPart IVItem 15. Exhibits, Financial Statement SchedulesNote 1 -basis Of PresentationNote 2 -organization and Nature Of Business OperationsNote 9 -commitments and ContingenciesNote 14 -related Party TransactionsNote 3 -summary Of Significant Accounting PoliciesNote 4 -recent Accounting PronouncementsNote 5 -fair Value Of Financial InstrumentsNote 6 -agency Securities, Available For SaleNote 7 -repurchase AgreementsNote 8 -derivativesNote 10 -stock Based CompensationNote 11 -stockholders' EquityNote 12 -net Loss Per Common ShareNote 13 -income TaxesNote 15 -interest Rate RiskNote 16 -subsequent EventsNote 17 -quarterly Financial Data (unaudited)