ARMOUR RESIDENTIAL REIT, INC.
10-Ks and 10-Qs
|
|
|
|
|
|
|
|
|
|
|
|
|
|
|
|
|
|
|
|
|
|
|
|
|
|
|
|
|
|
|
|
|
|
|
|
|
|
|
|
|
|
|
|
|
|
|
|
|
|
|
|
|
|
|
|
UNITED STATES
SECURITIES AND EXCHANGE COMMISSION
WASHINGTON, D.C. 20549
FORM 10-Q
|
x
|
QUARTERLY REPORT PURSUANT TO SECTION 13 OR 15(d) OF THE SECURITIES EXCHANGE ACT OF 1934
|
For the Quarterly Period Ended
June 30, 2018
OR
|
o
|
TRANSITION REPORT PURSUANT TO SECTION 13 OR 15(d) OF THE SECURITIES EXCHANGE ACT OF 1934
|
For the transition period from
to
ARMOUR RESIDENTIAL REIT, INC.
(Exact name of registrant as specified in its charter)
|
Maryland
|
001-34766
|
26-1908763
|
|
(State or other jurisdiction of incorporation or organization)
|
(Commission File Number)
|
(I.R.S. Employer Identification No.)
|
3001 Ocean Drive, Suite 201, Vero Beach, FL 32963
(Address of principal executive offices)(zip code)
(772) 617-4340
(Registrant’s telephone number, including area code)
Indicate by check mark whether the registrant (1) has filed all reports required to be filed by Section 13 or 15(d) of the Securities Exchange Act of 1934 during the preceding 12 months (or for such shorter period that the registrant was required to file such reports) and (2) has been subject to such filing requirements for the past 90 days. YES
x
NO
o
Indicate by check mark whether the registrant has submitted electronically and posted on its corporate Web site, if any, every Interactive Data File required to be submitted and posted pursuant to Rule 405 of Regulation S-T (§232.405 of this chapter) during the preceding 12 months (or for such shorter period that the registrant was required to submit and post such files). YES
x
NO
o
Indicate by check mark whether the registrant is a large accelerated filer, an accelerated filer, a non-accelerated filer, a smaller reporting company or an emerging growth company. See the definitions of "large accelerated filer," "accelerated filer" "smaller reporting company" and "emerging growth company" in Rule 12b-2 of the Exchange Act.
Large accelerated filer
x
Accelerated filer
o
Non-accelerated filer
o
(Do not check if a smaller reporting company)
Smaller reporting company
o
Emerging growth company
o
If an emerging growth company, indicate by a check mark if the registrant has elected not to use the extended transition period for complying with any new or revised financial accounting standards provided pursuant to Section 13(a) of the Exchange Act
o
Indicate by check mark whether the registrant is a shell company (as defined in Rule 12b-2 of the Exchange Act). YES
o
NO
x
The number of outstanding shares of the Registrant’s common stock as of
July 24, 2018
was
41,928,133
.
ARMOUR Residential REIT, Inc.
TABLE OF CONTENTS
3
ARMOUR Residential REIT, Inc.
(in thousands, except per share)
|
|
June 30,
2018 |
December 31, 2017
|
||||||
|
Assets
|
|
|
||||||
|
Cash
|
$
|
|
|
$
|
|
|
||
|
Cash collateral posted to counterparties
|
|
|
|
|
||||
|
Investments in securities, at fair value
|
||||||||
|
Agency Securities (including pledged securities of $5,816,453 at June 30, 2018 and $7,094,766 at December 31, 2017)
|
|
|
|
|
||||
|
Credit Risk and Non-Agency Securities (including pledged securities of $831,040 at June 30, 2018 and $974,372 at December 31, 2017)
|
|
|
|
|
||||
|
Interest-Only Securities
|
|
|
|
|
||||
|
Receivable for unsettled sales (including pledged securities of $216,292 at June 30, 2018)
|
|
|
|
|
||||
|
Derivatives, at fair value
|
|
|
|
|
||||
|
Accrued interest receivable
|
|
|
|
|
||||
|
Prepaid and other
|
|
|
|
|
||||
|
Subordinated loans due from BUCKLER Securities LLC
|
|
|
|
|
||||
|
Total Assets
|
$
|
|
|
$
|
|
|
||
|
Liabilities and Stockholders’ Equity
|
|
|
||||||
|
Liabilities:
|
|
|
||||||
|
Repurchase agreements
|
$
|
|
|
$
|
|
|
||
|
Cash collateral posted by counterparties
|
|
|
|
|
||||
|
Payable for unsettled purchases
|
|
|
|
|
||||
|
Derivatives, at fair value
|
|
|
|
|
||||
|
Accrued interest payable- repurchase agreements
|
|
|
|
|
||||
|
Accounts payable and other accrued expenses
|
|
|
|
|
||||
|
Total Liabilities
|
$
|
|
|
$
|
|
|
||
|
Commitments and contingencies (Note 10)
|
|
|
||||||
|
Stockholders’ Equity:
|
|
|
||||||
|
Preferred stock, $0.001 par value, 50,000 shares authorized;
|
|
|
||||||
|
8.250% Series A Cumulative Preferred Stock; 2,181 issued and outstanding ($54,514 aggregate liquidation preference)
|
|
|
|
|
||||
|
7.875% Series B Cumulative Preferred Stock; 6,369 and 6,262 shares issued and outstanding at June 30, 2018 and December 31, 2017 ($159,232 and $156,560 aggregate liquidation preference, respectively)
|
|
|
|
|
||||
|
Common stock, $0.001 par value, 125,000 shares authorized, 41,928 and 41,877 shares issued and outstanding at June 30, 2018 and December 31, 2017
|
|
|
|
|
||||
|
Additional paid-in capital
|
|
|
|
|
||||
|
Accumulated deficit
|
(
|
)
|
(
|
)
|
||||
|
Accumulated other comprehensive loss
|
(
|
)
|
(
|
)
|
||||
|
Total Stockholders’ Equity
|
$
|
|
|
$
|
|
|
||
|
Total Liabilities and Stockholders’ Equity
|
$
|
|
|
$
|
|
|
||
See financial statement notes (unaudited).

4
ARMOUR Residential REIT, Inc.
(in thousands, except per share)
|
|
For the Three Months Ended June 30,
|
For the Six Months Ended June 30,
|
||||||||||||||
|
|
2018
|
2017
|
2018
|
2017
|
||||||||||||
|
Interest Income:
|
||||||||||||||||
|
Agency Securities, net of amortization of premium and fees
|
$
|
|
|
$
|
|
|
$
|
|
|
$
|
|
|
||||
|
Credit Risk and Non-Agency Securities, including discount accretion
|
|
|
|
|
|
|
|
|
||||||||
|
Interest-Only Securities
|
|
|
|
|
|
|
|
|
||||||||
|
U.S. Treasury Securities
|
|
|
|
|
|
|
|
|
||||||||
|
BUCKLER Subordinated loans
|
|
|
|
|
|
|
|
|
||||||||
|
Total Interest Income
|
$
|
|
|
$
|
|
|
$
|
|
|
$
|
|
|
||||
|
Interest expense- repurchase agreements
|
(
|
)
|
(
|
)
|
(
|
)
|
(
|
)
|
||||||||
|
Net Interest Income
|
$
|
|
|
|
$
|
|
|
|
$
|
|
|
|
$
|
|
|
|
|
Other Income (Loss):
|
|
|
|
|
||||||||||||
|
Realized loss on sale of Agency Securities (reclassified from Other comprehensive income (loss))
|
(
|
)
|
(
|
)
|
(
|
)
|
(
|
)
|
||||||||
|
Other than temporary impairment of Agency Securities (reclassified from Other comprehensive income)
|
|
|
(
|
)
|
(
|
)
|
(
|
)
|
||||||||
|
Gain (loss) on Credit Risk and Non-Agency Securities
|
(
|
)
|
|
|
(
|
)
|
|
|
||||||||
|
Gain (loss) on Interest-Only Securities
|
(
|
)
|
|
|
(
|
)
|
(
|
)
|
||||||||
|
Loss on U.S. Treasury Securities
|
(
|
)
|
|
|
(
|
)
|
|
|
||||||||
|
Subtotal
|
$
|
(
|
)
|
|
$
|
|
|
|
$
|
(
|
)
|
|
$
|
|
|
|
|
Realized gain (loss) on derivatives
(1)
|
(
|
)
|
|
|
(
|
)
|
(
|
)
|
||||||||
|
Unrealized gain (loss) on derivatives
|
|
|
(
|
)
|
|
|
(
|
)
|
||||||||
|
Subtotal
|
$
|
|
|
|
$
|
(
|
)
|
|
$
|
|
|
$
|
(
|
)
|
||
|
Total Other Income (Loss)
|
$
|
(
|
)
|
|
$
|
(
|
)
|
|
$
|
|
|
$
|
|
|
||
|
Expenses:
|
|
|
|
|
||||||||||||
|
Management fees
|
|
|
|
|
|
|
|
|
||||||||
|
Professional fees
|
|
|
|
|
|
|
|
|
||||||||
|
Insurance
|
|
|
|
|
|
|
|
|
||||||||
|
Compensation
|
|
|
|
|
|
|
|
|
||||||||
|
Other
|
|
|
|
|
|
|
|
|
||||||||
|
Total Expenses
|
$
|
|
|
|
$
|
|
|
|
$
|
|
|
|
$
|
|
|
|
|
Net Income
|
$
|
|
|
|
$
|
|
|
|
$
|
|
|
$
|
|
|
||
|
Dividends on preferred stock
|
(
|
)
|
(
|
)
|
(
|
)
|
(
|
)
|
||||||||
|
Net Income available to common stockholders
|
$
|
|
|
|
$
|
|
|
|
$
|
|
|
$
|
|
|
||
|
Net Income per share available to common stockholders (Note 13):
|
|
|
|
|
||||||||||||
|
Basic
|
$
|
|
|
$
|
|
|
$
|
|
|
$
|
|
|
||||
|
Diluted
|
$
|
|
|
$
|
|
|
$
|
|
|
$
|
|
|
||||
|
Dividends declared per common share
|
$
|
|
|
$
|
|
|
$
|
|
|
$
|
|
|
||||
|
Weighted average common shares outstanding:
|
|
|
|
|
||||||||||||
|
Basic
|
|
|
|
|
|
|
|
|
||||||||
|
Diluted
|
|
|
|
|
|
|
|
|
||||||||
(1)
Interest expense related to our interest rate swap contracts is recorded in realized gain (loss) on derivatives on the consolidated statements of operations. For additional information, see financial statement
Note 9
.
See financial statement notes (unaudited).
5
ARMOUR Residential REIT, Inc.
CONSOLIDATED STATEMENTS OF COMPREHENSIVE INCOME (LOSS) (UNAUDITED)
(in thousands)
|
|
For the Three Months Ended June 30,
|
For the Six Months Ended June 30,
|
||||||||||||||
|
|
2018
|
2017
|
2018
|
2017
|
||||||||||||
|
Net Income
|
$
|
|
|
$
|
|
|
$
|
|
|
$
|
|
|
||||
|
Other comprehensive income (loss):
|
|
|
|
|
||||||||||||
|
Reclassification adjustment for realized loss on sale of available for sale Agency Securities
|
|
|
|
|
|
|
|
|
||||||||
|
Reclassification adjustment for other than temporary impairment of available for sale Agency Securities
|
|
|
|
|
|
|
|
|
||||||||
|
Net unrealized gain (loss) on available for sale Agency Securities
|
(
|
)
|
|
|
(
|
)
|
|
|
||||||||
|
Other comprehensive income (loss)
|
$
|
(
|
)
|
$
|
|
|
$
|
(
|
)
|
$
|
|
|
||||
|
Comprehensive Income (Loss)
|
$
|
(
|
)
|
$
|
|
|
$
|
(
|
)
|
$
|
|
|
||||
See financial statement notes (unaudited).
6
ARMOUR Residential REIT, Inc.
CONSOLIDATED STATEMENT OF STOCKHOLDERS’ EQUITY (UNAUDITED)
(in thousands)
|
Preferred Stock
|
Common Stock
|
|
|
|
|
|||||||||||||||||||||||||||||||||||||||||||
|
|
8.250% Series A
|
7.875% Series B
|
|
|
|
|
|
|
|
|||||||||||||||||||||||||||||||||||||||
|
|
Shares
|
Par Amount
|
Additional Paid-in Capital
|
Shares
|
Par Amount
|
Additional Paid-in Capital
|
Shares
|
Par Amount
|
Additional Paid-in Capital
|
Total
Additional Paid-in
Capital
|
Accumulated
Deficit
|
Accumulated
Other
Comprehensive Income (Loss)
|
Total
|
|||||||||||||||||||||||||||||||||||
|
Balance, January 1, 2017
|
|
|
$
|
|
|
$
|
|
|
|
|
$
|
|
|
$
|
|
|
|
|
$
|
|
|
$
|
|
|
$
|
|
|
$
|
(
|
)
|
$
|
(
|
)
|
$
|
|
|
||||||||||||
|
Series A Preferred dividends
|
—
|
|
—
|
|
—
|
|
—
|
|
—
|
|
—
|
|
—
|
|
—
|
|
—
|
|
—
|
|
(
|
)
|
—
|
|
(
|
)
|
||||||||||||||||||||||
|
Series B Preferred dividends
|
—
|
|
—
|
|
—
|
|
—
|
|
—
|
|
—
|
|
—
|
|
—
|
|
—
|
|
—
|
|
(
|
)
|
—
|
|
(
|
)
|
||||||||||||||||||||||
|
Common stock dividends
|
—
|
|
—
|
|
—
|
|
—
|
|
—
|
|
—
|
|
—
|
|
—
|
|
—
|
|
—
|
|
(
|
)
|
—
|
|
(
|
)
|
||||||||||||||||||||||
|
Issuance of Series B Preferred stock, net of expenses
|
—
|
|
—
|
|
—
|
|
|
|
—
|
|
|
|
—
|
|
—
|
|
—
|
|
|
|
—
|
|
—
|
|
|
|
||||||||||||||||||||||
|
Stock based compensation, net of withholding requirements
|
—
|
|
—
|
|
—
|
|
—
|
|
—
|
|
—
|
|
|
|
—
|
|
|
|
|
|
—
|
|
—
|
|
|
|
||||||||||||||||||||||
|
Net Income
|
—
|
|
—
|
|
—
|
|
—
|
|
—
|
|
—
|
|
—
|
|
—
|
|
—
|
|
—
|
|
|
|
—
|
|
|
|
||||||||||||||||||||||
|
Other comprehensive loss
|
—
|
|
—
|
|
—
|
|
—
|
|
—
|
|
—
|
|
—
|
|
—
|
|
—
|
|
—
|
|
—
|
|
(
|
)
|
(
|
)
|
||||||||||||||||||||||
|
Balance, June 30, 2018
|
|
|
$
|
|
|
$
|
|
|
|
|
$
|
|
|
$
|
|
|
|
|
$
|
|
|
$
|
|
|
$
|
|
|
$
|
(
|
)
|
$
|
(
|
)
|
$
|
|
|
||||||||||||
See financial statement notes (unaudited).
7
ARMOUR Residential REIT, Inc.
(in thousands)
|
|
For the Six Months Ended June 30,
|
|||||||
|
|
2018
|
2017
|
||||||
|
Cash Flows From Operating Activities:
|
|
|
||||||
|
Net Income
|
$
|
|
|
$
|
|
|
||
|
Adjustments to reconcile net income to net cash provided by operating activities:
|
||||||||
|
Net amortization of premium on Agency Securities
|
|
|
|
|
||||
|
Accretion of net discount on Credit Risk and Non-Agency Securities
|
(
|
)
|
(
|
)
|
||||
|
Net amortization of Interest-Only Securities
|
|
|
|
|
||||
|
Net amortization of U.S. Treasury Securities
|
(
|
)
|
|
|
||||
|
Realized loss on sale of Agency Securities
|
|
|
|
|
||||
|
Other than temporary impairment of Agency Securities
|
|
|
|
|
||||
|
(Gain) loss on Credit Risk and Non-Agency Securities
|
|
|
(
|
)
|
||||
|
Loss on Interest-Only Securities
|
|
|
|
|
||||
|
Loss on U.S. Treasury Securities
|
|
|
|
|
||||
|
Stock based compensation
|
|
|
|
|
||||
|
Changes in operating assets and liabilities:
|
||||||||
|
Decrease in accrued interest receivable
|
|
|
|
|
||||
|
Increase in prepaid and other assets
|
(
|
)
|
(
|
)
|
||||
|
Change in derivatives, at fair value
|
(
|
)
|
(
|
)
|
||||
|
Decrease in accrued interest payable- repurchase agreements
|
(
|
)
|
(
|
)
|
||||
|
Increase (decrease) in accounts payable and other accrued expenses
|
|
|
(
|
)
|
||||
|
Net cash provided by operating activities
|
$
|
|
|
$
|
|
|
||
|
Cash Flows From Investing Activities:
|
|
|
||||||
|
Purchases of Agency Securities
|
(
|
)
|
(
|
)
|
||||
|
Purchases of Credit Risk and Non-Agency Securities
|
|
|
(
|
)
|
||||
|
Purchases of U.S. Treasury Securities
|
(
|
)
|
|
|
||||
|
Principal repayments of Agency Securities
|
|
|
|
|
||||
|
Principal repayments of Credit Risk and Non-Agency Securities
|
|
|
|
|
||||
|
Proceeds from sales of Agency Securities
|
|
|
|
|
||||
|
Proceeds from sales of U.S. Treasury Securities
|
|
|
|
|
||||
|
Increase in cash collateral
|
|
|
|
|
||||
|
Subordinated loans due from BUCKLER
|
|
|
(
|
)
|
||||
|
Net cash provided by investing activities
|
$
|
|
|
$
|
|
|
||
|
Cash Flows From Financing Activities:
|
|
|
||||||
|
Issuance of Series B Preferred stock, net of expenses
|
|
|
|
|
||||
|
Issuance of common stock, net of expenses
|
|
|
|
|
||||
|
Proceeds from repurchase agreements
|
|
|
|
|
||||
|
Principal repayments on repurchase agreements
|
(
|
)
|
(
|
)
|
||||
|
Series A Preferred stock dividends paid
|
(
|
)
|
(
|
)
|
||||
|
Series B Preferred stock dividends paid
|
(
|
)
|
(
|
)
|
||||
|
Common stock dividends paid
|
(
|
)
|
(
|
)
|
||||
|
Net cash used in financing activities
|
$
|
(
|
)
|
$
|
(
|
)
|
||
|
Net increase in cash
|
|
|
|
|
||||
|
Cash - beginning of period
|
|
|
|
|
||||
|
Cash - end of period
|
$
|
|
|
$
|
|
|
||
|
Supplemental Disclosure:
|
|
|
||||||
|
Cash paid during the period for interest
|
$
|
|
|
$
|
|
|
||
|
Non-Cash Investing Activities:
|
|
|
||||||
|
Receivable for unsettled sales
|
$
|
|
|
$
|
|
|
||
|
Payable for unsettled purchases
|
$
|
|
|
$
|
|
|
||
|
Net unrealized gain (loss) on available for sale Agency Securities
|
$
|
(
|
)
|
$
|
|
|
||
See financial statement notes (unaudited).
8
ARMOUR Residential REIT, Inc.
FINANCIAL STATEMENT NOTES (UNAUDITED)
(in thousands, except per share)
References to “we,” “us,” “our,” or the “Company” are to ARMOUR Residential REIT, Inc. (“ARMOUR”) and its subsidiaries. References to “ACM” are to ARMOUR Capital Management LP, a Delaware limited partnership. Refer to the Glossary of Terms for definitions of capitalized terms and abbreviations used in this report.
ARMOUR is an externally managed Maryland corporation incorporated in 2008. The Company is managed by ACM, an investment advisor registered with the Securities and Exchange Commission (the “SEC”), (see
Note 10 -Commitments and Contingencies
and
Note 15 -Related Party Transactions
for additional discussion). We have elected to be taxed as a real estate investment trust (“REIT”) under the Internal Revenue Code of 1986, as amended (the "Code”). Our qualification as a REIT depends on our ability to meet, on a continuing basis, various complex requirements under the Code relating to, among other things, the sources of our gross income, the composition and values of our assets, our distribution levels and the concentration of ownership of our capital stock. We believe that we are organized in conformity with the requirements for qualification as a REIT under the Code and our manner of operations enables us to meet the requirements for taxation as a REIT for federal income tax purposes. As a REIT, we will generally not be subject to federal income tax on the REIT taxable income that we currently distribute to our stockholders. If we fail to qualify as a REIT in any taxable year and do not qualify for certain statutory relief provisions, we will be subject to federal income tax at regular corporate rates. Even if we qualify as a REIT for U.S. federal income tax purposes, we may still be subject to some federal, state and local taxes on our income.
We invest in residential mortgage backed securities issued or guaranteed by a United States (“U.S.”) Government-sponsored entity (“GSE”), such as the Federal National Mortgage Association (Fannie Mae), the Federal Home Loan Mortgage Corporation (Freddie Mac), or a government agency such as Government National Mortgage Administration (Ginnie Mae) (collectively, “Agency Securities”). We also invest in Interest-Only Securities, which are the interest portion of Agency Securities, that is separated and sold individually from the principal portion of the same payment. Other securities backed by residential mortgages in which we invest, for which the payment of principal and interest is not guaranteed by a GSE or government agency (collectively, “Credit Risk and Non-Agency Securities” and together with Agency Securities and Interest-Only Securities, “MBS”), may benefit from credit enhancement derived from structural elements such as subordination, over collateralization or insurance.
The unaudited consolidated financial statements include the accounts of ARMOUR Residential REIT, Inc. and its subsidiaries. All intercompany accounts and transactions have been eliminated. The preparation of the consolidated financial statements in conformity with GAAP requires management to make estimates and assumptions that affect the reported amounts of assets and liabilities and disclosure of contingent assets and liabilities at the date of the financial statements and the reported amounts of revenues and expenses during the reporting period. Actual results could differ from those estimates. Significant estimates affecting the accompanying condensed consolidated financial statements include the valuation of MBS
9
ARMOUR Residential REIT, Inc.
FINANCIAL STATEMENT NOTES (UNAUDITED)
(in thousands, except per share)
We generally intend to hold most of our securities for extended periods of time. We may, from time to time, sell any of our securities as part of the overall management of our securities portfolio. Management determines the appropriate classifications of the securities at the time they are acquired and evaluates the appropriateness of such classifications at each balance sheet date. Purchases and sales of our securities are recorded on the trade date.
Agency Securities
-
At
June 30, 2018
and
December 31, 2017
, all of our Agency Securities were classified as available for sale securities. Agency Securities classified as available for sale are reported at their estimated fair values with unrealized gains and losses excluded from earnings and reported as part of the consolidated statements of comprehensive income (loss).
Credit Risk and Non-Agency
Securities
-
At
June 30, 2018
and
December 31, 2017
, all of our Credit Risk and Non-Agency Securities were classified as trading securities. Credit Risk and Non-Agency Securities classified as trading are reported at their estimated fair values with unrealized gains and losses included in Other Income (Loss) as a component of the consolidated statements of operations.
Interest-Only Securities
- At
June 30, 2018
and
December 31, 2017
, all of our Interest-Only Securities were classified as trading securities. Interest-Only Securities represent the right to receive a specified proportion of the contractual interest flows of specific Agency MBS. Interest-Only Securities classified as trading are reported at their estimated fair values with unrealized gains and losses included in Other Income (Loss) as a component of the consolidated statements of operations.
10
ARMOUR Residential REIT, Inc.
FINANCIAL STATEMENT NOTES (UNAUDITED)
(in thousands, except per share)
We finance the acquisition of our MBS through the use of repurchase agreements. Our repurchase agreements are secured by our MBS and bear interest rates that have historically moved in close relationship to the Federal Funds Rate and the London Interbank Offered Rate (“LIBOR”). Under these repurchase agreements, we sell MBS to a lender and agree to repurchase the same MBS in the future for a price that is higher than the original sales price. The difference between the sales price that we receive and the repurchase price that we pay represents interest paid to the lender. A repurchase agreement operates as a financing arrangement under which we pledge our MBS as collateral to secure a loan which is equal in value to a specified percentage of the estimated fair value of the pledged collateral. We retain beneficial ownership of the pledged collateral. At the maturity of a repurchase agreement, we are required to repay the loan and concurrently receive back our pledged collateral from the lender or, with the consent of the lender, we may renew such agreement at the then prevailing interest rate. The repurchase agreements may require us to pledge additional assets to the lender in the event the estimated fair value of the existing pledged collateral declines.
We recognize all derivatives as either assets or liabilities at fair value on our consolidated balance sheets. All changes in the fair values of our derivatives are reflected in our consolidated statements of operations. We designate derivatives as hedges for tax purposes and any unrealized derivative gains or losses would not affect our distributable net taxable income. These transactions include interest rate swap contracts, interest rate swaptions and basis swap contracts. We also may utilize forward contracts for the purchase or sale of TBA Agency Securities. We account for TBA Agency Securities as derivative instruments if it is reasonably possible that we will not take or make physical delivery of the Agency Security upon settlement of the contract. We account for TBA dollar roll transactions as a series of derivative transactions.
11
ARMOUR Residential REIT, Inc.
FINANCIAL STATEMENT NOTES (UNAUDITED)
(in thousands, except per share)
•
Impairment of Assets: We evaluate Agency Securities for other than temporary impairment at least on a quarterly basis and more frequently when economic or market concerns warrant such evaluation. We consider an impairment to be other than temporary if we (1) have the intent to sell the Agency Securities, (2) believe it is more likely than not that we will be required to sell the securities before recovery (for example, because of liquidity requirements or contractual obligations) or (3) a credit loss exists. Impairment losses recognized establish a new cost basis for the related Agency Securities.
12
ARMOUR Residential REIT, Inc.
FINANCIAL STATEMENT NOTES (UNAUDITED)
(in thousands, except per share)
t on our consolidated financial statements when adopted, or did not have a significant impact on our consolidated financial statements upon adoption.
In June 2018, the Financial Accounting Standards Board issued ASU 2018–07,
Improvements to Nonemployee Share–Based Payment Accounting (Topic 718)
. The standard largely aligns the accounting for share–based payment awards issued to employees and nonemployees. Equity–classified share–based payment awards issued to nonemployees will be measured on the grant date, instead of being remeasured through the performance completion date (generally the vesting date), as required under the current guidance. The standard is to be applied on a modified retrospective basis through a cumulative–effect adjustment to retained earnings as of the beginning of the fiscal year when adopted. The standard is effective for fiscal years beginning after December 15, 2018 including interim periods within that fiscal year. The Company is currently assessing the impact of the standard on the consolidated financial statements.
In August 2017, the Financial Accounting Standards Board issued ASU 2017-12,
Derivatives and Hedging (Topic 815): Targeted Improvements to Accounting for Hedging Activities
. The standard amends the hedge accounting recognition and presentation requirements in ASC 815. The standard is effective for fiscal years beginning after December 15, 2018 and interim periods therein, however, early adoption is permitted. The Company is currently assessing the impact of the standard and whether it may apply hedge accounting in the future.
Our valuation techniques for financial instruments use observable and unobservable inputs. Observable inputs reflect readily obtainable data from third party sources, while unobservable inputs reflect management’s market assumptions. The Accounting Standards Codification Topic No. 820,
“Fair Value Measurement,”
classifies these inputs into the following hierarchy:
Level 1
Input
s - Quoted prices for identical instruments in active markets.
Level 2
Inputs
- Quoted prices for similar instruments in active markets; quoted prices for identical or similar instruments in markets that are not active; and model-derived valuations whose inputs are observable or whose significant value drivers are observable.
Level 3
Inputs
- Prices determined using significant unobservable inputs. Unobservable inputs may be used in situations where quoted prices or observable inputs are unavailable (for example, when there is little or no market activity for an investment at the end of the period). Unobservable inputs reflect management’s assumptions about the factors that market participants would use in pricing an asset or liability, and would be based on the best information available.
At the beginning of each quarter, we assess the assets and liabilities that are measured at fair value on a recurring basis to determine if any transfers between levels in the fair value hierarchy are needed.
The following describes the valuation methodologies used for our assets and liabilities measured at fair value, as well as the general classification of such instruments pursuant to the valuation hierarchy. Any transfers between levels are assumed to occur at the beginning of the reporting period.
13
ARMOUR Residential REIT, Inc.
FINANCIAL STATEMENT NOTES (UNAUDITED)
(in thousands, except per share)
Cash
- Cash includes cash on deposit with financial institutions. The carrying amount of cash is deemed to be its fair value and is classified as Level 1. Cash balances posted by us to counterparties or posted by counterparties to us as collateral are classified as Level 2 because they are integrally related to the Company's repurchase financing and interest rate swap agreements, which are classified as Level 2.
Agency Securities
- Fair value for the Agency Securities in our securities portfolio is based on obtaining a valuation for each Agency Security from third party pricing services and/or dealer quotes. The third party pricing services use common market pricing methods that may include pricing models that may incorporate such factors as coupons, prepayment speeds, spread to the Treasury curves and interest rate swap curves, duration, periodic and life caps and credit enhancement. If the fair value of an Agency Security is not available from the third party pricing services or such data appears unreliable, we obtain pricing indications from up to
three
dealers who make markets in similar Agency Securities. Management reviews pricing used to ensure that current market conditions are properly reflected. This review includes, but is not limited to, comparisons of similar market transactions or alternative third party pricing services, dealer pricing indications and comparisons to a third party pricing model. Fair values obtained from the third party pricing services for similar instruments are classified as Level 2 securities if the inputs to the pricing models used are consistent with the Level 2 definition. If quoted prices for a security are not reasonably available from the third party pricing service, but dealer pricing indications are, the security will be classified as a Level 2 security. If neither is available, management will determine the fair value based on characteristics of the security that we receive from the issuer and based on available market information and classify it as a Level 3 security. At
June 30, 2018
and
December 31, 2017
, all of our Agency Security fair values are classified as Level 2 based on the inputs used by our third party pricing services and dealer quotes.
Credit Risk and Non-Agency Securities -
The fair value for the Credit Risk and Non-Agency Securities in our securities portfolio is based on obtaining a valuation for each Credit Risk and Non-Agency Security from third party pricing services and/or dealer quotes. The third party pricing services incorporate such factors as collateral type, bond structure and priority of payments, coupons, prepayment speeds, defaults, delinquencies and severities. If the fair value of a Credit Risk and Non-Agency Security is not available from the third party pricing services or such data appears unreliable, we obtain pricing indications from up to
three
dealers who make markets in similar Credit Risk and Non-Agency Securities. Management reviews pricing used to ensure that current market conditions are properly reflected. This review includes, but is not limited to, comparisons of similar market transactions or alternative third party pricing services, dealer pricing indications and comparisons to fair value determined using a third party pricing model. Fair values obtained from the third party pricing services for similar instruments are classified as Level 2 securities if the inputs to the pricing models used are consistent with the Level 2 definition. If quoted prices for a security are not reasonably available from the third party pricing service, but dealer pricing indications are, the security will be classified as a Level 2 security. If neither is available, management will determine the fair value based on characteristics of the security that we receive from the issuer and based on available market information and classify it as a Level 3 security. At
June 30, 2018
and
December 31, 2017
, all of our Credit Risk and Non-Agency Securities are classified as Level 2 based on the inputs used by our third party pricing services and dealer quotes.
Interest-Only Securities
- The fair value for the Interest-Only Securities in our securities portfolio is based on obtaining a valuation for each Interest-Only Security from third party pricing services and/or dealer quotes. The third party pricing services use common market pricing methods that may include pricing models consistent with those models used to price Agency Securities underlying the Interest-Only Securities that may incorporate such factors as coupons, prepayment speeds, spread to the Treasury curves and interest rate swap curves, duration, periodic and life caps and credit enhancement. If the fair value of an Interest-Only Security is not available from the third party pricing services or such data appears unreliable, we obtain pricing indications from up to
three
dealers who make markets in similar Interest-Only Securities. Management reviews pricing used to ensure that current market conditions are properly reflected. This review includes, but is not limited to, comparisons of similar market transactions or alternative third party pricing services, dealer pricing indications and comparisons to a third party pricing model. Fair values obtained from the third party pricing services for similar instruments are classified as Level 2 securities if the inputs to the pricing models used are consistent with the Level 2 definition. If quoted prices for a security are not reasonably available from the third party pricing service, but dealer pricing indications are, the security will be classified as a Level 2 security. If neither is available, management will determine the fair value based on characteristics of the security that we receive from the issuer and based on available market information and classify it as a Level 3 security. At
June 30, 2018
and
December 31, 2017
, all of our Interest-Only Security fair values are classified as Level 2 based on the inputs used by our third party pricing services and dealer quotes.
14
ARMOUR Residential REIT, Inc.
FINANCIAL STATEMENT NOTES (UNAUDITED)
(in thousands, except per share)
U.S. Treasury Securities
- Fair value for the U.S. Treasury Securities in our securities portfolio is based on obtaining a valuation for each U.S. Treasury Securities from third party pricing services and/or dealer quotes. U.S. Treasury Securities fair values are classified as Level 1, as quoted unadjusted prices are available in active markets for identical assets. We did not have any U.S. Treasury Securities at
June 30, 2018
and
December 31, 2017
.
Receivables and Payables for Unsettled Sales and Purchases
- The carrying amount is generally deemed to be fair value because of the relatively short time to settlement. Such receivables and payables are classified as Level 2 because they are effectively secured by the related securities and could potentially be subject to counterparty credit considerations.
Repurchase Agreements -
The fair value of repurchase agreements reflects the present value of the contractual cash flows discounted at the estimated LIBOR based market interest rates at the valuation date for repurchase agreements with a term equivalent to the remaining term to interest rate repricing, which may be at maturity, of our repurchase agreements. The fair value of the repurchase agreements approximates their carrying amount due to the short-term nature of these financial instruments. Our repurchase agreements are classified as Level 2.
Derivative Transactions
-
The fair values of our interest rate swap contracts, interest rate swaptions and basis swaps are valued using information provided by third party pricing services that incorporate common market pricing methods that may include current interest rate curves, forward interest rate curves and market spreads to interest rate curves. We estimate the fair value of TBA Agency Securities based on similar methods used to value our Agency Securities. Management compares the pricing information received to dealer quotes to ensure that the current market conditions are properly reflected. The fair values of our interest rate swap contracts, interest rate swaptions, basis swap contracts and TBA Agency Securities are classified as Level 2.
|
Quoted Prices
in Active
Markets for
Identical Assets
(Level 1)
|
Significant
Observable
Inputs
(Level 2)
|
Significant
Unobservable
Inputs
(Level 3)
|
Balance at June 30, 2018
|
|||||||||||||
|
Assets at Fair Value:
|
|
|
|
|
||||||||||||
|
Agency Securities
|
$
|
|
|
$
|
|
|
$
|
|
|
$
|
|
|
||||
|
Credit Risk and Non-Agency Securities
|
$
|
|
|
$
|
|
|
$
|
|
|
$
|
|
|
||||
|
Interest-Only Securities
|
$
|
|
|
$
|
|
|
$
|
|
|
$
|
|
|
||||
|
Derivatives
|
$
|
|
|
$
|
|
|
$
|
|
|
$
|
|
|
||||
|
Liabilities at Fair Value:
|
|
|
|
|
|
|||||||||||
|
Derivatives
|
$
|
|
|
$
|
|
|
$
|
|
|
$
|
|
|
||||
There were no transfers of assets or liabilities between the levels of the fair value hierarchy during the
three and six months ended
ending
June 30, 2018
.
15
ARMOUR Residential REIT, Inc.
FINANCIAL STATEMENT NOTES (UNAUDITED)
(in thousands, except per share)
|
|
Quoted Prices
in Active
Markets for
Identical Assets
(Level 1)
|
Significant
Observable
Inputs
(Level 2)
|
Significant
Unobservable
Inputs
(Level 3)
|
Balance at December 31, 2017
|
||||||||||||
|
Assets at Fair Value:
|
|
|
|
|
||||||||||||
|
Agency Securities
|
$
|
|
|
$
|
|
|
$
|
|
|
$
|
|
|
||||
|
Credit Risk and Non-Agency Securities
|
$
|
|
|
$
|
|
|
$
|
|
|
$
|
|
|
||||
|
Interest-Only Securities
|
$
|
|
|
$
|
|
|
$
|
|
|
$
|
|
|
||||
|
Derivatives
|
$
|
|
|
$
|
|
|
$
|
|
|
$
|
|
|
||||
|
Liabilities at Fair Value:
|
|
|
|
|
||||||||||||
|
Derivatives
|
$
|
|
|
$
|
|
|
$
|
|
|
$
|
|
|
||||
|
June 30, 2018
|
Fair Value Measurements using:
|
|||||||||||||||||||
|
|
Carrying Value
|
Fair
Value
|
Quoted Prices
in Active
Markets for
Identical Assets
(Level 1)
|
Significant
Observable
Inputs
(Level 2)
|
Significant
Unobservable
Inputs
(Level 3)
|
|||||||||||||||
|
Financial Assets:
|
|
|
|
|
|
|||||||||||||||
|
Cash
|
$
|
|
|
$
|
|
|
$
|
|
|
$
|
|
|
$
|
|
|
|||||
|
Cash collateral posted to counterparties
|
$
|
|
|
$
|
|
|
$
|
|
|
$
|
|
|
$
|
|
|
|||||
|
Receivable for unsettled sales
|
$
|
|
|
$
|
|
|
$
|
|
|
$
|
|
|
$
|
|
|
|||||
|
Accrued interest receivable
|
$
|
|
|
$
|
|
|
$
|
|
|
$
|
|
|
$
|
|
|
|||||
|
Subordinated loans due from BUCKLER Securities LLC
|
$
|
|
|
$
|
|
|
$
|
|
|
$
|
|
|
$
|
|
|
|||||
|
Financial Liabilities:
|
|
|
|
|
|
|||||||||||||||
|
Repurchase agreements
|
$
|
|
|
$
|
|
|
$
|
|
|
$
|
|
|
$
|
|
|
|||||
|
Cash collateral posted by counterparties
|
$
|
|
|
$
|
|
|
$
|
|
|
$
|
|
|
$
|
|
|
|||||
|
Payable for unsettled purchases
|
$
|
|
|
$
|
|
|
$
|
|
|
$
|
|
|
$
|
|
|
|||||
|
Accrued interest payable- repurchase agreements
|
$
|
|
|
$
|
|
|
$
|
|
|
$
|
|
|
$
|
|
|
|||||
16
ARMOUR Residential REIT, Inc.
FINANCIAL STATEMENT NOTES (UNAUDITED)
(in thousands, except per share)
|
December 31, 2017
|
Fair Value Measurements using:
|
|||||||||||||||||||
|
|
Carrying Value
|
Fair
Value
|
Quoted Prices
in Active
Markets for
Identical Assets
(Level 1)
|
Significant
Observable
Inputs
(Level 2)
|
Significant
Unobservable
Inputs
(Level 3)
|
|||||||||||||||
|
Financial Assets:
|
|
|
|
|
|
|||||||||||||||
|
Cash
|
$
|
|
|
$
|
|
|
$
|
|
|
$
|
|
|
$
|
|
|
|||||
|
Cash collateral posted to counterparties
|
$
|
|
|
$
|
|
|
$
|
|
|
$
|
|
|
$
|
|
|
|||||
|
Accrued interest receivable
|
$
|
|
|
$
|
|
|
$
|
|
|
$
|
|
|
$
|
|
|
|||||
|
Subordinated loans due from BUCKLER Securities LLC
|
$
|
|
|
|
|
$
|
|
|
$
|
|
|
$
|
|
|
||||||
|
Financial Liabilities:
|
|
|
|
|
|
|
||||||||||||||
|
Repurchase agreements
|
$
|
|
|
$
|
|
|
$
|
|
|
$
|
|
|
$
|
|
|
|||||
|
Cash collateral posted by counterparties
|
$
|
|
|
$
|
|
|
$
|
|
|
$
|
|
|
$
|
|
|
|||||
|
Accrued interest payable- repurchase agreements
|
$
|
|
|
$
|
|
|
$
|
|
|
$
|
|
|
$
|
|
|
|||||
|
For the Three Months Ended June 30,
|
For the Six Months Ended June 30,
|
|||||||
|
Credit Risk and Non-Agency Securities
|
2017
|
2017
|
||||||
|
Balance, beginning of period
|
$
|
|
|
$
|
|
|
||
|
Purchases of Credit Risk and Non-Agency Securities, at cost
|
|
|
|
|
||||
|
Principal repayments of Credit Risk and Non-Agency Securities
|
(
|
)
|
(
|
)
|
||||
|
Gain on Credit Risk and Non-Agency Securities
|
|
|
|
|
||||
|
Accretion of net discount on Credit Risk and Non-Agency Securities
|
|
|
|
|
||||
|
Balance, end of period
|
$
|
|
|
$
|
|
|
||
|
Gain on Credit Risk and Non-Agency Securities
|
$
|
|
|
$
|
|
|
||
17
ARMOUR Residential REIT, Inc.
FINANCIAL STATEMENT NOTES (UNAUDITED)
(in thousands, except per share)
At
June 30, 2018
and
December 31, 2017
, investments in Agency Securities accounted for
86.5
%
and
88.2
%
of our securities portfolio.
We evaluated our Agency Securities with unrealized losses at
June 30, 2018
,
June 30, 2017
and
December 31, 2017
, to determine whether there was an other than temporary impairment. All of our Agency Securities are issued and guaranteed by GSEs or Ginnie Mae. The GSEs have a long term credit rating of AA+. At those dates, we also considered whether we intended to sell Agency Securities and whether it was more likely than not that we could meet our liquidity requirements and contractual obligations without selling Agency Securities.
Results of this evaluation for the
three and six months ended
June 30, 2018
-
No
other than temporary impairment was recognized for the three months ended
June 30, 2018
. During the first quarter of 2018, we recognized additional losses on Agency Securities, previously identified during 2017, totaling
$
12,090
, in our consolidated financial statements of operations.
Results of this evaluation for the
three and six months ended
June 30, 2017
-
At June 30, 2017, unrealized losses on certain of our low yielding Agency Securities were determined to represent an other than temporary impairment because we planned to replace these low yielding securities with securities that had more attractive returns, as market conditions permitted. Accordingly, we recognized losses totaling
$
10,338
in our consolidated financial statements of operations, thereby establishing a new cost basis for those Agency Securities with an aggregate fair value of
$
1,113,815
as of June 30, 2017. We determined that there was no other than temporary impairment of our remaining Agency Securities as of June 30, 2017.
Results of this evaluation for the year ended
December 31, 2017
- During the second quarter of 2017, we identified certain low yielding Agency Securities that we replaced with securities having more attractive returns as market conditions permit. Accordingly, we recognized losses totaling
$
13,707
in our consolidated statements of operations for the year ended
December 31, 2017
, thereby establishing a new cost basis for those Agency Securities with an aggregate fair value of
$
795,724
as of
December 31, 2017
. We determined that there was no other than temporary impairment of our remaining Agency Securities as of
December 31, 2017
.
18
ARMOUR Residential REIT, Inc.
FINANCIAL STATEMENT NOTES (UNAUDITED)
(in thousands, except per share)
|
June 30, 2018
|
Amortized Cost
|
Gross Unrealized Loss
|
Gross Unrealized Gain
|
Fair Value
|
Percent of Total
|
||||||||||||||
|
Fannie Mae
|
|||||||||||||||||||
|
ARMs & Hybrids
|
$
|
|
|
$
|
(
|
)
|
$
|
|
|
$
|
|
|
|
%
|
|||||
|
Multi-Family MBS
|
|
|
(
|
)
|
|
|
|
|
|
|
|||||||||
|
10 Year Fixed
|
|
|
(
|
)
|
|
|
|
|
|
|
|||||||||
|
15 Year Fixed
|
|
|
(
|
)
|
|
|
|
|
|
|
|||||||||
|
20 Year Fixed
|
|
|
(
|
)
|
|
|
|
|
|
|
|||||||||
|
25 Year Fixed
|
|
|
(
|
)
|
|
|
|
|
|
|
|||||||||
|
30 Year Fixed
|
|
|
(
|
)
|
|
|
|
|
|
|
|||||||||
|
Total Fannie Mae
|
$
|
|
|
$
|
(
|
)
|
$
|
|
|
$
|
|
|
|
%
|
|||||
|
Freddie Mac
|
|||||||||||||||||||
|
10 Year Fixed
|
|
|
(
|
)
|
|
|
|
|
|
|
|||||||||
|
15 Year Fixed
|
|
|
(
|
)
|
|
|
|
|
|
|
|||||||||
|
25 Year Fixed
|
|
|
(
|
)
|
|
|
|
|
|
|
|||||||||
|
30 Year Fixed
|
|
|
(
|
)
|
|
|
|
|
|
|
|||||||||
|
Total Freddie Mac
|
$
|
|
|
$
|
(
|
)
|
$
|
|
|
$
|
|
|
|
%
|
|||||
|
Ginnie Mae
|
|||||||||||||||||||
|
ARMs & Hybrids
|
|
|
(
|
)
|
|
|
|
|
|
|
|||||||||
|
10 Year Fixed
|
|
|
|
|
|
|
|
|
|
|
|||||||||
|
Total Ginnie Mae
|
$
|
|
|
$
|
(
|
)
|
$
|
|
|
$
|
|
|
|
%
|
|||||
|
Total Agency Securities
|
$
|
|
|
$
|
(
|
)
|
$
|
|
|
$
|
|
|
|
%
|
|||||
19
ARMOUR Residential REIT, Inc.
FINANCIAL STATEMENT NOTES (UNAUDITED)
(in thousands, except per share)
At
December 31, 2017
, we had the following securities in an unrealized gain or loss position as presented below. The components of the carrying value of our Agency Securities at
December 31, 2017
are also presented below. Our Agency Securities had a weighted average coupon of
3.68
%
at
December 31, 2017
.
|
December 31, 2017
|
Amortized Cost
|
Gross Unrealized Loss
|
Gross Unrealized Gain
|
Fair Value
|
Percent of Total
|
||||||||||||||
|
Fannie Mae
|
|||||||||||||||||||
|
ARMs & Hybrids
|
$
|
|
|
$
|
(
|
)
|
$
|
|
|
$
|
|
|
|
%
|
|||||
|
Multi-Family MBS
|
|
|
(
|
)
|
|
|
|
|
|
|
|||||||||
|
10 Year Fixed
|
|
|
(
|
)
|
|
|
|
|
|
|
|||||||||
|
15 Year Fixed
|
|
|
(
|
)
|
|
|
|
|
|
|
|||||||||
|
20 Year Fixed
|
|
|
(
|
)
|
|
|
|
|
|
|
|||||||||
|
25 Year Fixed
|
|
|
(
|
)
|
|
|
|
|
|
|
|||||||||
|
30 Year Fixed
|
|
|
(
|
)
|
|
|
|
|
|
|
|||||||||
|
Total Fannie Mae
|
$
|
|
|
$
|
(
|
)
|
$
|
|
|
$
|
|
|
|
%
|
|||||
|
Freddie Mac
|
|||||||||||||||||||
|
10 Year Fixed
|
|
|
(
|
)
|
|
|
|
|
|
|
|||||||||
|
15 Year Fixed
|
|
|
(
|
)
|
|
|
|
|
|
|
|||||||||
|
25 Year Fixed
|
|
|
(
|
)
|
|
|
|
|
|
|
|||||||||
|
30 Year Fixed
|
|
|
(
|
)
|
|
|
|
|
|
|
|||||||||
|
Total Freddie Mac
|
$
|
|
|
$
|
(
|
)
|
$
|
|
|
$
|
|
|
|
%
|
|||||
|
|
|
|
|
|
|||||||||||||||
|
Ginnie Mae
|
|
|
|
|
|
||||||||||||||
|
ARMs & Hybrids
|
|
|
(
|
)
|
|
|
|
|
|
|
|||||||||
|
10 Year Fixed
|
|
|
|
|
|
|
|
|
|
|
|||||||||
|
Total Ginnie Mae
|
$
|
|
|
$
|
(
|
)
|
$
|
|
|
$
|
|
|
|
%
|
|||||
|
Total Agency Securities
|
$
|
|
|
$
|
(
|
)
|
$
|
|
|
$
|
|
|
|
%
|
|||||
Recognition of interest income commences on the settlement date of the purchase transaction and continues through the settlement date of the sale transaction. At
June 30, 2018
, we had investment related receivables of
$
216,292
with respect to unsettled sales and investment related payables of
$
462,325
with respect to unsettled purchases. At
December 31, 2017
we did not have any investment related receivables or payables with respect to unsettled sales and purchases of our Agency Securities.
Actual maturities of Agency Securities are generally shorter than stated contractual maturities because actual maturities of Agency Securities are affected by the contractual lives of the underlying mortgages, periodic payments of principal and prepayments of principal.
20
ARMOUR Residential REIT, Inc.
FINANCIAL STATEMENT NOTES (UNAUDITED)
(in thousands, except per share)
|
|
June 30, 2018
|
December 31, 2017
|
||||||||||||||
|
Weighted Average Life of all Agency Securities
|
Fair Value
|
Amortized
Cost
|
Fair Value
|
Amortized
Cost
|
||||||||||||
|
Less than one year
|
$
|
|
|
$
|
|
|
$
|
|
|
$
|
|
|
||||
|
Greater than or equal to one year and less than three years
|
|
|
|
|
|
|
|
|
||||||||
|
Greater than or equal to three years and less than five years
|
|
|
|
|
|
|
|
|
||||||||
|
Greater than or equal to five years
|
|
|
|
|
|
|
|
|
||||||||
|
Total Agency Securities
|
$
|
|
|
$
|
|
|
$
|
|
|
$
|
|
|
||||
We use a third party model to calculate the weighted average lives of our Agency Securities. Weighted average life is calculated based on expectations for estimated prepayments for the underlying mortgage loans of our Agency Securities. These estimated prepayments are based on assumptions such as interest rates, current and future home prices, housing policy and borrower incentives. The weighted average lives of our Agency Securities at
June 30, 2018
and
December 31, 2017
in the table above are based upon market factors, assumptions, models and estimates from the third party model and also incorporate management’s judgment and experience. The actual weighted average lives of our Agency Securities could be longer or shorter than estimated.
|
|
Unrealized Loss Position For:
|
|||||||||||||||||||||||
|
|
Less than 12 Months
|
12 Months or More
|
Total
|
|||||||||||||||||||||
|
Fair Value
|
Unrealized
Losses
|
Fair Value
|
Unrealized
Losses
|
Fair Value
|
Unrealized
Losses
|
|||||||||||||||||||
|
June 30, 2018
|
$
|
|
|
$
|
(
|
)
|
$
|
|
|
$
|
(
|
)
|
$
|
|
|
$
|
(
|
)
|
||||||
|
December 31, 2017
|
$
|
|
|
$
|
(
|
)
|
$
|
|
|
$
|
(
|
)
|
$
|
|
|
$
|
(
|
)
|
||||||
At
June 30, 2018
and
December 31, 2017
, investments in Credit Risk and Non-Agency Securities accounted for
13.2
%
and
11.5
%
of our securities portfolio.
21
ARMOUR Residential REIT, Inc.
FINANCIAL STATEMENT NOTES (UNAUDITED)
(in thousands, except per share)
|
|
Credit Risk and Non-Agency Securities
|
|||||||||||||
|
June 30, 2018
|
Fair Value
|
Amortized
Cost
|
Principal
Amount
|
Weighted
Average
Coupon
|
||||||||||
|
Credit Risk Transfer
|
$
|
|
|
$
|
|
|
$
|
|
|
|
||||
|
Legacy Prime Fixed
|
|
|
|
|
|
|
|
|||||||
|
Legacy ALT-A Fixed
|
|
|
|
|
|
|
|
|||||||
|
Legacy Prime Hybrid
|
|
|
|
|
|
|
|
|||||||
|
Legacy ALT-A Hybrid
|
|
|
|
|
|
|
|
|||||||
|
New Issue Prime Fixed
|
|
|
|
|
|
|
|
|||||||
|
Total Credit Risk and Non-Agency Securities
|
$
|
|
|
$
|
|
|
$
|
|
|
|
||||
The components of the carrying value of our Credit Risk and Non-Agency Securities at
December 31, 2017
are presented in the table below.
|
|
Credit Risk and Non-Agency Securities
|
|||||||||||||
|
December 31, 2017
|
Fair Value
|
Amortized
Cost
|
Principal
Amount
|
Weighted
Average
Coupon
|
||||||||||
|
Credit Risk Transfer
|
$
|
|
|
$
|
|
|
$
|
|
|
|
||||
|
Legacy Prime Fixed
|
|
|
|
|
|
|
|
|||||||
|
Legacy ALT-A Fixed
|
|
|
|
|
|
|
|
|||||||
|
Legacy Prime Hybrid
|
|
|
|
|
|
|
|
|||||||
|
Legacy ALT-A Hybrid
|
|
|
|
|
|
|
|
|||||||
|
New Issue Prime Fixed
|
|
|
|
|
|
|
|
|||||||
|
Total Credit Risk and Non-Agency Securities
|
$
|
|
|
$
|
|
|
$
|
|
|
|
||||
Our Credit Risk Transfer securities are collaterized by residential mortgage loans meeting agency criteria. However, our securities principal and interest are not guaranteed by the agencies. Credit Risk Transfer securities include tranches issued since 2014. Our Legacy and New Issue Prime Fixed securities are collaterized by residential mortgage loans not guaranteed by any agency. Legacy Prime Fixed, Legacy Alt-A Fixed securities include tranches issued between 2005-2007. New Issue Prime Fixed securities include tranches issued in 2013.
|
|
June 30, 2018
|
December 31, 2017
|
||||||||||||||
|
Weighted Average Life of all Credit Risk and Non-Agency Securities
|
Fair Value
|
Amortized Cost
|
Fair Value
|
Amortized Cost
|
||||||||||||
|
Less than one year
|
$
|
|
|
$
|
|
|
$
|
|
|
$
|
|
|
||||
|
Greater than or equal to one year and less than three years
|
|
|
|
|
|
|
|
|
||||||||
|
Greater than or equal to three years and less than five years
|
|
|
|
|
|
|
|
|
||||||||
|
Greater than or equal to five years
|
|
|
|
|
|
|
|
|
||||||||
|
Total Credit Risk and Non-Agency Securities
|
$
|
|
|
$
|
|
|
$
|
|
|
$
|
|
|
||||
22
ARMOUR Residential REIT, Inc.
FINANCIAL STATEMENT NOTES (UNAUDITED)
(in thousands, except per share)
At
June 30, 2018
, we had MRAs with
47
counterparties and outstanding borrowings with
26
of those counterparties. At
December 31, 2017
, we had MRAs with
46
counterparties and outstanding borrowings with
32
of those counterparties.
|
June 30, 2018
|
Repurchase Agreements
|
Weighted Average Contractual Rate
|
Weighted Average Maturity in days
|
Haircut for Repurchase Agreements
(1)
|
||||||||
|
Agency Securities
|
$
|
|
|
|
%
|
|
|
%
|
||||
|
Credit Risk and Non-Agency Securities
|
|
|
|
%
|
|
|
%
|
|||||
|
Total or Weighted Average
|
$
|
|
|
|
%
|
|
|
%
|
||||
(1) The Haircut represents the weighted average margin requirement, or the percentage amount by which the collateral value must exceed the loan amount.
|
December 31, 2017
|
Repurchase Agreements
|
Weighted Average Contractual Rate
|
Weighted Average Maturity in days
|
Haircut for Repurchase Agreements
(1)
|
||||||||
|
Agency Securities
|
$
|
|
|
|
%
|
|
|
%
|
||||
|
Credit Risk and Non-Agency Securities
|
|
|
|
%
|
|
|
%
|
|||||
|
Total or Weighted Average
|
$
|
|
|
|
%
|
|
|
%
|
||||
(1) The Haircut represents the weighted average margin requirement, or the percentage amount by which the collateral value must exceed the loan amount.
Our repurchase agreements require that we maintain adequate pledged collateral. A decline in the value of the MBS pledged as collateral for borrowings under repurchase agreements could result in the counterparties demanding additional collateral pledges or liquidation of some of the existing collateral to reduce borrowing levels. We manage this risk by maintaining an adequate balance of available cash and unpledged securities. An event of default or termination event under the standard MRA would give our counterparty the option to terminate all repurchase transactions existing with us and require any amount due to be payable immediately. In addition, certain of our MRAs contain a restriction that prohibits our leverage from exceeding
twelve
times our stockholders’ equity as well as termination events in the case of significant reductions in equity capital. We also may receive cash or securities as collateral from our derivative counterparties which we may use as additional collateral for repurchase agreements. Certain interest rate swap contracts provide for cross collateralization and cross default with repurchase agreements and other contracts with the same counterparty.
23
ARMOUR Residential REIT, Inc.
FINANCIAL STATEMENT NOTES (UNAUDITED)
(in thousands, except per share)
The following table summarizes the maturity or repricing and the weighted average contractual rates of our repurchase agreements to finance our MBS at
June 30, 2018
and
December 31, 2017
.
|
June 30, 2018
|
December 31, 2017
|
|||||||||||||
|
Maturing or Repricing
|
Repurchase Agreements
|
Weighted Average Contractual Rate
|
Repurchase Agreements
|
Weighted Average Contractual Rate
|
||||||||||
|
Within 30 days
|
$
|
|
|
|
%
|
$
|
|
|
|
%
|
||||
|
31 days to 60 days
|
|
|
|
%
|
|
|
|
%
|
||||||
|
61 days to 90 days
|
|
|
|
%
|
|
|
|
%
|
||||||
|
Greater than 90 days
|
|
|
|
%
|
|
|
|
%
|
||||||
|
Total or Weighted Average
|
$
|
|
|
|
%
|
$
|
|
|
|
%
|
||||
At
June 30, 2018
and
December 31, 2017
, BUCKLER Securities LLC, (See
Note 15 -Related Party Transactions
) accounted for
49.0
%
and
38.4
%
of our aggregate borrowings and had an amount at risk of
10.6
%
and
9.0
%
, respectively, of our total stockholders' equity with a weighted average maturity of
25
days and
70
days, respectively, on repurchase agreements.
We enter into derivative transactions to manage our interest rate risk exposure. These transactions may include entering into interest rate swap contracts, swaptions and basis swaps. These transactions are designed to lock in funding costs for repurchase agreements associated with our assets in such a way to help assure the realization of net interest margins. Such transactions are based on assumptions about prepayments which, if not realized, will cause transaction results to differ from expectations. Basis swap contracts allow us to exchange one floating interest rate basis for another, for example, 3 month LIBOR and Fed Funds Rates, thereby allowing us to diversify our floating rate basis exposures. We also utilize forward contracts for the purchase or sale of TBA Agency Securities.
We have agreements with our derivative counterparties that provide for the posting of collateral based on the fair values of our interest rate swap contracts, swaptions, basis swap contracts and TBA Agency Securities. Through this margin process, either we or our swap counterparty may be required to pledge cash or Agency Securities as collateral. Collateral requirements vary by counterparty and change over time based on the fair value, notional amount and remaining term of the contracts. Certain interest rate swap contracts provide for cross collateralization and cross default with repurchase agreements and other contracts with the same counterparty.
Interest rate swaptions generally provide us the option to enter into an interest rate swap agreement at a certain point of time in the future with a predetermined notional amount, stated term and stated rate of interest in the fixed leg and interest rate index on the floating leg.
TBA Agency Securities are forward contracts for the purchase (“long position”) or sale (“short position”) of Agency Securities at a predetermined price, face amount, issuer, coupon and stated maturity on an agreed-upon future date. The specific Agency Securities delivered into the contract upon the settlement date, published each month by the Securities Industry and Financial Markets Association, are not known at the time of the transaction. We may enter into TBA Agency Securities as a means of hedging against short-term changes in interest rates. We may also enter into TBA Agency Securities as a means of acquiring or disposing of Agency Securities and we may from time to time utilize TBA dollar roll transactions to finance Agency Security purchases. We estimate the fair value of TBA Agency Securities based on similar methods used to value our Agency Securities.
24
ARMOUR Residential REIT, Inc.
FINANCIAL STATEMENT NOTES (UNAUDITED)
(in thousands, except per share)
June 30, 2018
|
Derivative Type
|
Remaining / Underlying Term
|
Weighted Average Remaining Swap/Option Term (Months)
|
Weighted Average Rate
|
Notional Amount
(3)
|
Asset Fair Value
(1)
|
Liability Fair Value
(1)
|
|||||||||||||
|
Interest rate swap contracts
|
13-24 Months
|
|
|
%
|
|
|
|
|
|
|
|||||||||
|
Interest rate swap contracts
|
25-36 Months
|
|
|
%
|
|
|
|
|
|
|
|||||||||
|
Interest rate swap contracts
|
49-60 Months
|
|
|
%
|
|
|
|
|
|
|
|||||||||
|
Interest rate swap contracts
|
61-72 Months
|
|
|
%
|
|
|
|
|
|
|
|||||||||
|
Interest rate swap contracts
|
73-84 Months
|
|
|
%
|
|
|
|
|
|
|
|||||||||
|
Interest rate swap contracts
|
85-96 Months
|
|
|
%
|
|
|
|
|
|
|
|||||||||
|
Interest rate swap contracts
|
97-108 Months
|
|
|
%
|
|
|
|
|
|
|
|||||||||
|
Interest rate swap contracts
|
109-120 Months
|
|
|
%
|
|
|
|
|
|
|
|||||||||
|
TBA Agency Securities
(2)
|
n/a
|
n/a
|
n/a
|
|
|
|
|
(
|
)
|
||||||||||
|
Total or Weighted Average
|
$
|
|
|
|
$
|
|
|
|
$
|
(
|
)
|
||||||||
|
(1)
|
See
Note 5
,
“
Fair Value of Financial Instruments
”
for additional discussion.
|
|
(2)
|
Implied cost basis of
$
|
|
(3)
|
Includes
$
|
December 31, 2017
|
Derivative Type
|
Remaining / Underlying Term
|
Weighted Average Remaining Swap / Option Term (Months)
|
Weighted Average Rate
|
Notional Amount
|
Asset Fair Value
(1)
|
Liability Fair Value
(1)
|
|||||||||||||
|
Interest rate swap contracts
|
0-12 Months
|
|
|
%
|
$
|
|
|
$
|
|
|
$
|
|
|
||||||
|
Interest rate swap contracts
|
13-24 Months
|
|
|
%
|
|
|
|
|
|
|
|||||||||
|
Interest rate swap contracts
|
25-36 Months
|
|
|
%
|
|
|
|
|
|
|
|||||||||
|
Interest rate swap contracts
|
61-72 Months
|
|
|
%
|
|
|
|
|
(
|
)
|
|||||||||
|
Interest rate swap contracts
|
73-84 Months
|
|
|
%
|
|
|
|
|
(
|
)
|
|||||||||
|
Interest rate swap contracts
|
97-108 Months
|
|
|
%
|
|
|
|
|
(
|
)
|
|||||||||
|
Interest rate swap contracts
|
109-120 Months
|
|
|
%
|
|
|
|
|
(
|
)
|
|||||||||
|
TBA Agency Securities
(2)
|
0-60 Months
|
n/a
|
n/a
|
|
|
|
|
(
|
)
|
||||||||||
|
Total or Weighted Average
|
$
|
|
|
$
|
|
|
$
|
(
|
)
|
||||||||||
|
(1)
|
See
Note 5
,
“
Fair Value of Financial Instruments
”
for additional discussion.
|
(2) Implied cost basis of
$
1,674,438
and implied market value of
$
1,673,113
.
25
ARMOUR Residential REIT, Inc.
FINANCIAL STATEMENT NOTES (UNAUDITED)
(in thousands, except per share)
We have netting arrangements in place with all derivative counterparties pursuant to standard documentation developed by the International Swap and Derivatives Association. We are also required to post or hold cash collateral based upon the net underlying market value of our open positions with the counterparty.
|
June 30, 2018
|
|
Gross Amounts Not Offset in the consolidated Balance Sheet
|
|
|||||||||||||
|
Assets
|
Gross and Net Amounts of Assets Presented in the consolidated Balance Sheet
|
Financial
Instruments
|
Cash Collateral
|
Net Amount
|
||||||||||||
|
Interest rate swap contracts
|
$
|
|
|
$
|
|
|
$
|
(
|
)
|
$
|
|
|
||||
|
TBA Agency Securities
|
|
|
(
|
)
|
(
|
)
|
|
|
||||||||
|
Totals
|
$
|
|
|
$
|
(
|
)
|
$
|
(
|
)
|
$
|
|
|
||||
|
June 30, 2018
|
|
Gross Amounts Not Offset in the consolidated Balance Sheet
|
|
|||||||||||||
|
Liabilities
|
Gross and Net Amounts of Liabilities Presented in the consolidated Balance Sheet
|
Financial
Instruments
|
Cash Collateral
|
Net Amount
|
||||||||||||
|
Interest rate swap contracts
|
$
|
|
|
$
|
|
|
$
|
|
|
$
|
|
|
||||
|
Agency Securities TBA
|
(
|
)
|
|
|
|
|
|
|
||||||||
|
Totals
|
$
|
(
|
)
|
$
|
|
|
$
|
|
|
$
|
|
|
||||
26
ARMOUR Residential REIT, Inc.
FINANCIAL STATEMENT NOTES (UNAUDITED)
(in thousands, except per share)
|
December 31, 2017
|
|
Gross Amounts Not Offset in the consolidated Balance Sheet
|
|
|||||||||||||
|
Assets
|
Gross and Net Amounts of Assets Presented in the consolidated
Balance Sheet
|
Financial
Instruments
|
Cash Collateral
|
Net Amount
|
||||||||||||
|
Interest rate swap contracts
|
$
|
|
|
$
|
(
|
)
|
$
|
(
|
)
|
$
|
|
|
||||
|
Agency Securities TBA
|
|
|
(
|
)
|
|
|
|
|
||||||||
|
Totals
|
$
|
|
|
$
|
(
|
)
|
$
|
(
|
)
|
$
|
|
|
||||
|
December 31, 2017
|
|
Gross Amounts Not Offset in the consolidated Balance Sheet
|
|
|||||||||||||
|
Liabilities
|
Gross and Net Amounts of Liabilities Presented in the consolidated Balance Sheet
|
Financial
Instruments
|
Cash Collateral
|
Net Amount
|
||||||||||||
|
Interest rate swap contracts
|
$
|
(
|
)
|
$
|
|
|
$
|
|
|
$
|
|
|
||||
|
Agency Securities TBA
|
(
|
)
|
|
|
|
|
|
|
||||||||
|
Totals
|
$
|
(
|
)
|
$
|
|
|
$
|
|
|
$
|
|
|
||||
27
ARMOUR Residential REIT, Inc.
FINANCIAL STATEMENT NOTES (UNAUDITED)
(in thousands, except per share)
|
|
|
Income (Loss) Recognized
|
||||||||||||||||
|
|
|
For the Three Months Ended June 30,
|
For the Six Months Ended June 30,
|
|||||||||||||||
|
Derivatives
|
Location on consolidated statements of operations
|
2018
|
2017
|
2018
|
2017
|
|||||||||||||
|
Interest rate swap contracts:
|
|
|
|
|
||||||||||||||
|
Realized gain
|
Realized gain (loss) on derivatives
|
$
|
|
|
$
|
|
|
$
|
|
|
$
|
|
|
|||||
|
Interest income
|
Realized gain (loss) on derivatives
|
|
|
|
|
|
|
|
|
|||||||||
|
Interest expense
|
Realized gain (loss) on derivatives
|
(
|
)
|
(
|
)
|
(
|
)
|
(
|
)
|
|||||||||
|
Changes in fair value
|
Unrealized gain (loss) on derivatives
|
|
|
(
|
)
|
|
|
(
|
)
|
|||||||||
|
|
|
$
|
|
|
|
$
|
(
|
)
|
|
$
|
|
|
|
$
|
(
|
)
|
||
|
TBA Agency Securities:
|
||||||||||||||||||
|
Realized loss
|
Realized gain (loss) on derivatives
|
(
|
)
|
|
|
(
|
)
|
|
|
|||||||||
|
Changes in fair value
|
Unrealized gain (loss) on derivatives
|
(
|
)
|
(
|
)
|
|
|
(
|
)
|
|||||||||
|
$
|
(
|
)
|
|
$
|
|
|
|
$
|
(
|
)
|
|
$
|
|
|
||||
|
Totals
|
$
|
|
|
|
$
|
(
|
)
|
|
$
|
|
|
|
$
|
(
|
)
|
|||
Management Agreements with ACM
The Company is managed by ACM, pursuant to management agreements with ARMOUR and JAVELIN (see also
Note 15
, “
Related Party Transactions
”).
The management agreements entitle ACM to receive management fees payable monthly in arrears. Currently, the monthly ARMOUR management fee is 1/12th of the sum of (a)
1.5
%
of gross equity raised up to
$1.0 billion
plus (b)
0.75
%
of gross equity raised in excess of
$1.0 billion
. The cost of repurchased stock and any dividend representing a return of capital for tax purposes will reduce the amount of gross equity raised used to calculate the monthly management fee. At
June 30, 2018
, the effective ARMOUR management fee was
1.04
%
based on gross equity raised of
$
2,620,693
. At
June 30, 2017
, the effective ARMOUR management fee was
1.04
%
based on gross equity raised of
$
2,586,188
. The ACM monthly management fees are not calculated based on the performance of our assets. Accordingly, the payment of our monthly management fees may not decline in the event of a decline in our earnings and may cause us to incur losses. We are also responsible for any costs and expenses that ACM incurred solely on behalf of ARMOUR or JAVELIN other than the various overhead expenses specified in the terms of the management agreements. ACM is further entitled to receive termination fees from ARMOUR and JAVELIN under certain circumstances.
Indemnifications and Litigation
We enter into certain contracts that contain a variety of indemnifications, principally with ACM and underwriters, against third party claims for errors and omissions in connection with their services to us. We have not incurred any costs to defend lawsuits or settle claims related to these indemnification agreements. As a result, the estimated fair value of these agreements, as well as the maximum amount attributable to past events, is not material. Accordingly, we have no liabilities recorded for these agreements at
June 30, 2018
and
December 31, 2017
.
28
ARMOUR Residential REIT, Inc.
FINANCIAL STATEMENT NOTES (UNAUDITED)
(in thousands, except per share)
name ARMOUR, the previous members of JAVELIN’s board of directors prior to the Merger (of which
eight
are current members of ARMOUR’s board of directors) (the “Individual Defendants”) and JMI Acquisition Corporation (“Acquisition”
)
as defendants. Certain cases also name ACM and JAVELIN as additional defendants. The lawsuits were brought by purported holders of JAVELIN’s common stock, both individually and on behalf of a putative class of JAVELIN’s stockholders, alleging that the Individual Defendants breached their fiduciary duties owed to the plaintiffs and the putative class of JAVELIN stockholders, including claims that the Individual Defendants failed to properly value JAVELIN; failed to take steps to maximize the value of JAVELIN to its stockholders; ignored or failed to protect against conflicts of interest; failed to disclose material information about the Transactions; took steps to avoid competitive bidding and to give ARMOUR an unfair advantage by failing to adequately solicit other potential acquirors or alternative transactions; and erected unreasonable barriers to other third-party bidders. The suits also allege that ARMOUR, JAVELIN, ACM and Acquisition aided and abetted the alleged breaches of fiduciary duties by the Individual Defendants. The lawsuits seek equitable relief, including, among other relief, to enjoin consummation of the Transactions, or rescind or unwind the Transactions if already consummated, and award costs and disbursements, including reasonable attorneys’ fees and expenses. The sole Florida lawsuit was never served on the defendants, and that case was voluntarily dismissed and closed on January 20, 2017
.
On April 25, 2016, the Maryland court issued an order consolidating the
eight
Maryland cases into
one
action, captioned In re JAVELIN Mortgage Investment Corp. Shareholder Litigation (Case No. 24-C-16-001542), and designated counsel for one of the Maryland cases as interim lead co-counsel. On May 26, 2016, interim lead counsel filed the Consolidated Amended Class Action Complaint for Breach of Fiduciary Duty asserting consolidated claims of breach of fiduciary duty, aiding and abetting the breaches of fiduciary duty, and waste. On June 27, 2016, defendants filed a Motion to Dismiss the Consolidated Amended Class Action Complaint for failing to state a claim upon which relief can be granted. A hearing was held on the Motion to Dismiss on March 3, 2017, and the Court reserved ruling. To date, the Court has not issued an order on the Motion to Dismiss.
We adopted the 2009 Stock Incentive Plan as amended (the “Plan”) to attract, retain and reward directors and other persons who provide services to us in the course of operations. The Plan authorizes the Board to grant awards including common stock, restricted shares of common stock (“RSUs”), stock options, performance shares, performance units, stock appreciation rights and other equity and cash-based awards (collectively, “Awards”), subject to terms as provided in the Plan. At
June 30, 2018
, there were
1,875
shares of common stock issuable under the Plan, of which
1,137
remain available for future issuance.
|
|
June 30, 2018
|
||||||
|
|
Number of
Awards
|
Weighted
Average Grant
Date Fair Value
per Award
|
|||||
|
Unvested RSU Awards Outstanding beginning of period
|
|
|
$
|
|
|
||
|
Vested
|
(
|
)
|
$
|
|
|
||
|
Unvested RSU Awards Outstanding end of period
|
|
|
$
|
|
|
||
29
ARMOUR Residential REIT, Inc.
FINANCIAL STATEMENT NOTES (UNAUDITED)
(in thousands, except per share)
Preferred Stock
At
June 30, 2018
and
December 31, 2017
, we were authorized to issue up to
50,000
shares of preferred stock, par value
$
0.001
per share, with such designations, voting and other rights and preferences as may be determined from time to time by our Board of Directors (“Board”) or a committee thereof. We have designated
9,610
shares as
8.250
%
Series A Preferred Stock and
7,650
shares as
7.875
%
Series B Preferred Stock. At
June 30, 2018
, a total of
32,740
shares of our authorized preferred stock remain available for designation as future series.
Series A Cumulative Preferred Shares (“Series A Preferred Stock”)
At
June 30, 2018
and
December 31, 2017
, we had
2,181
shares of Series A Preferred Stock issued and outstanding with a par value of
$
0.001
per share and a liquidation preference of
$
25.00
per share, or
$
54,514
in the aggregate. Shares designated as Series A Preferred Stock but unissued totaled
7,429
at
June 30, 2018
. At
June 30, 2018
and
December 31, 2017
, there were no accrued or unpaid dividends on the Series A Preferred Stock. The Series A Preferred Stock is entitled to a dividend at a rate of
8.250
%
per year based on the
$
25.00
per share liquidation preference before the common stock is entitled to receive any dividends. Commencing on June 7, 2017, the Series A Preferred Stock is redeemable at
$
25.00
per share plus accrued and unpaid dividends exclusively at our option (subject to our right under limited circumstances to redeem the Series A Preferred Stock earlier in order to preserve our qualification as a REIT). The Series A Preferred Stock is senior to our common stock and therefore in the event of liquidation, dissolution or winding up, the Series A Preferred Stock will receive a liquidation preference of
$
25.00
per share plus accumulated and unpaid dividends before distributions are paid to holders of our common stock, with no right or claim to any of our remaining assets thereafter. The Series A Preferred Stock generally does not have voting rights, except if we fail to pay dividends on the Series A Preferred Stock for
eighteen
months, whether or not consecutive. Under such circumstances, the Series A Preferred Stock will be entitled to vote to elect
two
additional directors to the Board, until all unpaid dividends have been paid or declared and set aside for payment. The Series A Preferred Stock has no stated maturity, is not subject to any sinking fund or mandatory redemption and will remain outstanding indefinitely unless repurchased or redeemed by us or converted into our common stock in connection with a change of control by the holders of Series A Preferred Stock.
Series B Cumulative Preferred Shares (“Series B Preferred Stock”)
At
June 30, 2018
and
December 31, 2017
, we had
6,369
and
6,262
shares of Series B Preferred Stock, respectively, issued and outstanding with a par value of
$
0.001
per share and a liquidation preference of
$
25.00
per share, or
$
159,232
and
$
156,560
, respectively, in the aggregate at
June 30, 2018
and
December 31, 2017
. Shares designated as Series B Preferred Stock but unissued totaled
1,281
at
June 30, 2018
. At
June 30, 2018
and
December 31, 2017
, there were no accrued or unpaid dividends on the Series B Preferred Stock. The Series B Preferred Stock is entitled to a dividend at a rate of
7.875
%
per year based on the
$
25.00
per share liquidation preference before the common stock is entitled to receive any dividends. The Series B Preferred Stock is redeemable at
$
25.00
per share plus accrued and unpaid dividends exclusively at our option commencing on February 12, 2018 (subject to our right under limited circumstances to redeem the Series A Preferred Stock earlier in order to preserve our qualification as a REIT). The Series B Preferred Stock is senior to our common stock and rank on parity with the Series A Preferred Stock. In the event of liquidation, dissolution or winding up, the Series B Preferred Stock will receive a liquidation preference of
$
25.00
per share plus accumulated and unpaid dividends before distributions are paid to holders of our common stock, with no right or claim to any of our remaining assets thereafter. The Series B Preferred Stock generally does not have voting rights, except if we fail to pay dividends on the Series B Preferred Stock for
eighteen
months, whether or not consecutive. Under such circumstances, the Series B Preferred Stock will be entitled to vote to elect
two
additional directors to the Board, until all unpaid dividends have been paid or declared and set aside for payment. The Series B Preferred Stock has no stated maturity, is not subject to any sinking fund or mandatory redemption and will remain outstanding indefinitely unless repurchased or redeemed by us or converted into our common stock in connection with a change of control by the holders of Series B Preferred Stock.
30
ARMOUR Residential REIT, Inc.
FINANCIAL STATEMENT NOTES (UNAUDITED)
(in thousands, except per share)
On August 30, 2017, the Company entered into an ATM Equity Offering Sales Agreement (the “Preferred B ATM Sales Agreement”) relating to an "at-the-market" offering program for our Series B Preferred Stock. In accordance with the terms of the Preferred B ATM Sales Agreement, we may offer and sell over a period of time and from time to time, up to
2,000
shares of our Series B Preferred Stock. For the
six months ended
June 30, 2018
, we sold
107
shares under this agreement. Proceeds from the sale of the
107
shares were
$
2,632
, net of issuance costs of approximately
$
42
.
Common Stock
At
June 30, 2018
and
December 31, 2017
, we were authorized to issue up to
125,000
shares of common stock, par value
$
0.001
per share, with such designations, voting and other rights and preferences as may be determined from time to time by our Board. We had
41,928
shares of common stock issued and outstanding at
June 30, 2018
and
41,877
shares of common stock issued and outstanding at
December 31, 2017
.
On May 26, 2017, the Company entered into an ATM Equity Offering Sales Agreement (the “Common stock ATM Sales Agreement”) relating to the shares of our common stock. In accordance with the terms of the Common stock ATM Sales Agreement, we may offer and sell over a period of time and from time to time, up to
5,000
shares of our common stock par value
$
0.001
per share. The Common stock ATM Sales Agreement relates to a proposed "at-the-market" offering program. On October 2, 2017, the Sales Agreement was amended
.
As of
June 30, 2018
, we have not sold any shares under this agreement.
Common Stock Repurchased
At
June 30, 2018
and
December 31, 2017
, there were
1,874
authorized shares remaining under our common stock repurchase program (the “Repurchase Program”). During the
six months ended
June 30, 2018
, we did not repurchase any common shares under the Repurchase Program. Under the Repurchase Program, shares may be purchased in the open market, including block trades, through privately negotiated transactions, or pursuant to a trading plan separately adopted in the future. The timing, manner, price and amount of any repurchases will be at our discretion, subject to the requirements of the Securities Exchange Act of 1934, as amended, and related rules. We are not required to repurchase any shares under the Repurchase Program and it may be modified, suspended or terminated at any time for any reason. We do not intend to purchase shares from our Board or other affiliates. Under Maryland law, such repurchased shares are treated as authorized but unissued.
Dividends
|
Record Date
|
Payment Date
|
Rate per common share
|
Aggregate
amount paid
to holders of record
|
|||||||
|
January 16, 2018
|
January 29, 2018
|
$
|
|
|
$
|
|
|
|||
|
February 15, 2018
|
February 27, 2018
|
$
|
|
|
|
|
||||
|
March 15, 2018
|
March 28, 2018
|
$
|
|
|
|
|
||||
|
April 13, 2018
|
April 27, 2018
|
$
|
|
|
|
|
||||
|
May 15, 2018
|
May 30, 2018
|
$
|
|
|
|
|
||||
|
June 15, 2018
|
June 28, 2018
|
$
|
|
|
|
|
||||
|
Total dividends paid
|
$
|
|
|
|||||||
31
ARMOUR Residential REIT, Inc.
FINANCIAL STATEMENT NOTES (UNAUDITED)
(in thousands, except per share)
The following table presents our Series A Preferred Stock dividend transactions for the
six months ended
June 30, 2018
.
|
Record Date
|
Payment Date
|
Rate per
Series A
Preferred
Share
|
Aggregate
amount paid
to holders of record
|
|||||||
|
January 15, 2018
|
January 29, 2018
|
$
|
|
|
$
|
|
|
|||
|
February 15, 2018
|
February 27, 2018
|
$
|
|
|
|
|
||||
|
March 15, 2018
|
March 27, 2018
|
$
|
|
|
|
|
||||
|
April 15, 2018
|
April 27, 2018
|
$
|
|
|
|
|
||||
|
May 15, 2018
|
May 29, 2018
|
$
|
|
|
|
|
||||
|
June 15, 2018
|
June 27, 2018
|
$
|
|
|
|
|
||||
|
Total dividends paid
|
$
|
|
|
|||||||
The following table presents our Series B Preferred Stock dividend transactions for the
six months ended
June 30, 2018
.
|
Record Date
|
Payment Date
|
Rate per
Series B
Preferred
Share
|
Aggregate
amount paid
to holders of record
|
|||||||
|
January 15, 2018
|
January 29, 2018
|
$
|
|
|
$
|
|
|
|||
|
February 15, 2018
|
February 27, 2018
|
$
|
|
|
|
|
||||
|
March 15, 2018
|
March 27, 2018
|
$
|
|
|
|
|
||||
|
April 15, 2018
|
April 27, 2018
|
$
|
|
|
|
|
||||
|
May 15, 2018
|
May 29, 2018
|
$
|
|
|
|
|
||||
|
June 15, 2018
|
June 27, 2018
|
$
|
|
|
|
|
||||
|
Total dividends paid
|
$
|
|
|
|||||||
Equity Capital Raising Activities
|
Transaction Type
|
Completion Date
|
Number of Shares
|
Per Share price
(1)
|
Net Proceeds
|
|||||||||
|
Series B Preferred equity distribution agreement
|
January 2, 2018-January 26, 2018
|
|
|
$
|
|
|
$
|
|
|
||||
32
ARMOUR Residential REIT, Inc.
FINANCIAL STATEMENT NOTES (UNAUDITED)
(in thousands, except per share)
|
|
For the Three Months Ended June 30,
|
For the Six Months Ended June 30,
|
||||||||||||||
|
|
2018
|
2017
|
2018
|
2017
|
||||||||||||
|
Net Income
|
$
|
|
|
$
|
|
|
$
|
|
|
$
|
|
|
||||
|
Less: Preferred dividends
|
(
|
)
|
(
|
)
|
(
|
)
|
(
|
)
|
||||||||
|
Net Income available to common stockholders
|
$
|
|
|
$
|
|
|
$
|
|
|
$
|
|
|
||||
|
Weighted average common shares outstanding – basic
|
|
|
|
|
|
|
|
|
||||||||
|
Add: Effect of dilutive non-vested awards, assumed vested
|
|
|
|
|
|
|
|
|
||||||||
|
Weighted average common shares outstanding – diluted
|
|
|
|
|
|
|
|
|
||||||||
|
|
For the Three Months Ended June 30,
|
For the Six Months Ended June 30,
|
||||||||||||||
|
|
2018
|
2017
|
2018
|
2017
|
||||||||||||
|
GAAP net income
|
$
|
|
|
$
|
|
|
$
|
|
|
$
|
|
|
||||
|
Book to tax differences:
|
||||||||||||||||
|
TRS income
|
(
|
)
|
|
|
(
|
)
|
|
|
||||||||
|
Premium amortization expense
|
(
|
)
|
|
|
(
|
)
|
(
|
)
|
||||||||
|
Credit Risk and Non-Agency Securities
|
|
|
(
|
)
|
|
|
(
|
)
|
||||||||
|
Interest-Only Securities
|
|
|
(
|
)
|
(
|
)
|
|
|
||||||||
|
U.S. Treasury Securities
|
|
|
|
|
|
|
|
|
||||||||
|
Changes in interest rate contracts
|
(
|
)
|
|
|
(
|
)
|
(
|
)
|
||||||||
|
Other than temporary loss on Agency Securities
|
|
|
|
|
|
|
|
|
||||||||
|
Losses on Security Sales
|
|
|
|
|
|
|
|
|
||||||||
|
Amortization of deferred hedging costs
|
(
|
)
|
(
|
)
|
(
|
)
|
(
|
)
|
||||||||
|
Other
|
|
|
|
|
|
|
|
|
||||||||
|
Estimated REIT taxable income
|
$
|
|
|
|
$
|
|
|
|
$
|
|
|
$
|
|
|
||
Interest rate contracts are treated as hedging transactions for U. S. federal income tax purposes. Unrealized gains and losses on open interest rate contracts are not included in the determination of REIT taxable income. Realized gains and losses on interest rate contracts terminated before their maturity are deferred and amortized over the remainder of the original term of the contract for REIT taxable income.
33
ARMOUR Residential REIT, Inc.
FINANCIAL STATEMENT NOTES (UNAUDITED)
(in thousands, except per share)
|
Net capital losses realized
|
Amount
|
Available to offset capital gains though
|
|||
|
2013
|
(
|
)
|
2018
|
||
|
2014
|
(
|
)
|
2019
|
||
|
2015
|
(
|
)
|
2020
|
||
|
2016
|
(
|
)
|
2021
|
||
|
2017
|
(
|
)
|
2022
|
||
The Company's subsidiary, ARMOUR TRS, Inc. has made an election as a taxable REIT subsidiary (“TRS”). As such, the Company's TRS is taxable as a domestic C corporation and subject to federal, state and local income taxes based upon its taxable income. The Company's TRS is subject to federal, state and local taxes. During the
three and six months ended
June 30, 2018
, we recorded
$
25
and
$
50
of income tax expense attributable to our TRS.
The aggregate tax basis of our assets and liabilities was greater
than our total Stockholders’ Equity at
June 30, 2018
by approximately
$
63,603
, or approximately
$
1.52
per common share (based on the
41,928
common shares then outstanding).
We are required and intend to timely distribute substantially all of our REIT taxable income in order to maintain our REIT status under the Code. Total dividend payments to stockholders were
$
28,396
and
$
56,787
for the
three and six months ended
June 30, 2018
and
$
24,856
and
$
49,713
for the
three and six months ended
June 30, 2017
, respectively. Our estimated REIT taxable income available for distribution as dividends was
$
3,891
and
$
9,691
for the
three and six months ended
June 30, 2018
and
$
5,047
and
$
9,974
for the
three and six months ended
June 30, 2017
, respectively. Our REIT taxable income and dividend requirements to maintain our REIT status are determined on an annual basis. Dividends paid in excess of current tax earnings and profits for the year will generally not be taxable to common stockholders.
ACM
The Company is managed by ACM, pursuant to management agreements with ARMOUR and JAVELIN. All of our executive officers are also employees of ACM. ACM manages our day-to-day operations, subject to the direction and oversight of the Board. The ARMOUR management agreement runs through June 18, 2024 and is thereafter automatically renewed for an additional
five
-year terms unless terminated under certain circumstances. The JAVELIN Management Agreement renewed on October 5, 2017, for a
one
-year period, with the base management fee thereunder reduced to
one
dollar for the entirety of the renewal term. It will be automatically renewed annually for successive one- year terms unless terminated under certain circumstances. Either party must provide
180 days
prior written notice of any such termination.
Under the terms of the management agreements, ACM is responsible for costs incident to the performance of its duties, such as compensation of its employees and various overhead expenses. ACM is responsible for the following primary roles:
|
•
|
Advising us with respect to, arranging for and managing the acquisition, financing, management and disposition of, elements of our investment portfolio;
|
|
•
|
Evaluating the duration risk and prepayment risk within the investment portfolio and arranging borrowing and hedging strategies;
|
|
•
|
Coordinating capital raising activities;
|
|
•
|
Advising us on the formulation and implementation of operating strategies and policies, arranging for the acquisition of assets, monitoring the performance of those assets and providing administrative and managerial services in connection with our day-to-day operations; and
|
34
ARMOUR Residential REIT, Inc.
FINANCIAL STATEMENT NOTES (UNAUDITED)
(in thousands, except per share)
|
•
|
Providing executive and administrative personnel, office space and other appropriate services required in rendering management services to us.
|
In accordance with management agreements, we incurred
$
6,803
and
$
13,604
in management fees for the
three and six months ended
June 30, 2018
. For the
three and six months ended
June 30, 2017
, we incurred
$
6,523
and
$
13,044
in management fees. In accordance with the JAVELIN management agreement, we paid management fees of
$
565
and
$
1,130
for the
three and six months ended
June 30, 2017
.
We are required to take actions as may be reasonably required to permit and enable ACM to carry out its duties and obligations. We are also responsible for any costs and expenses that ACM incurred solely on our behalf other than the various overhead expenses specified in the terms of the management agreements. For the
three and six months ended
June 30, 2018
, we reimbursed ACM
$
66
and
$
113
for other expenses incurred on our behalf. For the
three and six months ended
June 30, 2017
, we reimbursed ACM
$
328
and
$
683
for other expenses incurred on our behalf. In consideration of our 2012 results, in 2013, we also elected to make a restricted stock award to our executive officers and other ACM employees through ACM. The award fully vested in December 2017 and resulted in our recognizing stock based compensation expense of
$
92
and
$
175
for the
three and six months ended
June 30, 2017
. In November 2017, we elected to make restricted stock unit awards to ACM and to the Board. These awards began vesting in February 2018, causing us to recognize stock based compensation expense of
$
109
and
$
217
for the
three and six months ended
June 30, 2018
.
BUCKLER
In March 2017, we contributed
$
352
for a
10
%
ownership interest in BUCKLER Securities, LLC, (“BUCKLER”) a Delaware limited liability company and a FINRA-regulated broker-dealer, controlled by ACM and certain executive officers of ARMOUR. The investment is included in prepaid and other assets in our consolidated balance sheet and is accounted for using the equity method as BUCKLER maintains specific ownership accounts. In May 2018, we made an additional contribution to BUCKLER of
$
66
. The value of the investment was
$
85
at
June 30, 2018
reflecting our total investment less our share of BUCKLER’s startup costs and operating losses, in accordance with the terms of the operating agreement of BUCKLER that our independent directors negotiated. The primary purpose of our investment in BUCKLER is to facilitate our access to repurchase financing, on potentially attractive terms (considering rate, term, size, haircut, relationship and funding commitment) compared to other suitable repurchase financing counterparties.
Our operating agreement with BUCKLER contains certain provisions to benefit and protect the Company, including (1) sharing in any (a) defined profits realized by BUCKLER from the anticipated financing spreads resulting from repurchase financing facilitated by BUCKLER, and (b) distributions from BUCKLER to its members of net cash receipts, and (2) the realization of anticipated savings from reduced clearing, brokerage, trading and administrative fees. In addition, the independent directors of the Company, must approve in their sole discretion, any third-party business engaged by BUCKLER and may cause BUCKLER to wind up and dissolve and promptly return certain subordinated loans we provide to BUCKLER as regulatory capital (as described more below) if the independent directors reasonably determine that BUCKLER’s ability to provide attractive securities transactions for the Company is materially adversely affected. BUCKLER began trading operations on October 25, 2017.
The Company has entered three subordinated loan agreements with BUCKLER, totaling
$
105.0
million
. The loans have a stated interest rate of
zero
, plus additional interest payable to us in an amount equal to the amount of interest earned by BUCKLER on the investment of the loan proceeds, generally in government securities funds. In 2018, BUCKLER has paid the Company
$
624
of interest on these loans, and accrued another
$
430
, which it received in July 2018. The loans are repayable as follows:
|
•
|
$
|
|
•
|
$
|
|
•
|
$
|
35
ARMOUR Residential REIT, Inc.
FINANCIAL STATEMENT NOTES (UNAUDITED)
(in thousands, except per share)
2018, our audit committee and independent directors separately approved an extension of the
$
65.0
million
loan agreement with BUCKLER, to April 25, 2020, subject to approval by FINRA.
A cash dividend of
$
0.17
per outstanding share of Series A Preferred Stock, or
$
375
in the aggregate, and
$
0.16
per outstanding share of Series B Preferred Stock, or
$
1,045
in the aggregate, is payable on July 27, 2018 to holders of record on July 15, 2018. We have also declared cash dividends of
$
0.17
and
$
0.16
per outstanding share of Series A Preferred Stock and Series B Preferred Stock, respectively, payable August 27, 2018 to holders of record on August 15, 2018 and payable September 27, 2018 to holders of record on September 15, 2018.
36
ARMOUR Residential REIT, Inc.
The following discussion of our financial condition and results of operations should be read in conjunction with our consolidated financial statements and related notes included elsewhere in this report.
References to “we,” “us,” “our,” or the “Company” are to ARMOUR Residential REIT, Inc. (“ARMOUR”) and its subsidiaries. References to “ACM” are to ARMOUR Capital Management LP, a Delaware limited partnership. Refer to the Glossary of Terms for definitions of capitalized terms and abbreviations used in this report.
U.S. dollar amounts are presented in thousands, except per share data or as otherwise noted.
Overview
ARMOUR is a Maryland corporation formed to invest in and manage a leveraged portfolio of MBS and mortgage loans. We invest in residential mortgage backed securities issued or guaranteed by a U.S. GSE, such as Fannie Mae, Freddie Mac, or a government agency such as Ginnie Mae (collectively, Agency Securities). Interest-Only Securities are the interest portion of Agency Securities, which is separated and sold individually from the principal portion of the same payment. Other securities backed by residential mortgages in which we invest, for which the payment of principal and interest is not guaranteed by a GSE or government agency (collectively, Credit Risk and Non-Agency Securities and together with Agency Securities and Interest-Only Securities, MBS), may benefit from credit enhancement derived from structural elements such as subordination, over collateralization or insurance. The Company is managed by ACM, an investment advisor registered with the SEC. See
Note 10
and
Note 15
to the consolidated financial statements for further details.
We seek to create shareholder value through thoughtful investment and risk management that produces current yield and superior risk adjusted returns over the long term. Our focus on residential real estate finance supports home ownership for a broad and diverse spectrum of Americans by bringing private capital into the mortgage markets.
We earn returns on the spread between the yield on our assets and our costs, including the interest cost of the funds we borrow, after giving effect to our hedges. We identify and acquire MBS, finance our acquisitions with borrowings under a series of short-term repurchase agreements at the most competitive interest rates available to us and then cost-effectively hedge our interest rate and other risks based on our entire portfolio of assets, liabilities and derivatives and our management’s view of the market. Successful implementation of this approach requires us to address interest rate risk, maintain adequate liquidity and effectively hedge interest rate risks. We believe that the residential mortgage market will undergo significant changes in the coming years as the role of GSEs, such as Fannie Mae and Freddie Mac, is diminished, which we expect will create attractive investment opportunities for us. We execute our business plan in a manner consistent with our intention of qualifying as a REIT under the Code and avoiding regulation as an investment company under the 1940 Act.
We have elected to be taxed as a REIT under the Code. We will generally not be subject to federal income tax to the extent that we distribute our taxable income to our stockholders and as long as we satisfy the ongoing REIT requirements under the Code including meeting certain asset, income and stock ownership tests.
Factors that Affect our Results of Operations and Financial Condition
Our results of operations and financial condition are affected by various factors, many of which are beyond our control, including, among other things, our net interest income, the market value of our assets and the supply of and demand for such assets. Recent events, such as those discussed below, can affect our business in ways that are difficult to predict and may produce results outside of typical operating variances. Our net interest income varies primarily as a result of changes in interest rates, borrowing costs and prepayment speeds, the behavior of which involves various risks and uncertainties. We look to invest across the spectrum of mortgage investments, from Agency Securities, for which the principal and interest payments are guaranteed by a GSE, to Credit Risk and Non-Agency Securities, non-prime mortgage loans and unrated equity tranches of CMBS. As such, we expect our investments to be subject to risks arising from delinquencies and foreclosures, thereby exposing our investment portfolio to potential losses. We are exposed to changing credit spreads, which could result in declines in the fair value of our investments. We believe ACM’s in-depth investment expertise across multiple sectors of the mortgage market, prudent asset selection and our hedging strategy enable us to minimize our credit losses, our market value losses and financing costs. Prepayment rates, as reflected by the rate of principal pay downs and interest rates vary according to the type of
37
ARMOUR Residential REIT, Inc.
Management’s Discussion and Analysis (continued)
investment, conditions in financial markets, government actions, competition and other factors, none of which can be predicted with any certainty. In general, as prepayment rates on our assets that are purchased at a premium increase, related purchase premium amortization increases, thereby reducing the net yield on such assets. Because changes in interest rates may significantly affect our activities, our operating results depend, in large part, upon our ability to manage interest rate risks and prepayment risks effectively while maintaining our status as a REIT.
For any period during which changes in the interest rates earned on our assets do not coincide with interest rate changes on our borrowings, such assets will tend to reprice more slowly than the corresponding liabilities. Consequently, changes in interest rates, particularly short-term interest rates, may significantly influence our net interest income. With the maturities of our assets generally of a longer term than those of our liabilities, interest rate increases will tend to decrease our net interest income and the market value of our assets (and therefore our book value). Such rate increases could possibly result in operating losses or adversely affect our ability to make distributions to our stockholders.
Prepayments on MBS and the underlying mortgage loans may be influenced by changes in market interest rates and a variety of economic and geographic factors, policy decisions by regulators, as well as other factors beyond our control. To the extent we hold MBS acquired at a premium or discount to par, or face value, changes in prepayment rates may impact our anticipated yield. In periods of declining interest rates, prepayments on our MBS will likely increase. If we are unable to reinvest the proceeds of such prepayments at comparable yields, our net interest income may decline. The climate of government intervention in the mortgage markets significantly increases the risk associated with prepayments.
While we use strategies to economically hedge some of our interest rate risk, we do not hedge all of our exposure to changes in interest rates and prepayment rates, as there are practical limitations on our ability to insulate our securities portfolio from all potential negative consequences associated with changes in short-term interest rates in a manner that will allow us to seek attractive net spreads on our securities portfolio. Also, since we have not elected to use cash flow hedge accounting, earnings reported in accordance with GAAP will fluctuate even in situations where our derivatives are operating as intended. As a result of this mark-to-market accounting treatment, our results of operations are likely to fluctuate far more than if we were to designate our derivative activities as cash flow hedges. Comparisons with companies that use cash flow hedge accounting for all or part of their derivative activities may not be meaningful. For these and other reasons more fully described under the section captioned “Derivative Instruments” below, no assurance can be given that our derivatives will have the desired beneficial impact on our results of operations or financial condition.
In addition to the use of derivatives to hedge interest rate risk, a variety of other factors relating to our business may also impact our financial condition and operating performance; these factors include
|
•
|
our degree of leverage;
|
|
•
|
our access to funding and borrowing capacity;
|
|
•
|
the REIT requirements under the Code; and
|
|
•
|
the requirements to qualify for an exclusion under the 1940 Act and other regulatory and accounting policies related to our business.
|
Our Manager
See
Note 10
and
Note 15
to the consolidated financial statements.
Market and Interest Rate Trends and the Effect on our securities portfolio
Developments at Fannie Mae and Freddie Mac
The payments we receive on the Agency Securities in which we invest depend upon a steady stream of payments by borrowers on the underlying mortgages and the fulfillment of guarantees by GSEs. There can be no assurance that the U.S. Government's intervention in Fannie Mae and Freddie Mac will continue to be adequate or assured for the longer-term viability of these GSEs. These uncertainties may lead to concerns about the availability of and trading market for Agency Securities in
38
ARMOUR Residential REIT, Inc.
Management’s Discussion and Analysis (continued)
the long term. Accordingly, if the GSEs defaulted on their guaranteed obligations, suffered losses or ceased to exist, the value of our Agency Securities and our business, operations and financial condition could be materially and adversely affected.
The passage of any new federal legislation affecting Fannie Mae and Freddie Mac may create market uncertainty and reduce the actual or perceived credit quality of securities issued or guaranteed by them. If Fannie Mae and Freddie Mac were reformed or wound down, it is unclear what effect, if any, this would have on the value of the existing Fannie Mae and Freddie Mac Agency Securities. The foregoing could materially adversely affect the pricing, supply, liquidity and value of the Agency Securities in which we invest and otherwise materially adversely affect our business, operations and financial condition.
On June 3, 2019, Fannie Mae and Freddie Mac are scheduled to start issuing a new common security, the Uniform MBS, in place of their current offerings of MBS. The new Uniform MBS will be issued using a new Common Securitization Platform ("CSP"). The Uniform MBS will more closely resemble current Fannie Mae MBS than current Freddie Mac MBS and will become the basis for the TBA MBS market place. Existing Freddie Mac MBS will be eligible for exchange into new Uniform MBS. We are unable to predict what impact the introduction of the new Uniform MBS and CSP will have on our existing MBS or the MBS market in the future.
Short-term Interest Rates and Funding Costs
On January 31, 2018, the Fed raised its target range for the Federal Funds Rate to between 1.25% and 1.50%. After its March 2018 meeting, the Fed raised its target range to between 1.50% and 1.75%. At its June 2018 meeting, the Fed raised its target range to between 1.75% and 2.00%. Changes in Fed policy affect our financial results, since our cost of funds is largely dependent on short-term rates. An increase in our cost of funds without a corresponding increase in interest income earned on our MBS would cause our net income to decline.
Historically, 30-day LIBOR has closely tracked movements in the Federal Funds Rate and the Effective Federal Funds Rate. The Effective Federal Funds Rate can differ from the Federal Funds Rate in that the Effective Federal Funds Rate represents the volume weighted average of interest rates at which depository institutions lend balances at the Fed to other depository institutions overnight (actual transactions, rather than target rate).
Our borrowings in the repurchase market have also historically closely tracked the Federal Funds Rate and LIBOR. Traditionally, a lower Federal Funds Rate has indicated a time of increased net interest margin and higher asset values. The difference between 30-day LIBOR and the Effective Federal Funds Rate can be quite volatile, with the spread alternately returning to more normal levels and then widening out again. Volatility in these rates and divergence from the historical relationship among these rates could negatively impact our ability to manage our securities portfolio. If rates were to increase as a result, our net interest margin and the value of our securities portfolio might suffer as a result.
39
ARMOUR Residential REIT, Inc.
Management’s Discussion and Analysis (continued)
The following graph shows 30-day LIBOR as compared to the Effective Federal Funds Rate on a monthly basis from
June 30, 2016
to
June 30, 2018
.

Long-term Interest Rates and Mortgage Spreads
Our Agency Securities are valued at an interest rate spread versus long-term interest rates (mortgage spread). This mortgage spread varies over time and can be above or below long-term averages, depending upon market participants' current desire to own Agency Securities over other investment alternatives. When the mortgage spread gets smaller (or negative) versus long-term interest rates, our book value will be positively affected. When this spread gets larger (or positive), our book value will be negatively affected.
Mortgage spreads can vary due to movements in Agency Securities valuations, movements in long-term interest rates or a combination of both. Since 2015, the interest rate swap spread has been negative to U.S. Treasury interest rates for certain longer tenors, an inversion of longstanding market norms. We mainly use interest rate swap contracts (including swaptions) to economically hedge against changes in the valuation of our MBS. We do not use such hedging contracts for speculative purposes. As of
June 30, 2018
and
December 31, 2017
, we have not entered into any contract or purchased any asset specifically designed to offset the impact of mortgage spreads on our book value.
40
ARMOUR Residential REIT, Inc.
Management’s Discussion and Analysis (continued)
Results of Operations
Net Income Summary
The following is a summary of our consolidated results of operations for the periods presented:

Interest income for the
three and six months ended
June 30, 2018
, increased due to a larger average securities portfolio and an increase in asset yields compared to the
three and six months ended
June 30, 2017
. The increases in our securities portfolio and asset yields, in the aggregate, were not enough to offset the increase in interest expense on our repurchase agreements, which led to the decrease in net interest income for the
three and six months ended
June 30, 2018
compared to the
three and six months ended
June 30, 2017
.
41
ARMOUR Residential REIT, Inc.
Management’s Discussion and Analysis (continued)
Net Interest Income

Net interest income is a function of both our securities portfolio size and net interest rate spread.
2018
vs.
2017
|
•
|
Our average securities portfolio (including TBA Agency Securities) increased by
11.5%
from
$8,916,626
for the
six months ended
June 30, 2017
to
$9,939,789
for the
six months ended
June 30, 2018
.
|
|
•
|
Our asset yields increased by
0.11%
and our interest expense on our repurchase agreements increased by
0.75%
for the
six months ended
June 30, 2018
, compared to the
six months ended
June 30, 2017
. The asset yield increase was mainly due to the change in the composition of our securities portfolio and slower prepayment speeds. The change in interest expense on our repurchase agreements was due to a larger average securities portfolio and an increase in short-term rates by the Fed.
|
|
•
|
Our net interest rate spread decreased by
0.11%
basis points from
1.67%
for the
six months ended
June 30, 2017
to
1.56%
for the
six months ended
June 30, 2018
.
|
At
June 30, 2018
and
December 31, 2017
, our Agency Securities in our securities portfolio were carried at a net premium to par value with a weighted average amortized cost of
103.9%
and
104.4%
, respectively, due to the average interest rates on these securities being higher than prevailing market rates.
42
ARMOUR Residential REIT, Inc.
Management’s Discussion and Analysis (continued)
The following table presents the components of the yield earned on our securities portfolio (including TBA Agency Securities) for the quarterly periods ended on the dates shown below:

43
ARMOUR Residential REIT, Inc.
Management’s Discussion and Analysis (continued)
The yield on our assets is most significantly affected by the rate of repayments on our Agency Securities. The following graph shows the annualized CPR on a monthly basis for the quarterly periods ended on the dates shown below.

44
ARMOUR Residential REIT, Inc.
Management’s Discussion and Analysis (continued)
Other Income

45
ARMOUR Residential REIT, Inc.
Management’s Discussion and Analysis (continued)
2018
vs.
2017
|
•
|
Losses on Agency Securities resulted from the sales of Agency Securities during the
three and six months ended
June 30, 2018
of
$1,236,423
and
$2,373,507
, including
$216,292
of unsettled sales in the second quarter. Sales were
$660,971
and
$2,687,595
, including
$639,258
of unsettled sales from the first quarter for the
three and six months ended
June 30, 2017
.
|
|
•
|
At
June 30, 2018
and
June 30, 2017
, we also considered whether we intended to sell Agency Securities and whether it was more likely than not that we could meet our liquidity requirements and contractual obligations without selling Agency Securities. During the second quarter of 2017, we identified certain low yielding Agency Securities that were replaced with securities having more attractive returns. For those securities that were previously identified, we recognized additional losses totaling
$12,090
for the six months ended
June 30, 2018
in our consolidated financial statements of operations. We determined that there was no other than temporary impairment of our remaining Agency Securities as of
June 30, 2018
. We recognized a loss of
$10,338
in our consolidated financial statements of operations for the
three and six months ended
June 30, 2017
on certain of our low yielding Agency Securities that were determined to represent an other than temporary impairment because we planned to replace these low yielding securities with securities that had more attractive returns, as market conditions permitted. A new cost basis was established for those Agency Securities with an aggregate fair value of
$1,113,815
as of June 30, 2017. We determined that there was no other than temporary impairment of our remaining Agency Securities as of June 30, 2017.
|
|
•
|
Gain (loss) on Credit Risk and Non-Agency Securities resulted from the change in fair value of the securities.
|
|
•
|
Gain (loss) on Interest-Only Securities resulted from the change in the fair value of these securities.
|
|
•
|
Loss on U.S. Treasury Securities resulted from the loss on the sale of these in the second quarter of 2018. We did not have any U.S. Treasury Securities remaining at
June 30, 2018
.
|
|
•
|
Gains (losses) on Derivatives resulted from a combination of the following:
|
|
◦
|
Changes in interest rates and TBA prices.
|
|
◦
|
The increase in our total interest rate swap contracts aggregate notional balance from
$5,200,000
at
June 30, 2017
to
$6,750,000
at
June 30, 2018
.
|
|
◦
|
The decrease in our total TBA Agency Securities aggregate notional balance from
$2,350,000
at
June 30, 2017
to
$2,100,000
at
June 30, 2018
.
|
46
ARMOUR Residential REIT, Inc.
Management’s Discussion and Analysis (continued)
Expenses

The Company is managed by ACM, pursuant to management agreements with ARMOUR and JAVELIN. The ARMOUR management fees are determined based on gross equity raised. Therefore, management fees increase when we raise capital and decline when we repurchase previously issued stock and liquidate distributions as approved and so designated by a majority of the Board. However, because the ARMOUR management fee rate decreased to 0.75% per annum for gross equity raised in excess of $1.0 billion pursuant to the ARMOUR management agreement, the effective average management fee rate declines as equity is raised. Gross equity raised was
$2,620,693
at
June 30, 2018
and
$2,586,188
at
June 30, 2017
, respectively.
47
ARMOUR Residential REIT, Inc.
Management’s Discussion and Analysis (continued)
Professional fees include securities clearing, legal, audit and consulting costs and are generally driven by the size and complexity of our securities portfolio, the volume of transactions we execute and the extent of research and due diligence activities we undertake on potential transactions.
Insurance includes premiums for both general business and directors and officers liability coverage. The fluctuation from year to year is due to changes in premiums.
Compensation includes both non-executive director compensation as well as the restricted stock units awarded to our executive officers and other ACM employees through ACM. The fluctuation from year to year is due to a combination of the change in our stock price and the number of awards vesting to our executive officers and other ACM employees.
Other expenses include fees for market and pricing data, analytics and risk management systems and portfolio related data processing costs as well as stock exchange listing fees and similar stockholder related expenses.
Taxable Income
As a REIT that regularly distributes all of its taxable income, we are generally not required to pay federal income tax. See
Note 14
to the consolidated financial statements.
Other Comprehensive Income (Loss)
Comprehensive income (loss) includes all changes in equity during a period, except those resulting from investments by owners and distributions to owners. For the
three and six months ended
June 30, 2018
and
June 30, 2017
, other comprehensive (loss) income totaled
$(24,271)
and
$(124,988)
and
$25,980
and
$43,248
, respectively, reflecting net unrealized gain (loss) on available for sale Agency Securities net of amounts reclassified upon sale.
Financial Condition
Our securities portfolio consists primarily of Agency Securities backed by fixed rate home loans. From time to time, a portion of our Agency Securities may be backed by hybrid adjustable rate and adjustable rate home loans as well as unsecured notes and bonds issued by GSEs, U.S. Treasury Securities and money market instruments, subject to certain income tests we must satisfy for our qualification as a REIT. Our charter permits us to invest in these asset classes.
48
ARMOUR Residential REIT, Inc.
Management’s Discussion and Analysis (continued)
The charts below present the breakout by percentage of our securities portfolio, at fair value as of the dates indicated.


Agency Securities, Interest-Only Securities and TBA Agency Securities
Security purchase and sale transactions, including purchases and sales for forward settlement, are recorded on the trade date to the extent it is probable that we will take or make timely physical delivery of the related securities. Gains or losses realized from the sale of securities are included in income and are determined using the specific identification method. We typically purchase Agency Securities at premium prices. The premium price paid over par value on those assets is expensed as the underlying mortgages experience repayment or prepayment. The lower the constant prepayment rate, the lower the amount of amortization expense for a particular period. Accordingly, the yield on an asset and earnings are higher. If prepayment rates increase, the amount of amortization expense for a particular period will go up. These increased prepayment rates would act to decrease the yield on an asset and would decrease earnings.
We account for TBA Agency Securities as derivative instruments if it is reasonably possible that we will not take or make physical delivery of the Agency Security upon settlement of the contract. TBA Agency Securities are forward contracts for the purchase (“long position”) or sale (“short position”) of Agency Securities at a predetermined price, face amount, issuer, coupon and stated maturity on an agreed-upon future date. The specific Agency Securities delivered pursuant to the contract upon the settlement date, published each month by the Securities Industry and Financial Markets Association, are not known at the time of the transaction. We estimate the fair value of TBA Agency Securities based on similar methods used to value our Agency Securities. TBA Agency Securities are included in the table below on a gross basis as they can be used to establish and finance portfolio positions in Agency Securities.
49
ARMOUR Residential REIT, Inc.
Management’s Discussion and Analysis (continued)
The tables below summarize certain characteristics of our Agency Securities, Interest-Only Securities and TBA Agency Securities at
June 30, 2018
and
December 31, 2017
.
June 30, 2018
|
Asset Type
|
Principal Amount
|
Fair Value
|
Weighted Average Coupon
|
CPR
(1)
|
Weighted Average Month to Reset or Maturity
|
|||||||||||
|
ARMs & Hybrids
|
$
|
55,053
|
|
$
|
56,932
|
|
3.18
|
%
|
10.95
|
%
|
9
|
|||||
|
Multi-Family MBS
|
1,441,797
|
|
1,429,449
|
|
3.19
|
%
|
0.00
|
%
|
81
|
|||||||
|
10 Year Fixed
|
27,100
|
|
27,691
|
|
4.04
|
%
|
6.41
|
%
|
86
|
|||||||
|
15 Year Fixed
|
101,901
|
|
105,198
|
|
4.03
|
%
|
12.38
|
%
|
153
|
|||||||
|
20 Year Fixed
|
5,923
|
|
6,115
|
|
4.16
|
%
|
0.59
|
%
|
196
|
|||||||
|
25 Year Fixed
|
52,392
|
|
52,857
|
|
3.64
|
%
|
5.81
|
%
|
284
|
|||||||
|
30 Year Fixed
|
4,475,612
|
|
4,575,070
|
|
4.01
|
%
|
5.88
|
%
|
347
|
|||||||
|
Total or Weighted Average
|
$
|
6,159,778
|
|
$
|
6,253,312
|
|
3.81
|
%
|
4.65
|
%
|
278
|
|||||
|
TBA Agency Securities 15 Year
(2)
|
300,000
|
|
307,621
|
|
4.00
|
%
|
0.00
|
%
|
180
|
|||||||
|
TBA Agency Securities 30 Year
(2)
|
1,800,000
|
|
1,885,336
|
|
4.72
|
%
|
0.00
|
%
|
360
|
|||||||
|
Total or Weighted Average
|
8,259,778
|
|
8,446,269
|
|
||||||||||||
|
Interest-Only Securities
(3)
|
119,459
|
|
23,415
|
|
4.83
|
%
|
15.18
|
%
|
268
|
|||||||
|
Total or Weighted Average
|
|
|
|
$
|
8,469,684
|
|
||||||||||
(1) Weighted average for all prepayments during the
three and six months ended
June 30, 2018
, including prepayments related to Agency Securities purchased during the quarter.
(2) Our TBA Agency Securities are recorded as derivative instruments in our accompanying consolidated financial statements. As of
June 30, 2018
, our TBA Agency Securities had a net carrying value of
$3,222
, reported as a derivative asset and
$(177)
, reported as a derivative liability on our accompanying consolidated balance sheets. The net carrying value represents the difference between the fair value of the underlying Agency Security in the TBA Agency Security and the cost basis or the forward price to be paid or received for the underlying Agency Security. The weighted average months to maturity represents the maximum maturity acceptable within the delivery standards. Securities actually delivered may have shorter maturities.
(3) Interest-Only Securities principal amount represents the outstanding balance of the underlying Agency Securities from which the Interest-Only Security is derived. We are not entitled to receive any of those principal amounts.
50
ARMOUR Residential REIT, Inc.
Management’s Discussion and Analysis (continued)
December 31, 2017
|
Asset Type
|
Principal Amount
|
Fair Value
|
Weighted Average Coupon
|
CPR
(1)
|
Weighted Average Month to Reset or Maturity
|
|||||||||||
|
ARMs & Hybrids
|
$
|
63,675
|
|
$
|
66,048
|
|
2.87
|
%
|
11.40
|
%
|
9
|
|||||
|
Multi-Family MBS
|
1,764,840
|
|
1,811,555
|
|
3.15
|
%
|
0.00
|
%
|
88
|
|||||||
|
10 Year Fixed
|
94,262
|
|
98,018
|
|
4.00
|
%
|
9.44
|
%
|
93
|
|||||||
|
15 Year Fixed
|
1,315,191
|
|
1,379,921
|
|
3.80
|
%
|
10.87
|
%
|
161
|
|||||||
|
20 Year Fixed
|
27,405
|
|
29,211
|
|
4.42
|
%
|
17.10
|
%
|
202
|
|||||||
|
25 Year Fixed
|
47,875
|
|
49,753
|
|
3.69
|
%
|
5.49
|
%
|
281
|
|||||||
|
30 Year Fixed
|
3,872,423
|
|
4,044,460
|
|
3.88
|
%
|
6.56
|
%
|
349
|
|||||||
|
Total or Weighted Average
|
$
|
7,185,671
|
|
$
|
7,478,966
|
|
3.68
|
%
|
5.85
|
%
|
244
|
|||||
|
TBA Agency Securities 15 Year
(2)
|
500,000
|
|
509,278
|
|
3.00
|
%
|
0.00
|
%
|
180
|
|||||||
|
TBA Agency Securities 30 Year
(2)
|
1,100,000
|
|
1,163,836
|
|
4.37
|
%
|
0.00
|
%
|
360
|
|||||||
|
Total or Weighted Average
|
$
|
8,785,671
|
|
$
|
9,152,080
|
|
||||||||||
|
Interest-Only Securities
(3)
|
132,029
|
|
25,752
|
|
4.84
|
%
|
13.28
|
%
|
276
|
|||||||
|
Total or Weighted Average
|
$
|
9,177,832
|
|
|||||||||||||
(1) Weighted average for all prepayments during the year ended
December 31, 2017
, including prepayments related to Agency Securities purchased during the quarter.
(2) Our TBA Agency Securities are recorded as derivative instruments in our accompanying consolidated financial statements. As of
December 31, 2017
, our TBA Agency Securities had a carrying value of $934, reported as derivative assets and a carrying amount of $(2,258), reported as a derivative liability on our accompanying consolidated balance sheets. The net carrying value represents the difference between the fair value of the underlying Agency Security in the TBA Agency Security and the cost basis or the forward price to be paid or received for the underlying Agency Security. The weighted average months to maturity represents the maximum maturity acceptable within the delivery standards. Securities actually delivered may have shorter maturities.
(3) Interest-Only Securities principal amount represents the outstanding balance of the underlying Agency Securities from which the Interest-Only Security is derived. We are not entitled to receive any of those principal amounts.
51
ARMOUR Residential REIT, Inc.
Management’s Discussion and Analysis (continued)
The charts below present the percentage of our Agency Securities, Interest-only Securities and TBA Agency Securities by type each at fair value as of the dates indicated.
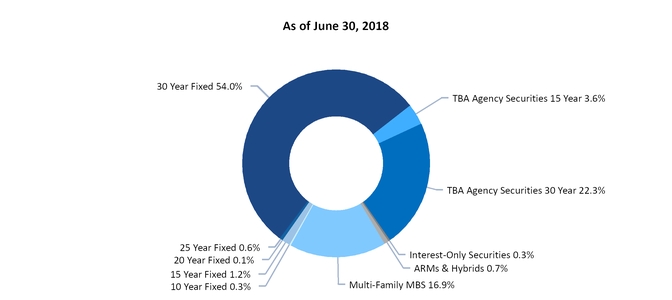
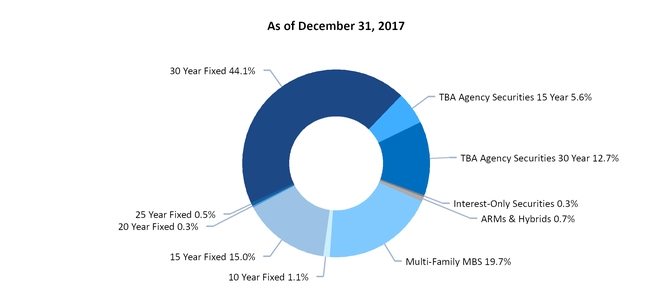
Recognition of interest income commences on the settlement date of the purchase transaction and continues through the settlement date of the sale transaction. At
June 30, 2018
, we had investment related receivables of
$216,292
with respect to unsettled sales and investment related payables of
$462,325
with respect to unsettled purchases. At
December 31, 2017
we did not have any investment related receivables or payables with respect to unsettled sales and purchases of our Agency Securities.
Our net interest income is primarily a function of the difference between the yield on our assets and the financing (borrowing and hedging) cost of owning those assets. Since we tend to purchase Agency Securities at a premium to par, the main item that can affect the yield on our Agency Securities after they are purchased is the rate at which the mortgage borrowers repay the loan. While the scheduled repayments, which are the principal portion of the homeowners’ regular monthly payments,
52
ARMOUR Residential REIT, Inc.
Management’s Discussion and Analysis (continued)
are fairly predictable, the unscheduled repayments, which are generally refinancing of the mortgage but can also result from repurchases of delinquent, defaulted, or modified loans, are less so. Being able to accurately estimate and manage these repayment rates is a critical portion of the management of our securities portfolio, not only for estimating current yield but also for considering the rate of reinvestment of those proceeds into new securities, the yields which those new securities may add to our securities portfolio and our hedging strategy.
At
June 30, 2018
and
December 31, 2017
, the adjustable and hybrid adjustable rate mortgage loans underlying our Agency Securities have fixed-interest rates for an average period of approximately
9
months and
9
months, respectively, after which time the interest rates reset and become adjustable. After a reset date, interest rates on our adjustable and hybrid adjustable Agency Securities float based on spreads over various indices, typically LIBOR or the one-year constant maturity treasury rate. These interest rates are subject to caps that limit the amount the applicable interest rate can increase during any year, known as an annual cap and through the maturity of the security, known as a lifetime cap.
Credit Risk and Non-Agency Securities
We purchase Credit Risk and Non-Agency Securities at prices which incorporate our expectations for prepayment speeds, defaults, delinquencies and severities. These expectations determine the yields we receive on our assets. If actual prepayment speeds, defaults, delinquencies and severities are different from our expectations, our actual yields could be higher or lower.
The table below summarizes certain characteristics of our Credit Risk and Non-Agency Securities at
June 30, 2018
.
|
Asset Type
|
Principal Amount
|
Fair Value
|
Weighted Average Coupon
|
Weighted Average Month to Maturity
|
|||||||||
|
Credit Risk Transfer
|
$
|
752,694
|
|
$
|
859,562
|
|
6.59
|
%
|
106
|
||||
|
Legacy Prime Fixed
|
17,980
|
|
15,529
|
|
6.03
|
%
|
223
|
||||||
|
Legacy ALTA Fixed
|
62,166
|
|
51,126
|
|
5.85
|
%
|
230
|
||||||
|
Legacy Prime Hybrid
|
10,389
|
|
9,512
|
|
3.34
|
%
|
222
|
||||||
|
Legacy ALTA Hybrid
|
4,518
|
|
4,288
|
|
3.85
|
%
|
210
|
||||||
|
New Issue Prime Fixed
|
18,353
|
|
17,735
|
|
3.69
|
%
|
310
|
||||||
|
Total or Weighted Average
|
$
|
866,100
|
|
$
|
957,752
|
|
6.45
|
%
|
120
|
||||
The table below summarizes certain characteristics of our Credit Risk and Non-Agency Securities at
December 31, 2017
.
|
Asset Type
|
Principal Amount
|
Fair Value
|
Weighted Average Coupon
|
Weighted Average Month to Maturity
|
|||||||||
|
Credit Risk Transfer
|
$
|
764,172
|
|
$
|
870,494
|
|
6.05
|
%
|
112
|
||||
|
Legacy Prime Fixed
|
19,237
|
|
16,778
|
|
6.03
|
%
|
230
|
||||||
|
Legacy ALTA Fixed
|
65,920
|
|
54,727
|
|
5.85
|
%
|
237
|
||||||
|
Legacy Prime Hybrid
|
11,452
|
|
10,469
|
|
3.17
|
%
|
229
|
||||||
|
Legacy ALTA Hybrid
|
4,901
|
|
4,660
|
|
3.47
|
%
|
217
|
||||||
|
New Issue Prime Fixed
|
19,025
|
|
18,701
|
|
3.69
|
%
|
317
|
||||||
|
Total or Weighted Average
|
$
|
884,707
|
|
$
|
975,829
|
|
5.95
|
%
|
127
|
||||
53
ARMOUR Residential REIT, Inc.
Management’s Discussion and Analysis (continued)
Our Credit Risk and Non-Agency Securities are subject to risk of loss with regard to principal and interest payments and at
June 30, 2018
and
December 31, 2017
, have generally either been assigned below investment grade ratings by rating agencies, or have not been rated. We evaluate each investment based on the characteristics of the underlying collateral and securitization structure, rather than relying on the ratings assigned by rating agencies. The table below summarizes the credit ratings of our Credit Risk and Non-Agency Securities.
|
Investment Grade
|
Non-Investment Grade
|
Non-Rated
|
Total
|
|||||||||||||
|
June 30, 2018
|
$
|
337,094
|
|
$
|
570,959
|
|
$
|
49,699
|
|
$
|
957,752
|
|
||||
|
December 31, 2017
|
$
|
21,452
|
|
$
|
931,327
|
|
$
|
23,050
|
|
$
|
975,829
|
|
||||
Recognition of interest income commences on the settlement date of the purchase transaction and continues through the settlement date of the sale transaction. We did not have any investment related receivables or payables on Credit Risk and Non-Agency Securities at
June 30, 2018
or
December 31, 2017
.
The charts below present the percentage of our Credit Risk and Non-Agency Securities, at fair value, by type at
June 30, 2018
and at
December 31, 2017
.

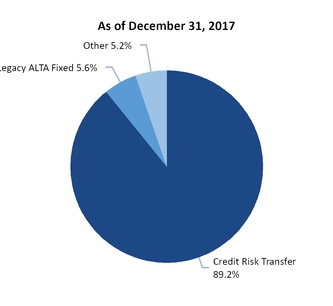
U.S. Treasury Securities
From time to time we may purchase U.S. Treasury Securities to tailor the overall risk characteristics of our investment securities portfolio. While U.S. Treasury Securities provide overall interest rate exposure, they are generally not sensitive to the other risks inherent in MBS. We did not have any U.S. Treasury Securities at
June 30, 2018
and
December 31, 2017
.
Repurchase Agreements
We have entered into repurchase agreements to finance most of our Agency Securities. Our repurchase agreements are secured by our Agency Securities and bear interest at rates that have historically moved in close relationship to the Federal Funds Rate and LIBOR. We have established borrowing relationships with numerous investment banking firms and other lenders,
26
and
32
of which had open repurchase agreements with us at
June 30, 2018
and
December 31, 2017
, respectively. We had outstanding balances under our repurchase agreements at
June 30, 2018
and
December 31, 2017
of
$6,254,189
and
$7,555,917
, respectively, consistent with the decrease in our Agency Securities in our securities portfolio.
54
ARMOUR Residential REIT, Inc.
Management’s Discussion and Analysis (continued)
Our repurchase agreements require excess collateral, known as a “haircut.” At
June 30, 2018
, the average haircut percentage was
6.12%
compared to
6.39%
at
December 31, 2017
. The change in the average haircut percentage reflects the financing of our Credit Risk and Non-Agency Securities.
Derivative Instruments
We use various interest rate contracts to manage our interest rate risk as we deem prudent in light of market conditions and the associated costs with counterparties that have a high quality credit rating and with futures exchanges. We generally pay a fixed rate and receive a floating rate with the objective of fixing a portion of our borrowing costs and hedging the change in our book value to some degree. The floating rate we receive is generally the Federal Funds Rate or LIBOR. Our policies do not contain specific requirements as to the percentages or amount of interest rate risk that we are required to hedge. At
June 30, 2018
and
December 31, 2017
, the notional value of our interest rate swap contracts was
108.9%
and
70.8%
, respectively, of the fair market value of the non-adjustable rate mortgages of our Agency Securities. For interest rate risk mitigation purposes, we consider Agency Securities to be ARMs if their interest rate is either currently subject to adjustment according to prevailing rates or if they are within 18 months of the period where such adjustments will occur. No assurance can be given that our derivatives will have the desired beneficial impact on our results of operations or financial condition. We have not elected cash flow hedge accounting treatment as allowed by GAAP. Since we do not designate our derivative activities as cash flow hedges, realized as well as unrealized gains/losses from these transactions will impact our GAAP earnings.
Use of derivative instruments may fail to protect or could adversely affect us because, among other things:
|
•
|
available derivatives may not correspond directly with the interest rate risk for which protection is sought (e.g., the difference in interest rate movements for long-term U.S. Treasury Securities compared to Agency Securities);
|
|
•
|
the duration of the derivatives may not match the duration of the related liability;
|
|
•
|
the counterparty to a derivative agreement with us may default on its obligation to pay or not perform under the terms of the agreement and the collateral posted may not be sufficient to protect against any consequent loss;
|
|
•
|
we may lose collateral we have pledged to secure our obligations under a derivative agreement if the associated counterparty becomes insolvent or files for bankruptcy;
|
|
•
|
we may experience a termination event under one or more of our derivative agreements related to our REIT status, equity levels and performance, which could result in a payout to the associated counterparty and a taxable loss to us;
|
|
•
|
the credit-quality of the party owing money on the derivatives may be downgraded to such an extent that it impairs our ability to sell or assign our side of the hedging transaction; and
|
|
•
|
the value of derivatives may be adjusted from time to time in accordance with GAAP to reflect changes in fair value; downward adjustments, or “mark-to-market losses,” would reduce our net income or increase any net loss.
|
The following graphs present the notional and weighted average interest rate of our hedging portfolio by year of maturity.
55
ARMOUR Residential REIT, Inc.
Management’s Discussion and Analysis (continued)
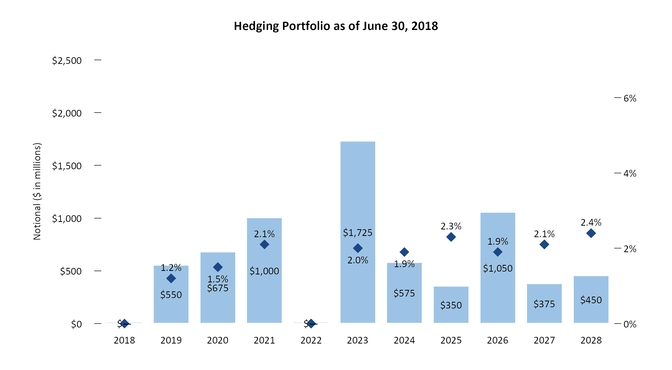
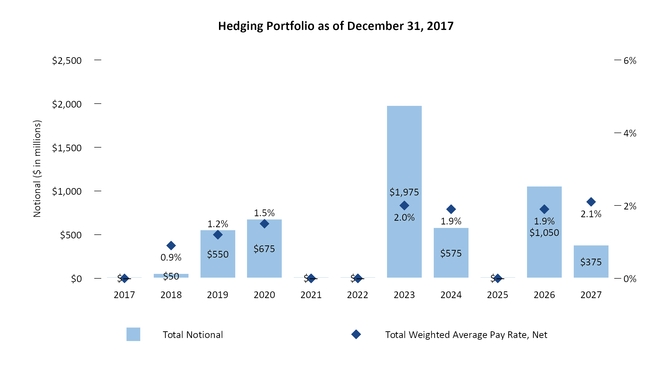
At
June 30, 2018
and
December 31, 2017
, we had derivatives with a net fair value of
$173,686
and
$29,263
, respectively. At
June 30, 2018
and
December 31, 2017
, we had interest rate swap contracts with an aggregate notional balance of
$6,750,000
and
$5,250,000
. We also had TBA Agency Securities with an aggregate notional balance of
$2,100,000
and
56
ARMOUR Residential REIT, Inc.
Management’s Discussion and Analysis (continued)
$1,600,000
at
June 30, 2018
and
December 31, 2017
, respectively. Counterparty risk of interest rate swap contracts and interest rate swaptions are limited to some degree because of daily mark-to-market and collateral requirements. These derivative transactions are designed to lock in a portion of funding costs for financing activities associated with our assets in such a way as to help assure the realization of attractive net interest margins and to vary inversely in value with our Agency Securities. Such contracts are based on assumptions about prepayments which, if not realized, will cause results to differ from expectations.
Although we attempt to structure our derivatives to offset the changes in asset prices, the complexity of the actual and expected pre-payment characteristics of the underlying mortgages as well as the volatility in mortgage interest rates relative to U.S. Treasury and interest rate swap contract rates makes achieving high levels of off-set difficult. We recognized net gains of
$30,713
and
$89,310
, related to our derivatives for the
three and six months ended
June 30, 2018
and losses of
$(21,148)
and
$(9,629)
at
June 30, 2017
, respectively. For the
three and six months ended
June 30, 2018
, the net unrealized gain (loss) of our Agency Securities decreased by
$(49,587)
and
$(194,997)
, respectively. For the
three and six months ended
June 30, 2017
, the net unrealized gain (loss) of our Agency Securities increased by
$15,182
and
$21,296
, respectively. The net unrealized gain (loss) on Agency Securities is due to market price fluctuations.
As required by the Dodd-Frank Act, the Commodity Futures Trading Commission has adopted rules requiring certain interest rate swap contracts to be cleared through a derivatives clearing organization. We are required to clear certain new interest rate swap contracts. Cleared interest rate swaps may have higher margin requirements than un-cleared interest rate swaps we previously had. We have established an account with a futures commission merchant for this purpose. To date, we have not entered into any cleared interest rate swap contracts.
We are required to account for our TBA Agency Securities as derivatives when it is reasonably possible that we will not take or make timely physical delivery of the related securities. However, from time to time, we use TBA Agency Securities primarily to effectively establish and finance portfolio positions. See the section, Agency Securities, Interest-Only Securities and TBA Agency Securities above.
Contractual Obligations and Commitments
We had the following contractual obligations at
June 30, 2018
:
|
|
Payments Due By Period
|
|||||||||||||||||||
|
Obligations
|
Total
|
Less Than
1 Year
|
2-3 Years
|
4-5 Years
|
Greater Than 5 Years
|
|||||||||||||||
|
Repurchase agreements
|
$
|
6,254,189
|
|
$
|
6,254,189
|
|
$
|
—
|
|
$
|
—
|
|
$
|
—
|
|
|||||
|
Interest expense on repurchase agreements
|
14,551
|
|
14,551
|
|
—
|
|
—
|
|
—
|
|
||||||||||
|
Related Party Fees
(1)
|
190,085
|
|
27,155
|
|
54,310
|
|
54,310
|
|
54,310
|
|
||||||||||
|
Board of Directors fees
(2)
|
8,288
|
|
1,184
|
|
2,368
|
|
2,368
|
|
2,368
|
|
||||||||||
|
Total
|
$
|
6,467,113
|
|
$
|
6,297,079
|
|
$
|
56,678
|
|
$
|
56,678
|
|
$
|
56,678
|
|
|||||
(1) Represents fees to be paid to ACM under the terms of the Management Agreements (Refer to
Note 10
and
Note 15
to the consolidated financial statements).
(2) Represents compensation to be paid to the Board in the form of cash and common equity.
We had contractual commitments under derivatives at
June 30, 2018
. We had interest rate swap contracts with an aggregate notional balance of
$6,750,000
, a weighted average swap rate of
1.91%
and a weighted average term of
63
months at
June 30, 2018
.
57
ARMOUR Residential REIT, Inc.
Management’s Discussion and Analysis (continued)
Liquidity and Capital Resources
Net cash provided by operating activities was
$17,277
and
$59,532
, respectively, for the
six months ended
June 30, 2018
and
June 30, 2017
. Our average securities portfolio was
$9,939,789
and
$8,916,626
, respectively, for the
six months ended
June 30, 2018
and
June 30, 2017
, respectively.
At
June 30, 2018
, we financed our securities portfolio with
$6,254,189
of borrowings under repurchase agreements. Our leverage ratio at
June 30, 2018
, was
5.18
:1. At
June 30, 2018
, we had a leverage ratio of
6.56
:1 including TBA Agency Securities purchased forward and excluding debt related to forward settling sales. At
June 30, 2018
, our liquidity totaled
$676,125
, consisting of
$335,548
of cash plus
$340,577
of unpledged Agency Securities (including securities received as collateral). Our primary sources of funds are borrowings under repurchase arrangements, monthly principal and interest payments on our Agency Securities and cash generated from our operating results. Other sources of funds may include proceeds from equity and debt offerings and asset sales. We generally maintain liquidity to pay down borrowings under repurchase arrangements to reduce borrowing costs and otherwise efficiently manage our long-term investment capital. Because the level of our borrowings can be adjusted on a daily basis, the level of cash carried on our consolidated balance sheet is significantly less important than our potential liquidity available under our borrowing arrangements.
In addition to the repurchase agreement financing discussed above, from time to time we have entered into reverse repurchase agreements with certain of our repurchase agreement counterparties. Under a typical reverse repurchase agreement, we purchase U.S. Treasury Securities from a borrower in exchange for cash and agree to sell the same securities back in the future. We then sell such U.S. Treasury Securities to third parties and recognize a liability to return the securities to the original borrower. Reverse repurchase agreement receivables and repurchase agreement liabilities are presented net when they meet certain criteria, including being with the same counterparty, being governed by the same MRA, settlement through the same brokerage or clearing account and maturing on the same day. The practical effect of these transactions is to replace a portion of our repurchase agreement financing of our Agency Securities in our securities portfolio with short positions in U.S. Treasury Securities. We believe that this helps to reduce interest rate risk, and therefore counterparty credit and liquidity risk. We did not have any reverse repurchase agreements outstanding at
June 30, 2018
and
December 31, 2017
.
Both parties to the repurchase and reverse repurchase transactions have the right to make daily margin calls based on changes in the value of the collateral obtained and/or pledged.
We currently believe that we have sufficient liquidity and capital resources available for the acquisition of additional investments, repayments on repurchase borrowings, reacquisition of securities to be returned to borrowers and the payment of cash dividends as required for continued qualification as a REIT.
Our primary uses of cash are to purchase MBS, pay interest and principal on our borrowings, fund our operations and pay dividends. From time to time, we purchase or sell assets for forward settlement up to 90 days in the future to lock in purchase prices or sales proceeds.
During the
six months ended
June 30, 2018
, we purchased
$2,360,577
of securities using proceeds from repurchase agreements and principal repayments. Of this amount,
$462,325
was payable at
June 30, 2018
. During the
six months ended
June 30, 2018
, we received cash of
$348,226
from prepayments and scheduled principal payments on our securities. We had a net cash decrease from our repurchase agreements of
$1,301,728
for the
six months ended
June 30, 2018
and made cash interest payments of approximately
$91,941
on our liabilities for the
six months ended
June 30, 2018
. Part of funding our operations includes providing margin cash to offset liability balances on our derivatives. We recovered
$7,509
of cash collateral posted to counterparties at
June 30, 2018
and increased our liability by
$132,341
for cash collateral posted by counterparties at
June 30, 2018
.
During the
six months ended
June 30, 2017
, we purchased
$3,493,256
of securities using proceeds from repurchase agreements and principal repayments. Of this amount,
$828,642
was payable at
June 30, 2017
. During the
six months ended
June 30, 2017
, we received cash of
$518,094
from prepayments and scheduled principal payments on our securities. We had a net cash increase from our repurchase agreements of
$522,651
for the
six months ended
June 30, 2017
and made cash interest payments of approximately
$57,131
on our liabilities for the
six months ended
June 30, 2017
. Part of funding our
58
ARMOUR Residential REIT, Inc.
Management’s Discussion and Analysis (continued)
operations includes providing margin cash to offset liability balances on our derivatives. We recovered $21,849 of cash collateral posted to counterparties at
June 30, 2017
and decreased our liability by $1,425 for cash collateral posted by counterparties at
June 30, 2017
.
We have continued to pursue additional lending counterparties in order to help increase our financial flexibility and ability to withstand periods of contracting liquidity in the credit markets.
Repurchase Agreements
Declines in the value of our Agency securities portfolio can trigger margin calls by our lenders under our repurchase agreements. An event of default or termination event under the standard MRA would give our counterparty the option to terminate all repurchase transactions existing with us and require any amount due to be payable immediately.
Changing capital or other financial market regulatory requirements may cause our lenders to exit the repurchase market, increase financing rates, tighten lending standards or increase the amount of required equity capital or haircut we post, any of which could make it more difficult or costly for us to obtain financing.
Financial sector volatility can also lead to increased demand and prices for high quality debt securities, including Agency Securities. While increased prices may increase the value of our Agency Securities, higher values may also reduce the return on reinvestment of capital, thereby lowering our future profitability.
The following graph represents the outstanding balances of our repurchase agreements (before the effect of netting reverse repurchase agreements), which finance most of our Agency Securities. Our repurchase agreements balance will fluctuate based on our change in capital, leverage targets and the market prices of our assets. The balance of repurchase agreements outstanding will fluctuate within any given month based on changes in the market value of the particular Agency Security pledged as collateral (including the effects of principal paydowns) and the level and timing of investment and reinvestment activity.

59
ARMOUR Residential REIT, Inc.
Management’s Discussion and Analysis (continued)
At June 30, 2018 and December 31, 2017, BUCKLER Securities LLC, (“BUCKLER”) accounted for 49.0% and 38.4% of our aggregate borrowings and had an amount at risk of 10.6% and 9.0%, respectively, of our total stockholders’ equity with a weighted average maturity of 25 days and 70 day, respectively, on repurchase agreements.
We have purchased a 10% equity ownership interest in BUCKLER and additionally, provided it with an aggregate of $105.0 million in subordinated loans which qualify as regulatory capital. Our Audit Committee reviewed, approved and authorized these BUCKLER agreements as related party transactions under Item 404 of Regulation S-K, which approval was subject to approval by our independent directors. Our independent directors separately and simultaneously authorized and approved these agreements and transactions. Our borrowings from BUCKLER and BUCKLER’s operating results are periodically reviewed by our Audit Committee and independent directors.
The primary purpose of our investment in BUCKLER is to facilitate our access to repurchase financing, on potentially attractive terms (considering rate, term, size, haircut, relationship and funding commitment) compared to other suitable repurchase financing counterparties.
See
Note 8
and
Note 15
to the consolidated financial statements for more information.
Effects of Margin Requirements, Leverage and Credit Spreads
Our MBS have values that fluctuate according to market conditions and, as discussed above, the market value of our MBS will decrease as prevailing interest rates or credit spreads increase. When the value of the securities pledged to secure a repurchase agreement decreases to the point where the positive difference between the collateral value and the loan amount is less than the haircut, our lenders may issue a margin call, which means that the lender will require us to pay the margin call in cash or pledge additional collateral to meet that margin call. Under our repurchase facilities, our lenders have full discretion to determine the value of the MBS we pledge to them. Most of our lenders will value securities based on recent trades in the market. Lenders also issue margin calls as the published current principal balance factors change on the pool of mortgages underlying the securities pledged as collateral when scheduled and unscheduled principal repayments are announced monthly.
We experience margin calls in the ordinary course of our business and under certain conditions, such as during a period of declining market value for MBS and we may experience margin calls as frequently as daily. In seeking to effectively manage the margin requirements established by our lenders, we maintain a position of cash and unpledged securities. We refer to this position as our liquidity. The level of liquidity we have available to meet margin calls is directly affected by our leverage levels, our haircuts and the price changes on our securities. If interest rates increase as a result of a yield curve shift or for another reason or if credit spreads widen, the prices of our collateral (and our unpledged assets that constitute our liquidity) will decline and we may experience margin calls. We will use our liquidity to meet such margin calls. There can be no assurance that we will maintain sufficient levels of liquidity to meet any margin calls. If our haircuts increase, our liquidity will proportionately decrease. If we increase our borrowings, our liquidity will decrease by the amount of additional haircut on the increased level of indebtedness. In addition, certain of our MRAs contain a restriction that prohibits our leverage from exceeding twelve times our stockholders’ equity as well as termination events in the case of significant reductions in equity capital.
We intend to maintain a level of liquidity in relation to our assets that enables us to meet reasonably anticipated margin calls but that also allows us to be substantially invested in MBS. We may misjudge the appropriate amount of our liquidity by maintaining excessive liquidity, which would lower our investment returns, or by maintaining insufficient liquidity, which would force us to involuntarily liquidate assets into unfavorable market conditions and harm our results of operations and financial condition.
We generally seek to borrow (on a recourse basis) between six and ten times the amount of our total stockholders’ equity. At
June 30, 2018
and
December 31, 2017
, our total borrowings were
$6,254,189
and
$7,555,917
(excluding accrued interest), respectively. At
June 30, 2018
and
December 31, 2017
, we had a leverage ratio of approximately
5.18
:1 and
5.70:1
, respectively. At
June 30, 2018
, we had a leverage ratio of
6.56
:1 including TBA Agency Securities purchased forward and excluding debt related to forward settling sales. At
December 31, 2017
, we had a leverage ratio of
6.96
:1 including TBA Agency Securities purchased forward and excluding debt related to forward settling sales.
60
ARMOUR Residential REIT, Inc.
Management’s Discussion and Analysis (continued)
Forward-Looking Statements Regarding Liquidity
Based on our current portfolio, leverage rate and available borrowing arrangements, we believe that our cash flow from operations and our ability to make timely portfolio adjustments, will be sufficient to enable us to meet anticipated short-term (one year or less) liquidity requirements such as to fund our investment activities, meet our financing obligations, pay fees under the management agreements and fund our distributions to stockholders and pay general corporate expenses.
We may increase our capital resources by obtaining long-term credit facilities or making public or private offerings of equity or debt securities, including classes of preferred stock, common stock and senior or subordinated notes to meet our long-term (greater than one year) liquidity. Such financing will depend on market conditions for capital raises and for the investment of any proceeds and there can be no assurances that we will successfully obtain any such financing.
Stockholders’ Equity
See
Note 12
to the consolidated financial statements.
Off-Balance Sheet Arrangements
At
June 30, 2018
and
December 31, 2017
, we had not maintained any relationships with unconsolidated entities or financial partnerships, such as entities often referred to as structured finance, or special purpose or variable interest entities, established for the purpose of facilitating off-balance sheet arrangements or other contractually narrow or limited purposes. Furthermore, at
June 30, 2018
and
December 31, 2017
, we had not guaranteed any obligations of any unconsolidated entities or entered into any commitment or intent to provide funding to any such entities.
Critical Accounting Policies
See
Note 3
to the consolidated financial statements for our significant accounting policies.
Valuation of Investments in Securities
We carry our MBS and derivatives at fair value. Our Agency Securities are classified as available for sale, and therefore unrealized changes in fair value are reflected directly in total stockholders' equity as accumulated other comprehensive income or loss. Our Credit Risk and Non-Agency Securities and Interest-Only Securities are classified as trading securities, and therefore changes in fair value are reported in the consolidated statements of operations as income or loss. We do not use hedge accounting for our derivatives for financial reporting purposes and therefore changes in fair value are reflected in net income as other gain or loss. To the extent that fair value changes on derivatives offset fair value changes in our MBS, the fluctuation in our stockholders’ equity will be lower. For example, rising interest rates may tend to result in an overall increase in our reported net income even while our total stockholders’ equity declines.
Fair value for the Agency Securities and Interest-Only Securities in our securities portfolio is based on obtaining a valuation for each Agency Security from third party pricing services and/or dealer quotes. The third party pricing services use common market pricing methods that may include pricing models that may incorporate such factors as coupons, prepayment speeds, spread to the Treasury curves and interest rate swap curves, duration, periodic and life caps and credit enhancement. If the fair value of an Agency Security is not available from the third party pricing services or such data appears unreliable, we obtain pricing indications from up to three dealers who make markets in similar Agency Securities. Management reviews pricing used to ensure that current market conditions are properly reflected. This review includes, but is not limited to, comparisons of similar market transactions or alternative third party pricing services, dealer pricing indications and comparisons to a third party pricing model.
The fair values of our derivatives are valued using information provided by third party pricing services that incorporate common market pricing methods that may include current interest rate curves, forward interest rate curves and market spreads
61
ARMOUR Residential REIT, Inc.
Management’s Discussion and Analysis (continued)
to interest rate curves. Management compares pricing information received to dealer quotes to ensure that the current market conditions are properly reflected.
Fair value for the Credit Risk and Non-Agency Securities in our securities portfolio is based on obtaining a valuation for each Credit Risk and Non-Agency Security from third party pricing services and/or dealer quotes. The third party pricing services incorporate such factors as collateral type, bond structure and priority of payments, coupons, prepayment speeds, defaults, delinquencies and severities. If the fair value of a Credit Risk and Non-Agency Security is not available from the third party pricing services or such data appears unreliable, we obtain pricing indications from up to three dealers who make markets in similar Credit Risk and Non-Agency Securities. Management reviews pricing used to ensure that current market conditions are properly reflected. This review includes, but is not limited to, comparisons of similar market transactions or alternative third party pricing services, dealer pricing indications and comparisons to a third party pricing model.
Fair value for the U.S. Treasury Securities in our securities portfolio is based on obtaining a valuation for each U.S. Treasury Securities from third party pricing services and/or dealer quotes.
Realized Gains and Losses on Agency Securities
Security purchase and sale transactions, including purchases and sales for forward settlement, are recorded on the trade date to the extent it is probable that we will take or make timely physical delivery of the related securities. Gains or losses realized from the sale of securities are included in income and are determined using the specific identification method. We realize gains and losses on our Agency Securities upon their sale. At that time, previously unrealized amounts included in accumulated other comprehensive income are reclassified and reported in net income as other gain or loss. To the extent that we sell Agency Securities in later periods after changes in the fair value of those Agency Securities have occurred, we may report significant net income or net loss without a corresponding change in our total stockholders' equity.
Declines in the fair values of our Agency Securities that represent other than temporary impairments are also treated as realized losses and reported in net income as other loss. We evaluate Agency Securities for other than temporary impairment at least on a quarterly basis and more frequently when economic or market concerns warrant such evaluation. We consider an impairment to be other than temporary if we (1) have the intent to sell the Agency Securities, (2) believe it is more likely than not that we will be required to sell the securities before recovery (for example, because of liquidity requirements or contractual obligations), or (3) a credit loss exists. Impairment losses recognized establish a new cost basis for the related Agency Securities. Gains or losses on subsequent sales are determined by reference to such new cost basis.
Gains and Losses on Credit Risk and Non-Agency Securities, Interest-Only Securities and U.S. Treasury Securities
We carry our Credit Risk and Non-Agency Securities and Interest-Only Securities at fair value and reflect changes in those fair values in net income as other gains and losses.
We carry our U.S. Treasury Securities at fair value and reflect changes in those fair values in net income as other gains and losses.
Inflation
Virtually all of our assets and liabilities are interest rate-sensitive in nature. As a result, interest rates and other factors influence our performance far more than inflation. Changes in interest rates do not necessarily correlate with inflation rates or changes in inflation rates. Our financial statements are prepared in accordance with GAAP and any distributions we may make will be determined by our Board based in part on our REIT taxable income as calculated according to the requirements of the Code; in each case, our activities and balance sheet are measured with reference to fair value without considering inflation.
62
ARMOUR Residential REIT, Inc.
Management’s Discussion and Analysis (continued)
Subsequent Events
See
Note 17
to the consolidated financial statements.
Cautionary Note Regarding Forward-Looking Statements
This report contains various “forward-looking statements.” Forward-looking statements relate to expectations, beliefs, projections, future plans and strategies, anticipated events or trends and similar expressions concerning matters that are not historical facts. In some cases, you can identify forward-looking statements by the use of forward-looking terminology such as “believes,” “expects,” “may,” “will,” “would,” “could,” “should,” “seeks,” “approximately,” “intends,” “plans,” “projects,” “estimates” or “anticipates” or the negative of these words and phrases or similar words or phrases. All forward-looking statements may be impacted by a number of risks and uncertainties, including statements regarding the following subjects:
|
•
|
our business and investment strategy;
|
|
•
|
our anticipated results of operations;
|
|
•
|
statements about future dividends;
|
|
•
|
our ability to obtain financing arrangements;
|
|
•
|
our understanding of our competition and ability to compete effectively;
|
|
•
|
market, industry and economic trends; and
|
|
•
|
interest rates.
|
The forward-looking statements in this report are based on our beliefs, assumptions and expectations of our future performance, taking into account all information currently available to us. These beliefs, assumptions and expectations are subject to risks and uncertainties and can change as a result of many possible events or factors, not all of which are known to us. If a change occurs, our business, financial condition, liquidity and results of operations may vary materially from those expressed in our forward-looking statements. You should carefully consider these risks before you make an investment decision with respect to our stock, along with the following factors that could cause actual results to vary from our forward-looking statements:
|
•
|
the impact of the federal conservatorship of Fannie Mae and Freddie Mac and related efforts, along with any changes in laws and regulations affecting the relationship between Fannie Mae and Freddie Mac and the federal government and the Fed system;
|
|
•
|
the possible material adverse effect on our business if the U.S. Congress passed legislation reforming or winding down Fannie Mae or Freddie Mac;
|
|
•
|
mortgage loan modification programs and future legislative action;
|
|
•
|
actions by the Fed which could cause a flattening of the yield curve, which could materially adversely affect our business, financial condition and results of operations and our ability to pay distributions to our stockholders;
|
|
•
|
the impact of a delay or failure of the U.S. Government in reaching an agreement on the national debt ceiling;
|
|
•
|
availability, terms and deployment of capital;
|
|
•
|
changes in economic conditions generally;
|
|
•
|
changes in interest rates, interest rate spreads and the yield curve or prepayment rates;
|
|
•
|
general volatility of the financial markets, including markets for mortgage securities;
|
|
•
|
the downgrade of the U.S. Government's or certain European countries' credit ratings and future downgrades of the U.S. Government's or certain European countries' credit ratings may materially adversely affect our business, financial condition and results of operations;
|
|
•
|
inflation or deflation;
|
|
•
|
availability of suitable investment opportunities;
|
|
•
|
the degree and nature of our competition, including competition for MBS;
|
|
•
|
changes in our business and investment strategy;
|
|
•
|
our failure to maintain an exemption from being regulated as a commodity pool operator;
|
|
•
|
our dependence on ACM and ability to find a suitable replacement if ACM was to terminate its management relationship with us;
|
63
ARMOUR Residential REIT, Inc.
Management’s Discussion and Analysis (continued)
|
•
|
the existence of conflicts of interest in our relationship with ACM, certain of our directors and our officers, which could result in decisions that are not in the best interest of our stockholders;
|
|
•
|
our management's competing duties to other affiliated entities, which could result in decisions that are not in the best interest of our stockholders;
|
|
•
|
changes in personnel at ACM or the availability of qualified personnel at ACM;
|
|
•
|
limitations imposed on our business by our status as a REIT under the Code;
|
|
•
|
the potential burdens on our business of maintaining our exclusion from the 1940 Act and possible consequences of losing that exemption;
|
|
•
|
changes in GAAP, including interpretations thereof; and
|
|
•
|
changes in applicable laws and regulations.
|
We cannot guarantee future results, levels of activity, performance or achievements. You should not place undue reliance on forward-looking statements, which apply only as of the date of this report. We do not intend and disclaim any duty or obligation to update or revise any industry information or forward-looking statements set forth in this report to reflect new information, future events or otherwise, except as required by law.
64
ARMOUR Residential REIT, Inc.
Management’s Discussion and Analysis (continued)
Glossary of Terms:
“Agency Securities” means securities issued or guaranteed by a GSE, such as Fannie Mae, Freddie Mac or a government agency such as Ginnie Mae
“ARMs” means Adjustable Rate Mortgage backed securities.
“Basis swap contracts” means derivative contracts that allow us to exchange one floating interest rate basis for another, for example, 3 month LIBOR and Fed Funds Rates, thereby allowing us to diversify our floating rate basis exposures.
“Board” means ARMOUR’s Board of Directors.
“BUCKLER” means BUCKLER Securities, LLC, a Delaware limited liability company, and a FINRA-regulated broker-dealer. The primary purpose of our investment in BUCKLER is to facilitate our access to repurchase financing, on potentially attractive terms (considering rate, term, size, haircut, relationship and funding commitment) compared to other suitable repurchase financing counterparties.
“CMBS” means commercial mortgage backed securities.
“Code” means the Internal Revenue Code of 1986.
“Common stock DRIP” means the Company's dividend reinvestment and stock purchase plan
“CPR” means constant prepayment rate.
“Dodd-Frank Act” means the Dodd-Frank Wall Street Reform and Consumer Protection Act.
“Exchange Act” means the Securities Exchange Act of 1934.
“Fannie Mae” means the Federal National Mortgage Association.
“Fed” means the U.S. Federal Reserve.
“FINRA” means the Financial Industry Regulatory Authority
“Freddie Mac” means the Federal Home Loan Mortgage Corporation.
“GAAP” means accounting principles generally accepted in the United States of America.
“Ginnie Mae” means the Government National Mortgage Administration.
“GSE” means U.S. Government Sponsored Entity. Obligations of agencies originally established or chartered by the U.S. government to serve public purposes as specified by the U.S. Congress; these obligations are not explicitly guaranteed as to the timely payment of principal and interest by the full faith and credit of the U.S. government.
“Haircut” means the weighted average margin requirement, or the percentage amount by which the collateral value must exceed the loan amount. Among other things, it is a measure of our unsecured credit risk to our lenders.
“Hybrid” means a mortgage that has a fixed rate for an initial term after which the rate becomes adjustable according to a specific schedule.
“Interest-Only Securities” means the interest portion of Agency Securities, which is separated and sold individually from the principal portion of the same payment.
“JAVELIN” means JAVELIN Mortgage Investment Corp., formerly a publicly-traded REIT. Since its acquisition on April 6, 2016, JAVELIN became a wholly-owned, qualified REIT subsidiary of ARMOUR and continues to be managed by ACM pursuant to the pre-existing management agreement between JAVELIN and ACM.
65
ARMOUR Residential REIT, Inc.
Management’s Discussion and Analysis (continued)
“LIBOR” means the London Interbank Offered Rate.
“MBS” means mortgage backed securities, a security representing a direct interest in a pool of mortgage loans. The pass-through issuer or servicer collects the payments on the loans in the pool and “passes through” the principal and interest to the security holders on a pro rata basis.
“Merger” means the merger of JMI Acquisition Corporation, a wholly-owned subsidiary that was formed for the purpose of acquiring JAVELIN.
“MRA” means master repurchase agreement. A document that outlines standard terms between the Company and counterparties for repurchase agreement transactions.
“Multi-Family MBS” means MBS issued under Fannie Mae's Delegated Underwriting System (DUS) program.
“Credit Risk and Non-Agency Securities” means securities backed by residential mortgages in which we may invest, for which are not guaranteed by Fannie Mae, Freddie Mac or Ginnie Mae.
“REIT” means Real Estate Investment Trust. A special purpose investment vehicle that provides investors with the ability to participate directly in the ownership or financing of real-estate related assets by pooling their capital to purchase and manage mortgage loans and/or income property.
“Repurchase Program” means the Company's common stock repurchase program authorized by our Board.
“SEC” means the Securities and Exchange Commission.
“TBA Agency Securities” means forward contracts for the purchase (“long position”) or sale (“short position”) of Agency Securities at a predetermined price, face amount, issuer, coupon and stated maturity on an agreed-upon future date.
“Tender Offer” means the tender offer by Acquisition to purchase all of the outstanding common stock of JAVELIN.
“U.S.” means United States.
“1940 Act” means the Investment Company Act of 1940.
66
ARMOUR Residential REIT, Inc.
We seek to manage our risks related to the credit-quality of our assets, interest rates, liquidity, prepayment speeds and market value while, at the same time, seeking to provide an opportunity to stockholders to realize attractive risk adjusted returns through ownership of our capital stock. While we do not seek to avoid risk completely, we believe the risk can be quantified from historical experience and seek to actively manage that risk, to earn sufficient compensation to justify taking those risks and to maintain capital levels consistent with the risks we undertake.
Interest Rate, Cap and Mismatch Risk
A portion of our securities portfolio consists of hybrid adjustable rate and adjustable rate MBS. Hybrid mortgages are ARMs that have a fixed-interest rate for an initial period of time (typically three years or greater) and then convert to an adjustable rate for the remaining loan term. Our debt obligations are generally repurchase agreements of limited duration that are periodically refinanced at current market rates.
ARMs are typically subject to periodic and lifetime interest rate caps that limit the amount the interest rate can change during any given period. ARMs are also typically subject to a minimum interest rate payable. Our borrowings are not subject to similar restrictions. Hence, in a period of increasing interest rates, interest rates on our borrowings could increase without limitation, while the interest rates on our mortgage related assets could be limited. This exposure would be magnified to the extent we acquire fixed rate MBS or ARMs that are not fully indexed. Furthermore, some ARMs may be subject to periodic payment caps that result in some portion of the interest being deferred and added to the principal outstanding. These factors could lower our net interest income or cause a net loss during periods of rising interest rates, which would negatively impact our liquidity, net income and our ability to make distributions to stockholders.
We fund the purchase of a substantial portion of our ARMs with borrowings that have interest rates based on indices and repricing terms similar to, but of shorter maturities than, the interest rate indices and repricing terms of our mortgage assets. Thus, we anticipate that in most cases the interest rate indices and repricing terms of our mortgage assets and our funding sources will not be identical, thereby creating an interest rate mismatch between assets and liabilities. During periods of changing interest rates, such interest rate mismatches could negatively impact our net interest income, dividend yield and the market price of our stock. Most of our adjustable rate assets are based on the one-year constant maturity treasury rate and the one-year LIBOR rate and our debt obligations are generally based on LIBOR. These indices generally move in the same direction, but there can be no assurance that this will continue to occur.
Our ARMs and borrowings reset at various different dates for the specific asset or obligation. In general, the repricing of our debt obligations occurs more quickly than on our assets. Therefore, on average, our cost of funds may rise or fall more quickly than our earnings rate on our assets.
Furthermore, our net income may vary somewhat as the spread between one-month interest rates, the typical term for our repurchase agreements and six-month and twelve-month interest rates, the typical reset term of ARMs, varies.
Prepayment Risk
As we receive repayments of principal on our Agency Securities from prepayments and scheduled payments, premiums paid on such securities are amortized against interest income and discounts are accreted to interest income as realized. Premiums arise when we acquire Agency Securities at prices in excess of the principal balance of the mortgage loans underlying such Agency Securities. Conversely, discounts arise when we acquire Agency Securities at prices below the principal balance of the mortgage loans underlying such Agency Securities. Volatility in actual prepayment speeds will create volatility in the amount of premium amortization we recognize. Higher speeds will reduce our interest income and lower speeds will increase our interest income.
67
ARMOUR Residential REIT, Inc.
Market Risk Disclosures (continued)
Credit Risk for Credit Risk and Non-Agency Securities
We purchase Credit Risk and Non-Agency Securities at prices which incorporate our expectations for prepayment speeds, defaults, delinquencies and severities. These expectations determine the yields we receive on our assets. If actual prepayment speeds, defaults, delinquencies and severities are different from our expectations, our actual yields could be higher or lower.
Our Credit Risk and Non-Agency Securities are subject to risk of loss with regard to principal and interest payments and at
June 30, 2018
and
December 31, 2017
, have generally either been assigned below investment grade ratings by rating agencies, or have not been rated. We evaluate each investment based on the characteristics of the underlying collateral and securitization structure, rather than relying on the ratings assigned by rating agencies.
Interest Rate Risk and Effect on Market Value Risk
Another component of interest rate risk is the effect changes in interest rates will have on the market value of our MBS. We face the risk that the market value of our MBS will increase or decrease at different rates than that of our liabilities, including our derivative instruments.
We primarily assess our interest rate risk by estimating the effective duration of our assets and the effective duration of our liabilities and by estimating the time difference between the interest rate adjustment of our assets and the interest rate adjustment of our liabilities. Effective duration essentially measures the market price volatility of financial instruments as interest rates change. We generally estimate effective duration using various financial models and empirical data. Different models and methodologies can produce different effective duration estimates for the same securities.
The sensitivity analysis tables presented below reflect the estimated impact of an instantaneous parallel shift in the yield curve, up and down 50 and 100 basis points, on the market value of our interest rate-sensitive investments and net interest income, at
June 30, 2018
and
December 31, 2017
. It assumes that the spread between the interest rates on Agency Securities and long term U.S. Treasury Securities remains constant. Actual interest rate movements over time will likely be different, and such differences may be material. When evaluating the impact of changes in interest rates, prepayment assumptions and principal reinvestment rates are adjusted based on ACM’s expectations. The analysis presented utilized assumptions, models and estimates of ACM based on ACM's judgment and experience.
June 30, 2018
|
Percentage Change in Projected
|
||||||
|
Change in Interest Rates
|
Net Interest Income
|
Portfolio Value
Including Derivatives
|
Shareholder's Equity Including Hedges
|
|||
|
1.00%
|
8.18%
|
(0.69)%
|
(5.28)%
|
|||
|
0.50%
|
4.22%
|
(0.23)%
|
(1.77)%
|
|||
|
(0.50)%
|
(4.94)%
|
(0.12)%
|
(0.89)%
|
|||
|
(1.00)%
|
(10.68)%
|
(0.67)%
|
(5.14)%
|
|||
68
ARMOUR Residential REIT, Inc.
Market Risk Disclosures (continued)
December 31, 2017
|
Percentage Change in Projected
|
||||||
|
Change in Interest Rates
|
Net Interest Income
|
Portfolio Value
Including Derivatives |
Shareholder's Equity Including Hedges
|
|||
|
1.00%
|
13.20%
|
(1.33)%
|
(10.39)%
|
|||
|
0.50%
|
7.13%
|
(0.54)%
|
(4.17)%
|
|||
|
(0.50)%
|
(5.97)%
|
0.20%
|
1.58%
|
|||
|
(1.00)%
|
(13.11)%
|
0.08%
|
0.59%
|
|||
While the tables above reflect the estimated immediate impact of interest rate increases and decreases on a static securities portfolio, we rebalance our securities portfolio from time to time either to seek to take advantage of or reduce the impact of changes in interest rates. It is important to note that the impact of changing interest rates on market value and net interest income can change significantly when interest rates change beyond 100 basis points from current levels. Therefore, the volatility in the market value of our assets could increase significantly when interest rates change beyond amounts shown in the tables above. In addition, other factors impact the market value of and net interest income from our interest rate-sensitive investments and derivative instruments, such as the shape of the yield curve, market expectations as to future interest rate changes and other market conditions. Accordingly, interest income would likely differ from that shown above and such difference might be material and adverse to our stockholders.
The above tables quantify the potential changes in net interest income and securities portfolio value, which includes the value of our derivatives, should interest rates immediately change. Given the low level of interest rates at
June 30, 2018
and
December 31, 2017
, we applied a floor of 0% for all anticipated interest rates included in our assumptions. Due to the presence of this floor, it is anticipated that any hypothetical interest rate decrease would have a limited positive impact on our funding costs beyond a certain level; however, because prepayments speeds are unaffected by this floor, it is expected that any increase in our prepayment speeds (occurring as a result of any interest rate decrease or otherwise) could result in an acceleration of our premium amortization and the reinvestment of such prepaid principal in lower yielding assets. As a result, the presence of this floor limits the positive impact of any interest rate decrease on our funding costs. Therefore, at some point, hypothetical interest rate decreases could cause the fair value of our financial instruments and our net interest income to decline.
Market Value Risk
All of our Agency Securities are classified as available for sale securities. As such, they are reflected at fair value with the periodic adjustment to fair value (that is not considered to be an other than temporary impairment) reported as part of the separate consolidated statement of comprehensive income (loss).
All of our Credit Risk and Non-Agency Securities, Interest-Only Securities and U.S. Treasury Securities are classified as trading securities. As such, they are reflected at fair value with the periodic adjustment to fair value reflected as part of “Other Income (Loss)” reported as part of the consolidated statements of operations.
The market value of our MBS can fluctuate due to changes in interest rates and other factors. Weakness in the mortgage market may adversely affect the performance and market value of our investments. This could negatively impact our book value. Furthermore, if our lenders are unwilling or unable to provide additional financing, we could be forced to sell our MBS at an inopportune time when prices are depressed. The principal and interest payments on our Agency Securities may be guaranteed by Fannie Mae, Freddie Mac, or Ginnie Mae.
69
ARMOUR Residential REIT, Inc.
Market Risk Disclosures (continued)
June 30, 2018
|
Percentage Change in Projected
|
||||
|
Change in MBS spread
|
Portfolio Market Value
|
Portfolio Book Value
|
||
|
+25 BPS
|
(1.32)%
|
(9.93)%
|
||
|
+10 BPS
|
(0.53)%
|
(3.37)%
|
||
|
-10 BPS
|
0.53%
|
3.97%
|
||
|
-25 BPS
|
1.32%
|
9.93%
|
||
December 31, 2017
|
Percentage Change in Projected
|
||||
|
Change in MBS spread
|
Portfolio Market Value
|
Portfolio Book Value
|
||
|
+25 BPS
|
(1.32)%
|
(10.08)%
|
||
|
+10 BPS
|
(0.53)%
|
(4.03)%
|
||
|
-10 BPS
|
0.53%
|
4.03%
|
||
|
-25 BPS
|
1.32%
|
10.08%
|
||
The above tables quantify the estimated changes in the fair value of our securities portfolio and in our portfolio book value as of
June 30, 2018
and
December 31, 2017
. Should spreads widen or tighten by 10 and 25 basis points (BPS), the estimated impact of changes in spreads is in addition to our interest rate sensitivity presented above. Our securities portfolio's sensitivity of mortgage spread changes will vary with changes in interest rates and in the size and composition of our securities portfolio. Therefore, actual results could differ materially from our estimates.
Credit Risk
We have limited our exposure to credit losses on our securities portfolio of Agency Securities. The payment of principal and interest on the Freddie Mac and Fannie Mae Agency Securities are guaranteed by those respective agencies and the payment of principal and interest on the Agency Securities guaranteed by Ginnie Mae are backed by the full faith and credit of the U.S. Government.
Fannie Mae and Freddie Mac remain in conservatorship of the U.S. Government. There can be no assurances as to how or when the U.S. Government will end these conservatorships or how the future profitability of Fannie Mae and Freddie Mac and any future credit rating actions may impact the credit risk associated with Agency Securities and, therefore, the value of the Agency Securities in our securities portfolio.
We purchase Credit Risk and Non-Agency Securities at prices which incorporate our expectations for prepayment speeds, defaults, delinquencies and severities. These expectations determine the yields we receive on our assets. If actual prepayment speeds, defaults, delinquencies and severities are different from our expectations, our actual yields could be higher or lower.
Liquidity Risk
Our primary liquidity risk arises from financing long-maturity MBS with short-term debt. The interest rates on our borrowings generally adjust more frequently than the interest rates on our ARMs. Accordingly, in a period of rising interest rates, our borrowing costs will usually increase faster than our interest earnings from MBS.
Operational Risk
We rely on our financial, accounting and other data processing systems. Computer malware, viruses, computer hacking and phishing attacks have become more prevalent in our industry and may occur on our systems. Although we have not detected
70
ARMOUR Residential REIT, Inc.
Market Risk Disclosures (continued)
a material cybersecurity breach to date, other financial services institutions have reported material breaches of their systems, some of which have been significant. Even with all reasonable security efforts, not every breach can be prevented or even detected. It is possible that we have experienced an undetected breach. There is no assurance that we, or the third parties that facilitate our business activities, have not or will not experience a breach. It is difficult to determine what, if any, negative impact may directly result from any specific interruption or cyber-attacks or security breaches of our networks or systems (or the networks or systems of third parties that facilitate our business activities) or any failure to maintain performance.
We have established an Information Technology Committee (“the Committee”) to help mitigate technology risks including cybersecurity. One of the roles of the Committee is to oversee cyber risk assessments, monitor applicable key risk indicators, review cybersecurity training procedures, oversee the Company’s Cybersecurity Incident Response Plan and engage third parties to conduct periodic penetration testing. Our cybersecurity risk assessment includes an evaluation of cyber risk related to sensitive data held by third parties on their systems. There is no assurance that these efforts will effectively mitigate cybersecurity risk and mitigation efforts are not an assurance that no cybersecurity incidents will occur.
Evaluation of Disclosure Controls and Procedures
Our Co-Chief Executive Officers (“Co-CEOs”) and Chief Financial Officer (“CFO”) participated in an evaluation by our management of the effectiveness of our disclosure controls and procedures (as defined in Rules 13a-15(e) and 15d-15(e) under the Securities Exchange Act of 1934, as amended (the “Exchange Act”)) as of the end of our fiscal quarter that ended on
June 30, 2018
. Based on their participation in that evaluation, our Co-CEOs and CFO concluded that our disclosure controls and procedures were effective as of
June 30, 2018
to ensure that information required to be disclosed in our reports filed or submitted under the Exchange Act, is recorded, processed, summarized and reported within the time periods specified in the SEC’s rules and forms, and to ensure that information required to be disclosed in our reports filed or furnished under the Exchange Act, is accumulated and communicated to our management, including our Co-CEOs and CFO, as appropriate, to allow timely decisions regarding required disclosures.
Internal Control Over Financial Reporting
Our Co-CEOs and CFO also participated in an evaluation by our management of any changes in our internal control over financial reporting (as defined in Rules 13a-15(f) and 15d-15(f) under the Exchange Act) that occurred during the
quarter
ended
June 30, 2018
. That evaluation did not identify any changes that have materially affected, or are reasonably likely to materially affect, our internal control over financial reporting.
71
ARMOUR Residential REIT, Inc.
Nine putative class action lawsuits have been filed in connection with the Tender Offer and Merger (collectively, the “Transactions”): (1) Stourbridge Investments Ltd. v. ARMOUR Residential REIT, Inc., et al. (Case No. 24-C-16-001542), filed March 8, 2016 in the Circuit Court for Baltimore City, Maryland; (2) Timothy Lenell v. ARMOUR Residential REIT, Inc., et al., (Case No. 2016 CA 000164), filed March 8, 2016 in the Circuit Court for the Nineteenth Judicial Circuit for Indian River County, Florida; (3) Alexander Vartanov v. ARMOUR Residential REIT, Inc., et al. (Case No. 24-C-16-001593), filed March 10, 2016, in the Circuit Court for Baltimore City, Maryland; (4) Robert Curley v. ARMOUR Residential REIT, Inc., et al. (Case No. 24-C-16-001659, filed March 14, 2016 in the Circuit Court for Baltimore City, Maryland; (5) Antonio Rado and Craig and Amanda Hosler v. ARMOUR Residential REIT, Inc., et al. (Case No. 24-C-16-001684), filed March 15, 2016 in the Circuit Court for Baltimore City, Maryland; (6) Curtis Heid v. ARMOUR Residential REIT, Inc., et al. (Case No. 24-C-16-001706), filed March 16, 2016 in the Circuit Court for Baltimore City, Maryland; (7) Robert Aivasian v. ARMOUR Residential REIT, Inc., et. al. (Case No. 24-C-16-001808), filed March 22, 2016 in the Circuit Court for Baltimore City, Maryland; (8) Neil Harmon v. ARMOUR Residential REIT, Inc., et al. (Case No. 24-C-16-001812), filed March 22, 2016 in the Circuit Court for Baltimore City, Maryland; and (9) Benjamin C. Washington, et al. v. ARMOUR Residential REIT, Inc., et al. (Case No. 24-C-16-001829), filed March 23, 2016 in the Circuit Court for Baltimore City, Maryland.
All nine suits name ARMOUR, the previous members of JAVELIN’s board of directors prior to the Merger (of which eight are current members of ARMOUR’s board of directors) (the “Individual Defendants”) and JMI Acquisition Corporation (“Acquisition”) as defendants. The Lenell, Curley, Heid and Harmon suits also name ACM as an additional defendant. All suits except for the Harmon suit also name JAVELIN as an additional defendant. The lawsuits were brought by purported holders of JAVELIN’s common stock, both individually and on behalf of a putative class of JAVELIN’s stockholders, alleging that the Individual Defendants breached their fiduciary duties owed to the plaintiffs and the putative class of JAVELIN stockholders, including claims that the Individual Defendants failed to properly value JAVELIN; failed to take steps to maximize the value of JAVELIN to its stockholders; ignored or failed to protect against conflicts of interest; failed to disclose material information about the Transactions; took steps to avoid competitive bidding and to give ARMOUR an unfair advantage by failing to adequately solicit other potential acquirors or alternative transactions; and erected unreasonable barriers to other third-party bidders. The suits also allege that ARMOUR, JAVELIN, ACM and Acquisition aided and abetted the alleged breaches of fiduciary duties by the Individual Defendants. The lawsuits seek equitable relief, including, among other relief, to enjoin consummation of the Transactions, or rescind or unwind the Transactions if already consummated, and award costs and disbursements, including reasonable attorneys’ fees and expenses. The Florida action was never served on the defendants, and that case was voluntarily dismissed and closed on January 20, 2017. On April 25, 2016, the Maryland court issued an order consolidating the 8 Maryland cases into 1 action, captioned In re JAVELIN Mortgage Investment Corp. Shareholder Litigation (Case No. 24-C-16-001542), and designated counsel for one of the Maryland cases as interim lead co-counsel. On May 26, 2016, interim lead counsel filed the Consolidated Amended Class Action Complaint for Breach of Fiduciary Duty asserting consolidated claims of breach of fiduciary duty, aiding and abetting the breaches of fiduciary duty, and waste. On June 27, 2016, defendants filed a Motion to Dismiss the Consolidated Amended Class Action Complaint for failing to state a claim upon which relief can be granted. A hearing was held on the Motion to Dismiss on March 3, 2017, and the Court reserved ruling. To date, the Court has not issued an order on the Motion to Dismiss.
Each of ARMOUR, JAVELIN, ACM and the Individual Defendants intends to defend the claims made in these lawsuits vigorously; however, there can be no assurance that any of ARMOUR, JAVELIN, ACM or the Individual Defendants will prevail in its defense of any of these lawsuits to which it is a party. An unfavorable resolution of any such litigation surrounding the Transactions may result in monetary damages being awarded to the plaintiffs and the putative class of former stockholders of JAVELIN, and the cost of defending the litigation, even if resolved favorably, could be substantial. Such litigation could also substantially divert the attention of the Individual Defendants and ARMOUR’s, JAVELIN’s and ACM’s management and their resources in general. Due to the preliminary nature of all nine suits, ARMOUR is not able at this time to estimate their outcome.
72
ARMOUR Residential REIT, Inc.
There have been no material changes to the risk factors disclosed in our Annual Report on Form 10-K for the year ended
December 31, 2017
, filed with the SEC on February 15, 2018.
None.
None.
Not applicable.
None.
|
EXHIBIT INDEX
|
||
|
Exhibit Number
|
|
Description
|
|
|
||
|
|
||
|
|
||
|
|
||
|
|
||
|
|
||
|
101.INS
|
|
XBRL Instance Document - the instance document does not appear in the Interactive Data File because its XBRL tags are embedded within the Inline XBRL document.
|
|
101.SCH
|
|
XBRL Taxonomy Extension Schema Document (1)
|
|
101.CAL
|
|
XBRL Taxonomy Extension Calculation Linkbase Document (1)
|
|
101.DEF
|
|
XBRL Taxonomy Extension Definition Linkbase Document (1)
|
|
101.LAB
|
|
XBRL Taxonomy Extension Label Linkbase Document (1)
|
|
101.PRE
|
|
XBRL Taxonomy Extension Presentation Linkbase Document (1)
|
|
(1)
|
Filed herewith.
|
|
|
(2)
|
Furnished herewith.
|
|
SIGNATURES
Pursuant to the requirements of the Securities and Exchange Act of 1934, the registrant has duly caused this report to be signed on its behalf by the undersigned thereunto duly authorized.
|
July 25, 2018
|
ARMOUR RESIDENTIAL REIT, INC.
|
|
|
|
|
|
/s/ James R. Mountain
|
|
|
James R. Mountain
|
|
|
Chief Financial Officer, Duly Authorized Officer and Principal Financial Officer
|
TABLE OF CONTENTS
Part I. Financial InformationItem 1. Financial StatementsNote 1 -organization and Nature Of Business OperationsNote 10 -commitments and ContingenciesNote 15 -related Party TransactionsNote 2 -basis Of Presentation and ConsolidationNote 3 -summary Of Significant Accounting PoliciesNote 4 -recent Accounting PronouncementsNote 5 -fair Value Of Financial InstrumentsNote 6 -agency SecuritiesNote 7 -credit Risk and Non-agency SecuritiesNote 8 -repurchase AgreementsNote 9 -derivativesNote 11 -stock Based CompensationNote 12 -stockholders' EquityNote 13 -net Income Per Common ShareNote 14 -income TaxesNote 16 -interest Rate RiskNote 17 -subsequent EventsItem 2. Management S Discussion and Analysis Of Financial Condition and Results Of OperationsItem 3. Quantitative and Qualitative Disclosures About Market RiskPart II. Other InformationItem 1. Legal ProceedingsItem 1A. Risk FactorsItem 2. Unregistered Sales Of Equity Securities and Use Of ProceedsItem 3. Defaults Upon Senior SecuritiesItem 4. Mine Safety DisclosuresItem 5. Other InformationItem 6. Exhibits