UNITED STATES
SECURITIES AND EXCHANGE COMMISSION
Washington, D.C. 20549
FORM 20-F
(Mark One)
|
[ ]
|
REGISTRATION STATEMENT PURSUANT TO SECTION 12(b) OR (g) OF THE SECURITIES EXCHANGE ACT OF 1934
|
|
OR
|
|
|
[X]
|
ANNUAL REPORT PURSUANT TO SECTION 13 OR 15(d) OF THE SECURITIES EXCHANGE ACT OF 1934
|
|
For the fiscal year ended
December 31, 2013
|
|
|
OR
|
|
|
[ ]
|
TRANSITION REPORT PURSUANT TO SECTION 13 OR 15(d) OF THE SECURITIES EXCHANGE ACT OF 1934
|
|
For the transition period from _________________ to _________________
|
|
|
OR
|
|
|
[ ]
|
SHELL COMPANY REPORT PURSUANT TO SECTION 13 OR 15(d) OF THE SECURITIES EXCHANGE ACT OF 1934
|
|
Date of event requiring this shell company report _________________
|
|
|
Commission file number: 001-36028
|
|
|
ARDMORE SHIPPING CORPORATION
|
|
(Exact name of Registrant as specified in its charter)
|
|
(Translation of Registrant's name into English)
|
|
Republic of the Marshall Islands
|
|
(Jurisdiction of incorporation or organization)
|
|
69 Pitts Bay Road, Hamilton, HM08, Bermuda
|
|
(Address of principal executive offices)
|
|
Mr. Anthony Gurnee
|
|
City Gate Building 1000, Mahon, Cork, Ireland
+ 353 21 240-9500
info@ardmoreshipping.com
|
|
(Name, Telephone, E-mail and/or Facsimile, and address of Company Contact Person)
|
Securities registered or to be registered pursuant to section 12(b) of the Act.
|
Title of each class
|
Name of each exchange on which registered
|
|
Common stock, par value $0.01 per share
|
New York Stock Exchange
|
Securities registered or to be registered pursuant to section 12(g) of the Act.
|
NONE
|
|
(Title of class)
|
Securities for which there is a reporting obligation pursuant to Section 15(d) of the Act.
|
NONE
|
|
(Title of class)
|
Indicate the number of outstanding shares of each of the issuer's classes of capital or common stock as of the close of the period covered by the annual report.
As of December 31, 2013, there were 18,050,000 shares of common stock outstanding, par value $0.01 per share.
Indicate by check mark if the registrant is a well-known seasoned issuer, as defined in Rule 405 of the Securities Act.
|
Yes
|
No
|
X
|
||
If this report is an annual or transition report, indicate by check mark if the registrant is not required to file reports pursuant to Section 13 or 15(d) of the Securities Exchange Act of 1934.
|
Yes
|
No
|
X
|
||
Note – Checking the box above will not relieve any registrant required to file reports pursuant to Section 13 or 15(d) of the Securities Exchange Act of 1934 from their obligations under those Sections.
Indicate by check mark whether the registrant (1) has filed all reports required to be filed by Section 13 or 15(d) of the Securities Exchange Act of 1934 during the preceding 12 months (or for such shorter period that the registrant was required to file such reports), and (2) has been subject to such filing requirements for the past 90 days.
|
Yes
|
X
|
No
|
||
Indicate by check mark whether the registrant has submitted electronically and posted on its corporate Web site, if any, every Interactive Data File required to be submitted and posted pursuant to Rule 405 of Regulation S-T (§232.405 of this chapter) during the preceding 12 months (or for such shorter period that the registrant was required to submit and post such files).
|
Yes
|
X
|
No
|
||
Indicate by check mark whether the registrant is a large accelerated filer, an accelerated filer or a non-accelerated filer. See the definitions of "large accelerated filer" and "accelerated filer" in Rule 12b-2 of the Exchange Act. (Check one):
|
Large accelerated filer
o
|
Accelerated filer
o
|
Non-accelerated filer
x
|
Indicate by check mark which basis of accounting the registrant has used to prepare the financial statements included in this filing:
|
X
|
|
U.S. GAAP
|
|
International Financial Reporting Standards as issued by the international Accounting Standards Board
|
||
|
Other
|
If "Other" has been checked in response to the previous question, indicate by check mark which financial statement item the registrant has elected to follow:
|
Item 17
|
Item 18
|
|||
If this is an annual report, indicate by check mark whether the registrant is a shell company (as defined in Rule 12b-2 of the Exchange Act).
|
Yes
|
No
|
X
|
||
TABLE OF CONTENTS
|
PART I
|
||
|
Item 1.
|
Identity of Directors, Senior Management and Advisors
|
2
|
|
Item 2.
|
Offer Statistics and Expected Timetable
|
2
|
|
Item 3.
|
Key Information
|
2
|
|
Item 4.
|
Information on the Company
|
21
|
|
Item 4.A
|
Unresolved Staff Comments
|
43
|
|
Item 5.
|
Operating and Financial Review and Prospects
|
43
|
|
Item 6.
|
Directors, Senior Management and Employees
|
55
|
|
Item 7.
|
Major Shareholders and Related Party Transactions
|
60
|
|
Item 8.
|
Financial Information
|
60
|
|
Item 9.
|
The Offer and Listing
|
61
|
|
Item 10.
|
Additional Information
|
62
|
|
Item 11.
|
Quantitative and Qualitative Disclosures about Market Risks
|
73
|
|
Item 12.
|
Description of Securities Other than Equity Securities
|
74
|
|
PART II
|
||
|
Item 13.
|
Defaults, Dividend Arrearages and Delinquencies
|
74
|
|
Item 14.
|
Material Modifications to the Rights of Shareholders and Use of Proceeds
|
74
|
|
Item 15.
|
Controls and Procedures
|
74
|
|
Item 16
|
Reserved
|
74
|
|
Item 16.A
|
Audit Committee Financial Expert
|
74
|
|
Item 16.B
|
Code of Ethics
|
75
|
|
Item 16.C
|
Principal Accountant Fees and Services
|
75
|
|
Item 16.D
|
Exemptions from the Listing Standards for Audit Committees
|
75
|
|
Item 16.E
|
Purchases of Equity Securities by the Issuer and Affiliated Purchasers
|
75
|
|
Item 16.F
|
Change in Registrant's Certifying Accountant
|
75
|
|
Item 16.G
|
Corporate Governance
|
75
|
|
Item 16.H
|
Mine Safety Disclosures
|
76
|
|
Item 17.
|
Financial Statements
|
76
|
|
Item 18.
|
Financial Statements
|
76
|
|
Item 19.
|
Exhibits
|
76
|
|
INDEX TO FINANCIAL STATEMENTS OF ARDMORE SHIPPING CORPORATION
|
F-1
|
|
FORWARD-LOOKING STATEMENTS
The Private Securities Litigation Reform Act of 1995 provides safe harbor protections for forward-looking statements in order to encourage companies to provide prospective information about their business. The Company desires to take advantage of the safe harbor provisions of the Private Securities Litigation Reform Act of 1995 and is including this cautionary statement in connection with such safe harbor legislation.
This annual report and any other written or oral statements made by us or on our behalf may include forward-looking statements which reflect our current views and assumptions with respect to future events and financial performance and are subject to risks and uncertainties. Forward-looking statements include statements concerning plans, objectives, goals, expectations, projections, strategies, beliefs about future events or performance, and underlying assumptions and other statements, which are other than statements of historical facts. In some cases, words such as "believe", "except," "anticipate," "intends," "estimate," "forecast," "project," "plan," "potential," "will," "may," "should," "expect" and similar expressions are intended to identify forward-looking statements, but are not the exclusive means of identifying such statements.
Forward-looking statements in this Annual Report include, but are not limited to, such matters as:
|
|
·
|
our future operating or financial results;
|
|
|
·
|
global and regional economic and political conditions, including piracy;
|
|
|
·
|
our pending vessel acquisitions, our business strategy and expected capital spending or operating expenses, including drydocking and insurance costs;
|
|
|
·
|
competition in the tanker industry;
|
|
|
·
|
statements about shipping market trends, including charter rates and factors affecting supply and demand;
|
|
|
·
|
our financial condition and liquidity, including our ability to obtain financing in the future to fund capital expenditures, acquisitions and other general corporate activities;
|
|
|
·
|
our ability to enter into fixed-rate charters after our current charters expire and our ability to earn income in the spot market; and
|
|
|
·
|
our expectations of the availability of vessels to purchase, the time it may take to construct new vessels, and vessels' useful lives.
|
Many of these statements are based on our assumptions about factors that are beyond our ability to control or predict and are subject to risks and uncertainties that are described more fully under the "Risk Factors" section of this Annual Report. Any of these factors or a combination of these factors could materially affect our future results of operations and the ultimate accuracy of the forward-looking statements. Factors that might cause future results to differ include, but are not limited to, the following:
|
|
·
|
changes in governmental rules and regulations or actions taken by regulatory authorities;
|
|
|
·
|
changes in economic and competitive conditions affecting our business, including market fluctuations in charter rates and charterers' abilities to perform under existing time charters;
|
|
|
·
|
potential liability from future litigation and potential costs due to environmental damage and vessel collisions;
|
|
|
·
|
the length and number of off-hire periods and dependence on third-party managers; and
|
|
|
·
|
other factors discussed under the "Risk Factors" section of the Annual Report
|
You should not place undue reliance on forward-looking statements contained in the Annual Report, because they are statements about events that are not certain to occur as described or at all. All forward-looking statements in the Annual Report are qualified in their entirety by the cautionary statements contained in the Annual Report. These forward-looking statements are not guarantees of our future performance, and actual results and future developments may vary materially from those projected in the forward-looking statements.
Except to the extent required by applicable law or regulation, we undertake no obligation to release publicly any revisions to these forward-looking statements to reflect events or circumstances after the date of this Annual Report or to reflect the occurrence of unanticipated events.
1
Not applicable
|
Item 2.
|
Offer Statistics and Expected Timetable
|
Not applicable.
|
Item 3.
|
Key Information
|
Unless the context otherwise requires, when used in this Annual Report, the terms "Ardmore," "Ardmore Shipping," the "Company," "we," "our" and "us" refer to Ardmore Shipping Corporation and its subsidiaries. "Ardmore Shipping Corporation" refers only to Ardmore Shipping Corporation and not its subsidiaries. Unless otherwise indicated, all references to "dollars," "U.S. dollars" and "$" in this annual report are to the lawful currency of the United States. We use the term deadweight tons, or dwt, expressed in metric tons, each of which is equivalent to 1,000 kilograms, in describing the size of tankers.
|
A.
|
Selected Financial Data
|
The following table sets forth our selected consolidated financial data and other operating data. The selected financial data as of December 31, 2013 and 2012 and the years ended December 31, 2013, 2012 and 2011 are derived from our audited consolidated financial statements, included elsewhere in the Annual Report. The selected consolidated financial data set forth below as of December 31, 2011 and 2010 and for the period ended December 31, 2010 have been derived from our audited consolidated financial statements, which are not included in the Annual Report. The financial statements have been prepared in accordance with U.S. GAAP. The data set forth below should be read in conjunction with "Item 5. Operating and Financial Review and Prospects."
|
INCOME STATEMENT DATA
|
For the years ended
|
|||||||||||||||
|
Dec 31, 2013
|
Dec 31, 2012
|
Dec 31, 2011
|
Dec 31, 2010
|
|||||||||||||
|
REVENUE
|
||||||||||||||||
|
Revenue
|
$ | 35,867,356 | 25,172,654 | 22,375,414 | 3,459,153 | |||||||||||
|
OPERATING EXPENSES
|
||||||||||||||||
|
Commissions and voyage related costs
|
2,523,842 | 789,149 | 468,067 | 94,439 | ||||||||||||
|
Vessel operating expenses
|
18,215,487 | 14,598,071 | 12,186,825 | 2,079,857 | ||||||||||||
|
Charter hire costs
|
- | 1,699,943 | 1,663,380 | - | ||||||||||||
|
Depreciation
|
8,388,208 | 6,195,416 | 5,343,091 | 959,903 | ||||||||||||
|
Amortization of deferred drydock expenditure
|
1,420,814 | 441,491 | - | - | ||||||||||||
|
General and administrative expenses
|
5,669,935 | 2,975,139 | 2,599,031 | 851,660 | ||||||||||||
|
Total operating expenses
|
36,218,286 | 26,699,209 | 22,260,394 | 3,985,859 | ||||||||||||
|
(Loss) / profit from operations
|
(350,930 | ) | (1,526,555 | ) | 115,020 | (526,706 | ) | |||||||||
|
Interest expense and finance costs
|
(3,464,006 | ) | (2,966,014 | ) | (3,080,472 | ) | (647,441 | ) | ||||||||
|
Interest income
|
6,059 | 4,713 | 3,608 | 2,723 | ||||||||||||
|
Loss before taxes
|
(3,808,877 | ) | (4,487,856 | ) | (2,961,844 | ) | (1,171,424 | ) | ||||||||
|
Income tax
|
(33,726 | ) | (51,237 | ) | (13,426 | ) | 3,424 | |||||||||
|
Net loss
|
$ | (3,842,603 | ) | (4,539,093 | ) | (2,975,270 | ) | (1,168,000 | ) | |||||||
|
Loss per share, basic and diluted
|
$ | (0.31 | ) | (0.56 | ) | (0.37 | ) | (0.15 | ) | |||||||
|
Weighted average number of common shares, basic and diluted
|
12,241,599 | 8,049,500 | 8,049,500 | 8,049,500 | ||||||||||||
2
|
BALANCE SHEET DATA
|
As at
|
|||||||||||||||
|
Dec 31, 2013
|
Dec 31, 2012
|
Dec 31, 2011
|
Dec 31, 2010
|
|||||||||||||
|
Cash and cash equivalents
|
$ | 56,860,845 | 15,334,123 | 5,460,304 | 5,203,790 | |||||||||||
|
Net vessels (including drydock assets)
|
292,054,606 | 157,008,968 | 145,760,106 | 94,288,390 | ||||||||||||
|
Total assets
|
357,965,633 | 179,960,468 | 160,631,102 | 104,051,350 | ||||||||||||
|
Short-term revolving credit facility
|
- | - | 30,265,000 | 14,770,000 | ||||||||||||
|
Senior debt and capital leases
|
119,239,015 | 67,100,000 | 65,600,000 | 38,000,000 | ||||||||||||
|
Paid in capital
|
244,883,077 | 117,073,352 | 65,747,599 | 50,790,925 | ||||||||||||
|
Accumulated deficit
|
$ | (12,524,966 | ) | (8,682,363 | ) | (4,143,270 | ) | (1,168,000 | ) | |||||||
|
CASHFLOW DATA
|
For the years ended
|
|||||||||||||||
|
Dec 31, 2013
|
Dec 31, 2012
|
Dec 31, 2011
|
Dec 31, 2010
|
|||||||||||||
|
Net cash provided by operating activities
|
$ | 8,120,173 | 3,985,253 | 397,273 | (2,259,892 | ) | ||||||||||
|
Net cash used in investing activities
|
(144,637,558 | ) | (14,941,514 | ) | (56,920,554 | ) | (95,260,596 | ) | ||||||||
|
Net cash provided by financing activities
|
$ | 178,044,107 | 20,830,080 | 56,779,795 | 102,724,278 | |||||||||||
|
TIME CHARTER EQUIVALENT DATA
(1)
|
For the years ended
|
|||||||||||||||
|
Dec 31, 2013
|
Dec 31, 2012
|
Dec 31, 2011
|
Dec 31, 2010
|
|||||||||||||
|
MR Tankers "Eco-design"
|
$ | 15,838 | - | - | - | |||||||||||
|
MR Tankers "Eco-mod"
|
13,732 | 13,294 | 13,097 | 12,800 | ||||||||||||
|
Chemical Tankers "Eco-mod"
|
$ | 10,483 | 9,108 | 8,878 | 10,459 | |||||||||||
|
FLEET OPERATING DATA
|
For the years ended
|
|||||||||||||||
|
Dec 31, 2013
|
Dec 31, 2012
|
Dec 31, 2011
|
Dec 31, 2010
|
|||||||||||||
|
Fleet TCE
|
||||||||||||||||
|
Fleet weighted average
(2)
|
$ | 12,850 | 10,911 | 11,100 | 12,597 | |||||||||||
|
Profit / (loss) on TC-Invest
(3)
|
(27 | ) | (185 | ) | (47 | ) | (361 | ) | ||||||||
|
Commissions and voyage related costs
(4)
|
(235 | ) | (337 | ) | (234 | ) | (334 | ) | ||||||||
|
Third party share of profit / (loss) on chartered-in vessels
(5)
|
(4 | ) | (205 | ) | (254 | ) | - | |||||||||
|
Net TCE
|
$ | 12,584 | 10,184 | 10,565 | 11,902 | |||||||||||
|
Operating Expenditure
|
||||||||||||||||
|
Fleet operating costs per day
(6)
|
$ | 6,152 | 6,103 | 6,150 | 6,963 | |||||||||||
|
Technical management fees per day
(7)
|
379 | 344 | 334 | 335 | ||||||||||||
|
Total fleet operating costs per day
|
$ | 6,531 | 6,447 | 6,484 | 7,298 | |||||||||||
|
Expenditures for drydock
(8)
|
242,263 | 2,959,280 | - | - | ||||||||||||
|
Hire
|
||||||||||||||||
|
On-hire utilization
(9)
|
99.54 | % | 99.10 | % | 99.80 | % | 99.20 | % | ||||||||
____________
|
(1)
|
Time Charter Equivalent ("TCE") daily rate is the gross charter rate or gross pool rate, as appropriate, per revenue day plus CVE income. For vessels employed on voyage charters, TCE is the net rate after deducting voyage costs incurred by commercial managers.
|
|
(2)
|
Fleet weighted average is total gross revenue for the fleet, after deducting voyage expenses incurred by commercial managers, before any profits arising or losses incurred on TC-Invest and share of profit arising or losses incurred on chartered-in vessels, divided by the number of revenue days.
|
|
(3)
|
Profit / (loss) on TC-Invest relate to two separate agreements entered into by the company with two third party charterers which were supplemental to the charters of the
Ardmore Seafarer
and the
Ardmore Seatrader
, respectively, to participate in the profits or losses arising from each vessel's employment in an MR pool managed by affiliates of the charterers, in exchange for an up-front investment to be used for working capital for the pool. The TC-Invest arrangements were for the period of each time charter. The time charter for the
Ardmore Seafarer
expired on July 10, 2012, and the time charter for the
Ardmore Seatrader
expired on February 12, 2013.
|
3
|
(4)
|
Commissions and voyage related costs relate to commission and administration and fees in relation to employment of the vessel, along with minor voyage expenses incurred directly by Ardmore.
|
|
(5)
|
Third-party share of profit / (loss) on chartered-in vessels relates to an agreement whereby the profit / (loss) arising from chartering-in and employing the
Hellespont Crusader
and the
Hellespont Commander
in a chemical tanker pool was shared 75% / 25% between us and a third party charterer, respectively.
|
|
(6)
|
Fleet operating costs per day are routine operating expenses and comprise, crewing, repairs and maintenance, insurance, stores, lube oils and communication costs. They do not include additional costs related to upgrading or enhancement of the vessels that are not capitalized.
|
|
(7)
|
Technical management are fees paid to third-party technical managers.
|
|
(8)
|
Drydock costs, which include costs for in-water surveys, comprise direct costs that are incurred as part of the drydocking to meet regulatory requirements, expenditures that add economic life to the vessel, and expenditures that increase the vessel's earnings capacity or improve the vessel's operating efficiency.
|
|
(9)
|
On-hire utilization is based on revenue days divided by net operating days (i.e. operating days less scheduled offhire days).
|
|
RECONCILIATION OF NET TCE
|
For the years ended
|
|||||||||||||||
|
Dec 31, 2013
|
Dec 31, 2012
|
Dec 31, 2011
|
Dec 31, 2010
|
|||||||||||||
|
Revenue
|
$ | 35,867,356 | 25,172,654 | 22,375,414 | 3,459,153 | |||||||||||
|
Commissions and voyage related costs
|
(2,523,842 | ) | (789,149 | ) | (468,067 | ) | (94,439 | ) | ||||||||
|
TCE Earnings
|
33,343,514 | 24,383,505 | 21,907,347 | 3,364,714 | ||||||||||||
|
Revenue Days
|
2,649 | 2,394 | 2,074 | 283 | ||||||||||||
|
Net TCE (after rounding)
|
$ | 12,584 | 10,184 | 10,565 | 11,902 | |||||||||||
|
B.
|
Capitalization and Indebtedness
|
Not applicable.
|
C.
|
Reasons for the Offer and Use of Proceeds
|
Not applicable.
|
D.
|
Risk Factors
|
RISKS RELATED TO OUR INDUSTRY
The tanker industry is cyclical and volatile in terms of charter rates and profitability, which may affect our earnings and available cash flow.
The tanker industry is both cyclical and volatile in terms of charter rates and profitability. The recent prolonged downturn in the tanker industry may continue and adversely affect our ability to recharter our vessels or to sell them on the expiration or termination of their charters. Moreover, the rates payable in respect of our vessels currently operating in a commercial pool, or any renewal or replacement charters that we enter into, may not be sufficient for us to operate our vessels profitably. Fluctuations in charter rates and tanker values result from changes in the supply and demand for tanker capacity and changes in the supply and demand for oil, oil products and chemicals. The factors affecting the supply and demand for tankers are outside of our control, and the nature, timing and degree of changes in industry conditions are unpredictable.
The factors that influence demand for tanker capacity include:
|
|
·
|
supply of and demand for oil, oil products and chemicals;
|
|
|
·
|
regional availability of refining capacity;
|
|
|
·
|
global and regional economic and political conditions;
|
|
|
·
|
the distance oil, oil products and chemicals are to be moved by sea;
|
|
|
·
|
changes in seaborne and other transportation patterns;
|
|
|
·
|
environmental and other legal and regulatory developments;
|
|
|
·
|
currency exchange rates;
|
|
|
·
|
weather;
|
|
|
·
|
competition from alternative sources of energy; and
|
|
|
·
|
international sanctions, embargoes, import and export restrictions, nationalizations and wars.
|
The factors that influence the supply of tanker capacity include:
|
|
·
|
the number of newbuilding deliveries;
|
|
|
·
|
the scrapping rate of older vessels;
|
|
|
·
|
conversion of tankers to other uses;
|
|
|
·
|
the price of steel and other raw materials;
|
|
|
·
|
the number of vessels that are out of service; and
|
|
|
·
|
environmental concerns and regulations.
|
4
Historically, the tanker markets have been volatile as a result of a variety of conditions and factors that can affect the price, supply and demand for tanker capacity. The recent global economic downturn may further reduce demand for transportation of oil products and chemicals over longer distances. As of April
24
,
2014, nine of our vessels in operation were on time charters and two of our vessels operated in a spot market commercial pool. We may seek to employ one or more of our vessels directly in the spot market upon re-delivery from the current time charterers. If time charter or spot charter rates decline, we may be unable to achieve a level of charter hire sufficient for us to operate our vessels profitably.
We are partially dependent on spot charters and any decrease in spot-charter rates in the future may adversely affect our earnings.
As at
April
24
,
2014 two of our vessels were employed in a spot market-oriented commercial pool. The earnings of these vessels are based on the spot market charter rates of the pool or the particular voyage charter. We may seek to employ other vessels directly in the spot market upon re-delivery from the current charterers. Of our ordered vessels, we expect delivery of four in 2015 that we intend to place in a third-party commercial pool for product tankers, further exposing us to fluctuations in spot-market charter rates.
We may employ additional vessels that we may acquire in the future in the spot-charter market. Where we plan to employ a vessel in the spot-charter market, we intend to generally place such vessel in a commercial pool that pertains to that vessel's size class or alternatively, we may engage a third-party chartering manager to arrange spot chartering of our vessels on our behalf (third-party spot chartering arrangement). Although spot chartering is common in the tanker industry, the spot-charter market may fluctuate significantly based upon tanker and oil product/chemical supply and demand. The successful operation of our vessels in the competitive spot-charter market, including within commercial pools, depends upon, among other things, spot-charter rates and minimizing, to the extent possible, time spent waiting for charters and time spent travelling unladen to pick up cargo. The spot-market is very volatile; there have been periods when spot rates have declined below the operating cost of vessels. If future spot-charter rates decline, we may be unable to operate our vessels trading in the spot market profitably, meet our obligations, including payments on indebtedness, or pay dividends in the future. Furthermore, as charter rates for spot-charters are fixed for a single voyage that may last up to several weeks, during periods in which spot-charter rates are rising, we will generally experience delays in realizing the benefits from such increases.
Our ability to renew the charters on our vessels on the expiration or termination of our current charters, or enter into charters on vessels that we may acquire in the future, the charter rates payable under any replacement charters and vessel values will depend upon, among other things, economic conditions in the sectors in which our vessels operate at that time, changes in the supply and demand for vessel capacity and changes in the supply and demand for the seaborne transportation of oil and chemical products.
Declines in charter rates and other market deterioration could cause us to incur impairment charges.
We evaluate the carrying amounts of our vessels to determine if events have occurred that would require an impairment of their carrying amounts. The recoverable amount of vessels is reviewed based on events and changes in circumstances that would indicate that the carrying amount of the assets might not be recovered. The review for potential impairment indicators and projection of future cash flows related to the vessels is complex and requires us to make various estimates including future charter rates, operating expenses and drydock costs. All of these items have been historically volatile.
An impairment charge is recognized if the carrying value is in excess of the estimated future undiscounted net operating cash flows. The impairment loss is measured based on the excess of the carrying amount over the fair market value of the asset.
An over-supply of tanker capacity may lead to reductions in charter rates, vessel values, and profitability.
The
market supply of tankers is affected by a number of factors such as demand for energy resources, oil, petroleum and chemical products, as well as strong overall global economic growth. If the capacity of new ships delivered exceeds the capacity of tankers being scrapped and lost, tanker capacity will increase. In addition, the newbuilding orderbook, which extends to 2017, equalled approximately 17.8% of the existing world tanker fleet and the orderbook may increase further in proportion to the existing fleet. If the supply of tanker capacity increases and if the demand for tanker capacity does not increase correspondingly, charter rates and vessel values could materially decline. A reduction in charter rates and the value of our vessels may have a material adverse effect on our results of operations and available cash.
5
Acts of piracy on ocean-going vessels could adversely affect our business.
Acts of piracy have historically affected ocean-going vessels trading in regions of the world such as the South China Sea, the Indian Ocean and in the Gulf of Aden. Although the frequency of sea piracy worldwide decreased during 2013, sea piracy incidents continue to occur, particularly in the Gulf of Aden off the coast of Somalia and increasingly in the Gulf of Guinea, with tankers particularly vulnerable to such attacks. If piracy attacks result in regions in which our vessels are deployed being characterized by insurers as "war risk" zones by insurers or Joint War Committee "war and strikes" listed areas, premiums payable for such coverage could increase significantly and such insurance coverage may be more difficult to obtain. In addition, crew costs, including costs which may be incurred to the extent we employ onboard security guards, could increase in such circumstances. We may not be adequately insured to cover losses from these incidents, which could have a material adverse effect on us. In addition, detention or hijacking as a result of an act of piracy against our vessels, or an increase in cost, or unavailability of insurance for our vessels, could have a material adverse impact on our business, results of operations, cash flows and financial condition and may result in loss of revenues, increased costs and decreased cash flows to our customers, which could impair their ability to make payments to us under our charters.
The current state of the global financial markets and current economic conditions may adversely impact our ability to obtain additional financing on acceptable terms and otherwise negatively impact our business.
Global financial markets and economic conditions have been, and continue to be, volatile. These issues, along with significant write-offs in the financial services sector, the re-pricing of credit risk and the current weak economic conditions, have made, and will likely continue to make, it difficult to obtain additional financing. The current state of global financial markets and current economic conditions might adversely impact our ability to issue additional equity at prices which will not be dilutive to our existing shareholders or preclude us from issuing equity at all.
Also, as a result of concerns about the stability of financial markets generally and the solvency of counterparties specifically, the cost of obtaining money from the credit markets has increased as many lenders have increased interest rates, enacted tighter lending standards, refused to refinance existing debt at all or on terms similar to current debt and reduced, and in some cases ceased, to provide funding to borrowers. Due to these factors, additional financing may not be available if needed by us and to the extent required, on acceptable terms or at all. If additional financing is not available when needed, or is available only on unfavorable terms, we may be unable to expand or meet our obligations as they come due or we may be unable to enhance our existing business, complete additional vessel acquisitions or otherwise take advantage of business opportunities as they arise.
If economic conditions throughout the world do not improve, it could impede our operations.
Negative trends in the global economy that emerged in 2008 continue to adversely affect global economic conditions. In addition, the world economy continues to face a number of new challenges, including uncertainty related to the continuing discussions in the United States regarding the U.S. federal debt ceiling, mandatory reductions in federal spending, along with widespread skepticism about the implementation of any resulting agreements, continuing turmoil and hostilities in the Middle East, North Africa and other geographic areas and continuing economic weakness in the European Union. There has historically been a strong link between the development of the world economy and demand for energy, including oil and gas. An extended period of deterioration in the outlook for the world economy could reduce the overall demand for oil and gas and for our services. Such changes could adversely affect our results of operations and cash flows.
The economies of the United States, the European Union and other parts of the world continue to experience relatively slow growth or remain in recession and exhibit weak economic trends. The credit markets in the United States and Europe have experienced significant contraction, de-leveraging and reduced liquidity, and the U.S. federal and state governments and European authorities continue to implement a broad variety of governmental action and/or new regulation of the financial markets. Global financial markets and economic conditions have been, and continue to be, severely disrupted and volatile.
We face risks affected by changes in economic environments, changes in interest rates, and instability in the banking and securities markets around the world, among other factors. We cannot predict how long the current market conditions will last. These continuing economic and governmental factors, together with the concurrent decline in charter rates and vessel values, may have a material adverse effect on our results of operations and may cause the price of our common stock to decline.
6
Changes in fuel, or bunkers, prices may adversely affect profits.
Fuel, or bunkers, is a significant expense in shipping operations for our vessels employed on the spot market and can have a significant impact on pool earnings. With respect to our vessels employed on time charter, the charterer is generally responsible for the cost and supply of fuel, however such cost may affect the charter rates we are able to negotiate for our vessels. Changes in the price of fuel may adversely affect our profitability. The price and supply of fuel is unpredictable and fluctuates based on events outside our control, including geopolitical developments, supply and demand for oil and gas, actions by OPEC and other oil and gas producers, war and unrest in oil producing countries and regions, regional production patterns and environmental concerns. Further, fuel may become much more expensive in the future, which may reduce the profitability and competitiveness of our business versus other forms of transportation, such as truck or rail.
We are subject to complex laws and regulations, including environmental laws and regulations, which can adversely affect our business, results of operations, cash flows and financial condition, and our available cash.
Our operations are subject to numerous laws and regulations in the form of international conventions and treaties, national, state and local laws and national and international regulations in force in the jurisdictions in which our vessels operate or are registered, which can significantly affect the ownership and operation of our vessels. These requirements include, but are not limited to, the U.S. Oil Pollution Act of 1990 ("OPA"), requirements of the U.S Coast Guard and the U.S. Environmental Protection Agency ("EPA"), the U.S. Comprehensive Environmental Response, Compensation and Liability Act of 1980 ("CERCLA"), the U.S. Clean Air Act, the U.S. Clean Water Act, the International Maritime Organization ("IMO"), International Convention on Civil Liability for Oil Pollution Damage of 1969 (as from time to time amended and generally referred to as "CLC"), the IMO International Convention on Civil Liability for Bunker Oil Pollution Damages, the IMO International Convention for the Prevention of Pollution from Ships of 1973 (as from time to time amended and generally referred to as "MARPOL"), including designation of Emission Control Areas thereunder, the IMO International Convention for the Safety of Life at Sea of 1974 (as from time to time amended and generally referred to as "SOLAS"), the IMO International Convention on Load Lines of 1966 (as from time to time amended), the U.S. Maritime Transportation Security Act of 2002, the International Labour Organization ("ILO") Maritime Labour Convention ("MLC") and European Union regulations. Compliance with such laws and regulations, where applicable, may require installation of costly equipment or operational changes and may affect the resale value or useful lives of our vessels. We may also incur additional costs in order to comply with other existing and future regulatory obligations, including, but not limited to, costs relating to air emissions including greenhouse gases, the management of ballast and bilge waters, maintenance and inspection, elimination of tin-based paint, development and implementation of emergency procedures and insurance coverage or other financial assurance of our ability to address pollution incidents. The 2010 Deepwater Horizon oil spill in the Gulf of Mexico may also result in additional regulatory initiatives or statutes or changes to existing laws that may affect our operations or require us to incur additional expenses to comply with such new laws or regulations.
These costs could have a material adverse effect on our business, results of operations, cash flows and financial condition and our available cash. A failure to comply with applicable laws and regulations may result in administrative and civil penalties, criminal sanctions or the suspension or termination of our operations. Environmental laws often impose strict liability for remediation of spills and releases of oil and hazardous substances, which could subject us to liability without regard to whether we were negligent or at fault. Under OPA, for example, owners, operators and bareboat charterers are jointly and severally strictly liable for the discharge of oil in U.S. waters, including the 200-nautical mile exclusive economic zone around the United States. An oil spill could also result in significant liability, including fines, penalties, criminal liability and remediation costs for natural resource damages under other international and U.S. federal, state and local laws, as well as third-party damages, and could harm our reputation with current or potential charterers of our tankers. We are required to satisfy insurance and financial responsibility requirements for potential oil (including marine fuel) spills and other pollution incidents. Although we have arranged insurance to cover certain environmental risks, there can be no assurance that such insurance will be sufficient to cover all such risks or that any claims will not have a material adverse effect on our business, results of operations, cash flows and financial condition and available cash.
If we fail to comply with international safety regulations, we may be subject to increased liability, which may adversely affect our insurance coverage and may result in a denial of access to, or detention in, certain ports.
The operation of our vessels is affected by the requirements set forth in the IMO's International Management Code for the Safe Operation of Ships and Pollution Prevention ("ISM Code"), promulgated by the IMO under SOLAS. The ISM Code requires shipowners, ship managers and bareboat charterers to develop and maintain an extensive "Safety Management System" that includes the adoption of safety and environmental protection policies setting forth instructions and procedures for safe operation and describing procedures for dealing with emergencies. If we fail to comply with the ISM Code, we may be subject to increased liability, invalidation of our existing insurance, or reduction in available insurance coverage for our affected vessels. Such noncompliance may also result in a denial of access to, or detention in, certain ports.
7
The market values of our vessels may decrease, which could cause us to breach covenants in our credit facilities and adversely affect our operating results.
The market values of tankers have generally experienced high volatility. The market prices for tankers declined significantly from historically high levels reached in early 2008 and remain at relatively low levels. You should expect the market value of our vessels to fluctuate depending on general economic and market conditions affecting the shipping industry and prevailing charterhire rates, competition from other shipping companies and other modes of transportation, types, sizes and ages of vessels, applicable governmental regulations and the cost of newbuildings. If the market value of our fleet declines, we may not be able to obtain other financing or incur debt on terms that are acceptable to us or at all. A decrease in these values could also cause us to breach certain covenants that are contained in our credit facilities and in future financing agreements that we may enter into from time to time. If the recoverable amounts of our vessels further decline and we do breach such covenants and we are unable to remedy the relevant breach, our lenders could accelerate our debt and foreclose on vessels in our fleet. If we sell any vessel at any time when vessel prices have fallen and before we have recorded an impairment adjustment to our financial statements, the sale may be at less than the vessel's carrying amount on our financial statements, resulting in a loss and a reduction in earnings.
If our vessels suffer damage due to the inherent operational risks of the shipping industry, we may experience unexpected drydocking costs and delays or total loss of our vessels, which may adversely affect our business and financial condition.
The operation of an ocean-going vessel carries inherent risks. Our vessels and their cargoes will be at risk of being damaged or lost because of events such as marine disasters, bad weather, business interruptions caused by mechanical failures, grounding, fire, explosions, collisions, human error, war, terrorism, piracy, cargo loss, latent defects, acts of God and other circumstances or events. Changing economic, regulatory and political conditions in some countries, including political and military conflicts, have from time to time resulted in attacks on vessels, mining of waterways, piracy, terrorism, labor strikes and boycotts. These hazards may result in death or injury to persons, loss of revenues or property, environmental damage, higher insurance rates, damage to our customer relationships, market disruptions, delay or rerouting. In addition, the operation of tankers has unique operational risks associated with the transportation of oil and chemical products. An oil or chemical spill may cause significant environmental damage, and the associated costs could exceed the insurance coverage available to us. Compared to other types of vessels, tankers are exposed to a higher risk of damage and loss by fire, whether ignited by a terrorist attack, collision, or other cause, due to the high flammability and high volume of the oil or chemicals transported in tankers.
If our vessels suffer damage, they may need to be repaired at a drydocking facility. The costs of drydock repairs are unpredictable and may be substantial. We may have to pay drydocking costs that our insurance does not cover in full. The loss of revenues while these vessels are being repaired and repositioned, as well as the actual cost of these repairs, may adversely affect our business and financial condition. In addition, space at drydocking facilities is sometimes limited and not all drydocking facilities are conveniently located. We may be unable to find space at a suitable drydocking facility or our vessels may be forced to travel to a drydocking facility that is not conveniently located to our vessels' positions. The loss of earnings while these vessels are forced to wait for space or to travel or be towed to more distant drydocking facilities may adversely affect our business and financial condition. Further, the total loss of any of our vessels could harm our reputation as a safe and reliable vessel owner and operator. If we are unable to adequately maintain or safeguard our vessels, we may be unable to prevent any such damage, costs, or loss which could negatively impact our business, financial condition, results of operations and available cash.
We operate our vessels worldwide and as a result, our vessels are exposed to international risks which may reduce revenue or increase expenses.
The international shipping industry is an inherently risky business involving global operations. Our vessels are at risk of damage or loss because of events such as marine disasters, bad weather, business interruptions caused by mechanical failures, grounding, fire, explosions, collisions, human error, war, terrorism, piracy, cargo loss, latent defects, acts of God and other circumstances or events. In addition, changing economic, regulatory and political conditions in some countries, including political and military conflicts, have from time to time resulted in attacks on vessels, mining of waterways, piracy, terrorism, labor strikes and boycotts. These sorts of events could interfere with shipping routes and result in market disruptions which may reduce our revenue or increase our expenses.
International shipping is subject to various security and customs inspection and related procedures in countries of origin and destination and transhipment points. Inspection procedures can result in the seizure of the cargo and/or our vessels, delays in the loading, offloading or delivery and the levying of customs duties, fines or other penalties against us. It is possible that changes to inspection procedures could impose additional financial and legal obligations on us. Furthermore, changes to inspection procedures could also impose additional costs and obligations on our customers and may, in certain cases, render the shipment of certain types of cargo uneconomical or impractical. Any such changes or developments may have a material adverse effect on our business, results of operations, cash flows, financial condition and available cash.
8
Political instability, terrorist or other attacks, war or international hostilities can affect the tanker industry, which may adversely affect our business
.
We conduct most of our operations outside of the United States, and our business, results of operations, cash flows, financial condition and available cash may be adversely affected by the effects of political instability, terrorist or other attacks, war or international hostilities. Continuing conflicts and recent developments in the Middle East and North Africa, including Libya, and the presence of the United States and other armed forces in those regions may lead to additional acts of terrorism and armed conflict around the world, which may contribute to further world economic instability and uncertainty in global financial markets. As a result of the above, insurers have increased premiums and reduced or restricted coverage for losses caused by terrorist acts generally. Future terrorist attacks could result in increased volatility of the financial markets and negatively impact the U.S. and global economy. These uncertainties could also adversely affect our ability to obtain additional financing on terms acceptable to us or at all.
In the past, political instability has also resulted in attacks on vessels, such as the attack on the M/T Limburg in October 2002, mining of waterways and other efforts to disrupt international shipping, particularly in the Arabian Gulf region. Acts of terrorism and piracy have also affected vessels trading in regions such as the South China Sea and the Gulf of Aden off the coast of Somalia. Any of these occurrences could have a material adverse impact on our business, financial condition, results of operations and available cash.
If our vessels call on ports located in countries that are subject to restrictions imposed by the U.S. government, our reputation and the market for our common stock could be adversely affected.
Although no vessels owned or operated by us have called on ports located in countries subject to sanctions and embargoes imposed by the U.S. government and other authorities or countries identified by the U.S. government or other authorities as state sponsors of terrorism, such as Cuba, Iran, Sudan, and Syria, in the future, our vessels may call on ports in these countries from time to time on charterers' instructions in violation of contractual provisions that prohibit them from doing so. Sanctions and embargo laws and regulations vary in their application, as they do not all apply to the same covered persons or proscribe the same activities, and such sanctions and embargo laws and regulations may be amended or strengthened over time. In 2010, the United States enacted the Comprehensive Iran Sanctions Accountability and Divestment Act ("CISADA"), that expanded the scope of the Iran Sanctions Act. Among other things, CISADA expands the application of the prohibitions on companies, such as ours, and introduces limits on the ability of companies and persons to do business or trade with Iran when such activities relate to the investment, supply or export of refined petroleum or petroleum products.
On November 24, 2013, the P5+1 (the United States, United Kingdom, Germany, France, Russia and China) entered into an interim agreement with Iran entitled the Joint Plan of Action ("JPOA"). Under the JPOA it was agreed that, in exchange for Iran taking certain voluntary measures to ensure that its nuclear program is used only for peaceful purposes, the United States and European Union would voluntarily suspend certain sanctions for a period of six months.
On January 20, 2014, the United States and European Union indicated that they would begin implementing the temporary relief measures provided for under the JPOA. These measures include, among other things, the suspension of certain sanctions on the Iranian petrochemicals, precious metals, and automotive industries from January 20, 2014 until July 20, 2014.
In 2012, President Barack Obama signed Executive Order 13608, which prohibits foreign persons from violating or attempting to violate, or causing a violation of any sanctions in effect against Iran or facilitating any deceptive transactions for or on behalf of any person subject to U.S. sanctions. Any persons found to be in violation of Executive Order 13608 will be deemed a foreign sanctions evader and will be banned from all contact with the United States, including conducting business in U.S. dollars. Also in 2012, President Obama signed into law the Iran Threat Reduction and Syria Human Rights Act of 2012 (the "Iran Threat Reduction Act"), which created new sanctions and strengthened existing sanctions. Among other things, the Iran Threat Reduction Act intensifies existing sanctions regarding the provision of goods, services, infrastructure or technology to Iran's petroleum or petrochemical sector. The Iran Threat Reduction Act also includes a provision requiring the President of the United States to impose five or more sanctions from Section 6(a) of the Iran Sanctions Act, as amended, on a person the President determines is a controlling beneficial owner of, or otherwise owns, operates, or controls or insures a vessel that was used to transport crude oil from Iran to another country and (1) if the person is a controlling beneficial owner of the vessel, the person had actual knowledge the vessel was so used or (2) if the person otherwise owns, operates, or controls, or insures the vessel, the person knew or should have known the vessel was so used. Such a person could be subject to a variety of sanctions, including exclusion from U.S. capital markets, exclusion from financial transactions subject to U.S. jurisdiction, and exclusion of that person's vessels from U.S. ports for up to two years.
9
Although we believe that we have been in compliance with all applicable sanctions and embargo laws and regulations, and intend to maintain such compliance, there can be no assurance that we will be in compliance in the future, particularly as the scope of certain laws may be unclear and may be subject to changing interpretations. In addition, the United States retains the authority to revoke the relief set forth in the JPOA if Iran fails to meet its commitments under the JPOA. Any such violation could result in fines, penalties or other sanctions that could severely impact our ability to access U.S. capital markets and conduct our business, and could result in some investors deciding, or being required, to divest their interest, or not to invest, in us. Moreover, our charterers may violate applicable sanctions and embargo laws and regulations as a result of actions that do not involve us or our vessels, and those violations could in turn negatively affect our reputation. In addition, our reputation and the market for our securities may be adversely affected if we engage in certain other activities, such as engaging in operations under an otherwise lawful contract or transaction with a third party which separately and subsequently becomes involved in sanctionable conduct. Investor perception of the value of our common stock may also be adversely affected by the consequences of war, the effects of terrorism, civil unrest and governmental actions in these and surrounding countries.
Certain or future counterparties of ours may be affiliated with persons or entities that are the subject of sanctions imposed by the Obama administration, and European Union and/or other international bodies as a result of the annexation of Crimea by Russia in March 2014. If we determine that such sanctions require us to terminate existing contracts or if we are found to be in violation of such applicable sanctions, our results of operations may be adversely affected or we may suffer reputational harm.
The smuggling of drugs or other contraband onto our vessels may lead to governmental claims against us.
We expect that our vessels will call in ports where smugglers may attempt to hide drugs and other contraband on vessels, with or without the knowledge of crew members. To the extent our vessels are found with contraband, whether inside or attached to the hull of our vessel and whether with or without the knowledge of any of our crew, we may face governmental or other regulatory claims which could have an adverse effect on our business, results of operations, cash flows, financial condition and ability to pay dividends.
Maritime claimants could arrest our vessels, which would have a negative effect on our cash flows.
Crew members, suppliers of goods and services to a vessel, shippers of cargo and other parties may be entitled to a maritime lien against a vessel for unsatisfied debts, claims or damages. In many jurisdictions, a maritime lien holder may enforce its lien by arresting or attaching a vessel through foreclosure proceedings. The arrest or attachment of one or more of our vessels could interrupt our business or require us to pay large sums of money to have the arrest lifted, which would have a negative effect on our cash flows.
In addition, in some jurisdictions, such as South Africa, under the "sister ship" theory of liability, a claimant may arrest both the vessel that is subject to the claimant's maritime lien and any "associated" vessel, which is any vessel owned or controlled by the same owner. Claimants could try to assert "sister ship" liability against one vessel in our fleet for claims relating to another of our ships.
Governments could requisition our vessels during a period of war or emergency, which may negatively impact our business, financial condition, results of operations and available cash.
A government could requisition for title or seize our vessels. Requisition for title occurs when a government takes control of a vessel and becomes the owner. Also, a government could requisition our vessels for hire. Requisition for hire occurs when a government takes control of a vessel and effectively becomes the charterer at dictated charter rates. Generally, requisitions occur during a period of war or emergency. Government requisition of one or more of our vessels may negatively impact our business, financial condition, results of operations and available cash.
Technological innovation could reduce our charter hire income and the value of our vessels.
The charterhire rates and the value and operational life of a vessel are determined by a number of factors including the vessel's efficiency, operational flexibility and physical life. Efficiency includes speed, fuel economy and the ability to load and discharge cargo quickly. Flexibility includes the ability to enter harbors, utilize related docking facilities and pass through canals and straits. The length of a vessel's physical life is related to its original design and construction, its maintenance and the impact of the stress of operations. If new tankers are built that are more efficient or more flexible or have longer physical lives than our vessels, competition from these more technologically advanced vessels could adversely affect the amount of charterhire payments we receive for our vessels once their initial charters expire and the resale value of our vessels could significantly decrease. As a result, our available cash could be adversely affected.
10
If labor or other interruptions are not resolved in a timely manner, they could have a material adverse effect on our business, results of operations, cash flows, financial condition and available cash.
We, indirectly through our technical managers, employ masters, officers and crews to man our vessels. If not resolved in a timely and cost-effective manner, industrial action or other labor unrest or any other interruption arising from incidents of whistleblowing whether proven or not, could prevent or hinder our operations from being carried out as we expect and could have a material adverse effect on our business, results of operations, cash flows, financial condition and available cash.
RISKS RELATED TO OUR BUSINESS
We have a limited history of operations on which investors may assess our performance.
We commenced business operations in April 2010. We have a limited performance record and operating history, and, therefore, limited historical financial information upon which you can evaluate our operating performance, ability to implement and achieve our business strategy or ability to pay dividends in the future. We cannot assure you that we will be successful in implementing our business strategy.
We are an "emerging growth company," and we cannot be certain if the reduced reporting requirements applicable to "emerging growth companies" will make our common stock less attractive to investors.
We are an "emerging growth company," as defined in the Securities Act, and we may take advantage of certain exemptions from various reporting requirements that are applicable to other public companies that are not "emerging growth companies." We cannot predict if investors will find our common shares less attractive because we may rely on these exemptions. If some investors find our common shares less attractive as a result, there may be a less active trading market for our common shares and our share price may be more volatile.
In addition, Section 107 of the Jumpstart Our Business Act (the "JOBS Act") provides that an "emerging growth company" can take advantage of the extended transition period provided in Section 13(a) of the Securities Exchange Act of 1934, as amended (the "Exchange Act"), for complying with new or revised accounting standards. In other words, an "emerging growth company" can delay the adoption of certain accounting standards until those standards would otherwise apply to private companies. We have elected not to take advantage of the benefits of this extended transition period and, therefore, will be subject to the same new or revised accounting standards as other public companies that are not emerging growth companies. This election is irrevocable.
In addition, because of our emerging growth company status, our independent registered public accounting firm will not be required to attest to the effectiveness of our internal control over financial reporting pursuant to Section 404 of the Sarbanes-Oxley Act of 2002 for so long as we are an emerging growth company. For as long as we take advantage of the reduced reporting obligations, the information that we provide shareholders may be different from information provided by other public companies. We may take advantage of these provisions until the end of the fiscal year following the fifth anniversary of our initial public offering or such earlier time that we are no longer an emerging growth company. We will cease to be an emerging growth company if, among other things, we have more than $1.0 billion in "total annual gross revenues" during the most recently completed fiscal year.
Because the Public Company Accounting Oversight Board ("PCAOB") is not currently permitted to inspect our independent accounting firm, you may not benefit from such inspections.
Auditors of U.S. public companies are required by law to undergo periodic PCAOB inspections to assess their compliance with U.S. law and professional standards in connection with performance of audits of financial statements filed with the SEC. Certain European Union countries, including Ireland, do not currently permit the PCAOB to conduct inspections of accounting firms established and operating in such European Union countries, even if they are part of major international firms. Accordingly, unlike for most U.S. public companies, the PCAOB is prevented from evaluating our auditor's performance of audits and its quality control procedures, and, unlike shareholders of most U.S. public companies, we and our shareholders are deprived of the possible benefits of such inspections.
11
If we do not identify suitable vessels for acquisition or successfully integrate any acquired vessels, we may not be able to grow or effectively manage our growth.
One of our principal strategies is to continue expanding our operations and adding to our fleet. Our future growth will depend upon a number of factors, some of which may not be within our control. These factors include our ability to:
|
|
·
|
identify suitable tankers and/or shipping companies for acquisitions at attractive prices;
|
|
|
·
|
identify businesses engaged in managing, operating or owning tankers for acquisitions or joint ventures;
|
|
|
·
|
integrate any acquired tankers or businesses successfully with our existing operations;
|
|
|
·
|
hire, train and retain qualified personnel and crew to manage and operate our growing business and fleet;
|
|
|
·
|
identify additional new markets;
|
|
|
·
|
improve our operating, financial and accounting systems and controls; and
|
|
|
·
|
obtain required financing for our existing and new vessels and operations.
|
Our failure to effectively identify, purchase, develop and integrate any tankers or businesses could adversely affect our business, financial condition and results of operations. The number of employees that perform services for us and our current operating and financial systems may not be adequate as we implement our plan to expand the size of our fleet, and we may not be able to effectively hire more employees or adequately improve those systems. Finally, acquisitions may require additional equity issuances or debt issuances (with amortization payments). If we are unable to execute the points noted above, our financial condition may be adversely affected.
Growing any business by acquisition presents numerous risks such as undisclosed liabilities and obligations, difficulty in obtaining additional qualified personnel and managing relationships with customers and suppliers and integrating newly acquired vessels and operations into existing infrastructures. The expansion of our fleet may impose significant additional responsibilities on our management and staff, and the management and staff of our technical managers, and may necessitate that we, and they, increase the number of personnel to support such expansion. We cannot give any assurance that we will be successful in executing our growth plans or that we will not incur significant expenses and losses in connection with such growth plans.
Delays in deliveries of vessels on order or additional vessels, our decision to cancel an order for purchase of a vessel or our inability to otherwise complete the acquisitions of additional vessels for our fleet, could harm our operating results.
We expect to purchase additional vessels from time to time. The delivery of these vessels, or vessels on order, could be delayed, not completed or cancelled, which would delay or eliminate our expected receipt of revenues from the employment of these vessels. The seller could fail to deliver these vessels to us as agreed, or we could cancel a purchase contract because the seller has not met its obligations.
If the delivery of any vessel is materially delayed or cancelled, especially if we have committed the vessel to a charter under which we become responsible for substantial liquidated damages to the customer as a result of the delay or cancellation, our business, financial condition and results of operations could be adversely affected.
The delivery of vessels on order could be delayed because of, among other things:
|
|
·
|
work stoppages or other labor disturbances or other events that disrupt the operations of the shipyard building the vessels;
|
|
|
·
|
quality or other engineering problems;
|
|
|
·
|
changes in governmental regulations or maritime self-regulatory organization standards;
|
|
|
·
|
lack of raw materials;
|
|
|
·
|
bankruptcy or other financial crisis of the shipyard building the vessels;
|
|
|
·
|
our inability to obtain requisite financing or make timely payments;
|
|
|
·
|
a backlog of orders at the shipyard building the vessels;
|
|
|
·
|
hostilities or political or economic disturbances in the countries where the vessels are being built;
|
|
|
·
|
weather interference or catastrophic event, such as a major earthquake or fire;
|
|
|
·
|
our requests for changes to the original vessel specifications;
|
|
|
·
|
shortages or delays in the receipt of necessary construction materials, such as steel;
|
|
|
·
|
our inability to obtain requisite permits or approvals; or
|
|
|
·
|
a dispute with the shipyard building the vessels.
|
12
The delivery of the vessels we propose to acquire could be delayed because of, among other things, hostilities or political disturbances, non-performance of the purchase agreement with respect to the vessels by the seller, our inability to obtain requisite permits, approvals or financings or damage to or destruction of vessels while being operated by the seller prior to the delivery date.
We will be required to make substantial capital expenditures to expand the number of vessels in our fleet and to maintain all our vessels, which will be dependent on additional financing.
Our business strategy is based in part upon the expansion of our fleet through the purchase of additional vessels. We currently estimate, based upon current and anticipated market conditions, our capital expenditures of our vessels on order plus the potential acquisition of additional vessels in 2014 and 2015 will be between $300 and $400 million. In addition, we will incur significant maintenance costs for our current and any newly-acquired vessels. A newbuilding vessel must be drydocked within five years of its delivery from a shipyard, and vessels are typically drydocked every 30 to 60 months thereafter depending on the vessel, not including any unexpected repairs. We estimate the cost to drydock a vessel is between $0.5 and $1.0 million, depending on the size and condition of the vessel and the location of drydocking.
We will not be able to take advantage of favorable opportunities in the current spot market with respect to vessels employed on medium to long-term time charters.
As of
April
24
, 2014
, nine of our vessels in operation were employed under fixed rate time charter agreements. When our existing time charter agreements expire and upon delivery of our vessels on order or vessels to be ordered, we may enter into new time charter agreements for periods of one year or longer. Vessels committed to medium- and long-term time charters may not be available for spot charters during periods of increasing charter hire rates, when spot charters might be more profitable.
If we purchase and operate secondhand vessels, we will be exposed to increased operating costs that could adversely affect our earnings and, as our fleet ages, the risks associated with older vessels could adversely affect our ability to obtain profitable charters.
Our current business strategy includes additional growth through the acquisition of new and secondhand vessels. While we typically inspect secondhand vessels prior to purchase, this does not provide us with the same knowledge about their condition that we would have had if these vessels had been built for and operated exclusively by us. Generally, we do not receive the benefit of warranties from the builders of the secondhand vessels that we acquire.
In general, the costs to maintain a vessel in good operating condition increase with the age of the vessel. Older vessels are typically less fuel-efficient than more recently constructed vessels due to improvements in engine technology. Cargo insurance rates increase with the age of a vessel, making older vessels less desirable to charterers.
Governmental regulations, safety or other equipment standards related to the age of vessels may require expenditures for alterations or the addition of new equipment, to our vessels and may restrict the type of activities in which the vessels may engage. As our vessels age, market conditions may not justify those expenditures or enable us to operate our vessels profitably during the remainder of their useful lives.
An increase in operating or voyage costs would decrease earnings and available cash.
For all vessels in operation, the charterer is primarily responsible for voyage costs and we are responsible for the vessel operating costs. We may seek to employ one or more of our vessels directly in the spot market upon re-delivery from the current charterers by entering into a third-party spot chartering arrangement. Under a third-party spot chartering arrangement, our third-party chartering manager will contract voyages for the vessel in the spot market and we will be responsible for all cost associated with operating the vessel including operating expenses, voyage costs, bunkers, port and canal costs.
Our vessel operating costs include the costs of crew, provisions, deck and engine stores, insurance and maintenance, repairs and spares, which depend on a variety of factors, many of which are beyond our control. If our vessels suffer damage, they may need to be repaired at a drydocking facility. The costs of drydocking repairs are unpredictable and can be substantial. Increases in any of these expenses would decrease earnings and available cash.
13
If we are unable to operate our vessels profitably, we may be unsuccessful in competing in the highly competitive international tanker market, which would negatively affect our financial condition and our ability to expand our business.
The operation of tanker vessels and transportation of petroleum and chemical products is extremely competitive, in an industry that is capital intensive and highly fragmented. Competition arises primarily from other tanker owners, including major oil companies as well as independent tanker companies, some of which have substantially greater resources than we do. Competition for the transportation of oil products and chemicals can be intense and depends on price, location, size, age, condition and the acceptability of the tanker and its operators to the charterers. We may be unable to compete effectively with other tanker owners, including major oil companies as well as independent tanker companies.
Our market share may decrease in the future. We may not be able to compete profitably as we expand our business into new geographic regions or provide new services. New markets may require different skills, knowledge or strategies than we use in our current markets, and the competitors in those new markets may have greater financial strength and capital resources than we do.
The failure of our charterers to meet their obligations under our time charter agreements, on which we depend for a majority of our revenues, could cause us to suffer losses or otherwise adversely affect our business.
As of
April
24
, 2014
, nine of our vessels in operation were employed under fixed rate time charter agreements. When our existing time charter agreements expire and upon delivery of our vessels under construction or to be ordered, we may enter into new time charter agreements for periods of one year or longer. The ability and willingness of each of our counterparties to perform its obligations under a time charter agreement with us will depend on a number of factors that are beyond our control and may include, among other things, general economic conditions, the condition of the tanker shipping industry and the overall financial condition of the counterparties. Charterers are sensitive to the commodity markets and may be impacted by market forces affecting commodities. In addition, in depressed market conditions, there have been reports of charterers renegotiating their charters or defaulting on their obligations under charters. Our customers may fail to pay charter hire or attempt to renegotiate charter rates. Should counterparty fail to honor its obligations under agreements with us, it may be difficult to secure substitute employment for such vessel, and any new charter arrangements we secure in the spot market or on time charters may be at lower rates. Where we plan to employ a vessel in the spot-charter market, we intend to generally place such vessel in a commercial pool managed by a pool manager that pertains to that vessel's size class or alternatively, we may enter into a third-party spot-chartering arrangement. If our charterers fail to meet their obligations to us or attempt to renegotiate our charter agreements, we could sustain significant losses, which could have a material adverse effect on our business, financial condition, results of operations and cash flows, as well as our ability to pay dividends, if any, in the future, and compliance with covenants in our credit facilities.
Our charterers may terminate or default on their charters, which could adversely affect our results of operations and cash flow.
Our charters may terminate earlier than the dates indicated in the charter party agreements. The terms of our charters vary as to which events or occurrences will cause a charter to terminate or give the charterer the option to terminate the charter, but these generally include a total or constructive loss of the relevant vessel, the requisition for hire of the relevant vessel, the drydocking of the relevant vessel for a certain period of time or the failure of the relevant vessel to meet specified performance criteria. In addition, the ability of each of our charterers to perform its obligations under a charter will depend on a number of factors that are beyond our control. These factors may include general economic conditions, the condition of the tanker industry, the charter rates received for specific types of vessels and various operating expenses. The costs and delays associated with the default by a charterer under a charter of a vessel may be considerable and may adversely affect our business, results of operations, cash flows and financial condition and our available cash.
We cannot predict whether our charterers will, upon the expiration of their charters, re-charter our vessels on favorable terms or at all. If our charterers decide not to re-charter our vessels, we may not be able to re-charter them on terms similar to our current charters or at all. In the future, we may also employ our vessels on the spot-charter market, which is subject to greater rate fluctuation than the time charter market. Where we plan to employ a vessel in the spot-charter market, we intend to generally place such vessel in a tanker pool managed by a pool manager that pertains to that vessel's size class.
If we receive lower charter rates under replacement charters or are unable to re-charter all of our vessels, our available cash may be significantly reduced or eliminated.
14
Our ability to pay dividends may be limited by the amount of cash we generate from operations following the payment of fees and expenses, by the establishment of any reserves and by additional factors unrelated to our profitability.
We intend to pay regular quarterly dividends. The amount of dividends we will be able to pay will depend upon the amount of cash we generate from our operations. We may not, however, have sufficient cash available each quarter to pay dividends, as a result of insufficient levels of profit, restrictions on the payment of dividends and the decisions of our management and directors. The amount of cash we will have available for dividends may fluctuate upon, among other things:
|
|
·
|
the rates we obtain from our charters as well as the rates obtained upon the expiration of our existing charters;
|
|
|
·
|
the level of our operating costs;
|
|
|
·
|
the number of unscheduled off-hire days and the timing of, and number of days required for, scheduled drydocking of our vessels;
|
|
|
·
|
vessel acquisitions and related financings, such as restrictions in our credit facilities and in any future debt programs;
|
|
|
·
|
prevailing global and regional economic and political conditions;
|
|
|
·
|
the effect of governmental regulations and maritime self-regulatory organization standards, including with respect to environmental and safety matters, on the conduct of our business; and
|
|
|
·
|
changes in the bases of taxation of our activities in various jurisdictions.
|
The actual amount of cash we will have available for dividends will also depend on many factors, including:
|
|
·
|
changes in our operating cash flows, capital expenditure requirements, working capital requirements and other cash needs;
|
|
|
·
|
our fleet expansion strategy and associated uses of our cash and our financing requirements;
|
|
|
·
|
modification or revocation of our dividend policy by our board of directors;
|
|
|
·
|
the amount of any cash reserves established by our board of directors; and
|
|
|
·
|
restrictions under Marshall Islands law.
|
The amount of cash we generate from our operations may differ materially from our net income or loss for the period, which may be affected by non-cash items. We may incur other expenses or liabilities that could reduce or eliminate the cash available for distribution as dividends. Our credit facilities also restrict our ability to declare and pay dividends if an event of default has occurred and is continuing or if the payment of the dividend would result in an event of default. In addition, Marshall Islands law generally prohibits the payment of dividends other than from surplus (retained earnings in excess of consideration received for the sale of stock above the par value of the stock), or while a company is insolvent or if it would be rendered insolvent by the payment of such a dividend, and any such dividend may be discontinued at the discretion of our board of directors. As a result of these and other factors mentioned above, we may pay dividends during periods when we record losses and may not pay dividends during periods when we record income.
Our ability to obtain additional debt financing may be dependent on the performance of our then existing charters and the creditworthiness of our charterers.
The actual or perceived credit quality of our charterers, and any defaults by them, may materially affect our ability to obtain the additional capital resources that we will require to purchase additional vessels or may significantly increase our costs of obtaining such capital. Our inability to obtain additional financing at all or at a higher than anticipated cost may materially affect our results of operations and our ability to implement our business strategy.
Servicing debt, including debt which we may incur in the future, would limit funds available for other purposes and if we cannot service our debt, we may lose our vessels.
Borrowing under our existing credit facilities and the credit facilities that we expect to enter into as of the date of this annual report requires us to dedicate a part of our cash flow from operations to paying principal and interest on our indebtedness. These payments limit funds available for working capital, capital expenditures and other purposes, including further equity or debt financing in the future. Amounts borrowed under our credit facilities bear interest at variable rates. Increases in prevailing rates could increase the amounts that we would have to pay to our lenders, even though the outstanding principal amount remains the same, and our net income and cash flows would decrease. We expect our earnings and cash flow to vary from year to year due to the cyclical nature of the tanker industry. If we do not generate or reserve enough cash flow from operations to satisfy our debt obligations, we may have to:
|
|
·
|
seek to raise additional capital;
|
|
|
·
|
refinance or restructure our debt;
|
15
|
|
·
|
sell tankers; or
|
|
|
·
|
reduce or delay capital investments.
|
However, these alternatives, if necessary, may not be sufficient to allow us to meet our debt obligations. If we are unable to meet our debt obligations or if some other default occurs under our credit facilities, the lenders could elect to declare that debt, together with accrued interest and fees, to be immediately due and payable and proceed against the collateral vessels securing that debt even though the majority of the proceeds used to purchase the collateral vessels did not come from our credit facilities.
We are a holding company and depend on the ability of our subsidiaries to distribute funds to us in order to satisfy our financial obligations and to make dividend payments
.
We are a holding company, and our subsidiaries, which are all directly and indirectly wholly owned by us, conduct all of our operations and own all of our operating assets. As a result, our ability to satisfy our financial obligations and to pay dividends to our shareholders depends on the ability of our subsidiaries to generate profits available for distribution to us and, to the extent that they are unable to generate profits, we will be unable to pay dividends to our shareholders.
We have limited history operating as a publicly traded entity and may incur increased costs as a result of being a publicly traded corporation.
As a public company we have significant legal, accounting and other expenses in addition to our initial registration and listing expenses that we did not incur as a private company. In addition, the Sarbanes-Oxley Act of 2002 ("Sarbanes-Oxley"), as well as rules subsequently implemented by the SEC and the New York Stock Exchange, have imposed various requirements on public companies, including changes in corporate governance practices, and these requirements may continue to evolve. We and our management personnel, and other personnel, if any, will need to devote a substantial amount of time to comply with these requirements. Moreover, these rules and regulations increase our legal and financial compliance costs and make some activities more time-consuming and costly.
Sarbanes-Oxley requires, among other things, that we maintain and periodically evaluate our internal control over financial reporting and disclosure controls and procedures. Our compliance with Sarbanes-Oxley may require that we incur substantial accounting expenses and expend significant management efforts.
Our credit facilities contain restrictive covenants that limit the amount of cash that we may use for other corporate activities, which could negatively affect our growth and cause our financial performance to suffer.
Our credit facilities impose operating and financial restrictions on us. These restrictions may limit our ability, or the ability of our subsidiaries party thereto to:
|
|
·
|
pay dividends and make capital expenditures if we do not repay amounts drawn under our credit facilities or if there is another default under our credit facilities;
|
|
|
·
|
incur additional indebtedness, including the issuance of guarantees;
|
|
|
·
|
create liens on our assets;
|
|
|
·
|
change the flag, class or management of our vessels or terminate or materially amend the management agreement relating to each vessel;
|
|
|
·
|
sell our vessels;
|
|
|
·
|
merge or consolidate with, or transfer all or substantially all our assets to, another person; or
|
|
|
·
|
enter into a new line of business.
|
Certain of our credit facilities require us to maintain specified financial ratios and satisfy financial covenants. These financial ratios and covenants include requirements that:
|
|
·
|
we maintain minimum solvency of not less than 30%;
|
|
|
·
|
we maintain minimum cash and cash equivalents based on the number of vessels owned and chartered-in and debt service requirements. Our required minimum cash balance as of December 31, 2013 was $4.8 million;
|
|
|
·
|
the aggregate fair market value of our vessels plus any additional collateral shall, depending on the facility, be no less than 125% to 150% of the debt outstanding (value maintenance covenant);
|
|
|
·
|
we maintain a corporate net worth of not less than $45 million;
|
|
|
·
|
we maintain positive working capital, excluding balloon maturities; and
|
|
|
·
|
our ratio of EBITDA plus a portion of cash in excess of our minimum liquidity to total interest expense shall at all times exceed 2.25:1
|
16
Therefore, we may need to seek permission from our lenders in order to engage in some corporate actions. Our lenders' interests may be different from ours and we may not be able to obtain our lenders' permission when needed. This may limit our ability to pay dividends to you if we determine to do so in the future, finance our future operations or capital requirements, make acquisitions or pursue business opportunities.
We cannot assure you that we will complete documentation of or enter into our current two prospective debt facilities (the "Prospective Debt Facilities") or that if we do so that we will be able to borrow all or any of the amounts committed thereunder.
We are in advanced discussions with our relationship banks and have received non-binding indicative terms for two prospective debt facilities (the "Prospective Debt Facilities"). We intend to use the Prospective Debt Facilities to finance two of our vessels on order which remain unfinanced, and the
Ardmore Seamariner
which was acquired in October 2013 for cash. There can be no assurance we will be successful in completing documentation for the Prospective Debt Facilities, or that we will be successful in agreeing to terms with respect to the Prospective Debt Facilities.
If interest rates increase, it will affect the interest rate under our credit facilities which could affect our profitability, earnings and cash flow.
Amounts borrowed under our existing credit facilities bear interest at an annual rate ranging from 2.45% to 3.75% above LIBOR. Interest rates have recently been at historic lows and any normalization in interest rates would lead to an increase in LIBOR, which would affect the amount of interest payable on amounts that we were to drawdown from our credit facilities, which in turn would have an adverse effect on our profitability, earnings and cash flow.
If we fail to maintain an effective system of internal control over financial reporting, we may not be able to accurately report our financial results or prevent fraud. As a result, stockholders could lose confidence in our financial and other public reporting, which would harm our business and the trading price of our common stock.
Effective internal controls over financial reporting are necessary for us to provide reliable financial reports and, together with adequate disclosure controls and procedures, are designed to prevent fraud. Any failure to implement required new or improved controls, or difficulties encountered in their implementation, could cause us to fail to meet our reporting obligations. In addition, any testing by us conducted in connection with Section 404 of Sarbanes-Oxley, or any subsequent testing by our independent registered public accounting firm, may reveal deficiencies in our internal controls over financial reporting that are deemed to be material weaknesses or that may require prospective or retroactive changes to our financial statements or identify other areas for further attention or improvement. Inferior internal controls could also cause investors to lose confidence in our reported financial information, which could have a negative effect on the trading price of our common stock.
We will be required to disclose changes made in our internal controls and procedures and our management will be required to assess the effectiveness of these controls annually. However, for as long as we are an "emerging growth company," our independent registered public accounting firm will not be required to attest to the effectiveness of our internal controls over financial reporting pursuant to Section 404 of Sarbanes-Oxley. We could be an "emerging growth company" for up to five years. An independent assessment of the effectiveness of our internal controls could detect problems that our management's assessment might not. Undetected material weaknesses in our internal controls could lead to financial statements and restatements and require us to incur the expense of remediation.
In the course of auditing our financial statements for the year ended December 31, 2012, our independent registered public accounting firm identified a deficiency relating to the application of U.S. GAAP to deferred finance fees and capitalization of imputed interest on vessels under construction which they considered to be a material weakness. The PCAOB defines a material weakness as a deficiency, or combination of deficiencies, in internal control over financial reporting, such that there is a reasonable possibility that a material misstatement of a company's annual or interim financial statements will not be prevented or detected on a timely basis. We have implemented steps to remediate this weakness, including retaining the services of an independent accounting firm to assist with non-routine complex U.S. GAAP accounting issues, and during the year ended December 31, 2013, the material weakness has been remediated. However, if additional material weaknesses or significant deficiencies in our internal controls are discovered in the future, we may fail to meet our future reporting obligations, our financial statements may contain material misstatements and our operating results may be adversely affected.
17
We are subject to certain risks with respect to our counterparties on contracts, and failure of such counterparties to meet their obligations could cause us to suffer losses or negatively impact our results of operations and cash flows.
We have entered into various contracts with counterparties, including, as of
April
24
, 2014,
nine long-term fixed-rate charter agreements, two commercial pool agreements, our credit facilities and our capital lease arrangement. Such agreements subject us to counterparty risks. The ability of each of our counterparties to perform its obligations under a contract with us will depend on a number of factors that are beyond our control and may include, among other things, general economic conditions, the condition of the maritime and offshore industries, the overall financial condition of the counterparty, charter rates received for specific types of vessels, and various expenses. For example, the combination of a reduction of cash flow resulting from declines in world trade, a reduction in borrowing bases under reserve-based credit facilities and the lack of availability of debt or equity financing may result in a significant reduction in the ability of our charterers to make charter payments to us. In addition, in depressed market conditions, our charterers and customers may no longer need a vessel that is currently under charter or contract or may be able to obtain a comparable vessel at lower rates. As a result, charterers and customers may seek to renegotiate the terms of their existing charter agreements or avoid their obligations under those contracts. Should a counterparty fail to honor its obligations under agreements with us, we could sustain significant losses, which could have a material adverse effect on our business, financial condition, results of operations and cash flows.
Our insurance may not be adequate to cover our losses that may result from our operations due to the inherent operational risks of the tanker industry.
We carry insurance to protect us against most of the accident-related risks involved in the conduct of our business, including marine hull and machinery insurance, protection and indemnity insurance, which includes pollution risks, crew insurance and war risk insurance. However, we may not be adequately insured to cover losses from our operational risks, which could have a material adverse effect on us. Additionally, our insurers may refuse to pay particular claims and our insurance may be voidable by the insurers if we take, or fail to take, certain action, such as failing to maintain certification of our vessels with applicable maritime regulatory organizations. Any significant uninsured or under-insured loss or liability could have a material adverse effect on our business, results of operations, cash flows and financial condition and our available cash. In addition, we may not be able to obtain adequate insurance coverage at reasonable rates in the future during adverse insurance market conditions.
Changes in the insurance markets attributable to terrorist attacks may also make certain types of insurance more difficult for us to obtain due to increased premiums or reduced or restricted coverage for losses caused by terrorist acts generally.
Because we obtain some of our insurance through protection and indemnity associations, which result in significant expenses to us, we may be required to make additional premium payments.
We may be subject to increased premium payments, or calls, in amounts based on our claim records, the claim records of our managers, as well as the claim records of other members of the protection and indemnity associations through which we receive insurance coverage for tort liability, including pollution-related liability. In addition, our protection and indemnity associations may not have enough resources to cover claims made against them. Our payment of these calls could result in significant expense to us, which could have a material adverse effect on our business, results of operations, cash flows, financial condition and available cash.
We are incorporated in the Marshall Islands, which does not have a well-developed body of case law or bankruptcy law and, as a result, shareholders may have fewer rights and protections under Marshall Islands law than under a typical jurisdiction in the United States.
Our corporate affairs are governed by our articles of incorporation and bylaws and by the Marshall Islands Business Corporations Act (the "BCA"). The provisions of the BCA resemble provisions of the corporation laws of a number of states in the United States. However, there have been few judicial cases in the Marshall Islands interpreting the BCA. The rights and fiduciary responsibilities of directors under the law of the Marshall Islands are not as clearly established as the rights and fiduciary responsibilities of directors under statutes or judicial precedent in existence in certain U.S. jurisdictions. Shareholder rights may differ as well. While the BCA does specifically incorporate the non-statutory law, or judicial case law, of the State of Delaware and other states with substantially similar legislative provisions, our public shareholders may have more difficulty in protecting their interests in the face of actions by management, directors or controlling shareholders than would shareholders of a corporation incorporated in a U.S. jurisdiction. Further, Marshall Islands does not have a well-developed body of bankruptcy law. As such, in the case of a bankruptcy of our Company, there may be a delay of bankruptcy proceedings and the ability of shareholders and creditors to receive recovery after a bankruptcy proceeding.
18
Our business depends upon key members of our senior management team who may not necessarily continue to work for us.
Our future success depends to a significant extent upon certain members of our senior management team. Our management team have substantial experience in the product tanker and chemical shipping industries and have worked with us since inception. Our management team is crucial to the execution of our business strategies and to the growth and development of our business. If the individuals were no longer to be affiliated with us, we may be unable to recruit other employees with equivalent talent and experience, and our business and financial condition may suffer as a result.
It may be difficult to serve process on or enforce a U.S. judgment against us, our officers and our directors.
We are a Marshall Islands corporation and several of our executive offices are located outside of the United States. Some of our directors and officers and certain of the experts named in this Annual Report reside outside the United States. In addition, a substantial portion of our assets and the assets of our directors, officers and experts are located outside of the United States. As a result, you may have difficulty serving legal process within the United States upon us or any of these persons. You may also have difficulty enforcing, both in and outside the United States, judgments you may obtain in U.S. courts against us or any of these persons in any action, including actions based upon the civil liability provisions of U.S. federal or state securities laws. Furthermore, there is substantial doubt that the courts of the Marshall Islands or of the non-U.S. jurisdictions in which our offices are located would enter judgments in original actions brought in those courts predicated on U.S. federal or state securities laws.
GA Holdings LLC ("GA Holdings") beneficially owns approximately 30.8% of our total outstanding common shares, which may limit shareholders' ability to influence our actions.
GA Holdings beneficially owns approximately 30.8% of our outstanding common shares and has the power to exert considerable influence over our actions through their ability to effectively control matters requiring shareholder approval, including the determination to enter into a corporate transaction or to prevent a transaction, regardless of whether our shareholders believe that any such transaction is in their or our best interests. For example, GA Holdings could cause us to consummate a merger or acquisition that increases the amount of our indebtedness or cause us to sell all of our revenue-generating assets. We cannot assure you that the interests of GA Holdings will coincide with the interests of other shareholders. As a result, the market price of our common shares could be adversely affected.
Additionally, GA Holdings may invest in entities that directly or indirectly compete with us, or companies in which GA Holdings currently invests may begin competing with us. GA Holdings may also separately pursue acquisition opportunities that may be complementary to our business, and as a result, those acquisition opportunities may not be available to us. As a result of these relationships, when conflicts arise between the interests of GA Holdings and the interests of our other shareholders, our directors who were nominated by GA Holdings may not be disinterested. GA Holdings will effectively control all of our corporate decisions so long as they continue to own a substantial number of our common shares.
Future sales of our common shares could cause the market price of our common shares to decline.
The market price for our common shares could decline as a result of sales by existing shareholders, including GA Holdings, of large numbers of our common shares, or as a result of the perception that such sales may occur. Sales of our common shares by these shareholders also might make it more difficult for us to sell equity or equity-related securities in the future at a time and at the prices that we deem appropriate.
Anti-takeover provisions in our Amended and Restated Articles of Incorporation could make it difficult for our shareholders to replace or remove our current board of directors or could have the effect of discouraging, delaying or preventing a merger or acquisition, which could adversely affect the market price of our common shares.
Several provisions of our Amended and Restated Articles of Incorporation and bylaws could make it difficult for our shareholders to change the composition of our board of directors in any one year, preventing them from changing the composition of management. In addition, the same provisions may discourage, delay or prevent a merger or acquisition that shareholders may consider favorable. These provisions include:
|
|
·
|
authorizing the board of directors to issue "blank check" preferred stock without shareholder approval;
|
|
|
·
|
providing for a classified board of directors with staggered, three year terms;
|
|
|
·
|
prohibiting cumulative voting in the election of directors;
|
|
|
·
|
authorizing the removal of directors only for cause and only upon the affirmative vote of the holders of two-thirds of the outstanding shares of our common stock entitled to vote for the directors;
|
19
|
|
·
|
limiting the persons who may call special meetings of shareholders; and
|
|
|
·
|
establishing advance notice requirements for nominations for election to our board of directors or for proposing matters that can be acted on by shareholders at shareholder meetings.
|
These anti-takeover provisions could substantially impede the ability of public shareholders to benefit from a change in control and, as a result, may adversely affect the market price of our common stock and your ability to realize any potential change of control premium.
Tax Risks
U.S. tax authorities could treat us as a "passive foreign investment company," which could have adverse U.S. federal income tax consequences to U.S. holders.
A foreign corporation will be treated as a passive foreign investment company ("PFIC"), for U.S. federal income tax purposes if either (1) at least 75% of its gross income for any taxable year consists of "passive income" or (2) at least 50% of the average value of the corporation's assets produce or are held for the production of "passive income." For purposes of these tests, "passive income" generally includes dividends, interest, and gains from the sale or exchange of investment property and rents and royalties other than rents and royalties which are received from unrelated parties in connection with the active conduct of a trade or business. For purposes of these tests, income derived from the performance of services generally does not constitute "passive income." U.S. shareholders of a PFIC are subject to an adverse U.S. federal income tax regime with respect to the income derived by the PFIC, the distributions they receive from the PFIC and the gain, if any, they derive from the sale or other disposition of their shares in the PFIC.
Based upon our operations as described herein, we do not believe that our income from our time charters should be treated as "passive income" for purposes of determining whether we are a PFIC, and, consequently, the assets that we own and operate in connection with the production of that income should not constitute passive assets. Accordingly, based on our current operations, we do not believe we will be treated as a PFIC with respect to any taxable year.
There is substantial legal authority supporting this position consisting of case law and U.S. Internal Revenue Service ("IRS"), pronouncements concerning the characterization of income derived from time charters and voyage charters as services income for other tax purposes. However, there is also authority which characterizes time charter income as rental income rather than services income for other tax purposes. Accordingly, no assurance can be given that the IRS or a court of law will accept this position, and there is a risk that the IRS or a court of law could determine that we are a PFIC. Moreover, no assurance can be given that we would not constitute a PFIC for any future taxable year if the nature and extent of our operations change.
If the IRS were successful in asserting that we are or have been a PFIC for any taxable year, U.S. shareholders would face adverse U.S. federal income tax consequences. Under the PFIC rules, unless a shareholder makes an election available under the U.S. Internal Revenue Code of 1986, as amended, ("the Code"), (which election could itself have adverse consequences for such shareholders, as discussed below under "Tax Considerations—U.S. Federal Income Tax Considerations—U.S. Federal Income Taxation of U.S. Holders"), excess distributions and any gain from the disposition of such shareholder's common shares would be allocated ratably over the shareholder's holding period of the common shares and the amounts allocated to the taxable year of the excess distribution or sale or other disposition and to any year before we became a PFIC would be taxed as ordinary income. The amount allocated to each other taxable year would be subject to tax at the highest rate in effect for individuals or corporations, as appropriate, for that taxable year, and an interest charge would be imposed with respect to such tax. See "Tax Considerations—U.S. Federal Income Tax Considerations—U.S. Federal Income Taxation of United States Holders" for a more comprehensive discussion of the U.S. federal income tax consequences to United States shareholders if we are treated as a PFIC.
We may have to pay tax on U.S. source shipping income, which would reduce our earnings.
Under the Code, 50% of the gross shipping income of a corporation that owns or charters vessels, as we and our subsidiaries do, that is attributable to transportation that begins or ends, but that does not both begin and end, in the United States will be subject to a 4% U.S. federal income tax without allowance for deduction, unless that corporation qualifies for exemption from tax under Section 883 of the Code and the applicable Treasury Regulations promulgated thereunder or that corporation is entitled to an exemption from such tax under an applicable U.S. income tax treaty.
20
Prior to our IPO, we believe that we had been exempt from this tax because we were entitled to the benefits of the U.S.–Irish tax treaty, which generally contains an exemption from this tax for qualified Irish residents. After our IPO, we no longer qualified for an exemption under the U.S.–Irish tax treaty. However, we believe and intend to take the position for U.S. federal income tax return reporting purposes that we qualified exemption under Section 883 of the Code for the full taxable year 2013 based on the CFC Test. Beginning our taxable year 2014 and future years, we expect that we will be able to qualify for exemption under Section 883 of the Code based on the Publicly-Traded Test.However, there are factual circumstances beyond our control that could cause us to lose the benefit of the tax exemption by not being able to qualify for the Publicly-Traded Test and thereby become subject to U.S. federal income tax on our U.S. source shipping income. For example, we would no longer qualify for exemption under Section 883 of the Code based on the Publicly-Traded Test for a particular taxable year if certain “non-qualified” shareholders with a 5% or greater interest in our common shares owned, in the aggregate, 50% or more of our outstanding common shares for more than half the days during the taxable year. Due to the factual nature of the issues involved, there can be no assurances that we will qualify for exemption under Section 883 of the Code for 2014 and future years based on the Publicly-Traded Test.
If we or our subsidiaries were not entitled to exemption under Section 883 of the Code for any taxable year, we or our subsidiaries would be subject for such year to an effective 2% U.S. federal income tax on the shipping income we or our subsidiaries derive during the year which is attributable to the transport of cargoes to or from the United States. The imposition of this taxation would have a negative effect on our business and would decrease our earnings available for distribution to our shareholders.
If our effective tax rate increases, our business and financial results would be adversely impacted.
We have significant operations and currently generate a significant portion of our taxable income in Ireland. In general, tax rates in Ireland on trading income are significantly lower than tax rates in the United States and many other developed jurisdictions. Moreover, our "relevant shipping profits" are taxed in Ireland under the "Tonnage Tax" regime. Tonnage Tax provides an alternative to charging corporation tax on certain profits of a qualifying shipping company. Rather than charging corporation tax in the normal way, tax is levied each year by reference to the tonnage of the ships operated by the qualifying company. We have received approval from the Irish Revenue Commissioners to operate a number of our ship-owning subsidiaries as qualifying shipping companies under the Tonnage Tax regime. In order to ensure a compliance with the Tonnage Tax regime, a number of conditions must continue to be satisfied. Importantly we must carry on the strategic and commercial management of our 'qualifying ships' from Ireland. If our operations no longer qualify for the lower and predictable tax rates available under Tonnage Tax or if the tax laws in Ireland were rescinded or changed, our effective tax rate could increase and our business, financial condition and results of operations could be materially adversely affected. In addition, if U.S. or other tax authorities were to challenge successfully the manner in which we recognize profits or, more generally, the jurisdiction in which our income is subject to taxation, our effective tax rate could increase and our cash flow and results of operations could be materially adversely affected.
|
A.
|
History and Development of the Company
|
We are Ardmore Shipping Corporation, a company incorporated in the Republic of the Marshall Islands. We provide seaborne transportation of petroleum products and chemicals worldwide to oil majors, national oil companies, oil and chemical traders, and chemical companies, with our modern, fuel-efficient fleet of mid-size product and chemical tankers.
Ardmore Shipping Corporation was incorporated under the laws of the Republic of the Marshall Islands on May 14, 2013. We commenced business operations through our predecessor company, Ardmore Shipping LLC, on April 15, 2010. On August 6, 2013, we completed our initial public offering ("IPO") of 10,000,000 shares of our common stock, at $14.00 per share. Prior to our IPO, GA Holdings LLC, who was our sole shareholder, exchanged its interest in its wholly owned subsidiary, Ardmore Shipping LLC, for 8,049,500 additional shares of Ardmore Shipping Corporation, and Ardmore Shipping LLC became a wholly owned subsidiary of Ardmore Shipping Corporation. In March 2014, we completed a follow-on public offering of 8,050,000 of our common shares at $13.50 per share. As of the date of this annual report, we have 26,100,000 shares of our common stock outstanding. GA Holdings LLC holds 8,050,000, or 30.8%, of the common stock of the Company, with the remaining 69.2% held by public investors.
We have 31 wholly owned subsidiaries, a list of which is in our consolidated financial statements, which are included elsewhere in this Annual Report.
21
We currently maintain our principal executive offices at Hamilton, Bermuda and our principal operating office at Cork, Ireland. Our telephone at 69 Pitts Bay Road, Hamilton, HM 08, Bermuda is +1 441 405 7800. We operate our business internally through our wholly-owned management company, Ardmore Shipping Limited ("ASL"), which is incorporated in Ireland. ASL's office is located at City Gate Building 1000, Mahon, Cork, Ireland. Our telephone at this address is +353 21 240 9500.
Vessel Acquisitions
Our Current Fleet consists of 21 vessels and is comprised of 11 vessels in operation ("Operational Vessels") and 10 vessels on order ("Ordered Vessels"). We expect deliveries of our Ordered Vessels to begin in November 2014. In 2011, we paid an aggregate of $56.8 for vessel acquisitions, vessel equipment and newbuilding orders. In 2012, we did not acquire any vessels and paid $14.9 million for vessel upgrades and progress payments for vessels under construction. In 2013, we paid an aggregate of $144.6 million for vessel acquisitions, equipment and vessels under construction.
In June and July 2011, we took delivery of the
Ardmore Calypso
and the
Ardmore Capella
. These vessels are 17,589 dwt and 17,567 dwt respectively and both ships are IMO2 product and chemical tankers built by Samho Shipbuilding in South Korea.
In February 2013, we took delivery of the
Ardmore Seavaliant,
a 49,998 dwt IMO3 product and chemical tanker built by SPP Shipbuilding in South Korea. In June 2013, we took delivery of the
Ardmore Seaventure
, a 49,998 dwt IMO3 product and chemical tanker built by SPP Shipbuilding in South Korea.
In January 2014, we took delivery of the
Ardmore Seamariner
, a 45,726 dwt product tanker built by Minami-Nippon, Usuki Shipyard in Japan. In January 2014, we also took delivery of the
Ardmore Seavantage,
a 49,997 dwt IMO3 product and chemical tanker built by SPP Shipbuilding in South Korea. In February 2014, we took delivery of the
Ardmore Seavanguard
, a 49,998 dwt IMO3 product and chemical tanker built by SPP Shipbuilding in South Korea.
Implications of Being an Emerging Growth Company
We were incorporated in the Republic of the Marshall Islands on May 14, 2013 for the purpose of providing seaborne transportation of petroleum products and chemicals worldwide.
We had less than $1.0 billion in revenue during our last fiscal year, which means that we qualify as an "emerging growth company" as defined in the Jumpstart Our Business Startups Act, or JOBS Act. An emerging growth company may take advantage of specified reduced reporting and other burdens that are otherwise applicable generally to public companies. These provisions include:
|
|
·
|
the ability to present only two years of audited financial statements and only two years of related Management's Discussion and Analysis of Financial Condition and Results of Operations in the registration statement for our initial public offering;
|
|
|
·
|
exemption from the auditor attestation requirement in the assessment of the emerging growth company's internal controls over financial reporting;
|
|
|
·
|
exemption from new or revised financial accounting standards applicable to public companies until such standards are also applicable to private companies; and
|
|
|
·
|
exemption from compliance with any new requirements adopted by the Public Company Accounting Oversight Board, or the PCAOB, requiring mandatory audit firm rotation or a supplement to our auditor's report in which the auditor would be required to provide additional information about the audit and our financial statement.
|
We may take advantage of these provisions until the end of the fiscal year following the fifth anniversary of our initial public offering or such earlier time that we are no longer an emerging
growth company. We will cease to be an emerging growth company if we have more than $1.0 billion in "total annual gross revenues" during our most recently completed fiscal year, if we become a "large accelerated filer" with market capitalization of more than $700 million, or as of any date on which we have issued more than $1.0 billion in non-convertible debt over the three year period to such date. As of the date of this annual report, we do not expect to become a "large accelerated filer". For as long as we take advantage of the reduced reporting obligations, the information that we provide shareholders may be different from information provided by other public companies. We are choosing to "opt out" of the extended transition period relating to the exemption from new or revised financial accounting standards and as a result, we will comply with new or revised accounting standards on the relevant dates on which adoption of such standards is required for non-emerging growth companies. Section 107 of the JOBS Act provides that our decision to opt out of the extended transition period for complying with new or revised accounting standards is irrevocable.
22
|
B.
|
Business Overview
|
We commenced business operations in April 2010 with the goal of building an enduring product and chemical tanker company that emphasizes service excellence, innovation, and operational efficiency through our focus on high quality, fuel-efficient vessels. We are led by a team of experienced senior managers who have previously held senior management positions with highly regarded public shipping companies and financial institutions.
We are strategically focused on modern, fuel-efficient, mid-size product and chemical tankers. We actively pursue opportunities to exploit the overlap we believe exists between the clean petroleum product ("CPP") and chemical sectors in order to enhance earnings, and also seek to engage in more complex CPP trades, such as multi-grade and multi-port loading and discharging operations, where our knowledge of chemical operations is beneficial to our CPP customers.
Our fuel-efficient operations are designed to enhance our investment returns and provide value-added service to our customers. We believe we are on the forefront of fuel efficiency and emissions reduction trends and are well-positioned to capitalize on these developments by constructing new economically advanced vessels ("Eco-design"), modifying ships to improve fuel efficiency ("Eco-mod"), and equipping our fleet with engine diagnostic and ship performance management systems to optimize voyage performance. As a result, our Eco-mod vessels achieve lower fuel consumption and, in some cases, achieve performance close to that of new Eco-design vessels. All of our vessels on order are Eco-design and we intend to make Eco-mod improvements to any secondhand acquisitions as necessary. Our acquisition strategy is to build our fleet with Eco-design newbuildings and modern secondhand vessels that can be upgraded to Eco-mod.
We have no related-party transactions concerning our vessel operations. Our wholly-owned subsidiary, ASL, carries out our management functions. ASL's office is in Cork, Ireland. ASL provides corporate and accounting services and fleet administration. Technical management of our vessels is performed by a combination of ASL and our third-party technical managers. ASL's operations team is directly responsible for insurance and for overseeing significant operational functions of the third-party technical managers. ASL's operations team also supervises the construction of our newbuildings in close coordination with the third-party supervision teams. We have a resolute focus on both high-quality service and efficient operations, and we believe that our corporate overhead and operating expenses are among the lowest of our peers.
We are commercially independent as we have no blanket employment arrangements with third-party or related-party commercial managers. We market our services directly to a broad range of customers, including oil majors, national oil companies, oil and chemical traders, chemical companies, and a range of pooling service providers. We monitor the market to understand and best utilize our vessels and may change our chartering strategy to take advantage of changing market conditions.
We believe that the market for mid-size product and chemical tankers is in the early stages of a recovery from cyclical lows, resulting from strong underlying demand growth driven by both cyclical and secular trends, as well as a reduction in the supply overhang due to reduced ordering activity and an extended period of fleet growth at a rate below that of demand growth. The Company was formed at a historically low point in the shipping cycle which our management believes represented an opportunity to build our fleet and business with a low cost asset base.
Fleet List
Our Current Fleet consists of 21 vessels and is comprised of 11 Operational Vessels (four Eco-design and seven Eco-mod) and 10 Ordered Vessels (all Eco-design) with deliveries expected to begin in November 2014. The average age of our Operational Vessels, at
April
24
, 2013, is
5.9
years, and the average age of the Current Fleet following delivery of the Ordered Vessels at December 31, 2015 will be 4.0 years.
23
|
Vessel Name
|
Type
|
Dwt
|
IMO
|
Built Date
|
Built Country
|
Flag
|
Charter Rate $/day
(1)
|
Charter Expires
|
Specification
|
|||||||||||||||
|
In Operation
|
||||||||||||||||||||||||
|
Ardmore Seavaliant
|
Product/Chemical
|
49,998 | 3 |
Feb-13
|
Korea
|
MI
|
17,149 |
Feb-15
|
Eco-design
|
|||||||||||||||
|
Ardmore Seaventure
|
Product/Chemical
|
49,998 | 3 |
Jun-13
|
Korea
|
MI
|
15,873 |
Jun-14
|
Eco-design
|
|||||||||||||||
|
Ardmore
Seavantage
|
Product/Chemical
|
49,997 | 3 |
Jan-14
|
Korea
|
MI
|
15,600 |
Jan-15
|
Eco-design
|
|||||||||||||||
|
Ardmore Seavanguard
|
Product/Chemical
|
49,998 | 3 |
Feb-14
|
Korea
|
MI
|
15,600 |
Feb-15
|
Eco-design
|
|||||||||||||||
|
Ardmore Seamariner
|
Product
|
45,726 | - |
Oct-06
|
Japan
|
MI
|
16,099 |
Apr-14
|
Eco-mod
|
|||||||||||||||
|
Ardmore Seatrader
|
Product
|
47,141 | - |
Dec-02
|
Japan
|
MI
|
14,299 |
Aug-14
|
Eco-mod
|
|||||||||||||||
|
Ardmore Seamaster
|
Product/Chemical
|
45,840 | 3 |
Sep-04
|
Japan
|
MI
|
14,299 |
Jul-14
|
Eco-mod
|
|||||||||||||||
|
Ardmore Seafarer
|
Product
|
45,744 | - |
Aug-04
|
Japan
|
MI
|
13,783 |
Jul-14
|
Eco-mod
|
|||||||||||||||
|
Ardmore Centurion
|
Product/Chemical
|
29,006 | 2 |
Nov-05
|
Korea
|
MI
|
13,549 |
Feb-15
|
Eco-mod
|
|||||||||||||||
|
Ardmore Calypso
|
Product/Chemical
|
17,589 | 2 |
Jan-10
|
Korea
|
MI
|
Pool
|
N/A |
Eco-mod
|
|||||||||||||||
|
Ardmore Capella
|
Product/Chemical
|
17,567 | 2 |
Jan-10
|
Korea
|
MI
|
Pool
|
N/A |
Eco-mod
|
|||||||||||||||
|
On Order
|
||||||||||||||||||||||||
|
SPP Hull S-1162
|
Product/Chemical
|
50,300 | 3 | 1Q15 |
Korea
|
MI
|
Pool
|
Eco-design
|
||||||||||||||||
|
SPP Hull S-1163
|
Product/Chemical
|
50,300 | 3 | 2Q15 |
Korea
|
MI
|
Pool
|
Eco-design
|
||||||||||||||||
|
SPP Hull S-1171
|
Product/Chemical
|
50,300 | 3 | 2Q15 |
Korea
|
MI
|
Pool
|
Eco-design
|
||||||||||||||||
|
SPP Hull S-1172
|
Product/Chemical
|
50,300 | 3 | 3Q15 |
Korea
|
MI
|
Pool
|
Eco-design
|
||||||||||||||||
|
HMD Hull H-2480
|
Product/Chemical
|
37,000 | 2 | 1Q15 |
Korea
|
MI
|
TBD
|
Eco-design
|
||||||||||||||||
|
HMD Hull H-2481
|
Product/Chemical
|
37,000 | 2 | 1Q15 |
Korea
|
MI
|
TBD
|
Eco-design
|
||||||||||||||||
|
FKA Hull N-2062
|
Product/Chemical
|
25,000 | 2 | 4Q14 |
Japan
|
MI
|
TBD
|
Eco-design
|
||||||||||||||||
|
FKA Hull N-2063
|
Product/Chemical
|
25,000 | 2 | 1Q15 |
Japan
|
MI
|
TBD
|
Eco-design
|
||||||||||||||||
|
FKA Hull N-2065
|
Product/Chemical
|
25,000 | 2 | 3Q15 |
Japan
|
MI
|
TBD
|
Eco-design
|
||||||||||||||||
|
FKA Hull N-2067
|
Product/Chemical
|
25,000 | 2 | 4Q15 |
Japan
|
MI
|
TBD
|
Eco-design
|
||||||||||||||||
|
Total
|
21
|
823,804 | ||||||||||||||||||||||
|
|
(1)
|
This table shows gross charter rates, averaged over the duration, as applicable, plus communications, victualing and entertainment ("CVE") income and does not include commissions payable by us at a rate of 1.25%, where applicable.
|
Recent Developments
On February 7, 2014 we obtained a permit from the Ministry of Finance in Bermuda to open an executive office at 69 Pitts Bay Road, Hamilton, HM 08, Bermuda. Our operating office, through ASL, will continue to be located at City Gate Building 1000, Mahon, Cork, Ireland.
In March 2014, we conducted a follow-on public offering of 8,050,000 common shares at $13.50 per share. The gross proceeds to the Company from the offering were $108.7 million before deducting underwriting commissions and related expenses.
Corporate Officers, Staff and Seafarers
Biographical information with respect to each of our directors and executive officers is set forth in the section titled "Directors and Senior Management."
We employ 14 full time staff at ASL in the port city of Cork, Ireland. We engage the services of two third-party ship management companies, Thome Ship Management and Univan Ship Management Limited, to provide technical management and crewing for our vessels, who are supervised by our in-house operations department comprising the Chief Operating Officer, Director of Chartering and Business Development, Director of Technical Services, Manager Marine and Insurance and Manager Cargo Operations. We play a central role in the selection and retention of all officers through our human resources strategy, comprising all key elements from attraction, selection, recruitment and retention. We currently employ, through our third-party technical managers, approximately four hundred seafarers, comprising one hundred and thirty officers and cadets and two hundred and seventy crew.
24
Our commercial management is managed in-house in the case of fixed time charters and by third-party commercial pool managers in the case where we operate our vessels in the spot market. Commercial pools provide many benefits for vessels operating in the spot market including the ability to generate higher returns due to the economies of scale derived by operating a larger fleet.
Customers
Our customers include national, regional, and international companies and our fleet is employed through a mixture of time charters, time charters with profit participation and direct pool employment. We believe that developing strong relationships with the end users of our services allow us to better satisfy their needs with appropriate and capable vessels. A prospective charterer's financial condition, creditworthiness, and reliability track record are important factors in negotiating our vessels' employment. Below is a brief description of our current customers:
|
|
·
|
Mansell Limited
is the commercial shipping arm of Vitol SA, one of the world's largest independent energy trading companies. Mansell Limited's activities complement the core cargo flows of Vitol SA, and through access to third-party and internal cargoes it seeks to maximise utilisation of its fleet.
|
|
|
·
|
Itochu Enex
is a global diversified business that trades petroleum products. Itochu Enex's Industrial Material segment is engaged in the sale of energy, materials, asphalt and cements, the manufacture, sale and distribution of high-pressure gas and liquefied natural gas, as well as the production, supply and sale of electrical power, steam and water.
|
|
|
·
|
Cargill International S.A
. is an international producer and marketer of food, agricultural, financial and industrial products and services.
|
|
|
·
|
Koch Shipping Inc.
is a supply and trading marine logistics company.
|
|
|
·
|
Nordic Womar Pte
is a tanker pool operating company, specializing in oil and chemical tanker tonnage up to 30,000 dwt.
|
|
|
·
|
Dampskibsselskabet Norden A/S
is an independent shipping company incorporated in Denmark and operates in the dry cargo and tanker segment worldwide.
|
|
|
·
|
Shell
is a global group of energy and petrochemicals companies with world wide operations.
|
Competition
We operate in markets that are highly competitive and based primarily on supply and demand. We compete for charters on the basis of price, vessel location, size, age and condition of the vessel, as well as our reputation. Ownership of tanker vessels is highly fragmented and is divided among publicly listed companies, state-controlled owners and private shipowners.
Our Credit Facilities
Ten of our Operational Vessels and eight of our Ordered Vessels have senior debt facilities in place, none of which expire until 2018. Of the four debt facilities that we currently have in place, two are with ABN AMRO Bank N.V. based in the Netherlands (the "First ABN AMRO Facility" and the "Second ABN AMRO Facility"), one is with DVB Bank SE based in Germany (the "DVB Facility") and one is a joint facility with ABN AMRO Bank N.V., Nordea Bank Finland Plc and Skandinaviska Enskilda Banken AB (the "Joint Debt Facility"). We also have a capital lease financing facility for two of the vessels with ICON Investments based in New York, USA (the "ICON Capital Leases") in an amount of $31.5 million.
The First ABN AMRO Facility is in the amount of $40.5 million and bears interest at a rate of 3.25% above LIBOR. We entered into this facility to finance the acquisition of the
Ardmore Seatrader
, the
Ardmore Calypso
and the
Ardmore Capella
. This loan was drawn down in three tranches. The first tranche was drawn down in April 2011 and the second and third tranches were drawn down in June 2011, totalling $32.0 million. The remaining $8.5 million is no longer available for borrowing. On March 28, 2013 two of the subsidiaries subject to the First ABN AMRO Facility entered into an agreement for the sale and leaseback (under the ICON Capital Leases) for $31.5 million. As part of this arrangement, the senior debt outstanding on the
Ardmore Calypso
and
Ardmore Capella
was repaid in full on April 2, 2013. The amount repaid was $17.9 million. As such, of the First ABN AMRO Facility, one vessel remains with debt outstanding and this fully matures in 2018.
The Second ABN AMRO Facility is in the amount of $48.9 million and bears interest at a rate of 3.20% above LIBOR. We entered into this facility to finance the acquisition of the
Ardmore Seavaliant
and the
Ardmore Seaventure
and the full amount, $48.9 million, of this facility was drawn down in line with its terms.
25
The DVB Facility is in the amount of $81.9 million. The first tranche, which was drawn down in October 2012, bears interest at a rate 3.75% above LIBOR. The second and third tranche were drawn down in January 2014 and February 2014, and bear interest at a rate of 2.45% above LIBOR. We entered into the DVB Facility to finance the
Ardmore Seafarer
,
Ardmore Seamaster
,
Ardmore Centurion
,
Ardmore Seavantage
and
Ardmore Seavanguard
. The amount drawn down under this facility as of December 31, 2013 was $36.9 million. The remainder of the DVB Facility, $45.0 million, was drawn down in two equal installments just prior to delivery of the
Ardmore Seavantage
and
Ardmore Seavanguard
in January 2014 and February 2014, respectively.
The Joint Debt Facility is in the amount of $172.0 million. This facility provides financing for eight of our Ordered Vessels. Drawdowns will be made in line with deliveries of each vessel, and we expect to begin drawing down on the facility in January 2015. Interest is calculated on each tranche at a rate of 3.15% above LIBOR. The terms of the Joint Debt Facility include an accordion option whereby, subject to lenders' approval, we may request to increase the Joint Debt Facility to finance the acquisition of additional vessels.
We are also in advanced discussions with our relationship banks and have received non-binding indicative terms for two additional debt facilities (the "Prospective Debt Facilities"). If obtained, we intend to use these facilities to finance the remaining two of our Ordered Vessels and the
Ardmore Seamariner
which was acquired in October 2013 with cash.
Agreements related to long-term debt obligations stated above include certain covenants. The financial covenants include:
|
|
·
|
we maintain minimum solvency of not less than 30%;
|
|
|
·
|
we maintain minimum cash and cash equivalents based on the number of vessels owned and chartered-in and debt service requirements. Our required minimum cash balance as of December 31, 2013 was $4.8 million;
|
|
|
·
|
the aggregate fair market value of our vessels plus any additional collateral shall, depending on the facility, be no less than 125% to 150% of the debt outstanding (value maintenance covenant);
|
|
|
·
|
we maintain a corporate net worth of not less than $45 million;
|
|
|
·
|
we maintain positive working capital, excluding balloon maturities; and
|
|
|
·
|
our ratio of EBITDA plus a portion of cash in excess of our minimum liquidity to total interest expense shall at all times exceed 2.25:1
|
The long-term debt obligations do not impose a restriction on dividends, distributions, or returns of capital unless an event of default has occurred, is continuing or will result from such payment. We are fully compliant with all of our loan covenants as of December 31, 2013.
The International Product and Chemical Tanker Industry
The information and data contained in this section relating to the international product and chemical tanker shipping industries has been provided by Drewry Maritime Research ("Drewry"), and is taken from Drewry's database and other sources. Drewry has advised that: (i) some information in their database is derived from estimates or subjective judgments; (ii) the information in the databases of other maritime data collection agencies may differ from the information in their database. We believe that all third-party data provided in this section, "The International Product and Chemical Tanker Industry," is reliable.
The world tanker fleet is generally divided into four main categories of vessels based on the main type of cargo carried. These categories are crude oil, refined petroleum products (both clean and dirty products), chemicals, oils and fats and specialist products such as bitumen. The main ship types and the cargoes they carry are shown in the table below.
26
Principal Tanker Types and Main Cargoes Carried
|
Vessel Type
|
Ship Size-Dwt
|
Tank Type
|
IMO
Status
|
Principal Cargo
|
Other Cargoes
|
||||||||||
|
UL/VLCC
|
200,000+ |
Uncoated
|
Crude Oil
|
||||||||||||
|
Suezmax
|
120,000- 199,999 |
Uncoated
|
Crude Oil
|
||||||||||||
|
Aframax
|
80,000-119,999 |
Uncoated
|
Crude Oil
|
Refined Products-Dirty
|
|||||||||||
|
Panamax
|
60,000-79,999 |
Uncoated
|
Crude Oil
|
Refined Products-Dirty
|
|||||||||||
|
Long Range 2 (LR2)
|
80,000-119,999 |
Coated
|
Non IMO
|
Refined Products
|
Crude
|
||||||||||
|
Long Range 1 (LR1)
|
60,000-79,999 |
Coated
|
Non IMO
|
Refined Products
|
Crude
|
||||||||||
|
Medium Range (MR)
|
25,000-59,999 |
IMO 2-Coated
|
Refined Products
|
Chemicals/Veg Oils
|
|||||||||||
| 25,000-59,999 |
IMO 3-Coated
|
Refined Products
|
Chemicals/Veg Oils
|
||||||||||||
| 25,000-59,999 |
Non IMO-Coated
|
Refined Products
|
|||||||||||||
|
Non IMO-Uncoated
|
Refined Products
|
||||||||||||||
|
Short Range (SR)
|
10,000-24,999 |
Coated
|
Non-IMO
|
Refined Products
|
|||||||||||
| 10,000-24,999 |
Coated
|
IMO 1/2
|
Refined Products; Chemicals
|
||||||||||||
|
Stainless Steel Tankers
|
10,000+ |
Stainless
|
IMO 1/2
|
Chemicals/Veg Oils
|
Refined Products
|
||||||||||
|
Specialist Tankers
|
10,000+ |
Uncoated/Coated
|
Non IMO
|
Various e.g Bitumen
|
|||||||||||
In the refined product and chemical sectors there are a number of vessels that possess the ability to carry both types of cargo. These vessels do represent a "swing" element in supply in both of these markets. However, many vessels will tend to trade in either refined products or chemicals/oils and fats.
In 2013, a total of 3.25 billion tonnes of crude oil, oil products and chemicals were moved by sea. Over the period from 2003 to 2013, the refined oil products trade has grown at an annual average rate of 4.6%, over five times the growth rate of the crude oil trade at 0.8%, while seaborne trade in chemicals grew at approximately 4.7% annually. Over the period from 2008 to 2013, the annual growth rates have been -0.2% for crude oil, 3.8% for oil products, and 2.9% for chemicals. Over the period from 2003 to 2013, seaborne trade in refined products and chemicals were two of the fastest growing sectors of international shipping.
The Product Tanker Industry
While crude oil tankers transport crude oil from points of production to points of consumption, typically oil refineries in consuming countries, product tankers can carry both refined and unrefined petroleum products, including some crude oil, as well as fuel oil and vacuum gas oil (often referred to as 'dirty products') and gas oil, gasoline, jet fuel, kerosene and naphtha (often referred to as 'clean products'). Tankers with IMO 2/3 certification are able to carry both products and chemicals/oils and fats. Product capable tankers make up 57% of the total tanker fleet (above 10,000 dwt) in numbers terms, and are therefore a key part of the global tanker trade.
Demand for product tankers is dictated by world oil demand and trade, which is influenced by many factors including economic activity, geographic changes in oil production, consumption and refinery capacity, oil prices, the availability of transport alternatives (such as pipelines) and inventory policies of nations and oil trading companies. Tanker demand is a product of (a) the amount of cargo transported in tankers, multiplied by (b) the distance that cargo is transported.
27
Oil demand growth and the changing location of oil supply have altered the structure of the tanker market in recent years. Between 2003 and 2008, more than half of new crude oil production was located in the Middle East and Africa. These two regions still produced approximately one third of global supply in 2013. However, in recent years, U.S. and Canadian crude oil production has increased as a result of the development of shale oil deposits. This has reduced U.S. seaborne crude import demand, but is resulting in greater oil product volumes becoming available for export from the U.S. Gulf in particular and thereby providing increased employment opportunities for product tankers.
In terms of tonne-mile demand, a notable development in the patterns of world refining over the last five years has been the shift towards crude oil producing regions developing their own refinery capacity, while at the same time, poor refinery margins have led to closures of refineries in the developed world, most notably in Europe and on the U.S. east coast. In this context it is already apparent that the closures of refining capacity in the developed world are prompting longer haul imports to cater for product demand, for instance on routes such as West Coast India to the U.S. eastern seaboard and Europe. Refinery closures close to consuming regions elsewhere in the world will also help to support product import demand. For example, in Australia, trade from Singapore is expected to become increasingly important to compensate for the conversion of local producing refineries into storage depots. This would be part of a general increase in intra-Asian trade which is already boosting product tanker demand, something which may be further supported by expected closures in Japan (a result of new government standards).
Another positive development for product tankers in recent years has been the significant increase in exports from the United States. Moderating domestic oil demand has combined with greater availability of crude feedstock (due to increased U.S. domestic crude oil production from tight oil and offshore) to make larger-scale exports feasible, particularly of middle distillates from the U.S. Gulf. Much of the increase in U.S. exports have gone to satisfy growing South America and African demand for oil products while other U.S. exports have been moving transatlantic into Europe, where local refinery shutdowns have supported import demand.
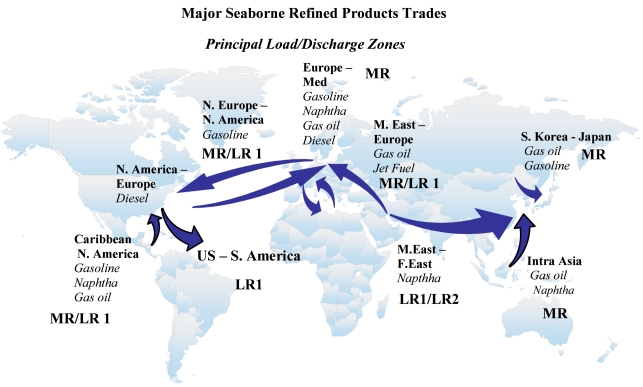
As a result of the growth in trade and the changes in the location of refinery capacity, demand for product tankers expressed in terms of tonne-miles have grown by a CAGR of 6.0% over the past ten years. Generally growth in products trades and product tanker demand is more consistent and less volatile than crude oil trade.
Product Tanker Supply
The globally trading product tanker fleet is classified as any non-specialised tanker between 10,000 dwt and 60,000 dwt, as well as coated and other "product-capable" vessels over 60,000 dwt. IMO 3 tankers are included in this classification, as are IMO 2 tankers above 30,000 dwt with an average tank size of greater than 3,000 cubic metres. As of March 31, 2014 the world product tanker capable fleet consisted of 3,308 vessels with a combined capacity of144.7 million dwt. Within the total tanker fleet MR vessels account for 32% of total ship numbers and in the global product tanker fleet they account for 56% of total ship numbers. MR vessels are considered the "workhorses" of the fleet.
28
As of March 31, 2014, the MR product tanker orderbook for all vessels above 10,000 dwt was 305 vessels totalling 14.35 million dwt. The MR orderbook as a percentage of the MR existing fleet for all tankers above 10,000 dwt was 17.8%, compared with just under 50% in 2008. Based on scheduled deliveries, 4.85 million dwt of MR product tankers are due for delivery in the remainder of 2014 and a further 5.85 million dwt in 2015. However, in recent years the orderbook has been affected by the non-delivery of vessels or "slippage" as it is sometimes referred to. Current estimates suggest that in 2013, approximately 30% of vessels across the entire tanker orderbook scheduled for delivery in 2013 did not deliver during the year. Some of the non-delivery was a result of delays, either through mutual agreement or through shipyard problems, whilst some was due to vessel cancellations. Slippage is likely to remain an issue going forward and will continue to temper fleet growth.
The other factor that will affect future supply is vessel scrapping. The volume of scrapping is a function primarily of the age profile of the fleet, scrap prices in relation to current and prospective charter market conditions, as well as operating, repair and survey costs. In 2012, a total of 131 oil tankers of a combined 11.6 million dwt were sold for scrap, of which 45 tankers of approximately 1.8 million dwt were in the MR size range. Approximately 10.0 million dwt of oil tanker tonnage was scrapped in 2013, of which 39 tankers of approximately 1.7 million dwt were in the MR size range. This compares to MR deliveries of 2.8 million dwt comprising 63 ships in 2012 and 4.0 million dwt comprising 84 ships in 2013. Therefore, the net supply growth for MR's in 2012 was 1% and in 2013 was 2.5%.
World Tanker Fleet & Orderbook: March 31, 2014
|
Vessel Type/Class
|
dwt
|
Existing Fleet
|
Orderbook
|
Orderbook Delivery
Schedule (dwt)
|
||||||||||||||||
|
Number
|
Mill dwt
|
Number
|
Mill dwt
|
% Fleet dwt
|
2014
|
2015
|
2016
|
2017+
|
||||||||||||
|
Crude Tankers
|
||||||||||||||||||||
|
UL/VLCC
|
200,000+
|
624
|
191.59
|
90
|
28.10
|
14.7%
|
7.95
|
3.74
|
14.27
|
2.14
|
||||||||||
|
Suezmax
|
120,000-199,999
|
485
|
74.90
|
39
|
6.06
|
8.1%
|
3.25
|
1.86
|
0.95
|
0.00
|
||||||||||
|
Aframax (Uncoated)
|
80,000-119,999
|
641
|
68.72
|
28
|
3.11
|
4.5%
|
0.77
|
1.10
|
0.68
|
0.56
|
||||||||||
|
Panamax (Uncoated)
|
60,000-79,999
|
89
|
6.18
|
2
|
0.15
|
2.4%
|
0.15
|
0.00
|
0.00
|
0.00
|
||||||||||
|
Crude Tankers
|
1,839
|
341.39
|
159
|
37.42
|
11.0%
|
12.12
|
6.70
|
15.90
|
2.70
|
|||||||||||
|
Long Range 2 (LR2)
|
80,000-119,999
|
251
|
27.02
|
68
|
7.72
|
28.8%
|
2.17
|
4.31
|
1.25
|
0.00
|
||||||||||
|
Long Range 1 (LR1)
|
60,000-79,999
|
328
|
23.96
|
18
|
1.34
|
5.6%
|
0.30
|
0.00
|
1.04
|
0.00
|
||||||||||
|
LR Product Tankers
|
579
|
50.98
|
86
|
9.07
|
17.8%
|
2.47
|
4.31
|
2.29
|
0.00
|
|||||||||||
|
Medium Range (MR)
|
||||||||||||||||||||
|
Coated IMO 2
|
25,000-59,999
|
323
|
12.49
|
52
|
2.10
|
16.8%
|
0.21
|
1.45
|
0.37
|
0.07
|
||||||||||
|
Coated IMO 3 & Non IMO Coated/Uncoated
|
25,000-59,999
|
1,517
|
68.03
|
253
|
12.25
|
33.8%
|
4.64
|
4.39
|
2.87
|
0.35
|
||||||||||
|
Total MR
|
1,840
|
80.52
|
305
|
14.35
|
17.8%
|
4.85
|
5.85
|
3.23
|
0.42
|
|||||||||||
|
Short Range
|
10,000-24,999
|
889
|
13.20
|
19
|
0.34
|
3.4%
|
0.25
|
0.06
|
0.03
|
0.00
|
||||||||||
|
Stainless Steel Tankers
|
10,000+
|
569
|
12.35
|
69
|
1.62
|
13.1%
|
0.28
|
0.46
|
0.60
|
0.29
|
||||||||||
|
Specialist Tankers
|
10,000+
|
54
|
1.26
|
10
|
0.34
|
27.1%
|
0.09
|
0.05
|
0.20
|
0.00
|
||||||||||
|
Total All Tankers
|
5,770
|
499.70
|
648
|
63.14
|
12.6%
|
20.06
|
17.43
|
22.24
|
3.41
|
|||||||||||
Source: Drewry
29
The Product Tanker Market
Between 2003 and 2007, the differential between demand and supply for tankers remained narrow and rates were generally very firm. Following the recession, tanker demand slowed, coinciding with substantial tonnage entering the fleet, driving earnings down. In 2013, clean product tanker spot earnings averaged $10,948 per day, compared to a ten-year average of $17,899 per day and a spot market high of $49,273 per day in January 2006.
The estimated three year timecharter rate for an MR was $15,561 per day in 2013, whilst the benchmark one year timecharter rate was $14,346 per day. It should be noted that these rates are based on a standard MR vessel built circa 2010, and there is some evidence that more-recently built vessels constructed to particularly fuel-efficient "Eco" specifications are currently able to achieve an additional premium on these levels of up to 10%. The market high for one-year timecharter rate was reached in November 2005 at $30,500 per day.
Asset Values
Product tanker asset values have also fluctuated over time, and there is a relationship between changes in asset values and the charter market. Newbuilding prices increased significantly between 2003 and 2007 primarily as a result of increased tanker demand. Current newbuilding prices are significantly below the peaks reported at the height of the market in 2008. Contracting activity in 2011 and 2012 was limited due to low freight rates, the poor market outlook and difficulties in securing financing.
The secondhand sale and purchase market has traditionally been relatively liquid, with tankers changing hands between owners on a regular basis. Secondhand prices peaked over the summer of 2008 and have since declined. In March 2014 MR prices were estimated at $29.0 million for a five year old ship and $37.5 million for a newbuilding. These figures compare to levels above $50.0 million for a newbuild and five year old vessel during mid-2007 to early 2008.
MR Product Tankers: Timecharter and Asset Value Summary

Source: Drewry
30
The Chemical Tanker Industry
Introduction
The world chemical industry is one of the largest and most diversified industries in the world with more than 1,000 large and medium-sized companies manufacturing over 70,000 different product lines. Although most specialist chemicals are used locally, world trade is becoming an increasingly prominent part of the global chemical industry for a number of reasons ranging from local stock imbalances to a lack of local production of particular chemicals in various parts of the world. In broad terms, seaborne trade growth in bulk liquid chemicals has tracked trends in economic activity and globalization.
The seaborne transportation of chemicals is technically and logistically complex compared with the transportation of crude oil and oil products, with cargoes ranging from hazardous and noxious chemicals to products such as edible oils and fats. Consequently, the chemical tanker sector comprises a broad array of specially constructed small and medium sized tankers designed to carry chemical products in various stages of production.
Chemical Tanker Demand
Demand for chemicals is affected by, among other things, general economic conditions (including increases and decreases in industrial production and transportation), chemical prices, feedstock costs and chemical production capacity. Given their industrial usage, chemical demand, and as a result demand for seaborne transport, is well-correlated with global GDP. Seaborne trade in chemicals is characterized by a wide range of individual cargoes and a relatively regionalized structure compared with crude and products. Given the geographical complexity and the diversity of cargoes involved and the way in which some cargoes are transported, estimating total seaborne trade in chemicals is difficult.
The United States is the largest exporter of organic chemicals, accounting for approximately 25% of all exports. The four organic chemicals most frequently traded by sea are methanol, styrene, benzene and P-xylene. Inorganic chemical trade accounts for approximately 15-20% of total seaborne movements. They are not traded geographically as wide as organic chemicals and they also present several transport problems; not only are they very dense, they are also highly corrosive. Palm oil accounts for about half of this, with the next top two commodities in this sector traded by sea being soybean oil and sunflower seed oil.
From a regional perspective, activity is focused on three main geographical areas. Europe is a mature, established producing region, contributing over one quarter of total chemical production. Much of Europe's production serves domestic requirements. This manifests itself in increased demand for short-sea services, rather than deep-sea trades. North American (predominantly the United States) manufacturers produce approximately one fifth of the major chemical products in the world. Although the majority of the United States' production is for domestic use, particularly where gasoline additives are involved, the country also produces above domestic requirements, which results in significant export volumes.
One potentially significant factor which will affect the U.S. chemicals industry is the development of shale gas. Increased supplies of natural gas in the United States have served to push down domestic gas prices. The fall in natural gas prices in the United States has also has a beneficial impact on feedstock costs for the petrochemical industry. In particular, the cost of ethane has fallen significantly since 2011 thereby increasing the competiveness of the U.S. petrochemical industry within a global perspective. Accordingly, U.S. ethylene production costs have fallen to levels where the United States can now compete with Middle Eastern suppliers, resulting in new projects to expand United States ethylene cracking capacity and subsequently petrochemical capacity. Ethylene cracker utilization in the United States has improved and a number of new plants have been announced. Industry sources have suggested that there could be an increase in ethylene production levels of up to 35% in the United States by the middle of the decade. Ethylene is a precursor for many of the organic chemicals shipped by sea (e.g. ethylene dichloride, ethylene glycol), so increased production points to increased availability of downstream chemical products for export from the United States.
31
United States Confirmed Ethylene Expansion Plans
(1)
based on Shale Gas

Source: Drewry
Chemical Tanker Supply
Chemical tankers are characterized mainly by cargo containment systems which are technically more sophisticated than those found in conventional oil and product tankers. Since chemical tankers are often required to carry many products which are typically hazardous and easily contaminated, cargo segregation and containment is important.
The IMO regulates the carriage of chemicals by sea, dividing potentially dangerous cargoes into three categories, typically referred to as IMO 1, IMO 2 and IMO 3. IMO conventions govern the requirements for particular tanks to be classified as each grading, which the pertinent features of each tank being the internal volume and its proximity to the sides and bottom of the vessel's hull. The carriage of 18 cargoes is restricted to IMO Type 1 classified vessels. The majority of cargoes require IMO 2 vessels, including vegetable oils and palm oils. One concession to the IBC Code regulations is an allowance that IMO 3 tankers may carry other edible oils, an exemption introduced because of the tendency for such cargoes to be shipped in large bulk parcels. This often requires ships of up to MR size, and at the point of the regulatory change, there were very few such large tankers with IMO 2 graded tanks. Despite this exemption, these vessels are not 'true' chemical tankers in the general sense of the word, and are not able to carry other IMO 2 cargoes.
As well as defining the chemical tanker fleet in terms of their IMO type, it is also possible to separate them according to their degree of tank segregation and tank size as detailed below. Therefore the classification as detailed below is more accurate assessment of the size of the chemical fleet, albeit there is "swing element" in tonnage supply and also some interchange ability.
|
|
·
|
Chemical parcel tankers:
Over 75% of the tanks are segregated with an average tank size less than 3,000 cbm and / or stainless steel tanks. A typical parcel tanker might be 20,000 dwt and have twenty fully segregated tanks which are stainless steel.
|
|
|
·
|
Chemical bulk tankers
: Vessels with a lower level of segregations to tanks (below 75%) and an average tank size below 3,000 cbm and not stainless. A typical chemical bulk tanker might be 17,000 dwt with 16 tanks but 8 segregations and be IMO 2.
|
32
With an orderbook of 140 vessels or 11.6% of the existing fleet for IMO 2 coated and stainless steel tankers, the chemical tanker fleet is expected to remain at moderate levels over the next few years as demand growth is expected to remain in excess of supply growth and the scrapping of older vessels is expected to continue. In 2013, provisional data suggests that 29 chemical tankers totaling 0.8 million dwt were sent for demolition. In addition, chemical tankers are relatively complex vessel types to build and this increases the barriers to entry for shipyards and the pool of yards that owners are willing to consider is small.
World Chemical Tanker Fleet and Orderbook by Ship Type: March 31, 2014
|
Type
|
Size (dwt)
|
Fleet
|
Orderbook
|
Orderbook Delivery Schedule (No. ships)
|
|||||||
|
Number
|
m dwt
|
Avg Age
|
Number
|
million dwt
|
% Fleet
|
2014
|
2015
|
2016
|
2017
|
||
| Parcel |
30,000+
|
228
|
8.92
|
10.2
|
17
|
0.59
|
6.6%
|
1
|
3
|
8
|
5
|
|
10,000-29,999
|
856
|
14.21
|
8.1
|
71
|
1.38
|
10%
|
27
|
22
|
17
|
5
|
|
| Bulk |
30,000+
|
1,112
|
49.73
|
7.8
|
244
|
11.46
|
23%
|
99
|
107
|
36
|
2
|
|
10,000-29,999
|
358
|
5.87
|
10.2
|
4
|
0.10
|
2%
|
1
|
3
|
0
|
0
|
|
| IMO 1/2 |
30,000+
|
392
|
15.49
|
10.4
|
65
|
2.59
|
17%
|
5
|
37
|
16
|
7
|
| Chem/Prod |
10,000-29,999
|
1,175
|
19.50
|
8.5
|
75
|
1.48
|
8%
|
28
|
25
|
17
|
5
|
| IMO 3 |
30,000+
|
948
|
43.16
|
7.3
|
196
|
9.46
|
22%
|
95
|
73
|
28
|
0
|
| Chem/Prod |
10,000-29,999
|
39
|
0.59
|
16.1
|
0.00
|
0.00
|
0%
|
0
|
0
|
0
|
0
|
|
Total
|
2,554
|
78.73
|
8.5
|
336
|
13.53
|
17%
|
128
|
135
|
61
|
12
|
|
Source: Drewry
The Chemical Tanker Market
Some 50% of all chemical movements are covered by COAs, while the spot market covers 35% to 40%. The remainder is made up by other charter arrangements and cargoes moved in tonnage controlled by exporters or importers. In the chemical tanker freight market, the level of reporting of fixture information is far less widespread than for the oil tanker market. Furthermore, it is not always possible to establish a monthly series of rates for an individual cargo, on a given route, as fixing is often sporadic, or more often than not covered by contract business. For these reasons, the assessment of spot freight rate trends in the freight market is made by using a small number of routes where there is sufficient fixture volume to produce meaningful measurements. Following a general firming in rates throughout 2010 and 2011 after the decline in 2009, freight rates on most major trade lanes declined during 2012 as market sentiment eroded before staging a recovery in 2013 as confidence improved and excess capacity was absorbed.
Chemical Tanker Asset Values
As in other shipping sectors, chemical tanker sale and purchase values show a relationship to the charter market and newbuilding prices. Newbuilding prices are influenced by shipyard capacity and increased steel prices; secondhand vessel values may vary because of the country of construction and the level of outfitting of such vessels. Although there has been a relatively high level of activity in recent years, chemical vessels can be difficult to market to buyers due to complexity of operations in the chemical market and they may not always achieve their initial newbuilding premium. Newbuilding price trends in the chemical tanker sector are more difficult to track than MRs due to the lower volume of ordering and variation in specification, however prices are generally 30% to 40% lower than at the market peak in early 2008. Similarly, in the secondhand market, asset values have fallen by nearly 50% since 2008.
33
Chemical Tanker IMO 2/3 Coated – Time Charter and Asset Value Summary

Source: Drewry
Environmental and Other Regulations
Government laws and regulations significantly affect the ownership and operation of our tankers. We are subject to international conventions, national, state and local laws and regulations in force in the countries in which our vessels may operate or are registered. Compliance with such laws, regulations and other requirements entails significant expense, including vessel modifications and implementation of certain operating procedures.
A variety of governmental, quasi-governmental and private organizations subject our tankers to both scheduled and unscheduled inspections. These organizations include the local port authorities, national authorities, harbor masters or equivalent, classification societies, flag state administrations (countries of registry), labor organizations (including but not limited to the International Transport Workers' Federation), charterers, terminal operators and oil companies. Some of these entities require us to obtain permits, licenses, certificates and approvals for the operation of our tankers. Our failure to maintain necessary permits, licenses, certificates or approvals could require us to incur substantial costs or temporarily suspend operation of one or more of the vessels in our fleet, or lead to the invalidation or reduction of our insurance coverage.
We believe that the heightened levels of environmental and quality concerns among insurance underwriters, financial institutions, regulators and charterers have led to greater inspection and safety requirements on all vessels and may accelerate the scrapping of older vessels throughout the tanker industry. Increasing environmental concerns have created a demand for tankers that conform to stricter environmental standards and these standards are set to increase in stringency in the short to medium term. We are required to maintain operating standards for all of our vessels that emphasize operational safety, quality maintenance, and procedural compliance together with continuous training of our officers and crews to maintain compliance with applicable local, national and international environmental laws and regulations. Such laws and regulations frequently change and may impose increasingly strict requirements. We cannot predict the ultimate cost of complying with these requirements, or the impact of these requirements on the resale value or useful lives of our tankers. In addition, a future serious marine incident that results in significant oil pollution, release of hazardous substances, loss of life or otherwise causes significant adverse environmental impact, such as the 2010
Deepwater Horizon
oil spill in the Gulf of Mexico, could result in additional legislation, regulation or other requirements that could negatively affect our profitability.
International Maritime Organization ("IMO")
The IMO, the United Nations agency for maritime safety and the prevention of pollution, has adopted the International Convention for the Prevention of Pollution from Ships of 1973 ("MARPOL"), which has been updated through various amendments. MARPOL establishes environmental standards relating to oil leakage or spilling, garbage management, sewage, air emissions, handling and disposal of noxious liquids and the handling of harmful substances in packaged forms.
In 2012, the IMO's Marine Environmental Protection Committee ("MEPC"), adopted a resolution amending the International Code for the Construction and Equipment of Ships Carrying Dangerous Chemicals in Bulk (the "IBC Code"). The provisions of the IBC Code are mandatory under MARPOL and SOLAS. These amendments, which are expected to enter into force in June 2014, pertain to revised international certificates of fitness for the carriage of dangerous chemicals in bulk and identifying new products that fall under the IBC Code. We may need to make certain financial expenditures to comply with these amendments.
In 2013, the MEPC adopted a resolution amending MARPOL Annex I Conditional Assessment Scheme ("CAS"). The amendments, which are expected to become effective on October 1, 2014, pertain to revising references to the inspections of bulk carriers and tankers after the 2011 International Code on the Enhanced Programme of Inspections during Surveys of Bulk Carriers and Oil Tankers ("ESP Code"), which provides for enhanced inspection programs, becomes mandatory. We may need to make certain financial expenditures to comply with these amendments.
34
Air Emissions
In September 1997, the IMO adopted Annex VI to MARPOL to address air pollution from ships. Effective May 2005 and as subsequently revised, Annex VI sets limits on sulfur oxide, nitrogen oxide and particulate matter emissions from all commercial vessel exhausts and prohibits deliberate emissions of ozone depleting substances (such as halons and chlorofluorocarbons), emissions of volatile organic compounds from cargo tanks, and the shipboard incineration from incinerators installed after January 1, 2000 of specific substances. "Deliberate emissions" are not limited to times when the ship is at sea; they can for example include discharges occurring in the course of the ship's repair and maintenance. Annex VI also includes a global cap on the sulfur content of fuel oil and allows for special areas to be established with more stringent controls on sulfur emissions known as Emission Control Areas ("ECAs"). Additional or new conventions, laws and regulations may be adopted that could require the installation of expensive emission control systems and adversely affect our business, cash flows, results of operations and financial condition. In October 2008, the IMO adopted amendments to Annex VI regarding emissions of sulfur oxide, nitrogen oxide, particulate matter and ozone-depleting substances, which entered into force on July 1, 2010. The amended Annex VI will reduce air pollution from vessels by, among other things, (i) implementing a progressive reduction of sulfur oxide emissions from ships by reducing the global sulfur fuel cap initially to 3.50%, effective January 1, 2012, then progressively to 0.50%, effective globally from January 1, 2020, subject to a feasibility review to be completed no later than 2018; and (ii) establishing new tiers of stringent nitrogen oxide emissions standards for new marine engines, depending on their date of installation. The United States ratified the Annex VI amendments in October 2008, and the EPA, promulgated equivalent emissions standards in late 2009.
The United States and Canada have requested IMO to designate the area extending 200 nautical miles from the Atlantic/Gulf and Pacific coasts of the United States and Canada and the Hawaiian Islands as ECAs under the MARPOL Annex VI amendments, which would subject ocean-going vessels in these areas to stringent emissions controls and cause us to incur additional costs. The North American ECA came into force on August 1, 2012. The North American ECA includes areas subject to the exclusive sovereignty of the United States and extends up to 200 nautical miles from the coasts of the United States, which area includes parts of the U.S. Gulf of Mexico. Consequently, the sulfur limit in marine fuel is capped at 1%. These capped amounts will then decrease progressively until they reach 0.5% by January 1, 2020 for non-ECA areas and 0.1% by January 1, 2015 for ECA areas, including the North American ECA. As of January 1, 2014, the United States Caribbean Sea was also designated an ECA.
As of January 1, 2013, amended Annex VI made mandatory certain measures relating to energy efficiency for ships in part to address greenhouse gas emissions. All new ships must utilize the Energy Efficiency Design Index ("EEDI"), and all ships must develop and implement Ship Energy Efficiency Management Plans ("SEEMPs").
If other ECAs are approved by the IMO or other new or more stringent requirements relating to emissions from marine diesel engines or port operations by vessels are adopted by the EPA or the states where we operate, compliance with these regulations could entail significant capital expenditures or operational changes or otherwise increase the costs of our operations.
Safety Management System Requirements
The IMO also adopted the International Convention for the Safety of Life at Sea ("SOLAS") and the International Convention on Load Lines ("LL"), which impose a variety of standards that regulate the design and operational features of ships. The IMO periodically revises the SOLAS and LL standards. The May 2012 SOLAS amendments that relate to the safe manning of vessels entered into force on January 1, 2014.
The IMO Legal Committee also adopted the 1996 Protocol to the Convention on Limitation of Liability for Maritime Claims (the "LLMC"), which specifies limits of liability for loss of life or personal injury claims and property claims against ship-owners. The limits of liability are periodically amended to adjust to inflation. Amendments to the LLMC, which were adopted in April 2012, are expected to go into effect on June 8, 2015.
Our operations are also subject to environmental standards and requirements contained in the International Management Code for the Safe Operation of Ships and for Pollution Prevention ("ISM Code"), promulgated by the IMO under SOLAS. The ISM Code requires the party with operational control of a vessel to develop an extensive safety management system that includes, among other things, the adoption of safety and environmental protection policies setting forth instructions and procedures for operating its vessels safely and describing procedures for responding to emergencies. We rely upon the safety management system that has been developed for our vessels for compliance with the ISM Code.
35
The ISM Code requires that vessel operators also obtain a safety management certificate for each vessel they operate. This certificate evidences compliance by a vessel's management with code requirements for a safety management system. No vessel can obtain a certificate unless its manager has been awarded a document of compliance, issued by each flag state, under the ISM Code. Our technical managers have obtained documents of compliance for its offices and safety management certificates for all of our vessels for which the certificates are required by the ISM Code. These documents of compliance and safety management certificates are renewed as required.
Noncompliance with the ISM Code and other IMO regulations may subject the shipowner or bareboat charterer to increased liability, may lead to decreases in, or invalidation of, available insurance coverage for affected vessels and may result in the denial of access to, or detention in, some ports. The U.S. Coast Guard and European Union authorities have indicated that vessels not in compliance with the ISM Code by the applicable deadlines will be prohibited from trading in U.S. and European Union ports, as the case may be.
Pollution Control and Liability Requirements
Many countries have ratified and follow the liability plan adopted by the IMO and set out in the International Convention on Civil Liability for Oil Pollution Damage of 1969, as from time to time amended ("CLC"), although the United States is not a party. Under this convention and depending on whether the country in which the damage results is a party to the 1992 Protocol to the CLC, a vessel's registered owner is strictly liable, subject to certain affirmative defenses, for pollution damage caused in the territorial waters of a contracting state by discharge of persistent oil. The limits on liability outlined in the 1992 Protocol use the International Monetary Fund currency unit of Special Drawing Rights ("SDR"). The right to limit liability is forfeited under the CLC where the spill is caused by the shipowner's personal fault and under the 1992 Protocol where the spill is caused by the shipowner's personal act or omission or by intentional or reckless conduct. Vessels trading with states that are parties to these conventions must provide evidence of insurance covering the liability of the owner. In jurisdictions where the CLC has not been adopted, various legislative schemes or common law govern, and liability is imposed either on the basis of fault or in a manner similar to that of the CLC. We believe that our protection and indemnity insurance will cover the liability under the plan adopted by the IMO.
The IMO adopted the International Convention on Civil Liability for Bunker Oil Pollution Damage (the "Bunker Convention"), to impose strict liability on ship owners for pollution damage in jurisdictional waters of ratifying states caused by discharges of bunker fuel. The Bunker Convention, which became effective on November 21, 2008, requires registered owners of ships over 1,000 gross tons to maintain insurance or other financial security for pollution damage in an amount equal to the limits of liability under the applicable national or international limitation regime (but not exceeding the amount calculated in accordance with the Convention on Limitation of Liability for Maritime Claims of 1976, as amended). With respect to non-ratifying states, liability for spills or releases of oil carried as fuel in a ship's bunkers typically is determined by the national or other domestic laws in the jurisdiction where the events or damages occur.
The IMO International Convention on Liability and Compensation for Damage in Connection with the Carriage of Hazardous and Noxious Substances by Sea ("HNS"), when it enters into force, will provide for compensation to be paid out to victims of accidents involving HNS, such as chemicals. HNS are defined by reference to lists of substances included in various IMO Conventions and Codes and include oils, other liquid substances defined as noxious or dangerous, liquefied gases, liquid substances with a flashpoint not exceeding 60°C, dangerous, hazardous and harmful materials and substances carried in packaged form, solid bulk materials defined as possessing chemical hazards, and certain residues left by the previous carriage of HNS. This Convention introduces strict liability for the shipowner and a system of compulsory insurance and insurance certificates. This Convention is still awaiting the requisite number of signatories in order to enter into force.
In addition, IMO adopted an International Convention for the Control and Management of Ships' Ballast Water and Sediments ("BWM Convention") in February 2004. The BWM Convention will not become effective until 12 months after it has been adopted by 30 states, the combined merchant fleets of which represent not less than 35% of the gross tonnage of the world's merchant shipping. To date, there has not been sufficient adoption of this standard for it to take force, but it is close. Many of the implementation dates originally written in the BWM Convention have already passed, so on December 4, 2013, the IMO Assembly passed a resolution revising the dates of applicability of the requirements of BWM Convention so that they are triggered by the entry into force date, and not the dates originally in the BWM Convention. This in effect makes all vessels constructed before the entry into force date 'existing vessels', and delayed the date for installation of ballast water management systems on vessels until the first renewal survey following entry to force of the convention. Upon entry into force of the BWM Convention mid-ocean ballast water exchanges would become mandatory. When mid-ocean ballast exchange or ballast water treatment requirements become mandatory, the cost of compliance could increase for ocean carriers. Although we do not believe that the costs of compliance with a mandatory mid-ocean ballast exchange would be material, it is difficult to predict the overall impact of such a requirement on our operations.
36
The IMO continues to review and introduce new regulations. It is impossible to predict what additional regulations, if any, may be passed by the IMO and what effect, if any, such regulations might have on our operations.
U.S. Regulations
The U.S. Oil Pollution Act of 1990 ("OPA"), established an extensive regulatory and liability regime for the protection and cleanup of the environment from oil spills. OPA affects all owners and operators whose vessels trade in the United States, its territories and possessions or whose vessels operate in U.S. waters, which includes the U.S. territorial sea and its 200 nautical mile exclusive economic zone. The United States has also enacted the Comprehensive Environmental Response, Compensation and Liability Act ("CERCLA"), which applies to the discharge of hazardous substances other than oil, whether on land or at sea. Both OPA and CERCLA impact our operations.
Under OPA, vessel owners, operators and bareboat charterers are "responsible parties" and are jointly, severally and strictly liable (unless the spill results solely from the act or omission of a third party, an act of God or an act of war) for all containment and clean-up costs and other damages arising from discharges or threatened discharges of oil from their vessels. OPA defines these other damages broadly to include:
|
|
·
|
injury to, destruction or loss of, or loss of use of, natural resources damage and related assessment costs;
|
|
|
·
|
injury to, economic loss resulting from, real and personal property damage;
|
|
|
·
|
net loss of taxes, royalties, rents, fees and other lost revenues resulting from injury, destruction or loss of real or personal property, or natural resources;
|
|
|
·
|
lost profits or impairment of earning capacity due to property or natural resources damage; and
|
|
|
·
|
net cost of public services necessitated by a spill response, such as protection from fire, safety or health hazards, and loss of subsistence use of natural resources.
|
OPA contains statutory caps on liability and damages; such caps do not apply to direct cleanup costs. Effective July 31, 2009, the U.S. Coast Guard adjusted the limits of OPA liability to the greater of $2,000 per gross ton or $17.088 million for any double-hull tanker that is over 3,000 gross tons (subject to possible adjustment for inflation), and our fleet is entirely composed of vessels of this size class. CERCLA, which applies to owners and operators of vessels, contains a similar liability regime and provides for cleanup, removal and natural resource damages. Liability under CERCLA is limited to the greater of $300 per gross ton or $5 million for vessels carrying a hazardous substance as cargo or residue and the greater of $300 per gross ton or $0.5 million for any other vessel. These OPA and CERCLA limits of liability do not apply if an incident was directly caused by violation of applicable U.S. federal safety, construction or operating regulations or by a responsible party's gross negligence or willful misconduct, or if the responsible party fails or refuses to report the incident or to cooperate and assist in connection with oil removal activities.
OPA and CERCLA each preserve the right to recover damages under exiting law, including maritime tort law.
OPA and the U.S. Coast Guard also require owners and operators of vessels to establish and maintain with the U.S. Coast Guard evidence of financial responsibility sufficient to meet the limit of their potential liability under OPA and CERCLA. Vessel owners and operators may satisfy their financial responsibility obligations by providing a proof of insurance, a surety bond, self-insurance or a guaranty. We comply with the U.S. Coast Guard's financial responsibility regulations by providing a certificate of responsibility evidencing sufficient self-insurance.
OPA permits individual states to impose their own liability regimes with regard to oil pollution incidents occurring within their boundaries, provided they accept, at a minimum, the levels of liability established under OPA. Some states have enacted legislation providing for unlimited liability for discharge of pollutants within their waters, however, in some cases, states which have enacted this type of legislation have not yet issued implementing regulations defining tanker owners' responsibilities under these laws.
The 2010 Deepwater Horizon oil spill in the Gulf of Mexico may also result in additional regulatory initiatives or statutes, including the raising of liability caps under OPA. For example, on February 24, 2014 the U.S. Bureau of Ocean Energy Management (BOEM) proposed a rule increasing the limits of liability of damages for off-shore facilities under the OPA based on inflation. Compliance with any new requirements of OPA may substantially impact our cost of operations or require us to incur additional expenses to comply with any new regulatory initiatives or statutes.
37
We have and expect to maintain pollution liability coverage insurance in the amount of $1 billion per incident for each of our vessels. If the damages from a catastrophic spill were to exceed our insurance coverage or if our insurance were to not respond, it could have a material adverse effect on our business, financial condition, results of operations and cash flows.
The U.S. Clean Water Act ("CWA"), prohibits the discharge of oil or hazardous substances in U.S. navigable waters unless authorized by a duly-issued permit or exemption, and imposes strict liability in the form of penalties for any unauthorized discharges. The CWA also imposes substantial liability for the costs of removal and remediation and damages and complements the remedies available under OPA and CERCLA. Furthermore, many U.S. states that border a navigable waterway have enacted environmental pollution laws that impose strict liability on a person for removal costs and damages resulting from a discharge of oil or a release of a hazardous substance. These laws may be more stringent than U.S. federal law.
The EPA and U.S. Coast Guard ("USCG") have enacted rules relating to ballast water discharge, compliance with which requires the installation of equipment on our vessels to treat ballast water before it is discharged or the implementation of other port facility disposal arrangements or procedures at potentially substantial cost, and/or otherwise restrict our vessels from entering U.S. waters.
The EPA requires a permit regulating ballast water discharges and other discharges incidental to the normal operation of certain vessels within United States waters under the Vessel General Permit for Discharges Incidental to the Normal Operation of Vessels ("VGP"). For a new vessel delivered to an owner or operator after September 19, 2009 to be covered by the VGP, the owner must submit a Notice of Intent ("NOI"), at least 30 days before the vessel operates in United States waters. On March 28, 2013 the EPA re-issued the VGP for another five years. This VGP took effect on December 19, 2013. The VGP focuses on authorizing discharges incidental to operations of commercial vessels and the new VGP contains numeric ballast water discharge limits for most vessels to reduce the risk of invasive species in US waters, more stringent requirements for exhaust gas scrubbers and the use of environmentally acceptable lubricants.
USCG regulations adopted and proposed for adoption under the U.S. National Invasive Species Act ("NISA"), also impose mandatory ballast water management practices for all vessels equipped with ballast water tanks entering or operating in U.S. waters, which require the installation of equipment on our vessels to treat ballast water before it is discharged or the implementation of other port facility disposal arrangements or procedures, and/or otherwise restrict our vessels from entering U.S. waters. The USCG must approve any technology before it is placed on a vessel, but has not yet approved the technology necessary for vessels to meet the foregoing standards.
Notwithstanding the foregoing, as of January 1, 2014, vessels are technically subject to the phasing-in of these standards. As a result, the USCG has provided waivers to vessels which cannot install the as-yet unapproved technology. The EPA, on the other hand, has taken a different approach to enforcing ballast discharge standards under the VGP. On December 27, 2013, the EPA issued an enforcement response policy in connection with the new VGP in which the EPA indicated that it would take into account the reasons why vessels do not have the requisite technology installed, but will not grant any waivers.
European Union Regulations
In October 2009, the European Union amended a directive to impose criminal sanctions for illicit ship-source discharges of polluting substances, including minor discharges, if committed with intent, recklessly or with serious negligence and the discharges individually or in the aggregate result in deterioration of the quality of water. Aiding and abetting the discharge of a polluting substance may also lead to criminal penalties. Member States were required to enact laws or regulations to comply with the directive by the end of 2010. Criminal liability for pollution may result in substantial penalties or fines and increased civil liability claims.
38
Greenhouse Gas Regulation
In February 2005, the Kyoto Protocol to the United Nations Framework Convention on Climate Change ("UNFCCC"), which we refer to as the Kyoto Protocol, entered into force. Pursuant to the Kyoto Protocol, adopting countries are required to implement national programs to reduce emissions of certain gases, generally referred to as greenhouse gases, which are suspected of contributing to global warming. Currently, the emissions of greenhouse gases from international shipping are not subject to the Kyoto Protocol. As of January 1, 2013, all new ships must comply with two new sets of mandatory requirements to address greenhouse gas emissions from ships, which were adopted by IMO's Marine Environment Protection Committee ("MEPC") in July 2011. Currently operating ships are required to develop SEEMPs and minimum energy efficiency levels per capacity mile, outlined in the EEDI, apply to new ships. These requirements could cause us to incur additional compliance costs.
International negotiations are continuing with respect to a successor to the Kyoto Protocol, which set emission reduction targets through 2012 and has been extended with new targets through 2020 pending negotiation of a new climate change treaty that would take effect in 2020. Restrictions on shipping emissions may be included in any new treaty. In December 2009, more than 27 nations, including the United States and China, signed the Copenhagen Accord, which includes a non-binding commitment to reduce greenhouse gas emissions. The European Union has indicated that it intends to propose an expansion of the existing European Union emissions trading scheme to include emissions of greenhouse gases from vessels, if such emissions were not regulated through the IMO or the UNFCCC by December 31, 2011. The European Union has proposed legislation that would require the monitoring and reporting of greenhouse gas emissions from marine vessels. In April 2013, the European Parliament rejected proposed changes to the European Union Emissions Law regarding carbon trading. In June 2013 the European Commission developed a strategy to integrate maritime emissions into the overall European Union Strategy to reduced greenhouse gas emissions. If the strategy is adopted by the European Parliament and Council large vessels using European Union ports would be required to monitor, report, and verify their carbon dioxide emissions beginning in January 2018. In December 2013 the European Union environmental ministers discussed draft rules to implement monitoring and reporting of carbon dioxide emissions from ships. In the United States, the EPA has issued a final finding that greenhouse gases threaten public health and safety, and has adopted regulations to limit greenhouse gas emissions from certain mobile sources and proposed regulations to limit greenhouse gas emissions from certain large stationary sources. Although the mobile source emission regulations do not apply to greenhouse gas emissions from vessels, the EPA is considering petitions from the California Attorney General and various environmental groups to regulate greenhouse gas emissions from ocean-going vessels. Other federal and state regulations relating to the control of greenhouse gas emissions may follow, including the climate change initiatives that are being considered in the U.S. Congress. In addition, the IMO is evaluating various mandatory measures to reduce greenhouse gas emissions from international shipping, including market-based instruments. Any passage of climate change legislation or other regulatory initiatives by the European Union, United States, IMO or other countries where we operate that restrict emissions of greenhouse gases could require us to make significant financial expenditures, including capital expenditures to upgrade our vessels, that we cannot predict with certainty at this time. Even in the absence of climate control legislation and regulations, our businesses may be materially affected to the extent that climate change may result in sea level changes or more intense weather events.
International Labour Organization
The International Labour Organization (ILO) is a specialized agency of the UN with headquarters in Geneva, Switzerland. The ILO has adopted the Maritime Labor Convention 2006 (MLC 2006). A Maritime Labor Certificate and a Declaration of Maritime Labor Compliance will be required to ensure compliance with the MLC 2006 for all ships above 500 gross tons in international trade. The MLC 2006 entered into force on August 20, 2013. The MLC 2006 requires us to develop new procedures to ensure full compliance with its requirements.
Vessel Security Regulations
Since the terrorist attacks of September 11, 2001, there have been a variety of initiatives intended to enhance vessel security. On November 25, 2002, the U.S. Maritime Transportation Security Act of 2002 (the "MTSA"), came into effect. To implement certain portions of the MTSA, in July 2003, the USCG issued regulations requiring the implementation of certain security requirements aboard vessels operating in waters subject to the jurisdiction of the United States. The regulations also impose requirements on certain ports and facilities, some of which are regulated by the EPA. Similarly, in December 2002, amendments to SOLAS created a new chapter of the convention dealing specifically with maritime security. The new chapter became effective in July 2004 and imposes various detailed security obligations on vessels and port authorities, most of which are contained in the International Ship and Port Facilities Security Code (the "ISPS Code"). The ISPS Code is designed to protect ports and international shipping against terrorism. After July 1, 2004, to trade internationally, a vessel must attain an International Ship Security Certificate ("ISSC"), from a recognized security organization approved by the vessel's flag state. Among the various requirements are:
39
|
|
·
|
on-board installation of automatic identification systems to provide a means for the automatic transmission of safety-related information from among similarly equipped ships and shore stations, including information on a ship's identity, position, course, speed and navigational status;
|
|
|
·
|
on-board installation of ship security alert systems, which do not sound on the vessel but only alert the authorities on shore;
|
|
|
·
|
the development of vessel security plans;
|
|
|
·
|
ship identification number to be permanently marked on a vessel's hull;
|
|
|
·
|
a continuous synopsis record kept onboard showing a vessel's history including, the name of the ship and of the state whose flag the ship is entitled to fly, the date on which the ship was registered with that state, the ship's identification number, the port at which the ship is registered and the name of the registered owner(s) and their registered address; and
|
|
|
·
|
compliance with flag state security certification requirements.
|
Ships operating without a valid certificate may be detained at port until it obtains an ISSC, or it may be expelled from port, or refused entry at port.
The U.S. Coast Guard regulations, intended to align with international maritime security standards, exempt from MTSA vessel security measures non-U.S. vessels that have on board, as of July 1, 2004, a valid ISSC attesting to the vessel's compliance with SOLAS security requirements and the ISPS Code. We have implemented the various security measures addressed by the MTSA, SOLAS and the ISPS Code.
Inspection by Classification Societies
Every oceangoing vessel must be "classed" by a classification society. The classification society certifies that the vessel is "in-class," signifying that the vessel has been built and maintained in accordance with the rules of International Association of Classification Standards and complies, as appointed, with applicable rules and regulations of the vessel's country of registry and the international conventions of which that country is a member. In addition, where surveys are required by international conventions and corresponding laws and ordinances of a flag state, the classification society will undertake them on application or by official order, acting on behalf of the authorities concerned.
The classification society also undertakes on request other surveys and checks that are required by regulations and requirements of the flag state. These surveys are subject to agreements made in each individual case and/or to the regulations of the country concerned.
For maintenance of the class, regular and extraordinary surveys of hull, machinery, including the electrical plant, and any special equipment classed are required to be performed as follows:
|
|
·
|
Annual Surveys. For seagoing ships, annual surveys are conducted for the hull and the machinery, including the electrical plant and where applicable for special equipment classed, within three months before or after each anniversary date of the date of commencement of the class period indicated in the certificate.
|
|
|
·
|
Intermediate Surveys. Extended annual surveys are referred to as intermediate surveys and typically are conducted two and one-half years after commissioning and each class renewal. Intermediate surveys may be carried out on the occasion of the second or third annual survey.
|
|
|
·
|
Class Renewal Surveys. Class renewal surveys, also known as special surveys, are carried out for the ship's hull, machinery, including the electrical plant and for any special equipment classed, at the intervals indicated by the character of classification for the hull. At the special survey the vessel is thoroughly examined, including audio-gauging to determine the thickness of the steel structures. Should the thickness be found to be less than class requirements, the classification society would prescribe steel renewals. The classification society may grant a one year grace period for completion of the special survey. Substantial amounts of money may have to be spent for steel renewals to pass a special survey if the vessel experiences excessive wear and tear. In lieu of the special survey every four or five years, depending on whether a grace period was granted, a ship owner has the option of arranging with the classification society for the vessel's hull or machinery to be on a continuous survey cycle, in which every part of the vessel would be surveyed within a five year cycle. At an owner's application, the surveys required for class renewal may be split according to an agreed schedule to extend over the entire period of class. This process is referred to as continuous class renewal.
|
All areas subject to survey as defined by the classification society are required to be surveyed at least once per class period, unless shorter intervals between surveys are prescribed elsewhere. The period between two subsequent surveys of each area must not exceed five years.
40
Vessels have their underwater parts inspected every 30 to 36 months. Depending on the vessel's classification status and constructed notation and other factors, this inspection can often be done afloat with minimal disruption to the vessel's commercial deployment. However, vessels are required to be drydocked, meaning physically removed from the water, for inspection and related repairs at least once every five years from delivery. If any defects are found, the classification surveyor will issue a condition of class or recommendation which must be rectified by the ship owner within prescribed time limits.
Most insurance underwriters make it a condition for insurance coverage that a vessel be certified as "in-class" by a classification society which is a member of the International Association of Classification Societies ("IACS"). All our vessels are certified as being "in-class" by American Bureau of Shipping and Lloyds Register. In December 2013 the IACS adopted new harmonized Common Rules, which will apply to oil tankers and bulk carriers to be constructed on or after July 1, 2015. All new and secondhand vessels that we purchase must be certified prior to their delivery under our standard purchase contracts and memoranda of agreement. If the vessel is not certified on the scheduled date of closing, we have no obligation to take delivery of the vessel.
In addition to the classification inspections, many of our customers regularly inspect our vessels as a precondition to chartering them for voyages. We believe that our well-maintained, high-quality vessels provide us with a competitive advantage in the current environment of increasing regulation and customer emphasis on quality.
Risk of Loss and Liability Insurance
General
The operation of any cargo vessel includes risks such as mechanical failure, collision, property loss, cargo loss or damage and business interruption due to political circumstances in foreign countries, hostilities, labor strikes and acts of God. In addition, there is always an inherent possibility of marine disaster, including oil spills and other environmental mishaps, and the liabilities arising from owning and operating vessels in international trade. OPA, which in certain circumstances imposes virtually unlimited liability upon owners, operators and demise charterers of any vessel trading in the U.S. exclusive economic zone for certain oil pollution accidents in the United States, has made liability insurance more expensive for vessel owners and operators trading in the U.S. market. While we believe that our present insurance coverage is adequate, not all risks can be insured against, and there can be no guarantee that any specific claim will be paid, or that we will always be able to obtain adequate insurance coverage at reasonable rates.
Marine and War Risks Insurance
We have in force marine and war risks insurance for all of our vessels. Our marine hull and machinery insurance covers risks of particular average and actual or constructive total loss from collision, fire, grounding, engine breakdown and other insured named perils up to an agreed amount per vessel. Our war risks insurance covers the risks of particular average and actual or constructive total loss from confiscation, seizure, capture, vandalism, sabotage, and other war-related named perils. We have also arranged coverage for increased value for each vessel. Under this increased value coverage, in the event of total loss of a vessel, we will be able to recover amounts in excess of those recoverable under the hull and machinery policy in order to compensate for additional costs associated with replacement of the loss of the vessel. Each vessel is covered up to at least its fair market value at the time of the insurance attachment and subject to a fixed deductible per each single accident or occurrence, but excluding actual or constructive total loss.
Protection and Indemnity Insurance
Protection and indemnity insurance is provided by mutual protection and indemnity associations ("P&I Associations"), and covers our third party liabilities in connection with our shipping activities. This includes third-party liability and other related expenses resulting from injury or death of crew, passengers and other third parties, loss or damage to cargo, claims arising from collisions with other vessels, damage to other third-party property, pollution arising from oil or other substances, and salvage, towing and other related costs, including wreck removal. Protection and indemnity insurance is a form of mutual indemnity insurance, extended by mutual protection and indemnity associations, or "clubs." Subject to the "capping" discussed below, our coverage, except for pollution, is unlimited.
Our current protection and indemnity insurance coverage for pollution is $1.0 billion per vessel per incident. We are a member of a P&I Club that is a member of the International Group of P&I Clubs ("International Group"). The P&I Clubs that comprise the International Group insure approximately 90% of the world's commercial tonnage and have entered into a pooling agreement to reinsure each association's liabilities.
41
Although the P&I Clubs compete with each other for business, they have found it beneficial to pool their larger risks under the auspices of the International Group. This pooling is regulated by a contractual agreement which defines the risks that are to be pooled and exactly how these risks are to be shared by the participating P&I Clubs. The pool provides a mechanism for sharing all claims in excess of $9.0 million up to approximately $7.5 billion as of May 19, 2013. We are subject to calls payable to the associations based on its claim records as well as the claim records of all other members of the individual associations and members of the pool of P&I Clubs comprising the International Group.
Legal Proceedings
To our knowledge, we are not currently a party to any lawsuit that, if adversely determined, would have a material adverse effect on our financial position, results of operations or liquidity. As such, we do not believe that pending legal proceedings, taken as a whole, should have any significant impact on our financial statements. From time to time in the future we may be subject to legal proceedings and claims in the ordinary course of business, principally personal injury and property casualty claims. While we expect that these claims would be covered by our existing insurance policies, those claims, even if lacking merit, could result in the expenditure of significant financial and managerial resources. We have not been involved in any legal proceedings which may have, or have had, a significant effect on our financial position, results of operations or liquidity, nor are we aware of any proceedings that are pending or threatened which may have a significant effect on our financial position, results of operations or liquidity.
Exchange Controls
Under Marshall Islands law, there are currently no restrictions on the export or import of capital, including foreign exchange controls or restrictions that affect the remittance of dividends, interest or other payments to non-resident holders of our common shares.
|
C.
|
Organizational Structure
|
ASC was incorporated in the Republic of the Marshall Islands on May 14, 2013 as a wholly owned subsidiary of GA Holdings LLC, a limited liability company incorporated in the Marshall Islands. We commenced business operations through our predecessor company Ardmore Shipping LLC ("ASLLC") on April 15, 2010 which also was owned by GA Holdings LLC. On August 6, 2013, the Company completed its initial public offering of 10,000,000 shares of its common stock, par value $0.01, at $14.00 per share. The gross proceeds to the Company from the offering were $140 million before deducting underwriting commissions and related expenses. Prior to the initial public offering of ASC's common stock, GA Holdings LLC exchanged all of the shares of its wholly owned subsidiary, Ardmore Shipping LLC ("ASLLC"), for 8,049,500 additional shares of ASC and ASLLC became a wholly owned subsidiary of ASC ("the Reorganization"). The financial statements have been retroactively adjusted to reflect the issuance of 8,049,500 shares in connection with the Reorganization. In March 2014, the Company completed a follow-on public offering of 8,050,000 common shares at $13.50 per share. The gross proceeds to the Company from the offering were $108.7 million before deducting underwriting commissions and related expenses. As of the date of this annual report, the Company has 26,100,000 shares of common stock outstanding. GA Holdings LLC holds 8,050,000, or 30.8%, of the common stock of the Company, with the remaining 69.2% primarily held by public investors.
42
The following is a list of ASC's direct and indirect subsidiaries:
|
|
|
|
|
|
Name of Company
|
Country of Incorporation
|
Principal Activities
|
Ownership (%)
|
|
Ardmore Shipping LLC
|
Marshall Islands
|
Holding company
|
100%
|
|
Ardmore Shipholding Limited
|
Ireland
|
Holding company
|
100%
|
|
Ardmore Shipping Limited
|
Ireland
|
Commercial management, transaction support
|
100%
|
|
Fastnet Shipco LLC
|
Marshall Islands
|
Ship ownership and operations
|
100%
|
|
Rockall Shipco LLC
|
Marshall Islands
|
Ship ownership and operations
|
100%
|
|
Shannon Shipco LLC
|
Marshall Islands
|
Ship ownership and operations
|
100%
|
|
Malin Shipco LLC
|
Marshall Islands
|
Ship ownership and operations
|
100%
|
|
Tyne Shipco LLC
|
Marshall Islands
|
Ship ownership and operations
|
100%
|
|
Forties Shipco LLC
|
Marshall Islands
|
Ship ownership and operations
|
100%
|
|
Fitzroy Shipco LLC
|
Marshall Islands
|
Ship ownership and operations
|
100%
|
|
Bailey Shipco LLC
|
Marshall Islands
|
Ship ownership and operations
|
100%
|
|
Forth Shipco LLC
|
Marshall Islands
|
Ship ownership and operations
|
100%
|
|
Viking Shipco LLC
|
Marshall Islands
|
Ship ownership and operations
|
100%
|
|
Ardmore Chartering LLC
|
Marshall Islands
|
Ship chartering and operations
|
100%
|
|
Cromarty Shipco LLC
|
Marshall Islands
|
Ship ownership and operations
|
100%
|
|
Dogger Shipco LLC
|
Marshall Islands
|
Ship ownership and operations
|
100%
|
|
Fisher Shipco LLC
|
Marshall Islands
|
Ship ownership and operations
|
100%
|
|
Humber Shipco LLC
|
Marshall Islands
|
Ship ownership and operations
|
100%
|
|
Wight Shipco LLC
|
Marshall Islands
|
Ship ownership and operations
|
100%
|
|
Lundy Shipco LLC
|
Marshall Islands
|
Ship ownership and operations
|
100%
|
|
Thames Shipco LLC
|
Marshall Islands
|
Ship ownership and operations
|
100%
|
|
Valentia Shipholding LLC
|
Marshall Islands
|
Ship ownership and operations
|
100%
|
|
Fair Isle Shipco LLC
|
Marshall Islands
|
Ship ownership and operations
|
100%
|
|
Faroe Shipco LLC
|
Marshall Islands
|
Ship ownership and operations
|
100%
|
|
Plymouth Shipco LLC
|
Marshall Islands
|
Ship ownership and operations
|
100%
|
|
Portland Shipco LLC
|
Marshall Islands
|
Ship ownership and operations
|
100%
|
|
Trafalgar Shipco LLC
|
Marshall Islands
|
Ship ownership and operations
|
100%
|
|
Hebrides Shipco LLC
|
Marshall Islands
|
Ship ownership and operations
|
100%
|
|
Sole Shipco LLC
|
Marshall Islands
|
Ship ownership and operations
|
100%
|
|
Biscay Shipco LLC
|
Marshall Islands
|
Ship ownership and operations
|
100%
|
|
Dover Shipco LLC
|
Marshall Islands
|
Ship ownership and operations
|
100%
|
|
D.
|
Property, Plant and Equipment
|
|
Item 4.A
|
Unresolved Staff Comments
|
None
|
Item 5
|
Operating and Financial Review and Prospects
|
The following discussion and analysis should be read in conjunction with our consolidated financial statements, accompanying notes thereto and other financial information, appearing elsewhere in this Annual Report. The consolidated financial statements as of and for the years ended December 31, 2013, 2012 and 2011 have been prepared in accordance with U.S. GAAP. The consolidated financial statements are presented in U.S. dollars unless otherwise indicated.
43
General
We are Ardmore Shipping Corporation, a company incorporated in the Republic of the Marshall Islands. We provide seaborne transportation of petroleum products and chemicals worldwide to oil majors, national oil companies, oil and chemical traders, and chemical companies, with our modern, fuel-efficient fleet of mid-size product and chemical tankers.
We are commercially independent as we have no blanket employment arrangements with third-party or related-party commercial managers. We market our services directly to a broad range of customers, including oil majors, national oil companies, oil and chemical traders, chemical companies, and a range of pooling service providers.
Our Charters
We generate revenues by charging customers for the transportation of their petroleum or chemical products using our vessels. Historically, these services generally have been provided under the following basic types of contractual relationships:
|
|
·
|
Time Charter:
vessels we operate and are responsible for crewing and for paying other operating expenses, such as repairs and maintenance, insurance, stores, lube oils, communication expenses, and technical management fees, are chartered to customers for a fixed period of time at rates that are generally fixed, but may contain a variable component based on inflation, interest rates, or current market rates.
|
|
|
·
|
Commercial Pools
: our vessels are pooled together with a group of other similar vessels for economies of scale and the earnings are pooled and distributed to the vessel owners according to a prearranged agreement.
|
|
|
·
|
Third-Party Spot Chartering Arrangement:
a third-party charterer and freight trader arranges spot employment for our vessels. Our third-party chartering manager contracts voyages for the vessel in the spot market and we will be responsible for all costs associated with operating the vessel including operating expenses, voyage costs, bunkers, port and canal costs, etc.
|
The table below illustrates the primary distinctions among these types of charters and contracts.
|
|
Time Charter
|
Commercial Pool
|
Third Party Spot Chartering Arrangement
|
|
Typical contract length
|
1 - 5 years
|
Indefinite
|
Indefinite
|
|
Hire rate basis(1)
|
Daily
|
Varies (daily rate reported)
|
N/A
|
|
Voyage expenses(2)
|
Charterer pays
|
Pool pays
|
We pay
|
|
Vessel operating costs(3)
|
We pay
|
We pay
|
We pay
|
|
Off-hire (4)
|
We pay
|
We pay
|
We pay
|
|
(1)
|
"Hire rate" refers to the basic payment from the charterer for the use of the vessel. |
|
(2)
|
"Voyage expenses" is defined herein under "Glossary of Shipping Terms." |
|
(3)
|
"Vessel operating costs" is defined below under "—Important Financial and Operational Terms and Concepts." |
|
(4)
|
"Off-hire" refers to the time a vessel is not available for service due primarily to scheduled and unscheduled repairs or drydocking.
|
|
A.
|
Operating Results
|
Important Financial and Operational Terms and Concepts
We use a variety of financial and operational terms and concepts. These include the following:
Vessel revenues.
Vessel revenues primarily include revenues from time charters, pool revenues and income from spot employment where the vessels are employed under a third party spot chartering arrangement. Vessel revenues are affected by hire rates and the number of days a vessel operates. Vessel revenues are also affected by the mix of business between vessels on time charter and vessels in pools. Revenues from vessels in pools or employed in the spot market are more volatile, as they are typically tied to prevailing market rates.
44
Voyage expenses.
Voyage expenses are all expenses related to a particular voyage, including any bunker fuel expenses, port fees, cargo loading and unloading expenses, canal tolls and agency fees. These expenses are subtracted from shipping revenues to calculate TCE rates.
Vessel operating costs.
We are responsible for vessel operating costs, which include crewing, repairs and maintenance, insurance, stores, lube oils, communication expenses, and technical management fees. The largest components of our vessel operating costs are generally crews and repairs and maintenance. Expenses for repairs and maintenance tend to fluctuate from period to period because most repairs and maintenance typically occur during periodic drydockings. Please read "Drydocking" below. We expect these expenses to increase as our fleet matures and to the extent that it expands.
Drydocking.
We must periodically drydock each of our vessels for inspection, and any modifications to comply with industry certification or governmental requirements. Generally, each vessel is drydocked every 30 to 60 months.
Depreciation.
Depreciation expense typically consists of charges related to the depreciation of the historical cost of our fleet (less an estimated residual value) over the estimated useful lives of the vessels and charges relating to the depreciation of upgrades to vessels, which are depreciated over the shorter of the vessel's remaining useful life or the life of the renewal or upgrade.
Amortization of deferred drydock expenditure.
Amortization of deferred drydock expenditure relates to the amortization of drydocking expenditures over the estimated number of years to the next scheduled drydocking.
Time Charter Equivalent Rates.
TCE rates are a standard industry measure of the average daily revenue performance of a vessel. The TCE rate achieved on a given voyage is expressed in U.S. dollars per day and is generally calculated by subtracting voyage expenses, including bunkers and port charges, from voyage revenue and dividing the net amount (time charter equivalent revenues) by the number of days in the period. In the case of time charters or commercial pool employment the TCE will generally equal the charter rate or daily pool rate.
Revenue Days.
Revenue days are the total number of calendar days our vessels were in our possession during a period, less the total number of off-hire days during the period generally associated with repairs or drydockings. Consequently, revenue days represent the total number of days available for the vessel to earn revenue. Idle days, which are days when a vessel is available to earn revenue, yet is not employed, are included in revenue days. We use revenue days to show changes in net voyage revenues between periods.
Operating Days.
Operating days are the number of days our vessels are in operation during the year. Where a vessel is under our ownership for a full year, operating days will generally equal calendar days. Days when a vessel is in drydock are included in the calculation of operating days as we incur operating expenses while in drydock.
Commercial Pools.
To increase vessel utilization and thereby revenues, we participate in commercial pools with other ship owners of similar modern, well-maintained vessels. By operating a large number of vessels as an integrated transportation system, commercial pools offer customers greater flexibility and a higher level of service while achieving scheduling efficiencies. Pools employ experienced commercial charterers and operators who have close working relationships with customers and brokers, while technical management is performed by each ship owner. Pools negotiate charters with customers primarily in the spot market. The size and scope of these pools enable them to enhance utilization rates for pool vessels by securing backhaul voyages and Contracts of Affreightment ("COAs"), thus generating higher effective TCE revenues than otherwise might be obtainable in the spot market while providing a higher level of service offerings to customers.
Factors You Should Consider When Evaluating Our Results
We face a number of risks associated with our business and industry and must overcome a variety of challenges to utilize our strengths and implement our business strategy. These risks include, among others, the highly cyclical tanker industry; partial dependence on spot charters; fluctuating charter values; changing economic, political and governmental conditions affecting our industry and business; material changes in applicable laws and regulations; full performance by counterparties, particularly charterers; acquisitions and dispositions; increased operating expenses; increased capital expenditures; taxes; maintaining customer relationships; maintaining sufficient liquidity; financing availability and terms; and management turnover.
Revenues and TCE revenues are generally equivalent because our vessels are primarily employed on time charter contracts or in a commercial pool. When a vessel is on time charter, the customer pays us the contract revenue, and the customer is responsible for all of the voyage expenses. When a vessel is in commercial pool, the customer pays us the vessel's allocated earnings within the commercial pool, which we record as revenue, and the pool is also responsible for the voyage expenses. The vessel's allocated earnings in the pool are reduced to reflect the commercial management fee charged by the commercial pool manager.
45
Shipowners base economic decisions regarding the deployment of their vessels upon actual and anticipated TCE rates, and industry analysts typically measure rates in terms of TCE rates. This is because under time charters the customer typically pays the voyage expenses, while under voyage charters, also known as spot market charters, the shipowner usually pays the voyage expenses. Accordingly, the discussion of revenue below focuses on TCE rates where applicable.
The following tables present our operating results for the years ended December 31, 2013 and 2012.
|
For the years ended
|
||||||||||||||||
|
Dec 31, 2013
|
Dec 31, 2012
|
Variance
|
Variance (%)
|
|||||||||||||
|
REVENUE
|
||||||||||||||||
|
Revenue
|
$ | 35,867,356 | 25,172,654 | 10,694,702 | 42.5 | % | ||||||||||
|
OPERATING EXPENSES
|
||||||||||||||||
|
Commissions and voyage related costs
|
2,523,842 | 789,149 | (1,734,693 | ) | -219.8 | % | ||||||||||
|
Vessel operating expenses
|
18,215,487 | 14,598,071 | (3,617,416 | ) | -24.8 | % | ||||||||||
|
Charter hire costs
|
- | 1,699,943 | 1,699,943 | 100.0 | % | |||||||||||
|
Depreciation
|
8,388,208 | 6,195,416 | (2,192,792 | ) | -35.4 | % | ||||||||||
|
Amortization of deferred drydock expenditure
|
1,420,814 | 441,491 | (979,323 | ) | -221.8 | % | ||||||||||
|
General and administrative expenses
|
5,669,935 | 2,975,139 | (2,694,796 | ) | -90.6 | % | ||||||||||
|
Total operating expenses
|
36,218,286 | 26,699,209 | (9,519,077 | ) | -35.7 | % | ||||||||||
|
(Loss)/profit from operations
|
(350,930 | ) | (1,526,555 | ) | 1,175,625 | 77.0 | % | |||||||||
|
Interest expense and finance costs
|
(3,464,006 | ) | (2,966,014 | ) | (497,992 | ) | -16.8 | % | ||||||||
|
Interest income
|
6,059 | 4,713 | 1,346 | 28.6 | % | |||||||||||
|
Loss before taxes
|
(3,808,877 | ) | (4,487,856 | ) | 678,979 | 15.1 | % | |||||||||
|
Income tax
|
(33,726 | ) | (51,237 | ) | 17,511 | 34.2 | % | |||||||||
|
Net loss
|
$ | (3,842,603 | ) | (4,539,093 | ) | 696,490 | 15.3 | % | ||||||||
Revenue.
Revenue for the year ended December 31, 2013 was $35.9 million, an increase of $10.7 million from $25.2 million for the year ended December 31, 2012. Revenue days on owned vessels increased by 520 days from 2,129 days for the year ended December 31, 2012 to 2,649 days for the year ended December 31, 2013. Revenue on owned vessels for the year ended December 31, 2013 was $35.9 million, an increase of $12.3 million from $23.6 million for the year ended December 31, 2012. The increase primarily relates to the
Ardmore Seavaliant
and
Ardmore Seaventure
, which were delivered on February 27, 2013 and June 7, 2013, respectively. In addition, the
Ardmore Centurion
was employed on a time charter until August 3, 2013 and following re-delivery to us, it was employed under a spot chartering arrangement. Under a time charter, voyage costs are borne by the charterer and thus revenue is recognized net of voyage expenses. Under a spot chartering arrangement, voyage expenses are borne directly by the company and thus revenue is recognized on a gross freight basis. Chartering days for chartered-in vessels decreased from 265 days for the year ended December 31, 2012 to nil for the year ended December 31, 2013. Chartering revenue for the year ended December 31, 2012 was $1.5 million. This is due to re-delivery of chartered-in vessels (the
Hellespont Crusader
and the
Hellespont Commander
) that were delivered to us on May 12, 2011, and July 17, 2011, respectively. Gross fleet TCE rate increased by $1,939 per day from $10,911 for the year ended December 31, 2012 to $12,850 for the year ended December 31, 2013.
Commissions and voyage related costs.
Commissions and voyage related costs for the year ended December 31, 2013 were $2.5 million, an increase of $1.7 million from $0.8 million for the year ended December 31, 2012. This increase is due to increases in revenue days and also voyage expenses related to the
Ardmore Centurion's
employment in a spot chartering arrangement as of August 3, 2013. Under a spot chartering arrangement, all voyage expenses are borne by us, as opposed to the Charterer. Voyage costs also include bunker and other costs associated with drydockings which were not capitalized.
46
Vessel operating expenses.
Vessel operating costs were $18.2 million for the year ended December 31, 2013, an increase of $3.6 million from $14.6 million for the year ended December 31, 2012. These costs primarily comprise crew, technical, lube oil, and insurance expenses. The operating expenses are based on the number of operating days in the year. Operating days for our owned vessels were 2,703 days for the year ended December 31, 2012 as compared to 2,196 for the year ended December 31, 2012.
Charter hire costs.
Charter hire costs were $0 for the year ended December 31, 2013 as compared to $1.7 million for the year ended December 31, 2012. Ardmore re-delivered two chartered-in vessels in 2012 (the
Hellespont Crusader
and the
Hellespont Commander
). Chartering days for chartered-in vessels were 265 for the year ended December 31, 2012.
Depreciation.
Depreciation charges were $8.4 million for the year ended December 31, 2013, an increase of $2.2 million from $6.2 million for the year ended December 31, 2012. This increase is a result of deliveries of the
Ardmore Seavaliant
and the
Ardmore Seaventure
which delivered on February 27, 2013 and June 7, 2013 respectively, along with timing of depreciation on upgrades and vessel equipment purchased. Our vessels are depreciated over an estimated useful life of 25 years on a straight line basis to their residual value (scrap value). The rate used to calculate the residual value is $300 per lightweight ton. Upgrades are depreciated on a straight line basis over the shorter of the life of the upgrade or the remaining life of the vessel.
Amortization of deferred drydock expenditure.
Amortization of deferred drydock expenditure for the year ended December 31, 2013 was $1.4 million, an increase of $1.0 million from $0.4 million for the year ended December 31, 2012. The capitalized costs of drydocking are depreciated on a straight line basis to the next scheduled drydocking. As such, the movement in amortization of deferred drydock expenditure is in line with timing of vessels undergoing drydock.
General and administrative expenses.
Total general and administrative expenses were $5.7 million for the year ended December 31, 2013, as compared to $3.0 million for the year ended December 31, 2012. $0.7 million was incurred in relation to our IPO that was expensed as incurred. Non-cash share based compensation expense included in general and administrative expenses for the year ended December 31, 2013 amounted to $0.6 million as compared to $0.01 million for the year ended December 31, 2012. The remaining increase is due to increased expenses as a consequence of being a public company. A significant portion of our general and administrative costs are incurred in Euros. These expenses are susceptible to foreign currency movements between U.S. dollars and Euros. However, we do not expect the impact of any fluctuations in foreign currency to have a material impact on us.
Interest expense.
Total interest expense for the year ended December 31, 2013 was $3.5 million as compared to $3.0 million for the year ended December 31, 2012. Interest costs on senior debt were $3.1 million for the year ended December 31, 2013, an increase of $0.5 million from $2.6 million for the year ended December 31, 2012. Interest incurred on capital leases was $1.7 million for the year ended December 31, 2013 as compared to $0 for the year ended December 31, 2012. Interest costs on our revolving credit facility for the year ended December 31, 2013 were $0 as compared to $0.5 million for the year ended December 31, 2012. Amortized deferred finance fees for the year ended December 31, 2013 were $0.8 million, as compared to $0.3 million for the year ended December 31, 2012.
We capitalize interest costs that are attributable to amounts advanced for vessels under construction. Where a loan is directly attributable to vessels under construction, we capitalize this interest in full. Where we have not financed the advances for vessels under construction with a loan, we attribute capitalized interest to these amounts based on the weighted average interest rate for the period ("capitalized interest"). Total capitalized interest was $2.2 million for the year ended December 31, 2013, an increase of $1.7 million from $0.5 million for the year ended December 31, 2012.
Interest income.
Interest income for the year ended December 31, 2013 was $6,059, an increase of $1,346 from $4,713 for the year ended December 31, 2012. This increase is due to increased interest earned on our cash balances for the year ended December 31, 2013.
Income tax.
Income tax for the year ended December 31, 2013 was $33,726, a decrease of $17,511 from $51,237 for the year ended December 31, 2012. A valuation allowance for deferred tax of $24,341 was provided for in the year ended December 31, 2012. A further decrease in income tax was realized due to timing of our chartered-in activities. This was offset by an increase in tax arising from a larger fleet as a result of deliveries of the
Ardmore Seavaliant
and the
Ardmore Seaventure
which delivered on February 27, 2013 and June 7, 2013 respectively.
Net loss.
Net loss was $3.8 million for the year ended December 31, 2013 as compared to a net loss of $4.5 million for the year ended December 31, 2012.
47
Statement of Operations for the Years Ended December 31, 2012 and December 31, 2011
|
For the years ended
|
||||||||||||||||
|
Dec 31, 2012
|
Dec 31, 2011
|
Variance
|
Variance (%)
|
|||||||||||||
|
REVENUE
|
||||||||||||||||
|
Revenue
|
$ | 25,172,654 | 22,375,414 | 2,797,240 | 12.5 | % | ||||||||||
|
OPERATING EXPENSES
|
||||||||||||||||
|
Commissions and voyage related costs
|
789,149 | 468,067 | (321,082 | ) | -68.6 | % | ||||||||||
|
Vessel operating expenses
|
14,598,071 | 12,186,825 | (2,411,246 | ) | -19.8 | % | ||||||||||
|
Charter hire costs
|
1,699,943 | 1,663,380 | (36,563 | ) | -2.2 | % | ||||||||||
|
Depreciation
|
6,195,416 | 5,343,091 | (852,325 | ) | -16.0 | % | ||||||||||
|
Amortization of deferred drydock expenditure
|
441,491 | - | (441,491 | ) | -100.0 | % | ||||||||||
|
General and administrative expenses
|
2,975,139 | 2,599,031 | (376,108 | ) | -14.5 | % | ||||||||||
|
Total operating expenses
|
26,699,209 | 22,260,394 | (4,438,815 | ) | -19.9 | % | ||||||||||
|
(Loss)/profit from operations
|
(1,526,555 | ) | 115,020 | (1,641,575 | ) | 1427.2 | % | |||||||||
|
Interest expense and finance costs
|
(2,966,014 | ) | (3,080,472 | ) | 114,458 | 3.7 | % | |||||||||
|
Interest income
|
4,713 | 3,608 | 1,105 | 30.6 | % | |||||||||||
|
Loss before taxes
|
(4,487,856 | ) | (2,961,844 | ) | (1,526,012 | ) | -51.5 | % | ||||||||
|
Income tax
|
(51,237 | ) | (13,426 | ) | (37,811 | ) | -281.6 | % | ||||||||
|
Net loss
|
$ | (4,539,093 | ) | (2,975,270 | ) | (1,563,823 | ) | -52.6 | % | |||||||
Revenue.
Revenue for the year ended December 31, 2012 was $25.2 million, an increase of $2.8 million from $22.4 million for the year ended December 31, 2011. The
Ardmore Calypso
and
Ardmore Capella
were delivered to Ardmore on June 11, 2011 and July 1, 2011, respectively. As these vessels were trading for a full year in 2012, this resulted in an increase in revenue days of 315 days. Chartering days for our chartered-in vessels was 265 for the year ended December 31, 2012, an increase of 5 days from 260 days for the year ended December 31, 2011. Time charter revenue was $17.7 million for the year ended December 31, 2012, an increase of $3.2 million from $14.5 million for the year ended December 31, 2011. Pool revenue was $7.5 million for the year ended December 31, 2012, a decrease of $0.4 million as compared to $7.8 million for the year ended December 31, 2011. This decrease is due to re-delivery of chartered in vessels (the
Hellespont Crusader
and the
Hellespont Commander
) that were delivered to us on May 12, 2011, and July 17, 2011, respectively.
Commissions and voyage related costs.
Commissions and voyage related costs for the year ended December 31, 2012 were $0.8 million, an increase of $0.3 million from $0.5 million for the year ended December 31, 2011. Revenue days for the year ended December 31, 2012 were 2,394 days as compared to 2,074 days for the year ended December 31, 2011 an increase in hire days of 321 days. Voyage costs include bunker costs associated with drydockings which were not capitalized.
Vessel operating expenses.
Vessel operating costs were $14.6 million for the year ended December 31, 2012, an increase of $2.4 million from $12.2 million for the year ended December 31, 2011. These costs primarily comprise crew, technical, lube oil, and insurance expenses. The operating expenses are based on the number of operating days in the year. Operating days for our owned vessels were 2,196 days for the year ended December 31, 2012 as compared to 1,817 for the year ended December 31, 2011.
Charterhire costs.
Charterhire costs were $1.70 million for the year ended December 31, 2012, an increase of $0.04 million from $1.66 million for the year ended December 31, 2011. We re-delivered two chartered-in vessels in 2012 (the
Hellespont Crusader
and the
Hellespont Commander
). Chartering days were 265 days for the year ended 2012 as compared to 260 for the year ended December 31, 2011.
48
Depreciation.
Depreciation charges were $6.2 million for the year ended December 31, 2012, an increase of $0.9 million from $5.3 million for the year ended December 31, 2011. Depreciation for the year ended December 31, 2012, on vessels which were acquired during 2011, was $1.6 million, an increase of $0.8 million from $0.8 million for the year ended December 31, 2011. Upgrades are depreciated on a straight line basis over the shorter of the life of the upgrade or the remaining life of the vessel. Our vessels are depreciated over an estimated useful life of 25 years on a straight line basis to their residual value (scrap value). The rate used to calculate the residual value is $300 per lightweight ton.
Amortization of deferred drydock expenditure.
Amortization of deferred drydock expenditure for the year ended December 31, 2013 was $0.4 million, an increase of $0.4 million from $0 for the year ended December 31, 2012. The capitalized costs of drydocking are depreciated on a straight line basis to the next scheduled drydocking. As such, the movement in amortization of deferred drydock expenditure is in line with timing of vessels undergoing drydock.
General and administrative expenses.
Total general and administrative expenses were $3.0 million for the year ended December 31, 2012, an increase of $0.4 million from $2.6 million for the year ended December 31, 2011. Total personnel costs were $1.5 million for the year ended December 31, 2012, as compared to $1.4 million for the year ended December 31, 2011. A significant portion of our general and administrative costs are incurred in Euros. These expenses are susceptible to foreign currency movements between US$ and Euros. However, we do not expect the impact of any fluctuations in foreign currency to have a material impact on us.
Interest expense.
Total interest expense for the year ended December 31, 2012 was $3.0 million as compared to $3.1 million for the year ended December 31, 2011. Interest costs on senior debt were $2.6 million for the year ended December 31, 2012, an increase of $0.5 million from $2.1 million for the year ended December 31, 2011. Interest costs on our revolving credit facility for the year ended December 31, 2012 were $0.5 million as compared to $0.7 million for the year ended December 31, 2011. Amortized deferred finance fees for the year ended December 31, 2012 were $0.3 million, flat from $0.3 million for the year ended December 31, 2011. Our weighted average interest rate for the year ended December 31, 2012 on senior debt was 4.1%, an increase of 0.3% as compared to 3.8% for the year ended December 31, 2011.
We capitalize interest costs that are attributable to amounts advanced for vessels under construction. Where a loan is directly attributable to vessels under construction, we capitalize this interest in full. Where we have not financed the advances for vessels under construction with a loan, we attribute capitalized interest to these amounts based on the weighted average interest rate for the period ("imputed capitalized interest"). Total imputed capitalized interest was $0.5 million for the year ended December 31, 2012, an increase of $0.5 million from $0 for the year ended December 31, 2011.
Interest income.
Interest income for the year ended December 31, 2012 was $4,713, an increase of $1,105 from $3,608 for the year ended December 31, 2011. This increase is due to increased interest earned on our cash balances for the year ended December 31, 2012.
Income tax.
Income tax for the year ended December 31, 2012 was $51,237, an increase of $37,811 from $13,426 for the year ended December 31, 2011. A valuation allowance for deferred tax of $24,341 was provided for in the year ended December 31, 2012, a $40,440 increase from the deferred tax asset of $16,099 recognized in the year ended December 31, 2011. A further decrease in income tax was realized due to timing of our chartered-in activities. This was offset by an increase in tax arising from a larger fleet as a result of deliveries of the Ardmore Calypso and the Ardmore Capella on June 11, 2011 and July 1, 2011, respectively.
Net loss.
Net loss was $4.5 million for the year ended December 31, 2012 as compared to a net loss of $3.0 million for the year ended December 31, 2011
|
B.
|
Liquidity and Capital Resources
|
Our primary source of funds for our short-term and long-term liquidity needs is the cash flows generated from our vessel operations.
As of April
24
, 2014,
nine of our vessels in operation were on time charters and two of our vessels operated in a spot market commercial pool. We intend to place our Ordered Vessels on time charters or in the spot market upon delivery to us, commencing late in November 2014. Time charters provide contracted revenue that reduces the volatility (rates can fluctuate within months) and seasonality (rates are generally stronger in first and fourth quarters of the year) from vessels that operate in the spot market. Two of our Operational Vessels are employed in a third-party commercial pool for chemical tankers. The commercial pool reduces volatility because it aggregates the revenues and expenses of all pool participants and distributes net earnings to the participants based on an agreed upon formula.
49
As of December 31, 2013, our cash balance was $56.9 million, which is a $41.6 million increase from our cash balance of $15.3 million as of December 31, 2012. This is primarily due to net proceeds from our IPO along with proceeds from debt and capital lease drawdowns that were offset by installment payments in respect of our Ordered Vessels.
Our long term liquidity needs are met through our long term debt obligations.
Ten of our Operational Vessels and eight of our Ordered Vessels have senior debt facilities in place, none of which expire until 2018. Of the four debt facilities that we currently have in place, two are with ABN AMRO Bank N.V. based in the Netherlands (the "First ABN AMRO Facility" and the "Second ABN AMRO Facility"), one is with DVB Bank SE based in Germany (the "DVB Facility") and one is a joint facility with ABN AMRO Bank N.V., Nordea Bank Finland Plc and Skandinaviska Enskilda Banken AB (the "Joint Debt Facility"). We also have a capital lease financing facility for two of the vessels with ICON Investments based in New York, USA (the "ICON Capital Leases") in an amount of $31.5 million.
The First ABN AMRO Facility is in the amount of $40.5 million and bears interest at a rate of 3.25% above LIBOR. We entered into this facility to finance the acquisition of the
Ardmore Seatrader
, the
Ardmore Calypso
and the
Ardmore Capella
. This loan was drawn down in three tranches. The first tranche was drawn down in April 2011 and the second and third tranches were drawn down in June 2011, totalling $32.0 million. The remaining $8.5 million is no longer available for borrowing. On March 28, 2013 two of the subsidiaries subject to the First ABN AMRO Facility entered into an agreement for the sale and leaseback (under the ICON Capital Leases) for $31.5 million. As part of this arrangement, the senior debt outstanding on the
Ardmore Calypso
and
Ardmore Capella
was repaid in full on April 2, 2013. The amount repaid was $17.9 million. As such, of the First ABN AMRO Facility, one vessel remains with debt outstanding and this fully matures in 2018. As of December 31, 2013, we had $9.0 million outstanding under the First ABN AMRO Facility and $30.4 million outstanding under the ICON Capital Leases facility.
The Second ABN AMRO Facility is in the amount of $48.9 million and bears interest at a rate of 3.20% above LIBOR. We entered into this facility to finance the acquisition of the
Ardmore Seavaliant
and the
Ardmore Seaventure
and the full amount, $48.9 million, of this facility was drawn down in line with its terms. As of December 31, 2013, we had $46.8 million outstanding under this facility.
The DVB Facility is in the amount of $81.9 million. The first tranche, which was drawn down in October 2012, bears interest at a rate 3.75% above LIBOR. The second and third tranche were drawn down in January 2014 and February 2014, and bear interest at a rate of 2.45% above LIBOR. We entered into the DVB Facility to finance the
Ardmore Seafarer
,
Ardmore Seamaster
,
Ardmore Centurion
,
Ardmore Seavantage
and
Ardmore Seavanguard
. The amount drawn down under this facility as of December 31, 2013 was $36.9 million. The remainder of the DVB Facility, $45.0 million, was drawn down in two equal installments just prior to delivery of the
Ardmore Seavantage
and
Ardmore Seavanguard
in January 2014 and February 2014, respectively. As of December 31, 2013, we had $33.0 million outstanding under this facility.
The Joint Debt Facility is in the amount of $172 million in order to finance eight of our Ordered Vessels. Drawdowns will be made in line with deliveries of each vessel, commencing in January 2015. Interest is calculated on each tranche at a rate of 3.15% above LIBOR. The terms of the Joint Debt Facility include an accordion option whereby, subject to lenders' approval, we may request to increase the Joint Debt Facility to finance the acquisition of additional vessels.
We are also in advanced discussions with our relationship banks and have received non-binding indicative terms for two additional debt facilities (the "Prospective Debt Facilities"). If obtained, we intend to use these facilities to finance the remaining two of our Ordered Vessels and the
Ardmore Seamariner
which was acquired in October 2013 with cash.
Agreements related to long-term debt obligations stated above include certain covenants. The financial covenants include:
|
|
·
|
we maintain minimum solvency of not less than 30%;
|
|
|
·
|
we maintain minimum cash and cash equivalents based on the number of vessels owned and chartered-in and debt service requirements. Our required minimum cash balance as of December 31, 2013 was $4.8 million;
|
|
|
·
|
the aggregate fair market value of our vessels plus any additional collateral shall, depending on the facility, be no less than 125% to 150% of the debt outstanding (value maintenance covenant);
|
|
|
·
|
we maintain a corporate net worth of not less than $45 million;
|
|
|
·
|
we maintain positive working capital, excluding balloon maturities; and
|
|
|
·
|
our ratio of EBITDA plus a portion of cash in excess of our minimum liquidity to total interest expense shall at all times exceed 2.25:1
|
The long-term debt obligations do not impose a restriction on dividends, distributions, or returns of capital unless an event of default has occurred, is continuing or will result from such payment. We are fully compliant with all of our loan covenants as of December 31, 2013.
50
Cashflow Data for the Years Ended December 31, 2013, December 31, 2012 and December 31, 2011
|
For the years ended
|
||||||||||||
|
CASHFLOW DATA
|
Dec 31, 2013
|
Dec 31, 2012
|
Dec 31, 2011
|
|||||||||
|
Net cash provided by operating activities
|
$ | 8,120,173 | 3,985,253 | 397,273 | ||||||||
|
Net cash used in investing activities
|
(144,637,558 | ) | (14,941,514 | ) | (56,920,554 | ) | ||||||
|
Net cash provided by financing activities
|
$ | 178,044,107 | 20,830,080 | 56,779,795 | ||||||||
Cash provided by operating activities
For the year ended December 31, 2013 cash flow provided by operating activities amounted to $8.1 million. Net profit (after adding back depreciation, amortization and other non-cash items) was an inflow of $7.3 million. Changes in operating assets and liabilities amounted to an inflow of $1.1 million and payments for drydock of $0.2 million in the year then ended.
For the year ended December 31, 2012, cash flow provided by operating activities amounted to $4.0 million. The net profit (after adding back depreciation, amortization and other non-cash items) was an inflow of $2.4 million. Changes in operating assets and liabilities accounted for an inflow of $4.6 million and drydock payments amounted to $3.0 million.
For the year ended December 31, 2011, cash flow provided by operating activities to $0.4 million. Net profit (after adding back depreciation, amortization and other non-cash items) was an inflow of $2.7 million. Changes in operating assets and liabilities for the year then ended accounted for a $2.3 million outflow. There were no payments for drydock for the year ended December 31, 2011.
Cash used by investing activities
For the year ended December 31, 2013, net cash used in investing activities was $144.6 million. Investment in secondhand vessels, the completion of vessels and vessel equipment was $63.5 million for the year the ended. Payments for vessels still under construction at December 31, 2013 were $81.1 million, due to new orders placed within the year. In addition to these outflows, $0.07 million was spent on other assets for the year ended December 31, 2013 which primarily relates to expenditure on IT infrastructure and further office fit out.
For the year ending December 31, 2012, net cash used in investing activities was $14.9 million. Investment in secondhand vessels, the completion of vessels and vessel equipment was $1.3 million. Payments for vessels under construction were $13.6 million and $0.05 million was spent on other assets for the year ended December 31, 2012.
For the year ended December 31, 2011, the net cash used in investing activities was $56.9 million. Investment in vessels, vessel equipment and vessels under construction was $56.8 million and $0.1 million was spent on other assets for the year then ended.
Cash provided by financing activities
For the year ended December 31, 2013, the net cash provided by financing activities was $178.0 million. Drawdowns of senior debt amounted to $47.0 million and repayments of senior debt amounted to $25.3 million. Total proceeds and repayments of a capital lease arrangement amounted to $31.5 million and $1.1 million respectively. We also incurred costs of $1.3 million in relation to deferred finance charges for senior loan facility that had not been drawn down at year end, along with commitment fees payable in respect of other financing committed for vessels under construction. Proceeds from our IPO amounted to $140.0 million which was offset by $11.6 million of IPO related expenses. A dividend was also paid on November 20, 2013 amounting to $1.2 million.
For the year ended December 31, 2012, the net cash provided by financing activities was $20.8 million. Drawdowns of senior debt amounted to $38.7 million and a repayments in association with drawn down debt was $37.2 million. A short term revolving credit facility of $30.3 million was repaid and we also incurred costs of $1.7 million in relation to deferred finance charges for senior loan facilities that had not been drawn down at year end. Additional paid in capital received from GA Holdings was $51.3 million.
For the year ended December 31, 2011, the net cash provided by financing activities was $56.8 million. Drawdowns in the year then ended amounted to $32.0 million and repayments of senior debt for the year were $4.4 million. Draw downs on our short term revolving credit facility were $15.5 million and additional paid in capital received from GA Holdings was $14.9 million. Amounts incurred for deferred finance charges amounted to a $1.3 million outflow.
51
Capital Expenditures
Drydock
Three of our vessels completed in-water surveys in 2013. The drydocking schedule for our Operational Vessels that were in operation as of December 31, 2013 is as follows:
|
For the years ended December 31
|
||||||||||||||||||||
|
2014
|
2015
|
2016
|
2017
|
2018
|
||||||||||||||||
|
Number of vessels in drydock (excl in-water surveys)
|
2 | 4 | - | 3 | 2 | |||||||||||||||
We will continue to try to ensure dockings are staggered across the fleet. As our fleet matures and expands, our drydock expenses are likely to increase. Ongoing costs for compliance with environmental regulations and society classification survey costs are a component of our vessel operating costs.
Newbuildings
As of April 24, 2014 we have ten vessels on order, with deliveries scheduled to begin in November 2014. We have a commitment letter with three of our relationship banks for a credit facility for eight of these newbuildings and we are in discussions with another relationship bank for a credit facility to finance the remaining two vessels on order.
Upgrades
We intend to continue our investment program for vessel upgrades where possible to maintain operational efficiency, optimum commercial performance and preservation of asset value.
Dividends
We have declared dividends of $5.6 million from August 1, 2013 to April 24, 2014. We paid $1.2 million to our shareholders on November 20, 2013 in respect of the period from August 1, 2013 to September 30, 2013 and an additional $1.8 million on February 14, 2014 in respect of the quarter ended December 31, 2013. We expect to pay our shareholders $2.6 million on May 15, 2014 in respect of the quarter ended March 31, 2014. While we cannot assure you that we will continue to do so, we currently intend to pay our stockholders quarterly dividends of $0.10 per share, or $0.40 per share per year.
|
C.
|
Research and Development, Patent and Licences, etc.
|
Not applicable
|
D.
|
Trend Information
|
Our results of operations depend primarily on the charter hire rates that we are able to realize for our vessels, which depend on the demand and supply dynamics characterizing the tanker market at any given time.
The oil tanker industry has been highly cyclical in recent years, experiencing volatility in charter hire rates and vessel values resulting from changes in the supply of and demand for crude oil and tanker capacity.
For other trends affecting our business please see other discussions in "Item 5–Operating and Financial Review and Prospects".
|
E.
|
Off-Balance Sheet Arrangements
|
As of December 31, 2013, we have no off-balance sheet arrangements that have or are reasonably likely to have a current or future material effect on our financial condition, changes in financial condition, revenues or expenses, results of operations, liquidity or capital resources.
52
|
F.
|
Tabular Disclosure of Contractual Obligations
|
The following table sets forth our total obligations on vessel finance and newbuild commitments as at December 31, 2013.
|
FY 2014
|
FY 2015 - 2017
|
FY 2018 - 2020
|
Total
|
|||||||||||||
|
Vessels under construction
|
$ | 120,592,620 | 192,069,410 | - | 312,662,030 | |||||||||||
|
Debt
|
9,100,000 | 27,300,000 | 52,460,000 | 88,860,000 | ||||||||||||
|
Vessels (acquired) deliveries
|
16,480,000 | - | - | 16,480,000 | ||||||||||||
|
Interest expense
(1)
|
3,184,493 | 7,473,220 | 1,253,331 | 11,911,044 | ||||||||||||
|
Loan commitment fees
|
34,313 | - | - | 34,313 | ||||||||||||
|
Office space
|
101,607 | 143,944 | - | 245,551 | ||||||||||||
| $ | 149,493,033 | 226,986,574 | 53,713,331 | 430,192,938 | ||||||||||||
|
(1)
|
The interest expense on our loans is variable and based on LIBOR. The amounts in the above schedule were calculated using an interest swap rate of 0.4% plus a margin of 3.41% which is the weighted average margin on our senior loan facilities.
|
Critical Accounting Estimates
In the application of our accounting policies, which are prepared in conformity with U.S. GAAP, we are required to make judgments, estimates and assumptions about the carrying amounts of assets and liabilities, and revenues and expenses that are not readily apparent from other sources. The estimates and associated assumptions are based on historical experience and other factors that are considered to be relevant. Actual results may differ from these estimates. The estimates and underlying assumptions are reviewed on an ongoing basis. Revisions to accounting estimates are recognized in the period in which the estimate is revised if the revision affects only that period, or in the period of the revision and future periods if the revision affects both current and future periods.
The significant judgments and estimates are as follows:
Revenue recognition
. If a time charter agreement exists, the rate is fixed or determinable, service is provided and collection of the related revenue is reasonably assured, then we recognize revenues over the term of the time charter. We do not recognize revenue during days the vessel is offhire. Where the time charter contains a profit or loss sharing arrangement, the profit or loss is recognized based on amounts earned or incurred as of the reporting date.
Revenues and voyage expenses of our vessels operating in pool arrangements are pooled with the revenues and voyage expenses of other pool participants. The resulting net pool revenues, calculated on the time charter equivalent basis, are allocated to the pool participants according to an agreed formula. The formula used to allocate net pool revenues vary among different pools but generally allocates revenues to pool participants on the basis of the number of days a vessel operates in the pool with weighted adjustments made to reflect the vessel's differing capacities and performance capabilities. We account for our vessels share of net pool revenue on the allocated time charter equivalent on a monthly basis. Net pool revenues due from the pool are included in trade receivables.
Shares-Based Compensation.
We may grant share-based payment awards, such as restricted stock units, as incentive-based compensation to certain employees. Stock Appreciation Rights ("SARs") were granted to certain employees and officers in August 2013. We measure the cost of equity-settled transactions with employees by reference to the fair value of the equity instruments at the date on which they are granted. Estimating fair value for share-based payment transactions requires determining the most appropriate valuation model, which is dependent on the terms and conditions of the grant. This estimate also requires determining the most appropriate inputs to the valuation model, including the expected life of the award, volatility and dividend yield, and making certain assumptions about the award.
Depreciation.
Vessels are depreciated on a straight-line basis over their estimated useful economic life from the date of initial delivery from the shipyard. The useful life of our vessels is estimated at 25 years from the date of initial delivery from the shipyard. Depreciation is based on cost less estimated residual scrap value. Residual scrap value is estimated as the lightweight tonnage of each vessel multiplied by the estimated scrap value per ton. The estimated scrap value is reviewed each year.
53
Vessel impairment.
Vessels and equipment that are "held and used" are assessed for impairment when events or circumstances indicate the carrying amount of the asset may not be recoverable. When such indicators are present, a vessel to be held and used is tested for recoverability by comparing the estimate of future undiscounted net operating cash flows expected to be generated by the use of the vessel over its remaining useful life and its eventual disposition to its carrying amount. An impairment charge is recognized if the carrying value is in excess of the estimated future undiscounted net operating cash flows. The impairment loss is measured based on the excess of the carrying amount over the fair market value of the asset.
Net operating cash flows are determined by applying various assumptions regarding future revenues net of commissions, operating expenses, scheduled drydockings, expected offhire and scrap values. These assumptions are based on historical trends as well as future expectations. Specifically, in estimating future charter rates, management takes into consideration rates currently in effect for existing time charters and estimated daily time charter equivalent rates for each vessel class for the unfixed days over the estimated remaining lives of each of the vessels. The estimated daily time charter equivalent rates used for unfixed days are based on a combination of internally forecasted rates that are consistent with forecasts provided to senior management and our board of directors, and the trailing 10-year historical average one-year time charter rates, based on average rates published by maritime researchers. Recognizing that rates tend to be cyclical, and subject to significant volatility based on factors beyond our control, management believes the use of estimates based on the combination of internally forecasted rates and 10-year historical average rates calculated as of the reporting date to be reasonable. Estimated outflows for operating expenses and drydocking requirements are based on historical and budgeted costs and are adjusted for assumed inflation. Utilization is based on historical levels achieved and estimates of a residual value are consistent with scrap rates used in management's evaluation of scrap value.
Although management believes that the assumptions used to evaluate potential impairment are reasonable and appropriate at the time they were made, such assumptions are highly subjective and likely to change, possibly materially, in the future. There can be no assurance as to how long charter rates and vessel values will remain at their current low levels or whether they will improve by a significant degree. If charter rates were to remain at depressed levels, future assessments of vessel impairment would be adversely affected.
In recent years, the market values of vessels have experienced particular volatility, with substantial declines in many of the charter-free market value, or basic market value, of various vessel classes. As a result, our vessels may have declined below those vessels' carrying value, even though we did not impair those vessels' carrying value under our impairment accounting policy. This is due to our belief that future undiscounted cash flows expected to be earned by such vessels over their operating lives would exceed such vessels' carrying amounts.
Our estimates of basic market value assume that our vessels are all in good and seaworthy condition without need for repair and, if inspected, would be certified in class without notations of any kind. Our estimates are based on the estimated market values for our vessels that we have received from independent ship brokers, reports by industry analysts and data providers that focus on our industry and related dynamics affecting vessel values and news and industry reports of similar vessel sales. Vessel values are highly volatile and as such, our estimates may not be indicative of the current or future basic market value of our vessels or prices that we could achieve if we were to sell them.
The table set forth below indicates the carrying value of each of our owned vessels as of December 31, 2013, at which time we were not holding any of the vessels listed in the table below as held for sale. We believe that the future undiscounted cash flows expected to be earned by those vessels, which have experienced a decline in charter-free market value below such vessels' carrying value, over their operating lives would exceed such vessels' carrying values as of December 31, 2013, and accordingly, have not recorded an impairment charge.
|
Carrying Value as at
|
|||||||||||||
|
Built
|
DWT
|
Dec 31, 2013
|
Dec 31, 2012
|
||||||||||
|
Ardmore Seavaliant
|
2013
|
49,998 | $ | 38,494,348 | - | ||||||||
|
Ardmore Seaventure
|
2013
|
49,998 | 39,171,535 | - | |||||||||
|
Ardmore Seatrader
|
2002
|
47,141 | 20,466,413 | 22,075,898 | |||||||||
|
Ardmore Seamaster
|
2004
|
45,840 | 22,102,978 | 23,676,818 | |||||||||
|
Ardmore Seafarer
|
2004
|
45,744 | 22,219,081 | 23,815,239 | |||||||||
|
Ardmore Centurion
|
2005
|
29,006 | 18,961,493 | 19,561,767 | |||||||||
|
Ardmore Calypso
|
2010
|
17,589 | 18,987,607 | 19,676,603 | |||||||||
|
Ardmore Capella
|
2010
|
17,567 | 18,401,311 | 19,190,083 | |||||||||
|
Total
|
$ | 198,804,766 | 127,996,408 | ||||||||||
54
(1) Carrying value includes drydock, upgrades, capitalized interest, supervision fees and other newbuilding pre-delivery costs.
(2) Deposits paid, or costs incurred, in relation to the acquisition of secondhand vessels are not presented in the above table.
We estimate that the aggregate carrying value of these vessels exceeded their aggregate basic charter-free market value by $3.8 million as of December 31, 2013 and $16.5 million as at December 31, 2012. We believe that four of our vessels' carrying value exceeded the basic charter-free market value as of December 31, 2013 and that six of our vessels carrying value exceeded the basic charter-free market value as of December 31, 2012. We did not impair any vessels due to our impairment accounting policy as future undiscounted cash flows expected to be earned by such vessels over their operating lives exceeded these vessels' carrying amounts. In addition to carrying out our impairment analysis, we performed sensitivity analysis for a 10% reduction in forecasted vessel utilization and a 10% reduction in time charter rates and in each scenario the future undiscounted cash flows significantly exceeded the carrying value of our vessels.
Contingencies.
Claims, suits and complaints arise in the ordinary course of our business. We provide for contingent liabilities when (i) it is probable that a liability has been incurred at the date of the financial statements and (ii) the amount of the loss can be reasonably estimated.
Financial instruments.
The carrying values of cash and cash equivalents, accounts receivable and accounts payable reported in the consolidated balance sheet for those financial instruments are reasonable estimates of their fair values due to their short-term nature.
Recent Accounting Pronouncements
There are no recent accounting pronouncements issued whose adoption would have a material impact on Ardmore's consolidated financial statements in the current year or are expected to have a material impact on future years.
|
G.
|
Safe Harbor
|
Forward-looking information discussed in this Item 5 includes assumptions, expectations, projections, intentions and beliefs about future events. These statements are intended as "forward-looking statements." We caution that assumptions, expectations, projections, intentions and beliefs about future events may and often do vary from actual results and the differences can be material. Please see the section entitled "Forward-Looking Statements" in this annual report.
|
Item 6.
|
Directors, Senior Management and Employees
|
|
A.
|
Directors and Senior Management
|
Set forth below are the names, ages and positions of our directors and executive officers. Our board of directors currently consists of seven directors. Each director elected holds office for a three-year term or until his successor shall have been duly elected and qualified, except in the event of his death, resignation, removal or the earlier termination of his term of office. The initial term of office of each director is as follows: Class I directors serve for a term expiring at the 2014 annual meeting of shareholders, Class II directors serve for a term expiring at the 2015 annual meeting of shareholders, and Class III directors serve for a term expiring at the 2016 annual meeting of the shareholders. Officers are elected from time to time by vote of our board of directors and hold office until a successor is elected. The business address for each director and executive officer is the address of our principal operating office which is Ardmore Shipping Limited. City Gate Building 1000, Mahon, Cork, Ireland.
55
|
|
|
|
|
|
|
|
|
Name
|
|
Age
|
Class
|
|
Position
|
|
|
Mr. Reginald Jones
|
|
54
|
III
|
|
Chairman and Director, Chairman of the Nominating and Corporate Governance Committee, Chairman of the Compensation Committee
|
|
|
Mr. Anthony Gurnee
|
|
54
|
II
|
|
Chief Executive Officer, President and Director
|
|
|
Mr. Brian Dunne
|
|
47
|
III
|
|
Director, Chairman of the Audit Committee, Member of the Nominating and Corporate Governance Committee
|
|
|
Mr. Niall McComiskey
|
|
33
|
II
|
|
Director, Member of the Nominating and Corporate Governance Committee, Member of the Audit Committee
|
|
|
Dr. Peter Swift
|
|
69
|
I
|
|
Director, Member of the Compensation Committee
|
|
|
Mr. Alan Robert McIlwraith
|
|
59
|
II
|
|
Director, Member of the Audit Committee
|
|
|
Mr. Albert Enste
|
|
55
|
I
|
|
Director, Member of the Compensation Committee
|
|
|
Mr. Mark Cameron
|
|
48
|
N/A
|
|
Chief Operating Officer
|
|
|
Mr. Paul Tivnan
|
|
34
|
N/A
|
|
Chief Financial Officer, Secretary and Treasurer
|
|
|
Mr. Gernot Ruppelt
|
|
32
|
N/A
|
|
Director, Chartering and Business Development
|
Biographical information with respect to each of our directors and executive officers is set forth below.
Reginald Jones
is our Chairman and a director. Mr. Jones has been the Chairman of the Ardmore Group since 2010. Mr. Jones is a co-founder and Managing Partner of Greenbriar Equity Group LLC. Prior to founding Greenbriar in 1999, Mr. Jones spent thirteen years at Goldman, Sachs & Co., where he was a Managing Director and Group Head of global transportation investment banking. During his time there, Mr. Jones managed a number of the firm's largest corporate clients and led the execution of significant transactions related to mergers and acquisitions, equity and debt financings, leveraged buyouts, recapitalizations, and principal investments. Prior to Goldman Sachs, he worked as a consultant at Bain & Company. Mr. Jones earned a BA from Williams College and an MBA from the Harvard Business School.
Anthony Gurnee
is our Chief Executive Officer, President, and director. Mr. Gurnee has been the Chief Executive Officer and a director of Ardmore since 2010. Between 2006 and 2008, he was the Chief Executive Officer of Industrial Shipping Enterprises, Inc., a containership and chemical tanker company, and Chief Operating Officer of MTM Group, an operator of chemical tankers. From 1992 to 1997, he was the Chief Financial Officer of Teekay Shipping Corporation, where he led the company's financial restructuring and initial public offering. Mr. Gurnee began his career as a financier with Citicorp, and he served for six years as a surface line officer in the US Navy, including a tour with naval intelligence. He is a graduate of the US Naval Academy and earned an MBA at Columbia Business School, is a CFA charter holder, and a fellow of the Institute of Chartered Shipbrokers.
Brian Dunne
is a director of the Company. Mr. Dunne has served as a director within the Ardmore Group since June 2010. Mr. Dunne was the Chief Financial Officer of ACE Aviation Holdings Inc. (ACE) from 2005 until 2012 and was the President of the company in 2011 and 2012. ACE was the parent holding company of the reorganized Air Canada and a number of other entities including Aeroplan LP (now AIMIA Inc) and Air Canada Jazz (now Chorus Aviation Inc). Mr. Dunne was also a director of Air Canada from its initial public offering in 2006 until 2008. Prior to joining ACE, Mr. Dunne was Chief Financial Officer and a director of Aer Lingus Group plc. He started his career at Arthur Andersen in 1987 and became a partner in 1998. Mr. Dunne is a non-executive director or Chairman of a number of private companies including subsidiaries of Aviva plc in Ireland and Rainmaker Business Technologies Limited. Mr. Dunne is a Fellow of the Institute of Chartered Accountants in Ireland and holds a Bachelor of Commerce degree and a post graduate diploma in Professional Accounting from University College Dublin.
Niall McComiskey
is a director of the Company. Mr. McComiskey was appointed as a director within the Ardmore Group in March 2011. Mr. McComiskey is also a Director at Greenbriar Equity Group LLC. Prior to joining Greenbriar, Mr. McComiskey was a Vice President at HSH Nordbank AG from 2004 to 2006 where he led many of the firm's investment activities in the transportation sector. Previously, Mr. McComiskey worked in the Mergers & Acquisitions Group at Deutsche Bank AG. Mr. McComiskey holds a BA in economics from Yale University. He also serves as a director of Grakon International, Inc.
56
Peter Swift
is a director of the Company, as of our IPO date. Dr. Swift has had a distinguished career spanning 45 years in the maritime industry, and is presently serving in non-profit and charitable directorships including acting as the Chairman of the Maritime Piracy Humanitarian Response Programme, as a Member for both the American Bureau of Shipping and the IMO Committee of the Royal Institution of Naval Architects, and as a Director of the Maritime Industry Foundation. Dr. Swift was previously the Managing Director of INTERTANKO from 2000 to 2010 and a Director of Seascope Shipping Limited from 1999 to 2001. He was employed by Royal Dutch Shell from 1975 to 1999 in a range of commercial and technical roles. He was a visiting lecturer and Director for Marine Transport Economics at University of Michigan from 1970 to 1975, and was previously a naval architect for Swan Hunter. Dr. Swift holds a PhD in Transport Economics, an MS Engineering from University of Michigan, and a BS in Naval Architecture from University of Durham. He is a Chartered Engineer, a Fellow of the Royal Institution of Naval Architects, a British National and resides in the UK.
Robert McIlwraith
is a director of the Company, as of our IPO date. Mr. McIlwraith has been an owner of Redwood Management Consultants since April 2011 and has served as Chairman of the Exeter Initiative for Science and Technology (ExIST) since June 2011. He has also served as Chairman of the Trustees of AmSafe Bridport Pension Scheme since 2000, has been teaching Accounting and Finance and Management Studies at INTO University of Exeter since January 2011, became a chamber member at the Exeter Chamber of Commerce and Industry in April 2013, and has served as a Trustee of Sidmouth Hospiscare since 2011. Prior, he served as the President of Align Aerospace France from October 2011 to August 2012 and as a Managing Director and Executive Vice President for the global aerospace and defense business Amsafe from 1998 to 2011. Prior to joining AmSafe, from 1992 to 1998 Mr. McIlwraith was Managing Director of MBM Technology, a subsidiary of Morgan Crucible plc, worked at Rolls Royce plc as a senior development engineer from 1979 to 1984, and completed a five year apprenticeship at the British Steel Corporation as a design draughtsman. Mr. McIlwraith earned his Bachelor's degree in Mechanical Engineering from Cardiff University and is a Chartered Engineer and a Member of the Institution of Mechanical Engineers.
Albert Enste
is a director of the Company, as of our IPO date. Mr. Enste currently serves as active partner and Managing Director of both Enste & American Investors Holding Gmbh and Federnfabrik Schmid AG. He also currently serves on the boards of People Guard USA and Federnfabrik Schmid AG Switzerland. Between 2006 and 2011, Mr. Enste served as the Vice President and General Manager of International Business at Electro-Motive Diesel, Inc. From 2000 to 2001, Mr. Enste headed worldwide locomotive sales as Vice President of Locomotives at DaimlerChrysler Rail Systems ADtranz and continued to hold this position as Senior Director until 2006 with Bombardier Transportation after they acquired DaimlerChrysler Rail Systems ADtranz. Mr. Enste started his career in 1985 with Siemens AG, holding various positions in their automotive and automation groups until 1999. Mr. Enste holds a Master of Engineering from the Technical University of Munich.
Mark Cameron
is the Chief Operating Officer for Ardmore. Mr. Cameron joined Ardmore as Chief Operating Officer and was appointed an alternate director in June 2010. From 2008 to 2010 Mr. Cameron served as Vice President, Strategy and Planning for Teekay Marine Services, Teekay Corporation's internal ship management function. Mr. Cameron spent eleven years at sea rising to the rank of Chief Engineer with Safmarine and later AP Moller, including time served onboard bulk carriers, salvage tugs, tankers, general cargo, reefer and container ships. Mr. Cameron has held a number of senior management roles ashore specializing in integrating acquisitions covering all facets of ship management, as well as sale & purchase, newbuilding supervision, personnel management, procurement, fleet management and technical supervision.
Paul Tivnan
is our Chief Financial Officer, Secretary and Treasurer. Mr. Tivnan joined Ardmore Shipping LLC in June 2010. He was employed at Ernst & Young most recently and was Senior Manager in their Financial Services Tax Advisory Services department from 2009 to 2010. He was also a participant in Ernst & Young's Accelerated Leadership Program from 2008 to 2010. Mr. Tivnan is a graduate of Dublin City University, holds a BA in Accounting and Finance and an MBS in Accounting. He is an Associate of the Institute of Chartered Accountants of Ireland, an Associate of the Irish Taxation Institute and a member of the Institute of Chartered Shipbrokers.
Gernot Ruppelt
is our Director, Chartering and Business Development. Mr. Rupplet joined Ardmore with 12 years of commercial experience in the maritime business. He previously worked as a Tanker Broker at Poten & Partners, New York, for five years. During his time at Poten & Partners, Gernot brokered longer term deals for crude oil, product and chemical tankers working on behalf of ship-owners and operators, oil traders, refineries and oil companies. In the seven years prior to this he worked for Maersk Broker and AP Moller—Maersk in Copenhagen, Singapore and Germany. As a broker at Maersk, Gernot concluded container ship contracts for third party business, and he also spent several years at Maersk's liner organization, most recently as Trade Manager for their Pacific Eastbound trade. Gernot is a Member of the Institute of Chartered Shipbrokers in London. He also completed the two-year 'Maersk International Shipping Education' program and graduated from Hamburg Shipping School.
57
|
B.
|
Compensation of Directors and Senior Management
|
We paid $1,753,200 in compensation to members of our senior executive officers in 2013, which includes awards under our equity incentive plan. Each of our non-employee directors will receive annual cash compensation in the aggregate amount of $35,000 annually, plus $25,000 in stock-based compensation annually plus an additional fee of $12,500 for each committee for which a director serves as Chairman, per year, plus reimbursements for actual expenses incurred while acting in their capacity as a director. Our Chairman will receive an additional $25,000 per year. Our officers and directors are eligible to receive awards under our equity incentive plan which is described below under "—Equity Incentive Plan." We do not have a retirement plan for our officers or directors.
We believe that it is important to align the interests of our directors and management with that of our shareholders. In this regard, we have determined that it will generally be beneficial to us and to our shareholders for our directors and management to have a stake in our long-term performance. We expect to have a meaningful component of our compensation package for our directors and management consist of equity interests in the Company in order to provide them on an on-going basis with a meaningful percentage of ownership in the Company.
Equity Incentive Plan
We currently have an equity incentive plan, which we refer to as the plan, under which directors, officers, and employees, (including any prospective officer or employee) of the Company and its subsidiaries and affiliates, and consultants and service providers to (including persons who are employed by or provide services to any entity that is itself a consultant or service provider to) the Company and its subsidiaries and affiliates, as well as entities wholly-owned or generally exclusively controlled by such persons, may be eligible to receive incentive stock options, non-qualified stock options, stock appreciation rights, restricted stock, restricted stock units, dividend equivalents, unrestricted stock and other equity-based or equity-related awards that the plan administrator determines are consistent with the purposes of the plan and the interests of the Company. Subject to adjustment for changes in capitalization, the aggregate number of shares of our common stock with respect to which awards may at any time be granted under the plan will be equal to 8% of the issued and outstanding shares of our common stock at the time of the award issuance. Subject to adjustment for changes in capitalization, the aggregate number of shares of our common stock with respect to which incentive stock options may at any time be granted under the plan will be 1,000,000, provided in no event will incentive stock options be issued in excess of 8% of the issued and outstanding shares of our common stock at the time of issuance of the incentive stock option. The plan will be administered by our compensation committee.
Under the terms of the plan, stock options and stock appreciation rights granted under the plan will have an exercise price equal to the fair market value of a common share on the date of grant, unless otherwise determined by the plan administrator, but in no event will the exercise price be less than the fair market value of a common share on the date of grant. Options and stock appreciation rights will be exercisable at times and under conditions as determined by the plan administrator, but in no event will they be exercisable later than ten years from the date of grant.
The plan administrator may grant shares of restricted stock and awards of restricted stock units subject to vesting, forfeiture and other terms and conditions as determined by the plan administrator. With respect to restricted stock units, the award recipient will be paid an amount equal to the number of vested restricted stock units multiplied by the fair market value of a common share on the date of vesting, which payment may be paid in the form of cash or common shares or a combination of both, as determined by the plan administrator. The plan administrator may grant dividend equivalents with respect to grants of restricted stock units.
Adjustments may be made to outstanding awards in the event of a corporate transaction or change in capitalization or other extraordinary event. In the event of a "change in control" (as defined in the plan), unless otherwise provided by the plan administrator in an award agreement, awards then outstanding will become fully vested and exercisable in full.
Our board of directors may amend or terminate the plan and the plan administrator may amend outstanding awards, provided that no such amendment or termination may be made that would materially impair any rights, or materially increase any obligations, of a grantee under an outstanding award without the consent of the grantee. Shareholder approval of plan amendments will be required under certain circumstances. Unless terminated earlier by our board of directors, the plan will expire ten years from the date the plan is adopted.
58
Stock Appreciation Rights
As of December 31, 2013 the Company has granted 1,078,125 stock appreciation rights ("SARs") to certain of its officers and directors. Under a SAR award, the grantee is entitled to receive the appreciation of a share of our common stock following the grant of the award. Each SAR provides for a payment of an amount equal to the excess (if any) of the fair market value of a share of our common stock at the time of exercise of the SAR over the per share exercise price of the SAR, multiplied by the number of shares for which the SAR is then exercised. Payment under the SAR will be made in the form of shares of our common stock, based on the fair market value of a share of our common stock at the time of exercise of the SAR.
The SAR awards provide that in no event will the appreciation per share for any portion of the SAR award be deemed to exceed four times (i.e., 400%) the per share exercise price of the SAR. In other words, the fair market value of a share of our common stock for purposes of calculating the amount payable under the SAR is not deemed to exceed five times (i.e., 500%) the per share exercise price of the SAR. Any appreciation in excess of four times the per share exercise price of the SAR will be disregarded for purposes of calculating the amount payable under the SAR.
The SARs are scheduled to vest and become exercisable ratably over five years from the date of grant of the SAR award (i.e., 20% of the shares covered by the SAR award will vest on each of the first five anniversaries of the grant date), subject to, and conditioned upon, the grantee's continued service as an employee, officer or director of the Company or one of its subsidiaries or affiliates. Notwithstanding that schedule, no portion of the SAR award will be exercisable prior to the third anniversary of its grant date unless the fair market value of a share of our common stock is equal to more than two times the SAR's per share exercise price and has remained above such amount for 30 consecutive days. The SAR award may receive accelerated vesting in cases of termination of service due to death or disability or in connection with a change of control of the Company. The SAR award will have a term of seven years from the date of grant and in no event will the SAR be exercisable to any extent following the seventh anniversary of the grant date.
The SAR awards are subject to adjustment in the event of certain changes in capitalization or other significant corporate events, as more fully set forth in the equity incentive plan document.
|
C.
|
Board Practices
|
Our board of directors currently consists of seven directors, four of whom, Brian Dunne, Peter Swift, Robert McIlwraith and Albert Enste, have been determined by our board of directors to be independent under the rules of the New York Stock Exchange and the rules and regulations of the SEC. Our Audit Committee consists of Brian Dunne, as Chairman, Robert McIlwraith and Niall McComiskey. Our board of directors has determined that Mr. Dunne qualifies as an Audit Committee financial expert as such term is defined under SEC rules. Mr. McComiskey, a non-independent member of our board of directors, does not have voting rights on the Audit Committee. The Audit Committee, among other things, reviews our external financial reporting, engages our external auditors, and oversees our financial reporting procedures and the adequacy of our internal accounting controls. The Nominating and Corporate Governance Committee consists of Reginald Jones (a non-independent member of our board of directors) as Chairman, Niall McComiskey and Brian Dunne. The Nominating and Corporate Governance Committee is responsible for recommending to the board of directors nominees for director and directors for appointment to board committees and advising the board with regard to corporate governance practices. The Compensation Committee consists of Reginald Jones, as Chairman, Peter Swift and Albert Enste. The Compensation Committee will oversee our equity incentive plan and recommend director and senior employee compensation. Our shareholders may also nominate directors in accordance with procedures set forth in our bylaws.
|
D.
|
Employees
|
We have entered into employment agreements with four of our executives: Anthony Gurnee, our Chief Executive Officer, Paul Tivnan, our Chief Financial Officer, Mark Cameron, our Chief Operating Officer and Gernot Ruppelt, our Director of Chartering and Business Development. These employment agreements are in effect as of August 1, 2013 and terminate in accordance with the terms of such agreements. Pursuant to the terms of their respective employment agreements, our executives are prohibited from disclosing or unlawfully using any of our material confidential information. The employment agreements also include a one year non-solicitation and a one year non-compete clause following the cessation of the employee's employment with us.
The employment agreements require that we maintain director and officer insurance subject to which we shall indemnify and hold the employee harmless against all expenses, liability and loss (including reasonable and necessary attorneys' fees, judgments, fines and amounts paid in settlement) in connection with any threatened or pending action, suit or proceeding, to which the employee is a party or is threatened to be made a party as a result of the employee's employment with us. The indemnification provisions exclude fraud, willful misconduct or criminal activity on the employee's behalf.
59
|
E.
|
Share Ownership
|
With respect to the total amount of common stock owned by all of our officers and directors as a group, see "Item 7. Major Stockholders and Related Party Transactions—A. Major Shareholders."
|
Item 7.
|
Major Shareholders and Related Party Transactions
|
|
A.
|
Major Shareholders
|
The following table sets forth information regarding the beneficial owners of more than five percent of our common shares, and the beneficial ownership of each of our directors and executive officers and of all of our directors and executive officers as a group as of April 24, 2014. All of our shareholders, including the shareholders listed in this table, are entitled to one vote for each common share held. Beneficial ownership is determined in accordance with the SEC's rules. In computing percentage ownership of each person, common shares subject to options held by that person that are currently exercisable or convertible, or exercisable or convertible within 60 days of the date of this annual report, are deemed to be beneficially owned by that person. These shares, however, are not deemed outstanding for the purpose of computing the percentage ownership of any other person.
|
Identity of person or group
|
Shares Beneficially Owned
|
|||||||
|
Number
|
Percentage
|
|||||||
|
GA Holdings LLC (1)
|
8,050,000 | 30.8 | % | |||||
|
Donald Smith & Co. Inc. (2)
|
1,806,370 | 6.9 | % | |||||
|
Blackstone Holdings I L.P. (3)
|
1,500,000 | 5.7 | % | |||||
|
All directors and executive officers as a group
|
* | * | ||||||
|
(1)
|
Approximately 98.6% of the limited company interests in GA Holdings LLC are owned by private investment funds managed by affiliates of Greenbriar Equity Group, LLC. Such entities and their control persons, Joel S. Beckman, Reginald L. Jones III and Gerald Greenwald, have voting and investment power with respect to shares of the company held by GA Holdings LLC.
|
(2) This information is derived from Schedule 13G filed with the SEC on February 10, 2014.
(3) This information is derived from Schedule 13G filed with the SEC on March 24, 2014.
* Less than 1% of our outstanding shares of common stock.
As of April 24, 2014, we had one shareholder of record located in the United States, which was CEDE & CO., a nominee of The Depository Trust Company, which held an aggregate of 18,050,000 shares of our common stock, representing 69% of our outstanding shares of common stock. We believe that the shares held by CEDE & CO. include shares of common stock beneficially owned by both holders in the United States and non-U.S. beneficial owners. We are not aware of any arrangements the operation of which may at a subsequent date result in our change of control.
|
B.
|
Related Party Transactions
|
In 2013, during the period prior to our IPO, Ardmore paid $175,000 (2012: $350,000; 2011:$175,000) to Greenbriar Equity Group LLC in respect of consulting services provided to Ardmore. Greenbriar Equity Group LLC manages funds with an investment in GA Holdings LLC, a significant shareholder in Ardmore Shipping Corporation.
An amount of $600,000 at December 31, 2012, which related to a cash advance from GA Holdings LLC, was repaid prior to our IPO.
|
C.
|
Interest of Experts and Council
|
Not applicable.
|
Item 8.
|
Financial Information
|
|
A.
|
Consolidated Financial Statements and Other Financial Information
|
See Item 18.
60
Legal Proceedings
Although we may, from time to time, be involved in litigation and claims arising out of our operations in the normal course of business, we are not at present party to any legal proceedings or aware of any proceedings against us, or contemplated to be brought against us, that would have a material effect on our business, financial position, results of operations or liquidity. We maintain insurance policies with insurers in amounts and with coverage and deductibles as our board of directors believes are reasonable and prudent. We expect that these claims would be covered by insurance, subject to customary deductibles. Those claims, even if lacking merit, could result in the expenditure of significant financial and managerial resources.
Dividend Policy
While we cannot assure you that we will continue to do so, and subject to the limitations discussed below, we currently intend to pay our stockholders quarterly dividends of $0.10 per share, or $0.40 per share per year. Our board of directors may review and amend our dividend policy from time to time in light of our plans for future growth and other factors. Our ability to pay dividends will be subject to the restrictions in our credit facilities and the provisions of the laws of the Marshall Islands as well as the other limitations set forth in the section of this Annual Report entitled "Risk Factors."
|
B.
|
Significant Changes
|
Not Applicable.
|
Item 9.
|
The Offer and Listing
|
|
A.
|
Offer and Listing Details
|
Shares of our common stock trade on the New York Stock Exchange under the symbol "ASC." The high and low closing prices of our common shares on the New York Stock Exchange are presented for the periods listed below.
|
FOR THE YEAR ENDED
|
HIGH
|
LOW
|
||||||
|
December 31, 2013
(1)
|
$ | 15.56 | $ | 11.69 | ||||
|
FOR THE QUARTER ENDED
|
HIGH
|
LOW
|
||||||
|
September 30, 2013
(1)
|
$ | 14.00 | $ | 12.08 | ||||
|
December 31, 2013
|
$ | 15.56 | $ | 11.69 | ||||
|
March 31, 2014
|
$ | 15.16 | $ | 12.53 | ||||
|
FOR THE MONTHS ENDED
|
HIGH
|
LOW
|
||||||
|
October 31, 2013
|
$ | 13.39 | $ | 11.69 | ||||
|
November 30, 2013
|
$ | 13.35 | $ | 12.63 | ||||
|
December 31, 2013
|
$ | 15.56 | $ | 12.21 | ||||
|
January 31, 2014
|
$ | 15.16 | $ | 14.15 | ||||
|
February 28, 2014
|
$ | 14.58 | $ | 12.98 | ||||
|
March 31, 2014
|
$ | 13.89 | $ | 12.53 | ||||
|
April 2014 (through and including April 23, 2014)
|
$ | 13.54 | $ | 12.41 | ||||
|
|
(1)
|
Commencing with the date of our IPO on August 1, 2013
|
|
B.
|
Plan of Distribution
|
Not applicable.
|
C.
|
Markets
|
Shares of our common stock are trading on the NYSE under the symbol "ASC".
61
|
D.
|
Selling Shareholders
|
Not applicable.
|
E.
|
Dilution
|
Not applicable.
|
F.
|
Expenses of the Issue
|
Not applicable.
|
Item 10.
|
Additional Information
|
|
A.
|
Share Capital
|
|
B.
|
Memorandum and Articles of Association
|
Our Amended and Restated Articles of Incorporation and Amended and Restated Bylaws have been filed as Exhibits 3.1 and 3.2, respectively, to Form F-1/A (Registration Number 333-189714), declared effective by the Securities and Exchange Commission on July 31, 2013. The information contained in these exhibits is incorporated by reference herein.
There are no limitations on the rights to own securities, including the rights of non-resident or foreign shareholders to hold or exercise voting rights on the securities, imposed by the laws of the Republic of The Marshall Islands or by our Articles of Incorporation or Bylaws.
|
C.
|
Material Contracts
|
Attached as exhibits to this annual report are the contracts we consider to be both material and not entered into in the ordinary course of business. Descriptions are included within Item 5.B. with respect to our credit facilities. Other than these contracts, we have not entered into any other material contracts in the two years immediately preceding the date of the annual report, other than contracts entered into in the ordinary course of business.
|
D.
|
Exchange Controls
|
|
E.
|
Taxation of Holders
|
Marshall Islands Tax Considerations
The following are the material Marshall Islands tax consequences of the ownership of our common shares. We are incorporated in the Marshall Islands. Under current Marshall Islands law, we are not subject to tax on income or capital gains, and no Marshall Islands withholding tax will be imposed upon payments of dividends by us to our shareholders.
62
Bermuda Tax Considerations
The following are the material Bermuda tax consequences of the ownership of our common shares. We are not currently subject to taxation under the laws of Bermuda. Distributions we receive from our subsidiaries also are not subject to any Bermuda tax. There is currently no Bermuda income, corporation or profits tax, withholding tax, capital gains tax, capital transfer tax, or estate duty or inheritance tax payable by non-residents of Bermuda in respect of capital gains realized on a disposition of our common shares or in respect of distributions they receive from us with respect to our common shares. This does not, however, apply to the taxation of persons ordinarily resident in Bermuda. Bermuda shareholders should consult their own tax advisors regarding possible Bermuda taxes with respect to dispositions of, and distributions on, our common shares.
We have received from the Minister of Finance under the Exempted Undertakings Tax Protection Act 1966, as amended, an assurance that, in the event that Bermuda enacts legislation imposing tax computed on profits, income, any capital asset, gain or appreciation, or any tax in the nature of estate duty or inheritance, the imposition of any such tax shall not be applicable to us or to any of our operations or shares, debentures or other obligations, until 31st March 2035. This assurance is subject to the proviso that it is not to be construed to prevent the application of any tax or duty to such persons as are ordinarily resident in Bermuda or to prevent of the application of any tax payable in accordance with the provisions of the Land Tax Act 1967. The assurance does not exempt us from paying import duty on goods imported into Bermuda. In addition, all entities employing individuals in Bermuda are required to pay a payroll tax and there are other sundry taxes payable, directly or indirectly, to the Bermuda government. We and our subsidiaries incorporated in Bermuda pay annual government fees to the Bermuda government.
Bermuda currently has no tax treaties in place with other countries in relation to double-taxation or for the withholding of tax for foreign tax authorities.
Irish Tax Considerations
The following are the material corporate tax consequences to us of our activities in Ireland and to Irish Holders and Non-Irish Holders, each as defined below, of the common shares. This summary is based on Irish taxation laws currently in force, regulations promulgated thereunder, proposals to amend any of the foregoing publicly announced prior to the date hereof, and the currently published administrative practices of the Irish Revenue Commissioners, all as of the date hereof. Taxation laws are subject to change, from time to time, and no representation is or can be made as to whether such laws will change, or what impact, if any, such changes will have on the statements contained in this summary. No assurance is or can be given that legislative or judicial changes, or changes in administrative practice, will not modify or change the statements expressed herein. We have assumed for the purposes of this summary that any proposed changes to the taxation laws will be enacted in the form proposed. Holders of the common shares are advised to consult with their own tax advisers with respect of the application of Irish taxation laws to their particular circumstances in relation to the purchase, ownership or disposition of the common shares.
This summary is of a general nature only. It does not constitute tax or legal advice and does not discuss all aspects of Irish taxation that may be relevant to our activities or to Irish Holders and Non-Irish Holders. The summary generally only applies to Irish and Non-Irish Holders that legally and beneficially hold their common shares as capital assets and does not address special classes of holders including, but not limited to, dealers in securities, insurance companies, pension schemes, employee share ownership trusts, collective investment undertakings, investment undertakings, charities, tax-exempt organizations, financial institutions and close companies, each of which may be subject to special rules not discussed below. For the purposes of this summary, "Ireland" means the Republic of Ireland.
Irish Tax Considerations Applicable to Irish Holders
For the purposes of this discussion, an "Irish Holder" means a holder of common shares that (i) beneficially owns the common shares; (ii) in the case of individual holders, are resident, ordinarily resident and domiciled in Ireland under Irish taxation laws; (iii) in the case of holders that are companies, are resident in Ireland under Irish taxation laws; and (iv) are not also resident in any other country under any double taxation agreement entered into by Ireland.
Taxation of Dividends
Individual Irish Holders will be subject to income tax on the gross amount of any dividend (the amount of the dividend received plus any Dividend Withholding Tax ("DWT") withheld), at their marginal rate of tax (currently either 20 percent or 41 percent depending on the individual's circumstances). Individual Irish Holders may be able to claim a credit against their resulting income tax liability in respect of any DWT withheld.
63
Individual Irish Holders may, depending on their circumstances, also be subject to the universal social charge at rates of up to 10 percent and pay related social insurance contribution of rates up to 4 percent in respect of their dividend income. Individual Irish Holders must account for all Irish taxes on a self-assessment basis.
Corporate Irish Holders will be subject to corporation tax on the gross amount of any dividend received at the rate of 25 percent. Where the Corporate Irish Holders is a company for whom the dividends are a trading receipt, the gross amounts of any dividend will form part of its taxable income for self-assessment purposes subject to corporation tax at the rate of 12.5 percent. Corporate Irish Holders may be able to claim a credit against their resulting corporation tax liability in respect of any DWT withheld.
Disposals of Common Shares
Irish Holders that acquire common shares will be considered, for Irish tax purposes, to have acquired their common shares at a base cost equal to the Euro equivalent amount paid for the common shares. On subsequent dispositions, common shares acquired at an earlier time will be deemed, for Irish tax purposes, to be disposed of on a "first in first out" basis before common shares acquired at a later time.
Irish Holders that dispose of their common shares will be subject to capital gains tax ("CGT") to the extent that the Euro equivalent of the proceeds realized from such disposition exceeds the Euro equivalent of the base cost of the common shares disposed of and any incidental expenses. The current rate of CGT is 33 percent. An annual exemption allows individuals to realise chargeable gains of up to €1,270 in each tax year without giving rise to CGT. This exemption may not be transferred between spouses.
Irish Holders that realize a loss on the disposition of common shares will generally be entitled to offset such allowable losses against capital gains realized from other sources in determining their capital gains tax liability in a year. Allowable losses which remain unrelieved in a year may generally be carried forward indefinitely for Irish capital gains tax purposes and applied against capital gains in future years.
Capital Acquisitions Tax
A gift or inheritance of common shares by Irish Holders may fall within the charge to Irish capital acquisitions tax ("CAT"). CAT may apply to gifts or inheritances of Irish situate assets or where either the person from whom the gift or inheritance is taken is Irish domiciled, resident or ordinarily resident or the person taking the gift or inheritance is Irish resident or ordinarily resident.
CAT is currently chargeable at a rate of 33 percent on the value of gifts or inheritances above specified tax free thresholds. Different classes of tax free thresholds apply depending upon the relationship between the donor and the recipient. These tax free thresholds are also affected by the value of previous gifts or inheritances received. Gifts or inheritances between spouses are not subject to Irish CAT.
Irish Tax Considerations Applicable to Non-Irish Holders
For the purposes of this discussion, a "Non-Irish Holder" means a holder of common shares that (i) beneficially owns the common shares; (ii) in the case of individual holders, are neither resident, ordinarily resident or domiciled in Ireland under Irish taxation laws; (iii) in the case of holders that are companies, are neither resident in Ireland under Irish taxation laws nor carrying on a trade in Ireland through a branch or agency; and (iv) are not carrying on a trade in Ireland through a 'permanent establishment' as defined under any double taxation agreement entered into by Ireland.
Under current Irish taxation law, Non-Irish Holders are not subject to tax on income or capital gains, and no Irish withholding tax will be imposed upon payments of dividends, from common shares.
Irish Tax Considerations Applicable to Ardmore's Irish Subsidiaries
The following is a brief overview of the material tax considerations relevant to our activities in Ireland. For the purposes of this discussion, Ardmore's "Irish Subsidiaries" means our intermediate holding company Ardmore Shipholding Limited, an Irish incorporated and resident company, and its wholly-owned subsidiaries resident in Ireland for tax purposes. These wholly-owned subsidiaries include Ardmore Shipping Limited, our management company, and the separate vessel subsidiaries.
64
Taxation in Ireland—General
Companies that are resident in Ireland for tax purposes are subject to Irish corporation tax on their worldwide income and gains. The current rates of Irish corporation tax are 12.5 percent for certain trading income, 25 percent for all other income and 33 percent for capital gains. These rates may be reduced or eliminated depending on the nature of the income and gains and the activities of the recipient company.
Taxation of Dividends
Should Irish Subsidiaries pay dividends, such dividends will generally be subject to DWT in Ireland at the standard rate of income tax (currently 20 percent). Where DWT applies, we will be responsible for withholding such tax at source.
Should an Irish Subsidiary pay a dividend to another Irish Subsidiary an automatic exemption from DWT will apply and so the dividend will be paid gross. The Irish Subsidiary recipient will not be subject to tax in respect of such dividends received.
Should an Irish Subsidiary pay a dividend to an Ardmore company, that is not an Irish Subsidiary, the recipient company should be entitled to claim an exemption from DWT as a "qualifying non-resident person." A qualifying non-resident person for these purposes includes a non-Irish resident company which is a 75% or greater subsidiary of a company the principal class of shares of which are substantially and regularly traded on a recognised stock exchange in a relevant territory. A "relevant territory" means a Member State of the European Union or a jurisdiction with which Ireland has a Double Taxation Treaty.
The term "substantially and regularly traded" is not defined in Irish Tax legislation, however, for the purposes of qualifying for exemption from DWT the Irish Revenue Commissioners have stated that they will accept that a company's shares are "substantially and regularly traded" where the shares are traded on a regular basis each year in more than de minimus quantities.
The common shares, which constitute the Company's sole class of issued and outstanding stock, are traded on the New York Stock Exchange, or the NYSE. It is anticipated that the common shares will therefore be substantially and regularly traded on a recognised stock exchange and so any dividends paid by Irish Subsidiaries should be exempt from DWT.
Disposals of Shares—Irish Subsidiaries
A holder of common shares in an Irish Subsidiary will not be subject to CGT on a disposal of such common shares provided that such holder (i) is neither resident nor ordinarily resident in Ireland at the time of the disposal and provided that the common shares do not derive the greater part of their value from Irish land, minerals or mineral rights, and (ii) does not hold the Shares through or for the purposes of a trade carried on by an Irish branch or agency.
An Irish Subsidiary which itself is the holder of common shares in another company, including an Irish Subsidiary, will not be subject to CGT on a disposal of such common shares under the substantial shareholding exemption provided that (i) at the time of the disposal the Irish Subsidiary held a minimum of 5 percent of the common shares in the company being disposed of for a continuous period of at least 12 months ending not more than two years before the date of disposal, (ii) the company being disposed of is resident for tax purposes in a Member State of the European Union or a jurisdiction with which Ireland has a Double Taxation Treaty, and (iii) the company being disposed of is a 'trading' company (under Irish tax rules) or when viewed as part of a group taken with the Irish Subsidiary and any other 5% subsidiaries, that group is mainly carrying on 'trading' activities.
Tonnage Tax
A number of the Irish Subsidiaries currently operate under what is known as Ireland's "Tonnage Tax Regime." Tonnage Tax provides an alternative to charging corporation tax on certain profits of a qualifying shipping company. Rather than charging corporation tax in the normal way, tax is levied each year by reference to the tonnage of the ships operated by the qualifying company. Tonnage Tax is specifically legislated for under the Irish tax code. It is elective and requires a ten year commitment to remain within the regime. Completion of a detailed application process and approval from the Irish Revenue Commissioners is required before Tonnage Tax can be adopted.
A "qualifying company" for Tonnage Tax purposes is one which (i) is within the charge to Irish corporation tax, (ii) operates qualifying ships, and (iii) caries on the strategic and commercial management of those ships from Ireland. A "qualifying ship" for these purposes means a self-propelled seagoing vessel of 100 tons or more gross tonnage and which is certified for navigation at sea by the competent authorities of any country or territory. It does not include a vessel of "an excluded kind" examples of which include fishing and fish factory vessels, recreational vessels, oil tankers and dredgers.
65
Tonnage tax is not itself a tax, rather it is an alternative method by which certain qualifying shipping companies may calculate their shipping related profits for Irish corporation tax purposes. The shipping related profits, once calculated using the tonnage tax method, are subject to the 12.5% rate of corporation tax. The profits are calculated by reference to the tonnage of the ships used in a company's shipping trade. The "tonnage" profits replace for tax purposes the income and gains arising to the shipping company from certain specific activities.
The tonnage tax profit is calculated on the basis of a specified notional daily profit per ship depending on the net tonnage of the ship. This notional profit per ship is then multiplied by the number of days the ship was operated in the accounting period by the qualifying company. This calculation provides the profit per ship. Where the company operates more than one qualifying ship, the profits per ship are aggregated to arrive at the total tonnage tax profits. The 12.5% corporation tax rate is then applied to this notional total tonnage tax profit. Therefore corporation tax is not subsequently applied to the company's relevant shipping profits (which may include significant chartering income and gains from the disposal of qualifying ships). Losses accruing to the company in respect of its tonnage tax activities may not be set off against other taxable profits subject to corporation tax.
U.S. Federal Income Tax Considerations
In the opinion of Seward & Kissel LLP, our U.S. counsel, the following are the material U.S. federal income tax consequences to us of our activities and to U.S. Holders and Non-U.S. Holders, each as defined below, of the common shares. The following discussion of U.S federal income tax matters is based on the Code, judicial decisions, administrative pronouncements, and existing and proposed regulations issued by the United States Department of the Treasury (the "Treasury Regulations") all of which are subject to change, possibly with retroactive effect. The discussion below is based, in part, on the description of our business as described in this annual report and assumes that we conduct our business as described herein. References in the following discussion to the "Company," "we," "our" and "us" are to Ardmore Shipping Corporation and its subsidiaries on a consolidated basis.
U.S. Federal Income Taxation of Operating Income: In General
We anticipate that we will earn substantially all our income from the hiring or leasing of vessels for use on a time charter basis, from participation in a pool or from the performance of services directly related to those uses, all of which we refer to as "shipping income."
Unless we qualify from an exemption from U.S. federal income taxation under either an applicable tax treaty or the rules of Section 883 of the Code ("Section 883"), as discussed below, a foreign corporation such as the Company will be subject to United States federal income taxation on its "shipping income" that is treated as derived from sources within the United States ("U.S. source shipping income"). For U.S. federal income tax purposes, "U.S. source shipping income" includes 50% of shipping income that is attributable to transportation that begins or ends, but that does not both begin and end, in the United States.
Shipping income attributable to transportation exclusively between non-U.S. ports will be considered to be 100% derived from sources entirely outside the United States. Shipping income derived from sources outside the United States will not be subject to any U.S. federal income tax.
Shipping income attributable to transportation exclusively between U.S. ports is considered to be 100% derived from U.S. sources. However, we are not permitted by United States law to engage in the transportation of cargoes that produces 100% U.S. source shipping income.
Prior to our IPO, we believe that we had been exempt from the U.S. federal income taxation with respect to our U.S. shipping income because we were entitled to the benefits of the U.S.–Irish tax treaty, which generally contains an exemption from this tax for qualified Irish residents. After our IPO, although we no longer qualified for an exemption under the U.S.–Irish tax treaty, we nonetheless took the position that we were exempt from such tax because we qualified for an exemption from such tax under Section 883 of the Code. We intend to continue to take the position that we qualify for the exemption under Section 883. If we do not qualify for the exemption from tax under Section 883, our gross United States source shipping income would be subject to a 4% tax imposed without allowance for deductions as described below.
66
Exemption of Operating Income from U.S. Federal Income Taxation
Under Section 883 and the Treasury Regulations promulgated thereunder, a foreign corporation will be exempt from U.S. federal income taxation of its U.S. source shipping income if:
|
|
(1)
|
it is organized in a "qualified foreign country" which is one that grants an "equivalent exemption" from tax to corporations organized in the United States in respect of each category of shipping income for which exemption is being claimed under Section 883, to which we refer as the "Qualified Foreign Country Test"; and
|
|
|
(2)
|
one of the following tests is met:
|
|
|
(A)
|
during more than half of the days in its taxable year the foreign corporation is a controlled foreign corporation (a “CFC”) within the meaning of Section 957(a), more than 50% of the total value of whose shares are owned by one or more “qualified U.S. persons,” and the foreign corporation complies with certain substantiation and reporting requirements, to which we refer as the “CFC Test”;
|
|
|
(B)
|
more than 50% of the value of its shares is beneficially owned, directly or indirectly, by "qualified shareholders," which as defined includes individuals who are "residents" of a qualified foreign country, to which we refer as the "50% Ownership Test"; or
|
|
|
(C)
|
its shares are "primarily and regularly traded on an established securities market" in a qualified foreign country or in the United States, to which we refer as the "Publicly-Traded Test."
|
The Marshall Islands, the jurisdiction where we and our ship-owning subsidiaries are incorporated, has been officially recognized by the IRS, as a “qualified foreign country” that grants the requisite “equivalent exemption” from tax in respect of each category of shipping income we earn and currently expect to earn in the future. Therefore, we will be exempt from U.S. federal income taxation with respect to our U.S. source shipping income if we satisfy the CFC Test, the 50% Ownership Test or the Publicly-Traded Test.
We intend to take the position that for our 2013 taxable year that we satisfy the CFC Test or the Publicly-Traded Test and therefore qualify for an exemption from tax under Section 883. We anticipate that we will satisfy the Publicly-Traded Test with respect to future taxable years but, as discussed below, this is a factual determination made on an annual basis. We do not currently anticipate circumstances under which we would
be able to satisfy the 50% Ownership Test .
CFC Test
A foreign corporation will satisfy the CFC Test if, in addition to certain substantiation and reporting requirements, during more than half of the days in a taxable year, it is a CFC within the meaning of Section 957(a) and during such period one or more “qualified U.S. persons” own more than 50% of the total value of all its outstanding stock. For these purposes “qualified U.S. persons” generally includes U.S. citizens or resident aliens, domestic corporations, and certain tax-exempt domestic trusts.
For these purposes, a foreign corporation is a CFC if one or more of its U.S. shareholders each owning 10% or more of the total combined voting power of all classes of its stock entitled to vote, in the aggregate, own more than 50% of the total combined voting power of all classes of its stock entitled to vote or more than 50% of the total value of its stock.
We believe and intend to take the position for U.S. federal income tax reporting purposes for our full 2013 taxable year that we satisfy CFC Test, and therefore qualify for the exemption under Section 883, because for more than half of the days during the 2013 taxable year we were a CFC and, more than 50% of the total value of our shares were held by one or more “qualified U.S. persons”, and we have satisfied or will timely satisfy the requisite substantiation and reporting requirements.
Publicly-Traded Test
The Treasury Regulations under Section 883 provide, in pertinent part, that shares of a foreign corporation will be considered to be "primarily traded" on an established securities market in a country if the number of shares of each class of stock that are traded during any taxable year on all established securities markets in that country exceeds the number of shares in each such class that are traded during that year on established securities markets in any other single country. The Company's common shares, which constitute its sole class of issued and outstanding stock are "primarily traded" on the New York Stock Exchange ("NYSE").
Under the Treasury Regulations, our common shares will be considered to be "regularly traded" on an established securities market if one or more classes of our shares representing more than 50% of our outstanding stock, by both total combined voting power of all classes of stock entitled to vote and total value, are listed on such market, (the "listing threshold"). Since all our common shares are listed on the NYSE, we satisfy the listing threshold.
The Treasury Regulations also require that with respect to each class of stock relied upon to meet the listing threshold, (i) such class of stock traded on the market, other than in minimal quantities, on at least 60 days during the taxable year or one-sixth of the days in a short taxable year (“trading frequency test”); and (ii) the aggregate number of shares of such class of stock traded on such market during the taxable year must be at least 10% of the average number of shares of such class of stock outstanding during such year or as appropriately adjusted in the case of a short taxable year (the “trading volume test”). We believe that we satisfy the trading frequency and trading volume tests with respect to the 2013 taxable year and will continue to do so for the 2014 taxable year and future years. Even if this were not the case, the Treasury Regulations provide that the trading frequency and trading volume tests will be deemed satisfied if, as is the case with our common shares, such class of stock is traded on an established securities market in the United States and such shares are regularly quoted by dealers making a market in such shares.
Notwithstanding the foregoing, the Treasury Regulations provide, in pertinent part, that a class of shares will not be considered to be "regularly traded" on an established securities market for any taxable year in which 50% or more of the vote and value of the outstanding shares of such class are owned, actually or constructively under specified share attribution rules, on more than half the days during the taxable year by persons who each own 5% or more of the vote and value of such class of outstanding stock ("5% Override Rule").
For purposes of being able to determine the persons who actually or constructively own 5% or more of the vote and value of our common shares ("5% Shareholders") the Treasury Regulations permit us to rely on those persons that are identified on Schedule 13G and Schedule 13D filings with the United States Securities and Exchange Commission, as owning 5% or more of our common shares. The Treasury Regulations further provide that an investment company which is registered under the Investment Company Act of 1940, as amended, will not be treated as a 5% Shareholder for such purposes.
67
In the event the 5% Override Rule is triggered, the Treasury Regulations provide that the 5% Override Rule will nevertheless not apply if we can establish that within the group of 5% Shareholders, qualified shareholders (as defined for purposes of Section 883) own sufficient number of shares to preclude non-qualified shareholders in such group from owning 50% or more of our common shares for more than half the number of days during the taxable year.
We expect to satisfy the Publicly-Traded Test for the 2014 taxable year and future taxable years. However, there are factual circumstances beyond our control that could cause us to lose the benefit of the Section 883 exemption for any future taxable year. For example, there is a risk that we could no longer qualify for Section 883 exemption based on the Publicly-Traded Test for a particular taxable year if one or more 5% Shareholders were to own 50% or more of our outstanding common shares on more than half the days of the taxable year. Under these circumstances, we would be subject to the 5% Override Rule and we would not qualify for the Section 883 exemption based on the Publicly-Traded Test unless we could establish that our shareholding during the taxable year was such that non-qualified 5% Shareholders did not own 50% or more of our common shares on more than half the days of the taxable year. Under the Treasury Regulations, we would have to satisfy certain substantiation requirements regarding the identity of our shareholders. These requirements are onerous and there is no assurance that we would be able to satisfy them. Given the factual nature of the issues involved, we can give no assurances in regards to our
qualification for the Section 883 exemption.
Taxation in Absence of Section 883 Exemption
If the benefits of Section 883 are unavailable, our U.S. source shipping income would be subject to a 4% tax imposed by Section 887 of the Code on a gross basis, without the benefit of deductions, or the "4% gross basis tax regime," to the extent that such income is not considered to be "effectively connected" with the conduct of a United States trade or business, as described below. Since under the sourcing rules described above, no more than 50% of our shipping income would be treated as being U.S. source shipping income, the maximum effective rate of U.S. federal income tax on our shipping income would never exceed 2% under the 4% gross basis tax regime.
To the extent our U.S. source shipping income is considered to be "effectively connected" with the conduct of a U.S. trade or business, as described below, any such "effectively connected" U.S. source shipping income, net of applicable deductions, would be subject to U.S. federal income tax, currently imposed at rates of up to 35%. In addition, we would generally be subject to the 30% "branch profits" tax on earnings effectively connected with the conduct of such trade or business, as determined after allowance for certain adjustments, and on certain interest paid or deemed paid attributable to the conduct of our U.S. trade or business.
Our United States source shipping income would be considered "effectively connected" with the conduct of a United States trade or business only if:
|
|
·
|
we have, or are considered to have, a fixed place of business in the United States involved in the earning of U.S. source shipping income; and
|
|
|
·
|
substantially all of our U.S. source shipping income is attributable to regularly scheduled transportation, such as the operation of a vessel that follows a published schedule with repeated sailings at regular intervals between the same points for voyages that begin or end in the United States.
|
We do not intend to have, or permit circumstances that would result in having, any vessel sailing to or from the United States on a regularly scheduled basis. Based on the foregoing and on the expected mode of our shipping operations and other activities, it is anticipated that none of our U.S. source shipping income will be "effectively connected" with the conduct of a U.S. trade or business.
United States Taxation of Gain on Sale of Vessels
Regardless of whether we qualify for an exemption under Section 883, we will not be subject to U.S. federal income tax with respect to gain realized on a sale of a vessel, provided the sale is considered to occur outside of the United States under U.S. federal income tax principles. In general, a sale of a vessel will be considered to occur outside of the United States for this purpose if title to the vessel, and risk of loss with respect to the vessel, pass to the buyer outside of the United States. It is expected that any sale of a vessel by us will be considered to occur outside of the United States.
68
U.S. Federal Income Taxation of United States Holders
As used herein, the term "U.S. Holder" means a holder that for U.S. federal income tax purposes is a beneficial owner of common shares and is an individual U.S. citizen or resident, a United States corporation or other U.S. entity taxable as a corporation, an estate the income of which is subject to U.S. federal income taxation regardless of its source, or a trust if a court within the United States is able to exercise primary jurisdiction over the administration of the trust and one or more U.S. persons have the authority to control all substantial decisions of the trust.
If a partnership holds the common shares, the tax treatment of a partner will generally depend upon the status of the partner and upon the activities of the partnership. If you are a partner in a partnership holding the common shares, you are encouraged to consult your tax advisor.
Distributions
Subject to the discussion of passive foreign investment companies below, any distributions made by us with respect to our common shares to a U.S. Holder will generally constitute dividends to the extent of our current or accumulated earnings and profits, as determined under U.S. federal income tax principles. Distributions in excess of such earnings and profits will be treated first as a nontaxable return of capital to the extent of the U.S. Holder's tax basis in its common shares and thereafter as capital gain. Because we are not a U.S. corporation, U.S. Holders that are corporations will not be entitled to claim a dividends received deduction with respect to any distributions they receive from us. Dividends paid with respect to our common shares will generally be treated as foreign source dividend income and will generally constitute "passive category income" for purposes of computing allowable foreign tax credits for U.S. foreign tax credit purposes.
Subject to applicable limitations, including a holding period requirement, dividends paid on our common shares to certain non-corporate U.S. Holders will generally be treated as "qualified dividend income" that is taxable to such U.S. Holders at preferential tax rates provided that (1) the common shares are readily tradable on an established securities market in the U.S. (such as the NYSE, on which our common shares are traded); and (2) we are not a passive foreign investment company for the taxable year during which the dividend is paid or the immediately preceding taxable year (which, as discussed below, we do not believe that we are or will be for any future taxable years).
There is no assurance that any dividends paid on our common shares will be eligible for these preferential rates in the hands of such non-corporate U.S. Holders, although, as described above, we expect such dividends to be so eligible provided an eligible non-corporate U.S. Holder meets all applicable requirements. Any dividends paid by us which are not eligible for these preferential rates will be taxed as ordinary income to a non-corporate U.S. Holder.
Special rules may apply to any "extraordinary dividend"—generally, a dividend in an amount which is equal to or in excess of 10% of a shareholder's adjusted tax basis in a common share—paid by us. If we pay an "extraordinary dividend" on our common shares that is treated as "qualified dividend income," then any loss derived by certain non-corporate U.S. Holders from the sale or exchange of such common shares will be treated as long term capital loss to the extent of such dividend.
Sale, Exchange or Other Disposition of Common Shares
Assuming we do not constitute a passive foreign investment company for any taxable year, a U.S. Holder generally will recognize taxable gain or loss upon a sale, exchange or other disposition of our common shares in an amount equal to the difference between the amount realized by the U.S. Holder from such sale, exchange or other disposition and the U.S. Holder's tax basis in such shares. Such gain or loss will be treated as long-term capital gain or loss if the U.S. Holder's holding period is greater than one year at the time of the sale, exchange or other disposition. Such capital gain or loss will generally be treated as U.S. source income or loss, as applicable, for U.S. foreign tax credit purposes. Long-term capital gains of certain non-corporate U.S. Holders are currently eligible for reduced rates of taxation. A U.S. Holder's ability to deduct capital losses is subject to certain limitations.
3.8% Tax on Net Investment Income
For taxable years beginning after December 31, 2012, a U.S. Holder that is an individual, estate, or, in certain cases, a trust, will generally be subject to a 3.8% tax on the lesser of (1) the U.S. Holder's net investment income for the taxable year and (2) the excess of the U.S. Holder's modified adjusted gross income for the taxable year over a certain threshold (which in the case of individuals will be between $125,000 and $250,000). A U.S. Holder's net investment income will generally include distributions we make on the common stock which are treated as dividends for U.S. federal income tax purposes and capital gains from the sale, exchange or other disposition of the common stock. This tax is in addition to any income taxes due on such investment income.
69
Passive Foreign Investment Company Status and Significant Tax Consequences
Special U.S. federal income tax rules apply to a U.S. Holder that holds shares in a PFIC for U.S. federal income tax purposes. In general, we will be treated as a PFIC with respect to a U.S. Holder if, for any taxable year in which such holder holds our common shares, either
|
|
·
|
at least 75% of our gross income for such taxable year consists of passive income (e.g., dividends, interest, capital gains and rents derived other than in the active conduct of a rental business); or
|
|
|
·
|
at least 50% of the average value of our assets during such taxable year produce, or are held for the production of, passive income.
|
For purposes of determining whether we are a PFIC, cash held by us will be treated as passive assets. In addition, we will be treated as earning and owning our proportionate share of the income and assets, respectively, of any of our subsidiary corporations in which we own at least 25% of the value of the subsidiary's stock. Income earned, or deemed earned, by us in connection with the performance of services would not constitute passive income. By contrast, rental income would generally constitute "passive income" unless we were treated under specific rules as deriving our rental income in the active conduct of a trade or business.
Based on our current and anticipated operations, we do not believe that we are currently a PFIC or will be treated as a PFIC for any future taxable year. Our belief is based principally on the position that the gross income we derive from our time chartering activities should constitute services income, rather than rental income. Accordingly, such income should not constitute passive income, and the assets that we own and operate in connection with the production of such income, in particular, the vessels, should not constitute passive assets for purposes of determining whether we are a PFIC. There is substantial legal authority supporting this position consisting of case law and IRS pronouncements concerning the characterization of income derived from time charters as services income for other tax purposes. However, there is also authority which characterizes time charter income as rental income rather than services income for other tax purposes. Accordingly, no assurance can be given that the IRS or a court of law will accept this position, and there is a risk that the IRS or a court of law could determine that we are a PFIC. In addition, although we intend to conduct our affairs in a manner to avoid being classified as a PFIC with respect to any taxable year, we cannot assure you that the nature of our operations will not change in the future.
As discussed more fully below, if we were to be treated as a PFIC for any taxable year, a United States Holder would be subject to different taxation rules depending on whether the United States Holder makes an election to treat us as a "Qualified Electing Fund" ("QEF election"). As an alternative to making a QEF election, a United States Holder should be able to make a "mark-to-market" election with respect to our common shares, as discussed below. A United States holder of shares in a PFIC will be required to file an annual information return on IRS Form 8621 containing information regarding the PFIC as required by applicable Treasury Regulations.
Taxation of United States Holders Making a Timely QEF Election
If a United States Holder makes a timely QEF election, which United States Holder we refer to as an "Electing Holder," the Electing Holder must report for United States federal income tax purposes its pro rata share of our ordinary earnings and net capital gain, if any, for each of our taxable years during which we are a PFIC that ends with or within the taxable year of the Electing Holder, regardless of whether distributions were received from us by the Electing Holder. No portion of any such inclusions of ordinary earnings will be treated as "qualified dividend income." Net capital gain inclusions of certain non-corporate United States Holders would be eligible for preferential capital gains tax rates. The Electing Holder's adjusted tax basis in the common shares will be increased to reflect any income included under the QEF election. Distributions of previously taxed income will not be subject to tax upon distribution but will decrease the Electing Holder's tax basis in the common shares. An Electing Holder would not, however, be entitled to a deduction for its pro rata share of any losses that we incur with respect to any taxable year. An Electing Holder would generally recognize capital gain or loss on the sale, exchange or other disposition of our common shares. A U.S. Holder would make a timely QEF election for our common shares by filing one copy of IRS Form 8621 with its United States federal income tax return for the first year in which it held such shares when we were a PFIC. If we determine that we are a PFIC for any taxable year, we would provide each United States Holder with all necessary information in order to make the QEF election described above.
70
Taxation of United States Holders Making a Mark-to-Market Election
Alternatively, if we were to be treated as a PFIC for any taxable year and, as we anticipate will be the case, our shares are treated as "marketable stock," a United States Holder would be allowed to make a "mark-to-market" election with respect to our common shares, provided the United States Holder completes and files IRS Form 8621 in accordance with the relevant instructions and related Treasury Regulations. If that election is made, the United States Holder generally would include as ordinary income in each taxable year the excess, if any, of the fair market value of the common shares at the end of the taxable year over such Holder's adjusted tax basis in the common shares. The U.S. Holder would also be permitted an ordinary loss in respect of the excess, if any, of the U.S. Holder's adjusted tax basis in the common shares over its fair market value at the end of the taxable year, but only to the extent of the net amount previously included in income as a result of the mark-to-market election. A U.S. Holder's tax basis in its common shares would be adjusted to reflect any such income or loss amount recognized. In a year when we are a PFIC, any gain realized on the sale, exchange or other disposition of our common shares would be treated as ordinary income, and any loss realized on the sale, exchange or other disposition of the common shares would be treated as ordinary loss to the extent that such loss does not exceed the net mark-to-market gains previously included by the U.S. Holder.
Taxation of U.S. Holders Not Making a Timely QEF or Mark-to-Market Election
If we were to be treated as a PFIC for any taxable year, a U.S. Holder who does not make either a QEF election or a "mark-to-market" election for that year, whom we refer to as a "Non-Electing Holder," would be subject to special rules with respect to (i) any excess distribution (i.e., the portion of any distributions received by the Non-Electing Holder on the common shares in a taxable year in excess of 125% of the average annual distributions received by the Non-Electing Holder in the three preceding taxable years, or, if shorter, the Non-Electing Holder's holding period for the common shares), and (ii) any gain realized on the sale, exchange or other disposition of our common shares. Under these special rules:
|
|
|
|
|
|
·
|
the excess distribution or gain would be allocated ratably over the Non-Electing Holder's aggregate holding period for the common shares;
|
|
|
·
|
the amount allocated to the current taxable year, and any taxable year prior to the first taxable year in which we were a PFIC, would be taxed as ordinary income and would not be "qualified dividend income"; and
|
|
|
·
|
the amount allocated to each of the other taxable years would be subject to tax at the highest rate of tax in effect for the applicable class of taxpayer for that year, and an interest charge for the deemed tax deferral benefit would be imposed with respect to the resulting tax attributable to each such other taxable year.
|
U.S. Federal Income Taxation of Non-U.S. Holders
As used herein, the term "Non-U.S. Holder" means a holder that, for U.S. federal income tax purposes, is a beneficial owner of common shares (other than a partnership) that is not a U.S. Holder.
If a partnership holds our common shares, the tax treatment of a partner will generally depend upon the status of the partner and upon the activities of the partnership. If you are a partner in a partnership holding our common shares, you are encouraged to consult your tax advisor.
Dividends on Common Shares
A Non-U.S. Holder generally will not be subject to U.S. federal income or withholding tax on dividends received from us with respect to our common shares, unless that income is effectively connected with the Non-U.S. Holder's conduct of a trade or business in the U.S.
Sale, Exchange or Other Disposition of Common Shares
A Non-U.S. Holder generally will not be subject to U.S. federal income or withholding tax on any gain realized upon the sale, exchange or other disposition of our common shares, unless:
|
|
·
|
the gain is effectively connected with the Non-U.S. Holder's conduct of a trade or business in the U.S.; or
|
|
|
·
|
the Non-U.S. Holder is an individual who is present in the U.S. for 183 days or more during the taxable year of disposition and other conditions are met.
|
71
Income or Gains Effectively Connected with a U.S. Trade or Business
If the Non-U.S. Holder is engaged in a U.S. trade or business for U.S. federal income tax purposes, dividends on the common shares and gain from the sale, exchange or other disposition of the shares, that is effectively connected with the conduct of that trade or business (and, if required by an applicable income tax treaty, is attributable to a U.S. permanent establishment), will generally be subject to regular U.S. federal income tax in the same manner as discussed in the previous section relating to the taxation of U.S. Holders. In addition, in the case of a corporate Non-U.S. Holder, its earnings and profits that are attributable to the effectively connected income, which are subject to certain adjustments, may be subject to an additional branch profits tax at a rate of 30%, or at a lower rate as may be specified by an applicable U.S. income tax treaty.
Backup Withholding and Information Reporting
In general, dividend payments, or other taxable distributions, and the payment of the gross proceeds on a sale of our common shares, made within the U.S. to a non-corporate U.S. Holder will be subject to information reporting. Such payments or distributions may also be subject to backup withholding if the non-corporate U.S. Holder:
|
|
·
|
fails to provide an accurate taxpayer identification number;
|
|
|
·
|
is notified by the IRS that it has failed to report all interest or dividends required to be shown on its federal income tax returns; or
|
|
|
·
|
in certain circumstances, fails to comply with applicable certification requirements.
|
Non-U.S. Holders may be required to establish their exemption from information reporting and backup withholding with respect to dividends payments or other taxable distribution on our common shares by certifying their status on an applicable IRS Form W-8. If a Non-U.S. Holder sells our common shares to or through a U.S. office of a broker, the payment of the proceeds is subject to both U.S. backup withholding and information reporting unless the Non-U.S. Holder certifies that it is a non-U.S. person, under penalties of perjury, or it otherwise establishes an exemption. If a Non-U.S. Holder sells our common shares through a non-U.S. office of a non-U.S. broker and the sales proceeds are paid outside the U.S., then information reporting and backup withholding generally will not apply to that payment. However, U.S. information reporting requirements, but not backup withholding, will apply to a payment of sales proceeds, even if that payment is made outside the U.S., if a Non-U.S. Holder sells our common shares through a non-U.S. office of a broker that is a U.S. person or has some other contacts with the U.S. Such information reporting requirements will not apply, however, if the broker has documentary evidence in its records that the Non-U.S. Holder is not a U.S. person and certain other conditions are met, or the Non-U.S. Holder otherwise establishes an exemption.
Backup withholding is not an additional tax. Rather, a refund may generally be obtained of any amounts withheld under backup withholding rules that exceed the taxpayer's U.S. federal income tax liability by filing a timely refund claim with the IRS.
Individuals who are U.S. Holders (and to the extent specified in applicable Treasury regulations, Non-U.S. Holders and certain U.S. entities) who hold "specified foreign financial assets" (as defined in Section 6038D of the Code) are required to file IRS Form 8938 with information relating to the asset for each taxable year in which the aggregate value of all such assets exceeds $75,000 at any time during the taxable year or $50,000 on the last day of the taxable year (or such higher dollar amount as prescribed by applicable Treasury Regulations). Specified foreign financial assets would include, among other assets, our common shares, unless the common shares are held in an account maintained with a U.S. financial institution. Substantial penalties apply to any failure to timely file IRS Form 8938, unless the failure is shown to be due to reasonable cause and not due to willful neglect. Additionally, in the event an individual U.S. Holder (and to the extent specified in applicable Treasury Regulations, a Non-U.S. Holder or a U.S. entity) that is required to file IRS Form 8938 does not file such form, the statute of limitations on the assessment and collection of U.S. federal income taxes of such holder for the related tax year may not close until three years after the date that the required information is filed. U.S. Holders (including U.S. entities) and Non-U.S. Holders are encouraged to consult their own tax advisors regarding their reporting obligations in respect of our common shares.
|
F.
|
Dividends and Paying Agents
|
Not applicable.
|
G.
|
Statements by Experts
|
Not applicable.
72
|
H.
|
Documents on Display
|
We file reports and other information with the SEC. These materials, including this Annual Report and the accompanying exhibits, may be inspected and copied at the public facilities maintained by the SEC at 100 F Street, N.E., Washington, D.C. 20549, or from the SEC's website http://www.sec.gov. You may obtain information on the operation of the public reference room by calling 1 (800) SEC-0330 and you may obtain copies at prescribed rates.
|
I.
|
Subsidiary Information
|
Not applicable.
|
Item 11.
|
Quantitative and Qualitative Disclosures about Market Risks
|
Operational risk
We are exposed to operating costs risk arising from various vessel operations. The key areas of operating risk include drydock, repair costs, insurance and piracy. Our risk management includes various strategies for technical management of drydock and repairs coordinated with a focus on measuring cost and quality. Our young fleet helps to minimize the risk. Given the potential for accidents and other incidents that may occur in vessel operations, the fleet is insured against various types of risk. Finally, we have established a set of countermeasures in order to minimize this risk of piracy attacks during voyages, particularly through the Gulf of Aden and off the coast of Africa, to make the navigation safer for sea staff and to protect our assets.
Foreign exchange risk
The majority of our transactions, assets and liabilities are denominated in U.S. dollars. We incur certain general and operating expenses in other currencies (primarily Euro, Singapore Dollar, Pounds Sterling and Hong Kong Dollar) and as a result there is a transactional risk to us where the risk that currency fluctuations will have a negative effect on the value of our cash flows. Such risk may have an adverse effect on our financial condition and results of operations. We believe these adverse effects to be immaterial and have not entered into any derivative contracts for either transaction or translation risk during the year.
Interest rate risk
We are exposed to the impact of interest rate changes primarily through borrowings that require us to make interest payments based on LIBOR. Significant increases in interest rates could adversely affect our margins, results of operations and our ability to repay debt. Lower interest rates lower the returns on cash investments. We regularly monitor interest rate exposure and will enter into swap arrangements to hedge exposure where it is considered economically advantageous to do so.
Credit risk
There is a concentration of credit risk with respect to cash and cash equivalents to the extent that substantially all of the amounts are held across two banks—Nordea Bank Finland Plc and Morgan Stanley & Co. LLC. While we believe this risk of loss is low, we keep this under review and will revise our policy for managing cash and cash equivalents if considered advantageous and prudent to do so.
We limit our credit risk with trade accounts receivable by performing ongoing credit evaluations of our customers' financial condition. We generally do not require collateral for trade accounts receivable.
We may have a credit risk in relation to vessel employment and at times may have multiple vessels employed by one charterer. We consider and evaluate concentration of credit risk regularly and perform on-going evaluations of these charterers for credit risk. As of December 31, 2013, eight of our Operational Vessels were employed with five different charterers.
Liquidity risk
The principal objective in relation to liquidity is to ensure that we have access at minimum cost, to sufficient liquidity to enable us to meet our obligations as they come due and to provide adequately for contingencies. Our policy is to manage its liquidity by strict forecasting of cash flows arising from time charter revenue, pool revenue, vessel operating expenses, general and administrative overhead and servicing of debt.
73
Inflation
We do not expect inflation to be a significant risk to direct expenses in the current and foreseeable economic environment.
|
Item 12.
|
Description of Securities Other than Equity Securities
|
Not applicable.
|
Item 13.
|
Defaults, Dividend Arrearages and Delinquencies
|
None.
|
Item 14.
|
Material Modifications to the Rights of Shareholders and Use of Proceeds
|
None.
|
Item 15.
|
Controls and Procedures
|
|
A.
|
Disclosure Controls and Procedures
|
We evaluated the effectiveness of the Company's disclosure controls and procedures (as defined in Rules 13a-15(e) and 15d-15(e) under the Exchange Act) as of December 31, 2013. Based on that evaluation, our Principal Executive Officer and Principal Financial Officer concluded that our disclosure controls and procedures were effective to provide reasonable assurance that the information required to be disclosed by the Company in reports filed under the Exchange Act is recorded, processed, summarized and reported within the time periods specified in the SEC's rules and forms. There are inherent limitations to the effectiveness of any system of disclosure controls and procedures, including the possibility of human error and the circumvention or overriding of the controls and procedures. Accordingly, even effective disclosure controls and procedures can only provide reasonable assurance of achieving their control objectives.
|
B.
|
Management's Report on Internal Control over Financial Reporting
|
This annual report does not include a report of management's assessment regarding internal control over financial reporting due to a transition period established by rules of the Securities and Exchange Commission for newly public companies.
|
C.
|
Attestation Report of the Registered Public Accounting Firm
|
This annual report does not include an attestation report of the Company's registered public accounting firm due to a transition period established by rules of the Securities and Exchange Commission for newly public companies.
|
D.
|
Changes in Internal Control Over Financial Reporting
|
There were no changes in our internal controls over financial reporting that occurred during the period covered by this annual report that have materially affected, or are reasonably likely to materially affect, our internal control over financial reporting.
|
Item 16
|
Reserved
|
|
Item 16.A
|
Audit Committee Financial Expert
|
Our audit committee consists of Mr. Brian Dunne, Mr. Niall McComiskey and Mr. Alan Robert McIlwraith. Each member of our audit committee is financially literate under the current listing standards of the New York Stock Exchange, and our board of directors has determined that Mr. Brian Dunne qualifies as an "audit committee financial expert," as such term is defined by the SEC. Mr. Brian Dunne is independent under applicable NYSE and SEC standards.
74
|
Item 16.B
|
Code of Ethics
|
We have adopted a code of conduct and ethics applicable to our directors, chief executive officer, chief financial officer, principal accounting officer and other key management personnel. The code is available for review on our website at
http://www.ardmoreshipping.com
.
|
Item 16.C
|
Principal Accountant Fees and Services
|
Audit Fees
Our principal accountants for the fiscal years 2013 and 2012 were Ernst & Young. The audit fees for the audit of each of the years ended December 31, 2013 and 2012 were $0.4 million and $0.1 million, respectively. We also incurred $0.6 million of audit fees in relation to our IPO in August 2013.
Audit-Related Fees
There were no audit-related fees billed in 2013 and 2012.
Tax Fees
There were no tax fees billed in 2013 and 2012.
Other Fees
There were no other fees billed in 2013 and 2012.
Audit Committee
The Audit Committee is responsible for the appointment, replacement, compensation, evaluation and oversight of the work of the independent auditors. As part of this responsibility, the audit committee pre-approves the audit and non-audit services performed by the independent auditors in order to assure that they do not impair the auditors' independence. The Audit Committee has adopted a policy which sets forth the procedures and the conditions pursuant to which services proposed to be performed by the independent auditors may be pre-approved.
The Audit Committee separately pre-approved all engagements and fees paid to our principal accountants in 2013 and 2012.
|
Item 16.D
|
Exemptions from the Listing Standards for Audit Committees
|
Not applicable.
|
Item 16.E
|
Purchases of Equity Securities by the Issuer and Affiliated Purchasers
|
None.
|
Item 16.F
|
Change in Registrant's Certifying Accountant
|
Not applicable.
|
Item 16.G
|
Corporate Governance
|
Pursuant to an exception for foreign private issuers, we, as a Marshall Islands company, are not required to comply with certain corporate governance practices followed by U.S. companies under the NYSE listing standards. We believe that our established practices in the area of corporate governance are in line with the spirit of the NYSE standards and provide adequate protection to our shareholders. In this respect, we have voluntarily adopted a number of NYSE required practices, such as having a majority of independent directors and establishing a compensation committee and a nominating and corporate governance committee.
75
The following are the significant ways in which our corporate governance practices differ from those followed by U.S. domestic companies listed on the NYSE:
|
|
·
|
U.S. issuers are required to have an audit committee, a compensation committee and a nominating and corporate governance committee, each comprised entirely of independent directors. Our audit committee currently consists of two independent directors and one non-independent director, who is a non-voting member of the committee. Our compensation committee currently consists of two independent directors and one non-independent director. Our nominating and corporate governance committee currently consists one independent director and two non-independent directors.
|
|
|
·
|
U.S. issuers are required to obtain shareholder approval prior to the adoption of equity compensation plans. Our Board approves such adoption in lieu of such shareholder approval.
|
|
|
·
|
The NYSE requires that non-management directors meet regularly in executive sessions without management. The NYSE also requires that all independent directors meet in an executive session at least once a year. The Marshall Islands law and our bylaws do not require our non-management directors to regularly hold executive sessions without management.
|
|
|
·
|
The NYSE requires companies to adopt and disclose corporate governance guidelines. The guidelines must address, among other things: director qualification standards, director responsibilities, director access to management and independent advisers, director compensation, director orientation and continuing education, management succession and an annual performance evaluation. We are not required to adopt such guidelines under Marshall Islands law and we have not adopted such guidelines.
|
|
Item 16.H
|
Mine Safety Disclosures
|
Not applicable.
|
Item 17.
|
Financial Statements
|
Not applicable.
|
Item 18.
|
Financial Statements
|
See index to Financial Statements on page F-1.
|
Item 19.
|
Exhibits
|
|
Exhibit
Number
|
Description
|
|
1.1
|
Amended and Restated Articles of Incorporation of the Company, incorporated by reference to Exhibit 3.1 to Ardmore Shipping Corporation's Registration Statement on Form F-1/A (Registration Number 333-189714), filed with the Securities and Exchange Commission on July 22, 2013
|
|
1.2
|
Amended and Restated Bylaws of the Company, incorporated by reference to Exhibit 3.2 to Ardmore Shipping Corporation's Registration Statement on Form F-1/A (Registration Number 333-189714), filed with the Securities and Exchange Commission on July 22, 2013
|
|
2.1
|
Form of Stock Certificate, incorporated by reference to Exhibit 4.1 to Ardmore Shipping Corporation's Registration Statement on Form F-1/A (Registration Number 333-189714), filed with the Securities and Exchange Commission on July 22, 2013.
|
|
4.1
|
Purchase and Option Agreement with respect to SPP Hull TBA #1, SPP Hull TBA #2, MR NB#1 and MR NB#2, incorporated by reference to Exhibit 10.3 to Ardmore Shipping Corporation's Registration Statement on Form F-1/A (Registration Number 333-189714), filed with the Securities and Exchange Commission on July 22, 2013
|
|
4.2
|
Equity Incentive Plan, incorporated by reference to Exhibit 10.4 to Ardmore Shipping Corporation's Registration Statement on Form F-1/A (Registration Number 333-189714), filed with the Securities and Exchange Commission on July 22, 2013
|
76
|
4.3
|
Loan Agreement, dated September 28, 2012, by and among Fastnet Shipco LLC, Shannon Shipco LLC, Rockall Shipco LLC, Forth Shipco LLC, Viking Shipco LLC and DBV Bank SE
|
|
4.4
|
Term Loan Facility, dated March 19, 2014, by and among Fair Isle Shipco LLC, Faroe Shipco LLC, Plymouth Shipco LLC, Portland Shipco LLC, Wight Shipco LLC, Lundy Shipco LLC, Fisher Shipco LLC, Humber Shipco, ABN AMRO Bank N.V., Nordea Bank Finland Plc and Skandinaviska Enskilda Banken AB
|
|
8.1
|
Subsidiaries of the Company
|
|
12.1
|
Rule 13a-14(a)/15d-14(a) Certification of Principal Executive Officer
|
|
12.2
|
Rule 13a-14(a)/15d-14(a) Certification of Principal Financial Officer
|
|
13.1
|
Certification of Principal Executive Officer pursuant to 18 U.S.C. Section 1350, as adopted pursuant to Section 906 of the Sarbanes-Oxley Act of 2002
|
|
13.2
|
Certification of Principal Financial Officer pursuant to 18 U.S.C. Section 1350, as adopted pursuant to Section 906 of the Sarbanes-Oxley Act of 2002
|
|
101
|
The following materials from the Company's Annual Report on Form 20-F for the fiscal year ended December 31, 2013, formatted in eXtensible Business Reporting Language (XBRL):
(i) Consolidated Balance Sheets as of December 31, 2012 and 2013;
(ii) Consolidated Statements of Operations for the years ended December 31, 2011, 2012 and 2013;
(iii) Consolidated Statements of Changes in Equity for the years ended December 31, 2011, 2012 and 2013;
(iv) Consolidated Statements of Cash Flows for the years ended December 31, 2011, 2012 and 2013; and
(v) Notes to Consolidated Financial Statements
|
77
SIGNATURE
Pursuant to the requirements of the Securities Exchange Act of 1934, the hereby certifies that it meets all of the requirements for filing on Form 20-F and that it has duly caused and authorized the undersigned to sign this annual report on its behalf.
|
Ardmore Shipping Corporation
|
|||
|
By:
|
/s/ Anthony Gurnee
|
||
|
Chief Executive Officer
|
|||
|
Date: April 24, 2014
|
|||
78
INDEX TO FINANCIAL STATEMENTS OF ARDMORE SHIPPING CORPORATION
Index to Audited Financial Statements of Ardmore Shipping Corporation
|
Report of independent registered public accounting firm
|
F-2
|
|
Audited consolidated financial statements
|
|
|
Consolidated balance sheets at December 31, 2013 and 2012
|
F-3
|
|
Consolidated statement of operations for the years ended December 31, 2013, 2012 and 2011
|
F-4
|
|
Consolidated statement of changes in equity for the years ended December 31, 2013, 2012 and 2011
|
F-5
|
|
Consolidated statement of cash flows for the year ended December 31, 2013, 2012 and 2011
|
F-6
|
|
Notes to consolidated financial statements
|
F-7
|
F-1
Report of Independent Registered Public Accounting Firm
The Board of Directors and Shareholders of Ardmore Shipping Corporation
We have audited the accompanying consolidated balance sheets of Ardmore Shipping Corporation as of December 31, 2013 and 2012, and the related consolidated statements of operations, changes in equity and cash flows for each of the three years in the period ended December 31, 2013. These financial statements are the responsibility of the Company's management. Our responsibility is to express an opinion on these financial statements based on our audits.
We conducted our audits in accordance with the standards of the Public Company Accounting Oversight Board (United States). Those standards require that we plan and perform the audit to obtain reasonable assurance about whether the financial statements are free of material misstatement. We were not engaged to perform an audit of the Company's internal control over financial reporting. Our audits included consideration of internal control over financial reporting as a basis for designing audit procedures that are appropriate in the circumstances, but not for the purpose of expressing an opinion on the effectiveness of the Company's internal control over financial reporting. Accordingly, we express no such opinion. An audit also includes examining, on a test basis, evidence supporting the amounts and disclosures in the financial statements, assessing the accounting principles used and significant estimates made by management, and evaluating the overall financial statement presentation. We believe that our audits provide a reasonable basis for our opinion.
In our opinion, the financial statements referred to above present fairly, in all material respects, the consolidated financial position of Ardmore Shipping Corporation at December 31, 2013 and 2012, and the consolidated results of its operations and its cash flows for each of the three years in the period ended December 31, 2013, in conformity with U.S. generally accepted accounting principles.
/s/ Ernst & Young
Dublin, Ireland
February 12, 2014
F-2
Ardmore Shipping Corporation
Notes to Consolidated Financial Statements
(Expressed in U.S. dollars, unless otherwise stated)
|
|
As at
|
|||||||||||
|
|
Notes
|
Dec 31, 2013
|
Dec 31, 2012
|
|||||||||
|
ASSETS
|
|
|
||||||||||
|
Current assets
|
|
|
||||||||||
|
Cash and cash equivalents
|
5 | 56,860,845 | 15,334,123 | |||||||||
|
Receivables, trade
|
6 | 743,406 | 864,386 | |||||||||
|
Working capital advances
|
7 | 534,571 | 1,573,955 | |||||||||
|
Prepayments
|
471,563 | 223,471 | ||||||||||
|
Advances and deposits
|
1,894,317 | 423,703 | ||||||||||
|
Other receivables
|
321,810 | 498,259 | ||||||||||
|
Inventories
|
1,131,466 | 666,240 | ||||||||||
|
Total current assets
|
61,957,978 | 19,584,137 | ||||||||||
|
Non-current assets
|
||||||||||||
|
Vessels and equipment, net of accumulated depreciation of $20.8 million (2012: $12.4 million)
|
8 | 201,700,229 | 125,478,619 | |||||||||
|
Deferred drydock expenditure, net of accumulated amortization of $1.9 million (2012: $0.4 million)
|
8 | 1,339,238 | 2,517,789 | |||||||||
|
Vessels under construction
|
8 | 89,015,139 | 29,012,560 | |||||||||
|
Other non-current assets, net of accumulated depreciation of $0.1 million (2012: $0.05 million)
|
8 | 158,308 | 133,147 | |||||||||
|
Deferred finance charges, net of accumulated amortization of $0.7 million (2012: $0.6 million)
|
3,794,741 | 3,234,216 | ||||||||||
|
Total non-current assets
|
296,007,655 | 160,376,331 | ||||||||||
|
|
||||||||||||
|
TOTAL ASSETS
|
357,965,633 | 179,960,468 | ||||||||||
|
|
||||||||||||
|
LIABILITIES AND EQUITY
|
||||||||||||
|
Current liabilities
|
||||||||||||
|
Payables, trade
|
3,999,311 | 2,514,052 | ||||||||||
|
Charter revenue received in advance
|
1,806,600 | 851,045 | ||||||||||
|
Other payables
|
5,436 | 1,867 | ||||||||||
|
Amounts due to related parties
|
— | 600,000 | ||||||||||
|
Accrued interest on loans
|
557,160 | 502,515 | ||||||||||
|
Current portion of long-term debt
|
9 | 9,100,000 | 6,819,918 | |||||||||
|
Current portion of capital lease obligations
|
10 | 1,578,686 | — | |||||||||
|
Total current liabilities
|
17,047,193 | 11,289,397 | ||||||||||
|
Non-current liabilities
|
||||||||||||
|
Non-current portion of long-term debt
|
9 | 79,760,000 | 60,280,082 | |||||||||
|
Non-current portion of capital lease obligations
|
10 | 28,800,329 | — | |||||||||
|
Total non-current liabilities
|
108,560,329 | 60,280,082 | ||||||||||
|
Equity
|
||||||||||||
|
Share capital ($0.01 par value, 250,000,000 shares authorized, 18,050,000 issued and outstanding at December 31, 2013 and 8,049,500 at December 31, 2012)
|
180,500 | 80,495 | ||||||||||
|
Additional paid in capital
|
244,702,577 | 116,992,857 | ||||||||||
|
Accumulated deficit
|
(12,524,966 | ) | (8,682,363 | ) | ||||||||
|
Total equity
|
232,358,111 | 108,390,989 | ||||||||||
|
|
||||||||||||
|
TOTAL LIABILITIES AND EQUITY
|
357,965,633 | 179,960,468 | ||||||||||
|
|
||||||||||||
The accompanying notes are an integral part of these financial statements
F-3
Ardmore Shipping Corporation
Notes to Consolidated Financial Statements
(Expressed in U.S. dollars, unless otherwise stated)
|
For the years ended
|
||||||||||||||||
|
Notes
|
Dec 31, 2013
|
Dec 31, 2012
|
Dec 31, 2011
|
|||||||||||||
|
REVENUE
|
|
|
|
|||||||||||||
|
Revenue
|
35,867,356 | 25,172,654 | 22,375,414 | |||||||||||||
|
OPERATING EXPENSES
|
||||||||||||||||
|
Commissions and voyage related costs
|
2,523,842 | 789,149 | 468,067 | |||||||||||||
|
Vessel operating expenses
|
18,215,487 | 14,598,071 | 12,186,825 | |||||||||||||
|
Charter hire costs
|
— | 1,699,943 | 1,663,380 | |||||||||||||
|
Depreciation
|
8,388,208 | 6,195,416 | 5,343,091 | |||||||||||||
|
Amortization of deferred drydock expenditure
|
1,420,814 | 441,491 | — | |||||||||||||
|
General and administrative expenses
|
12 | 5,669,935 | 2,975,139 | 2,599,031 | ||||||||||||
|
Total operating expenses
|
36,218,286 | 26,699,209 | 22,260,394 | |||||||||||||
|
|
||||||||||||||||
|
(Loss) / profit from operations
|
(350,930 | ) | (1,526,555 | ) | 115,020 | |||||||||||
|
|
||||||||||||||||
|
Interest expense and finance costs
|
13 | (3,464,006 | ) | (2,966,014 | ) | (3,080,472 | ) | |||||||||
|
Interest income
|
14 | 6,059 | 4,713 | 3,608 | ||||||||||||
|
|
||||||||||||||||
|
Loss before taxes
|
(3,808,877 | ) | (4,487,856 | ) | (2,961,844 | ) | ||||||||||
|
|
||||||||||||||||
|
Income tax
|
(33,726 | ) | (51,237 | ) | (13,426 | ) | ||||||||||
|
|
||||||||||||||||
|
Net loss
|
(3,842,603 | ) | (4,539,093 | ) | (2,975,270 | ) | ||||||||||
|
|
||||||||||||||||
|
Loss per share, basic and diluted
|
15 | (0.31 | ) | (0.56 | ) | (0.37 | ) | |||||||||
|
Weighted average number of common shares, basic and diluted
|
12,241,599 | 8,049,500 | 8,049,500 | |||||||||||||
The accompanying notes are an integral part of these financial statements
F-4
Ardmore Shipping Corporation
Notes to Consolidated Financial Statements
(Expressed in U.S. dollars, unless otherwise stated)
|
|
|
Share
capital
|
|
|
Additional
paid-in capital
|
|
|
Accumulated
deficit
|
|
|
TOTAL
|
|
||||
|
Balance as at January 1, 2011
|
|
|
80,495
|
|
|
|
50,710,430
|
|
|
|
(1,168,000
|
)
|
|
|
49,622,925
|
|
|
Shareholder contributions
|
|
|
—
|
|
|
|
14,940,000
|
|
|
|
—
|
|
|
|
14,940,000
|
|
|
Share based compensation
|
|
|
—
|
|
|
|
16,674
|
|
|
|
—
|
|
|
|
16,674
|
|
|
Loss for year
|
|
|
—
|
|
|
|
—
|
|
|
|
(2,975,270
|
)
|
|
|
(2,975,270
|
)
|
|
Balance as at December 31, 2011
|
|
|
80,495
|
|
|
|
65,667,104
|
|
|
|
(4,143,270
|
)
|
|
|
61,604,329
|
|
|
Shareholder contributions
|
|
|
—
|
|
|
|
51,314,503
|
|
|
|
—
|
|
|
|
51,314,503
|
|
|
Share based compensation
|
|
|
—
|
|
|
|
11,250
|
|
|
|
—
|
|
|
|
11,250
|
|
|
Loss for year
|
|
|
—
|
|
|
|
—
|
|
|
|
(4,539,093
|
)
|
|
|
(4,539,093
|
)
|
|
Balance as at December 31, 2012
|
|
|
80,495
|
|
|
|
116,992,857
|
|
|
|
(8,682,363
|
)
|
|
|
108,390,989
|
|
|
Shareholder contributions
|
|
|
5
|
|
|
|
495
|
|
|
|
—
|
|
|
|
500
|
|
|
Net proceeds from equity offering
|
|
|
100,000
|
|
|
|
128,329,204
|
|
|
|
—
|
|
|
|
128,429,204
|
|
|
Share based compensation
|
|
|
—
|
|
|
|
571,321
|
|
|
|
—
|
|
|
|
571,321
|
|
|
Dividend payment ($0.066 per share)
|
|
|
—
|
|
|
|
(1,191,300
|
)
|
|
|
—
|
|
|
|
(1,191,300
|
)
|
|
Loss for year
|
|
|
—
|
|
|
|
—
|
|
|
|
(3,842,603
|
)
|
|
|
(3,842,603
|
)
|
|
Balance as at December 31, 2013
|
|
|
180,500
|
|
|
|
244,702,577
|
|
|
|
(12,524,966
|
)
|
|
|
232,358,111
|
|
|
|
|
|
|
|
|
|
|
|
|
|
|
|
|
|
|
|
The accompanying notes are an integral part of these financial statements
F-5
Ardmore Shipping Corporation
Notes to Consolidated Financial Statements
(Expressed in U.S. dollars, unless otherwise stated)
|
|
For the years ended
|
|||||||||||||||
|
|
Notes
|
Dec 31, 2013
|
Dec 31, 2012
|
Dec 31, 2011
|
||||||||||||
|
OPERATING ACTIVITIES
|
|
|
|
|||||||||||||
|
Net loss
|
(3,842,603 | ) | (4,539,093 | ) | (2,975,270 | ) | ||||||||||
|
Non-cash items:
|
||||||||||||||||
|
Depreciation
|
8,388,208 | 6,195,416 | 5,343,091 | |||||||||||||
|
Amortization of deferred drydock expenditure
|
1,420,814 | 441,491 | — | |||||||||||||
|
Share based compensation
|
571,321 | 11,250 | 16,674 | |||||||||||||
|
Amortization of deferred finance charges
|
13 | 772,787 | 254,547 | 290,391 | ||||||||||||
|
Deferred tax (benefit) / expense
|
— | 24,341 | (16,099 | ) | ||||||||||||
|
Changes in operating assets and liabilities:
|
||||||||||||||||
|
Receivables, trade
|
120,980 | 1,126,119 | (1,629,497 | ) | ||||||||||||
|
Working capital advances
|
1,039,384 | 2,098,612 | (1,331,321 | ) | ||||||||||||
|
Prepayments
|
(248,092 | ) | 26,518 | (214,710 | ) | |||||||||||
|
Advances and deposits
|
(1,470,614 | ) | 145,540 | (419,243 | ) | |||||||||||
|
Other receivables
|
176,449 | (104,521 | ) | 155,121 | ||||||||||||
|
Inventories
|
(465,226 | ) | (44,449 | ) | (315,842 | ) | ||||||||||
|
Payables, trade
|
1,485,259 | 324,688 | 1,401,642 | |||||||||||||
|
Charter revenue received in advance
|
955,555 | 411,705 | (14,968 | ) | ||||||||||||
|
Other payables
|
3,569 | (70,993 | ) | (86,532 | ) | |||||||||||
|
Amounts due to related parties
|
(600,000 | ) | 625,397 | (25,397 | ) | |||||||||||
|
Accrued interest on loans
|
54,645 | 17,965 | 219,233 | |||||||||||||
|
Deferred drydock expenditure
|
(242,263 | ) | (2,959,280 | ) | — | |||||||||||
|
Net cash provided by operating activities
|
8,120,173 | 3,985,253 | 397,273 | |||||||||||||
|
INVESTING ACTIVITIES
|
||||||||||||||||
|
Payments for acquisition of vessels and equipment
|
9 | (63,497,023 | ) | (1,330,198 | ) | (41,381,029 | ) | |||||||||
|
Payments for vessels under construction
|
9 | (81,072,100 | ) | (13,560,194 | ) | (15,418,751 | ) | |||||||||
|
Payments for other non-current assets
|
9 | (68,435 | ) | (51,122 | ) | (120,774 | ) | |||||||||
|
Net cash used in investing activities
|
(144,637,558 | ) | (14,941,514 | ) | (56,920,554 | ) | ||||||||||
|
FINANCING ACTIVITIES
|
||||||||||||||||
|
Short-term revolving credit facility
|
— | (30,265,000 | ) | 15,495,000 | ||||||||||||
|
Proceeds from long-term debt
|
47,030,000 | 38,700,000 | 32,000,000 | |||||||||||||
|
Repayments of long term debt
|
(25,270,000 | ) | (37,200,000 | ) | (4,400,000 | ) | ||||||||||
|
Proceeds from capital leases
|
31,500,000 | — | — | |||||||||||||
|
Repayments of capital leases
|
(1,120,985 | ) | — | — | ||||||||||||
|
Payments for deferred finance charges
|
(1,333,312 | ) | (1,719,423 | ) | (1,255,205 | ) | ||||||||||
|
Net proceeds from equity offering
|
128,429,204 | — | — | |||||||||||||
|
Payment of dividend
|
(1,191,300 | ) | — | — | ||||||||||||
|
Shareholder contributions
|
500 | 51,314,503 | 14,940,000 | |||||||||||||
|
Net cash provided by financing activities
|
178,044,107 | 20,830,080 | 56,779,795 | |||||||||||||
|
|
||||||||||||||||
|
Net increase in cash and cash equivalents
|
41,526,722 | 9,873,819 | 256,514 | |||||||||||||
|
|
||||||||||||||||
|
Cash and cash equivalents at the beginning of the year
|
15,334,123 | 5,460,304 | 5,203,790 | |||||||||||||
|
|
||||||||||||||||
|
Cash and cash equivalents at the end of the year
|
56,860,845 | 15,334,123 | 5,460,304 | |||||||||||||
|
|
||||||||||||||||
|
Cash paid during the year for:
|
||||||||||||||||
|
Interest payments, net of capitalised interest
|
3,619,005 | 3,235,270 | 2,570,847 | |||||||||||||
|
Taxation
|
33,963 | 42,998 | 12,063 | |||||||||||||
The accompanying notes are an integral part of these financial statements
F-6
Ardmore Shipping Corporation
Notes to Consolidated Financial Statements
(Expressed in U.S. dollars, unless otherwise stated)
1. Overview
1.1. Background
Ardmore Shipping Corporation (NYSE: ASC) ("ASC") and subsidiaries (collectively "Ardmore" or "the Company") is an international marine transportation company. Ardmore was established to acquire and operate a high quality fleet of tanker vessels. As at December 31, 2013 Ardmore had eight vessels in operation, twelve vessels under construction and was awaiting delivery of one recently acquired second-hand vessel. The average age of Ardmore's operating fleet at December 31, 2013 is 5.9 years.
All of Ardmore's vessels are double-hulled and are engaged in the transportation of refined oil and chemical products. All the vessels are subject to IMO (International Maritime Organization) regulations including MARPOL (the International Convention for the Prevention of Pollution from Ships) and regulations of major oil and energy-related companies and other relevant international standards.
1.2. Management and organizational structure
Ardmore Shipping Corporation ("ASC") was incorporated in the Republic of the Marshall Islands on May 14, 2013 as a wholly owned subsidiary of GA Holdings LLC, a limited liability company incorporated in the Marshall Islands. On August 6, 2013, the Company completed its initial public offering ("IPO") of 10,000,000 shares of its common stock, par value $0.01, at $14.00 per share. The gross proceeds to the Company from the IPO were $140 million before deducting underwriting commissions and IPO related expenses. Prior to the initial public offering of ASC's common stock, GA Holdings LLC exchanged all of the shares of its wholly owned subsidiary, Ardmore Shipping LLC ("ASLLC"), for 8,049,500 additional shares of ASC and ASLLC became a wholly owned subsidiary of ASC ("the Reorganization"). The financial statements have been retroactively adjusted to reflect the issuance of 8,049,500 shares in connection with the Reorganization. Immediately following the IPO, GA Holdings LLC held 44.6% of the common stock of the Company, with the remaining 55.4% held by public investors.
1.3. Vessels
Ardmore's fleet as of December 31, 2013 comprises the following:
|
Vessel Name
|
Type
|
Dwt
|
IMO
|
Built
Date
|
Built
Country
|
Employment
|
Specification
|
|||||
|
In Operation
|
|
|
|
|
|
|
|
|||||
|
Ardmore Seavaliant
|
Product/Chemical
|
49,998
|
3
|
Feb-13
|
Korea
|
Time Charter
|
Eco-design
|
|||||
|
Ardmore Seaventure
|
Product/Chemical
|
49,998
|
3
|
Jun-13
|
Korea
|
Time Charter
|
Eco-design
|
|||||
|
Ardmore Seatrader
|
Product
|
47,141
|
—
|
Dec-02
|
Japan
|
Time Charter
|
Eco-mod
|
|||||
|
Ardmore Seamaster
|
Product/Chemical
|
45,840
|
3
|
Sep-04
|
Japan
|
Time Charter
|
Eco-mod
|
|||||
|
Ardmore Seafarer
|
Product
|
45,744
|
—
|
Aug-04
|
Japan
|
Time Charter
|
Eco-mod
|
|||||
|
Ardmore Centurion
|
Product/Chemical
|
29,006
|
2
|
Nov-05
|
Korea
|
Spot
|
Eco-mod
|
|||||
|
Ardmore Calypso
|
Product/Chemical
|
17,589
|
2
|
Jan-10
|
Korea
|
Pool
|
Eco-mod
|
|||||
|
Ardmore Capella
|
Product/Chemical
|
17,567
|
2
|
Jan-10
|
Korea
|
Pool
|
Eco-mod
|
|||||
|
Awaiting delivery
|
|
|
|
|
|
|
|
|||||
|
Ardmore Seamariner
|
Product
|
45,726
|
—
|
Oct-06
|
Japan
|
Time Charter
|
Eco-mod
|
F-7
Ardmore Shipping Corporation
Notes to Consolidated Financial Statements
(Expressed in U.S. dollars, unless otherwise stated)
|
|
|
|
|
|
|
|
|
|
|
|
|
|
|
|
|
Vessel Name
|
|
Type
|
|
Dwt
|
|
IMO
|
|
Built
Date
|
|
Built
Country
|
|
Employment
|
|
Specification
|
|
On Order
|
|
|
|
|
|
|
|
|
|
|
|
|
|
|
|
Ardmore Seavantage
|
|
Product/Chemical
|
|
49,997
|
|
3
|
|
Jan-14
|
|
Korea
|
|
Time Charter
|
|
Eco-design
|
|
Ardmore Seavanguard
|
|
Product/Chemical
|
|
49,998
|
|
3
|
|
Feb-14
|
|
Korea
|
|
MI
|
|
Eco-design
|
|
SPP Hull S-1162
|
|
Product/Chemical
|
|
50,300
|
|
3
|
|
1Q15
|
|
Korea
|
|
MI
|
|
Eco-design
|
|
SPP Hull S-1163
|
|
Product/Chemical
|
|
50,300
|
|
3
|
|
2Q15
|
|
Korea
|
|
MI
|
|
Eco-design
|
|
SPP Hull S-1171
|
|
Product/Chemical
|
|
50,300
|
|
3
|
|
2Q15
|
|
Korea
|
|
MI
|
|
Eco-design
|
|
SPP Hull S-1172
|
|
Product/Chemical
|
|
50,300
|
|
3
|
|
3Q15
|
|
Korea
|
|
MI
|
|
Eco-design
|
|
HMD Hull H-2480
|
|
Product/Chemical
|
|
37,000
|
|
2
|
|
1Q15
|
|
Korea
|
|
MI
|
|
Eco-design
|
|
HMD Hull H-2481
|
|
Product/Chemical
|
|
37,000
|
|
2
|
|
1Q15
|
|
Korea
|
|
MI
|
|
Eco-design
|
|
FKA Hull N-2062
|
|
Product/Chemical
|
|
25,000
|
|
2
|
|
4Q14
|
|
Japan
|
|
MI
|
|
Eco-design
|
|
FKA Hull N-2063
|
|
Product/Chemical
|
|
25,000
|
|
2
|
|
1Q15
|
|
Japan
|
|
MI
|
|
Eco-design
|
|
FKA Hull N-2065
|
|
Product/Chemical
|
|
25,000
|
|
2
|
|
3Q15
|
|
Japan
|
|
MI
|
|
Eco-design
|
|
FKA Hull N-2067
|
|
Product/Chemical
|
|
25,000
|
|
2
|
|
4Q15
|
|
Japan
|
|
MI
|
|
Eco-design
|
|
Total
|
|
21
|
|
823,804
|
|
|
|
|
|
|
|
|
|
|
On February 27, 2013 Ardmore took delivery of the
Ardmore Seavaliant
from SPP Shipbuilding Co., Ltd, in Korea. The
Ardmore Seavaliant
is an IMO 3 product and chemical tanker and was employed on a one year time charter.
On June 7, 2013 Ardmore took delivery of the
Ardmore Seaventure
from SPP Shipbuilding Co., Ltd, in Korea. The
Ardmore Seaventure
is an IMO 3 product and chemical tanker and was employed on a one year time charter.
On October 23, 2013 Ardmore agreed to acquire a 45,726 dwt MR product tanker built in October 2006 at Minami Nippon Shipbuilding Co., Ltd., Japan, to be renamed the
Ardmore Seamariner
.
2. Significant accounting policies
2.1. Basis of preparation
The accompanying consolidated financial statements have been prepared in accordance with U.S. Generally Accepted Accounting Principles ("U.S. GAAP"). The consolidated financial statements include the accounts of ASC and its subsidiaries. All subsidiaries are 100% directly or indirectly owned by ASC. All intercompany balances and transactions have been eliminated on consolidation.
2.2. Uses of estimates
The preparation of the consolidated financial statements in accordance with U.S. GAAP requires management to make estimates and assumptions that affect the amounts reported in the consolidated financial statements and accompanying notes. On an on-going basis, management evaluates the estimates and judgments, including those related to uncompleted voyages, future drydock dates, the selection of useful lives for tangible assets, expected future cash flows from long-lived assets to support impairment tests, provisions necessary for accounts receivables, the selection of inputs used in the valuation model for share based payment awards, provisions for legal disputes and contingencies. Management bases its estimates and judgments on historical experience and on various other factors that are believed to be reasonable. Actual results could differ from those estimates.
F-8
Ardmore Shipping Corporation
Notes to Consolidated Financial Statements
(Expressed in U.S. dollars, unless otherwise stated)
2.3. Reporting currency
The consolidated financial statements are stated in U.S. Dollars. The functional currency of Ardmore is U.S. Dollars because Ardmore operates in international shipping markets which typically utilize the U.S. Dollar as the functional currency. Transactions involving other currencies during the year are converted into U.S. Dollars using the exchange rates in effect at the time of the transactions. At the balance sheet date, monetary assets and liabilities that are denominated in currencies other than U.S. Dollar are translated to reflect the year end exchange rates. Resulting gains and losses are included in the accompanying consolidated statement of operations.
2.4. Recent accounting pronouncements
There are no recent accounting pronouncements issued whose adoption would have a material impact on Ardmore's consolidated financial statements in the current year or are expected to have a material impact on future years.
2.5. Cash and cash equivalents
Ardmore classifies investments with an original maturity date of three months or less as cash and cash equivalents.
2.6. Receivables, trade
Trade receivables include amounts due from charterers for hire and other recoverable expenses due to Ardmore. At the balance sheet date, all potentially uncollectible accounts are assessed individually for the purposes of determining the appropriate provision for doubtful accounts.
2.7. Working capital advances
Working capital advances relate to capital advanced directly to ship pools in which Ardmore's vessels operate together with working capital amounts advanced under time charter agreements. The working capital amounts advanced under time charter agreements allows Ardmore to share in the profits and losses arising from the vessels employment in the spot market. The working capital amounts advanced under the time charter are advanced for the period of the time charter. The amounts are classified as current assets where it is expected that the amounts advanced will be realized within one year.
2.8. Prepayments
Prepayments consist of payments in advance for insurance or other ad hoc purchases.
2.9. Advances and deposits
Advances and deposits primarily include amounts advanced to the technical managers for expenses incurred by them in operating the vessels, together with other necessary deposits paid during the course of business.
2.10. Other receivables
Other receivables primarily relate to insurance claims outstanding, certain assets held by vessel managers and other necessary receivables. Insurance claims are recorded, net of any deductible amounts, at the time Ardmore
realizes insured damages, where recovery is probable under the related insurance policies and where Ardmore can make an estimate of the amount to be reimbursed following the insurance claim. At the balance sheet date, all potentially uncollectible accounts are assessed individually for the purposes of determining the appropriate provision for doubtful accounts.
F-9
Ardmore Shipping Corporation
Notes to Consolidated Financial Statements
(Expressed in U.S. dollars, unless otherwise stated)
2.11. Inventories
Inventories consist of bunkers, lubricating oils and other consumables on board our vessels. Inventories are valued at the lower of cost or market value on a first-in first-out basis. Cost is based on the normal levels of cost and comprises the cost of purchase, being the suppliers' invoice price with the addition of charges such as freight or duty where appropriate.
2.12. Vessels
Vessels are recorded at their cost less accumulated depreciation. Vessel cost comprises acquisition costs directly attributable to the vessel and the expenditures made to prepare the vessel for its initial voyage. Vessels are depreciated on a straight-line basis over their estimated useful economic life from the date of initial delivery from the shipyard. The useful life of Ardmore's vessels is estimated at 25 years from the date of initial delivery from the shipyard. Depreciation is based on cost less estimated residual scrap value. Residual scrap value is estimated as the lightweight tonnage of each vessel multiplied by the estimated scrap value per ton. Ardmore capitalizes and depreciates the costs of significant replacements, renewals and upgrades to its vessels over the shorter of the vessel's remaining useful life or the life of the renewal or upgrade. The amount capitalized is based on management's judgment as to expenditures that extend a vessel's useful life or increase the operational efficiency of a vessel. Costs that are not capitalized are recorded as a component of direct vessel operating expenses during the period incurred. Expenses for routine maintenance and repairs are expensed as incurred.
2.13. Impairment
Vessels and equipment that are "held and used" are assessed for impairment when events or circumstances indicate the carrying amount of the asset may not be recoverable. When such indicators are present, a vessel to be held and used is tested for recoverability by comparing the estimate of future undiscounted net operating cash flows expected to be generated by the use of the vessel over its remaining useful life and its eventual disposition to its carrying amount. Net operating cash flows are determined by applying various assumptions regarding future revenues net of commissions, operating expenses, scheduled dry-dockings, expected offhire and scrap values, and taking into account historical revenue data and published forecasts on future world economic growth and inflation. An impairment charge is recognized if the carrying value is in excess of the estimated future undiscounted net operating cash flows. The impairment loss is measured based on the excess of the carrying amount over the fair market value of the asset.
2.14. Drydock expenditure
Vessels are typically drydocked every three to five years. Expenditures incurred in drydocking are deferred and amortized until the next scheduled drydocking. Ardmore only includes in deferred drydocking costs those direct costs that are incurred as part of the drydocking to meet regulatory requirements, expenditures that add economic life to the vessel, and expenditures that increase the vessels earnings capacity or improve the vessels operating efficiency.
F-10
Ardmore Shipping Corporation
Notes to Consolidated Financial Statements
(Expressed in U.S. dollars, unless otherwise stated)
2.15. Vessels under construction
The carrying value of the vessels under construction represents the accumulated costs to the balance sheet date which Ardmore has had to pay by way of purchase instalments and other capital expenditures, together with capitalized interest and other re-delivery costs. The amount of interest expense capitalized in an accounting period is determined by applying an interest rate ("the capitalization rate") to the average amount of accumulated expenditures for the asset during the period. The capitalization rates used in an accounting period are based on the rates applicable to borrowings outstanding during the period. If Ardmore's borrowings are directly attributable to the vessels under construction, Ardmore uses the rate on that borrowing as the capitalization rate. If average accumulated expenditures for the asset exceed the amounts of specific borrowings associated with the asset, the capitalization rate applied to such excess is a weighted average of the rates applicable to other borrowings of Ardmore. Ardmore does not capitalize amounts in excess of actual interest expense incurred in the period. No charge for depreciation is made until the vessel is available for use.
2.16. Other non-current assets
Other assets relate to office equipment, fixtures and fittings. These are recorded at their cost less accumulated depreciation and are depreciated based on estimated useful life of five years.
2.17. Deferred finance charges
Deferred financing charges include fees, commissions and legal expenses associated with securing loan facilities. These costs are amortized to interest expense and finance costs in the consolidated statement of operations using the effective interest method over the life of the related debt.
2.18. Payables, trade
Payables, trade include all accounts payable and accrued liabilities in relation to the operating and running of the vessels, along with amounts due for general and administrative expenses.
2.19. Capital leases
Capital leases relate to financing arrangements for vessels in operation. Interest costs are expensed to interest expense and finance costs in the consolidated statement of operations using the effective interest method over the life of the lease.
2.20. Contingencies
Claims, suits and complaints arise in the ordinary course of Ardmore's business. Ardmore provides for contingent liabilities when (i) it is probable that a liability has been incurred at the date of the financial statements and (ii) the amount of the loss can be reasonably estimated. Disclosure in the notes to the financial statements is required for contingent liabilities that do not meet both these conditions if there is a reasonable possibility that a liability may have been incurred at the balance sheet date. Any such matters that should be disclosed, or for which a provision should be established in the accompanying consolidated financial statements, are discussed in Note 19 to the consolidated financial statements.
2.21. Distributions to shareholder
Distributions to the shareholder are applied first to retained earnings. When retained earnings are not sufficient, distributions are applied to the additional paid in capital account.
F-11
Ardmore Shipping Corporation
Notes to Consolidated Financial Statements
(Expressed in U.S. dollars, unless otherwise stated)
2.22. Equity issuance costs
Incremental costs incurred that are directly attributable to a proposed or actual offering of equity securities are deferred and deducted from the related proceeds of the offering, and the net amount recorded as contributed shareholder's equity in the period when such shares are issued. Other costs incurred that are not directly attributable, but are related, to a proposed or actual offering are expensed as incurred.
2.23. Share based compensation
Ardmore may grant share based payment awards, such as restricted stock units, as incentive-based compensation to certain employees. The Company measures the cost of such awards using the grant date fair value of the award and recognizes that cost, net of estimated forfeitures, over the requisite service period, which generally equals the vesting period. If the award contains a market condition, such conditions are included in the determination of the fair value of the stock unit. Once, the fair value has been determined the associated expense is recognized in the statement of operations over the requisite service period. Refer to Note 18 to the consolidated financial statements for further information.
2.24. Financial instruments
The carrying values of cash and cash equivalents, accounts receivable and accounts payable reported in the consolidated balance sheet are reasonable estimates of their fair values due to their short-term nature. The fair values of long-term debt approximate the recorded values due to the variable interest rates payable.
2.25. Revenues and expenses
2.25.1. Time charter revenues
If a time charter agreement exists, the rate is fixed or determinable, service is provided and collection of the related revenue is reasonably assured, Ardmore recognizes revenues over the term of the time charter. Ardmore does not recognize revenue during days the vessel is offhire. Where the time charter contains a profit or loss sharing arrangement, the profit or loss is recognized based on amounts earned or incurred as of the reporting date.
2.25.2. Pool revenues
Revenues and voyage expenses of Ardmore's vessels operating in pool arrangements are pooled with the revenues and voyage expenses of other pool participants. The resulting net pool revenues, calculated on the time charter equivalent basis, are allocated to the pool participants according to an agreed formula. The formula used to allocate net pool revenues vary among different pools but generally allocates revenues to pool participants on the basis of the number of days a vessel operates in the pool with weighted adjustments made to reflect the vessel's differing capacities and performance capabilities. Ardmore accounts for its vessels share of net pool revenue on the allocated time charter equivalent on a monthly basis. Net pool revenues due from the pool are included in receivables, trade.
2.25.3. Voyage revenues
Revenues from voyage charters on the spot market are recognized ratably on a discharge to discharge basis, i.e. from when cargo is discharged (unloaded) at the end of one voyage to when it is discharged after the next voyage, provided an agreed non-cancelable charter between Ardmore and the charterer is in existence, the charter
F-12
Ardmore Shipping Corporation
Notes to Consolidated Financial Statements
(Expressed in U.S. dollars, unless otherwise stated)
rate is fixed or determinable and collectability is reasonably assured. Revenue under voyage charters will not be recognized until a charter has been agreed even if the vessel has discharged its previous cargo and is proceeding to an anticipated port of loading.
2.25.4. Expenses
All voyage expenses are expensed as incurred. Under time charters or pool employment, expenses such as fuel, port charges, canal tolls and cargo handling operations are paid by the charterers. Under voyage charters, these expenses are borne by Ardmore and expensed as incurred.
All commissions and administration fees are expensed as incurred which is over the term of the employment of the vessel.
Vessel operating expenses are costs which are directly attributable to the operation of the vessels such as crew costs, lubricating oils, insurance, repairs and maintenance. Vessel operating expenses are expensed as incurred.
2.25.5. Charter hire costs
Charter hire costs relate to amounts paid for chartering in vessels. Charter hire costs are expensed to the statement of operations as incurred.
2.26. Income taxes
Republic of Marshall Islands
Ardmore Shipping Corporation, Ardmore Shipping LLC and all vessel owning subsidiaries are incorporated in the Marshall Islands. Ardmore Shipping Corporation believes that neither it, nor its subsidiaries, are subject to taxation under the laws of the Republic of Marshall Islands and that distributions by its subsidiaries to Ardmore Shipping Corporation will not be subject to any taxes under the laws of the Republic of the Marshall Islands.
Ireland
Ardmore Shipholding Limited and Ardmore Shipping Limited are incorporated in Ireland. The consolidated financial statements reflect the fact that the Irish incorporated entities, along with all vessels operating subsidiaries, are separate taxable entities resident for tax purposes in Ireland. All income tax relates to continuing operations.
Ardmore Shipping Corporations vessel operating subsidiaries have elected, for Irish corporation tax purposes, into the Irish Tonnage Tax regime whereby each vessel operating subsidiary is assessed to Irish corporation tax on attributed notional tonnage tax profits which are calculated by reference to the size of the ship. The notional tonnage tax profits are then taxed at the standard rate of corporation tax of 12.5%. Ardmore Shipholding Limited and Ardmore Shipping Limited's non-tonnage tax trading profits are taxable at the standard rate of corporation tax which is currently 12.5% based on generally accepted accounting principles in Ireland. Other trading profits are taxed at 12.5%. Any non-trading / passive income is taxed at the higher rate of corporation tax which is currently 25%.
F-13
Ardmore Shipping Corporation
Notes to Consolidated Financial Statements
(Expressed in U.S. dollars, unless otherwise stated)
Deferred taxation
Deferred income tax assets and liabilities are recognized for the future tax consequences attributed to differences between the financial statements and tax basis of existing assets and liabilities using enacted rates applicable to the periods in which the differences are expected to affect taxable income. Deferred income tax balances included on the consolidated balance sheet reflect the effects of temporary differences between the carrying amounts of assets and liabilities and their tax basis and are stated at enacted tax rates expected to be in effect when taxes are actually paid or recovered. Deferred income tax assets represent amounts available to reduce income taxes payable on taxable income in future years. The recoverability of these future tax deductions is evaluated by assessing the adequacy of future taxable income, including the reversal of temporary differences and forecasted operating earnings. If it is deemed more likely than not that the deferred tax assets will not be realized Ardmore provides for a valuation allowance. Income taxes have been provided for all items included in the consolidated statement of operations regardless of when such items were reported for tax purposes or when the taxes were actually paid or refunded.
Uncertainties related to income taxes
The Financial Accounting Standards Board issued guidance clarifying the accounting for uncertainty in income taxes recognized in the financial statements. The guidance requires companies to determine whether it is more-likely-than-not that the tax position taken or expected to be taken in a tax return will be sustained upon examination, including resolution of any related appeals or litigation processes, based on the technical merits of the position. If a tax position meets the more-likely-than-not threshold it is measured to determine the amount of benefit to recognize in the financial statements. The Company recognizes interest and penalties related to uncertain tax positions in income tax expense.
3. Business and segmental reporting
Ardmore is primarily engaged in the ocean transportation of petroleum and chemical products in international trade through the ownership and operation of a fleet of tankers. Tankers are not bound to specific ports or schedules and therefore can respond to market opportunities by moving between trades and geographical areas. Ardmore charters its vessels to commercial shippers through a combination of time-charter and pool arrangements. The chief operating decision maker ("CODM") does not use discrete financial information to evaluate the operating results for each such type of charter. Although revenue can be identified for these types of charters, management cannot and does not identify expenses, profitability or other financial information for these charters. As a result, management, including the chief operating decision maker, reviews operating results solely by revenue per day and operating results of the fleet. Furthermore, when Ardmore charters a vessel to a charterer, the charterer is free to trade the vessel worldwide and, as a result, the disclosure of geographic information is impracticable. In this respect, Ardmore has determined that it operates under one reportable segment, relating to its operations of its vessels.
The following table presents consolidated revenues for customers that accounted for more than 10% of Ardmore's consolidated revenues during the periods presented:
|
|
|
For the year ended
|
|
|||||||||
|
|
|
Dec 31, 2013
|
|
|
Dec 31, 2012
|
|
|
Dec 31, 2011
|
|
|||
|
Navig8 Group
|
|
|
<10
|
%
|
|
|
16,336,503
|
|
|
|
17,183,539
|
|
|
Dampskibsselskabet Norden A/S
|
|
|
5,145,075
|
|
|
|
5,022,559
|
|
|
|
5,191,875
|
|
|
Cargill International SA,Geneva
|
|
|
8,119,657
|
|
|
|
<10
|
%
|
|
|
<10
|
%
|
|
Itochu Enex Co., Ltd
|
|
|
4,860,957
|
|
|
|
<10
|
%
|
|
|
<10
|
%
|
|
Koch Shipping, Inc.
|
|
|
4,360,159
|
|
|
|
<10
|
%
|
|
|
<10
|
%
|
|
Womar Logistic Pte., Ltd
|
|
|
10,299,096
|
|
|
|
<10
|
%
|
|
|
<10
|
%
|
F-14
Ardmore Shipping Corporation
Notes to Consolidated Financial Statements
(Expressed in U.S. dollars, unless otherwise stated)
4. Contractual charter revenue
The minimum future revenues to be received from time charters in place as of December 31, 2013 (before Ardmore's share of profit / loss under the time charter participation and assuming no offhire) which are accounted for as operating leases is as follows:
|
|
|
As at
|
|
|
|
|
|
Dec 31, 2013
|
|
|
|
2014
|
|
|
22,361,045
|
|
|
2015
|
|
|
1,032,857
|
|
As of December 31, 2013, seven of Ardmore's vessels are part of time charter agreements. The leases expire as follows:
|
|
|
|
|
Name
|
Lease expiry
|
Lease option
|
|
Ardmore Seavaliant
|
Feb, 2014
|
No
|
|
Ardmore Seaventure
|
Jun, 2014
|
No
|
|
Ardmore Seatrader
|
Aug, 2014
|
Yes
|
|
Ardmore Seamaster
|
Jul, 2014
|
Yes
|
|
Ardmore Seafarer
|
Jul, 2014
|
Yes
|
|
Ardmore Seavantage
|
Jan, 2015
|
Yes
|
|
Ardmore Seavanguard
|
Feb, 2015
|
Yes
|
The charterers of the
Ardmore Seavantage
and the
Ardmore Seavanguard
have an option to extend the time charter agreement at a market based rate for a second and third year which is to be determined prior to the commencement of the option.
The
Ardmore Calypso
and
Ardmore Capella
are employed under a pool arrangement which does not have a fixed lease expiration period.
From August, 2013 the
Ardmore Centurion
was employed under a third party spot chartering arrangement. Prior to this the
Ardmore Centurion
was employed on a time charter which included a profit sharing arrangement whereby, Ardmore was entitled to 50% of the profits arising on vessels employment in the charterer's pool after payment of charter hire to Ardmore. All profits arising from the profit sharing arrangement were recognized based on amounts earned as of the reporting date. Profit share revenue in relation to this arrangement for the year ended December 31, 2013 amounted to $222,648 (2012: $207,788 and 2011: $50,097).
Ardmore had two separate supplemental charter hire agreements, in respect of the
Ardmore Seafarer
and the
Ardmore Seatrader
, which entitled Ardmore to participate in the profits arising from, or losses incurred on, each vessels employment in the charterer's pool. These agreements are for the period of each time charter. One of the time charters expired in July 2012 and the other time charter expired in February 2013. The supplemental charter hire agreements entitled Ardmore to 60% of the profits arising from, or losses incurred on, each vessels employment in the charterer's pool, after payment of charter hire to Ardmore. All profits or losses under the supplemental charter hire agreement are recognized based on amounts earned or incurred as of the reporting date. For the year ended December 31, 2013 Ardmore incurred losses of $71,615 (2012: loss of $441,713 and 2011: loss of $98,235) in relation to these agreements.
On May 12, 2011 and July 17, 2011 Ardmore took delivery of the
Hellespont Crusader
and
Hellespont Commander
respectively under a time charter-in arrangement. These vessels were re-delivered to the owner on May 29, 2012 and June 23, 2012 respectively. These vessels were employed under a pool arrangement.
F-15
Ardmore Shipping Corporation
Notes to Consolidated Financial Statements
(Expressed in U.S. dollars, unless otherwise stated)
Supplementary to the pool employment agreement for the vessels, Ardmore entered into a profit or loss sharing agreement with an affiliate of the pool manager (the "Pool Manager Affiliate"), whereby the profit or loss arising from the pool employment income less the charter-in cost, of the vessels, was shared 75% / 25% between Ardmore and the Pool Manager Affiliate respectively. Ardmore's policy is to recognize only its share of revenue and expenses.
5. Cash and cash equivalents
| As at | ||||||||
|
|
|
Dec 31, 2013
|
|
|
Dec 31, 2012
|
|
||
|
Cash and cash equivalents
|
|
|
56,860,845
|
|
|
|
15,334,123
|
|
Ardmore is required to maintain a minimum cash balance in accordance with its long-term debt facility agreement (see Note 9).
6. Receivables, trade
There was no provision for doubtful accounts as at December 31, 2013 (2012: $0). The maximum amount of loss due to the credit risk is the full amount of trade receivables. All trade receivables are current. The carrying value of receivables approximates their fair value.
7. Working capital advances
At the balance sheet date, all potentially uncollectible working capital advances are assessed individually for purposes of determining the appropriate provision for doubtful accounts. There was no provision for doubtful advances at December 31, 2013 (2012: $0).
8. Non-current assets
The scrap value of the vessels is estimated at $300 (2012: $300) per lightweight ton. Interest capitalized in relation to vessels under construction as of December 31, 2013 amounts to $2,372,199 (2012: $1,081,182). Vessels, which are owned and operated by Ardmore, have been provided as collateral under certain loan agreements entered into by Ardmore (see Note 9). As at December 31, 2013 an amount of $4,234,701 (2012: $0) was included in vessels and equipment which related to initial payments for the acquisition of a second-hand vessel that had not delivered at the balance sheet date. Other non-current assets comprise office equipment, fixtures and fittings. No impairment has been recognized as at the balance sheet date.
9. Debt
Short-term revolving credit facility
On July 15, 2010, Ardmore Shipholding Limited, entered into a short term revolving credit facility agreement for $30 million. On September 6, 2011, the loan agreement was amended to increase the amount available under the facility to $50 million. Interest was calculated on each tranche from July 2010 to April 2013 at LIBOR plus 5%. Interest from May 2013 to August 2013 was calculated on each tranche at LIBOR plus 4%. In August 2013 the facility was fully repaid and the facility cancelled. Amounts drawn down in prior periods were used to finance Ardmore's capital commitments and for temporary working capital needs.
F-16
Ardmore Shipping Corporation
Notes to Consolidated Financial Statements
(Expressed in U.S. dollars, unless otherwise stated)
As at December 31, 2013 Ardmore had three loan facilities. ASC's subsidiaries have first priority mortgages against the relevant vessels in favor of the financier as security for its obligations under the loan agreements. ASC's subsidiary, Ardmore Shipholding Limited, has provided a guarantee in respect of the three loan facilities. These guarantees can be called upon where a default in loan repayment occurs. The balance on each facility at the balance sheet date is as follows:
|
|
|
As at
|
|
|
|
|
|
Dec 31, 2013
|
|
|
|
Facility I (ABN AMRO)
|
|
|
9,000,000
|
|
|
Facility II (ABN AMRO)
|
|
|
46,830,000
|
|
|
Facility III (DVB Bank)
|
|
|
33,030,000
|
|
|
|
|
|
88,860,000
|
|
|
Current portion of long-term debt
|
|
|
9,100,000
|
|
|
Non-current portion of long-term debt
|
|
|
79,760,000
|
|
|
|
|
|
|
|
Future minimum repayments under ASC's loan facilities for each year ended are as follows:
|
|
|
As at
|
|
|
|
|
|
Dec 31, 2013
|
|
|
|
2014
|
|
|
9,100,000
|
|
|
2015
|
|
|
9,100,000
|
|
|
2016
|
|
|
9,100,000
|
|
|
2017
|
|
|
9,100,000
|
|
|
2018
|
|
|
38,530,000
|
|
|
2019
|
|
|
13,930,000
|
|
|
|
|
|
88,860,000
|
|
|
|
|
|
|
|
Facility I
On March 16, 2011, three of ASC's subsidiaries entered into a long term loan facility agreement with ABN AMRO Bank for $40.5 million for vessel acquisitions. This loan was drawn down in three tranches. The first tranche was drawn down in April, 2011 and the second and third tranches were drawn down in June 2011. $32 million was drawn down on this facility and the remaining $8.5 million is no longer available for borrowing. Interest is calculated on each tranche at LIBOR plus 3.25%. On March 28, 2013 two of the subsidiaries subject to this loan entered into a capital lease arrangement (see Note 10). As part of this arrangement the senior debt outstanding on the vessels was repaid in full on April 2, 2013. The amount repaid was $17.9 million. As such, of this facility, one subsidiary remains with debt outstanding. Principal repayments on loans are made on a quarterly basis. There was an amendment to this loan facility on September 30, 2013 whereby the maturity date was extended from 2016 to 2018. This resulted in a modification of the loan agreement (See note 13). The amount outstanding at the balance sheet date in relation to this facility is $9.0 million.
Facility II
On August 24, 2011, two of ASC's subsidiaries entered into a long term loan facility agreement with ABN AMRO Bank for $48.9 million for two of its vessels under construction. This loan was drawn down in six
tranches. Interest is calculated on each tranche at LIBOR plus 3.20%. Principal repayments on loans are made on a quarterly basis, with a balloon payment paid with the final instalment. The loan fully matures in 2018. The total amount of this facility was drawn down and the balance at the balance sheet date is $46.8 million.
F-17
Ardmore Shipping Corporation
Notes to Consolidated Financial Statements
(Expressed in U.S. dollars, unless otherwise stated)
Facility III
On September 28, 2012, five of ASC's subsidiaries entered into a long term loan facility agreement with DVB Bank for $81.85 million. $36.85 million of this has been drawn down at the balance sheet date and matures in 2019. Interest on this tranche is calculated at LIBOR plus 3.75%. The remaining $45 million of the new facility is for Ardmore's vessels under construction and will be drawn down in conjunction with the delivery of these vessels. Principal repayments on loans are made on a quarterly basis, with a balloon payment paid with the final instalment. The amount outstanding at the balance sheet date in relation to this facility is $33.0 million. This loan agreement replaced an existing loan agreement dated October 15, 2010 which resulted in a modification of the loan agreement (See note 13).
Long-term debt financial covenants
Agreements related to long-term debt obligations stated above include covenants which limit the amount of total long-term debt as a proportion of total market value of assets and provide for a minimum net worth for Ardmore. Ardmore is required to maintain a minimum cash balance based on the number of vessels Ardmore owns. The required minimum cash balance for Ardmore as at December 31, 2013 was $4,800,000 (2012: $3,600,000). Ardmore is also required to maintain sufficient collateral for its debt facilities whereby the fair market value of its vessels, plus any additional collateral, must be above a certain percentage of debt outstanding (value maintenance covenant). The required value maintenance covenant varies under each loan facility ranging from 125% to 135%. The value maintenance covenant for one of Ardmore's vessels increases from 135% to 150% when the vessel is over twelve years old. Ardmore is also required to have a net worth of not less than $45 million. The long-term debt obligations do not impose a restriction on dividend, distribution, return of capital unless an event of default has occurred, is continuing or will result from such payment. Ardmore is fully compliant with all of its loan covenants at the balance sheet date.
10. Capital leases
On March 28, 2013 two of ASC's subsidiaries entered into an agreement for the sale and leaseback (under a capital lease arrangement) of the
Ardmore Calypso
and
Ardmore Capella
. The capital lease arrangement was executed on April 2, 2013. This transaction is treated as a financing transaction. As part of this arrangement the senior debt outstanding on the vessels was repaid in full on April 2, 2013. The amount repaid was $17.9 million. The capital lease is scheduled to expire in 2018 and includes a mandatory purchase obligation to repurchase the vessels. ASC's subsidiary, Ardmore Shipholding Limited, has provided a guarantee in respect of this financing arrangement.
|
|
|
As at
|
|
|
|
|
|
Dec 31, 2013
|
|
|
|
Current portion of capital lease obligations
|
|
|
1,578,686
|
|
|
Non-current portion of capital lease obligations
|
|
|
28,800,329
|
|
|
Total capital lease obligations
|
|
|
30,379,015
|
|
|
|
|
|
|
|
F-18
Ardmore Shipping Corporation
Notes to Consolidated Financial Statements
(Expressed in U.S. dollars, unless otherwise stated)
The future minimum lease payments required under the capital leases at December 31, 2013, are as follows:
|
|
|
As at
|
|
|
|
|
|
Dec 31, 2013
|
|
|
|
2014
|
|
|
3,834,690
|
|
|
2015
|
|
|
3,834,690
|
|
|
2016
|
|
|
3,845,196
|
|
|
2017
|
|
|
3,834,690
|
|
|
2018
|
|
|
23,705,540
|
|
|
Total minimum lease payments
|
|
|
39,054,806
|
|
|
Less amount representing interest
|
|
|
(8,675,791
|
)
|
|
Net minimum lease payments
|
|
|
30,379,015
|
|
|
|
|
|
|
|
Assets recorded under capital leases and included in vessels and vessel equipment, net consist of the following at December 31, 2013:
|
|
|
As at
|
|
|
|
|
|
Dec 31, 2013
|
|
|
|
Vessels and equipment
|
|
|
41,326,198
|
|
|
Accumulated depreciation
|
|
|
(4,009,872
|
)
|
|
|
|
|
37,316,326
|
|
|
|
|
|
|
|
11. Risk Management
11.1. Operational risk
Ardmore is exposed to operating costs risk arising from various vessel operations. The key areas of operating risk include drydock, repair costs, insurance and piracy. Ardmore's risk management includes various strategies for technical management of drydock and repairs coordinated with a focus on measuring cost and quality. Ardmore's young fleet helps to minimize the risk. Given the potential for accidents and other incidents that may occur in vessel operations, the fleet is insured against various types of risk. Finally, Ardmore has established a set of countermeasures in order to minimize the risk of piracy attacks during voyages, particularly through the Gulf of Aden and off the coast of Africa, to make the navigation safer for sea staff and to protect Ardmore's assets.
11.2. Foreign exchange risk
The majority of Ardmore's transactions, assets and liabilities are denominated in U.S. Dollars, the functional currency of Ardmore. Ardmore incurs certain general and operating expenses in other currencies (primarily Euro, Singapore Dollar, Pounds Sterling, Hong Kong Dollar) and as a result there is a transactional risk to Ardmore where the risk that currency fluctuations will have a negative effect on the value of Ardmore's cash flows. Such risk may have an adverse effect on Ardmore's financial condition and results of operations. Ardmore believes these adverse effects to be immaterial and have not entered into any derivative contracts for either transaction or translation risk during the year.
11.3. Interest rate risk
Ardmore is exposed to the impact of interest rate changes primarily through borrowings that require Ardmore to make interest payments based on LIBOR. Significant increases in interest rates could adversely affect Ardmore's
F-19
Ardmore Shipping Corporation
Notes to Consolidated Financial Statements
(Expressed in U.S. dollars, unless otherwise stated)
margins, results of operations and its ability to repay debt. Lower interest rates lower the returns on cash investments. Ardmore regularly monitors its interest rate exposure and will enter into swap arrangements to hedge its exposure where it is considered economically advantageous to do so.
11.4. Credit risk
There is a concentration of credit risk with respect to cash and cash equivalents to the extent that substantially all of the amounts are held across two banks—Nordea Bank and Morgan Stanley & Co. LLC. While Ardmore believes this risk of loss is low, it will keep this under review and will revise its policy for managing cash and cash equivalents if considered advantageous and prudent to do so.
Ardmore limits its credit risk with trade accounts receivable by performing ongoing credit evaluations of its customers' financial condition. It generally does not require collateral for its trade accounts receivable.
Ardmore may have a credit risk in relation to vessel employment and at times may have multiple vessels employed by one charterer. Ardmore considers and evaluates concentration of credit risk regularly and performs on-going evaluations of these charterers for credit risk. As at December 31, 2013 Ardmore's eight vessels in operation were employed with five different charterers and the Company continuously monitors credit concentration risk.
11.5. Liquidity risk
The principal objective in relation to liquidity is to ensure that Ardmore has access at minimum cost, to sufficient liquidity to enable it to meet its obligations as they fall due and to provide adequately for contingencies. Ardmore's policy is to manage its liquidity by strict forecasting of cash flows arising from time charter revenue, pool revenue, vessel operating expenses, general and administrative overhead and servicing of debt.
12. General and administration expenses
|
|
|
For the year ended
|
|
|||||||||
|
|
|
Dec 31, 2013
|
|
|
Dec 31, 2012
|
|
|
Dec 31, 2011
|
|
|||
|
Staff salaries
|
|
|
2,020,970
|
|
|
|
1,493,475
|
|
|
|
1,360,582
|
|
|
Share based compensation (non-cash)
|
|
|
571,321
|
|
|
|
11,250
|
|
|
|
16,674
|
|
|
Office administration
|
|
|
590,518
|
|
|
|
245,477
|
|
|
|
466,550
|
|
|
Bank charges and foreign exchange
|
|
|
61,295
|
|
|
|
48,942
|
|
|
|
45,326
|
|
|
Auditors' remuneration
|
|
|
870,394
|
|
|
|
109,517
|
|
|
|
96,720
|
|
|
Other professional fees
|
|
|
589,720
|
|
|
|
535,857
|
|
|
|
181,948
|
|
|
Other administration costs
|
|
|
965,717
|
|
|
|
530,621
|
|
|
|
431,231
|
|
|
|
|
|
5,669,935
|
|
|
|
2,975,139
|
|
|
|
2,599,031
|
|
|
|
|
|
|
|
|
|
|
|
|
|
|
|
Of the above $721,375 related to costs in relation to ASCs initial public offering that were expensed as incurred. Audit remuneration for the year arises solely on fees incurred for independent audit services.
F-20
Ardmore Shipping Corporation
Notes to Consolidated Financial Statements
(Expressed in U.S. dollars, unless otherwise stated)
13. Interest expense and finance costs
|
|
|
For the year ended
|
|
|||||||||
|
|
|
Dec 31, 2013
|
|
|
Dec 31, 2012
|
|
|
Dec 31, 2011
|
|
|||
|
Interest incurred
|
|
|
5,063,418
|
|
|
|
3,248,789
|
|
|
|
3,333,941
|
|
|
Capitalized interest
|
|
|
(2,372,199
|
)
|
|
|
(537,322
|
)
|
|
|
(543,860
|
)
|
|
Amortization of deferred financing charges
|
|
|
772,787
|
|
|
|
254,547
|
|
|
|
290,391
|
|
|
|
|
|
3,464,006
|
|
|
|
2,966,014
|
|
|
|
3,080,472
|
|
|
|
|
|
|
|
|
|
|
|
|
|
|
|
Following drawdown of the loan entered into on September 28, 2012, the outstanding balance of $32.4 million in respect of an earlier loan facility dated October 15, 2010 was repaid in full. As this resulted in a modification of the debt facility dated October 15, 2010, the deferred finance charges associated with the original facility, along with newly incurred fees with Ardmore's creditor, were deferred and amortized to interest expense and finance costs using the effective interest method over the life of the new loan facility. Third party costs associated with the modification were expensed as incurred. Further to this there was an amendment to a loan facility on September 30, 2013 whereby the loan maturity was extended from 2016 to 2018. As this resulted in a modification of the debt facility dated March 16, 2011 the deferred finance charges associated with the original facility, along with newly incurred fees with Ardmore's creditor, are deferred and amortized to interest and finance costs using the effective interest method over the new life of the loan facility. Third party costs associated with the modification were expensed as incurred.
14. Interest income
Interest income relates to bank interest received on Ardmore's cash balances.
15. Income taxes
Loss before taxes was derived from the following sources:
|
|
|
For the year ended
|
|
|||||||||
|
|
|
Dec 31, 2013
|
|
|
Dec 31, 2012
|
|
|
Dec 31, 2011
|
|
|||
|
Domestic
|
|
|
(3,808,877
|
)
|
|
|
(4,487,856
|
)
|
|
|
(2,961,844
|
)
|
|
Foreign
|
|
|
—
|
|
|
|
—
|
|
|
|
—
|
|
|
|
|
|
(3,808,877
|
)
|
|
|
(4,487,856
|
)
|
|
|
(2,961,844
|
)
|
|
|
|
|
|
|
|
|
|
|
|
|
|
|
The components of the provision for income taxes are as follows:
|
|
|
For the year ended
|
|
|||||||||
|
|
|
Dec 31, 2013
|
|
|
Dec 31, 2012
|
|
|
Dec 31, 2011
|
|
|||
|
Domestic:
|
|
|
|
|
|
|
|
|
|
|
|
|
|
Current tax expense
|
|
|
(33,726
|
)
|
|
|
(26,896
|
)
|
|
|
(29,525
|
)
|
|
Deferred tax (expense) / benefit
|
|
|
—
|
|
|
|
(24,341
|
)
|
|
|
16,099
|
|
|
Income tax expense for year
|
|
|
(33,726
|
)
|
|
|
(51,237
|
)
|
|
|
(13,426
|
)
|
|
|
|
|
|
|
|
|
|
|
|
|
|
|
F-21
Ardmore Shipping Corporation
Notes to Consolidated Financial Statements
(Expressed in U.S. dollars, unless otherwise stated)
The deferred tax (expense) / benefit was calculated as follows:
|
|
|
For the year ended
|
|
|||||||||
|
|
|
Dec 31, 2013
|
|
|
Dec 31, 2012
|
|
|
Dec 31, 2011
|
|
|||
|
Non tonnage tax trade—net loss
|
|
|
—
|
|
|
|
—
|
|
|
|
126,873
|
|
|
Tax at 12.5%
|
|
|
—
|
|
|
|
—
|
|
|
|
15,859
|
|
|
Other
|
|
|
—
|
|
|
|
—
|
|
|
|
240
|
|
|
Change in valuation allowance
|
|
|
—
|
|
|
|
(24,341
|
)
|
|
|
—
|
|
|
Deferred tax (expense) / benefit
|
|
|
—
|
|
|
|
(24,341
|
)
|
|
|
16,099
|
|
|
|
|
|
|
|
|
|
|
|
|
|
|
|
All domestic tax arises under the Irish tax jurisdiction. There is no direct relationship between the provision for income taxes and income or loss before income taxes for companies availing of the tonnage tax election in Ireland because Ireland operates a tonnage taxation regime which computes Irish corporation tax by reference to the weight of the ships rather than accounting profits. Accordingly, a reconciliation between the income tax expense and the income tax calculated based on net income at the Irish statutory rate, has not been presented herein as it would not provide additional useful information to users of the consolidated financial statements. All current elections are valid until a minimum of December 31, 2023. All tax years are open to audit by tax authorities.
Reconciliation of deferred tax asset:
|
|
|
For the year ended
|
|
|||||||||
|
|
|
Dec 31, 2013
|
|
|
Dec 31, 2012
|
|
|
Dec 31, 2011
|
|
|||
|
Cumulative non tonnage tax trade—net loss
|
|
|
—
|
|
|
|
189,531
|
|
|
|
189,531
|
|
|
Deferred tax at 12.5%
|
|
|
—
|
|
|
|
23,691
|
|
|
|
23,691
|
|
|
Other
|
|
|
—
|
|
|
|
650
|
|
|
|
650
|
|
|
Total deferred tax assets
|
|
|
—
|
|
|
|
24,341
|
|
|
|
24,341
|
|
|
Valuation allowance
|
|
|
—
|
|
|
|
(24,341
|
)
|
|
|
—
|
|
|
Net deferred tax asset
|
|
|
—
|
|
|
|
—
|
|
|
|
24,341
|
|
|
|
|
|
|
|
|
|
|
|
|
|
|
|
In the year ended December 31, 2012 Ardmore established a valuation allowance against deferred tax assets because Ardmore believed it was more likely than not that the full amount of the deferred tax assets generated primarily by non-tonnage trading losses would not be realized through the generation of taxable income in future periods.
16. Loss per share
Basic loss per share is calculated by dividing the net loss available to common shareholders by the average number of common shares of Ardmore outstanding during the periods. Diluted earnings per share is calculated by adjusting the net loss available to common shareholders and the weighted average number of common shares used for calculating basic earnings per share for the effects of all potentially dilutive shares. Such dilutive common shares are excluded when the effect would be to increase earnings per share or reduce a loss per share.
|
|
|
For the year ended
|
|
|||||||||
|
Numerator:
|
|
|
Dec 31, 2013
|
|
|
|
Dec 31, 2012
|
|
|
|
Dec 31, 2011
|
|
|
Net loss available to common shareholders
|
|
|
(3,842,603
|
)
|
|
|
(4,539,093
|
)
|
|
|
(2,975,270
|
)
|
|
Denominator:
|
|
|
|
|
|
|
|
|
|
|
|
|
|
Weighted average number of shares
|
|
|
12,241,599
|
|
|
|
8,049,500
|
|
|
|
8,049,500
|
|
|
|
|
|
|
|
|
|
|
|
|
|
|
|
|
Loss per share, basic and diluted
|
|
|
(0.31
|
)
|
|
|
(0.56
|
)
|
|
|
(0.37
|
)
|
F-22
Ardmore Shipping Corporation
Notes to Consolidated Financial Statements
(Expressed in U.S. dollars, unless otherwise stated)
17. Related-Party Transactions
In 2013, during the period prior to our IPO, Ardmore paid $175,000 (2012: $350,000; 2011:$175,000) to Greenbriar Equity Group LLC in respect of consulting services provided to Ardmore. Greenbriar Equity Group LLC manages funds with an investment in GA Holdings LLC, a significant shareholder in Ardmore Shipping Corporation. This amount is included in general and administrative expenses (Note 12).
An amount of $600,000 at December 31, 2012, which related to a cash advance from GA Holdings LLC, was repaid prior to our IPO.
There were no other relationships with officers, employees or affiliated companies that require disclosure during the year.
18. Share based compensation
Stock appreciation rights ("SARs")
SAR's were granted to certain employees and officers in August 2013. The SARs vest on a graded time-based schedule (20% on each anniversary of the grant date). Vesting in the first three years is subject to certain market conditions being met. On the third anniversary of the award the vesting reverts to being solely dependent on service. The exercise price is $14 per share, Ardmore's IPO price.
The total number of units awarded was 1,078,125 with a contractual term of 7 years. The grant date fair value was calculated by applying a model based on Monte Carlo simulation. The model inputs were the grant price, based on the IPO price, a dividend yield of 2.87% based on the initial intended dividend set out at the IPO date, a risk free rate of return equal to the zero coupon US Treasury bill commensurate with the contractual terms of the units of 2.15% and expected volatility of 54.89%, based on the average of most recent historical volatilities in an Ardmore peer group. The weighted average fair value of the units is $4.28 per unit and the average expected exercise life ranges from 4.9 to 6 years. Ardmore has determined that none of the units will be forfeited prior to the requisite services being provided.
The cost of each tranche is being recognized by Ardmore, on a straight line basis. The recognition of share based compensation costs related to the 20% tranches that vest in one and two years will be accelerated if the market condition is met and the requisite service period has been completed. The total cost charged to the consolidated statement of operations for the year ended December 31, 2013, was $560,071 and is included in general and administrative expenses. The remaining unrecognized share-based compensation cost at December 31, 2013 is $4,056,460. It is expected that unrecognized compensation cost related to each tranche will be recognized over the respective service period through the fifth anniversary of the grant (i.e., August 1, 2018). Ardmore's policy for issuing shares, if exercised, is to register and issue new common shares to the beneficiary.
Management Incentive Units
During the period ended December 31, 2010 the parent of ASCs Predecessor Company, ASLLC, implemented a Management Incentive Unit award scheme whereby certain employees are awarded units in ASLLC's parent. The date of grant of the units was July 5, 2010. The units vest on that date but are subject to forfeiture whereby the units are returned by the recipient if certain time (five years' service) and performance criteria are not met. If all of the performance criteria are met, the units will no longer be subject to forfeiture on the fifth anniversary of the date of grant.
F-23
Ardmore Shipping Corporation
Notes to Consolidated Financial Statements
(Expressed in U.S. dollars, unless otherwise stated)
The total number of units awarded in the parent, in respect of services to be performed to Ardmore, was 6,250. The estimated fair value of each Management Incentive Unit granted in Management Incentive Unit award scheme is $9 per unit. The intrinsic value of Management Incentive Units at the date of grant is nil. The fair value was calculated by applying a model based on Monte Carlo simulation whereby a range of probable outcomes of return were identified based on the performance criteria attached to the units. The model inputs were the market value of the ordinary units at grant date, expected returns over a five year period, with a cost of equity of 25%. The market value of the ordinary units was par at the date of the investment. Discounts were applied to the units, in arriving at fair value, for a lack of voting rights, control and marketability. The probability of various returns was based on analysis of the historical performance of charter rates and ship values, taking account of volatility, over a ten year period.
Ardmore's units have been valued using level three inputs of the fair value hierarchy. The cost of the unit award is recognized by Ardmore, on a straight line basis, as the services are received. The total cost charged to the consolidated statement of operations of Ardmore, for the year ended December 31, 2013 was $11,250 (2012: $11,250 and 2011: $16,674) and the cost is included as part of staff salaries. The remaining unrecognized share-based compensation cost at December 31, 2013 is $17,076.
19. Commitments and contingencies
As at December 31, 2013 Ardmore has the following commitments due within the next five years:
|
|
|
2014
|
|
|
2015
|
|
|
2016
|
|
|||
|
Vessels under construction
|
|
|
120,592,620
|
|
|
|
192,069,410
|
|
|
|
—
|
|
|
Vessels (acquired) deliveries
|
|
|
16,480,000
|
|
|
|
—
|
|
|
|
—
|
|
|
Loan commitment fees
|
|
|
34,313
|
|
|
|
—
|
|
|
|
—
|
|
|
Office space
|
|
|
101,607
|
|
|
|
101,607
|
|
|
|
42,336
|
|
|
|
|
|
137,208,540
|
|
|
|
192,171,017
|
|
|
|
42,336
|
|
|
|
|
|
|
|
|
|
|
|
|
|
|
|
Loan commitment fees are based on management's best estimates of future drawdown dates as of December 31, 2013.
20. Subsequent events
On January 7, 2014 Ardmore took delivery of a 45,726 Dwt MR product tanker built in October 2006 at Minami Nippon Shipbuilding Co., Ltd., Japan, and renamed the vessel the
Ardmore Seamariner
. The vessel was converted to "Eco-Mod" on delivery and was employed on a three month time charter.
On January 15, 2014 Ardmore announced that its Board of Directors has declared a cash dividend of $0.10 per share for the quarter ended December 31, 2013. The cash dividend will be paid on February 14, 2014 to all shareholders of record on January 31, 2014.
On January 17, 2014 Ardmore took delivery of the
Ardmore Seavantage
(SPP Hull S-5118) from SPP shipbuilding Co., Ltd in Korea. The
Ardmore Seavantage
is an IMO 3 product and chemical tanker and was employed on a one year time charter following delivery. Total debt drawn down under the DVB Bank loan facility was $22.5 million, in respect of this vessel.
On January 23, 2014 Ardmore agreed terms for a senior debt facility with ABN AMRO Bank N.V., Nordea Bank Finland Plc and Skandinaviska Enskilda Banken AB ("SEB"). This facility is in the amount of $172 million and is expected to be used to finance eight vessels under construction. Drawdowns will be made in line with deliveries of each vessel. Interest is payable on each tranche at LIBOR plus 3.15%.
F-24
Ardmore Shipping Corporation
Notes to Consolidated Financial Statements
(Expressed in U.S. dollars, unless otherwise stated)
On February 11, 2014 Ardmore drew down the remaining $22.5 million of our DVB debt facility in order to finance the delivery of the
Ardmore Seavanguard
(Hull S-5119) from SPP, which is expected to deliver on February 14, 2014.
21. Subsidiaries
The following is a list of ASC's direct and indirect subsidiaries:
|
|
|
|
|
|||
|
Name of Company
|
Country of Incorporation
|
Principal Activities
|
Ownership
(%)
|
|||
|
Ardmore Shipping LLC
|
Marshall Islands
|
Holding company
|
100 | % | ||
|
Ardmore Shipholding Limited
|
Ireland
|
Holding company
|
100 | % | ||
|
Ardmore Shipping Limited
|
Ireland
|
Commercial management, transaction support
|
100 | % | ||
|
Fastnet Shipco LLC
|
Marshall Islands
|
Ship ownership and operations
|
100 | % | ||
|
Rockall Shipco LLC
|
Marshall Islands
|
Ship ownership and operations
|
100 | % | ||
|
Shannon Shipco LLC
|
Marshall Islands
|
Ship ownership and operations
|
100 | % | ||
|
Malin Shipco LLC
|
Marshall Islands
|
Ship ownership and operations
|
100 | % | ||
|
Tyne Shipco LLC
|
Marshall Islands
|
Ship ownership and operations
|
100 | % | ||
|
Forties Shipco LLC
|
Marshall Islands
|
Ship ownership and operations
|
100 | % | ||
|
Fitzroy Shipco LLC
|
Marshall Islands
|
Ship ownership and operations
|
100 | % | ||
|
Bailey Shipco LLC
|
Marshall Islands
|
Ship ownership and operations
|
100 | % | ||
|
Forth Shipco LLC
|
Marshall Islands
|
Ship ownership and operations
|
100 | % | ||
|
Viking Shipco LLC
|
Marshall Islands
|
Ship ownership and operations
|
100 | % | ||
|
Ardmore Chartering LLC
|
Marshall Islands
|
Ship chartering and operations
|
100 | % | ||
|
Cromarty Shipco LLC
|
Marshall Islands
|
Ship ownership and operations
|
100 | % | ||
|
Dogger Shipco LLC
|
Marshall Islands
|
Ship ownership and operations
|
100 | % | ||
|
Fisher Shipco LLC
|
Marshall Islands
|
Ship ownership and operations
|
100 | % | ||
|
Humber Shipco LLC
|
Marshall Islands
|
Ship ownership and operations
|
100 | % | ||
|
Wight Shipco LLC
|
Marshall Islands
|
Ship ownership and operations
|
100 | % | ||
|
Lundy Shipco LLC
|
Marshall Islands
|
Ship ownership and operations
|
100 | % | ||
|
Thames Shipco LLC
|
Marshall Islands
|
Ship ownership and operations
|
100 | % | ||
|
Valentia Shipholding LLC
|
Marshall Islands
|
Ship ownership and operations
|
100 | % | ||
|
Fair Isle Shipco LLC
|
Marshall Islands
|
Ship ownership and operations
|
100 | % | ||
|
Faroe Shipco LLC
|
Marshall Islands
|
Ship ownership and operations
|
100 | % | ||
|
Plymouth Shipco LLC
|
Marshall Islands
|
Ship ownership and operations
|
100 | % | ||
|
Portland Shipco LLC
|
Marshall Islands
|
Ship ownership and operations
|
100 | % | ||
|
Trafalgar Shipco LLC
|
Marshall Islands
|
Ship ownership and operations
|
100 | % | ||
|
Hebrides Shipco LLC
|
Marshall Islands
|
Ship ownership and operations
|
100 | % | ||
|
Sole Shipco LLC
|
Marshall Islands
|
Ship ownership and operations
|
100 | % | ||
|
Biscay Shipco LLC
|
Marshall Islands
|
Ship ownership and operations
|
100 | % | ||
|
Dover Shipco LLC
|
Marshall Islands
|
Ship ownership and operations
|
100 | % | ||
F-25
TABLE OF CONTENTS
Part IItem 1. Identity Of Directors, Senior Management and AdvisorsItem 2. Offer Statistics and Expected TimetableItem 3. Key InformationItem 4. Information on The CompanyItem 4. A Unresolved Staff CommentsItem 5 Operating and Financial Review and ProspectsItem 6. Directors, Senior Management and EmployeesItem 7. Major Shareholders and Related Party TransactionsItem 8. Financial InformationItem 9. The Offer and ListingItem 10. Additional InformationItem 11. Quantitative and Qualitative Disclosures About Market RisksItem 12. Description Of Securities Other Than Equity Securities Not ApplicableItem 12. Description Of Securities Other Than Equity SecuritiesPart IIItem 13. Defaults, Dividend Arrearages and DelinquenciesItem 14. Material Modifications To The Rights Of Shareholders and Use Of Proceeds NoneItem 14. Material Modifications To The Rights Of Shareholders and Use Of ProceedsItem 15. Controls and ProceduresItem 16 ReservedItem 16. A Audit Committee Financial ExpertItem 16. B Code Of EthicsItem 16. C Principal Accountant Fees and ServicesItem 16. D Exemptions From The Listing Standards For Audit CommitteesItem 16. E Purchases Of Equity Securities By The Issuer and Affiliated PurchasersItem 16. F Change in Registrant's Certifying AccountantItem 16. G Corporate GovernanceItem 16. H Mine Safety Disclosures Not ApplicableItem 16. H Mine Safety DisclosuresItem 17. Financial Statements Not ApplicableItem 17. Financial StatementsItem 18. Financial StatementsItem 19. Exhibits