ASGN INC
10-Ks and 10-Qs
|
|
|
|
|
|
|
|
|
|
|
|
|
|
|
|
|
|
|
|
|
|
|
|
|
|
|
|
|
|
|
|
|
|
|
|
|
|
|
|
|
|
|
|
|
|
|
|
|
|
|
|
|
|
|
|
UNITED STATES
SECURITIES AND EXCHANGE COMMISSION
Washington, DC 20549
FORM 10-K
|
|
x
ANNUAL REPORT PURSUANT TO SECTION 13 OR 15(d) OF THE
|
SECURITIES EXCHANGE ACT OF 1934
For the fiscal year ended December 31, 2010
|
|
o
TRANSITION REPORT PURSUANT TO SECTION 13 OR 15(d) OF THE
|
SECURITIES EXCHANGE ACT OF 1934
Commission File Number 0-20540
ON ASSIGNMENT, INC.
(Exact name of registrant as specified in its charter)
|
Delaware
|
95-4023433
|
|
|
(State or other jurisdiction of
|
(I.R.S. Employer
|
|
|
incorporation or organization)
|
Identification No.)
|
26745 Malibu Hills Road
Calabasas, California 91301
(Address of Principal Executive Offices)
Registrant’s telephone number, including area code:
(818) 878-7900
Securities registered pursuant to Section 12(b) of the Act:
|
Title of each class
|
Name of each exchange on which registered
|
|
|
Common Stock, $0.01 par value
|
The NASDAQ Stock Market, LLC
|
Securities registered pursuant to Section 12(g) of the Act:
None
(Title of Class)
Indicate by check mark if the registrant is a well-known seasoned issuer, as defined in Rule 405 of the Securities Act. Yes
o
No
x
Indicate by check mark if the registrant is not required to file reports pursuant to Section 13 or Section 15(d) of the Act. Yes
o
No
x
Indicate by check mark whether the registrant (1) has filed all reports required to be filed by Section 13 or 15(d) of the Securities Exchange Act of 1934 during the preceding 12 months (or for such shorter period that the registrant was required to file such reports), and (2) has been subject to such filing requirements of the past 90 days. Yes
x
No
o
Indicate by check mark whether the registrant has submitted electronically and posted on its corporate Web site, if any, every Interactive Data File required to be submitted and posted pursuant to Rule 405 of Regulation S-T during the preceding 12 months (or for such shorter period that the registrant was required to submit and post such files). Yes
o
No
o
Indicate by check mark if disclosure of delinquent filers pursuant to Item 405 of Regulation S-K is not contained herein, and will not be contained, to the best of registrant’s knowledge, in definitive proxy or information statements incorporated by reference in Part III of this Form 10-K or any amendment to this Form 10-K. o
Indicate by check mark whether the registrant is a large accelerated filer, an accelerated filer, a non-accelerated filer or a smaller reporting company. See the definitions of “large accelerated filer,” “accelerated filer” and “smaller reporting company” in Rule 12b-2 of the Exchange Act.
|
Large accelerated filer
o
|
Accelerated filer
x
|
Non-accelerated filer
o
|
Smaller reporting company
o
|
Indicate by check mark whether the registrant is a shell company (as defined in Rule 12b-2 of the Exchange Act). Yes
o
No
x
As of June 30, 2010, the aggregate market value of our common stock held by non-affiliates of the registrant was approximately $134,513,487.
As of March 10, 2011, the registrant had outstanding 36,753,091 shares of Common Stock, $0.01 par value.
DOCUMENTS INCORPORATED BY REFERENCE
Portions of the registrant’s proxy statement for the 2011 Annual Meeting of Stockholders, to be filed within 120 days of the close of the registrant’s fiscal year 2010, are incorporated by reference into Part III of this Annual Report on Form 10-K.
ON ASSIGNMENT, INC.
ANNUAL REPORT ON FORM 10-K FOR THE FISCAL YEAR ENDED DECEMBER 31, 2010
TABLE OF CONTENTS
|
Item 1.
|
Business
|
4
|
|
|
Item 1A.
|
Risk Factors
|
13
|
|
|
Item 1B.
|
Unresolved Staff Comments
|
21
|
|
|
Item 2.
|
Properties
|
21
|
|
|
Item 3.
|
Legal Proceedings
|
21
|
|
|
Item 4.
|
Removed and Reserved
|
21
|
|
|
Item 5.
|
Market for Registrant’s Common Equity, Related Stockholder Matters and Issuer Purchases of Equity Securities
|
22
|
|
|
Item 6.
|
Selected Financial Data
|
24
|
|
|
Item 7.
|
Management’s Discussion and Analysis of Financial Condition and Results of Operations
|
25
|
|
|
Item 7A.
|
Quantitative and Qualitative Disclosures About Market Risk
|
34
|
|
|
Item 8.
|
Financial Statements and Supplementary Data
|
36
|
|
|
Item 9.
|
Changes in and Disagreements With Accountants on Accounting and Financial Disclosure
|
64
|
|
|
Item 9A.
|
Controls and Procedures
|
64
|
|
|
Item 9B.
|
Other Information
|
65
|
|
|
Item 10.
|
Directors, Executive Officers and Corporate Governance
|
67
|
|
|
Item 11.
|
Executive Compensation
|
67
|
|
|
Item 12.
|
Security Ownership of Certain Beneficial Owners and Management and Related Stockholder Matters
|
67
|
|
|
Item 13.
|
Certain Relationships and Related Transactions and Director Independence
|
67
|
|
|
Item 14.
|
Principal Accountant Fees and Services
|
67
|
|
|
Item 15.
|
Exhibits and Financial Statement Schedule
|
68
|
|
|
69
|
|||
2
SPECIAL NOTE ON FORWARD-LOOKING STATEMENTS
This Annual Report on Form 10-K contains forward-looking statements within the meaning of Section 27A of the Securities Act of 1933, as amended, and Section 21E of the Securities Exchange Act of 1934, as amended. Such statements are based upon current expectations, as well as management’s beliefs and assumptions, and involve a high degree of risk and uncertainty. Any statements contained herein that are not statements of historical fact may be deemed to be forward-looking statements. Statements that include the words “believes,” “anticipates,” “plans,” “expects,” “intends,” and similar expressions that convey uncertainty of future events or outcomes are forward-looking statements. Forward-looking statements include statements regarding our anticipated financial and operating performance for future periods. Our actual results could differ materially from those discussed or suggested in the forward-looking statements herein. Factors that could cause or contribute to these differences or prove our forward-looking statements, by hindsight, to be overly optimistic or unachievable include, but are not limited to actual demand for our services, our ability to attract, train, and retain qualified staffing consultants (which includes our sales and recruiting staff), our ability to remain competitive in obtaining and retaining temporary staffing clients, the availability of qualified temporary nurses and other qualified contract professionals, our ability to manage our growth efficiently and effectively, continued performance of our information systems and the factors described in Item 1A of this Annual Report on Form 10-K under the Section titled ”Risk Factors.” Other factors also may contribute to the differences between our forward-looking statements and our actual results. In addition, as a result of these and other factors, our past financial performance should not be relied on as an indication of future performance. All forward-looking statements in this document are based on information available to us as of the date we file this Annual Report on Form 10-K, and we assume no obligation to update any forward-looking statement or the reasons why our actual results may differ.
3
|
|
|
Overview and History
On Assignment, Inc. is a diversified professional staffing firm providing flexible and permanent staffing solutions in specialty skills including Laboratory/Scientific, Healthcare/Nursing, Physician, Medical Financial, Information Technology and Engineering. We provide clients in these markets with short-term or long-term assignments of contract professionals, contract-to-permanent placement and direct placement of these professionals. As of December 31, 2010, our business consists of four operating segments: Life Sciences, Healthcare, Physician and IT and Engineering.
Our Life Sciences segment includes our domestic and international life science staffing businesses. Life Sciences segment revenues for 2010 were $109.5 million and represented 25.0 percent of our total revenues. We provide locally-based contract life science professionals to clients in the biotechnology, pharmaceutical, food and beverage, medical device, personal care, chemical, automotive, educational and environmental industries. Our contract professionals include chemists, clinical research associates, clinical lab assistants, engineers, biologists, biochemists, microbiologists, molecular biologists, food scientists, regulatory affairs specialists, lab assistants, biostatisticians, drug safety specialists, SAS programmers, medical writers, and other skilled scientific professionals.
Our Healthcare segment includes our Nurse Travel and Allied Healthcare lines of business. Healthcare segment revenues for 2010 were $76.3 million and represented 17.4 percent of our total revenues. We offer our healthcare clients locally-based and traveling contract professionals, from a number of healthcare medical financial and allied occupations. Our contract professionals include nurses, specialty nurses, health information management professionals, dialysis technicians, surgical technicians, imaging technicians, x-ray technicians, medical technologists, medical assistants, pharmacists, pharmacy technicians, respiratory therapists, phlebotomists, coders, billers, claims processors and collections staff, and dental professionals - including dental assistants, hygienists and dentists and rehabilitation therapists.
Our Physician segment consists of VISTA Staffing Solutions, Inc. (“VISTA”), which we acquired on January 3, 2007. The Physician segment revenues for 2010 were $73.6 million and represented 16.8 percent of our total revenues. VISTA,
based in Salt Lake City, Utah, is a leading provider of physician staffing, known as locum tenens, and permanent physician search services. We provide short and long-term locum tenens services and full-service physician search and consulting services, primarily in the United States, with some locum tenens placements in Australia and New Zealand. We work with physicians in a wide range of specialties, placing them in hospitals, community-based practices and federal, state and local facilities.
Our IT and Engineering segment consists of Oxford Global Resources, Inc. (“Oxford”), which we acquired on January 31, 2007. IT and Engineering segment revenues for 2010 were $178.7 million and represented 40.8 percent of our total revenues. Oxford, based in Beverly, Massachusetts, delivers high-end consultants with expertise in specialized information technology, hardware and software engineering and mechanical, electrical, validation and telecommunications engineering fields. We combine international reach with local depth, serving clients through a network of Oxford International recruiting centers in the United States and Europe, and Oxford & Associates branch offices in major metropolitan markets across the United States.
We were incorporated on December 30, 1985, and thereafter commenced operation of our Lab Support line of business (now included in our Life Sciences operating segment), our first contract staffing line of business. Utilizing our experience and unique approach in servicing our clients and contract professionals, we expanded our operations into other industries requiring specialty staffing. In 1994, through our acquisition of 1
st
Choice Personnel, Inc. and Sklar Resource Group, Inc., we established our Healthcare Financial Staffing service line of business (now a part of our Healthcare operating segment). Originally named Finance Support, this service line of business changed its name in 1997 and shifted in its business development focus to medical billing and collections for hospitals, health management organizations and physician groups.
In 1996, we acquired Enviro
Staff, and began providing contract professionals to the environmental services industry. In 1998, we acquired LabStaffers, Inc. to enhance our Life Sciences business. In 1999, we expanded our Life Sciences operations into Europe. Also in 1999, we formed our Clinical Lab Staff service line of business. Both of these service lines of business provide scientific and medical professionals to hospitals, physicians’ offices, clinics, reference laboratories and HMO’s and are currently included as a part of our Healthcare segment.
4
In 2002, we acquired Health Personnel Options Corporation, and established our Nurse Travel line of business, which provides registered nurses to hospitals and managed healthcare organizations. In 2003, we expanded the service offerings for our Life Sciences operating segment to include clinical research and engineering. Our clinical research line of business provides life science professionals in medical and clinical trial research, and our engineering line of business provides contract professionals in manufacturing, packaging, research and development and quality control positions.
In 2004, we expanded our service offerings in our Healthcare operating segment to include local nursing and health information management, which provides health information professionals to healthcare clients to process insurance claims and manage patient data. On January 3, 2007, we acquired VISTA and established our Physician operating segment. On January 31, 2007, we acquired Oxford and established our IT and Engineering operating segment. On October 1, 2009, we acquired Fox Hill & Associates, a physician permanent placement business specializing in retained and contingent search, which is included in our Physician operating segment. On April 16, 2010, the Company acquired The Cambridge Group Ltd., a Connecticut−based privately−held firm specializing in clinical research, IT, and physician staffing services and accordingly, is included in each of our Life Sciences, IT & Engineering and Physician operating segments. On July 19, 2010, the Company acquired Sharpstream Holdings Limited, a London-based privately−owned provider of executive search services in the life sciences sector and is included in our Life Sciences segment
.
Sharpstream provides search services across Europe, Asia, and the United States.
Financial information regarding our operating segments and our domestic and international revenues are included under “Financial Statements and Supplementary Data” in Part II, Item 8 of this Annual Report on Form 10-K.
Our principal executive office is located at 26745 Malibu Hills Road, Calabasas, California 91301, and our telephone number is (818) 878-7900. We have approximately 73 branch offices in 24 states within the United States and in five foreign countries.
Industry and Market Dynamics
General
Though the most recent U.S. employment figures indicate a significant contraction in job growth rates, from late 2007 through the present, the U.S. Bureau of Labor Statistics estimates that total employment will grow by 15 million jobs, or 10 percent, between 2008 and 2018. By comparison, there were 10 million new jobs created in the prior ten-year period, between 1998 and 2008, an increase of 7 percent. The U.S. Bureau of Labor Statistics estimates that employment growth will continue to be concentrated in the service sector with healthcare and social assistance, and professional and business services providing the strongest employment growth.
The
Staffing Industry Analysts: Staffing Industry Insight
(dated November 2010), an independent staffing industry publication, estimates that total staffing industry revenues were $102 billion in 2010 and forecasted to be $113 billion in 2011, up from $92 billion in 2009. The biggest industry segment, contract labor, is forecasted to grow at an annual rate of 12 percent in 2011 with revenues of $88 billion, while permanent placement is forecasted to grow by 13 percent in 2011. Within the contract help segment, professional staffing is expected to grow at an annual rate of 10 percent in 2011 to revenues of $45 billion. The temporary staffing (or contract labor) industry is historically cyclical and typically has a strong correlation to employment and GDP growth. We anticipate that our healthcare, life sciences and IT clients will increase their use of outsourced labor through professional staffing firms to meet the need for increases in capacity of their workforce. By using outsourced labor, these end users will benefit from cost structure advantages, improved flexibility to fluctuating demand in business and access to greater expertise. Typically, life sciences and healthcare clients’ products directly influence an individual’s health, welfare and well being, which will also impact our customers’ decision to use our services.
Life Sciences
The
Staffing Industry Analysts: Staffing Industry Insight
(dated November 2010), states that the life sciences professional staffing market will grow by 7 percent in 2011. Demand for staffing in our Life Sciences segment is driven primarily by clients with research and development projects across a wide array of industries.
Our Life Sciences segment includes our domestic and international life science staffing businesses. We provide locally-based, contract and permanent life science professionals to clients in the biotechnology, pharmaceutical, food and beverage, personal care, chemical, medical device, automotive, municipal, education and environmental industries. Our Life Sciences segment operates from local branch offices in the United States, United Kingdom, Netherlands, Belgium and Canada.
5
Healthcare
The
Staffing Industry Analysts: Staffing Industry Insight
(dated November 2010), estimates that the healthcare staffing market will grow by 4 percent in 2011. Within the healthcare staffing industry, allied health and locum tenens remain the areas that are most resilient to changing economic conditions with estimated 2011 revenue growth of 4 percent and 3 percent, respectively.
In prior years, nursing employment levels were affected by cutbacks in the use of agency workers by hospitals and medical groups and their reluctance to pay market rates. Today, as a result of the economy, hospitals are seeing fewer admissions and procedures and are attempting to minimize expenses, which in turn have impacted the demand for our services. Looking forward, contract nursing employment growth could potentially be driven by various factors including a supply shortage of nurses, impacts of healthcare reform, more favorable nurse-patient ratios and aging demographics.
The combination of healthcare clients facing shortages of operations-critical staff that limit their ability to generate revenues and increased demand for health services and advances in life science and medical technology is expected to create significant demand for workers with specialized science and medical skills. Also influencing the demand for these workers is the departure of mature professionals from the ranks of full-time employment as they retire, reduced hours worked and the pursuit of other career opportunities. This is evidenced by the continued increase in the average age of nurses in the workforce.
Our Healthcare segment provides locally-based and traveling contract professionals to healthcare clients, including hospitals, integrated delivery systems, imaging centers, clinics, physician offices, reference laboratories, universities, managed care organizations and third-party administrators.
Physician
The
Staffing Industry Analysts: Staffing Industry Insight
(dated November 2010), states that the physician staffing market will increase 3 percent in 2011. An ongoing shortage of physicians and potential impacts of healthcare reform could fuel future growth.
Our Physician staffing business places physicians in a wide range of specialties throughout the United States, as well as Australia and New Zealand, under the brand VISTA. The physician staffing market requires a high degree of specialized knowledge about credentialing and qualifications, as well as unique insurance requirements that make it more difficult to replicate than certain other types of staffing markets. Our Physician segment operates out of one primary recruitment center with several branch offices.
IT and Engineering
The
Staffing Industry Analysts: Staffing Industry Insight
(dated November 2010), estimates that the IT staffing market will increase 12 percent in 2011. Demand in our IT and Engineering business segment is driven by a shortage of highly skilled professionals with specific expertise.
Our IT and Engineering segment places only very highly qualified professionals across a wide range of disciplines. The segment operates out of several large sales and recruitment centers including one in Cork, Ireland under the brand Oxford International, and a number of domestic branch offices under the brand Oxford & Associates. Placements are highly diversified in that we average less than two contract placements per client. In late 2009, Oxford re-opened a permanent placement recruitment business.
Sales and Fulfillment
General
Our strategy is to serve the needs of our targeted industries by effectively understanding and matching client staffing needs with qualified contract professionals. In contrast to the mass market approach generally used for contract office/clerical and light industrial personnel, we believe effective assignments of contract healthcare, life science, physician and IT and engineering professionals require the people involved in making assignments to have significant knowledge of the client’s industry and the ability to assess the specific needs of the client as well as the contract professionals’ qualifications. We believe that face-to-face selling in many circumstances is significantly more effective than the telephonic solicitation of clients, a tactic favored by many of our competitors. We believe our strategy of using industry professionals to develop professional relationships provides us with a competitive advantage in our industry which is recognized by our clients.
6
Our corporate offices are organized to perform many functions that allow staffing consultants and recruiters to focus more effectively on business development and the assignment of contract professionals. These functions include the recruiting and hiring of staffing consultants, recruiters and support staff, as well as ongoing training, coaching and administrative support. Our corporate offices also select, open and maintain branch offices.
Life Sciences
We have developed a tailored approach to the assignment-making process that utilizes staffing consultants. Unlike traditional approaches that tend to be focused on telephonic solicitation, our Life Sciences staffing consultants are experienced professionals who work in our branch office network in the United States, United Kingdom, Netherlands, Belgium and Canada to enable face-to-face meetings with clients and contract professionals. At December 31, 2010, we had 42 Life Sciences segment branch offices. Most of our staffing consultants are either focused on sales and business development or on fulfillment. Sales and business development staffing consultants meet with clients’ managers to understand client needs, formulate position descriptions and assess workplace environments. Fulfillment staffing consultants meet with candidates to assess their qualifications and interests and place these contract professionals on
quality assignments with clients.
Contract professionals assigned to clients are generally our employees, although clients provide on-the-job supervisors for these professionals. Therefore, clients control and direct the work of contract professionals and approve hours worked, while we are responsible for many of the activities typically handled by the client’s human resources department.
Healthcare
The sales, account management, and recruiting functions of our Nurse Travel business are aligned with traditional nurse travel companies with an added emphasis on rapid response fulfillment. We employ regional sales directors and account managers to identify and sell a variety of nurse staffing solutions to health care clients nationally. Our recruiters seek the most experienced, highly skilled nurses and place them on assignments as contract professionals with healthcare providers for periods ranging from four to twenty-six weeks and longer. We service a diverse collection of healthcare clients, including acute care hospitals, rehabilitation facilities, long-term care facilities and integrated delivery systems. We seek to address occupations that represent “high demand and highly-skilled” staff such as emergency room, pediatrics, intensive care and operating room nurses, which are essential to maintaining the hospital’s ability to care for patients and maintain business and revenues. The critical nature of these occupations to drive revenue motivates clients to respond to our ability to rapidly fill open positions with experienced nurses. The recruitment and placement of nurse travel assignments are primarily managed at our locations in Cincinnati, Ohio, Tupelo, Mississippi and San Diego, California.
The nurses we assign to our clients are our employees, although clients provide on-the-job supervisors for the nurses. Therefore, clients control and direct the work of nurses and approve hours worked, while we are responsible for many of the activities typically handled by the client’s human resources department.
At December 31, 2010, we had 24 Allied Healthcare branch offices in the United States, of which 13 share office space with the Life Sciences segment. We have developed a tailored approach to the assignment-making process that utilizes staffing consultants. Staffing consultants are experienced professionals who work in our branch offices and personally meet with clients and contract professionals. Our staffing consultants are typically either focused primarily on sales and business development or on fulfillment. Sales and business development staffing consultants meet with clients to understand their staffing needs, formulate position descriptions and assess workplace environments. Fulfillment staffing consultants meet with candidates to assess their qualifications and interests and place these contract professionals on quality assignments with clients.
The contract professionals assigned to our Allied Healthcare clients are usually our employees, although clients provide on-the-job supervisors for these professionals. Therefore, clients control and direct the work of contract professionals and approve hours worked, while we are responsible for many of the activities typically handled by the client’s human resources department.
Physician
The sales and fulfillment functions at our Physician segment are similar to those of our competitors. Our client sales specialists are organized by geographic territories so that a single individual can handle a client’s physician staffing needs for all disciplines. Our recruiters and schedulers are organized by physician specialty and identify physician candidates with the skills, experience and availability to meet our clients’ needs. Our Physician business is headquartered in Salt Lake City, Utah, where the majority of our recruiters and all back-office functions are located. In addition, we have four branch locations that also carry out recruiting functions. We supply doctors in a wide range of specialties throughout the United States, Australia and New Zealand. Assignments are typically booked up to three months in advance and last six weeks.
7
The physicians we place at clients are independent contractors. Clients assign shifts and approve hours worked, while we are responsible for issuing payments to the physicians for services rendered to our clients.
IT and Engineering
Our IT and Engineering segment is headquartered in Beverly, Massachusetts, 30 minutes north of Boston, where all of the segment’s back-office activities are located. The segment serves the market in two separate operating formats. The first consists of 8 sales and recruiting hubs that manage client orders submitted from anywhere in North America and fulfill those orders with appropriate candidates identified from a nationwide database of skilled IT and engineering professionals. This operating unit also has 1 hub in Cork, Ireland that serves the European market. The right candidates for these assignments often reside in locations that are remote from the client worksite and will travel away from their homes to perform the assignments. The second operating format consists of 11 branch offices across the United States that typically receive orders from clients in their local metropolitan market and fulfill those orders with professionals from that local market. In each of these formats, we employ both client-oriented sales people and recruiters. Because our IT and Engineering segment addresses a wide range of disciplines within the IT and engineering markets, our sales people and recruiters generally specialize in a given discipline. Our competitive advantage in this segment comes from our effort to respond very quickly with high quality candidates to a client’s request.
Contract professionals assigned to clients are generally our employees. Clients provide on-the-job supervisors for these professionals, control and direct their work, and approve all hours worked. We are responsible for many of the activities typically handled by the client’s human resources department.
Clients
General
During the year ended December 31, 2010, we provided contract professionals to approximately 4,807 clients. In 2010, we had no single customer that represented 10 percent or more of our revenues.
All contract assignments, regardless of their planned length, may be terminated with limited notice by the client or the contract professional.
Life Sciences
Our clients in the Life Sciences segment include biotechnology and pharmaceutical companies, along with a broad range of clients in food and beverage, medical device, personal care, chemical, material sciences, energy, education and environmental industries. Our primary contacts with our clients are a mix of end users and process facilitators. End users consist of lab directors, managers and department heads. Facilitators consist of human resource managers, procurement departments and administrators. Facilitators are more price sensitive than end users who typically are more focused on technical capabilities. Assignments in our Life Sciences segment typically have a term of three to six months.
Healthcare
In our Healthcare segment, we serve a diverse collection of healthcare clients, including hospitals, integrated delivery systems, imaging centers, clinics, physician offices, reference laboratories, universities, managed care organizations and third-party administrators. In doing so, we address occupations that require “high demand and highly-skilled” staff, such as operating room nurses and health information professionals who are essential to the hospital’s ability to care for patients and maintain business and revenues. Assignments in our Healthcare segment typically have a term of two to thirteen weeks.
Physician
Clients in our Physician segment include hospitals, doctors’ practice groups, large healthcare systems and government agencies. We are called on to supply temporary and permanent doctors because of the difficulty that healthcare providers have finding qualified practitioners. Assignments in our Physician segment typically have a term of six weeks.
8
IT and Engineering
In our IT and Engineering segment, we supply services to a wide range of clients. Our clients range from large companies that may, for example, be installing new enterprise-wide computer systems and have a need for a subject matter expert with a specific technical and industry-specific experience, to a mid-sized medical device manufacturer who needs specialized mechanical engineers. The disciplines in our IT and Engineering segment are quite varied in the information technology, software and hardware, mechanical and electrical engineering, and network and telecommunication engineering markets. Assignments in our IT and Engineering segment typically have a term of approximately five months.
The Contract Professional
General
Contract professionals often work with a number of staffing companies and develop relationships or loyalty based on a variety of factors, including competitive salaries and benefits, availability and diversity of assignments, quality and duration of assignments and responsiveness to requests for placement. Contract professionals seeking traveling positions
are also interested in the quality of travel and housing accommodations as well as the quality of the clinical experience while on assignment.
Hourly wage or contract rates for our contract professionals are established based on their specific skills and whether or not the assignment involves travel away from the professional’s primary residence. Our staffing consultants are our employees or are subcontracted from other affiliated corporate entities. For our consultant employees we pay the related costs of employment including social security taxes, federal and state unemployment taxes, workers’ compensation insurance and other similar costs. After achieving minimum service periods and hours worked, we also provide our contract professional employees with paid holidays and allow participation in our 401(k) Retirement Savings Plan.
Life Sciences
Our Life Sciences segment’s professionals include chemists, clinical research associates, clinical lab assistants, engineers, biologists, biochemists, microbiologists, molecular biologists, biostatisticians, drug safety specialists, SAS programmers, medical writers
,
food scientists, regulatory affairs specialists, lab assistants and other skilled scientific professionals. These contract professionals range from individuals with bachelor’s and/or master’s degrees and considerable experience to technicians with limited chemistry or biology backgrounds and lab experience.
Healthcare
Our Healthcare segment’s contract professionals include nurses, specialty nurses, health information management professionals, pharmacists, pharmacy technicians, dentists, respiratory therapists, rehabilitation professionals, surgical technicians, imaging technicians, medical technologists, phlebotomists, coders, billers, medical assistants, dental assistants, hygienists, claims processors and collections staff.
Physician
The physicians in our Physician segment, come from 33 different specialties including emergency medicine, psychiatry, anesthesiology, radiology, family practice, surgical specialties, internal medicine, pediatrics, obstetrics and gynecology. All of these professionals are independent contractors.
IT and Engineering
Our IT and Engineering segment’s professionals come from various information technology, software/hardware, engineering, and telecom disciplines. Typically, they have a great deal of knowledge and experience in a fairly narrow field which makes them uniquely qualified to fill a given assignment.
Strategy
We remain committed to growing our operations in the life science, healthcare, physician and IT and engineering markets that we currently serve, primarily through supporting our core service offerings and growing our newer service lines of business.
9
In 2010, we continued to focus on increasing market share in each of our segments, increasing our gross margins, expanding our service offerings and controlling our operating costs. We have increased interaction between our segments so that each can learn best practices from the others.
As part of our initiative to improve our sales capabilities, field operations, and back office processing efficiency, we continue to make strategic investments enhancing our primary business systems. Our front office system (RecruitMax) supports all domestic and European Lab Support locations along with our Allied Healthcare and Nurse Travel operations. Deployment for these platforms began in 2004 and was principally completed in 2008. Currently underway is our next major front-office development initiative supporting the IT and Engineering segment. The RecruitMax application interfaces with the existing enterprise-wide information system, PeopleSoft, used in our Life Sciences, IT and Engineering, Nurse Travel and Allied Healthcare lines of business and provides additional functionality, including applicant tracking and search tools, customer and candidate contact management and sales management tools.
We continue to extend the use and capabilities of PeopleSoft in domestic and European operations. The Physician staffing segment will be migrating to the PeopleSoft platform in fiscal year 2011. Our ongoing plan is to deploy a common front-office system integrated with the PeopleSoft platform wherever efficiencies can be realized.
We improved our pay-bill processing efficiencies and services by deploying an on-line time collection and customer approval system. This particular extension of PeopleSoft is fully operational in the IT and Engineering unit and the roll-out will continue by business segment. Life Sciences and Allied Healthcare are slated for deployment this year.
Moderate investments are planned to keep our wide area network and computing platform running with high availability hardware. All primary business operate from a secure data center.
A significant number of leasehold improvements are planned for 2011 as we expand, relocate, and rationalize our branch facilities and leverage favorable commercial real estate terms for cost savings. We have relocated the corporate headquarters to a nearby more efficient space in March.
We believe these improvements should continue to increase the productivity of our staffing consultants and streamline corporate operations.
During 2010, we substantially added to the number of recruiters and sales personnel employed by the company. Over the course of the year, the average number of recruiters and sales personnel employed by the company increased 40.0 percent. In 2011, we anticipate that the markets we serve will improve with the economy. We have made small investments in enhancing our permanent placement capabilities and we will continue to invest in our existing businesses to support growth. In addition, we will continue to review acquisition opportunities that may enable us to leverage our current infrastructure and capabilities, increase our service offerings and expand our geographic reach.
We also continue to manage our capitalization over the next four years through the Company’s authorized stock repurchase plan.
Competition
General
Many of our competitors are larger than us and have substantially greater financial and marketing resources than we do. We also compete with privately-owned temporary staffing companies on a regional and local basis. Frequently, the strongest competition in a particular market is a privately-held local company with established relationships. These companies oftentimes are extremely competitive on pricing. While their pricing strategies are not necessarily sustainable, they can be problematic for us in the short-term.
The principal competitive factors in attracting qualified candidates for temporary employment or engagements are salaries, contract rates and benefits, availability and variety of assignments, quality and duration of assignments and responsiveness to requests for placement. We believe that many people seeking temporary employment or engagements through us are also pursuing employment through other means, including other temporary staffing. Therefore, the speed at which we place prospective contract professionals and the availability of appropriate assignments are important factors in our ability to complete assignments of qualified candidates. In addition to having high quality contract professionals to assign in a timely manner, the principal competitive factors in obtaining and retaining clients in the temporary staffing industry are properly assessing the clients’ specific job requirements, the appropriateness of the contract professional assigned to the client, the price of services and the monitoring of client satisfaction. Although we believe we compete favorably with respect to these factors, we expect competition to continue to increase.
10
Life Sciences
Our Life Sciences segment competes in the biotechnology, pharmaceutical, food and beverage, medical device, personal care, chemical, material sciences, energy, education and environmental markets. We believe our Life Sciences segment is one of the few nationwide temporary staffing providers specializing exclusively in the placement of life science professionals. Although other nationwide temporary staffing companies compete with us with respect to scientific, clinical laboratory, medical billing and collection personnel, many of these companies focus on office/clerical and light and heavy industrial personnel, which account for a significant portion of the overall contract staffing market. These competitors include Manpower, Inc., Kelly Services, Inc., Adecco SA, Yoh Company and the Allegis Group.
Healthcare
Our Healthcare segment competes in the healthcare market, serving hospitals, integrated delivery systems, imaging centers, clinics, physician offices, reference laboratories, universities, managed care organizations and third-party administrators. In the Nurse Travel line of business, our competitors include AMN Healthcare Services, Inc., Cross Country, Inc. and several privately-held companies. In the Allied Healthcare line of business, our competitors include Cross Country, Inc., AMN Healthcare Services, Inc., Kforce Inc. and the Allegis Group.
Physician
Our Physician segment also competes in the healthcare market, serving hospitals, doctors’ practice groups and private healthcare systems and government administrated healthcare agencies. VISTA’s competitors include CHG Healthcare Services, TeamHealth, Inc., Cross Country, Inc. and AMN Healthcare Services, Inc., along with several other privately-held companies providing locum tenens services.
IT and Engineering
Our IT and Engineering segment competes in the higher-end of the market for information technology and engineering consultants. Our IT specialties include enterprise resource planning, business intelligence, customer relationship management, supply chain management and database administration. Our engineering specialties include hardware, software, mechanical, electrical, validation, network, and telecommunications. Oxford’s competition ranges from local and regional specialty staffing companies to large IT consulting firms like Accenture, Inc. and International Business Machines Corporation (IBM), and international staffing firms such as Aerotek and Robert Half International, Inc.
Seasonality
Demand for our staffing services historically has been lower during the first and fourth quarters due to fewer business days resulting from client shutdowns, adverse weather conditions and a decline in the number of contract professionals willing to work during the holidays. As is common in the staffing industry, we run special incentive programs to keep our contract professionals, particularly nurses, working through the holidays. Demand for our staffing services usually increases in the second and third quarters of the year.
In addition, our cost of services typically increases in the first quarter primarily due to the reset of payroll taxes.
Employees
At December 31, 2010, we employed approximately 1,123 full-time regular employees, including staffing consultants, regional sales directors, account managers, recruiters and corporate office employees. During 2010, we employed approximately 11,407 contract professionals and 921 locum tenens physicians.
Government Regulation
The healthcare industry is subject to extensive and complex federal and state laws and regulations related to professional licensure, certification, conduct of operations, payment for services, payment for referrals and insurance. Our operations are subject to additional state and local regulations that require temporary staffing companies placing healthcare personnel to be licensed or separately registered to an extent beyond that required by temporary staffing companies that only place non-healthcare personnel. To date, we have not experienced any material difficulties in complying with such regulations and obtaining required licensure.
11
Some states require state licensure with associated fees for businesses that employ and/or assign certain healthcare personnel at hospitals and other healthcare facilities. We are currently licensed in all the states that require such licenses. In addition, most of the contract healthcare professionals that we employ are required to be individually licensed and/or certified under applicable state laws. We take reasonable steps to ensure that our contract professionals possess all current licenses and certifications required for each placement. We provide state mandated workers’ compensation insurance, unemployment insurance and professional liability insurance for our contract professionals who are employees and our regular employees. We provide medical malpractice insurance coverage under VISTA’s group medical malpractice insurance policy for our locum tenens physicians. These expenses have a direct effect on our cost of services, margins and likelihood of achieving or maintaining profitability.
For a further discussion of government regulation associated with our business, see “Risk Factors” within Item 1A of Part I of this Form 10-K.
Executive Officers of the Company
The executive officers of On Assignment, Inc. are as follows:
|
Name
|
Age
|
Position
|
|
Peter T. Dameris
|
51
|
Chief Executive Officer and President
|
|
James L. Brill
|
59
|
Senior Vice President, Finance and Chief Financial Officer
|
|
Emmett B. McGrath
|
49
|
President, Life Sciences and Allied Healthcare
|
|
Mark S. Brouse
|
57
|
President, VISTA Staffing Solutions, Inc.
|
|
Michael J. McGowan
|
57
|
President, Oxford Global Resources, Inc.
|
Peter T. Dameris
joined the Company in November 2003 as Executive Vice President, Chief Operating Officer and was promoted to President and Chief Executive Officer in September 2004. He was appointed to the Board of Directors of the Company in February 2005. From February 2001 through October 2002, Mr. Dameris served as Executive Vice President and Chief Operating Officer of Quanta Services, Inc. (NYSE: PWR), a leading provider of specialized contracting services for the electric and gas utility, cable and telecommunications industries. From December 1994 through September 2000, Mr. Dameris served in a number of different positions at Metamor Worldwide, Inc., an international, publicly-traded IT consulting/staffing company, including Chairman of the Board, President and Chief Executive Officer, Executive Vice President, General Counsel, Senior Vice President and Secretary. In June 2000, Mr. Dameris successfully negotiated the sale of Metamor for $1.9 billion. From November 2002 to January 2006,
Mr. Dameris was a member of the Board of Directors of BindView Corporation (acquired by Symatec Corporation in January 2006). Mr. Dameris is a member of the Board of Directors of Seismic Micro-Technology. Mr. Dameris holds a Juris Doctorate from the University of Texas Law School and a Bachelor’s in Business Administration from Southern Methodist University.
James L. Brill
joined the Company in January 2007 as Senior Vice President, Finance and Chief Financial Officer. Mr. Brill was Vice President, Finance and Chief Financial Officer of Diagnostic Products Corporation, a manufacturer of immuno-diagnostic kits, from July 1999 until it was acquired by Siemens in July 2006. From August 1998 to June 1999, Mr. Brill served as Chief Financial Officer of Jafra Cosmetics International, a marketing and direct-selling company in the skin care and beauty industry, and as Vice President of Finance and Administration and Chief Financial Officer of Vertel Corporation, a provider of middleware for the telecommunications industry, from 1996 to 1998. Mr. Brill also served as Senior Vice President, Finance and Chief Financial Officer of Merisel, Inc., a computer hardware and software distributor, from 1988 to 1996. Mr. Brill has been a member of the Board of Directors of Onvia Inc. since March 2004. He holds a Bachelor’s of Science degree from the United States Naval Academy and a Master’s of Business Administration degree from the University of California Los Angeles.
Emmett B. McGrath
joined the Company in September 2004 as President, Life Sciences U.S., and in August 2005, Mr. McGrath was appointed as President of Life Sciences Europe. Mr. McGrath was appointed as President of Allied Healthcare in November 2007. From February 1985 through August 2004, Mr. McGrath worked at Yoh Company, a privately-held IT staffing firm. During his tenure at Yoh, Mr. McGrath held various staffing positions, including Technical Recruiter, Account Manager, Branch and District Management, Vice President and Regional President. As Regional President, Mr. McGrath was responsible for core lines of businesses, including Scientific, Information Technology, Engineering, Healthcare, Telecommunications and Vendor on Premise (“VOP”) programs. In addition, Mr. McGrath served on Yoh’s Executive Committee and the Chairman’s Board of the Day & Zimmermann Group, Yoh’s parent company. Mr. McGrath received a Bachelor’s of Science degree in Business Administration, with an emphasis in Human Resources, from California State University, Northridge in 1991.
Mark S. Brouse
is President of VISTA Staffing Solutions, Inc., On Assignment’s Physician segment. Mr. Brouse joined On Assignment as a result of On Assignment’s January 2007 acquisition of VISTA, a company he co-founded in 1990. Mr. Brouse began his career in pharmaceutical sales in 1980, and in 1986 joined CompHealth, a locum tenens staffing company, where he led specialty teams serving psychiatry and internal medicine clients before founding VISTA. Mr. Brouse holds a Bachelor’s of Arts degree in Chemistry from California State, Dominguez Hills, and is a member of the Boards of Directors of the YMCA of Greater Salt Lake and PEHR Technologies, an electronic medical records company.
12
Michael J. McGowan
is President of Oxford Global Resources, Inc., On Assignment’s IT and Engineering segment. He has held this position since 1998. He joined Oxford in May of 1997 as Chief Operating Officer. Formerly, Mr. McGowan was Senior Vice President and General Manager for Kelly Services’ Middle Markets Division, a provider of staffing solutions. Prior to that time he was Vice President & General Manager for The MEDSTAT Group, a healthcare information firm, and held increasingly senior positions for Automatic Data Processing (“ADP”), a provider of human resources, payroll and tax and benefits administration solutions, during a sixteen year tenure. Mr. McGowan holds a Bachelor’s of Science degree in Electrical Engineering from Michigan State University and a Master’s of Business Administration degree from the Eli Broad Graduate School of Management, also at Michigan State University. Mr. McGowan joined On Assignment as a result of the Company’s acquisition of Oxford in January 2007.
Available Information and Access to Reports
We electronically file our Annual Report on Form 10-K, Quarterly Reports on Form 10-Q, Current Reports on Form 8-K, and all amendments to those reports with the Securities and Exchange Commission (“SEC”). You may read and copy any of our reports that are filed with the SEC in the following manner:
|
·
|
At the SEC’s Public Reference Room at 100 F Street NE, Washington, DC 20549. You may obtain information on the operation of the Public Reference Room by calling the SEC at (800) SEC-0330;
|
|
·
|
At the SEC’s website,
http://www.sec.gov
;
|
|
·
|
At our website,
http://www.onassignment.com
; or
|
|
·
|
By contacting our Investor Relations Department at (818) 878-7900.
|
Our reports are available through any of the foregoing means and are available free of charge on our website as soon as practicable after such material is electronically filed with or furnished to the SEC. Also available on our website (
http://www.onassignment.com)
, free of charge, are copies of our Code of Ethics for the Principal Executive Officer and Senior Financial Officers, Code of Business Conduct and Ethics and the charters for the committees of our Board of Directors. We intend to disclose any amendment to, or waiver from, a provision of our Code of Ethics for Principal Executive Officer and Senior Financial Officers on our website within five business days following the date of the amendment or waiver
.
Recent U.S. economic conditions have been uncertain and challenging, which adversely affects our business and results of operations.
Global market and economic conditions have been unprecedented and challenging with tighter credit conditions and recession in most major economies continuing into 2011. Continued concerns about the systemic impact of potential long-term and wide-spread recession, energy costs, geopolitical issues, the availability and cost of credit, and the global housing and mortgage markets have contributed to market volatility and diminished expectations for western and emerging economies. In 2009, added concerns fueled by the subprime mortgage crisis, higher interest rates and inflation, federal government stimulus spending, continued government conservatorship, government financial assistance and other federal government interventions
lead to increased market uncertainty and instability in both U.S. and international capital and credit markets. These conditions, combined with volatile oil prices, lowered business and consumer confidence and high unemployment, have contributed to economic slowdown and volatility of unprecedented levels. Further regulation of the healthcare industry also has a significant effect on spending in this area.
As a result of these market conditions, the cost and availability of credit has been and may continue to be adversely affected by illiquid credit markets and wider credit spreads. Concern about the stability of the markets generally and the strength of counterparties specifically has led many lenders and institutional investors to reduce, and in some cases, cease to provide credit to businesses and consumers. These factors have lead to a decrease in spending by businesses and consumers alike, and a corresponding decrease in demand for business services. Continued turbulence in the U.S. and international markets and economies and prolonged declines in business consumer spending may adversely affect our liquidity and financial condition, including our ability to refinance maturing liabilities and access the capital markets to meet liquidity needs.
13
Our liquidity and our ability to obtain financing may be adversely impacted if any of the lenders under our credit facilities suffers liquidity issues. In such an event, we may not be able to draw on all, or a substantial portion, of our credit facilities.
Temporary staffing companies are negatively impacted by high unemployment rates which have accompanied this period of economic turbulence. We experienced, and may continue to experience, a decline in demand for our staffing services as the U.S. suffers high levels of unemployment.
The market condition has also affected the liquidity and financial condition of many of our clients. The problems our clients are experiencing, including with regard to their access to financing, liquidity issues, funding issues, creditworthiness and their budgetary constraints may expose us to risks in collections of our accounts receivable.
Our results of operations may vary from quarter to quarter as a result of a number of factors, which may make it difficult to evaluate our business and could cause instability in the trading price of our common stock.
Factors that may cause our quarterly results to fluctuate include:
|
·
|
the level of demand for our temporary staffing services and the efficiency with which we source and assign our contract professionals and support our staffing consultants in the execution of their duties;
|
|
·
|
changes in our pricing policies or those of our competitors; and
|
|
·
|
our ability to control costs and manage our accounts receivable balances.
|
In addition, most temporary staffing companies experience seasonal declines in demand during the first and fourth quarters as a result of fewer business days and the reduced number of contract professionals willing to work during the holidays. Historically, we have experienced variability in the duration and depth of these seasonal declines, which in turn have materially affected our quarterly results of operations and made period-to-period comparisons of our financial and operating performance difficult.
If our operating results are below the expectations of public market analysts or investors in a given quarter, the trading price of our common stock could decline.
Failure to comply with restrictive covenants under our debt instruments could trigger prepayment obligations or additional costs.
Our failure to comply with restrictive covenants under our credit facilities and other debt instruments could result in
an event of default, which, if not cured or waived, could result in us being required to repay these borrowings before their due date. Some of these covenants are tied to our operating results and thus may be breached if we do not perform as expected. The lenders may require fees and expenses to be paid or other changes to terms in connection with waivers or amendments. If we are forced to refinance these borrowings on less favorable terms, our results of operations and financial condition could be adversely affected by increased costs and rates.
Failure of internal controls may leave us susceptible to errors and fraud.
Our management, including our CEO and CFO, does not expect that our disclosure controls and internal controls will prevent all errors and all fraud. A control system, no matter how well conceived and operated, can provide only reasonable assurance that the objectives of the control system are met. Furthermore, because of the inherent limitations in all control systems, no evaluation of controls can provide absolute assurance that all control issues and instances of fraud, if any, would be detected.
Significant legal actions could subject us to substantial uninsured liabilities.
In recent years, we have been subject to an increasing number of legal actions alleging malpractice, vicarious liability, intentional torts, negligent hiring, discrimination or related legal theories. We may be subject to liability in such cases even if the contribution to the alleged injury was minimal. Many of these actions involve large claims and significant defense costs. In addition, we may be subject to claims related to torts or crimes committed by our corporate employees or contract professionals. In most instances, we are required to indemnify clients against some or all of these risks. A failure of any of our corporate employees or contract professionals to observe our policies and guidelines intended to reduce these risks; relevant client policies and guidelines or applicable federal, state or local laws, rules and regulations could result in negative publicity, payment of fines or other damages.
To protect ourselves from the cost of these types of claims, we maintain workers’ compensation, medical malpractice, errors and omissions, employment practices and general liability insurance coverage in amounts and with deductibles that we believe are appropriate for our operations. Our coverage is, in part, self-insured and our insurance coverage may not cover all claims against us or continue to be available to us at a reasonable cost. If we are unable to maintain adequate insurance coverage, we may be exposed to substantial liabilities.
14
If we are unable to attract and retain qualified contract professionals for our Life Sciences, Healthcare, Physician and IT and Engineering segments, our business could be negatively impacted.
Our business is substantially dependent upon our ability to attract and retain contract professionals who possess the skills, experience and, as required, licenses to meet the specified requirements of our clients. We compete for such contract professionals with other temporary staffing companies and with our clients and potential clients. There can be no assurance that qualified healthcare, nursing, life sciences, physician, IT and engineering professionals will be available to us in adequate numbers to staff our operating segments. Moreover, our contract professionals are often hired to become regular employees of our clients. Attracting and retaining contract professionals depends on several factors, including our ability to provide contract professionals with desirable assignments and competitive benefits and wages. The cost of attracting and retaining contract professionals may be higher than we anticipate and, as a result, if we are unable to pass these costs on to our clients, our likelihood of achieving or maintaining profitability could decline. In periods of high unemployment, contract professionals frequently opt for full-time employment directly with clients and, due to a large pool of available candidates, clients are able to directly hire and recruit qualified candidates without the involvement of staffing agencies. If we are unable to attract and retain a sufficient number of contract professionals to meet client demand, we may be required to forgo staffing and revenue opportunities, which may hurt the growth of our business.
We may not successfully make or integrate acquisitions, which could harm our business and growth.
As part of our growth strategy, we intend to opportunistically pursue selected acquisitions. We compete with other companies in the professional staffing and consulting industries for acquisition opportunities, and we cannot assure that we will be able to effect future acquisitions on commercially reasonable terms or at all. To the extent we enter into acquisition transactions in the future, we may experience:
|
·
|
delays in realizing or a failure to realize the benefits, cost savings and synergies that we anticipate;
|
|
·
|
difficulties or higher-than-anticipated costs associated with integrating any acquired companies into our businesses;
|
|
·
|
attrition of key personnel from acquired businesses;
|
|
·
|
diversion of management’s attention from other business concerns;
|
|
·
|
inability to maintain the business relationships and reputation of the acquired companies;
|
|
·
|
difficulties in integrating the acquired companies into our information systems, controls, policies and procedures;
|
|
·
|
additional risks relating to the businesses or industry of the acquired companies that are different from ours;
|
|
·
|
unexpected costs or charges; and
|
|
·
|
unforeseen operating difficulties that require significant financial and managerial resources that would otherwise be available for the ongoing development or expansion of our existing operations.
|
To undertake more transactions, we may incur additional debt in the future. We may face unexpected contingent liabilities arising from these or future acquisitions that could harm our business. We may also issue additional equity in connection with future transactions, which would dilute our existing shareholders.
If we cannot attract, develop and retain qualified and skilled sales and recruiting staff, our business growth will suffer.
A key component of our ability to grow our lines of business is our ability to attract, develop and retain qualified and skilled sales and recruiting staff, particularly persons with industry experience. The available pool of qualified staffing consultant candidates is limited, and further constrained by the industry practice of entering into non-compete agreements with these employees, which may restrict their ability to accept employment with other staffing firms, including us. We cannot assure that we will be able to recruit, develop and retain qualified sales and recruiting staff in sufficient numbers or that our staffing consultants will achieve productivity levels sufficient to enable growth of our business. Failure to attract and retain productive sales and recruiting staff could adversely affect our business, financial condition and results of operations.
Reclassification of our independent contractors by tax authorities could materially and adversely affect our business model and could require us to pay significant retroactive wages, taxes and penalties.
We consider our locum tenens physicians to be independent contractors rather than employees. As such, we do not withhold or pay income or other employment related taxes or provide workers’ compensation insurance for them. Our classification of locum tenens physicians as independent contractors is consistent with general industry standard, but can nonetheless be challenged by the contractors themselves as well as the relevant taxing authorities. If federal or state taxing authorities determine that locums tenens physicians engaged as independent contractors are employees, our business model for that segment would be materially and adversely affected. Although we believe we would qualify for safe harbor under the provisions of Section 530 of the Revenue Act of 1978, Pub. L. No. 95−600 (“Section 530”), and any similar applicable state laws, we could incur significant liability for past wages, taxes, penalties and other employment benefits if we could not so qualify. In addition, many states have laws that prohibit non−physician owned companies from employing physicians. If our independent contractor physicians are classified as employees, we could be found in violation of such state laws, which could subject us to liability in those states and thereby negatively impact on our profitability.
15
If our information systems do not function in a cost effective manner, our business will be harmed.
The operation of our business is dependent on the proper functioning of our information systems. In 2009, we continued to upgrade our information technology systems, including our PeopleSoft and Vurv Technology enterprise-wide information systems used in daily operations to identify and match staffing resources and client assignments, track regulatory credentialing, manage scheduling and also perform billing and accounts receivable functions. If the systems fail to perform reliably or otherwise do not meet our expectations, or if we fail to successfully complete the implementation of other modules of the systems, we could experience business interruptions that could result in deferred or lost sales. Our information systems are vulnerable to fire, storm, flood, power loss, telecommunications failures, physical or software break-ins and similar events. Our network infrastructure is currently located at our facility in Salt Lake City, Utah. As a result, any system failure or service outage at this primary facility could result in a loss of service for the duration of the failure of the outage. Our location in Southern California is susceptible to earthquakes and has, in the past, experienced power shortages and outages, any of which could result in system failures or outages. If our information systems fail or are otherwise unavailable, these functions would have to be accomplished manually, which could impact our ability to respond to business opportunities quickly, to pay our staff in a timely fashion and to bill for services efficiently.
If we are not able to remain competitive in obtaining and retaining temporary staffing clients, our future growth will suffer.
The contract staffing industry is highly competitive and fragmented with limited barriers to entry. We compete in national, regional and local markets with full-service agencies and in regional and local markets with specialized contract staffing agencies. Some of our competitors in the Nurse Travel line of business include AMN Healthcare Services, Inc.,
Cross Country, Inc. and several privately-held companies. Some of our competitors in the Life Sciences segment and Allied Healthcare line of business include Kelly Services, Inc., Kforce Inc., Manpower, Inc., Adecco SA, Yoh Company, and Allegis Group. Competitors for the Physician segment include CHG Healthcare Services, Cross Country, Inc., TeamHealth, Inc. and AMN Healthcare Services, Inc., along with several other privately-held companies specializing in locum tenens services. Competitors of our IT and Engineering segment include Robert Half International, Accenture, and Aerotek. Several of these companies have significantly greater marketing and financial resources than we do. Our ability to attract and retain clients is based on the value of the service we deliver, which in turn depends principally on the speed with which we fill assignments and the appropriateness of the match based on clients’ requirements and the skills and experience of our contract professionals. Our ability to attract and retain skilled, experienced contract professionals is based on our ability to pay competitive wages or contract rates, to provide competitive benefits and provide multiple, continuous assignments. To the extent that competitors seek to gain or retain market share by reducing prices or increasing marketing expenditures, we could lose revenues and our gross and operating margins could decline, which could seriously harm our operating results and cause the trading price of our stock to decline. As we expand into new geographic markets, our success will depend in part on our ability to gain market share from competitors. We expect competition for clients to increase in the future, and the success and growth of our business depend on our ability to remain competitive.
Agreements may be terminated by clients and contract professionals at will and the termination of a significant number of such agreements would adversely affect our revenues and results of operations.
Each contract professional’s employment or independent contractor’s relationship with us is terminable at will. A locum tenens physician may generally terminate his or her contract with VISTA for non-emergency reasons upon 60 days notice. The duration of agreements with clients are generally dictated by the contract. Usually, contracts with clients may be terminated with 30 days notice by us or by the clients and, oftentimes, assignments may be terminated with less than one week’s notice. We cannot assure that existing clients will continue to use our services at historical levels, if at all. In addition, we continue to participate in an increasing number of third party contracts as a subcontractor and that requires us to participate in vendor management contracts, which may subject us to greater risks or lower margins. If clients terminate a significant number of our staffing agreements or assignments and we are unable to generate new contract staffing orders to replace lost revenues or a significant number of our contract professionals terminate their employment with us and we are unable to find suitable replacements, our revenues and results of operations could be harmed.
16
We are subject to business risks associated with international operations, which could make our international operations significantly more costly.
During 2010, we had international sales in all countries in the European Union, in Canada, the Virgin Islands, New Zealand and Australia. In 2010, our international operations comprised approximately 7.0 percent of total sales compared with 5.0 percent in 2009 and 2008. We have limited experience in marketing, selling and supporting our services outside of North America.
Operations in certain markets are subject to risks inherent in international business activities, including:
|
·
|
fluctuations in currency exchange rates;
|
|
·
|
complicated work permit requirements;
|
|
·
|
varying economic and political conditions;
|
|
·
|
seasonal reductions in business activity during the summer months in Europe and Asia;
|
|
·
|
overlapping or differing tax structures;
|
|
·
|
difficulties collecting accounts receivable; and
|
|
·
|
regulations concerning pay rates, benefits, vacation, union membership, redundancy payments and the termination of employment.
|
Our inability to effectively manage our international operations could result in increased costs and adversely affect our results of operations.
Improper activities of our contract professionals could result in damage to our business reputation, discontinuation of our client relationships and exposure to liability.
We may be subject to possible claims by our clients related to errors and omissions, misuse of proprietary information, discrimination and harassment, theft and other criminal activity, malpractice and other claims stemming from the improper activities or alleged activities of our contract professionals. We cannot assure that our current liability insurance coverage will be adequate or will continue to be available in sufficient amounts to cover damages or other costs associated with such claims. Claims raised by clients stemming from the improper actions of our contract professionals, even if without merit, could cause us to incur significant expense associated with the costs or damages related to such
claims. Further, such claims by clients could damage our business reputation and result in the discontinuation of client relationships.
Claims against us by our contract professionals for damages resulting from the negligence or mistreatment by our clients could result in significant costs and adversely affect our recruitment and retention efforts.
We may be subject to possible claims by our contract professionals alleging discrimination, sexual harassment, negligence and other similar activities. Our physicians, nurses and healthcare professionals may also be subject to medical malpractice claims. We cannot assure that our current liability insurance coverage will be adequate or will continue to be available in sufficient amounts to cover damages or other costs associated with such claims. Claims raised by our contract professionals, even if without merit, could cause us to incur significant expense associated with the costs or damages related to such claims. Further, any associated negative publicity could adversely affect our ability to attract and retain qualified contract professionals in the future.
If we are required to further write down goodwill or identifiable intangible assets, the related charge could materially impact our reported net income or loss for the period in which it occurs.
We have approximately $199.7 million in goodwill on our balance sheet at December 31, 2010, as well as $25.2 million in identifiable intangible assets. As part of the analysis of goodwill impairment, Accounting Standards Codification Topic 350,
Intangibles
-
Goodwill and Other
, requires the Company’s management to estimate the fair value of the reporting units on at least an annual basis and more frequently if events or changes in circumstances indicate that the carrying amount may not be recoverable. At December 31, 2010, we performed our annual goodwill and indefinite lived intangible assets impairment test and concluded that there was an impairment of goodwill related to our Nurse Travel business. While we began to experience growth in the Nurse Travel business during the fourth quarter, the decrease in the value was due to lowered growth expectations in the later years due to uncertainty regarding the timing of the recovery of the Nurse Travel industry. We recognized a goodwill impairment charge of $15.4 million in the fourth quarter of 2010. In addition, at December 31, 2010, we determined that there were no events or changes in circumstances that indicated that the carrying values of other identifiable intangible assets subject to amortization may not be recoverable. Future declines in our market capitalization or any other impairment indicators subsequent to the balance sheet date could be an early indication that remaining goodwill may become impaired in the future. Although a future impairment of goodwill and identifiable intangible assets would not affect our cash flow, it would negatively impact our operating results.
17
If we are subject to material uninsured liabilities under our partially self-insured workers’ compensation program and medical malpractice coverage, our financial results could be adversely affected.
We maintain a partially self-insured workers’ compensation program and medical malpractice coverage. In connection with these programs, we pay a base premium plus actual losses incurred up to certain levels. We are insured for losses greater than certain levels, both per occurrence and in the aggregate. There can be no assurance that our loss reserves and insurance coverage will be adequate in amount to cover all workers’ compensation or medical malpractice claims. If we become subject to substantial uninsured workers’ compensation or medical malpractice liabilities or there is a significant change in the circumstances related to claims, our results of operations and financial condition could be adversely affected.
Our costs of providing travel and housing for traveling contract professionals may be higher than we anticipate and, as a result, our margins could decline.
If our travel and housing costs, including the costs of airline tickets, rental cars, apartments and rental furniture for our traveling contract professionals exceed the levels we anticipate, and we are unable to pass such increases on to our clients, our margins may decline. To the extent the length of our apartment leases exceed the terms of our staffing contracts, we bear the risk that we will be obligated to pay rent for housing we do not use. If we cannot source a sufficient number of appropriate short-term leases in regional markets, or if, for any reason, we are unable to efficiently utilize the apartments we do lease, we may be required to pay rent for unutilized or underutilized housing. Effective management of travel costs will be necessary to prevent a decrease in gross profit and gross and operating margins.
Demand for our services is significantly impacted by changes in the general level of economic activity and continued periods of reduced economic activity could negatively impact our business and results of operations.
Demand for the contract staffing services that we provide is significantly impacted by changes in the general level of economic activity, particularly any negative effect on healthcare, research and development and quality control and capital spending. As economic activity slows, many clients or potential clients for our services reduce their usage of and reliance upon contract professionals before laying off their regular, full-time employees. During periods of reduced economic activity, we may also be subject to increased competition for market share and pricing pressure. As a result, continued periods of reduced economic activity could harm our business and results of operations.
We do not have long-term or exclusive agreements with our temporary staffing clients and growth of our business depends upon our ability to continually secure and fill new orders.
We do not have long-term agreements or exclusive guaranteed order contracts with our temporary staffing clients. Assignments for our Life Sciences segment typically have a term of three to six months. Assignments for our Healthcare segment typically have a term of two to thirteen weeks. Assignments for our Physician segment typically have a term of six weeks. Assignments for our IT and Engineering segment typically have a term of approximately five months. The success of our business depends upon our ability to continually secure new orders from clients and to fill those orders with our contract professionals. Our agreements do not provide for exclusive use of our services, and clients are free to place orders with our competitors. As a result, it is imperative to our business that we maintain positive relationships with our clients. If we fail to maintain positive relationships with these clients, we may be unable to generate new contract staffing orders, and the growth of our business could be adversely affected.
Fluctuation in patient occupancy rates at client facilities could adversely affect demand for services of our Healthcare and Physician segments and our results of operations.
Client demand for our Healthcare and Physician segment services is significantly impacted by changes in patient occupancy rates at our hospital and healthcare clients’ facilities. Increases in occupancy often result in increased client need for contract professionals before full-time employees can be hired. During periods of decreased occupancy, however, hospitals and other healthcare facilities typically reduce their use of contract professionals before laying off their regular, full-time employees. During periods of decreased occupancy, we may experience increased competition to service clients, including pricing pressure. Occupancy at certain healthcare clients’ facilities also fluctuates due to the seasonality of some elective procedures and patients declining elective procedures. Periods of decreased occupancy at client healthcare facilities could materially adversely affect our results of operations.
The loss of key members of our senior management team could adversely affect the execution of our business strategy and our financial results.
We believe that the successful execution of our business strategy and our ability to build upon the significant recent investments in our business and acquisitions of new businesses depends on the continued employment of key members of our senior management team. If any members of our senior management team become unable or unwilling to continue in their present positions, our financial results and our business could be materially adversely affected.
18
Future changes in reimbursement trends could hamper our Healthcare and Physician segments clients’ ability to pay us, which would harm our financial results.
Many of our Healthcare and Physician segments’ clients are reimbursed under the federal Medicare program and state Medicaid programs for the services they provide. In recent years, federal and state governments have made significant changes in these programs that have reduced reimbursement rates. In addition, insurance companies and managed care organizations seek to control costs by requiring that healthcare providers, such as hospitals, discount their services in exchange for exclusive or preferred participation in their benefit plans. Future federal and state legislation or evolving commercial reimbursement trends may further reduce, or change conditions for, our clients’ reimbursement. Limitations on reimbursement could reduce our clients’ cash flows, thereby hampering their ability to pay us.
If our insurance costs increase significantly, these incremental costs could negatively affect our financial results.
The costs related to obtaining and maintaining workers’ compensation insurance, medical malpractice insurance, professional and general liability insurance and health insurance for our contract professionals have been increasing. If the cost of carrying this insurance continues to increase significantly, this may reduce our gross and operating margins and affect our financial results.
Recent U.S. healthcare legislation could negatively impact our results of operations.
In March 2010, the Patient Protection and Affordable Care Act and the Health Care and Education Reconciliation Act of 2010 (collectively, the “Acts”) were signed into U.S. law. The Acts represent comprehensive healthcare reform legislation that, in addition to other provisions, will require that we provide healthcare coverage to our temporary employees in the United States or incur penalties. Although our intent is to bill these costs to our customers, there can be no assurance that we will be able to increase client bill rates in a sufficient amount to cover the increased costs. This may reduce our gross and operating margins and negatively impact our financial results. Additionally, since significant provisions of the Acts will not become effective until 2014, possible future changes to the Acts could significantly impact any estimates we develop during that period. While we are unable at this time to estimate the net impact of the Acts, we believe the net financial impact on our results of operations could be significant.
We operate in a regulated industry and changes in regulations or violations of regulations may result in increased costs or sanctions that could reduce our revenues and profitability.
Our organization is subject to extensive and complex federal and state laws and regulations including but not limited to laws and regulations related to professional licensure, payroll tax, conduct of operations, payment for services and payment for referrals. If we fail to comply with the laws and regulations that are directly applicable to our business, we could suffer civil and/or criminal penalties or be subject to injunctions or cease and desist orders.
Extensive and complex laws that apply to our hospital and healthcare facility clients, including laws related to Medicare, Medicaid and other federal and state healthcare programs, could indirectly affect the demand or the prices paid for our services. For example, our hospital and healthcare facility clients could suffer civil and/or criminal penalties and/or be excluded from participating in Medicare, Medicaid and other healthcare programs if they fail to comply with the laws and regulations applicable to their businesses. In addition, our hospital and healthcare facility clients could receive reduced reimbursements or be excluded from coverage because of a change in the rates or conditions set by federal or state governments. In turn, violations of or changes to these laws and regulations that adversely affect our hospital and healthcare facility clients could also adversely affect the prices that these clients are willing or able to pay for our services.
We may be subject to increases in payroll-related costs and state unemployment insurance taxes which, as a result, our margins could decline.
We currently pay federal, state and local payroll costs and taxes for our corporate employees and contract professional employees. If we are subject to significant increases in costs associated with payroll and state unemployment taxes, we may not be able to increase client bill rates to cover the additional expense and this may reduce our gross and operating margins and affect our financial results.
The trading price of our common stock has experienced significant fluctuations, which could make it difficult for us to access the public markets for financing or use our common stock as consideration in a strategic transaction.
19
In 2010, the trading price of our common stock experienced significant fluctuations, ranging from a high of $8.85 to a low of $4.17. The closing price of our common stock on The NASDAQ Global Select Market was $9.70 on March 10, 2011. Our common stock may continue to fluctuate widely as a result of a large number of factors, many of which are beyond our control, including:
|
·
|
period to period fluctuations in our financial results or those of our competitors;
|
|
·
|
failure to meet previously announced guidance or analysts’ expectations of our quarterly results;
|
|
·
|
announcements by us or our competitors of acquisitions, significant contracts, commercial relationships or capital commitments;
|
|
·
|
commencement of, or involvement in, litigation;
|
|
·
|
any major change in our board or management;
|
|
·
|
changes in government regulations, including those related to Medicare and Medicaid reimbursement policies;
|
|
·
|
recommendations by securities analysts or changes in earnings estimates;
|
|
·
|
announcements about our earnings that are not in line with analyst expectations;
|
|
·
|
the volume of shares of common stock available for public sale;
|
|
·
|
announcements by our competitors of their earnings that are not in line with analyst expectations;
|
|
·
|
sales of stock by us or by our shareholders;
|
|
·
|
short sales, hedging and other derivative transactions in shares of our common stock; and
|
|
·
|
general economic conditions, slow or negative growth of unrelated markets and other external factors.
|
The stock market has experienced extreme price and volume fluctuations that have affected the trading prices of the common stock of many companies involved in the temporary staffing industry. As a result of these fluctuations, we may encounter difficulty should we determine to access the public markets for financing or use our common stock as consideration in a strategic transaction.
Future sales of our common stock and the future exercise of options may cause the market price of our common stock to decline and may result in substantial dilution.
We cannot predict what effect, if any, future sales of our common stock, or the availability of our common stock for sale will have on the market price of our common stock. Sales of substantial amounts of our common stock in the public market by management or us, or the perception that such sales could occur, could adversely affect the market price of our common stock and may make it more difficult for you to sell your common stock at a time and price which you may deem appropriate.
We have adopted anti-takeover measures that could prevent a change in our control.
In June 2003, we adopted a shareholder rights plan that has certain anti-takeover effects and will cause substantial dilution to a person or group that attempts to acquire us in a manner or on terms that have not been approved by our board of directors. This plan could delay or impede the removal of incumbent directors and could make more difficult a merger, tender offer or proxy contest involving us, even if such events could be beneficial, in the short-term, to the interests of our shareholders. In addition, such provisions could limit the price that some investors might be wiling to pay in the future for shares of our common stock. Our certificate of incorporation and bylaws contain provisions that limit liability and provide for indemnification of our directors and officers, and provide that our stockholders can take action only at a duly called meeting of stockholders. These provisions and others also may have the affect of deterring hostile takeovers or delaying changes in control or management.
Provisions in our corporate documents and Delaware law may delay or prevent a change in control that our stockholders consider favorable.
Provisions in our certificate of incorporation and bylaws could have the effect of delaying or preventing a change of control or changes in our management. These provisions include the following:
|
·
|
Our board of directors has the right to elect directors to fill a vacancy created by the expansion of the board of directors or the resignation, death or removal of a director, which prevents stockholders from being able to fill vacancies on our board of directors.
|
|
·
|
Our stockholders may not act by written consent. In addition, a holder or holders controlling a majority of our capital stock would not be able to take certain actions without holding a stockholder’s meeting, and only stockholders owning at least 50 percent of our entire voting stock must request in writing in order to call a special meeting of stockholders (which is in addition to the authority held by our board of directors to call a special stockholder meeting).
|
|
·
|
Stockholders must provide advance notice to nominate individuals for election to the board of directors or to propose matters that can be acted upon at a stockholders’ meeting. These provisions may discourage or deter a potential acquirer from conducting a solicitation of proxies to elect the acquirer’s own slate of directors or otherwise attempting to obtain control of our company.
|
|
·
|
Our board of directors may issue, without stockholder approval, up to 1 million shares of undesignated or “blank check” preferred stock. The ability to issue undesignated or “blank check” preferred stock makes it possible for our board of directors to issue preferred stock with voting or other rights or preferences that could impede the success of any attempt or make it more difficult for a third party to acquire us.
|
20
As a Delaware corporation, we are also subject to certain Delaware anti-takeover provisions, including Section 203 of the Delaware General Corporation Law. Under these provisions, a corporation may not engage in a business combination with any large stockholders who hold 15 percent or more of our outstanding voting capital stock in a merger or business combination unless the holder has held the stock for 3 years, the board of directors has expressly approved the merger or business transaction or at least two-thirds of the outstanding voting capital stock not owned by such large stockholder approve the merger or the transaction. These provisions of Delaware law may have the effect of delaying, deferring or preventing a change of control, and may discourage bids for our common stock at a premium over its market price. In addition, our board of directors could rely on these provisions of Delaware law to discourage, prevent or delay an acquisition of us.
As of December 31, 2010, we leased approximately 30,500 square feet of office space through March 2011 for our field support and corporate headquarters in Calabasas, California. Additionally, we leased 16,600 square feet of office space for our field support offices in Blue Ash, Ohio. As of December 31, 2010, we leased approximately 56,000 square feet of office space through December 2016 at our VISTA headquarters in Salt Lake City, Utah, and 48,300 square feet of office space through December 2015 at our Oxford headquarters in Beverly, Massachusetts.
On August 18, 2010, we entered into a lease agreement with Calabasas BDC, Inc. with respect to the relocation of our corporate headquarters to 26745 Malibu Hills Road, Calabasas, California 91301. The lease term commences on April 1, 2011 and shall continue for 128 months, with two five-year renewal options. While our payment obligations under the lease commence on April 1, 2011, the lease allows for earlier occupancy. The total leased premises equals approximately 37,172 square feet.
In addition, we lease approximately 234,000 square feet of office space in approximately 73 branch office locations in the United States, United Kingdom, Netherlands, Belgium, Ireland, China and Canada. A branch office typically occupies space ranging from approximately 1,000 to 4,000 square feet with lease terms that typically range from six months to five years.
We are involved in various legal proceedings, claims and litigation arising in the ordinary course of business. However, based on the facts currently available, we do not believe that the disposition of matters that are pending or asserted will have a material adverse effect on our financial position,
results of operations or cash flows.
21
Our common stock trades on The NASDAQ Global Select Market under the symbol ASGN. The following table sets forth the range of high and low sales prices as reported on The NASDAQ Global Select Market for each quarterly period within the two most recent fiscal years. At March 10, 2011, we had approximately 40 holders of record, approximately 3,650 beneficial owners of our common stock and 36,753,091 shares outstanding.
|
Price Range of
Common Stock
|
|||||||
|
High
|
Low
|
||||||
|
Year Ended December 31, 2010
|
|||||||
|
First Quarter
|
$ | 7.89 | $ | 6.47 | |||
|
Second Quarter
|
$ | 7.75 | $ | 4.17 | |||
|
Third Quarter
|
$ | 5.75 | $ | 4.18 | |||
|
Fourth Quarter
|
$ | 8.85 | $ | 5.06 | |||
|
Year Ended December 31, 2009
|
|||||||
|
First Quarter
|
$ | 5.79 | $ | 1.28 | |||
|
Second Quarter
|
$ | 4.41 | $ | 2.40 | |||
|
Third Quarter
|
$ | 6.29 | $ | 3.53 | |||
|
Fourth Quarter
|
$ | 7.52 | $ | 5.15 | |||
Since inception, we have not declared or paid any cash dividends on our common stock, and we currently plan to retain all earnings to support the development and expansion of our business and we have no present intention of paying any dividends on our common stock in the foreseeable future. However, the board of directors periodically reviews our dividend policy to determine whether the declaration of dividends is appropriate. Terms of our senior credit facility restrict our ability to pay dividends of more than $2.0 million per year.
On June 15, 2001, the Company’s Board of Directors authorized the repurchase of up to 2,940,939 shares of common stock. As of December 31, 2009, the Company had repurchased and retired the entire amount of the authorized repurchase shares of its common stock at a total cost of $25.0 million for such 2,940,939 shares. On October 25, 2010, the Board of Directors authorized additional corporate stock repurchases subject to an overall repurchase cost limitation of $20.0 million. Under this program, the Company, through a third party, may repurchase shares in open market purchases or in privately negotiated transactions over a four year period. In November 2010, the Company repurchased and retired 291,212 shares of its common stock at a total cost of $2.0 million under this program. Accordingly, the Company’s remaining authorized cost limitation to repurchase its common stock was $18.0 million as of December 31, 2010.
Stock Performance Graph
The following graph compares the performance of On Assignment’s common stock price during the period from December 31, 2005 to December 31, 2010 with the composite prices of companies listed on the NASDAQ Stock Market and of companies included in the SIC Code No. 736—Personnel Supply Services Companies Index. The companies listed in the SIC Code No. 736 include peer companies in the same industry or line of business as On Assignment.
The graph depicts the results of investing $100 in On Assignment’s common stock, the NASDAQ Stock Market composite index and an index of the companies listed in the SIC Code No. 736 on December 31, 2005 and assumes that dividends were reinvested during the period.
The comparisons shown in the graph below are based upon historical data, and we caution stockholders that the
stock price performance shown in the graph below is not indicative of, nor intended to forecast, potential future performance.
22
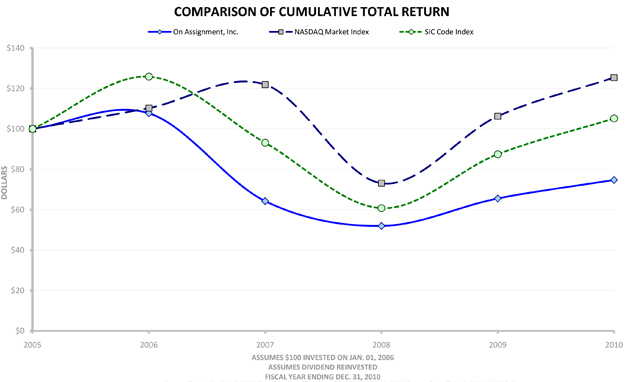
|
Year Ended December 31,
|
|||||||||||||||||||||||
|
2010
|
2009
|
2008
|
2007
|
2006
|
2005
|
||||||||||||||||||
|
On Assignment, Inc.
|
$ | 74.70 | $ | 65.54 | $ | 51.97 | $ | 64.25 | $ | 107.70 | $ | 100.00 | |||||||||||
|
SIC Code No. 736 Index—Personnel Supply Services Company Index
|
$ | 105.16 | $ | 87.45 | $ | 60.78 | $ | 93.13 | $ | 125.84 | $ | 100.00 | |||||||||||
|
NASDAQ Stock Market Index
|
$ | 125.37 | $ | 106.23 | $ | 73.10 | $ | 121.89 | $ | 110.26 | $ | 100.00 | |||||||||||
On Assignment purchases of equity securities during the quarter ended December 31, 2010 were as follows:
|
Period
|
Total # of shares
purchased
|
Avg. price paid
per share
|
Total # of shares purchased as
part of publicly announced plans
or programs
|
Maximum # of shares (or approximated
dollar value) that may yet be purchased
under the plans or programs
|
|||||||||||
|
Oct.
|
- | - | - | $ 20,000,000 | |||||||||||
|
Nov.
|
291,212 | 6.84 | 291,212 | $ 18,000,000 | |||||||||||
|
Dec.
|
- | - | - | $ 18,000,000 | |||||||||||
|
Total
|
291,212 | 6.84 | 291,212 | $ 18,000,000 | |||||||||||
23
The following table presents selected financial data of On Assignment. This selected financial data should be read in conjunction with the consolidated financial statements and notes thereto included under “Financial Statements and Supplementary Data” in Part II, Item 8 of this report.
|
Year Ended December 31,
|
||||||||||||||||||||
|
2010
|
2009
|
2008
|
2007
(1)
|
2006
(2)
|
||||||||||||||||
|
(in thousands, except per share data)
|
||||||||||||||||||||
|
Statement of Operations Data:
|
||||||||||||||||||||
|
Revenues
|
$ | 438,065 | $ | 416,613 | $ | 618,058 | $ | 567,180 | $ | 287,566 | ||||||||||
|
Cost of services
|
288,609 | 280,245 | 418,602 | 387,643 | 209,725 | |||||||||||||||
|
Gross profit
|
149,456 | 136,368 | 199,456 | 179,537 | 77,841 | |||||||||||||||
|
Selling, general and administrative expenses
|
130,830 | 121,141 | 155,942 | 151,942 | 67,900 | |||||||||||||||
|
Impairment of goodwill
|
15,399 | - | - | - | - | |||||||||||||||
|
Operating income
|
3,227 | 15,227 | 43,514 | 27,595 | 9,941 | |||||||||||||||
|
Interest expense
|
(8,309 | ) | (6,612 | ) | (9,998 | ) | (12,174 | ) | (54 | ) | ||||||||||
|
Interest income
|
141 | 170 | 715 | 1,394 | 1,698 | |||||||||||||||
|
Income (loss) before income taxes
|
(4,941 | ) | 8,785 | 34,231 | 16,815 | 11,585 | ||||||||||||||
|
Provision for income taxes
|
4,956 | 4,078 | 15,261 | 7,493 | 541 | (2) | ||||||||||||||
|
Net income (loss)
|
$ | (9,897 | ) | $ | 4,707 | $ | 18,970 | $ | 9,322 | $ | 11,044 | |||||||||
|
Earnings (loss) per share:
|
||||||||||||||||||||
|
Basic
|
$ | (0.27 | ) | $ | 0.13 | $ | 0.53 | $ | 0.27 | $ | 0.41 | |||||||||
|
Diluted
|
$ | (0.27 | ) | $ | 0.13 | $ | 0.53 | $ | 0.26 | $ | 0.39 | |||||||||
|
Number of shares and share equivalents used to calculate
earnings (loss) per share:
|
||||||||||||||||||||
|
Basic
|
36,429 | 36,011 | 35,487 | 35,138 | 27,155 | |||||||||||||||
|
Diluted
|
36,429 | 36,335 | 35,858 | 35,771 | 28,052 | |||||||||||||||
|
Balance Sheet Data (at end of period):
|
||||||||||||||||||||
|
Cash, cash equivalents, restricted cash and current portion of marketable securities
|
$ | 18,409 | $ | 25,974 | $ | 46,271 | $ | 37,764 | $ | 110,161 | ||||||||||
|
Working capital
|
50,596 | 62,238 | 91,192 | 79,009 | 135,501 | |||||||||||||||
|
Total assets
|
341,116 | 343,462 | 401,850 | 384,680 | 186,995 | |||||||||||||||
|
Long-term liabilities
|
76,579 | 84,847 | 129,805 | 140,803 | 627 | |||||||||||||||
|
Stockholders’ equity
|
219,487 | 226,661 | 218,514 | 193,034 | 165,944 | |||||||||||||||
(1)
On January 3, 2007, we acquired VISTA Staffing Solutions, Inc., and on January 31, 2007, we acquired Oxford Global Resources, Inc.
(2)
In 2006, there was a reversal of the valuation allowance of $4.9 million that was recorded against our net deferred income tax assets in 2004 and 2005.
24
The information in this discussion contains forward-looking statements within the meaning of Section 27A of the Securities Act of 1933, as amended, and Section 21E of the Securities Exchange Act of 1934, as amended. Such statements are based upon current expectations that involve risks and uncertainties. Any statements contained herein that are not statements of historical fact may be deemed to be forward-looking statements. For example, the words “believes,” “anticipates,” “plans,” “expects,” “intends,” and similar expressions are intended to identify forward-looking statements. Forward-looking statements include statements regarding our anticipated financial and operating performance for future periods. Our actual results could differ materially from those discussed herein. Factors that could cause or contribute to such differences include, but are not limited to, the following: (1) the continued negative impact of the current credit crisis and global economic slowdown on On Assignment as well as the professional staffing industry; (2) actual demand for our services; (3) our ability to attract, train and retain qualified staffing consultants; (4) our ability to remain competitive in obtaining and retaining temporary staffing clients; (5) the availability of qualified contract nurses and other qualified contract professionals; (6) our ability to manage our growth efficiently and effectively; (7) continued performance of our information systems; and (8) other factors described in Item 1A of this Annual Report on Form 10-K under the Section titled ”Risk Factors.” Other factors also may contribute to the differences between our forward-looking statements and our actual results. In addition, as a result of these and other factors, our past financial performance should not be relied on as an indication of future performance. All forward-looking statements in this document are based on information available to us as of the date we file this Annual Report on Form 10-K, and we assume no obligation to update any forward-looking statement or the reasons why our actual results may differ.
OVERVIEW
On Assignment, Inc. is a diversified professional staffing firm providing flexible and permanent staffing solutions in specialty skills including Laboratory/Scientific, Healthcare/Nursing, Physicians, Medical Financial, Information Technology and Engineering. We provide clients in these markets with short-term or long-term assignments of contract professionals, contract-to-permanent placement and direct placement of these professionals. Our business currently consists of four operating segments: Life Sciences, Healthcare, Physician, and IT and Engineering.
The Life Sciences segment includes our domestic and international life science staffing lines of business. We provide locally-based, contract life science professionals to clients in the biotechnology, pharmaceutical, food and beverage, medical device, personal care, chemical, nutraceutical, materials science, consumer products, environmental petrochemical and contract manufacturing industries. Our contract professionals include chemists, clinical research associates, clinical lab assistants, engineers, biologists, biochemists, microbiologists, molecular biologists, food scientists, regulatory affairs specialists, lab assistants and other skilled scientific professionals.
The Healthcare segment includes our Nurse Travel and Allied Healthcare lines of business. We offer our healthcare clients contract professionals, both locally-based and traveling, from a number of healthcare and allied healthcare occupations. Our contract professionals include nurses, specialty nurses, health information management professionals, dialysis technicians, surgical technicians, imaging technicians, x-ray technicians, medical technologists, phlebotomists, coders, billers, claims processors and collections staff.
Our Physician segment consists mainly of VISTA, which is a leading provider of physician staffing, known as locum tenens coverage, and permanent physician search services based in Salt Lake City, Utah. We provide short and long-term locum tenens coverage and full-service physician search and consulting in the United States with capabilities in Australia and New Zealand. VISTA works with physicians from nearly all medical specialties, placing them in hospitals, community-based practices, and federal, state and local facilities.
Our IT and Engineering segment consists mainly of Oxford, which delivers high-end consultants with expertise in specialized information technology, software and hardware engineering, mechanical, electrical, validation and telecommunications engineering fields. We combine international reach with local depth, serving clients through a network of Oxford International recruiting centers in the United States and Europe, and Oxford & Associates branch offices in major metropolitan markets across the United States. Oxford is based in Beverly, Massachusetts.
25
Results of Operations
The following table summarizes selected statement of operations data expressed as a percentage of revenues:
|
Year Ended December 31,
|
||||||||||||
|
2010
|
2009
|
2008
|
||||||||||
|
Revenues
|
100.0 | % | 100.0 | % | 100.0 | % | ||||||
|
Cost of services
|
65.9 | 67.3 | 67.7 | |||||||||
|
Gross profit
|
34.1 | 32.7 | 32.3 | |||||||||
|
Selling, general and administrative expenses
|
29.9 | 29.1 | 25.2 | |||||||||
|
Impairment of goodwill
|
3.5 | - | - | |||||||||
|
Operating income
|
0.7 | 3.6 | 7.1 | |||||||||
|
Interest income
|
0.0 | 0.0 | 0.1 | |||||||||
|
Interest expense
|
(1.9 | ) | (1.5 | ) | (1.6 | ) | ||||||
|
Income (loss) before income taxes
|
(1.2 | ) | 2.1 | 5.6 | ||||||||
|
Provision for income taxes
|
1.1 | 1.0 | 2.5 | |||||||||
|
Net income (loss)
|
(2.3 | )% | 1.1 | % | 3.1 | % | ||||||
RESULTS OF OPERATIONS FOR THE YEAR ENDED DECEMBER 31, 2010 COMPARED WITH THE YEAR ENDED DECEMBER 31, 2009
Revenues
|
Year Ended December 31,
|
Change
|
||||||||||||||
|
2010
|
2009
|
$ | % | ||||||||||||
|
Revenues by segment (in thousands):
|
|||||||||||||||
|
Life Sciences
|
$ | 109,495 | $ | 93,664 | $ | 15,831 | 16.9% | ||||||||
|
Healthcare
|
76,287 | 97,137 | (20,850 | ) | (21.5%) | ||||||||||
|
Physician
|
73,595 | 87,719 | (14,124 | ) | (16.1%) | ||||||||||
|
IT and Engineering
|
178,688 | 138,093 | 40,595 | 29.4% | |||||||||||
|
Total
|
$ | 438,065 | $ | 416,613 | $ | 21,452 | 5.1% | ||||||||
Revenues increased $21.5 million, or 5.1 percent, as a result of improved operating environments in our IT and Engineering and Life Sciences segments and our acquisitions of Cambridge and Sharpstream, offset by continued weak demand for our services in our Healthcare and Physician segments. Consolidated revenues for the year ended December 31, 2010 include $7.3 million related to our Cambridge acquisition in the second quarter of 2010 and $2.6 million related to the Sharpstream acquisition in the third quarter of 2010.
Life Sciences segment revenues increased $15.8 million, or 16.9 percent, primarily due to an 11.3 percent increase in contract professionals on assignment and a $4.4 million, or 156.2 percent increase in direct hire and conversion fees. The increase in revenues was primarily due to the increase in demand for Life Sciences service offerings as our clients’ end markets have improved with the economic recovery beginning in the second quarter of 2010 and the Cambridge and Sharpstream acquisitions.
Healthcare segment revenues (comprised of our Nurse Travel and Allied Healthcare lines of business) decreased $20.9 million, or 21.5 percent. Nurse Travel revenues decreased $18.9 million, or 34.0 percent, to $36.7 million, which included $5.0 million of revenue in 2010 generated from supporting customers that experienced labor disruptions. The decrease was primarily due to a 40.6 percent decrease in the average number of nurses on assignment and a 3.6 percent decrease in the average bill rate. Allied Healthcare revenues decreased $2.0 million, or 4.7 percent, to $39.5 million due to an 11.6 percent decrease in the average number of contract professionals on assignment and a $0.5 million decrease in direct hire and conversion fee revenues. These decreases were partially offset by a 2.8 percent increase in the average bill rate. Based on our research and client feedback, we believe the decrease in revenues was attributable to continued adverse economic trends in the healthcare sector, which contributed to the decrease in number of travelers on assignment, open orders, and average bill rates. While the Allied Healthcare operating environment continued to demonstrate signs of improvement, growth was constrained by (i) a continued reduction in demand for elective procedures, (ii) a greater number of patients choosing more cost effective forms of treatment such as self-medication, (iii) hospitals reduced usage of contract professionals in response to declining cash balances and patient admissions and (iv) reduced demand for less critical allied skill modalities and a dramatic decline in demand for flu vaccine as compared to the H1N1 pandemic we faced the prior year.
26
Physician segment revenues decreased $14.1 million, or 16.1 percent. The decrease in revenues was primarily attributable to a 16.9 percent decrease in the average number of physicians on assignment. These decreases were partially offset by a $0.6 million, or 32.5 percent increase in direct hire revenues. The average bill rate for the Physician segment was flat. Based on industry research and client feedback, we believe the decrease in revenues was primarily due to the economic conditions and high unemployment which have reduced the number of elective procedures and lowered patient census at client facilities.
IT and Engineering segment revenues increased $40.6 million, or 29.4 percent. The increase in revenues was primarily due to a 34.1 percent increase in the average number of contract professionals on assignment and a $1.2 million increase in direct hire and conversion fee revenues. These increases were partially offset by a 4.4 percent decrease in the average bill rate. Because many of our placements involve capital projects, we believe that one of the reasons the demand for our IT and Engineering services has increased with the economic recovery is that more companies have increased their capital spending.
Gross Profit and Gross Margins
|
Year Ended December 31,
|
|||||||||||||||||
|
2010
|
2009
|
||||||||||||||||
|
Gross Profit
|
Gross Margin
|
Gross Profit |
Gross Margin
|
||||||||||||||
|
GrGross Profit by segment (in thousands):
|
|||||||||||||||||
|
Life Sciences
|
$ | 37,776 | 34.5 | % | $ | 30,470 | 32.5 | % | |||||||||
|
Healthcare
|
23,058 | 30.2 | % | 27,329 | 28.1 | % | |||||||||||
|
P Physician
|
23,847 | 32.4 | % | 28,545 | 32.5 | % | |||||||||||
|
IT and Engineering
|
64,775 | 36.3 | % | 50,024 | 36.2 | % | |||||||||||
|
Total
|
$ | 149,456 | 34.1 | % | $ | 136,368 | 32.7 | % | |||||||||
The year-over-year gross profit increase was primarily due to a 139 basis point expansion in consolidated gross margin and a 5.1 percent improvement in total revenue. The increase in gross margin was primarily attributable to an increase in the percent of revenues related to the IT and Engineering reporting unit, which has highest gross margin of all the segments and margin expansion in the Healthcare and Life Sciences segments.
Life Sciences segment gross profit increased $7.3 million, or 24.0 percent. The increase in gross profit was primarily due to a 16.9 percent increase in the segment revenues and a 197 basis point expansion in gross margin. The expansion in gross margin was due to a $4.4 million, or 156.2 percent, increase in direct hire and conversion fee revenues, partially offset by a 2.4 percent decrease in bill/pay spread.
Healthcare segment gross profit decreased $4.3 million, or 15.6 percent. The decrease in gross profit was due to a 21.5 percent decrease in the segment revenues, partially offset by a 210 basis point expansion in gross margin. The expansion in gross margin was primarily due to Nurse Travel revenues of $5.0 million at gross margins of 53.5 percent related to supporting customers with labor disruptions in 2010. The expansion in gross margin was partially offset by a 7.6 percent decrease in the bill/pay spread and an increase in billable expenses and workers’ compensation insurance expense. Within this segment, Allied Healthcare gross profit decreased 5.8 percent while gross margin decreased 39 basis points and Nurse Travel gross profit decreased 25.5 percent while gross margin increased 312 basis points which was primarily due to the high gross margins on supporting customers with labor disruptions in 2010 described above.
Physician segment gross profit decreased $4.7 million, or 16.5 percent. The decrease in gross profit was due to a $14.1 million, or 16.1 percent, decrease in the segment revenues as well as a 14 basis point contraction in gross margin. The contraction in gross margin was primarily due to a 3.2 percent decrease in bill/pay spread, partially offset by a $0.6 million increase in direct hire revenues.
IT and Engineering segment gross profit increased $14.8 million, or 29.5 percent. The increase in gross profit was primarily due to a $40.6 million, or 29.4 percent increase in revenues.
Selling, General and Administrative Expenses.
Selling, general and administrative (SG&A) expenses include field operating expenses, such as costs associated with our network of staffing consultants and branch offices for each of our four segments, including staffing consultant compensation, rent, other office expenses, marketing and recruiting expenses for our contract professionals. SG&A expenses also include our corporate and branch office support expenses, such as the salaries of corporate operations and support personnel, recruiting and training expenses for field staff, marketing staff expenses, expenses related to being a publicly-traded company and other general and administrative expenses.
For the year ended December 31, 2010, SG&A expenses increased $9.7 million, or 8.0 percent, to $130.8 million from $121.1 million for the same period in 2009. The increase in SG&A expenses was primarily due to a $12.9 million increase in compensation and benefits. The increase in compensation and benefits was due to a $9.4 million increase in bonuses, commissions and stock-based compensation as a result of increased revenue and the attainment of incentive compensation targets as well as a $3.2 million increase in compensation expenses as a result of increased headcount related to the Cambridge and Sharpstream acquisitions. The increase in SG&A expenses was also due to a $0.9 million increase in travel expenses for acquisition-related activities in 2010. The increase in SG&A expenses was partially offset by a $4.0 million decrease in amortization expense as certain intangible assets became fully amortized in the first quarter of 2010. Total SG&A expenses as a percentage of revenues increased to 29.9 percent for the year ended December 31, 2010 from 29.1 percent in the same period in 2009.
Impairment of Goodwill.
We recognized
a goodwill impairment charge of $15.4 million related to Nurse Travel during 2010. The goodwill impairment charge for Nurse Travel was a result of the decreased fair value of the reporting unit due to lowered growth expectations in the later years because of uncertainty regarding the timing of the recovery of the Nurse Travel industry.
27
Interest Expense and Interest Income.
Interest expense was $8.3 million for the year ended December 31, 2010 compared with $6.6 million in 2009. This increase was primarily due to the write-off of unamortized capitalized loan costs of $2.8 million related to the old borrowing facility that was paid in full in December 2010 as well as a $1.3 million gain in 2009 for the mark-to-market adjustment on our interest rate swap, which expired on June 30, 2009, partially offset by lower average debt balances in 2010.
Interest income decreased to $0.1 million for the year ended December 31, 2010 compared with $0.2 million in 2009 due to lower account balances invested in interest-bearing accounts and lower average interest rates.
Provision for Income Taxes.
The provision for income taxes was $5.0 million for the year ended December 31, 2010 compared with $4.1 million in 2009. Excluding the impact of the goodwill impairment charge, the effective tax rate was 47.4 percent in 2010 compared with 46.4 percent in 2009.
RESULTS OF OPERATIONS FOR THE YEAR ENDED DECEMBER 31, 2009 COMPARED WITH THE YEAR ENDED DECEMBER 31, 2008
Revenues.
|
Year Ended December 31,
|
Change
|
||||||||||||||
|
2009
|
2008
|
$ | % | ||||||||||||
|
Revenues by segment (in thousands):
|
|||||||||||||||
|
Life Sciences
|
$ | 93,664 | $ | 129,483 | $ | (35,819 | ) | (27.7%) | |||||||
|
Healthcare
|
97,137 | 180,671 | (83,534 | ) | (46.2%) | ||||||||||
|
Physician
|
87,719 | 89,217 | (1,498 | ) | (1.7%) | ||||||||||
|
IT and Engineering
|
138,093 | 218,687 | (80,594 | ) | (36.9%) | ||||||||||
|
Total
|
$ | 416,613 | $ | 618,058 | $ | (201,445 | ) | (32.6%) | |||||||
Revenues decreased $201.4 million, or 32.6 percent, as a result of weakened demand for our services in all segments.
Life Sciences segment revenues decreased $35.8 million, or 27.7 percent. The decrease in revenues was primarily attributable to a 24.8 percent decrease in the average number of contract professionals on assignment, as well as a $3.4 million, or 54.8 percent decrease in direct hire and conversion fees. Based on our research and client feedback, we believe this was a direct result of our clients’ decisions to focus more on cost containment than on completing projects and developing new products or enhancing existing product lines during this challenging economic period, decreased venture capital funding in the life sciences sector, softness in the clinical trials arena, which is closely tied to the struggling pharmaceutical industry, decreased demand for recent graduates and lower level scientific skill disciplines.
Healthcare segment revenues (comprised of our Nurse Travel and Allied Healthcare lines of business) decreased $83.5 million, or 46.2 percent. Nurse Travel revenues decreased $69.4 million, or 55.5 percent, to $55.6 million primarily as a result of a 51.1 percent decrease in the average number of nurses on assignment and a 3.4 percent decrease in the average bill rate. Allied Healthcare revenues decreased $14.1 million, or 25.3 percent, to $41.5 million due to a 21.1 percent decrease in the average number of contract professionals on assignment, partially offset by a 6.5 percent increase in the average bill rate. Based on our research and client feedback, we believe the decrease in revenues was attributable to less demand from hospitals and other healthcare facilities as they reduced their usage of contract professionals in response to declining patient admissions, endowment balances, reduced charitable contributions and the inability to access the credit markets during this challenging economic period.
Physician segment revenues decreased $1.5 million, or 1.7 percent. The decrease in revenue was primarily attributable to a 13.2 percent decrease in the average number of physicians on assignment and a $0.9 million decrease in reimbursable revenue for billable expenses, partially offset by a 2.3 percent increase in the average bill rate. Based on industry research and client feedback, we believe the decrease in revenues reflects the uncertainty surrounding health care reform and the decline in patient admissions which has slowed down our clients’ hiring decisions.
28
IT and Engineering segment revenues decreased $80.6 million, or 36.9 percent. The decrease in revenues was primarily due to a 31.8 percent decrease in the average number of contract professionals on assignment, an 8.8 percent decrease in the average bill rate and a $3.7 million decrease in reimbursable revenue for billable expenses. Based on client feedback, the decrease in revenues was mainly the result of the current economic environment and the lack of capital available to clients for projects and programs.
Gross Profit and Gross Margins.
|
Year Ended December 31,
|
|||||||||||||||||
|
2009
|
2008
|
||||||||||||||||
|
Gross Profit
|
Gross Margin
|
Gross Profit |
Gross Margin
|
||||||||||||||
|
Gross Profit by segment (in thousands):
|
|||||||||||||||||
|
Life Sciences
|
$ | 30,470 | 32.5 | % | $ | 43,502 | 33.6 | % | |||||||||
|
Healthcare
|
27,329 | 28.1 | % | 46,265 | 25.6 | % | |||||||||||
|
Physician
|
28,545 | 32.5 | % | 27,369 | 30.7 | % | |||||||||||
|
IT and Engineering
|
50,024 | 36.2 | % | 82,320 | 37.6 | % | |||||||||||
|
Total
|
$ | 136,368 | 32.7 | % | $ | 199,456 | 32.3 | % | |||||||||
The year-over-year gross profit decrease was primarily due to the decline in revenues in all four segments, partially offset by a 46 basis point expansion in consolidated gross margin. The increase in gross margin was primarily attributable to margin expansion in the Healthcare and Physician segments and a shift in mix from our Nurse Travel line of business which has the lowest gross margin.
Life Sciences segment gross profit decreased $13.0 million, or 30.0 percent. The decrease in gross profit was primarily due to a 27.7 percent decrease in the segment revenues and a 107 basis point contraction in gross margin mainly due to a $3.4 million decrease in direct hire and conversion fee revenues. The contraction in gross margin was partially offset by a $0.5 million decrease in workers’ compensation expense as a result of both lower claim frequency and favorable settlements.
Healthcare segment gross profit decreased $18.9 million, or 40.9 percent. The decrease in gross profit was due to a 46.2 percent decrease in the segment revenues, partially offset by a 252 basis point expansion in gross margin. The expansion in gross margin was primarily due to a 117 basis point decrease in travel related expenses, an 88 basis point reduction in other employee-related expenses and a 38 basis point decrease in workers’ compensation expense as a result of our loss control efforts. The expansion in gross margin was partially offset by an 8.5 percent decrease in the bill/pay spread. Within this segment Allied Healthcare gross profit decreased 22.4 percent while gross margin expanded 123 basis points and Nurse Travel gross profit decreased 52.4 percent while gross margin increased 160 basis points.
Physician segment gross profit increased $1.2 million, or 4.3 percent. The increase in gross profit was attributable to a 186 basis point expansion in gross margin, partially offset by a $1.5 million decrease in revenue. The expansion in gross margin was primarily due to a 6.9 percent increase in the bill/pay spread as well as a $0.9 million increase in direct hire and conversion fee revenues. The expansion in gross margin was partially offset by an increase of $0.5 million in medical malpractice expense, which included a $0.6 million non-cash expense related to the Company’s adjustment of the discount rate applied to our medical malpractice liability because of the decrease in interest rates.
IT and Engineering segment gross profit decreased $32.3 million, or 39.2 percent, primarily due to a 36.9 percent decrease in revenues and a contraction in gross margin of 142 basis points. The contraction in gross margin was primarily due to an 11.3 percent decrease in the bill/pay spread and a $1.0 million decrease in direct hire and conversion fee revenues.
Selling, General and Administrative Expenses.
SG&A expenses decreased $34.8 million, or 22.3 percent, to $121.1 million from $155.9 million. The decrease in SG&A expenses was primarily due to a $23.9 million decrease in compensation and benefits as a result of lower
headcount as compared with the prior year. The decrease in SG&A expenses was also due to a $3.4 million decrease in amortization expense as certain intangible assets became fully amortized beginning in late 2008, as well as a $2.2 million decrease in travel related expense and a $1.4 million decrease in marketing expense. Total SG&A expenses as a percentage of revenues increased to 29.1 percent in the 2009 period from 25.2 percent in the same period in 2008, primarily due to revenue decreasing faster than SG&A expenses in 2009.
29
Interest expense and interest income.
Interest expense was $6.6 million in 2009 compared with $10.0 million in 2008. This decrease was primarily due to a $1.3 million gain in 2009 compared with a $0.1 million loss in 2008 for the mark-to-market adjustment on our interest rate swap, which expired on June 30, 2009 and lower average debt balances, partially offset by higher interest rates as a result of the debt amendment completed in the first quarter of 2009.
Interest income was $0.2 million and $0.7 million for the years ended 2009 and 2008, respectively. Interest income in the current period decreased compared to 2008 due to lower account balances invested in interest-bearing accounts and lower average interest rates.
Provision for Income Taxes
. The provision for income taxes was $4.1 million for the year ended December 31, 2009 compared with $15.3 million for 2008. The annual effective tax rate for 2009 was 46.4 percent compared with 44.6 percent for 2008. The increase in the annual effective tax rate was attributable to a decline in the income before income taxes for the year while our level of permanent differences was comparable with 2008.
Liquidity and Capital Resources
Our working capital at December 31, 2010 was $50.6 million and our cash and cash equivalents were $18.4 million. Our operating cash flows have been our primary source of liquidity and historically have been sufficient to fund our working capital and capital expenditure needs. Our working capital requirements consist primarily of the financing of accounts receivable, payroll expenses and the periodic payments of principal and interest on our loans.
Net cash provided by operating activities was $26.9 million for 2010 compared with $42.0 million for 2009. The 2009 period benefited from a significant reduction in accounts receivable of $28.0 million versus an increase of $10.5 million in 2010. These fluctuations in accounts receivable were primarily responsible for the significantly reduced operating cash flows in 2010 compared to 2009. This reduction was partially offset by increased cash flows resulting from an increase in accrued payroll and contract professional pay.
Net cash used in investing activities was $16.6 million during 2010 compared with $13.8 million during 2009. Cash paid for acquisitions was approximately $10.5 million and capital expenditures for information technology projects, leasehold improvements and various property and equipment purchases increased $1.6 million to $6.3 million in 2010. We estimate that capital expenditures for 2011 will be approximately $7.4 million.
Net cash used in financing activities was $16.6 million for 2010, compared with $49.0 million in 2009. During 2010, principal payments of long-term debt were $79.2 million versus $48.0 million paid down during 2009. On December 3, 2010, we replaced our existing credit facility with a new senior secured credit agreement, which consists of a $50.0 million, five-year term loan facility, a $75.0 million, five-year revolving loan facility and a $10.0 million sublimit for letters of credit, as well as the ability to increase the loan facilities for up to an additional $50.0 million, subject to receipt of lender commitments and satisfaction of specified conditions. This resulted in debt amendment costs of $1.9 million that will be amortized over the life of the new loan. Proceeds from the new loan facility were $68.0 million.
Finally, the Board of Directors approved the repurchase of $20.0 million worth of our common stock over a four-year period, of which, 291,212 shares were purchased in November 2010 at a total cost of $2.0 million.
Under terms of the new credit facility, the term loan facility is repayable at the minimum rate of $1.3 million per quarter and we are required to reduce the term loan by up to 50 percent of our excess cash flow based on leverage ratios, as defined by the agreement for each year end over the next five years. We are required to maintain certain financial covenants, including a maximum leverage ratio and a minimum fixed charge coverage ratio. As of December 31, 2010, we were in compliance with all such covenants. Additionally, the agreement, which is secured by substantially all of our assets, provides for certain limitations on our ability to, among other things, incur additional debt, offer loans, declare dividends and incur capital expenditures.
We continue to make progress on enhancements to our front-office and back-office information systems. These enhancements include the consolidation of back-office systems across all corporate functions, as well as enhancements to and broader application of our front-office software across all lines of business. The timing of the full integration of information systems used by VISTA and Oxford will remain a consideration of management.
30
We believe that our working capital as of December 31, 2010, our new credit facility and positive operating cash flows expected from future activities will be sufficient to fund future requirements of our debt repayment obligations, accounts payable and related payroll expenses as well as capital expenditure initiatives for the next twelve months.
Commitments and Contingencies
We lease space for our corporate and branch offices. Rent expense was $8.4 million in 2010, $8.2 million in 2009 and $9.5 million in 2008.
The following table sets forth, on an aggregate basis, at December 31, 2010, the amounts of specified contractual cash obligations required to be paid in the periods shown (in thousands):
|
Contractual Obligations
|
2011
|
2012
|
2013
|
2014
|
2015
|
Thereafter
|
Total
|
||||||||||||||||||||
|
Long-term debt obligations
|
$ | 5,000 | $ | 5,000 | $ | 5,000 | $ | 5,000 | $ | 46,750 | $ | ― | $ | 66,750 | |||||||||||||
|
Operating lease obligations
|
5,260 | 5,242 | 5,692 | 5,925 | 5,129 | 10,366 | 37,614 | ||||||||||||||||||||
|
Total
|
$ | 10,260 | $ | 10,242 | $ | 10,692 | $ | 10,925 | $ | 51,879 | $ | 10,366 | $ | 104,364 | |||||||||||||
For additional information about these contractual cash obligations, see Note 7 to our Consolidated Financial Statements appearing in Part II, Item 8 of this report. Interest payments related to our bank debt are not set forth in the table above.
As of December 31, 2010, included in other current assets is a balance of $0.3 million for claims indemnifiable by the selling shareholders of VISTA, which we anticipate will be settled by the agreement of all applicable parties to the terms and provisions related to such payment in 2011.
We are partially self-insured for our workers' compensation liability related to the Life Sciences, Healthcare and IT and Engineering segments as well as the medical malpractice liability related to the Physician segment. In connection with this program, we pay a base premium plus actual losses incurred up to certain levels and are insured for losses greater than certain levels per occurrence and in the aggregate. The self-insurance claim liability is determined based on claims filed and claims incurred but not yet reported. We account for claims incurred but not yet reported based on estimates derived from historical claims experience and current trends of industry data. Changes in estimates, differences in estimates and actual payments for claims are recognized in the period that the estimates changed or payments were made. The self-insurance claim liability was approximately $10.2 million and $10.3 million at December 31, 2010 and 2009, respectively. Additionally, we have unused stand-by letters of credit outstanding to secure obligations for workers’ compensation claims with various insurance carriers. The unused stand-by letters of credit at December 31, 2010 and 2009 were $2.8 million and $3.8 million, respectively.
As of December 31, 2010 and 2009, we have an income tax reserve in other long-term liabilities related to our uncertain tax positions of $0.3 million.
We are involved in various other legal proceedings, claims and litigation arising in the ordinary course of business. However, based on the facts currently available, we do not believe that the disposition of matters that are pending or asserted will have a material adverse effect on our consolidated financial statements.
Off-Balance Sheet Arrangements
As of December 31, 2010, the Company had no significant off-balance sheet arrangements other than operating leases and unused stand-by letters of credit outstanding.
Accounting Standards Updates
In January 2010, the FASB issued an update to ASC Topic 820,
Fair Value Measurements and Disclosures
(ASC 820), which requires new disclosures for fair value measurements and provides clarification for existing disclosure requirements. More specifically, this update will require (a) an entity to disclose separately the amounts of significant transfers in and out of Levels 1 and 2 fair value measurements and to describe the reasons for the transfers; and (b) information about purchases, sales, issuances and settlements to be presented separately (i.e. present the activity on a gross basis rather than net) in the reconciliation for fair value measurements using significant unobservable inputs (Level 3 inputs). This guidance clarifies existing disclosure requirements for the level of disaggregation used for classes of assets and liabilities measured at fair value and requires disclosures about the valuation techniques and inputs used to measure fair value for both recurring and nonrecurring fair value measurements using Level 2 and Level 3 inputs. The new disclosures and clarifications of existing disclosure are effective for fiscal years beginning after December 15, 2009, except for the disclosure requirements related to the purchases, sales, issuances and settlements in the rollforward activity of Level 3 fair value measurements, which are effective for fiscal years beginning after December 15, 2010. We are in the process of evaluating the impact of this guidance on our consolidated financial statements, which will be effective in the quarter ended March 31, 2011.
31
In September 2009, the FASB issued an update to ASC Topic 605,
Revenue Recognition
, which establishes the criteria for separating consideration in multiple-element arrangements. The updated guidance requires companies allocating the overall consideration to each deliverable to use an estimated selling price of individual deliverables in the arrangement in the absence of vendor-specific evidence or other third-party evidence of the selling price for the deliverables and it also provides additional factors that should be considered when determining whether software in a tangible product is essential to its functionality. We adopted this guidance on January 1, 2011 with no impact to the consolidated financial statements.
In August 2009, the FASB issued an update to ASC 820
on measuring liabilities at fair value. The updated guidance provides clarification that in circumstances in which a quoted market price in an active market for an identical liability is not available, an entity is required to measure fair value using a valuation technique that uses the quoted price of an identical liability when traded as an asset or, if unavailable, quoted prices for similar liabilities or similar assets when traded as assets. If none of this information is available, an entity should use a valuation technique in accordance with existing fair valuation principles. We adopted the measurement requirements of this guidance in the quarter ended December 31, 2010 with no impact on the consolidated financial statements.
Critical Accounting Policies
Our accounting policies are described in Note 1 of the Notes to Consolidated Financial Statements in Part II, Item 8 of this report. We prepare our financial statements in conformity with accounting principles generally accepted in the United States, which require us to make estimates and assumptions that affect the reported amounts of assets and liabilities and disclosures of contingent assets and liabilities at the date of the financial statements and the reported amounts of revenues and expenses during the year. Actual results could differ from those estimates. We consider the following policies to be most critical in understanding the judgments that are involved in preparing our financial statements and the uncertainties that could impact our results of operations, financial condition and cash flows.
Allowance for Doubtful Accounts and Billing Adjustments.
We estimate an allowance for doubtful accounts as well as an allowance for billing adjustments related to trade receivables based on our analysis of historical collection and adjustment experience. We apply actual collection and adjustment percentages to the outstanding accounts receivable balances at the end of the period. Impaired receivables, or portions thereof, are charged off when deemed uncollectible. If we experience a significant change in collections or billing adjustment experience, our estimates of the recoverability of accounts receivable could change by a material amount.
Workers’ Compensation and Medical Malpractice Loss Reserves.
We are partially self-insured for our workers’ compensation liability related to the Life Sciences, Healthcare and IT and Engineering segments as well as our medical malpractice liability in relation to the Physician segment. In connection with these programs, we pay a base premium plus actual losses incurred, not to exceed certain stop-loss limits. We are insured for losses above these limits, both per occurrence and in the aggregate. The self-insurance claim liability is determined based on claims filed and claims incurred but not reported. We account for claims incurred but not yet reported based on estimates derived from historical claims experience and current trends of industry data. Changes in estimates and differences in estimates and actual payments for claims are recognized in the period that the estimates changed or the payments were made.
Contingencies.
We record an estimated loss from a loss contingency when information available prior to issuance of our financial statements indicates it is probable that an asset has been impaired or a liability has been incurred at the date of the financial statements, and the amount of the loss can be reasonably estimated. Accounting for contingencies, such as legal settlements, workers’ compensation matters and medical malpractice insurance matters, requires us to use our judgment. While we believe that our accruals for these matters are adequate, if the actual loss from a loss contingency is significantly different than the estimated loss, results of operations may be over or understated.
Income taxes.
We account for income taxes under the asset and liability method. Deferred tax assets and liabilities are recognized for the future tax consequences attributable to differences between the financial statement carrying amounts of existing assets and liabilities and their respective tax bases. Deferred tax assets and liabilities are measured using enacted tax rates expected to apply to taxable income in the years in which those temporary differences are expected to be recovered or settled. The effect on deferred tax assets and liabilities of a change in tax rates is recognized in income in the period that includes the enactment date. Deferred tax assets are reduced by a valuation allowance if it is more likely than not that a portion of the deferred tax asset will not be realized.
32
We make a comprehensive review of our uncertain tax positions regularly. In this regard, an uncertain tax position represents our expected treatment of a tax position taken in a filed return, or planned to be taken in a future tax return or claim that has not been reflected in measuring income tax expense for financial reporting purposes. In general, until these positions are sustained by the taxing authorities or statutes expire for the year that the position was taken, we do not recognize the tax benefits resulting from such positions and report the tax effects as a liability for uncertain tax positions in our consolidated balance sheets.
Goodwill and Identifiable Intangible Assets.
Goodwill and other intangible assets having an indefinite useful life are not amortized for financial statement purposes. Goodwill and intangible assets with indefinite lives are reviewed for impairment on an annual basis as of December 31, and whenever events or changes in circumstances indicate that the carrying amount may not be recoverable.
Intangible assets with indefinite lives consist of trademarks. In order to test the trademarks for impairment, we determine the fair value of the trademarks and compare such amount to its carrying value. We determine the fair value of the trademarks using a projected discounted cash flow analysis based on the relief-from-royalty approach. The principal factors used in the discounted cash flow analysis requiring judgment are projected net sales, discount rate, royalty rate and terminal value assumption. The royalty rate used in the analysis is based on transactions that have occurred in our industry. Intangible assets having finite lives are amortized over their useful lives and are reviewed to ensure that no conditions exist indicating the recorded amount is not recoverable from future undiscounted cash flows.
Goodwill is tested for impairment using a two-step process that begins with an estimation of the fair value of a reporting unit. This first step is a screen for impairment and compares the fair value of a reporting unit to its carrying value. We determine the fair value based upon discounted cash flows prepared for each reporting unit. Cash flows are developed for each reporting unit based on assumptions including revenue growth expectations, gross margins, operating expense projections, working capital, capital expense requirements and tax rates. The multi-year financial forecasts for each reporting unit used in the cash flow models considered several key business drivers such as new product lines, historical performance and industry and economic trends, among other considerations. The second step measures the amount of impairment by comparing the fair value of the impacted reporting unit’s goodwill with the carrying value of that goodwill. The fair value of goodwill was determined in the same manner utilized to estimate the amount of goodwill recognized in a business combination. As part of the second step, we calculated the fair value of certain assets including tradenames, staffing databases and customer relationships. To determine the fair value of goodwill, fair values were allocated to the assets and liabilities of the reporting unit which failed the first step. The fair value of goodwill was measured as the excess of the fair value of the reporting unit over the amounts assigned to its assets and liabilities. The impairment loss was measured by the amount the carrying value of goodwill exceeded the fair value of goodwill.
The principal factors used in the discounted cash flow analysis requiring judgment are the projected results of operations, discount rate, and terminal value assumptions. The discount rate is determined using the weighted average cost of capital (WACC). The WACC takes into account the relative weights of each component of an average market participant’s capital structure (equity and debt). It also considers our risk-free rate of return, equity market risk premium, beta and size premium adjustment. A single discount rate is utilized across each reporting unit since we do not believe that there would be significant differences by reporting unit. Additionally, the selection of the discount rate accounts for any uncertainties in the forecasts. The terminal value assumptions are applied subsequent to the tenth year of the discounted cash flow model.
For purposes of establishing inputs for the estimated fair value calculations described above, we applied annual revenue growth rates based on the then current economic and market conditions and a terminal growth rate of 4.0 percent. These growth factors were applied to each reporting unit for the purpose of projecting future cash flows. The cash flows as of December 31, 2009 were discounted at a rate of approximately 16.9 percent. We performed a review of market-based data to perform the step one analysis as part of our annual impairment test. The market data review included a comparable trading multiple analysis based on public company competitors in the staffing industry. The market analysis was performed on a consolidated basis to assess the reasonableness of the results of the discounted cash flow analysis. The market analysis was performed on a consolidated basis because we did not believe that there were direct competitors with publicly available financial data that were comparable to each of our reporting units. Based on this analysis, the fair value determination based on the discounted cash flow model was determined to be reasonable in comparison to the fair values derived from these other valuation methods. Except as noted, no other impairment of goodwill or intangible assets with indefinite lives was determined to exist as of December 31, 2010, 2009 and 2008.
We performed the step one analyses for each reporting unit as of December 31, 2010 as this is our annual impairment test date. We noted no impairment for any of the reporting units as of December 31, 2010, except for the Nurse Travel reporting unit. The discount rate that was used was 14.0 percent. We performed a review of market-based data to perform the step one analysis as part of our annual impairment test. The market data review included a comparable trading multiple analysis based on public company competitors in the staffing industry. The market analysis was performed on a consolidated basis to assess the reasonableness of the results of the discounted cash flow analysis. Based on this analysis, the fair value determination based on the discounted cash flow model was determined to be reasonable in comparison to the fair values derived from these other valuation methods.
33
We determined in the step one analysis that the fair value of the Nurse Travel reporting unit was lower than its carrying value. While we began to experience growth in the Nurse Travel business during the fourth quarter, the decrease in the value was due to lowered growth expectations in the later years due to uncertainty regarding the timing of the recovery of the Nurse Travel industry. In addition, we performed a market-based analysis for the Nurse Travel reporting unit, which included a comparable trading multiple analysis based on public company competitors in the staffing industry. This analysis arrived at a fair value comparable with the fair value derived from the discounted cash flow model and further supported the impairment of goodwill. We recognized a goodwill impairment charge of $15.4 million in the fourth quarter of 2010.
The Physician reporting unit’s revenues met the forecasted amounts in the fourth quarter of 2010 and revenue is forecasted to stabilize the first half of 2011 for the Physician reporting unit and revenue growth rates in the years beginning 2012 reflect a recovery from the recession. The revenue growth rates are within the range of historical growth rates we have previously experienced during economic recoveries. In addition, we performed a market-based analysis for the Physician reporting unit, which included a comparable trading multiple analysis based on public company competitors in the staffing industry. We averaged the results of discounted cash flow model and the market-analysis which showed no indicator of impairment for the Physician reporting unit. As of December 31, 2010, the Physician reporting unit represented 18.6 percent of our $199.7 million goodwill balance and the estimated fair value of the reporting unit as determined by the average of the discounted cash flow analysis and the market-based analysis exceeded the carrying value by 54.5 percent.
The discounted cash flows and the resulting fair value estimates of our reporting units are highly sensitive to changes in other assumptions which include an increase of less than 300 basis points in the discount rate and/or a less than 22.0 percent decline in the cash flow projections of a reporting unit could cause the fair value of certain significant reporting units to be below their carrying value. Additionally, we have assumed that there will be an economic recovery at the beginning of 2012 for the Physician reporting unit. Changes in the timing of the recovery and the impact on our operations and costs may also affect the sensitivity of the projections including achieving future cost savings resulting from initiatives which contemplate further synergies from system and operational improvements in infrastructure and field support which were included in our forecasts. Ultimately, future changes in these assumptions may impact the estimated fair value of a reporting unit and cause the fair value of the reporting unit to be below its carrying value, which would require a step two analysis and may result in impairment of goodwill.
Due to the many variables inherent in the estimation of a business’s fair value and the relative size of recorded goodwill, changes in assumptions may have a material effect on the results of our impairment analysis. Downward revisions of our forecasts, extended delays in the economic recovery, or a sustained decline of our stock price resulting in market capitalization significantly below book value could lead to an impairment of goodwill or intangible assets with indefinite lives in future periods.
Impairment or Disposal of Long-Lived Assets.
We evaluate long-lived assets, other than goodwill and identifiable intangible assets with indefinite lives, for impairment whenever events or changes in circumstances indicate that the carrying value of an asset may not be recoverable. An impairment loss is recognized when the sum of the undiscounted future cash flows is less than the carrying amount of the asset, in which case a write-down is recorded to reduce the related asset to its estimated fair value. There was no impairment of long-lived assets as of December 31, 2010, 2009 or 2008.
Business Combinations
.
The purchase price of an acquisition is allocated to the underlying assets acquired and liabilities assumed based upon their estimated fair values at the date of acquisition. To the extent the purchase price exceeds the fair value of the net identifiable tangible and intangible assets acquired and liabilities assumed, such excess is allocated to goodwill. We determine the estimated fair values after review and consideration of relevant information including discounted cash flows, quoted market prices and estimates made by management. Accordingly, these can be affected by contract performance and other factors over time, which may cause final amounts to differ materially from original estimates. We adjust the preliminary purchase price allocation, as necessary, up to one year after the acquisition closing date if we obtain more information regarding asset valuations and liabilities assumed.
Goodwill acquired in business combinations is assigned to the reporting unit(s) expected to benefit from the combination as of the acquisition date. Acquisition related costs are recognized separately from the acquisition and are expensed as incurred.
Stock-Based Compensation.
We record compensation expense for restricted stock awards and stock units based on the fair market value of the awards on the date of grant. Market-based awards, which are based on achievement of targets indexed to our share price, are valued using a Monte Carlo simulation model. Compensation expense for performance-based awards is measured based on the amount of shares ultimately expected to vest, estimated at each reporting date based on management’s expectations regarding the relevant performance criteria. We account for stock options granted and ESPP shares based on an estimated fair market value using a Black-
Scholes option valuation model. This methodology requires the use of subjective assumptions, including expected stock price volatility and the estimated life of each award. The fair value of equity-based compensation awards less the estimated forfeitures is amortized over the service period of the award.
We are exposed to certain market risks arising from transactions in the normal course of business, principally risks associated with foreign currency fluctuations and interest rates. We are exposed to foreign currency risk from the translation of foreign operations into U.S. dollars. Based on the relative size and nature of our foreign operations, we do not believe that a ten percent change in the value of foreign currencies relative to the U.S. dollar would have a material impact on our financial statements.
34
Our primary exposure to market risk is interest rate risk associated with our debt instruments. See “Item 7. Management’s Discussion and Analysis of Financial Condition and Results of Operations” for further description of our debt instruments. The interest rate swap that we entered into with a financial institution on May 2, 2007 expired as of June 30, 2009 in accordance with the terms of the agreement. Prior to the expiration of the interest rate swap on June 30, 2009, the Company entered into a one-year interest rate cap contract effective July 1, 2009, in order to mitigate the interest rate risk as required by the prior credit facility agreement. The interest rate cap contract was for a notional amount of $51.0 million with a one-month LIBOR cap of 3.0 percent. The interest rate cap agreement expired on July 1, 2010. Prior to its expiration, the interest rate cap contract had the effect of capping the effective one month LIBOR rate at 3.0 percent. Following the expiration of the interest rate cap agreement, the fair value of the long-term debt effectively became subject to market interest rate volatility until such time that the credit facility was replaced with a new senior secured credit agreement on December 3, 2010.
Under our new credit agreement and as of December 31, 2010, we had $66.8 million in principal amount of variable-rate long-term debt outstanding, with a fair value of $66.8 million based on the fact that the debt agreement had only been in place for twenty-nine days. Given the limited time outstanding during the last part of the year, it has been determined that the carrying value of the debt approximates its fair value. We have the option to determine the variable interest rate as the Eurodollar rate or the base rate (which is the highest of the bank’s prime rate, one-half of 1.0 percent in excess of the overnight federal funds rate, and 1.0 percent in excess of the one-month Eurodollar rate), plus in each case, an applicable margin. Additionally, the new credit agreement required that we enter into, and maintain for at least three years, an interest rate hedge by March 2, 2011. Accordingly, we entered into an interest rate swap agreement on February 18, 2011, which is outlined more fully in this report in Note 14 to the Consolidated Financial Statements in Part II, Item 8.
Excluding the effect of our interest rate swap agreement, a hypothetical 1.0 percent change in interest rates on variable rate debt would have resulted in interest expense fluctuating approximately $0.7 million based on $66.8 million of debt outstanding for any twelve month period. Including the effect of our interest rate swap agreement, a 1.0 percent change in interest rates on variable debt would have resulted in interest expense fluctuating approximately $0.7 million based on $66.8 million of debt outstanding for any twelve month period.
We have not entered into any market risk sensitive instruments for trading purposes.
35
REPORT OF INDEPENDENT REGISTERED PUBLIC ACCOUNTING FIRM
To the Board of Directors and Stockholders of On Assignment, Inc.
Calabasas, California
We have audited the accompanying consolidated balance sheets of On Assignment, Inc. and subsidiaries (the "Company") as of December 31, 2010 and 2009, and the related consolidated statements of operations and comprehensive income, stockholders' equity, and cash flows for each of the three years in the period ended December 31, 2010. Our audits also included the financial statement schedule listed in the Index at Item 15. These financial statements and financial statement schedule are the responsibility of the Company's management. Our responsibility is to express an opinion on these financial statements and financial statement schedule based on our audits.
We conducted our audits in accordance with the standards of the Public Company Accounting Oversight Board (United States). Those standards require that we plan and perform the audit to obtain reasonable assurance about whether the financial statements are free of material misstatement. An audit includes examining, on a test basis, evidence supporting the amounts and disclosures in the financial statements. An audit also includes assessing the accounting principles used and significant estimates made by management, as well as evaluating the overall financial statement presentation. We believe that our audits provide a reasonable basis for our opinion.
In our opinion, such consolidated financial statements present fairly, in all material respects, the financial position of On Assignment, Inc. and subsidiaries as of December 31, 2010 and 2009, and the results of their operations and their cash flows for each of the three years in the period ended December 31, 2010, in conformity with accounting principles generally accepted in the United States of America. Also, in our opinion, such financial statement schedule, when considered in relation to the basic consolidated financial statements taken as a whole, presents fairly, in all material respects, the information set forth therein.
We have also audited, in accordance with the standards of the Public Company Accounting Oversight Board (United States), the Company's internal control over financial reporting as of December 31, 2010, based on the criteria established in
Internal Control—Integrated Framework
issued by the Committee of Sponsoring Organizations of the Treadway Commission and our report dated March 16, 2011 expressed an unqualified opinion on the Company's internal control over financial reporting.
/s/
Deloitte & Touche LLP
Los Angeles, California
March 16, 2011
36
ON ASSIGNMENT, INC. AND SUBSIDIARIES
CONSOLIDATED BALANCE SHEETS
(In thousands, except share and per share data)
|
December 31,
|
|||||||
|
2010
|
2009
|
||||||
|
ASSETS
|
|||||||
|
Current Assets:
|
|||||||
|
Cash and cash equivalents
|
$ | 18,409 | $ | 25,974 | |||
|
Accounts receivable, net of allowance for doubtful accounts and billing adjustments of $2,175 and $1,949, respectively
|
62,518 | 50,173 | |||||
|
Advances and deposits
|
480 | 163 | |||||
|
Prepaid expenses
|
3,555 | 3,445 | |||||
|
Prepaid income taxes
|
494 | 4,717 | |||||
|
Deferred income tax assets
|
8,784 | 7,507 | |||||
|
Other
|
1,406 | 2,213 | |||||
|
Total current assets
|
95,646 | 94,192 | |||||
|
Property and equipment, net
|
15,818 | 15,618 | |||||
|
Goodwill
|
199,720 | 202,814 | |||||
|
Identifiable intangible assets, net
|
25,170 | 25,523 | |||||
|
Other long-term assets
|
4,762 | 5,315 | |||||
|
Total Assets
|
$ | 341,116 | $ | 343,462 | |||
|
LIABILITIES AND STOCKHOLDERS’ EQUITY
|
|||||||
|
Current Liabilities:
|
|||||||
|
Current portion of long-term debt
|
$ | 5,000 | $ | — | |||
|
Accounts payable
|
5,392 | 4,164 | |||||
|
Accrued payroll and contract professional pay
|
15,727 | 11,625 | |||||
|
Deferred compensation
|
2,198 | 2,070 | |||||
|
Workers’ compensation and medical malpractice loss reserves
|
10,244 | 10,349 | |||||
|
Income taxes payable
|
1,496 | — | |||||
|
Other
|
4,993 | 3,746 | |||||
|
Total current liabilities
|
45,050 | 31,954 | |||||
|
Deferred income tax liabilities
|
10,156 | 5,697 | |||||
|
Long-term debt
|
61,750 | 77,913 | |||||
|
Accrued earn-out
|
2,900 | — | |||||
|
Other long-term liabilities
|
1,773 | 1,237 | |||||
|
Total liabilities
|
121,629 | 116,801 | |||||
|
Commitments and Contingencies (Note 7)
|
|||||||
|
Stockholders’ Equity:
|
|||||||
|
Preferred Stock, $0.01 par value, 1,000,000 shares authorized, no shares issued
|
— | — | |||||
|
Common Stock, $0.01 par value, 75,000,000 shares authorized, 36,398,811 and 36,262,810 issued, respectively
|
365 | 363 | |||||
|
Paid-in capital
|
224,139 | 220,082 | |||||
|
Retained earnings (accumulated deficit)
|
(5,021 | ) | 5,090 | ||||
|
Accumulated other comprehensive income
|
4 | 1,126 | |||||
|
Total stockholders’ equity
|
219,487 | 226,661 | |||||
|
Total Liabilities and Stockholders’ Equity
|
$ | 341,116 | $ | 343,462 | |||
See notes to consolidated financial statements.
37
ON ASSIGNMENT, INC. AND SUBSIDIARIES
CONSOLIDATED STATEMENTS OF OPERATIONS AND COMPREHENSIVE INCOME (LOSS)
(In thousands, except per share data)
|
Year Ended December 31,
|
||||||||||||
|
2010
|
2009
|
2008
|
||||||||||
|
Revenues
|
$ | 438,065 | $ | 416,613 | $ | 618,058 | ||||||
|
Cost of services
|
288,609 | 280,245 | 418,602 | |||||||||
|
Gross profit
|
149,456 | 136,368 | 199,456 | |||||||||
|
Selling, general and administrative expenses
|
130,830 | 121,141 | 155,942 | |||||||||
|
Impairment of goodwill
|
15,399 | - | - | |||||||||
|
Operating income
|
3,227 | 15,227 | 43,514 | |||||||||
|
Interest expense
|
(8,309 | ) | (6,612 | ) | (9,998 | ) | ||||||
|
Interest income
|
141 | 170 | 715 | |||||||||
|
Income (loss) before income taxes
|
(4,941 | ) | 8,785 | 34,231 | ||||||||
|
Provision for income taxes
|
4,956 | 4,078 | 15,261 | |||||||||
|
Net income (loss)
|
$ | (9,897 | ) | $ | 4,707 | $ | 18,970 | |||||
|
Earnings (loss) per share:
|
||||||||||||
|
Basic
|
$ | (0.27 | ) | $ | 0.13 | $ | 0.53 | |||||
|
Diluted
|
$ | (0.27 | ) | $ | 0.13 | $ | 0.53 | |||||
|
Number of shares and share equivalents used to calculate earnings (loss) per share:
|
||||||||||||
|
Basic
|
36,429 | 36,011 | 35,487 | |||||||||
|
Diluted
|
36,429 | 36,335 | 35,858 | |||||||||
|
Reconciliation of net income (loss) to comprehensive income (loss):
|
||||||||||||
|
Net income (loss)
|
$ | (9,897 | ) | $ | 4,707 | $ | 18,970 | |||||
|
Foreign currency translation adjustment
|
(1,122 | ) | 326 | (1,390 | ) | |||||||
|
Comprehensive income (loss)
|
$ | (11,019 | ) | $ | 5,033 | $ | 17,580 | |||||
See notes to consolidated financial statements.
38
ON ASSIGNMENT, INC. AND SUBSIDIARIES
CONSOLIDATED STATEMENTS OF STOCKHOLDERS’ EQUITY
(In thousands, except share data)
|
Common Stock
|
Paid-in Capital
|
Retained Earnings (Accumulated Deficit)
|
Accumulated Other Comprehensive Income
|
Treasury Stock
|
Total
|
|||||||||||||||||||||||||||
|
Shares
|
Amount
|
Shares
|
Amount
|
|||||||||||||||||||||||||||||
|
Balance at January 1, 2008
|
38,216,421 | $ | 382 | $ | 219,217 | $ | (2,755 | ) | $ | 2,190 | (3,038,938 | ) | $ | (26,000 | ) | $ | 193,034 | |||||||||||||||
|
Exercise of common stock options
|
98,187 | 1 | 482 | — | — | — | — | 483 | ||||||||||||||||||||||||
|
Employee stock purchase plan
|
315,827 | 3 | 1,576 | — | — | — | — | 1,579 | ||||||||||||||||||||||||
|
Stock-based compensation expense
|
— | — | 6,288 | — | — | — | — | 6,288 | ||||||||||||||||||||||||
|
Vesting of restricted stock units and restricted stock awards
|
186,409 | 2 | (2 | ) | — | — | (58,426 | ) | (411 | ) | (411 | ) | ||||||||||||||||||||
|
Tax deficiency from stock-based compensation
|
— | — | (39 | ) | — | — | — | — | (39 | ) | ||||||||||||||||||||||
|
Translation adjustments
|
— | — | — | — | (1,390 | ) | — | — | (1,390 | ) | ||||||||||||||||||||||
|
Net income
|
— | — | — | 18,970 | — | — | — | 18,970 | ||||||||||||||||||||||||
|
Balance at December 31, 2008
|
38,816,844 | 388 | 227,522 | 16,215 | 800 | (3,097,364 | ) | (26,411 | ) | 218,514 | ||||||||||||||||||||||
|
Exercise of common stock options
|
17,925 | — | 98 | — | — | — | — | 98 | ||||||||||||||||||||||||
|
Employee stock purchase plan
|
227,784 | 2 | 455 | — | — | — | — | 457 | ||||||||||||||||||||||||
|
Stock-based compensation expense
|
— | — | 5,015 | — | — | — | — | 5,015 | ||||||||||||||||||||||||
|
Vesting of restricted stock units and restricted stock awards
|
297,621 | 3 | (1,073 | ) | — | — | — | — | (1,070 | ) | ||||||||||||||||||||||
|
Tax deficiency from stock-based compensation
|
— | — | (1,386 | ) | — | — | — | — | (1,386 | ) | ||||||||||||||||||||||
|
Retirement of treasury stock
|
(3,097,364 | ) | (30 | ) | (10,549 | ) | (15,832 | ) | — | 3,097,364 | 26,411 | — | ||||||||||||||||||||
|
Translation adjustments
|
— | — | — | — | 326 | — | — | 326 | ||||||||||||||||||||||||
|
Net income
|
— | — | — | 4,707 | — | — | — | 4,707 | ||||||||||||||||||||||||
|
Balance at December 31, 2009
|
36,262,810 | 363 | 220,082 | 5,090 | 1,126 | — | — | 226,661 | ||||||||||||||||||||||||
|
Exercise of common stock options
|
68,200 | 1 | 332 | — | — | — | — | 333 | ||||||||||||||||||||||||
|
Stock repurchase and retirement of shares
|
(291,212 | ) | (3 | ) | (1,783 | ) | (214 | ) | — | — | — | (2,000 | ) | |||||||||||||||||||
|
Stock-based compensation expense
|
— | — | 7,151 | — | — | — | — | 7,151 | ||||||||||||||||||||||||
|
Vesting of restricted stock units and restricted stock awards
|
359,013 | 4 | (1,309 | ) | — | — | — | — | (1,305 | ) | ||||||||||||||||||||||
|
Tax deficiency from stock-based compensation
|
— | — | (334 | ) | — | — | — | — | (334 | ) | ||||||||||||||||||||||
|
Translation adjustments
|
— | — | — | — | (1,122 | ) | — | — | (1,122 | ) | ||||||||||||||||||||||
|
Net loss
|
— | — | — | (9,897 | ) | — | — | — | (9,897 | ) | ||||||||||||||||||||||
|
Balance at December 31, 2010
|
36,398,811 | $ | 365 | $ | 224,139 | $ | (5,021 | ) | $ | 4 | — | $ | — | $ | 219,487 | |||||||||||||||||
See notes to consolidated financial statements.
39
ON ASSIGNMENT, INC. AND SUBSIDIARIES
CONSOLIDATED STATEMENTS OF CASH FLOWS
(In thousands)
|
Year Ended December 31,
|
||||||||||||
|
2010
|
2009
|
2008
|
||||||||||
|
Cash Flows from Operating Activities:
|
||||||||||||
|
Net income (loss)
|
$ | (9,897 | ) | $ | 4,707 | $ | 18,970 | |||||
|
Adjustments to reconcile net income (loss) to net cash provided by operating activities:
|
||||||||||||
|
Depreciation
|
5,881 | 5,731 | 5,106 | |||||||||
|
Amortization of intangible assets
|
2,115 | 6,075 | 9,436 | |||||||||
|
Provision for doubtful accounts and billing adjustments
|
644 | 296 | 641 | |||||||||
|
Deferred income tax provision
|
2,274 | 4,287 | 9 | |||||||||
|
Stock-based compensation
|
7,749 | 5,007 | 6,349 | |||||||||
|
Amortization of deferred loan costs
|
961 | 894 | 591 | |||||||||
|
Write-down of deferred loan costs
|
2,208 | — | — | |||||||||
|
Change in fair value of interest rate swap
|
— | (1,345 | ) | 139 | ||||||||
|
(Gain) loss on officers’ life insurance policies
|
(212 | ) | (478 | ) | 851 | |||||||
|
Gross excess tax benefits from stock-based compensation
|
(205 | ) | (34 | ) | (327 | ) | ||||||
|
Impairment of goodwill
|
15,399 | — | — | |||||||||
|
(Gain) loss on disposal of property and equipment
|
(3 | ) | (246 | ) | 112 | |||||||
|
Workers’ compensation and medical malpractice provision
|
4,310 | 4,283 | 5,384 | |||||||||
|
Changes in operating assets and liabilities, net of effect of acquisitions:
|
||||||||||||
|
Accounts receivable
|
(10,532 | ) | 28,024 | (1,142 | ) | |||||||
|
Prepaid expenses
|
(501 | ) | 1,076 | (411 | ) | |||||||
|
Prepaid income taxes
|
4,223 | (958 | ) | (4,802 | ) | |||||||
|
Accounts payable
|
1,032 | (695 | ) | (809 | ) | |||||||
|
Accrued payroll and contract professional pay
|
3,880 | (9,017 | ) | 877 | ||||||||
|
Income taxes payable
|
856 | — | — | |||||||||
|
Deferred compensation
|
128 | 460 | (427 | ) | ||||||||
|
Workers’ compensation and medical malpractice loss reserves
|
(3,948 | ) | (3,688 | ) | (4,551 | ) | ||||||
|
Other
|
499 | (2,366 | ) | (638 | ) | |||||||
|
Net cash provided by operating activities
|
26,861 | 42,013 | 35,358 | |||||||||
|
Cash Flows from Investing Activities:
|
||||||||||||
|
Purchase of property and equipment
|
(6,302 | ) | (4,673 | ) | (8,201 | ) | ||||||
|
Net cash paid for acquisitions
|
(10,458 | ) | (10,239 | ) | (9,013 | ) | ||||||
|
Proceeds from insurance settlements
|
42 | 512 | — | |||||||||
|
Other
|
137 | 572 | (499 | ) | ||||||||
|
Net cash used in investing activities
|
(16,581 | ) | (13,828 | ) | (17,713 | ) | ||||||
|
Cash Flows from Financing Activities
:
|
||||||||||||
|
Principal payments of long-term debt
|
(79,163 | ) | (48,000 | ) | (10,000 | ) | ||||||
|
Proceeds from term loan and credit facility
|
68,000 | — | — | |||||||||
|
Proceeds from stock transactions
|
333 | 555 | 2,064 | |||||||||
|
Payment of employment taxes related to release of restricted stock awards
|
(1,955 | ) | (325 | ) | (411 | ) | ||||||
|
Gross excess tax benefits from stock-based compensation
|
205 | 34 | 327 | |||||||||
|
Repurchase of Common Stock
|
(2,000 | ) | — | — | ||||||||
|
Debt issuance or amendment costs
|
(1,938 | ) | (1,065 | ) | — | |||||||
|
Payments of other long-term liabilities
|
(52 | ) | (156 | ) | (383 | ) | ||||||
|
Other
|
(44 | ) | — | — | ||||||||
|
Net cash used in financing activities
|
(16,614 | ) | (48,957 | ) | (8,403 | ) | ||||||
|
Effect of exchange rate changes on cash and cash equivalents
|
(1,231 | ) | 475 | (735 | ) | |||||||
|
Net Increase (Decrease) in Cash and Cash Equivalents
|
(7,565 | ) | (20,297 | ) | 8,507 | |||||||
|
Cash and Cash Equivalents at Beginning of Year
|
25,974 | 46,271 | 37,764 | |||||||||
|
Cash and Cash Equivalents at End of Year
|
$ | 18,409 | $ | 25,974 | $ | 46,271 | ||||||
40
ON ASSIGNMENT, INC.
CONSOLIDATED STATEMENTS OF CASH FLOWS (continued)
|
Year Ended December 31,
|
|||||||||||
|
2010
|
2009
|
2008
|
|||||||||
|
Supplemental Disclosure of Cash Flow Information
|
|||||||||||
|
Cash paid (refunds received) for:
|
|||||||||||
|
Income taxes, net of refunds
|
$ | (2,578 | ) | $ | 1,230 | $ | 20,255 | ||||
|
Interest
|
$ | 5,478 | $ | 8,564 | $ | 9,370 | |||||
|
Acquisitions:
|
|||||||||||
|
Goodwill
|
$ | 10,458 | $ | — | $ | 9,013 | |||||
|
Intangible assets acquired
|
1,761 | 170 | — | ||||||||
|
Net tangible assets acquired
|
— | 44 | — | ||||||||
|
Fair value of assets acquired, net of cash received
|
$ | 12,219 | $ | 214 | $ | 9,013 | |||||
|
Supplemental Disclosure of Non-Cash Transactions
|
|||||||||||
|
Payable for employment taxes withheld related to release of restricted stock awards
|
$ | 96 | $ | 745 | $ | — | |||||
|
Accrued earn-out payments and escrow claim receivable
|
$ | 3,700 | $ | — | $ | 8,766 | |||||
|
Acquisition through notes payable
|
$ | — | $ | 143 | $ | — | |||||
|
Acquisition of property and equipment through accounts payable
|
$ | 383 | $ | 555 | $ | 1,251 | |||||
See notes to consolidated financial statements.
41
ON ASSIGNMENT, INC. AND SUBSIDIARIES
NOTES TO CONSOLIDATED FINANCIAL STATEMENTS
1. Summary of Significant Accounting Policies.
Principles of Consolidation.
The consolidated financial statements include the accounts of the Company and its wholly-owned domestic and foreign subsidiaries. All intercompany accounts and transactions have been eliminated.
Cash and Cash Equivalents.
The Company considers all highly liquid investments with a maturity of three months or less on the date of purchase to be cash equivalents.
Accounts Receivable.
The Company estimates an allowance for doubtful accounts and an allowance for billing adjustments related to trade receivables based on an analysis of historical collection and billing adjustment experience. The Company applies actual historical collection and adjustment percentages to the outstanding accounts receivable balances at the end of the period. Impaired receivables, or portions thereof, are charged off when deemed uncollectible. If the Company experiences a significant change in collections or billing adjustment experience, the estimates of the recoverability of accounts receivable could change by a material amount.
Property and Equipment.
Property and equipment are stated at cost. Depreciation and amortization are provided using the straight-line method over the estimated useful lives of the related assets, generally three to five years. Leasehold improvements are amortized over the shorter of the life of the related asset or the life of the lease. Costs associated with customized internal-use software systems that have reached the application stage and meet recoverability tests are capitalized. Such capitalized costs include external direct costs utilized in developing or obtaining the applications and payroll and payroll-related expenses for employees who are directly associated with the applications.
Goodwill and Identifiable Intangible Assets.
Goodwill and other intangible assets having an indefinite useful life are not amortized for financial statement purposes. Goodwill and intangible assets with indefinite lives are reviewed for impairment on an annual basis as of December 31, and whenever events or changes in circumstances indicate that the carrying amount may not be recoverable.
Intangible assets with indefinite lives consist of trademarks. In order to test the trademarks for impairment, the Company determines the fair value of the trademarks and compares such amount to its carrying value. The Company determines the fair value of the trademarks using a projected discounted cash flow analysis based on the relief-from-royalty approach. The principal factors used in the discounted cash flow analysis requiring judgment are projected net sales, discount rate, royalty rate and terminal value assumption. The royalty rate used in the analysis is based on transactions that have occurred in the Company’s industry. Intangible assets having finite lives are amortized over their useful lives and are reviewed to ensure that no conditions exist indicating the recorded amount is not recoverable from future undiscounted cash flows.
Goodwill is tested for impairment using a two-step process that begins with an estimation of the fair value of a reporting unit. This first step is a screen for impairment and compares the fair value of a reporting unit to its carrying value. The Company determines the fair value based upon discounted cash flows prepared for each reporting unit and uses a market-based analysis as appropriate. Cash flows are developed for each reporting unit based on assumptions including revenue growth expectations, gross margins, operating expense projections, working capital, capital expense requirements and tax rates. The multi-year financial forecasts for each reporting unit used in the cash flow models considered several key business drivers such as new product lines, historical performance and industry and economic trends, among other considerations. The second step measures the amount of impairment by comparing the fair value of the impacted reporting unit’s goodwill with the carrying value of that goodwill. The fair value of goodwill was determined in the same manner utilized to estimate the amount of goodwill recognized in a business combination. As part of the second step, the Company calculated the fair value of certain assets including tradenames, staffing databases and customer relationships. To determine the fair value of goodwill, fair values were allocated to the assets and liabilities of the reporting unit which failed the first step. The fair value of goodwill was measured as the excess of the fair value of the reporting unit over the amounts assigned to its assets and liabilities. The impairment loss was measured by the amount the carrying value of goodwill exceeded the fair value of goodwill.
42
The principal factors used in the discounted cash flow analysis requiring judgment are the projected results of operations, discount rate, and terminal value assumptions. The discount rate is determined using the weighted average cost of capital (WACC). The WACC takes into account the relative weights of each component of an average market participant’s capital structure (equity and debt). It also considers our risk-free rate of return, equity market risk premium, beta and size premium adjustment. A single discount rate is utilized across each reporting unit since the Company does not believe that there would be significant differences by reporting unit. Additionally, the selection of the discount rate accounts for any uncertainties in the forecasts. The terminal value assumptions are applied subsequent to the tenth year of the discounted cash flow model.
The Company performed the step one analyses for each reporting unit as of December 31, 2010 as this is the annual impairment test date. The Company noted no impairment for any of the reporting units as of December 31, 2010, except for the Nurse Travel reporting unit. The discount rate that was used was 14.0 percent. The Company performed a review of market-based data to perform the step one analysis as part of its annual impairment test. The market data review included a comparable trading multiple analysis based on public company competitors in the staffing industry. The market analysis was performed on a consolidated basis to assess the reasonableness of the results of the discounted cash flow analysis. Based on this analysis, the fair value determination based on the discounted cash flow model was determined to be reasonable in comparison to the fair values derived from these other valuation methods.
The Company determined in the step one analysis that the fair value of the Nurse Travel reporting unit was lower than the carrying value. While the Company began to experience growth in the Nurse Travel business during the fourth quarter, the decrease in the value was due to lowered growth expectations in the later years due to uncertainty regarding the timing of the recovery of the Nurse Travel industry. In addition, the Company performed a market-based analysis for the Nurse Travel reporting unit, which included a comparable trading multiple analysis based on public company competitors in the staffing industry. This analysis arrived at a fair value comparable with the fair value derived from the discounted cash flow model and further supported the impairment of goodwill. The Company recognized a goodwill impairment charge of $15.4 million in the fourth quarter of 2010.
Impairment of Long-Lived Assets.
The Company evaluates long-lived assets, other than goodwill and identifiable intangible assets with indefinite lives, for impairment whenever events or changes in circumstances indicate that the carrying value of an asset may not be recoverable. An impairment loss is recognized when the sum of the undiscounted future cash flows is less than the carrying amount of the asset, in which case a write-down is recorded to reduce the related asset to its estimated fair value. There was no impairment of long-lived assets as of December 31, 2010, 2009 or 2008.
Workers’ Compensation and Medical Malpractice Loss Reserves.
The Company is partially self-insured for its workers’ compensation liability related to the Life Sciences, Healthcare and IT and Engineering segments as well as its medical malpractice liability in relation to the Physician segment. In connection with these programs, the Company pays a base premium plus actual losses incurred, not to exceed certain stop-loss limits. The Company is insured for losses above these limits, both per occurrence and in the aggregate. The self-insurance claim liability is determined based on claims filed and claims incurred but not reported. The Company accounts for claims incurred but not yet reported based on estimates derived from historical claims experience and current trends of industry data. Changes in estimates and differences in estimates and actual payments for claims are recognized in the period that the estimates changed or the payments were made.
.
Contingencies.
The Company records an estimated loss from a loss contingency when information available prior to issuance of its financial statements indicates it is probable that an asset has been impaired or a liability has been incurred at the date of the financial statements, and the amount of the loss can be reasonably estimated. Accounting for contingencies, such as legal settlements, workers’ compensation matters and medical malpractice insurance matters, requires the Company to use judgment. While the Company believes that the accruals for these matters are adequate, if the actual loss from a loss contingency is significantly different than the estimated loss, results of operations may be over or understated.
Income Taxes.
Income taxes are accounted for under the asset and liability method. Deferred tax assets and liabilities are recognized for the future tax consequences attributable to differences between the financial statement carrying amounts of existing assets and liabilities and their respective tax bases. Deferred tax assets and liabilities are measured using enacted tax rates expected to apply to taxable income in the years in which those temporary differences are expected to be recovered or settled. The effect on deferred tax assets and liabilities of a change in tax rates is recognized in income in the period that includes the enactment date. Deferred tax assets are reduced by a valuation allowance if it is more likely than not that a portion of the deferred tax asset will not be realized.
43
The Company makes a comprehensive review of its uncertain tax positions regularly. In this regard, an uncertain tax position represents the Company’s expected treatment of a tax position taken in a filed return, or planned to be taken in a future tax return or claim that has not been reflected in measuring income tax expense for financial reporting purposes. In general, until these positions are sustained by the taxing authorities or statutes expire for the year that the position was taken, the Company does not recognize the tax benefits resulting from such positions and reports the tax effects as a liability for uncertain tax positions in its consolidated balance sheets.
Revenue Recognition.
Revenues from contract assignments, net of sales adjustments and discounts, are recognized when earned, based on hours worked by the Company’s contract professionals on a weekly basis. Conversion and direct hire fees are recognized when earned, upon conversion or direct hire of a contract professional to a client’s regular employee. In addition, the Company records a sales allowance against consolidated revenues, which is an estimate based on historical billing adjustment experience. The sales allowance is recorded as a reduction to revenues and an increase to the allowance for billing adjustments. The billing adjustment reserve includes an allowance for fallouts. Fallouts are direct hire and conversion fees that do not complete the contingency period. The contingency period is typically 90 days or less. The Company includes reimbursed expenses, including those related to travel and out-of-pocket expenses, in revenues and the associated amounts of reimbursable expenses in cost of services.
The Company generally records revenue on a gross basis as a principal versus on a net basis as an agent in the consolidated statements of operations. The key indicators supporting the Company’s conclusion that it acts as a principal in substantially all of its transactions are that the Company (i) has the direct contractual relationships with its customers, (ii) bears the risks and rewards of the transactions, and (iii) has the discretion to select the contract professionals and establish their price. To the extent that the Company concludes that it does not act as the principal in the arrangement, revenues are recorded on a net basis.
Foreign Currency Translation.
The functional currency of the Company’s foreign operations is their local currency, and as such, their assets and liabilities are translated into U.S. dollars at the rate of exchange in effect on the balance sheet date. Revenue and expenses are translated at the average rates of exchange prevailing during each monthly period. The related translation adjustments are recorded as cumulative foreign currency translation adjustments in accumulated other comprehensive income as a separate component of stockholders’ equity. Gains and losses resulting from foreign currency transactions, which are not material, are included in SG&A expenses in the Consolidated
Statements of Operations and Comprehensive Income (Loss).
Business Combinations.
The purchase price of an acquisition is allocated to the underlying assets acquired and liabilities assumed based upon their estimated fair values at the date of acquisition. To the extent the purchase price exceeds the fair value of the net identifiable tangible and intangible assets acquired and liabilities assumed, such excess is allocated to goodwill. The Company determines the estimated fair values after review and consideration of relevant information including discounted cash flows, quoted market prices and estimates made by management. Accordingly, these can be affected by contract performance and other factors over time, which may cause final amounts to differ materially from original estimates. The Company adjusts the preliminary purchase price allocation, as necessary, up to one year after the acquisition closing date if it obtains more information regarding asset valuations and liabilities assumed.
Goodwill acquired in business combinations is assigned to the reporting unit(s) expected to benefit from the combination as of the acquisition date. Acquisition related costs are recognized separately from the acquisition and are expensed as incurred.
Stock-Based Compensation.
The Company records compensation expense for restricted stock awards and stock units based on the fair market value of the awards on the date of grant. Market-based awards, which are based on achievement of targets indexed to the Company’s share price, are valued using a Monte Carlo simulation model. Compensation expense for performance-based awards is measured based on the amount of shares ultimately expected to vest, estimated at each reporting date based on management’s expectations regarding the relevant performance criteria. The Company accounts for stock options granted and ESPP shares based on an estimated fair market value using a Black-Scholes option valuation model. This methodology requires the use of subjective assumptions including expected stock price volatility and the estimated life of each award. The fair value of equity-based compensation awards less the estimated forfeitures is amortized over the vesting period of the award.
Use of Estimates.
The preparation of financial statements in conformity with generally accepted accounting principles requires management to make estimates and assumptions that affect the reported amounts of assets and liabilities and disclosure of contingent assets and liabilities at the date of the financial statements and the reported amounts of revenues and expenses during the reporting period. Actual results could differ from those estimates.
44
Concentration of Credit Risk.
Financial instruments that potentially subject the Company to credit risks consist primarily of cash, cash equivalents and trade receivables. The Company places its cash and cash equivalents in low risk investments with quality credit institutions and limits the amount of credit exposure with any single institution above FDIC insured limits. For the Life Sciences, Physician, IT and Engineering segments, and the Nurse Travel and the Allied Healthcare lines of businesses, concentration of credit risk with respect to accounts receivable is limited because of the large number of geographically dispersed customers, thus spreading the trade credit risk. The Company performs ongoing credit evaluations to identify risks and maintains an allowance to address these risks.
Fair Value of Financial Instruments.
There were no financial instruments carried at fair value on a recurring basis at December 31, 2010. The interest rate cap was carried at fair value on a recurring basis but it expired on June 30, 2010. See Note 13 for the fair value disclosures of the interest rate cap and interest rate swap. The recorded values of cash and cash equivalents, accounts receivable, accounts payable and accrued expenses approximate their fair value based on their short-term nature. Long-term debt is not measured at fair value on a recurring basis. See Note 12 for fair value disclosures. Certain assets and liabilities, such as goodwill, are not measured at fair value on an ongoing basis but are subject to fair value adjustments in certain circumstances (e.g., when there is evidence of impairment).
Derivative Instruments.
The Company utilizes derivative financial instruments to manage interest rate risk. The Company does not use derivative financial instruments for trading or speculative purposes, nor does it use leveraged financial instruments.
Advertising Costs.
Advertising costs, which are expensed as incurred, were $3.1 million, $3.5 million and $4.9 million for the years ended December 31, 2010, 2009 and 2008 respectively.
Subsequent Events
. Management performed a review of subsequent events after December 31, 2010, through the
issuance date. Except for those items discussed in Note 14 to our Consolidated Financial Statements, no other recognized or non-recognized subsequent events were noted.
Recent Accounting Pronouncements
.
In January 2010, the FASB issued an update to ASC Topic 820,
Fair Value Measurements and Disclosures
(ASC 820), which requires new disclosures for fair value measurements and provides clarification for existing disclosure requirements. More specifically, this update will require (a) an entity to disclose separately the amounts of significant transfers in and out of Levels 1 and 2 fair value measurements and to describe the reasons for the transfers; and (b) information about purchases, sales, issuances and settlements to be presented separately (i.e. present the activity on a gross basis rather than net) in the reconciliation for fair value measurements using significant unobservable inputs (Level 3 inputs). This guidance clarifies existing disclosure requirements for the level of disaggregation used for classes of assets and liabilities measured at fair value and requires disclosures about the valuation techniques and inputs used to measure fair value for both recurring and nonrecurring fair value measurements using Level 2 and Level 3 inputs. The new disclosures and clarifications of existing disclosure are effective for fiscal years beginning after December 15, 2009, except for the disclosure requirements related to the purchases, sales, issuances and settlements in the rollforward activity of Level 3 fair value measurements, which are effective for fiscal years beginning after December 15, 2010. The Company is in the process of evaluating the impact of this guidance on the Company’s consolidated financial statements, which will be effective in the quarter ended March 31, 2011.
In September 2009, the FASB issued an update to ASC Topic 605,
Revenue Recognition
, which establishes the criteria for separating consideration in multiple-element arrangements. The updated guidance requires companies allocating the overall consideration to each deliverable to use an estimated selling price of individual deliverables in the arrangement in the absence of vendor-specific evidence or other third-party evidence of the selling price for the deliverables and it also provides additional factors that should be considered when determining whether software in a tangible product is essential to its functionality. The Company adopted this guidance on January 1, 2011 with no impact to the consolidated financial statements.
In August 2009, the FASB issued an update to ASC 820
on measuring liabilities at fair value. The updated guidance provides clarification that in circumstances in which a quoted market price in an active market for an identical liability is not available, an entity is required to measure fair value using a valuation technique that uses the quoted price of an identical liability when traded as an asset or, if unavailable, quoted prices for similar liabilities or similar assets when traded as assets. If none of this information is available, an entity should use a valuation technique in accordance with existing fair valuation principles. The Company adopted the measurement requirements of this guidance in the quarter ended December 31, 2010 with no impact on the consolidated financial statements.
45
2. Property and Equipment.
Property and equipment at December 31, 2010 and 2009 consisted of the following (in thousands):
|
2010
|
2009
|
|||||||
|
Furniture and fixtures
|
$ | 3,551 | $ | 3,635 | ||||
|
Computers and related equipment
|
4,950 | 4,433 | ||||||
|
Computer software
|
24,649 | 19,688 | ||||||
|
Machinery and equipment
|
1,062 | 1,265 | ||||||
|
Leasehold improvements
|
3,463 | 3,522 | ||||||
|
Work-in-progress
|
4,412 | 4,579 | ||||||
| 42,087 | 37,122 | |||||||
|
Less accumulated depreciation and amortization
|
(26,269 | ) | (21,504 | ) | ||||
|
Total
|
$ | 15,818 | $ | 15,618 | ||||
Depreciation and amortization expense related to property and equipment for the years ended December 31, 2010, 2009 and 2008 was $5.9 million, $5.7 million and $5.1 million, respectively.
The Company has capitalized costs related to its various technology initiatives. The net book value of the property and equipment related to software development was $7.9 million as of December 31, 2010 and $7.5 million as of December 31, 2009, which includes work-in-progress of $3.0 million and $4.5 million, respectively.
3. Acquisitions.
On April 16, 2010, the Company acquired the outstanding shares of The Cambridge Group Ltd. and Cambridge Contract Staffing Group, Inc. (“Cambridge”), a Connecticut-based privately-held provider of specialized staffing services. The primary reasons for the Cambridge acquisition were to expand our Life Sciences, IT and Engineering, and Physician business operations and to leverage the Company’s infrastructure. The purchase price totaled $7.6 million, comprised of $5.3 million in cash plus potential future earn-out consideration of up to $2.3 million based upon the operating results of the related business through March 31, 2012. The earn-outs will be paid, if and to the extent earned, sixty days after the end of each of the preceding periods, pending the agreement of all applicable parties to all terms and provisions related to such payments. Pursuant to ASC Topic 805, Business Combinations, the Company accrued $2.3 million representing the estimated fair value of the future earn-out payments as of the acquisition date and the amount is included in the Consolidated Balance Sheets in other long-term liabilities. Acquisition costs of $0.1 million related to the purchase were recorded in the Consolidated Statement of Operations for the year ended December 31, 2010.
On July 19, 2010, the Company acquired the outstanding shares of Sharpstream Holdings Limited (“Sharpstream”), a privately owned provider of search services for executives to middle managers in the life sciences sector. The primary reasons for the Sharpstream acquisition were to expand our Life Sciences business operations, further expand our global presence and to leverage the Company’s infrastructure. The purchase price totaled $8.6 million, comprised of $7.2 million in cash plus potential future consideration of up to $1.4 million based upon the operating results of the related business through December 31, 2011. The earn-outs will be paid, if and to the extent earned, on or before April 15 of the year following the end of each preceding period, pending the agreement of all applicable parties to all terms and provisions related to such payments. Pursuant to ASC Topic 805, Business Combinations, the Company accrued $1.4 million representing the estimated fair value of the future earn-out payments as of the acquisition date and the amount is included in the Consolidated Balance Sheets in other current liabilities and other long-term liabilities. Adjustments to the purchase price, such as working capital adjustments, will be reflected in subsequent periods, if and when, conditions are met, but are expected to be determined by Q3 2011. Acquisition costs of $0.1 million related to the purchase were recorded in the Consolidated Statement of Operations for the year ended December 31, 2010.
For both the Cambridge and Sharpstream acquisitions, the Company allocated the purchase price to assets acquired and liabilities assumed based on their estimated fair values on the acquisition date. The excess of the purchase price over the aggregate fair value was recorded as goodwill. None of the goodwill will be deductible for tax purposes. The fair value assigned to identifiable intangible assets was determined primarily by using a discounted cash flow method. See Note 5 to the Consolidated Financial Statements for a discussion of the intangible assets acquired and the allocation of goodwill to the segments.
46
The following summarizes the purchase price allocation of the Cambridge and Sharpstream purchase prices as of December 31, 2010 (in thousands):
|
Cambridge
|
Sharpstream
|
||||||
|
Current assets
|
$ | 1,472 | $ | 3,437 | |||
|
Goodwill
|
6,591 | 5,714 | |||||
|
Identifiable intangible assets
|
746 | 1,015 | |||||
|
Long-term deposits and other long-term assets
|
32 | 18 | |||||
|
Total assets acquired
|
$ | 8,841 | $ | 10,184 | |||
|
Current liabilities
|
$ | 731 | $ | 1,175 | |||
|
Long-term liabilities
|
525 | 383 | |||||
|
Total liabilities assumed
|
1,256 | 1,558 | |||||
|
Total purchase price
|
$ | 7,585 | $ | 8,626 | |||
The financial results of these acquisitions have been included in our consolidated statements of operations as of the acquisition date. These acquisitions are individually not considered material to the Company and therefore, pro-forma information has not been presented.
4. Long-Term Debt.
Long-term debt at December 31, 2010 and 2009 consisted of the following (in thousands):
|
2010
|
2009
|
||||||
|
Senior Secured Debt:
|
|||||||
|
$75 million revolving credit facility, due January 2015
|
$ | 18,000 | $ | — | |||
|
$50 million term loan facility, due January 2015
|
48,750 | — | |||||
|
$145 million term loan facility, due January 2013, retired in December 2010
|
— | 77,913 | |||||
|
Total
|
$ | 66,750 | $ | 77,913 | |||
On December 3, 2010, we replaced our $145 million term loan facility existing credit facility with a new senior secured credit agreement, which consists of a $50.0 million, five-year term loan facility, a $75.0 million, five-year revolving loan facility and a $10.0 million sublimit for letters of credit, as well as the ability to increase the loan facilities for up to an additional $50.0 million, subject to receipt of lender commitments and satisfaction of specified conditions. During 2010, we expensed unamortized capitalized loan costs of $2.8 million related to the old borrowing facility. These costs are included as interest expense in the consolidated statements of operations.
Borrowings under the new credit agreement bear interest through maturity at a variable rate based upon, at the Company’s option, either the Eurodollar rate or the base rate (which is the highest of the administrative agent’s prime rate, one-half of 1.0 percent in excess of the overnight federal funds rate, and 1.0 percent in excess of the one-month Eurodollar rate), plus in each case, an applicable margin. The applicable margin for Eurodollar rate loans ranges, based on the applicable leverage ratio, from 2.0 percent to 3.25 percent per annum and the applicable margin for base rate loans ranges, based on the applicable leverage ratio, from 1.0 percent to 2.25 percent per annum. The Company is required to pay a commitment fee equal to 0.5 percent per annum on the undrawn portion available under the revolving loan facility if its leverage ratio is less than 3.0:1.0 and a commitment fee equal to 0.625 percent per annum if its leverage ratio is equal to or greater than 3.0:1.0. Additionally, the Company is required to pay variable per annum fees equal to the applicable margin for Eurodollar rate loans in respect of outstanding letters of credit.
During the five years after the closing date, the Company is required to make quarterly amortization payments on the term loan facility in the amount of $1.3 million. The Company is also required to make mandatory prepayments of loans under the new credit agreement, subject to specified exceptions, from excess cash flow, and with the proceeds of asset sales, debt issuances and specified other events.
The Company’s obligations under the new credit agreement are guaranteed by substantially all of its direct and indirect domestic subsidiaries, which are secured by a lien on substantially all of the Company’s tangible and intangible property, and by a pledge of all of the shares of stock, partnership interests and limited liability company interests of its direct and indirect domestic subsidiaries.
47
In addition to other covenants, the new credit agreement places limits on the Company’s and its subsidiaries’ ability to incur liens, incur additional indebtedness, make loans and investments, engage in mergers and acquisitions, engage in asset sales, declare dividends or redeem or repurchase capital stock, alter the business conducted by the Company and its subsidiaries, transact with affiliates, make capital expenditures, prepay, redeem or purchase subordinated debt and amend or otherwise alter debt agreements.
The new credit agreement also contains financial covenants requiring the Company to (i) maintain a maximum ratio of consolidated funded debt to consolidated EBITDA of 3.0 to 1.0, with a one-time election, upon notice to the administrative agent, to temporarily increase the maximum ratio to 3.25 to 1.0; (ii) maintain a minimum consolidated fixed charge coverage ratio of consolidated EBITDA to consolidated interest charges of 1.25 to 1.0 as of the end of any fiscal quarter of the Company ending on or before March 31, 2011 and 1.5 to 1.0 as of the end of any fiscal quarter of the Borrowing ending on or after June 30, 2011; and (iii) to limit its operating lease payments to not more than $10.0 million in 2010 and 2011, $10.5 million in 2012, $11.0 million in 2013, $11.5 million in 2014 and $12.0 million in any fiscal year thereafter. A failure to comply with these covenants could permit the lenders under the new credit agreement to declare all amounts borrowed under the new credit agreement, together with accrued interest and fees, to be immediately due and payable. As of December 31, 2010 and 2009 the Company was in compliance with all of its financial covenants, including minimum quarterly principal payment requirements. The Company made principal reducing payments of $77.9 million and $48.0 million for the years ended December 31, 2010 and 2009, respectively.
5. Goodwill and Other Identifiable Intangible Assets.
The changes in the carrying amount of goodwill for the years ended December 31, 2010 and 2009 are as follows (in thousands):
|
Life Sciences
|
Healthcare
|
Physician
|
IT and Engineering
|
Total
|
||||||||||||||||
|
Gross carrying value
|
$ | 1,197 | $ | 122,230 | $ | 37,143 | $ | 148,525 | $ | 309,095 | ||||||||||
|
Accumulated impairment
|
― | 106,318 | ― | ― | 106,318 | |||||||||||||||
|
Balance as of December 31, 2008
|
$ | 1,197 | $ | 15,912 | $ | 37,143 | $ | 148,525 | $ | 202,777 | ||||||||||
|
Additional consideration for earn-outs
|
― | ― | 20 | 17 | 37 | |||||||||||||||
|
Balance as of December 31, 2009
|
$ | 1,197 | $ | 15,912 | $ | 37,163 | $ | 148,542 | $ | 202,814 | ||||||||||
|
Cambridge acquisition (see Note 3)
|
5,650 | ― | ― | 941 | 6,591 | |||||||||||||||
|
Sharpstream acquisition (see Note 3)
|
5,714 | ― | ― | ― | 5,714 | |||||||||||||||
|
Goodwill Impairment
|
― | $ | (15,399 | ) | ― | ― | (15,399 | ) | ||||||||||||
|
Balance as of December 31, 2010
|
$ | 12,561 | $ | 513 | $ | 37,163 | $ | 149,483 | $ | 199,720 | ||||||||||
The goodwill impairment charge related to the Nurse Travel reporting unit. See footnote 1, under “Goodwill and Identifiable Intangible Assets”, for more information.
During the current year, the Company recorded $0.7 million and $1.0 million of intangible assets with definite lives related to the Cambridge acquisition and the Sharpstream acquisition, respectively. Intangible assets related to the Cambridge acquisition included contractor relations of $0.1 million (4 year amortization period), customer relations of $0.5 million (4 year amortization period) and non-compete agreements of $0.1 million (3 year amortization period).
Intangible assets related to the Sharpstream acquisition included trademarks of $0.5 million, contractor relations of $5,000 (3 months amortization period), customer relations of $0.5 million (3 year amortization period) and non-compete agreements of $30,000 (2 year amortization period). The purchased identifiable intangible assets are amortized on an accelerated or straight-line basis over their respective useful lives depending on the intangible asset.
48
As of December 31, 2010 and December 31, 2009, the Company had the following acquired intangible assets (in thousands):
|
December 31, 2010
|
December 31, 2009
|
|||||||||||||||||||||||
|
Estimated Useful Life
|
Gross Carrying Amount
|
Accumulated Amortization
|
Net Carrying Amount
|
Gross Carrying Amount
|
Accumulated Amortization
|
Net Carrying Amount
|
||||||||||||||||||
|
Intangible assets subject to amortization:
|
||||||||||||||||||||||||
|
Customer relations
|
3 months - 7 years
|
$ | 7,740 | $ | 6,830 | $ | 910 | $ | 6,660 | $ | 6,257 | $ | 403 | |||||||||||
|
Contractor relations
|
3 months - 7 years
|
26,111 | 24,600 | 1,511 | 26,010 | 23,100 | 2,910 | |||||||||||||||||
|
Non-compete agreements
|
2 - 3 years
|
470 | 371 | 99 | 340 | 330 | 10 | |||||||||||||||||
|
In-use software
|
2 years
|
500 | 500 | — | 500 | 500 | ― | |||||||||||||||||
| 34,821 | 32,301 | 2,520 | 33,510 | 30,187 | 3,323 | |||||||||||||||||||
|
Intangible assets not subject to
amortization:
|
||||||||||||||||||||||||
|
Trademarks
|
22,650 | — | 22,650 | 22,200 | — | 22,200 | ||||||||||||||||||
|
Goodwill
|
199,720 | — | 199,720 | 202,814 | — | 202,814 | ||||||||||||||||||
|
Total
|
$ | 257,191 | $ | 32,301 | $ | 224,890 | $ | 258,524 | $ | 30,187 | $ | 228,337 | ||||||||||||
Amortization expense for intangible assets with finite lives was $2.1 million, $6.1 million and $9.4 million for the years ended December 31, 2010, 2009 and 2008, respectively. Estimated amortization for each of the four years in the period ended December 31, 2014
is $1.2 million in 2011, $0.7 million in 2012, $0.5 million in 2013, and $42,000 in 2014.
Goodwill and other intangible assets having indefinite useful lives are not amortized for financial statement purposes. Goodwill and intangible assets with indefinite lives are reviewed for impairment on an annual basis as of December 31, and whenever events or changes in circumstances indicate that the carrying amount may not be recoverable.
6. 401(k) Retirement Savings Plan, Deferred Compensation Plan and Change in Control Severance Plan.
Under the Company’s 401(k) Retirement Savings Plan, which covers eligible employees of On Assignment and its wholly-owned subsidiaries, Assignment Ready Inc., On Assignment Staffing Services, Inc., VISTA, and Oxford, eligible employees may elect to have a portion of their salary deferred and contributed to the plans. The amount of salary deferred, up to certain limits set by the IRS, is not subject to federal and state income tax at the time of deferral, but together with any earnings on deferred amounts, is subject to taxation upon distribution. The plan covers all eligible employees and permits matching or other discretionary contributions at the Company’s discretion. Eligible employees may enroll once they complete three months of service prior to the next quarterly offering. The Company pledged to make contributions to the 401(k) plan of $0.4 million in 2010 and made contributions of $1.3 million during 2008. No contributions were made by the Company in 2009.
Effective January 1, 1998, the Company implemented the On Assignment, Inc. Deferred Compensation Plan. The plan permits a select group of management and highly compensated employees and directors that contribute materially to the continued growth, development and future business success of the Company to annually elect to defer up to 100 percent of their base salary, annual bonus, stock option gain or fees on a pre-tax basis and earn tax-deferred returns on these amounts. On September 4, 2008, effective as of January 1, 2008, the Company amended the On Assignment Deferred Compensation Plan so that it applies to deferrals made before January 1, 2005 only (hereinafter referred to as the 1998 Deferred Compensation Plan) and, also effective January 1, 2008, adopted a new plan, called the On Assignment Deferred Compensation Plan – Effective January 1, 2008, applicable to deferrals made on or after January 1, 2005 (referred to herein as the 2008 Deferred Compensation Plan). The plans are not intended to be “qualified” within the meaning of IRS Code Section 401(a), rather, the plans are “unfunded and maintained by an employer primarily for the purpose of providing deferred compensation for a select group of management or highly compensated employees” within the meaning of the Employee Retirement Income Security Act of 1974, as amended (ERISA), Sections 201(2), 301(a)(3) and 401(a)(1).
49
Distributions from the 1998 Deferred Compensation Plan are commenced within 60 days after the participant’s retirement, death or termination of employment, in a lump sum, or over five, ten or fifteen years, except that payments made upon termination (other than due to death or retirement), are paid in a lump sum if the participant’s account balance at the time of termination is less than $25,000. Furthermore, if the Company determines in good faith prior to a change in control that there is a reasonable likelihood that any compensation paid to a participant for a taxable year of the Company would not be deductible by the Company solely by reason of the limitation under IRS Code Section 162(m), (Section 162(m)) then the Company may defer all or any portion of a distribution until the earliest possible date, as determined by the Company in good faith, on which the deductibility of compensation paid or payable to the participant for the taxable year of the Company during which the distribution is made will not be limited by Section 162(m), or if earlier, the effective date of a change in control.
Distributions from the 2008 Deferred Compensation Plan are commenced within 60 days following the participant’s termination of employment, in a lump sum or in annual installments of up to fifteen years, except that if the participant’s account balance is less than the applicable dollar amount specified in IRS Code Section 402(g)(1)(B), in effect for the year in which the distribution is to occur, payment shall be made in a lump sum. Notwithstanding the foregoing, in compliance with certain requirements of IRS Code Section 409A, plan distributions to “specified employees” will commence the first day after the end of the six month period immediately following the date on which the participant experiences a termination of employment. Furthermore, if the Company reasonably anticipates that the Company’s deduction with respect to any distribution from the 2008 Deferred Compensation Plan would be limited or eliminated by application of Section 162(m), then to the extent permitted by applicable treasury regulations, payment shall be delayed until the earliest date the Company reasonably anticipates that the deduction of the payment will not be limited or eliminated by application of Section 162(m).
The deferred compensation liability under the deferred compensation plan were approximately $2.2 million and $2.1 million at December 31, 2010 and 2009, respectively. Life insurance policies are maintained as a funding source to the plans, under which the Company is the sole owner and beneficiary of such insurance. The cash surrender value of these life insurance policies, which is reflected in other assets in the accompanying Consolidated Balance Sheets, was approximately $2.3 million and $2.1 million at December 31, 2010 and 2009, respectively.
The Company adopted the On Assignment, Inc. Change in Control Severance Plan (the CIC Plan) to provide severance benefits for officers and certain other employees who are terminated following an acquisition of the Company. This CIC Plan was adopted on February 12, 1998 and amended on August 8, 2004, January 23, 2007, May 21, 2009, December 10, 2009 and May 20, 2010. Under the CIC Plan, if an eligible employee is involuntarily terminated within eighteen months after a change in control, as defined in the CIC Plan, then the employee will be entitled to (i) a payment equal to the employee’s annual salary plus the employee’s target bonus, payable in a lump sum, and (ii) a lump sum payment representing the cost of continuation of health and welfare benefits, under the Consolidated Omnibus Budget Reconciliation Act of 1985 (COBRA) for periods of time ranging from nine months to eighteen months, for employees with titles of vice president or higher. Severance benefits under the plan range from one month to eighteen months of salary and target bonus, depending on the employee’s length of service and position with the Company.
The Company entered into an Amended and Restated Executive Change of Control Agreements with the Chief Executive Officer and the Chief Financial Officer on December 11, 2008, primarily for the purpose of causing their existing agreements to meet the requirements of Code Section 409A. These agreements supersede the CIC Plan with respect to these officers and provide, in the event of an involuntary termination occurring within six months and ten days following a change of control of the Company, for the following benefits (i) a lump-sum payment equal to three times (for the Chief Executive Officer’s salary plus target bonus) or two and a half times (for the Chief Financial Officer) the sum of the officer’s base salary plus target bonus, (ii) eighteen months continuation of the officer’s health and welfare benefits and car allowance, (subject to limitations in connection with subsequent employment), (iii) cash payments equal to insurance premiums and retirement and deferred compensation contributions that the Company would have paid (in each case, if any), over a period of eighteen months following termination, and (iv) payment of up to $15,000 of the cost of outplacement services. Additionally, under the arrangements, immediately prior to a change of control, all outstanding Company stock options, restricted stock and stock units held by the officer will become fully vested (and, in the case of options, remain exercisable for an extended period), subject, in the case of certain performance-vesting awards, to any express limitations contained in the officer’s employment or other governing agreement. In addition, the agreements entitle the executives to tax gross-up payments in the event that any payments to the executives are subject to “golden parachute” excise taxes under IRS Code Section 280G.
7. Commitments and Contingencies.
The Company leases its facilities and certain office equipment under operating leases, which expire at various dates through 2021. Certain leases contain rent escalations and/or renewal options. Rent expense for all significant leases is recognized on a straight-line basis. At December 31, 2010 and 2009, the balance of the deferred rent liability reflected in other current liabilities in the accompanying Consolidated Balance Sheets was $0.2 million and $0.3 million, respectively and the balance reflected in other long-term liabilities was $0.6 million and $0.5 million, respectively.
50
The following is a summary of specified contractual cash obligation payments by the Company as of December 31, 2010 (in thousands):
|
Long-Term Debt
|
Operating
Leases
|
Total
|
|||||||||
|
2011
|
$ | 5,000 | $ | 5,260 | $ | 10,260 | |||||
|
2012
|
5,000 | 5,242 | 10,242 | ||||||||
|
2013
|
5,000 | 5,692 | 10,692 | ||||||||
|
2014
|
5,000 | 5,925 | 10,925 | ||||||||
|
2015
|
46,750 | 5,129 | 51,879 | ||||||||
|
Thereafter
|
― | 10,366 | 10,366 | ||||||||
|
Total
|
$ | 66,750 | $ | 37,614 | $ | 104,364 | |||||
Rent expense, which is included in SG&A expenses, was $8.4 million for 2010, $8.2 million for 2009 and $9.5 million for 2008.
As discussed in Note 1, the Company is partially self-insured for its workers’ compensation liability and its medical malpractice liability. The Company accounts for claims incurred but not yet reported based on estimates derived from historical claims experience and current trends of industry data. Changes in estimates, differences in estimates and actual payments for claims are recognized in the period that the estimates changed or the payments were made. The self-insurance claim liability was approximately $10.2 million and $10.3 million at December 31, 2010 and 2009, respectively. Additionally, the Company has unused stand-by letters of credit outstanding to secure obligations for workers’ compensation claims with various insurance carriers. The unused stand-by letters of credit at December 31, 2010 were $2.8 million and at December 31, 2009 were $3.8 million.
As of December 31, 2010 and 2009, the Company has an income tax reserve in other long-term liabilities related to uncertain tax positions of $0.3 million.
Legal Proceedings
The Company is involved in various legal proceedings, claims and litigation arising in the ordinary course of business. However, based on the facts currently available, the Company does not believe that the disposition of matters that are pending or asserted will have a material adverse effect on its consolidated financial statements.
51
8. Income Taxes.
The provision (benefit) for income taxes consists of the following (in thousands):
|
Year Ended December 31,
|
||||||||||||
|
2010
|
2009
|
2008
|
||||||||||
|
Current:
|
||||||||||||
|
Federal
|
$ | 1,748 | $ | (736 | ) | $ | 13,319 | |||||
|
State
|
522 | 75 | 2,314 | |||||||||
|
Foreign
|
412 | 452 | 691 | |||||||||
| 2,682 | (209 | ) | 16,324 | |||||||||
|
Deferred:
|
||||||||||||
|
Federal
|
2,271 | 3,852 | (1,292 | ) | ||||||||
|
State
|
- | 427 | 232 | |||||||||
|
Foreign
|
(212 | ) | (98 | ) | (3 | ) | ||||||
| 2,059 | 4,181 | (1,063 | ) | |||||||||
|
Change in Valuation Allowance
|
215 | 106 | ― | |||||||||
|
Total
|
$ | 4,956 | $ | 4,078 | $ | 15,261 | ||||||
Income (loss) before provision (benefit) for income taxes consists of the following (in thousands):
|
Year Ended December 31,
|
|||||||||||
|
2010
|
2009
|
2008
|
|||||||||
|
United States
|
$ | (6,071 | ) | $ | 7,602 | $ | 32,085 | ||||
|
Foreign
|
1,130 | 1,183 | 2,146 | ||||||||
| $ | (4,941 | ) | $ | 8,785 | $ | 34,231 | |||||
The components of deferred tax assets (liabilities) are as follows (in thousands):
|
December 31, 2010
|
December 31, 2009
|
|||||||||||||||
|
Federal
|
State
|
Federal
|
State
|
|||||||||||||
|
Deferred income tax assets (liabilities):
|
||||||||||||||||
|
Current:
|
||||||||||||||||
|
Allowance for doubtful accounts
|
$ | 698 | $ | 73 | $ | 653 | $ | 79 | ||||||||
|
Employee related accruals
|
3,114 | 246 | 1,750 | 212 | ||||||||||||
|
State taxes
|
178 | — | 225 | — | ||||||||||||
|
Workers’ compensation loss reserve
|
615 | 69 | 695 | 89 | ||||||||||||
|
Medical malpractice loss reserve
|
2,990 | 236 | 3,008 | 314 | ||||||||||||
|
Net operating loss carry-forwards
|
— | 75 | — | 86 | ||||||||||||
|
Prepaid insurance
|
(281 | ) | (21 | ) | (356 | ) | (37 | ) | ||||||||
|
Other
|
749 | 43 | 775 | 14 | ||||||||||||
|
Total current deferred income tax assets
|
8,063 | 721 | 6,750 | 757 | ||||||||||||
|
Non-current:
|
||||||||||||||||
|
Net operating loss carry-forwards
|
— | 578 | — | 292 | ||||||||||||
|
Stock-based compensation
|
2,244 | 133 | 1,841 | 123 | ||||||||||||
|
Purchased intangibles
|
(9,294 | ) | (822 | ) | (5,218 | ) | (490 | ) | ||||||||
|
Depreciation and amortization expense
|
(2,778 | ) | (265 | ) | (1,663 | ) | (203 | ) | ||||||||
|
Employee related accruals
|
(72 | ) | (9 | ) | (460 | ) | (50 | ) | ||||||||
|
Other
|
108 | 21 | 112 | 19 | ||||||||||||
|
Total non-current deferred income tax liabilities
|
(9,792 | ) | (364 | ) | (5,388 | ) | (309 | ) | ||||||||
|
Total deferred income tax assets (liabilities)
|
$ | (1,729 | ) | $ | 357 | $ | 1,362 | $ | 448 | |||||||
52
The reconciliation between the amount computed by applying the U.S. federal statutory tax rate of 34.0 percent to income before income taxes and the income tax provision is as follows (in thousands):
|
Year Ended December 31,
|
||||||||||||
|
2010
|
2009
|
2008
|
||||||||||
|
Income tax provision at the statutory rate
|
$ | (1,680 | ) | $ | 3,075 | $ | 11,981 | |||||
|
State income taxes, net of federal benefit
|
460 | 471 | 1,569 | |||||||||
|
Impairment of goodwill
|
5,236 | — | — | |||||||||
|
Permanent difference – (gain)/loss on cash surrender value of life insurance
|
(72 | ) | (178 | ) | 309 | |||||||
|
Permanent difference – non deductible items
|
901 | 614 | 1,035 | |||||||||
|
Valuation allowance
|
215 | 106 | — | |||||||||
|
Income tax contingency
|
(16 | ) | (232 | ) | 32 | |||||||
|
Return to provision adjustment
|
— | 280 | — | |||||||||
|
Foreign tax rate differential
|
(181 | ) | 46 | (61 | ) | |||||||
|
Other
|
93 | (104 | ) | 396 | ||||||||
|
Total
|
$ | 4,956 | $ | 4,078 | $ | 15,261 | ||||||
As of December 31, 2010, the Company had no federal net operating losses and total combined state net operating losses of $11.8 million. The state net operating losses can be carried forward for up to 20 years and begin expiring in 2013.
At December 31, 2010, the Company had accumulated net foreign earnings of $8.9 million. The Company intends to reinvest the undistributed earnings of its foreign subsidiaries and, therefore, no U.S. income tax has been provided on the foreign earnings.
The Company had gross deferred tax assets of $12.7 million and $10.3 million and gross deferred tax liabilities of $14.0 million and $8.5 million at December 31, 2010 and 2009, respectively. Foreign deferred tax assets and liabilities were not material as of December 31, 2010 and 2009.
The Company receives a tax deduction for stock-based awards upon exercise of a non-qualified stock option or as the result of disqualifying dispositions made by directors, officers and employees. A disqualifying disposition occurs when stock acquired through the exercise of incentive stock options or the Employee Stock Purchase Plan is disposed of prior to the required holding period. The Company also receives a tax deduction upon the vesting of restricted stock units or restricted stock awards. The Company received tax deductions of $3.8 million and $2.9 million, respectively, from stock-based awards in 2010 and 2009.
As of December 31, 2010, the estimated value of the Company’s uncertain tax positions is a liability of $0.3 million, which includes penalties and interest, all of which was carried in other long-term liabilities. If the Company’s positions are sustained by the taxing authority in favor of the Company, the entire $0.3 million would reduce the Company’s effective tax rate. The Company recognizes accrued interest and penalties related to uncertain tax positions in income tax expense.
53
The following is a reconciliation of the total amounts of unrecognized tax benefits (in thousands):
|
Year ended December 31,
|
||||||||||||
|
2010
|
2009
|
2008
|
||||||||||
|
Unrecognized Tax Benefit beginning of year
|
$ | 397 | $ | 812 | $ | 832 | ||||||
|
Gross Decreases - tax positions in prior year
|
(39 | ) | — | (109 | ) | |||||||
|
Gross Increases - tax positions in prior year
|
— | — | — | |||||||||
|
Gross Increases - tax positions in current year
|
— | — | 89 | |||||||||
|
Reductions for tax positions as a result of a lapse of the applicable statute of limitations
|
— | (415 | ) | — | ||||||||
|
Unrecognized Tax Benefit end of year
|
$ | 358 | $ | 397 | $ | 812 | ||||||
During 2010, 2009 and 2008, the Company recognized $5,000, $8,000 and ($7,000), respectively, in interest on unrecognized tax benefits. Accruals for interest and penalties totaled $61,000 at December 31, 2010 and $56,000 at December 31, 2009.
The Company believes that there will be no significant increases or decreases to unrecognized tax benefits within the next twelve months.
The Company is subject to taxation in the United States and various states and foreign jurisdictions. The IRS has examined and concluded all tax matters for years through 2006. Open tax years related to federal, state and foreign jurisdictions remain subject to examination but are not considered material.
9. Earnings per Share
.
Basic earnings per share are computed based upon the weighted average number of shares outstanding and diluted earnings per share are computed based upon the weighted average number of shares and dilutive share equivalents (consisting of incentive stock options, non-qualified stock options, restricted stock units, restricted stock awards and employee stock purchase plan contributions) outstanding during the periods using the treasury stock method.
The following is a reconciliation of the shares used to compute basic and diluted earnings per share (in thousands):
|
Year Ended December 31,
|
|||||||||||
|
2010
|
2009
|
2008
|
|||||||||
|
Weighted average number of shares outstanding used to compute basic earnings per share
|
36,429 | 36,011 | 35,487 | ||||||||
|
Dilutive effect of stock-based awards
|
— | 324 | 371 | ||||||||
|
Number of shares used to compute diluted earnings per share
|
36,429 | 36,335 | 35,858 | ||||||||
The following table outlines the weighted average share equivalents outstanding during each period that were excluded from the computation of diluted earnings per share because the exercise price for these options was greater than the average market price of the Company’s shares of common stock during the respective periods. Also excluded from the computation of diluted earnings per share were other share equivalents that became anti-dilutive when applying the treasury stock method.
|
Year Ended December 31,
|
|||||||||||
|
2010
|
2009
|
2008
|
|||||||||
|
Anti-dilutive common share equivalents outstanding (in thousands):
|
1,339 | 2,660 | 2,645 | ||||||||
The following table outlines the weighted average share equivalents outstanding during the year ended December 31, 2010 that were excluded from the computation of diluted earnings per share as a result of the Company’s net loss position. Had the Company been in a net income position for the period, the following common share equivalents outstanding would have been dilutive:
54
|
Weighted average number of shares outstanding used to compute basic earnings per share
|
36,429 | ||
|
Dilutive effect of stock-based awards
|
621 | ||
|
Number of shares used to compute diluted earnings per share
|
37,050 |
10. Stock-based Compensation: Incentive Award Plan and Employee Stock Purchase Plan.
The Company believes that stock-based compensation better aligns the interests of its employees and directors with those of its shareholders versus exclusively providing cash-based compensation. Stock-based compensation provides incentives to retain and motivate executive officers and key employees responsible for driving Company performance and maintaining important relationships that contribute to the growth of the Company.
Compensation expense charged to operations related to stock-based compensation was $7.7 million, $5.0 million and $6.3 million for each of the years ended December 31, 2010, 2009 and 2008, respectively, and is included in the Consolidated Statements of Operations and Comprehensive Income (Loss) in selling, general and administrative expenses. The Company has recognized an income tax benefit of $2.9 million, $1.9 million and $2.2 million for the year ended December 31, 2010, 2009 and 2008, respectively in the consolidated statements of operations for stock-based compensation arrangements.
Effective June 3, 2010, the shareholders approved the adoption of the On Assignment, Inc. 2010 Incentive Award Plan (the 2010 Plan), which replaced the Company’s Restated 1987 Stock Option Plan. The 2010 Plan permits the grant of stock options, including incentive stock options, nonqualified stock options, restricted stock awards (RSAs), dividend equivalent rights, stock payments, deferred stock, restricted stock units (RSUs), performance shares and other incentive awards, stock appreciation rights and cash awards to its employees, directors and consultants for up to 2,184,983 shares of common stock, which included the 884,983 shares that remained available for issuance under the 1987 Plan as of June 3, 2010. The 2010 Plan allows for stock option awards to be granted with an exercise price equal to the closing market price of the Company’s stock at the date of grant. Stock option awards generally vest over four years of continuous service with the Company and generally have ten-year contractual terms. RSUs and RSAs generally vest over a three year continuous service period, though individual award vesting terms vary within these parameters. Certain stock option awards and RSUs and RSAs provide for accelerated vesting in the event of a change in control (see Note 6). Options or awards that are cancelled or forfeited are added back to the pool of shares available for issuance under the 2010 Plan. As of December 31, 2010, there were 2,299,077 shares available for issuance under the 2010 Plan.
The fair value of each option award is estimated on the date of grant using a Black-Scholes option valuation model that incorporates assumptions disclosed in the table below. Expected volatility is based on historical volatility of the underlying stock for a period consistent with the expected lives of the stock options as the Company believes this is a reasonable representation of future volatility. Additionally, the Company analyzes historical stock option exercise behavior and vesting patterns for RSUs and RSAs in order to estimate employee turnover rates (i.e. forfeiture rates). The forfeiture rate, set by management, is used to estimate the number of options and awards that will eventually vest and the associated impact on stock-based compensation expense. The expected life, or term, of options granted is derived from historical exercise behavior and represents the period of time that stock option awards are expected to be outstanding. The Company has selected a risk-free rate based on the implied yield available on U.S. Treasury Securities with a maturity equivalent to the options’ expected term. For RSUs and RSAs, the Company records compensation expense based on the fair market value of the awards on the grant date.
Officer Awards
The preceding paragraphs describe the general terms of most stock-based incentives awards granted by the Company. However, the Company has granted a discrete set of stock-based awards to its Chief Executive Officer (CEO) and other corporate officers that differ from those generally stated terms. The grant-date fair-value of these awards, which was determined by applying certain provisions of the stock compensation guidance relative to performance-based and market-based awards, is generally being expensed over the vesting term. The impact of these awards is reflected in the detailed RSU and RSA disclosures below. All awards are subject to the officer’s continued employment through such vesting dates, however, the vesting of certain awards will accelerate upon the occurrence of a change in control of the Company and/or upon certain qualifying terminations of employment.
55
On June 3, 2010, the CEO was awarded a number of RSUs that will be determined by dividing $0.5 million by the closing price of the Company’s stock on February 1, 2013 contingent upon the Company meeting certain stock price performance objectives measured over the thirty-six month period between January 1, 2010 and December 31, 2012. As of December 31, 2010, the fair value of the award was $0.3 million and is being expensed over a derived service period of 1.6 years, determined by applying certain provisions relative to market-based awards in ASC Topic 718, Stock Compensation. Furthermore, certain provisions of ASC Topic 480, Distinguishing Liabilities from Equity, require the Company to classify and account for this award as a liability award until the number of shares is determined and the fair value of the award is remeasured at each reporting period until the award is settled. Fluctuations in the fair value of the liability award and its derived service period are recorded as increases or decreases to stock-based compensation cost. The associated liability related to this award included in the Consolidated Balance Sheets in other long-term liabilities was $95,000 as of December 31, 2010.
On March 17, 2010, the CEO was granted 67,568 RSUs, with a grant-date fair value of $0.5 million, which will vest in two equal components on February 1, 2011 and February 1, 2012, which were contingent upon meeting certain performance objectives approved by the Compensation Committee based on adjusted EBITDA, measured over the thirteen-month period between January 1, 2010 and February 1, 2011. As of December 31, 2010, the performance targets had been fully achieved and the grant-date fair value will continue to be expensed over the respective vesting periods for each of the two components. All awards are subject to the CEO’s continued employment through applicable vesting dates and may vest on an accelerated basis in part or in full upon the occurrence of certain qualifying terminations of employment and/or corporate events.
In the first quarter of 2010, the Company granted RSUs to certain other executive officers with an aggregate grant-date fair value of $1.2 million. Sixty percent of the total RSU award will vest in three annual increments subject to continued employment on each succeeding grant-date anniversary. Forty percent of the awards will vest in three consecutive annual installments contingent upon the officer attaining certain performance objectives approved by the Compensation Committee. Accordingly, the Company records stock-based compensation expense over the vesting period of these awards based on the probability that the performance objectives will be met and that the executives will maintain their employment through the respective vesting dates.
On November 4, 2009, we entered into a new employment agreement with our Chief Executive Officer that provides for three annual stock award grants with grant-date values of $0.8 million each, based on performance objectives for 2010 through 2012 that vest and become payable, subject to continued employment, on February 1, 2011, 2012, and 2013, respectively, contingent upon achieving positive adjusted earnings before interest, taxes, depreciation and amortization (EBITDA) during the thirteen month period ending on February 1 the year following the grant.
On January 2, 2009, the Chief Executive Officer was granted (1) 90,252 RSUs valued at $0.5 million which vest on the third anniversary of the date of the grant, (2) 90,252 RSAs valued at $0.5 million, which were to vest on December 31, 2009, but did not vest because the performance objectives approved by the Compensation Committee (based on adjusted EBITDA) were not met, and (3) 90,252 RSUs valued at $0.5 million, which vest December 31, 2011 contingent upon the Company meeting certain stock price performance objectives relative to its peers over three years from the date of grant.
On January 2, 2008, the Chief Executive Officer was granted (1) 78,369 RSUs valued at $0.5 million which vest on the third anniversary of the date of the grant, (2) 78,369 RSAs valued at $0.5 million, which vested December 31, 2009 when the Company met the performance objectives approved by the Compensation Committee (based on adjusted EBITDA), and (3) 78,369 RSUs valued at $0.5 million, which were to vest on December 31, 2010, subject to the Company meeting certain stock price performance objectives relative to its peers, however, only 75,615 shares, or 96.5 percent of the original award, vested on December 31, 2010.
Stock Options
The following table displays the weighted average assumptions that have been applied to estimate the fair value of stock option awards on the date of grant for the years ended December 31, 2010, 2009 and 2008:
|
2010
|
2009
|
2008
|
|||||||||
|
Dividend yield
|
— | — | — | ||||||||
|
Risk-free interest rate
|
1.5% | 1.6% | 1.7% | ||||||||
|
Expected volatility
|
73.3% | 73.1% | 51.5% | ||||||||
|
Expected lives
|
3.6 years
|
3.5 years
|
3.4 years
|
||||||||
56
The following summarizes pricing and term information for options outstanding as of December 31, 2010:
|
Options Outstanding
|
Options Exercisable
|
||||||||||||||||||||||
|
Range of Exercise Prices
|
Number Outstanding at December 31, 2010
|
Weighted Average Remaining Contractual Life (years)
|
Weighted Average Exercise Price
|
Number Exercisable at December 31, 2010
|
Weighted Average Exercise Price
|
||||||||||||||||||
| $ | 2.82 |
─
|
$ | 4.97 | 388,760 |
5.2
|
$ | 4.63 | 308,965 | $ | 4.72 | ||||||||||||
| 4.98 |
─
|
5.17 | 405,449 |
4.3
|
5.12 | 368,734 | 5.12 | ||||||||||||||||
| 5.20 |
─
|
6.68 | 375,228 |
4.1
|
5.80 | 355,673 | 5.79 | ||||||||||||||||
| 6.86 |
─
|
11.39 | 444,806 |
7.1
|
9.15 | 271,694 | 10.21 | ||||||||||||||||
| 11.56 |
─
|
13.31 | 571,410 |
6.1
|
12.77 | 548,660 | 12.76 | ||||||||||||||||
| 15.93 |
─
|
23.01 | 60,950 |
1.0
|
20.90 | 60,950 | 20.90 | ||||||||||||||||
| $ | 2.82 |
─
|
$ | 23.01 | 2,246,603 |
5.3
|
$ | 8.32 | 1,914,676 | $ | 8.59 | ||||||||||||
The following table is a summary of stock option activity under the Plan as of December 31, 2010 and changes for the year then ended:
|
Incentive Stock Options
|
Non- Qualified Stock Options
|
Weighted Average Exercise Price Per Share
|
Weighted Average Remaining Contractual
Term (Years)
|
Aggregate Intrinsic Value
|
|||||||||||||||
|
Outstanding at January 1, 2010
|
424,832 | 2,012,109 | $ | 8.54 | 6.3 | $ | 2,549,000 | ||||||||||||
|
Granted
|
― | 45,750 | $ | 7.22 | |||||||||||||||
|
Exercised
|
(37,308 | ) | (30,892 | ) | $ | 4.88 | |||||||||||||
|
Canceled
|
(45,688 | ) | (122,200 | ) | $ | 12.58 | |||||||||||||
|
Outstanding at December 31, 2010
|
341,836 | 1,904,767 | $ | 8.32 | 5.3 | $ | 3,655,000 | ||||||||||||
|
Vested or Expected to Vest at December 31, 2010
|
341,519 | 1,829,952 | $ | 8.38 | 5.2 | $ | 3,520,000 | ||||||||||||
|
Exercisable at December 31, 2010
|
341,354 | 1,573,322 | $ | 8.59 | 4.8 | $ | 3,054,000 | ||||||||||||
The table above includes 90,000 non-employee director stock options outstanding as of December 31, 2010 and January 1, 2010.
The weighted-average grant-date fair value of options granted during the years ended December 31, 2010, 2009 and 2008 was $3.80, $3.45, and $2.08 per option, respectively. The total intrinsic value of options exercised during the years ended December 31, 2010, 2009 and 2008 was $0.2 million, $27,000, and $0.2 million, respectively.
As of December 31, 2010 there was unrecognized compensation expense of $0.7 million related to unvested stock options based on options that are expected to vest. The unrecognized compensation expense is expected to be recognized over a weighted-average period of 2.4 years.
In January 2009, the Company implemented a stock option exchange program that gave eligible employees the opportunity to exchange options with an exercise price greater than $8.00 per share that were granted on or after December 31, 2000, for a reduced number of restricted stock units at an exchange price with a fair value approximately equivalent to the fair value of the cancelled options. Certain executive officers and the Board of Directors were not eligible to participate in the stock option exchange program. As a result of this stock option exchange program, 603,700 stock options were cancelled and exchanged for 87,375 RSUs which will vest 50.0 percent on January 22, 2011, 25.0 percent on January 22, 2012 and 25.0 percent on January 22, 2013 subject to the employee’s continued employment through such vesting dates. Incremental compensation cost related to the option exchange was not significant to the Company’s financial statements.
57
Restricted Stock Units and Restricted Stock Awards
A summary of the status of the Company’s unvested RSUs and RSAs as of December 31, 2010 and changes during the year then ended are presented below:
|
Restricted Stock Units / Awards
|
Weighted Average Grant-Date Fair Value Per Unit / Award
|
||||||
|
Unvested RSUs and RSAs outstanding at January 1, 2010
|
1,222,589 | $ 7.19 | |||||
|
Granted
|
646,709 | 7.26 | |||||
|
Market value share count adjustment for liability awards
|
(75,391 | ) | 8.34 | ||||
|
Vested
|
(552,631 | ) | 7.25 | ||||
|
Forfeited
|
(35,425 | ) | 6.49 | ||||
|
Unvested RSUs and RSAs outstanding at December 31, 2010
|
1,205,851 | $ 7.15 | |||||
|
Unvested and expected to vest RSUs and RSAs outstanding at December 31, 2010
|
1,139,487 | $ 7.15 | |||||
The number of shares vested in the table above includes 193,618 shares surrendered by the employees to the Company for payment of minimum tax withholding obligations. Shares of stock withheld for purposes of satisfying minimum tax withholding obligations are again available for issuance under the Plan.
Additionally, the table above includes 44,284 RSUs that were awarded to non-employee directors on August 6, 2010, of which 22,142 shares vested immediately upon issuance and the remaining shares will vest on August 6, 2011. The weighted average grant-date fair value of these awards was $5.42. There was unrecognized compensation expense of $72,000 as of December 31, 2010 related to these RSUs that will be recorded over the remaining term of approximately seven months.
The weighted-average grant-date fair value of RSUs and RSAs granted during the years ended December 31, 2010, 2009 and 2008 was $7.26, $5.62 and $6.77 per award, respectively. The total intrinsic value of RSUs and RSAs vested during the years ended December 31, 2010, 2009 and 2008 was $3.7 million, $2.9 million and $1.3 million, respectively.
As of December 31, 2010, there was unrecognized compensation expense of $3.9 million related to unvested RSUs and RSAs based on awards that are expected to vest. The unrecognized compensation expense is expected to be recognized over a weighted-average period of 1.3 years.
Employee Stock Purchase Plan
Effective June 3, 2010 when the shareholders approved the On Assignment 2010 Employee Stock Purchase Plan (ESPP), the Company reinstated the employee stock purchase program for issuance of up to 3,500,000 shares of common stock with the first offering periods. The ESPP allows eligible employees to purchase common stock of the Company, through payroll deductions, at 85.0 percent of the lower of the market price on the first day or the last day of semi-annual purchase periods. The ESPP is intended to qualify as an “employee stock purchase plan” under IRS Code Section 423. Eligible employees may contribute up to a certain percentage set by the plan administrator of their eligible earnings toward the purchase of the stock (subject to certain IRS limitations). Previously, the Company maintained a shareholder-approved Employee Stock Purchase Plan which was originally adopted by the Board of Directors on March 1, 1993 (the Prior ESPP). The pool of shares available for issuance under the Prior ESPP was fully depleted on February 27, 2009. As a result, the Prior ESPP was terminated and no additional shares will be issued under the Prior ESPP.
In accordance with the ESPP, shares of common stock are transferred to participating employees at the conclusion of each six month enrollment period, which now end on the last business day of the month in March and September each year. The first purchase period under the 2010 Plan will end on March 31, 2011. Accordingly, no shares had yet been issued under the new plan as of December 31, 2010. Under the Prior ESPP plan, 227,784 and 315,827 shares of common stock were issued to employees for the years ended December 31, 2009 and 2008, respectively.
58
Compensation expense of shares purchased under the ESPP is measured based on a Black-Scholes option-pricing model. The model accounts for the discount from market value and applies an expected life in line with each six month purchase period. The weighted average fair value of stock purchased under the Prior ESPP was $2.67 per share for the year ended December 31, 2009 and $2.21 per share for the year ended December 31, 2008. The amount of stock-based compensation expensed related to the ESPP was less than $0.1 million for the years ended December 31, 2010 and 2009 and $0.6 million for the year ended December 31, 2008.
11. Business Segments.
The Company has four reportable segments: Life Sciences, Healthcare, Physician and IT and Engineering. The Life Sciences segment provides contract, contract-to-permanent and direct placement services of laboratory and scientific professionals to the biotechnology, pharmaceutical, food and beverage, medical device, personal care, chemical and environmental industries. These contract staffing specialties include chemists, clinical research associates, clinical lab assistants, engineers, biologists, biochemists, microbiologists, molecular biologists, food scientists, regulatory affairs specialists, lab assistants and other skilled scientific professionals.
The Healthcare segment includes the combined results of the Nurse Travel and Allied Healthcare (formerly Medical Financial and Allied, or MF&A) lines of business. The lines of business have been aggregated into the Healthcare segment based on similar economic characteristics, end-market customers and management personnel. The Healthcare segment provides contract, contract-to-permanent and direct placement of professionals from a number of healthcare, medical financial and allied occupations. These contract staffing specialties include nurses, specialty nurses, respiratory therapists, surgical technicians, imaging technicians, x-ray technicians, medical technologists, phlebotomists, coders, billers, claims processors and collections staff.
The Physician segment, comprised of VISTA Staffing Solutions, Inc., provides contract and direct placement physicians to healthcare organizations. The Physician segment works with nearly all medical specialties, placing locum tenens physicians in hospitals, community-based practices, and federal, state and local facilities.
The IT and Engineering segment, comprised of Oxford Global Resources, Inc., provides high-end contract placement services of information technology and engineering professionals with expertise in specialized information technology; software and hardware engineering; and mechanical, electrical, validation and telecommunications engineering fields.
The Company’s management evaluates the performance of each segment primarily based on revenues, gross profit and operating income. The information in the following table is derived directly from the segments’ internal financial reporting used for corporate management purposes.
59
The following table represents revenues, gross profit and operating income by reportable segment (in thousands):
|
Year Ended December 31,
|
|||||||||||
|
2010
|
2009
|
2008
|
|||||||||
|
Revenues:
|
|||||||||||
|
Life Sciences
|
$ | 109,495 | $ | 93,664 | $ | 129,483 | |||||
|
Healthcare
|
76,287 | 97,137 | 180,671 | ||||||||
|
Physician
|
73,595 | 87,719 | 89,217 | ||||||||
|
IT and Engineering
|
178,688 | 138,093 | 218,687 | ||||||||
|
Total Revenues
|
$ | 438,065 | $ | 416,613 | $ | 618,058 | |||||
|
Gross Profit:
|
|||||||||||
|
Life Sciences
|
$ | 37,776 | $ | 30,470 | $ | 43,502 | |||||
|
Healthcare
|
23,058 | 27,329 | 46,265 | ||||||||
|
Physician
|
23,847 | 28,545 | 27,369 | ||||||||
|
IT and Engineering
|
64,775 | 50,024 | 82,320 | ||||||||
|
Total Gross Profit
|
$ | 149,456 | $ | 136,368 | $ | 199,456 | |||||
|
Operating Income (Loss):
|
|||||||||||
|
Life Sciences
|
$ | 5,305 | $ | 6,176 | $ | 13,048 | |||||
|
Healthcare
|
(20,998 | ) | (3,074 | ) | 6,285 | ||||||
|
Physician
|
5,010 | 8,214 | 5,869 | ||||||||
|
IT and Engineering
|
13,910 | 3,911 | 18,312 | ||||||||
|
Total Operating Income
|
$ | 3,227 | $ | 15,227 | $ | 43,514 | |||||
The Company does not report Life Sciences and Healthcare segments’ total assets separately as the operations are largely centralized. The following table represents total assets as allocated by reportable segment (in thousands):
|
Year Ended December 31,
|
|||||||||
|
2010
|
2009
|
||||||||
| . | |||||||||
|
Total Assets:
|
|||||||||
|
Life Sciences and Healthcare
|
$ | 74,979 | $ | 78,645 | |||||
|
Physician
|
63,908 | 69,912 | |||||||
|
IT and Engineering
|
202,229 | 194,905 | |||||||
|
Total Assets
|
$ | 341,116 | $ | 343,462 | |||||
The Company does not report all assets by segment for all reportable segments. The following table represents identifiable assets by reportable segment (in thousands):
|
Year Ended December 31,
|
|||||||||
|
2010
|
2009
|
||||||||
| . | |||||||||
|
Gross Accounts Receivable:
|
|||||||||
|
Life Sciences
|
$ | 14,107 | $ | 10,548 | |||||
|
Healthcare
|
9,628 | 9,722 | |||||||
|
Physician
|
10,233 | 12,453 | |||||||
|
IT and Engineering
|
30,725 | 19,399 | |||||||
|
Total Gross Accounts Receivable
|
$ | 64,693 | $ | 52,122 | |||||
60
The Company operates internationally, with operations in the United States, Europe, Canada, Australia, New Zealand and Bermuda. The following table represents revenues by geographic location (in thousands):
|
Year Ended December 31,
|
|||||||||||
|
2010
|
2009
|
2008
|
|||||||||
|
Revenues:
|
|||||||||||
|
Domestic
|
$ | 407,317 | $ | 393,846 | $ | 584,316 | |||||
|
Foreign
|
30,748 | 22,767 | 33,742 | ||||||||
|
Total Revenues
|
$ | 438,065 | $ | 416,613 | $ | 618,058 | |||||
The following table represents long-lived assets by geographic location (in thousands):
|
Year Ended December 31,
|
|||||||||||
|
2010
|
2009
|
2008
|
|||||||||
|
Long-Lived Assets:
|
|||||||||||
|
Domestic
|
$ | 19,826 | $ | 20,364 | $ | 22,300 | |||||
|
Foreign
|
754 | 569 | 622 | ||||||||
|
Total Long-Lived Assets
|
$ | 20,580 | $ | 20,933 | $ | 22,922 | |||||
The valuation techniques utilized are based upon observable and unobservable inputs. Observable inputs reflect market data obtained from independent sources, while unobservable inputs reflect internal market assumptions. These two types of inputs create the following fair value hierarchy:
Level 1: Quoted market prices in active markets for identical assets or liabilities.
Level 2: Observable market based inputs or unobservable inputs that are corroborated by market data.
Level 3: Unobservable inputs that are not corroborated by market data.
The recorded values of cash and cash equivalents, accounts receivable, accounts payable and accrued expenses approximate their fair value based on their short-term nature.
There were no financial instruments carried at fair value on a recurring basis at December 31, 2010 because the interest rate cap expired on July 1, 2010. The Company’s fair value measurement as of December 31, 2009 using significant other observable inputs (Level 2) for the interest rate cap was not significant.
The following table presents the carrying amounts and the related estimated fair values of the financial assets and liabilities not measured at fair value on a recurring basis at December 31, 2010 and 2009 (in thousands):
|
2010
|
2009
|
|||||||||||||||
|
Carrying Amount
|
Fair Value
|
Carrying Amount
|
Fair Value
|
|||||||||||||
|
Long-Term Debt
|
$ | (61,750 | ) | $ | (61,750 | ) | $ | (77,913 | ) | $ | (75,576 | ) | ||||
The fair value of the long-term debt is based on the yields of comparable companies with similar credit characteristics. As of December 31, 2010, the Company’s long-term debt agreement had only been in place for twenty-nine days. Given the limited time outstanding during the last part of the year, it has been determined that the carrying value of the debt approximates its fair value. The recorded values of cash and cash equivalents, accounts receivable, accounts payable and accrued expenses approximate their fair value based on their short-term nature.
Certain assets and liabilities, such as goodwill and indefinite-lived intangible assets, are not measured at fair value on an ongoing basis but are subject to fair value adjustments in certain circumstances (e.g., when there is evidence of impairment).
61
The Company evaluates goodwill annually, or earlier if circumstances indicate that goodwill may be impaired, at the reporting unit. The Company determines the fair value of its reporting units primarily based on level 3 inputs such as discounted cash flows which are not observable from the market, directly or indirectly. While the Company began to experience growth in the Nurse Travel business during the fourth quarter of 2010, the decrease in the value was due to lowered growth expectations in the later years due to uncertainty regarding the timing of the recovery of the Nurse Travel industry. The Company recognized a goodwill impairment charge of $15.4 million in the fourth quarter of 2010. Goodwill for the Company’s impaired reporting unit, Nurse Travel, with a carrying amount of $15.4 million was written down to the implied fair value of $0 resulting in an impairment charge of $15.4 million, which is included in the net loss for the year ended December 31, 2010. In addition, the Company evaluates indefinite-lived intangibles assets annually for impairment and whenever circumstances occur indicating that the indefinite-lived intangible assets may be impaired. The Company did not have any impairment of indefinite-lived intangibles in 2010, 2009 or 2008. The Company determined the fair value of its indefinite-lived intangible assets using the income approach (relief-from-royalty method), based on level 3 inputs.
13. Derivative Instruments.
The Company utilized derivative financial instruments to manage interest rate risk through July 1, 2010. The Company does not use derivative financial instruments for trading or speculative purposes, nor does it use leveraged financial instruments.
On May 2, 2007, the Company entered into a transaction with a financial institution to fix the underlying interest rate on $73.0 million of its outstanding bank loan for a period of two years beginning June 30, 2007. This transaction, commonly known as an interest rate swap, essentially fixed the Company’s base borrowing rate at 4.9425 percent as opposed to a floating rate, which reset at selected periods. On June 30, 2009, the swap expired in accordance with the terms of the agreement. The Company recorded a gain of $1.3 million for the year ended December 31, 2009 for the change in fair value of the interest rate swap. The change in the fair value of the swap is included in interest expense in the consolidated statements of operations and comprehensive income (loss).
The interest rate swap was not designated as a hedging instrument for accounting purposes. The fair value of the interest rate swap was the estimated amount the Company would have received to terminate the swap agreement at the reporting date, taking into account current interest rates and the creditworthiness of the Company and the swap counterparty depending on whether the swap was in an asset or liability position, referred to as a credit valuation adjustment. The interest rate swap expired on June 30, 2009, thus there was no related fair value measurement as of December 31, 2010 or December 31, 2009. The interest rate swap was a pay-fixed, receive-variable interest rate swap based on a LIBOR swap rate. The LIBOR swap rate was observable at commonly quoted intervals for the full term of the swap and, therefore, was considered a Level 2 item. Credit risk related to the swap was considered minimal and was managed by requiring high credit standards for the counterparty and periodic settlements of the underlying transactions.
Effective July 1, 2009, pursuant to terms of the amended credit agreement, the Company entered into an interest rate cap contract, in order to mitigate the interest rate risk. The interest rate cap contract was for a notional amount of $51.0 million with a one-month LIBOR cap of 3.0 percent for a term of one year and expired on July 1, 2010. As this agreement was not designated as a hedging instrument, changes in the fair value of this agreement increased or decreased interest expense.
The following table reflects the effect of derivative instruments on the Consolidated Statements of Operations and Comprehensive Income (Loss) for the year ended December 31, 2010 and 2009 (in thousands):
|
|
Location of Gain(Loss) Recognized in Income on Derivative
|
Amount of Gain(Loss)
Recognized in Income on Derivative
|
||||||
|
2010
|
2009
|
|||||||
|
Interest rate cap
|
Interest expense
|
— | — | |||||
|
Interest rate swap
|
Interest expense
|
— | 1,345 | |||||
14. Subsequent events.
On February 28, 2011, the Company completed its acquisition of all of the outstanding capital stock of Warphi NV, a Belgium entity (“Warphi”), the parent company of Valesta, NV (“Valesta”) for EUR 12.8 millionin cash, and a post-closing contingent payment of up to EUR 5.2 million based on the 2011, 2012 and 2013 performance of Valesta.
62
Valesta is a leading provider of staffing in the area of pharmaceutical firms, biotech companies and contract research organizations in Belgium, Spain and the Netherlands. The acquisition allows the Company to expand its clinical research and life sciences business into Western Europe.
On February 18, 2011, the Company entered into an interest rate swap agreement with a notional amount of $25.0 million. The interest rate swap fixes a portion of the Company’s base borrowing rate, which is a floating rate that resets periodically
.
15. Unaudited Quarterly Results.
The following tables present unaudited quarterly financial information for each of the four quarters ended December 31, 2010 and December 31, 2009. In the opinion of the Company’s management, the quarterly information contains all adjustments, consisting only of normal recurring accruals, necessary for a fair presentation thereof. The operating results for any quarter are not necessarily indicative of the results for any future periods.
|
2010
|
||||||||||||||||
|
Dec. 31,
|
Sep. 30,
|
June 30,
|
Mar. 31,
|
|||||||||||||
|
(in thousands, except per share data)
|
||||||||||||||||
|
Revenues
|
$ | 121,152 | $ | 116,141 | $ | 104,459 | $ | 96,313 | ||||||||
|
Cost of services
|
78,918 | 75,038 | 69,163 | 65,490 | ||||||||||||
|
Gross profit
|
42,234 | 41,103 | 35,296 | 30,823 | ||||||||||||
|
Selling, general and
administrative expenses
|
35,374 | 33,661 | 31,964 | 29,831 | ||||||||||||
|
Impairment of goodwill
|
15,399 | - | - | - | ||||||||||||
|
Operating income (loss)
|
(8,539 | ) | 7,442 | 3,332 | 992 | |||||||||||
|
Interest expense
|
(3,541 | ) | (1,601 | ) | (1,607 | ) | (1,560 | ) | ||||||||
|
Interest income
|
70 | 7 | 32 | 32 | ||||||||||||
|
Earnings (loss) before income taxes
|
(12,010 | ) | 5,848 | 1,757 | (536 | ) | ||||||||||
|
Provision for income taxes
|
1,688 | 2,685 | 817 | (234 | ) | |||||||||||
|
Net income (loss)
|
$ | (13,698 | ) | $ | 3,163 | $ | 940 | $ | (302 | ) | ||||||
|
Earnings (loss) per share:
|
||||||||||||||||
|
Basic
|
$ | (0.38 | ) | $ | 0.09 | $ | 0.03 | $ | (0.01 | ) | ||||||
|
Diluted
|
$ | (0.38 | ) | $ | 0.09 | $ | 0.03 | $ | (0.01 | ) | ||||||
|
Number of shares and share equivalents used to calculate earnings per share:
|
||||||||||||||||
|
Basic
|
36,421 | 36,506 | 36,427 | 36,361 | ||||||||||||
|
Dilutive
|
36,421 | 36,974 | 37,150 | 36,361 | ||||||||||||
63
|
2009
|
||||||||||||||||
|
Dec. 31,
|
Sep. 30,
|
June 30,
|
Mar. 31,
|
|||||||||||||
|
(in thousands, except per share data)
|
||||||||||||||||
|
Revenues
|
$ | 99,924 | $ | 98,053 | $ | 101,834 | $ | 116,802 | ||||||||
|
Cost of services
|
66,710 | 65,280 | 68,437 | 79,818 | ||||||||||||
|
Gross profit
|
33,214 | 32,773 | 33,397 | 36,984 | ||||||||||||
|
Selling, general and
administrative expenses
|
29,576 | 28,451 | 29,985 | 33,129 | ||||||||||||
|
Operating income
|
3,638 | 4,322 | 3,412 | 3,855 | ||||||||||||
|
Interest expense
|
(1,689 | ) | (1,777 | ) | (2,744 | ) | (1,747 | ) | ||||||||
|
Interest income
|
33 | 34 | 732 | 716 | ||||||||||||
|
Earnings before income taxes
|
1,982 | 2,579 | 1,400 | 2,824 | ||||||||||||
|
Provision for income taxes
|
947 | 1,125 | 830 | 1,176 | ||||||||||||
|
Net income
|
$ | 1,035 | $ | 1,454 | $ | 570 | $ | 1,648 | ||||||||
|
Earnings per share:
|
||||||||||||||||
|
Basic
|
$ | 0.03 | $ | 0.04 | $ | 0.02 | $ | 0.05 | ||||||||
|
Diluted
|
$ | 0.03 | $ | 0.04 | $ | 0.02 | $ | 0.05 | ||||||||
|
Number of shares and share equivalents used to calculate earnings per share:
|
||||||||||||||||
|
Basic
|
36,110 | 36,068 | 36,181 | 35,840 | ||||||||||||
|
Dilutive
|
36,760 | 36,578 | 36,385 | 35,982 | ||||||||||||
Not applicable.
Evaluation of Disclosure Controls and Procedures
As of the end of the period covered by this report, the Company’s management carried out an evaluation, under the supervision and with the participation of our Principal Executive Officer and Principal Financial Officer, of the effectiveness of our disclosure controls and procedures (as defined in Rule 13a-15(e) of the Securities Exchange Act of 1934). Based on this evaluation, our Principal Executive Officer and Principal Financial Officer have concluded that our disclosure controls and procedures are effective as of the end of the period covered by this report. The term “disclosure controls and procedures” means controls and other procedures of the Company that are designed to ensure that information required to be disclosed by the Company in the reports that it files or submits under the Securities Exchange Act of 1934 is recorded, processed, summarized and reported within the time periods specified in the Securities and Exchange Commission’s rules and forms. “Disclosure controls and procedures” include, without limitation, controls and procedures designed to ensure that information required to be disclosed by the Company in the reports that it files or submits under the Securities Exchange Act of 1934 is accumulated and communicated to the Company’s management, including its principal executive and principal financial officers, or persons performing similar functions, as appropriate to allow timely decisions regarding required disclosure.
Management’s Report on Internal Control Over Financial Reporting
Management is responsible for establishing and maintaining adequate internal control over financial reporting (as defined in Rule 13a-15(f) of the Securities Exchange Act of 1934) for the Company. The term “internal control over financial reporting” is defined as a process designed by, or under the supervision of, the Company’s principal executive and principal financial officers, or persons performing similar functions, and effected by the Company’s board of directors, management and other personnel, to provide reasonable assurance regarding the reliability of financial reporting and the preparation of financial statements for external purposes in accordance with generally accepted accounting principles and includes those policies and procedures that:
64
|
·
|
Pertain to the maintenance of records that, in reasonable detail, accurately and fairly reflect the transactions and dispositions of the assets of the Company;
|
|
·
|
Provide reasonable assurance that the transactions are recorded as necessary to permit preparation of financial statements in accordance with generally accepted accounting principles, and that receipts and expenditures of the Company are being made only in accordance with authorizations of management and directors of the Company; and
|
|
·
|
Provide reasonable assurance regarding prevention of timely detection of unauthorized acquisition, use, or disposition of the Company’s assets that could have a material effect on the financial statements.
|
Because of its inherent limitations, internal control over financial reporting may not prevent or detect misstatements. Also, projections of any evaluation of effectiveness to future periods are subject to risk that controls may become inadequate because of changes in conditions, or that the degree of compliance with policies or procedures may deteriorate.
Management, under the supervision and with the participation of our Principal Executive Officer and Principal Financial Officer, assessed the effectiveness of the Company’s internal control over financial reporting as of December 31, 2010. In making this assessment, management used the criteria set forth by the Committee of Sponsoring Organizations of the Treadway Commission in
Internal Control-Integrated Framework
. Based on our assessment and those criteria, management believes that the Company maintained effective internal control over financial reporting as of December 31, 2010. Our independent registered public accounting firm, Deloitte & Touche LLP, has included an attestation report on our internal control over financial reporting, which is included below.
Changes in Internal Controls
There were no changes in the Company’s internal control over financial reporting that occurred during the Company’s fourth quarter that have materially affected, or are reasonably likely to materially affect, the Company’s internal control over financial reporting.
None.
65
REPORT OF INDEPENDENT REGISTERED PUBLIC ACCOUNTING FIRM
To the Board of Directors and Stockholders of On Assignment, Inc.
Calabasas, California
We have audited the internal control over financial reporting of On Assignment, Inc. and subsidiaries (the "Company") as of December 31, 2010, based on criteria established in
Internal Control — Integrated Framework
issued by the Committee of Sponsoring Organizations of the Treadway Commission. The Company's management is responsible for maintaining effective internal control over financial reporting and for its assessment of the effectiveness of internal control over financial reporting, included in the accompanying Management's Report on Internal Control Over Financial Reporting. Our responsibility is to express an opinion on the Company's internal control over financial reporting based on our audit.
We conducted our audit in accordance with the standards of the Public Company Accounting Oversight Board (United States). Those standards require that we plan and perform the audit to obtain reasonable assurance about whether effective internal control over financial reporting was maintained in all material respects. Our audit included obtaining an understanding of internal control over financial reporting, assessing the risk that a material weakness exists, testing and evaluating the design and operating effectiveness of internal control based on the assessed risk, and performing such other procedures as we considered necessary in the circumstances. We believe that our audit provides a reasonable basis for our opinion.
A company's internal control over financial reporting is a process designed by, or under the supervision of, the company's principal executive and principal financial officers, or persons performing similar functions, and effected by the company's board of directors, management, and other personnel to provide reasonable assurance regarding the reliability of financial reporting and the preparation of financial statements for external purposes in accordance with generally accepted accounting principles. A company's internal control over financial reporting includes those policies and procedures that (1) pertain to the maintenance of records that, in reasonable detail, accurately and fairly reflect the transactions and dispositions of the assets of the company; (2) provide reasonable assurance that transactions are recorded as necessary to permit preparation of financial statements in accordance with generally accepted accounting principles, and that receipts and expenditures of the company are being made only in accordance with authorizations of management and directors of the company; and (3) provide reasonable assurance regarding prevention or timely detection of unauthorized acquisition, use, or disposition of the company's assets that could have a material effect on the financial statements.
Because of the inherent limitations of internal control over financial reporting, including the possibility of collusion or improper management override of controls, material misstatements due to error or fraud may not be prevented or detected on a timely basis. Also, projections of any evaluation of the effectiveness of the internal control over financial reporting to future periods are subject to the risk that the controls may become inadequate because of changes in conditions, or that the degree of compliance with the policies or procedures may deteriorate.
In our opinion, the Company maintained, in all material respects, effective internal control over financial reporting as of December 31, 2010, based on the criteria established in
Internal Control — Integrated Framework
issued by the Committee of Sponsoring Organizations of the Treadway Commission.
We have also audited, in accordance with the standards of the Public Company Accounting Oversight Board (United States), the consolidated financial statements and financial statement schedule as of and for the year ended December 31, 2010 of the Company and our report dated March 16, 2011 expressed an unqualified opinion on those financial statements and financial statement schedule.
/s/
Deloitte & Touche LLP
Los Angeles, California
March 16, 2011
66
Information responsive to this item will be set forth in the Company’s proxy statement for use in connection with its 2011 Annual Meeting of Stockholders (the “2011 Proxy Statement”) and is incorporated herein by reference. The 2011 Proxy Statement will be filed with the SEC within 120 days after the end of the Company’s fiscal year. The information under the heading “Executive Officers of the Registrant” in Item 1 of this Form 10-K is also incorporated by reference in this section.
Information responsive to this item will be set forth in the 2011 Proxy Statement to be filed with the SEC within 120 days after the end of the Company’s fiscal year and is incorporated herein by reference.
Information responsive to this item will be set forth in the 2011 Proxy Statement to be filed with the SEC within 120 days after the end of the Company’s fiscal year and is incorporated herein by reference.
Information responsive to this Item will be set forth in the 2011 Proxy Statement to be filed with the SEC within 120 days after the end of the Company’s fiscal year and is incorporated herein by reference.
Information responsive to this Item will be set forth in the 2011 Proxy Statement, to be filed with the SEC within 120 days after the end of the Company’s fiscal year and is incorporated herein by reference.
67
(a) List of documents filed as part of this report
1. Financial Statements:
Report of Independent Registered Public Accounting Firm
Consolidated Balance Sheets at December 31, 2010 and 2009
Consolidated Statements of Operations and Comprehensive Income (Loss) for the Years Ended December 31, 2010, 2009 and 2008
Consolidated Statements of Stockholders’ Equity for the Years Ended December 31, 2010, 2009 and 2008
Consolidated Statements of Cash Flows for the Years Ended December 31, 2010, 2009 and 2008
Notes to Consolidated Financial Statements
2.
Financial Statement Schedule:
Schedule II—Valuation and Qualifying Accounts
Schedules other than those referred to above have been omitted because they are not applicable or not required under the instructions contained in
Regulation S-X or
because the information is included elsewhere in the financial statements or notes thereto.
(b) Exhibits
See Index to Exhibits.
68
Pursuant to the requirements of the Section 13 or 15(d) of the Securities and Exchange Act of 1934, the registrant has duly caused this to report to be signed on its behalf by the undersigned, thereunto duly authorized, on this 16th day of March 2011.
|
ON ASSIGNMENT, INC.
|
|

|
|
|
Peter T. Dameris
|
|
|
Chief Executive Officer and President
|
Pursuant to the requirements of the Securities Exchange Act of 1934, this report has been signed below by the following persons on behalf of the registrant and in the capacities indicated and on the dates indicated.
|
Signature
|
Title
|
Date
|
||
|
|
Chief Executive Officer, President and Director
|
March 16, 2011
|
||
|
Peter T. Dameris
|
(Principal Executive Officer)
|
|||

|
Senior Vice President, Finance and Chief Financial Officer
|
March 16, 2011
|
||
|
James L. Brill
|
(Principal Financial and Accounting Officer)
|
|||
|
/s/ William E. Brock
|
Director
|
March 16, 2011
|
||
|
William E. Brock
|
||||
|
/s/ Jonathan S. Holman
|
Director
|
March 16, 2011
|
||
|
Jonathan S. Holman
|
||||
|
/s/ Edward L. Pierce
|
Director
|
March 16, 2011
|
||
|
Edward L. Pierce
|
||||
|
/s/ Jeremy M. Jones
|
Director
|
March 16, 2011
|
||
|
Jeremy M. Jones
|
69
SCHEDULE II—VALUATION AND QUALIFYING ACCOUNTS
Year Ended December 31, 2010, 2009 and 2008
(In thousands)
|
Description
|
Balance at beginning of year
|
Acquired balances
|
Provisions
|
Deductions from reserves
|
Balance at end of year
|
||||||||||||||
|
Year ended December 31, 2010
|
|||||||||||||||||||
|
Allowance for doubtful accounts and billing adjustments
|
$ | 1,949 | — | 644 | (418 | ) | $ | 2,175 | |||||||||||
|
Workers’ compensation and medical malpractice loss reserves
|
$ | 10,349 | — | 4,310 | (4,415 | ) | $ | 10,244 | |||||||||||
|
Year ended December 31, 2009
|
|||||||||||||||||||
|
Allowance for doubtful accounts and billing adjustments
|
$ | 2,443 | — | 296 | (790 | ) | $ | 1,949 | |||||||||||
|
Workers’ compensation and medical malpractice loss reserves
|
$ | 9,754 | — | 4,283 | (3,688 | ) | $ | 10,349 | |||||||||||
|
Year ended December 31, 2008
|
|||||||||||||||||||
|
Allowance for doubtful accounts and billing adjustments
|
$ | 2,254 | — | 641 | (452 | ) | $ | 2,443 | |||||||||||
|
Workers’ compensation and medical malpractice loss reserves
|
$ | 8,921 | — | 5,384 | (4,551 | ) | $ | 9,754 | |||||||||||
70
INDEX TO EXHIBITS
|
Number
|
Footnote
|
Description
|
||
|
2.2
|
(15)
|
Stock Purchase Agreement, dated as of December 20, 2006, by and among On Assignment, Inc., VSS Holding, Inc., the stockholders of VSS Holding, Inc. and the optionholders of VSS Holding, Inc.
|
||
|
3.1
|
(1)
|
Certificate of Amendment of Restated Certificate of Incorporation of On Assignment, Inc.
|
||
|
3.2
|
(2)
|
Restated Certificate of Incorporation of On Assignment, Inc., as amended.
|
||
|
3.3
|
(3)
|
Amended and Restated Bylaws of On Assignment, Inc.
|
||
|
4.1
|
(4)
|
Specimen Common Stock Certificate.
|
||
|
4.2
|
(9)
|
Rights Agreement, dated June 4, 2003, between On Assignment, Inc. and U.S. Stock Transfer Corporation as Rights Agent, which includes the Certificate of Designation, Preferences and Rights of Series A Junior Participating Preferred Stock as Exhibit A, the Summary of Rights to Purchase Series A Junior Participating Preferred Stock as Exhibit B and the Form of Rights Certificate as Exhibit C.
|
||
|
10.1
|
(13)
|
Form of Indemnification Agreements.
†
|
||
|
10.2
|
(12)
|
Restated 1987 Stock Option Plan, as amended and restated April 7, 2006.
†
|
||
|
10.3
|
(13)
|
First Amendment to Restated 1987 Stock Option Plan, dated January 23, 2007.
†
|
||
|
10.4
|
(12)
|
Second Amendment to the Restated 1987 Stock Option Plan, dated April 17, 2007.
†
|
||
|
10.5
|
(17)
|
Third Amendment to the Restated 1987 Stock Option Plan, dated December 11, 2008.
†
|
||
|
10.6
|
(12)
|
2010 Employee Stock Purchase Plan, dated March 18, 2010. †
|
||
|
10.7
|
(12)
|
On Assignment, Inc. 2010 Incentive Award Plan, dated March 18, 2010. †
|
||
|
10.8
|
(5)
|
Office Lease, dated December 7, 1993, by and between On Assignment, Inc. and Malibu Canyon Office Partners, LP.
|
||
|
10.9
|
(6)
|
Seventh Amendment to Office Lease, dated August 20, 2002.
|
||
|
10.10
|
(21)
|
Office Lease, dated August 18, 2010, by and between On Assignment, Inc. and Calabasas BDC, Inc.
|
||
|
10.11
|
(22)
|
On Assignment, Inc. Amended and Restated Change in Control Severance Plan and Summary Plan Description.
†
|
||
|
10.12
|
(8)
|
On Assignment, Inc. Amended and Restated Deferred Compensation Plan, effective January 1, 1998.
†
|
||
|
10.13
|
(16)
|
Amendment No. 1 to the On Assignment, Inc. Amended and Restated Deferred Compensation Plan, dated September 4, 2008.
†
|
||
|
10.14
|
(8)
|
Master Trust Agreement for On Assignment, Inc. Amended and Restated Deferred Compensation Plan.
|
||
|
10.15
|
(16)
|
On Assignment, Inc. Deferred Compensation Plan, effective January 1, 2008.
†
|
||
|
10.16
|
(19)
|
Amended and Restated Senior Executive Agreement between On Assignment, Inc. and Peter Dameris, dated December 11, 2008.
†
|
||
|
10.17
|
(20)
|
First Amendment to Amended and Restated Senior Executive Agreement between On Assignment, Inc. and Peter Dameris, dated March 19, 2009.
†
|
||
|
10.18
|
(22)
|
Senior Executive Agreement between On Assignment, Inc. and Peter Dameris, dated November 4, 2009.
†
|
||
|
10.19
|
(23)
|
First Amendment to Senior Executive Agreement, dated March 30, 2010 by and between On Assignment, Inc. and Peter Dameris. †
|
||
|
10.20
|
(19)
|
Amended and Restated Employment Agreement between Oxford Global Resources, Inc., On Assignment, Inc. and Michael J. McGowan dated December 30, 2008.
†
|
71
|
10.22
|
(19)
|
Amended and Restated Employment Agreement between VISTA Staffing Solutions, Inc., On Assignment, Inc. and Mark S. Brouse, dated December 11, 2008.
†
|
|||||||||||||
|
10.23
|
(19)
|
Amended and Restated Senior Executive Agreement between On Assignment, Inc. and Emmett McGrath, dated December 11, 2008.
†
|
|||||||||||||
|
10.24
|
(19)
|
Amended and Restated Executive Change in Control Agreement between On Assignment, Inc. and Peter T. Dameris, dated December 11, 2008.
†
|
|||||||||||||
|
10.25
|
(19)
|
Amended and Restated Executive Change in Control Agreement between On Assignment, Inc. and James L. Brill, dated December 11, 2008.
†
|
|||||||||||||
|
10.26
|
(7)
|
Form of Option Agreements.
|
|||||||||||||
|
10.27
|
(10)
|
Executive Incentive Compensation Plan.
†
|
|||||||||||||
|
10.28
|
(11)
|
Form of Restricted Stock Unit Agreements.
|
|||||||||||||
|
10.29
|
(14)
|
Credit Agreement among On Assignment, Inc., UBS Securities, LLC, UBS AG, Stamford Branch, UBS Loan Finance, LLC and other parties thereto, dated January 31, 2007.
|
|||||||||||||
|
10.30
|
(14)
|
Amendment No. 1 to Credit Agreement, dated as of March 27, 2009.
|
|||||||||||||
|
10.31
|
(13)
|
Form of On Assignment, Inc. Stock Option Agreement
†
|
|||||||||||||
|
10.32
|
(18)
|
Form of On Assignment, Inc. Restricted Stock Unit Award Agreement
†
|
|||||||||||||
|
10.33
|
(24)
|
Credit Agreement, dated as of December 3, 2010, among On Assignment, Inc., Bank of America, N.A., as administrative agent, swing line lender and letter of credit issuer, Wells Fargo Bank, N.A., as syndication agent, Union Bank, N.A. and BBVA Compass as co-documentation agents and the lenders party thereto.
|
|||||||||||||
|
21.1*
|
Subsidiaries of the Registrant.
|
||||||||||||||
|
23.1*
|
Consent of Independent Registered Public Accounting Firm.
|
||||||||||||||
|
31.1*
|
Certification of Peter T. Dameris, Chief Executive Officer and President pursuant to Rule 13a-14(a) or 15d-14(a).
|
||||||||||||||
|
31.2*
|
Certification of James L. Brill, Senior Vice President, Finance and Chief Financial Officer pursuant to Rule 13a-14(a) or 15d-14(a).
|
||||||||||||||
|
32.1*
|
Certification of Peter T. Dameris, Chief Executive Officer and President, and James L. Brill, Senior Vice President, Finance and Chief Financial Officer pursuant to 18 U.S.C. Section 1350.
|
||||||||||||||
|
|
|
|
|||||||||||||
|
*
|
Filed herewith.
|
|
†
|
These exhibits relate to management contracts or compensatory plans, contracts or arrangements in which directors and/or executive officers of the Registrant may participate.
|
|
(1)
|
Incorporated by reference from an exhibit filed with our Current Report on Form 8-K (File No. 0-20540) filed with the Securities and Exchange Commission on October 5, 2000.
|
|
(2)
|
Incorporated by reference from an exhibit filed with our Annual Report on Form 10-K (File No. 0-20540) filed with the Securities and Exchange Commission on March 30, 1993.
|
|
(3)
|
Incorporated by reference from an exhibit filed with our Current Report on Form 8-K (File No. 0-20540) filed with the Securities and Exchange Commission on May 3, 2002.
|
|
(4)
|
Incorporated by reference from an exhibit filed with our Registration Statement on Form S-1 (File No. 33-50646) declared effective by the Securities and Exchange Commission on September 21, 1992.
|
|
(5)
|
Incorporated by reference from an exhibit filed with our Annual Report on Form 10-K (File No. 0-20540) filed with the Securities and Exchange Commission on March 24, 1994.
|
|
(6)
|
Incorporated by reference from an exhibit filed with our Quarterly Report on Form 10-Q (File No. 0-20540) filed with the Securities and Exchange Commission on November 14, 2002.
|
72
|
(7)
|
Incorporated by reference from an exhibit filed with our Annual Report on Form 10-K (File No. 0-20540) filed with the Securities and Exchange Commission on March 16, 2005.
|
|
(8)
|
Incorporated by reference from an exhibit filed with our Quarterly Report on Form 10-Q (File No. 0-20540) filed with the Securities and Exchange Commission on May 15, 1998.
|
|
(9)
|
Incorporated by reference from an exhibit filed with our Current Report on Form 8-K (File No. 0-20540) filed with the Securities and Exchange Commission on June 5, 2003.
|
|
(10)
|
Incorporated by reference from an exhibit filed with our Current Report on Form 8-K (File No. 0-20540) filed with the Securities and Exchange Commission on April 1, 2005.
|
|
(11)
|
Incorporated by reference from an exhibit filed with our Current Report on Form 8-K (File No. 0-20540) filed with the Securities and Exchange Commission on August 8, 2005.
|
|
(12)
|
Incorporated by reference from our Proxy Statement on Schedule 14A filed with the Securities and Exchange Commission on April 27, 2010.
|
|
(13)
|
Incorporated by reference from an exhibit filed with our Annual Report on Form 10-K (File No. 0-20540) filed with the Securities and Exchange Commission on March 16, 2007.
|
|
(14)
|
Incorporated by reference from an exhibit filed with our Quarterly Report on Form 10-Q (File No. 0-20540) filed with the Securities and Exchange Commission on August 9, 2010.
|
|
(15)
|
Incorporated by reference from an exhibit filed with our Current Report on Form 8-K (File No. 0-20540) filed with the Securities and Exchange Commission on December 22, 2006.
|
|
(16
)
|
Incorporated by reference from an exhibit filed with our Current Report on Form 8-K (File No. 0-20540) filed with the Securities and Exchange Commission on September 9, 2008.
|
|
(17)
|
Incorporated by reference from an exhibit filed with our Current Report on Form 8-K (File No. 0-20540) filed with the Securities and Exchange Commission on December 16, 2008.
|
|
(18)
|
Incorporated by reference from an exhibit filed with our Current Report on Form 8-K (File No. 0-20540) filed with the Securities and Exchange Commission on March 30, 2009.
|
|
(19)
|
Incorporated by reference from an exhibit filed with our Annual Report on Form 10-K (File No. 0-20540) filed with the Securities and Exchange Commission on March 16, 2010.
|
|
(20)
|
Incorporated by reference from an exhibit filed with our Current Report on Form 8-K (File No. 0-20540) filed with the Securities and Exchange Commission on May 11, 2009.
|
|
(
21
)
|
Incorporated by reference from an exhibit filed with our Quarterly Report on Form 10-Q (File No. 0-20540) filed with the Securities and Exchange Commission on November 8, 2010.
|
|
(22)
|
Incorporated by reference from an exhibit filed with our Annual Report on Form 10-K (File No. 0-20540) filed with the Securities and Exchange Commission on March 16, 2010.
|
|
(23)
|
Incorporated by reference from an exhibit filed with our Quarterly Report on Form 10-Q (File No. 0-20540) filed with the Securities and Exchange Commission on May 10, 2010.
|
|
(24)
|
Incorporated by reference from an exhibit filed with our Current Report on Form 8-K (File No. 0-20540) filed with the Securities and Exchange Commission on December 8, 2010.
|
73
TABLE OF CONTENTS
Part IItem 1. BusinessItem 1A. Risk FactorsItem 1B. Unresolved Staff CommentsItem 2. PropertiesItem 3. Legal ProceedingsItem 4. Removed and ReservedPart IIItem 5. Market For Registrant S Common Equity, Related Stockholder Matters and Issuer Purchases Of Equity SecuritiesItem 6. Selected Financial DataItem 7 - Management S Discussion and Analysis Of Financial Condition and Results Of OperationsItem 7A. Quantitative and Qualitative Disclosures About Market RiskItem 8. Financial Statements and Supplementary DataItem 9. Changes in and Disagreements with Accountants on Accounting and Financial DisclosureItem 9A. Controls and ProceduresItem 9B. Other InformationPart IIIItem 10. Directors, Executive Officers and Corporate GovernanceItem 11. Executive CompensationItem 12. Security Ownership Of Certain Beneficial Owners and Management and Related Stockholder MattersItem 13. Certain Relationships and Related Transactions and Director IndependenceItem 14. Principal Accountant Fees and ServicesPart IVItem 15. Exhibits and Financial Statement Schedules