United States
Securities and Exchange Commission
Washington, D.C. 20549
Form 20-F
ANNUAL REPORT PURSUANT TO SECTION 13 OR 15(d)
OF THE SECURITIES EXCHANGE ACT OF 1934
for the fiscal year ended December 31,
2018
Commission file number 001-33463
ASML HOLDING N.V.
(Exact Name of Registrant as Specified in Its Charter)
THE NETHERLANDS
(Jurisdiction of Incorporation or Organization)
DE RUN 6501
5504 DR VELDHOVEN
THE NETHERLANDS
(Address of Principal Executive Offices)
Skip Miller
Telephone: +1 480 235 0934
E-mail: skip.miller@asml.com
2650 W Geronimo Place
Chandler, AZ 85224, USA
(Name, Telephone, E-mail, and / or Facsimile number and Address of Company Contact Person)
Securities registered or to be registered pursuant to Section 12(b) of the Act:
Title of each class Name of each exchange on which registered
Ordinary Shares The NASDAQ Stock Market LLC
(nominal value EUR 0.09 per share)
Securities registered or to be registered pursuant to Section 12(g) of the Act:
None
(Title of Class)
Securities for which there is a reporting obligation pursuant to Section 15(d) of the Act:
None
(Title of Class)
Indicate the number of outstanding shares of each of the issuer’s classes of
capital or common stock as of the close of the period covered by the annual report.
421,097,729
Ordinary Shares
(nominal value EUR 0.09 per share)
Indicate by check mark if the registrant is a well-known seasoned issuer, as defined in Rule 405 of the Securities Act.
Yes (x) No ( )
If this report is an annual or transition report, indicate by check mark if the registrant
is not required to file reports pursuant to Section 13 or 15(d) of the Securities Exchange Act of 1934.
Yes ( ) No (x)
Indicate by check mark whether the registrant: (1) has filed all reports required to be filed by Section 13 or 15(d) of the
Securities Exchange Act of 1934 during the preceding 12 months (or for such shorter period that the registrant
was required to file such reports), and (2) has been subject to such filing requirements for the past 90 days.
Yes (x) No ( )
Indicate by check mark whether the registrant has submitted electronically
every Interactive
Data File required to be submitted pursuant to Rule
405 of Regulation S-T (§232.405 of this chapter) during the
preceding 12 months (or for such shorter period that the registrant was required to submit such files).
Yes (x) No ( )
Indicate by check mark whether the registrant is a large accelerated filer, an accelerated filer,
a non-accelerated filer, or an emerging growth company
.
See definition of "
large accelerated filer,” “accelerated filer," and “emerging growth company
" in Rule 12b-2 of the Exchange Act. (Check one):
Large accelerated filer (x) Accelerated filer ( ) Non-accelerated filer ( ) Emerging growth company ( )
If an emerging growth company that prepares its financial statements in accordance with U.S. GAAP, indicate by check mark if the registrant has elected not to use the extended transition period for complying with any new or revised financial accounting standards provided pursuant to Section 13(a) of the Exchange Act. ( )
Indicate by check mark which basis of accounting the registrant has used to prepare
the financial statements included in this filing:
U.S. GAAP (x) International Financial Reporting Standards as issued by the
International Accounting Standards Board ( ) Other ( )
If "Other" has been checked in response to the previous question, indicate by check mark
which financial statement item the registrant has elected to follow.
If this is an annual report, indicate by check mark whether the registrant is a
shell company (as defined in Rule 12b-2 of the Exchange Act)
Yes ( ) No (x)
Name and address of person authorized to receive notices and communications
from the Securities and Exchange Commission:
James A. McDonald
Skadden, Arps, Slate, Meagher & Flom (UK) LLP
40 Bank Street, Canary Wharf London E14 5DS England
ASML INTEGRATED REPORT 2018
ASML INTEGRATED REPORT 2018


Contents
|
Message from our CEO
|
|
|
Highlights
|
|
|
Management Board Report
|
|
|
Board of Management
|
|
|
The Role of Lithography
|
|
|
Our Company
|
|
|
Industry Trends and Opportunities
|
|
|
Business Strategy
|
|
|
Products and Technology
|
|
|
People
|
|
|
Partners
|
|
|
Operations
|
|
|
Financial Performance
|
|
|
Trend Information
|
|
|
Business Risk and Continuity
|
|
|
Risk Factors
|
|
|
Materiality Assessment
|
|
|
Business Ethics and Compliance
|
|
|
Supervisory Board Report
|
|
|
63
|
Supervisory Board
|
|
65
|
Introduction
|
|
65
|
Activities in 2018
|
|
66
|
Meetings and Attendance
|
|
67
|
Composition, Diversity and Independence
|
|
68
|
Evaluation
|
|
68
|
Supervisory Board Committees
|
|
70
|
Remuneration of the Supervisory Board
|
|
70
|
A Word of Thanks to ASML Employees
|
|
72
|
Remuneration Report
|
|
Corporate Governance
|
|
|
General
|
|
|
Board of Management
|
|
|
Supervisory Board
|
|
|
85
|
Shareholders and General Meeting of Shareholders
|
|
85
|
The Audit of Financial Reporting and the Position of the Internal and External Auditor Function
|
|
88
|
Other Information on Governance
|
|
92
|
Compliance with the Corporate Governance Code
|
|
Consolidated Financial Statements
|
|
|
Consolidated Statements of Operations
|
|
|
Consolidated Statements of Comprehensive Income
|
|
|
Consolidated Balance Sheets
|
|
|
Consolidated Statements of Shareholders’ Equity
|
|
|
Consolidated Statements of Cash Flows
|
|
|
Notes to the Consolidated Financial Statements
|
|
|
Report of Independent Registered Public Accounting Firm
|
|
|
Non-Financial Statements
|
|
|
About the Non-financial Information
|
|
|
Non-financial Indicators
|
|
|
Stakeholder Engagement
|
|
|
Assurance Report of the Independent Auditor
|
|
ASML INTEGRATED REPORT 2018
|
Other Appendices
|
|
|
Appendix - Board of Management and Supervisory Board Remuneration
|
|
|
Appendix - Selected Financial Data
|
|
|
Appendix - Results of Operations 2017 Compared to 2016
|
|
|
Appendix - Principal Accountant Fees and Services
|
|
|
Appendix - Property, Plant and Equipment
|
|
|
Appendix - Taxation
|
|
|
Appendix - Financing and Capital Return Policy
|
|
|
Appendix - Competition
|
|
|
Appendix - Government Regulation
|
|
|
Appendix - Offer and Listing Details
|
|
|
Appendix - Material Contracts
|
|
|
Appendix - Exchange Controls
|
|
|
Appendix - Documents on Display
|
|
|
Appendix - Controls and Procedures
|
|
|
Appendix - Information and Investor Relations
|
|
|
Appendix - ASML Worldwide Contact Information
|
|
|
Appendix - Reference Table 20-F
|
|
|
Definitions
|
|
|
Exhibit Index
|
|
A definition or explanation of abbreviations, technical terms and other terms used throughout this Integrated Report that require explanation can be found in the chapter
Definitions
. In some cases numbers have been rounded for readers' convenience.
This report comprises regulated information within the meaning of articles 1:1 and 5:25c of the Dutch Financial Markets Supervision Act
(Wet op het Financieel Toezicht)
.
On
November 22, 2016
, we acquired 100 percent of the issued share capital of HMI. Financial information presented in our Integrated Report includes HMI from
November 22, 2016
onwards.
On
June 29, 2017
, we completed the acquisition of a
24.9 percent
interest in Carl Zeiss SMT Holding GmbH & Co. KG, which owns 100 percent of the shares in Carl Zeiss SMT GmbH
.
We record the results from the interest in Carl Zeiss SMT Holding GmbH & Co. KG using a one-quarter time lag as the results are not available in time to record them in our concurrent period.
In this report the name ‘ASML’ is sometimes used for convenience in contexts where reference is made to ASML Holding N.V. and / or any of its subsidiaries and / or any
equity method investments
, as the context may require. The name is also used where no useful purpose is served by identifying the particular company or companies.
©
2018
, ASML Holding N.V. All Rights Reserved.
ASML INTEGRATED REPORT 2018
Special Note Regarding Forward-Looking Statements
In addition to historical information, this Integrated Report contains statements relating to our future business and / or results. These statements include certain projections, business trends and other matters that are "forward-looking" within the meaning of the Private Securities Litigation Reform Act of 1995. You can generally identify these statements by the use of words like "may", "will", "could", "should", "project", "believe", "anticipate", "expect", "plan", "estimate", "forecast", "potential", "intend", "continue" and variations of these words or comparable words. They appear in a number of places throughout this Integrated Report and include statements with respect to our expected trends and outlook, corporate priorities and strategy, including the potential pursuit of merger and acquisition activities in the future bookings, expected financial results and expected semiconductor industry trends and opportunities, including expected sales, EUV revenue, gross margin, capital expenditures, R&D and SG&A expenses, cash conversion cycle, target effective annualized tax rate, opportunity, the new wave of semiconductor devices and the expected introduction of the first set of such devices in 2019 and expected customer demand in specified market segments including memory, logic and foundry, expected annual revenue opportunity and potential in 2020 and for 2025, the expected impact of the fire experienced by one of our suppliers including the expected timing of recovery of financial impact, expected trends in the lithography system market, trends in DUV systems revenue and expected future DUV sales and Holistic Lithography and installed based management revenues, expected semiconductor market growth and growth in worldwide factory capacity, statements with respect to customer demand and the commitment of customers to High NA machines and to insert EUV into volume manufacturing by ordering systems and investing in preparation for high-volume production, statements with respect to Holistic Lithography roadmaps and roadmap acceleration, including the expected introduction of higher productivity systems in 2019 (including the expected shipment of NXE:3400C and expected timing thereof) and the expected benefits, statements with respect to commitments for systems sales orders, including expected timing of recognition of anticipated revenues and expected timing of shipment of first High NA systems, ASML’s commitment to secure system performance, shipments, and support for volume manufacturing, including availability, timing of and progress supporting EUV ramp and improving consistency, statements with respect to the expected benefits of EUV, including year-on-year cost reduction and system performance, and of the introduction of the new DUV system and expected demand for such system, the expected benefits of HMI’s e-beam metrology capabilities, including the expansion of ASML’s integrated Holistic Lithography solutions through the introduction of a new class of pattern fidelity control, the expected enhancement of pattern fidelity metrology, statements with respect to the expected benefits of the imec collaboration, including roadmap acceleration and potential for printing of even smaller nanoscale devices, statements with respect to ASML’s applications business, expected lower attrition rate in the near future, customer, partner and industry roadmaps, including shrink roadmaps and continued semiconductor process scaling, the development of High NA and its benefits, including offering at least 10 more years of development opportunity, the expected benefits of the indirect interest in Carl Zeiss SMT GmbH, statements with respect to DUV competitiveness, strategy alignment with international standards such as United Nations Sustainable Development Goals, statements with respect to the intention to keep driving innovation into the next decade and beyond, expected growth of our service business, expected shipments of systems, planned shipments of EUV tools, productivity of our tools and systems, including EUV productivity targets and goals, and system performance, expected industry adoption of EUV, supply chain and service capabilities, expected integration of use of supplier information in sourcing decisions, the development of EUV technology and EUV industrialization, the number and timing of EUV systems expected to be shipped, expected use of EUV systems in high-volume manufacturing and revenue recognition, enabling of high-volume manufacturing of next generation chips and higher performance chips at lower cost, shrink being a key driver supporting innovation and providing long-term industry growth, lithography enabling affordable shrink and delivering value to customers, expected industry trends and expected trends and opportunities in the business environment, including the expectation that semiconductor end-market growth will be fueled by innovation drivers such as 5G connectivity, artificial intelligence, autonomous driving and big data, the continuation of Moore’s law and the expectation that EUV will continue to enable Moore’s law and drive long term value for ASML beyond the next decade, dividend policy, our proposed dividend and intention to repurchase and cancel shares, including statements with respect to the share repurchase plan for 2018-2019, our expectation to continue to return cash to our shareholders through share buybacks and dividends and statements with respect to the expected impact of accounting standards, and statements with respect to the memorandum of understanding (MOU) executed with Nikon to settle litigation proceedings, including the expectation to enter into a definitive cross-license and settlement agreement and the terms of such agreements.
These forward-looking statements are not historical facts, but rather are based on current expectations, estimates, assumptions and projections about the business and our future financial results and readers should not place undue reliance on them. Forward-looking statements do not guarantee future performance, and actual results may differ materially from projected results as a result of certain risks, and uncertainties. These risks and uncertainties include, without limitation, those described under Management Board Report - Risk Factors. These forward-looking statements are made only as of the date of this Integrated Report. We do not undertake to update or revise the forward-looking statements, whether as a result of new information, future events or otherwise.
ASML INTEGRATED REPORT 2018
Message from our CEO
Dear stakeholders,
This has truly been a milestone year for ASML: 2018 has seen extraordinary growth, building on the heights of recent years. Our technology breakthroughs have helped us increase the performance of our newest generation of chip-making systems, which will allow customers to start high-volume production of next-generation chips. This will create huge value, helping technologies such as artificial intelligence, 5G connectivity, the Internet of Things and augmented reality to become part of everyday life and to solve some of society's major challenges.
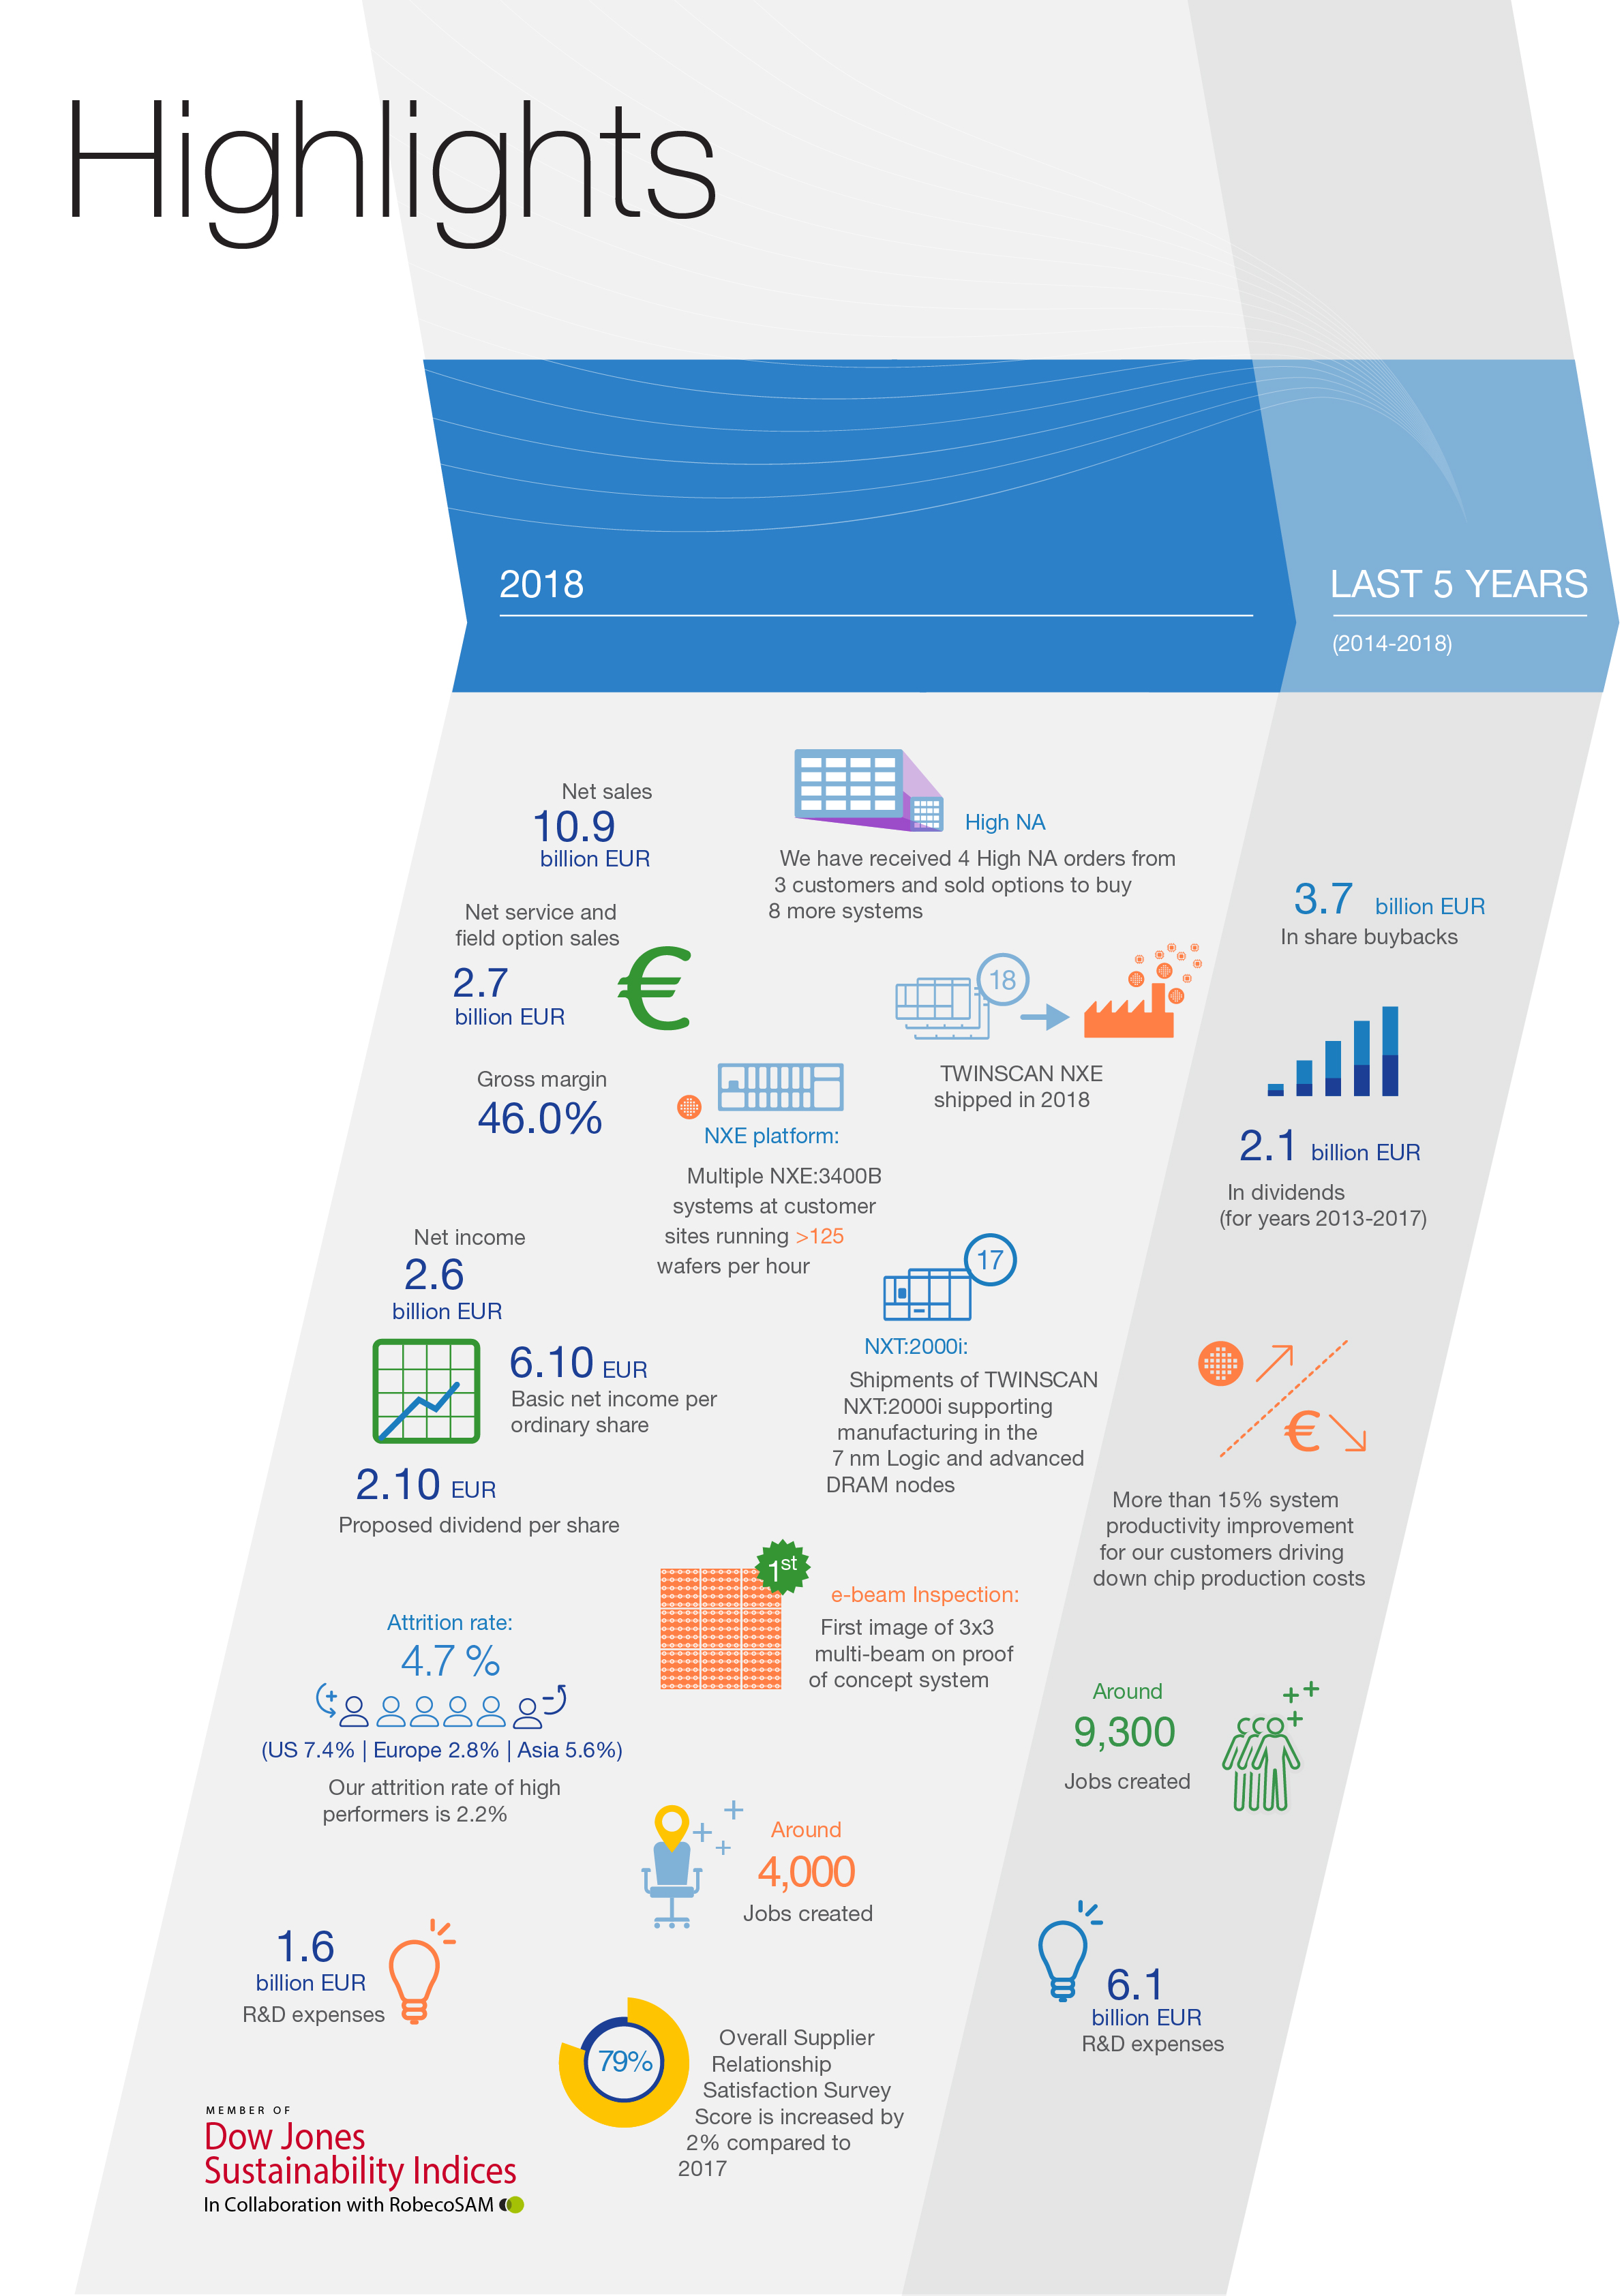
Our record net income of
EUR 2.6 billion
in 2018 underscores our growth path. With net sales of
EUR 10.9 billion
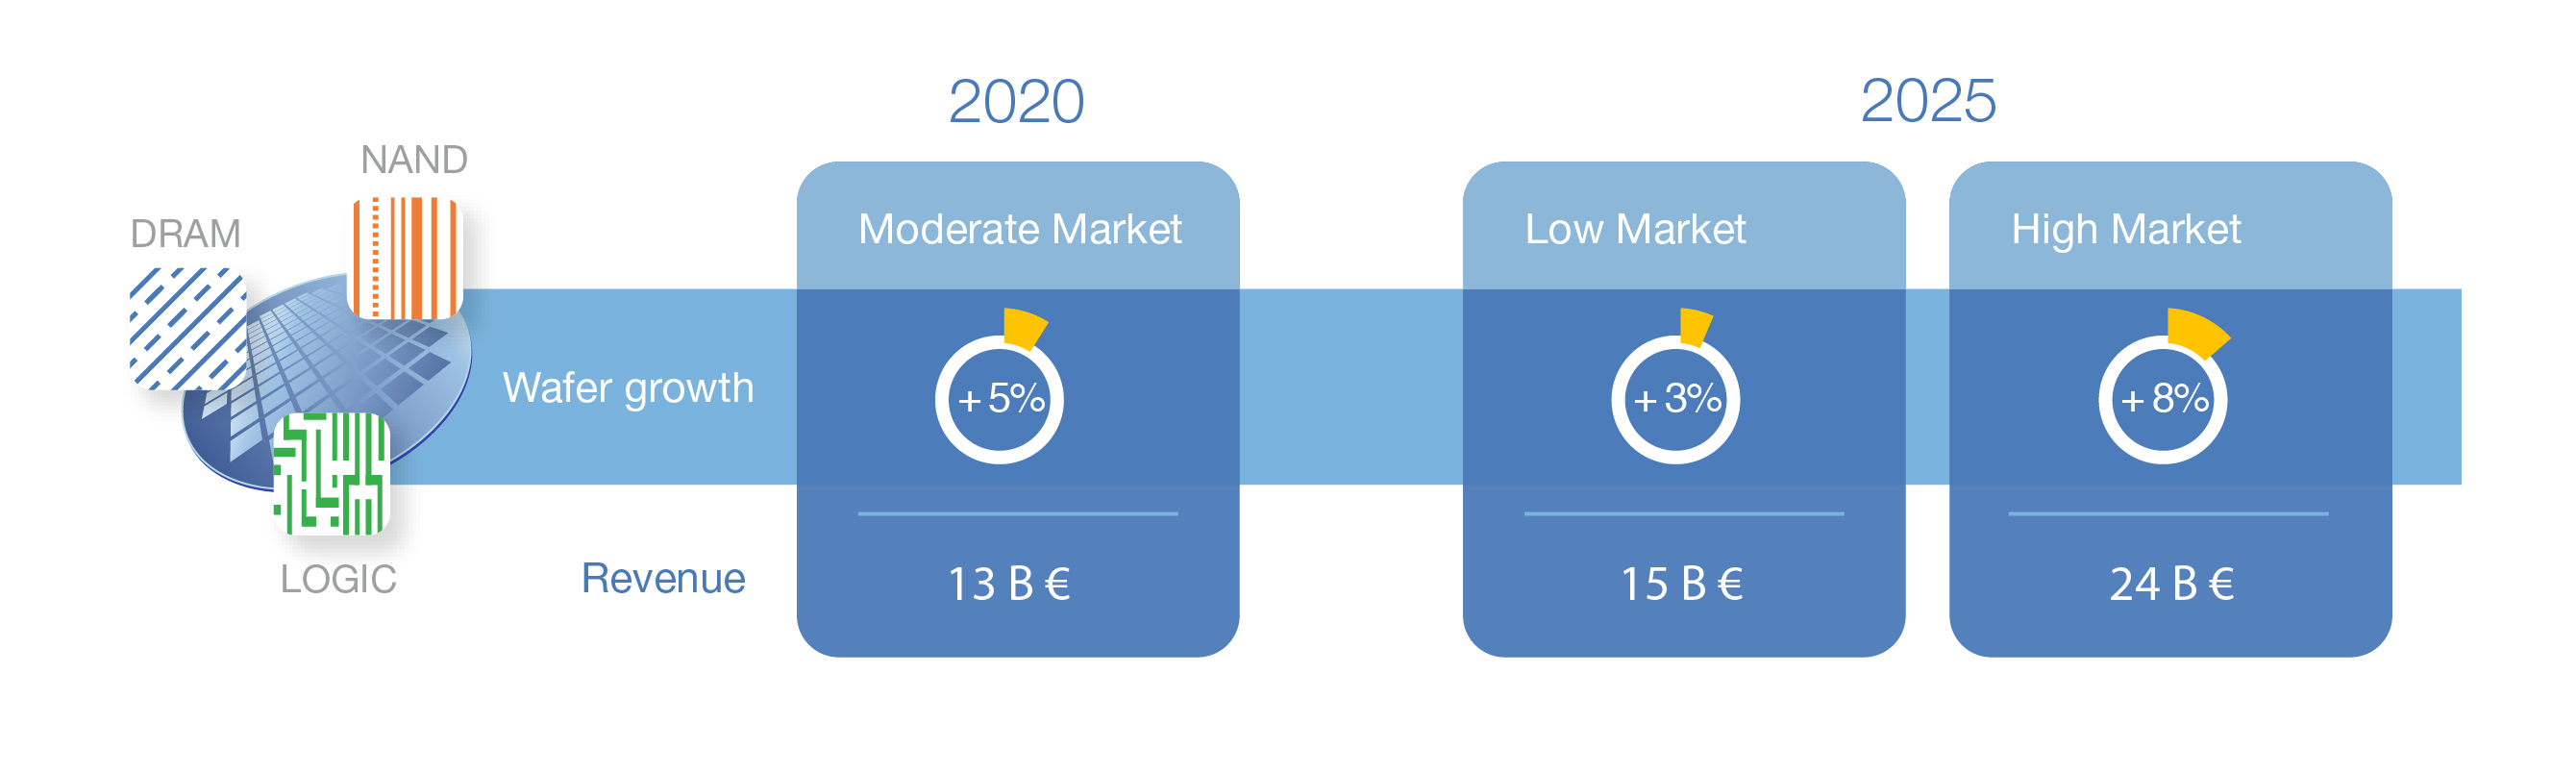
, we have nearly reached our initial sales target for 2020. Overall, we have a solid foundation to take us into the next decade, allowing us to update our target for 2020 to net sales of EUR 13 billion, based on a moderate market scenario.
ASML’s entire suite of products and services performed well in 2018, advancing the execution of our roadmap of our Holistic Lithography solutions. In line with our projections, we made progress in EUV profitability and continued to strengthen our DUV and Applications businesses. With EUV, all systems sold and shipped to customers meet the specifications that are able to support high-volume manufacturing.
Highlights in the DUV business include significant progress in the introduction of the TWINSCAN NXT:2000i, while in Applications, we adopted YieldStar 375 in 3D NAND manufacturing. We also made breakthroughs in implementing multi-beam technology, as part of our inspection and metrology product offering, which is a result of the synergy of pattern verification improvements in stage hardware and computational lithography software for the identification of critical inspection areas.
To support the industry driver of shrink well into the next decade, we accelerated our 0.33 NA EUV and are on track with our High NA EUV program, with major customers already committing themselves commercially to this technology. This is an indication that our strategy resonates with our customers and other stakeholders.
While helping the semiconductor industry to continue to realize Moore’s Law, we seek to contribute to realizing the United Nations Sustainability Development Goals that aim to protect the planet and end poverty, and will further align our 2019-2025 strategy with these goals. Our technological breakthroughs in 2018 enhance the energy efficiency of our products, as well as address challenges related to aging populations, healthcare and the energy transition, among others. Advanced chips use significantly less power than older-generation chips. Reuse of parts was also a critical focus area for us in 2018, and we are continually improving ways to reduce waste and extend the lifespan of our lithography systems.
We believe we are an integral part of the communities in which we operate, and this is key to our sustainable business model. We invest in these communities not only to make them more attractive for people to live and work in, but also to create strong ecosystems. ASML volunteers help local schools improve their technology and science education, to prepare the younger generations for a digitalized world. We support universities, research institutes and startups, as well as the ASML Foundation’s global education projects.
Of course, 2018 was not without its challenges. Geopolitical shifts are taking place, new global trade blocs are forming, and we are seeing signs of protectionism. We can only keep progressing through an open and global innovation model, and protectionism will hinder innovation. We strongly favor the free flow of people, trade and knowledge, while at the same time respecting ownership of that knowledge.
As we expand around the globe, recruiting and onboarding the right people, and seamlessly integrating them into our culture, also presents a challenge. We achieved successes here in 2018, creating 4,000 jobs and filling them with the best and brightest people, as well as providing a dynamic, nurturing workspace where our talent pool can learn and grow.
We are very pleased Roger Dassen joined us as our CFO. He brings to the position deep financial expertise and broad managerial experience. Roger succeeded Wolfgang Nickl, who left ASML at the end of April. Additionally, we are delighted to welcome Christophe Fouquet to the Board of Management, where he will lead business line EUV utilizing his extensive technology and business experience.
Looking ahead, we see yet more growth, with potential for net sales of EUR 15 billion in a low market scenario and net sales of EUR 24 billion in a high market scenario for 2025. The path is clear: we have the technology, people, customers, suppliers and partners. We will keep driving innovation for the good of all our stakeholders, and to help solve society’s challenges into the next decade and beyond.
Peter Wennink
President and Chief Executive Officer
Dated:
February 5, 2019
ASML INTEGRATED REPORT 2018
1
ASML Integrated Report 2018
ASML INTEGRATED REPORT 2018
3

All information disclosed in this
Management Board Report
is provided as a supplement to, and should be read in conjunction with, our
Corporate Governance
and
Consolidated Financial Statements
.
Board of Management


|
Peter T.F.M. Wennink (1957)
Term expires 2022 President, Chief Executive Officer and Chairman of the Board of Management |
|
l
|
Mr. Wennink joined ASML in 1999 and was appointed as Executive Vice President, CFO and member of our BoM at the 1999 AGM. Mr. Wennink was appointed as President and CEO in 2013.
|
|
l
|
Mr. Wennink has an extensive background in finance and accounting. Prior to his employment with ASML, Mr. Wennink worked as a partner at Deloitte Accountants B.V., specializing in the high-technology industry with an emphasis on the semiconductor equipment industry.
|
|
l
|
Mr. Wennink is a member of the Dutch Institute of Registered Accountants, a member of the supervisory board of the Eindhoven University of Technology, and a member of the Advisory Board of the Investment Committee of Stichting Pensioenfonds ABP (Dutch pension fund for government employees). Mr. Wennink further serves on the board of the FME-CWM (the employers’ organization for the technology industry in the Netherlands).
|
|
|
|

|
Martin A. van den Brink (1957)
Term expires 2022 President, Chief Technology Officer and Vice Chairman of the Board of Management |
|
l
|
Mr. Van den Brink joined ASML when the company was founded in 1984. Mr. Van den Brink held several positions in engineering and from 1995 he served as Vice President Technology. Mr. Van den Brink was appointed as Executive Vice President Product & Technology and member of the BoM at the 1999 AGM. Mr. Van den Brink was appointed as President and CTO in 2013.
|
|
l
|
Mr. Van den Brink earned a degree in Electrical Engineering from HTS Arnhem (HAN University), and a degree in Physics (1984) from the University of Twente, the Netherlands.
|
|
l
|
Mr. Van den Brink was awarded an honorary doctorate in physics by the University of Amsterdam, the Netherlands, in 2012.
|
|
|
|

|
Roger J.M. Dassen (1965)
Term expires 2022 Executive Vice President and Chief Financial Officer |
|
l
|
Mr. Dassen joined ASML in June, 2018 and was appointed as Executive Vice President and CFO and member of our BoM at the 2018 AGM.
|
|
l
|
Prior to joining ASML, Mr. Dassen was the Global Vice Chairman and member of the Executive Board of Deloitte Touche Tohmatsu Limited. Before that Mr. Dassen was the CEO of Deloitte Holding B.V.
|
|
l
|
Mr. Dassen earned a Master’s degree in Economics and Business Administration (1988), University of Maastricht; a post-master in Auditing (1990), University of Maastricht; and a PhD in Business Administration (1995).
|
|
l
|
Mr. Dassen is a professor of auditing at the Free University of Amsterdam and serves as a member of the supervisory board of The Dutch National Bank.
|
ASML INTEGRATED REPORT 2018
5

|
Frits J. van Hout (1960)
Term expires 2021 Executive Vice President and Chief Strategy Officer |
|
l
|
Mr. Van Hout joined ASML in 1984 and rejoined ASML in 2001, after an eight-year absence. He was appointed as Executive Vice President and Chief Marketing Officer and became a member of our BoM at the 2009 AGM. Mr. Van Hout served as Executive Vice President and Chief Program Officer from July 1, 2013 and was appointed Executive Vice President and Chief Strategy Officer effective April 1, 2018. Prior to his BoM membership, Mr. Van Hout served as ASML’s Executive Vice President Integral Efficiency, Senior Vice President Customer Support and held various other positions.
|
|
l
|
Mr. Van Hout served as CEO of the Beyeler Group and held various management positions at Datacolor International from 1992 until 2001.
|
|
l
|
Mr. Van Hout earned a Master’s degree in Theoretical Physics (1981), University of Oxford; and a Master’s degree in Applied Physics (1984), Eidgenössische Technische Hochschule, Zürich.
|
|
l
|
Mr. Van Hout is a member of the Board of the Stichting Brainport, the Eindhoven Region Economic Development Board.
|
|
|
|

|
Christophe D. Fouquet (1973)
Term expires 2022 Executive Vice President EUV |
|
l
|
Mr. Fouquet joined ASML in 2008 and was appointed as Executive Vice President EUV and became a member of our BoM at the 2018 AGM.
|
|
l
|
Mr. Fouquet has held several positions at ASML, including Executive Vice President Applications, which he has held from 2013 until 2018. Prior to joining ASML, Mr. Fouquet worked at semiconductor equipment peers KLA Tencor and Applied Materials.
|
|
l
|
Mr. Fouquet earned a degree in Physics at the Institut Polytechnique de Grenoble.
|
|
|
|

|
Frédéric J.M. Schneider-Maunoury (1961)
Term expires 2022 Executive Vice President and Chief Operations Officer |
|
l
|
Mr. Schneider-Maunoury joined ASML in December, 2009, as Executive Vice President and COO and was appointed to our BoM at the 2010 AGM.
|
|
l
|
Prior to joining ASML, Mr. Schneider-Maunoury served as Vice President Thermal Products Manufacturing of the power generation and rail transport equipment group ALSTOM. Previously, Mr. Schneider-Maunoury was general manager of the worldwide Hydro Business of ALSTOM. Mr. Schneider-Maunoury also held various positions at the French Ministry of Trade and Industry.
|
|
l
|
Mr. Schneider-Maunoury is a graduate of Ecole Polytechnique (1985) and Ecole Nationale Supérieure des Mines (1988) in Paris.
|
|
|
|
ASML INTEGRATED REPORT 2018
6
The Role of Lithography
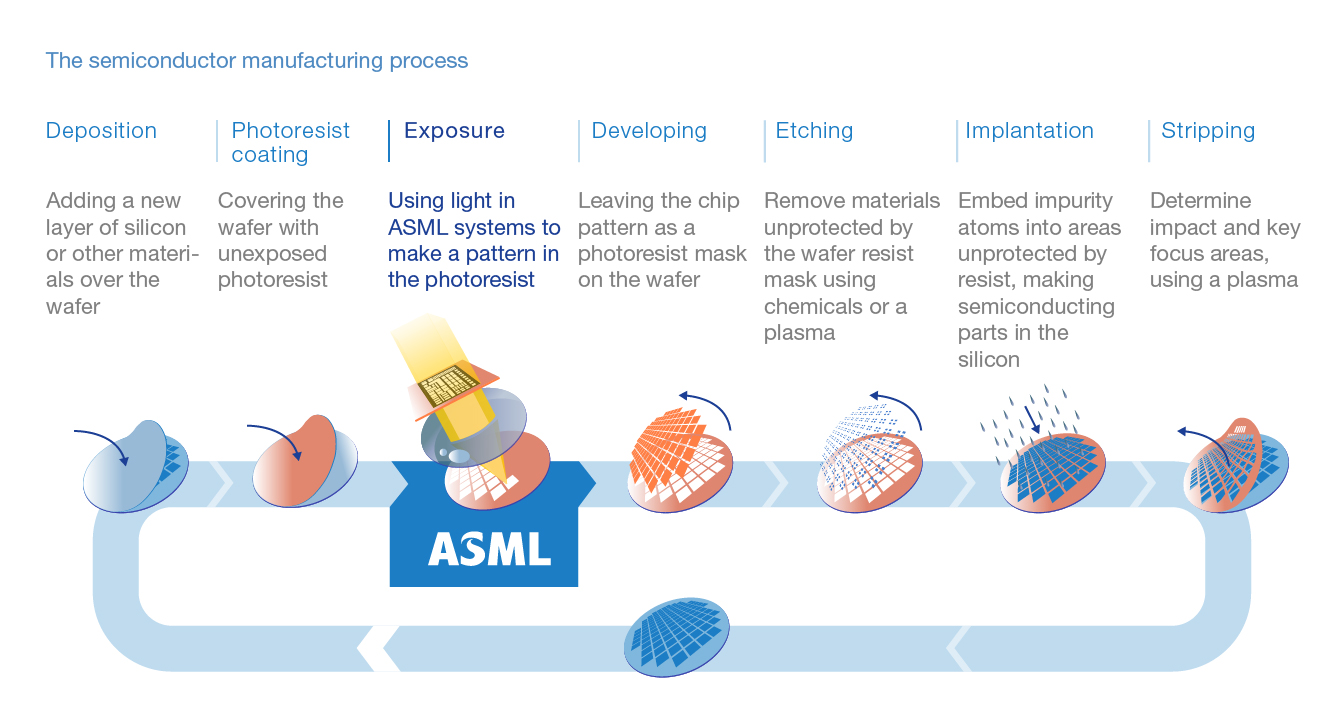
 Lithography is the critical process step in the production of microchips. Our systems are essentially projection systems, comparable to a slide projector, using laser light to lay out the transistors - the ‘brain cells’ of a microchip. The light is projected using a so-called mask (also known as a reticle), containing the blueprint of the pattern that will be printed. A lens or mirror focuses the pattern onto the wafer - a thin, round slice of semiconductor material - which is coated with a light-sensitive material. When the unexposed parts are etched away, the pattern is revealed. Because lithography patterns the structures on a microchip, lithography plays an important role in determining how small the features on the chip can be and how densely chip makers can pack transistors together.
Lithography is the critical process step in the production of microchips. Our systems are essentially projection systems, comparable to a slide projector, using laser light to lay out the transistors - the ‘brain cells’ of a microchip. The light is projected using a so-called mask (also known as a reticle), containing the blueprint of the pattern that will be printed. A lens or mirror focuses the pattern onto the wafer - a thin, round slice of semiconductor material - which is coated with a light-sensitive material. When the unexposed parts are etched away, the pattern is revealed. Because lithography patterns the structures on a microchip, lithography plays an important role in determining how small the features on the chip can be and how densely chip makers can pack transistors together.
ASML INTEGRATED REPORT 2018
7
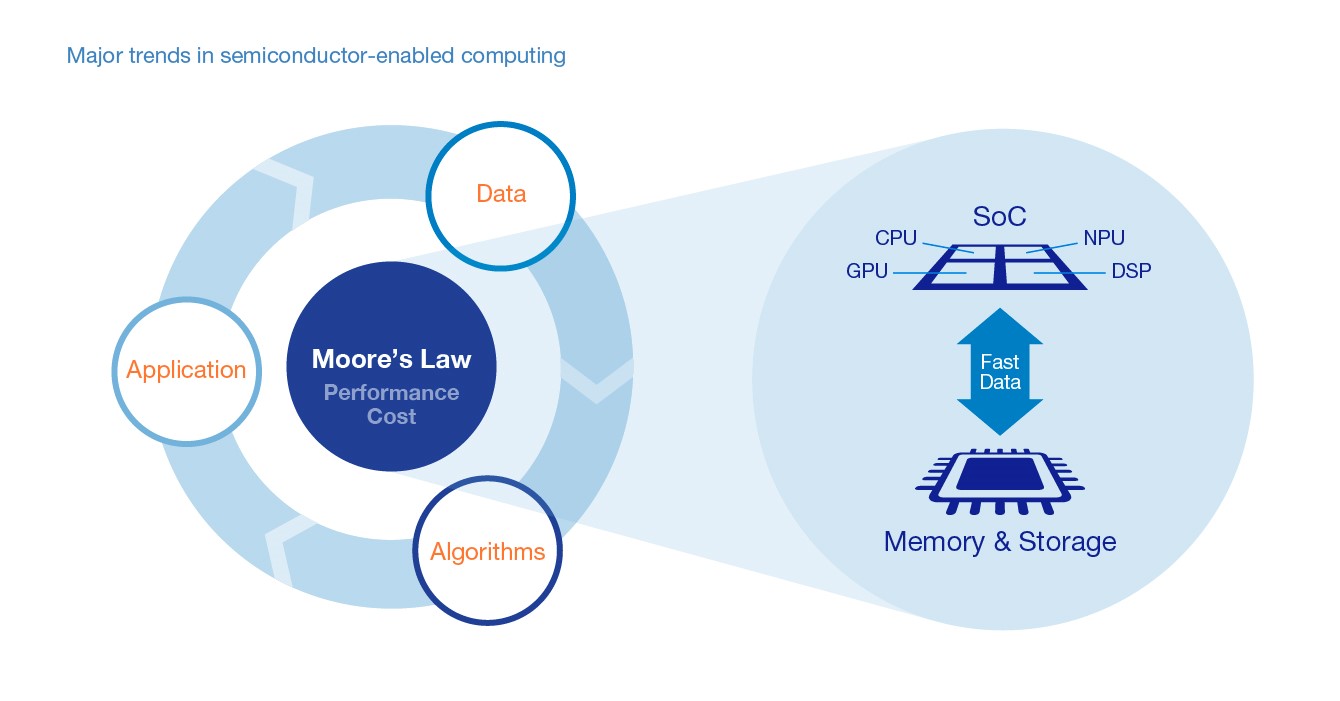
Faster, smaller, greener
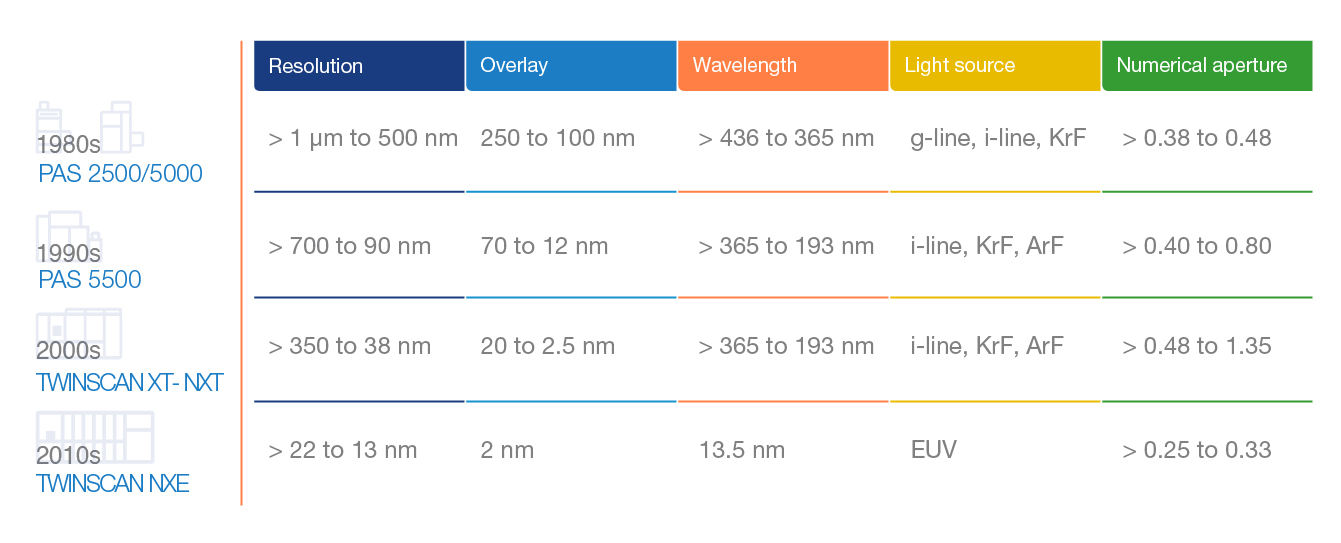
Our guiding principle is continuing Moore’s Law towards ever-smaller, cheaper, more powerful and energy-efficient semiconductors. The long-term growth of the semiconductor industry is based on the principle that the power, cost and time required for every computation on a digital electronic device can be reduced by shrinking the size of transistors on chips. One of the main drivers of shrink is the resolution that our systems can achieve. This, in turn, is mainly determined by the wavelength of the light that is used and the numerical aperture of the optics. A shorter wavelength - like a finer brush used for painting - can resolve smaller features. A larger numerical aperture can focus the light more tightly, which also leads to smaller resolution. The industry has gone through a series of technology transitions where it shortened the wavelength of the light from 365 nm (i-line) to 193 nm (ArF) in the DUV part of the spectrum. Currently ASML is helping customers to transition to 13.5 nm (EUV), which again allows lithography systems to resolve smaller features.
Leading-edge chip makers have routinely produced chip features with geometries of between 20 nm and 10 nm, compared to typical geometries of
10,000
nm in the early 1970s. The number of transistors on the most advanced microchips has increased from several thousand to over
6 billion
.
This trend was first observed by Intel co-founder Gordon Moore in 1965. Moore stated that chip makers could double the number of transistors in - and boost the performance of - a typical microprocessor every year, while maintaining the same cost. He later adjusted this to every 2 years. The trend has held for more than 50 years. The semiconductor industry continues to realize Moore’s Law, and our customers’ roadmaps require lithography-enabled shrink beyond the next decade, which is the time frame the industry has always used to plan its roadmap. In 2018, major chip makers were investing in and preparing for high volume-production with EUV. We expect the first commercial chips with EUV layers to be on the market in 2019.
Our Company
It is hard to imagine the world without microchips. They are at the heart of the devices that we use to work, travel, stay healthy and be entertained - from smartphones to cars, from MRI scanners to industrial robots. Delivering new functionalities, better performance and lower cost with each generation, advances in chips have spawned new products and transformed industries. New technologies and trends, such as artificial intelligence, 5G connectivity, augmented reality and the Internet of Things, result in additional demand for semiconductor chips to generate, transfer, store, analyze and apply vast amounts of data.
As one of the world’s leading manufacturers of chip-making equipment, ASML provides its customers with tools - hardware, software and services - to create the patterns that define the electronic circuits on a chip. As we improve our products, our customers can increase the value and reduce the cost of chips for their customers.
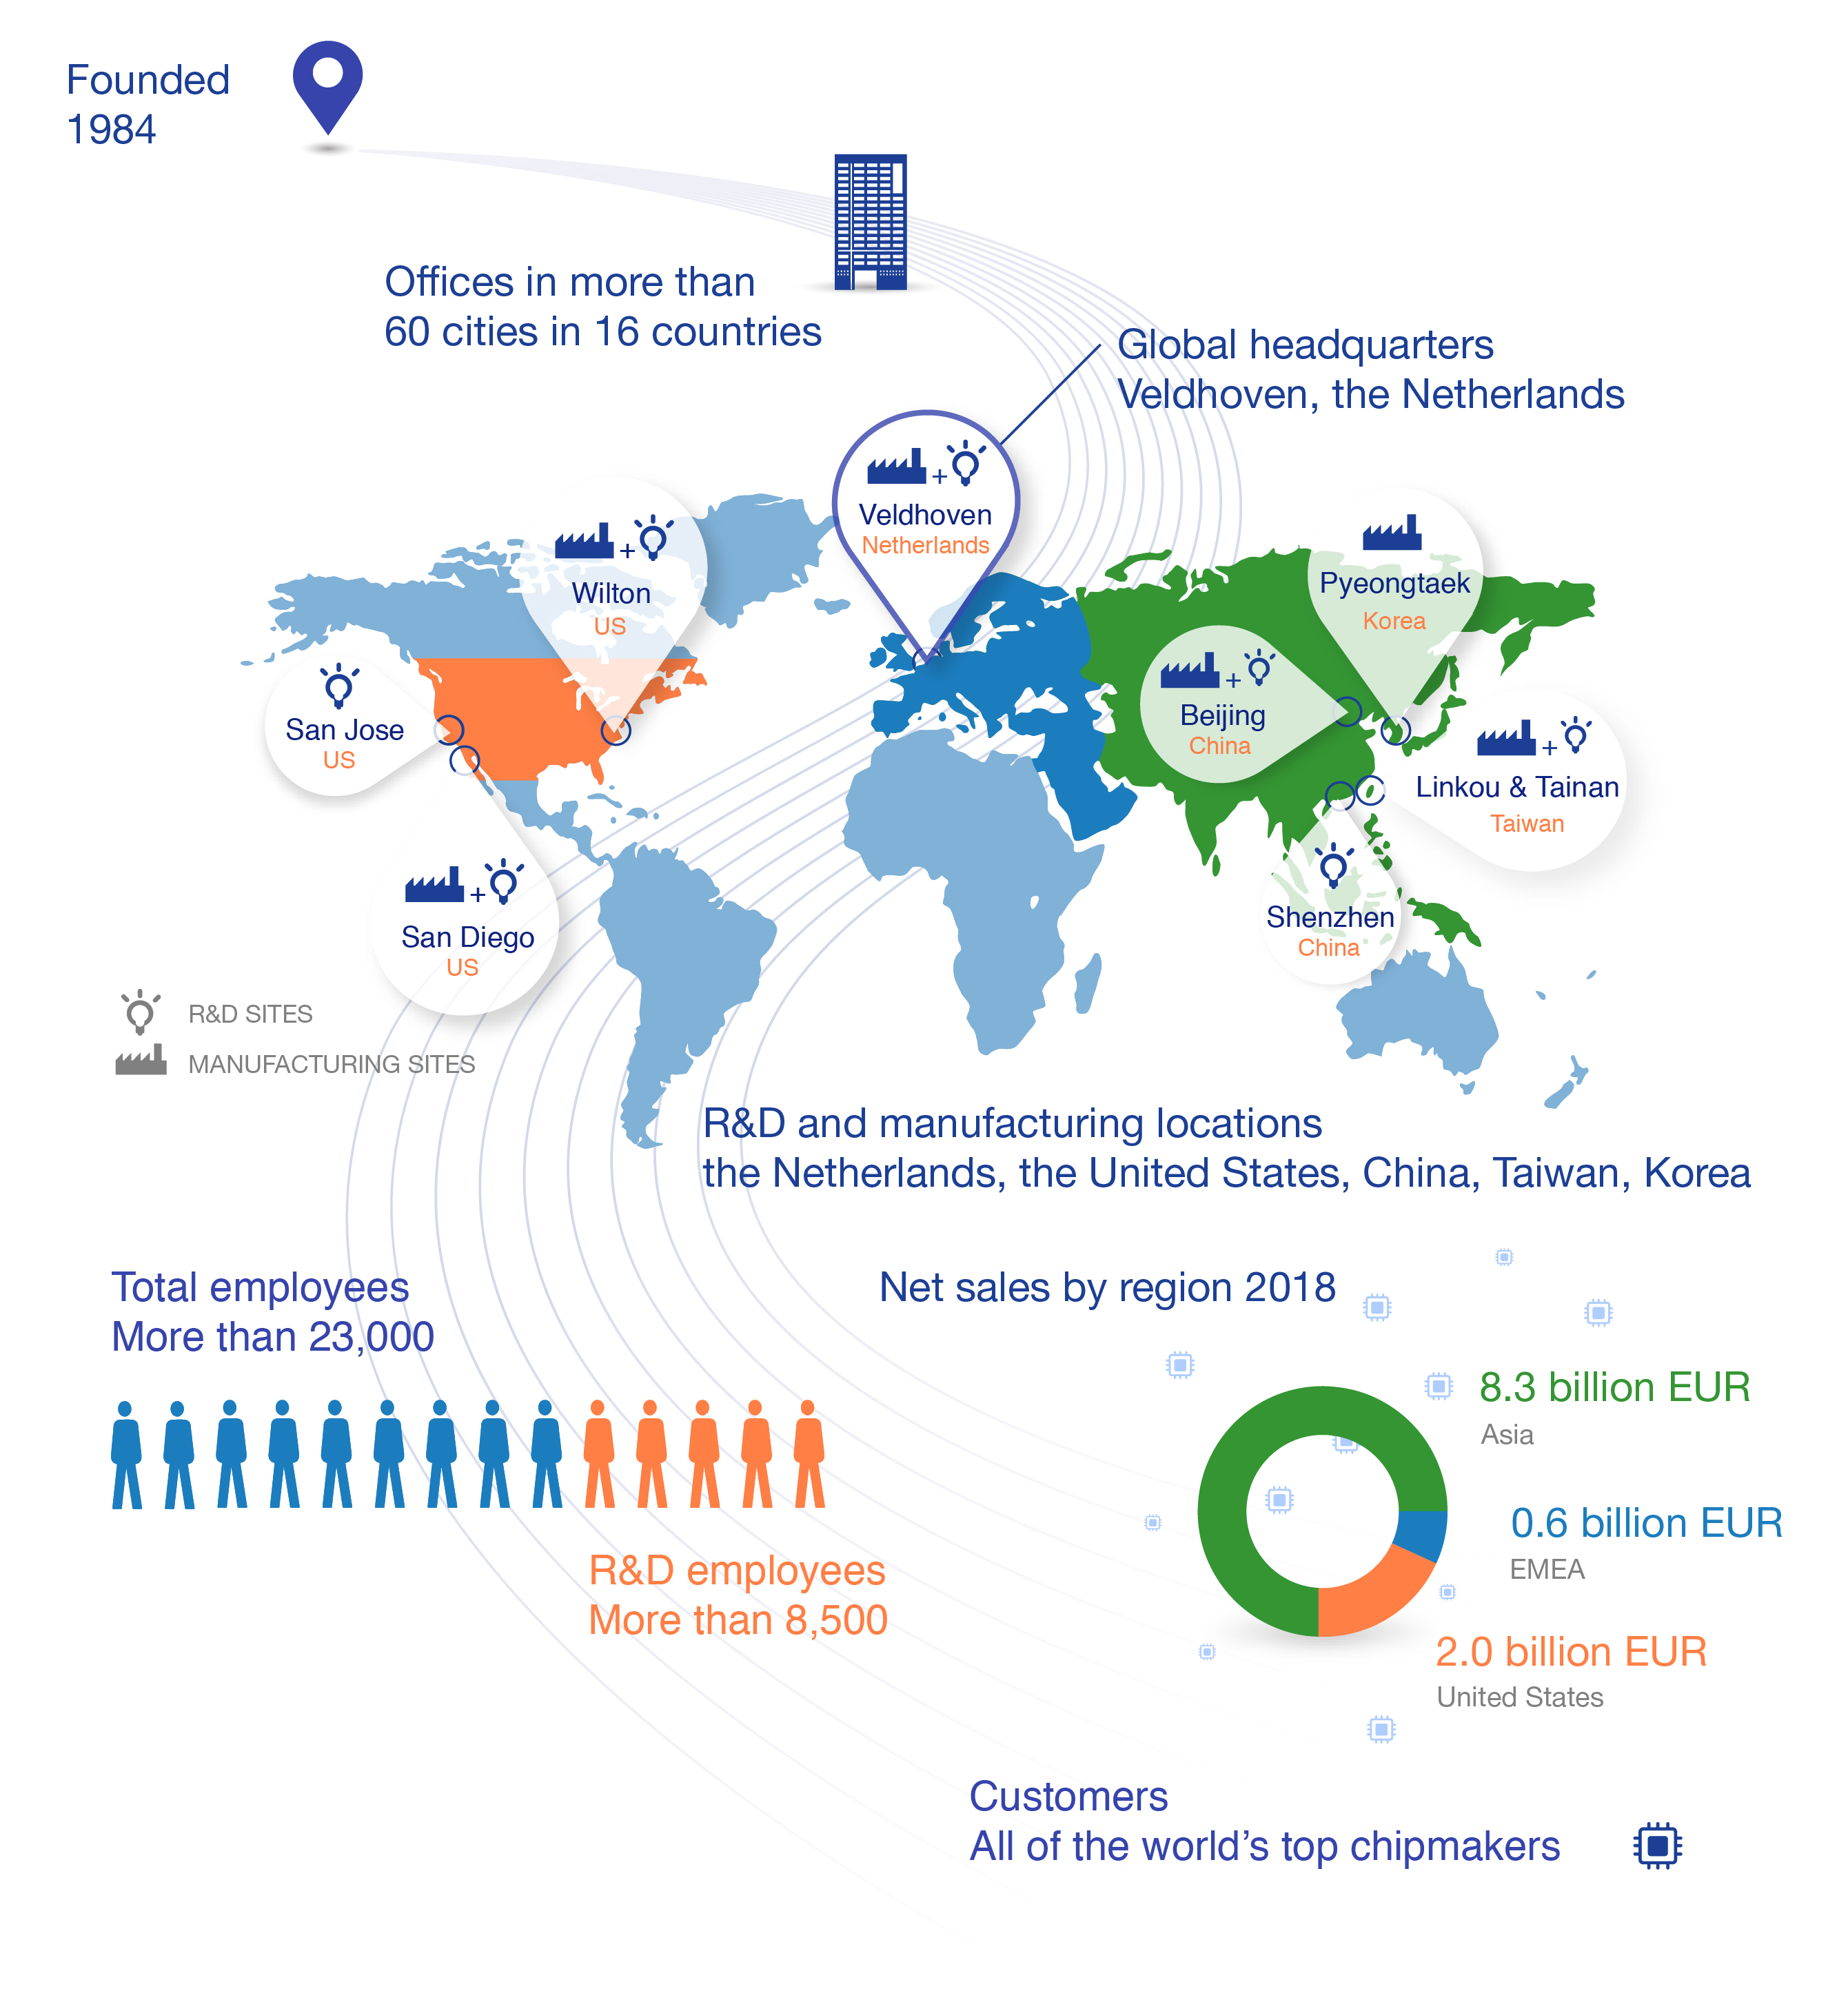
We are a global company with
23,247
employees and achieved total net sales of
EUR 10.9 billion
during 2018, resulting in a net income of
EUR 2.6 billion
. Our thousands of engineers work in multi-disciplinary teams and with a network of suppliers and technology partners, innovating to maintain our technology leadership. We set ourselves ambitious goals and take pride in the impact we have on the world around us.
ASML INTEGRATED REPORT 2018
8
A short company history
Our company was founded in 1984 in Eindhoven under the name of ASM Lithography. By 1985 we had grown into a company of more than 200 employees and moved to Veldhoven, where we have been headquartered ever since. In 1991, we launched our PAS 5500, which became a major success for ASML and continues to be in use today. After we incorporated as ‘ASM Lithography Holding N.V.’ in the Netherlands on October 3, 1994, we became a public company in 1995 with listings on NASDAQ and Euronext Amsterdam.
We continued our growth and technological advancement by acquiring the Silicon Valley Group in 2001, whose site in Wilton, Connecticut, in the US, is now a major R&D and manufacturing center. That same year we introduced our TWINSCAN system which, using ‘dual-stage’ technology, exposes one wafer while the next wafer is already being measured, maximizing performance and productivity. In 2001, we changed our name to ASML Holding N.V.
In 2007, we acquired Brion, a US company specialized in computational lithography for ICs, which became a cornerstone of our Holistic Lithography product strategy. In 2013, we acquired Cymer, a manufacturer of light sources in the US, to accelerate the development of the next-generation lithography technology, EUV. In 2016, we acquired HMI in Taiwan to further enhance our Holistic Lithography product portfolio.
In 2017, we acquired a 24.9 percent indirect interest in Carl Zeiss SMT GmbH in Germany, to facilitate the further development of our EUV systems.
ASML INTEGRATED REPORT 2018
9
Industry Trends and Opportunities
The exponential increase in data generation, transfer and storage is being complemented by new data analysis techniques and applications, which together are fueling industry growth and a new wave of semiconductor devices. These new drivers include technologies and applications such as 5G connectivity, Internet of Things (IoT), virtual assistants, autonomous driving, augmented and virtual reality, big data and artificial intelligence.
1
5G connectivity enables speeds up to 1,000 times faster than 4G mobile networks, supporting several of these new applications. We expect the first of these semiconductor devices will be introduced in 2019. Artificial intelligence is being enabled by the increasing processing capability of advanced semiconductors, reinforced by new classes of devices that are designed to support these applications, both at the edge in mobile devices, such as Neural Processing Units (NPUs), and in the cloud, with devices such as Google’s Tensor Processing Unit (TPU).
The importance of semiconductors in enabling these new applications is reflected in the move by leading technology companies like Google, Amazon and Microsoft to join companies like Apple, Samsung and Huawei in designing their own advanced ICs. These new growth engines complement the maturing smartphone, PC, laptop and tablet semiconductor market segments, which continue to refresh product offerings with more advanced ICs, to process and store more data and offer these new applications. This is expected to translate into semiconductor end-market growth, which in turn drives investments in technology upgrades and growth in worldwide factory capacity in all segments, especially at the leading-edge nodes.
To address these market requirements, our customers continue to invest in developing more advanced semiconductor processes to enable more powerful, energy-efficient, cost-effective logic and memory ICs. For further information on these markets, see
Management Board Report - Business Strategy - Our markets
. Industry and customers' roadmaps indicate a path for continued semiconductor process scaling beyond the next decade. We are addressing this trend by extending the accuracy and productivity of our TWINSCAN XT and NXT lithography systems while in parallel maturing TWINSCAN NXE lithography to the point where it can be used for high-volume IC manufacturing. To secure the tighter accuracy requirements for the more advanced processes we continue to develop enhancements to our YieldStar optical metrology systems and associated feedback and control software. This has been further strengthened with the acquisition of HMI in 2016 to provide higher resolution e-beam metrology and inspection capability.
Beyond technology and productivity our customers continue to focus on cost and quality of our products and services. To address this, we are investing in programs to enhance quality and drive lean processes in our development, manufacturing, field service and supply chain operations. See
Management Board Report - Operations - Operational excellence
and
Management Board Report - Operations - Quality
.
We believe these industry trends offer continued strong business opportunities for ASML for the coming 10 years and beyond. For a broader overview of trends, risks and opportunities in our industry and global environment, see
Management Board Report - Materiality Assessment
.
We also follow developments regarding international guidelines, such as the United Nations Sustainable Development Goals, which aim to end poverty, protect the planet and ensure prosperity for all. We support this ambition and aligned our strategy with certain United Nations Sustainable Development Goals. See also
Management Board Report - Materiality Assessment - Sustainable Development Goals
.
|
1.
|
Source: BI Intelligence, CCS Insights, Gartner.
|
ASML INTEGRATED REPORT 2018
10
Business Strategy
How we create value
ASML creates economic value with strong financial performance; social value by enhancing the welfare of our employees, suppliers, customers and the communities we operate in; and environmental value by improving the energy efficiency of chips.
Our value chain
Geared towards providing long-term value to our customers and other stakeholders, our value chain consists of our R&D partners, our supply chain and our manufacturing and service activities, as shown below:

Creating value
We use input from stakeholders and trends in our industry and society to develop our strategy, our products and services. As such, we aim to create long-term value for our customers and other stakeholders.

For details on the value we created in the past year, see
Management Board Report - Products and Technology
,
People
,
Partners
and
Operations
for our social and environmental impact and
Management Board Report - Financial Performance
for our economic impact. For the topics most relevant to our stakeholders see
Management Board Report - Materiality Assessment
and
Non-Financial Statements - Stakeholder Engagement
. For details on our value creation over the past five years see
Highlights
.
ASML INTEGRATED REPORT 2018
11
Our vision and mission

We see a world in which semiconductor technology is everywhere and helps to tackle society’s toughest challenges. We contribute to this goal by creating products and services that let our customers define the patterns that ICs are made of. We continuously raise our products' capabilities, which allows our customers to increase the value and reduce the cost of chips. By helping to make chips cheaper and more powerful, we make semiconductor technology more attractive for a larger range of products and services. This enables progress in fields such as healthcare, energy, mobility and entertainment.
Our strategy
We are a focused supplier of Holistic Lithography solutions, including patterning, metrology & inspection products and services, to IC manufacturers, providing high-performance hardware and software. This allows our customers to increase the value and capability of their microchips, while reducing their cost. We work with long-term partners to share the risk and reward of inventing, designing and manufacturing our high-end, market-leading technology. We set targets to get our innovations into the hands of our customers faster, while enhancing the value and reliability of our products with well-integrated software and services.
In determining our strategy, we carefully consider the input and interests of all of our stakeholders. See
Management Board Report - Materiality Assessment
. We also analyze the risk and opportunities based on the industry and global trends, and set strategic and corporate priorities, which aim to create value for all of our stakeholders. Our strategic priorities remain unchanged for 2019 and focus on the successful industrialization of EUV, securing our DUV competitiveness, building a leadership position in Holistic Lithography extension, and aligning the plan for the introduction of High NA with our customers and key technology providers.
The strategic priorities are translated into Corporate Priorities that guide our entire company.
ASML INTEGRATED REPORT 2018
12
The following table demonstrates how the execution of Corporate Priorities addresses our key risk areas and supports the themes material to our stakeholders in creating value for them.

|

|

|

|

|
||||||
|
Corporate
Priorities |
|
Corporate
Priority 1: |
Corporate
Priority 2: |
Corporate
Priority 3: |
Corporate
Priority 4: |
Corporate
Priority 5: |
||||
|
|
||||||||||
|
|
Execute the product and installed base services roadmap in Holistic Lithography
|
Deliver quality products and services that consistently meet or exceed the expectations as agreed with customers, reinforced by an ASML quality culture
|
Drive the patterning ecosystem with customers, suppliers and peers in target market segments
|
Improve return on investments for ASML and its stakeholders, with a focus on cost of ownership and cost awareness
|
Develop our people and processes to support the growth of the organization towards a EUR 13 billion revenue company by 2020
|
|||||
|
|
|
|||||||||
|
Related material themes
1
|
•
•
|
Innovation
Knowledge management
|
•
•
|
Sustainable relationships with customers
Operational excellence
|
•
•
•
|
Sustainable relationships with suppliers
Sustainable relationships with customers
Innovation
|
•
|
Financial performance
|
•
•
•
•
•
|
Employee safety
Business ethics & compliance
Talent management
Sustainable relationships with our people
Business risk & continuity
|
|
|
|
|
|
|
|
|
||||
|
Key related risks
2
|
•
•
|
Rapid and complex technological changes
Ability to execute our R&D programs
|
•
|
Product industrialization
|
•
•
•
|
Supplier dependency
Rapid and complex technological changes
Product industrialization
|
•
•
•
•
•
•
|
Success of new product introductions
High cyclicality of the semiconductor industry
Competition
High % of net sales derived from few customers
Revenues derived from a small number of products
Global trade issues
|
•
•
•
|
Attraction and retention of adequately skilled people
The growth of our organization
Use of hazardous substances
|
|
|
|
|
|
|
|
|
||||
|
Related KPIs
|
•
•
•
•
|
R&D expenses
Technology Leadership Index
Technical Competence and Functional Ownership maturity
Number of technical training hours
|
•
|
Customer Loyalty Survey Score
|
•
•
|
Supplier Relationship Satisfaction Survey Score
VLSI Survey Results
|
•
•
•
•
•
|
Total net sales
Gross margin
EPS
Cash flow
ROAIC
|
•
•
•
•
|
Employee engagement
Employee attrition rate (overall, high performers)
Promotion rate of high performers
Recordable incident rate
|
|
|
|
|
|
|
|
|
||||
|
Related impact areas
3
|
•
•
•
•
|
Affordable technology
Knowledge creation & sharing
Resource efficient chips
Financial performance
|
•
•
|
Affordable technology
Financial performance
|
•
•
•
•
•
|
Employment creation
Affordable technology
Knowledge creation & sharing
Resource efficient chips
Financial performance
|
•
|
Financial performance
|
•
•
•
|
Employment creation
Employee welfare
Financial performance
|
|
1.
|
See
Management Board Report - Materiality Assessment
.
|
|
2.
|
See
Management Board Report - Risk Factors
.
|
|
3.
|
See
Management Board Report - Business Strategy - How we create value
.
|
In terms of our sustainability focus, we began a refresh of our Corporate Responsibility Strategy in 2018, covering the period 2019-2025. We revised our corporate responsibility priorities, identifying five main priority areas: People, the Circular Economy, Climate & Energy, Responsible Supply Chain, and the Innovation Ecosystem. This strategy contributes to a number of the United Nations Sustainable Development Goals. The Industry, Innovation and Infrastructure (SDG 9) goal is connected to the core of our company, as innovation is our lifeblood and the engine that drives our business. We also contribute towards the Quality Education (SDG 4), Decent Work and Economic Growth (SDG 8), Responsible Production and Consumption (SDG 12) and Climate Action (SDG 13) goals.
We are in the process of finalizing how this new strategy will be implemented (including performance indicators and quantitative 2025 targets), and will begin reporting on the new strategy in 2019.
ASML INTEGRATED REPORT 2018
13
Our markets
Our main customer groups are memory and logic chip makers. Memory chips can store a large amount of data in a very small area. They are used in an increasing variety of electronic products like smartphones, high-performance computing, automotive or personal computers, and other communication devices. There are two main classes of memory: NAND and DRAM. With NAND chips, information can be stored even when the device is powered off. DRAM memory is used to improve the performance of the electronic product. These DRAM and NAND chips are made in dedicated memory-chip factories.
Logic chips process information in electronic devices. They are produced by two groups of manufacturers. The first group designs and manufactures logic chips and is referred to as Integrated Device Manufacturers (IDM). The second group is made up of contract manufacturers known as foundries. Foundry manufacturers do not design chips, but produce chips for other companies.
Over the past 20 years, the chip market has grown at an average of five percent per year, however the growth drivers have changed over time. In the 1990s, the introduction and adoption of Personal Computers (PCs), both “desktops” and later “laptops” fueled chip demand. In the first decade of this century, the market driver transitioned from PCs to smartphones. PCs and smartphones have in turn fueled a new market driver, data-centers, where data from PCs and smartphones is routed, stored, and processed with extensive use of DRAM, NAND and specialized logic chips. A new category of end-point devices, beyond PCs and smartphones, has emerged over the last five years classified as the Internet of Things (IoT), which includes devices such as security cameras, home and industrial devices, and autonomous vehicles, that are exponentially adding to the growth in data being transmitted, processed and stored. The combination of increasing data together with more powerful processing capability from more advanced logic chips is enabling the application of artificial intelligence techniques, such as machine-learning and deep-learning, leading to whole new set of applications and services. These new applications in-turn are fueling new growth drivers at the edge, such as smart assistants, and in data centers, such as real-time language translation.
Long-term growth opportunity
On November 8, 2018, we presented our view of long-term growth opportunity, updated our outlook for 2020, and extended our outlook to 2025. We also updated our long-term business and financial analysis, reflecting an annual revenue opportunity of around EUR 13 billion in 2020, based on a moderate market scenario.
For 2025, we have modeled our potential revenue scenarios within the context of different business sensitivities. We recognize our potential growth opportunity is sensitive to market growth, and potential annual revenue for 2025 between EUR 15 billion in a low market scenario and EUR 24 billion in a high market scenario.
Our revenue potential is primarily based on organic growth. We continuously review our product roadmap and have, from time to time, made focused acquisitions /
equity method investments
to enhance the industrial value of our product offering. Based on such reviews and the assessment of clear potential product and value synergies, we may also evaluate and pursue focused merger and acquisition activities in the future. Within this growth ambition, we expect to continue to return significant amounts of cash to our shareholders through a combination of share buybacks and growing dividends.
ASML INTEGRATED REPORT 2018
14
ASML INTEGRATED REPORT 2018
15
ASML Integrated Report 2018
Our products
We sell Holistic Lithography solutions which integrate our three categories of products: DUV lithography, EUV lithography, and Applications. We believe that our customers get the best-possible performance from their chip-making systems by considering the whole chip-creation process, from design to volume manufacturing. We provide services that make sure our systems are installed effectively and efficiently, and there is superior support and training to create the best-possible manufacturing processes for our customers. We also have services to upgrade and refurbish our systems, helping our customers extend their systems’ lifespan and enhance our customers’ capital efficiency.
We offer TWINSCAN (N)XT (DUV) systems for imaging wafers. The DUV range consists of systems that operate at a specific wavelength of the light source, varying from the so-called i-line (365 nm) to KrF (248 nm) and ArF (193 nm). Although these systems are usually referred to as dry systems, the DUV range is completed with ArF immersion lithography systems that provide imaging capability down to a resolution of 38 nm. In these systems, a film of water is placed between the wafer and the projection lens. This film acts as an extra lens, which results in smaller features compared with the previous generation of dry systems. We pioneered this technology and have extended it over multiple generations to enhance the precision of the feature placement to enable so-called multiple patterning technology. This technique has enabled our customers to produce integrated circuits down to the 7nm logic node and 10 nm class DRAM nodes.
Our next-generation lithography systems, TWINSCAN NXE (EUV), are equipped with an entirely new EUV light-source technology and a new optical technology that uses reflective mirrors rather than traditional lenses. The shorter wavelength of this light (13.5 nm) results in a higher resolution for the manufacturing of denser and faster chips. The EUV platform can produce ICs of 13 nm resolution and smaller. We are developing the future generation of EUV lithography systems due early in the next decade, using High NA technology. Customers are already committing to this technology. In April 2018, ASML received its first orders for these future-generation systems. Three customers placed
initial orders for the research-level High NA systems, for an aggregate four tools initially, plus options for another eight volume systems. The initial research-level systems are targeted to start shipping in 2021.
With this technology, the semiconductor industry will be able to produce higher-performance microchips at lower costs. The higher numerical aperture optics will make it possible to further reduce critical dimensions in the lithography process. The current EUV systems have an optical system with a numerical aperture of 0.33, whereas the new optics will have a numerical aperture of 0.55, enabling several generations of geometric chip scaling.
We have complemented our scanner products with a rapidly expanding Applications portfolio of software and metrology & inspection products. This portfolio helps our customers get optimal use from and control over semiconductor scanner performance, which provides faster start-to-chip production. This results in better patterning at higher resolutions, and higher product yields. Our solutions offer cost-saving opportunities for our customers. The addition of HMI’s e-beam technology to our existing portfolio extends our control scope. New process control opportunities, built on the same unique and proven approach, will give our customers additional value. This approach - pattern fidelity metrology - allows us to guide the e-beam inspection system to the most critical areas, based on the predictive model, on the wafer to increase the effective productivity. We are extending this technology even further with a multi-beam design. In 2018, we demonstrated the first proof of concept of multiple e-beams to further improve productivity of e-beam metrology, and expand the application opportunity in high-volume production. The biggest new opportunity is in the extension of overlay control to a comprehensive control of pattern fidelity.
See our lithography systems overview below.
ASML INTEGRATED REPORT 2018
17
Managing our installed base systems
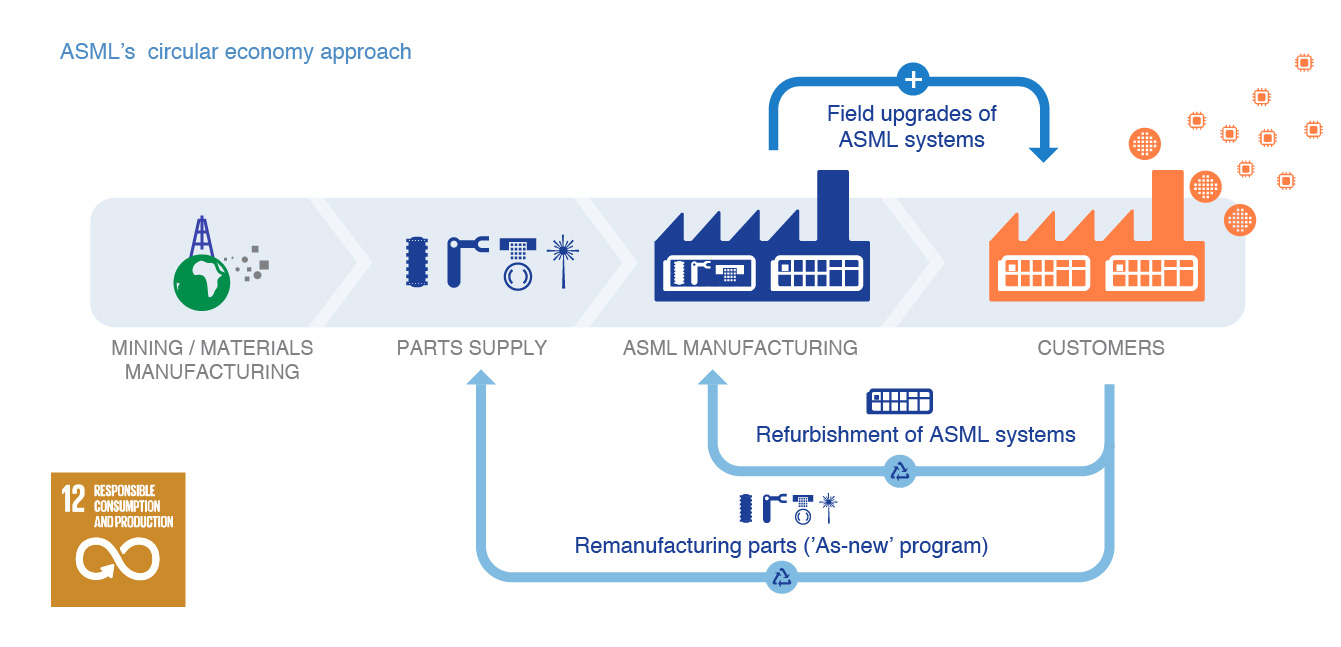
We develop and sell product options and enhancements designed to increase throughput, and improve patterning and overlay. This allows for optimal cost of ownership over the lifespan of our systems. We have developed field upgrade packages, which allow our DUV and EUV scanners to be upgraded from one model to another in the field. Customers are able to migrate these systems in production from one process technology node to another. This lets them meet tighter lithography requirements for increasingly advanced processes. In addition, our Mature Products and Services business refurbishes used lithography equipment, and offers associated services. Upgrades and refurbishments help our customers extend their systems’ lifespan and get the best value from their capital. They also support our circular economy approach.
We support our customers with a broad range of applications, services, and technical support products to maintain and enhance our systems' performance. We also offer our customers OnPulse contracts on DUV sources, providing on-site support from certified service engineers and continuous real-time light-source monitoring.
We expect our service business, which is critical to our overall success, to continue to grow. We aim to deliver a complete and cohesive service product offering designed to keep our customers' systems operating continuously and competitively. Our service business strategy makes customer value and satisfaction a priority, while seeking to optimize our total net sales and gross margin. Our Installed Base Management product portfolio, and its wide range of service and upgrade product offerings, is structured in line with the life cycle of our customers’ technology nodes and is intended to offer the best-possible value proposition for customers.
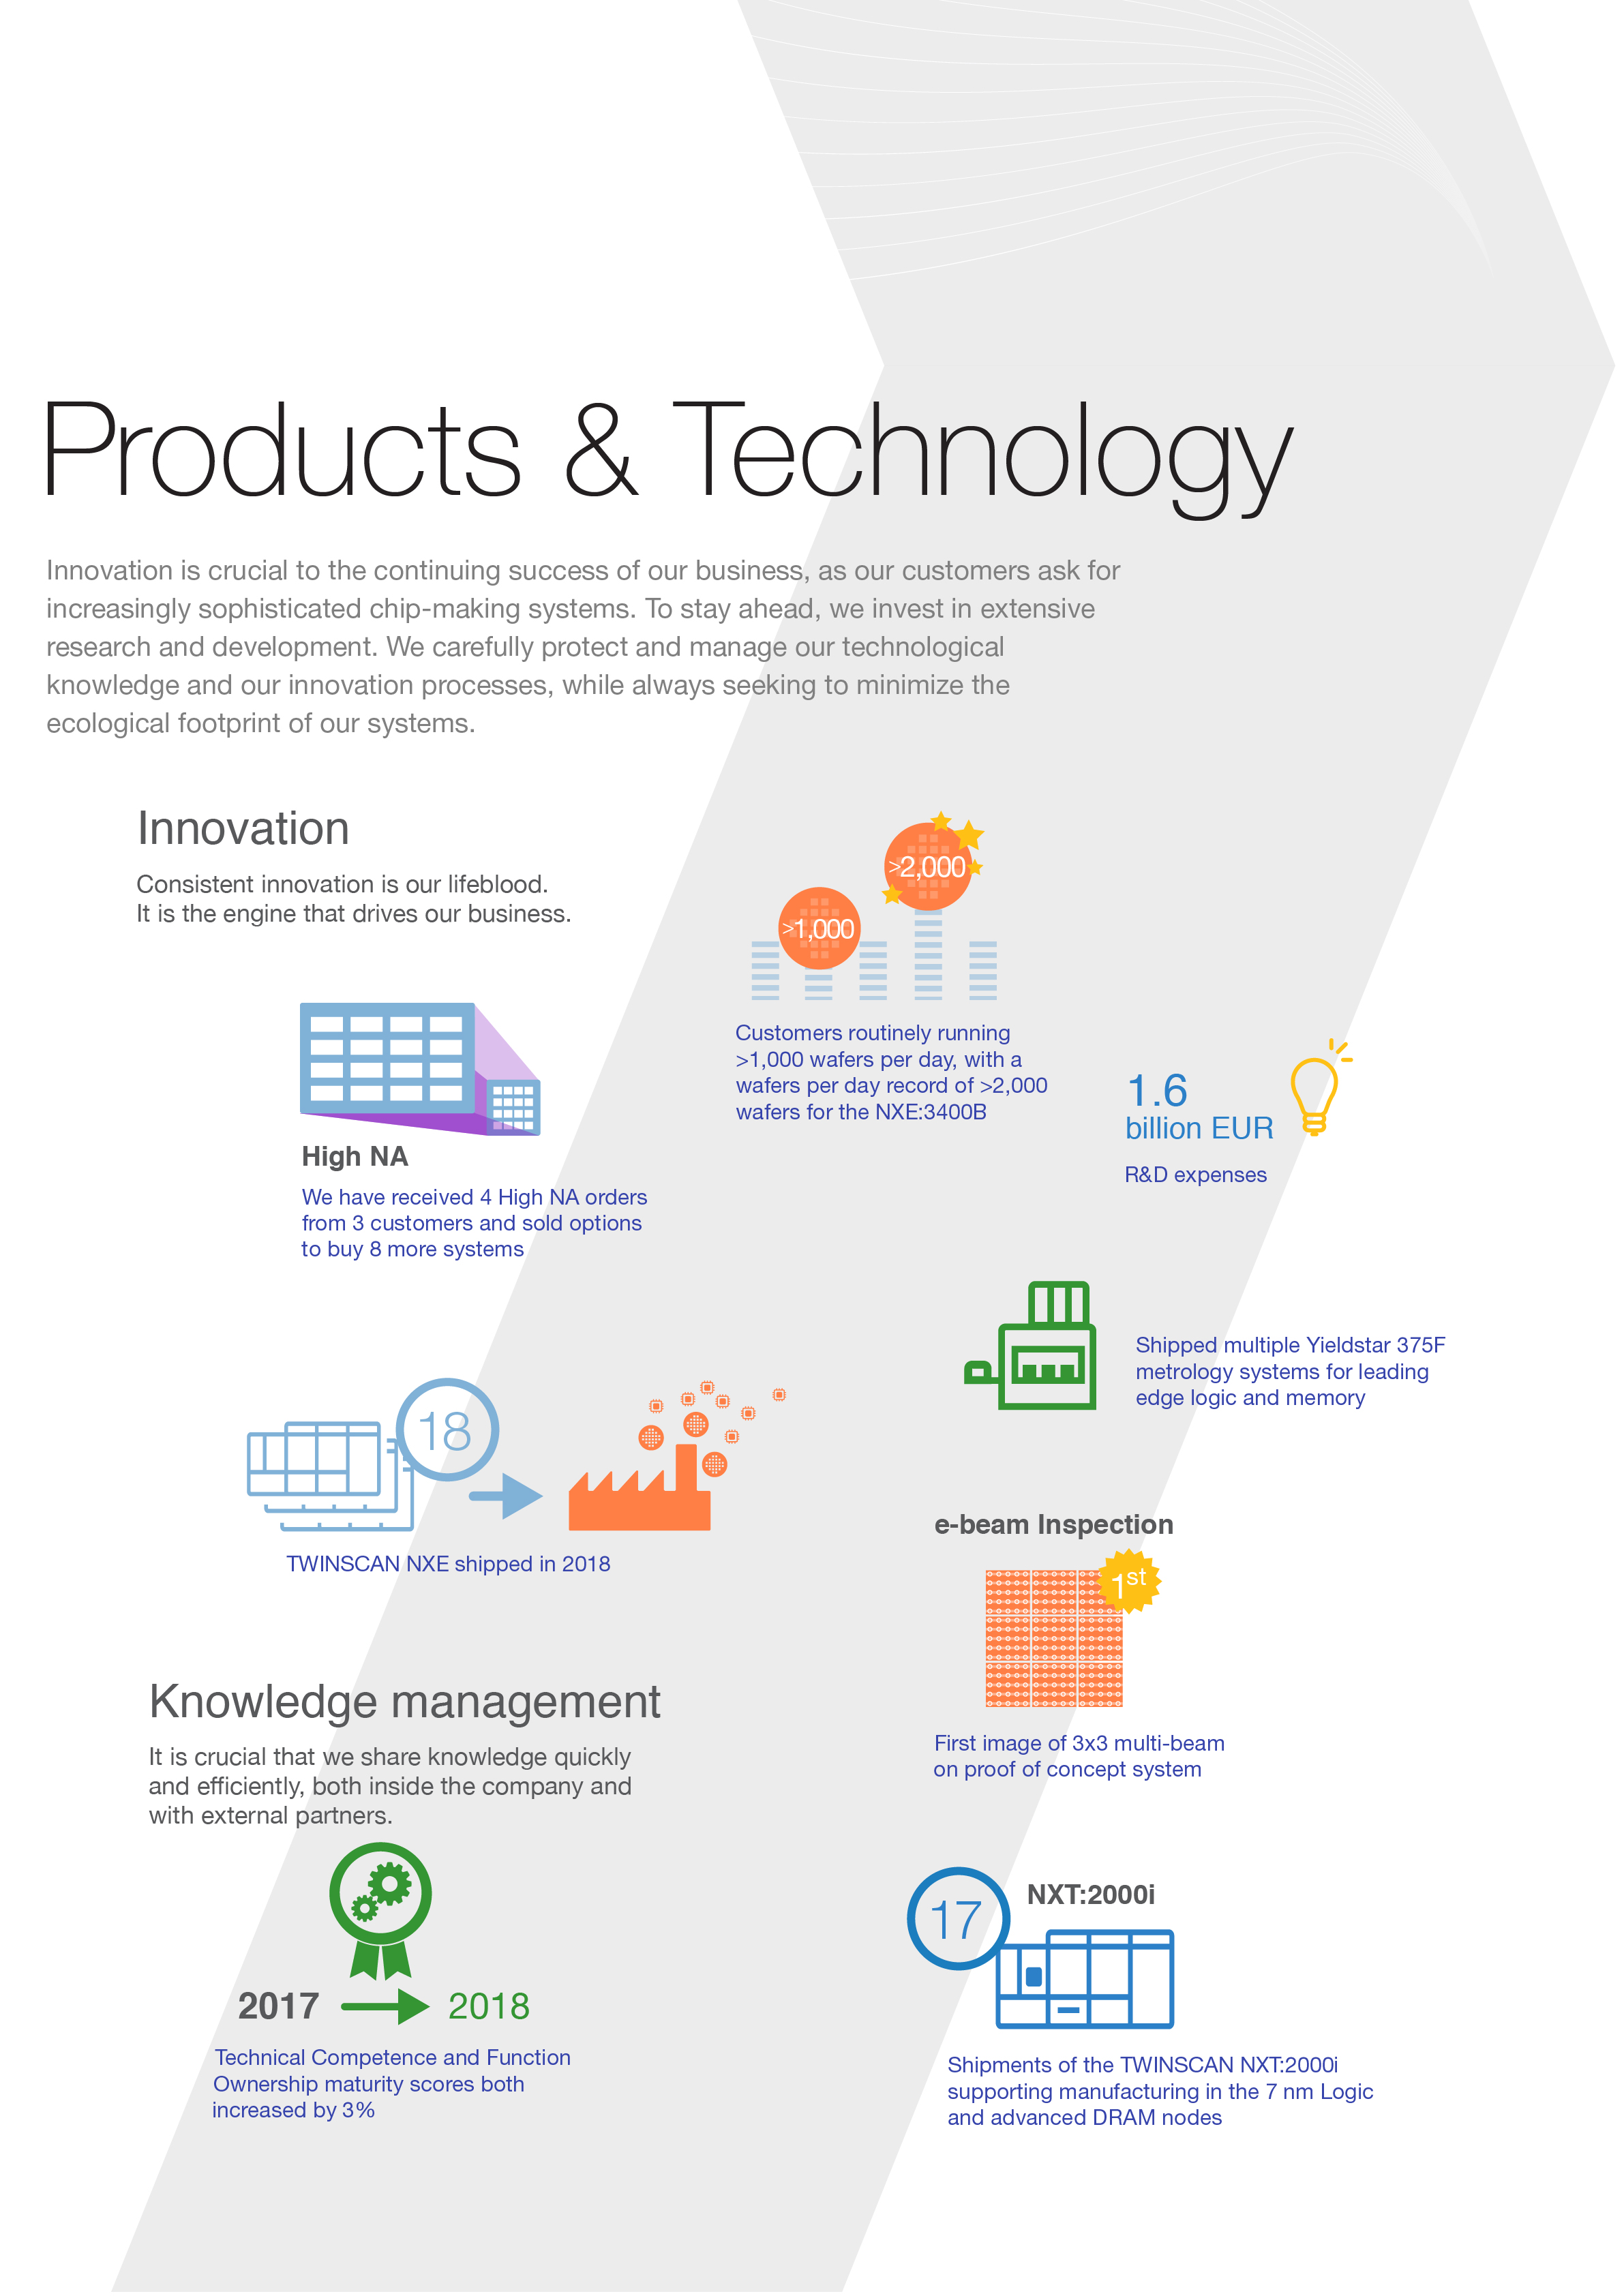
Innovation drives our business
Innovation is ASML’s lifeblood and the engine that drives our business. As the markets of artificial intelligence, 5G connectivity, augmented reality and the Internet of Things expand, consumers across the world are using ever-more powerful and sophisticated devices that are increasingly interconnected. These developments drive demand for microchips, which in turn drive demand for the chip-making systems that produce smaller, faster, cheaper, more powerful and energy-efficient microchips. We can only meet this demand by consistently and continuously advancing our technology.
Our innovations in 2018 helped us improve our DUV technology. This allowed us to meet our goal of continuing to offer competitive chip-making systems using ‘dry’ and ‘immersion’ lithography technology. Due to improvements and innovations, we succeeded in further increasing the number of wafers processed per day for most of our DUV systems. We shipped
206
TWINSCAN DUV systems in 2018. We also shipped
17
of our latest TWINSCAN NXT:2000i immersion systems, which are used on the most advanced nodes. While bringing new technology to the field, we also managed to ramp time-to-yield, hitting a performance level of >150 hours Mean Time Between Interruption (MTBI) in 15 weeks. This is almost 40 percent faster than the previous model, NXT1980i, and is enabled by a more mature platform achieved through continuous improvements.
Continuous improvements helped us move our EUV technology to the high-volume production stage in 2018. We demonstrated production capability of >145 wafers per hour, up from 125 wafers per hour in 2017, and are working towards 92 percent production time (availability) with consistent performance. We shipped
18
EUV systems in 2018 of which 17 were NXE:3400B EUV systems. The NXE:3400B showed improved performance on a customer site, where the customer ran over 1,000 wafers per day over a period of more than six weeks. On some days, more than 1,500 wafers were produced. At another customer site, we saw a peak performance of more than 2,000 wafers per day. These performances were representative of a significant number of successes for our NXE:3400Bs. Through innovations and improvements, we are committed to accelerating our roadmap, providing our customers with a system with more than 35 percent higher productivity, the NXE:3400C, which is capable of producing 170 wafers per hour. This has a planned delivery date for the second half of 2019.
Since the acquisition of HMI, we shipped multiple ePfm5 systems, a pattern fidelity metrology tool that offers our customers enhanced capabilities for detecting patterning defects. We enabled customers to substantially improve accuracy in chip patterning by implementing HMI’s metrology technology and Brion’s metrology software and machine-learning technology. The ePfm5 device is based on single-beam technology, which will be guided to the critical areas (known as areas of interest) based on our computational lithography model. In 2018, we also achieved significant breakthroughs in multi-beam technology, showing our first 3x3 image on a proof of concept system. This will further enhance pattern fidelity metrology.
There was large-scale adoption of YieldStar 375 among all major memory makers in 2018. The unique, large spot multi-wavelength measurement mode has proven to be accurate and robust compared to alternative methods. Memory makers have seen significant overlay performance improvements after adopting YieldStar.
We continued efforts to develop High NA, the next generation of EUV optics. We are confident we have the ability to apply this technology at a scalable model in coming years. High NA will offer a higher numerical aperture, making it possible to further reduce critical dimensions in the lithography process. We have received the first four orders for High NA systems from three customers and we also sold options to buy eight more systems.
We measure innovation based on an internal KPI we call the Technology Leadership Index. This index comprises three objectives: a) DUV performance enabling memory 1x and 7/5 nm logic nodes, b) Enable on product performance, and c) Drive economics and extendibility of EUV. See
Products and technology objectives
in the table towards the end of this chapter.
ASML INTEGRATED REPORT 2018
18
Another important indicator of our focus on innovation is the amount we spend on R&D. In 2018, we spent
EUR 1,575.9 million
or
14 percent
of total net sales on R&D, compared to
EUR 1,259.7 million
or
14 percent
of total net sales in
2017
, and
EUR 1,105.8 million
or
16 percent
of total net sales in
2016
, which underscores our commitment to investing in R&D.
How we manage innovation
We manage innovation based on ‘roadmaps’ - the semiconductor industry’s standard term for product-development planning. Our marketing organization first assesses our customers’ needs, the required functionality of our systems, and the deadline for these requirements. This ‘marketing roadmap’ of customer requirements includes detailed system specifications and functionalities. Our product organization then puts together a ‘product roadmap’. This outlines the specifications and functionalities of the new types of system that are feasible to produce and that meet our customers’ demands.
At the same time, we draw up a ‘technology roadmap’, identifying what technology we need to build in the system as described in the product roadmap. From our integrated roadmap we create further detailed roadmaps for each of our main product groups: DUV, EUV and Applications. Roadmaps typically look five years ahead. We adjust them when required, depending on changing customer needs or unexpected technological breakthroughs or challenges.
We also invest in innovation by conducting research with a longer-term view. Run by our Research department, this research aims to create technological solutions our D&E experts can tap into when they develop new systems or improve existing models. Our research teams collaborate with a wide network of technology partners, such as universities and other research institutions.
We manage our innovation efforts through our Product Generation Process. Our CTO is responsible for R&D at board level. Our Executive Vice-President Development and Engineering and our Senior Vice-President Technology report to the CTO.
ASML’s ‘open innovation’ concept
The concept of ‘open innovation’ helps us sustain our pace of invention. This means we develop our technology in close collaboration with partners inside and outside our company, sharing the rewards and the risks. This way of working gives us easy access to leading-edge knowledge and skills across a wide range of technologies. Our partners can also use these in other markets.
Researchers from ASML, the Advanced Research Center for Nanolithography, Tata Steel and Vrije Universiteit Amsterdam cooperate to develop new techniques for imaging surfaces based on lensless microscopy. To support our lithography business, we also have a close and long-standing partnership with Carl Zeiss AG, and with Cadence Design Systems, as part of our holistic patterning strategy.
ASML and world-famous research and innovation hub, imec, announced the next step in their extensive collaboration. Together, we expect to accelerate the adoption of EUV lithography for high-volume production, including the latest available equipment for EUV. Additionally, we will explore the potential of the next-generation High NA EUV lithography to enable printing of even smaller nanoscale devices.
In 2018, our annual ASML Technology Conference was one of the largest of its kind with delegates spread across four locations. Participants included external technology experts and representatives from our customer base, such as the COO of IBM Research. This year's conference was centered around the theme of ‘Moore to explore’, which discussed the view that EUV industrialization does not mean the end for Moore’s Law. Rather, it signals a new departure for further exploration within EUV, with High NA offering at least 10 more years of development opportunity. Matching this with the potential for further innovation in DUV and Applications shows that we still have many challenges ahead of us.
Knowledge management
Our major investment in R&D means it is crucial for us to share and protect our inventions and knowledge. Knowledge management is a key focus area for us. In 2018, it enabled ASML to rapidly grow the organization and to effectively onboard many new employees.
To maintain our technological leadership and pace of innovation, we need to develop the right knowledge and share it quickly and efficiently. We share our knowledge internally and externally, with partners such as suppliers and customers. Faster access to knowledge spurs faster development, allowing problems to be solved more quickly. It also makes our investments in knowledge creation more effective and efficient.
Our ambition is to ensure that the right knowledge is available to the right people at the right time. This means we must acquire or develop the required competencies at an early stage, maintaining a knowledge pipeline that allows us to build the system functions we need. This process is facilitated by our Technical Training Center. Our line managers regularly assess the technical competencies we need, varying from software programming to laser physics, and take steps to fill capability gaps where necessary.
Our ‘MyLearning’ management system, which covers the activities of all our training centers, helps our employees and their managers decide what courses to attend to develop their skills and competencies. The system provides information on training hours, and the kinds of training our employees are receiving. It also helps employees design their individual Development Action Plans. See also Management Board Report - People - Talent management. The number of technical training hours per full-time D&E
ASML INTEGRATED REPORT 2018
19
employee increased to
31.4
in
2018
from
18.2
in
2017
.
This increase is due to a significant influx of new employees, who received additional onboarding training, and the successful introduction of several new training programs.
In 2018, we continued with the Onboarding Success Planner, which is a series of trainings to be followed in an employee's first year. The purpose of the Onboarding Success Planner is to help speed up the learning curve of the large number of new employees we need to onboard to be able to implement our many new product-development programs.
To gauge the effectiveness of our knowledge management, we measure our Technical Competence maturity and Functional Ownership maturity. Technical Competence maturity measures the capabilities and spread of technical competencies among our people, as well as the extent to which they are embedded in our processes and operations. We have identified over 80 different competencies that are relevant to our technology. Functional Ownership maturity measures the level of required knowledge among our teams of experts about the system functions they are responsible for. A system is divided into about 90 distinct functions, and responsibility for each function is assigned to a function owner and his/her team.
We score the maturity KPIs on a scale of 1 to 5. Levels 1 and 2 cover the basic requirements, showing that teams are establishing links with departments they cooperate with, setting individual targets, etc. Levels 3, 4 and 5 are more advanced, reflecting mechanisms to gather and process feedback, make processes predictable, and ensure they function well at customers’ sites.
In 2019, we will reassess the present competence function framework to bring it to the next level. The current framework and metrics will remain in place until we have completed this reassessment and defined new metrics.
While continuing to build and maintain a solid knowledge base, in 2018 we focused on raising the maturity level of our employees in terms of their technical and functional knowledge. For Functional Ownership we paid particular attention to using feedback from customers, e.g. feedback loops. In terms of Technical Competence and Functional Ownership, we met our targets to achieve an average maturity score of 3.8 in 2018. See
Products and technology objectives
in the table near the end of this chapter.
We have roadmaps in place for system functions. These plans are updated on a regular basis. We have mechanisms to process feedback from customers and co-development partners, helping to reduce the recurrence of technical function issues.
Protecting our intellectual property
We rely on intellectual property rights such as patents, copyrights and trade secrets to protect our proprietary technology. We aim to acquire ownership rights on technology developed by us or for us or, alternatively, to have license rights in place with respect to such technology.
In our management of our intellectual property rights, we focus on protecting ASML’s intellectual property and respecting the intellectual property of others. Preservation of intellectual property and other assets is one of our Business Principles and part of our
Code of Conduct
.
As of December 31, 2018, we had approximately 12,000 patents and patent applications across the main equipment and chip-manufacturing countries around the world and covering various fields of our business, including about 300 new patent applications which may be extended to other countries in the coming years.
See also
Management Board Report - Risk Factors - Failure to adequately protect the intellectual property rights upon which we depend could harm our business
and
Defending against intellectual property claims brought by others could harm our business
.
Product stewardship
While putting continuous effort into innovation and effectively managing and protecting our knowledge, we also strive to make sure our products are manufactured and can be operated responsibly. Our commitment to product stewardship means that we work to make our manufacturing processes and systems more environmentally friendly, improving their resource efficiency.
As we brought our EUV systems to the point of high-volume production in 2018, we began exploring how we can achieve energy savings for these systems. Together with a supplier, we looked into how to redesign the pre-vacuum systems for our EUV systems in a way that they use less energy. At year-end, we had not concluded this investigation. We continued research, in partnership with suppliers, into increasing the recycling rate of the H
2
used in our systems. We also continued exploring the possibility that some sections of the EUV system can operate at higher temperatures. This will allow us to reduce energy used for cooling purposes in these systems at our customers' sites.
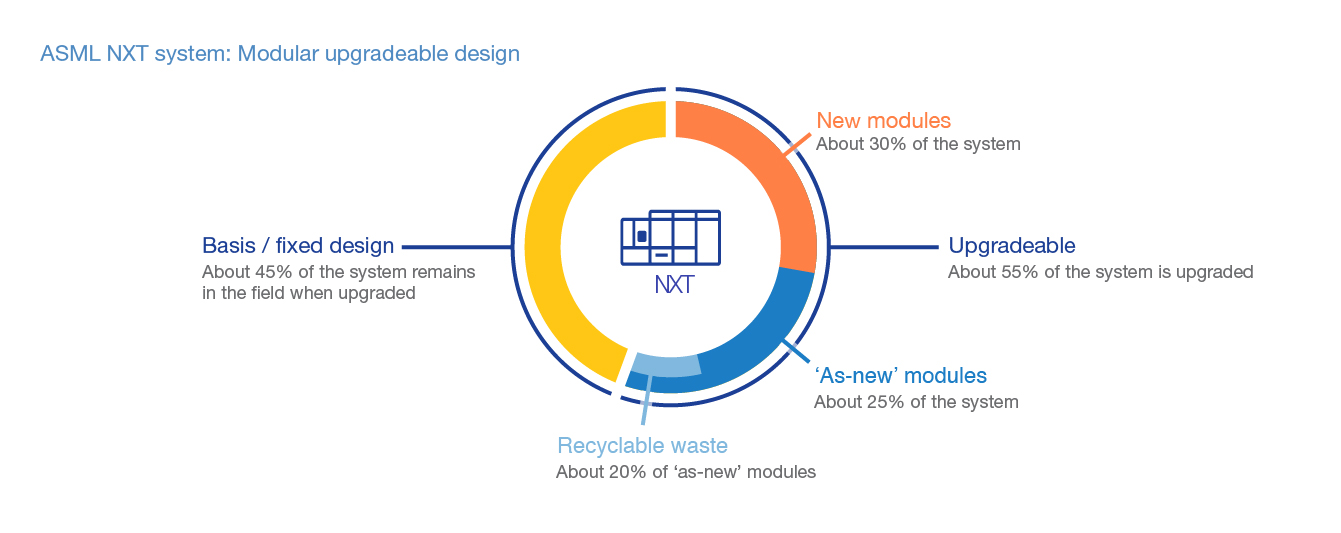
We support the circular economy concept - a model for industry moving from the linear model of ‘Take, Make, Dispose’ to one where we extract the maximum value from resources we use, and then recycle and regenerate products at the end of their lives. We believe this is essential to ensuring the future success and competitiveness of the semiconductor equipment industry. To this end, we have incorporated the circular economy into our Business Principles. We are committed to playing our part, not only by enhancing energy efficiency and the efficient use of other resources and materials, but also by refurbishing systems, remanufacturing parts (‘As-new’ program), and upgrading systems to a higher performance level while in use ‘in the field’, to extend their lives. Our systems have a modular design, which allows for reuse and upgrades. About 45 percent of the weight of a typical NXT system consists of a fixed architecture that can be kept when upgrading the system. See Graphic: ASML NXT system: Modular upgradeable design, in this section.
ASML INTEGRATED REPORT 2018
20
|
Extending our systems' lifetime
Our Mature Products and Services business refurbishes older lithography systems and offers associated services. A well-maintained ASML lithography system has a useful life that is measured in decades. Typically, an ASML lithography system will be used in a leading-edge Fab for many years, and will then be given a second life with, for example, a manufacturer that makes specialized devices, such as accelerometers, radio frequency chips, thin-film heads for hard disk drives, or LEDs, which require relatively less sophisticated chips. The vast majority of the systems we have previously sold are currently still operational in our customers' factories.
|
||||
In 2018, we upgraded dozens of our older-generations NXT systems, and began upgrades to some of our EUV systems. Due to the new software and hardware, we can significantly extend the lifespan of a significant part of our systems currently in use at our customers’ production locations.
We also further engaged with our customers around the introduction of ‘As-new’ modules into our mainstream manufacturing. ‘As-new’ modules (segments of our systems) are those suitable for multiple product life cycles. They are returned from the field and, after a thorough re-qualification process, restored to an as-new condition. Their performance level is equal to that of new ones. In 2018, we continued a pilot project launched in 2016 to explore how we can effectively use ‘As-new’ parts and modules in new systems. In collaboration with our customers and suppliers, we aim to increase the number of ‘As-new’ parts used in the future.
By working to make the production of computer chips cheaper and more powerful, we also fuel the development of new electronic applications. This poses a challenge for our entire industry, as these new applications may use more energy and need potentially scarce resources. For us, it emphasizes the importance of working with all relevant stakeholders in the value chain to make our industry more sustainable, and of contributing to this process through research and innovation.
ASML INTEGRATED REPORT 2018
21
RoHS and REACH
We are committed to complying with EU guidelines for handling hazardous materials and chemicals, the so-called RoHS directive and the REACH regulation, even though the products we manufacture are currently excluded from the RoHS directive. We aim to, whenever possible, reduce and eliminate use of hazardous substances and replace non-compliant parts with RoHS-compliant alternatives.
Product safety and compliance
Our products must be safe to work with, starting at the design stage. Our engineers develop systems that meet international safety regulations. We require product designers to pay attention to nine risk areas we have identified, and to alert risk experts if they believe their design might pose a safety risk. This lets us address any potential safety issue at an early stage.
Our products and non-commercial tools comply with all relevant legislation, including EU safety regulations and SEMI S2, the semiconductor industry guidelines. A third party verifies our compliance with SEMI S2. In 2018, a report confirming SEMI S2 compliancy was available for each and every product type we shipped. See
Non-Financial Statements - Non-financial Indicators - Products and technology - Product Stewardship
.
Products and technology objectives
|
Theme
|
|
Objective
|
Target year
|
How we did
|
|
|
|
|
|
|
|
|
|
Innovation
|
Realize the following as part of our Technology Leadership Index:
a) DUV performance enabling memory 1x and 7/5 nm logic nodes. b) Enable on product performance. c) Drive economics and extendibility of EUV. |
2018
|

|
See Innovation drives our business above.
|
|

|
|
Realize the following as part of our Technology Leadership Index:
a) Enable 3 nm node and the installed base products & services roadmap without compromise to quality b) Enable on product performance c) Drive economics and extendibility of EUV. |
2019-2020
|

|
|
|
|
|
|
|
|
|
|
Knowledge management
|
Maintain the Technical Competence and Functional Ownership maturity score at a level of 3.8.
1
|
2018-2020
|

|
See Products and technology KPIs in the table below - we achieved a maturity score of 3.8 for Technical Competence and 4.1 for Functional Ownership.
|
|
|
|
|
|
|
|
|

|
|
Realize 17.5 hours of technical training hours per FTE (D&E employees).
|
2018
|
|
See Products and technology KPIs in the table below - the number of training hours was 31.4, exceeding our 2018 target.
|
|
|
|
|
|
|
|
|
Product stewardship
|
Annual reduction of RoHS non-compliant parts by 15%.
|
2016 and beyond
|
|
In 2018, we have assessed that 91.6% of the parts in scope are RoHS compliant (with 0.8% non-compliant and 7.6% unknown). We have therefore reduced the RoHS non-compliant parts by 21%, thus exceeding our annual target of 15% reduction. We will continue to investigate unknown parts and further reduce the RoHS non-compliant parts.
|
|
|
|
|
|
|
|
|

|
|||||
|
1.
|
Technical Competence maturity measures the capabilities and spread of technical competencies among our people, as well as the extent to which they are embedded in our processes and operations. Functional Ownership maturity measures the level of required knowledge among our teams of experts about the system functions they are responsible for.
|
ASML INTEGRATED REPORT 2018
22
Products and technology KPIs
|
KPI
|
2016
|
|
2017
|
|
2018
|
|
|
R&D expenses (in million EUR)
|
1,105.8
|
|
1,259.7
|
|
1,575.9
|
|
|
Technical Competence maturity score
1
|
3.4
|
|
3.7
|
|
3.8
|
|
|
Function Ownership maturity score
1
|
3.6
|
|
4.0
|
|
4.1
|
|
|
Number of technical training hours per FTE
|
15.9
|
|
18.2
|
|
31.4
|
|
|
Sales of lithography systems (in units)
2, 3
|
154
|
|
197
|
|
224
|
|
|
1.
|
Measured on a scale from 0 to 5, with 5 being the top score.
|
|
2.
|
Lithography systems do not include metrology and inspection systems.
See
Management Board Report - Financial Performance - Operating results - Total net sales and gross profit
.
|
|
3.
|
As of January 1, 2018, ASML has adopted the new Revenue Recognition Standard (ASC 606) and Lease Standard (ASC 842). The comparative numbers have been adjusted to reflect this change in accounting policy.
|
ASML INTEGRATED REPORT 2018
23

ASML Integrated Report 2018
Talent management
Attracting and retaining talent is crucial to maintaining our fast pace of innovation and essential to our long-term success as a company. Highly skilled people with a technical background are scarce in the labor market and competition to recruit talented people is growing. The complexity of our products means new and existing employees face a steep learning curve. As such, we put significant effort into onboarding newly hired people. To enhance their performance, we need them to be familiar with our technologies and ways of working in a short time. We are continuously looking to grow our talented and highly skilled professionals through tailor-made training and development programs. This allows for continuity in our workforce as we are able to retain our employees' knowledge, skills and competencies. In 2018, we succeeded in hiring the people we need to support ASML’s strong growth, as we hired approximately
3,500
new payroll employees and 1,900 temporary employees.
To attract talent, we focus on two areas:
|
•
|
Internal talent - We assess the development potential of our employees for new roles and identify candidates for critical positions. Employees discuss their career ambitions with managers, jointly considering next steps. Employees can pursue opportunities themselves or be approached within the organization. We also have internal career fairs where people can learn more about internal career opportunities.
|
|
•
|
External talent - We cooperate closely with universities in Europe, the US and Asia to attract highly talented staff, including offering internships and scholarships. For positions that we cannot develop or fill internally, we scan the labor market for the skills we need, and run targeted recruitment campaigns.
|
Developing our people is crucial for the sustained success of our business. Every year, our employees’ personal targets and development plans are aligned with our business targets through our People Performance Management process. Our MyGrowth program, established in 2018, lets employees assess their strengths and potential gaps in their competencies. It also helps guide them in deciding how to fill these gaps through development actions. This is part of our process to identify what action we need to take to achieve short-term goals, as well as longer-term career development. Together, managers and employees define individual Development Action Plans.
Our company enjoyed even stronger growth in 2018 than in the previous year. We had to set ambitious recruitment targets to support this growth and make sure we have the skilled people we need. As in previous years, we were successful in meeting our recruitment objectives. We exceeded the target we set at the beginning of the year, and adjusted to our shifting hiring needs. We view our recruitment and employee development efforts as an ongoing process. We continuously seek to improve and professionalize, responding to changing business requirements and developments in the labor market. In 2018, we bolstered the governance structure of our global talent acquisition, adding the position of Head of Recruitment Asia and increasing our recruitment capacity in all countries. To support recruitment, we train line managers to improve their interviewing and selection skills. ‘Buddies’ are also an important part of our onboarding approach. We aim to ensure that each newcomer is assigned a buddy to help him or her find their way at ASML and in their new job. In addition, we introduced a ‘New at ASML’ intranet site. Managers can get the information they need here, and are guided through a structured process to onboard different categories of new employees. It is also a useful resource for buddies and new employees.
Our attrition rate, i.e. the number of employees leaving the company, increased slightly to
4.7
percent in
2018
(
2017
:
4.4
percent). We attribute this mainly to the global shortage of technically skilled people. Our attrition rate is still significantly below the industry benchmark, and we do not expect a significant change in this regard. The attrition rate of our best people (‘high performers’) was
2.2
percent in
2018
(
2017
:
1.8
percent). We also measured the extent to which high performers move to higher-level positions. This promotion rate was
40 percent
(compared to an overall promotion rate of
14 percent
), indicating that our best people were over-proportionally promoted and so able to further develop themselves. We fast-track the careers of our most promising managers through our Potentials Acceleration programs, with
331
people participating in
2018
. We also deployed a new management development curriculum to support development of leaders at all levels. In total, more than 1,200 managers attended training in this curriculum in 2018.
Succession management is an essential part of building a pipeline of talent. Our efforts here ensure we have the talent ready to replace managers and employees as they are promoted or if they choose to leave the company. Building on our strong process for this purpose, we completed assessments of about 9,000 employees in 2018 to determine their potential to take over more senior positions. This was up from around 7,200 employees in 2017. We have succession plans in place for more than 300 senior positions. Two potential successors were identified in most of these cases.
We also support technical studies through scholarships. In
2018
,
53
students entered our ASML Technology Scholarship program. To build relationships with people before they enter the labor market, we increased the number of internships we offer. In the US, we secured positions on the advisory boards of several universities. This helped us contribute to defining the skills and competencies these institutions could include in the curriculum they offer students. In 2018, our scholarship program was also made available to students in the US, which is expected to increase our total number of scholarships in 2019.
For further information, see
Non-Financial Statements - Non-financial Indicators - People - Talent Management
.
ASML INTEGRATED REPORT 2018
25
Sustainable relationship with our people
We strongly believe building sustainable relationships motivates our people to develop themselves, make the most of their talents, and perform to the best of their ability. This serves to boost our productivity, innovative strength and competitiveness.
Employee engagement and employability are the cornerstones of a sustainable relationship with our employees. To us, engagement is the dedication our employees have for their jobs and ASML. Engaged employees feel their efforts make a difference, and they are therefore motivated to go the extra mile. Employability is our employees' capacity to sustain and improve their performance over time and adjust to change.
To build an engaged and enabled workforce, we have our Place to Work, Meet, Learn and Share framework. Our aim is to create an inspiring and safe work environment. This must be beneficial to our employees’ personal development and help them strike a good work-life balance. There are three dimensions to the Place to Work, Meet, Learn and Share framework:
Our employees (People), our campuses and buildings (Bricks), and IT innovation to improve collaboration and work processes (Bytes).
In 2018, we launched discussions on improvements to our locations in Veldhoven. This aims to improve mobility management in the area, including traffic to and from our premises. To contain travel time and costs, we use Microsoft Surface Hubs, which offer teleconferencing and presentation tools. They have made our interactive design sessions and remote training more efficient. This enables our employees to be more productive and engaged. In Asia, we opened several buildings for our employees that meet all the latest standards, creating a pleasant work environment.
We have also continued our program to convert our offices into activity-based working environments, promoting more interaction and providing the facilities our employees need. In 2018, we added more than 1,800 flexible workplaces. Overall, we now have more than 6,750 flexible workplaces worldwide.
As we adhere to an 18-month cycle for our employee survey, me@ASML, we did not conduct one in 2018. The previous survey showed an average engagement level of 7.0, which was slightly below our target. We aimed to achieve the same level as our peer group benchmark of 7.2. We also began the process of making several changes to the survey. We intend, for example, to add sector-specific surveys for employees in different company units. This will let us gain greater insight into specific developments, such as the integration of acquired businesses, or how newly hired employees view our onboarding processes. We also aim to introduce pulse surveys, as a way of getting feedback on certain topics more quickly. To make our processes more efficient and to help us better learn from each other, we discuss employee feedback from our survey feedback sessions at a team level. In 2018, we continued with these sessions.
Promoting diversity and inclusion
We believe a diverse and inclusive workforce helps us develop new solutions and ideas. Different voices and points of view are necessary to drive our innovation. We maintained our high level of diversity in terms of culture and nationality, employing people of
123
different nationalities in 2018 (up from
115
in 2017). In 2018, about half of our newly hired staff in the Netherlands were non-Dutch. As a result of our continuous efforts to recruit and retain women, our percentage of female employees increased from 11 percent in 2010 to
16 percent
in 2018. Gender diversity is, however, still an area where we need to improve. In 2018, more than 40 percent of our scholarship grants in the Netherlands were awarded to women. To increase our future talent pool and get young women interested in technology, ASML supports initiatives in the Netherlands such as Girlsday, where girls aged 10-15 are given the opportunity to learn more about technology. We support similar initiatives in the US and Asia. In 2018, we appointed our first female Fellow. We award this title to experts in our R&D department who have made outstanding contributions to our technology.
We subscribe to the ‘Declaration of Amsterdam’, a call to action for employers, unions and governments to implement concrete changes that ensure progress in matters affecting LGBTI people. The declaration is an initiative by Workplace Pride, an Amsterdam-based international non-profit organization that strives for greater worldwide acceptance of LGBTI people in the workplace. In November 2018, only a year after becoming a member of Workplace Pride, ASML's LGBTI employee network, Pink ASML, was recognized for its hard work and achievement by receiving the Most Engaged Network Award at the Workplace Pride Foundation Leadership Awards. Pink ASML aims to highlight the increasing importance of LGBTI inclusion in the tech industry. Demonstrating our support for LGBTI rights, one of our board members joined our ‘Pink ASML’ employee group in attending the 2018 Gay Pride Canal Parade in the Netherlands, riding an ASML-branded boat through the canals of Amsterdam. We take a position in public discussions on diversity and immigration, making it clear that ASML strongly believes in offering jobs to people regardless of their gender, sexual orientation, religion or nationality. We oppose legislation that limits people’s right to travel freely, based on such criteria.
We promote diversity and inclusion through efforts to integrate people with disabilities in our workforce. We pay particular attention to people with autism, hosting lectures and promoting discussion to enhance awareness and accommodate the integration of those with autism, and other minorities in our company. For more information on our diversity and inclusion performance data, see
Non-Financial Statements - Non-financial Indicators
.
ASML INTEGRATED REPORT 2018
26
Fair remuneration
We want our remuneration to be fair and balanced, so that it is no distraction from the motivation and engagement our employees experience from their job content, and from working at ASML as a Great Place to Work. In our remuneration policies, we strive for global consistency, while respecting what is common practice in local markets. We want our employees to work together towards shared company goals, and we believe that they are key to the success of our company and deserve to share in this success.
Every year we analyze paid salaries for any gender disparity and, in 2018, as in previous years, we found no major differences in these salaries. See
Non-Financial Statements - Non-financial Indicators
for details on gender payment.
We continuously review how our remuneration compares to the market benchmark for technology professionals in every region where we operate. Where necessary, we make changes to our remuneration policies and levels. In 2018, we implemented adjustments we made to our remuneration policies the previous year for our operations in all regions. This is to make sure we align with our overall corporate remuneration philosophy. In 2018, remuneration at Cymer and HMI was fully aligned with ASML’s current remuneration policies and practices.
At ASML, where we strive for salaries that are competitive in each market and where we have a predominantly highly educated workforce with relatively high levels of remuneration, we are confident that we meet adequate ‘living wage’ requirements, meaning that employees earn salaries that meet their basic needs.
Human rights and labor relations
We believe that human rights, as defined by the United Nations in its Universal Declaration of Human Rights, are a common standard that all employers should uphold. We support the principles laid down in the OECD Guidelines for Multinational Enterprises and those in the International Labor Organization’s Tripartite Declaration of Principles concerning Multinational Enterprises and Social Policy. In the spirit of these principles, we support our employees’ right to organize in labor unions and to collectively negotiate fair wages and working conditions. We believe these rights must be respected for all ASML employees at our locations worldwide.
We want to provide fair labor conditions and social protection for all our employees, regardless of whether they are on a fixed contract or a flex one. In the Netherlands, we negotiate with and consult labor unions and our company’s Works Council, our employees’ representative body. As required by Dutch law, our BoM must seek the non-binding advice of the Works Council before taking certain decisions, such as those related to a major restructuring or a change of control. Some decisions directly involving employment matters that apply either to all employees or certain groups of employees may only be taken with the Works Council’s approval. In the event the Works Council does not agree with a particular decision, and the BoM still wishes to proceed, the BoM must suspend any further action while the Works Council determines whether to appeal to the Enterprise Chamber of the Amsterdam Court of Appeal.
We strive to comply with the relevant legislation in every country we operate in. In the US, for instance, we aim to comply with all state and federal laws and regulations regarding labor practices and employees’ rights to organize. This means we do not interfere with, restrain, or influence employees who want to organize themselves in a labor organization for collective bargaining purposes. In Taiwan, where we have several business operations, all employees, except those working in government administrative organizations, can form unions. ASML seeks to comply with all relevant legislation, such as the Taiwanese Union Act and the Law Governing Collective Bargaining Agreements.
In Korea, the Labor-Management Council (LMC) is a consultative body that aims to promote welfare and cooperation between employers and employees under the Promotion of Worker Participation and Cooperation Act. The LMC discusses ways to enhance productivity, improve working environments, address employee grievances, promote workers' welfare, and other matters. LMC representation for ASML consists of 20 members
(
10 members each for employer and employees), and holds council meetings at least every three months.
At ASML, the principle of free choice of employment is respected. It applies to every employee in every country we operate in. We adhere to the Responsible Business Alliance Code of Conduct and expect our suppliers to adhere to this code, as well as other human rights principles. See
Management Board Report - Partners - Sustainable relationships with suppliers
.
Our policy stipulates that compliance with human rights standards and other Responsible Business Alliance standards should be included in our supplier agreements.
Protecting privacy
In the countries where we operate we aim for compliance with the legal requirements regarding the protection of our employees’ privacy, as well as the privacy of our customers and suppliers, and that of their employees. In Europe especially, legislation on these matters is developing fast. As such, we are implementing ASML’s binding corporate rules, or Privacy codes, on employee data as well as customer, supplier and other business partner data. We are also developing a program to increase privacy awareness globally within our company. We have a Privacy Officer who reports to our Senior Vice President Corporate Legal.
ASML INTEGRATED REPORT 2018
27
Our flexible labor model
The flexible labor model in the Netherlands consists of employees on fixed or flex contracts. This model allows us to adapt to semiconductor market cycles, including providing support for potential 24 / 7 production activities as and when this is needed.
Globally,
14
percent of our employees were flex workers at year-end 2018.
We work with three categories of flex employees: those hired to fill gaps in our fixed workforce and who will be offered a fixed contract after one year; those hired to temporarily increase our operational capacity, with flex contracts of a maximum of two years; and those with skills we need temporarily and who can stay on a flex contract for a maximum of three years. In 2018 there were 1,200 flex employees who received a fixed employment contract.
Overtime
We pay constant attention to protecting our employees from working overtime during peak periods. The nature of our business means employees often need to work significant amounts of overtime, taking responsibility for finishing projects on time. It is our policy to follow local rules regarding working hours. However, we apply our own company standards when these are stricter. Our company standards are based on Responsible Business Alliance norms.
Due to high customer demand and job vacancies, there is still significant overtime. This applies particularly to Dutch employees who are temporarily working at an ASML or a client location abroad.
As overtime remains an important attention point for management, we keep monitoring the use of overtime and take appropriate measures to manage the situation. We continue to raise awareness about our standards.
Community involvement
As a global technology leader and employer, ASML plays an active role in the communities we operate in. By fostering close community ties, we learn more about the world around us and raise awareness of our business, our industry and our interests. Our involvement is also a way for us to fulfill our leadership role, as the community can benefit from our success and position.
Our community relations program, which falls under the remit of our CEO, is built on three pillars:
|
•
|
Making local communities we operate in attractive places to live for our employees and their families by event sponsoring and our government engagement.
In 2018, for example, ASML played a significant role in engaging the Dutch government to invest EUR 130 million in the Brainport / Eindhoven area. Local authorities and the business community will invest EUR 240 million, which amounts to a total investment into the region of around EUR 370 million. This is the first phase of a broader initiative: the Brainport National Action Agenda. ASML is a key partner. Funding will be made available for a significant number of initiatives linked to making the region a more attractive place to work and live for internationals as well as locals.
|
|
•
|
Promoting and providing technical education in local communities.
For the sixth consecutive year, ASML sponsored the annual Mechatronics competition at Cornell University, in the US. The competition entails about 180 students in 60 teams of three designing and developing autonomous robots that compete against each other. Each year, ASML develops its own robot to compete against the students. ASML volunteers, divided into three teams, held their own internal competition before the winning team traveled to Cornell to challenge the students.
|
|
•
|
Giving back to communities by supporting local charities and global education projects (through the ASML Foundation).
One of the key activities, launched in October 2018 and due to run until 2021, is ASML’s partnership with PLAN International to promote girls in technology. Titled ‘STEM - Girls Can Do It’, the project will focus on young people in rural China, near ASML’s offices in Chengdu and Xi’an. The aim is to promote more gender-balanced STEM education. The project will expose about 1,200 young people, of which 70 percent are girls, to technology, science, engineering and math, and teach them coding and programming. Employees from the local ASML offices intend to participate as role models.
|
The total amount ASML spent on charities, community involvement, organizations, and its own ASML Foundation in 2018 was around EUR 1.8 million.
A key part of our community focus is education, particularly technology education and upskilling. As the rate of technological advancement speed ups, we are increasingly faced with a critical skills shortage. With technology now ever-present, more companies than ever, including non-technical companies not traditionally needing these skills, are seeking the expertise of engineers and data specialists.
There is a recognized shortage of data experts, with skills such as machine learning and artificial intelligence increasingly in demand. Digital expertise is the most critical skill of the 21st century. At ASML, we believe it is important to start educating young people as we are involved in co-creating this new age.
We have a responsibility to prepare people for an increasingly digital future. We are looking into opportunities to get more closely involved in education to address the shortage of tech teachers. To this end, ASML, along with many other regional partners, signed the Brainport Talent & Skills Agreement in 2018.
ASML INTEGRATED REPORT 2018
28
This focus on technology education has a direct impact on developing communities. With digital expertise being in such high demand, lack of skills means those without them will lose out on opportunities.
Our headquarters at Veldhoven is also based in a region where there is significant emphasis on education, through the Brainport initiative. In one of our many activities in 2018, we played a part in developing a program with our Brainport partners to expose teachers to technology upskilling. They spent time at ASML, among other companies, and were able to take their leading-edge technology learnings back to share in their classrooms.
The following table provides an overview of some of our community programs and what they have achieved.
|
Pillars
|
Key programs
|
Results
|
||
|
Making local communities we operate in attractive places to live for our employees and their families
|
•
•
|
Together with our partners in the Brainport Eindhoven region and key public stakeholders in The Hague, we developed the Brainport National Action Agenda, which invites the Dutch government to invest more in our high-tech region. An important part of this is creating a pleasant environment to live in, as we need to be able to attract talented employees from all over the world.
Through our sponsorship program, we support several local organizations, such as The Hub and the Expat Center in Eindhoven, the Netherlands. We also support local events such as the Veldhoven Tasting food festival in Veldhoven, the Netherlands, Habitat for Humanity in San Diego, California, in the US, and Community Food events in San Diego and Wilton, Connecticut, in the US. |
•
•
|
The Dutch government has recognized the unique and valuable contribution of the Brainport Eindhoven region. In collaboration with the new government, the Brainport National Action Agenda will be developed further, moving a step closer towards realization.
We provided funds to the PSV Eindhoven football club, the Muziekgebouw concert hall in Eindhoven, and are the main sponsors of the Eindhoven marathon, in which more than 500 ASML employees participate. For ASML, mastering light is key, and in 2018 and into 2019, we sponsored the GLOW light art exhibition in Eindhoven and Nanjing, in China. For the first time, the light festival in Nanjing gave us an opportunity to blend our own light exhibition and a traditional Chinese light festival. |

|
||||
|
Promoting and providing technical education in local communities
|
•
•
•
|
We run an intensive technology promotion program to boost interest in technology among young people and increase the local and regional talent pool. As such, we also raise awareness of career prospects in a sector offering many development opportunities.
We help technology startups through our active role in the Eindhoven Startup Alliance (HighTechXL) and the Make Next Platform. We focus on providing expertise and coaching support rather than financial contributions.
We grant ASML Makers Awards to help develop good ideas into concrete prototypes and prototypes into products that can be produced locally.
|
•
•
•
•
|
The ASML Foundation financially supports Science Camp Korea. The three-year program provides science education to vulnerable children in disadvantaged areas close to ASML's headquarters. Around 65 ASML employees teach a self-developed science program.
In the Netherlands, we organized Girlsday and the Dutch Technology Week. At the Night of the Nerds during Dutch Technology Week, around 4,500 children between 14 and 19 got the opportunity to experience the world of technology and innovation, featuring the latest digital, technological and media developments from ASML and other companies. We have seen several high-tech hardware startups thrive and some scale up to become more mature businesses. We organized two Get in the Ring events, attracting startups from all over the world. Five winners were selected and will get support from ASML to develop their activities. At least four ideas that won an ASML Makers Award were brought to the next level, and one has been made ready for market introduction and production. ASML supports Eindhoven University of Technology’s research activities in the new and highly innovative field of integrated or smart photonics with an annual donation of EUR 122,000 for 5 years, ending in 2021. |
|
|
||||
|
Giving back to communities by supporting local charities and global education projects
|
•
•
|
Our volunteer work policy allows ASML employees to do eight hours of volunteer work annually during working hours.
We provide financial support to projects related to education for underprivileged children and teenagers, mostly through the ASML Foundation. |
•
•
•
•
|
ASML employees in the Netherlands completed a total of 5,434 hours of volunteer work in 2018.
Since 2015, we have been supporting Stichting Leergeld in the Netherlands, which helps students from low-income backgrounds pay for the technical and safety equipment they need for technical studies at MBO schools in the Brainport region.
In 2018, we began to support the Boys & Girls Club Silicon Valley through the ASML Foundation. There is a wide income gap in Silicon Valley between people working in tech and those outside the industry. Studies show that children from high-income families outperform those from low-income areas. With its focus on STEM, the after-school program aims to bridge this gap.
We have a cooperation with Close the Gap, and donate about 100 refurbished laptops annually for their programs in developing countries. We also donate about 230 laptops annually to local charities.
|
|
|
||||
ASML INTEGRATED REPORT 2018
29
|
|
The ASML Foundation
The ASML Foundation focuses on the UN’s fourth Sustainable Development Goal: to ensure inclusive and quality education for all and promote lifelong learning. The ASML Foundation aims to increase the self-sufficiency of disadvantaged children through educational initiatives that develop their talents and help unlock their potential. Although closely linked to our company, the ASML Foundation operates independently. The ASML Foundation supported 24 projects in 17 countries and committed over EUR 1.4 million. The Foundation is our charity of choice. The ASML Foundation mainly supports projects in the regions where ASML operates: Asia, Europe and the US. These projects address the specific needs in that region. In the US for example, projects mainly focus on preventing school drop-outs in underprivileged areas, and the promotion of STEM, especially for girls. Projects in Asia differ per country. In developing areas of Asia, for example, projects focus on education for girls to prevent child marriages, and on vocational training for young people to increase their self-sufficiency. In China, the focus is on STEM for girls in rural areas. In Europe, and the Netherlands specifically, the foundation focuses on education for disadvantaged children, and children lacking in education, that suits their specific needs. We encourage our employees to support the ASML Foundation, either financially or through volunteer work. For more information, see www.asmlfoundation.org. |
People objectives
|
Theme
|
|
Objective
|
Target year
|
How we did
|
|
|
|
|
|
|
|
|
|
Talent management
|
2018 focus areas:
|
||||
|
|
a. Secure Workforce Management and Workforce Planning to support future growth.
|
2018
|
|
Our headcount targets are translated into people plans and specific hiring plans including related competences. Due to additional demand during the year, the initial planned number of hires in 2018 has now been exceeded.
|
|
|
|
|
b. Execute recruitment strategy by implementing the new Applicant Tracking System, focused communication strategy on labor market and deploying a strengthening selection process.
|
|
The new Applicant Tracking system went live at the the start of 2018. Specific labor market campaigns helped to exceed the initially planned hiring number. The selection process has been strengthened through global training of line managers and an extension of the existing assessment deployment.
|
|
|
|
|
c. Strengthen onboarding activities on a global scale by further roll-out of our pre-onboarding app, developing a social onboarding program and further deploying of the buddy program.
|
|
Our pre-onboarding app has been deployed to all sites. The pre-onboarding app was deployed in Europe and the US in 2018, and will also be deployed in Asia. The buddy program, including documentation and training, was also launched throughout the company.
|
|
|
|
|
|
|
|
|
|
|
|
Attrition rate of high performers < overall employee attrition.
|
2017 - 2020
|
|
See People KPIs in the table below - our attrition rate of high performers is 2.2%, lower than our overall attrition rate of 4.7%.
|
|
|
|
|
|
|
|
|
|
|
Promotion rate of high performers > overall promotion rate.
|
2017 - 2020
|
|
See People KPIs in the table below - our promotion rate of high performers is 40%, well above the overall promotion rate of 14%.
|
|
|
|
|
|
|
|
|
|
2019 focus areas:
|
|
|
|
|
|
a. Secure quality of hires
|
2019
|
|
|
||
|
b. Secure effectiveness of new hires
|
|
|
|||
|
c. Secure internal leadership pipeline
|
|
|
|||
|
d. Define and deploy a global Culture & Values Framework
|
|
|
|||
|
|
|
|
|
|
|
|
|
|||||
ASML INTEGRATED REPORT 2018
30
People KPIs
|
KPI
|
2016
|
2017
|
2018
|
|
Average engagement score me@ASML survey
1
|
7.0
|
7.0
|
n/a
|
|
Employee Attrition (in %)
|
3.9
|
4.4
|
4.7
|
|
Attrition rate of high performers (in %)
|
1.7
|
1.8
|
2.2
|
|
Promotion rate of high performers (in %)
|
35
|
37
|
40
|
|
1.
|
Measured on a scale from 0 to 10, with 10 being the top score. No survey was held in 2018.
|
ASML INTEGRATED REPORT 2018
31
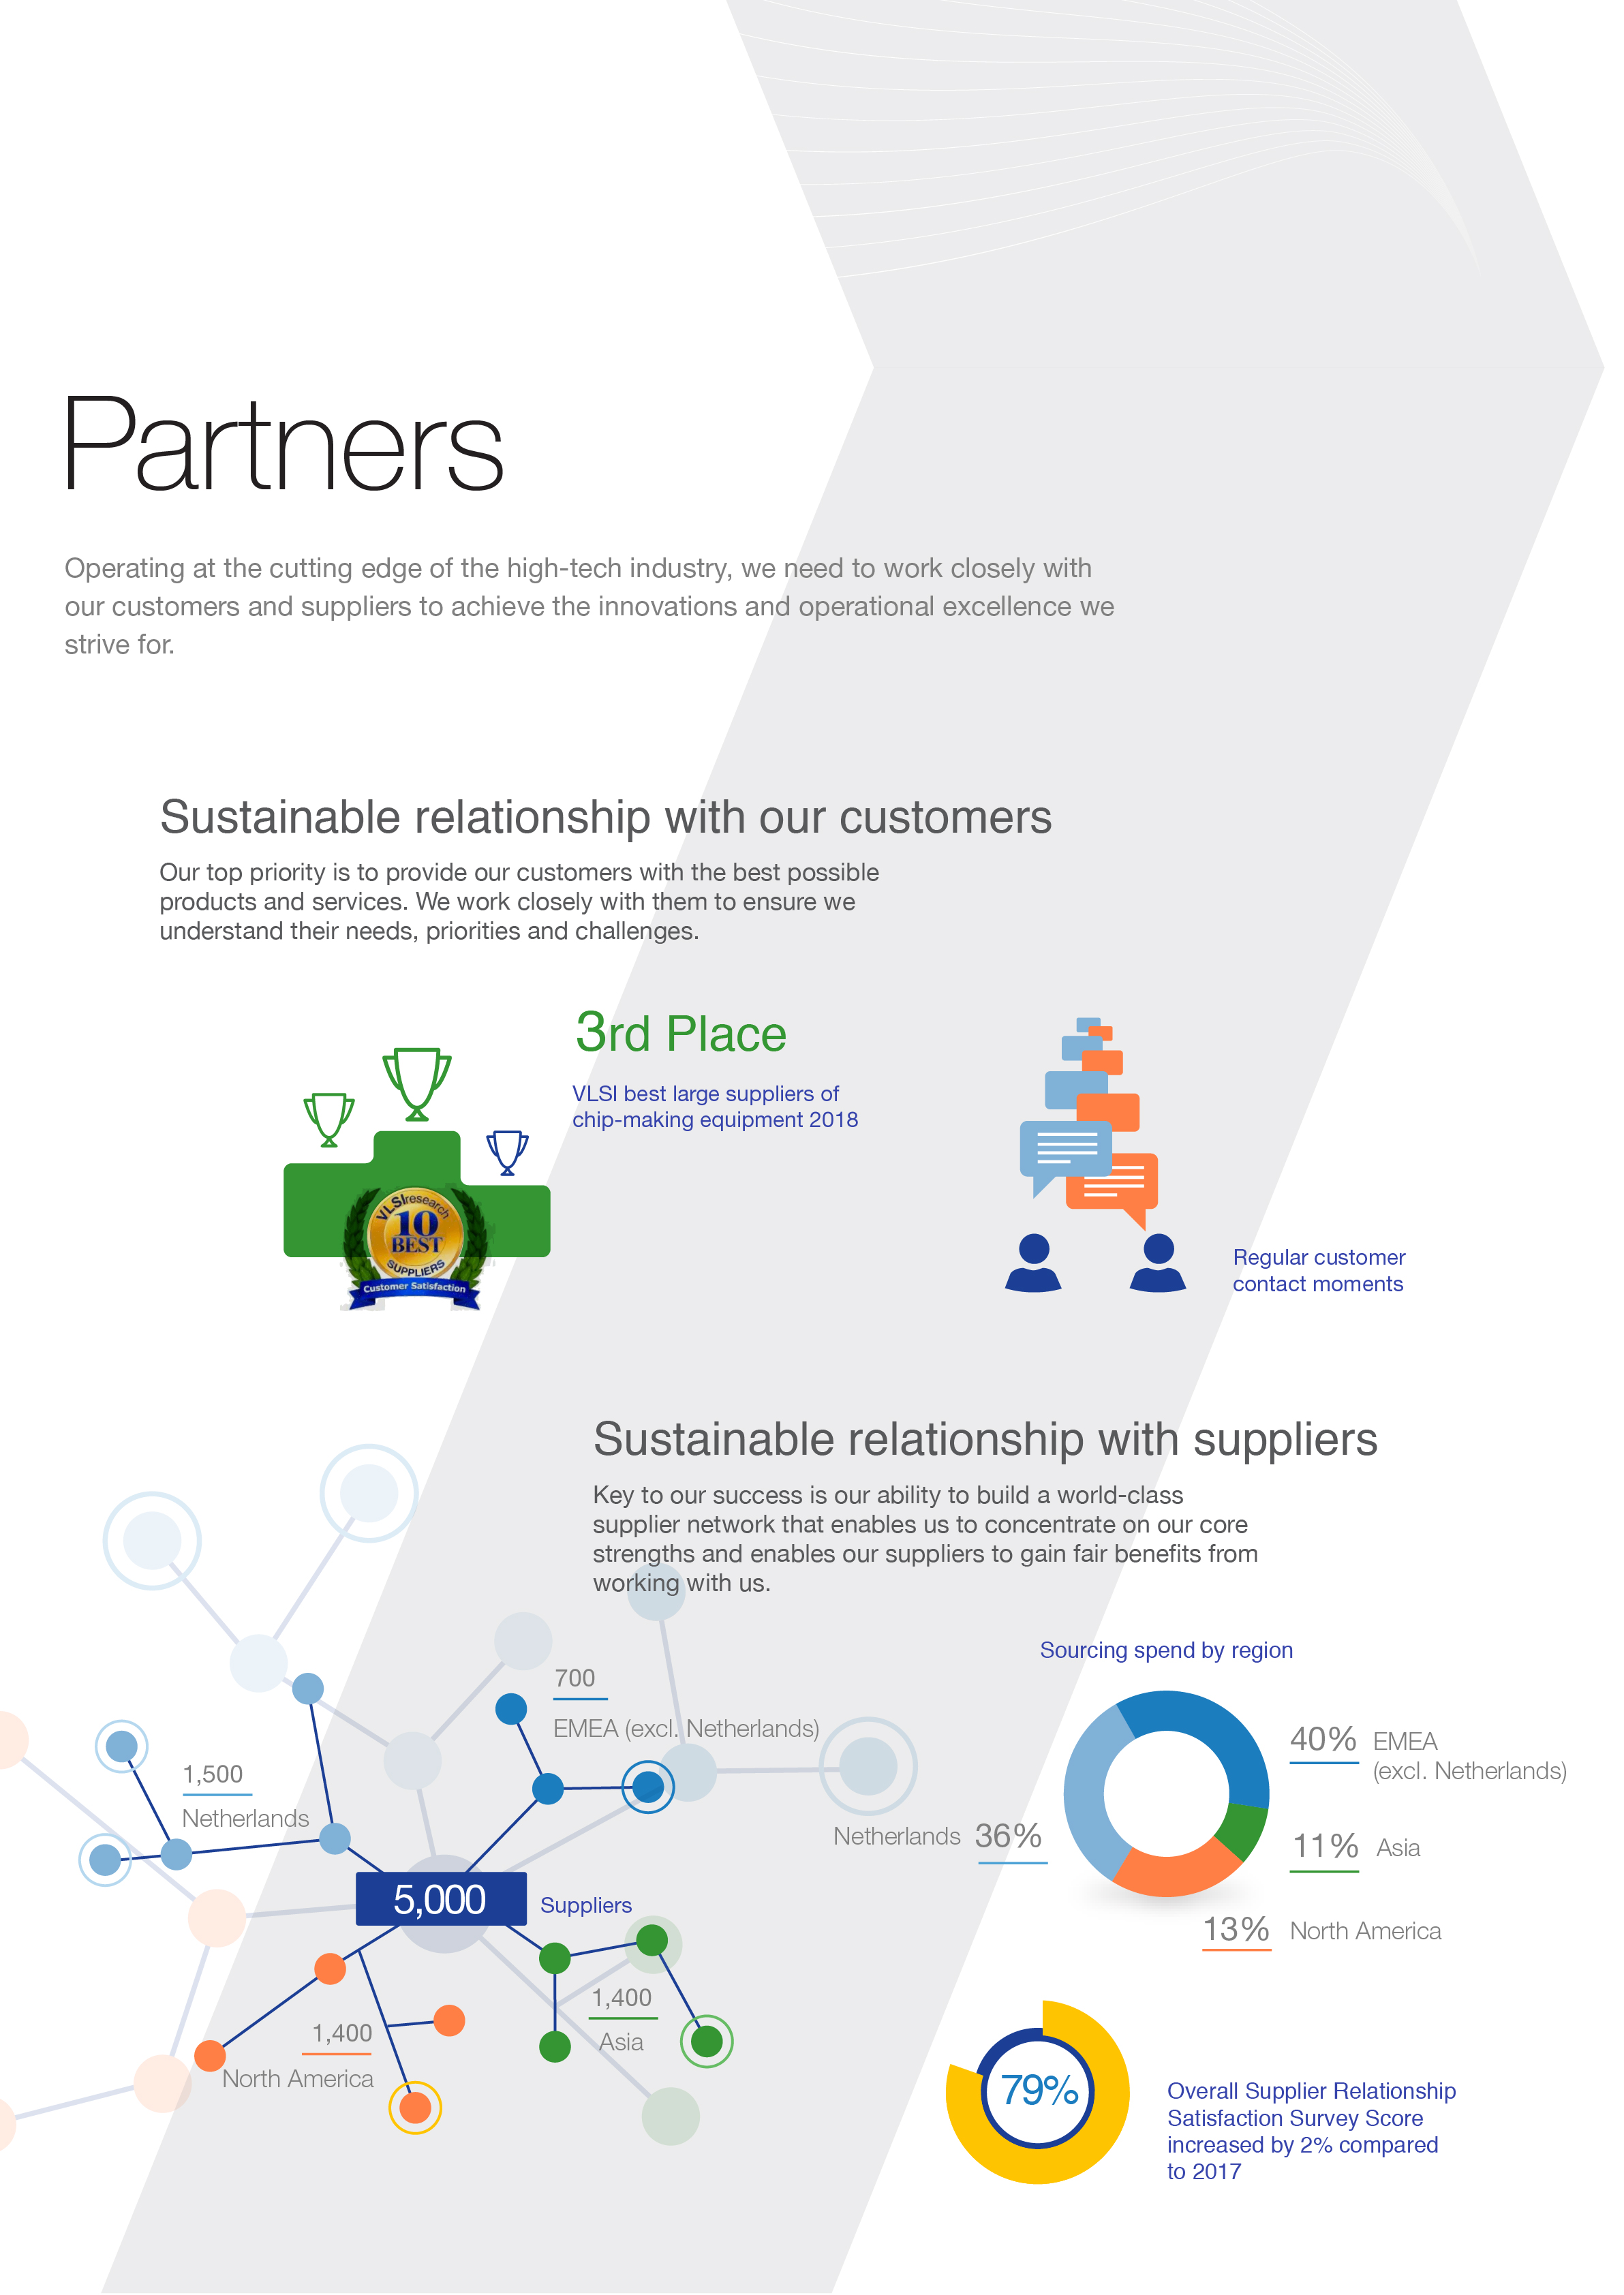
ASML Integrated Report 2018
Sustainable relationships with our customers
Our priority is to give our customers the best-possible products and services. We work closely with them to make sure we understand their needs, priorities and challenges. The high cost of new chip-making equipment and factories is a major incentive for building partnerships, sharing knowledge and risks, and aligning our investments in innovation with those of our customers. This is reflected in the commitments made in 2018 by three of our leading customers to ASML’s High NA EUV development program for future delivery of up to 12 systems.
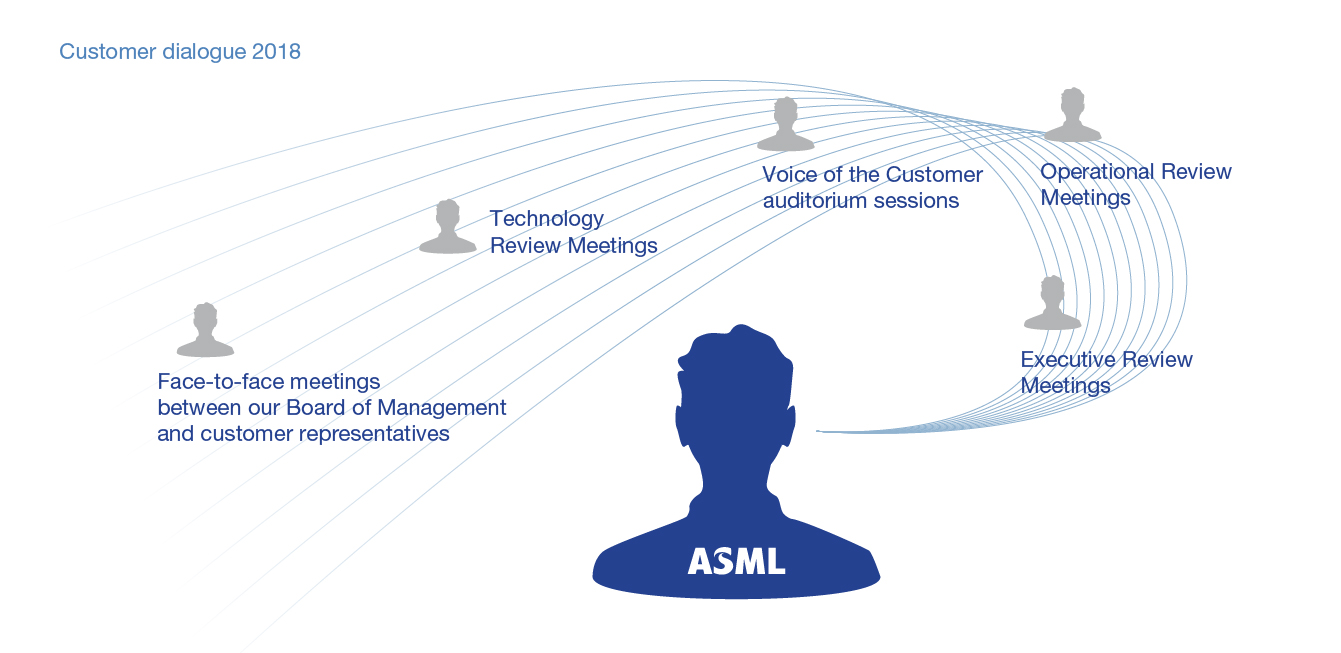
Staying close to our customers
Our sales teams market and sell our products directly to our customers, without agencies or other intermediaries. Our account managers, field and application engineers, and service and technical support specialists are located throughout Asia, the US and Europe. In addition to the establishment of industrial sites in Linkou and Tainan, Taiwan, in 2017, we created a new training site in China in 2018. These sites are supplementary engines to drive our long-term growth, providing customer support and training, logistics, refurbishment, technology and application development. The new site in China is a training center to develop worldwide talent for our workforce, clients and customers.
To support and sustain our partnerships with customers, we have a system of customer meetings in place. These take place regularly with our biggest customers, who collectively account for the vast majority of our revenue and the semiconductor equipment market. These meetings include our Executive Review Meetings, at which members of our senior management team and BoM discuss business and general issues with customers, Technology Review Meetings, at which our senior technology experts and CTO discuss technology plans and requirements with customers. These meetings are an opportunity for customers to set out a roadmap for their technology requirements, such as shrinking chip size, and Operational Review Meetings, to review topics related to the operational activities of our customers. These meetings help align our future product plans with our customers’ goals, and also help to identify and close gaps. Besides these important planning sessions, we also hold numerous face-to-face meetings between our BoM and customer representatives to discuss business.
Our Voice of the Customer program allows our employees to hear firsthand about our customers’ needs and challenges. This is especially important for employees who do not usually have direct access to customers. To reach as many of our people as possible, the program uses different channels of communication: live presentations and Q&As with senior customer representatives; recorded customer interviews; online articles, and personal engagement with customer representatives who are based near our offices in Veldhoven. In 2018, eight of our customers had representatives that were based near Veldhoven. To share feedback with an even bigger audience at ASML, we expanded our Voice of the Customer program in 2018 by adding customer feedback briefings. Our account teams used company gatherings, such as our ASML Day, as an opportunity to share this feedback. This generates more ideas from employees, and helps us act on the feedback and make improvements.
Based on customer feedback, we focused on communication in 2018, with our teams working on enhancing frequency of communication with customers. This was done, for example, by increasing the number of points of contact with customers, holding more regular meetings, and, in some cases, hosting quarterly reviews with ASML teams from sectors beyond account management. We aim to keep in close contact with customers and update them on improvements and solutions.
According to an annual customer survey conducted by research specialists VLSI, we ranked
3rd
(
2017
:
3
rd)
on the list of best suppliers of chip-making equipment with a score of
9.1
out of 10.0
(
2017
:
9.0
).
ASML INTEGRATED REPORT 2018
33
Customer Loyalty Survey
In 2018, we held our biennial Customer Loyalty Survey, which asks our customers to rate our performance. It presents them with multiple-choice questions on the most important areas of improvement for our account teams and business lines. The survey is one of our most important tools for gauging customer satisfaction and receiving feedback. Along with our Voice of the Customer program, it helps us define our improvement priorities for the coming year. Once these areas have been identified, ASML teams come together regularly to track progress. They report back to customers with their findings. For the first time, HMI and Brion were included in the Customer Loyalty Survey. Our latest survey, in September 2018, resulted in a satisfaction score of
73.3 percent
. Our next survey will be held in September 2020.
Through our Customer Loyalty Survey, customers asked that we focus on quality improvements, product performance in a high-volume manufacturing environment, and timely solutions for install-base problems. In 2018, we continued using feedback from the survey to improve our service. Our account teams fine-tuned their priorities, and stepped up efforts to proactively inform customers about any expected issues so as to find solutions at an earlier stage. We also continued our efforts to make sure customers receive spare parts at the right time and of the right quality, so reducing downtime in their chip-making operations.
Cost of ownership
Our customers look to us to deliver cost-effective solutions with improved cost of ownership over time to enable the introduction of more advanced process technologies that enable more powerful microchips with lower cost per function, and for a given microchip design to enable cost reduction over time. We aim to deliver this first by introducing new technology that allows the device to shrink cost effectively, for example with EUV that enables smaller features with fewer process steps than with multiple patterning, secondly by introducing higher productivity on our systems to reduce the cost to process a wafer, and lastly by providing upgrades and services to our installed base systems to enhance their output and operating life cycle. In 2018, we showed continued progress with our EUV technology, bringing our systems to the point of high-volume production. See also
Management Board Report - Products and Technology - Innovation drives our business
. We also continued our program to upgrade our DUV immersion scanners, which enables customers to reuse their installed base, and through our Brion software, allowed them to take advantage of a faster and more efficient patterning process, so helping to reduce the overall cost of ownership. In 2018, the integrated sales teams of ASML and HMI served our customers with our holistic lithographic solution, including accurate patterning information metrology.
Sustainable relationships with suppliers
We rely heavily on our suppliers to develop, manufacture and deliver innovative parts for our systems, on time and with the right quality. It is our strategy to develop and manufacture those parts and modules that are unique for lithography in house, both from a manufacturing and a development competence perspective. If this does not prove possible, supplier partnerships are established and well maintained. Contract manufacturers or Original Equipment Manufacturing suppliers are mainly responsible for delivering modules and / or parts that require non-unique manufacturing. It is crucial that we build a world-class supplier network. One of our major priorities is to work with our suppliers to reduce the total cost of ownership of our systems, while meeting our challenging quality standards.
We conduct risk assessments for all key suppliers every year, evaluating risk areas such as our suppliers’ financial health, change of ownership, potential for supply disruptions (e.g. as a result of natural hazards), and situations where we depend on a single supplier for certain parts or modules. For product-related suppliers, we conducted 190 risk assessments in 2018 covering more than 90 percent of spend. As suppliers operating in the same industry or market are typically exposed to similar risk, we evaluate suppliers’ risk and performance within the context of the supply market category, so enhancing efficiency. Whenever necessary, we mitigate risks by adjusting our sourcing strategy. Our risk assessment includes monitoring of critical raw materials. As our suppliers purchase and process most of the raw materials we require for our products, we have limited exposure to price volatility of these materials. Due to a fire at one of our suppliers of electronics components and modules, work in progress and part of the inventory was lost. Due to the integral cycle time of around one quarter for these modules, we expect ASML's first-quarter sales to be negatively impacted by approximately EUR 300 million, which we expect to largely recover in the second quarter, with the remainder expected to be recovered in the second half of 2019.
We also require our suppliers to meet standards regarding quality, logistics, technology, cost and sustainability. In 2018, we continued our quality program with suppliers. Quality metrics were improved and we introduced Supplier Quality Mission Statements to emphasize both ASML's and suppliers' commitment to achieving quality improvements. We rolled out a new version of the ASML supplier profile, our approach to supplier management and development. This provides an enhanced knowledge base to improve supplier performance dialogue. Supplier capability management is further improved by the implementation of a single framework for supplier assessment and development, allowing ASML to communicate process requirements and compliance expectations clearly to suppliers. We regularly evaluate our risk assessment and supplier profile methodology, and will continue to invest in evolving the norms underpinning the supplier profile to better meet industry requirements. Improvement initiatives for 2019 include further embedding of product safety requirements and information security improvements, including continued focus on GDPR compliance.
ASML INTEGRATED REPORT 2018
34
Partnership with Carl Zeiss SMT GmbH
Carl Zeiss SMT GmbH is our single supplier, and we are their single customer, of optical columns for lithography systems. Carl Zeiss SMT GmbH is capable of developing and producing these items only in limited numbers and only through the use of manufacturing and testing facilities in Oberkochen and Wetzlar, Germany.
In
2018
,
28.3 percent
of our aggregate cost of system sales was purchased from Carl Zeiss SMT GmbH (
2017
:
26.6 percent
;
2016
:
27.6 percent
).
Our relationship with Carl Zeiss AG is structured as a strategic alliance pursuant to several agreements executed in 1997 and subsequent years. These agreements define a framework in all areas of our business relationship. The partnership between ASML and Carl Zeiss AG is run under the principle of ‘two companies, one business’ and is focused on continuous improvement of operational excellence. Pursuant to these agreements, ASML and Carl Zeiss AG have agreed to continue their strategic alliance until either party provides at least three years' notice of its intent to terminate.
In 2017, we completed the acquisition of a
24.9 percent
indirect interest in Carl Zeiss SMT GmbH for EUR 1 billion. We also agreed to support Carl Zeiss SMT GmbH’s R&D expenses, capital expenditures and other supply chain investments pertaining to High NA technology
over
six years
, beginning in 2016. The main objective of this partnership is to facilitate the further development of our EUV lithography chip-making systems. See
Consolidated Financial Statements - Notes to the Consolidated Financial Statements - Note 10 Equity method investments
.
Sustainability criteria
The sustainability criteria that we cascade to our suppliers are based on the Responsible Business Alliance (RBA, formerly known as Electronic Industry Citizenship Coalition) Code of Conduct. This code covers, among other things, standards for human rights, anti-corruption and bribery, and for sound environmental practices. Compliance with the Responsible Business Alliance Code of Conduct is a prerequisite for doing business with us, and we actively pursue our suppliers' adherence to this code. The requirement to meet human rights and other ethical RBA standards is included in our long-term product-related supplier contracts, along with the right to audit RBA compliance. We conduct supplier audits to address risks identified in our regular risk assessments. These audits also help ensure suppliers deliver what we expect. Our objective is to conduct a review of the sustainability efforts of our business-critical suppliers. To further align our efforts with international RBA guidelines we have replaced ASML's own sustainability survey with the RBA self-assessment survey as offered by the RBA platform. We expect the results in the course of 2019 at which point we can tailor supplier interventions. We aim to audit our suppliers' sustainability performance according to a perceived level of risk. If a supplier does not conform to the required standards, it is our policy to discuss mitigating measures.
|
|
Responsible Business Alliance
Responsible Business Alliance members commit and are held accountable to a common Code of Conduct and utilize a range of Responsible Business Alliance training and assessment tools to support continuous improvement in the social, environmental and ethical responsibility of their supply chains. The Responsible Business Alliance used to be known as the Electronic Industry Citizenship Coalition and was renamed in 2017. See also www.responsiblebusiness.org. |
Supplier Relationship Satisfaction Survey
We have been conducting an annual Supplier Relationship Satisfaction Survey since 2015, which has helped us set priorities to improve how we collaborate with our suppliers. Based on feedback from our 2016 Supplier Relationship Satisfaction Survey, we made our supplier meeting setup more structured and transparent to improve meeting effectiveness and to facilitate involvement of senior management. In 2018, we further strengthened our supplier management approach by implementing category management, meaning we categorize suppliers based on the supply market in which they operate, thereby improving the effectiveness of our sourcing organization.
After revising the survey questions in 2017, we again focused the survey on the critical questions, while still capturing key trends. We recalibrated the scores for multi-year comparison. The weighted average satisfaction scores for 2018 were 81 percent for product-related and 77.6 percent for non-product related suppliers. These ratings represented 1.3 percent increase for product related suppliers and a 2.7 percent increase for non-product related suppliers, compared to 2017, see
Partners KPIs
in the table near the end of this section.
Across non-product related suppliers, most individual topics faced an increase in rating compared to 2017. The business relationship with our suppliers is, in particular, highly valued. It is important that we continue to improve what we communicate towards our suppliers and with what frequency. We believe that close collaboration with our suppliers, and increasing transparency on future roadmaps and strategies during regular business review meetings, will make this happen.
For product related suppliers, the overall rating score increased for almost all individual topics. Insights into our long-term roadmap and collaboration between ASML and suppliers were especially highly rated. It is important that we continue to improve on the effectiveness and communication of our supplier performance management system. We changed the way we measure performance in 2018, and started the roll out to our critical suppliers. In 2019, we will further integrate the use of supplier
ASML INTEGRATED REPORT 2018
35
performance information in our sourcing decisions. We believe that using the new supplier profile during regular business review meetings, together with clear communication on objectives, will help to make our collaboration with suppliers more effective.
One way in which we strengthen our relationship with suppliers is our Supplier Day in Veldhoven. In 2018, this brought together some 130 representatives from about 90 product-related suppliers from across the globe to participate in workshops and attend presentations by our senior management, including our CEO and CTO. Workshops and presentations were centered around the theme of 'Sustaining Growth', translating our priorities into concrete tasks that we need to complete, as well as the contribution from our suppliers needed to meet these targets. In 2018, we also facilitated a Supplier Day for our non-product related suppliers, bringing together around 65 representatives from approximately 55 suppliers. These Supplier Days offer our suppliers the opportunity to familiarize themselves with our business strategy and targets. Additionally, about 100 quality specialists from approximately 70 suppliers are invited this year to our ‘crossing event’. These are meetings organized by our Supplier Network Management unit, which provide a platform to discuss operational improvements for our products, such as improvements in quality or production volume.
|
‘As-new’ program helps cut waste
As part of our commitment to the circular economy, we work together with customers and suppliers to remanufacture used system parts so that they can be reused as if they were new parts. See also Management Board Report - Products and Technology - Product stewardship. Our first pilot scheme under this ‘As-new’ program, conducted in collaboration with our customers and suppliers, demonstrated the positive environmental impact: total valuable parts returned from upgrades amount to 795,400 kilograms. We discussed the program with more than 20 suppliers and decided to expand it to boost the circular economy model even further. 'Return 4 Reuse' enables circular use In addition to the 'As-new' program, we are improving the reuse of packing, locking and transport materials, aiming to return 80 percent or more for reuse in the next install or relocation. Starting with the EUV systems, the ‘Return 4 Reuse program’ is now expanding the concept to the DUV systems. All packing, locking and transport materials are reused at use level (highest level of reuse). The concept is driven by an automated circular process triggering the limited manual interventions to return and reuse the materials by itself. This makes the process sustainable and enables ASML to focus on increasing the number of materials to be reused. |
Conflict minerals
As of 2012, Section 1502 of the Dodd-Frank Act in the US requires companies to publicly disclose their use of conflict minerals originating from the Democratic Republic of the Congo or any neighboring countries. These include minerals mined under conditions of armed conflict and human rights abuses. The four main minerals concerned are tin, tantalum, tungsten and gold, also known as 3TG.
We closely monitor use of these materials in our supply chain. We encourage our suppliers and sub-suppliers to have policies and due diligence measures in place that will enable us to investigate if the products and components they supply us with contain any conflict minerals from the Democratic Republic of the Congo or neighboring countries. We have also developed our own due diligence process to identify and manage the sourcing of our components, focusing especially on 3TG. As such, we have been conducting due diligence reviews with relevant suppliers to trace the supply chain back to the smelter and will seek confirmation from the selected suppliers that potential 3TG minerals are responsibly sourced.
We are collaborating with both the Responsible Business Alliance (formerly known as the Electronic Industry Citizenship Coalition) and the Global e-Sustainability Initiative, as well as with other semiconductor and electronics companies, to address conflict-free mineral sourcing on an industry-wide level. The Responsible Business Alliance and Global e-Sustainability Initiative have provided us with the standards and templates we use in reporting and implementing our due diligence. As a member of the Responsible Business Alliance we support initiatives which foster better working conditions in raw material production, as well as the Responsible Business Alliance’s efforts to build a trustworthy system that ensures the social and environmental responsibility of mineral sources. We will continue to work with our suppliers on due diligence in the supply chain, supporting industry initiatives and taking appropriate action to comply with the SEC rules and guidance regarding the Dodd-Frank Act. We hope this concerted effort will dissuade perpetrators of violence and human rights violations and encourage transparent mineral sourcing.
Our Conflict Minerals Report is publicly available on our Website.
ASML INTEGRATED REPORT 2018
36
Partners objectives
|
Theme
|
|
Objective
|
Target year
|
How we did
|
|
|
|
|
|
|
|
|
|
Sustainable relationships with customers
|
Respond to customer feedback by improving the quality of spare parts upon arrival and addressing cost of ownership issues.
|
2015 - 2020
|
|
We continued initiatives taken at various levels within the organization to increase quality and address cost of ownership issues (e.g. Account teams have received / are receiving training on Cost of Ownership, Voice of the customer sessions, Quality as one of our Corporate Priorities).
|
|
|
|
|
|
|
|
|
|
|
|
Continue to strengthen executive alignment.
|
2016-2020
|
|
In 2018, regular meetings and numerous face-to-face meetings between our BoM and customer representatives took place to discuss business and general issues.
|
|
|
|
|
|
|
|
|
|
|
Additional emphasis on account teams driving customer quality issues through the organization.
|
2016-2020
|
|
Account teams are supporting the Voice of the Customer sessions to ensure customer feedback is widely shared at ASML.
|
|
|
|
|
|
|
|
|
|
|
Achieve top three ranking among large suppliers of semiconductor equipment.
|
2016-2020
|
|
ASML ranked 3rd on the list of best suppliers.
|
|
|
|
|
|
|
|
|
Sustainable relationships with suppliers
|
More extensive review of sustainability efforts at our business critical suppliers.
|
2016-2018
|
|
All business critical suppliers were invited to fill out a business continuity quickscan and RBA self-assessment. Next step is the evaluation of the results by the Supplier Account Teams. In addition, 34 suppliers were invited to an information security self-assessment.
|
|
|
|
|
|
|
|
|
|
|
|
Introduce revised supplier profiling to separate out performance, capability and risk indicators.
|
2017-2018
|
|
Roll out of the new supplier profile to all 70 key suppliers has been concluded. The focus has shifted to monitor adherence, specifically for the closure of supplier improvement plans and risk mitigation plans.
|
|
|
|
|
|
|
|
|
|
|||||
Partners KPIs
|
KPI
|
2016
|
|
2017
|
|
2018
|
|
|
Supplier Relationship Satisfaction Survey (overall rating score)
1
|
77.4
|
%
|
77.0
|
%
|
79.3
|
%
|
|
Supplier Relationship Satisfaction Survey (overall rating score)
Product related suppliers 1 |
77.5
|
%
|
79.7
|
%
|
81.0
|
%
|
|
Supplier Relationship Satisfaction Survey (overall rating score)
Non-product related suppliers 1 |
77.1
|
%
|
74.9
|
%
|
77.6
|
%
|
|
Overall Loyalty Score (Customer Loyalty Survey)
2
|
75.4
|
%
|
n/a
|
|
73.3
|
%
|
|
VLSI Survey results
3
|
||||||
|
Large suppliers of chip-making equipment - score
|
8.9
|
|
9.0
|
|
9.1
|
|
|
Suppliers of Fab equipment - score
|
8.9
|
|
9.0
|
|
9.1
|
|
|
Technical leadership for lithography equipment - score
|
9.6
|
|
9.4
|
|
9.6
|
|
|
1.
|
The overall rating score covers both product-related suppliers and non-product related suppliers. In 2019 we will review and revise the survey to ensure that we continue to identify meaningful improvement areas.
|
|
2.
|
The Customer Loyalty Survey is held every two years.
|
|
3.
|
Measured on a scale from 0 to 10, with 10 being the top score.
|
ASML INTEGRATED REPORT 2018
37
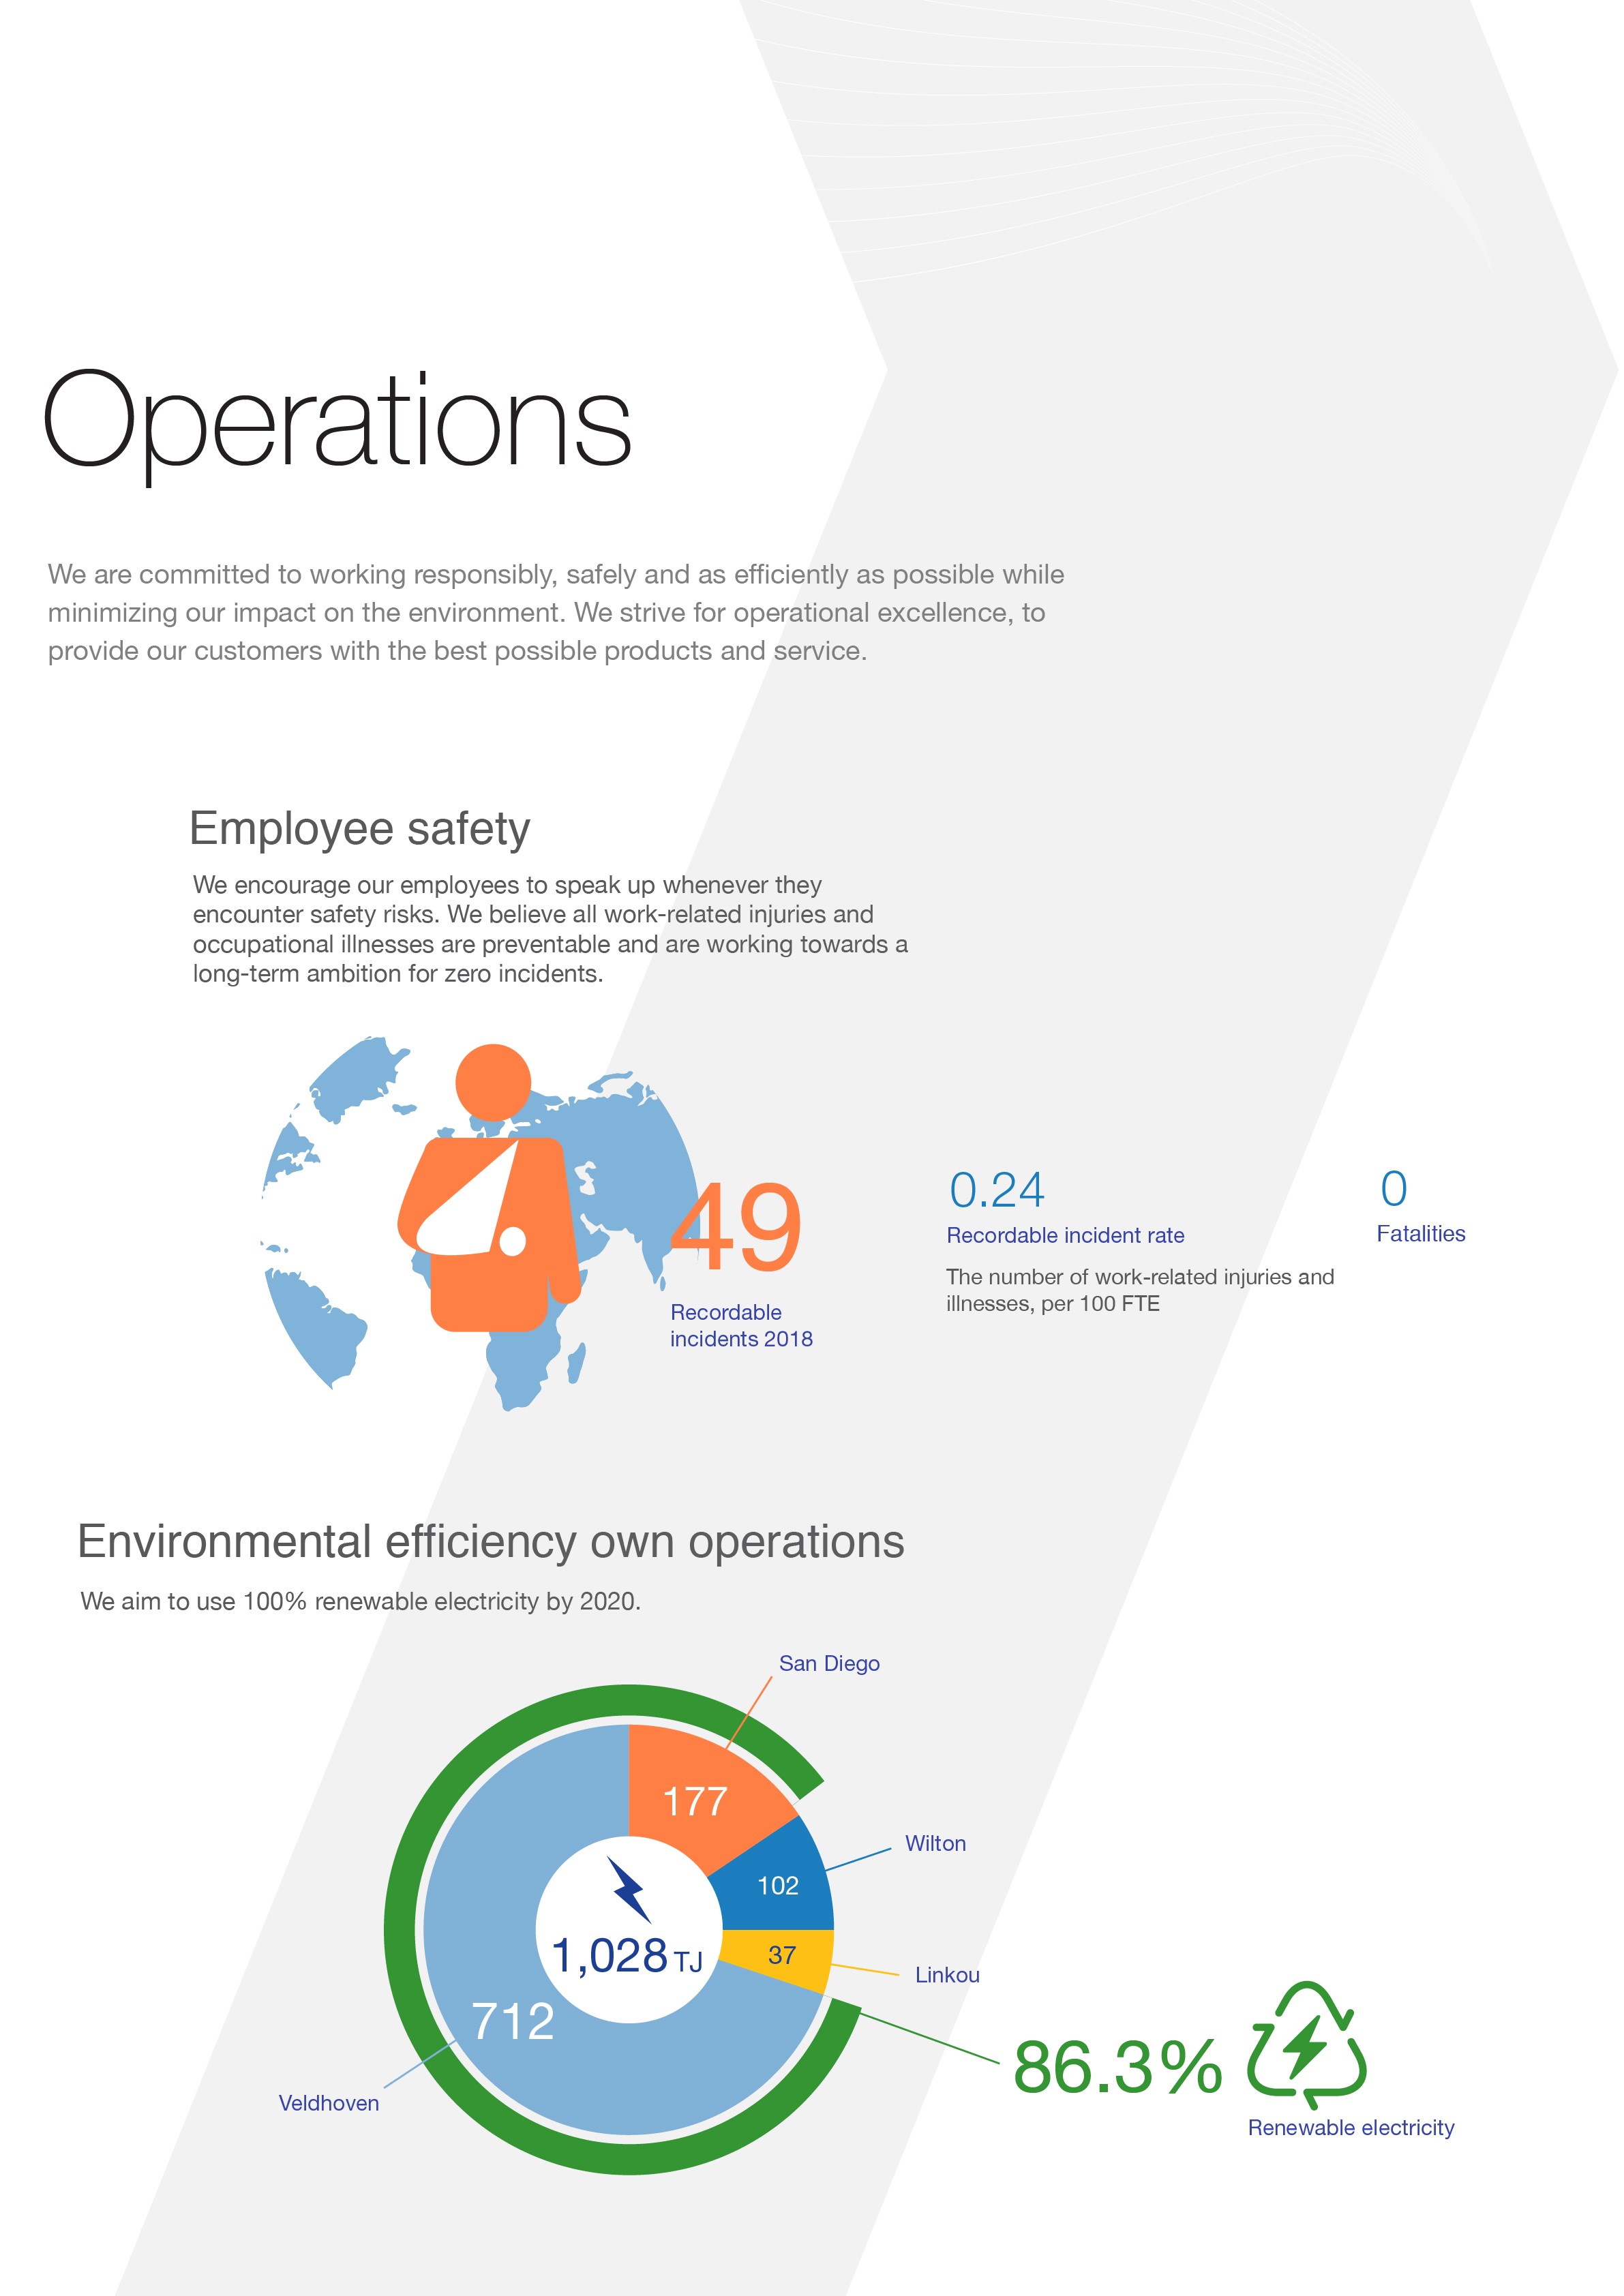
ASML Integrated Report 2018
Operational excellence
We have a long track record of innovation, having introduced several generations of cutting-edge chip-making systems that help our customers produce ever-smaller microchips (‘shrink’) at affordable prices. ASML has evolved along the axis of technology leadership, always first to market with leading-edge technology and products. We have been successful in this technology journey, to the point where we now have significant market share in lithography systems. As products mature, however, customers increasingly focus on cost of ownership and customer experience. Their expectations are changing.
Our value proposition needs us to balance technology leadership with operational excellence. In certain sectors of the market, operational excellence will become our key differentiator. Our challenge is to maintain both business models. For the higher end of the market such as EUV and High NA, we need to retain our technology leadership edge. While for DUV, there will be more of a drive for operational excellence over technology as our competitors match us in certain areas. This will require different sets of behaviors and changes to our culture. Eventually both EUV / High NA and DUV will need a combination of innovation power and operational excellence.
To meet our customers’ expectations, we set up a comprehensive and organized portfolio for structural improvement projects to achieve operational excellence. We aim to deliver products and services with the right quality, on time, at a competitive cost, in a safe work environment and with the optimum use of capital.
Efforts to enhance operational excellence are led by our Operations organization, and more specifically our Department of Operational Strategy and Excellence (OSE). A
policy deployment exercise was conducted to make sure strategic goals are being driven at every level.
In October 2018, the OSE department held an all-hands meeting at Veldhoven, which served to identify the most pressing challenges and breakthroughs needed and how to achieve them.
Lean principles
As our industry evolves and our company grows, which requires a strong drive for standardizing our processes and ways of working, we need to ensure that our Operations organization and way of working are scalable, agile, effective and efficient. To achieve this, we carry on developing our Centers of Excellence network where we bring together and exchange expert knowledge and experience from across our business to support best-practice decision-making and execution. We are monitoring the maturity level of the competence centers rated on a scale of 0 to 5. Secondly, we work to adjust our basic processes to ensure they meet future needs and support them with state-of-the art IT systems. Thirdly, to achieve the cost, quality and delivery improvements we seek for our customers, we use the Lean principles to build a continuous improvement mindset. This means, among other things, that we seek to eliminate anything that does not add value for our customers. Lean also helps us define a clear end goal, and foster a culture of continuous improvement.
Lean is proving to be an effective tool with quantifiable results. In one example of Lean implementation in the TWINSCAN factory in 2018, 300 e
mployees who were trained and coached daily by Lean experts were shown over the period of a year to have generated nearly 400 new ideas. These were aimed at improving quality, reducing costs and enhancing efficiencies.
In another exercise in 2018, in which we analyzed the different steps in our production processes (‘value stream maps’), our end-to-end factory lead time of XT systems was reduced by 70 percent in the period from the third quarter of 2016 up to and including the first quarter of 2018. Production capability increased by 50 percent and employee productivity in ‘natural teams’ (those
working together on a common product or function to improve performance) by 20 percent.
One of the ways of gauging progress in achieving operational excellence is measuring the number of employees we have reached with our initiatives to implement Lean principles. Our overall objective is to familiarize over 10,000 operations employees with our Lean way of working. We will do so gradually, targeting a specific number of employees each time. In 2018, we met our target to reach a group of around 3,500 employees by year-end.
Quality
Quality is an integral part of operational excellence. It is the essential ingredient that protects and enhances ASML's reputation as an innovative company that delivers excellence, helps to improve profitability and drives change. Ultimately, quality from a customer perspective is an outcome - that our products and services are delivered as promised to our customers.
The Quality roadmap we launched in 2016 addresses customer needs by implementing a range of products to improve quality. Some of the key parts, such as managing parts quality, reducing issues at install, reduction of software patch hits and improved supplier performance, are included in this roadmap.
These initiatives resulted in improvements in 2018. For example, the mature parts quality framework for DUV has seen the dead-on-arrival rate being reduced to 0.45 percent from 1.5 percent three years ago. The number of issues per install has dropped from 6.5 to 3.7 for DUV, Yieldstar and upgrades. There were also improvements in software quality with the need to install patches being reduced in EUV / DUV from 130 to 90 patches per year.
ASML INTEGRATED REPORT 2018
39
A mature risk assessment framework including implementation of FMEAs (failure mode & effects analysis) has seen prevention of “extra-long downs” at our customers. Pilots focused on packaging have seen a reduction in packaging-related issues in transfers by 85 percent. Our suppliers met with our renewed quality demands as we saw a reduction in material quality performance (defects) from 0.8 percent at the end of 2015 to 0.25 percent at the end of 2018. In 2018 we reintroduced Statistical Process Control (SPC) in our factories - starting with the Linkou Factory in Taiwan.
Many of these projects have reached a stage of maturity due to increased focus, proactive risk assessment and a consolidated view across our entire value chain. While customers recognize and appreciate our efforts around quality, it will remain an area of focus for the foreseeable future.
The Executive Committee has enforced a culture of quality, committing, for example, to improvements via 'gemba' walks. These entail in-person, on-site observations in an effort to understand workplace challenges. In 2018, the ASML quality principles of first-time right, zero defect and zero repeat were introduced. These form a simple and easy to understand quality model. Quality Training was also launched worldwide as part of the 'creating a culture of quality' change program - created with input from our key customers, senior management, and employee feedback. Nearly 90 percent of the ASML employees have completed the training displaying an appetite for learning and willingness to be part of the Quality drive at ASML. In addition, in 2018, several suppliers signed the Quality First agreement, reinforcing their commitment to accompany us on our journey to excellence.
Environment, health and safety
At ASML, we take responsibility for protecting our people and planet. We aim to invent, develop, manufacture and service our products in a safe and sustainable manner, striving towards zero incidents and zero emissions. Employee health and safety is crucial to creating a trusted working environment, where our employees feel respected and can thrive. Our corporate responsibility strategy is based on the premise that all workplace-related injuries and occupational illnesses are preventable.
We are working to reduce CO
2
emissions by ensuring all of our electricity usage will be ‘green’ by 2020. Other measures include the implementation of safety programs, as well as energy and waste-saving projects.
How we manage environment, health and safety
Our line managers are responsible for day-to-day EHS management, with processes and policies set and overseen by the Corporate EHS Committee, a subcommittee of our Corporate Risk Committee. All employees can access our global online EHS incident reporting tool. It is mandatory to report incidents and unsafe / near-miss situations as this is the first step towards improving our EHS performance. We investigate all incidents and the near-misses that could potentially create a hazardous situation to determine the root causes and take corrective actions to prevent them from recurring or materializing.
Our EHS Competence Center gathers the best-known practices, defines EHS standards for ASML, and helps managers across the business to implement these. Our EHS management system complies with ISO 14001 requirements, and is structured based on the basic idea and purpose of ISO 45001. Since the early 2000s, we have held certificates for ISO 14001. Recertification is scheduled for 2020. As well as helping to improve results on environmental goals, and meet the requirements of involved regulatory bodies, the certificates give ASML and our stakeholders the confidence that we are a learning organization. We provide employees with EHS training to raise their awareness and operational skills, and familiarize them with EHS standards. Based on risk and hazard evaluations, we gain insight into our main risk and hazard areas. We identify and manage our lines of defense and take appropriate action to mitigate risk.
How we did in 2018
Our ‘recordable incident rate’ in 2018 was
0.24
, an improvement on our target of 0.31. No work-related fatalities were recorded in 2018, just as in previous years. We register EHS-related incidents in line with the US Occupational Health and Safety Act. Given our ambition to have zero incidents, we will continue to take any necessary action to improve safety and remain focused on preventing incidents.
We organized a global ‘Have a safe day’ campaign to take action on safety topics and raise overall awareness. Managers used this day to again stress the importance of safety, urging employees to always take action on safety issues and encourage others to do the same. To prevent incidents, we focus on the learning value of near-miss and unsafe situations with a high risk value across the organization. For this, we introduced a standardized incident investigation method to identify and eliminate common root causes.
We are on track with our aim to achieve 100 percent renewable electricity (scope 2) by 2020. One of the ways we are working to achieve this priority objective is by our contributions to financing renewable projects generating Guarantees of Origin (GO2). These include the 1MW hydropower project initiated in Sandvik, Norway, which was commissioned in March 2018. In addition, we replaced the wind turbine project we had selected in 2017 in Sweden (this was shelved due to a lack of financing) with a 3.5MW hydropower project in Skånevik in Norway. In 2018, we continued to invest in hydropower, ramping up to 6MW.
Enhancing energy efficiency is another priority. Our target for 2020 is to achieve an energy saving of 111 TJ, which equates to a 10 percent reduction of our 2015 energy consumption. The energy savings at year-end 2018 are on track to achieve this target. Some important projects have been initiated for completion in 2020. This action, together with quantification of ongoing energy-saving opportunities, put us on track to achieve 111 TJ in 2020.
ASML INTEGRATED REPORT 2018
40
We aim to cut the amount of waste we generate by five percent by 2020, compared to the amount of waste generated in 2015. Waste-saving projects in 2018 included, among other efforts, a reduction in organic waste. This resulted in waste reduction of 0.4 percent, due to less kitchen waste, at our headquarters in Veldhoven. We need to develop further initiatives to reach our targets.
Several regulatory inspections were carried out at our locations across the world in 2018, none of which resulted in any significant EHS-related sanctions or fines. ASML was granted all legally required EHS permits required for our operations. In 2018, three environmental incidents were reported to the local authorities. These included one minor oil spill (less than one pint), a small leak, of unknown duration, in the sewage system, and a leak of five gallons of hydrofluoric acid. These took place at our production location in Wilton, Connecticut, in the US. These spills did not cause any significant damage to the environment and were contained according to local regulatory requirements.
For further information, see
Non-Financial Statements - Non-financial Indicators - Operations
.
Environment, health and safety objectives
|
Theme
|
|
Objective
|
Target year
|
How we did
|
|
|
|
|
|
|
|
|
|
Employee safety
|
Reduce recordable incident rate by 15% compared to average of previous three years (which results in a target for 2018 of 0.31).
|
2018
|
|
Our recordable incident rate of 0.24 is better than our target of 0.31.
|
|
|
|
|
|
|
|
|
|
Environmental efficiency own operations
|
100% Renewable electricity.
|
2020
|
|
We are on track. We achieved a 86.3% renewable electricity level in 2018 and have a plan in place to meet our 2020 target.
|
|
|
|
|
|
|
|
|
|
|
|
10% Energy savings through projects.
|
2020
|
|
We are on track with our energy savings to achieve our target of 111 TJ by the end of 2020.
|
|
|
|
|
|
|
|
|

|
5% Waste savings through projects.
|
2020
|

|
We ran some waste-reduction initiatives though more needs to be done since we have only achieved 1.6% (since 2016) of our targeted waste savings (of 5% of our waste generated in 2015).
|
|
|
|
|
|
|
|

|
|||||
Environment, health and safety KPIs
|
KPI
|
2016
|
|
2017
|
|
2018
|
|
|
ASML recordable incident rate
1
|
0.44
|
|
0.26
|
|
0.24
|
|
|
Renewable electricity (of total electricity purchased)
|
71.0
|
%
|
70.2
|
%
|
86.3
|
%
|
|
Energy savings worldwide through projects (in TJ)
2
|
35.1
|
|
48.8
|
|
77.3
|
|
|
Waste savings worldwide through projects
2
|
1.2
|
%
|
1.2
|
%
|
1.6
|
%
|
|
1.
|
The number of work-related injuries and illnesses, per 100 full-time workers. We use OHSA guidelines to determine work-related injuries and illnesses. Minor (first-aid level) injuries are excluded from the calculation of the recordable incident rate.
|
|
2.
|
In 2016 we started a new master plan period which concludes in 2020. The savings reported are cumulated compared to base year 2015.
|
ASML INTEGRATED REPORT 2018
41
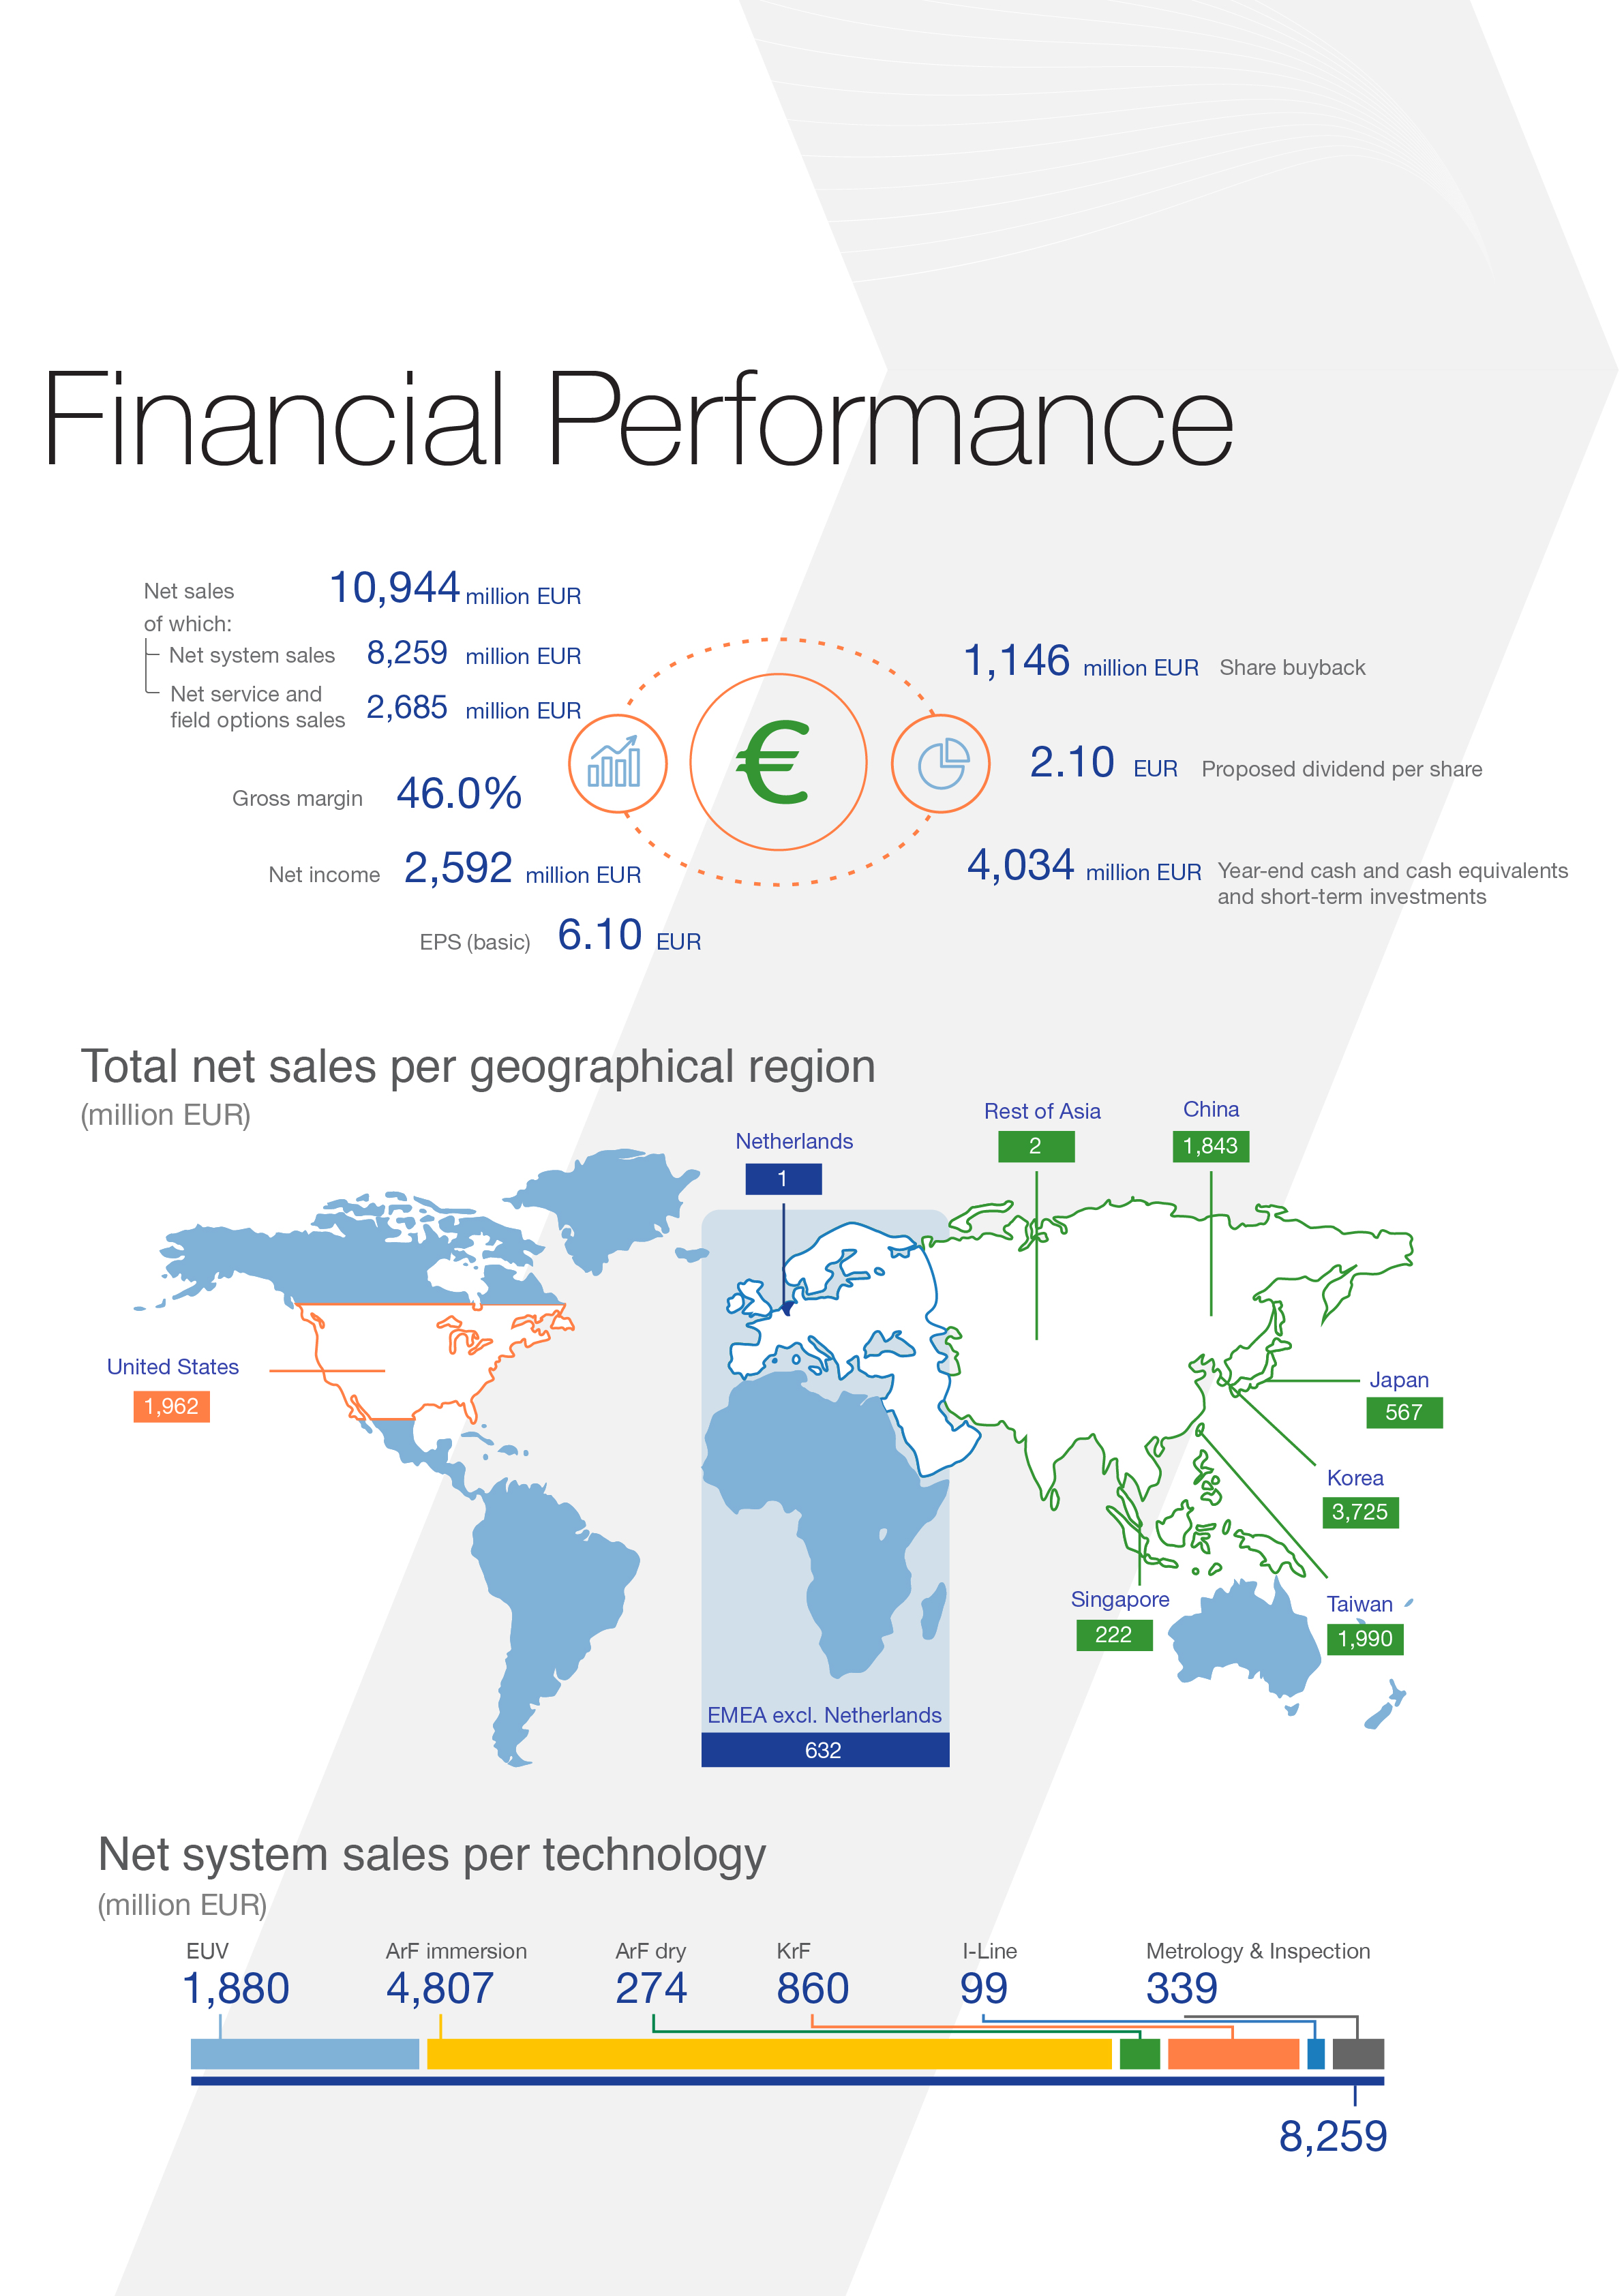
ASML INTEGRATED REPORT 2018
42
ASML operations update on key performance indicators
The following table presents the KPIs used by our BoM and senior management to regularly measure performance.
|
Year ended December 31
|
2017
1
|
|
|
2018
|
|
|
|
(in millions, unless otherwise indicated)
|
EUR
|
|
%
2
|
EUR
|
|
%
2
|
|
|
|
|
|
|
|
|
|
Sales
|
|
|
|
|
|
|
|
Total net sales
|
8,962.7
|
|
|
10,944.0
|
|
|
|
Increase in total net sales (%)
|
30.4
|
|
|
22.1
|
|
|
|
Net system sales
|
6,424.4
|
|
|
8,259.1
|
|
|
|
Net service and field option sales
|
2,538.3
|
|
|
2,684.9
|
|
|
|
Sales of lithography systems (in units)
3
|
197
|
|
|
224
|
|
|
|
Immersion systems recognized (in units)
|
76
|
|
|
86
|
|
|
|
EUV systems recognized (in units)
|
11
|
|
|
18
|
|
|
|
Profitability
|
|
|
|
|
|
|
|
Gross profit
|
4,020.2
|
|
44.9
|
5,029.2
|
|
46.0
|
|
Income from operations
|
2,439.7
|
|
27.2
|
2,965.3
|
|
27.1
|
|
Net income
|
2,066.7
|
|
23.1
|
2,591.6
|
|
23.7
|
|
Liquidity
|
|
|
|
|
|
|
|
Cash and cash equivalents
|
2,259.0
|
|
|
3,121.1
|
|
|
|
Short-term investments
|
1,029.3
|
|
|
913.3
|
|
|
|
Net cash provided by operating activities
|
1,818.3
|
|
3,072.7
|
|
||
|
Free cash flow
4
|
1,460.3
|
|
|
2,463.2
|
|
|
|
1.
|
As of January 1, 2018, ASML has adopted the new Revenue Recognition Standard (ASC 606) and Lease Standard (ASC 842). The comparative numbers have been adjusted to reflect these changes in accounting policies, see Note 1 General information / summary of significant accounting policies.
|
|
2.
|
As a percentage of total net sales.
|
|
3.
|
Lithography systems do not include metrology and inspection systems.
|
|
4.
|
Free cash flow is a non-GAAP measure and is defined as net cash provided by operating activities
(
2018
:
EUR 3,072.7 million
and
2017
:
EUR 1,818.3 million
)
minus purchase of property, plant and equipment
(
2018
:
EUR 574.0 million
and
2017
:
EUR 338.9 million
) and purchase of intangible assets (
2018
:
EUR 35.5 million
and
2017
:
EUR 19.1 million
). We believe that free cash flow is an important liquidity metric, reflecting cash that is available for acquisitions, to repay debt and to return money to our shareholders by means of dividends and share buybacks. Purchase of property, plant and equipment and purchase of intangible assets are deducted from net cash provided by operating activities because these payments are necessary to support the maintenance and investments in our assets to maintain the current asset base. Free cash flow therefore provides an alternative measure (in addition to net cash provided by operating activities) for investors to assess our ability to generate cash from our business. For further details about the purchase of property, plant and equipment and the purchase of intangible assets see
Consolidated Financial Statements - Consolidated Statements of Cash Flows
.
|
Operating results
Results of operations 2018 compared to 2017
The following discussion and analysis of our results of operations should be viewed in the context of the risks that may interfere with our business objectives or otherwise affect our results of operations, see
Management Board Report - Risk Factors
.
Set out below are our
Consolidated Statements of Operations
data for the years ended December 31,
2017
and
2018
:
|
Year ended December 31
|
2017
1
|
|
2018
|
|
|
(in millions)
|
EUR
|
|
EUR
|
|
|
Total net sales
|
8,962.7
|
|
10,944.0
|
|
|
Total cost of sales
|
(4,942.5
|
)
|
(5,914.8
|
)
|
|
Gross profit
|
4,020.2
|
|
5,029.2
|
|
|
Other income
|
95.8
|
|
—
|
|
|
Research and development costs
|
(1,259.7
|
)
|
(1,575.9
|
)
|
|
Selling, general and administrative costs
|
(416.6
|
)
|
(488.0
|
)
|
|
Income from operations
|
2,439.7
|
|
2,965.3
|
|
|
Interest and other, net
|
(50.3
|
)
|
(28.3
|
)
|
|
Income before income taxes
|
2,389.4
|
|
2,937.0
|
|
|
Provision for income taxes
|
(306.0
|
)
|
(351.6
|
)
|
|
Income after income taxes
|
2,083.4
|
|
2,585.4
|
|
|
Profit (loss) related to equity method investments
|
(16.7
|
)
|
6.2
|
|
|
Net income
|
2,066.7
|
|
2,591.6
|
|
|
1.
|
As of January 1, 2018, ASML has adopted the new Revenue Recognition Standard (ASC 606) and Lease Standard (ASC 842). The comparative numbers have been adjusted to reflect these changes in accounting policies, see Note 1 General information / summary of significant accounting policies.
|
ASML INTEGRATED REPORT 2018
43
Set out below are our
Consolidated Statements of Operations
data for the years ended December 31,
2017
and
2018
expressed as a percentage of our total net sales:
|
Year ended December 31
|
2017
1
|
|
2018
|
|
|
Total net sales
|
100.0
|
|
100.0
|
|
|
Total cost of sales
|
(55.1
|
)
|
(54.0
|
)
|
|
Gross profit
|
44.9
|
|
46.0
|
|
|
Other income
|
1.1
|
|
—
|
|
|
Research and development costs
|
(14.1
|
)
|
(14.4
|
)
|
|
Selling, general and administrative costs
|
(4.7
|
)
|
(4.5
|
)
|
|
Income from operations
|
27.2
|
|
27.1
|
|
|
Interest and other, net
|
(0.5
|
)
|
(0.3
|
)
|
|
Income before income taxes
|
26.7
|
|
26.8
|
|
|
Provision for income taxes
|
(3.4
|
)
|
(3.2
|
)
|
|
Income after income taxes
|
23.3
|
|
23.6
|
|
|
Profit (loss) related to equity method investments
|
(0.2
|
)
|
0.1
|
|
|
Net income
|
23.1
|
|
23.7
|
|
|
1.
|
As of January 1, 2018, ASML has adopted the new Revenue Recognition Standard (ASC 606) and Lease Standard (ASC 842). The comparative numbers have been adjusted to reflect these changes in accounting policies, see Note 1 General information / summary of significant accounting policies.
|
For further information, see
Other Appendices - Appendix - Selected Financial Data
and
Other Appendices - Appendix - Results of Operations 2017 Compared to 2016
.
Total net sales and gross profit
The following table shows a summary of sales data, units sold and gross margin for the years ended December 31,
2017
and
2018
:
|
Year ended December 31
|
2017
1
|
|
2018
|
|
|
(in millions, unless otherwise indicated)
|
EUR
|
|
EUR
|
|
|
Total net sales
|
8,962.7
|
|
10,944.0
|
|
|
Net system sales
|
6,424.4
|
|
8,259.1
|
|
|
Net service and field option sales
|
2,538.3
|
|
2,684.9
|
|
|
Sales of lithography systems (in units)
2
|
197
|
|
224
|
|
|
Gross margin
|
44.9
|
|
46.0
|
|
|
1.
|
As of January 1, 2018, ASML has adopted the new Revenue Recognition Standard (ASC 606) and Lease Standard (ASC 842). The comparative numbers have been adjusted to reflect these changes in accounting policies, see Note 1 General information / summary of significant accounting policies.
|
|
2.
|
Lithography systems do not include metrology and inspection systems.
|
We had another record year in 2018, with contributions from each of our wide range of product offerings in Holistic Lithography solutions.
Total net sales
increased
by
22.1 percent
, driven by an
increase
in net system sales of
28.6 percent
and an
increase
in net service and field option sales of
5.8 percent
in 2018 compared to 2017.
The increase in net system sales is mainly driven by an increase in the number of systems sold in all products as well as the relative increase in system sales towards more high-end systems. The memory sector was the largest end-user growth driver, increasing by over 50%, whereas the logic sector was the largest consumer of our most advanced EUV systems. Shipments of EUV systems in 2018 are intended for high volume manufacturing of advanced logic and DRAM devices in 2019. In addition, China saw the largest geographic regional system sales growth at over 100% in support of multiple new factories in the region.
The
increase
in net service and field option sales is mainly driven by an increase in the sales of productivity and focus upgrade packages in combination with a growing installed base.
Gross profit
increased
by
EUR 1,009.0 million
due to an increase in sales
and profitability.
Gross profit as a percentage of net sales
increased
from
44.9 percent
in
2017
to
46.0 percent
in
2018
primarily driven by improved margins on our high-end systems. The increase in gross profit as percentage of net sales is negatively impacted by the provision related to the settlement of our legal dispute with Nikon, see
Note 20 Legal contingencies
.
Other income
In 2017 other income consisted of contributions for R&D programs under the NRE Funding Agreements from certain Participating Customers in the CCIP. In 2018 there is no other income
(
2017
:
EUR 95.8 million
) due to the NRE funding being completed by the end of 2017.
ASML INTEGRATED REPORT 2018
44
Research and development costs
R&D costs (net of credits and excluding contributions under the NRE Funding Agreements from Participating Customers in the CCIP)
were
EUR 1,575.9 million
in
2018
as compared to
EUR 1,259.7 million
in
2017
.
R&D costs
for both 2018 and 2017 were primarily focused on programs supporting our Holistic Lithography solutions in EUV, DUV immersion, and Applications. In 2018, R&D activities mainly related to:
|
•
|
EUV - Further improving availability and productivity focused on the final stages of industrialization related to our NXE:3400B system, as well as introduction of the NXE:3400C. In addition, we are extending our roadmap by including High NA to support our customers with 3 nm logic and beyond.
|
|
•
|
DUV immersion - Mainly dedicated to the development of our next generation Immersion system NXT:2000i, of which we shipped our first systems in 2018. In addition we are completing industrialization of new modules and further improving our roadmaps on alignment/overlay and productivity
.
|
|
•
|
Applications - HMI expansion, including multi-beam innovation, and further development of YieldStar and process window control solutions.
|
Selling, general and administrative costs
SG&A costs
increased
by
17.1 percent
mainly driven by an increase in the number of employees as a result of the growth of our business and an increase in legal fees as a result of litigation.
Interest and other, net
Interest and other, net
decreased by
EUR 22.0 million
in
2018
compared to
2017
.
This decrease is mainly due to lower hedging costs resulting from the change in functional currency of the US business.
Income taxes
The increase in the provision for income tax in absolute numbers is primarily caused by an increase in the Income before income taxes.
The effective tax rate
decreased
to
12.0 percent
of income before income taxes in
2018
compared to
12.8 percent
in
2017
, mainly resulting from an internal restructuring which resulted in release of deferred tax liabilities on intangible assets that were initially included in the business combination accounting for HMI.
Profit (loss) related to equity method investments
The profit related to
equity method investments
, which consists of the result of our
24.9 percent
equity interest in Carl Zeiss SMT Holding GmbH & Co. KG, was
EUR 6.2 million
for
2018
(
2017
: loss of
EUR 16.7 million
).
For more details see
Note 10 Equity method investments
.
Net income
Net income in
2018
amounted to
EUR 2,591.6 million
,
or
23.7 percent
of total net sales, representing
EUR 6.10
basic net income per ordinary share, compared with net income in
2017
of
EUR 2,066.7 million
,
or
23.1 percent
of total net sales, representing
EUR 4.81
basic net income per ordinary share.
Liquidity and capital resources
Our principal sources of liquidity consist of cash and cash equivalents as of
December 31, 2018
of
EUR 3,121.1 million
, short-term investments as of
December 31, 2018
of
EUR 913.3 million
and available credit facilities as of
December 31, 2018
of
EUR 700.0 million
. In addition, we may from time to time raise additional capital in debt and equity markets.
Our goal is to remain an investment grade rated company and maintain a capital structure that supports this.
Our cash and cash equivalents
increased
to
EUR 3,121.1 million
as of
December 31, 2018
from
EUR 2,259.0 million
as of
December 31, 2017
and our short-term investments
decreased
to
EUR 913.3 million
as of
December 31, 2018
from
EUR 1,029.3 million
as of
December 31, 2017
.
We invest our cash and cash equivalents and short-term investments in short-term deposits with financial institutions that have investment grade credit ratings and in money market and other investment funds that invest in high-rated short-term debt securities. Our investments are mainly denominated in euros and to some extent in US dollars and Taiwanese dollars.
Our available credit facilities amount to
EUR 700.0 million
as of
December 31, 2018
and
as of December 31,
2017
.
No
amounts were outstanding under these credit facilities at the end of
2018
and
2017
.
The amounts available at
December 31, 2018
and
2017
consisted of
EUR 700.0 million
committed revolving credit facility with a group of banks, which matures in
2022
.
Outstanding amounts under this credit facility will bear interest at EURIBOR or LIBOR plus a margin that depends on our credit rating.
We have the following repayment obligations relating to our Eurobonds:
|
•
|
EUR 500 million in 2022.
|
|
•
|
EUR 750 million in 2023.
|
|
•
|
EUR 1,000 million in 2026.
|
|
•
|
EUR 750 million in 2027.
|
We seek to ensure that our principal sources of liquidity will be sufficient to satisfy our liquidity requirements throughout every phase of the industry cycle.
ASML INTEGRATED REPORT 2018
45
Our liquidity needs are affected by many factors, some of which are based on the normal on-going operations of the business, and others that relate to the uncertainties of the global economy and the semiconductor industry. Although our cash requirements fluctuate based on the timing and extent of these factors, we believe that cash generated from operations, together with our other sources of liquidity are sufficient to satisfy our current requirements, including our expected capital expenditures and debt servicing.
We intend to return cash to our shareholders on a regular basis in the form of dividend payments and, subject to our actual and anticipated liquidity requirements and other relevant factors, share buybacks or capital repayments.
See
Consolidated Financial Statements - Consolidated Statements of Cash Flows
and
Notes to the Consolidated Financial Statements
4
,
5
,
16
,
17
,
28
and
29
.
Trend Information
We expect that Moore’s Law will continue beyond the next decade including industry fundamentals of a decline in cost per transistor. There is a strong demand for advanced ICs, supported by a value chain with means and incentive to support this. However, cost and process complexity of shrinking with multiple patterning together with new device structures and materials reshapes customer roadmaps, resulting in a continued need to improve DUV lithography performance while exploiting execution of agreed EUV targets for the future and complementing it with a portfolio of product options, enhancements and upgrade packages that support product stewardship and optimize the cost of ownership over the entire lifetime of our systems. It also results in zero tolerance for non-performance, driving improvement of quality and cost efficiency of our products and services.
During the last two years the memory manufacturers have experienced increasing price levels due to shortages in both DRAM and NAND markets. Over the past months, prices declined, albeit still at highly profitable levels. For next year, node migrations in combination with inventory reductions will likely be sufficient to meet the increasing memory demand, therefore memory sales are expected to be lower in 2019. The underlying demand for memory chips remains strong and hence the memory makers will start ramping new factories once the memory prices have normalized.
The past year has been highly profitable for logic manufacturers. High chip demand in automotive and data science applications, have increased factory utilization to record levels. For foundry manufacturers 14 and 16nm has proven to be a strong node; furthermore, an increasing number of fabless chip companies have designs ready for 10 and 7nm. The first high volume manufacturing with EUV is expected in 2019. For the coming year we expect ASML logic sales to increase as the leading foundries are putting capacity in place for nodes with significant EUV adoption, eager to realize the cost benefits of process simplification, cycle time reductions and yield improvement.
We expect continued solid growth in 2019. We plan to ship 30 EUV systems in 2019, however shipment profile will be back-end loaded.
Due to a fire at one of our suppliers of electronics components and modules, work in progress and part of the inventory was lost. Due to the integral cycle time of around one quarter for these modules, we expect ASML's first-quarter sales to be negatively impacted by approximately EUR 300 million, which we expect to largely recover in the second quarter, with the remainder expected to be recovered in the second half of 2019.
Our expectations and guidance for the first quarter of 2019 can be summarized as follows:
|
•
|
Total net sales of
around EUR 2.1 billion
.
|
|
•
|
Gross margin of
around 40 percent
.
|
|
•
|
R&D costs of
around EUR 480 million
. The increase in R&D costs
reflects continued accelerated investments in our portfolio.
|
|
•
|
SG&A costs of
around EUR 130 million
.
|
|
•
|
Effective annualized tax rate of
around 14 percent
.
|
For discussion on the main key performance indicators indicated above, see
Management Board Report - Financial Performance - Operating results
and
Liquidity and capital resources
.
The trends discussed above
are subject to risks and uncertainties. See
Special Note Regarding Forward-Looking Statements
and
Management Board Report - Risk Factors
.
ASML INTEGRATED REPORT 2018
46
Business Risk and Continuity
The Corporate Risk Management function helps us achieve our aims by being systematic in its approach to setting standards and enabling management to make our governance, risk management, internal control and compliance more efficient and effective. It also helps to identify opportunities to achieve our objectives and enable continuous sustainable growth
.
The BoM is responsible for ensuring that we comply with applicable legislation and regulations. It is also responsible for managing the internal and external risks related to our business activities.
The BoM has delegated its risk oversight to ASML’s Corporate Risk Committee. The Corporate Risk Committee is chaired by the COO and comprises senior management representatives from all sectors within ASML, including the CEO and CFO. The Corporate Risk Committee is a central risk oversight body, which reviews, manages and controls risks in the ASML risk universe. The Corporate Risk Committee approves the risk appetite (i.e. the acceptable level of risk), risk management policies and risk mitigation strategies. Our risk universe is reviewed annually. We take into account a broad range of internal and external information sources such as macroeconomic and industry trends, relevant guidelines and legislation (e.g. the EU Directive on disclosure of non-financial and diversity information and the Dutch Corporate Governance Code), and stakeholders’ needs and expectations in all areas, including corporate responsibility. We may have a different risk appetite for different identified risks and our approach is geared towards mitigating the risks to a reasonable level.
Vice President Corporate Risk and Assurance is responsible for leading the development and maintenance of the Enterprise Risk Management (ERM) framework, which oversees the execution of the ERM process. This ensures ERM activities are aligned with our objectives. It is also crucial to enabling the organization to meet our business objectives.
Our ERM process assesses both top-down (company-level) and bottom-up (organization and process-level) risks. It is built on a comprehensive risk universe, consisting of external and internal risk factors that could influence our operational, business continuity, financial and regulatory compliance objectives.
The risk universe allows consolidated and comparative analysis across ASML. The ERM process is also there to make sure that actions to mitigate risk are monitored through a system of multidisciplinary assessments, monitoring, reporting and operational reviews. For example:
|
•
|
Quarterly senior management meetings are held to assess ASML’s corporate initiatives, as well as execution of ASML’s strategy.
|
|
•
|
Monthly operating review meetings with ASML’s senior management and quarterly business review meetings by the CEO, CFO, CTO, and COO with ASML's senior management. These review meetings focus on financial performance, the realization of operating objectives and responses to emerging issues.
|
|
•
|
Quarterly review of key operational risk areas by the Corporate Risk Committee.
|
|
•
|
ASML’s Anti-Fraud Policy. This aims to develop controls, which will aid in prevention, deterrence and detection of fraud against ASML.
|
|
•
|
Risk & compliance assessments, performed by Corporate Risk management.
|
|
•
|
Internal control assessments, performed by Internal Audit.
|
|
•
|
On a semi-annual basis, letters of representation are signed by ASML’s key senior management members. They confirm, among others, the following:
|
|
–
|
Compliance with the applicable laws and regulations.
|
|
–
|
Adequate processes and controls that enable the preparation of financial statements.
|
|
–
|
Completeness of transactions and commitments.
|
|
•
|
Regular reporting to the Supervisory Board.
|
ASML INTEGRATED REPORT 2018
47
Risk management process
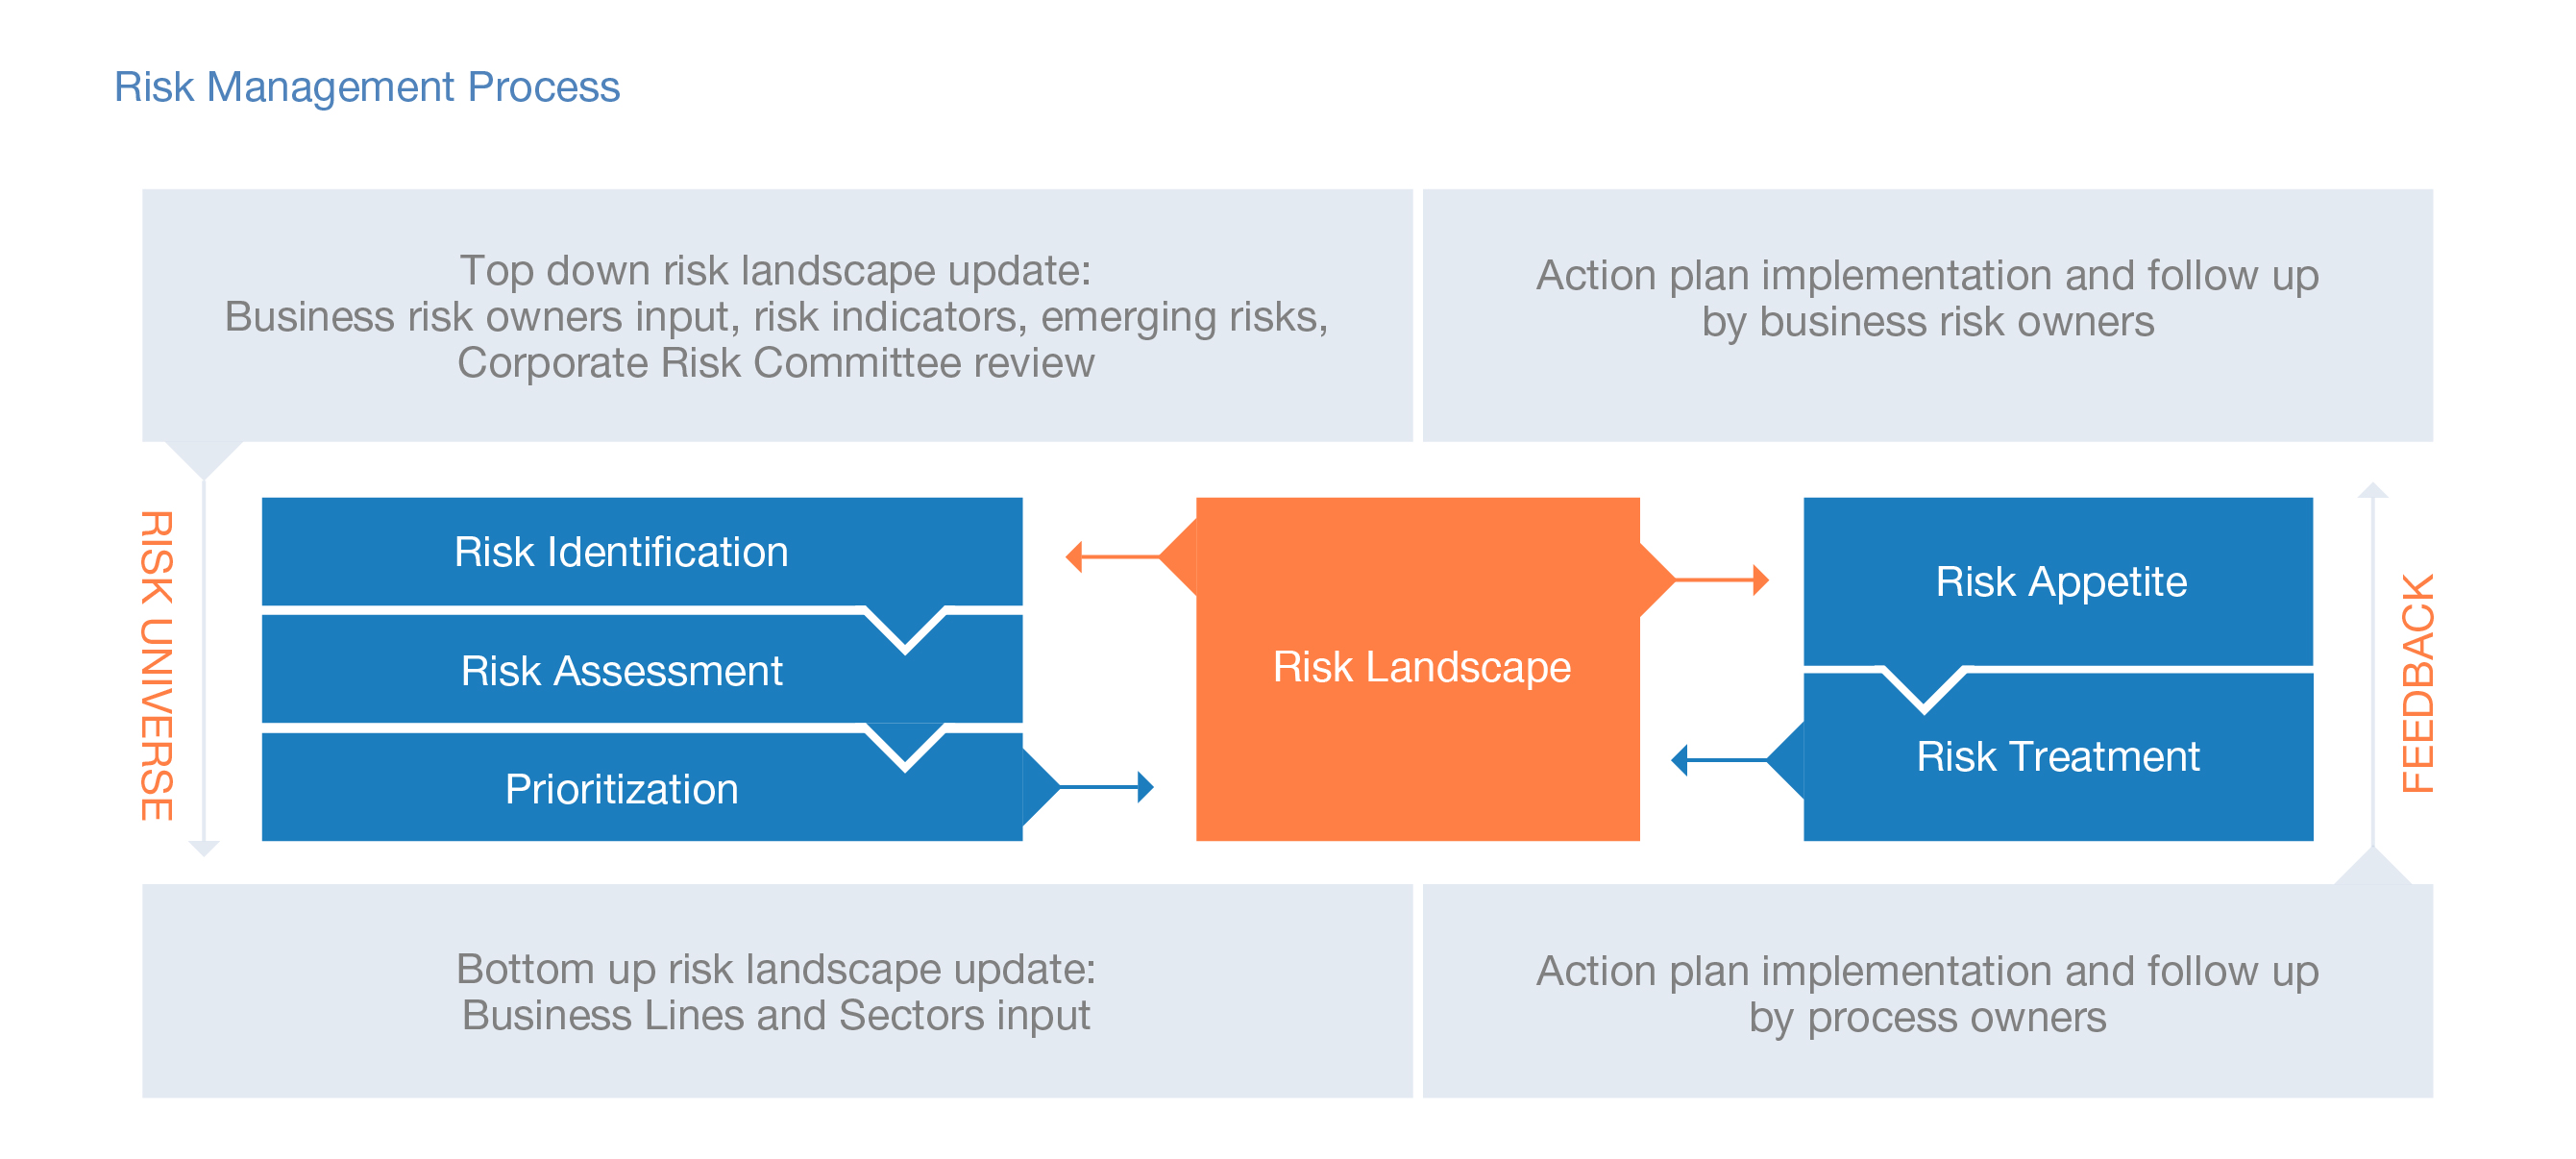
In the risk management process, the Supervisory Board (SB) provides independent oversight on management’s response to mitigating critical risk areas based on bi-annual risk reviews. The SB's Audit Committee provides independent oversight on the risk management process and timely follow-up on high-priority actions based on quarterly progress updates.
The Disclosure Committee and Internal Control Committee are there to make sure risk management complies with external reporting requirements, and to assess the effectiveness of related internal controls over financial reporting.
The Disclosure Committee tracks compliance with requirements arising from US and Dutch law, and applicable stock exchange rules, US GAAP, IFRS-EU and the Sarbanes-Oxley Act. The committee is made up of various members of the senior management team, and reports to the CEO and CFO. The chairman reports to the Audit Committee on the outcome of meetings. The Disclosure Committee gathers all relevant financial and non-financial information and assesses whether public disclosures are accurate and complete. The Disclosure Committee and Internal Control Committee also advise the CEO and CFO on the effectiveness of the disclosure controls and procedures, and the internal control over financial reporting (Sarbanes-Oxley Act).
Our Internal Control Committee, which includes three members of the Disclosure Committee, advises ASML’s Disclosure Committee in its assessment of ASML’s internal control over financial reporting and disclosures, under section 404 of the Sarbanes-Oxley Act. The chairman of the Internal Control Committee updates the Audit Committee, the CEO and CFO on the progress of this assessment. The chairperson of the Audit Committee includes this item in their report to the full Supervisory Board.
ASML INTEGRATED REPORT 2018
48
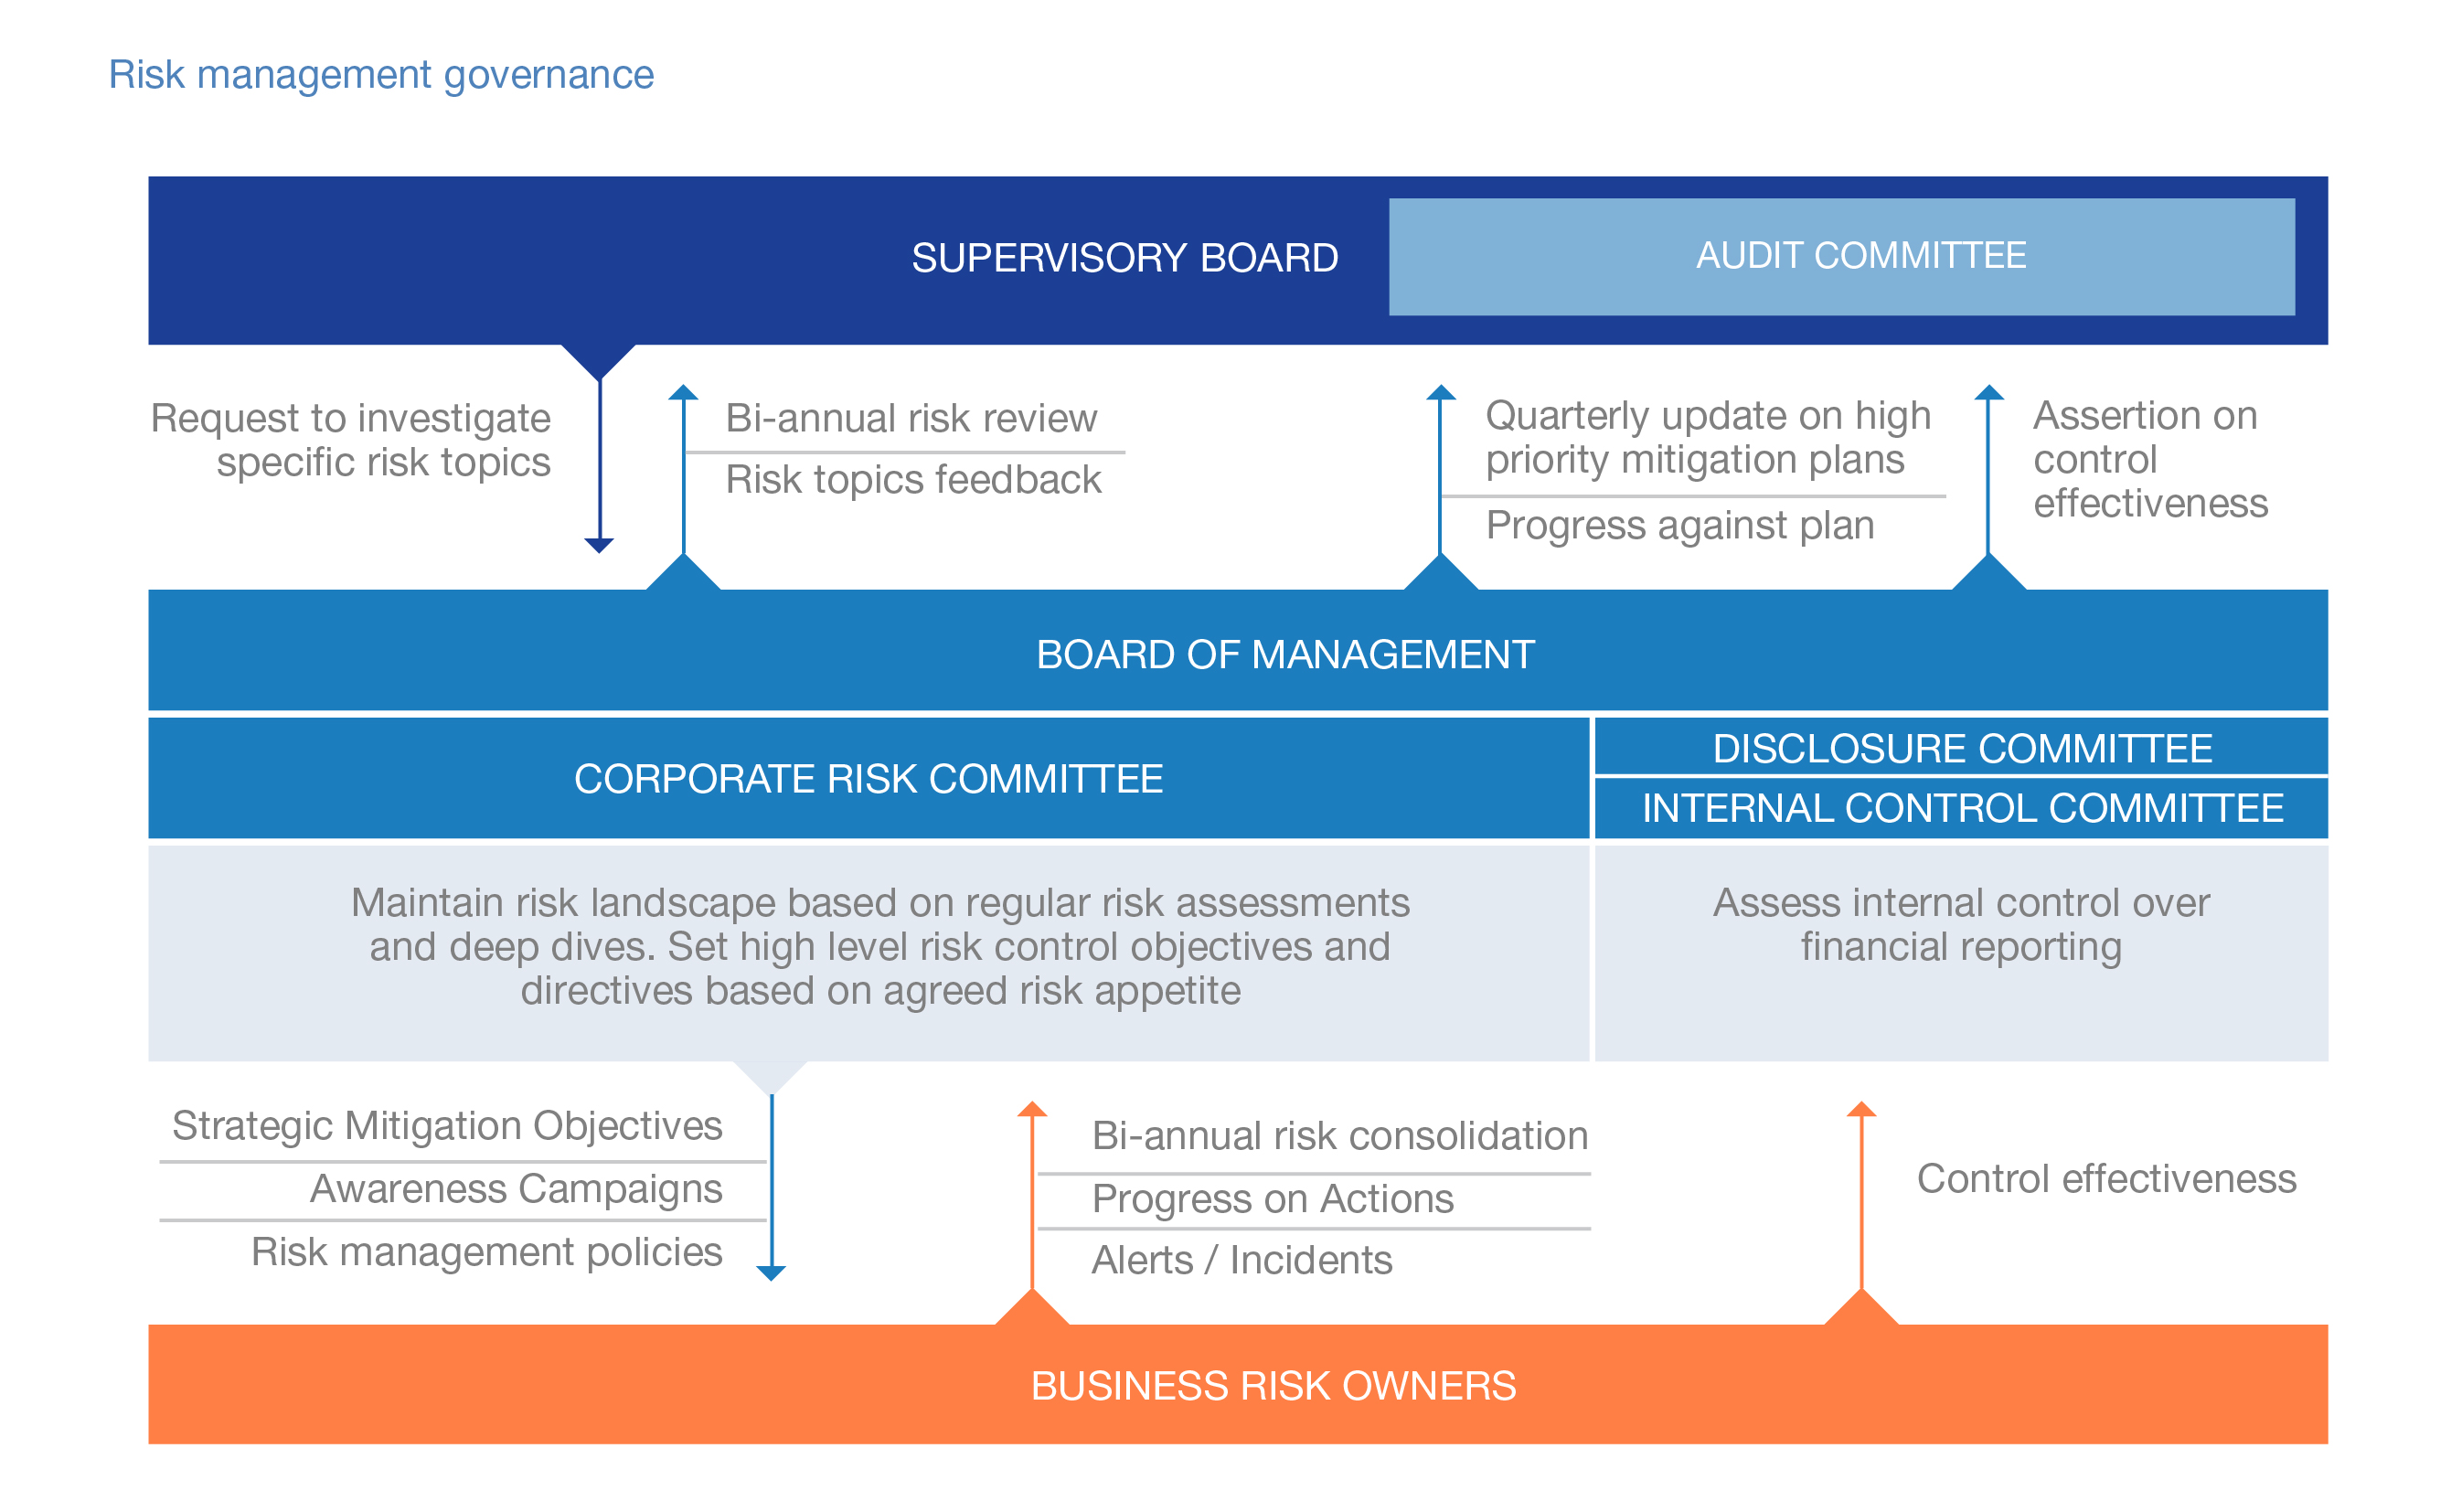
All material risk management activities have been discussed with the Audit Committee and the SB. For a discussion of ASML’s risk factors, see
Management Board Report - Risk Factors
. See also
Corporate Governance - Board of Management - ASML Reports
.
We do not rank the individual risks identified in our Management Board Report. We believe this defies the purpose of a comprehensive risk assessment. Also, it would be arbitrary since all the risks mentioned have significant relevance for us and our business.
We define strategies to address these risks, which are taken into account when we define the corporate priorities needed to secure risk mitigation in our business processes. For example:
|
•
|
To address the rapid commercial and technological changes in the semiconductor industry, as well as the increasing complexity in executing our product introduction roadmap, we focus on partnerships, collaboration and knowledge-sharing with our customers and suppliers. We work closely to align roadmaps, oversee execution and ensure we maximize customer value. See
Management Board Report - Products and Technology
and
Partners
.
|
|
•
|
To address our dependence on a limited number of suppliers we nurture high-quality and collaborative relationships with our suppliers. We share our expert knowledge, including risks and rewards, so we all work together to achieve cost-effective shrink, boost innovation and enable our industry to grow. See
Management Board Report - Partners
.
|
|
•
|
To address risks related to intellectual property rights, we have developed an intellectual property rights management mechanism to protect our intellectual property rights, and to respect the intellectual property of other parties. To protect ourselves from incidents related to cyber security, we have also set up a broad information security program, which looks at measures to prevent, detect and respond to security threats. See
Management Board Report - Products and Technology
.
|
|
•
|
To address the scarcity of staff with specific technical expertise, we put effort into educating, training and retaining talent. We also promote initiatives that encourage young people to study science, technology and engineering. See
Management Board Report - People
.
|
ASML INTEGRATED REPORT 2018
49
Risk Factors
In conducting our business, we face many risks that may interfere with our business objectives. It is important to understand the nature of these risks and the impact they may have on our business, financial condition and results of operations. Some of the more relevant risks are described below. These risks are not the only ones that we face. Some risks may not yet be known to us and certain risks that we do not currently believe to be material could become material in the future.
Our business will suffer if we or the industry do not respond rapidly to commercial and technological changes in the semiconductor industry
Our success in developing new technologies, products and in enhancing our existing products depends on a variety of factors, including the successful management of our and our suppliers’ R&D programs and the timely and successful completion of product development and design relative to competitors. If the technologies that we pursue to assist our customers in producing smaller and more energy efficient chips are not as effective as those developed by current or new competitors, or if our customers adopt new technological architectures that are less focused on lithography products, this may adversely affect our business, financial condition and results of operations. The success of our EUV technology, which we believe is critical for keeping pace with Moore’s Law, which postulates that the number of transistors on a chip doubles approximately every 24 months at equivalent costs, remains dependent on continuing technical advances by us and our suppliers. We invest considerable financial and other resources to develop and introduce new technologies, products and product enhancements, and if we are not successful in developing products that are adopted by customers, we may not recoup the significant investments we have made in such products or enhancements, including in EUV and Applications technology, and our competitive position may suffer. In particular, the multi-beam innovation, which we are developing as part of our Holistic Lithography solutions, and High NA, which is a further extension of our EUV technology, require significant R&D resources for their development. If we are unsuccessful in developing new technology, products and product enhancements such as multi-beam and High NA, or if competitors successfully introduce alternative technologies or processes, this could impact our business and we may be unable to recoup some or all of the investments that we have made, which could have a material adverse effect on our business, financial condition and results of operations.
We may incur increased costs related to inventory obsolescence, as a result of complex technological changes. Such inventory obsolescence costs may be higher as the complexity of technology increases.
Due to increased complexity of our systems or alternative technologies, our customers may purchase existing technology systems rather than new leading-edge systems or may delay their investment in new technology systems to the extent that such investment is not economical or required given their product cycles. Some of our customers have experienced and may continue to experience delays in implementing their product roadmaps, which increases the risk of slowing down the overall transition period (or cadence) for introduction of new systems and lengthening the period for a return on our investments.
We are also dependent on our suppliers to maintain their development roadmaps to enable us to introduce new technologies on a timely basis, and if they are unable to keep pace whether due to technological factors, lack of financial resources or otherwise, this could prevent us from meeting our development roadmaps, which could have a material adverse effect on our business, financial condition and results of operations.
The success of new product introductions is uncertain and depends on our ability to successfully execute our R&D programs
Our lithography systems and applications have become increasingly complex, and accordingly, the costs and time period to develop new products and technologies have increased, and we expect such costs and time period to continue to increase. In particular, developing new technology including a multi-beam innovation and EUV technology (including High NA), as part of our Holistic Lithography solutions, requires significant R&D investments by us and our suppliers in order to meet our and our customers’ technology demands. Our suppliers may not have, or may not be willing to invest in, the resources necessary to continue the development of the new technologies to the extent such investments are necessary, which may result in our contributing funds to such R&D programs or limiting the R&D investments that we can undertake. Furthermore, if our R&D programs are not successful in developing the desired new technology, our business, financial condition and results of operations could be materially and adversely affected.
We may face challenges in managing industrialization of our products and bringing them to high volume production which could impact profitability
Bringing our products to high volume production at a value-based price and in a cost effective manner, depends on our ability to manage the industrialization of our products and our ability to manage costs. Customer acceptance of our products depends on performance of our products in the field. As our products become more complex, the risk that our products may not perform according to specifications or quality standards increases. If quality or performance issues arise, they may result in additional costs and may damage our reputation and reduce demand for our products. In particular, with respect to EUV, there are a number of development milestones that remain to be met, such as the ability of our new systems to consistently perform above certain thresholds. If our products do not perform according to specifications and performance criteria and as a result our customers are not able to meet planned wafer capacity, we may be required to pre-ship additional systems to affected customers leading to additional costs.
ASML INTEGRATED REPORT 2018
50
Transitioning our products to full-scale production also requires the growth of our infrastructure, including enhancing our manufacturing capabilities, increasing supply of components and training qualified personnel. The transition also requires our suppliers to grow their infrastructure capabilities. If we are unable to meet these growth requirements on a timely basis or at all due to manufacturing constraints, delays in our suppliers’ development roadmaps, or insufficiently increasing employee education and training, this could have a material adverse effect on our business, financial condition and results of operations.
The capability, capacity and costs associated with providing the required customer support function to cover the increasing amount of shipments and servicing a growing number of EUV systems that are operational in the field could affect the timing of shipments and the efficient execution of maintenance, servicing and upgrades, which is key to the systems continuing to achieve the required productivity. The build-up of the service organization, its people and the complexity of the technology requirements will take time. It may also mean that we have to extend warranty beyond the agreed standard terms. This may delay the profitability of the service business and could also have a material impact on our reputation and relationships with customers.
We face intense competition
The lithography equipment industry is highly competitive. Our competitiveness depends upon our ability to develop new and enhanced lithography equipment, related applications and services that are competitively priced and introduced on a timely basis, as well as our ability to protect and defend our intellectual property rights.
See
Management Board Report - Products and Technology - Knowledge management
and
Protecting our intellectual property
,
Consolidated Financial Statements - Notes to the Consolidated Financial Statements - Note 20 Legal contingencies
, and
Other Appendices - Appendix - Government Regulation
.
We compete primarily with Canon and Nikon in respect of systems. Both Canon and Nikon have substantial financial resources and broad patent portfolios. Each continues to offer products that compete directly with most of our products, which may impact our sales or cause a loss of market acceptance for our lithography systems. In particular, we have experienced increased competition from Nikon and Canon in existing technologies such as TWINSCAN XT systems, where end-market demand has increased. In addition, adverse market conditions, industry overcapacity or a decrease in the value of the Japanese yen in relation to the euro, could further intensify price-based competition, resulting in lower prices, lower sales, and margins which could have a material adverse effect on our business, financial condition and results of operations.
We also compete with providers of applications that support or enhance complex patterning solutions, e.g Applied Materials Inc. and KLA-Tencor Corporation. These applications effectively compete with our Applications offering, which has become an increasingly significant part of our business. The competition we face in our applications business may be higher than for our systems, as there are more competitors and potential competitors in this market.
Our production is highly dependent on the performance of a limited number of critical suppliers of single source key components
We rely on outside vendors for components and subassemblies used in our systems including the design thereof. These components and subassemblies are obtained from a single supplier or a limited number of suppliers. As our business has grown, our dependence on single suppliers or a limited number of suppliers has grown, as the highly specialized nature of many of our components, particularly for EUV systems, means it is not economical to source from more than one supplier. Our reliance on a limited group of suppliers involves several risks, including a potential inability to obtain an adequate supply of required components, in a timely manner or at all, additional costs resulting from switching to alternate suppliers, reduced control over pricing and quality and the risk of untimely delivery of our products as a result of delays in supply of these components and subassemblies. Delays in supply of components and subassembly could occur for a variety of reasons, such as disruptions experienced by our suppliers, including work stoppages, fire, energy shortages, flooding or other natural disasters. For example, one of our suppliers of electronics components experienced a fire in December 2018, and as a result we expect an impact on first quarter 2019 sales.
The number of lithography systems we are able to produce may be limited by the production capacity of one of our key suppliers, Carl Zeiss SMT GmbH, which is our sole supplier of lenses, mirrors, illuminators, collectors and other critical optical components (which we refer to as optics). If Carl Zeiss SMT GmbH is unable to maintain and increase production levels or if we are unable to maintain our business relationship with Carl Zeiss SMT GmbH in the future we could be unable to fulfill orders, which could damage relationships with current and prospective customers and have a material adverse effect on our business, financial condition and results of operations. If Carl Zeiss SMT GmbH were to terminate its supply relationship with us or if Carl Zeiss SMT GmbH is unable to maintain production of optics over a prolonged period, we would effectively cease to be able to conduct our business.
See
Management Board Report - Partners - Sustainable relationships with suppliers
.
In addition to Carl Zeiss SMT GmbH’s current position as a supplier of optics, a number of other critical components are available from only a limited number of suppliers.
ASML INTEGRATED REPORT 2018
51
Lead-times in obtaining components have increased as our products have become more complex, and a failure by us to adequately predict demand for our systems or any delays in the shipment of components can result in insufficient supply of components, which can lead to delays in delivery of our systems and can limit our capabilities to react quickly to changing market conditions. Conversely, a failure to predict demand could lead to excess and obsolete inventory. A prolonged inability to obtain adequate deliveries of components or subassemblies, or any other circumstance that requires us to seek alternative sources of supply, could significantly hinder our ability to deliver our products in a timely manner, which could damage relationships with current and prospective customers and have a material adverse effect on our business, financial condition and results of operations.
A high percentage of net sales is derived from a few customers
Historically, we have sold a substantial number of lithography systems to a limited number of customers. Customer concentration can increase because of continuing consolidation in the semiconductor manufacturing industry. In addition, although the applications' part of our Holistic Lithography solutions constitutes an increasing portion of our revenue, a significant portion of those customers are the same customers as those of our systems. Consequently, while the identity of our largest customers may vary from year to year, sales may remain concentrated among relatively few customers in any particular year. In
2018
, recognized total net sales to our largest customer accounted for
EUR 2,476.8 million
, or
22.6 percent
of total net sales, compared with
EUR 2,454.4 million
, or
27.4 percent
of total net sales, in
2017
and
EUR 1,633.9 million
, or
23.8 percent
of total net sales in
2016
.
The loss of any significant customer or any significant reduction or delay in orders by a significant customer may have a material adverse effect on our business, financial condition and results of operations.
Additionally, as a result of our limited number of customers, credit risk on our receivables is concentrated. Our three largest customers (based on total net sales) accounted for
EUR 1,491.3 million
, or
58.8 percent
of accounts receivable and finance receivables on December 31,
2018
, compared with
EUR 1,356.7 million
, or
65.7 percent
on December 31,
2017
.
As a result of the foregoing risks, business failure or insolvency of one of our main customers may have a material adverse effect on our business, financial condition and results of operations.
The semiconductor industry can be cyclical and we may be adversely affected by any downturn
As a supplier to the global semiconductor industry, we are subject to the industry’s business cycles, of which the timing, duration and volatility are difficult to predict. The semiconductor industry has historically been cyclical. New entrants in the industry, including Chinese entrants, could increase the risk of cyclicality in the future. Certain key end market customers - Memory and Logic, exhibit different levels of cyclicality and different business cycles. Sales of our lithography systems, services and other Holistic Lithography products depend in large part upon the level of capital expenditures by semiconductor manufacturers, which in turn are influenced by industry cycles and a range of competitive and market factors, including semiconductor industry conditions and prospects. Large capital expenditures of our customers also impact the available production capacity of the industry to produce chips thereby creating imbalances in the supply and demand of chips. Reductions or delays in capital expenditures by our customers or incorrect assumptions by us about our customers’ capital expenditures could have a material adverse effect on our business, financial condition and results of operations.
Our ability to maintain profitability in an industry downturn will depend substantially on whether we are able to lower our costs and break-even level, which is the level of sales that we must reach in a year to have positive net income. If sales decrease significantly as a result of an industry downturn and we are unable to adjust our costs over the same period, our net income may decline significantly or we may suffer losses. Furthermore, we have grown in terms of employees, facilities and inventories in recent years, so it may be even more difficult for us to reduce our costs in order to respond to an industry downturn.
We derive most of our revenues from the sale of a relatively small number of products
We derive most of our revenues from the sale of a relatively small number of lithography systems (
224
units in
2018
and
197
units in
2017
). As a result, the timing of shipment, including any delays, and recognition of system sales for a particular reporting period from a small number of systems may have a material adverse effect on our business, financial condition and results of operations in that period.
Failure to adequately protect the intellectual property rights upon which we depend could harm our business
We rely on intellectual property rights such as patents, copyrights and trade secrets to protect our proprietary technology and applications. However, we face the risk that such measures could prove to be inadequate and result in circumstances which have a material adverse effect on our business, financial condition and results of operations because:
|
•
|
Intellectual property laws may not sufficiently support our proprietary rights or may change in the future in a manner adverse to us;
|
|
•
|
Patent rights may not be granted or interpreted as we expect;
|
|
•
|
Patents will expire which may result in key technology becoming widely available that may harm our competitive position;
|
|
•
|
The steps we take to prevent misappropriation or infringement of our proprietary rights may not be successful; and
|
|
•
|
Third parties may be able to develop or obtain patents for similar competing technology.
|
ASML INTEGRATED REPORT 2018
52
In addition, legal proceedings may be necessary to enforce our intellectual property rights, to determine the validity and scope of the proprietary rights of others, or to defend against claims of infringement. Any such proceedings may result in substantial costs and diversion of management resources, and, if decided unfavorably to us, could have a material adverse effect on our business, financial condition and results of operations.
Defending against intellectual property claims brought by others could harm our business
In the course of our business, we are subject to claims by third parties alleging that our products or processes infringe upon their intellectual property rights. If successful, such claims could limit or prohibit us from developing our technology, manufacturing and selling our products, which could have a material adverse effect on our business, financial condition and results of operations.
In addition, our customers or suppliers may be subject to claims of infringement from third parties, alleging that our products used by such customers in the manufacturing of semiconductor products and / or the processes relating to the use of our products infringe one or more patents issued to such third parties. If such claims are successful, we could be required to indemnify our customers or suppliers for some or all of any losses incurred or damages assessed against them as a result of such infringement, which could have a material adverse effect on our business, financial condition and results of operations.
We also may incur substantial licensing or settlement costs to settle disputes or to potentially strengthen or expand our intellectual property rights or limit our exposure to intellectual property claims of third parties, which could have a material adverse effect on our business, financial condition and results of operations.
Currently, a number of patent infringement suits between Nikon on the one hand and ASML and its supplier Carl Zeiss SMT GmbH are pending in multiple jurisdictions. On January 23, 2019, we entered into a binding MOU with Nikon and Zeiss relating to a comprehensive settlement of all pending disputes between Nikon, ASML and Zeiss. The terms of the MOU include a payment to Nikon by ASML and Zeiss of a total of EUR 150 million, and the cross-license agreement to be executed among the parties as contemplated by the MOU includes royalty payments of 0.8% by ASML to Nikon, and by Nikon to ASML, over the sales of their respective immersion lithography systems for 10 years from date of the definitive agreements giving effect to the MOU. In addition to the payments contemplated by the MOU and related agreements, we incurred significant costs in connection with the litigation with Nikon. See
Note 20 Legal contingencies
for a disclosure of litigation proceedings with Nikon.
While we have agreed to settle our current litigation with Nikon, we continue to face the risk that we may be subject to claims alleging the infringement of others’ patents or intellectual property rights or involved in patent litigation to defend our intellectual property rights.
Patent litigation is complex and may extend for a protracted period of time, giving rise to the potential for both substantial costs and diverting the attention of key management and technical personnel. Potential adverse outcomes from patent litigation may include, without limitation, payment of significant monetary damages, injunctive relief prohibiting our manufacturing, exporting or selling of products, and / or settlement involving significant costs to be paid by us, any of which may have a material adverse effect on our business, financial condition and results of operations.
A disruption in our information technology systems, including incidents related to cyber security, could adversely affect our business operations
We rely on the accuracy, availability and security of our information technology systems. Despite the measures that we have implemented, including those related to cyber security, our systems could be breached or damaged by computer viruses and systems attacks, natural or man-made incidents, disasters or unauthorized physical or electronic access.
From time to time we experience cyber-attacks on our information technology systems as well as the information technology systems of our suppliers, customers and other service providers, whose systems we do not control. These attacks include malicious software (malware), attempts to gain unauthorized access to data, and other electronic security breaches of our information technology systems as well as the information technology systems of our suppliers, customers and other service providers that have led and could lead, for us, our customers, suppliers or other business partners, including R&D partners, to disruptions in critical systems, unauthorized release, misappropriation, corruption or loss of data or confidential information (including confidential information relating to our customers, employees and suppliers). In addition any system failure, accident or security breach could result in business disruption, theft of our intellectual property, trade secrets (including our proprietary technology), unauthorized access to, or disclosure of, customer, personnel or supplier information, corruption of our data or of our systems, reputational damage or litigation. Furthermore, computer viruses or other malware may harm our systems and software and could be inadvertently transmitted to our customers' systems and operations, which could result in reputational damage, loss of customers or litigation. We may also be required to incur significant costs to protect against or repair the damage caused by these disruptions or security breaches in the future, including, for example, rebuilding internal systems, implementing additional threat protection measures, providing modifications to our products and services, defending against litigation, responding to regulatory inquiries or actions, paying damages, providing customers with incentives to maintain the business relationship, or taking other remedial steps with respect to third parties. These cyber security threats are constantly evolving. We, therefore, remain potentially vulnerable to additional known or yet unknown threats, as in some instances, we, our customers, and our suppliers may be unaware of an incident or its magnitude and effects. We also face the risk that we expose our customers to cybersecurity
ASML INTEGRATED REPORT 2018
53
attacks through the systems we deliver to our customers, including in the form of malware or other types of attacks as described above, which could harm our customers and therefore our business and reputation.
In addition, from time to time, we implement updates to our information technology systems and software, which can disrupt or shutdown our information technology systems. For example, we are currently implementing a new enterprise-wide management system and infrastructure. We may not be able to successfully integrate and launch these new systems as planned without disruption to our operations. Information technology system disruptions, if not anticipated and appropriately mitigated, could have a material adverse effect on our operations. In addition, we may not be able to effectively integrate and launch these new systems and these new systems may not deliver the intended cost savings and efficiencies and thereby have a material adverse effect on our business, financial condition and results of our operations.
The General Data Protection Regulation (the "GDPR") came into effect in May 2018. The regulation imposes a strict data protection compliance regime and includes new rights. The GDPR applies to the collection, use, retention, security, processing, and transfer of personally identifiable information of residents of EU countries, and created a range of new compliance obligations. Implementation of, and compliance with the GDPR has increased and could continue to increase our cost of doing business. In addition, the GDPR may be interpreted or applied in a manner that is unforeseen by or adverse to us. Violations of the GDPR may result in significant fines (up to four percent of worldwide net sales or EUR 20.0 million, whichever is greater) and reputational harm.
We are subject to risks in our international operations
Our operations are global, see
our
Consolidated Financial Statements - Notes to the Consolidated Financial Statements - Note 22 Segment disclosure
. There are a number of risks inherent in doing business globally, for example:
|
•
|
Unfavorable political, geopolitical or economic environments;
|
|
•
|
Increased exposure to natural hazards;
|
|
•
|
Potentially adverse tax consequences;
|
|
•
|
Unexpected legal or regulatory changes;
|
|
•
|
Global trade issues and changes in and uncertainties with respect to multilateral and bilateral treaties and trade policies, including the ability to obtain required licenses (including licenses for our employees) and approvals and the effects of trade sanctions, export controls, tariffs and similar regulations and international trade disputes, that could impact our ability to produce and deliver our systems and services internationally;
|
|
•
|
Failure to comply with regulatory requirements, including anti-corruption, anti-bribery and human rights standards;
|
|
•
|
Our inability to attract and retain sufficiently qualified personnel;
|
|
•
|
Our inability to protect our intellectual property and information technology systems; and
|
|
•
|
Adverse effects of foreign currency fluctuations.
|
If we are unable to manage successfully the risks inherent in our international activities, our business, financial condition and results of operations could be materially and adversely affected.
In particular, certain of our manufacturing facilities as well as customers are located in Taiwan. Customers in Taiwan represented
18.2 percent
of our
2018
total net sales and
23.4 percent
of our
2017
total net sales. Taiwan has a unique international political status. The People’s Republic of China asserts sovereignty over Taiwan and does not recognize the legitimacy of the Taiwanese government. Changes in relations between Taiwan and the People’s Republic of China, Taiwanese government policies and other factors affecting Taiwan’s political, economic or social environment could have a material adverse effect on our business, financial condition and results of operations. The risks we face by doing business in Taiwan increased with our acquisition of HMI. Furthermore, certain of our manufacturing facilities as well as customers are located in South Korea. Customers in South Korea represented,
34.0 percent
of our
2018
total net sales and
33.8 percent
of our
2017
total net sales were derived from customers in South Korea. There are tensions with the Democratic People’s Republic of Korea (North Korea), which have existed since the division of the Korean Peninsula following World War II, which have increased significantly in recent years. The worsening of relations between those countries or the outbreak of war on the Korean Peninsula could have a material adverse effect on our business, financial condition or results of operations.
We have a presence in a number of jurisdictions, including the People’s Republic of China and Russia. In particular, our business in People’s Republic of China has increased in recent years and is expected to increase further. Such increased presence in new jurisdictions increases the risks we face, including risks relating to compliance with multilateral and bilateral treaties, delays in receipt of appropriate permits, compliance with anti-corruption and anti-bribery laws and regulations, our ability to effectively manage and control our growing business, attracting and retaining sufficiently qualified personnel, and the protection of our intellectual property and information technology systems. For example, we are experiencing delays in processing work permits for foreign nationals, which could potentially delay development and support provided to customers. These risks could have a material adverse effect on our business, financial condition and results of operations.
ASML INTEGRATED REPORT 2018
54
The administration of U.S. President Trump has enacted trade measures, including import tariffs and other tariffs on People's Republic of China and on other countries and restrictions on conducting business with certain Chinese entities. In response to such measures, the European Union and other countries, including China, have responded with retaliatory tariffs on certain products from the United States. Our business involves the sale of systems and services to customers in a number of countries, including China where our business has grown in recent periods, and includes sensitive technologies that may be the subject of increased export regulations, policies or practices. These and further developments in multilateral and bilateral treaties, national regulation, and trade, national security and investment policies and practices have affected and may further affect our business and the businesses of our suppliers and customers. Any of the foregoing could impact our ability to sell systems and services to our customers and to obtain necessary permits, including permits for use of US technology and for employees producing and developing such technology, which could adversely affect our business, financial condition and results of operations.
We are dependent on the continued operation of a limited number of manufacturing facilities
All of our manufacturing activities, including subassembly, final assembly and system testing, take place in cleanroom facilities in Veldhoven, the Netherlands, in Wilton, Connecticut and in San Diego, California, both in the US, in Pyeongtaek, South-Korea, in Beijing, China, in Linkou and Tainan, Taiwan. These facilities may be subject to disruption for a variety of reasons, including work stoppages, fire, energy shortages, flooding or other natural disasters. We cannot ensure that alternative production capacity would be available if a major disruption were to occur. In addition, some of our key suppliers, including Carl Zeiss SMT GmbH, have a limited number of manufacturing facilities, the disruption of which may significantly and adversely affect our production capacity, which could adversely affect our business, financial condition and results of operations.
Our business and future success depend on our ability to manage the growth of our organization and attract and retain a sufficient number of adequately educated and skilled employees
Our business and future success significantly depends upon our employees, including a large number of highly qualified professionals, as well as our ability to attract and retain employees. Competition for such personnel is intense and has increased in recent years, and we may not be able to continue to attract and retain such personnel. Our R&D programs require a significant number of qualified employees. If we are unable to attract sufficient numbers of qualified employees, this could affect our ability to conduct our R&D on a timely basis, which could adversely affect our business, financial condition and results of operations.
In addition, if we lose key employees or officers to retirement, illness or otherwise, particularly a number of our highly qualified professionals and / or senior management, we may not be able to timely find a suitable replacement. Moreover, as a result of the uniqueness and complexity of our technology, qualified engineers capable of working on our systems are scarce and generally not available (e.g. from other industries or companies). As a result, we must educate and train our employees to work on our systems. Therefore, a loss of a number of key professionals and / or senior management can be disruptive, costly and time consuming. Our R&D activities with respect to new technology systems, such as EUV and High NA, and our service activities have increased our need for qualified personnel. Competition for qualified personnel is particularly significant in the area surrounding our headquarters in Veldhoven, the Netherlands and in the other regions where our facilities are located, where also a number of other high technology companies are located.
Furthermore, the increasing complexity of our products results in a longer learning-curve for new and existing employees and suppliers leading to an inability to decrease cycle times and may result in the occurrence of significant additional costs.
Our suppliers face similar risks in attracting qualified employees, including attracting employees in connection with R&D programs that will support our R&D programs and technology developments. To the extent that our suppliers are unable to attract qualified employees, this could impact our R&D programs or deliveries of components to us, which could adversely affect our business, financial condition and results of operations.
In recent years, our organization has grown significantly. This growth in a short period of time could result in challenges in managing our employees, facilities and other resources. An inability to effectively manage, monitor and control the growth in our employees, facilities and operations could adversely affect our business, financial condition and results of operations. Our personnel also needs to adapt and acquire the appropriate skillset in order to effectively work in our growing business and an inability to do so could adversely affect our business, financial condition and results of operations.
Fluctuations in foreign exchange rates could harm our results of operations
We are exposed to currency risks. Our Financial Statements are expressed in euros. Accordingly, our results of operations are exposed to fluctuations in exchange rates between the euro and such other currencies, and changes in currency exchange rates can result in losses in our Financial Statements. We are particularly exposed to fluctuations in the exchange rates between the US dollar and the euro, and to a lesser extent to the Japanese yen and the Taiwanese dollar in relation to the euro. We incur costs of sales predominantly in euros with portions also denominated in US and Taiwanese dollars, particularly following our acquisitions of Cymer in 2013 and HMI in 2016. A small portion of our operating results are driven by movements in currencies other than the euro, yen, US dollar or Taiwanese dollar.
In general, our customers run their businesses in US dollars and therefore a weakening of the US dollar against the euro might impact the ability or desire of our customers to purchase our products at quoted prices, which could adversely affect our business, financial condition and results of operations.
ASML INTEGRATED REPORT 2018
55
Changes in taxation could affect our future profitability
We are subject to income taxes in the Netherlands and numerous other jurisdictions. Our effective tax rate has fluctuated in the past and may fluctuate in the future.
Changes in tax legislation in the countries where we operate can affect our effective tax rate. For example, in 2012 the OECD has embarked on a project to propose measures against so called Base Erosion and Profit Shifting or BEPS. Based on the BEPS reports the EU has proposed directives to counter base erosion and profit shifting which in turn will result in legislative proposals in EU member states. Similar legislative initiatives inspired by the BEPS reports have been taken in Asian jurisdictions in which we operate. Anticipating these legislative initiatives, we have implemented and will implement changes in our business flows to align our business flows with these anticipated initiatives.
In addition, in 2018, the newly elected Dutch government issued new proposals for amendments in Dutch tax legislation which, amongst others includes a reduction in the general Dutch corporate income tax rate over a number of years. Furthermore, in December 2017, the U.S. President Trump signed the Tax Cuts and Jobs Act (TCJA) which significantly changed the US income tax code. Regarding TCJA several aspects are currently still waiting for further clarification in the form of to be published Treasury Regulations.
We currently do not expect significant tax effects but we are continuing to assess the impact of those developments.
Changes to tax legislation of jurisdictions we operate in, may adversely impact our tax position and consequently our net income. In this respect it should be noted that our worldwide effective tax rate is heavily impacted by R&D incentives included in tax laws and regulations in the countries we operate in. An example is the so-called innovation box tax legislation in the Netherlands. In case these jurisdictions alter their tax policies in this respect this may have an adverse effect on our worldwide effective tax rate. In addition, jurisdictions levy corporate income tax at different rates. The mix of our sales over the various jurisdictions in which we operate may vary from year to year, resulting in a different mix of corporate income tax rates applicable to our profits, which can affect our worldwide effective tax rate and adversely impact our net income.
Hazardous substances are used in the production and operation of our systems and failure to comply with applicable regulations or failure to implement appropriate practices for the environment, health and safety could subject us to significant liabilities
Hazardous substances are used in the production and operation of our products and systems, which subjects us to a variety of governmental regulations relating to environmental protection and employee and product health and safety, including the transport, use, storage, discharge, handling, emission, generation, and disposal of toxic or other hazardous substances. In addition, operating our systems (which use lasers and other potentially hazardous systems) can be dangerous and can result in injury. The failure to comply with current or future regulations could result in substantial fines being imposed on us or other adverse consequences. Additionally, our products have become increasingly complex. The increasing complexity requires us to invest in continued risk assessments and development of appropriate preventative and protective measures for health and safety for both our employees (in connection with the production and installation of our systems and field options and performance of our services) and our customers’ employees (in connection with the operation of our systems). Our health and safety practices may not be effective in mitigating all health and safety risks. Failing to comply with applicable regulations or the failure of our implemented practices for customer and employee health and safety could subject us to significant liabilities, which could have a material adverse effect on our business, financial condition and results of operations.
In addition, we face risks related to the global transition to a lower carbon economy and / or climate change. Such risks may result in an increase in our cost of goods, including as a result of the imposition of carbon taxes or increased regulations on technology restrictions, which could have a material adverse effect on our business, financial condition and results of operations.
We may be unable to make desirable acquisitions or to integrate successfully any businesses we acquire
Our future success may depend in part on the acquisition of businesses or technologies intended to complement, enhance or expand our current business or products or that might otherwise offer us growth opportunities. Our acquisitions could fail to achieve our financial or strategic objectives, disrupt our ongoing business and adversely impact our results of operations. Furthermore, our ability to complete such transactions may be hindered by a number of factors, including potential difficulties in obtaining government approvals.
Any acquisition that we do make could pose risks related to the integration of the new business or technology with our business and organization. We cannot be certain that we will be able to achieve the benefits we expect from a particular acquisition investment. Such transactions may also strain our managerial and operational resources, as the challenge of managing new operations may divert our management from day-to-day operations of our existing business. Furthermore, we may be unable to retain key personnel of acquired businesses or may have difficulty integrating employees, business systems, and technology. The controls, processes and procedures of acquired businesses may also not adequately ensure compliance with laws and regulations and we may fail to identify compliance issues or liabilities. Our business, financial condition and results of operations may be materially and adversely affected if we fail to coordinate our resources effectively to manage both our existing operations and any businesses we acquire.
ASML INTEGRATED REPORT 2018
56
In addition, in connection with acquisitions, anti-trust regulators have in the past and may in the future impose conditions on us, including requirements to divest assets or other conditions that could make it difficult for us to integrate the businesses that we acquire. Furthermore, as the industry is becoming more consolidated, anti-trust clearances may become harder to obtain, which could inhibit future desired acquisitions.
Moreover, our resources are limited and our decision to pursue a transaction has opportunity costs; accordingly, if we pursue a particular transaction, we may need to forgo the prospect of entering into other transactions that could help us achieve our financial or strategic objectives. Any of these risks could have a material adverse effect on our business, results of operations, financial condition, or cash flows, particularly in the case of a large acquisition or several concurrent acquisitions.
As a result of acquisitions, we have recorded, and may continue to record, a significant amount of goodwill and other intangible assets. Under current accounting guidelines, we must assess, at least annually and potentially more frequently, whether there are indicators that
the value of goodwill has been impaired. Furthermore, we have recorded our indirect interest in Carl Zeiss SMT GmbH as an
equity method investment
and, therefore, we must assess in each reporting period whether there are triggers that cause this investment to be impaired. Any reduction or impairment of the value of our indirect investment in Carl Zeiss SMT GmbH, goodwill or other intangible assets will result in additional charges against earnings, which could materially reduce our reported results of operations in future periods.
We may not declare cash dividends and conduct share buyback programs at all or in any particular amounts in any given year
We aim to pay an annual dividend that is growing over time. Annually, the BoM, upon prior approval from the SB, submits a proposal to the AGM with respect to the amount of dividend to be declared with respect to the prior year. In addition, as part of our plan to return excess cash to shareholders, we conduct share buyback programs from time to time. The dividend proposal and amount of share buyback programs in any given year will be subject to the availability of distributable profits or retained earnings and may be affected by, among other factors, the BoM’s views on our potential future liquidity requirements, including for investments in production capacity, the funding of our R&D programs and for acquisition opportunities that may arise from time to time; and by future changes in applicable income tax and corporate laws.
We may also suspend buyback programs from time to time which would reduce the amount of cash we are able to return to shareholders.
Accordingly, the BoM may decide to propose not to pay a dividend or pay a lower dividend and may adjust the amount of share buyback programs with respect to any particular year in the future, which could have a negative effect on our share price.
We may face share price volatility
Stock markets in general and our share price, in particular, have experienced significant price and volume volatility over recent years. The market price and trading volume of our common stock is subject and may continue to be subject to significant fluctuations due to fluctuations in prices of semi-conductor equipment as a result of economic and geopolitical conditions and due to the variability in the prevailing sentiment regarding our operations or business prospects, as well as, among other things, changing investment priorities of our shareholders. This could have a material adverse effect on our business and results of operations and may frustrate our investors’ ability to value their investments in us.
Restrictions on shareholder rights may dilute voting power
Our Articles of Association provide that we are subject to the provisions of Dutch law applicable to large corporations, called "structuurregime". These provisions have the effect of concentrating control over certain corporate decisions and transactions in the hands of our SB. As a result, holders of ordinary shares may have more difficulty in protecting their interests in the face of actions by members of our SB than if we were incorporated in the US or another jurisdiction.
Our authorized share capital also includes a class of cumulative preference shares and we have granted Stichting Preferente Aandelen ASML, a Dutch foundation, an option to acquire, at their nominal value of EUR 0.09 per share, such cumulative preference shares. Exercise of the Preference Share Option would effectively dilute the voting power of our outstanding ordinary shares by one-half, which may discourage or significantly impede a third party from acquiring a majority of our voting shares.
See
Corporate Governance - Board of Management
and
Supervisory Board
,
and
Consolidated Financial Statements - Notes to the Consolidated Financial Statements - Note 28 Shareholders’ equity
.
ASML INTEGRATED REPORT 2018
57
Materiality Assessment
Dialogue and knowledge-sharing are important in an innovation-driven industry. To this end, we continually and openly communicate with our main stakeholder groups through various channels, see
Non-Financial Statements - Stakeholder Engagement
,
and at different levels within our organization. We also analyze global trends, risks and opportunities. Our materiality analysis uses this input to identify the issues that matter most to our stakeholders and to our business. This, in turn, contributes to our vision, mission and strategy.
Our stakeholders are parties affected by our activities or those who have a direct interest in or who can influence our long-term business success. We have identified 5 main stakeholder groups: customers, shareholders, employees, suppliers and society.
We performed a comprehensive new materiality assessment in 2016, considering the GRI principles for defining report content. Through this, we were able to reassess the topics that are most important to our stakeholders and to sustain ASML’s long-term business growth. We based our materiality analysis on stakeholder feedback, a review of the industry and relevant global trends, legislation, guidelines and standards (such as the GRI principles and ISO 26000), a sector and media analysis, and analysts’ questionnaires (such as the Dow Jones Sustainability Index assessment and the Carbon Disclosure Project). This led to a list of relevant topics. To assess the impact of each of these topics on ASML and our stakeholders, we discussed them with the most relevant internal stakeholders and surveyed representatives from all five stakeholder groups. The assessment results were validated and approved by our Corporate Risk Committee. Our 2018 Integrated Report is based on the aforementioned assessment.
|
Material themes
|
Section in this report
|
|
|
|
|
Innovation
|
Products & Technology
|
|
Sustainable relationship with customers
|
Partners
|
|
Operational excellence
|
Operations
|
|
Sustainable relationship with our people
|
People
|
|
Talent management
|
People
|
|
Sustainable relationship with suppliers
|
Partners
|
|
Financial performance
|
Financial Performance & Consolidated Financial Statements
|
|
Employee safety
|
Operations
|
|
Knowledge management
|
Products & Technology
|
|
Business risk & continuity
|
Business Risk & Continuity
|
|
Business ethics & compliance
|
Business Ethics & Compliance
|
|
|
|
|
Responsible business behavior themes
|
Section in this report
|
|
|
|
|
Product safety & compliance
|
Products & Technology
|
|
Financing & capital return policy
|
Other Appendices
|
|
Product stewardship
|
Products & Technology
|
|
Fair remuneration
|
People
|
|
Tax strategy & transparency
|
Other Appendices
|
|
Human rights
|
People
|
|
Environmental efficiency own operations
|
Operations
|
|
Responsible supply chain
|
Partners
|
|
Community involvement
|
People
|
|
Labor relations
|
People
|
|
Diversity & inclusion
|
People
|
|
|
|
We identified 11 material themes that are most relevant to our stakeholders and directly contribute to our potential to innovate and excel. We also identified other issues that could affect our business. These include issues our stakeholders expect us to act on or issues that we have an impact on and therefore, as a company with a strong sense of corporate social responsibility, feel we need to address. These issues have been categorized under the ‘Responsible business behavior themes’. Each theme is the responsibility of one of our senior managers (referred to as the ‘theme owner’). The theme owner monitors progress for this theme in relation to agreed targets and ensures there are sufficient resources to meet the agreed targets and objectives. Insufficient progress is discussed during operational performance review meetings and escalated to our Corporate Risk Committee or during other relevant committee meetings where necessary.
During 2018 we started our review of our material themes as input, among others, for our new Corporate Responsibility Strategy as of 2019 onwards. See also
Management Board Report - Business Strategy - Our strategy
. We will finalize and implement the new Corporate Responsibility Strategy in our 2019 Integrated Report.
ASML INTEGRATED REPORT 2018
58
Sustainable Development Goals
We also support the 2030 ambition defined in the United Nations Sustainable Development Goals adopted by the United Nations in 2015. These goals aim to protect the planet and improve the lives of people everywhere. We have mapped out how our strategy and current efforts actively support these goals and the table below outlines the five most relevant United Nations Sustainable Development Goals to which we contribute.
|
|
Relevant United Nations Sustainable Development Goal
|
ASML Theme
|
Contribution to the United Nations Sustainable Development Goal
|
Section in this report
|
|||
|
|
|
|
|
|
|||

|
Ensure inclusive and quality education for all and promote lifelong learning
|
•
•
•
|
Talent management
Community involvement
Knowledge management
|
•
•
•
|
People development & training
Technology promotion program & ASML Foundation
Technical training
|
•
•
•
|
People
People
Products & Technology
|
|
|
|
|
|
|
|||
|
|
Promote inclusive and sustainable economic growth, employment and decent work for all
|
•
•
•
|
Sustainable relationship with suppliers
Responsible supply chain
Sustainable relationship with our people
|
•
•
•
•
|
Co-development with business critical suppliers
Responsible Business Alliance (formerly Electronic Industry Citizenship Coalition) membership
Place to Work, Meet, Learn and Share
Employment creation
|
•
•
•
•
|
Partners
Partners
People
Highlights
|
|
|
|
|
|
|
|||
|
|
Build resilient infrastructure, promote sustainable industrialization and foster innovation
|
•
•
•
|
Innovation
Knowledge management
Community involvement
|
•
•
•
|
ASML’s ‘open innovation’ concept
Knowledge creation and sharing
Strengthening local knowledge infrastructure
|
•
•
•
|
Products & Technology
How We Create Value
People
|
|
|
|
|
|
|
|||
|
|
Ensure sustainable consumption and production patterns
|
•
•
|
Product stewardship
Environmental efficiency own operations
|
•
•
|
Circular economy approach
Waste savings
|
•
•
|
Products & Technology
Operations
|
|
|
|
|
|
|
|||
|
|
Take urgent action to combat climate change and its impacts
|
•
•
|
Product stewardship
Environmental efficiency own operations
|
•
•
|
Energy efficiency products
Renewable electricity
|
•
•
|
Products & Technology
Operations
|
|
|
|
|
|
|
|||
We identified our new sustainability priorities for the period 2019-2025. We will further align our strategy with the SDG goals, and select the areas where we believe we can have the most impact.
This report focuses on the material themes which we disclose in a comprehensive manner. However, we also want to meet our stakeholders’ expectations. For our responsible business behavior themes, we therefore seek to address the elements that especially interest them. This results in themes being addressed in different detail.
ASML INTEGRATED REPORT 2018
59
Business Ethics and Compliance
It is crucial in an international company like ours to provide clear guidance on ethical behavior. We not only do business in a variety of countries and need to adhere to local laws and regulations, but we also have employees from over 120 countries and a range of cultures. To this end, we have our Code of Conduct, Business Principles and our Ethics Program. We encourage our management to set the right example and create an environment in which our people and business partners feel comfortable to speak up if they experience or suspect a breach of our Code of Conduct and Business Principles. As a member of the Responsible Business Alliance, we adhere to this industry organization’s code of conduct and integrate its norms and values into the way we work. We are committed to achieving our strategic goals while conducting business in such a way that is lawful, ethical and sound.
ASML’s Ethics Board, chaired by our CEO, oversees and implements our Ethics Program. The corporate Ethics Office, led by our Corporate Ethics Officer, is responsible for implementing and monitoring this Ethics Program. The program consists not only of providing computer-based training on ethics, but also enrolls global classroom trainings throughout the company. In addition, the Ethics Office uses other means of communication to reach out to employees, such as the Yearly Ethics Awareness Week. The Ethics Office also actively promotes our company’s Speak Up policy and encourages employees to report any concerns relating to misconduct or suspected misconduct. Our ethics organization includes employees who, in addition to their regular roles at ASML, act as Ethics Liaisons in all the countries we operate in. They are the trusted points of contact for each local office, offering advice and answering questions from colleagues.
Our Business Principles elaborate on our Code of Conduct and give employees greater clarity about the standards we expect them to follow and the behavior they should adopt. We update our code and principles when required to incorporate the latest legal and regulatory requirements or to reflect our internal policies. No changes were made in 2018. Our business principles are: We respect people and planet; We encourage Speak Up; We operate with integrity; We preserve our assets; We manage professionally. Our Code of Conduct and Business Principles can be found in the Governance section of our website.
Our Speak Up policy (whistleblower) and our internal Ethics Investigation Procedure outline the steps employees are encouraged to take if they experience or suspect a breach of our business ethics. These documents also reassure employees that they can report a breach without fear of repercussions. For employees or external stakeholders who feel more comfortable remaining anonymous, we have a Speak Up system available, which is run by an independent external service company. Like our Code of Conduct and Business Principles, our Speak Up policy is available on our Website.
In 2018, we registered
266
Speak Up messages made by employees.
The highest number of these Speak Up messages were related to our business principle ‘
We respect people and planet
’, more specifically these concerned issues such as bullying, harassment, problems with style and language of communication and HR related topics (appraisal, demotion, compensation and benefits). Other queries related to our business principle ‘
We operate with integrity
’, mostly in the form of questions (am I allowed to accept or give away), but we also received Speak Up messages relating to employees (potentially) crossing the line of what is acceptable, as well as potential conflicts of interest. We have looked into and addressed all Speak Up messages.
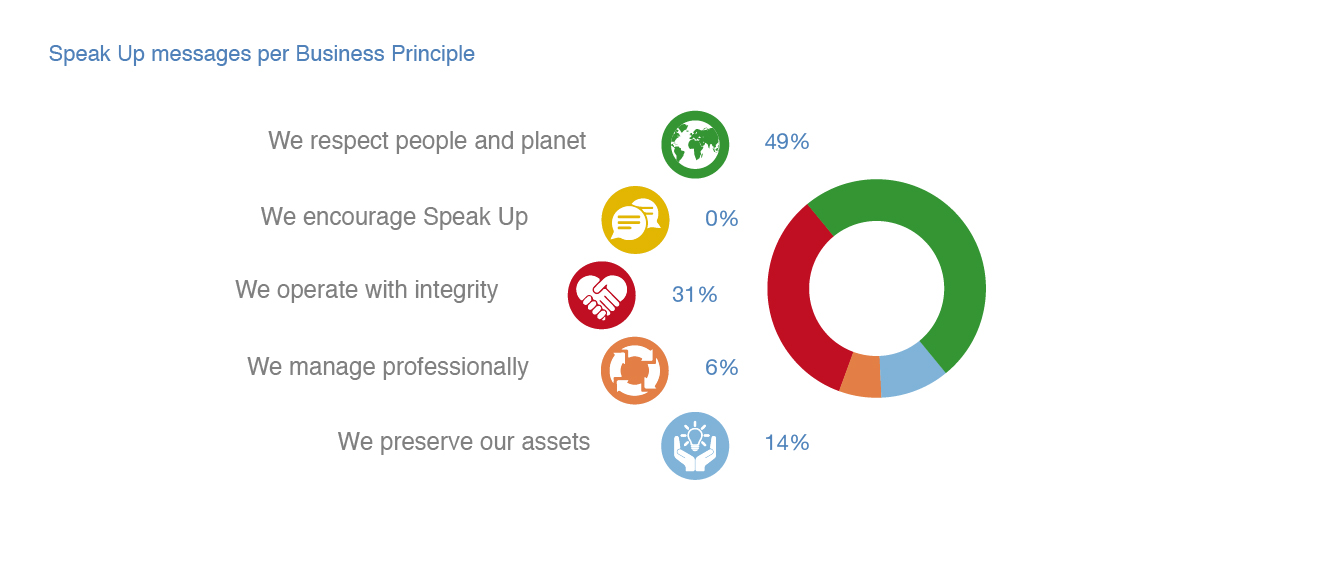
The increase in Speak Up messages compared to last year is mainly due to the growth of our workforce, an increase in awareness of our policy and a growing familiarity with the procedure for raising issues due to the specific worldwide efforts of the Corporate Ethics Office.
In March, we released our Ethics Program to all HMI employees. This phased implementation entailed the onboarding of HMI managers into ASML’s Ethics Program. They received our code of conduct, online as well as face-to-face training, and a dedicated website outlining relevant changes.
ASML INTEGRATED REPORT 2018
60
Based on the number of questions and Speak Up messages we received via our system, the Ethics Liaisons and internal network decided to choose conflict of interest as the theme of our global Ethics Awareness Week in September 2018. We put specific focus on gifts and entertainment, personal relationships at work, and employees who hold external positions in addition to the work they do at ASML. The aim was to raise general awareness of the topic, and then focus on three specific areas: the need to be transparent, ask questions, and make the right decisions. We provided a guidance framework, outlining what conflict of interest actually means and reiterated what to do if faced with such a situation. As part of this focus, we also released an updated version of our Gifts and Entertainment policy.
In response to employee questions related to fraud, we reviewed our anti-fraud policy and released a revised version. We introduced fraud-prevention training, which is available to all managers and employees. Some of the issues addressed include those related to expense reporting and the use of the clocking system in Veldhoven.
As in previous years, we did not incur any significant fines for breaches of ethical regulations.
Compliance focus
As regulations have expanded worldwide since the financial crisis, we have invested significantly in compliance infrastructure, and are making continued efforts to respond proactively to relevant laws and regulations, for example GDPR, in all the countries we operate in. This is particularly relevant in China, one of our biggest growth markets, which presents unique regulatory challenges with its complex business environment and governmental interests in the semiconductor industry.
We rely on the integrity and accountability of our senior management to comply with relevant laws, and our Chief Compliance Officer supports the business in implementing measures to help managers fulfill their responsibilities.
Our Compliance Office, led by our Chief Compliance Officer, oversees and advises management in complying with laws, regulations and corporate policies. While compliance is strongly rooted in a legal framework, there are three distinct compliance pillars spread throughout the organization: the Compliance Office within our legal department that provides an oversight and advisory role across the company; compliance owners, who are responsible for ensuring that adequate measures are in place to be compliant, and the internal control and compliance function, which supports compliance owners with the design and implementation of adequate internal controls to become, and remain, compliant. Our Corporate Legal department owns certain key corporate-wide compliance programs, including anti-bribery and corruption, anti-trust, and insider trading. We are in the process of entrenching this compliance structure throughout the organization, and this was a key focus area in 2018.
We had two broad, company-wide compliance focus areas in 2018:
|
•
|
Working to take a pre-emptive approach to compliance, as opposed to responding in a reactive manner.
|
|
•
|
Strengthening the local capability and responsiveness in the countries we operate in. We are in the process of decentralizing certain responsibilities in compliance and creating capabilities in the regions themselves. This improves traction and allows for training and awareness and compliance enhancements to be more tailored and relevant.
|
ASML INTEGRATED REPORT 2018
61
ASML INTEGRATED REPORT 2018
62
Supervisory Board


|
Gerard J. Kleisterlee (1946, Dutch)
Member of the SB since 2015; first term expires in 2019 Chairman of the SB, Chairman of the Selection and Nomination Committee and member of the Technology Committee |
|
l
|
Mr. Kleisterlee was the President and CEO of the Board of Management of Royal Philips N.V. from 2001 until 2011, after having worked at Philips from 1974 onwards.
|
|
l
|
Currently, Mr. Kleisterlee is the Chairman of the Board of Vodafone Group Plc. and the Senior Independent Director of Royal Dutch Shell Plc.
|
|
|
|

|
Antoinette (Annet) P. Aris (1958, Dutch)
Member of the SB since 2015; first term expires in 2019 Member of Technology Committee and Selection and Nomination Committee |
|
l
|
Ms. Aris is Senior Affiliate of Strategy at INSEAD, France, a position she has held since 2003.
|
|
l
|
From 1994 to 2003 Ms. Aris was a partner at McKinsey & Company in Germany.
|
|
l
|
Currently, Ms. Aris is a Non-Executive Director of Thomas Cook Plc. and a member of the supervisory boards of Jungheinrich AG, ASR Nederland N.V., Randstad Holding N.V. and Coöperatieve Rabobank U.A.
|
|
|
|

|
Clara (Carla) M.S. Smits-Nusteling (1966, Dutch)
Member of the SB since 2013; second term expires in 2021 Chairperson of the Audit Committee |
|
l
|
Ms. Smits-Nusteling was CFO and a member of the Board of Management of Royal KPN N.V. from 2009 until 2012.
|
|
l
|
Prior to that, Ms. Smits-Nusteling held several finance and business related positions at Royal KPN N.V. and PostNL.
|
|
l
|
Currently, Ms. Smits-Nusteling is a Non-Executive Director of the Board of Tele2 AB, a member of the Management Board of the Foundation Unilever N.V. Trust Office, Non-Executive Director of the Board of Directors of Nokia Corporation and lay judge of the Enterprise Court of the Amsterdam Court of Appeal.
|
|
|
|

|
Douglas A. Grose (1950, American)
Member of the SB since 2013, second term expires 2021 Vice Chairman of the SB, Chairman of the Technology Committee and member of the Selection and Nomination Committee |
|
l
|
Mr. Grose was CEO of GlobalFoundries from 2009 until 2011.
|
|
l
|
Prior to that, Mr. Grose served as senior vice president of technology development, manufacturing and supply chain for Advanced Micro Devices, Inc. Mr. Grose also spent 25 years at IBM as General Manager of technology development and manufacturing for the systems and technology group.
|
|
l
|
Currently, Mr. Grose is a member of the Board of Directors of SBA Materials, Inc., President of Fuller Road Management Corporation and Fort Schuyler Management Corporation.
|
|
|
|
ASML INTEGRATED REPORT 2018
63

|
Johannes (Hans) M.C. Stork (1954, American)
Member of the SB since 2014; second term expires in 2022 Member of the Technology Committee and the Remuneration Committee |
|
l
|
Mr. Stork is Senior Vice President and CTO of ON Semiconductor Corporation, a position he has held since 2011.
|
|
l
|
Prior to that, Mr. Stork held various management positions at IBM Corporation, Hewlett Packard Company, Texas Instruments, Inc. and Applied Materials, Inc., including Senior Vice President and CTO of Texas Instruments, Inc. and Group Vice President and CTO of Applied Materials, Inc. Further, Mr. Stork was a member of the Board of Sematech.
|
|
l
|
Currently, Mr. Stork is a member of the Scientific Advisory Board of imec.
|
|
|
|

|
Terri L. Kelly (1961, American)
Member of the SB since 2018; first term expires in 2022 Member of the Remuneration Committee |
|
l
|
Ms. Kelly was the President and Chief Executive Officer at W.L. Gore & Associates Inc. from 2005 until April 1, 2018, after having worked at Gore since 1983 in various (management) roles. Ms. Kelly served on the board of directors of Gore through July 2018.
|
|
l
|
Currently, Ms. Kelly serves as Trustee of The Nemours Foundation, Vice-Chair of the University of Delaware and Trustee of the Unidel Foundation. Furthermore, Ms. Kelly is a member of the Board of Directors of United Rentals, Inc.
|
|
|
|

|
Rolf-Dieter Schwalb (1952, German)
Member of the SB since 2015; first term expires in 2019 Chairman of the Remuneration Committee and member of the Audit Committee |
|
l
|
Mr. Schwalb was CFO and member of the Board of Management of Royal DSM N.V. from 2006 to 2014.
|
|
l
|
Prior to that, Mr. Schwalb was CFO and member of the Executive Board of Beiersdorf AG and he held a variety of management positions in Finance, IT and Internal Audit at Beiersdorf AG and Procter & Gamble Co.
|
|
|
|

|
Wolfgang H. Ziebart (1950, German)
Member of the SB since 2009; third term expires in 2019 Member of the Technology Committee and the Audit Committee |
|
l
|
Mr. Ziebart was President and CEO of Infineon Technologies A.G. from 2004 until 2008.
|
|
l
|
Prior to that, Mr. Ziebart was on the Boards of Management of car components manufacturer Continental A.G. and automobile producer BMW A.G.
|
|
l
|
Currently, Mr. Ziebart is the Chairman of the supervisory board of Nordex SE and a member of the Board of Veoneer, Inc.
|
|
|
|
Company Secretary :
Mr. Robert F. Roelofs
Appointed : 2002
Deputy Company Secretary :
Ms. Angela J.F.M. van de Kerkhof
Appointed : 2017
ASML INTEGRATED REPORT 2018
64
Introduction
As ASML's SB we focus on long-term and sustainable value creation. Our goal is to ensure the company pursues a strategy that secures its leading position as a supplier of holistic lithography solutions to the semiconductor industry. There is a strong alignment between the SB and the BoM on all key elements of the company strategy. Having the right people and policies in place is crucial to the successful implementation of the agreed strategy and is therefore another focus area for the SB. We uphold an appropriate system of checks and balances, provide oversight, evaluate performance and give advice where required or requested. Through good governance, we help to ensure that ASML always acts in the best interests of the company and its stakeholders. ASML is fully compliant with the Dutch Corporate Governance Code. In this Supervisory Board Report, we report on our activities in 2018.
In line with expectations, ASML had another very good year. We made progress in EUV industrialization and profitability and continued to show the strength of our DUV and Applications business. Shrink remains a key industry driver supporting innovation and providing long-term industry growth. To support this industry driver and further enable the continuation of Moore’s Law well into the next decade, ASML continues to develop the next generation EUV systems, EUV High NA. This year ASML managed to sign agreements with 3 major customers, committing to 4 orders for High NA R&D systems targeting initial shipment in 2021, and 8 options for early volume systems with shipments planned from 2024. We also made further strides in the integration of HMI. All of this puts us well on track towards achieving our ambitions for 2025 as announced during the Investor Day in November of this year, subject to market conditions.
The success of ASML goes hand in hand with strong growth in people. It is a challenge to not only bring the right people into the company, but also enable them to work efficiently and make a contribution as quickly as possible. In addition to that there is also a strong focus on retention of employees to maintain a strong workforce. While ASML has many technological and organizational challenges ahead, we are confident the company is very well positioned for the future.
Activities in 2018
In 2018, ASML's SB discussed in depth the company’s corporate strategy, including its implementation and translation thereof into Corporate and Business Priorities during a two-day off-site meeting in September. More specifically, ASML's strategies for EUV, DUV and Applications were extensively reviewed and also discussed throughout the year. With respect to EUV, the SB supported the BoM with advice relating to the further development and industrialization of this technology as well as the further development of its High NA program. In DUV, the SB supported the BoM in its activities to further improve competitiveness and operational excellence. With respect to Applications, the growing pattern fidelity control business as well as the continuing efforts with respect to the integration of HMI, were attention points for the SB.
This year, a specific focus area for the SB was the rapid growth of the business in size, complexity and international reach. This rapid growth comes with challenges both on an operational level, as well as on an organizational and employment level. Therefore, in 2018 special attention was paid to the way this growth and increasing complexity is managed, to the risks involved and the mitigation measures taken. The SB also extensively discussed with the BoM the organizational structure of the company, which remains an important element in supporting the further growth of the company. The same goes for development of ASML employees, leadership development and talent attraction and retention and recruitment, which was also a topic discussed regularly in the SB meetings. The SB considers it of vital importance that the company is able to employ the right people and that new employees are onboarded as quickly and effectively as possible, during which time the employees are not only made aware of internal processes and procedures, but also ASML's core values as described in its Code of Conduct. Special attention was paid to talent management and people development in general, as well as to succession planning for the Board of Management and senior management in particular.
In November, the SB paid a three day visit to China and Taiwan. As China is becoming an increasingly important market for ASML, the SB wanted to be informed firsthand about market developments, customers, risks and opportunities for the company in the short and long term. In Taiwan the SB was provided with an update on the business in general and in particular on HMI and the status of the integration.
A recurring item on the SB's agenda is a review of developments in the semiconductor market and the customer domain, financial performance and the development of ASML’s share price and analyst perceptions.
Other topics addressed by the SB were the annual budget and the quarterly results and accompanying press releases, as well as the outcomes of the year-end US GAAP and IFRS-EU audits. The SB reviewed the financing of ASML, including the long-term financial plan and ASML’s capital return policy, and approved the BoM’s dividend proposals for the financial years 2017 and 2018. The SB provided advice to the BoM in relation to the share buyback program, which was announced on January 17, 2018. The SB also reviewed ASML’s annual and interim financial statements, including non-financial information, prior to publication thereof.
ASML INTEGRATED REPORT 2018
65
A considerable amount of attention was paid to a review of ASML’s risk landscape as well as the measures required to mitigate such risks. Part of a significant review of our risk-management approach were the assessment and mitigation of risks resulting from the aforementioned rapid growth of ASML and related operational and organizational challenges, as well as of risks related to ASML's supply chain, as part of which the SB reviewed ASML's supplier risk-management process. In December 2018, ASML was confronted with a risk in its supply chain when a major fire destroyed a large part of the production facility of Prodrive Technologies, an important supplier of ASML. As a result of having the right processes in place, the company was able to react quickly and could start working immediately with Prodrive to mitigate the impact of the fire. Nonetheless, the risks in the supply chain will remain an important point of attention for the SB. The SB also closely followed developments in the legal proceedings between ASML and Nikon and also paid attention to the potential impact on ASML of increasing international trade tensions.
Furthermore, the SB reviewed and discussed ASML's IP strategy and its operational strategy, including global footprint. Corporate responsibility strategy was another topic discussed by the SB and its Remuneration Committee, as this is a long-term qualitative target for the BoM. The SB monitored compliance with rules and regulations including the Dutch Corporate Governance Code.
The SB also extensively discussed its own composition and profile, the composition of its Committees and the composition of the BoM, as well as the remuneration of the BoM and the SB. Reference is made to the Reports of the Selection and Nomination Committee and the Remuneration Committee as included in this Supervisory Board Report.
A SB delegation held two formal meetings with the Works Council in 2018. This year the SB and the Works Council exchanged views on the rapid growth of the Company and the effects thereof on the Company as a whole and in particular on the company culture and its core values. In addition, the onboarding processes and the effectiveness thereof were discussed and evaluated. Furthermore, the meetings generally focused on the strategy and overall performance of ASML, particularly in EUV, the composition of the SB and the BoM, the Remuneration Policy for the BoM, the alignment of remuneration policies for senior management and the job grades below that level, long-term value creation, and our strategy and business-development process. Finally, the SB and the Works Council reflected on their perspectives on their future cooperation, as a new Works Council was installed on November 14, 2017.
An SB delegation and the Works Council also discussed the nomination for appointment to the SB of Ms. Kelly, who was appointed per the 2018 AGM and for whose position the Works Council had an enhanced right of recommendation.
Meetings and Attendance
In 2018, the SB held eight meetings. Of these meetings, three were held at the company's headquarters in Veldhoven, one was at an off-site where the primary focus was on strategy, one was at an off-site meeting in China and Taiwan focused on the Chinese market and three were held via telephone conference. In addition to these meetings, there were several informal meetings and telephone calls among SB and/or BoM members.
The SB meetings and the SB committee meetings are held over several days, ensuring there is time for review and discussion. At each meeting, the SB members discuss among themselves the goals and outcome of the meeting, as well as topics such as the functioning and composition of the SB and the BoM. Also discussed during each meeting are the reports from the Committees of the Supervisory Board.
The SB meetings and the meetings of the four SB committees were well attended
. See table below for a full overview of SB members’ meeting attendance.
Most BoM members were present for the SB meetings. Besides the formal meetings, SB members were in regular contact with the BoM and its individual members.
ASML INTEGRATED REPORT 2018
66
Supervisory Board members’ meeting attendance
|
SB member
|
SB
|
Audit Committee
|
Remuneration Committee
|
Selection and Nomination Committee
|
Technology Committee
|
|
|
|
|
|
|
|
|
Annet Aris
1
|
8/8
|
n/a
|
1/1
|
2/2
|
5/5
|
|
Douglas Grose
|
8/8
|
n/a
|
n/a
|
3/3
|
5/5
|
|
Gerard Kleisterlee
2
|
8/8
|
8/9
|
n/a
|
3/3
|
5/5
|
|
Pauline van der Meer Mohr
3
|
2/3
|
3/4
|
n/a
|
0/1
|
n/a
|
|
Hans Stork
|
8/8
|
n/a
|
5/5
|
n/a
|
5/5
|
|
Rolf-Dieter Schwalb
|
8/8
|
9/9
|
5/5
|
n/a
|
n/a
|
|
Carla Smits-Nusteling
|
8/8
|
9/9
|
n/a
|
n/a
|
n/a
|
|
Wolfgang Ziebart
4
|
8/8
|
5/5
|
1/1
|
n/a
|
5/5
|
|
Terri Kelly
5
|
5/5
|
n/a
|
4/4
|
n/a
|
n/a
|
|
|
|
|
|
|
|
|
1.
|
As per 25 April 2018 Ms. Aris retired from the Remuneration Committee and joined the Selection and Nomination Committee.
|
|
2.
|
Mr. Kleisterlee is not a member of the Audit Committee, but attends the Audit Committee meetings whenever possible.
|
|
3.
|
Ms. Van der Meer Mohr retired by rotation at the 2018 AGM.
|
|
4.
|
As per 25 April 2018 Mr. Ziebart retired from the Remuneration Committee and joined the Audit Committee.
|
|
5
|
Ms. Kelly was appointed at the 2018 AGM.
|
For further details on the structure, organization and responsibilities of the SB, see
Corporate Governance - Supervisory Board
.
Composition, Diversity and Independence
To ensure an appropriate and balanced composition, the SB spends considerable time discussing its (future) composition as well as its rotation schedule on an ongoing basis. The SB attaches great importance to its composition, independence and diversity in the broadest possible sense and strives to meet all the associated guidelines and requirements. In order to properly perform its tasks the SB considers it to be very important that its members are able to act critically and independently of one another, the BoM and other stakeholders. All current members of the SB are fully independent as defined by the Code, and such independence is annually assessed by the members of the SB by means of a statement addressing the relevant requirements for independence. The current composition of ASML’s SB is diverse in terms of gender, nationality, knowledge, experience and background. It also meets the Dutch statutory requirements aimed at ensuring a balanced representation of men and women.
The SB has formulated a diversity policy, which is included in the Profile of the Supervisory Board as published on the Website.
Per the 2018 AGM, Mr. Stork's and Ms. Van der Meer Mohr's term of appointment expired. The SB nominated Mr. Stork for reappointment because of his contribution to the SB, especially given his background and experience in various industries, including the semiconductor industry, and in various roles. At the 2018 AGM, Mr. Stork was reappointed for a second term of four years. Ms. Van der Meer Mohr had already indicated at the 2017 AGM that she would not be available for reappointment.
The SB decided to nominate Ms. T.L. (Terri) Kelly for appointment per the 2018 AGM. The decision to nominate Ms. Kelly was due to her background and experience as the CEO of an innovative, multinational business with a long-term orientation, as well as her experience in the area of organizational and leadership development. ASML's Works Council used its enhanced recommendation right for the nomination of Ms. Kelly. At the 2018 AGM, Ms. Kelly was appointed for a first term of four years.
Per the 2019 AGM, the appointment terms of Ms. Aris and Messrs. Kleisterlee, Schwalb and Ziebart will expire. All have informed the SB that they are available for reappointment. Taking into consideration their valuable contribution to the company and the Supervisory Board in particular, the SB intends to propose to the General Meeting of Shareholders to reappoint Ms. Aris and Messrs. Kleisterlee, Schwalb and Ziebart. For the intended nomination of Ms. Aris the Works Council has an enhanced recommendation right. As regards Mr. Ziebart, given that he has been a member of the SB since 2009, the SB considers it desirable to reappoint Mr. Ziebart in particular because of his background and experience in various industries, including the semiconductor industry, and in various roles. Mr. Ziebart has proved himself to be a valuable contributor to the SB, which has benefited from his knowledge, experience and leadership capabilities.
For further information and background on the members of the SB, including details on nationality, gender and age, please see the SB members’ information in
Supervisory Board Report - Supervisory Board
.
ASML INTEGRATED REPORT 2018
67
Evaluation
The SB greatly values the structural and ongoing evaluation process as a means of ensuring continuous improvement in our way of working. Each year, the SB, assisted by the Selection and Nomination Committee, evaluates the composition, competence and functioning of the SB and its committees, the relationship between the SB and the BoM, its committees, its individual members, the chairpersons of both the SB and the committees, as well as the composition and functioning of the BoM and its individual members, and the education and training needs for the SB and BoM members. The SB and its Committees conducted its annual self-assessment at the end of 2018. The self-evaluation was carried out in cooperation with an external party and using a web-based survey. Also, one-on-one meetings were held between the SB Chairman and the individual members. The results of the self-evaluation were discussed at the start of 2019 by the full SB as well as in the committees. This led to the conclusion that the SB and its committees continue to function well. Several suggestions were made to further improve the functioning of the SB, including recommendations to optimize the balance between the discussion of recurring items and deep dives into certain topics by the SB.
The BoM also conducted a self-evaluation in 2018, focusing on the functioning of the BoM collectively as well as on the functioning of the individual BoM members. This self-evaluation was performed with the assistance of an external adviser, who conducted interviews with each of the BoM members. Furthermore, the BoM discussed its functioning in a meeting especially set up for this purpose. The conclusion of the self-evaluation was that ASML has a well-functioning BoM; some suggestions were made in relation to strengthening the individual feedback loops. These recommendations will be implemented in 2019.
Supervisory Board Committees
For information on the roles and responsibilities of the SB committees, see
Corporate Governance - Supervisory Board - Composition and role of the four committees of the Supervisory Board
.
Audit Committee
The current members of the Audit Committee are Ms. Smits-Nusteling (Chairperson), Messrs. Schwalb and Ziebart. Mr. Kleisterlee attends the Audit Committee meetings whenever possible. The members of the Audit Committee are all independent members of the SB. The SB has determined that both Ms. Smits-Nusteling and Mr. Schwalb qualify as an Audit Committee financial expert pursuant to Section 407 of the Sarbanes-Oxley Act and the rules promulgated thereunder as well as pursuant to Dutch statutory rules, taking into consideration their extensive financial backgrounds and experience.
The Audit Committee held nine meetings in
2018
.
The Audit Committee’s focus in
2018
was, among other things, overseeing the integrity and quality of our financial reporting and the effectiveness of the internal risk management and internal control systems. The Audit Committee reviewed the Company’s annual and interim financial statements, including non-financial information, the quarterly results and the accompanying press releases as well as the outcomes of the year-end US GAAP and IFRS-EU audits. The operational short and long-term performance was also discussed extensively, with a focus on various performance scenarios and their impact on ASML’s results, cash generation, and financing and capital return policies. The Audit Committee also performed accounting deep dives focused on revenue recognition disclosures and balance sheet treatment, a deep dive on the internal controls framework and a review of the balance sheet.
The Audit Committee extensively discussed the effectiveness of the internal control framework in accordance with the US Sarbanes-Oxley Act. This included monitoring the scoping, framework updates, control execution and control assessments. The Audit Committee discussed management’s assessment of the results from the test of design and test of effectiveness of internal controls over financial reporting.
Furthermore, the Audit Committee reviewed and approved the audit plans of the internal and external auditors, including scoping, materiality levels and the fees of the external auditor. The Audit Committee monitored the progress of the internal and external audit activities including review of observations identified as a result of the internal audit activities over the quarter, quarterly procedures performed by the external auditor, and the audit performed at year-end by the external auditor. The Audit Committee oversaw the follow-up by the BoM on the recommendations made in the internal and external management letters. The Audit Committee also evaluated the performance of the external auditor at the end of 2018, including a review of their independence.
The Audit Committee closely monitored risk management and the risk-management process, including the timely follow-up of high-priority actions based on quarterly progress updates. The Audit Committee also discussed compliance, for instance in relation to the implementation of GDPR, as well as the compliance function at ASML.
The Audit Committee reviewed and provided the SB with advice regarding the financing of ASML, including the long-term financial plan and ASML’s capital return policy, the dividend proposal in respect of the 2018 financial year and the implementation of the 2018-2019 share buyback program.
The Audit Committee (and the SB) fully supports ASML’s principles regarding its current and future financing and capital return policies, which helps ASML to respond to the cyclical nature of the semiconductor equipment industry.
Other recurring agenda items in 2018 related to ASML’s tax policy and planning and ASML’s management of the IT landscape and the containment of any risks identified in that respect, as well as the IT security risks, roadmap and related activities. Also, the
ASML INTEGRATED REPORT 2018
68
Audit Committee regularly discussed the so-called Future Mode of Operations project aimed at re-engineering ASML's business processes given the increased size and complexity of ASML.
After each in-person meeting, the Audit Committee held one-to-one meetings with the CFO, and with the external and internal auditors. The external auditor and the internal auditor attended all Audit Committee meetings.
With respect to the external auditor’s communication over the 2018 financial year, the Audit Committee confirms that the communication contained no significant items that need to be mentioned in this report.
Remuneration Committee
The current members of the Remuneration Committee are Mr. Schwalb (Chairman), Ms. Kelly and Mr. Stork, each of whom is an independent, non-executive member of our SB in accordance with the NASDAQ Listing Rules. Mr. Schwalb is neither a former member of our BoM, nor a member of the management board of another company. Currently, no member of the Remuneration Committee is a member of the management board of another Dutch listed company.
In
2018
, the Remuneration Committee held five meetings.
In 2018 the Remuneration Committee reviewed the group of companies used for reference for BoM remuneration and used this information to set a benchmark and perform scenario analyses. Where applicable, this was debated and used to make recommendations to the SB concerning the total remuneration package of the BoM and the variable remuneration consisting of an STI in cash and an LTI in shares as well as the assessment of the shareholding positions of the BoM based upon the share ownership guideline of the Remuneration Policy. Furthermore, the Remuneration Committee recommended to the SB to update the Remuneration Policy for the BoM; the SB intends to submit a proposal for an updated Remuneration Policy for adoption by the General Meeting of Shareholders during the 2019 AGM. The Remuneration Committee also reviewed the
Remuneration Report
as part of the SB Report and
Other Appendices - Appendix - Board of Management and Supervisory Board Remuneration
, which details the remuneration of members of the SB and the BoM.
Working with the Audit Committee and the Technology Committee, the Remuneration Committee reviewed the STI and LTI targets for the BoM and proposed
2018
targets to the SB. It also provided recommendations to the SB regarding the achievement of the
2017
targets and related compensation levels for the BoM members in
2018
.
The Remuneration Committee also performed a reference group review and benchmark for the SB remuneration together with an external adviser. This review and benchmark resulted in a recommendation by the Remuneration Committee to the SB to adjust the remuneration of the SB. The SB intends to submit this proposed adjustment to the General Meeting of Shareholders at the 2019 AGM.
The external auditor performs certain agreed-upon procedures with respect to the execution of the Remuneration Policy.
For further details, see
Supervisory Board Report - Remuneration Report
.
Selection and Nomination Committee
The current members of the Selection and Nomination Committee are Mr. Kleisterlee (Chairman), Mr. Grose and Ms. Aris, each of whom is an independent, non-executive member of our SB in accordance with the NASDAQ Listing Rules.
The Selection and Nomination Committee held four meetings in 2018.
ASML INTEGRATED REPORT 2018
69
In 2018 there were several changes in composition of the BoM, the SB and the SB Committees, which were discussed at length by the Selection and Nomination Committee as well as by the full SB. At the 2018 AGM Mr. Dassen and Mr. Fouquet were appointed as members of the BoM. Mr. Dassen succeeded Mr. Nickl as Executive Vice President and CFO of the company and Mr. Fouquet was added to the BoM, as a result of which the BoM expanded from five to six members. In addition, certain changes were made to the division of tasks within the BoM, with Mr. Fouquet becoming responsible for ASML's EUV business and Mr. Van Hout assuming the role of Chief Strategy Officer and head of Strategic Supplier Relations. In addition, Messrs Wennink, Van den Brink and Schneider-Maunoury were reappointed effective as of the 2018 AGM. The SB acknowledges that the BoM is not considered to be balanced within the meaning of Dutch law, as it does not consist of at least 30% women. The SB recognizes the importance of diversity and the benefits it brings to the company. When searching for suitable candidates for the BoM, candidates are considered on merit against objective criteria and the specific profile for the job, while having due regard for the relevant aspects of diversity, in particular gender diversity. In the search for a new CFO, which took place in 2017 and 2018, diversity aspects, especially gender, were included in the profile for this position. As a result, several female candidates were included on both the long list and the short list. After following due process to determine which candidate would be the best fit for ASML, the SB unanimously selected Mr. Dassen. The company does have the ambition to meet the requirements of balanced gender representation as applicable for Dutch companies. The company has a specific program to improve gender diversity, getting women more interested in science, engineering and technology and to grow them into (senior) management positions. With respect to the SB, Ms. Kelly was appointed as a member based on the enhanced recommendation right of the Works Council, and Mr. Stork was reappointed for a second term. The Selection and Nomination Committee also discussed the intended nomination for reappointment of Messrs. Kleisterlee, Schwalb, Ziebart and Ms. Aris, whose terms will expire per the 2019 AGM. Furthermore, the Selection and Nomination Committee also discussed the composition of the BoM and the SB in the longer term. As part of that discussion, the Selection and Nomination Committee paid special attention to the current and desired profile of the SB, the competences represented in the SB as well as the rotation schedule to prevent too many simultaneous rotations of SB members. Other topics of discussion in 2018 were the functioning of the individual members of the SB and the BoM, the outcome of the SB’s self-evaluation in 2017 and the 2018 self-evaluation process. For further details on the self-evaluation, see Supervisory Board Report - Evaluation. The Selection and Nomination Committee also spent ample time discussing management development and succession planning of the BoM and senior management.
As part of its responsibility to monitor corporate governance developments, the Selection and Nomination Committee paid attention to, among other things, the status of the implementation by the Dutch legislator of the revised EU Shareholder Rights Directive, which implementation is scheduled to take place in the course of 2019.
Technology Committee
The current members of the Technology Committee are Mr. Grose (Chairman), Ms. Aris, Mr. Kleisterlee, Mr. Stork, and Mr. Ziebart.
The Technology Committee held five scheduled meetings in
2018
.
In 2018 the Technology Committee focused on the execution and implementation of technology programs in EUV (including High NA), DUV and Applications. The Technology Committee also discussed the technology targets and the achievements related thereto, and provided the Remuneration Committee and the SB with advice in this area.
With respect to EUV, special attention was paid to further improving the operational performance of the EUV systems. In DUV, the Technology Committee focused on cost reduction and maintaining our competitive market position. For Applications, the integration of HMI was the primary point of attention.
To further increase its knowledge and understanding of technological developments relevant to ASML, the Technology Committee invited external speakers on specific technological areas relevant for ASML.
Remuneration of the Supervisory Board
For information on the remuneration of the SB, please see
Corporate Governance - Supervisory Board - Remuneration of the Supervisory Board
.
A Word of Thanks to ASML Employees
The Supervisory Board would like to extend a word of gratitude to all ASML employees, either working on a fixed or temporary basis. In a dynamic and demanding environment, the success of ASML depends on being able to deliver our cutting-edge technology to the customer. With your hard work and constant focus, you've contributed greatly to another successful year for ASML.
ASML INTEGRATED REPORT 2018
70
The Supervisory Board,
Gerard Kleisterlee, Chairman
Douglas Grose, Vice Chairman
Annet Aris
Terri Kelly
Carla Smits-Nusteling
Rolf-Dieter Schwalb
Hans Stork
Wolfgang Ziebart
Veldhoven,
February 5, 2019
ASML INTEGRATED REPORT 2018
71
Remuneration Report
The SB, on recommendation of the Remuneration Committee, determines the remuneration of the members of the BoM.
The Remuneration Policy was adopted by the AGM on April 26, 2017 and applies as from January 1, 2017 onwards.
In this Remuneration Report, an overview is provided of the Remuneration Policy for the BoM and the application thereof in 2018.
For details regarding the remuneration of the BoM in
2018
, see
Other Appendices - Appendix - Board of Management and Supervisory Board Remuneration
.
Remuneration policy
The Remuneration Policy supports the long-term development of the company in a highly dynamic environment, while aiming to fulfill all stakeholders’ requirements and keeping an acceptable risk profile. More than ever, the challenge for us is to drive technology, to serve our customers and to satisfy our stakeholders. These drivers are the backbone of the Remuneration Policy. The SB ensures that the policy and its implementation are linked to the company’s objectives.
The objective of the Remuneration Policy is to enable ASML to attract, motivate and retain qualified industry professionals for the BoM in order to define and achieve our strategic goals. The policy acknowledges the internal and external context as well as our business needs and long-term strategy. The policy is designed to encourage behavior that is focused on long-term value creation, while adopting the highest standards of good corporate governance. The policy is aimed at motivating for outstanding achievements, using a combination of non-financial and financial performance measures. Technology leadership and customer value creation are the key drivers of sustainable returns to our shareholders.
The policy is built on the following principles:
|
•
|
Transparent - The policy and its execution are clear and practical;
|
|
•
|
Aligned - The Remuneration Policy is aligned with the policy for ASML senior management and other ASML employees;
|
|
•
|
Long-term oriented - The incentives focus on long-term value creation;
|
|
•
|
Compliant - ASML adopts the highest standards of good corporate governance; and
|
|
•
|
Simple - The policy and its execution are as simple as possible and easily understandable to all stakeholders.
|
Reference group and market positioning
We offer a remuneration package that is competitive as compared to a relevant labor market. To define this market, a reference group is created, consisting of companies that are comparable to us in terms of size and complexity, data transparency and geographical area. For as long as ASML is positioned around the median of the group of companies with respect to size (measured by enterprise value, revenue and number of employees), the median market level may serve as a reference in determining the level of pay for the BoM.
The reference group consists of the following companies:
|
Reference group composition
|
|
|
|
|
|
AkzoNobel
|
Leonardo-Finmeccanica
|
|
Alstom
|
Linde
|
|
Continental
|
Nokia
|
|
Covestro
|
Philips
|
|
DSM
|
Schindler
|
|
Essilor
|
Shire
|
|
Evonik
|
Smith & Nephew
|
|
Gemalto
|
Solvay
|
|
Givaudan
|
UCB
|
|
Infineon Technologies
|
Yara International
|
|
Legrand
|
|
|
|
|
In principle, a benchmark assessment is conducted every 2 years. In the year without a market assessment, the SB considers the appropriateness of any change of base salary on the market environment as well as the salary adjustments for other ASML employees. To ensure an appropriate composition of the relevant labor market, the SB reviews the composition of the reference group in conjunction with the frequency of the benchmark. Substantial changes applied to the composition of the reference group will be proposed to the shareholders
.
Total direct compensation
The remuneration levels are determined using the total direct compensation. Total direct compensation consists of base salary, an STI and an LTI. Each component and corresponding performance measures are described in this section.
Other remuneration elements are pension and expense reimbursements. The latter may include company car costs, travel expenses, representation allowances, housing costs (gross amount before taxes), social-security costs, and health and disability insurance costs.
ASML INTEGRATED REPORT 2018
72
Base salary
The policy prescribes a benchmark that will be conducted for the total direct compensation level. The base salary of BoM members is derived from this level.
Variable income
The performance parameters are set by the SB and consist of financial and qualitative measures. The SB may adjust the performance measures and their relative weighting of the variable income based on the rules and principles as outlined in this policy, if required by changed strategic priorities in any given year.
The SB assesses the extent to which performance standards are met at the end of a performance period.
|
Variable compensation (on-target)
|
Presidents
|
Other Board members
|
|
|
|
|
|
STI
|
65%
|
65%
|
|
LTI
|
100%
|
85%
|
|
Total variable compensation as % of base salary
|
165%
|
150%
|
|
|
|
|
In order to comply with the highest standards of Corporate Governance, the appropriate claw-back and change-in-control provisions are incorporated in the employment contracts and management services contracts of all members of the BoM.
The SB has the discretionary power to adjust the incentive pay-out upward or downward if it feels that the outcome is unreasonable due to exceptional circumstances during the performance period (‘ultimum remedium’). Scenario analyses of the possible outcomes of the variable remuneration components and their effect on the remuneration of the BoM are conducted.
Short-term incentive
The STI refers to the annual performance-related cash incentive that is applicable to all members of the BoM. The target level of the STI is set at 65 percent of base salary for all members. In case of excellent performance the maximum opportunity amounts to 150 percent of target.
In order to achieve alignment in the remuneration structure of the BoM and other ASML employees, the policy includes a modifier on the STI pay-out that is connected to the profit-sharing program for employees. In applying the modifier, the SB will take into account the pay-out under the profit-sharing scheme for all ASML employees. The modifier enables the SB to discretionary adjust the STI pay-out of the BoM upward with 10 percent or downward with 20 percent of base salary.
For the STI the following criteria are set:
|
Performance Measure
|
Weight
|
|
|
|
|
Qualitative
|
|
|
Technology Leadership Index
|
20%
|
|
Market position
|
20%
|
|
|
|
|
Financial
1
|
60%
|
|
Total
|
100%
|
|
|
|
|
1.
|
Every year, prior to the performance period, the SB chooses several financial measures, depending on business challenges and circumstances, with a total weight of 60 percent.
|
ASML INTEGRATED REPORT 2018
73
The financial measures are chosen from the below list. The SB may still deviate from this list when necessary, given any specific challenges in a given year, but will as much as possible choose measures from the pre-defined list. The actual financial performance criteria selected for the financial years
2018
and 2019 are set out in
Other Appendices - Appendix - Board of Management and Supervisory Board Remuneration
.
|
Measure
|
Description
|
|
|
|
|
Sales
|
Total net sales as included in the US GAAP Consolidated Financial Statements
|
|
Gross Margin
|
Gross Profit as a percentage of total net sales
|
|
R&D opex
|
R&D costs as included in the US GAAP Consolidated Financial Statements
|
|
SG&A opex
|
SG&A costs as included in the US GAAP Consolidated Financial Statements
|
|
EBITDA Margin %
|
Income from operations (plus depreciation and amortization) as percentage of total net sales
|
|
EBIT Margin %
|
Income from operations as percentage of total net sales
|
|
Net Margin %
|
Net income as a percentage of total net sales
|
|
Free Cash Flow
|
Cash flow from operations minus purchases of property, plant and equipment and intangible fixed assets
|
|
Cash Conversion Cycle
1
|
Days Inventory Outstanding + Days Sales Outstanding -/- Days Payable Outstanding
|
|
Capital Expenditures
|
Investment in property, plant and equipment
|
|
|
|
|
1.
|
The SB could also decide to focus on certain elements of Cash Conversion Cycle in any year, i.e. Days Inventory Outstanding, Days Sales Outstanding and / or Days Payable Outstanding, instead of Cash Conversion Cycle only.
|
Days Inventory Outstanding = Average (last 4 quarters) annual inventory divided by last 4 quarters cost of sales.
Days Sales Outstanding = Average (last 4 quarters) accounts receivable divided by last 4 quarters total net sales.
Days Payable Outstanding = Average (last 4 quarters) accounts payable divided by last 4 quarters cost of sales.
The performance measures form a balanced mix of financial (60 percent) and other business measures (40 percent).
For each of the performance criteria the SB sets challenging, but realistic target levels. The target-setting and performance review occur on an annual basis, except for circumstances where the SB considers semi-annual target-setting more appropriate. All performance measures are set in advance and will not change during the performance period.
The pay-out levels are prorated upon the level of achievement of the aforementioned performance criteria. Below threshold performance, there is no pay-out. Meeting threshold performance will result in a pay-out of 50 percent of target pay-out. In case of excellent performance, the maximum pay-out is capped at 150 percent of the target pay-out. The STI is paid on an annual basis.
Long-term incentive
The LTI refers to the share-based incentive. All members of the BoM are eligible to receive performance-related shares. The target level of the LTI is set at 100 percent of base salary for the Presidents and 85 percent for the other members of the BoM. In case of excellent performance the maximum opportunity amounts to 200 percent of target.
The performance shares are conditionally granted on an annual basis to the members of the BoM. The shares will become unconditional depending on the achievement of predetermined performance targets during a three-year period. Each performance cycle starts on the first day of the year of grant. The number of performance shares to be conditionally awarded is calculated at the beginning of this period using the volume-weighted average share price during the last quarter of the year preceding the conditional award.
Performance measures
Three types of performance measures relate to the LTI:
|
•
|
ASML’s total shareholder return compared to a reference index.
|
|
•
|
ASML’s ROAIC compared to a pre-defined target to be set by the SB prior to the performance period.
|
|
•
|
Long-term strategic qualitative targets to ensure ASML’s ability to keep performing at high standards. Depending on the strategic requirements the definition and relative weight may change upon the discretion of the SB:
|
•
Technology Leadership Index
•
Sustainability
The definition of the total shareholder return target and calculation is as follows:
|
•
|
ASML’s relative change in share price, plus dividends paid over the relevant performance period. The total shareholder return is calculated as the difference between (i) the average (closing) share price during the last quarter of the performance period and (ii) the average (closing) share price during the quarter preceding the performance period; in the calculation, dividends are reinvested at the ex-dividend date. The total shareholder return of ASML (calculated with the ASML New York share) is compared to the PHLX Semiconductor Sector Index. This NASDAQ index is designed to track the performance of a set of companies engaged in the design, distribution, manufacture, and sale of semiconductors. There are two versions of this index, a price return index and a total return index, the latter of which is chosen (NASDAQ: X.SOX), since this index reinvests cash dividends, equivalent to the total shareholder return definition described above).
|
ASML INTEGRATED REPORT 2018
74
The definition of the ROAIC target and calculation is as follows:
|
•
|
ASML’s rate of return on capital it has put to work, regardless of the capital structure of the company. It is used as a fundamental metric to measure value creation of the company. The ROAIC is calculated by dividing the Net Operating Profit After Tax by the Average Invested Capital.
|
The aforementioned performance measures receive the following weights:
|
LTI performance measures
|
Weight
|
|
|
|
|
ROAIC
|
40%
|
|
Total shareholder return
|
30%
|
|
Technology Leadership Index
|
20%
|
|
Sustainability
|
10%
|
|
Total
|
100%
|
|
|
|
Performance incentive zone
The vesting of performance shares depends on the relative total shareholder return as compared to the aforementioned index, the ROAIC performance as compared to the pre-defined target and the evaluation of the qualitative targets by the SB. The vesting will be calculated at the end of the three-year performance period for all performance measures, based on a predefined pay-out matrix.
|
Performance ASML vs PHLX Index
(total shareholder return ASML -/- total shareholder return X.SOX) |
Pay-out as a % of target
|
|
|
|
|
≥ 20%
|
200%
|
|
Between 0% and 20%
|
Linear between 100% and 200%
|
|
Between -20% and 0%
|
Linear between 50% and 100%
|
|
< -20%
|
0%
|
|
|
|
For ROAIC, the Technology Leadership Index and Sustainability targets, the same principle of threshold, target and maximum levels applies as for the STI, with the maximum pay-out equal to 200 percent of target. The SB, in cooperation with the relevant subcommittees (Technology Committee, Audit Committee and Remuneration Committee) will assess the performance achieved against ROAIC and the qualitative targets. Both the STI and LTI make use of the Technology Leadership Index as a qualitative performance measure. The objective is equal, but the applicable measures, targets and performance periods are different and aligned with specific short- and long-term strategic priorities.
Grant date
Performance shares will be granted two days after the publication of ASML’s annual results in January of the year in which the three-year performance period starts.
Holding period
The minimum holding period is two years after the vesting date. Upon termination of the employment contracts / management services contracts the transfer restrictions will remain in place during the holding period except in case of decease.
In case a tax payment is due by the members of the BoM over the retrieved variable income, performance shares may be partially sold at vesting (‘sell to cover’) in accordance with the law and internal regulations.
Share ownership guidelines
Members of the BoM are required to hold at least the value of two times base salary in the form of shares; for the two Presidents this is three times base salary. This ensures an alignment of the interests of members of the BoM with long-term value creation throughout their employment with / services for the Company. The Remuneration Committee of the SB will (i) after each financial year, determine the value of ASML shares then held by the individual members of the BoM, based on the shareholding data of the members of the BoM (to be) published in the Integrated Report over that year, (ii) include vested ASML shares that are still in the holding period when determining the value of the ASML shares held by the individual members of the BoM, (iii) not define penalties upfront should the value of ASML shares held by a member of the BoM be lower than agreed, but determine potential penalties by using its discretionary judgment, thereby taking into consideration all relevant circumstances, and (iv) allow new members of the BoM time to meet the share ownership requirements (three years, depending on the actual situation).
Other remuneration
Benefits
The pension arrangement for the BoM is based on the ‘excedent’ (supplementary) arrangement for our employees in the Netherlands. The plan is a defined contribution opportunity as defined in Dutch fiscal regulations. The total defined contribution is a percentage of the pensionable salary and depends on the participants’ age at the beginning of the year. The total net contribution is according to the maximum level as allowed by Dutch fiscal legislation, of which the participant contributes 3.9 percent of his pension base.
ASML INTEGRATED REPORT 2018
75
Dependents pension and disability pension are insured on a risk basis, the premium of which is paid by ASML. As a guiding principle, the value of the pension arrangement is set at the median of executive pensions in the Netherlands using a general industry sample of companies.
Severance payment
All employment agreements, respectively management services agreements, with members of the BoM contain specific provisions regarding benefits upon termination of those agreements. If the Company gives notice of termination of the agreement for reasons which are not exclusively or mainly found in acts or omissions on the side of the BoM member, a severance amount equal to one year base salary will be made available upon the effective date of termination.
This severance payment will also be made available in case of a termination of the agreement of a BoM member with mutual consent between such BoM member and the Company.
Change of control over the company
BoM members are also entitled to the aforementioned severance payment in the event ASML or its legal successor gives notice of termination due to a change of control or if the BoM gives notice of termination, which is directly related to such change of control and such notice is given within twelve months from the date on which the change of control occurs.
For further information, see
Corporate Governance - Other Information on Governance - Severance payments under agreements with members of Board of Management
The change of control provision includes a mitigation of the pay-out under the LTI. This entails that the share price will be fixed on the average of i) the average closing share price over a period of 15 trading days prior to the first public announcement of change in control negotiations and ii) the average share price over a period of 30 trading days prior to the closing of the transaction.
Loans
ASML does not grant any loans or guarantees to any of the members of the BoM.
Other information
Additional information on BoM remuneration in
2018
is included in
Other Appendices - Appendix - Board of Management and Supervisory Board Remuneration
.
ASML INTEGRATED REPORT 2018
76
ASML INTEGRATED REPORT 2018
77

ASML INTEGRATED REPORT 2018
78
General
ASML Holding N.V. is a public limited liability company operating under Dutch law and has a two-tier board structure with a board of management responsible for managing the company under supervision of an independent supervisory board. ASML’s shares are listed on Euronext Amsterdam and NASDAQ.
The address of our registered office is De Run 6501, 5504 DR Veldhoven, the Netherlands (Tel.: +31 40 268 3000).
We endorse the importance of good corporate governance, of which independence, accountability and transparency are the most significant elements. These are also the elements on which a relationship of trust between us and all our stakeholders (employees, customers, suppliers, shareholders and the public) can be built.
We continuously monitor and assess applicable Dutch, US and other relevant corporate governance codes, rules, and regulations. ASML is subject to the Dutch Corporate Governance Code, and because we are listed on NASDAQ, we are also required to comply with the Sarbanes-Oxley Act, as well as NASDAQ Listing Rules, and the rules and regulations promulgated by the SEC.
Our SB and BoM will continue their efforts to ensure that our practices and procedures comply with the applicable rules and regulations, including the Code. This section of the report addresses our corporate governance structure, part of which refers to the principles and best practices set forth in the Code, as well as applicable laws on corporate governance. Our SB and BoM are of the opinion that we comply with all recommendations in the Code.
Board of Management
Role and procedure
ASML’s BoM is responsible for managing ASML, under the chairmanship of the President and CEO, and the vice chairmanship of the President and CTO, which together constitutes a dual leadership. The current BoM comprises 6 members.
Although the various management tasks are divided among the members of the BoM, the BoM remains collectively responsible for the management of ASML, establishing a position on the relevance of long-term value creation for ASML and its business, the deployment of ASML’s strategy, ASML’s risk profile and policies, the achievement of ASML’s objectives, ASML’s results and the corporate social responsibility aspects relevant to ASML.
In fulfilling its management tasks and responsibilities, the BoM considers the interests of ASML and the business connected with it, as well as the interests of ASML’s stakeholders. The BoM is accountable to the SB and the General Meeting of Shareholders for the performance of its management tasks.
The SB supervises and advises the BoM in the execution of its tasks and responsibilities, while the BoM provides the SB with all the information, in writing or otherwise, necessary for the SB to fulfill its duties. Besides the information provided in the regular meetings, the BoM provides the SB with regular updates on developments relating to our business, financials, operations, and industry developments in general.
Important decisions of the BoM that require the approval of the SB are, among others:
|
•
|
ASML’s operational and financial objectives.
|
|
•
|
The strategy designed to achieve the objectives.
|
|
•
|
The parameters to be applied in relation to the strategy designed to achieve the objectives.
|
|
•
|
Corporate responsibility issues that are relevant to ASML.
|
The main elements of the operational and financial objectives, the strategy to achieve the objectives, and the parameters to be applied are included in the
Management Board Report
. The
Management Board Report - Risk Factors
included in this
2018
Integrated Report outlines the sensitivity of the results to both external and internal factors and variables.
The BoM’s rules of procedure include such matters as the general responsibilities of the BoM, the relationship with the SB and various stakeholders, the decision-making process within the BoM, and the logistics surrounding the meetings. The BoM’s rules of procedure are published in the Governance section on our Website.
Appointment, other functions
Members of the BoM are appointed by the SB upon recommendation by the Selection and Nomination Committee and upon notification to the General Meeting of Shareholders. Members of the BoM are appointed for a period of four years, after which reappointment is possible.
The SB may suspend and dismiss members of the BoM, but this can only be done after consulting the General Meeting of Shareholders
.
ASML INTEGRATED REPORT 2018
79
Pursuant to Dutch legislation a member of the BoM may not be a supervisory board member in more than two other large companies (within the meaning of Dutch Corporate Law). A member of the BoM may never be the chairman of a supervisory board of a large company. BoM members may only accept a supervisory board membership of another large company after having obtained prior approval from the SB. Members of the BoM are also required to notify the SB of other important functions held or to be held by them. Currently, no members of our BoM hold more than two supervisory board seats in other large companies and no member of the BoM is a chairman of a supervisory board of a large company.
Dutch legislation provides for statutory provisions to ensure a balanced representation of men and women on the management boards and supervisory boards of companies governed by this legislation. Balanced representation of men and women is deemed to exist if at least 30 percent of the seats are filled by men and at least 30 percent are filled by women. Within the meaning of this legislation, our SB currently qualifies as balanced, but no seats are taken by women on the BoM. As such the BoM would not qualify as balanced. We have the ambition to meet the statutory requirements for ensuring a balanced gender representation. In a technology environment such as the environment ASML operates in this has proven to be challenging. For that reason and in order to increase gender diversity in the BoM, we have a specific program in place to improve gender diversity, aimed at getting women more interested in science, engineering and technology. In this way, we try to increase the number of women throughout ASML and by doing so increase our future talent pool so that more women will be available in the future for technical positions and (senior) management positions. Given the specific nature of our industry, this is a long-term process. Female participation in our total workforce has improved. Our percentage of female employees increased from 11 percent in 2010 to
16 percent
in 2018. For more information on our diversity and inclusion initiatives and performance data, see
Management Board Report - People - Promoting diversity and inclusion
and
Non-Financial Statements - Non-financial Indicators - People
.
ASML Reports
ASML publishes, among others, the following annual reports regarding the financial year
2018
: the Integrated Report comprising the
Management Board Report
and the Financial Statements in accordance with Part 9 of Book 2 of the Dutch Civil Code and IFRS-EU, as well as the SB Report in accordance with the Code; and the Integrated Report on Form 20-F in conformity with US GAAP. Both reports have the same qualitative base and describe the same risk factors that are specific to the semiconductor industry, ASML and ASML’s shares. We also provide sensitivity analyses by providing:
|
•
|
A narrative explanation of ASML’s financial statements.
|
|
•
|
The context within which financial information should be analyzed.
|
|
•
|
Information about the quality, and variability, of our earnings and cash flow.
|
With respect to the process of creating the Integrated Report, we have extensive guidelines for the lay-out and the content of our report. These guidelines are primarily based on applicable laws and regulations. For Dutch statutory purposes, we follow the requirements of Dutch law and regulations, including those on the preparation of the consolidated financial statements in accordance with IFRS-EU. For the Integrated Report on Form 20-F, we apply the requirements of the Exchange Act, and prepare the financial statements included therein in accordance with US GAAP. With respect to the preparation process of these and the other financial reports, we apply internal procedures to safeguard the completeness and accuracy of such information as part of its disclosure controls and procedures.
See also
Management Board Report - Business Risk and Continuity
where ASML’s internal risk management and control systems are discussed.
Code of Conduct
Our Code of Conduct describes what ASML stands for and believes in:
|
•
|
We respect people and planet
.
|
|
•
|
We operate with integrity
.
|
|
•
|
We preserve our assets.
|
|
•
|
We manage professionally.
|
|
•
|
We encourage Speak Up.
|
The Code of Conduct and Business Principles can be found on the Governance section of our Website.
Remuneration of the Board of Management
For detailed information see
Supervisory Board Report - Remuneration Report
and
Other Appendices - Appendix - Board of Management and Supervisory Board Remuneration
.
Indemnification
Our Articles of Association provide for the indemnification of the members of the BoM against claims that are a direct result of their tasks as members of the BoM, provided that such claim is not attributable to willful misconduct or intentional recklessness of such member of the BoM. The SB has further implemented the indemnification of the BoM members by means of separate indemnification agreements for each BoM member.
Conflicts of interest
Conflicts of interest procedures are incorporated in the BoM’s rules of procedure, and reflect Dutch law and the principles and best practice provisions of the Code with respect to conflicts of interest.
ASML INTEGRATED REPORT 2018
80
There have been no transactions in
2018
, nor are there currently any transactions, between ASML or any of ASML’s subsidiaries, or any significant shareholder and any member of the BoM or officer or any relative or spouse thereof, other than ordinary course compensation arrangements.
Supervisory Board
Role and procedure
As mentioned before, our SB supervises the BoM and the general course of affairs of ASML and its subsidiaries. The SB also supports the BoM with its advice. As we have and intend to keep a two-tier structure, the SB is a separate and independent body from the BoM and from ASML.
In fulfilling its role and responsibilities, the SB takes into consideration the interests of ASML and its subsidiaries, as well as the relevant interests of its stakeholders. The SB supervises how the BoM determines its position on the long-term value creation strategy and how the BoM implements that strategy. The SB supervises and advises the BoM in performing its tasks, with a particular focus on:
|
•
|
The achievement of ASML’s objectives.
|
|
•
|
ASML’s corporate strategy and the management of risks inherent to ASML’s business activities.
|
|
•
|
The structure and operation of internal risk management and control systems.
|
|
•
|
The financial reporting process.
|
|
•
|
ASML’s culture and the activities of the BoM in that regard.
|
|
•
|
Compliance with applicable legislation and regulations.
|
|
•
|
The relationship with shareholders and other stakeholders.
|
|
•
|
The corporate social responsibility issues important for ASML.
|
Major management decisions, such as ASML’s strategy, major investments and budget, require the SB’s approval. The SB selects and appoints new BoM members, prepares the Remuneration Policy for the BoM, and decides on the remuneration for the individual members of the BoM. Also, the SB is the body that nominates new SB candidates for appointment and submits remuneration proposals for the SB members to the General Meeting of Shareholders.
The SB, through its Selection and Nomination Committee, closely follows the developments in the area of corporate governance and the applicability of the relevant corporate governance rules for ASML. For a more detailed description on the SB’s activities in the area of corporate governance, see
Supervisory Board Report
.
Meetings and activities of the Supervisory Board
For detailed information on the meetings and activities of the SB in
2018
, see
Supervisory Board Report - Meetings and Attendance
.
The rules of procedure
The SB’s rules of procedure include requirements based on the Code, the Sarbanes-Oxley Act and on any other applicable laws, as well as corporate governance practices developed by the SB over the years. Given the continuous developments in corporate governance, these rules of procedure are subject to regular review. Items covered in these rules include the responsibilities of the SB and its committees, the composition of the SB and its committees, logistics surrounding the meetings, the meeting attendance of members of the SB, and the rotation schedule for these members.
The SB’s rules of procedure also include the charters of the four committees. The SB has assigned some of its tasks and responsibilities to the four committees. That said, the plenary SB remains responsible for the fulfillment of these tasks and responsibilities. The SB and its committees may obtain information from officers and external advisers, if necessary for the execution of its tasks. The committees in particular occasionally call upon external advisers, who assist the committees with preparing the recommendations to be decided upon by the full SB.
The SB’s rules of procedure, as well as the charters of the four committees, are regularly reviewed and, if needed, amended. Changes to the SB’s rules of procedure need to be approved by the full SB. Changes to the charters of the committees are approved by the committee concerned. The Audit Committee charter is reviewed annually to check whether the charter still complies with the applicable rules and regulations, especially those relating to the Sarbanes-Oxley Act. The SB’s rules of procedure, and those of the four committees, were revised in 2017 pursuant to the amended Code and to ensure that our practices and procedures comply with Dutch corporate governance requirements.
Expertise, composition, appointment
The SB currently consists of eight members, the minimum being three members. The SB determines the number of SB members required to perform its functions.
ASML INTEGRATED REPORT 2018
81
The members of the SB show a diverse mix with respect to background, nationality, age, gender and expertise, in line with the diversity policy as included in the current profile drawn up by the SB. The aim of this profile is to ensure that the SB has an international and fitting composition that reflects our global business activities and has a suitable level of experience in the financial, economic, technological, social, and legal aspects of international business. In the case of (re)appointments, the Selection and Nomination Committee checks whether the candidates fit the SB’s profile. See also
Supervisory Board Report - Composition, Diversity and Independence
.
We are subject to the law applicable to large corporations (‘
structuurregime
’). As such, members of the SB are appointed by the General Meeting of Shareholders based on binding nominations proposed by the SB. The SB informs the General Meeting of Shareholders and the Works Council about upcoming retirements by rotation at the AGM in the year preceding the actual retirement(s) by rotation. This ensures they have sufficient opportunity to recommend candidates for the upcoming vacancies. The SB has the right to reject the proposed recommendations. Furthermore, the Works Council has an enhanced right to make recommendations for one-third of the members of the SB. This enhanced recommendation right implies that the SB may only reject the Works Council’s recommendations in limited circumstances: (i) if the relevant person is unsuitable or (ii) if the SB would not be duly composed if the recommended person were appointed as SB member.
The General Meeting of Shareholders may reject binding nominations of the SB by way of a resolution adopted with an absolute majority of the votes cast, representing at least one-third of ASML’s outstanding share capital. If the votes cast in favor of such a resolution do not represent at least one-third of the total outstanding capital, a new shareholders’ meeting can be convened, at which the nomination can be overruled by an absolute majority.
Ms. Aris and Ms. Kelly were (re)appointed as per the Works Council’s enhanced recommendation right.
For newly appointed SB members, an introduction program is prepared, which is aimed at effectively familiarizing new members with all aspects of ASML. SB members are regularly given the opportunity to follow technical tutorials to maintain and increase their knowledge of our ever progressing technology. In addition, specific training is also provided for new committee members based on individual needs. Every year, the SB and / or committees members determine their need for further training on specific topics.
Members of the SB serve for a maximum term of four years from the date of their appointment or a shorter period as per the SB’s rotation schedule. Members can be reappointed, provided that their entire term of office does not exceed 12 years. A member of the SB may be reappointed once for another four-year period. After that, the member may subsequently be reappointed again for a period of two years; this appointment may be extended for a final term of no more than two years. The rotation schedule is available in the Corporate Governance section on our Website.
The General Meeting of Shareholders may, by an absolute majority of the votes representing at least one-third of the total outstanding capital, withdraw its confidence in the SB. This resolution shall result in the immediate dismissal of the entire SB. In such case, the Enterprise Chamber of the Amsterdam Court of Appeal shall appoint one or more members to the SB at the request of the BoM.
Legal restrictions apply to the overall number of executive board positions (including a one-tier board) and supervisory board positions that a member of the supervisory board (or a non-executive director in the case of a one-tier board) of a large company, may hold. None of the members of the SB is in violation of these rules.
For detailed information on the members of our SB, see
Supervisory Board Report - Supervisory Board
.
Role of the Chairman of the Supervisory Board and the Company Secretary
Mr. Kleisterlee is the Chairman of the SB and Mr. Grose is the Vice Chairman. The role and responsibilities of the Chairman of the SB are described in its rules of procedure. The Chairman sets the agenda of the SB meetings, acts as the main point of contact between the SB and the BoM and ensures orderly and efficient proceedings at General Meetings of Shareholders. The Chairman will, among other responsibilities, also ensure that:
|
•
|
The members of the SB follow an introduction and training program;
|
|
•
|
The SB elects a vice chairman;
|
|
•
|
The members of the SB receive all information necessary for the proper performance of their duties on a timely basis;
|
|
•
|
There is enough time for consultation and decision-making by the SB;
|
|
•
|
The committees function properly;
|
|
•
|
The BoM performs activities in respect of culture;
|
|
•
|
The communication with our shareholders is effective;
|
|
•
|
The performance of the members of the BoM and the SB members is assessed at least once a year; and
|
|
•
|
The SB has proper contact with the BoM and the Works Council.
|
The Company Secretary assists the SB in the performance of its duties, ensures that the correct procedures are followed, and that the SB acts in accordance with its legal and statutory obligations. The Company Secretary assists the Chairman of the SB in the organization of the affairs of the SB and its committees. The Company Secretary is appointed by and may also be dismissed by the BoM after prior approval from the SB. The Company Secretary is assisted by a Deputy Company Secretary.
ASML INTEGRATED REPORT 2018
82
Composition and role of the four committees of the Supervisory Board
In the plenary SB meetings, the chairpersons of the four committees report on the issues and items discussed in the committee meetings. In addition, the minutes of the committee meetings are made available to all SB members, enabling the full SB to make the appropriate decisions.
For detailed information on the composition, meetings and activities of the committees of the SB, see
Supervisory Board Report - Supervisory Board Committees
.
Audit Committee
In general, the Audit Committee meets at least four times a year and always before the publication of the quarterly, half-year and annual financial results.
The Audit Committee assists the SB in overseeing the integrity and quality of our financial reporting and the effectiveness of the internal risk management and internal control systems. Frequently discussed topics are the annual results, the audits and the internal and external audit plans and their execution, our internal control systems, including testing of internal controls over financial reporting in light of Section 404, 302 and 906 of the Sarbanes-Oxley Act, our risk management systems, and our financial- and cash position, our long-term financial plan and the supervision of the enforcement of the relevant legislation and regulations.
We provide the Audit Committee with all relevant information to be able to adequately and efficiently supervise the preparation and disclosure of financial information. This includes information on the status and development of the (semiconductor) market to be able to judge the outlook and budget for the next 6-12 months, the application of IFRS-EU and US GAAP, the choice of accounting policies and the work of internal and external auditors. Each year, the Audit Committee discusses and reviews such matters as our financing policy and strategy, tax planning policy, investor relations activities and strategy, fraud policy, and information and communication technology policy.
With regard to internal audit, the Audit Committee reviews the internal audit charter, the internal audit plan and the interaction with the external auditor. As a general rule, the internal auditor attends the Audit Committee meetings and then meets with the Audit Committee after the meeting without management present.
The Audit Committee reviews and approves the external audit plan, including the scope of the audit, the materiality level and the fees of the external auditor, as well as the external auditor’s independence and performance regarding audit and permitted non-audit services. The Audit Committee is the first point of contact for the external auditor if the external auditor discovers irregularities in the content of the financial reports. As a general rule, the external auditor attends the Audit Committee meetings and then meets with the Audit Committee after the meeting without management present to discuss the relationship between the Audit Committee and the external auditor, the relationship between the BoM and the external auditor, and any other matters deemed necessary to be discussed.
In addition to the internal auditor and the external auditor, the Audit Committee generally invites the CEO, CFO, Corporate Controller, Corporate Chief Accountant and Vice-President Corporate Risk and Assurance to its meetings. In general, after each Audit Committee meeting, the Audit Committee also meets with the CFO alone. From time to time, other ASML employees are invited to Audit Committee meetings to address subjects that are of importance to the Audit Committee such as the return policy (including the share buyback program), tax and IT.
Remuneration Committee
In general, the Remuneration Committee meets at least two times a year and more frequently when deemed necessary.
The Remuneration Committee oversees the development and implementation of the Remuneration Policy. In cooperation with the Audit Committee and the Technology Committee, the Remuneration Committee reviews and proposes to the SB corporate goals and objectives relevant to the variable part of the BoM’s remuneration. Before proposing these corporate goals and objectives to the SB for approval, the Remuneration Committee carries out scenario analyses of the possible financial outcomes on the variable remuneration of meeting these goals, as well as exceeding these goals. Also in cooperation with the Audit Committee and the Technology Committee, the Remuneration Committee evaluates the performance of the members of the BoM in view of those goals and objectives, and - based on this evaluation - recommends to the SB appropriate compensation levels for the members of the BoM. In doing so, the Remuneration Committee takes note of the views of the individual members of the BoM with regard to the amount and structure of their own remuneration.
ASML INTEGRATED REPORT 2018
83
Selection and Nomination Committee
In general, the Selection and Nomination Committee meets at least two times a year and more frequently when deemed necessary.
The Selection and Nomination Committee assists the SB with:
|
•
|
Preparing the selection criteria and appointment procedures for members of the SB and BoM.
|
|
•
|
Periodically evaluating the scope and composition of the BoM and the SB, and proposing the profile of the SB in relation thereto.
|
|
•
|
Periodically evaluating the functioning of the BoM and the SB and the individual members of those boards and reporting the results thereof to the SB.
|
|
•
|
Proposing (re)appointments of members of the BoM and the SB, and supervising the policy of the BoM in relation to the selection and appointment criteria for senior management.
|
The Selection and Nomination Committee also discusses developments in corporate governance, for example those based on legislative proposals or revisions of the Code, but also the outcome of the Report of the Monitoring Committee with respect to compliance with the Code.
Technology Committee
The Technology Committee meets at least two times a year and more frequently when deemed necessary.
The Technology Committee provides advice to the SB with respect to our technology plans required to execute our business strategy, including but not limited to, technology trends, the study of potential alternative strategies, the technology strategy, product roadmaps, required technical resources and operational performance in R&D. The Technology Committee makes recommendations to the SB on technology related projects with respect to ASML’s competitive position. In addition, the Technology Committee discusses the technology targets set to measure short- and long-term performance as well as the achievements related thereto, and advises the Remuneration Committee on this topic.
External experts as well as experts from within ASML may act as advisers to the Technology Committee with respect to the subjects reviewed and discussed by this committee. The advisers do not have voting rights, but regularly attend committee meetings (except for those meetings or calls specifically designated to set and / or evaluate technology targets). External experts may include representatives of customers, suppliers and partners to increase the committee’s understanding of the technology and research required to develop our leading-edge systems.
The Technology Committee’s in-depth technology discussions and the subsequent reporting on the main points of these discussions in the full SB increases the SB’s understanding of our technology requirements and enables the SB to adequately supervise the strategic choices we face, including our investment in R&D.
Conflict of interest
Conflict of interest procedures are incorporated in the SB’s rules of procedure, and address Dutch law and the principles and best-practice provisions of the Code with respect to conflicts of interest.
There have been no transactions during
2018
, nor are there currently any transactions, between ASML or any of its subsidiaries, and any other significant shareholder, and any SB member or any relative or spouse thereof other than ordinary course compensation arrangements.
Remuneration of the Supervisory Board
The General Meeting of Shareholders determines the remuneration of the SB members; this remuneration is not dependent on our (financial) results. The SB’s remuneration was last revised in 2017. In addition to their fee as members of the SB, the members are also paid a fee for each committee membership, as well as a net cost allowance. Detailed information on the SB’s remuneration can be found in
Other Appendices - Appendix - Board of Management and Supervisory Board Remuneration
.
No member of the SB personally maintains a business relationship with ASML, other than as a member of the SB.
The members of the SB do not receive ASML shares, or rights to acquire ASML shares, as part of their remuneration. Members who acquire or have acquired ASML shares or rights to acquire ASML shares must intend to keep these for long-term investment only. No member of the SB currently has any ASML shares or rights to acquire ASML shares. In concluding transactions in ASML shares, members of the SB must comply with our Insider Trading Rules.
We have not granted any personal loans, guarantees, or the like to members of the SB. Our Articles of Association provide for the indemnification of the members of the SB against claims that are a direct result of their tasks as members of the SB, provided that such claims are not attributable to willful misconduct or intentional recklessness of the member of the SB. We have also implemented the indemnification of the members of the SB by means of separate indemnification agreements for each member.
ASML INTEGRATED REPORT 2018
84
Shareholders and General Meeting of Shareholders
Powers
A General Meeting of Shareholders is held at least once a year and generally takes place in Veldhoven, the Netherlands. During this meeting, at least the following items are discussed and / or approved:
|
•
|
The written report of the BoM containing the course of affairs at ASML and the conduct of the management over the past financial year.
|
|
•
|
The adoption of the financial statements for the past financial year, as prepared in accordance with applicable laws and regulations.
|
|
•
|
The discharge of the members of the BoM in respect of their management during the previous financial year.
|
|
•
|
The discharge of the members of the SB in respect of their supervision during the previous financial year.
|
|
•
|
Our reserves and dividend policy and justification thereof by the BoM.
|
|
•
|
Each material change in our corporate governance structure. The material changes in our corporate governance structure and ASML’s compliance with the amended Code will be discussed at the AGM of 2019 as a separate agenda item.
|
|
•
|
Any other item the BoM or the SB decide to put on the agenda.
|
The General Meeting of Shareholders also has (with due observance of the statutory provisions) the power:
|
•
|
To resolve to amend the articles of association.
|
|
•
|
To resolve to dissolve ASML.
|
|
•
|
To resolve to issue shares if and insofar as the BoM has not been designated by the General Meeting of Shareholders for this purpose.
|
|
•
|
To resolve to reduce the issued share capital.
|
|
•
|
To appoint members of the SB.
|
|
•
|
To withdraw its confidence in the SB (resulting in a dismissal of the SB in its entirety).
|
|
•
|
To adopt the Remuneration Policy for members of the BoM.
|
|
•
|
To determine the remuneration of the members of the SB.
|
|
•
|
To approve resolutions regarding a significant change in the identity or character of ASML or its business, as referred to in article 2:107 of the Dutch Civil Code.
|
Proposals placed on the agenda by the SB, the BoM, or by shareholders, provided that they have submitted the proposals in accordance with the applicable legal provisions, are discussed and resolved. Shareholders representing at least 1.0 percent of ASML’s outstanding share capital or representing a share value of at least EUR 50.0 million are entitled to place agenda items on the agenda of a General Meeting of Shareholders at the latest 60 days before the date of said meeting.
A recurring agenda item is the limited authorization for the BoM to issue (rights to) shares in ASML’s capital, and to exclude preemptive rights for such issuances. This agenda item typically includes two elements: i) the authorization to the BoM to issue 5.0 percent (rights to) shares of ASML’s issued share capital as of the date of authorization, plus an additional 5.0 percent of ASML’s issued share capital as of the date of authorization that may be issued in connection with mergers, acquisitions and / or (strategic) alliances, and ii) the authorization to exclude preemptive rights in relation to the above share issue, with a maximum of 10.0 percent of ASML’s issued share capital as of the date of authorization.
A simple majority is required for the authorization to issue shares. For the authorization to exclude the preemptive rights, a simple majority is required provided at least 50 percent of ASML’s issued share capital is present or represented at the AGM. Otherwise a majority of two thirds of the votes cast is required. The BoM must obtain the approval of the SB for the issuance of ASML shares as well as for excluding the preemptive rights.
It is important for us to be able to issue (rights to) shares and to exclude the preemptive shareholders’ rights in situations where it is imperative to be able to act quickly, for example when financial opportunities arise. This authorization has been used in the past, especially to optimize our financial position. Given the dynamics of the global capital markets, such financing transactions generally need to be executed within a short window of opportunity. The opportunity to issue shares or rights to shares, such as convertible bonds, would be limited if we needed a resolution of the General Meeting of Shareholders to issue shares and / or to exclude the shareholders’ preemptive rights and may therefore interfere with the financial flexibility of ASML.
As communicated in our press release of January 23, 2019, a proposal will be submitted
to the 2019 Annual General Meeting of Shareholders to declare a dividend in respect of 2018 of EUR 2.10 per ordinary share (for a total amount of approximately EUR 0.9 billion), compared with a dividend of EUR 1.40 per ordinary share paid in respect of 2017.
In addition to dividend payments, we intend to return cash to our shareholders on a regular basis through share buybacks or capital repayment, subject to our actual and anticipated level of liquidity requirements and other relevant factors.
ASML INTEGRATED REPORT 2018
85
On January 17, 2018, we announced a new share buyback program, to be executed within the 2018-2019 time frame. As part of this program, we intend to repurchase approximately
EUR 2.5 billion
of our own shares. We intend to cancel these shares after repurchase, with the exception of up to EUR 2.4 million shares, which will be used to cover employee share plans.
Through
December 31, 2018
, we acquired
7 million
shares under this program for a total consideration of
EUR 1.1 billion
. In January 2019, a number of
5,806,366
ordinary shares were canceled. The share buyback program may be suspended, modified or discontinued at any time.
Voting Rights
We are subject to the relevant provisions of Dutch law applicable to large corporations (the '
structuurregime
'). These provisions have the effect of concentrating control over certain corporate decisions and transactions in the hands of the SB. Members of the BoM are appointed by the SB. The SB shall notify the General Meeting of Shareholders of intended appointments to the BoM. General Meetings of Shareholders will be held at least once a year. We do not solicit from or nominate proxies for our shareholders. However, shareholders and other persons entitled to attend General Meetings of Shareholders may be represented by proxies.
EGMs may be held as often as deemed necessary by the SB or BoM and must be held if one or more ordinary or cumulative preference shareholders jointly representing at least 10 percent of the issued share capital make a written request to that effect to the SB and the BoM specifying in detail the business to be dealt with.
Resolutions are adopted at General Meetings of Shareholders by an absolute majority of the votes cast (except where a different proportion of votes are required by the Articles of Association or Dutch law), and there are generally no quorum requirements applicable to such meetings. In the General Meeting of Shareholders each share confers the right to cast one vote.
Logistics of the General Meeting of Shareholders
The convocation date for the AGM is legally set at 42 days, and the record date at the 28th day prior to the day of the AGM. Those who are registered as shareholders on the record date are entitled to attend the meeting and to exercise other shareholder rights.
The BoM and SB shall provide the shareholders with the facts and circumstances relevant to the proposed resolutions, by way of an explanation to the agenda and other documents necessary and / or helpful for this purpose. All documents relevant to the General Meeting of Shareholders, including the agenda with explanations, shall be posted in the Investors and Governance sections on our Website. The agenda indicates which agenda items are voting items, and which items are for discussion only.
ASML shareholders may appoint a proxy who can vote on their behalf at the AGM. We also use an Internet proxy voting system, thus facilitating shareholder participation without having to attend in person. Shareholders who voted using their Internet proxy voting are required, however, to appoint a proxy to officially represent them at the AGM in person. We also provide the option for shareholders to issue voting proxies or voting instructions to an independent third party (civil law notary) prior to the AGM.
Voting results from the AGM will be made available on our Website within 15 days of the meeting.
The draft minutes of the AGM are available on our Website, and also upon request by letter or e-mail, no later than 3 months after the meeting. Shareholders are given the opportunity to provide their comments in the subsequent 3 months, after which the minutes are adopted by the Chairman and the Secretary of the meeting. The adopted minutes are also available on our Website and on request by letter or e-mail.
Information to the shareholders
To ensure fair disclosure, we distribute company information that may influence the share price to shareholders and other parties in the financial markets simultaneously and through means that are public to all interested parties. In case of bilateral contact with shareholders, we follow the procedure related thereto as published on our Website.
When our annual and quarterly results are published by means of a press release, interested parties, including shareholders, can participate through conference calls, listen to a web cast and view the presentation of the results on our Website. The schedule for communicating the annual financial results is posted on our Website. In addition, we provide information to our shareholders at our AGM. We also publish an Integrated Report on our Website every year, reporting on financial and non-financial performance, as well as a Statutory Interim Report.
It is our policy to post the presentations given to analysts and investors at investor conferences on our Website. Information regarding presentations to investors and analysts and conference calls are announced in advance on our Website (for details see our financial calendar as published in the Investor Relations section on our Website). Meetings and discussions with investors and analysts will, in principle, not be held shortly before the publication of regular financial information. We do not assess, comment on, or correct analysts’ reports and valuations in advance, other than to comment on factual errors. We do not pay any fees to parties carrying out research for analysts’ reports, or for the production or publication of analysts’ reports, and take no responsibility for the content of such reports.
At the AGM, the BoM and the SB provide shareholders with all requested information, unless this is contrary to an overriding interest of ASML. If this is the case, the BoM and SB will provide their reasons for not providing the requested information.
ASML INTEGRATED REPORT 2018
86
The Corporate Governance section on our Website also provides links to websites that contain information about ASML published or filed by ASML in accordance with applicable rules and regulations.
Our sole anti-takeover device is the possibility of issuing cumulative preference shares in its share capital to the Foundation under an option agreement between ASML and the Foundation.
Relationship with institutional investors
It is important to us that our institutional investors participate in our General Meetings of Shareholders. To increase the participation rate, several measures have been taken, including providing Internet proxy voting. In addition, we actively approach our institutional investors to discuss their participation at the AGM.
The Audit of Financial Reporting and the Position of the Internal and External Auditor Function
Financial reporting
We have comprehensive internal procedures in place for the preparation and publication of our Integrated Report, quarterly figures, and all other financial information. These internal procedures are frequently discussed by the Audit Committee and the SB. The Disclosure Committee assists the BoM in overseeing ASML’s disclosure activities and ensures compliance with applicable disclosure requirements arising under Dutch and US law, and other regulatory requirements.
The Audit Committee reviews and approves the external auditor’s audit plan for the audits planned during the financial year. The audit plan also includes, among others, the activities of the external auditor with respect to their limited procedures on the quarterly results other than the annual accounts. The external auditor regularly updates the Audit Committee on the progress of the audits and other activities.
The SB has reviewed and approved, and all SB members signed, ASML’s
2018
financial statements as prepared by the BoM. KPMG has duly examined our financial statements, and the Auditor’s Report is included in the Consolidated Financial Statements.
Appointment, role, assessment of the functioning of the external auditor, and the auditor’s fee
In accordance with Dutch law, our external auditor is appointed by the General Meeting of Shareholders and is nominated for appointment by the SB upon advice from the Audit Committee and the BoM. ASML’s current external auditor, KPMG, was appointed by the General Meetings of Shareholders in 2017 for the reporting year 2018.
Every year, the BoM and the Audit Committee provide the SB with a report on the relationship with the external auditor.
The external auditor is present at our AGM to respond to questions, if any, from the shareholders about the auditor’s report on the Consolidated Financial Statements.
The Audit Committee approves the remuneration of the external auditor on behalf of the SB after consultation with the BoM. It has been agreed among the members of the SB and the BoM that the Audit Committee has the most relevant insight and experience to be able to approve this item. The SB has therefore delegated these responsibilities to the Audit Committee.
The Audit Committee monitors compliance with Dutch and US rules on non-audit services provided by the external auditor, which outlines strict separation of audit and advisory services for Dutch public-interest entities.
In principle, the external auditor attends all the Audit Committee meetings, unless the Audit Committee deems this unnecessary. The external auditor’s findings are discussed at these meetings. Furthermore, the external auditor also attends the SB meetings in which the quarterly financial results are discussed.
The Audit Committee reports to the SB on all issues discussed with the external auditor, including the external auditor’s reports with regard to the audit of the annual reports as well as the content of the annual reports. The independent auditor’s report refers to materiality, scope of the group audit,
the responsibilities of management, the SB and the external auditor for the financial statements, and reports on other legal and regulatory requirements.
For more information on principal accountant fees and services see
Other Appendices - Appendix - Principal Accountant Fees and Services
.
Internal Audit function
The Internal Audit function assesses our systems of internal controls by performing independent procedures such as risk-based operational audits, IT audits and compliance audits. The Internal Audit department reports directly to the Audit Committee and the BoM. The department’s annual Internal Audit plan is discussed with and approved by the Audit Committee, the BoM and the SB. The follow-up on the Internal Audit findings and progress being made compared to the Internal Audit plan are discussed on a quarterly basis with the Audit Committee. The external auditor and Internal Audit department have meetings on a regular basis.
ASML INTEGRATED REPORT 2018
87
Other Information on Governance
General
ASML Holding N.V. is a holding company that operates through its subsidiaries. We have operating subsidiaries in the Netherlands, the United States, Italy, France, Germany, the United Kingdom, Ireland, Belgium, Korea, Taiwan, Singapore, China, Hong Kong, Japan, Malaysia and Israel. Our major operating subsidiaries, each of which is ultimately wholly owned by ASML Holding N.V., are ASML Netherlands B.V., ASML Hong Kong Ltd. and ASML US LLC. See
Exhibit Index - Exhibit 8.1 - List of main subsidiaries
.
The EU Takeover Directive requires that listed companies publish additional information providing insight into the defensive structures and mechanisms they use. The relevant provision has been implemented into Dutch law by means of a decree made on April 5, 2006. The information required to be disclosed in accordance with this decree is listed below.
Our BoM has the power to issue ordinary shares and cumulative preference shares insofar as the BoM has been authorized to do so by the General Meeting of Shareholders. The BoM requires approval of the SB for such an issue. The authorization by the General Meeting of Shareholders can only be granted for a certain period not exceeding
5 years
and may be extended for no longer than
5 years
on each occasion. If the General Meeting of Shareholders has not authorized the BoM to issue shares, the General Meeting of Shareholders will be authorized to issue shares on the BoM’s proposal, provided that the SB has approved such proposal.
Share capital
ASML’s authorized share capital amounts to
EUR 126.0 million
and is divided into:
|
•
|
700,000,000
Cumulative Preference Shares with a nominal value of
EUR 0.09
each.
|
|
•
|
699,999,000
Ordinary Shares with a nominal value of
EUR 0.09
each.
|
|
•
|
9,000
Ordinary Shares B with a nominal value of
EUR 0.01
each.
|
As of
December 31, 2018
,
431,465,767
ordinary shares with a nominal value of
EUR 0.09
each were issued and fully paid up; this includes
10,368,038
treasury shares.
No
ordinary shares B and
no
cumulative preference shares have been issued.
A total of
96,566,077
depository receipts for ordinary shares were issued at the launch of the CCIP. This number has since decreased with the sell-down by the relevant customers following expiry of the lock-up.
For further information see
Reporting obligations under the Act on the supervision of financial markets (‘Wet op het financieel toezicht’, the FMSA) and under US securities laws
below.
Ordinary shares
An ordinary share entitles the holder thereof to cast
nine
votes at the General Meeting of Shareholders. Each ordinary share consists of
900
fractional shares. Fractional shares entitle the holder thereof to a fractional dividend, but do not entitle the holder thereof to voting rights. Only those persons who hold shares directly in the share register in the Netherlands, held by us at our address at 5504 DR Veldhoven, de Run 6501, the Netherlands, or in the New York share register, held by JP Morgan Chase Bank, N.A., P.O. Box 64506, St. Paul, MN 55164-0506, United States, can hold fractional shares. Those who hold ordinary shares through the deposit system under the Dutch Securities Bank Giro Transactions Act (‘Wet giraal effectenverkeer’; the Giro Act) maintained by the Dutch central securities depository Euroclear Nederland or through the Depository Trust Company cannot hold fractional shares. At our 2018 AGM, the BoM was authorized from April 25, 2018
through October 25, 2019, subject to the approval of the SB, to issue shares and / or rights thereto representing up to a maximum of
5.0 percent
of our issued share capital at April 25, 2018, plus an additional
5.0 percent
of our issued share capital at April 25, 2018 that may be issued in connection with mergers, acquisitions and / or (strategic) alliances.
Holders of ASML’s ordinary shares have a preemptive right, in proportion to the aggregate nominal amount of the ordinary shares held by them. This preemptive right may be restricted or excluded. Holders of ordinary shares do not have preemptive right with respect to any ordinary shares issued for consideration other than cash or ordinary shares issued to employees. If authorized for this purpose by the General Meeting of Shareholders, the BoM has the power, subject to approval of the SB, to restrict or exclude the preemptive rights of holders of ordinary shares. At our 2018 AGM, our shareholders authorized the BoM through October 25, 2019, subject to approval of the SB, to restrict or exclude preemptive rights of holders of ordinary shares up to a maximum of
10 percent
of our issued share capital.
We may repurchase our issued ordinary shares at any time, subject to compliance with the requirements of Dutch law and our Articles of Association. Any such repurchases are and remain subject to the approval of the SB and the authorization by the General Meeting of Shareholders, which authorization may not be for more than 18 months. At the 2018 AGM, the BoM has been authorized, subject to SB approval, to repurchase through October 25, 2019, up to a maximum of two times
10.0 percent
of our issued share capital at April 25, 2018, at a price between the nominal value of the ordinary shares purchased and
110.0 percent
of the market price of these securities on Euronext Amsterdam or NASDAQ.
For details on our share buyback program, see
Consolidated Financial Statements - Notes to the Consolidated Financial Statements - Note 29 Purchases of equity securities by the issuer and affiliated purchasers
.
ASML INTEGRATED REPORT 2018
88
Ordinary shares B
Our Articles of Association provide for
9,000
ordinary shares B with a nominal value of
EUR 0.01
. Each ordinary share B entitles the holder thereof to cast
one
vote at the General Meeting of Shareholders. Holders of fractional shares had the opportunity, until July 31, 2013, to convert fractional shares into ordinary shares B to obtain voting rights with respect to those fractional shares. No ordinary shares B have been issued.
Special voting rights on the issued shares
There are no special voting rights on the issued shares in our share capital.
Limitation voting rights on ordinary shares indirectly held by the Participating Customers
Pursuant to the agreements entered into with them, the Participating Customers (and their respective foundations) will not be entitled to vote with the ordinary shares that were acquired by (the foundations of) the Participating Customers as part of the CCIP or any other ordinary shares otherwise transferred to the foundations (under the circumstances described under ‘Standstill; Additional Purchases’,
prior to a Shareholder Agreement Termination Event
except when a Suspension Event
occurs and is continuing or where the following matters are proposed at any General Meeting of Shareholders (the ‘Voting Restrictions’): (i) an issuance of ASML shares or grant of rights to subscribe for ASML shares representing 25 percent or more of the issued and outstanding share capital of ASML or the restriction or exclusion of preemption rights relating thereto (in each case, on an aggregate basis during the preceding 12 months) or the designation of the BoM as the authorized body to resolve on these matters; (ii) an authorization to repurchase 25 percent or more of ASML’s issued and outstanding share capital on an aggregate basis during the preceding 12 months; (iii) the approval of a significant change in the identity or nature of ASML or its business, including a transfer of all or substantially all business or assets of ASML and its subsidiaries to a third party, the establishment or cancellation of a long-lasting cooperation of essential importance with a third party and an acquisition or disposition of an interest in the capital or assets of a person with a value of at least one third of the assets of ASML (on a consolidated basis); (iv) an amendment to ASML’s Articles of Association that would materially affect the specific voting rights of the Participating Customers, would materially affect the identity or nature of ASML or its business, or would disproportionately (or uniquely) and adversely affect the rights or benefits attached to or derived from the ordinary shares held by the Participating Customers through the foundations as compared to the shareholders; (v) the dissolution of ASML; and (vi) any merger or demerger which would result in a material change in the identity or nature of ASML or its business.
Cumulative preference shares
In 1998, we granted the Preference Share Option to the Foundation. This option was amended and extended in 2003 and 2007. A third amendment to the option agreement between the Foundation and ASML became effective on January 1, 2009, to clarify the procedure for the repurchase and cancellation of the preference shares when issued.
The nominal value of the cumulative preference shares amounts to EUR 0.09 and the number of cumulative preference shares included in the authorized share capital is 700,000,000. A cumulative preference share entitles the holder thereof to cast 9 votes in the General Meeting of Shareholders.
The Foundation may exercise the Preference Share Option in situations where, in the opinion of the Foundation’s Board of Directors, ASML’s interests, ASML’s business or the interests of ASML’s stakeholders are at stake. This may be the case if a public bid for ASML’s shares is announced or made, or there is a justified expectation that such a bid will be made without any agreement having been reached in relation to such a bid with ASML. The same may apply if one shareholder, or more shareholders acting in concert, hold a substantial percentage of ASML’s issued ordinary shares without making an offer or if, in the opinion of the Foundation’s Board of Directors, the (attempted) exercise of the voting rights by one shareholder or more shareholders, acting in concert, is materially in conflict with ASML’s interests, ASML’s business or ASML’s stakeholders.
The Foundation’s objectives are to look after the interests of ASML and of the enterprises maintained by ASML and of the companies which are affiliated in a group with ASML, in such a way that the interests of ASML, of those enterprises and of all parties concerned are safeguarded in the best possible way, and influences in conflict with these interests which might affect the independence or the identity of ASML and those companies are deterred to the best of the Foundation’s ability, and everything related to the above or possibly conducive thereto. The Foundation seeks to realize its objects by the acquiring and holding of cumulative preference shares in the capital of ASML and by exercising the rights attached to these shares, particularly the voting rights attached to these shares.
The Preference Share Option gives the Foundation the right to acquire a number of cumulative preference shares as the Foundation will require, provided that the aggregate nominal value of such number of cumulative preference shares shall not exceed the aggregate nominal value of the ordinary shares that have been issued at the time of exercise of the Preference Share Option for a subscription price equal to their nominal value. Only one-fourth of the subscription price would be payable at the time of initial issuance of the cumulative preference shares, with the other three-fourths of the nominal value only being payable when we call up this amount. Exercise of the preference share option could effectively dilute the voting power of the outstanding ordinary shares by one-half.
ASML INTEGRATED REPORT 2018
89
Cancellation and repayment of the issued cumulative preference shares by ASML requires the authorization by the General Meeting of Shareholders of a proposal to do so by the BoM approved by the SB. If the Preference Share Option is exercised and as a result cumulative preference shares are issued, ASML, at the request of the Foundation, will initiate the repurchase or cancellation of all cumulative preference shares held by the Foundation. In that case ASML is obliged to effect the repurchase and cancellation respectively as soon as possible. A cancellation will result in a repayment of the amount paid and exemption from the obligation to pay up on the cumulative preference shares. A repurchase of the cumulative preference shares can only take place when such shares are fully paid up.
If the Foundation does not request ASML to repurchase or cancel all cumulative preference shares held by the Foundation within 20 months of issuance of these shares, we will be obliged to convene a General Meeting of Shareholders in order to decide on a repurchase or cancellation of these shares.
The Foundation is independent of ASML. The Board of Directors of the Foundation comprises four independent members from the Netherlands’ business and academic communities. The current members of the Foundation’s Board of Directors are: Mr. A.P.M. van der Poel, Mr. S. Perrick, Mr. J.M. de Jong and Mr. A.H. Lundqvist.
Limitations to transfers of shares in the share capital of ASML
There are currently no limitations, either under Dutch law or in ASML’s Articles of Association, on the transfer of ordinary shares in the share capital of ASML. Pursuant to ASML’s Articles of Association, the SB’s approval shall be required for every transfer of cumulative preference shares.
Reporting obligations under the Act on the supervision of financial markets (‘Wet op het financieel toezicht’, the FMSA) and under US securities laws
The following table sets forth the total number of ordinary shares owned by each shareholder that reported to the AFM or SEC a beneficial ownership of ordinary shares that is at least 3.0 percent (5.0 percent, in the case of the SEC) of our ordinary shares issued and outstanding as well as the ordinary shares (including shares underlying options) owned by our members of the BoM (which includes those persons specified in
Management Board Report - Board of Management
), as a group, as of
December 31, 2018
. The information set out below with respect to shareholders is based on public filings with the SEC and AFM as of January 31, 2019.
|
|
|
|
||
|
Identity of Person or Group
|
Shares Owned
|
|
Percent of
Class
5
|
|
|
Capital Group International, Inc
1
|
64,679,514
|
|
15.36
|
%
|
|
BlackRock Inc.
2
|
27,139,122
|
|
6.44
|
%
|
|
Members of ASML’s Board of Management (6 persons)
3,4
|
84,933
|
|
0.02
|
%
|
|
1.
|
As reported to the AFM on November 20, 2018, Capital Group International, Inc. and Capital Research & Management Company, which we believe to be an affiliate of Capital Group International, Inc., indirectly have 582,115,626 voting rights corresponding to
64,679,514
shares (based on 9 votes per share) of our ordinary shares but do not have ownership rights related to those shares. Capital World Investors reported on a Schedule 13-G/A filed with the SEC on February 14, 2018, that it is the beneficial owner of 51,761,833 shares of our ordinary shares as a result of its affiliation with Capital Research & Management Company. In addition, the Growth Fund of America reported to the AFM on May 15, 2014 that it owns 3.08 percent of our outstanding shares. We believe that some or all of these shares are included within the shares reported to be owned by Capital Group International, Inc., as set forth above.
|
|
2.
|
Based solely on the Schedule 13-G/A filed by BlackRock Inc. with the SEC on January 30, 2018; BlackRock reports voting power with respect to 24,678,344 of these shares. A public filing with the AFM on August 1, 2018 shows aggregate holdings of various BlackRock funds of 4.92 percent, based on total number of issued shares at the time, and 6.21 percent in voting rights.
|
|
3.
|
Does not include unvested shares granted to members of the BoM. For further information see
Supervisory Board Report - Remuneration Report
and
Other Appendices - Appendix - Board of Management and Supervisory Board Remuneration
.
|
|
4.
|
No shares are owned by members of the SB.
|
|
5.
|
As a percentage of the total number of ordinary shares issued and outstanding (
421,097,729
) as of December 31,
2018
, which excludes
10,368,038
ordinary shares which have been issued but are held in treasury by ASML. Please note that share ownership percentages reported to the AFM are expressed as a percentage of the total number of ordinary shares issued (including treasury stock) and that accordingly, percentages reflected in this table may differ from percentages reported to the AFM.
|
As of
December 31, 2018
,
71,710,774 ordinary shares were held by 325 registered holders with a registered address in the US
. Since certain of our ordinary shares were held by brokers and nominees, the number of record holders in the US may not be representative of the number of beneficial holders or of where the beneficial holders are resident.
Appointment of Board of Management and Supervisory Board
Board of Management
The rules governing the appointment and dismissal of members of the BoM are described in
Corporate Governance - Board of Management
.
Supervisory Board
The rules governing the appointment and dismissal of members of the SB are described in
Corporate Governance - Supervisory Board
.
ASML INTEGRATED REPORT 2018
90
Articles of Association
The General Meeting of Shareholders can resolve to amend our Articles of Association. The (proposed) amendment requires the approval of the SB.
A resolution to amend the Articles of Association is adopted at a General Meeting of Shareholders, at which more than one half of the issued share capital is represented and with at least three-fourths of the votes cast. If the required share capital is not represented at a meeting convened for that purpose, a subsequent meeting shall be convened, to be held within four weeks of the first meeting, at which, irrespective of the share capital represented, the resolution can be adopted with at least three-fourths of the votes cast. If a resolution to amend the Articles of Association is proposed by the BoM, the resolution will be adopted with an absolute majority of votes cast irrespective of the represented share capital at the General Meeting of Shareholders.
A summary of our Articles of Association is included as Exhibit 99.1 to our form 6-K filed furnished with the SEC on February 8, 2013 (the
‘
Articles of Association
’
).
Severance payments under agreements with members of Board of Management
Employment agreements, respectively management services agreements, for members of the BoM contain specific provisions regarding severance payments. If ASML gives notice of termination of the employment agreement respectively management services agreements for reasons which are not exclusively or mainly found in acts or omissions of the member of the BoM concerned, a severance payment not exceeding one year’s base salary will be paid upon the effective date of termination.
As of July 1, 2013, the relationship between a member of the BoM and a listed company can no longer be treated as an employment contract. All members of the BoM that were appointed and reappointed at the 2018 AGM have entered into a management services agreement.
Current contracts contain a provision that a member of the BoM, on their own initiative (when giving notice of termination pursuant to a change of control), will be entitled to a severance amount. Given that such a resignation is specifically linked to a change of control, ASML does not consider this provision a deviation from the Code.
NASDAQ Corporate Governance Standards
NASDAQ rules provide that foreign private issuers may follow home country practice in lieu of the NASDAQ corporate governance standards subject to certain exceptions and except to the extent that such exemptions would be contrary to US federal securities laws. The practices followed by ASML in lieu of NASDAQ rules are described below:
|
•
|
ASML does not follow NASDAQ’s quorum requirements applicable to meetings of ordinary shareholders. In accordance with Dutch law and generally accepted Dutch business practice, ASML’s Articles of Association provide that there are no quorum requirements generally applicable to General Meetings of Shareholders.
|
|
•
|
ASML does not follow NASDAQ’s requirements regarding the solicitation of proxies and the provision of proxy statements for General Meetings of Shareholders. ASML does furnish proxy statements and solicit proxies for the General Meeting of Shareholders. Dutch corporate law sets a mandatory (participation and voting) record date for Dutch listed companies at the 28th day prior to the date of the General Meeting of Shareholders. Shareholders registered at such record date are entitled to attend and exercise their rights as shareholders at the General Meeting of Shareholders, regardless of sale of shares after the record date.
|
|
•
|
ASML does not follow NASDAQ’s requirement regarding distribution to shareholders of copies of an annual report containing audited Financial Statements prior to our AGM. The distribution of our Integrated Reports to shareholders is not required under Dutch corporate law or Dutch securities laws, or by Euronext Amsterdam. Furthermore, it is generally accepted business practice for Dutch companies not to distribute annual reports. In part, this is because the Dutch system of bearer shares has made it impractical to keep a current list of holders of the bearer shares in order to distribute the annual reports. Instead, we make our Integrated Report available at our corporate head office in the Netherlands (and at the offices of our Dutch listing agent as stated in the convening notice for the meeting) no later than 42 days prior to convocation of the AGM. In addition, we post a copy of our Integrated Reports on our Website prior to the AGM.
|
|
•
|
ASML does not follow NASDAQ’s requirement to obtain shareholder approval of stock option or purchase plans or other equity compensation arrangements available to officers, directors or employees. It is not required under Dutch law or generally accepted practice for Dutch companies to obtain shareholder approval of equity compensation arrangements available to officers, directors or employees. The AGM adopts the Remuneration Policy for the BoM, approves equity compensation arrangements for the BoM and approves the remuneration for the SB. The Remuneration Committee evaluates the achievements of individual members of the BoM with respect to the short and long-term quantitative performance, the full SB evaluates the quantitative performance criteria. Equity compensation arrangements for employees are adopted by the BoM within limits approved by the AGM.
|
ASML INTEGRATED REPORT 2018
91
Compliance with the Corporate Governance Code
ASML fully complies with the Code.
The Board of Management and the Supervisory Board,
Veldhoven,
February 5, 2019
ASML INTEGRATED REPORT 2018
92
ASML INTEGRATED REPORT 2018
93

Consolidated Statements of Operations
|
Year ended December 31
|
2016
1
|
|
2017
1
|
|
2018
|
|
|
|
Notes
|
(in millions, except per share data)
|
EUR
|
|
EUR
|
|
EUR
|
|
|
|
|
|
|
|
|
|
|
|
Net system sales
2
|
4,718.9
|
|
6,424.4
|
|
8,259.1
|
|
|
|
Net service and field option sales
2
|
2,156.2
|
|
2,538.3
|
|
2,684.9
|
|
|
|
22, 23
|
Total net sales
|
6,875.1
|
|
8,962.7
|
|
10,944.0
|
|
|
Cost of system sales
2
|
(2,423.9
|
)
|
(3,439.9
|
)
|
(4,141.2
|
)
|
|
|
Cost of service and field option sales
2
|
(1,305.9
|
)
|
(1,502.6
|
)
|
(1,773.6
|
)
|
|
|
24
|
Total cost of sales
|
(3,729.8
|
)
|
(4,942.5
|
)
|
(5,914.8
|
)
|
|
Gross profit
|
3,145.3
|
|
4,020.2
|
|
5,029.2
|
|
|
|
30
|
Other income
|
93.8
|
|
95.8
|
|
—
|
|
|
24, 25
|
Research and development costs
|
(1,105.8
|
)
|
(1,259.7
|
)
|
(1,575.9
|
)
|
|
24
|
Selling, general and administrative costs
|
(374.8
|
)
|
(416.6
|
)
|
(488.0
|
)
|
|
Income from operations
|
1,758.5
|
|
2,439.7
|
|
2,965.3
|
|
|
|
26
|
Interest and other, net
|
33.7
|
|
(50.3
|
)
|
(28.3
|
)
|
|
Income before income taxes
|
1,792.2
|
|
2,389.4
|
|
2,937.0
|
|
|
|
21
|
Provision for income taxes
|
(234.4
|
)
|
(306.0
|
)
|
(351.6
|
)
|
|
Income after income taxes
|
1,557.8
|
|
2,083.4
|
|
2,585.4
|
|
|
|
10
|
Profit (loss) related to equity method investments
|
—
|
|
(16.7
|
)
|
6.2
|
|
|
Net income
|
1,557.8
|
|
2,066.7
|
|
2,591.6
|
|
|
|
|
|
|
|
|
|
|
|
|
1
|
Basic net income per ordinary share
|
3.66
|
|
4.81
|
|
6.10
|
|
|
1
|
Diluted net income per ordinary share
3
|
3.64
|
|
4.79
|
|
6.08
|
|
|
Number of ordinary shares used in computing per share amounts
|
|
|
|
||||
|
1
|
Basic
|
425.6
|
|
429.8
|
|
424.9
|
|
|
1
|
Diluted
3
|
427.7
|
|
431.6
|
|
426.4
|
|
|
1.
|
As of January 1, 2018, ASML has adopted the new Revenue Recognition Standard (ASC 606) and Lease Standard (ASC 842). The comparative numbers have been adjusted to reflect these changes in accounting policies, see Note 1 General information / summary of significant accounting policies.
|
|
2.
|
As of January 1, 2017, ASML presents net sales with respect to metrology and inspection systems as part of net system sales instead of net service and field option sales.
The 2016 numbers have been adjusted to reflect this change in accounting policy.
|
|
3.
|
The calculation of diluted net income per ordinary share assumes the exercise of options issued under our stock option plans and the issuance of shares under our share plans for periods in which exercises or issuances would have a dilutive effect. The calculation of diluted net income per ordinary share does not assume exercise of options when exercise would be anti-dilutive.
|
ASML INTEGRATED REPORT 2018
95
Consolidated Statements of Comprehensive Income
|
Year ended December 31
|
2016
1
|
|
2017
1
|
|
2018
|
|
|
|
Notes
|
(in millions)
|
EUR
|
|
EUR
|
|
EUR
|
|
|
Net income
|
1,557.8
|
|
2,066.7
|
|
2,591.6
|
|
|
|
Other comprehensive income:
|
|||||||
|
Proportionate share of other comprehensive income from equity method investments
|
—
|
|
(1.0
|
)
|
(4.8
|
)
|
|
|
Foreign currency translation, net of taxes:
|
|||||||
|
Gain (loss) on foreign currency translation and effective portion of hedges on net investments
|
120.4
|
|
(329.0
|
)
|
18.2
|
|
|
|
Financial instruments, net of taxes:
|
|||||||
|
4
|
Gain (loss) on derivative financial instruments
|
6.0
|
|
(16.6
|
)
|
8.3
|
|
|
4
|
Transfers to net income
|
2.4
|
|
(3.1
|
)
|
11.8
|
|
|
Other comprehensive income, net of taxes
|
128.8
|
|
(349.7
|
)
|
33.5
|
|
|
|
Total comprehensive income, net of taxes
|
1,686.6
|
|
1,717.0
|
|
2,625.1
|
|
|
|
Attributable to equity holders
|
1,686.6
|
|
1,717.0
|
|
2,625.1
|
|
|
|
1.
|
As of January 1, 2018, ASML has adopted the new Revenue Recognition Standard (ASC 606) and Lease Standard (ASC 842). The comparative numbers have been adjusted to reflect these changes in accounting policies, see Note 1 General information / summary of significant accounting policies.
|
ASML INTEGRATED REPORT 2018
96
Consolidated Balance Sheets
|
As of December 31
|
2017
1
|
|
2018
|
|
||
|
Notes
|
(in millions, except share and per share data)
|
EUR
|
|
EUR
|
|
|
|
|
|
|
|
|
||
|
Assets
|
|
|
||||
|
5
|
Cash and cash equivalents
|
2,259.0
|
|
3,121.1
|
|
|
|
5
|
Short-term investments
|
1,029.3
|
|
913.3
|
|
|
|
6
|
Accounts receivable, net
|
1,740.3
|
|
1,498.2
|
|
|
|
7
|
Finance receivables, net
|
59.1
|
|
611.1
|
|
|
|
21
|
Current tax assets
|
61.6
|
|
79.7
|
|
|
|
23
|
Contract assets
|
270.4
|
|
95.9
|
|
|
|
8
|
Inventories, net
|
2,955.6
|
|
3,439.5
|
|
|
|
9
|
Other assets
|
510.5
|
|
772.6
|
|
2
|
|
Total current assets
|
8,885.8
|
|
10,531.4
|
|
||
|
|
|
|
|
|
||
|
7
|
Finance receivables, net
|
159.4
|
|
275.1
|
|
|
|
21
|
Deferred tax assets
|
31.7
|
|
236.3
|
|
2
|
|
9
|
Other assets
|
708.2
|
|
806.1
|
|
|
|
10
|
Equity method investments
|
982.2
|
|
915.8
|
|
|
|
11
|
Goodwill
|
4,541.1
|
|
4,541.1
|
|
|
|
12
|
Other intangible assets, net
|
1,166.0
|
|
1,104.0
|
|
|
|
13, 22
|
Property, plant and equipment, net
|
1,600.8
|
|
1,589.5
|
|
|
|
14
|
Right-of-use assets
|
113.7
|
|
137.6
|
|
|
|
Total non-current assets
|
9,303.1
|
|
9,605.5
|
|
||
|
|
|
|
|
|
||
|
Total assets
|
18,188.9
|
|
20,136.9
|
|
||
|
|
|
|
||||
|
Liabilities and shareholders’ equity
|
|
|
||||
|
Accounts payable
|
837.3
|
|
964.0
|
|
||
|
15
|
Accrued and other liabilities
|
625.5
|
|
911.4
|
|
|
|
21
|
Current tax liabilities
|
152.0
|
|
187.9
|
|
|
|
16
|
Current portion of long-term debt
|
25.2
|
|
—
|
|
|
|
23
|
Contract liabilities
|
1,530.0
|
|
1,728.6
|
|
|
|
Total current liabilities
|
3,170.0
|
|
3,791.9
|
|
||
|
|
|
|
|
|
||
|
16
|
Long-term debt
|
3,000.1
|
|
3,026.5
|
|
|
|
21
|
Deferred and other tax liabilities
|
341.1
|
|
251.2
|
|
|
|
23
|
Contract liabilities
|
622.0
|
|
1,224.6
|
|
|
|
15
|
Accrued and other liabilities
|
279.3
|
|
201.7
|
|
|
|
Total non-current liabilities
|
4,242.5
|
|
4,704.0
|
|
||
|
|
|
|
|
|
||
|
Total liabilities
|
7,412.5
|
|
8,495.9
|
|
||
|
|
|
|
|
|
||
|
Ordinary shares; EUR 0.09 nominal value;
|
|
|
||||
|
699,999,000 shares authorized at December 31, 2018;
|
|
|
||||
|
421,097,729 issued and outstanding at December 31, 2018;
|
|
|
||||
|
699,999,000 shares authorized at December 31, 2017;
|
|
|
||||
|
427,393,592 issued and outstanding at December 31, 2017;
|
|
|
||||
|
Issued and outstanding shares
|
38.8
|
|
38.6
|
|
||
|
Share premium
|
3,732.5
|
|
3,741.3
|
|
||
|
Treasury shares at cost
|
(557.9
|
)
|
(1,621.8
|
)
|
||
|
Retained earnings
|
7,311.5
|
|
9,197.9
|
|
2
|
|
|
Accumulated other comprehensive income
|
251.5
|
|
285.0
|
|
||
|
28
|
Total shareholders’ equity
|
10,776.4
|
|
11,641.0
|
|
|
|
|
|
|
|
|
||
|
Total liabilities and shareholders’ equity
|
18,188.9
|
|
20,136.9
|
|
||
|
|
|
|
|
|
||
|
1.
|
As of January 1, 2018, ASML has adopted the new Revenue Recognition Standard (ASC 606) and Lease Standard (ASC 842). The comparative numbers have been adjusted to reflect these changes in accounting policies, see Note 1 General information / summary of significant accounting policies.
|
|
2.
|
As per January 1, 2018, ASML has adopted ASU No. 2016-16 Income Taxes (ASC 740) 'Intra-Entity Transfers of Assets Other Than Inventory', adjusted to retained earnings as of January 1, 2018. See
Note 1 General information / summary of significant accounting policies
.
|
ASML INTEGRATED REPORT 2018
97
Consolidated Statements of Shareholders’ Equity
|
Issued and
Outstanding Shares |
|||||||||||||||
|
Number
1
|
|
Amount
|
|
Share Premium
|
|
Treasury Shares at Cost
|
|
Retained Earnings
3
|
|
Accumulated OCI
2
|
|
Total
|
|
||
|
Notes
|
(in millions)
|
EUR
|
|
EUR
|
|
EUR
|
|
EUR
|
|
EUR
|
|
EUR
|
|
||
|
Balance at January 1, 2016
|
428.0
|
|
38.8
|
|
3,070.2
|
|
(476.9
|
)
|
5,350.4
|
|
472.4
|
|
8,454.9
|
|
|
|
Components of comprehensive income:
|
|||||||||||||||
|
Net income
3
|
—
|
|
—
|
|
—
|
|
—
|
|
1,557.8
|
|
—
|
|
1,557.8
|
|
|
|
Foreign currency translation and effective portion of hedges on net investments
|
—
|
|
—
|
|
—
|
|
—
|
|
—
|
|
120.4
|
|
120.4
|
|
|
|
4
|
Gain on financial instruments, net of taxes
|
—
|
|
—
|
|
—
|
|
—
|
|
—
|
|
8.4
|
|
8.4
|
|
|
Total comprehensive income
|
—
|
|
—
|
|
—
|
|
—
|
|
1,557.8
|
|
128.8
|
|
1,686.6
|
|
|
|
CCIP:
|
|||||||||||||||
|
30
|
Fair value differences
4
|
—
|
|
—
|
|
27.9
|
|
—
|
|
—
|
|
—
|
|
27.9
|
|
|
29
|
Purchase of treasury shares
|
(4.8
|
)
|
—
|
|
—
|
|
(400.0
|
)
|
—
|
|
—
|
|
(400.0
|
)
|
|
29
|
Cancellation of treasury shares
|
—
|
|
—
|
|
—
|
|
—
|
|
—
|
|
—
|
|
—
|
|
|
19, 24
|
Share-based payments
5
|
—
|
|
—
|
|
49.2
|
|
—
|
|
—
|
|
—
|
|
49.2
|
|
|
Issuance of shares
6
|
6.7
|
|
0.6
|
|
545.3
|
|
80.7
|
|
(27.8
|
)
|
—
|
|
598.8
|
|
|
|
28
|
Dividend paid
|
—
|
|
—
|
|
—
|
|
—
|
|
(445.9
|
)
|
—
|
|
(445.9
|
)
|
|
19, 21
|
Tax benefit from share-based
payments |
—
|
|
—
|
|
0.9
|
|
—
|
|
—
|
|
—
|
|
0.9
|
|
|
Balance at December 31, 2016
|
429.9
|
|
39.4
|
|
3,693.5
|
|
(796.2
|
)
|
6,434.5
|
|
601.2
|
|
9,972.4
|
|
|
|
Components of comprehensive income:
|
|||||||||||||||
|
Net income
3
|
—
|
|
—
|
|
—
|
|
—
|
|
2,066.7
|
|
—
|
|
2,066.7
|
|
|
|
Proportionate share of other comprehensive income from equity method investments
|
—
|
|
—
|
|
—
|
|
—
|
|
—
|
|
(1.0
|
)
|
(1.0
|
)
|
|
|
Foreign currency translation and effective portion of hedges on net investments
|
—
|
|
—
|
|
—
|
|
—
|
|
—
|
|
(329.0
|
)
|
(329.0
|
)
|
|
|
4
|
Loss on financial instruments, net of taxes
|
—
|
|
—
|
|
—
|
|
—
|
|
—
|
|
(19.7
|
)
|
(19.7
|
)
|
|
Total comprehensive income
|
—
|
|
—
|
|
—
|
|
—
|
|
2,066.7
|
|
(349.7
|
)
|
1,717.0
|
|
|
|
CCIP:
|
|||||||||||||||
|
30
|
Fair value differences
4
|
—
|
|
—
|
|
28.6
|
|
—
|
|
—
|
|
—
|
|
28.6
|
|
|
29
|
Purchase of treasury shares
|
(3.5
|
)
|
—
|
|
—
|
|
(500.0
|
)
|
—
|
|
—
|
|
(500.0
|
)
|
|
29
|
Cancellation of treasury shares
|
—
|
|
(0.7
|
)
|
—
|
|
650.0
|
|
(649.3
|
)
|
—
|
|
—
|
|
|
19, 24
|
Share-based payments
|
—
|
|
—
|
|
53.1
|
|
—
|
|
—
|
|
—
|
|
53.1
|
|
|
Issuance of shares
|
1.0
|
|
0.1
|
|
(42.7
|
)
|
88.3
|
|
(23.7
|
)
|
—
|
|
22.0
|
|
|
|
28
|
Dividend paid
|
—
|
|
—
|
|
—
|
|
—
|
|
(516.7
|
)
|
—
|
|
(516.7
|
)
|
|
Balance at December 31, 2017
|
427.4
|
|
38.8
|
|
3,732.5
|
|
(557.9
|
)
|
7,311.5
|
|
251.5
|
|
10,776.4
|
|
|
|
Opening balance adjustment
7
|
—
|
|
—
|
|
—
|
|
—
|
|
(85.3
|
)
|
—
|
|
(85.3
|
)
|
|
|
Opening balance January 1, 2018
|
427.4
|
|
38.8
|
|
3,732.5
|
|
(557.9
|
)
|
7,226.2
|
|
251.5
|
|
10,691.1
|
|
|
|
Components of comprehensive income:
|
|||||||||||||||
|
Net income
|
—
|
|
—
|
|
—
|
|
—
|
|
2,591.6
|
|
—
|
|
2,591.6
|
|
|
|
Proportionate share of other comprehensive income from equity method investments
|
—
|
|
—
|
|
—
|
|
—
|
|
—
|
|
(4.8
|
)
|
(4.8
|
)
|
|
|
Foreign currency translation and effective portion of hedges on net investments
|
—
|
|
—
|
|
—
|
|
—
|
|
—
|
|
18.2
|
|
18.2
|
|
|
|
4
|
Gain on financial instruments, net of taxes
|
—
|
|
—
|
|
—
|
|
—
|
|
—
|
|
20.1
|
|
20.1
|
|
|
Total comprehensive income
|
—
|
|
—
|
|
—
|
|
—
|
|
2,591.6
|
|
33.5
|
|
2,625.1
|
|
|
|
29
|
Purchase of treasury shares
|
(7.0
|
)
|
(0.3
|
)
|
—
|
|
(1,145.9
|
)
|
—
|
|
—
|
|
(1,146.2
|
)
|
|
29
|
Cancellation of treasury shares
|
—
|
|
—
|
|
—
|
|
—
|
|
—
|
|
—
|
|
—
|
|
|
19, 24
|
Share-based payments
|
—
|
|
—
|
|
46.3
|
|
—
|
|
—
|
|
—
|
|
46.3
|
|
|
Issuance of shares
|
0.7
|
|
0.1
|
|
(37.5
|
)
|
82.0
|
|
(22.8
|
)
|
—
|
|
21.8
|
|
|
|
28
|
Dividend paid
|
—
|
|
—
|
|
—
|
|
—
|
|
(597.1
|
)
|
—
|
|
(597.1
|
)
|
|
Balance at December 31, 2018
|
421.1
|
|
38.6
|
|
3,741.3
|
|
(1,621.8
|
)
|
9,197.9
|
|
285.0
|
|
11,641.0
|
|
|
ASML INTEGRATED REPORT 2018
98
|
1.
|
As of
December 31, 2018
,
the number of issued shares was
431,465,767
. This includes the number of issued and outstanding shares of
421,097,729
and the number of treasury shares of
10,368,038
. As of
December 31, 2017
, the number of issued shares was
431,464,705
. This includes the number of issued and outstanding shares of
427,393,592
and the number of treasury shares of
4,071,113
. As of
December 31, 2016
, the number of issued shares was
439,199,514
. This includes the number of issued and outstanding shares of
429,941,232
and the number of treasury shares of
9,258,282
.
|
|
2.
|
As of
December 31, 2018
, accumulated OCI, net of taxes, consists of
EUR 5.8 million
loss
relating to our proportionate share of other comprehensive income from equity method investments (
2017
:
EUR 1.0 million
loss
;
2016
:
no
amount
),
EUR 282.3 million
relating to foreign currency translation
gain
(
2017
:
EUR 264.1 million
gain
;
2016
:
EUR 593.1 million
gain
) and
EUR 8.5 million
relating to unrealized
gains
on financial instruments (
2017
:
EUR 11.6 million
losses
;
2016
:
EUR 8.1 million
gain
).
|
|
3.
|
As of January 1, 2018, ASML has adopted the new Revenue Recognition Standard (ASC 606) and Lease Standard (ASC 842). The comparative numbers have been adjusted to reflect these changes in accounting policies, see Note 1 General information / summary of significant accounting policies.
The Retained Earnings balance at January 1, 2016 has been increased by
EUR 66.1 million
to reflect the changes in the new Revenue Recognition Standard.
|
|
4.
|
In
2017
(
EUR 28.6 million
) and
2016
(
EUR 27.9 million
)
is recognized to increase equity to the fair value of the shares issued to the Participating Customers in the CCIP. The portion of the NRE funding allocable to the shares was recognized over the NRE Funding Agreements period (2013-2017).
|
|
5.
|
Share-based payments include an amount of
EUR 1.5 million
in relation to the fair value compensation of unvested equity awards exchanged as part of the acquisition of HMI.
|
|
6.
|
Issuance of shares includes
5,866,001
ordinary shares issued in relation to the acquisition of HMI for a total fair value of
EUR 580.6 million
.
|
|
7.
|
As per January 1, 2018, ASML has adopted ASU No. 2016-16 Income Taxes (ASC 740) 'Intra-Entity Transfers of Assets Other Than Inventory', adjusted to retained earnings as of January 1, 2018. See
Note 1 General information / summary of significant accounting policies
.
|
ASML INTEGRATED REPORT 2018
99
Consolidated Statements of Cash Flows
|
Year ended December 31
|
2016
1
|
|
|
|
2017
1
|
|
|
2018
|
|
|
||
|
Notes
|
(in millions)
|
EUR
|
|
|
EUR
|
|
|
EUR
|
|
|
||
|
|
|
|
|
|
|
|
|
|
||||
|
Cash Flows from Operating Activities
|
|
|
|
|
|
|
||||||
|
Net income
|
1,557.8
|
|
|
2,066.7
|
|
|
2,591.6
|
|
|
|||
|
Adjustments to reconcile net income to net cash flows from operating activities:
|
|
|
|
|
|
|
||||||
|
9, 12, 13, 16
|
Depreciation and amortization
2
|
356.9
|
|
|
417.5
|
|
|
422.7
|
|
|
||
|
11, 12, 13
|
Impairment
|
3.5
|
|
|
9.0
|
|
|
15.4
|
|
|
||
|
13
|
Loss on disposal of property, plant and equipment
3
|
5.2
|
|
|
2.8
|
|
|
3.6
|
|
|
||
|
19, 24
|
Share-based payments
|
47.7
|
|
|
53.1
|
|
|
46.3
|
|
|
||
|
6
|
Allowance for doubtful receivables
|
3.2
|
|
|
7.8
|
|
|
11.2
|
|
|
||
|
8
|
Allowance for obsolete inventory
|
73.0
|
|
|
120.1
|
|
|
218.2
|
|
|
||
|
21
|
Deferred income taxes
|
13.4
|
|
|
(8.4
|
)
|
|
(238.5
|
)
|
|
||
|
10
|
Equity method investments
4
|
—
|
|
36.4
|
|
61.6
|
|
|||||
|
Changes in assets and liabilities:
|
|
|
|
|
|
|
||||||
|
6
|
Accounts receivable
|
213.4
|
|
|
(1,136.4
|
)
|
|
201.2
|
|
|
||
|
7
|
Finance receivables
|
(62.9
|
)
|
|
237.0
|
|
|
(664.9
|
)
|
|
||
|
8
|
Inventories
3,5
|
5.4
|
|
|
(284.1
|
)
|
|
(515.7
|
)
|
|
||
|
9
|
Other assets
|
(122.1
|
)
|
|
(169.4
|
)
|
|
(404.0
|
)
|
|
||
|
15
|
Accrued and other liabilities
|
(27.0
|
)
|
|
90.9
|
|
|
237.7
|
|
|
||
|
Accounts payable
|
50.9
|
|
|
266.6
|
|
|
97.9
|
|
|
|||
|
21
|
Current tax assets and liabilities
|
93.4
|
|
|
(151.8
|
)
|
|
13.1
|
|
|
||
|
23
|
Contract assets and liabilities
|
(546.0
|
)
|
260.5
|
|
975.3
|
|
|||||
|
Net cash provided by operating activities
|
1,665.9
|
|
|
1,818.3
|
|
|
3,072.7
|
|
|
|||
|
|
|
|
|
|
|
|
||||||
|
Cash Flows from Investing Activities
|
|
|
|
|
|
|
||||||
|
13
|
Purchase of property, plant and equipment
5
|
(316.3
|
)
|
|
(338.9
|
)
|
6
|
|
(574.0
|
)
|
6,7
|
|
|
12
|
Purchase of intangible assets
|
(8.4
|
)
|
|
(19.1
|
)
|
|
(35.5
|
)
|
|
||
|
5
|
Purchase of short-term investments
|
(2,520.0
|
)
|
|
(1,129.3
|
)
|
|
(918.1
|
)
|
|
||
|
5
|
Maturity of short-term investments
|
2,320.0
|
|
|
1,250.0
|
|
|
1,034.1
|
|
|
||
|
Cash from (used for) derivative financial instruments
|
(15.0
|
)
|
|
27.0
|
|
|
(2.4
|
)
|
|
|||
|
Loans issued and other investments
|
—
|
|
|
(0.6
|
)
|
|
(1.0
|
)
|
|
|||
|
13
|
Repayment on loans
|
(7.4
|
)
|
1.6
|
|
5.4
|
|
|||||
|
10
|
Acquisition of equity method investments
|
—
|
|
(1,019.7
|
)
|
—
|
|
|||||
|
2
|
Acquisition of subsidiaries (net of cash acquired)
|
(2,641.3
|
)
|
|
—
|
|
|
—
|
|
|
||
|
Net cash used in investing activities
|
(3,188.4
|
)
|
|
(1,229.0
|
)
|
|
(491.5
|
)
|
|
|||
|
|
|
|
|
|
|
|
||||||
|
Cash Flows from Financing Activities
|
|
|
|
|
|
|
||||||
|
28
|
Dividend paid
|
(445.9
|
)
|
|
(516.7
|
)
|
|
(597.1
|
)
|
|
||
|
28, 29
|
Purchase of treasury shares
|
(400.0
|
)
|
|
(500.0
|
)
|
|
(1,146.2
|
)
|
|
||
|
2
|
Net proceeds from issuance of shares
|
582.7
|
|
8
|
|
50.6
|
|
|
|
21.8
|
|
|
|
16
|
Net proceeds from issuance of notes
|
2,230.6
|
|
9
|
|
—
|
|
|
—
|
|
|
|
|
16
|
Repayment of debt
|
(4.7
|
)
|
|
(243.0
|
)
|
|
(2.8
|
)
|
7
|
||
|
19, 21
|
Tax benefit (deficit) from share-based payments
|
0.9
|
|
|
—
|
|
|
—
|
|
|
||
|
Net cash from (used in) financing activities
|
1,963.6
|
|
|
(1,209.1
|
)
|
|
(1,724.3
|
)
|
|
|||
|
|
|
|
|
|
|
|
|
|
|
|||
|
Net cash flows
|
441.1
|
|
|
(619.8
|
)
|
|
856.9
|
|
|
|||
|
Effect of changes in exchange rates on cash
|
7.1
|
|
|
(28.1
|
)
|
|
5.2
|
|
|
|||
|
Net increase (decrease) in cash and cash equivalents
|
448.2
|
|
|
(647.9
|
)
|
|
862.1
|
|
|
|||
|
5
|
Cash and cash equivalents at beginning of the year
|
2,458.7
|
|
|
2,906.9
|
|
|
2,259.0
|
|
|
||
|
5
|
Cash and cash equivalents at end of the year
|
2,906.9
|
|
|
2,259.0
|
|
|
3,121.1
|
|
|
||
|
Supplemental Disclosures of Cash Flow Information:
|
|
|
|
|
|
|
||||||
|
Interest paid
|
(55.7
|
)
|
|
(91.4
|
)
|
|
(61.0
|
)
|
|
|||
|
Income taxes paid
|
(115.9
|
)
|
|
(475.0
|
)
|
|
(554.4
|
)
|
|
|||
|
|
|
|
|
|
|
|
|
|
||||
ASML INTEGRATED REPORT 2018
100
|
1.
|
As of January 1, 2018, ASML has adopted the new Revenue Recognition Standard (ASC 606) and Lease Standard (ASC 842). The comparative numbers have been adjusted to reflect these changes in accounting policies, see Note 1 General information / summary of significant accounting policies.
|
|
2.
|
In
2018
,
depreciation and amortization includes
EUR 315.4 million
of
depreciation of property, plant and equipment
(
2017
:
EUR 308.2 million
,
2016
:
EUR 290.8 million
),
EUR 103.7 million
of
amortization of intangible assets
(
2017
:
EUR 105.5 million
,
2016
:
EUR 63.5 million
) and
EUR 3.6 million
of
amortization of underwriting commissions and discount related to the bonds and credit facility
(
2017
:
EUR 3.8 million
,
2016
:
EUR 2.6 million
).
|
|
3.
|
In
2018
, an amount of
EUR 70.8 million
(
2017
:
EUR 45.8 million
,
2016
:
EUR 22.8 million
)
of the disposal of property, plant and equipment relates to non-cash transfers to inventory
.
Since the transfers between inventory and property, plant and equipment are non-cash events, these are not reflected in
these
Consolidated Statements of Cash Flows
. Additionally, in
2018
, an amount of
EUR 54.7 million
of land and buildings was reclassified to other assets. See
Note 13 Property, plant and equipment
.
|
|
4.
|
Equity method investments
includes the profit (loss) related to
equity method investments,
dividends received from
equity method investments
and capitalization of
R&D and supply chain support funding.
|
|
5.
|
In 2018, an amount of
EUR 59.8 million
(
2017
:
EUR 13.4 million
,
2016
:
EUR 21.6 million
)
of the additions in property, plant and equipment relates to non-cash transfers from inventory. Since the transfers between inventory and property, plant and equipment are non-cash events, these are not reflected in
these Consolidated Statements of Cash Flows. See
Note 13 Property, plant and equipment
.
|
|
6.
|
In
2018
, an amount of
EUR 191.6 million
(
2017
:
EUR 36.5 million
) of the purchase of property, plant and equipment relates to funding provided for tooling to our
equity method investment
. This funding is not reflected as addition in our movement schedule of property, plant and equipment, see
Note 13 Property, plant and equipment
, but is presented as part of the other assets
. For further details regarding our
equity method investments
see
Note 10 Equity method investments
.
|
|
7.
|
In 2018, an amount of
EUR 24.5 million
of the purchase of property, plant and equipment relates to exercising the purchase option of our headquarters in Veldhoven in June 2018. This cash outflow is not reflected as addition in our movement schedule of property, plant and equipment as it was previously recognized as property, plant and equipment as Koppelenweg I B.V. was a VIE. See
Note 13 Property, plant and equipment
.
|
|
8.
|
In 2016, net proceeds from issuance of shares include an amount of
EUR 536.6 million
which is included in the consideration transferred for the acquisition of HMI.
See
Note 2 Business combinations
.
|
|
9.
|
In 2016, net proceeds from issuance of notes relate to the total cash proceeds of
EUR 2,230.6 million
(net of incurred transaction costs) from the issuance of our
EUR 500 million
0.625 percent
senior notes due
2022
, our
EUR 1,000 million
1.375 percent
senior notes due
2026
and our
EUR 750 million
1.625 percent
senior notes due
2026
.
|
ASML INTEGRATED REPORT 2018
101
Notes to the Consolidated Financial Statements
1
. General information / summary of significant accounting policies
ASML, with its corporate headquarters in Veldhoven, the Netherlands, is engaged in the development, production, marketing, selling and servicing of advanced semiconductor equipment. ASML’s principal operations are in the Netherlands, the US and Asia.
Our shares are listed for trading in the form of registered shares on Euronext Amsterdam and on NASDAQ. The principal trading market of our ordinary shares is Euronext Amsterdam.
Basis of preparation
The accompanying Consolidated Financial Statements are stated in
millions
of euros
unless indicated otherwise.
The accompanying Consolidated Financial Statements have been prepared in conformity with
US GAAP
.
We have reclassified certain prior period amounts to align with the current period presentation.
Use of estimates
The preparation of
our
Consolidated Financial Statements in conformity with
US GAAP
requires
management
to make estimates and assumptions that affect the reported amounts of assets and liabilities and the disclosure of contingent assets and liabilities on the
balance sheet dates
, and the reported amounts of net sales and costs during the reported periods.
Actual results could differ from those estimates.
We evaluate our estimates continuously and we base our estimates on historical experience and on various other assumptions that we believe to be reasonable under the circumstances. Actual results may differ from these estimates if the assumptions prove incorrect. To the extent there are material differences between actual results and these estimates, our future results could be materially and adversely affected.
We believe that the accounting policies described below require us to make significant judgments and estimates in the preparation of our
Consolidated Financial Statements. Our most critical accounting estimates include:
|
•
|
Revenue recognition
|
|
•
|
Business combinations
|
|
•
|
Inventories
|
|
•
|
Income taxes
|
|
•
|
Contingencies and litigation
|
|
•
|
Lease accounting
|
|
•
|
Evaluation of long-lived assets for impairment
|
Principles of consolidation
The Consolidated Financial Statements include the Financial Statements of ASML Holding N.V. and all of its subsidiaries and the
variable interest entity
of which ASML was the primary beneficiary until June 29, 2018.
All intercompany profits, balances and transactions have been eliminated in the consolidation.
Subsidiaries
Subsidiaries are all entities over which ASML has the control to govern financial and operating policies generally accompanying a shareholding of more than
50 percent
of the outstanding voting rights. As from the date that these criteria are met, the financial data of the relevant subsidiaries are included in the consolidation.
Business combinations
Acquisitions of subsidiaries are included on the basis of the acquisition method. The cost of acquisition is measured based on the consideration transferred at fair value, the fair value of identifiable assets distributed and the fair value of liabilities incurred or assumed at the acquisition date (i.e., the date which we obtain control). The excess of the costs of an acquired subsidiary over the net of the amounts assigned to identifiable assets acquired and liabilities incurred or assumed, is capitalized as goodwill. Acquisition-related costs are expensed when incurred in the period they arise or the service is received.
Variable interest entities
We assess whether we have a controlling financial interest in any variable interest entity. We consolidate a variable interest entity when we have a variable interest that provides us with a controlling financial interest. We are deemed to have a controlling financial interest in a variable interest entity if both of the following characteristics are met: a) the power to direct the activities of a variable interest entity that most significantly impact the variable interest entity‘s economic performance and b) the obligation to absorb losses of the variable interest entity that could potentially be significant to the variable interest entity or the right to receive benefits from the variable interest entity that could potentially be significant to the variable interest entity.
ASML INTEGRATED REPORT 2018
102
Foreign currency translation
The financial information for subsidiaries outside the euro-zone is measured using a mix of local currencies or the euro as the functional currency. The Financial Statements of those foreign subsidiaries are translated into euros in the preparation of ASML’s Consolidated Financial Statements. Assets and liabilities are translated into euros at the exchange rate on the respective balance sheet dates. Income and costs are translated into euros based on the average exchange rate for the corresponding period. The resulting translation adjustments are recorded directly in shareholders’ equity.
Derivative financial instruments
We use derivative financial instruments for the management of foreign currency risks and interest rate risks. We measure all derivative financial instruments based on fair values derived from market prices of the instruments. We adopt hedge accounting for hedges that are highly effective in offsetting the identified hedged risks taking into account required effectiveness criteria.
Derivatives are initially recognized at fair value on the date a derivative contract is entered into and subsequently remeasured. The method of recognizing the resulting gain or loss depends on whether the derivative is designated as a hedging instrument, and if so, the nature of the item being hedged. We designate derivatives as one of the following:
|
•
|
A hedge of an exposure relating to changes in the fair value of a recognized asset or liability, that is attributable to a particular risk (fair value hedge).
|
|
•
|
A hedge of an exposure relating to the variability in the cash flows of a recognized asset or liability, or of a forecasted transaction, that is attributable to a particular risk (cash flow hedge).
|
|
•
|
A hedge of the foreign currency exposure relating to a net investment in a foreign operation (net investment hedge).
|
We document at the inception of the transaction the relationship between hedging instruments and hedged items, as well as our risk management objectives and strategy for undertaking various hedging transactions. We also document, both at hedge inception and on an ongoing basis, whether derivatives that are used in hedging transactions are highly effective in offsetting changes in fair values or cash flows of hedged items. The cash flows resulting from the derivative financial instruments are classified in the
Consolidated Statements of Cash Flows
according to the nature of the hedged item.
Fair value hedge
Changes in the fair value of a derivative financial instrument, that is designated and qualified as a fair value hedge, along with the gain or loss on the hedged asset or liability that is attributable to the hedged risk, are recorded in the
Consolidated Statements of Operations.
Hedge accounting is discontinued when we revoke the hedging relationship, the hedging instrument expires or is sold, terminated or exercised, or no longer qualifies for hedge accounting. The adjustment to the carrying amount of the hedged item arising from the hedged risk is amortized to the
Consolidated Statements of Operations
from that date.
Interest rate swaps that are being used to hedge the fair value of fixed loan coupons payable are designated as fair value hedges. The change in fair value is intended to offset the change in the fair value of the underlying fixed loan coupons, which is recorded accordingly. The gain or loss relating to the ineffective portion of interest rate swaps hedging fixed loan coupons payable is recognized in the
Consolidated Statements of Operations as interest and other, net.
Cash flow hedge
Changes in the fair value of a derivative that is designated and qualified as a cash flow hedge are recorded in OCI
, net of taxes,
until the underlying hedged transaction is recognized in the
Consolidated Statements of Operations.
In the event that the underlying hedge transaction will not occur within the specified time period,
the gain or loss on the related cash flow hedge is released from OCI and included in the Consolidated Statements of Operations, unless extenuating circumstances exist that are related to the nature of the forecasted transaction and are outside our control or influence and which cause the forecasted transaction to be probable of occurring on a date that is beyond the specified time period.
Foreign currency hedging instruments that are being used to hedge cash flows related to
forecasted
sales or purchase transactions in non-functional currencies are designated as cash flow hedges. The gain or loss relating to the ineffective portion of the foreign currency hedging instruments is recognized in the
Consolidated Statements of Operations
in net sales or cost of sales.
Interest rate swaps that are being used to hedge changes in the variability of future interest
cash flows to certain of our operating lease obligations
are designated as cash flow hedges.
The changes in fair value of the derivatives are intended to offset changes in future interest cash flows of such operating lease obligations.
The gain or loss relating to the ineffective portion of interest rate swaps hedging the variability of future interest cash flows is recognized in the
Consolidated Statements of Operations as interest and other, net.
Net investment hedge
Foreign currency hedging instruments that are being used to hedge changes in the value of a net investment are designated as
net investment hedges
. Changes in the fair value of a derivative that is designated and qualifies as a
net investment hedge
are recorded in
other comprehensive income
. The gain or loss relating to the ineffective portion is recognized in the
Consolidated Statements of Operations
as interest and other, net.
Gains and losses accumulated in
OCI
are recognized in the
Consolidated Statements of Operations
when the foreign operation is (partially) disposed or sold.
ASML INTEGRATED REPORT 2018
103
Cash and cash equivalents
Cash and cash equivalents consist primarily of highly liquid investments, such as bank deposits, money market funds and interest-bearing bank accounts with
insignificant interest rate risk and remaining maturities of
3 months
or less at the date of acquisition.
Short-term investments
Investments with remaining maturities longer than
3 months
and less than
1 year
at the date of acquisition are presented as short-term investments. Gains and losses other than impairments, interest income and foreign exchange results, are recognized in OCI until the short-term investments are derecognized. Upon derecognition, the cumulative gain or loss recognized in OCI, is recognized in the
Consolidated Statements of Operations.
Accounts receivable
Accounts receivable are measured at fair value and are subsequently measured at amortized cost using the effective interest rate method, less allowance for doubtful debts.
Finance receivable
Finance receivables consist of receivables in relation to
sales-type
leases. We perform ongoing credit evaluations on our customers’ financial condition. We periodically review whether an allowance for credit losses is needed by considering factors such as historical payment experience, credit quality, the aging of the finance receivables balances,
and current economic conditions that may affect a customer’s ability to pay.
Inventories
Inventories are stated at the lower of cost (applying the first-in, first-out method) or
net realizable value.
Cost includes net prices paid for materials purchased, charges for freight and customs duties, production labor cost and factory overhead
.
Allowances are made for defect, obsolete or excess inventory
.
Allowances for inventory are determined based on the expected demand which is derived from sales forecasts, technical obsolescence as well as the expected net realizable value of the inventory.
Equity method investments
Equity investments, through which we are able to exercise significant influence but do not control, are accounted for using the equity method and presented on our
Consolidated Balance Sheets within equity method investments
. The difference between the cost of our investment and our proportionate share of the carrying value of the
equity method investments’
underlying net assets as of the acquisition date is the basis difference. The basis difference is allocated to the identifiable assets and liabilities based on their fair value as of the acquisition date (i.e., the date which we obtain significant influence), with the excess costs of the investment over our proportional fair value of the identifiable assets and liabilities being equity method goodwill.
Under the equity method, after initial recognition at cost, our
equity method investments
are adjusted for our proportionate share of the profit or loss and other comprehensive income of the
equity method investments
, recognized on a one-quarter time lag and presented within profit (loss)
related to equity method investments
. Our proportionate share of the profit or loss of the
equity method investments
is adjusted for any differences in accounting principles and policies, basis difference adjustments and intra-entity profits. Receipt of dividends reduces the
equity method investments
, which is presented as an operating cash flow based on the nature of the distributions.
Goodwill
Goodwill represents the excess of the costs of an acquisition over the fair value of the amounts assigned to assets acquired and liabilities incurred or assumed of the acquired subsidiary at the date of acquisition. Goodwill on acquisition of subsidiaries is allocated to
reporting units
for the purpose of impairment testing. The allocation is made to those
reporting units
that are expected to benefit from the business combination in which the goodwill arose.
Goodwill is stated at cost less accumulated impairment losses.
Other intangible assets
Other intangible assets include
brands, intellectual property, developed technology, customer relationships, and other.
Other intangible assets are stated at cost, less accumulated amortization and accumulated impairment losses.
Amortization is calculated using the straight-line method based on the estimated useful lives of the assets.
The following table presents the estimated useful lives of our finite-lived other intangible assets:
|
Category
|
Estimated useful life
|
|
Brands
|
20 years
|
|
Intellectual property
|
3 - 10 years
|
|
Developed technology
|
6 - 15 years
|
|
Customer relationships
|
8 - 18 years
|
|
Other
|
2 - 6 years
|
|
|
|
ASML INTEGRATED REPORT 2018
104
Property, plant and equipment
Property, plant and equipment are stated at cost, less accumulated depreciation and accumulated impairment losses. Costs of assets manufactured by ASML include direct manufacturing costs, production overhead and interest costs incurred for qualifying assets during the construction period. Depreciation is calculated using the straight-line method based on the estimated useful lives of the related assets. In the case of leasehold improvements, the estimated useful lives of the related assets do not exceed the remaining term of the corresponding leases.
The following table presents the estimated useful lives of our property, plant and equipment:
|
Category
|
Estimated useful life
|
|
Buildings and constructions
|
5 - 45 years
|
|
Machinery and equipment
|
1 - 5 years
|
|
Leasehold improvements
|
1 - 10 years
|
|
Furniture, fixtures and other equipment
|
3 - 5 years
|
|
|
|
Land is not depreciated.
Evaluation of long-lived assets for impairment
Long-lived assets include equity method investments, goodwill, other intangible assets and property, plant and equipment.
Our equity method investments are tested for impairment whenever events or changes in circumstances indicate that the carrying amount of the equity method investments may not be recoverable. We remeasure our equity method investments at fair value when they are deemed to be other-than-temporarily impaired.
Goodwill is tested for impairment annually or whenever events or changes in circumstances indicate that the carrying amount of the goodwill may not be recoverable. These events or circumstances could include a significant change in the business climate, legal factors, operating performance indicators, competition, or sale or disposition of a significant portion of a reporting unit. To determine whether it is necessary to perform the quantitative goodwill impairment test, we first assess qualitative factors. If we determine that it is more likely than not (a likelihood of more than
50 percent
)
that the fair value of a reporting unit is less than its carrying amount (including goodwill), the quantitative goodwill impairment test is performed. The recoverability of goodwill is tested by comparing the carrying amount of the reporting unit including goodwill with the fair value of the reporting unit. If the carrying amount of the reporting unit is higher than the fair value of the reporting unit, an impairment loss shall be recognized in an amount equal to that excess, limited to the total amount of goodwill allocated to that reporting unit.
Finite-lived other intangible assets and property, plant and equipment are reviewed for impairment whenever events or changes in circumstances indicate that the carrying amount of those assets may not be recoverable. An impairment loss is recognized only if the carrying amount of finite-lived other intangible assets or property, plant and equipment is not recoverable and exceeds its fair value. The carrying amount is not recoverable if it exceeds the sum of the (un)discounted forecasted cash flows resulting from the use and eventual disposition of such asset. An impairment loss is measured as the amount by which the carrying amount exceeds its fair value.
In determining the fair value of long-lived assets, we make estimates about future cash flows. These estimates are based on our strategic plan updated with the latest available projections of the semiconductor industry and our income and cost expectations, which are consistent with the plans and estimates that we use to manage our business. We also make estimates and assumptions concerning our WACC. It is possible that actual results may differ from our plans, estimates and assumptions. Future adverse changes in market conditions may also require impairment of certain long-lived assets, which could have a material adverse effect on our financial condition and results of operations.
High NA agreement with Carl Zeiss SMT GmbH
On
November 3, 2016
we agreed with Carl Zeiss SMT GmbH to support their R&D costs, capital expenditures and other supply chain investments, in respect of High NA, beginning in 2016.
R&D and supply chain support costs are capitalized for
24.9 percent
of this funding because it directly benefits us through our investment in Carl Zeiss SMT Holding GmbH & Co. KG. The amount capitalized is presented within
equity method investments
. The remainder of this support relating to supply chain support costs is charged to the cost of sales as incurred, the part related to R&D costs is charged to the operating expenses as incurred.
The support provided related to capital expenditures consists of tooling and facilities. Funding provided for facilities is accounted for in property, plant & equipment as we are considered the accounting owner during the construction period. The support provided for tooling is determined to be a capital lease. Support provided for tooling prior to the asset being put into use is recorded in other assets and transferred into property, plant & equipment when put into use.
ASML INTEGRATED REPORT 2018
105
Revenue From Contracts With Customers
We measure revenue based on the consideration specified in the contracts with our customers, adjusted for any significant financing components, and excluding any tax amounts collected on behalf of third parties. We recognize revenue when we satisfy a performance obligation by transferring control over a good or service to our customer. Taxes assessed by a governmental authority that are imposed on a specific revenue-producing transaction, that are collected by us from our customers, are excluded from revenue.
We bill our customers for, and recognize as net sales, any charges for shipping and handling costs. The related costs are recognized as cost of sales. For certain contracts and constructive obligations resulting from these arrangements, for which a loss is evident, we recognize the anticipated loss to the extent the costs of completing these contracts and constructive obligations exceed the amount of the contract price. When we satisfy these obligations, we utilize the related liability.
We generate revenue from the sale of integrated patterning solutions for the semiconductor industry, which mainly consist of systems, system related options and upgrades, other holistic lithography solutions and customer services. The main portion of our net sales is derived from contractual arrangements with our customers that have multiple deliverables (performance obligations), which mainly include the sale of our systems, system related options, installation, training and extended and enhanced (optic) warranty.
The main portion of our system sales results from volume purchase agreements, in which we offer customers discounts in the normal course of sales negotiations. As part of these volume purchases agreements, we may also offer free goods or services and credits that can be used towards future purchases. Occasionally, systems, with the related extended and enhanced (optic) warranties, installation and training services, are ordered individually. Our system sales agreements do not include a general right of return.
For bundled packages, we account for individual goods and services, including the free or discounted goods or services, separately if they are distinct - i.e. if a product or service is separately identifiable from other items in the bundled package and if a customer can benefit from it on its own or with other resources that are readily available to the customer. The consideration paid for our performance obligations is typically fixed, unless specifically noted in the nature of the performance obligations. At times the total consideration of the contract can be dependent on the final volume of systems ordered by the customer. Payment is typically due 15-45 days after shipment or completion of the service unless described otherwise. The total consideration of the contract is allocated between all distinct performance obligations in the contract based on their stand-alone selling prices. The stand-alone selling prices are determined based on other stand-alone sales that are directly observable, when possible. However, for the majority of our performance obligations these are not available. If no directly observable evidence is available, the stand-alone selling price is estimated using the adjusted market assessment approach. These estimates are considered significant judgments.
Variable consideration is estimated at contract inception for each performance obligation, and subsequently updated each quarter, using either the expected value method or most likely amount method, whichever is determined to best predict the consideration to be collected from the customer. Variable consideration is only included in the transaction price if it is considered probable that a significant revenue reversal will not occur.
In certain scenarios when entering into a volume purchase agreement, free goods or services are provided directly or through a voucher that can be used on future contracts. Consideration from the contract will be allocated to these performance obligations and revenue recognized when control transfers based on the nature of the goods or service provided.
Options to buy goods or services in addition to the purchase commitment are assessed to determine if they provide a material right to the customer that they would not have received if they had not entered into this contract. Each option to buy additional goods or services provided at a discount from the stand-alone selling price is considered a material right. The discount offered from the stand-alone selling price will be allocated from the consideration of the other goods and services in the contract if it is determined the customer will exercise the option to buy, adjusted for the likelihood. Revenue will be recognized in line with the nature of the related goods or services. If it is subsequently determined the customer will not exercise the option to buy, or the option expires, revenue will be recognized.
Occasionally we may enter into a bill-and-hold transaction where we invoice a customer for a system that is ready for delivery but not shipped to the customer until a later date, based on customer’s request. Transfer of control is determined to have occurred only when there is a substantive reason for the arrangement, the system is separately identified as belonging to the customer, the good has been accepted by the customer and is ready for delivery, and we do not have the ability to direct the use of the system.
ASML INTEGRATED REPORT 2018
106
|
Goods or services
|
Nature, timing of satisfying the performance obligations, and significant payment terms
|
|
New systems (established technologies)
|
New systems sales include i-line, KrF, ArF, ArFi and EUV related systems, along with the related factory options ordered with the base system, as well as metrology and inspection systems. Prior to shipment, the majority of our systems undergo a Factory Acceptance Test (FAT) in our cleanroom facilities, effectively replicating the operating conditions that will be present on the customer’s site, in order to verify whether the system meets its standard specifications and any additional technical and performance criteria agreed with the customer. A system is shipped only after all contractual specifications are met or discrepancies from agreed upon specifications are waived and customer signoff is received for delivery. Each system’s performance is re-tested through a Site Acceptance Test (SAT) after installation at the customer site. We have never failed to successfully complete installation of a system at a customer’s premises; therefore, acceptance at FAT is considered to be proven for established technologies with a history of successful customer acceptances at SAT (equal or better than FAT).
|
|
Transfer of control of a system undergoing FAT, and recognition of revenue related to this system, will occur upon delivery of the system, depending on the Incoterms.
|
|
|
Transfer of control of a system not undergoing a FAT, and recognition of revenue related to this system, will occur upon customer acceptance of the system at SAT.
|
|
|
Used systems
|
We have no significant repurchase commitments in our general sales terms and conditions, however from time to time we repurchase systems that we have manufactured and sold and, following refurbishment, will resell to other customers. This repurchase decision is mainly driven by market demand expressed by other customers and less frequently by explicit or implicit contractual arrangements relating to the initial sale. We consider reasonable offers from any vendor, including customers, to repurchase used systems that we can refurbish, resell, and install as part of our normal business operations.
|
|
Transfer of control of the systems, and related revenue recognition, will occur either upon delivery of the system to the carrier or upon arrival of the system to the customer’s loading dock, depending on the Incoterms and if a FAT was performed prior to shipment. If no FAT was performed, then transfer of control will be upon customer acceptance at SAT. If a FAT was performed, then transfer of control will be upon customer acceptance at FAT, refer to "New systems (established technologies)".
|
|
|
Field upgrades and options (system enhancements)
|
Field upgrades and options mainly relate to goods and services that are delivered for systems already installed in the customer factories. Certain upgrades require significant installation efforts, enhancing an asset the customer controls, therefore resulting in transfer of control over the period of installation, measured using the cost incurred method which is estimated using labor hours, as this best depicts the satisfaction of our obligation in transferring control. The options and other upgrades that do not require significant installation effort transfer control upon delivery, depending on the Incoterms.
|
|
As long as we are not able to make a reliable estimate of the total efforts needed to complete the upgrade, we only recognize revenue to cover costs incurred. Margin will be realized at the earlier of us being able to make a reliable estimate or completion of the upgrade.
|
|
|
New product introduction
|
New product introductions are typically newly developed options to be used within our systems. Transfer of control and revenue recognition for new product introductions occurs upon customer acceptance (generally at SAT). Once there is an established history of successful installation and customer acceptance, revenue will be recognized consistent with other systems and goods after transfer of control.
|
|
Installation
|
Installation is provided within the selling price of a system. Installation is considered to be distinct as it does not significantly modify the system being purchased and the customer or a third party could be capable of performing the installation themselves if desired. Transfer of control takes place over the period of installation from delivery through SAT, measured on a straight-line basis, as our performance is satisfied evenly over this period of time.
|
|
As long as we are not able to make a reliable estimate of the total efforts needed to complete the installation, we only recognize revenue to cover costs incurred. Margin will be realized at the earlier of us being able to make a reliable estimate or installation completion.
|
|
|
Warranties
|
We provide standard warranty coverage on our systems for 12 months, providing labor and non-consumable parts necessary to repair our systems during these warranty periods. These standard warranties cannot be purchased and do not provide a service in addition to the general assurance the system will perform as promised. As a result, no revenue is allocated to these standard warranties.
|
|
Both the extended and enhanced (optic) warranties on our systems are accounted for as a separate performance obligation, with transfer of control taking place over the warranty period, measured on a straight-line basis, as this is a stand-ready obligation.
|
|
|
Time-based licenses and related service
|
Time-based licenses relate to software licenses and the related service which are sold for a period of time. The licenses and the related service are not considered to be individually distinct and the transfer of control takes place over the license term, measured on a straight-line basis, as our performance is satisfied evenly over this period of time. Payments are made in installments throughout the license term.
|
ASML INTEGRATED REPORT 2018
107
|
Goods or services
|
Nature, timing of satisfying the performance obligations, and significant payment terms
|
|
Application projects
|
Application projects are node transition and consulting projects which at times may be provided as free service within a volume purchase agreement. Measuring satisfaction of this performance obligation is performed through an input method based on the labor hours expended relative to the estimated total labor hours as this best depicts the transfer of control of these kind of services.
|
|
As long as we are not able to make a reliable estimate of the total efforts needed to complete these kind of projects, we only recognize revenue to cover costs incurred. Margin will be realized at the earlier of us being able to make a reliable estimate or project completion.
|
|
|
Service contracts
|
Service contracts are entered into with our customers to support our systems used in their ongoing operations during the systems lifecycle, typically in the form of full-service agreements, limited manpower agreements, other labor agreements, parts availability or parts usage agreements. These services are typically for a specified period of time. Control transfers over this period of time, measured on a straight-line basis, as these are stand-ready obligations, with an exception for the labor hour pool service contracts for which we recognize revenue in line with invoicing, using the practical expedient in ASC 606-10-55-18. Invoicing is typically performed monthly or quarterly throughout the service period, typically payable within 15-45 days.
|
|
Billable parts and labor
|
Billable labor represents maintenance services to our systems installed in the customer’s factories while in operation, through purchase orders from our customer. Control over these services is transferred to the customer upon receipt of customer sign-off.
|
|
Billable parts represent spare parts including optical components relating to our systems installed in the customer’s factories while in operation, through purchase orders from our customer.
|
|
|
Billable parts can be:
|
|
|
•
Sold as direct spare parts, for which control transfers upon the relevant Incoterms; or
|
|
|
•
Sold as part of maintenance services, for which control transfers upon receipt of customer sign-off.
|
|
|
Field projects (relocations)
|
Field projects represent mainly relocation services. Measuring satisfaction of this performance obligation is performed through an input method based on the labor hours expended relative to the estimated total labor hours as this best depicts the transfer of control of our service.
|
|
OnPulse Maintenance
|
OnPulse maintenance services are provided over a specified period of time on our light source systems. Payment is determined by the amount of pulses counted from each light source system, which is variable. Invoicing is monthly based on the pulses counted. Revenue is recognized in line with invoicing using the practical expedient in ASC 606-10-55-18.
|
Cost of sales
Cost of system and field option sales comprise direct product costs such as materials, labor, cost of warranty, depreciation, amortization, shipping and handling costs and related overhead costs.
Costs of service sales comprise direct service costs such as materials, labor, depreciation and overhead costs.
Lease arrangements - Lessee
We determine if an arrangement is a lease at inception. Determining whether a contract contains a lease requires judgment. In general, arrangements are considered to be a lease when all of the following apply:
|
•
|
It conveys the right to control the use of an identified asset for a period of time in exchange for consideration;
|
|
•
|
We have substantially all economic benefits from the use of the asset; and
|
|
•
|
We can direct the use of the identified asset.
|
Each lease arrangement we enter into is classified as either a finance lease or an operating lease, which is determined at lease commencement or at the modification of the lease arrangement and based upon the terms of each lease.
Lease assets and lease liabilities are recognized based on the present value of the future minimum lease payments over the lease term at commencement date. As our leases do not provide an implicit rate, we use our incremental borrowing rate based on the information available at commencement date in determining the present value of future payments. The right-of-use asset includes all lease payments made and initial direct costs incurred. Our lease terms may include options to extend or terminate the lease when it is reasonably certain that we will exercise that option.
For operating leases the lease expense for minimum lease payments is recognized on a straight-line basis over the lease term. For finance leases each lease payment is allocated between the liability and finance cost. The finance cost is charged to the Consolidated Statements of Operations over the lease period so as to produce a constant periodic rate of interest on the remaining balance of the liability for each period. The finance lease asset is depreciated over the shorter of the asset's useful life and the lease term on a straight-line basis.
ASML INTEGRATED REPORT 2018
108
We have lease agreements with lease and non-lease components, which are generally accounted for as a single lease component. For certain equipment and for leased warehouses we account for the lease and non-lease components separately. For warehouse leases the allocation of the consideration between lease and non-lease components is based on the relative stand-alone prices of lease components included in the lease contracts. Additionally, for car leases, we apply a portfolio approach to effectively account for the operating lease right-of-use assets and liabilities.
Operating leases are included in right-of-use assets and in accrued and other liabilities. Finance leases are included in property, plant and equipment and long-term debt.
Lease Arrangements - Lessor
We classify a lease as a sales-type when the lease meets any of the following criteria at lease commencement:
|
•
|
The lease transfers ownership of the underlying asset to the lessee by the end of the lease term;
|
|
•
|
The lease grants the lessee an option to purchase the underlying asset that the lessee is reasonably certain to exercise;
|
|
•
|
The lease term is for the major part of the remaining economic life of the underlying asset. However, if the commencement date falls at or near the end of the economic life of the underlying asset, this criterion shall not be used for purposes of classifying the lease;
|
|
•
|
The present value of the sum of the lease payments and any residual value guaranteed by the lessee that is not already reflected in the lease payments equals or exceeds substantially all of the fair value of the underlying asset; or
|
|
•
|
The underlying asset is of such a specialized nature that it is expected to have no alternative use to the lessor at the end of the lease term.
|
Revenue is recognized at commencement of the lease term of a sales-type lease. The present value of the lease payments is recognized as a finance receivable. The difference between the gross receivable and the present value of the receivable is unearned interest, which is recognized over time in the Consolidated Statements of Operations.
A lease is classified as an operating lease if the lease classification criteria (as described above) are not met. If we have offered our customers an operating lease arrangement, the contract consideration is recognized in the Consolidated Statements of Operations on a straight-line basis over the period of the lease.
Sales-type leases
Leases where substantially all the risks and rewards incidental to ownership of an asset are transferred to the lessee are classified as sales-type lease arrangements. If we have offered the customer a sales-type lease arrangement, revenue is recognized at commencement of the lease term. The difference between the gross finance receivable and the present value of the minimum lease payments is initially recognized as unearned interest and presented as a deduction to the gross finance receivable. Interest income is recognized in the Consolidated Statement of Operations over the term of the lease contract using the effective interest method.
Operating leases
Leases whereby all the risks and rewards incidental to ownership are not transferred to the lessee are classified as operating lease arrangements. If we have offered the customer an operating lease arrangement, the system is included in property, plant and equipment upon commencement of the lease. Revenue from operating lease arrangements is recognized in the Consolidated Statement of Operations on a straight-line basis over the term of the lease contract.
Warranty
We provide standard warranty coverage on our systems for
12 months
and on certain optic parts for
60 months
, providing labor and parts necessary to repair systems during the warranty period. The estimated warranty costs are accounted for by accruing these costs for each system upon recognition of the system sale. The estimated warranty costs are based on historical product performance and service records. We calculate the charge of average service hours and parts per system to determine the estimated warranty costs. On an annual basis, we assess, and update if necessary, our accounting estimates used to calculate the costs of the standard warranty coverage
.
Customer Co-Investment Program
In connection with the CCIP, we entered into investment agreements, shareholders agreements, NRE Funding Agreements and a commercial agreement with Participating Customers.
The investment agreements, shareholder agreements, NRE Funding Agreements and commercial agreement are accounted for as
a multiple-element arrangement with each of the Participating Customers. The following
two
separate elements are identified:
(1) the share issuance (governed by the investment agreements and the shareholder agreements) and (2) the NRE funding and commercial discounts and credits (governed by the NRE Funding Agreements and the commercial agreement with Intel).
The shares issued to the Participating Customers were recorded at fair value based on quoted share prices (
EUR 3,977.4 million
) with the remaining aggregate arrangement consideration allocated to the NRE funding and commercial discounts and credits. The difference between the fair value of the shares at the time of issuance and the subscription price of the shares (
EUR 39.91
) was recorded as a deduction from
shareholders’
equity upon issuance of the shares (
EUR 123.4 million
).
Shareholders’ equity
is increased to the fair value of the shares as the portion of the NRE funding allocable to the shares is received over the NRE funding period (
2013-2017
).
ASML INTEGRATED REPORT 2018
109
A significant related party relationship existed between ASML and Intel as a result of the equity investment made by Intel as part of the CCIP. Based on the commercial discounts and credits (governed by the commercial agreement with Intel) and the significant related party relationship that existed up to July 2, 2017, all NRE funding from Intel was deferred and recognized in the
Consolidated Statements of Operations
only when the commercial discounts and credits are earned.
Other income
The portion of the NRE funding from TSMC and Samsung not allocable to the shares issued to those Participating Customers under the CCIP was recognized in other income when the R&D costs relating to lithography projects were recognized over the NRE funding period (
2013-2017
).
Research and development costs and credits
Costs relating to R&D are charged to operating expenses as incurred.
ASML receives subsidies and other grants from several Dutch and international (inter-)governmental institutes (‘government grants’). These government grants that cover R&D costs relating to approved projects are recorded as R&D credits in the R&D costs in the Consolidated Statements of Operations.
Government grants are not recognized until there is reasonable assurance that ASML will comply with the conditions and that the grants will be received.
Government grants that are received as compensation for expenses or losses already incurred, or for the purpose of giving immediate financial support to ASML with
no
future related costs, are recognized in the Consolidated Statements of Operations in the period in which they become receivable.
Share-based payments
Compensation expenses in relation to share-based payments are recognized based upon the grant-date fair value of stock options and shares. The grant-date fair value of stock options is estimated using a Black-Scholes option valuation model. This Black-Scholes model requires the use of assumptions, including expected share price volatility, the estimated life of each award and the estimated dividend yield. The risk-free interest rate used in the model is determined, based on an index populated with euro-denominated European government agency bond with high credit ratings and with a life equal to the expected life of the equity-settled share-based payments. The grant-date fair value of shares is determined based on the closing price of our shares listed at Euronext Amsterdam on the grant-date.
The grant-date fair value of the equity-settled share-based payments is, based on the terms and conditions, expensed over the vesting period, based on our estimate of equity instruments that will eventually vest. At each
balance sheet
date, we revise our estimate of the number of equity instruments expected to vest. The impact of the revision of the original estimates, if any, is recognized in the
Consolidated Statements of Operations
in the period in which the revision is determined, with a corresponding adjustment
to shareholders’
equity.
Income taxes
The asset and liability method is used in accounting for income taxes. Under this method, deferred tax assets and liabilities are recognized for the tax effect of incurred net operating losses and for tax consequences attributable to differences between the balance sheet carrying amounts of existing assets and liabilities and their respective tax bases. If it is more likely than not that the carrying amounts of deferred tax assets will not be realized, a valuation allowance is recorded for the differences. Tax expense includes current taxes on profit as well as actual or potential withholding taxes on current and expected income from group companies.
Deferred tax assets and liabilities are measured using enacted tax rates expected to apply to taxable income in the years in which temporary differences are expected to be recovered or settled. The effect on deferred tax assets and liabilities of a change in tax rates is recognized in the Consolidated Statements of Operations in the period that includes the enactment date.
We recognize liabilities for uncertain tax positions based on a two-step process. The first step is to evaluate the tax position for recognition by determining if the weight of available evidence indicates that it is more likely than not that the position will be sustained on audit, including resolution of related appeals or litigation processes, if any. The second step is to measure the tax benefit as the largest amount that is more than
50 percent
likely of being realized upon settlement. While we believe we have appropriate support for the positions taken on our tax returns, we regularly assess the potential outcomes of examinations by tax authorities in determining the adequacy of our provision for income taxes, and adjust the income tax provision, income taxes payable and deferred taxes in the period in which the facts that give rise to a revision become known.
ASML INTEGRATED REPORT 2018
110
Contingencies and litigation
In connection with proceedings and claims, our management evaluates, based on the relevant facts and legal principles, the likelihood of an unfavorable outcome and whether the amount of the loss can be reasonably estimated. In most cases, management determined that either a loss was not probable or was not reasonably estimable. Significant subjective judgments were required in these evaluations, including judgments regarding the validity of asserted claims and the likely outcome of legal and administrative proceedings. The outcome of these proceedings, however, is subject to a number of factors beyond our control, most notably the uncertainty associated with predicting decisions by courts and administrative agencies. In addition, estimates of the potential costs associated with legal and administrative proceedings frequently cannot be subjected to any sensitivity analysis, as damage estimates or settlement offers by claimants may bear little or no relation to the eventual outcome. Finally, in any particular proceeding, we may agree to settle or to terminate a claim or proceeding in which we believe that it would ultimately prevail where we believe that doing so, when taken together with other relevant commercial considerations, is more effective than engaging in an expensive and protracted litigation, the outcome of which is uncertain.
We accrue for legal costs related to litigation in our
Consolidated Statements of Operations
at the time when the related legal services are actually provided to us.
Net income per ordinary share
Basic net income per ordinary share is calculated by dividing net income by the weighted average number of ordinary shares outstanding for that period. The dilutive effect is calculated using the treasury stock method. Excluded from the diluted weighted average number of shares outstanding calculation are cumulative preference shares contingently issuable to the preference share foundation, since they represent a different class of stock than the ordinary shares.
The basic and diluted net income per ordinary share has been calculated as follows:
|
Year ended December 31
|
2016
1
|
|
2017
1
|
|
2018
|
|
|
(in millions, except per share data)
|
EUR
|
|
EUR
|
|
EUR
|
|
|
Net income
|
1,557.8
|
|
2,066.7
|
|
2,591.6
|
|
|
Weighted average number of shares outstanding
|
425.6
|
|
429.8
|
|
424.9
|
|
|
Basic net income per ordinary share
|
3.66
|
|
4.81
|
|
6.10
|
|
|
Weighted average number of shares outstanding
|
425.6
|
|
429.8
|
|
424.9
|
|
|
Plus shares applicable to
|
|
|
|
|||
|
Options and conditional shares
|
2.1
|
|
1.8
|
|
1.5
|
|
|
Dilutive potential ordinary shares
|
2.1
|
|
1.8
|
|
1.5
|
|
|
Diluted weighted average number of shares
|
427.7
|
|
431.6
|
|
426.4
|
|
|
Diluted net income per ordinary share
2
|
3.64
|
|
4.79
|
|
6.08
|
|
|
1.
|
As of January 1, 2018, ASML has adopted the new Revenue Recognition Standard (ASC 606) and Lease Standard (ASC 842). The comparative numbers have been adjusted to reflect these changes in accounting policies, see Note 1 General information / summary of significant accounting policies.
|
|
2.
|
The calculation of diluted net income per ordinary share assumes the exercise of options issued under our stock option plans and the issuance of shares under our share plans for periods in which exercises or issuances would have a dilutive effect. The calculation of diluted net income per ordinary share does not assume exercise of options when exercise would be anti-dilutive.
|
Comprehensive income
Comprehensive income consists of net income and OCI, including unrealized gains and losses on financial
instruments, derivative financial instruments designated for cash flow hedge accounting, net
of taxes, and unrealized gains and losses on foreign currency translation and effective portion of hedges on net investments, net of taxes. OCI also contains gains and losses that are not included in net income (loss) related to the proportionate share of other comprehensive income from equity method investments.
ASML INTEGRATED REPORT 2018
111
New US GAAP accounting pronouncements adopted
During
2018
, ASML has adopted the following accounting pronouncements:
Adoption of ASC 606 "Revenue from Contracts with Customers"
In March 2014, the FASB issued ASU No. 2014-9 "Revenue From Contracts With Customers". The standard is a joint project of the FASB and the IASB,
to clarify the principles for recognizing revenue and to develop a common revenue standard for US GAAP and IFRS that would:
|
•
|
Remove inconsistencies and weaknesses in previous revenue requirements;
|
|
•
|
Provide a more robust framework for addressing revenue issues;
|
|
•
|
Improve comparability of revenue recognition practices across entities, industries, jurisdictions and capital markets;
|
|
•
|
Provide more useful information to users of financial statements through improved disclosure requirements; and
|
|
•
|
Simplify the preparation of financial statements by reducing the number of requirements to which an entity must refer.
|
We have closely assessed the impact of adopting
ASC 606
on our Consolidated Financial Statements by assessing all contracts that have an impact on net system sales and net service and field option sales over
2017
and
2016
.
We have finalized our assessment of all contracts based on which we have adopted
ASC 606
"Revenue from Contracts with Customers" with a date of the initial application of January 1, 2018. We have selected full retrospective adoption and therefore have restated all years presented in our Consolidated Financial Statements upon adoption. As a result, we have changed our accounting policy for revenue recognition as detailed below.
We applied
ASC 606
for the years ended December 31,
2016
and
2017
retrospectively using the practical expedients in paragraph
ASC 606-10-65-1(f)
, under which we:
|
•
|
Do not restate contracts that begin and are completed in the same annual or semi-annual reporting period;
|
|
•
|
Used the transaction price at the date the contract was completed rather than estimating variable consideration amounts in the comparative reporting periods;
|
|
•
|
Do not disclose the amount of consideration allocated to the remaining performance obligations or an explanation of when we expect to recognize that amount as revenue for all reporting periods presented before the date of the initial application - i.e. January 1, 2018; and
|
|
•
|
Reflect the aggregate effect of all modifications that occurred before January 1,
2016
when identifying the performance obligations, determining the transaction price and allocating the transaction price to the satisfied and unsatisfied performance obligations.
|
Applying these practical expedients does not have a significant impact on our adjusted annual financial results as the impact is limited to certain shifts of revenue recognition between periods due to not using the hindsight allowed by these practical expedients.
The details of the significant changes and quantitative impact of the changes are disclosed below:
|
A.
|
Allocation of consideration based on stand-alone selling price
|
We changed from allocating the consideration of a contract to the elements of the contract using the relative selling price
determined through VSOE or BESP in accordance with ASC 605
to allocating the consideration of a contract based on stand-alone selling prices determined using the adjusted market assessment approach in accordance with
ASC 606
. As a result, we consider customer discounts and credits, within volume purchase agreements, a reduction of the transaction price. Consequently, we allocate these customer discounts and credits ratably to the performance obligations based on the stand-alone selling prices.
As we have very limited sales on a stand-alone basis we have to make estimates to determine our stand-alone selling prices. For this we selected the adjusted market assessment approach. This estimate requires our judgment as we mainly enter into bundled arrangements and we sell specialized goods and services. Furthermore, we have no insight into the stand-alone selling prices of our competitors for comparable products and services. Therefore, we considered our pricing policies and practices, which are based on the value we provide to our customers. Our internal pricing policies result in a list price, which is for the majority of products only determined and set when the products or services are introduced. We conclude that these list prices generally do not reflect the stand-alone selling prices over the lifetime of the related product or services.
To determine the stand-alone selling prices for our products and services we used data of bundled arrangements over the last one to three years and derived the price for which each system model would be sold, on a stand-alone basis, from this data. We used the same relative step-down from the list price for options and services that are sold together with the system. For other services we used list prices, as these contracts typically have duration of one year and prices are updated periodically. For options that are not sold as part of a system for systems already installed at the customer, we used the contract data over the last three years and derived the price for which these options would be sold, on a stand-alone basis, from this data.
ASML INTEGRATED REPORT 2018
112
|
B.
|
Field upgrades
|
Transfer of control of field upgrades and options, that require significant installation efforts, was previously upon customer acceptance of the upgraded system. The new over-time revenue recognition requirement, in
ASC 606-10-25-27
regarding performance that enhances an asset the customer controls, results in revenue for these field upgrades and options to be recognized over time during the period of installation.
|
C.
|
Installation
|
Installation revenue was previously recognized upon completion and customer acceptance. It has been determined, in accordance with
ASC 606-10-25-27
, that the customer simultaneously consumes and receives the benefits provided by the performance of the installation. As a result, transfer of control takes place over the period of installation from delivery through customer acceptance, measured on a straight-line basis, as our performance is satisfied evenly over this period of time.
|
D.
|
Applications projects and Field projects (relocations)
|
Applications and Field project revenue was previously recognized upon completion and customer acceptance. It has been determined, in accordance with
ASC 606-10-25-27
, that the customer simultaneously consumes and receives the benefits provided by the performance of our services. As a result, the transfer of control occurs throughout the service period.
|
E.
|
Bill-and-hold transactions
|
Previously, in order to recognize revenue for a bill-and-hold transaction,
we required a fixed schedule of delivery,
as well as the buyer must have had a substantial business purpose for requesting the bill-and-hold transaction
, in combination with the other requirements of SAB Topic 13. In accordance with ASC 606-10-55-83,
we no longer require a fixed scheduled delivery and a customer’s explicit request.
|
F.
|
Options to buy as a material right
|
Options to buy goods or services, in addition to the purchase commitment, were previously not assessed as a separate element. These options are now assessed in order to determine if they provide a material right to the customer they would not have received if they had not entered into the contract. Each option to buy additional goods or services provided at a discount from the stand-alone selling price is considered a material right and will be recognized as revenues in accordance with
ASC 606-10-55-42.
|
G.
|
Contract assets and liabilities
|
The contract assets primarily relate to our rights to a consideration for goods or services delivered but not invoiced at the reporting date. The contract assets are transferred to receivables when invoiced and the rights become unconditional. The contract liabilities primarily relate to down payments, received on systems to be delivered, as well as deferred revenue from system shipments, based on the allocation of the consideration to the related performance obligations in the contract. This balance mainly consists of extended warranties, installation and other free goods or services provided as part of a volume purchase agreement.
The majority of our customer contracts contain both asset and liability positions. At the end of each reporting period, these positions are netted on a contract basis and presented as either an asset or a liability in the financial statements. Consequently, a contract balance can change between periods from a net contract asset balance to a net contract liability balance on the balance sheet.
ASML INTEGRATED REPORT 2018
113
The following tables summarize the impacts of the adoption of
ASC 606
on our
Consolidated Statements of Operations
and Comprehensive Income for the year ended December 31, 2017:
|
|
||||||
|
Year ended December 31, 2017
|
As previously reported
|
|
Adoption of ASC 606
|
|
As adjusted
|
|
|
(in millions, except per share data)
|
EUR
|
|
EUR
|
|
EUR
|
|
|
Net system sales
|
6,373.7
|
|
50.7
|
|
6,424.4
|
|
|
Net service and field option sales
|
2,679.1
|
|
(140.8
|
)
|
2,538.3
|
|
|
Total net sales
|
9,052.8
|
|
(90.1
|
)
|
8,962.7
|
|
|
Cost of system sales
|
(3,459.0
|
)
|
19.1
|
|
(3,439.9
|
)
|
|
Cost of service and field option sales
|
(1,517.1
|
)
|
14.5
|
|
(1,502.6
|
)
|
|
Total cost of sales
|
(4,976.1
|
)
|
33.6
|
|
(4,942.5
|
)
|
|
Gross profit
|
4,076.7
|
|
(56.5
|
)
|
4,020.2
|
|
|
|
|
|||||
|
Other income
|
95.8
|
|
—
|
|
95.8
|
|
|
Research and development costs
|
(1,259.7
|
)
|
—
|
|
(1,259.7
|
)
|
|
Selling, general and administrative costs
|
(416.6
|
)
|
—
|
|
(416.6
|
)
|
|
Income from operations
|
2,496.2
|
|
(56.5
|
)
|
2,439.7
|
|
|
Interest and other, net
|
(50.3
|
)
|
—
|
|
(50.3
|
)
|
|
Income before income taxes
|
2,445.9
|
|
(56.5
|
)
|
2,389.4
|
|
|
Provision for income taxes
|
(310.7
|
)
|
4.7
|
|
(306.0
|
)
|
|
Income after income taxes
|
2,135.2
|
|
(51.8
|
)
|
2,083.4
|
|
|
Profit (loss) related to equity method investments
|
(16.7
|
)
|
—
|
|
(16.7
|
)
|
|
Net income
|
2,118.5
|
|
(51.8
|
)
|
2,066.7
|
|
|
Basic net income per ordinary share
|
4.93
|
|
4.81
|
|
||
|
Diluted net income per ordinary share
|
4.91
|
|
4.79
|
|
||
|
Number of ordinary shares used in computing per share amounts
|
||||||
|
Basic
|
429.8
|
|
429.8
|
|
||
|
Diluted
|
431.6
|
|
431.6
|
|
||
|
Consolidated Statements of Comprehensive Income
|
||||||
|
Year ended December 31, 2017
|
As previously reported
|
|
Adoption of ASC 606
|
|
As adjusted
|
|
|
(in millions)
|
EUR
|
|
EUR
|
|
EUR
|
|
|
Net income
|
2,118.5
|
|
(51.8
|
)
|
2,066.7
|
|
|
Other comprehensive income:
|
||||||
|
Proportionate share of other comprehensive income from equity method investments
|
(1.0
|
)
|
—
|
|
(1.0
|
)
|
|
Foreign currency translation, net of taxes:
|
||||||
|
Gain (loss) on foreign currency translation and effective portion of hedges
on net investments
|
(329.0
|
)
|
—
|
|
(329.0
|
)
|
|
Financial instruments, net of taxes:
|
|
|
||||
|
Gain (loss) on derivative financial instruments
|
(16.6
|
)
|
—
|
|
(16.6
|
)
|
|
Transfers to net income
|
(3.1
|
)
|
—
|
|
(3.1
|
)
|
|
Other comprehensive income, net of taxes
|
(349.7
|
)
|
—
|
|
(349.7
|
)
|
|
Total comprehensive income, net of taxes
|
1,768.8
|
|
(51.8
|
)
|
1,717.0
|
|
|
Attributable to equity holders
|
1,768.8
|
|
(51.8
|
)
|
1,717.0
|
|
ASML INTEGRATED REPORT 2018
114
The following table summarizes the impacts of the adoption of
ASC 606
on our
Consolidated Balance Sheets
as of December 31, 2017:
|
|
||||||
|
As of December 31, 2017
|
As previously reported
|
|
Adoption of ASC 606
|
|
As adjusted
|
|
|
(in millions, except share and per share data)
|
EUR
|
|
EUR
|
|
EUR
|
|
|
Assets
|
||||||
|
Cash and cash equivalents
|
2,259.0
|
|
—
|
|
2,259.0
|
|
|
Short-term investments
|
1,029.3
|
|
—
|
|
1,029.3
|
|
|
Accounts receivable, net
|
1,772.3
|
|
(32.0
|
)
|
1,740.3
|
|
|
Finance receivables, net
|
59.1
|
|
—
|
|
59.1
|
|
|
Current tax assets
|
61.6
|
|
—
|
|
61.6
|
|
|
Contract assets
|
—
|
|
270.4
|
|
270.4
|
|
|
Inventories, net
|
2,958.4
|
|
(2.8
|
)
|
2,955.6
|
|
|
Other assets
|
867.3
|
|
(356.8
|
)
|
510.5
|
|
|
Total current assets
|
9,007.0
|
|
(121.2
|
)
|
8,885.8
|
|
|
Finance receivables, net
|
264.9
|
|
—
|
|
264.9
|
|
|
Deferred tax assets
|
31.7
|
|
—
|
|
31.7
|
|
|
Other assets
|
602.7
|
|
—
|
|
602.7
|
|
|
Equity method investments
|
982.2
|
|
—
|
|
982.2
|
|
|
Goodwill
|
4,541.1
|
|
—
|
|
4,541.1
|
|
|
Other intangible assets, net
|
1,166.0
|
|
—
|
|
1,166.0
|
|
|
Property, plant and equipment, net
|
1,600.8
|
|
—
|
|
1,600.8
|
|
|
Right-of-use assets
|
—
|
|
—
|
|
—
|
|
|
Total non-current assets
|
9,189.4
|
|
—
|
|
9,189.4
|
|
|
Total assets
|
18,196.4
|
|
(121.2
|
)
|
18,075.2
|
|
|
Liabilities and shareholders’ equity
|
||||||
|
Accounts payable
|
837.3
|
|
—
|
|
837.3
|
|
|
Accrued and other liabilities
|
2,327.4
|
|
(1,734.6
|
)
|
592.8
|
|
|
Current tax liabilities
|
152.0
|
|
—
|
|
152.0
|
|
|
Current portion of long-term debt
|
25.2
|
|
—
|
|
25.2
|
|
|
Contract liabilities
|
—
|
|
1,530.0
|
|
1,530.0
|
|
|
Total current liabilities
|
3,341.9
|
|
(204.6
|
)
|
3,137.3
|
|
|
Long-term debt
|
3,000.1
|
|
—
|
|
3,000.1
|
|
|
Deferred and other tax liabilities
|
327.9
|
|
13.2
|
|
341.1
|
|
|
Contract liabilities
|
—
|
|
622.0
|
|
622.0
|
|
|
Accrued and other liabilities
|
850.3
|
|
(652.0
|
)
|
198.3
|
|
|
Total non-current liabilities
|
4,178.3
|
|
(16.8
|
)
|
4,161.5
|
|
|
|
|
|||||
|
Total liabilities
|
7,520.2
|
|
(221.4
|
)
|
7,298.8
|
|
|
Issued and outstanding shares
|
38.8
|
|
—
|
|
38.8
|
|
|
Share premium
|
3,732.5
|
|
—
|
|
3,732.5
|
|
|
Treasury shares at cost
|
(557.9
|
)
|
—
|
|
(557.9
|
)
|
|
Retained earnings
|
5,092.8
|
|
152.0
|
|
5,244.8
|
|
|
Earnings current year
|
2,118.5
|
|
(51.8
|
)
|
2,066.7
|
|
|
Accumulated other comprehensive income
|
251.5
|
|
—
|
|
251.5
|
|
|
Total shareholders’ equity
|
10,676.2
|
|
100.2
|
|
10,776.4
|
|
|
Total liabilities and shareholders’ equity
|
18,196.4
|
|
(121.2
|
)
|
18,075.2
|
|
ASML INTEGRATED REPORT 2018
115
The following tables summarize the impacts of the adoption of
ASC 606
on our Consolidated
Statements of Cash Flows
for the for the year ended December 31, 2017:
|
|
||||||
|
Year ended December 31, 2017
|
As previously reported
|
|
Adoption of ASC 606
|
|
As adjusted
|
|
|
(in millions)
|
EUR
|
|
EUR
|
|
EUR
|
|
|
|
|
|
||||
|
Cash Flows from Operating Activities
|
||||||
|
Net income
|
2,118.5
|
|
(51.8
|
)
|
2,066.7
|
|
|
Adjustments to reconcile net income to net cash flows from operating activities:
|
||||||
|
Depreciation and amortization
|
417.5
|
|
—
|
|
417.5
|
|
|
Impairment
|
9.0
|
|
—
|
|
9.0
|
|
|
Loss on disposal of property, plant and equipment
|
2.8
|
|
—
|
|
2.8
|
|
|
Share-based payments
|
53.1
|
|
—
|
|
53.1
|
|
|
Allowance for doubtful receivables
|
7.8
|
|
—
|
|
7.8
|
|
|
Allowance for obsolete inventory
|
120.1
|
|
—
|
|
120.1
|
|
|
Deferred income taxes
|
(7.6
|
)
|
(0.8
|
)
|
(8.4
|
)
|
|
Equity method investments, net of income taxes
|
16.7
|
|
—
|
|
16.7
|
|
|
Changes in assets and liabilities:
|
||||||
|
Accounts receivable
|
(1,142.4
|
)
|
6.0
|
|
(1,136.4
|
)
|
|
Finance receivables
|
224.8
|
|
(61.3
|
)
|
163.5
|
|
|
Inventories
|
(237.8
|
)
|
(46.3
|
)
|
(284.1
|
)
|
|
Other assets
|
(389.8
|
)
|
294.0
|
|
(95.8
|
)
|
|
Accrued and other liabilities
|
491.2
|
|
(400.3
|
)
|
90.9
|
|
|
Accounts payable
|
266.5
|
|
—
|
|
266.5
|
|
|
Current tax assets and liabilities
|
(151.8
|
)
|
—
|
|
(151.8
|
)
|
|
Contract assets and liabilities
|
—
|
|
260.5
|
|
260.5
|
|
|
Net cash provided by operating activities
|
1,798.6
|
|
—
|
|
1,798.6
|
|
|
Cash Flows from Investing Activities
|
||||||
|
Purchase of property, plant and equipment
|
(338.9
|
)
|
—
|
|
(338.9
|
)
|
|
Purchase of intangible assets
|
(19.1
|
)
|
—
|
|
(19.1
|
)
|
|
Purchase of short-term investments
|
(1,129.3
|
)
|
—
|
|
(1,129.3
|
)
|
|
Maturity of short-term investments
|
1,250.0
|
|
—
|
|
1,250.0
|
|
|
Cash from (used for) derivative financial instruments
|
27.0
|
|
—
|
|
27.0
|
|
|
Loans issued and other investments
|
(0.6
|
)
|
—
|
|
(0.6
|
)
|
|
Repayment on loans
|
1.6
|
|
—
|
|
1.6
|
|
|
Acquisition of equity method investments
|
(1,019.7
|
)
|
—
|
|
(1,019.7
|
)
|
|
Dividend income from equity method investments
|
19.7
|
|
—
|
|
19.7
|
|
|
Acquisition of subsidiaries (net of cash acquired)
|
—
|
|
—
|
|
—
|
|
|
Net cash used in investing activities
|
(1,209.3
|
)
|
—
|
|
(1,209.3
|
)
|
|
Cash Flows from Financing Activities
|
||||||
|
Dividend paid
|
(516.7
|
)
|
—
|
|
(516.7
|
)
|
|
Purchase of treasury shares
|
(500.0
|
)
|
—
|
|
(500.0
|
)
|
|
Net proceeds from issuance of shares
|
50.6
|
|
—
|
|
50.6
|
|
|
Net proceeds from issuance of notes
|
—
|
|
—
|
|
—
|
|
|
Repayment of debt
|
(243.0
|
)
|
—
|
|
(243.0
|
)
|
|
Tax benefit (deficit) from share-based payments
|
—
|
|
—
|
|
—
|
|
|
Net cash used in financing activities
|
(1,209.1
|
)
|
—
|
|
(1,209.1
|
)
|
|
Net cash flows
|
(619.8
|
)
|
—
|
|
(619.8
|
)
|
|
Effect of changes in exchange rates on cash
|
(28.1
|
)
|
—
|
|
(28.1
|
)
|
|
Net increase (decrease) in cash and cash equivalents
|
(647.9
|
)
|
—
|
|
(647.9
|
)
|
|
Cash and cash equivalents at beginning of the year
|
2,906.9
|
|
—
|
|
2,906.9
|
|
|
Cash and cash equivalents at end of the year
|
2,259.0
|
|
—
|
|
2,259.0
|
|
ASML INTEGRATED REPORT 2018
116
The following tables summarize the impacts of the adoption of
ASC 606
on our
Consolidated Statements of Operations and Comprehensive Income
for the year ended December 31, 2016:
|
Consolidated Statements of Operations
|
||||||
|
Year ended December 31, 2016
|
As previously reported
|
|
Adoption of ASC 606
|
|
As adjusted
|
|
|
(in millions, except per share data)
|
EUR
|
|
EUR
|
|
EUR
|
|
|
Net system sales
|
4,672.0
|
|
46.9
|
|
4,718.9
|
|
|
Net service and field option sales
|
2,122.8
|
|
33.4
|
|
2,156.2
|
|
|
Total net sales
|
6,794.8
|
|
80.3
|
|
6,875.1
|
|
|
Cost of system sales
|
(2,468.2
|
)
|
44.3
|
|
(2,423.9
|
)
|
|
Cost of service and field option sales
|
(1,282.1
|
)
|
(23.8
|
)
|
(1,305.9
|
)
|
|
Total cost of sales
|
(3,750.3
|
)
|
20.5
|
|
(3,729.8
|
)
|
|
Gross profit
|
3,044.5
|
|
100.8
|
|
3,145.3
|
|
|
Other income
|
93.8
|
|
—
|
|
93.8
|
|
|
Research and development costs
|
(1,105.8
|
)
|
—
|
|
(1,105.8
|
)
|
|
Selling, general and administrative costs
|
(374.8
|
)
|
—
|
|
(374.8
|
)
|
|
Income from operations
|
1,657.7
|
|
100.8
|
|
1,758.5
|
|
|
Interest and other, net
|
33.7
|
|
—
|
|
33.7
|
|
|
Income before income taxes
|
1,691.4
|
|
100.8
|
|
1,792.2
|
|
|
Provision for income taxes
|
(219.5
|
)
|
(14.9
|
)
|
(234.4
|
)
|
|
Income after income taxes
|
1,471.9
|
|
85.9
|
|
1,557.8
|
|
|
Profit (loss) related to equity method investments
|
—
|
|
—
|
|
—
|
|
|
Net income
|
1,471.9
|
|
85.9
|
|
1,557.8
|
|
|
Basic net income per ordinary share
|
3.46
|
|
3.66
|
|
||
|
Diluted net income per ordinary share
|
3.44
|
|
3.64
|
|
||
|
Number of ordinary shares used in computing per share amounts
|
||||||
|
Basic
|
425.6
|
|
425.6
|
|
||
|
Diluted
|
427.7
|
|
427.7
|
|
||
|
Consolidated Statements of Comprehensive Income
|
||||||
|
Year ended December 31, 2016
|
As previously reported
|
|
Adoption of ASC 606
|
|
As adjusted
|
|
|
(in millions)
|
EUR
|
|
EUR
|
|
EUR
|
|
|
Net income
|
1,471.9
|
|
85.9
|
|
1,557.8
|
|
|
Other comprehensive income:
|
||||||
|
Proportionate share of other comprehensive income from equity method investments
|
—
|
|
—
|
|
—
|
|
|
Foreign currency translation, net of taxes:
|
||||||
|
Gain (loss) on foreign currency translation and effective portion of hedges
on net investments
|
120.4
|
|
—
|
|
120.4
|
|
|
Financial instruments, net of taxes:
|
|
|
||||
|
Gain (loss) on derivative financial instruments
|
6.0
|
|
—
|
|
6.0
|
|
|
Transfers to net income
|
2.4
|
|
—
|
|
2.4
|
|
|
Other comprehensive income, net of taxes
|
128.8
|
|
—
|
|
128.8
|
|
|
Total comprehensive income, net of taxes
|
1,600.7
|
|
85.9
|
|
1,686.6
|
|
|
Attributable to equity holders
|
1,600.7
|
|
85.9
|
|
1,686.6
|
|
ASML INTEGRATED REPORT 2018
117
The following table summarizes the impacts of the adoption of
ASC 606
on our Consolidated Balance Sheets
as of December 31, 2016:
|
Consolidated Balance Sheets
|
||||||
|
As of December 31, 2016
|
As previously reported
|
|
Adoption of ASC 606
|
|
As adjusted
|
|
|
(in millions, except share and per share data)
|
EUR
|
|
EUR
|
|
EUR
|
|
|
Assets
|
||||||
|
Cash and cash equivalents
|
2,906.9
|
|
—
|
|
2,906.9
|
|
|
Short-term investments
|
1,150.0
|
|
—
|
|
1,150.0
|
|
|
Accounts receivable, net
|
700.2
|
|
(26.0
|
)
|
674.2
|
|
|
Finance receivables, net
|
447.4
|
|
—
|
|
447.4
|
|
|
Current tax assets
|
11.6
|
|
—
|
|
11.6
|
|
|
Contract assets
|
—
|
|
91.6
|
|
91.6
|
|
|
Inventories, net
|
2,780.9
|
|
(49.1
|
)
|
2,731.8
|
|
|
Deferred tax assets
|
—
|
|
—
|
|
—
|
|
|
Other assets
|
560.4
|
|
(62.8
|
)
|
497.6
|
|
|
Total current assets
|
8,557.4
|
|
(46.3
|
)
|
8,511.1
|
|
|
Finance receivables, net
|
117.2
|
|
(61.3
|
)
|
55.9
|
|
|
Deferred tax assets
|
34.9
|
|
—
|
|
34.9
|
|
|
Contract assets
|
—
|
|
56.7
|
|
56.7
|
|
|
Other assets
|
612.3
|
|
—
|
|
612.3
|
|
|
Equity method investments
|
—
|
|
—
|
|
—
|
|
|
Goodwill
|
4,873.9
|
|
—
|
|
4,873.9
|
|
|
Other intangible assets, net
|
1,323.0
|
|
—
|
|
1,323.0
|
|
|
Property, plant and equipment, net
|
1,687.2
|
|
—
|
|
1,687.2
|
|
|
Right-of-use assets
|
—
|
|
—
|
|
—
|
|
|
Total non-current assets
|
8,648.5
|
|
(4.6
|
)
|
8,643.9
|
|
|
Total assets
|
17,205.9
|
|
(50.9
|
)
|
17,155.0
|
|
|
Liabilities and shareholders’ equity
|
||||||
|
Accounts payable
|
593.2
|
|
—
|
|
593.2
|
|
|
Accrued and other liabilities
|
2,237.8
|
|
(1,590.8
|
)
|
647.0
|
|
|
Current tax liabilities
|
201.9
|
|
—
|
|
201.9
|
|
|
Current portion of long-term debt
|
247.7
|
|
—
|
|
247.7
|
|
|
Contract liabilities
|
—
|
|
1,386.4
|
|
1,386.4
|
|
|
Total current liabilities
|
3,280.6
|
|
(204.4
|
)
|
3,076.2
|
|
|
Long-term debt
|
3,071.8
|
|
—
|
|
3,071.8
|
|
|
Deferred and other tax liabilities
|
396.9
|
|
14.0
|
|
410.9
|
|
|
Provisions
|
20.5
|
|
—
|
|
20.5
|
|
|
Contract liabilities
|
—
|
|
447.4
|
|
447.4
|
|
|
Accrued and other liabilities
|
615.7
|
|
(459.9
|
)
|
155.8
|
|
|
Total non-current liabilities
|
4,104.9
|
|
1.5
|
|
4,106.4
|
|
|
Total liabilities
|
7,385.5
|
|
(202.9
|
)
|
7,182.6
|
|
|
|
|
|||||
|
Issued and outstanding shares
|
39.4
|
|
—
|
|
39.4
|
|
|
Share premium
|
3,693.5
|
|
—
|
|
3,693.5
|
|
|
Treasury shares at cost
|
(796.2
|
)
|
—
|
|
(796.2
|
)
|
|
Retained earnings
|
4,810.6
|
|
66.1
|
|
4,876.7
|
|
|
Earnings current year
|
1,471.9
|
|
85.9
|
|
1,557.8
|
|
|
Accumulated other comprehensive income
|
601.2
|
|
—
|
|
601.2
|
|
|
Total shareholders’ equity
|
9,820.4
|
|
152.0
|
|
9,972.4
|
|
|
Total liabilities and shareholders’ equity
|
17,205.9
|
|
(50.9
|
)
|
17,155.0
|
|
ASML INTEGRATED REPORT 2018
118
The following tables summarize the impacts of the adoption of
ASC 606 on our Consolidated Statements of Cash Flows
for the year ended December 31, 2016:
|
Consolidated Statements of Cash Flows
|
||||||
|
Year ended December 31, 2016
|
As previously reported
|
|
Adoption of ASC 606
|
|
As adjusted
|
|
|
(in millions)
|
EUR
|
|
EUR
|
|
EUR
|
|
|
|
|
|
||||
|
Cash Flows from Operating Activities
|
||||||
|
Net income
|
1,471.9
|
|
85.9
|
|
1,557.8
|
|
|
Adjustments to reconcile net income to net cash flows from operating activities:
|
||||||
|
Depreciation and amortization
|
356.9
|
|
—
|
|
356.9
|
|
|
Impairment
|
3.5
|
|
—
|
|
3.5
|
|
|
Loss on disposal of property, plant and equipment
|
5.2
|
|
—
|
|
5.2
|
|
|
Share-based payments
|
47.7
|
|
—
|
|
47.7
|
|
|
Allowance for doubtful receivables
|
3.2
|
|
—
|
|
3.2
|
|
|
Allowance for obsolete inventory
|
73.0
|
|
—
|
|
73.0
|
|
|
Deferred income taxes
|
(0.6
|
)
|
14.0
|
|
13.4
|
|
|
Equity method investments, net of income taxes
|
—
|
|
—
|
|
—
|
|
|
Changes in assets and liabilities:
|
|
|||||
|
Accounts receivable
|
187.4
|
|
26.0
|
|
213.4
|
|
|
Finance receivables
|
(156.1
|
)
|
61.3
|
|
(94.8
|
)
|
|
Inventories
|
(43.7
|
)
|
49.1
|
|
5.4
|
|
|
Other assets
|
(152.9
|
)
|
62.8
|
|
(90.1
|
)
|
|
Accrued and other liabilities
|
(273.9
|
)
|
246.9
|
|
(27.0
|
)
|
|
Accounts payable
|
50.9
|
|
—
|
|
50.9
|
|
|
Current tax assets and liabilities
|
93.4
|
|
—
|
|
93.4
|
|
|
Contract assets and liabilities
|
—
|
|
(546.0
|
)
|
(546.0
|
)
|
|
Net cash provided by operating activities
|
1,665.9
|
|
—
|
|
1,665.9
|
|
|
Cash Flows from Investing Activities
|
||||||
|
Purchase of property, plant and equipment
|
(316.3
|
)
|
—
|
|
(316.3
|
)
|
|
Purchase of intangible assets
|
(8.4
|
)
|
—
|
|
(8.4
|
)
|
|
Purchase of short-term investments
|
(2,520.0
|
)
|
—
|
|
(2,520.0
|
)
|
|
Maturity of short-term investments
|
2,320.0
|
|
—
|
|
2,320.0
|
|
|
Cash from (used for) derivative financial instruments
|
(15.0
|
)
|
—
|
|
(15.0
|
)
|
|
Loans issued and other investments
|
—
|
|
—
|
|
—
|
|
|
Repayment on loans
|
(7.4
|
)
|
—
|
|
(7.4
|
)
|
|
Acquisition of equity method investments
|
—
|
|
—
|
|
—
|
|
|
Dividend income from equity method investments
|
—
|
|
—
|
|
—
|
|
|
Acquisition of subsidiaries (net of cash acquired)
|
(2,641.3
|
)
|
—
|
|
(2,641.3
|
)
|
|
Net cash used in investing activities
|
(3,188.4
|
)
|
—
|
|
(3,188.4
|
)
|
|
Cash Flows from Financing Activities
|
||||||
|
Dividend paid
|
(445.9
|
)
|
—
|
|
(445.9
|
)
|
|
Purchase of treasury shares
|
(400.0
|
)
|
—
|
|
(400.0
|
)
|
|
Net proceeds from issuance of shares
|
582.7
|
|
—
|
|
582.7
|
|
|
Net proceeds from issuance of notes
|
2,230.6
|
|
—
|
|
2,230.6
|
|
|
Repayment of debt
|
(4.7
|
)
|
—
|
|
(4.7
|
)
|
|
Tax benefit (deficit) from share-based payments
|
0.9
|
|
—
|
|
0.9
|
|
|
Net cash used in financing activities
|
1,963.6
|
|
—
|
|
1,963.6
|
|
|
Net cash flows
|
441.1
|
|
—
|
|
441.1
|
|
|
Effect of changes in exchange rates on cash
|
7.1
|
|
—
|
|
7.1
|
|
|
Net increase (decrease) in cash and cash equivalents
|
448.2
|
|
—
|
|
448.2
|
|
|
Cash and cash equivalents at beginning of the year
|
2,458.7
|
|
—
|
|
2,458.7
|
|
|
Cash and cash equivalents at end of the year
|
2,906.9
|
|
—
|
|
2,906.9
|
|
ASML INTEGRATED REPORT 2018
119
Adoption of ASC 842 "Leases"
As of January 1, 2018, ASML has early adopted
ASC 842 "Leases". We applied a modified retrospective adoption and therefore restated 2016 and 2017. The most significant changes in our accounting policy (compared to ASC 840 "Leases") are the recognition of right-of-use assets and lease liabilities for operating leases and the classification of leases from a lessor perspective.
As of December 31, 2016 and 2017, our impact resulting from operating leases is as follows:
|
•
|
We have recognized right-of-use assets and lease liabilities of
EUR 131 million
and
EUR 114 million
, respectively.
|
|
•
|
The short term portion of the lease liabilities of
EUR 28 million
and
EUR 33 million
, respectively, has been classified as accrued and other liabilities - current.
|
|
•
|
The long term portion of the lease liabilities of
EUR 103 million
and
EUR 81 million
, respectively, has been included in the accrued and other liabilities - non-current.
|
As of December 31, 2016 and 2017, we reclassified our non-current accounts receivable of
EUR 32 million
and
EUR 106 million
, respectively, from finance receivables to other assets - non-current in order to present our sales-type leases separate on our balance sheet within finance receivables.
We elected the following practical expedients as a package and applied these consistently to all of our leases (including those for which we are a lessee or a lessor):
|
•
|
We did not reassess whether any expired or existing contracts are or contain leases.
|
|
•
|
We did not reassess the lease classification for any expired or existing leases (that is, all existing leases that were classified as operating leases in accordance with ASC 840 have been classified as operating leases, and all existing leases that were classified as capital leases in accordance with ASC 840 have been classified as finance leases).
|
|
•
|
We excluded initial direct costs for any existing leases.
|
Adoption of ASU 2016-16 Income Taxes: "Intra-Entity Transfers of Assets Other Than Inventory"
As of January 1, 2018, ASML adopted ASU 2016-16 Income taxes: "Intra-entity transfers of assets other than inventory". We applied a modified retrospective adoption with a cumulative effect adjustment to Retained earnings as of January 1, 2018. The most significant change in our accounting policy is that prepaid taxes as calculated using the purchaser’s rather than the seller’s tax jurisdiction (except for prepaid taxes arising from intra-entity transfers of inventory).
As of January 1, 2018, retained earnings decreased with
EUR 85 million
and other assets decreased with
EUR 157 million
whereas Deferred tax assets increased with
EUR 72 million
. This impact mainly relates to a so-called bi-lateral advanced pricing agreement between the US and the Dutch tax authorities on a inter group transfer of intellectual property rights.
Adoption of ASU 2017-04 "Simplifying the Test for Goodwill Impairment"
As of January 1, 2018, ASML adopted ASU 2017-04 "Simplifying the Test for Goodwill Impairment". This accounting standard update removes Step 2 of the goodwill impairment test, which requires a hypothetical purchase price allocation. The guidance provides that a goodwill impairment is the amount by which a reporting unit’s carrying value exceeds its fair value, not to exceed the carrying amount of goodwill. All other goodwill impairment guidance remains largely unchanged.
Adoption of ASU 2016-15 "Classification of Certain Cash Receipts and Cash Payments"
As of January 1, 2018, ASML adopted ASU 2016-15 "Classification of Certain Cash Receipts and Cash Payments". This accounting standard update provides guidance over certain cash flow issues. The guidance provided over distributions received from equity method investments allows for companies to make an accounting policy election to classify distributions received from equity method investees using the cumulative earnings approach or the nature of the distributions approach. ASML has elected to use the nature of distributions approach which results in our distributions received from Carl Zeiss SMT Holding GmbH & Co. KG to be classified as operating cash flows. This accounting policy election was applied retrospectively.
New US GAAP accounting pronouncements issued but not adopted
For the below mentioned ASUs issued up to the date of this report but not yet adopted by us, the impact on our Financial
Statements needs to be assessed:
ASU No. 2016-13 "Financial Instruments - Credit Losses (Topic 326)" was issued by the FASB in June 2016 and will provide financial statement users with more information about the expected credit losses on financial instruments and other commitments to extend credit held by an entity at each reporting date. The Update i
s effective for fiscal years beginning after December 15, 2020, including interim periods within those fiscal years. Early adoption is permitted for periods beginning after December 15, 2018.
The Standard will be applied using a modified retrospective approach, which requires
a cumulative-effect adjustment to retained earnings as of the beginning of the first reporting period in which the Standard is effective. We
will therefore not restate prior years presented in our Consolidated Financial Statements upon adoption.
We are currently in the process of determining the impact of implementing this Standard on our Consolidated Financial Statements.
We believe that the impact of all other recently issued ASUs, either adopted or not yet adopted by us, do not have or are not expected to have a material impact on our Consolidated Financial Statements.
ASML INTEGRATED REPORT 2018
120
2
. Business combinations
On
November 22, 2016
, we concluded the acquisition of HMI and obtained control through acquiring
100 percent
of the issued share capital of HMI, for a total consideration of
EUR 3.0 billion
. There were
no
contingent consideration arrangements.
The total consideration was allocated to other intangible assets of
EUR 606.7 million
, other net assets of
EUR 259.2 million
and goodwill of
EUR 2,115.0 million
.
The majority of the goodwill arising on the acquisition of HMI is attributable to buyer specific synergies, net sales and profits assigned to future multi-beam technology, net sales and profits assigned to next generation single-beam technology and HMI workforce. Synergies relate to the unique combination of HMI’s inspection tools and our defect prediction/pattern fidelity control software.
3
. Fair value measurements
Fair value is the price that would be received to sell an asset or paid to transfer a liability in an orderly transaction between market participants at the measurement date. The fair value measurement hierarchy prioritizes the inputs to valuation techniques used to measure fair value as follows:
|
•
|
Level 1: Valuations based on inputs such as quoted prices for identical assets or liabilities in active markets that the entity has the ability to access.
|
|
•
|
Level 2: Valuations based on inputs other than level 1 inputs such as quoted prices for similar assets or liabilities, quoted prices in markets that are not active, or other inputs that are observable or can be corroborated by observable data for substantially the full term of the assets or liabilities.
|
|
•
|
Level 3: Valuations based on inputs that are supported by little or no market activity and that are significant to the fair value of the assets or liabilities.
|
The fair value hierarchy gives the highest priority to quoted prices (unadjusted) in active markets for identical assets or liabilities (Level 1) and the lowest priority to unobservable inputs (Level 3). A financial instrument’s fair value classification is based on the lowest level of any input that is significant in the fair value measurement hierarchy.
Financial assets and financial liabilities measured at fair value on a recurring basis
Investments in money market funds (as part of our cash and cash equivalents) have fair value measurements which are all based on quoted prices for identical assets or liabilities.
Our short-term investments consist of deposits with a remaining maturity beyond three months at the date of acquisition with financial institutions that have investment grade credit ratings. The fair value of the deposits is determined with reference to quoted market prices in an active market for similar assets or discounted cash flow analysis.
The principal market in which we execute our derivative contracts is the institutional market in an over-the-counter environment with a high level of price transparency. The market participants usually are large commercial banks. The valuation inputs for our derivative contracts are based on quoted prices and quoting pricing intervals from public data sources; they do not involve management judgment.
The valuation technique used to determine the fair value of forward foreign exchange contracts (used for hedging purposes) approximates the net present value technique which is the estimated amount that a bank would receive or pay to terminate the forward foreign exchange contracts at the reporting date, taking into account current interest rates and current exchange rates.
The valuation technique used to determine the fair value of interest rate swaps (used for hedging purposes) is the net present value technique, which is the estimated amount that a bank would receive or pay to terminate the swap agreements at the reporting date, taking into account current interest rates
.
Our Eurobonds serve as hedged items in fair value hedge relationships in which we hedge the variability of changes in the fair value of our Eurobonds due to changes in market interest rates with interest rate swaps. The fair value changes of these interest rate swaps are recorded on the
Consolidated Balance Sheets under derivative financial instruments (within other current and non-current assets and other current and non-current liabilities)
and the carrying amounts of the Eurobonds are adjusted for the effective portion of these fair value changes only.
For the actual aggregate carrying amount and the fair value of our Eurobonds, see
Note 16 Long-term debt
.
ASML INTEGRATED REPORT 2018
121
The following tables present our financial assets and financial liabilities that are measured at fair value on a recurring basis:
|
As of December 31, 2018
|
Level 1
|
|
Level 2
|
|
Level 3
|
|
Total
|
|
|
(in millions)
|
EUR
|
|
EUR
|
|
EUR
|
|
EUR
|
|
|
|
||||||||
|
Assets measured at fair value
|
||||||||
|
Derivative financial instruments
1
|
—
|
|
101.9
|
|
—
|
|
101.9
|
|
|
Money market funds
2
|
2,342.6
|
|
—
|
|
—
|
|
2,342.6
|
|
|
Short-term investments
3
|
—
|
|
913.3
|
|
—
|
|
913.3
|
|
|
Total
|
2,342.6
|
|
1,015.2
|
|
—
|
|
3,357.8
|
|
|
|
||||||||
|
Liabilities measured at fair value
|
||||||||
|
Derivative financial instruments
1
|
—
|
|
47.4
|
|
—
|
|
47.4
|
|
|
|
||||||||
|
Assets and Liabilities for which fair values are disclosed
|
||||||||
|
Long-term debt
4
|
3,119.4
|
|
—
|
|
—
|
|
3,119.4
|
|
|
1.
|
Derivative financial instruments consist of forward foreign exchange contracts and interest rate swaps. See
Note 4 Financial risk management
.
|
|
2.
|
Money market funds are part of our cash and cash equivalents. See
Note 5 Cash and cash equivalents and short-term investments
.
|
|
3.
|
Short-term investments consist of deposits with a remaining maturity longer than three months, but less than one year at the date of acquisition. See
Note 5 Cash and cash equivalents and short-term investments
.
|
|
4.
|
Long-term debt relates to Eurobonds. See
Note 16 Long-term debt
.
|
|
As of December 31, 2017
|
Level 1
|
|
Level 2
|
|
Level 3
|
|
Total
|
|
|
(in millions)
|
EUR
|
|
EUR
|
|
EUR
|
|
EUR
|
|
|
|
||||||||
|
Assets measured at fair value
|
||||||||
|
Derivative financial instruments
1
|
—
|
|
115.7
|
|
—
|
|
115.7
|
|
|
Money market funds
2
|
1,329.4
|
|
—
|
|
—
|
|
1,329.4
|
|
|
Short-term investments
3
|
—
|
|
1,029.3
|
|
—
|
|
1,029.3
|
|
|
Total
|
1,329.4
|
|
1,145.0
|
|
—
|
|
2,474.4
|
|
|
|
||||||||
|
Liabilities measured at fair value
|
|
|
|
|
||||
|
Derivative financial instruments
1
|
—
|
|
67.3
|
|
—
|
|
67.3
|
|
|
|
||||||||
|
Assets and Liabilities for which fair values are disclosed
|
|
|
|
|
||||
|
Long-term debt
4
|
3,193.2
|
|
—
|
|
—
|
|
3,193.2
|
|
|
1.
|
Derivative financial instruments consist of forward foreign exchange contracts and interest rate swaps.
See
Note 4 Financial risk management
.
|
|
2.
|
Money market funds are part of our cash and cash equivalents.
See
Note 5 Cash and cash equivalents and short-term investments
.
|
|
3.
|
Short-term investments consist of deposits with a remaining maturity longer than three months, but less than one year at the date of acquisition.
See
|
|
4.
|
Long-term debt relates to Eurobonds. See
Note 16 Long-term debt
.
|
There were
no
transfers between levels during the years ended December 31,
2018
and December 31,
2017
.
Financial assets and financial liabilities that are not measured at fair value
The carrying amount of cash and cash equivalents, accounts payable, and other current financial assets and liabilities approximate their fair value because of the short-term nature of these instruments. Accounts receivable and finance receivables also approximate their fair value because of the fact that any recoverability loss is reflected in an impairment loss.
Assets and liabilities measured at fair value on a non-recurring basis
In
2017
and
2018
, we had
no
significant fair value measurements on a non-recurring basis. We did
no
t
recognize any impairment charges for goodwill and other intangible assets during
2017
and
2018
. See
Note 11 Goodwill
and
Note 12 Other intangible assets
for more information.
4
. Financial risk management
We are exposed to certain financial risks such as market risk (including foreign currency risk and interest rate risk), credit risk, liquidity risk and capital risk. Our overall risk management program focuses on the unpredictability of financial markets and seeks to minimize potentially adverse effects on our financial performance. We use derivative financial instruments to hedge certain risk exposures. None of our transactions are entered into for trading or speculative purposes. We believe that market information is the most reliable and transparent measure for our derivative financial instruments that are measured at fair value. To mitigate the risk that any of our counterparties in hedging transactions are unable to meet their obligations, we only enter into transactions with a limited number of major financial institutions that have investment grade credit ratings. Also, we closely monitor the creditworthiness of our counterparties. Concentration risk is mitigated by limiting the exposure to each of the individual counterparties. Our risk management program focuses appropriately on the current environment of uncertainty in the financial markets.
ASML INTEGRATED REPORT 2018
122
Foreign currency risk management
We are exposed to currency risks. Our Financial Statements are expressed in euros. Accordingly, our results of operations are exposed to fluctuations in exchange rates between the euro and such other currencies, and changes in currency exchange rates can result in losses in our Financial Statements. We are particularly exposed to fluctuations in the exchange rates between the US dollar and the euro, and to a lesser extent to the Japanese yen and the Taiwanese dollar in relation to the euro. We incur costs of sales predominantly in euros with portions also denominated in US and Taiwanese dollars, particularly following our acquisitions of Cymer in 2013 and HMI in 2016. A small portion of our operating results are driven by movements in currencies other than the euro, yen, US dollar or Taiwanese dollar.
It is our policy to hedge material transaction exposures, such as forecasted sales and purchase transactions, and material net remeasurement exposures, such as accounts receivable and payable. We hedge these exposures through the use of foreign exchange contracts.
As of December 31,
2018
, accumulated OCI includes
EUR 10.9 million
representing the total anticipated
gain to be released
to cost of sales (
2017
: loss
EUR 12.5 million
and
2016
: gain
EUR 10.4 million
) (net of taxes:
2018
: gain
EUR 9.7 million
;
2017
:
loss
EUR 11.2 million
;
2016
: gain
EUR 9.3 million
), which will offset the euro equivalent of foreign currency denominated forecasted purchase transactions. All amounts are expected to be released over the next
12 months
.
As of December 31,
2018
,
accumulated OCI includes
EUR (1.4) million
(
2017
:
no amount
;
2016
:
EUR 0.2 million
), representing the total anticipated gain to be released
to sales. The effectiveness of all contracts for which we apply hedge accounting is monitored on a quarterly basis throughout the life of the hedges. During
2018
,
2017
and
2016
,
no
ineffective hedge relationships were recognized.
As of December 31,
2018
,
EUR 11.9 million
loss
(
2017
:
EUR 13.9 million
gain
) representing the effective portion of hedges on net investments was recognized in accumulated OCI.
Interest rate risk management
We have interest-bearing assets and liabilities that expose us to fluctuations in market interest rates. We use interest rate swaps to align the interest-typical terms of interest-bearing liabilities with the interest-typical terms of interest-bearing assets. There may be residual interest rate risk to the extent the asset and liability positions do not fully offset.
As part of our hedging policy, we use interest rate swaps to hedge changes in fair value of our Eurobonds due to changes in market interest rates, thereby offsetting the variability of future interest receipts on part of our cash and cash equivalents. During
2018
, these hedges were highly effective in hedging the fair value exposure to interest rate movements. The changes in fair value of the Eurobonds were included in the
Consolidated Statements of Operations
in the same period
as the changes in the fair value of the interest rate swaps.
Furthermore, as part of our hedging policy, we use interest rate swaps to hedge the variability of future interest cash flows relating to certain of our operating lease obligations. In June 2018, these interest rate swaps matured together with the related operating lease obligation. Over the lifetime of the hedge relationship the hedge was highly effective in hedging the cash flow exposure to interest rate movements.
Financial instruments
We use foreign exchange contracts to manage our foreign currency risk and interest rate swaps to manage our interest rate risk.
The following table summarizes the notional amounts and estimated fair values of our derivative financial instruments:
|
As of December 31
|
2017
|
2018
|
||||||
|
(in millions)
|
Notional
amount
EUR
|
|
Fair Value
EUR
|
|
Notional
amount
EUR
|
|
Fair Value
EUR
|
|
|
Forward foreign exchange contracts
|
1,146.2
|
|
18.1
|
|
134.1
|
|
(2.0
|
)
|
|
Interest rate swaps
|
3,024.9
|
|
30.3
|
|
3,000.0
|
|
56.5
|
|
ASML INTEGRATED REPORT 2018
123
The following table summarizes our derivative financial instruments per category:
|
As of December 31
|
2017
|
2018
|
||||||
|
(in millions)
|
Assets
EUR
|
|
Liabilities
EUR
|
|
Assets
EUR
|
|
Liabilities
EUR
|
|
|
Interest rate swaps — cash flow hedges
|
—
|
|
0.6
|
|
—
|
|
—
|
|
|
Interest rate swaps — fair value hedges
|
93.6
|
|
62.7
|
|
88.5
|
|
32.0
|
|
|
Forward foreign exchange contracts — cash flow hedges
|
0.7
|
|
2.6
|
|
6.5
|
|
0.9
|
|
|
Forward foreign exchange contracts — net investment hedge
|
1.2
|
|
1.2
|
|
—
|
|
2.6
|
|
|
Forward foreign exchange contracts — no hedge accounting
|
20.2
|
|
0.2
|
|
6.9
|
|
11.9
|
|
|
Total
|
115.7
|
|
67.3
|
|
101.9
|
|
47.4
|
|
|
Less non-current portion:
|
||||||||
|
Interest rate swaps — fair value hedges
|
65.2
|
|
62.7
|
|
59.7
|
|
32.0
|
|
|
Total non-current portion
|
65.2
|
|
62.7
|
|
59.7
|
|
32.0
|
|
|
Total current portion
|
50.5
|
|
4.6
|
|
42.2
|
|
15.4
|
|
The fair value part of a hedging derivative financial instrument that has a remaining term of
12 months
or less after balance sheet
date is classified as current asset or liability.
When the fair value part of a hedging derivative has a term of more than
12 months
after
balance sheet
date, it is classified as non-current asset or liability.
The current portion of derivative financial instruments is included in other current assets and current accrued and other liabilities in the
Consolidated Balance Sheets
. The non-current portion of derivative financial instruments is included in other non-current assets and non-current accrued and other liabilities in the
Consolidated Balance Sheets
.
For further information regarding our derivative financial instruments, see
Note 3 Fair value measurement
.
Foreign exchange contracts
The notional principal amounts of the outstanding forward foreign exchange contracts in the main currencies US dollar, Japanese yen and Taiwanese dollar at
December 31, 2018
are
USD 348.6 million
,
JPY 6.0 billion
and
TWD 8.8 billion
(
2017
:
USD 796.3 million
,
JPY 7.4 billion
and
TWD 16.6 billion
).
The hedged highly probable forecasted transactions denominated in foreign currency are expected to occur at various dates during the coming
12 months
. Gains and losses recognized in OCI on forward foreign exchange contracts included in a hedge relationship will be recognized in
the
Consolidated Statements of Operations
in the period during which the hedged forecasted transactions affect
the
Consolidated Statements of Operations
.
In
2018
,
we recognized a net amount of
EUR 11.8 million
loss
(
2017
:
EUR 3.1 million
gain
;
2016
:
EUR 2.4 million
loss
) in the
Consolidated Statements of Operations
resulting from effective cash flow hedges for forecasted sales and purchase transactions that occurred in the year. Furthermore, we recognized a net amount of
EUR 24.2 million
gain
in the Consolidated Statements of Operations
resulting from derivative financial instruments measured at fair value through profit or loss
(
2017
:
EUR 126.4 million
gain
;
2016
:
EUR 81.2 million
loss
)
, which is almost fully offset by the revaluation of the hedged monetary items.
Interest rate swaps
The notional principal amount of the outstanding interest rate swap contracts as of December 31,
2018
was
EUR 3.0 billion
(
2017
:
EUR 3.0 billion
).
ASML INTEGRATED REPORT 2018
124
Sensitivity analysis financial instruments
Foreign currency sensitivity
We are mainly exposed to fluctuations in exchange rates between the euro and the US dollar, the euro and Taiwanese dollar and the euro and the Japanese yen. The following table details our sensitivity to a 10.0 percent strengthening of foreign currencies against the euro. The sensitivity analysis includes foreign currency denominated monetary items outstanding and adjusts their translation at the period end for a 10.0 percent strengthening in foreign currency rates. A positive amount indicates an increase in net income or equity, as shown.
|
2017
|
2018
|
|||||||
|
(in millions)
|
Impact on net income EUR
|
|
Impact on equity EUR
|
|
Impact on net income EUR
|
|
Impact on equity EUR
|
|
|
US dollar
|
(6.5
|
)
|
15.6
|
|
(8.7
|
)
|
28.2
|
|
|
Japanese yen
|
(1.8
|
)
|
0.9
|
|
(1.7
|
)
|
(4.0
|
)
|
|
Taiwanese dollar
|
(5.3
|
)
|
(22.3
|
)
|
(6.5
|
)
|
(12.7
|
)
|
|
Other currencies
|
(3.4
|
)
|
—
|
|
(5.9
|
)
|
—
|
|
|
Total
|
(17.0
|
)
|
(5.8
|
)
|
(22.8
|
)
|
11.5
|
|
It is our policy to limit the effects of currency exchange rate fluctuations on our
Consolidated Statements of Operations
. The decreased effect on net income in
2018
compared with
2017
reflects our lower net exposure to currencies other than the euro at year-end
2018
. The
negative
effect on net income as presented in the table above for
2018
is mainly attributable to timing differences between the arising and hedging of exposures.
The effects of the fair value movements of cash flow hedges, entered into for US dollar and Japanese yen transactions are recognized in equity. The US dollar and Japanese yen effect on equity in
2018
compared with
2017
is the result of an increase in outstanding purchase hedges and decrease in outstanding sales hedges.
The effects of the fair value movements of net investment hedges, entered into for Taiwanese dollar transactions are recognized in equity. This effect is offset by the translation adjustment on the net investment also recorded in equity. This offset is not included in the table above.
For a 10.0 percent weakening of the foreign currencies against the euro, there would be approximately an equal but opposite effect on net income and equity.
Interest rate sensitivity
The sensitivity analysis below has been determined based on the exposure to interest rates for both derivative financial and non-derivative financial instruments at the
balance sheet
date with the stipulated change taking place at the beginning of the financial year and held constant throughout the reporting period. The table below shows the effect of a 1.0 percentage point increase in interest rates on our net income and equity. A positive amount indicates an increase in net income and equity.
|
2017
|
2018
|
|||||||
|
(in millions)
|
Impact on net income EUR
|
|
Impact on equity EUR
|
|
Impact on net income EUR
|
|
Impact on equity EUR
|
|
|
Effect of a 1.0 percent point increase in interest rates
|
2.6
|
|
0.1
|
|
10.3
|
|
—
|
|
The positive effect on net income mainly relates to our cash and cash equivalents and short-term investments. The positive effect on equity, is mainly attributable to the fair value movements of the interest rate swaps designated as cash flow hedges.
For a 1.0 percentage point decrease in interest rates there would be approximately an equal but opposite effect on net income and equity.
Credit risk management
Financial instruments that potentially subject us to significant concentration of credit risk consist principally of cash and cash equivalents, short-term investments, derivative financial instruments used for hedging activities, accounts receivable and finance receivables.
ASML INTEGRATED REPORT 2018
125
Cash and cash equivalents, short-term investments and derivative financial instruments contain an element of risk of the counterparties being unable to meet their obligations. Our risk management program focuses appropriately on the current environment of uncertainty in the financial markets. We invest our cash and cash equivalents and short-term investments in short-term deposits with financial institutions that have investment grade credit ratings and in money market and other investment funds that invest in high-rated short-term debt securities. To mitigate the risk that our counterparties in hedging transactions are unable to meet their obligations, we enter into transactions with a limited number of major financial institutions that have investment grade credit ratings and closely monitor their creditworthiness. Concentration risk is mitigated by limiting the exposure to each of the individual counterparties.
Our customers consist of IC manufacturers located throughout the world. We perform ongoing credit evaluations of our customers’ financial condition. We mitigate credit risk through additional measures, including the use of down payments, letters of credit, and contractual ownership retention provisions. Retention of ownership enables us to recover the systems in the event a customer defaults on payment.
Capital risk management
We manage our capital availability risk by maintaining a conservative financial policy that focuses on liquidity and financial stability throughout industry cycles. This is pursued by maintaining a capital structure that supports a solid investment grade credit rating.
5
. Cash and cash equivalents and short-term investments
Cash and cash equivalents at December 31,
2018
include deposits with financial institutions that have investment grade credit ratings of
EUR 188.2 million
(
2017
:
EUR 42.1 million
)
, investments in money market and other investment funds that invest in high-rated short-term debt securities of
EUR 2,342.6 million
(
2017
:
EUR 1,329.4 million
) and interest-bearing bank accounts of
EUR 590.3 million
(
2017
:
EUR 887.5 million
).
Our cash and cash equivalents are predominantly denominated in euros and partly in US dollars and Taiwanese dollars.
Cash and cash equivalents have
insignificant interest rate risk and remaining maturities of
three months
or less at the date of acquisition.
At
December 31, 2018
no
restrictions on usage of cash and cash equivalents exist (
2017
:
no
restrictions). The carrying amount of these assets approximates their fair value.
Short-term investments have insignificant interest rate risk and remaining maturities longer than
three months
but less than
one year
at the date of acquisition.
The carrying amount of these assets approximates their fair value. No unrealized gains or losses have been recorded.
6
. Accounts receivable
Accounts receivable consist of the following:
|
As of December 31
|
2017
1
|
|
2018
|
|
|
(in millions)
|
EUR
|
|
EUR
|
|
|
|
|
|
|
|
|
Accounts receivable, gross
|
1,744.9
|
|
1,504.9
|
|
|
Allowance for doubtful receivables
|
(4.6
|
)
|
(6.7
|
)
|
|
Accounts receivable, net
|
1,740.3
|
|
1,498.2
|
|
|
1.
|
As of January 1, 2018, ASML has adopted the new Revenue Recognition Standard (ASC 606) and Lease Standard (ASC 842). The comparative numbers have been adjusted to reflect these changes in accounting policies, see Note 1 General information / summary of significant accounting policies.
|
The non-current portion of accounts receivable is included in the non-current other assets, see
Note 9 Other assets
.
The
decrease
in accounts receivable as of
December 31, 2018
compared to
December 31, 2017
is due to timing of payments from customers.
The carrying amount of the accounts receivable approximates the fair value. We perform ongoing credit evaluations on our customers’ financial condition. We periodically review whether an allowance for credit losses is needed by considering factors such as historical payment experience, credit quality, aging of the accounts receivable balances,
and current economic conditions that may affect a customer’s ability to pay.
ASML INTEGRATED REPORT 2018
126
7
. Finance receivables
Finance receivables consist of receivables in relation to
sales-type
leases.
The following table lists the components of the finance receivables as of December 31,
2018
and
2017
:
|
As of December 31
|
2017
1
|
|
2018
|
|
|
(in millions)
|
EUR
|
|
EUR
|
|
|
Finance receivables, gross
|
225.1
|
|
893.7
|
|
|
Unearned interest
|
(6.6
|
)
|
(7.5
|
)
|
|
Finance receivables, net
|
218.5
|
|
886.2
|
|
|
Current portion of finance receivables, gross
|
62.1
|
|
613.3
|
|
|
Current portion of unearned interest
|
(3.0
|
)
|
(2.2
|
)
|
|
Non-current portion of finance receivables, net
|
159.4
|
|
275.1
|
|
|
1.
|
As of January 1, 2018, ASML has adopted the new Revenue Recognition Standard (ASC 606) and Lease Standard (ASC 842). The comparative numbers have been adjusted to reflect these changes in accounting policies, see Note 1 General information / summary of significant accounting policies.
|
The
increase
in finance receivables as of December 31,
2018
compared to December 31,
2017
was mainly caused by an increase in the number of
sales-type
leases, as well as a change in the mix towards more high-end systems.
At December 31,
2018
, finance receivables, gross due for payment in each of the next 5 years
and thereafter are as follows:
|
(in millions)
|
EUR
|
|
|
|
||
|
2019
|
613.3
|
|
|
2020
|
250.6
|
|
|
2021
|
7.2
|
|
|
2022
|
22.6
|
|
|
2023
|
—
|
|
|
Thereafter
|
—
|
|
|
Finance receivables, gross
|
893.7
|
|
Gross profit recognized at the commencement date of the lease for our sales-type leases amounts to
EUR 446.5 million
during
2018
(
2017
:
EUR 247.4 million
;
2016
:
EUR 390.1 million
). Interest income for our sales-type leases in
2018
amounts to
EUR 4.9 million
(
2017
:
EUR 4.0 million
;
2016
:
EUR 6.3 million
).
We perform ongoing credit evaluations on our customers’ financial condition. We periodically review whether an allowance for credit losses is needed by considering factors such as historical payment experience, credit quality, the aging of the finance receivables balances,
and current economic conditions that may affect a customer’s ability to pay.
In
2018
,
2017
and
2016
we did
no
t
record any expected credit losses from finance receivables. As of December 31,
2018
, the finance receivables were neither past due nor impaired.
8
. Inventories
Inventories consist of the following:
|
|
|
|
|
|
|
As of December 31
|
2017
1
|
|
2018
|
|
|
(in millions)
|
EUR
|
|
EUR
|
|
|
|
|
|
|
|
|
Raw materials
|
826.8
|
|
1,238.3
|
|
|
Work-in-process
|
1,430.7
|
|
1,537.5
|
|
|
Finished products
|
1,048.0
|
|
1,105.0
|
|
|
|
|
|
|
|
|
Inventories, gross
|
3,305.5
|
|
3,880.8
|
|
|
Provision to net realizable value
|
(349.9
|
)
|
(441.3
|
)
|
|
Inventories, net
|
2,955.6
|
|
3,439.5
|
|
|
|
|
|
|
|
|
1.
|
As of January 1, 2018, ASML has adopted the new Revenue Recognition Standard (ASC 606) and Lease Standard (ASC 842). The comparative numbers have been adjusted to reflect these changes in accounting policies, see Note 1 General information / summary of significant accounting policies.
|
The
increase
in inventory in
2018
compared to
2017
is in line with the growing business.
ASML INTEGRATED REPORT 2018
127
A summary of activity in the provision to net realizable value is as follows:
|
Year ended December 31
|
2017
|
|
2018
|
|
|
(in millions)
|
EUR
|
|
EUR
|
|
|
Balance at beginning of year
|
(382.7
|
)
|
(349.9
|
)
|
|
Addition for the year
|
(120.1
|
)
|
(218.2
|
)
|
|
Effect of changes in exchange rates
|
7.9
|
|
4.2
|
|
|
Utilization of the provision
|
145.0
|
|
122.6
|
|
|
Balance at end of year
|
(349.9
|
)
|
(441.3
|
)
|
In
2018
, the addition for the year is recorded between cost of sales
EUR 207.9 million
and R&D costs
EUR 10.3 million
(
2017
: cost of sales
EUR 101.3 million
and R&D costs
EUR 18.8 million
,
2016
:
cost of sales
EUR 69.2 million
and R&D costs
EUR 3.8 million
).
In
2018
, the addition for the year mainly relates to inventory items which became obsolete due to technological developments and design changes.
9
.
Other assets
Other current assets consist of the following:
|
As of December 31
|
2017
1
|
|
2018
|
|
|
(in millions)
|
EUR
|
|
EUR
|
|
|
|
|
|
|
|
|
Advance payments to Carl Zeiss SMT GmbH
|
111.3
|
|
231.1
|
|
|
Prepaid expenses
|
198.4
|
|
299.6
|
|
|
Derivative financial instruments
|
50.5
|
|
42.2
|
|
|
VAT
|
67.3
|
|
116.0
|
|
|
Subordinated loan granted to lessor in respect of Veldhoven headquarters
2
|
5.4
|
|
—
|
|
|
Other assets
|
77.6
|
|
83.7
|
|
|
Other current assets
|
510.5
|
|
772.6
|
|
|
1.
|
As of January 1, 2018, ASML has adopted the new Revenue Recognition Standard (ASC 606) and Lease Standard (ASC 842). The comparative numbers have been adjusted to reflect these changes in accounting policies, see Note 1 General information / summary of significant accounting policies.
|
|
2.
|
For further details on the loan granted to the lessor in respect of the Veldhoven headquarters see
Note 13 Property, plant and equipment
.
|
ASML owns an indirect interest of 24.9 percent in Carl Zeiss SMT GmbH, who is our single supplier of optical columns and, from
time to time, ASML makes non-interest bearing advance payments to Carl Zeiss SMT GmbH supporting their work-in-process, thereby securing lens and optical column deliveries to us. Amounts included in these advance payments are settled through future lens or optical column deliveries.
Prepaid expenses mainly include prepaid income taxes on intercompany profit not realized by the ASML group
of
EUR 100.9 million
(
2017
:
EUR 99.7 million
) and
the contract balance related to the joint development program with imec of
EUR 107.5 million
as of
December 31, 2018
(
2017
:
EUR 15.6 million
).
At the end of 2018 we started the new joint development program under which we deliver a system and services upfront and receive R&D services throughout the contract period up until 2024.
Derivative financial instruments consist of the current part of the aggregate fair value of interest rate swaps and forward foreign exchange contracts, see
Note 4 Financial risk management
.
Other non-current assets consist of the following:
|
As of December 31
|
2017
1
|
|
2018
|
|
|
(in millions)
|
EUR
|
|
EUR
|
|
|
|
|
|
|
|
|
Advance payments to Carl Zeiss SMT GmbH
|
331.5
|
|
533.4
|
|
|
Derivative financial instruments
|
65.2
|
|
59.7
|
|
|
Compensation plan assets
2
|
41.2
|
|
43.1
|
|
|
Prepaid expenses
|
140.4
|
|
4.6
|
|
|
Non-current accounts receivable
|
105.5
|
|
150.7
|
|
|
Other assets
|
24.4
|
|
14.6
|
|
|
Other non-current assets
|
708.2
|
|
806.1
|
|
|
1.
|
As of January 1, 2018, ASML has adopted the new Revenue Recognition Standard (ASC 606) and Lease Standard (ASC 842). The comparative numbers have been adjusted to reflect these changes in accounting policies, see Note 1 General information / summary of significant accounting policies.
|
|
2.
|
For further details on compensation plan assets see
Note 19 Employee benefits
.
|
ASML INTEGRATED REPORT 2018
128
The non-current advance payments to Carl Zeiss SMT GmbH include the non-current part of the advance payments as described above, plus support for tooling (as part of the High NA agreement signed
November 3, 2016
)
for Carl Zeiss SMT GmbH of
EUR 176.7 million
as of
December 31, 2018
(
2017
:
EUR 39.1 million
).
Derivative financial instruments consist of the non-current part of the fair value of interest rate swaps, which
decreased
in value as a result of an increase in market interest rates, see
Note 4 Financial risk management
.
Prepaid expenses mainly included prepaid income taxes on intercompany profit (other than inventory) not realized by the ASML group.
As of
December 31, 2017
the balance of
prepaid income taxes on intercompany profit not realized by the ASML group amounts to
EUR 133.9 million
compared to
EUR 0.0 million
as of
December 31, 2018
. This change
is due to the adoption of ASU 2016-16 as of January 1, 2018. See
Note 1 General information / summary of significant accounting policies
.
Non-current accounts receivable increased as we sold more systems for which we granted our customers extended payment terms.
10
. Equity method investments
We include investments which are accounted for using the equity method,
under equity method investments in our Consolidated Balance Sheets.
As of December 31, 2018, these include a
24.9 percent
equity interest in Carl Zeiss SMT Holding GmbH & Co. KG, a limited partnership that owns Carl Zeiss SMT GmbH, our single supplier of optical columns.
We have determined that
Carl Zeiss SMT Holding GmbH & Co. KG
is a variable interest entity because the entity was established without substantive voting rights since there is disparity between
our voting rights and our economics, as well as substantially all
of Carl Zeiss SMT Holding GmbH & Co. KG
’
s activities involve or are conducted on our behalf. However, we are not the primary beneficiary of the variable interest entity because we lack the power, through voting rights or similar rights, to direct the activities that most significantly impact Carl Zeiss SMT Holding GmbH & Co. KG
’
s economic performance.
We account for our equity investment using the equity method of accounting because we do not control this partnership, however we can exert significant influence over its operating and financial policies.
On
June 29, 2017
, we completed the acquisition of the
24.9 percent
interest in Carl Zeiss SMT Holding GmbH & Co. KG for
EUR 1 billion
in cash plus
EUR 2.6 million
transaction costs. Our investment in Carl Zeiss SMT Holding GmbH & Co. KG was
EUR 979.3 million
more than our
24.9 percent
share of the carrying value of their underlying net assets as of the acquisition date. In order to determine the basis differences, we were required to determine the fair value of Carl Zeiss SMT Holding GmbH & Co. KG’s identifiable assets and liabilities at acquisition date in the same manner as if it would be a business combination. The excess costs of the investment over our proportional fair value of the identifiable assets and liabilities was identified as equity method goodwill.
The basis differences as of the acquisition date were allocated as follows:
|
|
|
|
|
(in millions)
|
EUR
|
|
|
Equity method goodwill
|
362.7
|
|
|
Other intangible assets
|
560.7
|
|
|
In-process research and development
|
50.7
|
|
|
Inventories
|
73.7
|
|
|
Pensions
|
19.9
|
|
|
Deferred tax liabilities
|
(88.4
|
)
|
|
|
|
|
|
Basis differences
|
979.3
|
|
We amortize the basis difference related to the other intangible assets over the estimated remaining useful lives of these assets that gave rise to this difference. The weighted-average life of the finite-lived intangible assets acquired is
19.4 years
and will be amortized using a straight-line method. In-process R&D is initially capitalized at fair value as an intangible asset with an indefinite life.
When the R&D project is complete, it is reclassified as an amortizable purchased intangible asset and is amortized over its estimated useful life. If the project is abandoned, we will record the full basis difference charge for the value of the related intangible asset in our
Consolidated Statements of Operations
in the period of abandonment. Equity method goodwill is not amortized or tested for impairment; instead the investment in Carl Zeiss SMT Holding GmbH & Co. KG is tested for impairment whenever events or changes in circumstances indicate that the carrying value of the investment may not be recoverable. The basis difference related to inventories will be recorded as part of profit (loss) related to
equity method investments.
For the year ended
December 31, 2018
, we recorded a
profit
from equity method investments of
EUR 6.2 million
in our Consolidated Statements of Operations. This
profit
includes the following components:
ASML INTEGRATED REPORT 2018
129
|
•
|
Profit of
EUR 80.9 million
related to our share of Carl Zeiss SMT Holding GmbH & Co. KG’s net income after accounting policy alignment.
|
|
•
|
Cost of
EUR 37.3 million
related to inventory step-up release.
|
|
•
|
Cost of
EUR 26.7 million
basis difference amortization related to intangible assets.
|
|
•
|
Cost due to intercompany profit elimination of
EUR 10.7 million
.
|
We record the results using a one-quarter time lag as these results are not available in time to record them in our concurrent period.
The
profit
was reflected as a
n increase
of the carrying amount of our equity method investments in our Consolidated Balance Sheets as of
December 31, 2018
.
During
2018
,
we received dividends amounting to
EUR 89.2 million
from Carl Zeiss SMT Holding GmbH & Co. KG
(
2017
:
EUR 19.7 million
).
Carl Zeiss SMT Holding GmbH & Co. KG is a privately held company; therefore, quoted market prices for their stock are not available.
The following summarizes the total assets and liabilities related to our variable interest in
Carl Zeiss SMT Holding GmbH & Co. KG
as reflected in our
Consolidated Balance Sheets
, as well as our maximum exposure to losses as of
December 31, 2018
. Our maximum exposure to loss is limited to our equity method investment in
Carl Zeiss SMT Holding GmbH & Co. KG
and prepayments provided to the equity method investment.
|
|
|
|||||
|
As of December 31
|
2018
|
|
2018
|
|
Maximum exposure to loss
|
|
|
(in millions)
|
Assets
|
|
Liabilities
|
|
||
|
EUV Agreements
1
|
393.7
|
|
—
|
|
393.7
|
|
|
DUV Agreements
1
|
31.5
|
|
—
|
|
31.5
|
|
|
High NA Agreement
1
|
342.9
|
|
—
|
|
342.9
|
|
|
Investment agreement for 24.9 percent equity
|
915.8
|
|
—
|
|
915.8
|
|
|
1.
|
Amounts are included in advanced payments to Carl Zeiss SMT GmbH within other current assets and other non-current assets. See
Note 9 Other assets
.
|
EUV and DUV Agreements
Carl Zeiss SMT
GmbH
is our single supplier of optical columns and, from time to time, receives non-interest bearing advance payments from us that support their work in-process, thereby securing lens and optical module deliveries to us. Amounts owed under these advance payments are settled through future lens, DUV or EUV optical component deliveries. Our maximum exposure related to this agreement is limited to the assets not settled as of the balance sheet date. See also
Note 9 Other assets
.
High NA Agreement
On
November 3, 2016
we agreed with Carl Zeiss SMT GmbH to support their R&D costs, capital expenditures and other supply chain investments, in respect of High NA, for an amount of
EUR 760.0 million
over
6 years
, beginning in 2016. During
2018
, we agreed to fund an additional
EUR 144.9 million
, which when combined with the agreed additional funding in
2017
of
EUR 325.0 million
, brings the current estimate of the total funding under this agreement to
EUR 1,229.9 million
. In
2018
we paid an amount of
EUR 275.1 million
, of which
EUR 74.8 million
related to R&D costs and
EUR 8.5 million
related to supply chain support costs (
2017
:
EUR 147.5 million
, of which
EUR 55.8 million
related to R&D cost
s a
nd
EUR 2.6 million
related to supply chain support costs)
. As of
December 31, 2018
our estimated remaining commitment to Carl Zeiss SMT GmbH amounts to
EUR 795.3 million
(
2017
:
EUR 925.5 million
).
Our maximum exposure related to this agreement is limited to the amount reimbursable from Carl Zeiss SMT GmbH as of the balance sheet date.
11
. Goodwill
Changes in goodwill are summarized as follows:
|
|
|
|
|
|
|
Year ended December 31
|
2017
|
|
2018
|
|
|
(in millions)
|
EUR
|
|
EUR
|
|
|
|
|
|
|
|
|
Cost
|
|
|
||
|
Balance at beginning of year
|
4,873.9
|
|
4,541.1
|
|
|
Effect of changes in exchange rates
|
(332.8
|
)
|
—
|
|
|
Balance at end of year
|
4,541.1
|
|
4,541.1
|
|
|
|
|
|
|
|
For more information with respect to business combinations, see
Note 2 Business combinations
.
Goodwill mainly results from the acquisitions of Cymer and HMI. Within ASML we have identified
two
reporting units, which are Reporting Unit ASML and Reporting Unit Cymer Light Sources.
ASML INTEGRATED REPORT 2018
130
As of
December 31, 2018
the goodwill allocated to Reporting Unit ASML amounts to
EUR 4,078.8 million
(
2017
:
EUR 4,078.8 million
) and for Reporting Unit Cymer Light Sources this amounts to
EUR 462.3 million
(
2017
:
EUR 462.3 million
).
Based on our assessment during the annual goodwill impairment test, we believe it is more likely than not that the
fair values of the reporting units
exceed their carrying amounts, and therefore goodwill was
no
t impaired as of
December 31, 2018
.
12
. Other intangible assets
As of
December 31, 2018
other intangible assets consist of
finite-lived other intangible assets. Brands, intellectual property,
developed technology, customer relationships
and other were
mainly
obtained from the acquisitions of HMI (2016) and Cymer (2013).
Finite-lived other intangible assets consist of the following:
|
|
|
|
|
|
|
|
|
|
|
|
|
|
|
(in millions)
|
Brands
EUR |
|
Intellectual
property EUR |
|
Developed
technology EUR |
|
Customer
relationships EUR |
|
Other
EUR |
|
Total
EUR |
|
|
Cost
|
|
|
|
|
|
|
||||||
|
Balance at January 1, 2017
|
40.2
|
|
61.4
|
|
1,264.7
|
|
253.2
|
|
17.4
|
|
1,636.9
|
|
|
Additions
|
—
|
|
0.5
|
|
—
|
|
—
|
|
14.9
|
|
15.4
|
|
|
Effect of changes in exchange rates
|
(2.0
|
)
|
—
|
|
(64.8
|
)
|
(24.6
|
)
|
(0.1
|
)
|
(91.5
|
)
|
|
Balance at December 31, 2017
|
38.2
|
|
61.9
|
|
1,199.9
|
|
228.6
|
|
32.2
|
|
1,560.8
|
|
|
Additions
|
—
|
|
5.0
|
|
—
|
|
—
|
|
37.0
|
|
42.0
|
|
|
Disposals
|
—
|
|
—
|
|
—
|
|
—
|
|
—
|
|
—
|
|
|
Effect of changes in exchange rates
|
1.0
|
|
2.0
|
|
—
|
|
—
|
|
(3.0
|
)
|
—
|
|
|
Balance at December 31, 2018
|
39.2
|
|
68.9
|
|
1,199.9
|
|
228.6
|
|
66.2
|
|
1,602.8
|
|
|
|
|
|
|
|
|
|
||||||
|
Accumulated amortization
|
|
|
|
|
|
|
||||||
|
Balance at January 1, 2017
|
3.2
|
|
57.9
|
|
199.1
|
|
50.0
|
|
3.7
|
|
313.9
|
|
|
Amortization
|
2.0
|
|
2.1
|
|
84.1
|
|
13.4
|
|
3.9
|
|
105.5
|
|
|
Impairment charges
|
—
|
|
—
|
|
—
|
|
—
|
|
0.1
|
|
0.1
|
|
|
Effect of changes in exchange rates
|
(0.4
|
)
|
—
|
|
(19.0
|
)
|
(5.6
|
)
|
0.3
|
|
(24.7
|
)
|
|
Balance at December 31, 2017
|
4.8
|
|
60.0
|
|
264.2
|
|
57.8
|
|
8.0
|
|
394.8
|
|
|
Amortization
|
1.9
|
|
1.2
|
|
82.1
|
|
12.7
|
|
5.8
|
|
103.7
|
|
|
Disposals
|
—
|
|
—
|
|
—
|
|
—
|
|
—
|
|
—
|
|
|
Effect of changes in exchange rates
|
0.7
|
|
1.6
|
|
0.2
|
|
—
|
|
(2.2
|
)
|
0.3
|
|
|
Balance at December 31, 2018
|
7.4
|
|
62.8
|
|
346.5
|
|
70.5
|
|
11.6
|
|
498.8
|
|
|
|
|
|
|
|
|
|
||||||
|
Carrying amount
|
|
|
|
|
|
|
||||||
|
December 31, 2017
|
33.4
|
|
1.9
|
|
935.7
|
|
170.8
|
|
24.2
|
|
1,166.0
|
|
|
December 31, 2018
|
31.8
|
|
6.1
|
|
853.4
|
|
158.1
|
|
54.6
|
|
1,104.0
|
|
During
2018
, we recorded amortization charges of
EUR 103.7 million
(
2017
:
EUR 105.5 million
;
2016
:
EUR 63.5 million
)
which were recorded in cost of sales for
EUR 97.2 million
(
2017
:
EUR 99.7 million
;
2016
:
EUR 59.5 million
),
in R&D costs for
EUR 1.3 million
(
2017
:
EUR 2.1 million
and
2016
:
EUR 2.5 million
) and in SG&A costs for
EUR 5.2 million
(
2017
:
EUR 3.7 million
and
2016
:
EUR 1.5 million
).
As of
December 31, 2018
, the other intangible assets not yet available for use
amount to
EUR 37.0 million
(
2017
:
EUR 6.0 million
) and are allocated to Reporting Unit ASML.
During
2018
we recorded
no
impairment charges (
2017
:
EUR 0.1 million
;
2016
:
EUR 0.0 million
).
As of
December 31, 2018
, the estimated amortization expenses for other intangible assets, for the next 5 years and thereafter, are as follows:
|
|
|
|
|
(in millions)
|
EUR
|
|
|
2019
|
105.1
|
|
|
2020
|
104.5
|
|
|
2021
|
103.7
|
|
|
2022
|
100.7
|
|
|
2023
|
93.5
|
|
|
Thereafter
|
596.5
|
|
|
Amortization expenses
|
1,104.0
|
|
ASML INTEGRATED REPORT 2018
131
13
. Property, plant and equipment
Property, plant and equipment consist of the following:
|
(in millions)
|
Land and
buildings
EUR
|
|
Machinery
and
equipment
EUR
|
|
Leasehold
improvements
EUR
|
|
Furniture,
fixtures and
other
equipment
EUR
|
|
Total
EUR
|
|
|
Cost
|
||||||||||
|
Balance at January 1, 2017
|
1,556.6
|
|
1,133.1
|
|
254.2
|
|
359.0
|
|
3,302.9
|
|
|
Additions
|
115.2
|
|
173.3
|
|
6.9
|
|
24.9
|
|
320.3
|
|
|
Disposals
|
(0.4
|
)
|
(105.3
|
)
|
(0.1
|
)
|
(3.5
|
)
|
(109.3
|
)
|
|
Effect of changes in exchange rates
|
(29.6
|
)
|
(41.2
|
)
|
(4.4
|
)
|
(4.8
|
)
|
(80.0
|
)
|
|
Balance at December 31, 2017
|
1,641.8
|
|
1,159.9
|
|
256.6
|
|
375.6
|
|
3,433.9
|
|
|
Acquisitions through business combinations
|
—
|
|
—
|
|
—
|
|
—
|
|
—
|
|
|
Additions
|
119.6
|
|
256.2
|
|
21.5
|
|
44.6
|
|
441.9
|
|
|
Disposals
|
(57.2
|
)
|
(114.7
|
)
|
(3.4
|
)
|
(4.9
|
)
|
(180.2
|
)
|
|
Effect of changes in exchange rates
|
5.6
|
|
3.7
|
|
0.5
|
|
0.9
|
|
10.7
|
|
|
Balance at December 31, 2018
|
1,709.8
|
|
1,305.1
|
|
275.2
|
|
416.2
|
|
3,706.3
|
|
|
Accumulated depreciation and impairment
|
||||||||||
|
Balance at January 1, 2017
|
474.6
|
|
642.9
|
|
224.8
|
|
273.4
|
|
1,615.7
|
|
|
Depreciation
|
87.9
|
|
172.3
|
|
21.5
|
|
26.5
|
|
308.2
|
|
|
Impairment charges
|
0.2
|
|
8.7
|
|
—
|
|
—
|
|
8.9
|
|
|
Disposals
|
(0.2
|
)
|
(57.1
|
)
|
(0.1
|
)
|
(3.3
|
)
|
(60.7
|
)
|
|
Effect of changes in exchange rates
|
(9.8
|
)
|
(24.4
|
)
|
(1.7
|
)
|
(3.1
|
)
|
(39.0
|
)
|
|
Balance at December 31, 2017
|
552.7
|
|
742.4
|
|
244.5
|
|
293.5
|
|
1,833.1
|
|
|
Depreciation
|
92.8
|
|
174.8
|
|
19.2
|
|
28.6
|
|
315.4
|
|
|
Impairment charges
|
1.0
|
|
14.4
|
|
—
|
|
—
|
|
15.4
|
|
|
Disposals
|
(2.5
|
)
|
(41.1
|
)
|
(3.0
|
)
|
(4.5
|
)
|
(51.1
|
)
|
|
Effect of changes in exchange rates
|
2.0
|
|
1.5
|
|
0.2
|
|
0.3
|
|
4.0
|
|
|
Balance at December 31, 2018
|
646.0
|
|
892.0
|
|
260.9
|
|
317.9
|
|
2,116.8
|
|
|
Carrying amount
|
|
|||||||||
|
December 31, 2017
|
1,089.1
|
|
417.5
|
|
12.1
|
|
82.1
|
|
1,600.8
|
|
|
December 31, 2018
|
1,063.8
|
|
413.1
|
|
14.3
|
|
98.3
|
|
1,589.5
|
|
As of
December 31, 2018
, the carrying amount includes assets under construction for land and buildings of
EUR 79.0 million
(
2017
:
EUR 94.6 million
), machinery and equipment of
EUR 39.1 million
(
2017
:
EUR 29.3 million
), leasehold improvements of
EUR 7.8 million
(
2017
:
EUR 2.3 million
) and furniture, fixtures and other equipment of
EUR 9.3 million
(
2017
:
EUR 7.0 million
).
As of
December 31, 2018
, the carrying amount of land amounts to
EUR 94.6 million
(
2017
:
EUR 94.0 million
).
As of
December 31, 2018
, the
carrying amount of machinery and equipment includes an amount of
EUR 17.1 million
with respect to evaluation systems
(
2017
:
EUR 8.1 million
).
The majority of the additions in
2018
in property, plant and equipment relates to the expansion and upgrades of facilities, prototypes and training systems.
The majority of additions in
2018
in machinery and equipment relates to upgrade and expansion of production tooling and investment in prototypes, evaluation and training systems which are similar to those that ASML sells in its ordinary course of business. These systems are capitalized under property, plant and equipment because these are held for own use and for evaluation purposes. These are recorded at cost and depreciated over their expected useful life taking into consideration their residual value. From the time that these assets are no longer held for own use but intended for sale in the ordinary course of business, they are reclassified from property, plant and equipment to inventory at their carrying value.
An amount of
EUR 59.8 million
(
2017
:
EUR 13.4 million
)
of the additions in property, plant and equipment relates to non-cash transfers from inventory. Since the transfers between inventory and property, plant and equipment are non-cash events, these are not reflected in
the Consolidated Statements of Cash Flows.
ASML INTEGRATED REPORT 2018
132
An amount of
EUR 70.8 million
(
2017
:
EUR 45.8 million
)
of the disposal of property, plant and equipment relates to non-cash transfers to inventory
.
When sold, the proceeds and cost of these systems are recorded as net sales and cost of sales, respectively, identical to the treatment of other sales transactions. The cost of sales for these systems includes the inventory value and the additional costs of refurbishing (materials and labor).
Since the transfers between inventory and property, plant and equipment are non-cash events, these are not reflected in
the Consolidated Statements of Cash Flows.
During
2018
, we recorded depreciation charges of
EUR 315.4 million
(
2017
:
EUR 308.2 million
; 2016:
EUR 290.8 million
)
of which we recorded
EUR 191.6 million
(
2017
:
EUR 195.7 million
;
2016
:
EUR 187.9 million
)
in cost of sales,
EUR 105.9 million
(
2017
:
EUR 101.7 million
;
2016
:
EUR 76.8 million
)
in R&D costs and
EUR 17.9 million
(
2017
:
EUR 10.8 million
;
2016
:
EUR 26.1 million
)
in SG&A costs.
The machinery and equipment contains
finance
lease arrangements for an amount of
EUR 7.5 million
(
2017
:
EUR 10.2 million
)
.
The depreciation included in the
Consolidated Statements of Operations
amounts to
EUR 2.7 million
(
2017
:
EUR 2.8 million
;
2016
:
EUR 2.8 million
)
.
The total cash outflow for
finance
leases was
EUR 2.7 million
(
2017
:
EUR 2.8 million
;
2016
:
EUR 2.8 million
).
The weighted average remaining lease term in
2018
was
52 months
(
2017
:
59 months
;
2016
:
68 months
) for finance
leases. The weighted average discount rate in
2018
was
2.1 percent
(
2017
:
2.2 percent
;
2016
:
2.2 percent
).
Variable interest entity
The carrying amount of land and buildings includes an amount of
EUR 25.1 million
(
2017
:
EUR 25.2 million
) relating to our headquarters in Veldhoven, the Netherlands, which as of
June 29, 2018
is owned by ASML, however previously was owned by Koppelenweg I B.V., a
"variable interest entity". This was determined to be a variable interest entity since the equity investors did not have sufficient equity at risk for the legal entity to finance its activities without additional subordinate support.
Since
2003
, we leased the Veldhoven headquarters for a period of
15 years
from an entity ("lessor") that was incorporated by the
VIE
shareholders. The
VIE
shareholders each granted a loan of
EUR 11.6 million
and a fourth bank granted a loan of
EUR 12.3 million
(
EUR 47.1 million
in total) to the parent of the lessor. ASML provided the parent of the lessor with a subordinated loan of
EUR 5.4 million
and had a purchase option that was exercisable either at the end of the lease in June 2018, at a price of
EUR 24.5 million
, or during the lease at a price equal to the book value of the assets.
On
June 28, 2018
, ASML exercised the purchase option and acquired the building, as well as subsequently redeemed the subordinated loan of
EUR 5.4 million
on
July 4, 2018
. As a result, Koppelenweg I B.V. is no longer considered a
VIE.
For more information with respect to our variable interest entity, Carl Zeiss SMT Holding GmbH & Co. KG, see
Note 10 Equity method investments
.
14
.
Right-of-use assets and lease liabilities
Right-of-use assets consist of the following
operating
leases:
|
As of December 31
|
2017
|
|
2018
|
|
|
(in millions)
|
EUR
|
|
EUR
|
|
|
Properties
|
81.7
|
|
105.1
|
|
|
Cars
|
10.1
|
|
11.9
|
|
|
Warehouses
|
16.7
|
|
14.5
|
|
|
Other
|
5.2
|
|
6.1
|
|
|
Right-of-use assets
|
113.7
|
|
137.6
|
|
Lease liabilities related to
operating
leases are split between current and non-current:
|
As of December 31
|
2017
|
|
2018
|
|
|
(in millions)
|
EUR
|
|
EUR
|
|
|
Current
|
32.8
|
|
46.3
|
|
|
Non-current
|
81.0
|
|
93.7
|
|
|
Lease liabilities
|
113.8
|
|
140.0
|
|
ASML INTEGRATED REPORT 2018
133
The
Consolidated Statements of Operations
shows the following depreciation charges relating to these
operating leases:
|
As of December 31
|
2016
|
|
2017
|
|
2018
|
|
|
(in millions)
|
EUR
|
|
EUR
|
|
EUR
|
|
|
|
||||||
|
Properties
|
31.0
|
|
29.9
|
|
40.2
|
|
|
Cars
|
7.1
|
|
7.1
|
|
7.4
|
|
|
Warehouses
|
5.1
|
|
5.9
|
|
7.1
|
|
|
Other
|
7.1
|
|
11.6
|
|
12.4
|
|
|
Depreciation charge right-of-use assets
|
50.3
|
|
54.5
|
|
67.1
|
|
The total cash outflow for operating leases in
2018
was
EUR 67.1 million
(
2017
:
EUR 54.5 million
;
2016:
EUR 50.3 million
).
The weighted average remaining lease term in
2018
was
60 months
(
2017
:
57 months
;
2016
:
65 months
). The weighted average discount rate in
2018
was
2.1 percent
(
2017
:
2.2 percent
; 2016:
2.2 percent
).
The contractual maturity of the lease liabilities has been disclosed in
Note 18 Commitments, contingencies and guarantees
.
The disclosure of Finance Leases has been included in
Note 13 Property, plant and equipment
.
15
. Accrued and other liabilities
Accrued and other liabilities consist of the following:
|
|
|
|
|
|
|
As of December 31
|
2017
1
|
|
2018
|
|
|
(in millions)
|
EUR
|
|
EUR
|
|
|
|
|
|
|
|
|
Costs to be paid
|
208.7
|
|
154.8
|
|
|
Personnel related items
|
427.6
|
|
544.4
|
|
|
Derivative financial instruments
|
67.3
|
|
47.4
|
|
|
Lease liabilities
|
113.8
|
|
140.0
|
|
|
Standard warranty reserve
|
59.7
|
|
59.8
|
|
|
Provisions
|
21.0
|
|
160.3
|
|
|
Other
|
6.7
|
|
6.4
|
|
|
Accrued and other liabilities
|
904.8
|
|
1,113.1
|
|
|
Less: non-current portion of accrued and other liabilities
|
279.3
|
|
201.7
|
|
|
Current portion of accrued and other liabilities
|
625.5
|
|
911.4
|
|
|
|
|
|
|
|
|
1.
|
As of January 1, 2018, ASML has adopted the new Revenue Recognition Standard (ASC 606) and Lease Standard (ASC 842). The comparative numbers have been adjusted to reflect these changes in accounting policies, see Note 1 General information / summary of significant accounting policies.
|
Costs to be paid as of December 31,
2018
include anticipated losses on constructive obligations to upgrade EUV sources in the field of
EUR 14.6 million
(
2017
:
EUR 84.5 million
).
In addition, costs to be paid include accrued costs for unbilled services provided by suppliers including contracted labor, outsourced services and consultancy.
Personnel related items mainly consist of accrued profit sharing, accrued management bonuses, accrued vacation days, accrued pension premiums, accrued wage tax and accrued vacation allowance. The increase in accrued personnel related items as of December 31,
2018
compared to December 31,
2017
is mainly the result of the increase in our number of FTEs.
Derivative financial instruments consist of the aggregate fair value of interest rate swaps which includes accrued interest. The interest rate swaps decreased in value as a result of increased interest rates, see
Note 4 Financial risk management
.
For more details on Lease liabilities refer to
Note 14 Right-of-use assets and lease liabilities
.
ASML INTEGRATED REPORT 2018
134
Changes in standard warranty reserve for the years
2018
and
2017
are as follows:
|
Year ended December 31
|
2017
|
|
2018
|
|
|
(in millions)
|
EUR
|
|
EUR
|
|
|
Balance at beginning of year
|
36.5
|
|
59.7
|
|
|
Additions for the year
|
74.3
|
|
79.7
|
|
|
Utilization of the reserve
|
(35.4
|
)
|
(59.8
|
)
|
|
Release of the reserve
|
(14.3
|
)
|
(17.8
|
)
|
|
Effect of exchange rates
|
(1.4
|
)
|
(2.0
|
)
|
|
Balance at end of year
|
59.7
|
|
59.8
|
|
The provisions mainly relate to the settlement with Nikon, see
Note 20 Legal contingencies
.
16
. Long-term debt
Long-term debt consists of the following:
|
|
|
|
|
|
|
As of December 31
|
2017
|
|
2018
|
|
|
(in millions)
|
EUR
|
|
EUR
|
|
|
|
|
|
|
|
|
EUR 500 million 0.625 percent senior notes due 2022, carrying amount
|
487.8
|
|
494.5
|
|
|
EUR 750 million 3.375 percent senior notes due 2023, carrying amount
|
820.6
|
|
816.0
|
|
|
EUR 1,000 million 1.375 percent senior notes due 2026, carrying amount
|
947.8
|
|
964.6
|
|
|
EUR 750 million 1.625 percent senior notes due 2027, carrying amount
|
732.1
|
|
742.4
|
|
|
Loan headquarter building
1
|
25.2
|
|
—
|
|
|
Other
|
11.8
|
|
9.0
|
|
|
Long-term debt
|
3,025.3
|
|
3,026.5
|
|
|
Less: current portion of long-term debt
|
25.2
|
|
—
|
|
|
Non-current portion of long-term debt
|
3,000.1
|
|
3,026.5
|
|
|
1.
|
This loan related to our
variable interest entity, see
|
Our obligations to make principal repayments under our Eurobonds and other borrowing arrangements excluding interest expense as of
December 31, 2018
:
|
|
|
|
|
(in millions)
|
EUR
|
|
|
2019
|
1.8
|
|
|
2020
|
1.8
|
|
|
2021
|
1.8
|
|
|
2022
|
501.8
|
|
|
2023
|
750.3
|
|
|
Thereafter
|
1,750.0
|
|
|
Long-term debt
|
3,007.5
|
|
|
Less: current portion of long-term debt
|
1.8
|
|
|
Non-current portion of long-term debt
|
3,005.7
|
|
For the years 2019-2021 the obligations relate to lease payments. The years thereafter mainly relate to repayments under our Eurobonds.
Eurobonds
The following table summarizes the carrying amount of our outstanding Eurobonds, including the fair value of interest rate swaps used to hedge the change in the fair value of the Eurobonds:
|
|
|
|
|
|
|
As of December 31
|
2017
|
|
2018
|
|
|
(in millions)
|
EUR
|
|
EUR
|
|
|
Amortized cost amount
|
2,976.6
|
|
2,980.0
|
|
|
Fair value interest rate swaps
1
|
11.7
|
|
37.5
|
|
|
Carrying amount
|
2,988.3
|
|
3,017.5
|
|
|
1.
|
The fair value of the interest rate swaps excludes accrued interest.
|
ASML INTEGRATED REPORT 2018
135
In
September 2013
, we completed an offering of our
EUR 750 million
3.375 percent
senior notes due
2023
,
with interest payable annually on September 19. The notes are redeemable at the option of ASML, in whole or in part, at any time by paying a make whole premium, and unless previously redeemed, will be redeemed at
100 percent
of their principal amount on
September 19, 2023
.
In
July 2016
, we completed an offering of our
EUR 500 million
0.625 percent
senior notes due
2022
,
with interest payable annually on July 7. The notes are redeemable at the option of ASML, in whole or in part, at any time by paying a make whole premium, and unless previously redeemed, will be redeemed at
100 percent
of their principal amount on
July 7, 2022
.
In
July 2016
, we completed an offering of our
EUR 1,000 million
1.375 percent
senior notes due
2026
,
with interest payable annually on July 7. The notes are redeemable at the option of ASML, in whole or in part, at any time by paying a make whole premium, and unless previously redeemed, will be redeemed at
100 percent
of their principal amount on
July 7, 2026
.
In
November 2016
, we completed an offering of our
EUR 750 million
1.625 percent
senior notes due
2027
, with interest payable annually on May 28. The notes are redeemable at the option of ASML, in whole or in part, at any time by paying a make whole premium, and unless previously redeemed, will be redeemed at
100 percent
of their principal amount on
May 28, 2027
.
The Eurobonds serve as hedged items in fair value hedge relationships in which we hedge the variability of changes in the fair value of our Eurobonds due to changes in market interest rates with interest rate swaps. The fair value changes of these interest rate swaps are recorded on the Consolidated Balance Sheets under derivative financial instruments (within other current assets, other non-current assets, current accrued and other liabilities and non-current accrued and other liabilities) and the carrying amount of the Eurobonds is adjusted for these fair value changes only.
The following table summarizes the estimated fair value of our Eurobonds:
|
As of December 31
|
2017
|
|
2018
|
|
|
(in millions)
|
EUR
|
|
EUR
|
|
|
Principal amount
|
3,000.0
|
|
3,000.0
|
|
|
Carrying amount
|
2,988.3
|
|
3,017.5
|
|
|
Fair value
1
|
3,193.2
|
|
3,119.4
|
|
|
1.
|
Source: Bloomberg Finance LP.
|
The fair value of our Eurobonds is estimated based on quoted market prices as of
December 31, 2018
. Due to changes in market interest rates and credit spreads since the issue of our Eurobonds which carry a fixed coupon interest rate, the fair value deviates from the principal amount.
17
. Lines of credit
Our available credit facilities amount to
EUR 700.0 million
as of
December 31, 2018
and
as of December 31,
2017
.
No
amounts were outstanding under these credit facilities at the end of
2018
and
2017
.
The amounts available at
December 31, 2018
and
2017
consisted of
EUR 700.0 million
committed revolving credit facility with a group of banks, which matures in
2022
.
Outstanding amounts under this credit facility will bear interest at EURIBOR or LIBOR plus a margin that depends on our credit rating.
18
. Commitments, contingencies and guarantees
We have various contractual obligations, some of which are required to be recorded as liabilities in our Financial Statements, including long- and short-term debt and lease commitments. Other contractual obligations, namely purchase obligations and guarantees, are generally not required to be recognized as liabilities on our
Consolidated Balance Sheets
but are required to be disclosed.
Our contractual obligations as of December 31,
2018
can be summarized as follows:
|
Payments due by period
|
Total
|
|
1 year
|
|
2 year
|
|
3 year
|
|
4 year
|
|
5 year
|
|
After
5 years |
|
|
(in millions)
|
EUR
|
|
EUR
|
|
EUR
|
|
EUR
|
|
EUR
|
|
EUR
|
|
EUR
|
|
|
Long-Term Debt Obligations, including interest expense
1
|
3,383.6
|
|
57.3
|
|
57.2
|
|
57.2
|
|
556.5
|
|
802.3
|
|
1,853.1
|
|
|
Lease Obligations
2
|
140.0
|
|
36.7
|
|
32.3
|
|
25.8
|
|
19.9
|
|
11.9
|
|
13.4
|
|
|
Purchase Obligations
|
4,020.5
|
|
3,594.4
|
|
324.6
|
|
37.6
|
|
33.9
|
|
8.8
|
|
21.2
|
|
|
Carl Zeiss SMT GmbH High NA Funding Commitment
|
795.3
|
|
351.8
|
|
282.0
|
|
87.0
|
|
46.0
|
|
28.5
|
|
—
|
|
|
Total Contractual Obligations
3
|
8,339.4
|
|
4,040.2
|
|
696.1
|
|
207.6
|
|
656.3
|
|
851.5
|
|
1,887.7
|
|
|
1.
|
See
Note 16 Long-term debt
for the amounts excluding interest expense.
|
|
2.
|
See
Note 14 Right-of-use assets and lease liabilities
for details.
|
|
3.
|
We have excluded unrecognized tax benefits for an amount of
EUR 208.7 million
as the amounts that will be settled in cash are not known and the timing of any payments is uncertain.
|
ASML INTEGRATED REPORT 2018
136
Long-term debt obligations mainly relate to interest payments and principal amounts of our Eurobonds. See
Note 16 Long-term debt
.
Lease obligations mainly relate to properties, cars and warehouses. See
Note 14 Right-of-use assets and lease liabilities
.
We have purchase commitments towards suppliers in the ordinary course of business. ASML expects that it will honor these purchase obligations to fulfill future sales, in line with the timing of those future sales. The general terms and conditions of the agreements relating to the major part of our purchase commitments as of December 31,
2018
contain clauses that enable us to delay or cancel delivery of ordered goods and services up to the dates specified in the corresponding purchase contracts. These terms and conditions that we typically agree with our supply chain partners give us additional flexibility to adapt our purchase obligations to our requirements in light of the cyclicality and technological developments inherent in the industry in which we operate. We establish a provision for cancellation costs when the liability has been incurred and the amount of cancellation fees is reasonably estimable.
On
November 3, 2016
we agreed with Carl Zeiss SMT GmbH to support their R&D costs, capital expenditures and other supply chain investments, in respect of High NA, for an amount of
EUR 760.0 million
over
6 years
, beginning in 2016. During
2018
, we agreed to fund an additional
EUR 144.9 million
, which when combined with the agreed additional funding in
2017
of
EUR 325.0 million
, brings the current estimate to
EUR 1,229.9 million
. In
2018
we paid an amount of
EUR 275.1 million
(
2017
:
EUR 147.5 million
)
. As of
December 31, 2018
our estimated remaining commitment to Carl Zeiss SMT GmbH amounts to
EUR 795.3 million
(
2017
:
EUR 925.5 million
).
We have a non-committed guarantee facility of
EUR 85.0 million
under which guarantees in the ordinary course of business can be provided to third parties.
19
. Employee benefits
We have a performance related bonus plan (STI) for some of our management. In 2018, we increased the number of employees who qualified for this bonus plan. Under this plan, the amounts depend on company and individual performance. Within ASML, the STI for these members of management (excluding BoM) can range between
0 percent
and
112.5 percent
of their annual base salary, depending on the job levels. The performance targets are set for a whole year. The STI over
2018
are accrued for in the
Consolidated Balance Sheets
as of December 31,
2018
and are expected to be paid in the first quarter of
2019
.
Our STI expenses for the BoM and other management were as follows:
|
Year ended December 31
|
2016
|
|
2017
|
|
2018
|
|
|
(in millions)
|
EUR
|
|
EUR
|
|
EUR
|
|
|
Board of Management
1
|
3.5
|
|
3.8
|
|
4.5
|
|
|
Other management
|
48.5
|
|
51.7
|
|
64.6
|
|
|
Bonus expenses
|
52.0
|
|
55.5
|
|
69.1
|
|
|
1.
|
Includes all members that served on the Board of Management throughout the year
.
|
Profit-sharing plan
We have a profit-sharing plan covering all European employees (in 2017 and 2016 this also included US non-sales employees) who are not members of the BoM or other management. Under the plan, eligible employees receive an annual profit-sharing, based on a percentage of net income relative to total net sales ranging from
0 percent
to
20.0 percent
of their annual salary. The profit sharing for the years
2018
,
2017
and
2016
was
EUR 82.6 million
,
EUR 126.0 million
and
EUR 93.3 million
, respectively.
Our profit is also one of the criteria for the variable pay programs for employees in Asia, and as of 2018, this also includes US non–sales employees. Expenses in relation to these plans amount to
EUR 86.5 million
for
2018
,
EUR 40.3 million
for
2017
and
EUR 33.8 million
for
2016
.
Share-based compensation
In the past we have adopted various share and option plans for our employees. Starting January 1, 2014 the Employee Umbrella Share Plan has become effective, covering all grants made as of that date for our employees. The AGM approves each year the maximum number of shares that can be used by ASML to execute share-based incentives. Within this limit, the SB determines the maximum number of shares that is granted to the BoM in line with the Remuneration Policy and the BoM determines the total maximum of shares that can be granted in that year for eligible employees in line with existing policies. Our current share-based compensation plans do not provide for cash settlement of options and shares.
The total gross amount of recognized compensation expenses associated with share-based payments (including share-based payments to the BoM) was
EUR 46.3 million
in
2018
,
EUR 53.1 million
in
2017
and
EUR 47.7 million
in
2016
.
The tax benefit (excluding excess tax benefits) recognized related to the recognized share-based compensation costs in the US amounted to
EUR 5.6 million
in
2018
,
EUR 8.7 million
in
2017
and
EUR 10.0 million
in
2016
.
ASML INTEGRATED REPORT 2018
137
Total compensation costs (including share-based payments to the BoM) to be recognized in future periods amount to
EUR 94.2 million
as of December 31,
2018
(
2017
:
EUR 78.5 million
;
2016
:
EUR 83.2 million
).
The weighted average period over which these costs are expected to be recognized is calculated
at
1.7 years
(
2017
:
1.8 years
;
2016
:
1.9 years
).
Employee Umbrella Share Plan
The Employee Umbrella Share Plan, effective as of January 1, 2014 covers all employees. Within this plan, we distinguish between performance and incentive shares. Within the incentive category, prior to October 3, 2016 employees could choose, at inception, to convert the shares into options. As of October 3, 2016 this option no longer exists. All grants under the Employee Umbrella Share Plan typically have a
three
-year vesting period.
Share plans
Our current share plans typically include a
three
-year service period and some plans have vesting conditions which are based on performance. The fair value of shares is determined on the closing trading price of our shares listed at Euronext Amsterdam on the grant date.
Details with respect to shares granted and vested during the year are set out in the following table:
|
|
EUR-denominated
|
USD-denominated
|
||||||||||
|
Year ended December 31
|
2016
|
|
2017
|
|
2018
|
|
2016
|
|
2017
|
|
2018
|
|
|
Total fair value at vesting date of shares vested during the year (in millions)
|
25.5
|
|
49.9
|
|
46.4
|
|
31.3
|
|
53.3
|
|
61.6
|
|
|
Weighted average fair value of shares granted
|
87.21
|
|
125.16
|
|
161.63
|
|
96.00
|
|
130.77
|
|
187.98
|
|
A summary of the status of conditionally outstanding shares as of December 31,
2018
,
and changes during the year ended December 31,
2018
,
is presented below:
|
|
EUR-denominated
|
USD-denominated
|
||||||
|
|
Number
of shares
|
|
Weighted
average
fair value at
grant date
(EUR)
|
|
Number
of shares
|
|
Weighted
average
fair value at
grant date
(USD)
|
|
|
Conditional shares outstanding at January 1, 2018
|
782,090
|
|
99.10
|
|
836,554
|
|
107.61
|
|
|
Granted
|
288,679
|
|
161.63
|
|
348,997
|
|
187.98
|
|
|
Vested
|
(293,075
|
)
|
108.10
|
|
(315,333
|
)
|
113.96
|
|
|
Forfeited
|
(56,867
|
)
|
96.98
|
|
(209,036
|
)
|
108.33
|
|
|
Conditional shares outstanding at December 31, 2018
|
720,827
|
|
120.73
|
|
661,182
|
|
146.78
|
|
Option plans
Our option plans typically vest over a
three
-year service period with any unexercised stock options expiring
10 years
after the grant date. Options granted have fixed exercise prices equal to the closing price of our shares listed at Euronext Amsterdam on grant date. The fair value of stock options was determined using a Black-Scholes option valuation model. As of 2017 we no longer grant options to our employees.
The Black-Scholes option valuation of our last stock options granted in 2016 were based on the following assumptions:
|
Year ended December 31
|
2016
|
|
|
Weighted average share price (in EUR)
|
88.3
|
|
|
Volatility (in percentage)
|
27.2
|
|
|
Expected life (in years)
|
5.7
|
|
|
Expected dividend yield (in EUR)
|
2.94
|
|
When establishing the expected life assumption, we considered the contractual terms of the stock options as well as historical employee exercise behavior.
ASML INTEGRATED REPORT 2018
138
Details with respect to stock options are set out in the following table:
|
|
EUR-denominated
|
USD-denominated
|
||||||||||
|
Year ended December 31
|
2016
|
|
2017
|
|
2018
|
|
2016
|
|
2017
|
|
2018
|
|
|
Weighted average fair value of stock options granted
|
20.34
|
|
—
|
|
—
|
|
22.69
|
|
—
|
|
—
|
|
|
Weighted average share price at the exercise date of stock options
|
98.08
|
|
132.67
|
|
169.68
|
|
100.68
|
|
148.48
|
|
201.01
|
|
|
Aggregate intrinsic value of stock options exercised (in millions)
|
11.5
|
|
12.5
|
|
13.6
|
|
4.1
|
|
4.8
|
|
7.6
|
|
|
Weighted average remaining contractual term of currently exercisable options (in years)
|
3.69
|
|
3.80
|
|
4.76
|
|
4.71
|
|
4.49
|
|
5.20
|
|
|
Aggregate intrinsic value of exercisable stock options (in millions)
|
22.3
|
|
21.0
|
|
8.9
|
|
8.9
|
|
13.1
|
|
5.2
|
|
|
Aggregate intrinsic value of outstanding stock options (in millions)
|
22.7
|
|
21.2
|
|
9.0
|
|
8.9
|
|
13.2
|
|
5.2
|
|
The number and weighted average exercise prices of stock options as of December 31,
2018
,
and changes during the year then ended are presented below:
|
|
EUR-denominated
|
USD-denominated
|
||||||
|
|
Number
of options
|
|
Weighted average
exercise price
per ordinary
share (EUR)
|
|
Number
of options
|
|
Weighted average
exercise price
per ordinary
share (USD)
|
|
|
Outstanding, January 1, 2018
|
207,796
|
|
42.67
|
|
118,659
|
|
62.85
|
|
|
Granted
|
—
|
|
—
|
|
—
|
|
—
|
|
|
Exercised
|
(90,710
|
)
|
19.86
|
|
(46,208
|
)
|
36.65
|
|
|
Forfeited
|
—
|
|
—
|
|
—
|
|
—
|
|
|
Expired
|
(197
|
)
|
—
|
|
(2,152
|
)
|
—
|
|
|
Outstanding, December 31, 2018
|
116,889
|
|
60.41
|
|
70,299
|
|
81.43
|
|
|
Exercisable, December 31, 2018
|
116,692
|
|
60.49
|
|
70,299
|
|
81.43
|
|
Details with respect to the stock options outstanding are set out in the following table:
|
EUR-denominated
|
USD-denominated
|
||||||
|
Range of
exercise prices (EUR) |
Number of outstanding options at December 31, 2018
|
|
Weighted
average remaining contractual life of outstanding options (years) |
Range of
exercise prices (USD) |
Number of outstanding options at December 31, 2018
|
|
Weighted
average remaining contractual life of outstanding options (years) |
|
15 - 20
|
9,347
|
|
0.79
|
15 - 20
|
—
|
|
0.00
|
|
20 - 25
|
11,227
|
|
1.80
|
20 - 25
|
—
|
|
0.00
|
|
25 - 40
|
9,343
|
|
2.74
|
25 - 40
|
10,212
|
|
1.90
|
|
40 - 50
|
11,231
|
|
3.79
|
40 - 50
|
950
|
|
2.62
|
|
50 - 60
|
8,853
|
|
4.95
|
50 - 60
|
3,760
|
|
3.66
|
|
60 - 70
|
17,079
|
|
4.93
|
60 - 70
|
729
|
|
4.06
|
|
70 - 80
|
16,517
|
|
6.40
|
70 - 80
|
1,422
|
|
4.30
|
|
80 - 90
|
33,292
|
|
6.78
|
80 - 90
|
15,155
|
|
5.78
|
|
90 - 100
|
—
|
|
0.00
|
90 - 100
|
38,071
|
|
6.13
|
|
Total
|
116,889
|
|
4.76
|
Total
|
70,299
|
|
5.20
|
Employee purchase plan
Every quarter, we offer our worldwide payroll employees the opportunity to buy our shares against fair value using their net salary. The BoM is excluded from participation in this plan. The fair value for shares is based on the closing price of our shares listed at Euronext Amsterdam on grant date. The maximum net amount for which employees can participate in the plan amounts to
10.0 percent
of their annual gross base salary. When employees retain the shares for a minimum of
12 months
,
we will pay out a
20.0 percent
cash bonus on the initial participation amount.
ASML INTEGRATED REPORT 2018
139
Deferred compensation plans
In July 2002, we adopted a non-qualified deferred compensation plan for our US employees that allows a select group of management or highly compensated employees to defer a portion of their salary, bonus, and commissions. The plan allows us to credit additional amounts to the participants’ account balances. The participants divide their funds among the investments available in the plan. Participants elect to receive their funds in future periods after the earlier of their employment termination or their withdrawal election, at least
3 years
after deferral.
There were minor expenses relating to this plan
in
2018
,
2017
and
2016
.
Cymer has a similar non-qualified deferred compensation plan for a selected group of management level employees in the US in which the employee may elect to defer receipt of current compensation in order to provide retirement and other benefits on behalf of such employee backed by Cymer owned life insurance policies.
As of December 31,
2018
,
our liability under deferred compensation plans was
EUR 46.8 million
(
2017
:
EUR 43.6 million
)
.
Pension plans
We maintain various pension plans covering substantially all of our employees. There are
10,027
eligible employees in the Netherlands. These employees participate in a multi-employer union plan (PME) determined in accordance with the collective bargaining agreements effective for the industry in which we operate. This collective bargaining agreement has no expiration date. This multi-employer union plan, accounted for as a defined-contribution plan, covers approximately
1,400
companies and approximately
154,000
contributing members. Our contribution to the multi-employer union plan was
9.6 percent
of the total contribution to the plan as per the
Annual Report
for the year ended December 31,
2017
.
The plan monitors its risks on a global basis, not by participating company or employee, and is subject to regulation by Dutch governmental authorities. By law (the Dutch Pension Act), a multi-employer union plan must be monitored against specific criteria, including the coverage ratio of the plan’s assets to its obligations. As of January 1, 2015 new pension legislation has been enacted. This legislation results in among others, an increase of legally required coverage levels. The coverage percentage is calculated by dividing the funds capital by the total sum of pension liabilities and is based on actual market interest rates. The coverage ratio as per December 31,
2018
of
101.3 percent
(
December 31,
2017
:
100.1 percent
)
is calculated giving consideration to the new pension legislation and is below the legally required level. However, we have no obligation to pay off any deficits the pension fund may incur, nor do we have any claim to any potential surpluses.
Every company participating in the PME contributes a premium calculated as a percentage of its total pensionable salaries, with each company subject to the same contribution rate. Although the premium can fluctuate yearly based on the coverage ratio of the multi-employer union plan, for the
5
-year period 2015-2019 the contribution percentage has been fixed at
23.6 percent
(2014
:
24.1 percent
)
.
The pension rights of each employee are based upon the employee’s average salary during employment.
Our net periodic pension cost for this multi-employer union plan for any period is the amount of the required employer contribution for that period.
We also participate in several other defined contribution pension plans (outside the Netherlands), with our expenses for these plans equaling the employer contributions made in the relevant period.
Our pension and retirement expenses for all employees for the years ended December 31
,
2018
,
2017
and
2016
were:
|
Year ended December 31
|
2016
|
|
2017
|
|
2018
|
|
|
(in millions)
|
EUR
|
|
EUR
|
|
EUR
|
|
|
Pension plan based on multi-employer union plan
|
54.9
|
|
62.4
|
|
74.0
|
|
|
Pension plans based on defined contribution
|
30.8
|
|
38.4
|
|
48.0
|
|
|
Pension and retirement expenses
|
85.7
|
|
100.8
|
|
122.0
|
|
20
. Legal contingencies
ASML is party to various legal proceedings generally incidental to our business. ASML also faces exposures from other actual or potential claims and legal proceedings. In addition, ASML’s customers may be subject to claims of infringement from third parties alleging that the ASML equipment used by those customers in the manufacture of semiconductor products, and / or the methods relating to use of the ASML equipment, infringes one or more patents issued to those third parties. If these claims were successful, ASML could be required to indemnify such customers for some or all of the losses incurred or damages assessed against them as a result of that infringement.
We accrue for legal costs related to litigation and legal proceedings in our
Consolidated Statements of Operations
at the time when the related legal services are actually provided to us.
In
2018
,
EUR 131.0 million
losses were recorded as a charge to our
Consolidated Statements of Operations
(
2017
:
EUR 0.0 million
and
2016
:
EUR 8.4 million
).
ASML INTEGRATED REPORT 2018
140
In April 2017, Nikon sued ASML in both the Netherlands and Japan, alleging that the manufacture, sale, and / or use by ASML of certain equipment infringes asserted Nikon patents, and requesting both damages and injunctive relief prohibiting the sale or manufacture of such equipment. Nikon also sued in Germany, Carl Zeiss SMT GmbH, a supplier to ASML of components that ASML sells with or as part of certain lithography equipment. Nikon alleged that the manufacture, sale, and / or use of certain of these Carl Zeiss SMT GmbH components infringe asserted Nikon patents, and also sought damages and an injunction prohibiting Carl Zeiss SMT GmbH from manufacturing or exporting certain components. Certain of these proceedings resulted in court judgments during 2018 in the Netherlands, Germany and the United States, and in most instances, the judgments were favorable to ASML.
In response to Nikon’s actions, ASML, in some cases jointly with Carl Zeiss SMT GmbH and / or its affiliates, filed several lawsuits against Nikon both in Japan and in a number of venues in the US and other jurisdictions, alleging patent infringement of certain patents owned by ASML and / or Carl Zeiss SMT GmbH and / or its affiliates.
On January 23, 2019, ASML entered into a binding MOU with Nikon and Carl Zeiss SMT relating to a comprehensive settlement of all pending disputes between Nikon, ASML and Zeiss.
The terms of the MOU include a payment to Nikon by ASML and Zeiss of a total of
EUR 150.0 million
, and the cross-license agreement to be executed among the parties as contemplated by the MOU includes royalty payments of 0.8% by ASML to Nikon, and by Nikon to ASML, over the sales of their respective immersion lithography systems for 10 years from date of the definitive agreements giving effect to the MOU. We accrued an amount of
EUR 131.0 million
representing ASML’s part of the
EUR 150.0 million
, see
Note 15 Accrued and other liabilities
.
21
. Income taxes
The components of
the provision for income taxes
are as follows:
|
Year ended December 31
|
2016
1
|
|
2017
1
|
|
2018
|
|
|
(in millions)
|
EUR
|
|
EUR
|
|
EUR
|
|
|
Netherlands
|
1,277.0
|
|
2,076.6
|
|
2,602.0
|
|
|
Foreign
|
515.2
|
|
312.8
|
|
335.0
|
|
|
Income before taxes
|
1,792.2
|
|
2,389.4
|
|
2,937.0
|
|
|
Provision for income taxes current
|
(66.5
|
)
|
(343.0
|
)
|
(383.1
|
)
|
|
Provision for income taxes deferred
|
(85.4
|
)
|
55.6
|
|
(40.7
|
)
|
|
Provision for income taxes Netherlands
|
(151.9
|
)
|
(287.4
|
)
|
(423.8
|
)
|
|
Provision for income taxes current
|
(91.4
|
)
|
(24.1
|
)
|
(203.4
|
)
|
|
Provision for income taxes deferred
|
9.0
|
|
5.4
|
|
275.6
|
|
|
Provision for income taxes Foreign
|
(82.4
|
)
|
(18.7
|
)
|
72.2
|
|
|
Total provision for income taxes current
|
(158.0
|
)
|
(367.0
|
)
|
(586.5
|
)
|
|
Total provision for income taxes deferred
|
(76.4
|
)
|
61.0
|
|
234.9
|
|
|
Provision for income taxes
|
(234.4
|
)
|
(306.0
|
)
|
(351.6
|
)
|
|
1.
|
As of January 1, 2018, ASML has adopted the new Revenue Recognition Standard (ASC 606) and Lease Standard (ASC 842). The comparative numbers have been adjusted to reflect these changes in accounting policies, see Note 1 General information / summary of significant accounting policies.
|
The Dutch statutory tax rate was
25.0 percent
in
2018
,
2017
and
2016
.
Tax amounts in other jurisdictions are calculated at the rates prevailing in the relevant jurisdictions.
ASML INTEGRATED REPORT 2018
141
The reconciliation of
the provision for income taxes
is as follows:
|
Year ended December 31
|
2016
1
|
|
2017
1
|
|
2018
|
|
||||||
|
(in millions)
|
EUR
|
|
%
2
|
|
EUR
|
|
%
2
|
|
EUR
|
|
%
2
|
|
|
Income before income taxes
|
1,792.2
|
|
100.0
|
%
|
2,389.4
|
|
100.0
|
%
|
2,937.0
|
|
100.0
|
%
|
|
Income tax provision based on ASML’s domestic rate
|
(448.1
|
)
|
25.0
|
%
|
(597.4
|
)
|
25.0
|
%
|
(734.3
|
)
|
25.0
|
%
|
|
Effects of tax rates in foreign jurisdictions
|
(2.7
|
)
|
0.2
|
%
|
21.0
|
|
(0.9
|
)%
|
15.4
|
|
(0.5
|
)%
|
|
Adjustments in respect of tax exempt income
|
31.3
|
|
(1.7
|
)%
|
24.0
|
|
(1.0
|
)%
|
6.2
|
|
(0.2
|
)%
|
|
Adjustments in respect of tax incentives
|
188.6
|
|
(10.5
|
)%
|
263.1
|
|
(11.0
|
)%
|
311.8
|
|
(10.6
|
)%
|
|
Adjustments in respect of prior years’ current taxes
|
(4.7
|
)
|
0.3
|
%
|
(38.3
|
)
|
1.6
|
%
|
(1.2
|
)
|
—
|
%
|
|
Adjustments in respect of prior years’ deferred taxes
|
(6.6
|
)
|
0.4
|
%
|
40.9
|
|
(1.7
|
)%
|
3.3
|
|
(0.1
|
)%
|
|
Movements in the liability for unrecognized tax benefits
|
4.0
|
|
(0.2
|
)%
|
(17.4
|
)
|
0.7
|
%
|
(57.2
|
)
|
1.9
|
%
|
|
Tax effects in respect of acquisition related items
|
8.8
|
|
(0.5
|
)%
|
—
|
|
—
|
%
|
115.3
|
|
(3.9
|
)%
|
|
Other credits and non tax deductible items
|
(5.0
|
)
|
0.3
|
%
|
(1.9
|
)
|
0.1
|
%
|
(10.9
|
)
|
0.4
|
%
|
|
Provision for income taxes
|
(234.4
|
)
|
13.1
|
%
|
(306.0
|
)
|
12.8
|
%
|
(351.6
|
)
|
12.0
|
%
|
|
1.
|
As of January 1, 2018, ASML has adopted the new Revenue Recognition Standard (ASC 606) and Lease Standard (ASC 842). The comparative numbers have been adjusted to reflect these changes in accounting policies, see Note 1 General information / summary of significant accounting policies.
|
|
2.
|
As a percentage of income before income taxes.
|
Income tax provision
based on ASML’s domestic rate
The provision for income taxes
based on ASML’s domestic rate is based on the Dutch statutory income tax rate. It reflects the
provision for income taxes
that would have been applicable assuming that all of our income is taxable against the Dutch statutory tax rate and there were no permanent differences between taxable base and financial results and no Dutch tax incentives were applied.
Effects of tax rates in foreign jurisdictions
A portion of our results is realized in countries other than the Netherlands where different tax rates are applicable. The lower effect in 2018 compared to 2017 is due to the relative decrease of income reported at the level of ASML Hong Kong which has a lower statutory tax rate than The Netherlands.
Adjustments in respect of tax exempt income
In certain jurisdictions part of the income generated is tax exempted. The lower effect in 2018 is caused by the decreasing level of income reported at the level of ASML Hong Kong.
Adjustments in respect of tax incentives
Adjustments in respect of tax incentives mainly relates to a reduced tax rate as a result of application of the Dutch Innovation Box. The Innovation box is a facility under Dutch corporate tax law pursuant to which qualified income associated with R&D is subject to an effective tax rate of
7 percent
. Increase in the Innovation Box benefit for 2018 as compared to 2017 is caused by the increase in the overall profit before tax in 2018 as of which approximately
90%
is effectively taxed in The Netherlands. The innovation box benefit is determined according to Dutch laws and published tax policy, the application of which has been confirmed in an agreement among ASML and the Dutch tax authorities, which agreement applies for the years 2017 through 2023 assuming facts and circumstances do not change.
In 2016 the tax incentives also included the Dutch RDA (‘Research & Development’) deduction, which has been converted into a deduction for wage tax purposes as of January 1, 2017.
Adjustments in respect of prior years’ current taxes
The movements
in the adjustments in respect of prior years
’
current taxes
are
considered to be limited. The adjustments mainly relate to differences occurred between the estimated income taxes and final corporate income tax returns.
Adjustments in respect of prior years’ deferred taxes
The movements in the adjustments in respect of prior years’ deferred taxes
are considered to be limited. The adjustments mainly relate to differences between the initially estimated income taxes and final corporate income tax returns.
In 2017 we agreed with the Dutch tax authorities to amortize certain IP over their useful life time rather than in the year of acquisition. This explains the largest part of the amount displayed for 2017 and is mirrored in the adjustment in respect of 2017 priors years
’
current taxes.
Movements in the liability for unrecognized tax benefits
In 2018, similar to
prior years
2017
and 2016,
the effective tax rate was impacted by movements in the liability for
unrecognized tax benefits.
ASML INTEGRATED REPORT 2018
142
Tax effects in respect of acquisition related items
The 2018 tax effects of acquisition related items are driven by an internal restructuring as a result of which the deferred tax liabilities on intangible assets that were initially included in the business combination accounting for HMI have been released during 2018.
Other credits and non-tax deductible items
Other credits and non-tax deductible items reflect the impact on our statutory rates of permanent non-tax deductible items such as non-deductible interest expense, and non-deductible meals and entertainment expenses, as well as the impact of various tax credits on our
provision for income taxes.
US Tax Reform
The 2017 and 2018 year-end tax positions calculated also reflect US Tax Reform, thereby taking into account the guidance on US Tax Reform. In regard to GILTI and BEAT, a tax policy election has been made to treat this as a period permanent item. Impact of US Tax Reform items are included in the 'other credits and non-tax deductible items' line item and are not significant from an overall group perspective.
Income taxes recognized directly in
shareholders’
equity
Income taxes recognized directly in
shareholders’
equity (including OCI) are as follows:
|
Income tax recognized in shareholders’ equity
|
2016
|
|
2017
|
|
2018
|
|
|
(in millions)
|
EUR
|
|
EUR
|
|
EUR
|
|
|
Current tax
|
||||||
|
OCI (financial instruments)
|
1.2
|
|
(2.3
|
)
|
(1.4
|
)
|
|
Tax benefit from share-based payments
1
|
(0.9
|
)
|
—
|
|
—
|
|
|
Deferred tax
|
||||||
|
OCI (equity method investments)
|
—
|
|
—
|
|
(0.9
|
)
|
|
Total income tax recognized in shareholders’ equity
|
0.3
|
|
(2.3
|
)
|
(2.3
|
)
|
|
1.
|
ASU No. 2016-09 is effective as per January 1, 2017. This requires all of the tax effects related to share based payments to be recorded through the Consolidated Statements of Operations. The comparative numbers have not been adjusted to reflect this change.
|
Liability for unrecognized tax benefits and deferred taxes
The liability for unrecognized tax benefits and total deferred tax position recorded on the
Consolidated Balance Sheets
is as follows:
|
As of December 31
|
2017
1
|
|
2018
|
|
|
(in millions)
|
EUR
|
|
EUR
|
|
|
Liability for unrecognized tax benefits
|
(148.8
|
)
|
(208.7
|
)
|
|
Deferred tax position
|
(160.6
|
)
|
193.8
|
|
|
Deferred and other tax assets (liabilities)
|
(309.4
|
)
|
(14.9
|
)
|
|
1.
|
As of January 1, 2018, ASML has adopted the new Revenue Recognition Standard (ASC 606) and Lease Standard (ASC 842). The comparative numbers have been adjusted to reflect these changes in accounting policies, see Note 1 General information / summary of significant accounting policies.
|
Liability for unrecognized tax benefits
We have operations in multiple jurisdictions, where we are subject to the application of complex tax laws. Application of these complex tax laws may lead to uncertainties on tax positions. We aim to resolve these uncertainties in discussions with the tax authorities. We reserve for uncertain tax positions
in line with the requirements of
ASC 740
, which requires us to estimate the potential outcome of any uncertain tax position when disputed by the tax authorities. Our estimate for the potential outcome of any uncertain tax position is highly judgmental. We conclude that we have adequately provided for uncertain tax positions. However, settlement of these uncertain tax positions in a manner inconsistent with our expectations could have a material impact on our
Consolidated Financial Statements
.
Consistent with the requirements of
ASC 740
, as of December 31,
2018
, the liability for
unrecognized tax benefits
amounts to
EUR 208.7 million
(
2017
:
EUR 148.8 million
) which is classified as Deferred and other tax liabilities. If recognized, these tax benefits would affect our effective tax rate for approximately the equal amounts.
Expected interest and penalties related to income tax liabilities have been accrued for and are included in the liability for
unrecognized tax benefits
and in the provision for income taxes. The balance of accrued interest and penalties recorded in the
Consolidated Balance Sheets
as of December 31,
2018
amounted to
EUR 68.5 million
(
2017
:
EUR 34.9 million
). Accrued interest and penalties recorded in the
Consolidated Statements of Operations
of
2018
amounted to a tax charge of
EUR 32.6 million
(
2017
:
EUR 4.2 million
;
2016
:
EUR 5.8 million
).
ASML INTEGRATED REPORT 2018
143
A reconciliation of the beginning and ending balance of the liability
for unrecognized tax benefits is as follows:
|
As of December 31
|
2017
|
|
2018
|
|
|
(in millions)
|
EUR
|
|
EUR
|
|
|
Balance, January 1
|
(105.5
|
)
|
(113.9
|
)
|
|
Gross increases – tax positions in prior period
|
(1.3
|
)
|
(27.4
|
)
|
|
Gross decreases – tax positions in prior period
|
3.4
|
|
10.3
|
|
|
Gross increases – tax positions in current period
|
(19.8
|
)
|
(21.9
|
)
|
|
Acquisitions through business combinations
|
—
|
|
—
|
|
|
Settlements
|
2.1
|
|
—
|
|
|
Lapse of statute of limitations
|
2.4
|
|
13.9
|
|
|
Effect of changes in exchange rates
|
4.8
|
|
(1.4
|
)
|
|
Total liability for unrecognized tax benefits
|
(113.9
|
)
|
(140.4
|
)
|
We conclude our allowances for tax contingencies to be appropriate. Based on the information currently available, we estimate that the liability for
unrecognized tax benefits
will decrease by
EUR 38.0 million
within the next
12 months
, mainly as a result of expiration of statute of limitations.
We file income tax returns with the Dutch tax authority, the U.S. federal government, various U.S. states, and various foreign jurisdictions throughout the world. The Dutch tax return is open to examination for the years 2013 to 2018. In addition our U.S. federal and state tax returns remain open to examination for the years 2014 through 2018. Additionally, in relation to the tax credits in the US, the years 2008 through 2013 are open to examination. We believe that adequate amounts of taxes and related interest and penalties have been provided for, and any adjustments as a result of examinations are not expected to have a material adverse effect on our business, results of operations, or financial condition.
ASML INTEGRATED REPORT 2018
144
Deferred taxes
The composition of total deferred tax assets and liabilities reconciled to the classification in the
Consolidated Balance Sheets
is as follows:
|
Deferred taxes
|
January 1, 2018
|
|
Effects of changes in accounting principles
|
|
Consolidated
Statements of
Operations
|
|
Effect of
changes
in exchange
rates
|
|
Income tax recognized in shareholders’ equity
|
|
December 31, 2018
|
|
|
(in millions)
|
EUR
1
|
|
EUR
|
|
EUR
|
|
EUR
|
|
EUR
|
|
||
|
Deferred tax assets:
|
||||||||||||
|
Capitalized R&D expenditures
|
3.2
|
|
—
|
|
(1.6
|
)
|
0.1
|
|
—
|
|
1.7
|
|
|
R&D credits
|
44.1
|
|
—
|
|
25.2
|
|
1.2
|
|
—
|
|
70.5
|
|
|
Inventories
|
46.5
|
|
—
|
|
4.6
|
|
1.8
|
|
—
|
|
52.9
|
|
|
Deferred revenue
|
21.0
|
|
—
|
|
128.7
|
|
0.6
|
|
—
|
|
150.3
|
|
|
Accrued and other liabilities
|
42.7
|
|
—
|
|
(4.4
|
)
|
2.2
|
|
—
|
|
40.5
|
|
|
Installation and warranty reserve
|
11.1
|
|
—
|
|
1.6
|
|
0.6
|
|
—
|
|
13.3
|
|
|
Tax effect carry-forward losses
|
5.7
|
|
—
|
|
2.8
|
|
—
|
|
—
|
|
8.5
|
|
|
Property, plant and equipment
|
9.2
|
|
8.2
|
|
1.8
|
|
0.2
|
|
—
|
|
19.4
|
|
|
Intangible fixed assets
|
—
|
|
51.7
|
|
(3.0
|
)
|
—
|
|
—
|
|
48.7
|
|
|
Restructuring and impairment
|
—
|
|
—
|
|
—
|
|
—
|
|
—
|
|
—
|
|
|
Alternative minimum tax credits
|
4.5
|
|
—
|
|
(4.5
|
)
|
—
|
|
—
|
|
—
|
|
|
Share-based payments
|
7.7
|
|
—
|
|
(0.3
|
)
|
0.3
|
|
—
|
|
7.7
|
|
|
Other temporary differences
|
20.1
|
|
2.6
|
|
(2.3
|
)
|
0.4
|
|
0.9
|
|
21.7
|
|
|
Total deferred tax assets, gross
|
215.8
|
|
62.5
|
|
148.6
|
|
7.4
|
|
0.9
|
|
435.2
|
|
|
Valuation allowance
2
|
(49.5
|
)
|
—
|
|
(28.5
|
)
|
(1.2
|
)
|
—
|
|
(79.2
|
)
|
|
Total deferred tax assets, net
|
166.3
|
|
62.5
|
|
120.1
|
|
6.2
|
|
0.9
|
|
356.0
|
|
|
Deferred tax liabilities:
|
||||||||||||
|
Intangible fixed assets
|
(265.1
|
)
|
—
|
|
149.7
|
|
(4.4
|
)
|
—
|
|
(119.8
|
)
|
|
Property, plant and equipment
|
(37.9
|
)
|
—
|
|
13.3
|
|
(1.1
|
)
|
—
|
|
(25.7
|
)
|
|
Deferred revenue
|
(13.2
|
)
|
—
|
|
13.1
|
|
—
|
|
—
|
|
(0.1
|
)
|
|
Borrowing costs
|
(1.7
|
)
|
—
|
|
0.2
|
|
—
|
|
—
|
|
(1.5
|
)
|
|
Other temporary differences
|
(9.0
|
)
|
—
|
|
(4.5
|
)
|
(1.6
|
)
|
—
|
|
(15.1
|
)
|
|
Total deferred tax liabilities
|
(326.9
|
)
|
—
|
|
171.8
|
|
(7.1
|
)
|
—
|
|
(162.2
|
)
|
|
|
|
|||||||||||
|
Net deferred tax assets (liabilities)
|
(160.6
|
)
|
62.5
|
|
291.9
|
|
(0.9
|
)
|
0.9
|
|
193.8
|
|
|
Classified as:
|
||||||||||||
|
Deferred tax assets – non-current
|
31.7
|
|
236.3
|
|
||||||||
|
Deferred tax liabilities – non-current
|
(192.3
|
)
|
(42.5
|
)
|
||||||||
|
Net deferred tax assets (liabilities)
|
(160.6
|
)
|
193.8
|
|
||||||||
|
1.
|
As of January 1, 2018, ASML has adopted the new Revenue Recognition Standard (ASC 606) and Lease Standard (ASC 842). The comparative numbers have been adjusted to reflect these changes in accounting policies, see Note 1 General information / summary of significant accounting policies.
|
|
2.
|
The valuation allowance disclosed above relates to
R&D credits and Tax effect carry-forward losses that may not be realized.
|
ASML INTEGRATED REPORT 2018
145
|
Deferred taxes
|
January 1, 2017
|
|
Consolidated
Statements of
Operations
|
|
Effect of
changes
in exchange
rates
|
|
December 31, 2017
|
|
|
(in millions)
|
EUR
1
|
|
EUR
1
|
|
EUR
|
|
EUR
1
|
|
|
Deferred tax assets:
|
||||||||
|
Capitalized R&D expenditures
|
9.5
|
|
(5.1
|
)
|
(1.2
|
)
|
3.2
|
|
|
R&D credits
|
35.8
|
|
12.6
|
|
(4.3
|
)
|
44.1
|
|
|
Inventories
|
80.6
|
|
(24.0
|
)
|
(10.1
|
)
|
46.5
|
|
|
Deferred revenue
|
47.4
|
|
(20.6
|
)
|
(5.8
|
)
|
21.0
|
|
|
Accrued and other liabilities
|
59.3
|
|
(9.5
|
)
|
(7.1
|
)
|
42.7
|
|
|
Installation and warranty reserve
|
15.7
|
|
(2.7
|
)
|
(1.9
|
)
|
11.1
|
|
|
Tax effect carry-forward losses
|
8.5
|
|
(3.1
|
)
|
0.3
|
|
5.7
|
|
|
Property, plant and equipment
|
11.0
|
|
(1.3
|
)
|
(0.5
|
)
|
9.2
|
|
|
Intangible fixed assets
|
—
|
|
—
|
|
—
|
|
—
|
|
|
Restructuring and impairment
|
0.7
|
|
(0.6
|
)
|
(0.1
|
)
|
—
|
|
|
Alternative minimum tax credits
|
5.1
|
|
—
|
|
(0.6
|
)
|
4.5
|
|
|
Share-based payments
|
13.9
|
|
(4.5
|
)
|
(1.7
|
)
|
7.7
|
|
|
Other temporary differences
|
26.0
|
|
(8.9
|
)
|
3.0
|
|
20.1
|
|
|
Total deferred tax assets, gross
|
313.5
|
|
(67.7
|
)
|
(30.0
|
)
|
215.8
|
|
|
Valuation allowance
2
|
(42.4
|
)
|
(11.9
|
)
|
4.8
|
|
(49.5
|
)
|
|
Total deferred tax assets, net
|
271.1
|
|
(79.6
|
)
|
(25.2
|
)
|
166.3
|
|
|
Deferred tax liabilities:
|
||||||||
|
Intangible fixed assets
|
(432.4
|
)
|
140.9
|
|
26.4
|
|
(265.1
|
)
|
|
Property, plant and equipment
|
(44.7
|
)
|
1.4
|
|
5.4
|
|
(37.9
|
)
|
|
Deferred revenue
|
(17.9
|
)
|
4.7
|
|
—
|
|
(13.2
|
)
|
|
Borrowing costs
|
(1.8
|
)
|
0.1
|
|
—
|
|
(1.7
|
)
|
|
Other temporary differences
|
(17.7
|
)
|
11.0
|
|
(2.3
|
)
|
(9.0
|
)
|
|
Total deferred tax liabilities
|
(514.5
|
)
|
158.1
|
|
29.5
|
|
(326.9
|
)
|
|
Net deferred tax assets (liabilities)
|
(243.4
|
)
|
78.5
|
|
4.3
|
|
(160.6
|
)
|
|
Classified as:
|
||||||||
|
Deferred tax assets – current
|
—
|
|
|
|
—
|
|
||
|
Deferred tax assets – non-current
|
34.9
|
|
|
|
31.7
|
|
||
|
Deferred tax liabilities – non-current
|
(278.3
|
)
|
|
|
(192.3
|
)
|
||
|
Net deferred tax assets (liabilities)
|
(243.4
|
)
|
|
|
(160.6
|
)
|
||
|
1.
|
As of January 1, 2018, ASML has adopted the new Revenue Recognition Standard (ASC 606) and Lease Standard (ASC 842). The comparative numbers have been adjusted to reflect these changes in accounting policies, see Note 1 General information / summary of significant accounting policies.
|
|
2.
|
The valuation allowance disclosed above relates to
R&D credits and Tax effect carry-forward losses that may not be realized.
|
Tax effect carry-forward losses
and R&D credits
The deferred tax assets from carry-forward losses and R&D credits recognized as per December 31,
2018
are almost fully reserved for. R&D credits for the amount of
EUR 51.1 million
have no expiration date. The remaining R&D credits of
EUR 19.4 million
have an expiration date between
2019
and
2033
. Carry-forward losses for the amount of
EUR 3.2 million
do not have an expiration date. The remaining carry-forward losses (
EUR 5.3 million
) have an expiration date between
2023
and
2028
.
22
. Segment disclosure
ASML has
one
reportable segment, for the development, production, marketing, sales, upgrading and servicing of advanced semiconductor equipment systems, consisting of lithography, metrology and inspection systems. Its operating results are regularly reviewed by the CODM (Chief Operating Decision Maker) in order to make decisions about resource allocation and assess performance.
Management reporting includes net system sales figures of new and used systems, sales per technology and sales per end-use. For the sales per technology and end-use refer to
Note 23 Revenue from contracts with customers
.
ASML INTEGRATED REPORT 2018
146
Net system sales for new and used systems were as follows:
|
Year ended December 31
|
2016
1,2
|
|
2017
1
|
|
2018
|
|
|
(in millions)
|
EUR
|
|
EUR
|
|
EUR
|
|
|
New systems
|
4,644.0
|
|
6,332.9
|
|
8,115.6
|
|
|
Used systems
|
74.9
|
|
91.5
|
|
143.5
|
|
|
Net system sales
|
4,718.9
|
|
6,424.4
|
|
8,259.1
|
|
|
1.
|
As of January 1, 2018, ASML has adopted the new Revenue Recognition Standard (ASC 606) and Lease Standard (ASC 842). The comparative numbers have been adjusted to reflect these changes in accounting policies, see Note 1 General information / summary of significant accounting policies.
|
|
2.
|
As of January 1, 2017, ASML presents net sales with respect to metrology and inspection systems as part of net system sales instead of net service and field option sales.
The 2016 numbers have been adjusted to reflect this change in accounting policy.
|
The
increase
in net system sales of
EUR 1,834.7 million
, or
28.6 percent
, to
EUR 8,259.1 million
in
2018
from
EUR 6,424.4 million
in
2017
(
2016
:
EUR 4,718.9 million
) is mainly due to the increase in the number of systems sold as well as the relative increase in system sales towards more high-end systems.
For geographical reporting, total net sales are attributed to the geographic location in which the customers’ facilities are located.
Long-lived assets
are attributed to the geographic location in which these assets are located
.
Total net sales and long-lived assets (consisting of property, plant and equipment) by geographic region were as follows:
|
Year ended December 31
|
Total net sales
|
|
Long-lived assets
|
|
|
(in millions)
|
EUR
|
|
EUR
|
|
|
2018
|
||||
|
Japan
|
567.6
|
|
8.2
|
|
|
Korea
|
3,725.1
|
|
24.6
|
|
|
Singapore
|
222.5
|
|
1.1
|
|
|
Taiwan
|
1,989.5
|
|
96.5
|
|
|
China
|
1,842.8
|
|
16.2
|
|
|
Rest of Asia
|
1.9
|
|
0.4
|
|
|
Netherlands
|
1.2
|
|
1,113.8
|
|
|
EMEA
|
631.7
|
|
5.1
|
|
|
United States
|
1,961.7
|
|
323.6
|
|
|
Total
|
10,944.0
|
|
1,589.5
|
|
|
2017
1
|
||||
|
Japan
|
404.3
|
|
3.4
|
|
|
Korea
|
3,031.4
|
|
23.2
|
|
|
Singapore
|
163.7
|
|
0.8
|
|
|
Taiwan
|
2,096.7
|
|
88.1
|
|
|
China
|
919.5
|
|
4.1
|
|
|
Rest of Asia
|
3.5
|
|
3.0
|
|
|
Netherlands
|
4.0
|
|
1,186.0
|
|
|
EMEA
|
921.5
|
|
5.0
|
|
|
United States
|
1,418.1
|
|
287.2
|
|
|
Total
|
8,962.7
|
|
1,600.8
|
|
|
2016
1
|
||||
|
Japan
|
415.1
|
|
4.3
|
|
|
Korea
|
1,594.3
|
|
17.3
|
|
|
Singapore
|
245.6
|
|
0.8
|
|
|
Taiwan
|
2,140.3
|
|
125.4
|
|
|
China
|
758.2
|
|
3.2
|
|
|
Rest of Asia
|
26.7
|
|
2.8
|
|
|
Netherlands
|
1.1
|
|
1,201.4
|
|
|
EMEA
|
606.3
|
|
4.1
|
|
|
United States
|
1,087.5
|
|
327.9
|
|
|
Total
|
6,875.1
|
|
1,687.2
|
|
|
1.
|
As of January 1, 2018, ASML has adopted the new Revenue Recognition Standard (ASC 606) and Lease Standard (ASC 842). The comparative numbers have been adjusted to reflect these changes in accounting policies, see Note 1 General information / summary of significant accounting policies.
|
ASML INTEGRATED REPORT 2018
147
In
2018
,
total net sales to the largest customer accounted for
EUR 2,476.8 million
, or
22.6 percent
,
of total net sales
(
2017
:
EUR 2,454.4 million
, or
27.4 percent
,
of total net sales
;
2016
:
EUR 1,633.9 million
, or
23.8 percent
,
of total net sales
).
Our three largest customers (based on total net sales) accounted for
EUR 1,491.3 million
, or
58.8 percent
,
of accounts receivable and finance receivables at December 31,
2018
, compared with
EUR 1,356.7 million
, or
65.7 percent
, at December 31,
2017
.
Substantially all of our sales were export sales in
2018
,
2017
and
2016
.
23
. Revenue from contracts with customers
Disaggregation of revenue
Our revenue from contracts with customers, on a disaggregated basis, aligns with our reportable segment disclosures with the addition of disaggregation of net system sales per technology and per end-use.
Net system sales per technology were as follows:
|
Year ended December 31
|
Net system sales
in units |
|
Net system sales
in EUR millions |
|
|
2018
|
||||
|
EUV
|
18
|
|
1,880.1
|
|
|
ArFi
|
86
|
|
4,806.9
|
|
|
ArF dry
|
16
|
|
274.3
|
|
|
KrF
|
78
|
|
860.1
|
|
|
I-line
|
26
|
|
98.6
|
|
|
Metrology & Inspection
|
114
|
|
339.1
|
|
|
Total
|
338
|
|
8,259.1
|
|
|
|
||||
|
2017
1
|
||||
|
EUV
|
11
|
|
1,084.2
|
|
|
ArFi
|
76
|
|
4,028.7
|
|
|
ArF dry
|
13
|
|
186.4
|
|
|
KrF
|
71
|
|
743.5
|
|
|
I-line
|
26
|
|
99.7
|
|
|
Metrology & Inspection
|
95
|
|
281.9
|
|
|
Total
|
292
|
|
6,424.4
|
|
|
|
||||
|
2016
1,2
|
||||
|
EUV
|
4
|
|
331.2
|
|
|
ArFi
|
68
|
|
3,539.6
|
|
|
ArF dry
|
7
|
|
113.4
|
|
|
KrF
|
55
|
|
552.5
|
|
|
I-line
|
20
|
|
71.2
|
|
|
Metrology & Inspection
|
55
|
|
111.0
|
|
|
Total
|
209
|
|
4,718.9
|
|
|
1.
|
As of January 1, 2018, ASML has adopted the new Revenue Recognition Standard (ASC 606) and Lease Standard (ASC 842). The comparative numbers have been adjusted to reflect these changes in accounting policies, see Note 1 General information / summary of significant accounting policies.
|
|
2.
|
As of January 1, 2017, ASML presents net sales with respect to metrology and inspection systems as part of net system sales instead of net service and field option sales.
The 2016 numbers have been adjusted to reflect this change in accounting policy.
|
ASML INTEGRATED REPORT 2018
148
Net system sales per end-use were as follows:
|
Year ended December 31
|
Net system sales
in units |
|
Net system sales
in EUR millions |
|
|
|
|
|
|
|
|
2018
|
|
|
|
|
|
Logic
|
125
|
|
3,713.7
|
|
|
Memory
|
213
|
|
4,545.4
|
|
|
Total
|
338
|
|
8,259.1
|
|
|
|
|
|
|
|
|
2017
1
|
|
|
|
|
|
Logic
|
145
|
|
3,456.7
|
|
|
Memory
|
147
|
|
2,967.7
|
|
|
Total
|
292
|
|
6,424.4
|
|
|
|
|
|
|
|
|
2016
1,2
|
|
|
|
|
|
Logic
|
141
|
|
3,212.4
|
|
|
Memory
|
68
|
|
1,506.5
|
|
|
Total
|
209
|
|
4,718.9
|
|
|
1.
|
As of January 1, 2018, ASML has adopted the new Revenue Recognition Standard (ASC 606) and Lease Standard (ASC 842). The comparative numbers have been adjusted to reflect these changes in accounting policies, see Note 1 General information / summary of significant accounting policies.
|
|
2.
|
As of January 1, 2017, ASML presents net sales with respect to metrology and inspection systems as part of net system sales instead of net service and field option sales.
The 2016 numbers have been adjusted to reflect this change in accounting policy.
|
Contract assets and liabilities
The following table provides information about the current and non-current positions of receivables, contracts assets, and contract liabilities from contracts with our customers.
|
Year ended December 31
|
2017
1
|
|
2018
|
|
|
(in millions)
|
EUR
|
|
EUR
|
|
|
Accounts receivable
|
1,850.4
|
|
1,655.6
|
|
|
Finance receivables
|
218.5
|
|
886.2
|
|
|
Contract Assets
|
270.4
|
|
95.9
|
|
|
Contract liabilities
|
(2,152.0
|
)
|
(2,953.2
|
)
|
|
Total
|
187.3
|
|
(315.5
|
)
|
|
1.
|
As of January 1, 2018, ASML has adopted the new Revenue Recognition Standard (ASC 606) and Lease Standard (ASC 842). The comparative numbers have been adjusted to reflect these changes in accounting policies, see Note 1 General information / summary of significant accounting policies.
|
The contract assets primarily relate to our rights to a consideration for goods or services delivered but not invoiced at the reporting date. The contract assets are transferred to the receivables when invoiced. The contract liabilities primarily relate to down payments received for systems to be delivered, as well as deferred revenue from system shipments, based on the allocation of the consideration to the related performance obligations in the contract. This deferred consideration mainly consists of extended and enhanced warranties, installation and free goods or services provided as part of a volume purchase agreement.
The majority of our customer contracts contain both asset and liability positions. At the end of each reporting period, these positions are netted on a contract basis and presented as either an asset or a liability in the Consolidated Balance Sheets. Consequently, a contract balance can change between periods from a net contract asset balance to a net contract liability balance in the balance sheet.
ASML INTEGRATED REPORT 2018
149
Significant changes in the contract assets and the contract liabilities balances during the period are as follows.
|
Year ended December 31
|
2017
1
|
2018
|
||||||
|
(in millions)
|
EUR
|
EUR
|
||||||
|
Contract Assets
|
|
Contract Liabilities
|
|
Contract Assets
|
|
Contract Liabilities
|
|
|
|
Balance at beginning of the year
|
148.3
|
|
1,833.8
|
|
270.4
|
|
2,152.0
|
|
|
Transferred to receivables from contract assets from the beginning of the period
|
(91.6
|
)
|
—
|
|
(456.2
|
)
|
—
|
|
|
Revenues recognized during the year, to be invoiced
|
456.7
|
|
—
|
|
192.3
|
|
—
|
|
|
Revenue recognition that was included in the contract liability balance at the beginning of the period
|
—
|
|
(1,197.9
|
)
|
—
|
|
(1,306.3
|
)
|
|
Changes as a result of cumulative catch-up adjustments arising form changes in estimates
|
—
|
|
—
|
|
—
|
|
(64.4
|
)
|
|
Remaining performance obligations for which considerations have been received
|
—
|
|
1,759.1
|
|
—
|
|
2,082.5
|
|
|
Transfer between contract assets and liabilities
|
(243.0
|
)
|
(243.0
|
)
|
89.4
|
|
89.4
|
|
|
Total
|
270.4
|
|
2,152.0
|
|
95.9
|
|
2,953.2
|
|
|
1.
|
As of January 1, 2018, ASML has adopted the new Revenue Recognition Standard (ASC 606) and Lease Standard (ASC 842). The comparative numbers have been adjusted to reflect these changes in accounting policies, see Note 1 General information / summary of significant accounting policies.
|
The
increase
in the net contract liability to
EUR 2,857.3 million
as of
December 31, 2018
compared to
EUR 1,881.6 million
as of
December 31, 2017
was mainly caused by an increase in contract liabilities related to down payments on our next-generation EUV platform, High NA, and by a decrease in contract assets related to timing of invoicing. The cumulative catch-up adjustments recognized as revenues in
2018
mainly relate to changed estimates on discounts and credits related to systems sold and shipped in the previous year.
Remaining performance obligations
The vast majority of our revenues results from volume purchase agreements with our customers, which typically span 12 months to 5 years. We have a stable customer base. The volume purchase agreements mainly consist of the sale of systems and related goods and services, such as options, installations, training and extended and enhanced warranties. When revenues will be recognized is mainly dependent on when systems are shipped or installed or when service projects are performed and completed. All of which is estimated based on contract terms and communication with our customers, as well as the customer facility readiness to take delivery of our goods or services. From time to time, the volume purchase agreements may be subject to modifications, impacting the amount and timing of revenue recognition for the anticipated revenues.
At the end of the reporting period the commitments from system sales orders amount to
EUR 6.2 billion
and service and field option sales orders amount to
EUR 0.8 billion
, for which written authorizations have been accepted but no contract liability has been recorded. These amounts exclude our next-generation EUV platform, High NA, for which we currently have written authorization for
four
system sales orders and
eight
options to buy systems. The initial selling price for these High NA systems is around
EUR 270 million
.
The vast majority of the anticipated revenues is expected to be recognized during the coming
18 months
, with the exception of High NA which is targeted to start shipping end of
2021
.
24
. Selected operating expenses and additional information
Personnel expenses for all payroll employees were:
|
Year ended December 31
|
2016
|
|
2017
|
|
2018
|
|
|
(in millions)
|
EUR
|
|
EUR
|
|
EUR
|
|
|
Wages and salaries
|
1,279.6
|
|
1,492.8
|
|
1,777.9
|
|
|
Social security expenses
|
103.8
|
|
119.6
|
|
146.3
|
|
|
Pension and retirement expenses
|
85.7
|
|
100.8
|
|
122.0
|
|
|
Share-based payments
|
47.7
|
|
53.1
|
|
46.3
|
|
|
Personnel expenses
|
1,516.8
|
|
1,766.3
|
|
2,092.5
|
|
The average number of payroll employees in FTEs during
2018
,
2017
and
2016
was
18,204
,
15,136
and
12,852
, respectively.
The average number of payroll employees in FTEs in our operations in the Netherlands during
2018
,
2017
and
2016
was
8,597
,
7,211
and
6,567
, respectively.
Both
increase
s
in
2018
compared to
2017
and in
2017
compared to
2016
in payroll employees (in FTEs) were in line with our business growth.
ASML INTEGRATED REPORT 2018
150
The total number of payroll and temporary employees as of December 31 in FTEs per sector was:
|
As of December 31
|
2016
|
|
2017
|
|
2018
|
|
|
(in FTE)
|
||||||
|
Customer Support
|
4,210
|
|
5,051
|
|
5,674
|
|
|
SG&A
|
1,561
|
|
1,701
|
|
2,260
|
|
|
Manufacturing & Logistics
|
4,443
|
|
5,112
|
|
6,046
|
|
|
R&D
|
6,433
|
|
7,352
|
|
9,267
|
|
|
Total
|
16,647
|
|
19,216
|
|
23,247
|
|
|
Less: Temporary employees
|
2,656
|
|
2,997
|
|
3,203
|
|
|
Payroll employees
|
13,991
|
|
16,219
|
|
20,044
|
|
25
. Research and development costs
R&D costs (net of credits and excluding contributions under the NRE Funding Agreements from Participating Customers in the CCIP)
increased
by
EUR 316.2 million
, or
25.1 percent
, to
EUR 1,575.9 million
in
2018
from
EUR 1,259.7 million
in
2017
.
R&D costs
for both 2018 and 2017 were primarily focused on programs supporting our Holistic Lithography solutions in EUV, DUV immersion, and Applications. In 2018, R&D activities mainly related to:
|
•
|
EUV - Further improving availability and productivity focused on the final stages of industrialization related to our NXE:3400B system, as well as introduction of the NXE:3400C. In addition, we are extending our roadmap by including High NA to support our customers with 3 nm logic and beyond.
|
|
•
|
DUV immersion - Mainly dedicated to the development of our next generation Immersion system NXT:2000i, of which we shipped our first systems in 2018. In addition we are completing industrialization of new modules and further improving our roadmaps on alignment/overlay and productivity
in 2018.
|
|
•
|
Applications - HMI expansion, including multi-beam innovation, and further development of YieldStar and process window control solutions.
|
R&D costs (net of credits and excluding contributions under the NRE Funding Agreements from Participating Customers in the CCIP)
increased
by
EUR 153.9 million
, or
13.9 percent
, to
EUR 1,259.7 million
in
2017
,
from
EUR 1,105.8 million
in
2016
.
R&D costs for both 2017 and 2016 were primarily focused on programs supporting our Holistic Lithography in EUV, DUV immersion, and Applications. In 2017, R&D activities mainly related to:
|
•
|
EUV - Further improving availability and productivity focused on the final stages of development related to our NXE:3400B system, of which we shipped our first systems in 2017. In addition, we are extending our roadmap by including High NA to support our customers with 3 nm logic.
|
|
•
|
DUV immersion - Mainly dedicated to the development of our next generation immersion system NXT:2000i.
|
|
•
|
Applications - HMI expansion and further development of YieldStar and process window control solutions.
|
26
. Interest and other, net
Interest and other income of
EUR 13.5 million
(
2017
:
EUR 7.2 million
and
2016
:
EUR 71.7 million
)
relates to interest income on deposits, short-term investments, money market, other investment funds, bank accounts and on finance receivables.
In addition, in
2016
we recognized
EUR 55.2 million
on foreign currency revaluations of transactions and balances relating to the HMI acquisition in
interest and other, net.
Interest and other costs of
EUR 41.8 million
(
2017
:
EUR 57.5 million
and
2016
:
EUR 38.0 million
)
mainly consist of net interest
expense
on our Eurobonds and related interest rate swaps, hedges, interest on finance lease obligations and amortized financing costs. This decrease is mainly due to lower hedging costs resulting from the change in functional currency of the US business.
27
. Vulnerability due to certain concentrations
We rely on outside vendors for components and subassemblies used in our systems including the design thereof, each of which is obtained from a single supplier or a limited number of suppliers. Our reliance on a limited group of suppliers involves several risks, including a potential inability to obtain an adequate supply of required components, reduced control over pricing and the risk of untimely delivery of these components and subassemblies.
Carl Zeiss SMT GmbH, in which ASML owns an indirect interest of
24.9 percent
, is our single supplier, and we are their single customer, of Optical Columns for lithography systems. Carl Zeiss SMT GmbH is capable of developing and producing these items only in limited numbers and only through the use of manufacturing and testing facilities in Oberkochen and Wetzlar, Germany.
In
2018
,
28.3 percent
of our aggregate cost of system sales was purchased from Carl Zeiss SMT GmbH (
2017
:
26.6 percent
;
2016
:
27.6 percent
).
ASML INTEGRATED REPORT 2018
151
Our relationship with Carl Zeiss AG is structured as a strategic alliance pursuant to several agreements executed in 1997 and subsequent years. These agreements define a framework in all areas of our business relationship. The partnership between ASML and Carl Zeiss AG is run under the principle of ‘two companies, one business’ and is focused on continuous improvement of operational excellence. Pursuant to these agreements, ASML and Carl Zeiss AG have agreed to continue their strategic alliance until either party provides at least three years notice of its intent to terminate.
A constraint in the production could result in limited availability of Optical Columns. During
2018
, our production was not limited by the deliveries from Carl Zeiss SMT GmbH.
For further information on the relationship between ASML and Carl Zeiss SMT GmbH reference is made to
Note 10 Equity method investments
and
Note 31 Related party transactions
.
28
. Shareholders’ equity
Share capital
ASML’s authorized share capital amounts to
EUR 126.0 million
and is divided into:
|
•
|
700,000,000
Cumulative Preference Shares with a nominal value of
EUR 0.09
each.
|
|
•
|
699,999,000
Ordinary Shares with a nominal value of
EUR 0.09
each.
|
|
•
|
9,000
Ordinary Shares B with a nominal value of
EUR 0.01
each.
|
As of
December 31, 2018
,
431,465,767
ordinary shares with a nominal value of
EUR 0.09
each were issued and fully paid up; this includes
10,368,038
treasury shares.
No
ordinary shares B and
no
cumulative preference shares have been issued.
Our BoM has the power to issue ordinary shares and cumulative preference shares insofar as the BoM has been authorized to do so by the General Meeting of Shareholders. The BoM requires approval of the SB for such an issue. The authorization by the General Meeting of Shareholders can only be granted for a certain period not exceeding
5 years
and may be extended for no longer than
5 years
on each occasion. If the General Meeting of Shareholders has not authorized the BoM to issue shares, the General Meeting of Shareholders will be authorized to issue shares on the BoM’s proposal, provided that the SB has approved such proposal.
Shares issued as a result of the acquisition of HMI
ASML and HMI completed the merger pursuant to which ASML acquired
HMI
on
November 22, 2016
. As part of the transaction, Hermes-Epitek Corporation and certain HMI officers have also agreed to (re)invest in ASML part of the proceeds from selling their HMI shares in the transaction, underscoring their belief in the strategic rationale for the transaction and their commitment to the combined businesses going forward. Accordingly, ASML issued a total number of
5,866,001
ordinary shares for an aggregate amount of
EUR 580.6 million
.
Ordinary shares
An ordinary share entitles the holder thereof to cast
nine
votes at the General Meeting of Shareholders. Each ordinary share consists of
900
fractional shares. Fractional shares entitle the holder thereof to a fractional dividend, but do not entitle the holder thereof to voting rights. Only those persons who hold shares directly in the share register in the Netherlands, held by us at our address at 5504 DR Veldhoven, de Run 6501, the Netherlands, or in the New York share register, held by JP Morgan Chase Bank, N.A., P.O. Box 64506, St. Paul, MN 55164-0506, United States, can hold fractional shares. Those who hold ordinary shares through the deposit system under the Dutch Securities Bank Giro Transactions Act (‘Wet giraal effectenverkeer’; the Giro Act) maintained by the Dutch central securities depository Euroclear Nederland or through the Depository Trust Company cannot hold fractional shares. At our 2018 AGM, the BoM was authorized from April 25, 2018
through October 25, 2019, subject to the approval of the SB, to issue shares and / or rights thereto representing up to a maximum of
5.0 percent
of our issued share capital at April 25, 2018, plus an additional
5.0 percent
of our issued share capital at April 25, 2018 that may be issued in connection with mergers, acquisitions and / or (strategic) alliances.
Holders of ASML’s ordinary shares have a preemptive right, in proportion to the aggregate nominal amount of the ordinary shares held by them. This preemptive right may be restricted or excluded. Holders of ordinary shares do not have preemptive right with respect to any ordinary shares issued for consideration other than cash or ordinary shares issued to employees. If authorized for this purpose by the General Meeting of Shareholders, the BoM has the power, subject to approval of the SB, to restrict or exclude the preemptive rights of holders of ordinary shares. At our 2018 AGM, our shareholders authorized the BoM through October 25, 2019, subject to approval of the SB, to restrict or exclude preemptive rights of holders of ordinary shares up to a maximum of
10.0 percent
of our issued share capital.
We may repurchase our issued ordinary shares at any time, subject to compliance with the requirements of Dutch law and our Articles of Association. Any such repurchases are and remain subject to the approval of the SB and the authorization by the General Meeting of Shareholders, which authorization may not be for more than 18 months. At the 2018 AGM, the BoM has been authorized, subject to SB approval, to repurchase through October 25, 2019, up to a maximum of two times
10.0 percent
of our issued share capital at April 25, 2018, at a price between the nominal value of the ordinary shares purchased and
110.0 percent
of the market price of these securities on Euronext Amsterdam or NASDAQ.
ASML INTEGRATED REPORT 2018
152
Ordinary shares B
Our Articles of Association provide for
9,000
ordinary shares B with a nominal value of
EUR 0.01
. Each ordinary share B entitles the holder thereof to cast
one
vote at the General Meeting of Shareholders. Holders of fractional shares had the opportunity, until July 31, 2013, to convert fractional shares into ordinary shares B to obtain voting rights with respect to those fractional shares. No ordinary shares B have been issued.
Cumulative preference shares
In 1998, we granted the Preference Share Option to the Foundation. This option was amended and extended in 2003 and 2007. A third amendment to the option agreement between the Foundation and ASML became effective on January 1, 2009, to clarify the procedure for the repurchase and cancellation of the preference shares when issued.
The nominal value of the cumulative preference shares amounts to
EUR 0.09
and the number of cumulative preference shares included in the authorized share capital is
700,000,000
. A cumulative preference share entitles the holder thereof to cast
nine
votes in the General Meeting of Shareholders.
The Foundation may exercise the Preference Share Option in situations where, in the opinion of the Board of Directors of the Foundation, ASML’s interests, ASML’s business or the interests of ASML’s stakeholders are at stake. This may be the case if a public bid for ASML’s shares has been announced or has been made, or the justified expectation exists that such a bid will be made without any agreement having been reached in relation to such a bid with ASML. The same may apply if one shareholder, or more shareholders acting in concert, hold a substantial percentage of ASML’s issued ordinary shares without making an offer or if, in the opinion of the Board of Directors of the Foundation, the (attempted) exercise of the voting rights by one shareholder or more shareholders, acting in concert, is materially in conflict with ASML’s interests, ASML’s business or ASML’s stakeholders.
The objectives of the Foundation are to look after the interests of ASML and of the enterprises maintained by ASML and of the companies which are affiliated in a group with ASML, in such a way that the interests of ASML, of those enterprises and of all parties concerned are safeguarded in the best possible way, and influences in conflict with these interests which might affect the independence or the identity of ASML and those companies are deterred to the best of the Foundation’s ability, and everything related to the above or possibly conducive thereto. The Foundation seeks to realize its objects by the acquiring and holding of cumulative preference shares in the capital of ASML and by exercising the rights attached to these shares, particularly the voting rights attached to these shares.
The Preference Share Option gives the Foundation the right to acquire a number of cumulative preference shares as the Foundation will require, provided that the aggregate nominal value of such number of cumulative preference shares shall not exceed the aggregate nominal value of the ordinary shares that have been issued at the time of exercise of the Preference Share Option for a subscription price equal to their nominal value. Only one-fourth of the subscription price would be payable at the time of initial issuance of the cumulative preference shares, with the other three-fourths of the nominal value only being payable when we call up this amount. Exercise of the Preference Share Option could effectively dilute the voting power of the outstanding ordinary shares by one-half.
Cancellation and repayment of the issued cumulative preference shares by ASML requires the authorization by the General Meeting of Shareholders of a proposal to do so by the BoM approved by the SB. If the Preference Share Option is exercised and as a result cumulative preference shares are issued, ASML, at the request of the Foundation, will initiate the repurchase or cancellation of all cumulative preference shares held by the Foundation. In that case ASML is obliged to effect the repurchase and cancellation respectively as soon as possible. A cancellation will have as a result a repayment of the amount paid and exemption from the obligation to pay up on the cumulative preference shares. A repurchase of the cumulative preference shares can only take place when such shares are fully paid up.
If the Foundation does not request ASML to repurchase or cancel all cumulative preference shares held by the Foundation within
20 months
after issuance of these shares, we will be obliged to convene a General Meeting of Shareholders in order to decide on a repurchase or cancellation of these shares.
The Foundation is independent of ASML. The Board of Directors of the Foundation comprises four independent members from the Netherlands’ business and academic communities. The current members of the Foundation’s Board of Directors are: Mr. A.P.M. van der Poel, Mr. S. Perrick, Mr. J.M. de Jong and Mr. A.H. Lundqvist.
ASML INTEGRATED REPORT 2018
153
Dividend policy
We aim to pay an annual dividend that is growing over time. Annually, the BoM, upon prior approval from the SB, submits a proposal to the AGM with respect to the amount of dividend to be declared with respect to the prior year. The dividend proposal and amount of share buyback programs in any given year will be subject to the availability of distributable profits or retained earnings and may be affected by, among other factors, the BoM’s views on our potential future liquidity requirements, including for investments in production capacity, the funding of our R&D programs and for acquisition opportunities that may arise from time to time; and by future changes in applicable income tax and corporate laws. Accordingly, the BoM may decide to propose not to pay a dividend or pay a lower dividend with respect to any particular year in the future.
For
2018
,
a proposal to declare a dividend of
EUR 2.10
per ordinary share of
EUR
0.09
nominal value will be submitted to the
2019
AGM.
29
. Purchases of equity securities by the issuer and affiliated purchasers
In addition to dividend payments, we intend to return cash to our shareholders on a regular basis through share buybacks or capital repayment, subject to our actual and anticipated level of liquidity requirements and other relevant factors.
On January 17, 2018, we announced a new share buyback program, to be executed within the 2018-2019 time frame. As part of this program, we intend to repurchase approximately
EUR 2.5 billion
of our own shares. We intend to cancel these shares after repurchase, with the exception of up to EUR 2.4 million shares, which will be used to cover employee share plans.
In
2018
, we repurchased
2,400,000
shares to cover employee share plans and
4,644,389
shares for cancellation for a total consideration of
EUR 1,146.2 million
.
No
shares were canceled in
2018
. In January 2019,
5,806,366
ordinary shares were canceled, of which
3,468,737
shares were repurchased under the 2016-2017 program.
The remainder of the shares bought back under the 2018-2019 program are intended to be canceled in
2019
.
The following table provides a summary of shares repurchased by ASML in
2018
:
|
Period
|
Total number of shares purchased
|
|
Average price paid per Share
(EUR) |
|
Total number of shares purchased as part of publicly announced plans or programs
|
|
Maximum value of shares that may yet be purchased under the program
(EUR millions) |
|
|
January 18 - 31, 2018
|
219,914
|
|
165.06
|
|
219,914
|
|
2,463.7
|
|
|
February 1 - 28, 2018
|
313,137
|
|
153.93
|
|
533,051
|
|
2,415.5
|
|
|
March 1 - 31, 2018
|
507,072
|
|
168.62
|
|
1,040,123
|
|
2,330.0
|
|
|
April 1 - 30, 2018
|
398,517
|
|
161.10
|
|
1,438,640
|
|
2,265.8
|
|
|
May 1 - 31, 2018
|
623,367
|
|
167.80
|
|
2,062,007
|
|
2,161.2
|
|
|
June 1 - 30, 2018
|
568,287
|
|
176.14
|
|
2,630,294
|
|
2,061.1
|
|
|
July 1 - 31, 2018
|
623,903
|
|
176.31
|
|
3,254,197
|
|
1,951.1
|
|
|
August 1 - 31, 2018
|
764,618
|
|
178.39
|
|
4,018,815
|
|
1,814.7
|
|
|
September 1 - 30, 2018
|
718,565
|
|
161.57
|
|
4,737,380
|
|
1,698.6
|
|
|
October 1 - 31, 2018
|
835,384
|
|
153.46
|
|
5,572,764
|
|
1,570.4
|
|
|
November 1 - 30, 2018
|
861,512
|
|
149.39
|
|
6,434,276
|
|
1,441.6
|
|
|
December 1 - 21, 2018
|
610,113
|
|
143.91
|
|
7,044,389
|
|
1,353.9
|
|
|
Total
|
7,044,389
|
|
162.70
|
|
||||
30
. Customer Co-Investment Program
On July 9, 2012, we announced our CCIP to accelerate our development of EUV technology beyond the current generation and our development of future 450mm silicon wafer technology. The Participating Customers collectively agreed to fund
EUR 1.38 billion
of our R&D projects from 2013 through 2017. This program created risk sharing with some of our largest customers while the results of our development programs will be available to every semiconductor manufacturer with no restrictions.
The funding under this program is now complete, with the total amount funded by the end of 2017. In addition to the funding commitments, Participating Customers invested an aggregated
EUR 3.85 billion
for
96,566,077
of our ordinary shares, the proceeds of which were returned to our shareholders (other than Participating Customers).
31
. Related party transactions
On
June 29, 2017
, we completed the acquisition of a
24.9 percent
interest in Carl Zeiss SMT Holding GmbH & Co. KG, which owns 100 percent of the shares in Carl Zeiss SMT GmbH
, to strengthen the long-standing and successful partnership and to facilitate the development of the future generation of EUV lithography systems. Based on the
24.9 percent
investment and our relationship with Carl Zeiss SMT GmbH being our single supplier of optical columns essential to our chip-making systems, Carl Zeiss SMT Holding GmbH & Co. KG and its subsidiaries are considered related parties of ASML as of
June 29, 2017
.
ASML INTEGRATED REPORT 2018
154
On
November 3, 2016
we agreed with Carl Zeiss SMT GmbH to support their R&D costs, capital expenditures and other supply chain investments, in respect of High NA, for an amount of
EUR 760.0 million
over
6 years
, beginning in 2016. During
2018
, we agreed to fund an additional
EUR 144.9 million
, which when combined with the agreed additional funding in
2017
of
EUR 325.0 million
), brings the current estimate to
EUR 1,229.9 million
. In
2018
we paid an amount of
EUR 275.1 million
(
2017
:
EUR 147.5 million
)
. As of
December 31, 2018
our estimated remaining commitment to Carl Zeiss SMT GmbH amounts to
EUR 795.3 million
(
2017
:
EUR 925.5 million
).
From
time to time, ASML makes non-interest bearing advance payments to Carl Zeiss SMT GmbH supporting their work-in-process, thereby securing lens and optical column deliveries to us. Amounts included in these advance payments are settled through future lens or optical column deliveries.
In 2018, ASML and Carl Zeiss SMT GmbH entered into an agreement for ASML to support the development and integration of certain tooling to be used in future production of High-NA optical columns, for which Carl Zeiss SMT GmbH will reimburse all costs to ASML. Receivable amounts from Carl Zeiss SMT GmbH are presented within Other Assets.
The total purchases and outstanding balances to and from Carl Zeiss SMT Holding GmbH & Co. KG and its subsidiaries were as follows:
|
Year ended December 31
|
2016
|
|
2017
|
|
2018
|
|
|
(in millions)
|
EUR
|
|
EUR
|
|
EUR
|
|
|
Total purchases from Carl Zeiss SMT Holding GmbH & Co. KG
|
967.7
|
|
1,141.6
|
|
1,401.0
|
|
|
|
|
|
|
|
|
|
|
|
|
|
|
|
|
|
|
As of December 31
|
|
|
2017
|
|
2018
|
|
|
(in millions)
|
|
|
EUR
|
|
EUR
|
|
|
Advance payments and CAPEX funding to Carl Zeiss SMT Holding GmbH & Co. KG
|
497.5
|
|
768.1
|
|
||
|
Net trade payables to Carl Zeiss SMT Holding GmbH & Co. KG
|
143.2
|
|
58.1
|
|
||
|
|
|
|
|
|||
For more details in relation to our
24.9 percent
interest in Carl Zeiss SMT Holding GmbH & Co. KG see
Note 10 Equity method investments
.
On January 23, 2019, ASML entered into a binding MOU with Nikon and Carl Zeiss SMT relating to a comprehensive settlement of all pending disputes between Nikon, ASML and Zeiss.
See
Note 20 Legal contingencies
.
There have been no transactions during
our most recent fiscal year
, and there are currently no transactions, between ASML or any of its subsidiaries, and any other significant shareholder, and any director or officer or any relative or spouse thereof other than ordinary course (compensation) arrangements. During
our most recent fiscal year
, there has been no, and at present there is no, outstanding indebtedness to ASML owed by or owing to any director or officer of ASML or any associate thereof
, other than the virtual financing arrangement with respect to shares described under
Note 19 Employee benefits
. Furthermore, ASML has not granted any personal loans, guarantees, or the like to members of the BoM or SB.
ASML INTEGRATED REPORT 2018
155
32
. Subsequent events
Subsequent events were evaluated up to
February 5, 2019
, which is the date the Financial Statements included in this Integrated Report were approved. On January 23, 2019 we signed a Memorandum of Understanding with Nikon to settle our legal dispute over alleged patent infringements that were initiated by Nikon, see
Note 20 Legal contingencies
.
There are
no
other events to report.
Veldhoven, the Netherlands
February 5, 2019
/s/ Peter T.F.M. Wennink
Peter T.F.M. Wennink
President, CEO and member of the Board of Management
/s/ Roger J.M. Dassen
Roger J.M. Dassen
Executive Vice President, CFO and member of the Board of Management
ASML INTEGRATED REPORT 2018
156
Report of Independent Registered Public Accounting Firm
To the Shareholders and the Supervisory Board
ASML Holding N.V.:
Opinions on the Consolidated Financial Statements and Internal Control Over Financial Reporting
We have audited the accompanying Consolidated Balance Sheets of ASML Holding N.V. and subsidiaries (the “Company”) as of December 31, 2018 and 2017, the related Consolidated Statements of Operations, Comprehensive Income, Shareholders’ Equity, and Cash Flows for each of the years in the three-year period ended December 31, 2018, and the related notes (collectively, the “consolidated financial statements”). We also have audited the Company’s internal control over financial reporting as of December 31, 2018, based on criteria established in
Internal Control - Integrated Framework
(2013)
issued by the Committee of Sponsoring Organizations of the Treadway Commission.
In our opinion, the consolidated financial statements referred to above present fairly, in all material respects, the financial position of the Company as of December 31, 2018 and 2017, and the results of its operations and its cash flows for each of the years in the three-year period ended December 31, 2018, in conformity with U.S. generally accepted accounting principles. Also in our opinion, the Company maintained, in all material respects, effective internal control over financial reporting as of December 31, 2018, based on criteria established in
Internal Control - Integrated Framework (2013)
issued by the Committee of Sponsoring Organizations of the Treadway Commission.
Change in Accounting Principles
As discussed in Note 1 to the consolidated financial statements, the Company has changed the manner in which it accounts for its revenue in 2017 and 2016 due to the adoption of ASC Topic 606 “Revenue from contracts with customers”.
Basis for Opinions
The Company’s management is responsible for these consolidated financial statements, for maintaining effective internal control over financial reporting, and for its assessment of the effectiveness of internal control over financial reporting, included in the accompanying Management’s report on internal control over financial reporting. Our responsibility is to express an opinion on the Company’s consolidated financial statements and an opinion on the Company’s internal control over financial reporting based on our audits. We are a public accounting firm registered with the Public Company Accounting Oversight Board (United States) (“PCAOB”) and are required to be independent with respect to the Company in accordance with the U.S. federal securities laws and the applicable rules and regulations of the Securities and Exchange Commission and the PCAOB.
We conducted our audits in accordance with the standards of the PCAOB. Those standards require that we plan and perform the audits to obtain reasonable assurance about whether the consolidated financial statements are free of material misstatement, whether due to error or fraud, and whether effective internal control over financial reporting was maintained in all material respects.
Our audits of the consolidated financial statements included performing procedures to assess the risks of material misstatement of the consolidated financial statements, whether due to error or fraud, and performing procedures that respond to those risks. Such procedures included examining, on a test basis, evidence regarding the amounts and disclosures in the consolidated financial statements. Our audits also included evaluating the accounting principles used and significant estimates made by management, as well as evaluating the overall presentation of the consolidated financial statements. Our audit of internal control over financial reporting included obtaining an understanding of internal control over financial reporting, assessing the risk that a material weakness exists, and testing and evaluating the design and operating effectiveness of internal control based on the assessed risk. Our audits also included performing such other procedures as we considered necessary in the circumstances. We believe that our audits provide a reasonable basis for our opinions.
Definition and Limitations of Internal Control Over Financial Reporting
A company’s internal control over financial reporting is a process designed to provide reasonable assurance regarding the reliability of financial reporting and the preparation of financial statements for external purposes in accordance with generally accepted accounting principles. A company’s internal control over financial reporting includes those policies and procedures that (1) pertain to the maintenance of records that, in reasonable detail, accurately and fairly reflect the transactions and dispositions of the assets of the company; (2) provide reasonable assurance that transactions are recorded as necessary to permit preparation of financial statements in accordance with generally accepted accounting principles, and that receipts and expenditures of the company are being made only in accordance with authorizations of management and directors of the company; and (3) provide reasonable assurance regarding prevention or timely detection of unauthorized acquisition, use, or disposition of the company’s assets that could have a material effect on the financial statements.
ASML INTEGRATED REPORT 2018
157
Because of its inherent limitations, internal control over financial reporting may not prevent or detect misstatements. Also, projections of any evaluation of effectiveness to future periods are subject to the risk that controls may become inadequate because of changes in conditions, or that the degree of compliance with the policies or procedures may deteriorate.
/s/ KPMG Accountants N.V.
We have served as the Company’s auditor since 2015.
Rotterdam, the Netherlands
February 5, 2019
ASML INTEGRATED REPORT 2018
158
ASML INTEGRATED REPORT 2018
159

ASML INTEGRATED REPORT 2018
160
About the Non-financial Information
Introduction
ASML’s aim is to provide a balanced, concise and comprehensive view of its material operations and performance. For the second year in a row, we publish an integrated report in which we disclose information on our financial performance and performance in the area of corporate responsibility. The Integrated Report
1
contains all information that is material for our stakeholders and ASML.
Reporting scope
The content disclosed in this report is based on the material topics identified for both ASML and our stakeholders by the comprehensive materiality assessment conducted in 2016. As part of the materiality assessment, we asked internal and external stakeholders to identify where in the value chain the theme has an impact (see table below where we include the boundaries as required by the GRI Standards). In general, all the information about our strategy, policies, procedures and initiatives and about the associated indicators is relevant to our own organization. In some cases the impact extends to the value chain.
|
Themes
|
Area of the value chain where the theme has an impact
|
||
|
Material themes
|
Supply chain
|
ASML internal
|
Product use
|
|
|
|
|
|
|
Innovation
|

|
|
|
|
Knowledge management
|
|
|
|
|
Sustainable relationship with our people
|
|
||
|
Talent management
|
|
||
|
Sustainable relationship with customers
|
|
|
|
|
Sustainable relationship with suppliers
|
|
|
|
|
Financial performance
|
|
||
|
Operational excellence
|
|
|
|
|
Employee safety
|
|
|
|
|
Business risk & continuity
|
|
|
|
|
Business ethics & compliance
|
|
|
|
|
|
|
|
|
|
Responsible business behavior themes
|
|
|
|
|
|
|
|
|
|
Product stewardship
|
|
|
|
|
Product safety & compliance
|
|
|
|
|
Fair remuneration
|
|
|
|
|
Labor relations
|
|
|
|
|
Human rights
|
|
|
|
|
Diversity & inclusion
|
|
||
|
Community involvement
|
|
||
|
Responsible supply chain
|
|
|
|
|
Environmental efficiency own operations
|
|
||
|
Financing and capital return policy
|
|
||
|
Tax strategy and transparency
|
|
||
|
|
|||
For more information on the materiality assessment process, see
Management Board Report - Materiality Assessment
.
This Integrated Report generally covers the performance of ASML from January 1, 2018 to December 31, 2018.
Please see
Management Board Report - Our Company - A short company history
for significant changes regarding the size, structure, or ownership of the organization or its supply chain.
The Reporting scope table clarifies the scope of the data reported per theme and explains where the scope of the data provided differs from the scope of the report’s content.
The financial performance information in this report is derived from our Financial Statements that are in accordance with
US GAAP.
The reporting basis for the information in this report on our performance in the area of corporate responsibility is prepared in accordance with the GRI Sustainability Reporting Standards and is presented in accordance with the ‘core’ option. Details of our compliance with the GRI standards (GRI content index) can be found in a separate Reporting Supplement available on the Website. We have also included disclosures required as part of the EU Directive on disclosure of non-financial information and diversity information, which was implemented in 2017 and is decreed as part of the Dutch Civil Code.
|
1.
|
We publish two versions of the Integrated Report: one version containing Financial Statements based on US GAAP and one version containing Financial Statements based on IFRS-EU.
|
ASML INTEGRATED REPORT 2018
161
Reporting indicators
The Consolidated Financial Statements included in this report are audited. Please see
Consolidated Financial Statements - Report of Independent Registered Public Accounting Firm
.
The non-financial data disclosed in this report is derived from various sources. The nature of certain data and the differing maturity levels of data processes within our operating subsidiaries, means that some data is subject to a degree of uncertainty caused by limitations in measuring and estimating data. We continue to work on improving our corporate responsibility control environment and data collection processes.
|
|
Reported data scope
|
|
Applicable to a subset of the reporting scope (where relevant) or where indicators do not fit the reporting scope
|
Exceptions
|
||||
|
|
|
|
|
|
|
|
|
|
|
|
ASML world-wide
|
ASML world-wide excluding HMI
|
ASML worldwide excluding Cymer Light Sources & HMI
|
|
ASML manufacturing locations
|
ASML D&E
|
ASML products
|
|
|
|
|
|
|
|
|
|
|
|
|
Governance
|
|
|||||||
|
Business ethics and compliance
|

|
|
||||||
|
|
|
|||||||
|
Products and technology
|
|
|||||||
|
Innovation
|
|
|
||||||
|
Knowledge management
|
|

|
|
|||||
|
Product stewardship
|
|
|
||||||
|
Product safety and compliance
|
|
|
||||||
|
|
|
|||||||
|
People
|
|
|||||||
|
Talent management
|

|
The indicators ‘Attrition rate high performers’, ‘Promotion rate high performers’ and ‘Number of non-product related training hours’ do not include Cymer and HMI. The ‘Nomination courses’ exclude HMI.
The ‘Number of scholarships’ is ASML Netherlands only. |
||||||
|
Sustainable relationship with our people
|
|
The indicator ‘Absenteeism’ is excluding Cymer and HMI. The indicator ‘Average engagement score me@ASML survey’ excludes HMI.
|
||||||
|
Community involvement
|
|
The scope is ASML The Netherlands for all, except for Time investment of volunteers (in hours) - Community Involvement, which is ASML worldwide excluding HMI.
|
||||||
|
Diversity and inclusion
|
|
|
||||||
|
Labor relations and fair remuneration
|
|
The indicator ‘Ratio of base salary and total cash of women to men’ excludes Cymer and HMI.
|
||||||
|
|
|
|||||||
|
Partners
|
|
|||||||
|
Sustainable relationship with customers
|
|
The survey scope is largest and most strategic customers (and industry customers (only for VLSI)).
|
||||||
|
Sustainable relationship with suppliers
|
|
The indicator ‘Supplier Relationship Satisfaction Survey’ is for largest and most strategic suppliers.
|
||||||
|
|
|
|||||||
|
Operations
|
|
|||||||
|
Employee health and safety
|
|
|
||||||
|
Environmental efficiency own operations
|
|
|
Pyeongtaek manufacturing location not included.
|
|||||
|
|
|
|||||||
|
Financial performance indicators
|
|
|
||||||
|
|
|
|||||||
Scope covers all indicators -
 Scope contains exceptions for some indicators
|
||||||||
ASML INTEGRATED REPORT 2018
162
Scope changes
Compared to the 2017 Integrated Report, the following scope changes have been made:
|
•
|
Talent Management: HMI is included in the scope of the indicators % of PPM completion and % of DAP completion.
|
|
•
|
Community involvement: Cymer is included in the scope of the indicator Time investment of volunteers (in hours) - Community Involvement.
|
|
•
|
Business Ethics: HMI is included in the scope of the indicator Number of Speak Up Messages.
|
|
•
|
Diversity and inclusion: due to scope change, Cymer Light Sources and HMI are excluded from the scope of indicator Male /Female in managerial positions (in headcount).
|
Reporting adjustments
Adjustments have been made to some non-financial information provided in previous reports. These adjustments are summarized below per theme:
|
•
|
In 2017, the indicator Total number of Speak Up Messages included general questions on topics related to Business Ethics. However, the number of Anti-corruption & bribery Speak Up messages and Human rights Speak Up messages, as reported in the Integrated Report 2017, did not include the questions related to these topics. To align the numbers, we restated the 2017 indicators Anti-corruption & bribery Speak Up messages and Human rights Speak Up messages.
|
Reporting process
Each theme has an owner who is responsible for the theme ambition, strategy and relevant performance indicators, as well as the timely delivery of content and relevant data for reporting and monitoring the execution of the strategy. The data is reviewed and consolidated by Finance. Finance is also responsible for the reporting and planning process for the Integrated Report.
Verification of this report
Given that we want to have our non-financial information independently reviewed, this report is subject to external assurance. As requested by our BoM, our external auditor (KPMG) was asked to provide this assurance. For KPMG’s assurance report, including details of the work they carried out, see
Non-Financial Statements - Assurance Report of the Independent Auditor
.
ASML INTEGRATED REPORT 2018
163
Non-financial Indicators
Please note that the non-financial Key Performance Indicators (KPIs) are reported in the different chapters of the Management Board Report. The other non-financial performance indicators are reported in the tables below.
|
Governance
|
|||||
|
Theme
|
Description
|
2016
|
2017
|
2018
|
Comments
|
|
|
|
|
|
|
|
|
Business ethics and compliance
|
Total number of Speak Up messages
|
196
|
230
|
266
|
|
|
|
Anti-corruption & bribery Speak Up messages
1
|
n/a
|
24
|
33
|
|
|
|
Human rights Speak Up messages
|
n/a
|
44
|
63
|
|
|
|
|
|
|
|
|
1. None of the Speak Up messages lead to any indication of violation of anti-corruption laws.
|
Products and technology
|
||||||||
|
Theme
|
Description
|
2016
|
|
2017
|
|
2018
|
|
Comments
|
|
|
|
|
|
|
|
|
|
|
|
Knowledge Management
|
Number of technical training hours per FTE
|
15.9
|
|
18.2
|
|
31.4
|
|
In 2018 new technical training programs were introduced, resulting in more training hours per FTE. The increase in FTEs also contributed to the relatively large increase in this indicator.
|
|
Knowledge Management
|
Number of technical training hours per FTE - Male
|
15.6
|
|
17.6
|
|
29.7
|
|
See comment above.
|
|
Knowledge Management
|
Number of technical training hours per FTE - Female
|
18.9
|
|
22.8
|
|
43.9
|
|
See comment above.
|
|
|
|
|
|
|
|
|
|
|
|
|
|
|
|
|
|
|
|
|
|
|
|
n/a
|
|
NXT:
2000i |
|
n/a
|
|
|
|
Product Stewardship
|
Throughput
|
n/a
|
|
275
|
|
n/a
|
|
No new NXT system was introduced in 2016 and 2018. Therefore there are no measurements in these years.
|
|
Product Stewardship
|
Measured energy efficiency
(kWh / waferpass) 1 |
n/a
|
|
0.51
|
|
n/a
|
|
See comment above.
|
|
|
|
|
|
|
|
|
|
|
|
|
|
|
|
|
|
|
|
|
|
Product safety & compliance
|
Percentage of product types shipped that have a SEMI S2 Safety Guidelines compliance report
|
100
|
%
|
100
|
%
|
100
|
%
|
|
|
Product safety & compliance
|
Number of (significant) fines and monetary value of significant fines for non-compliance with product design related laws and regulations
|
—
|
|
—
|
|
—
|
|
|
|
|
|
|
|
|
|
|||
|
1.
|
Machine energy efficiency is measured according to the new SEMI S23 standard, and scaled to 100 percent availability of our systems.
|
ASML INTEGRATED REPORT 2018
164
|
People
|
||||||||||||||||||||||
|
Theme
|
Description
|
|
||||||||||||||||||||
|
|
|
|
|
|
|
|
|
|
|
|
|
|
|
|||||||||
|
Talent Management
|
Number of FTEs (payroll and temporary)
|
Total ASML
|
Asia
|
Europe
|
US
|
|||||||||||||||||
|
2016
2
|
|
2017
3
|
|
2018
3
|
2016
|
|
2017
|
|
2018
|
|
2016
|
|
2017
|
|
2018
|
2016
|
|
2017
|
|
2018
|
||
|
|
|
|
|
|
|
|
|
|
|
|
|
|
|
|
|
|
|
|
|
|
|
|
|
|
Payroll employees
(in FTE) |
13,288
|
|
16,219
|
|
20,044
|
2,878
|
|
4,291
|
|
5,305
|
|
7,046
|
|
7,872
|
|
9,950
|
3,364
|
|
4,056
|
|
4,789
|
|
|
Female (in %)
|
13
|
|
14
|
|
16
|
12
|
|
15
|
|
16
|
|
13
|
|
14
|
|
16
|
14
|
|
15
|
|
16
|
|
|
Male (in %)
|
87
|
|
86
|
|
84
|
88
|
|
85
|
|
84
|
|
87
|
|
86
|
|
84
|
86
|
|
85
|
|
84
|
|
|
|
|
|
|
|
|
|
|
|
|
|
|
|
|
|
|
|
|
|
|
|
|
|
|
Temporary employees
(in FTE) 1 |
2,622
|
|
2,997
|
|
3,203
|
57
|
|
40
|
|
85
|
|
2,328
|
|
2,665
|
|
2,752
|
237
|
|
292
|
|
366
|
|
|
Female (in %)
|
14
|
|
15
|
|
15
|
54
|
|
48
|
|
36
|
|
13
|
|
14
|
|
14
|
14
|
|
18
|
|
12
|
|
|
Male (in %)
|
86
|
|
85
|
|
85
|
46
|
|
52
|
|
64
|
|
87
|
|
86
|
|
86
|
86
|
|
82
|
|
88
|
|
|
|
|
|
|
|
|
|
|
|
|
|
|
|
|
|
|
|
|
|
|
|
|
|
|
Total
4
|
15,910
|
|
19,216
|
|
23,247
|
2,935
|
|
4,331
|
|
5,390
|
|
9,374
|
|
10,537
|
|
12,702
|
3,601
|
|
4,348
|
|
5,155
|
|
|
|
|
|
|
|
|
|
|
|
|
|
|
|
|||||||||
|
Talent Management
|
Number of payroll FTEs (split in full-time and part-time)
|
Total ASML
|
Asia
|
Europe
|
US
|
|||||||||||||||||
|
2016
|
|
2017
|
|
2018
|
2016
|
|
2017
|
|
2018
|
|
2016
|
|
2017
|
|
2018
|
2016
|
|
2017
|
|
2018
|
||
|
|
Full-time employees
(in FTE) |
12,368
|
|
15,173
|
|
18,761
|
2,875
|
|
4,288
|
|
5,300
|
|
6,134
|
|
6,834
|
|
8,681
|
3,359
|
|
4,051
|
|
4,780
|
|
|
Female (in %)
|
12
|
|
13
|
|
14
|
12
|
|
15
|
|
16
|
|
10
|
|
10
|
|
13
|
14
|
|
15
|
|
16
|
|
|
Male (in %)
|
88
|
|
87
|
|
86
|
88
|
|
85
|
|
84
|
|
90
|
|
90
|
|
87
|
86
|
|
85
|
|
84
|
|
|
|
|
|
|
|
|
|
|
|
|
|
|
|
|
|
|
|
|
|
|
|
|
|
|
Part-time employees
(in FTE) |
920
|
|
1,046
|
|
1,283
|
3
|
|
3
|
|
5
|
|
912
|
|
1,038
|
|
1,269
|
5
|
|
5
|
|
9
|
|
|
Female (in %)
|
35
|
|
36
|
|
37
|
29
|
|
—
|
|
10
|
|
35
|
|
36
|
|
37
|
37
|
|
57
|
|
54
|
|
|
Male (in %)
|
65
|
|
64
|
|
63
|
71
|
|
100
|
|
90
|
|
65
|
|
64
|
|
63
|
63
|
|
43
|
|
46
|
|
|
|
|
|
|
|
|
|
|
|
|
|
|
|
|
|
|
|
|
|
|
|
|
|
|
Total
|
13,288
|
|
16,219
|
|
20,044
|
2,878
|
|
4,291
|
|
5,305
|
|
7,046
|
|
7,872
|
|
9,950
|
3,364
|
|
4,056
|
|
4,789
|
|
|
|
|
|
|
|
|
|
|
|
|
|
|
|
|||||||||
|
Talent Management
|
Employee attrition (in FTE)
|
Total ASML
|
Asia
|
Europe
|
US
|
|||||||||||||||||
|
2016
|
|
2017
|
|
2018
|
2016
|
|
2017
|
|
2018
|
|
2016
|
|
2017
|
|
2018
|
2016
|
|
2017
|
|
2018
|
||
|
|
Number of involuntary employee attrition
|
151
|
|
179
|
|
153
|
18
|
|
46
|
|
35
|
|
76
|
|
70
|
|
69
|
57
|
|
63
|
|
49
|
|
|
Number of voluntary employee attrition
|
342
|
|
472
|
|
679
|
99
|
|
157
|
|
232
|
|
99
|
|
112
|
|
176
|
144
|
|
203
|
|
271
|
|
|
Total
|
493
|
|
651
|
|
832
|
117
|
|
203
|
|
267
|
|
175
|
|
182
|
|
245
|
201
|
|
266
|
|
320
|
|
|
|
|
|
|
|
|
|
|
|
|
|
|
|
|
|
|
|
|
|
|
|
|
|
|
Gender
|
|
|
|
|
|
|
|
|
|
|
|
|
|
|
|
|
|
|
|
|
|
|
|
Female
|
86
|
|
129
|
|
151
|
23
|
|
40
|
|
45
|
|
24
|
|
39
|
|
48
|
39
|
|
50
|
|
58
|
|
|
Male
|
407
|
|
522
|
|
681
|
94
|
|
163
|
|
222
|
|
151
|
|
143
|
|
197
|
162
|
|
216
|
|
262
|
|
|
Total
|
493
|
|
651
|
|
832
|
117
|
|
203
|
|
267
|
|
175
|
|
182
|
|
245
|
201
|
|
266
|
|
320
|
|
|
|
|
|
|
|
|
|
|
|
|
|
|
|
|
|
|
|
|
|
|
|
|
|
|
Age group
|
|
|
|
|
|
|
|
|
|
|
|
|
|
|
|
|
|
|
|
|
|
|
|
< 30
|
80
|
|
121
|
|
183
|
32
|
|
59
|
|
104
|
|
19
|
|
20
|
|
29
|
29
|
|
42
|
|
50
|
|
|
30 - 50
|
302
|
|
383
|
|
478
|
77
|
|
138
|
|
149
|
|
120
|
|
112
|
|
158
|
105
|
|
133
|
|
171
|
|
|
> 50
|
111
|
|
147
|
|
171
|
8
|
|
6
|
|
14
|
|
36
|
|
50
|
|
58
|
67
|
|
91
|
|
99
|
|
|
Total
|
493
|
|
651
|
|
832
|
117
|
|
203
|
|
267
|
|
175
|
|
182
|
|
245
|
201
|
|
266
|
|
320
|
|
|
|
|
|
|
|
|
|
|
|
|
|
|
|
|||||||||
|
1.
|
For US 2016, 111 gender unknown and for US 2017, 36 gender unknown, as in the US temporary employees are not required to provide their gender. For US 2018, 0 gender unknown.
|
|
2.
|
Please note that the 2016 numbers do not include HMI. At 2016 year-end, we did not have all the relevant FTE splits to include HMI in the tables.
|
|
3.
|
Significant increase in 2018 and 2017 due to ambitious recruitment targets to support the strong company growth. Part of the increase in 2017 is due to the inclusion of HMI.
|
|
4.
|
Our employees work primarily in customer support, manufacturing & logistics and in R&D.
|
ASML INTEGRATED REPORT 2018
165
|
People
|
|||||||||||||||||||||
|
Theme
|
Description
|
|
|||||||||||||||||||
|
|
|
|
|
|
|
|
|
|
|
|
|
|
|
||||||||
|
Talent Management
|
Number of new hires payroll employees
(in FTEs) |
Total ASML
|
Asia
|
Europe
|
US
|
||||||||||||||||
|
2016
|
|
2017
|
|
2018
|
2016
|
|
2017
|
|
2018
|
2016
|
|
2017
|
|
2018
|
2016
|
|
2017
|
|
2018
|
||
|
|
|
|
|
|
|
|
|
|
|
|
|
|
|
|
|
|
|
|
|
|
|
|
|
Number of new hires
1
|
1,156
|
|
3,010
|
|
3,479
|
507
|
|
1,595
|
|
1,299
|
324
|
|
644
|
|
1,348
|
325
|
|
771
|
|
832
|
|
|
Rate of new hires
(in %) |
9
|
|
19
|
|
17
|
18
|
|
37
|
|
24
|
5
|
|
8
|
|
14
|
10
|
|
19
|
|
17
|
|
|
|
|
|
|
|
|
|
|
|
|
|
|
|
|
|
|
|
|
|
|
|
|
|
Gender
|
|
|
|
|
|
|
|
|
|
|
|
|
|
|
|
|
|
|
|
|
|
|
Female
|
213
|
|
592
|
|
746
|
74
|
|
295
|
|
234
|
76
|
|
140
|
|
332
|
64
|
|
157
|
|
180
|
|
|
Male
|
943
|
|
2,418
|
|
2,733
|
433
|
|
1,300
|
|
1,065
|
248
|
|
504
|
|
1,016
|
261
|
|
614
|
|
652
|
|
|
Total
|
1,156
|
|
3,010
|
|
3,479
|
507
|
|
1,595
|
|
1,299
|
324
|
|
644
|
|
1,348
|
325
|
|
771
|
|
832
|
|
|
|
|
|
|
|
|
|
|
|
|
|
|
|
|
|
|
|
|
|
|
|
|
|
Age group
2
|
|
|
|
|
|
|
|
|
|
|
|
|
|
|
|
|
|
|
|
|
|
|
< 30
|
531
|
|
1,267
|
|
1,666
|
343
|
|
781
|
|
783
|
95
|
|
224
|
|
522
|
93
|
|
262
|
|
361
|
|
|
30 - 50
|
565
|
|
1,574
|
|
1,636
|
158
|
|
794
|
|
508
|
213
|
|
394
|
|
750
|
194
|
|
386
|
|
378
|
|
|
> 50
|
58
|
|
169
|
|
177
|
6
|
|
20
|
|
8
|
16
|
|
26
|
|
76
|
36
|
|
123
|
|
93
|
|
|
Total
|
1,154
|
|
3,010
|
|
3,479
|
507
|
|
1,595
|
|
1,299
|
324
|
|
644
|
|
1,348
|
323
|
|
771
|
|
832
|
|
|
|
|
|
|
|
|
|
|
|
|
|
|
|
|
|
|
|
|
|
|
|
|
1.
|
The new hires 2017 includes the HMI acquisition of approximately 700 FTE (at the time of acquisition in 2016). The increases in 2017 and 2018 are in line with our business growth.
|
|
2.
|
For US 2016, 2 unknown.
|
|
People
|
|||||||||||||||
|
Theme
|
Description
|
|
|||||||||||||
|
|
|
|
|
|
|
|
|
|
|||||||
|
|
|
Gender
|
Age group
|
||||||||||||
|
Diversity & inclusion
|
Male/female in managerial positions
(in headcount) |
Female
|
|
Male
|
|
Total
|
|
< 30
|
|
30 - 50
|
|
>50
|
|
Total
|
|
|
|
|
|
|
|
|
|
|
|
|
|
|
|
|
|
|
|
|
Supervisory Board
|
3
|
|
5
|
|
8
|
|
—
|
|
—
|
|
8
|
|
8
|
|
|
|
Board of Management
|
—
|
|
6
|
|
6
|
|
—
|
|
1
|
|
5
|
|
6
|
|
|
|
Senior Management
|
41
|
|
392
|
|
433
|
|
—
|
|
199
|
|
234
|
|
433
|
|
|
|
Middle Management
|
230
|
|
1,906
|
|
2,136
|
|
1
|
|
1,398
|
|
737
|
|
2,136
|
|
|
|
Junior Management
|
130
|
|
906
|
|
1,036
|
|
19
|
|
873
|
|
144
|
|
1,036
|
|
|
|
Other
|
2,870
|
|
13,567
|
|
16,437
|
|
3,732
|
|
10,400
|
|
2,305
|
|
16,437
|
|
|
|
|
|
|
|
|
|
|
|
|||||||
ASML INTEGRATED REPORT 2018
166
|
People
|
|||||
|
Theme
|
Description
|
2016
|
2017
|
2018
|
Comments
|
|
|
|
|
|
|
|
|
Talent Management
|
Promotion rate - Overall (in %)
|
12
|
13
|
14
|
|
|
People Performance Management process
completion (in %)
|
98
|
98
|
96
|
|
|
|
Development Action Plan completion (in %)
|
92
|
89
|
81
|
Due to the high number of new hires in 2018, the number of completed DAPs went down as new employees do not start with a DAP directly after onboarding.
|
|
|
Number of scholarships
|
50
|
50
|
53
|
Increase due to the start of a new scholarship pilot.
|
|
|
|
|
|
|
|
|
|
Talent Management
|
Number of non-product related training hours per FTE
|
|
|
|
|
|
|
Female
|
13.3
|
11.2
|
11.6
|
|
|
|
Male
|
8.7
|
8.6
|
8.0
|
|
|
|
Total
|
9.3
|
8.9
|
8.6
|
|
|
|
|
|
|
|
|
|
Talent Management
|
Nomination courses: Leadership Development Programs
|
|
|
|
|
|
|
Number of training hours
|
22,789
|
37,588
|
24,738
|
|
|
|
Number of employees attending (unique)
|
323
|
431
|
331
|
|
|
|
|
|
|
|
|
|
Diversity & inclusion
|
Workforce by gender male / female (in %)
|
|
|
|
|
|
|
Female
|
13
|
14
|
16
|
|
|
|
Male
|
87
|
86
|
84
|
|
|
|
Total
|
100
|
100
|
100
|
|
|
|
|
|
|
|
|
|
Diversity & inclusion
|
Number of nationalities working for ASML
|
|
|
|
|
|
|
Asia
|
22
|
25
|
34
|
|
|
|
Europe
|
90
|
94
|
105
|
|
|
|
US
|
71
|
76
|
84
|
|
|
|
Total
|
105
|
115
|
123
|
|
|
|
|
|
|
|
|
|
Diversity & inclusion
|
Foreign nationals working for ASML (in %)
|
|
|
|
|
|
|
Asia
|
5
|
4
|
5
|
|
|
|
Europe
|
22
|
24
|
29
|
|
|
|
US
|
20
|
26
|
29
|
|
|
|
Total
|
18
|
20
|
24
|
|
|
|
|
|
|
|
|
|
Sustainable relationship with our people
|
Absenteeism (in %)
|
|
|
|
|
|
Asia
1
|
0.4
|
0.4
|
0.3
|
|
|
|
|
Europe
|
2.3
|
2.4
|
2.5
|
|
|
|
US
|
1.5
|
1.4
|
1.5
|
|
|
|
|
|
|
|
|
1.
In some Asian countries sick leave is regarded as annual leave, hence illness-related absenteeism is recorded as 0 percent.
ASML INTEGRATED REPORT 2018
167
|
People
|
||||||||
|
Theme
|
Description
|
2016
|
|
2017
|
|
2018
|
|
Comments
|
|
|
|
|
|
|
|
|
|
|
|
Labor relations
|
Percentage of employees covered by collective bargaining agreements
|
50
|
%
|
46
|
%
|
48
|
%
|
|
|
|
|
|
|
|
|
|
|
|
|
Fair remuneration
|
Ratio of base salary of women to men
|
|
|
|
|
|
|
|
|
|
Senior Management
|
106
|
%
|
106
|
%
|
107
|
%
|
|
|
|
Middle Management
|
98
|
%
|
97
|
%
|
99
|
%
|
|
|
|
Non-management
|
99
|
%
|
99
|
%
|
100
|
%
|
|
|
|
|
|
|
|
|
|
|
|
|
Fair remuneration
|
Ratio of total cash of women to men
|
|
|
|
|
|
|
|
|
|
Middle Management
|
97
|
%
|
96
|
%
|
98
|
%
|
|
|
|
|
|
|
|
|
|
|
|
|
|
|
|
|
|
|
|
|
|
|
Community involvement
|
Number of students met
|
1,637
|
|
7,299
|
|
11,694
|
|
Increase in 2018 due to increased focus to meet students.
|
|
Community involvement
|
Time investment of volunteers (in hours) - Technology promotion and Campus promotion
|
1,789
|
|
4,533
|
|
5,257
|
|
|
|
Community involvement
|
Time investment of volunteers (in hours) - Community Involvement
|
2,669
|
|
4,545
|
|
5,434
|
|
|
|
Community involvement
|
Cash commitments - Charity (x 1,000 EUR)
|
635
|
|
749
|
|
700
|
|
|
|
Community involvement
|
Cash commitments - Sponsorship
(x 1,000 EUR) |
425
|
|
620
|
|
784
|
|
|
|
|
|
|
|
|
|
|||
|
Partners
|
||||||
|
Theme
|
Description
|
2016
|
2017
|
2018
|
|
Comments
|
|
|
|
|
|
|
|
|
|
Sustainable relationship with suppliers & Responsible supply chain
|
Total number of supplier audits conducted
|
126
|
88
|
63
|
|
The number of supplier audits conducted decreased due to reduced audit capacity.
|
|
Proportion of spending on local suppliers
(in %) 1 |
|
|
|
|||
|
Veldhoven
|
n/a
|
n/a
|
44
|
%
|
A relatively large amount of the total supplier spend for Veldhoven relates to Zeiss (non-local).
|
|
|
Linkou
|
n/a
|
n/a
|
51
|
%
|
|
|
|
San Diego
|
n/a
|
n/a
|
93
|
%
|
|
|
|
Wilton
|
n/a
|
n/a
|
64
|
%
|
|
|
|
|
|
|
|
|
|
|
|
1.
|
We define 'local' as the country in which a significant location of operation is located. The significant locations of operations are the main manufacturing sites of ASML, which are located in Veldhoven, The Netherlands, in Linkou, Taiwan, in San Diego and in Wilton, both in the United States.
|
|
Operations
|
||||||||
|
Theme
|
Description
|
2016
|
|
2017
|
|
2018
|
|
Comments
|
|
|
|
|
|
|
|
|
|
|
|
Environmental efficiency own operations
|
Energy consumption (in TJ)
|
1,297
|
|
1,321
|
|
1,355
|
|
|
|
Environmental efficiency own operations
|
Water consumption (in 1,000 m
3
)
|
896
|
|
874
|
|
895
|
|
|
|
Environmental efficiency own operations
|
Waste generated (in 1,000 kg)
|
3,895
|
|
3,935
|
|
4,463
|
|
|
|
Nonhazardous waste
|
3,583
|
|
3,602
|
|
4,116
|
|
Increase mainly in Wilton and Veldhoven due to an increase in headcount, facility expansion, renovations and increased production.
|
|
|
|
Hazardous waste
|
312
|
|
333
|
|
347
|
|
|
|
Environmental efficiency own operations
|
Number and monetary value of significant fines and sanctions filed for non-compliance with environmental laws and regulations
|
—
|
|
—
|
|
—
|
|
|
|
|
|
|
|
|
|
|
|
|
|
Environmental efficiency own operations
|
CO
2
footprint (in kton) made up of
|
45.9
|
|
46.6
|
|
32.9
|
|
|
|
CO
2
footprint - direct scope 1 (in kton)
|
20.4
|
|
19.0
|
|
17.5
|
|
|
|
|
|
CO
2
footprint - indirect scope 2 (in kton)
|
25.5
|
|
27.6
|
|
15.4
|
|
|
|
|
|
|
|
|
|
|
|
|
ASML INTEGRATED REPORT 2018
168
|
Operations
|
|||||||
|
Theme
|
Description
|
2016
|
2017
|
|
2018
|
|
Comments
|
|
Employee safety
|
Number of incidents resulting in personal injury / illness (per region)
1
|
||||||
|
Asia
|
50
|
36
|
|
59
|
|
|
|
|
Europe
|
120
|
120
|
|
151
|
|
|
|
|
US
|
81
|
91
|
|
85
|
|
|
|
|
Total
|
251
|
247
|
|
295
|
|
|
|
|
Employee safety
|
Number of incidents resulting in personal injury / illness (by body part affected)
2
|
||||||
|
Head
|
n/a
|
38
|
|
54
|
|
|
|
|
Eye
|
n/a
|
10
|
|
10
|
|
|
|
|
Shoulder
|
n/a
|
4
|
|
8
|
|
|
|
|
Chest
|
n/a
|
6
|
|
4
|
|
|
|
|
Back
|
n/a
|
19
|
|
23
|
|
|
|
|
Arm
|
n/a
|
14
|
|
19
|
|
|
|
|
Hand
|
n/a
|
77
|
|
81
|
|
|
|
|
Leg
|
n/a
|
45
|
|
32
|
|
|
|
|
Foot
|
n/a
|
20
|
|
15
|
|
|
|
|
Other
|
n/a
|
14
|
|
49
|
|
|
|
|
Total
|
n/a
|
247
|
|
295
|
|
|
|
|
Employee safety
|
Lost workday rate
3
|
0.17
|
0.13
|
|
0.10
|
|
|
|
Employee safety
|
Severity rate
4
|
3.64
|
6.71
|
|
6.24
|
|
|
|
1.
|
The online EHS incident reporting tool was implemented at Cymer Light Sources on August 1, 2016, so not all Cymer Light Sources incidents for the indicator number of incidents resulting in personal injury / illness may be included in 2016.
|
|
2.
|
As of 2017 we use the Occupational Health and Safety Act guidelines to categorize the number of incidents resulting in personal injury / illness by body part affected. Therefore, data previously reported is not comparable and not included here. Please see the 2016 Integrated Report for the categorization of the incidents occurred in 2016.
|
|
3.
|
To calculate the lost workday rate we define days as scheduled work days. The lost workday count begins the day after the incident.
|
|
4.
|
The severity rate is calculated as the total number of lost workdays divided by the total number of recordable incidents.
|
ASML INTEGRATED REPORT 2018
169
Stakeholder Engagement
We communicate with our stakeholders through various channels and at a variety of levels. The following table is an overview of our main stakeholder groups, the way we communicate with them and an overview of the topics most relevant to them.
|
Stakeholder
|
Main communication channels
|
Most relevant themes
|
|
|
|
|
|
Customers
|
•
Customer Loyalty Survey
•
Direct interaction via account teams and zone quality managers
•
Voice of the customer auditorium sessions
•
Bi-annual Technology Review Meetings (between our major customers, ASML’s CTO, product managers and other ASML executives) and Executive Review Meetings (between ASML executives and major clients)
•
Different technology symposia and special events
|
•
Innovation
•
Talent management
•
Operational excellence
•
Sustainable relationship with customers
•
Product stewardship
|
|
|
||
|
Shareholders
|
•
Direct interaction with the Investor Relations department (e.g. financial results conference calls, investor visits to ASML, visits to investors during roadshows)
•
AGM
•
Investor Day (scheduled as needed, usually every other year)
•
Different investor conferences
•
Various sustainability self-assessments and survey feedback
|
•
Financial performance & financing and capital return policy
•
Innovation & Knowledge management
•
Talent management & Sustainable relationship with our people
•
Business risk & business continuity
•
Business ethics & compliance
•
Responsible supply chain
|
|
|
||
|
Employees
1
|
•
Employee satisfaction survey
•
Feedback from online training programs (e.g. ethics/Code of Conduct)
•
ASML Speak up service
•
Works Council
•
Young ASML
2
, Women@ASML, Seniors@ASML, Pink ASML
3
•
Intranet articles
•
Onboarding sessions for new employees
•
Lunches with board members
•
All-employee meeting
•
Senior Management meetings
•
Departmental meetings
|
•
Diversity & inclusion
•
Environmental efficiency own operations
•
Innovation
•
Product stewardship
•
Talent management
•
Operational excellence
•
Sustainable relationship with our people
|
|
|
||
|
Suppliers
|
•
ASML’s supplier days
•
Supplier Relationship Satisfaction Survey
•
Direct interaction via supplier account teams / procurement account managers
•
Supplier audits
•
ASML Speak up service
|
•
Sustainable relationship with suppliers
•
Sustainable relationship with customers
•
Innovation
•
Business risk & continuity
|
|
|
||
|
Society
|
||
|
a. Industry peers
|
•
SEMI meetings
•
Responsible Business Alliance meetings and workgroups
•
FME
4
events and meetings
|
•
Talent management
•
Community involvement
•
Innovation
•
Environmental efficiency own operations
|
|
b. Governments
5
|
•
Meetings with municipalities and regional and national government officials
•
EU joint technology initiatives
|
|
|
c. Universities
|
•
ASML scholarship programs
•
Internships
•
Partnerships with universities and institutes (e.g. in the Netherlands, Korea, Taiwan)
•
Labor market communication program
|
|
|
d. Local Communities & Other
|
•
Neighbor Evening
•
Brainport
6
•
HighTechXL
7
•
Make Next Platform
8
•
Jet-Net
•
Dutch technology week
•
Company visits
•
Meetings with various schools and local cultural institutions (e.g. in the Netherlands and U.S.)
•
ASML Speak up service
|
|
|
|
||
|
1.
|
Including Works Council and unions.
|
|
2.
|
Internal platform that aims to connect, develop, and support young professionals within ASML via social and professional initiatives.
|
|
3.
|
Internal platform that aims to contribute to making ASML a safe and great place to work, which explicitly welcomes diversity in gender expression and sexual orientation.
|
|
4.
|
FME is a Dutch organization that represents employers and businesses in the technology industry.
|
|
5.
|
Including regulatory bodies in the countries where ASML operates and municipalities.
|
|
6.
|
Brainport Eindhoven Region (the Netherlands) is an innovative technology region, home to world-class businesses, knowledge institutes, and research institutions.
|
|
7.
|
High TechXL is an European hub for high-tech hardware startups.
|
|
8.
|
The Platform provides the future generation of manufacturing companies with the unique opportunity to gain access to the networks, knowledge and expertise of leading Dutch companies.
|
ASML INTEGRATED REPORT 2018
170
Assurance Report of the Independent Auditor
To the Board of Management of ASML Holding N.V.
Our conclusion
We have reviewed the following non-financial information (hereafter: the Non-financial Information) of the 'Integrated Report 2018' based on U.S. generally accepted accounting principles (hereafter: the Report) of ASML Holding N.V. (hereafter: ASML), based in Veldhoven, the Netherlands. This review engagement is aimed at obtaining a limited level of assurance.
Based on our procedures performed, nothing has come to our attention that causes us to believe that the sustainability information is not prepared, in all material respects, in accordance with the reporting criteria as included in the section ‘reporting criteria’.
The non-financial information consists of: Message from our CEO (page 1), Highlights (page 2), Management Board report (pages 4 to 41, 47 to 49 and pages 58 to 61) and the Non-financial statements (pages 160-170).
Basis for our conclusion
We have performed our review on the Non-financial Information in accordance with Dutch law, including Dutch Standard 3810N: "Assurance engagements relating to sustainability reports", which is a specified Dutch standard that is based on the International Standard on Assurance Engagements (ISAE) 3000: "Assurance Engagements other than Audits or Reviews of Historical Financial Information".
Our responsibilities under this standard are further described in the section 'Our responsibilities for the review of the Nonfinancial Information' below.
We are independent of ASML in accordance with the 'Verordening inzake de onafhankelijkheid van accountants bij assurance-opdrachten' (ViO, Code of Ethics for Professional Accountants, a regulation with respect to independence) and other relevant independence regulations in the Netherlands. Furthermore, we have complied with the 'Verordening gedrags- en beroepsregels accountants' (VGBA, Dutch Code of Ethics).
We believe that the assurance evidence we have obtained is sufficient and appropriate to provide a basis for our conclusion.
Reporting criteria
The Non-financial information needs to be read and understood together with the reporting criteria. ASML is solely responsible for selecting and applying these reporting criteria, taking into account applicable law and regulations related to reporting.
The reporting criteria used for the preparation of the sustainability information are the Sustainability Reporting Standards of the Global Reporting Initiative (GRI) and the applied supplemental reporting criteria as disclosed in section ‘About the Non-financial Information’ of the Report.
Scope of the group review
ASML Holding N.V. is the parent company of a group of entities. The Non-financial information incorporates the consolidated information of this group of entities to the extent as specified in ‘About the Non-financial Information’ in the Report.
Our procedures consisted of both procedures at ASML group level and at local entity level. Our selection of entities in scope of our procedures is primarily based on the entity’s individual contribution to the consolidated information.
By performing our procedures at local entity level, together with additional procedures at group level, we have been able to obtain sufficient and appropriate assurance evidence about the group’s reported information to provide a conclusion about the Non-financial information.
Limitations to the scope of our review
The Non-financial Information includes prospective information such as ambitions, strategy, plans, expectations and estimates. Inherently the actual future results are uncertain. We do not provide any assurance on the assumptions and achievability of prospective information in the Non-financial Information.
The references to external sources or websites in the Non-financial information are not part of the Non-financial information itself as reviewed by us. We therefore do not provide assurance on this information.
Consistency with other non-financial information included in other parts of the Report
In addition to the Non-financial Information and our assurance report thereon, the Report contains other non-financial information.
Based on the following procedures performed, we conclude that the other information is consistent with the Non-financial Information reviewed and does not contain material misstatements.
We have read the other information. Based on our knowledge and understanding obtained through our review of the Non-financial Information, we have considered whether the other information in the Report contains material misstatements.
ASML INTEGRATED REPORT 2018
171
The scope of the procedures performed is substantially less than the scope of those performed in our review of the Non-financial Information.
Responsibilities of the Board of Management for the Non-financial Information
The Board of Management of ASML is responsible for the preparation of the Non-financial Information in accordance with the reporting criteria as included in the section ‘Reporting criteria’, including the identification of stakeholders and the definition of material matters. The choices made by the Board of Management regarding the scope of the Non-financial Information and the reporting policy are summarized in chapter ‘About the Non-financial Information’ of the Report.
The Board of Management is also responsible for such internal control as it determines is necessary to enable the preparation of the Non-financial Information that is free from material misstatement, whether due to fraud or error.
Our responsibilities for the review of the Non-financial Information
Our responsibility is to plan and perform the assurance engagement in a manner that allows us to obtain sufficient and appropriate assurance evidence for our conclusion.
Procedures performed in an assurance engagement to obtain a limited level of assurance are aimed at determining the plausibility of information and are less extensive than a reasonable assurance engagement. The level of assurance obtained in review engagements is therefore substantially less than the level of assurance obtained in an audit engagement.
Misstatements can arise from fraud or errors and are considered material if, individually or in the aggregate, they could reasonably be expected to influence the decisions of users taken on the basis of the Non-financial Information. The materiality affects the nature, timing and extent of our review procedures and the evaluation of the effect of identified misstatements on our conclusion.
We apply the 'Nadere voorschriften Kwaliteitssystemen' (Regulations on quality management systems) and accordingly maintain a comprehensive system of quality control including documented policies and procedures regarding compliance with ethical requirements, professional standards and applicable legal and regulatory requirements.
We have exercised professional judgement and have maintained professional scepticism throughout the review, in accordance with the Dutch Standard 3810N, ethical requirements and independence requirements.
Our review engagement included:
|
•
|
Performing an analysis of the external environment and obtaining an understanding of relevant social themes and issues, and the characteristics of the organization;
|
|
•
|
Evaluating the appropriateness of the reporting criteria used and their consistent application, including the evaluation of the results of the stakeholders' dialogue and the reasonableness of estimates made by management and related disclosures in the Non-Financial Information;
|
|
•
|
Obtaining an understanding of the reporting processes for the sustainability information, including obtaining a general understanding of internal control relevant to our review;
|
|
•
|
Identifying areas of the sustainability information with a higher risk of misleading or unbalanced information or material misstatements, whether due to fraud or error. Designing and performing further assurance procedures aimed at determining the plausibility of the sustainability information responsive to this risk analysis. These procedures included among others:
|
|
–
|
Interviewing relevant staff at corporate level responsible for the corporate social responsibility strategy and policy.
|
|
–
|
Interviews with relevant staff responsible for providing the information in the Non-financial Information, carrying out internal control procedures on the data and consolidating the data in the Non-financial Information.
|
|
–
|
Obtaining assurance information that the sustainability information reconciles with underlying records of the company;
|
|
–
|
Reviewing, on a limited test basis, relevant internal and external documentation;
|
|
–
|
An analytical review of the data and trends submitted for consolidation at corporate level.
|
|
•
|
Evaluating the presentation, structure and content of the sustainability information;
|
|
•
|
To consider whether the sustainability information as a whole, including the disclosures, reflects the purpose of the reporting criteria used.
|
We communicate with the Supervisory Board regarding, among other matters, the planned scope and timing of the review and significant findings, including any significant findings in internal control that we identify during our review.
Rotterdam, the Netherlands
February 5, 2019
KPMG Accountants N.V.
J. van Delden RA
ASML INTEGRATED REPORT 2018
172
ASML INTEGRATED REPORT 2018
173

ASML INTEGRATED REPORT 2018
174
Appendix - Board of Management and Supervisory Board Remuneration
The remuneration of the BoM for the financial year
2018
is based upon the Remuneration Policy. The SB ensures that the policy and its implementation are linked to the company’s objectives.
Over
2018
, the STI will result in a cash payout of 117.5 percent of the target payout. The two non-financial performance criteria (Technology Leadership Index and Market Position) were both achieved between target and maximum performance level. For the financial performance criteria, the SB at the beginning of the year chose the following three measures for the 2018 performance year: 1. EBIT Margin %, 2. Number of EUV Shipments, and 3. Free Cash Flow. The achievement over 2018 for these measures was as follows (expressed as payout percentage of target payout): EBIT margin 107 percent of target; EUV shipments 100 percent of target, and Free Cash Flow 150 percent of target. The total STI outcome results in a cash payout of EUR 3.3 million, representing 76.4 percent of the base salary of the BoM.
At the beginning of 2019, the SB decided to apply the following three financial performance measures for 2019: 1. EBIT Margin %, 2. EUV Gross Margin % (instead of EUV shipments), and 3. Free Cash Flow.
Share ownership guidelines
All members of the BoM complied with the share ownership guidelines as incorporated in the Remuneration Policy, except Mr. Wennink, who dropped just below the three times base salary requirement. This was due to the sudden and rapid share price decline at the end of 2018 as a result of negative market sentiment for the semiconductor sector. This will be remediated through the vesting of shares in early 2019.
Internal pay ratio
1
The pay ratio of CEO compensation compared to the average employee compensation during
2018
is
33
:1. Last year the ratio was 32:1.
This ratio consists of the CEO’s total direct compensation during
2018
of
EUR 3,284,747
as reported in the Total direct compensation, pension and other benefits table in this appendix, compared to the average compensation of all employees (equal to
EUR 100 thousand
). The average compensation of all employees was calculated from the numbers as reported in
Consolidated Financial Statements - Notes to the Consolidated Financial Statements - Note 24 Selected operating expenses and additional information
(wages and salaries + share-based payments) / average number of payroll employees =
EUR 1,824 million
/
18,204
=
EUR 100 thousand
.
Changes to the Board of Management
Mr. Nickl stepped down from his position with ASML as of the 2018 AGM, completing his term. A pro-rated compensation was applied for the period January through April 2018. He is replaced by Mr. Dassen, effective as per June 1, 2018. Mr. Fouquet was appointed to the BoM on April 1, 2018.
ASML INTEGRATED REPORT 2018
175
|
1.
|
This ratio is prepared in accordance with the Dutch Corporate Governance Code and has not been prepared to comply the Pay Ratio Disclosure requirements under SEC regulations.
|
Total direct compensation, pension and other benefits
The remuneration of key management personnel, comprising of members of the BoM in
2018
,
2017
and
2016
was as follows:
|
|
|
|
Fixed
|
|
Short-term (variable)
|
|
|
Long-term (variable)
|
|
|
Total Direct Compensation
|
|
Other
|
Total Remuneration
|
|
|||
|
Board of
Management |
Financial
Year |
|
Base salary
|
|
STI (Cash) |
|
|
LTI (share awards)
|
|
1
|
|
|
Pension
|
|
Other benefits
and expense reimbursement |
|
|
|
|
|
EUR
|
|
EUR
|
|
|
EUR
|
|
|
EUR
|
|
EUR
|
|
EUR
|
|
EUR
|
|
||
|
P.T.F.M. Wennink
|
2018
|
|
978,000
|
|
747,018
|
|
|
1,559,729
|
|
2
|
3,284,747
|
|
203,306
|
|
52,837
|
|
3,540,890
|
|
|
2017
|
|
978,000
|
|
869,002
|
|
|
1,471,106
|
|
3
|
3,318,108
|
|
169,742
|
|
51,263
|
|
3,539,113
|
|
|
|
|
2016
|
|
978,000
|
|
782,498
|
|
|
1,473,162
|
|
4
|
3,233,660
|
|
173,030
|
|
50,823
|
|
3,457,513
|
|
|
M.A. van den Brink
|
2018
|
|
978,000
|
|
747,018
|
|
|
1,559,729
|
|
2
|
3,284,747
|
|
203,306
|
|
50,994
|
|
3,539,047
|
|
|
2017
|
|
978,000
|
|
869,002
|
|
|
1,471,106
|
|
3
|
3,318,108
|
|
169,742
|
|
50,014
|
|
3,537,864
|
|
|
|
|
2016
|
|
978,000
|
|
782,498
|
|
|
1,478,790
|
|
4
|
3,239,288
|
|
173,030
|
|
49,786
|
|
3,462,104
|
|
|
W.U. Nickl
7
|
2018
|
|
220,333
|
|
168,296
|
|
|
969,576
|
|
2,6
|
1,358,205
|
|
24,840
|
|
19,215
|
|
1,402,260
|
|
|
|
2017
|
|
661,000
|
|
587,332
|
|
|
649,741
|
|
3,5,6
|
1,898,073
|
|
66,724
|
|
46,745
|
|
2,011,542
|
|
|
|
2016
|
|
661,000
|
|
528,866
|
|
|
2,103,103
|
|
5
|
3,292,969
|
|
67,890
|
|
46,498
|
|
3,407,357
|
|
|
F.J. van Hout
|
2018
|
|
661,000
|
|
504,887
|
|
|
908,043
|
|
2
|
2,073,930
|
|
114,453
|
|
43,691
|
|
2,232,074
|
|
|
|
2017
|
|
661,000
|
|
587,332
|
|
|
918,950
|
|
3
|
2,167,282
|
|
113,950
|
|
42,966
|
|
2,324,198
|
|
|
|
2016
|
|
661,000
|
|
528,866
|
|
|
1,009,870
|
|
4
|
2,199,736
|
|
115,649
|
|
44,801
|
|
2,360,186
|
|
|
F.J.M.
Schneider-
Maunoury
|
2018
|
|
661,000
|
|
504,887
|
|
|
914,440
|
|
2
|
2,080,327
|
|
114,453
|
|
30,794
|
|
2,225,574
|
|
|
2017
|
|
661,000
|
|
587,332
|
|
|
913,769
|
|
3
|
2,162,101
|
|
113,950
|
|
31,654
|
|
2,307,705
|
|
|
|
2016
|
|
661,000
|
|
528,866
|
|
|
991,216
|
|
4
|
2,181,082
|
|
88,982
|
|
31,405
|
|
2,301,469
|
|
|
|
R.J.M. Dassen
7
|
2018
|
|
385,583
|
|
294,517
|
|
|
148,830
|
|
|
828,930
|
|
53,072
|
|
27,848
|
|
909,850
|
|
|
C.D. Fouquet
7
|
2018
|
|
495,750
|
|
378,665
|
|
|
191,400
|
|
|
1,065,815
|
|
45,319
|
|
32,324
|
|
1,143,458
|
|
|
1.
|
The remuneration reported as part of the LTI (share awards) is based on cost incurred under US GAAP and IFRS-EU. The costs of share awards are charged to the
Consolidated Statements of Operations
over the 3 year vesting period based on the maximum achievable number of share awards. Therefore the costs for e.g. the financial year 2018 include costs of the BoM performance share plan 2018, 2017 and 2016. Furthermore, the difference between the amount based on the maximum achievable number of shares awards and the amount based on the actual number of share awards that vest, is released to the
Consolidated Statements of Operations
in the financial year in which the share awards vest.
|
|
2.
|
The remuneration reported as part of the LTI (share awards) for the year 2018 includes an adjustment for the BoM performance share plan 2015 based on the actual number of share awards vested in 2018. The adjustment for Mr. Wennink, Mr. van den Brink, Mr. Nickl, Mr. van Hout and Mr. Schneider-Maunoury amounts to EUR -394,434, EUR -394,434, EUR -253,072, EUR -264,593, EUR -257,605, respectively.
|
|
3.
|
The remuneration reported as part of the LTI (share awards) for the year 2017 includes an adjustment for the BoM performance share plan 2014 based on the actual number of share awards vested in 2017. The adjustment for Mr. Wennink, Mr. van den Brink, Mr. Nickl, Mr. van Hout and Mr. Schneider-Maunoury amounts to EUR -271,533, EUR -271,533, EUR -963,017, EUR -182,095, EUR -177,459, respectively.
|
|
4.
|
The remuneration reported as part of the LTI (share awards) for the year 2016 includes an adjustment for the BoM performance share plan 2013 based on the actual number of share awards vested in 2016. The adjustment for Mr. Wennink, Mr. van den Brink, Mr. van Hout and Mr. Schneider-Maunoury amounts to EUR -97,905, EUR -103,729, EUR -85,757, EUR -83,482, respectively
.
|
|
5.
|
The remuneration reported as part of the LTI (share awards) for the years 2016 and 2017 includes a compensation for Mr. Nickl for part of his shares and stock options that were forfeited when he left his former company. This compensation took the form of a maximum of 56,000 performance related shares awarded in 2014, subject to performance conditions, a three year vesting period and a two year holding period as applicable under the Remuneration Policy.
|
|
6.
|
The remuneration reported over 2018 includes an accelerated expense of EUR 1,222,648 of the LTI (share awards) for the years 2015, 2016, 2017 and 2018 resulting from the amended requisite service period. The remuneration reported over 2017 includes an accelerated expense EUR 452,203 for the years 2015, 2016, and 2017.
|
|
7.
|
As per the 2018 AGM Roger Dassen and Christophe Fouquet were appointed as members of the BoM. Roger Dassen replaces Wolfgang Nickl who stepped down from his position with ASML as per the 2018 AGM.
Their base salary is calculated pro-rata for the time served as BoM members.
|
ASML INTEGRATED REPORT 2018
176
The table below provides a comprehensive overview of conditional share awards that are granted in the performance period and unconditional share awards that are included in the holding period or that have become freely tradable in
2018
.
Details of performance shares granted to members of the BoM are as follows:
|
Board of
Management |
Grant date
|
|
Full
control |
Number of shares at grant date
|
Fair value at grant date
|
|
Vesting date
|
Number of shares at
vesting date 1 |
|
End of lock-up date
|
||
|
Status
|
||||||||||||
|
P.T.F.M.
Wennink
|
1/19/2018
|
Conditional
|
No
|
13,056
|
|
|
166.90
|
|
1/19/2021
|
—
|
|
1/19/2023
|
|
1/20/2017
|
Conditional
|
No
|
20,243
|
|
|
114.05
|
|
1/20/2020
|
—
|
|
1/20/2022
|
|
|
|
1/22/2016
|
Conditional
|
No
|
16,579
|
|
|
83.60
|
|
1/22/2019
|
—
|
|
1/22/2021
|
|
|
1/23/2015
|
Unconditional
|
No
|
16,710
|
|
|
94.43
|
|
1/23/2018
|
12,533
|
|
1/23/2020
|
|
|
1/24/2014
|
Unconditional
|
No
|
19,280
|
|
|
64.39
|
|
1/24/2017
|
15,063
|
|
1/24/2019
|
|
|
4/19/2013
|
Unconditional
|
No
|
35,035
|
|
|
55.47
|
|
4/19/2016
|
33,270
|
|
4/19/2018
|
|
M.A. van
den Brink
|
1/19/2018
|
Conditional
|
No
|
13,056
|
|
|
166.90
|
|
1/19/2021
|
—
|
|
1/19/2023
|
|
1/20/2017
|
Conditional
|
No
|
20,243
|
|
|
114.05
|
|
1/20/2020
|
—
|
|
1/20/2022
|
|
|
|
1/22/2016
|
Conditional
|
No
|
16,579
|
|
|
83.60
|
|
1/22/2019
|
—
|
|
1/22/2021
|
|
|
1/23/2015
|
Unconditional
|
No
|
16,710
|
|
|
94.43
|
|
1/23/2018
|
12,533
|
|
1/23/2020
|
|
|
1/24/2014
|
Unconditional
|
No
|
19,280
|
|
|
64.39
|
|
1/24/2017
|
15,063
|
|
1/24/2019
|
|
|
4/19/2013
|
Unconditional
|
No
|
37,111
|
|
|
55.47
|
|
4/19/2016
|
35,241
|
|
4/19/2018
|
|
W.U. Nickl
|
1/19/2018
|
Conditional
|
No
|
2,501
|
|
|
166.90
|
|
1/19/2021
|
—
|
|
1/19/2023
|
|
|
1/20/2017
|
Conditional
|
No
|
11,629
|
|
|
114.05
|
|
1/20/2020
|
—
|
|
1/20/2022
|
|
|
1/22/2016
|
Conditional
|
No
|
11,205
|
|
|
83.60
|
|
1/22/2019
|
—
|
|
1/22/2021
|
|
|
1/23/2015
|
Unconditional
|
No
|
10,720
|
|
|
94.43
|
|
1/23/2018
|
8,040
|
|
1/23/2020
|
|
|
1/24/2014
|
Unconditional
|
No
|
12,373
|
|
|
64.39
|
|
1/24/2017
|
9,669
|
|
1/24/2019
|
|
|
1/24/2014
|
Unconditional
|
No
|
56,000
|
|
2
|
64.39
|
|
1/24/2017
|
43,748
|
|
1/24/2019
|
|
F.J. van Hout
|
1/19/2018
|
Conditional
|
No
|
7,501
|
|
|
166.90
|
|
1/19/2021
|
—
|
|
1/19/2023
|
|
|
1/20/2017
|
Conditional
|
No
|
11,629
|
|
|
114.05
|
|
1/20/2020
|
—
|
|
1/20/2022
|
|
|
1/22/2016
|
Conditional
|
No
|
11,205
|
|
|
83.60
|
|
1/22/2019
|
—
|
|
1/22/2021
|
|
|
1/23/2015
|
Conditional
|
No
|
11,210
|
|
|
94.43
|
|
1/23/2018
|
8,408
|
|
1/23/2020
|
|
|
1/24/2014
|
Unconditional
|
No
|
12,929
|
|
|
64.39
|
|
1/24/2017
|
10,101
|
|
1/24/2019
|
|
|
4/19/2013
|
Unconditional
|
No
|
30,681
|
|
|
55.47
|
|
4/19/2016
|
29,135
|
|
4/19/2018
|
|
F.J.M.
Schneider-
Maunoury
|
1/19/2018
|
Conditional
|
No
|
7,501
|
|
|
166.90
|
|
1/19/2021
|
—
|
|
1/19/2023
|
|
1/20/2017
|
Conditional
|
No
|
11,629
|
|
|
114.05
|
|
1/20/2020
|
—
|
|
1/20/2022
|
|
|
1/22/2016
|
Conditional
|
No
|
11,205
|
|
|
83.60
|
|
1/22/2019
|
—
|
|
1/22/2021
|
|
|
|
1/23/2015
|
Unconditional
|
No
|
10,912
|
|
|
94.43
|
|
1/23/2018
|
8,184
|
|
1/23/2020
|
|
|
1/24/2014
|
Unconditional
|
No
|
12,599
|
|
|
64.39
|
|
1/24/2017
|
9,843
|
|
1/24/2019
|
|
|
4/19/2013
|
Unconditional
|
No
|
29,877
|
|
|
55.47
|
|
4/19/2016
|
28,372
|
|
4/19/2018
|
|
R.J.M. Dassen
3
|
7/20/2018
|
Conditional
|
No
|
4,376
|
|
|
188.45
|
|
1/19/2021
|
—
|
|
1/19/2023
|
|
C.D. Fouquet
3
|
7/20/2018
|
Conditional
|
No
|
5,626
|
|
|
188.45
|
|
1/19/2021
|
—
|
|
1/19/2023
|
|
|
|
|
|
|
|
|
|
|
|
|
|
|
|
1.
|
The number of shares represent the gross compensation, before any tax payments using shares is performed. Vested performance shares may be partially sold to pay for taxes over the performance shares (‘sell to cover’), which is in accordance with applicable tax regulations and our Remuneration Policy.
|
|
2.
|
ASML compensated part of the shares and stock options that were forfeited when Mr. Nickl left his former company in the US. This compensation takes the form of a maximum of 56,000 performance related shares awarded in 2014, subject to the performance conditions, a three year vesting period and a two year holding period as applicable under the Remuneration Policy.
|
|
3.
|
As per the 2018 AGM Roger Dassen and Christophe Fouquet were appointed as members of the BoM. Roger Dassen replaces Wolfgang Nickl who stepped down from his position with ASML as per the 2018 AGM.
Additionally Roger Dassen will be awarded a maximum of 20,000 performance shares in 2019 subject to the performance conditions, a three year vesting period and a two year holding period as applicable under the Remuneration Policy.
|
ASML INTEGRATED REPORT 2018
177
The following table sets forth an overview of the remuneration awarded to SB members in
2018
and
2017
(in EUR):
|
Year ended December 31, 2018
|
Total
|
|
Supervisory
Board
|
|
Audit
Committee
|
|
Remuneration
Committee
|
|
Selection and Nomination
Committee
|
|
Technology and Strategy Committee
|
|
Other
|
|
|||||||
|
Gerard J. Kleisterlee
|
138,000
|
|
100,000
|
|
|
13,000
|
|
1
|
—
|
|
|
15,000
|
|
|
10,000
|
|
|
—
|
|
|
|
|
Douglas A. Grose
|
115,000
|
|
90,000
|
|
|
—
|
|
|
—
|
|
|
10,000
|
|
|
15,000
|
|
|
—
|
|
|
|
|
Pauline F.M. van der Meer Mohr
|
27,667
|
|
20,000
|
|
3
|
4,333
|
|
2
|
—
|
|
|
3,333
|
|
2
|
—
|
|
|
—
|
|
|
|
|
Terri L. Kelly
|
60,000
|
|
53,333
|
|
3
|
|
|
|
6,667
|
|
|
|
|
|
|
|
|
|
|
|
|
|
Antoinette (Annet) P. Aris
|
80,000
|
|
60,000
|
|
|
—
|
|
|
3,333
|
|
2
|
6,667
|
|
2
|
10,000
|
|
|
—
|
|
|
|
|
Rolf-Dieter Schwalb
|
88,000
|
|
60,000
|
|
|
13,000
|
|
|
15,000
|
|
|
—
|
|
|
—
|
|
|
—
|
|
|
|
|
Clara (Carla) M.S. Smits-Nusteling
|
80,000
|
|
60,000
|
|
|
20,000
|
|
|
—
|
|
|
—
|
|
|
—
|
|
|
—
|
|
|
|
|
Johannes (Hans) M.C. Stork
|
100,000
|
|
80,000
|
|
|
—
|
|
|
10,000
|
|
|
—
|
|
|
10,000
|
|
|
—
|
|
|
|
|
Wolfgang H. Ziebart
|
82,000
|
|
60,000
|
|
|
8,667
|
|
2
|
3,333
|
|
2
|
—
|
|
|
10,000
|
|
|
—
|
|
|
|
|
Total
|
770,667
|
|
583,333
|
|
|
59,000
|
|
|
38,334
|
|
|
35,000
|
|
|
55,000
|
|
|
—
|
|
|
|
|
Year ended December 31, 2017
|
Total
|
|
Supervisory
Board |
|
|
Audit
Committee |
|
|
Remuneration
Committee |
|
|
Selection and Nomination
Committee |
|
|
Technology and Strategy Committee
|
|
|
Other
|
|
|
|
|
Gerard J. Kleisterlee
|
134,750
|
|
98,750
|
|
|
12,250
|
|
1
|
—
|
|
|
14,250
|
|
|
9,500
|
|
|
—
|
|
|
|
|
Douglas A. Grose
|
112,500
|
|
87,500
|
|
|
—
|
|
|
—
|
|
|
9,500
|
|
|
14,250
|
|
|
1,250
|
|
4
|
|
|
Pauline F.M. van der Meer Mohr
|
81,750
|
|
60,000
|
|
|
12,250
|
|
|
—
|
|
|
9,500
|
|
|
—
|
|
|
—
|
|
|
|
|
Antoinette (Annet) P. Aris
|
79,000
|
|
60,000
|
|
|
—
|
|
|
9,500
|
|
|
—
|
|
|
9,500
|
|
|
—
|
|
|
|
|
Rolf-Dieter Schwalb
|
86,500
|
|
60,000
|
|
|
12,250
|
|
|
14,250
|
|
|
—
|
|
|
—
|
|
|
—
|
|
|
|
|
Clara (Carla) M.S. Smits-Nusteling
|
78,750
|
|
60,000
|
|
|
18,750
|
|
|
—
|
|
|
—
|
|
|
—
|
|
|
—
|
|
|
|
|
Johannes (Hans) M.C. Stork
|
99,000
|
|
80,000
|
|
|
—
|
|
|
9,500
|
|
|
—
|
|
|
9,500
|
|
|
—
|
|
|
|
|
Wolfgang H. Ziebart
|
79,000
|
|
60,000
|
|
|
—
|
|
|
9,500
|
|
|
—
|
|
|
9,500
|
|
|
—
|
|
|
|
|
Total
|
751,250
|
|
566,250
|
|
|
55,500
|
|
|
42,750
|
|
|
33,250
|
|
|
52,250
|
|
|
1,250
|
|
|
|
|
|
|
|
|
|
|
|
|
|
|
|
|
|
|
|
|
|
|
|
|
|
|
|
1.
|
During 2018 and 2017 Gerard J. Kleisterlee was invited as a guest to the Audit Committee and received an observer fee.
|
|
2.
|
Amount differs from the annual compensation due to the movement of members between committees.
|
|
3.
|
During 2018 Terri L. Kelly succeeded Pauline F.M. van der Meer Mohr as a member of the SB.
|
|
4.
|
In the first quarter of 2017 the Vice Chairman of the SB received EUR 1,250 in addition to the annual fixed fee.
|
Additional reimbursements
In addition, ASML paid a net cost allowance amounting to EUR 1,380
to each SB member, and EUR 1,980 to the Chairman of the SB in
2018
.
Loans
The Company has not granted any (personal) loans to, nor has it granted any guarantees or the like in favor of, any of the members of the SB.
Total remuneration
The annual remuneration for the members of the BoM and SB members during
2018
amounts to
EUR 15.8 million
(
2017
:
EUR 14.5 million
).
ASML INTEGRATED REPORT 2018
178
Appendix - Selected Financial Data
The following selected consolidated financial data should be read in conjunction with our
Management Board Report
a
nd
Consolidated Financial Statements
.
Five-year financial summary
|
Year ended December 31
|
2014
|
|
2015
|
|
2016
1
|
|
2017
1
|
|
2018
|
|
|
(in millions, except per share data)
|
EUR
|
|
EUR
|
|
EUR
|
|
EUR
|
|
EUR
|
|
|
|
|
|
|
|
|
|||||
|
Consolidated Statements of Operations data
|
|
|
|
|
|
|||||
|
Net sales
|
5,856.3
|
|
6,287.4
|
|
6,875.1
|
|
8,962.7
|
|
10,944.0
|
|
|
Cost of sales
|
(3,259.9
|
)
|
(3,391.7
|
)
|
(3,729.8
|
)
|
(4,942.5
|
)
|
(5,914.8
|
)
|
|
Gross profit
|
2,596.4
|
|
2,895.7
|
|
3,145.3
|
|
4,020.2
|
|
5,029.2
|
|
|
|
|
|
|
|
|
|
|
|
|
|
|
Other income
|
81.0
|
|
83.2
|
|
93.8
|
|
95.8
|
|
—
|
|
|
Research and development costs
|
(1,074.1
|
)
|
(1,068.1
|
)
|
(1,105.8
|
)
|
(1,259.7
|
)
|
(1,575.9
|
)
|
|
Selling, general and administrative costs
|
(321.1
|
)
|
(345.7
|
)
|
(374.8
|
)
|
(416.6
|
)
|
(488.0
|
)
|
|
Income from operations
|
1,282.2
|
|
1,565.1
|
|
1,758.5
|
|
2,439.7
|
|
2,965.3
|
|
|
|
|
|
|
|
|
|
|
|
|
|
|
Interest and other, net
|
(8.6
|
)
|
(16.5
|
)
|
33.7
|
|
(50.3
|
)
|
(28.3
|
)
|
|
Income before income taxes
|
1,273.6
|
|
1,548.6
|
|
1,792.2
|
|
2,389.4
|
|
2,937.0
|
|
|
|
|
|
|
|
|
|
|
|
|
|
|
Provision for income taxes
|
(77.0
|
)
|
(161.4
|
)
|
(234.4
|
)
|
(306.0
|
)
|
(351.6
|
)
|
|
Income after income taxes
|
1,196.6
|
|
1,387.2
|
|
1,557.8
|
|
2,083.4
|
|
2,585.4
|
|
|
|
|
|
|
|
|
|
|
|
|
|
|
Profit (loss) related to equity method investments
|
—
|
|
—
|
|
—
|
|
(16.7
|
)
|
6.2
|
|
|
Net income
|
1,196.6
|
|
1,387.2
|
|
1,557.8
|
|
2,066.7
|
|
2,591.6
|
|
|
|
|
|
|
|
|
|||||
|
Earnings per share data
|
|
|
|
|
|
|||||
|
Basic net income per ordinary share
|
2.74
|
|
3.22
|
|
3.66
|
|
4.81
|
|
6.10
|
|
|
Diluted net income per ordinary share
2
|
2.72
|
|
3.21
|
|
3.64
|
|
4.79
|
|
6.08
|
|
|
|
|
|
|
|
|
|||||
|
Number of ordinary shares used in computing per share amounts (in millions)
|
|
|
|
|
|
|||||
|
Basic
|
437.1
|
|
430.6
|
|
425.6
|
|
429.8
|
|
424.9
|
|
|
Diluted
2
|
439.7
|
|
432.6
|
|
427.7
|
|
431.6
|
|
426.4
|
|
|
1.
|
As of January 1, 2018, ASML has adopted the new Revenue Recognition Standard (ASC 606) and Lease Standard (ASC 842).
The comparative numbers have been adjusted to reflect these changes in accounting policy.
|
|
2.
|
The calculation of diluted net income per ordinary share assumes the exercise of options issued under our stock option plans and the issuance of shares under our share plans for periods in which exercises or issuances would have a dilutive effect. The calculation of diluted net income per ordinary share does not assume exercise of options when exercise would be anti-dilutive.
|
ASML INTEGRATED REPORT 2018
179
Five-year financial summary
|
As of and for the year ended December 31
|
2014
|
|
2015
|
|
2016
1
|
|
2017
1
|
|
2018
|
|
|||||
|
(in millions)
|
EUR
|
|
EUR
|
|
EUR
|
|
EUR
|
|
EUR
|
|
|||||
|
|
|
|
|
|
|
|
|
||||||||
|
Consolidated Balance Sheets data
|
|
|
|
|
|
||||||||||
|
Cash and cash equivalents
|
2,419.5
|
|
2,458.7
|
|
2,906.9
|
|
2,259.0
|
|
3,121.1
|
|
|||||
|
Short-term investments
|
334.9
|
|
950.0
|
|
1,150.0
|
|
1,029.3
|
|
913.3
|
|
|||||
|
Working capital
2
|
4,257.4
|
|
4,600.4
|
|
5,434.9
|
|
5,715.8
|
|
6,739.5
|
|
|||||
|
Total assets
|
12,203.9
|
|
13,295.0
|
|
17,155.0
|
|
18,188.9
|
|
20,136.9
|
|
|||||
|
Long-term debt
3
|
1,154.1
|
|
1,129.7
|
|
3,319.5
|
|
3,000.1
|
|
3,026.5
|
|
|||||
|
Shareholders’ equity
|
7,512.6
|
|
8,388.8
|
|
9,972.4
|
|
10,776.4
|
|
11,641.0
|
|
|||||
|
Issued and outstanding shares
|
39.4
|
|
38.8
|
|
39.4
|
|
38.8
|
|
38.6
|
|
|||||
|
Consolidated Statements of Cash Flows data
|
|
|
|
|
|
||||||||||
|
Depreciation and amortization
4
|
254.6
|
|
296.9
|
|
356.9
|
|
417.5
|
|
422.7
|
|
|||||
|
Net cash provided by operating activities
|
1,025.2
|
|
2,025.5
|
|
1,665.9
|
|
1,818.3
|
|
3,072.7
|
|
|||||
|
Purchase of property, plant and equipment
5
|
(358.3
|
)
|
(371.8
|
)
|
(316.3
|
)
|
(338.9
|
)
|
(574.0
|
)
|
|||||
|
Purchase of intangible assets
|
(3.0
|
)
|
(1.1
|
)
|
(8.4
|
)
|
(19.1
|
)
|
(35.5
|
)
|
|||||
|
Purchase of short-term investments
|
(504.7
|
)
|
(950.0
|
)
|
(2,520.0
|
)
|
(1,129.3
|
)
|
(918.1
|
)
|
|||||
|
Maturity of short-term investments
|
849.8
|
|
334.9
|
|
2,320.0
|
|
1,250.0
|
|
1,034.1
|
|
|||||
|
Cash from (used for) derivative financial instruments
|
—
|
|
(171.9
|
)
|
(15.0
|
)
|
27.0
|
|
(2.4
|
)
|
|||||
|
Loans issued and other investments
|
—
|
|
—
|
|
(7.4
|
)
|
(0.6
|
)
|
(1.0
|
)
|
|||||
|
Repayment on loans
|
—
|
|
—
|
|
—
|
|
1.6
|
|
5.4
|
|
|||||
|
Acquisition of equity method investments
|
—
|
|
—
|
|
—
|
|
(1,019.7
|
)
|
—
|
|
|||||
|
Acquisition of subsidiary (net of cash acquired)
|
—
|
|
—
|
|
(2,641.3
|
)
|
—
|
|
—
|
|
|||||
|
Net cash used in investing activities
|
(16.2
|
)
|
(1,159.9
|
)
|
(3,188.4
|
)
|
(1,229.0
|
)
|
(491.5
|
)
|
|||||
|
Dividend paid
|
(268.0
|
)
|
(302.3
|
)
|
(445.9
|
)
|
(516.7
|
)
|
(597.1
|
)
|
|||||
|
Purchase of treasury shares
|
(700.0
|
)
|
(564.9
|
)
|
(400.0
|
)
|
(500.0
|
)
|
(1,146.2
|
)
|
|||||
|
Net proceeds from issuance of shares
|
39.7
|
|
|
33.2
|
|
582.7
|
|
6
|
50.6
|
|
21.8
|
|
|||
|
Net proceeds from issuance of notes
|
—
|
|
—
|
|
2,230.6
|
|
7
|
—
|
|
—
|
|
|
|||
|
Repurchase of notes
|
—
|
|
—
|
|
—
|
|
—
|
|
—
|
|
|||||
|
Repayment of debt
|
(4.1
|
)
|
(3.6
|
)
|
(4.7
|
)
|
|
(243.0
|
)
|
|
(2.8
|
)
|
|||
|
Tax benefit (deficit) from share-based payments
|
3.1
|
|
3.7
|
|
0.9
|
|
|
—
|
|
|
—
|
|
|||
|
Net cash from (used in) financing activities
|
(928.4
|
)
|
(833.9
|
)
|
1,963.6
|
|
(1,209.1
|
)
|
(1,724.3
|
)
|
|||||
|
Net increase (decrease) in cash and cash equivalents
|
88.8
|
|
39.2
|
|
448.2
|
|
(647.9
|
)
|
862.1
|
|
|||||
|
1.
|
As of January 1, 2018, ASML has adopted the new Revenue Recognition Standard (ASC 606) and Lease Standard (ASC 842).
The comparative numbers have been adjusted to reflect these changes in accounting policy.
|
|
2.
|
Working capital is calculated as the difference between total current assets and total current liabilities.
|
|
3.
|
Long-term debt includes the current portion of long-term debt.
|
|
4.
|
In
2018
,
depreciation and amortization includes
EUR 315.4 million
of
depreciation of property, plant and equipment
(
2017
:
EUR 308.2 million
,
2016
:
EUR 290.8 million
,
2015
:
EUR 243.0 million
and
2014
:
EUR 209.5 million
),
EUR 103.7 million
of
amortization of intangible assets
(
2017
:
EUR 105.5 million
,
2016
:
EUR 63.5 million
,
2015
:
EUR 51.2 million
and
2014
:
EUR 43.9 million
) and
EUR 3.6 million
of
amortization of underwriting commissions and discount related to the bonds and credit facility
(
2017
:
EUR 3.8 million
,
2016
:
EUR 2.6 million
,
2015
:
EUR 2.7 million
and
2014
:
EUR 1.2 million
).
|
|
5.
|
In
2018
, an amount of
EUR 59.8 million
(
2017
:
EUR 13.4 million
,
2016
:
EUR 21.6 million
,
2015
:
EUR 91.0 million
,
2014
:
EUR 95.5 million
)
of the additions in property, plant and equipment relates to non-cash transfers from inventory. Since the transfers between inventory and property, plant and equipment are non-cash events, these are not reflected in
the
Consolidated Statements of Cash Flows
data. For further details see
Consolidated Financial Statements - Notes to the Consolidated Financial Statements - Note 13 Property, plant and equipment
.
|
|
6.
|
In 2016, net proceeds from issuance of shares include an amount of
EUR 536.6 million
which is included in the consideration transferred for the acquisition of HMI.
|
|
7.
|
In 2016, net proceeds from issuance of notes relate to the total cash proceeds of
EUR 2,230.6 million
(net of incurred transaction costs) from the issuance of our
EUR 500 million
0.625 percent
senior notes due
2022
, our
EUR 1,000 million
1.375 percent
senior notes due
2026
and our
EUR 750 million
1.625 percent
senior notes due
2027
|
ASML INTEGRATED REPORT 2018
180
Five-year financial summary
|
As of and for the year ended December 31
|
2014
|
|
2015
|
|
2016
1
|
|
2017
1
|
|
2018
|
|
|||||
|
|
|
|
|
|
|
|
|
|
|
|
|||||
|
Ratios and other data
|
|
|
|
|
|
||||||||||
|
Gross profit as a percentage of net sales
|
44.3
|
|
46.1
|
|
45.7
|
|
44.9
|
|
46.0
|
|
|||||
|
Income from operations as a percentage of net sales
|
21.9
|
|
24.9
|
|
25.6
|
|
27.2
|
|
27.1
|
|
|||||
|
Net income as a percentage of net sales
|
20.4
|
|
22.1
|
|
22.7
|
|
23.1
|
|
23.7
|
|
|||||
|
Shareholders’ equity as a percentage of total assets
|
61.6
|
|
63.1
|
|
58.1
|
|
59.6
|
|
57.8
|
|
|||||
|
Income taxes as a percentage of income before income taxes
|
6.0
|
|
10.4
|
|
13.1
|
|
12.8
|
|
12.0
|
|
|||||
|
Sales of lithography systems (in units)
2
|
136
|
|
169
|
|
154
|
|
|
197
|
|
|
224
|
|
|||
|
Value of booked systems (in millions EUR)
3,4
|
4,902.2
|
|
4,639.0
|
|
5,396.3
|
|
9,357.2
|
|
8,180.7
|
|
|||||
|
Net bookings lithography systems (in units)
2,3,4
|
157
|
|
165
|
|
160
|
|
255
|
|
241
|
|
|||||
|
Number of payroll employees (in FTEs)
|
11,318
|
|
12,168
|
|
13,991
|
|
16,219
|
|
20,044
|
|
|||||
|
Number of temporary employees (in FTEs)
|
2,754
|
|
2,513
|
|
2,656
|
|
2,997
|
|
3,203
|
|
|||||
|
Increase (decrease) net sales in percentage
|
11.6
|
|
7.4
|
|
9.3
|
|
30.4
|
|
22.1
|
|
|||||
|
Number of ordinary shares issued and outstanding
(in millions)
|
432.9
|
|
428.0
|
|
429.9
|
|
427.4
|
|
421.1
|
|
|||||
|
Closing ASML share price on Euronext Amsterdam
(in EUR)
|
89.50
|
|
82.55
|
|
106.65
|
|
145.15
|
|
137.16
|
|
|||||
|
Volatility 260 days as percentage of our shares listed on Euronext Amsterdam (in EUR)
5
|
27.49
|
|
33.62
|
|
25.47
|
|
18.84
|
|
29.60
|
|
|||||
|
Closing ASML share price on NASDAQ (in USD)
|
107.83
|
|
88.77
|
|
112.20
|
|
173.82
|
|
155.62
|
|
|||||
|
Volatility 260 days as percentage of our shares listed on NASDAQ (in USD)
6
|
26.01
|
|
28.94
|
|
26.85
|
|
21.80
|
|
35.74
|
|
|||||
|
Dividend per ordinary share (in EUR)
|
0.70
|
|
1.05
|
|
1.20
|
|
1.40
|
|
2.10
|
|
7
|
||||
|
Dividend per ordinary share (in USD)
|
0.76
|
|
8
|
1.21
|
|
8
|
1.28
|
|
8
|
1.74
|
|
8
|
2.40
|
|
7,9
|
|
1.
|
As of January 1, 2018, ASML has adopted the new Revenue Recognition Standard (ASC 606) and Lease Standard (ASC 842).
The comparative numbers have been adjusted to reflect these changes in accounting policy
, except for our systems net booking values. The comparative numbers for our systems net booking values have not been adjusted.
|
|
2.
|
Lithography systems do not include metrology and inspection systems.
|
|
3.
|
Our systems net bookings include all system sales orders for which written authorizations have been accepted (for EUV starting with the NXE:3350B and excluding the High NA systems).
|
|
4.
|
Our systems net bookings values for 2014, 2015, 2016, and 2017 are calculated without giving effect to the impact of adoption of the new Revenue Recognition Standard (ASC 606) and Lease Standard (ASC 842) which ASML adopted effective January 1, 2018.
|
|
5.
|
Volatility represents the variability in our share price on Euronext Amsterdam as measured over the 260 business days of each year presented (source: Bloomberg Finance LP).
|
|
6.
|
Volatility represents the variability in our share price on NASDAQ as measured over the 260 business days of each year presented (source: Bloomberg Finance LP).
|
|
7.
|
Subject to approval of the AGM to be held on
April 24, 2019
.
|
|
8.
|
The dividend per ordinary share in USD has been adjusted compared to the relevant Annual Reports on Form 20-F for such years to reflect the actual exchange rates at time of dividend payment.
|
|
9.
|
The exchange rate used to express the proposed dividend per ordinary share in USD is the exchange rate of USD/EUR
1.14
as of
Jan
uary 27, 2019
.
|
ASML INTEGRATED REPORT 2018
181
Appendix - Results of Operations 2017 Compared to 2016
Set out below our
Consolidated Statements of Operations
data for the years ended December 31,
2016
and
2017
:
|
Year ended December 31
|
2016
1
|
|
2017
1
|
|
|
(in millions)
|
EUR
|
|
EUR
|
|
|
Total net sales
|
6,875.1
|
|
8,962.7
|
|
|
Cost of sales
|
(3,729.8
|
)
|
(4,942.5
|
)
|
|
Gross profit
|
3,145.3
|
|
4,020.2
|
|
|
Other income
|
93.8
|
|
95.8
|
|
|
Research and development costs
|
(1,105.8
|
)
|
(1,259.7
|
)
|
|
Selling, general and administrative costs
|
(374.8
|
)
|
(416.6
|
)
|
|
Income from operations
|
1,758.5
|
|
2,439.7
|
|
|
Interest and other, net
|
33.7
|
|
(50.3
|
)
|
|
Income before income taxes
|
1,792.2
|
|
2,389.4
|
|
|
Provision for income taxes
|
(234.4
|
)
|
(306.0
|
)
|
|
Income after income taxes
|
1,557.8
|
|
2,083.4
|
|
|
Profit (loss) related to equity method investments
|
—
|
|
(16.7
|
)
|
|
Net income
|
1,557.8
|
|
2,066.7
|
|
|
1.
|
As of January 1, 2018, ASML has adopted the new Revenue Recognition Standard (ASC 606) and Lease Standard (ASC 842). The comparative numbers have been adjusted to reflect these changes in accounting policies, see Note 1 General information / summary of significant accounting policies.
|
Set out below are our
Consolidated Statements of Operations
data for the years ended December 31,
2016
and
2017
expressed as a percentage of our total net sales:
|
Year ended December 31
|
2016
1
|
|
2017
1
|
|
|
Total net sales
|
100.0
|
|
100.0
|
|
|
Cost of sales
|
(54.3
|
)
|
(55.1
|
)
|
|
Gross profit
|
45.7
|
|
44.9
|
|
|
Other income
|
1.4
|
|
1.1
|
|
|
Research and development costs
|
(16.1
|
)
|
(14.1
|
)
|
|
Selling, general and administrative costs
|
(5.4
|
)
|
(4.7
|
)
|
|
Income from operations
|
25.6
|
|
27.2
|
|
|
Interest and other, net
|
0.5
|
|
(0.5
|
)
|
|
Income before income taxes
|
26.1
|
|
26.7
|
|
|
Provision for income taxes
|
(3.4
|
)
|
(3.4
|
)
|
|
Income after income taxes
|
22.7
|
|
23.3
|
|
|
Profit (loss) related to equity method investments
|
—
|
|
(0.2
|
)
|
|
Net income
|
22.7
|
|
23.1
|
|
|
1.
|
As of January 1, 2018, ASML has adopted the new Revenue Recognition Standard (ASC 606) and Lease Standard (ASC 842). The comparative numbers have been adjusted to reflect these changes in accounting policies, see Note 1 General information / summary of significant accounting policies.
|
ASML INTEGRATED REPORT 2018
182
Net sales and gross profit
The following table shows a summary of net sales, units sold and gross profit for the years ended December 31,
2016
and
2017
:
|
Year ended December 31
|
2016
1
|
|
2017
1
|
|
|
(in millions EUR, unless otherwise indicated)
|
EUR
|
|
EUR
|
|
|
Total net sales
|
6,875.1
|
|
8,962.7
|
|
|
Net system sales
2
|
4,718.9
|
|
6,424.4
|
|
|
Net service and field option sales
2
|
2,156.2
|
|
2,538.3
|
|
|
Sale of lithography systems (in units)
3
|
154
|
|
197
|
|
|
Gross profit as a percentage of net sales
|
45.7
|
|
44.9
|
|
|
1.
|
As of January 1, 2018, ASML has adopted the new Revenue Recognition Standard (ASC 606) and Lease Standard (ASC 842). The comparative numbers have been adjusted to reflect these changes in accounting policies, see Note 1 General information / summary of significant accounting policies.
|
|
2.
|
As of January 1, 2017, ASML presents net sales with respect to metrology and inspection systems as part of net system sales instead of net service and field option sales.
The 2016 numbers have been adjusted to reflect this change in accounting policy.
|
|
3.
|
Lithography systems do not include metrology and inspection systems.
|
We had another record year in 2017, with contributions from each of our wide range of product offerings in Holistic Lithography solutions. It was also the year where the industry turned the corner on the introduction of EUV. We strengthened our partnership with Carl Zeiss AG by completing our acquisition of an indirect interest in Carl Zeiss SMT GmbH to secure the extension of EUV beyond the next decade.
Total net sales increased by
30.4 percent
, driven by an increase in net system sales of
36.1 percent
and an increase in net service and field option sales of
17.7 percent
in
2017
compared to
2016
. The increase in net system sales is mainly due to:
|
•
|
An increase from
4
EUV systems recognized in net system sales in
2016
to
11
EUV systems recognized in 2017.
|
|
•
|
An increase from
150
DUV systems recognized in net system sales in
2016
to
186
DUV systems recognized in 2017.
|
|
•
|
The inclusion of 12 months HMI net system sales in
2017
, whereas
2016
only included 2 months.
|
The increase in net service and field option sales is mainly driven by an increase in the sales of productivity and focus upgrade packages in combination with a growing installed base.
Gross profit increased by EUR
874.9 million
mainly due to an increase in sales.
Gross profit as a percentage of net sales decrease from
45.7
percent in
2016
to
44.9
percent in
2017
primarily driven by a shift in product mix of systems towards more high-end systems, partly offset by higher EUV systems sales. Due to the accelerated investment in the EUV service infrastructure, we did not achieve a 0 percent gross margin on EUV over
2017
. Nevertheless, even with more than tripled EUV net sales compared to
2016
we only showed a minor decrease in gross margin to
44.9
percent.
Other income
Other income consists of contributions for R&D programs under the NRE funding arrangements from certain Participating Customers in the CCIP and amounted to
EUR 95.8 million
for
2017
(
2016
:
EUR 93.8 million
).
Research and development costs
R&D costs (net of credits and excluding contributions under the NRE Funding Agreements from Participating Customers in the CCIP) were
EUR 1,259.7 million
in
2017
as compared to
EUR 1,105.8 million
in
2016
. R&D costs for both
2017
and
2016
were primarily focused on programs supporting Holistic Lithography in EUV, DUV immersion, and Applications. In
2017
, R&D activities mainly related to:
|
•
|
EUV - Further improving availability and productivity focused on the final stages of development related to our NXE:3400B system, of which we shipped our first systems in 2017. In addition, we are extending our roadmap by including High NA to support our customers with 3 nm logic.
|
|
•
|
DUV immersion - Mainly dedicated to the development of our next generation Immersion system NXT:2000i.
|
|
•
|
Applications - HMI expansion and further development of YieldStar and process window control solutions.
|
Selling, general and administrative costs
SG&A costs
increased by
11.2 percent
mainly driven by the inclusion of HMI for the full year and an increase in the number of employees.
Interest and other, net
Interest and other, net
decreased
by
EUR 84.0 million
in
2017
compared to
2016
. This decrease is mainly due to the recognition of EUR 55.2 million gain in 2016 on foreign currency revaluations of transactions and balances relating to the HMI acquisition in interest and other, net.
Other drivers of the decrease are a full year impact of interest on the Eurobond issued in
2016
and lower yields on cash.
ASML INTEGRATED REPORT 2018
183
Profit (loss) related to equity method investments
The loss related to equity method investments, which consists of the result of our 24.9 percent equity interest in Carl Zeiss SMT Holding GmbH & Co. KG, was
EUR 16.7 million
for 2017 (
2016
:
0.0 million
). See Consolidated Financial Statements - Notes to the Consolidated Financial Statements - Note 1 General information / summary of significant accounting policies.
Net income
Net income in
2017
amounted to
EUR 2,066.7 million
, or
23.1 percent
of total net sales, representing
EUR 4.81
basic net income per ordinary share, compared with net income in
2016
of
EUR 1,557.8 million
, or
22.7 percent
of total net sales, representing
EUR 3.66
basic net income per ordinary share.
ASML INTEGRATED REPORT 2018
184
Appendix - Principal Accountant Fees and Services
KPMG has served as our
independent registered public accounting firm
for the years ending
December 31, 2018
and
2017
.
The following table sets out the aggregate fees for professional audit services and other services rendered by KPMG and their member firms and / or affiliates in
2018
and
2017
:
|
Year ended December 31
(in thousands) |
2017
|
2018
|
||||||||||
|
KPMG Accountants N.V.
EUR |
|
KPMG Network
EUR |
|
Total
EUR |
|
KPMG Accountants N.V.
EUR |
|
KPMG Network
EUR |
|
Total
EUR |
|
|
|
Audit fees
|
1,517
|
|
491
|
|
2,008
|
|
1,480
|
|
640
|
|
2,120
|
|
|
Audit-related fees
|
70
|
|
—
|
|
70
|
|
70
|
|
—
|
|
70
|
|
|
Tax fees
|
—
|
|
—
|
|
—
|
|
—
|
|
—
|
|
—
|
|
|
All other fees
|
48
|
|
—
|
|
48
|
|
24
|
|
—
|
|
24
|
|
|
Principal accountant fees
|
1,635
|
|
491
|
|
2,126
|
|
1,574
|
|
640
|
|
2,214
|
|
Audit fees and audit-related fees
Audit fees relate to the audit of the Financial Statements as set out in this Integrated Report, certain procedures on our quarterly results, procedures performed on a Form S-8 filing and services related to our statutory and regulatory filings of our subsidiaries. Other audit-related fees are related to assurance services on non-financial information.
Other (non-audit) services relate to certain agreed-upon procedures on the targets achieved in order for the Remuneration Committee to assess compliance with the Remuneration Policy and agreed-upon procedures related to XBRL.
The Audit Committee pre-approved the external audit plan and audit fees for the years
2018
and
2017
.
The Audit Committee monitors compliance with the Dutch, EU regulation and SEC rules on non-audit services provided by an independent
registered public accounting firm,
which outlines strict separation of audit and advisory services for Dutch public interest entities.
ASML INTEGRATED REPORT 2018
185
Appendix - Property, Plant and Equipment
We lease a number of our facilities under operating leases. We also own a number of buildings, mainly consisting of production facilities in Veldhoven, the Netherlands, in Wilton, Connecticut, and San Diego, California, both in the US, in Linkou and Tainan, both in Taiwan and in Pyeongtaek, South-Korea. The book value of land and buildings owned amounts to
EUR 1,063.8 million
as of
December 31, 2018
compared with
EUR 1,089.1 million
as of
December 31, 2017
. See
Consolidated Financial Statements - Notes to the Consolidated Financial Statements - Note 13 Property, plant and equipment
.
Our capital expenditures (purchases of property, plant and equipment, see the
Consolidated Statements of Cash Flows
as recorded in the
Consolidated Financial Statements
) for
2018
,
2017
and
2016
amounted to
EUR 574.0 million
,
EUR 338.9 million
and
EUR 316.3 million
, respectively. The increased capital expenditures in
2018
compared to
2017
relates to the expansion and upgrades of facilities, prototypes, evaluation and training systems.
Subject to market conditions, we e
xpect that our capital expenditures (purchases of property, plant and equipment) in
2019
will be approximately
EUR 780 million
. These expenditures will mainly consist of further expansion and upgrades of facilities. We expect to finance these capital expen
ditures through cash generated by operations and existing cash and cash equivalents.
Facilities in Europe
Our headquarters, main manufacturing and R&D facilities are located at a single site in Veldhoven, the Netherlands. This state-of-the-art facility includes 66 thousand square meters of office space and 50 thousand square meters of cleanroom used for manufacturing and R&D activities and 24 thousand square meters of warehouses. Our facilities in Veldhoven, the Netherlands are partly owned and partly leased.
We also lease several sales and service facilities at locations across Europe.
Facilities in the US
Our US head office is located in a 5,000 square meter office building in Chandler, Arizona. We maintain R&D and manufacturing operations in a 28,000 square meter facility in Wilton, Connecticut, and a 9,000 square meter facility in San Jose, California. Furthermore, our facilities in San Diego include 25,000 square meters of buildings used for manufacturing and office space, 19,000 square meters of buildings used for engineering and R&D activities and 7,000 square meters of buildings used for warehousing. As a result of the HMI acquisition, our facilities in San Jose, California expanded by approximately 34,000 square meters for R&D and local sales and service activities.
Facilities in Asia
Our Asian headquarters is located in Hong Kong, The People’s Republic of China. In addition, our facility in Linkou, Taiwan comprises a cleanroom (approximately 3,000 square meters) and office space (approximately 6,000 square meters). Our facility in Korea comprises of a cleanroom (approximately 700 square meters) and office space (approximately 6,000 square meters). We also lease and own several sales, service and training facilities at locations across Asia. As a result of the Cymer acquisition, we acquired a manufacturing facility in Pyeongtaek, South Korea, mainly used for refurbishment activities of light sources. As a result of the HMI acquisition, we acquired manufacturing facilities in Tainan, Taiwan (approximately 8,000 square meters) and Beijing, China (approximately 4,000 square meters) and office space in Hsinchu, Taiwan (approximately 2,000 square meters). Additionally, both Cymer and HMI lease various smaller locations across Asia which are mainly used for local sales and service activities.
ASML INTEGRATED REPORT 2018
186
Appendix - Taxation
Tax strategy and transparency
Our tax strategy is based on a well-defined set of principles and internationally accepted standards. Tax is a subject of continued interest by our stakeholders, so we strive for transparency in the way we report and pay our taxes.
We derive our tax principles from our Code of Conduct and our Business Principles. The code, Business Principles and our tax principles guide how we report and pay tax in the countries we operate in, including profit tax, trade taxes and income tax.
ASML strives to report and pay taxes in accordance with all relevant tax laws and regulations. We will comply with the letter and spirit of these laws and regulations, meaning that we are committed to complying not only with the literal reading of the relevant laws, but also their intent. In addition, ASML will only choose an option in structuring its business when such option has the highest level of tax assurance opinion that could be issued by a reputable tax advisory firm.
Profit allocation
Our worldwide profits are allocated to the various countries in which ASML operates based on the value created by ASML’s business in those jurisdictions. ASML’s allocation method is based on internationally accepted standards as published by the OECD, as well as relevant rules and regulations in the local jurisdictions where we operate.
Around
90 percent
of our income is taxable in the Netherlands because the vast majority of our value creation through research, design and manufacturing activities are based there. The income from other activities, such as regional equipment sales and after-sales support, is subject to taxation in the countries where these activities take place, the main ones being the US, Hong Kong, South Korea, Taiwan, Singapore and Japan.
Timely and complete compliance
We aim to file all the required tax-relevant returns with the appropriate tax authorities in a timely and complete manner. To ensure this happens, tax return processes are monitored through ASML’s corporate control framework and comprehensive tax control frameworks. The control frameworks are regularly reviewed and tested. Furthermore, ASML aims for timely payment of taxes to the relevant authorities.
ASML strives for open and constructive dialogue with tax authorities, disclosing all relevant facts and circumstances. We aim to be clear about all aspects pertaining to our tax position and to share these in a transparent manner, fostering a relationship of honesty and certainty with the tax authorities. The latter is also reflected by the number of (Bilateral) Advance Pricing Agreements we have with tax authorities in our significant jurisdictions.
Tax governance
Our Tax department works under the supervision of our BoM. The Audit Committee of the SB reviews our tax strategy and also regularly confers with our tax professionals to discuss tax policies and the impact of tax laws and regulations on ASML.
In this respect in 2018 we further followed up on the developments regarding the implementation of local legislation and regulations concerning the Action Plan on Base Erosion and Profit Shifting, or BEPS, issued by the OECD in 2015 to combat tax avoidance. The action plan led to proposed new legislation in several countries where we operate, which new legislation we closely monitor and act upon accordingly. None of these directives and legislative proposals are expected to have an adverse effect on ASML’s effective tax rate. Additionally, in 2018 we further followed up on the implications of US Tax Reform. Although on several aspects more detailed guidance from the US IRS is still to come, the potential impact has already been assessed and taken into account in the 2017 and 2018 provision for income tax based on the guidance and information as currently available.
We discuss potential tax risks and our tax position with the Audit Committee on a regular basis. Additionally, in the Netherlands, we participate in a cooperative compliance program with the Dutch tax authorities.
Tax policy
ASML occasionally engages in tax policy discussions with tax authorities of jurisdictions. Examples of discussions we have had with tax authorities are discussions on aligning VAT laws and regulations with internationally accepted standards in the area of VAT laws and regulations in order to enable spare part distribution centers to be established in a certain jurisdictions without undue VAT burden to be incurred on the spare part distribution activities. Another example is the exchange of ASML’s experience on cooperative compliance programs with tax authorities. As already indicated above, we strive for reporting and paying taxes in accordance with all relevant tax laws and regulations, thereby maintaining a conservative approach and aligning value creation with profit levels.
Dutch taxation
The statements below represent a summary of current Dutch tax laws, regulations and judicial interpretations thereof. The description is limited to the material tax implications for a holder of ordinary shares who is not, and / or is not deemed to be, a resident of the Netherlands for Dutch tax purposes (‘Non-Resident Holder’). This summary does not address special rules that may apply to special classes of holders of ordinary shares and should not be read as extending by implication to matters not specifically referred to herein. As to individual tax consequences, each investor in our ordinary shares should consult his or her tax counsel.
ASML INTEGRATED REPORT 2018
187
General
The acquisition of ordinary shares by a non-resident of the Netherlands should not be treated as a taxable event for Dutch tax purposes. The material tax consequences in connection with owning and disposing of our ordinary shares are discussed below.
Substantial interest
A person that, (inter alia) directly or indirectly, and either independently or jointly with his partner (as defined in the Dutch Personal Income Tax Act 2001), owns 5.0 percent or more of our share capital, owns profit participating rights that correspond to at least 5.0 percent of the annual profits of a Dutch company or to at least 5.0 percent of the liquidation proceeds of such company or holds options to purchase 5.0 percent or more of our share capital, is deemed to have a substantial interest in our shares, or our options, as applicable. Specific rules apply in case certain family members of the Non-Resident Holder hold a substantial interest. A deemed substantial interest also exists if (part of) a substantial interest has been disposed of, or is deemed to be disposed of, in a transaction where no taxable gain has been recognized. Specific attribution rules exist in determining the presence of a substantial interest.
Income tax consequences for individual non-resident holders on owning and disposing of the ordinary shares
An individual who is a Non-Resident Holder will not be subject to Dutch income tax on received income in respect of our ordinary shares or capital gains derived from the sale, exchange or other disposition of our ordinary shares, provided that such holder:
|
•
|
Does not carry on and has not carried on a business in the Netherlands through a (deemed) permanent establishment or a permanent representative to which the ordinary shares are attributable;
|
|
•
|
Does not hold and has not held a (deemed) substantial interest in our share capital or, in the event the Non-Resident Holder holds or has held a (deemed) substantial interest in our share capital, such interest is, or was, a business asset in the hands of the holder;
|
|
•
|
Does not share and has not shared directly (through the beneficial ownership of ordinary shares or similar securities) in the profits of an enterprise managed and controlled in the Netherlands which (is deemed to) own(s), or (is deemed to have) has owned, our ordinary shares; and
|
|
•
|
Does not carry out and has not carried out any activities which generate taxable profit in the Netherlands or taxable income in the Netherlands to which the holding of our ordinary shares was connected.
|
Corporate income tax consequences for corporate non-resident holders
Income derived from ordinary shares or capital gains derived from the sale, exchange or disposition of ordinary shares by a corporate Non-Resident Holder is taxable if:
|
•
|
The holder carries on a business in the Netherlands through a permanent establishment or a permanent representative in the Netherlands (Dutch enterprise) and the ordinary shares are attributable to this permanent establishment or permanent representative, unless the participation exemption (discussed below) applies; or
|
|
•
|
The holder has a substantial interest in our share capital, which is held with the primary aim or one of the primary aims to evade the levy of income tax at the level of another person and which is not put into place with valid commercial reasons that reflect economic reality; or
|
|
•
|
The holder is a resident of Aruba, Curacao or Saint Martin with a permanent establishment or permanent representative in Bonaire, Eustatius or Saba to which our ordinary shares are attributable and certain conditions are met; or
|
|
•
|
Certain assets of the holder are deemed to be treated as a Dutch enterprise under Dutch tax law and the ordinary shares are attributable to this Dutch enterprise.
|
To qualify for the Dutch participation exemption, the holder must generally hold at least 5.0 percent of our nominal paid-in capital and meet certain other requirements.
Dividend withholding tax
In general, a dividend distributed by us in respect of our ordinary shares will be subject to a withholding tax imposed by the Netherlands at the statutory rate of 15.0 percent.
Dividends include:
|
•
|
Dividends in cash and in kind;
|
|
•
|
Deemed and constructive dividends;
|
|
•
|
Consideration for the repurchase or redemption of ordinary shares (including a purchase by a direct or indirect ASML subsidiary) in excess of qualifying average paid-in capital unless such repurchase is made for temporary investment purposes or is exempt by law;
|
|
•
|
Stock dividends up to their nominal value (unless distributed out of qualifying paid-in capital);
|
|
•
|
Any (partial) repayment of paid-in capital not qualifying as capital for Dutch dividend withholding tax purposes; and
|
|
•
|
Liquidation proceeds in excess of qualifying average paid-in capital for Dutch dividend withholding tax purposes.
|
ASML INTEGRATED REPORT 2018
188
Under certain circumstances, a reduction of Dutch dividend withholding tax can be obtained:
|
•
|
An exemption at source is available if the participation exemption applies and the ordinary shares are attributable to a business carried out in the Netherlands;
|
|
•
|
An exemption at source is available for dividend distributions to certain qualifying EU/EEA resident corporate holders, unless such holder holds our ordinary shares with the primary aim or one of the primary aims to evade the levy of Dutch dividend withholding tax at the level of another person and our ordinary shares are not held for valid commercial reasons that reflect economic reality;
|
|
•
|
An exemption at source is available for dividend distributions to certain qualifying corporate holders that are a resident of a non-EU/EEA jurisdiction with which the Netherlands has concluded a tax treaty that includes a dividend article, unless such holder holds our ordinary shares with the primary aim or one of the primary aims to evade the levy of Dutch dividend withholding tax at the level of another person and our ordinary shares are not held for valid commercial reasons that reflect economic reality;
|
|
•
|
Certain tax exempt organizations (e.g. pension funds and excluding collective investment vehicles) resident in EU/EEA member states or in qualifying non-EU/EEA states may be eligible for a refund of Dutch dividend withholding tax upon their request. Based on domestic law not yet entered into force, in those circumstances, an exemption at source may also become available upon request;
|
|
•
|
Upon request and under certain conditions, certain qualifying Non-Resident Individual and Corporate Holders of ordinary shares resident in EU/EEA member states or in a qualifying non-EU/EEA state may be eligible for a refund of Dutch dividend withholding tax insofar the withholding tax levied is higher than the personal and corporate income tax which would have been due if they were resident of the Netherlands.
|
Furthermore, a Non-Resident Holder of ordinary shares can be eligible for a partial or complete exemption or refund of all or a portion of the above withholding tax under a tax treaty that is in effect between the Netherlands and the Non-Resident Holder’s country of residence. The Netherlands has concluded such treaties with the US, Canada, Switzerland, Japan, most EU member states, as well as many other countries. Under the treaty between the US and the Netherlands for the Avoidance of Double Taxation and the Prevention of Fiscal Evasion with Respect to Taxes on Income (the ‘US Tax Treaty’), dividends paid by us to a Non-Resident Holder that is a resident of the US as defined in the US Tax Treaty (other than an exempt organization or exempt pension trust, as discussed below) are generally liable to 15.0 percent Dutch withholding tax or, in the case of certain US corporate shareholders owning directly at least 10.0 percent of our voting power, a reduction to 5.0 percent, provided that the Holder is the beneficial owner of the dividends received and does not have an enterprise or an interest in an enterprise that is, in whole or in part, carried on through a permanent establishment or permanent representative in the Netherlands to which the dividends are attributable. The US Tax Treaty also provides for a dividend withholding tax exemption on dividends, but only for a shareholder owning directly at least 80.0 percent of our voting power and meeting all other requirements. The US Tax Treaty provides for a complete exemption from tax on dividends received by exempt pension trusts and exempt organizations, as defined therein. Except in the case of exempt organizations, the reduced dividend withholding tax rate (or exemption from withholding) can be applied at the source upon payment of the dividends, provided that the proper forms have been filed in advance of the payment. Exempt organizations, in principle, remain subject to the statutory withholding rate of 15.0 percent and are required to file for a refund of such withholding, however such organizations may become eligible for the exemption at source when the domestic law as described above has entered into force.
A Non-Resident Holder may not claim the benefits of the US Tax Treaty unless (i) he/she is a resident of the US as defined therein, or (ii) he/she is deemed to be a resident on the basis of the provisions of article 24(4) of the US Tax Treaty, and (iii) his or her entitlement to those benefits is not limited by the provisions of article 26 (limitation on benefits) of the US Tax Treaty.
Dividend stripping rules
Under Dutch tax legislation regarding anti-dividend stripping, no exemption from, or refund of, Dutch dividend withholding tax is granted if the recipient of dividends paid by us is not considered the beneficial owner of such dividends.
Gift or inheritance taxes
Dutch gift or inheritance taxes will not be levied on the transfer of ordinary shares by way of gift or upon the death of a Non-Resident Holder, unless the transfer is construed as an inheritance or as a gift made by or on behalf of a person, who at the time of the gift or death, is deemed to be resident of the Netherlands.
Gift tax and inheritance tax are levied on the beneficiary. For purposes of Dutch gift and inheritance tax, an individual of Dutch nationality is deemed to be a resident of the Netherlands if he/she has been a resident thereof at any time during the ten years preceding the time of the gift or death. For purposes of Dutch gift tax, a person not possessing Dutch nationality is deemed to be a resident of the Netherlands if he / she has resided therein at any time in the twelve months preceding the gift.
Value added tax
No Dutch VAT is imposed on dividends in respect of our ordinary shares or on the transfer of our shares.
Residence
A Non-Resident Holder will not become resident, or be deemed to be resident, in the Netherlands solely as a result of holding our ordinary shares or of the execution, performance, delivery and / or enforcement of rights in respect of our ordinary shares.
ASML INTEGRATED REPORT 2018
189
US taxation
The following is a discussion of the material US federal income tax consequences relating to the acquisition, ownership and disposition of ordinary shares by a United States Holder (as defined below) acting in the capacity of a beneficial owner who is not a tax resident of the Netherlands. This discussion deals only with ordinary shares held as capital assets and does not deal with the tax consequences applicable to all categories of investors, some of which (such as tax-exempt entities, financial institutions, regulated investment companies, dealers in securities/traders in securities that elect a mark-to-market method of accounting for securities holdings, insurance companies, investors owning directly, indirectly or constructively 10.0 percent or more of our outstanding voting shares, investors who hold ordinary shares as part of hedging or conversion transactions and investors whose functional currency is not the US dollar) may be subject to special rules. In addition, the discussion does not address any alternative minimum tax or any state, local, Foreign Investment in Real Property Tax Act-related US federal income tax consequences, or non-US tax consequences.
This discussion is based on the US-Netherlands Income tax treaty, the Internal Revenue Code of 1986, as amended to the date hereof, final, temporary and proposed Treasury Department regulations promulgated, and administrative and judicial interpretations thereof, changes to any of which subsequent to the date hereof, possibly with retroactive effect, may affect the tax consequences described herein. In addition, there can be no assurance that the IRS will not challenge one or more of the tax consequences described herein, and we have not obtained, nor do we intend to obtain, a ruling from the IRS or an opinion of counsel with respect to the US federal income tax consequences of acquiring or holding shares. Prospective purchasers of ordinary shares are advised to consult their tax advisers with respect to their particular circumstances and with respect to the effects of US federal, state, local or non-US tax laws to which they may be subject.
As used herein, the term ‘United States Holder’ means a beneficial owner of ordinary shares for US federal income tax purposes whose holding of such ordinary shares does not form part of the business property or assets of a permanent establishment or fixed base in the Netherlands; who is fully entitled to the benefits of the treaty in respect of such ordinary shares; and is:
|
•
|
An individual citizen or tax resident of the US; or
|
|
•
|
A corporation or other entity treated as a corporation for US federal income tax purposes created or organized in or under the laws of the US or of any political subdivision thereof; or
|
|
•
|
An estate of which the income is subject to US federal income taxation regardless of its source; or
|
|
•
|
A trust whose administration is subject to the primary supervision of a court within the US and which has one or more US persons who have the authority to control all of its substantial decisions.
|
If an entity treated as a partnership for US federal income tax purposes owns ordinary shares, the US federal income tax treatment of a partner in such partnership will generally depend upon the status and tax residency of the partner and the activities of the partnership. A partnership that owns ordinary shares and the partners in such partnership should consult their tax advisors about the US federal income tax consequences of holding and disposing of the ordinary shares.
Passive Foreign Investment Company considerations
We believe we were not a passive foreign investment company for US federal income tax purposes in
2018
and that we will not be a passive foreign investment company in
2019
. However, as passive foreign investment company status is a factual matter that must be determined annually at the close of each taxable year, there can be no certainty as to our actual passive foreign investment company status in any particular year until the close of the taxable year in question. We have not conducted a detailed study at this time to confirm our non-passive foreign investment company status. If we were treated as a passive foreign investment company in any year during which a United States Holder owned common shares, certain adverse tax consequences could apply. Investors should consult their tax advisors with respect to any passive foreign investment company considerations.
Taxation of dividends
United States Holders should generally include in gross income, as foreign-source dividend income the gross amount of any non-liquidating distribution (before reduction for Dutch withholding taxes) we make out of our current or accumulated earnings and profits (as determined for US federal income tax purposes) when the distribution is actually or constructively received by the United States Holder. Distributions will not be eligible for the dividends-received deduction generally allowed to US corporations in respect of dividends received from other US corporations. The amount of the dividend distribution includible in income of a United States Holder should be the US dollar value of the foreign currency (e.g. euros) paid, determined by the spot rate of exchange on the date of the distribution, regardless of whether the payment is in fact converted into US dollars. Distributions in excess of current and accumulated earnings and profits, as determined for US federal income tax purposes, will be treated as a non-taxable return of capital to the extent of the United States Holder’s US tax basis in the ordinary shares and thereafter as taxable capital gain. We presently do not maintain calculations of our earnings and profits under US federal income tax principles. If we do not report to a United States Holder the portion of a distribution that exceeds earnings and profits, the distribution will generally be taxable as a dividend even if that distribution would otherwise be treated as a non-taxable return of capital or as capital gain under the rules described above.
ASML INTEGRATED REPORT 2018
190
Subject to limitations provided in the US Internal Revenue Code, a United States Holder may generally deduct from its US federal taxable income, or credit against its US federal income tax liability, the amount of qualified Dutch withholding taxes. However, Dutch withholding tax may be credited only if the United States Holder does not claim a deduction for any Dutch or other non-US taxes paid or accrued in that year. In addition, Dutch dividend withholding taxes will likely not be creditable against the United States Holder’s US tax liability to the extent we are not required to pay over the amount withheld to the Dutch Tax Administration. Currently, a Dutch corporation that receives dividends from qualifying non-Dutch subsidiaries may credit source country tax withheld from those dividends against Dutch withholding tax imposed on a dividend paid by a Dutch corporation, up to a maximum of 3.0 percent of the dividend paid by the Dutch corporation. The credit reduces the amount of dividend withholding that we are required to pay to the Dutch Tax Administration but does not reduce the amount of tax we are required to withhold from dividends.
For US foreign tax credit purposes, dividends paid by us generally will be treated as foreign-source income and as ‘passive category income’ (or in the case of certain holders, as ‘general category income’). Gains or losses realized by a United States Holder on the sale or exchange of ordinary shares generally will be treated as US-source gain or loss. The rules governing the foreign tax credit are complex and we suggest that each United States Holder consult his or her own tax advisor to determine whether, and to what extent, a foreign tax credit will be available.
Dividends received by a United States Holder will generally be taxed at ordinary income tax rates. However, the Jobs and Growth Tax Relief Reconciliation Act of 2003, as amended by the Working Families Tax Relief Act of 2004, the American Jobs Creation Act of 2004, the American Taxpayer Relief Act of 2012, and most recently the 2017 tax reform act (Public Law No. 115-97) reduces to 20.0 percent the maximum tax rate for certain dividends received by individuals, so long as certain exclusions do not apply and the stock has been held for at least 60 days during the 121-day period beginning 60 days before the ex-dividend date. Dividends received from ‘qualified foreign corporations’ generally qualify for the reduced rate. A non-US corporation (other than a passive foreign investment company) generally will be considered to be a qualified foreign corporation if: (i) the shares of the non-US corporation are readily tradable on an established securities market in the US or (ii) the non-US corporation is eligible for the benefits of a comprehensive income tax treaty with the US that has been identified as a qualifying treaty and contains an exchange of information program. Individual United States Holders should consult their tax advisors regarding the impact of this provision on their particular situations.
Dividends paid by us generally will constitute ‘portfolio income’ for purposes of the limitations on the use of passive activity losses (and, therefore, generally may not be offset by passive activity losses) and as ‘investment income’ for purposes of the limitation on the deduction of investment interest expense.
Taxation on sale or other disposition of ordinary shares
Upon a sale or other disposition of ordinary shares, a United States Holder will generally recognize capital gain or loss for US federal income tax purposes in an amount equal to the difference between the amount realized, if paid in US dollars, or the US dollar value of the amount realized (determined at the spot rate on the settlement date of the sale) if proceeds are paid in currency other than the US dollar, as the case may be, and the United States Holder’s US tax basis (determined in US dollars) in such ordinary shares. Generally, the capital gain or loss will be long-term capital gain or loss if the holding period of the United States Holder in the ordinary shares exceeds one year at the time of the sale or other disposition. The deductibility of capital losses is subject to limitations for US federal income tax purposes. Gain or loss from the sale or other disposition of ordinary shares generally will be treated as US source income or loss for US foreign tax credit purposes. Generally, any gain or loss resulting from currency fluctuations during the period between the date of the sale of the ordinary shares and the date the sale proceeds are converted into US dollars will be treated as ordinary income or loss from sources within the US. Each United States Holder should consult his or her tax advisor with regard to the translation rules applicable when computing its adjusted US tax basis and the amount realized upon a sale or other disposition of its ordinary shares if purchased in, or sold or disposed of for, a currency other than US dollar.
Information reporting and backup withholding
Information returns may be filed with the IRS in connection with payments on the ordinary shares or proceeds from a sale, redemption or other disposition of the ordinary shares. A ‘backup withholding’ tax may be applied to, and withheld from, these payments if the beneficial owner fails to provide a correct taxpayer identification number to the paying agent and to comply with certain certification procedures or otherwise establish an exemption from backup withholding. Any amounts withheld under the backup withholding rules might be refunded (or credited against the beneficial owner’s US federal income tax liability, if any) depending on the facts and provided that the required information is furnished to the IRS.
The discussion set out above is included for general information only and may not be applicable depending upon a holder’s particular situation. Holders should consult their tax advisors with respect to the tax consequences to them of the purchase, ownership and disposition of shares including the tax consequences under state, local and other tax laws and the possible effects of changes in US federal and other tax laws.
ASML INTEGRATED REPORT 2018
191
Appendix - Financing and Capital Return Policy
Policy on liquidity and financing
We seek to ensure that our principal sources of liquidity will be sufficient to satisfy our liquidity requirements. Our liquidity needs are affected by many factors. We believe that cash generated from operations, together with our other sources of liquidity are sufficient to satisfy our requirements, including our expected capital expenditures and debt servicing.
Our goal is to remain an investment grade rated company and maintain a capital structure that supports this.
Return policy
We aim to pay an annual dividend that will be growing over time.
The dividend proposal in any given year will be subject to the availability of distributable profits or retained earnings and may be affected by, among other factors, the BOM's views on our potential future liquidity requirements. These requirements include, but are not limited to, using profits or retained earnings to: invest in production capacity, fund R&D programs, fund acquisition opportunities that may arise from time to time, and cover changes in applicable income tax and corporate laws.
In addition to dividend payments, we intend to return cash to our shareholders on a regular basis through share buybacks or capital repayment, subject to our actual and anticipated level of liquidity requirements and other relevant factors.
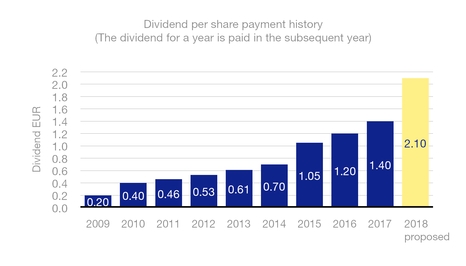

For more information on our financing and capital return policy, see
Management Board Report - Financial Performance - Liquidity and capital resources
and
Consolidated Financial Statements - Notes to the Consolidated Financial Statements - Note 28 Shareholders’ equity
and
Note 29 Purchases of equity securities by the issuer and affiliated purchasers
.
ASML INTEGRATED REPORT 2018
192
Appendix - Competition
The semiconductor equipment industry and the related services industries are highly competitive. The principal elements of competition in our market are:
|
•
|
The technical performance characteristics of a lithography system;
|
|
•
|
The productivity, cost-effectiveness and level of technical support of semiconductor-related services;
|
|
•
|
The cost of ownership of lithography systems based on purchase price, maintenance costs, availability, productivity, and customer service and support costs;
|
|
•
|
The ability to effectively service the installed base of our systems;
|
|
•
|
The ability to introduce and customer acceptance of new technology systems and managing technology roadmaps to high volume manufacturing;
|
|
•
|
The exchange rate of the euro against the functional currency of our competitors and our customers, particularly against the Japanese yen;
|
|
•
|
The strength and breadth of our portfolio of patents and other intellectual property rights; and
|
|
•
|
Our customers’ desire to obtain lithography equipment and related services from more than one supplier.
|
We believe that the market for lithography systems and services and the investments required to be a significant competitor in this market segment has resulted in competition for market share through aggressive prosecution of patents. Our competitiveness
depends upon our ability to protect and defend our patents, as well as our ability to develop new and enhanced semiconductor
equipment and services that is competitively priced and introduced on a timely basis.
ASML INTEGRATED REPORT 2018
193
Appendix - Government Regulation
Our business is subject to direct and indirect regulations in each of the countries in which our customers or we do business. As a result, changes in various types of regulations could affect our business adversely. The implementation of new safety, environmental or legal requirements, including export controls and required permits and licenses, could impact our products, our manufacturing or distribution processes or location of sales, and could affect the timing of product introductions, the cost of our production, and products as well as their commercial success in each market in which we operate. The impact of these changes in regulation could adversely affect our business, financial condition and our results of operations even where the specific regulations do not directly apply to us or to our products.
ASML INTEGRATED REPORT 2018
194
Appendix - Offer and Listing Details
Our ordinary shares are listed for trading in the form of registered ASML NASDAQ shares and in the form of registered ASML Euronext Amsterdam shares. The principal trading market of our ordinary shares is Euronext Amsterdam (trading symbol: ASML). Our ordinary shares also trade on NASDAQ (trading symbol: ASML).
Our shares listed on NASDAQ are registered with J.P. Morgan, our New York Transfer Agent, pursuant to the terms of the Transfer Agent Agreement between ASML and J.P. Morgan. Our shares listed on Euronext Amsterdam are held in dematerialized form through the facilities of Euroclear Nederland, the Dutch centralized securities custody and administration system. The New York Transfer Agent charges shareholders a fee of up to USD 5.00 per 100 shares for the exchange of our shares listed at NASDAQ for our shares listed at Euronext Amsterdam and vice versa.
Dividends payable on our shares listed at NASDAQ are declared in euro and converted to US dollars at the rate of exchange at the close of business on the date determined by the BoM. The resulting amounts are distributed through the New York Transfer Agent and no charge is payable by holders of our shares listed at NASDAQ in connection with this conversion or distribution.
Pursuant to the terms of the Transfer Agent Agreement, we have agreed to reimburse the New York Transfer Agent for certain out of pocket expenses, including in connection with any mailing of notices, reports or other communications made generally available by ASML to holders of ordinary shares. The New York Transfer Agent has waived its fees associated with routine services to ASML associated with our shares listed at NASDAQ. In addition, the New York Transfer Agent in consideration of its acting as Transfer Agent has agreed to make a contribution towards covering certain expenses incurred by ASML in connection with the issuance and transfer of our shares listed on NASDAQ. In the year ended
December 31, 2018
, the Transfer Agent contributed
USD 0.6 million
towards coverage of expenses incurred by ASML (which mainly comprised of audit, advisory, legal and listing fees incurred due to the existence of our share listing on NASDAQ).
ASML INTEGRATED REPORT 2018
195
Appendix - Material Contracts
Investment in Carl Zeiss SMT Holding GmbH & Co. KG
On November 2, 2016, ASML, Carl Zeiss AG, Carl Zeiss SMT Holding Management GmbH, Carl Zeiss SMT GmbH, and Carl Zeiss SMT Holding GmbH & Co. KG entered into the Carl Zeiss SMT Investment Agreement.
On June 29, 2017, we acquired a 24.9 percent limited partnership interest in Carl Zeiss SMT Holding GmbH & Co. KG, which became the sole owner of Carl Zeiss SMT GmbH, our sole supplier of critical optical columns, for EUR 1.0 billion.
In addition, on June 29, 2017, Carl Zeiss AG, and Carl Zeiss SMT Holding Management GmbH entered into the Carl Zeiss SMT Partnership and Joint Venture Agreement, establishing Carl Zeiss SMT Holding GmbH & Co. KG. Under the Carl Zeiss SMT Partnership and Joint Venture Agreement, we have been granted minority protection and veto rights in Carl Zeiss SMT Holding GmbH & Co. KG. The Carl Zeiss SMT Partnership and Joint Venture Agreement includes a right of first offer, pursuant to which, if Carl Zeiss AG wishes to transfer its 75.1 percent direct or indirect partnership interest to a third party, ASML has the right to make a first offer to purchase such partnership interest. If the right of first offer process does not result in a sale of the Carl Zeiss AG partnership interest to ASML or a third party, then any future sales by Carl Zeiss AG of its interest in the Carl Zeiss SMT Partnership and Joint Venture Agreement are subject to a right of first refusal of ASML. In addition, Carl Zeiss AG has drag-along rights, pursuant to which, in connection with a sale by Carl Zeiss AG of the Carl Zeiss AG partnership interest to a third party, Carl Zeiss AG may require ASML to sell its own partnership interest, subject to ASML’s right of first refusal to any such sale. Furthermore, the Carl Zeiss SMT Partnership and Joint Venture Agreement contains provisions relating to the governance and management of Carl Zeiss SMT Holding GmbH & Co. KG.
Memorandum of Understanding Among ASML, Zeiss and Nikon
In January 2019
, ASML entered into a binding MOU with Nikon and Carl Zeiss SMT relating to a comprehensive settlement of all pending disputes between Nikon, ASML and Zeiss. The MOU contemplates the execution of a cross-license agreement. The key terms to be included in the cr
oss-license agreement among the parties, as contemplated by the MOU, are set forth below.
Scope of License
Pursuant to the cross-license agreement with Nikon:
(i) ASML and Zeiss grant Nikon a worldwide, non-exclusive license under all patents owned or licensable ("Licensed Patents") by ASML and Zeiss to make, use and sell lithography equipment and components as well as digital cameras, but excluding EUV lithography products and laser sources ("Nikon Licensed Products");
(ii) Nikon grants ASML a worldwide, non-exclusive license under all Nikon Licensed Patents to make, use and sell lithography equipment and components, but excluding FPD/large area substrate products ("ASML Licensed Products"); and
(iii) Nikon grants Zeiss a worldwide, non-exclusive license under all Nikon Licensed Patents to make, use and sell a) components for use in lithography equipment and b) certain digital cameras developed and marketed by Zeiss, but excluding FPD/large area substrate products (“Zeiss Licensed Products”).
These license grants cover existing patents, as well as additional patents that issue worldwide before the end of the Term.
Term of License
The term of the cross-license is 10 years from the date of the cross-license agreement (the "Term"). ASML and Zeiss, jointly on the one hand and Nikon on the other hand, each have the right to convert up to 20 Licensed Patent families of the other side into permanently Licensed Patents.
Post-Term
After the Term, remedies for any party's infringement of any patents with an effective application date before the end of the Term are limited to damages in the form of a reasonable royalty applied against a royalty base that is apportioned to reflect the value of such patent features and excluding from the base value attributable to unpatented features. Whether a Licensed Product infringes a Licensed Patent, all defenses to such a claim, and any such reasonable royalty in the event liability is found shall be determined by a court mutually a
greed by the parties.
Certain Releases
The parties granted releases for claims of infringement of Licensed Patents based on acts prior to the date of the agreement.
Immunity
ASML and Nikon have granted each other certain immunities from patent suits by the other party in respect of covered entities, including customers, subject to certain defensive rights.
Payments
ASML and Zeiss agreed to make a payment of a total of
EUR 150.0 million
to Nikon.
ASML and Zeiss agreed to pay Nikon a royalty of 0.8% of the net sales price of entire immersion systems (on the first sale of each system) that are ASML Licensed Products sold during the Term of the agreement.
ASML INTEGRATED REPORT 2018
196
Nikon agreed to pay ASML and Zeiss a royalty of 0.8% of the net sales price of entire immersion systems (on the first sale of each system) that are Nikon Licensed Products sold during the Term of the agreement.
ASML INTEGRATED REPORT 2018
197
Appendix - Exchange Controls
Cash distributions, if any, payable in euros on our shares listed at Euronext Amsterdam may be officially transferred by a bank from the Netherlands and converted into any other currency without being subject to any Dutch legal restrictions. However, for statistical purposes, such payments and transactions must be reported by ASML to the Dutch Central Bank. Furthermore, no payments, including dividend payments, may be made to jurisdictions subject to certain sanctions, adopted by the government of the Netherlands, implementing resolutions of the Security Council of the United Nations. Cash distributions, if any, on our shares listed at NASDAQ shall be declared in euros but paid in US dollars, converted at the rate of exchange at the close of business on the date fixed for that purpose by the BoM in accordance with the Articles of Association.
ASML INTEGRATED REPORT 2018
198
Appendix - Documents on Display
We are subject to certain reporting requirements of the Exchange Act. As a "foreign private issuer", we are exempt from the rules under the Exchange Act prescribing certain disclosure and procedural requirements for proxy solicitations, and our officers, directors and principal shareholders are exempt from the reporting and "short-swing" profit recovery provisions contained in Section 16 of the Exchange Act, with respect to their purchases and sales of shares. In addition, we are not required to file reports and financial statements with the SEC as frequently or as promptly as companies whose securities are registered under the Exchange Act that are not foreign private issuers. However, we are required to file with the SEC, within 4 months after the end of each fiscal year, an Annual Report on Form 20-F containing financial statements audited by an independent accounting firm and interactive data comprising financial statements in extensible business reporting language. We publish unaudited interim financial information in accordance with U.S. GAAP after the end of each quarter. We furnish this quarterly financial information to the SEC under cover of a Form 6-K.
Documents we file with the SEC are publicly available at its public reference room at 100 F Street, N.E., Washington, DC 20549, United States. The SEC also maintains a website that contains reports and other information regarding registrants that are required to file electronically with the SEC. The address of this website is http://www.sec.gov. Please call the SEC at 1-800-SEC-0330 for further information on the operation of the public reference facilities.
ASML INTEGRATED REPORT 2018
199
Appendix - Controls and Procedures
Disclosure controls and procedures
As of
December 31, 2018
, ASML’s senior management conducted an evaluation, under the supervision and with the participation of ASML’s CEO and CFO, of the effectiveness of the design and operation of ASML’s disclosure controls and procedures (as defined in Rule 13a-15(e) under the Exchange Act). Based on such evaluation, ASML’s CEO and CFO have concluded that, as of
December 31, 2018
, ASML’s disclosure controls and procedures are effective in recording, processing, summarizing and reporting, on a timely basis, information required to be disclosed by ASML in the reports that it files or submits under the Exchange Act and are effective in ensuring that information required to be disclosed by ASML is accumulated and communicated to ASML’s management, including ASML’s CEO and CFO, as appropriate to allow timely decisions regarding required disclosure.
Management’s report on internal control over financial reporting
ASML’s management is responsible for establishing and maintaining adequate internal control over financial reporting, as defined in Rule 13a-15(f) under the Exchange Act. Under the supervision and with the participation of ASML’s CEO and CFO, ASML’s management conducted an evaluation of the effectiveness of ASML’s internal control over financial reporting as of
December 31, 2018
based upon the framework in "Internal Control – Integrated Framework" (2013) issued by the Committee of Sponsoring Organizations of the Treadway Commission. Based on that evaluation, management has concluded that ASML’s internal control over financial reporting was effective as of
December 31, 2018
at providing reasonable assurance regarding the reliability of financial reporting and the preparation of the Financial Statements for external purposes in conformity with US GAAP.
KPMG Accountants N.V., an independent registered public accounting firm, have audited the Financial Statements as included in this Integrated Report and, have also audited and issued a report, included herein, on the effectiveness of ASML’s internal control over financial reporting.
Changes in internal control over financial reporting
During the year ended
December 31, 2018
, there have been no changes in our internal control over financial reporting that have materially affected, or are reasonably likely to materially affect, our internal control over financial reporting.
Inherent limitations of disclosure controls and procedures in internal control over financial reporting
It should be noted that any system of controls, however well-designed and operated, can provide only reasonable, and not absolute, assurance that the objectives of the system will be met. In addition, the design of any control system is based in part upon certain assumptions about the likelihood of future events.
ASML INTEGRATED REPORT 2018
200
Appendix - Information and Investor Relations
Financial Calendar
April 17, 2019
Announcement of First Quarter results for
2019
April 24, 2019
Annual General Meeting of Shareholders
July 17, 2019
Announcement of Second Quarter results for
2019
October 16, 2019
Announcement of Third Quarter results for
2019
Fiscal Year
ASML’s fiscal year ends on December 31,
2019
Listing
Our ordinary shares are listed for trading on Euronext Amsterdam and on NASDAQ.
Investor Relations
ASML Investor Relations supplies information regarding the company and its business opportunities to investors and financial analysts. Our annual reports, quarterly releases and other information are also available on our Website.
ASML INTEGRATED REPORT 2018
201
Appendix - ASML Worldwide Contact Information
Corporate Headquarters
De Run 6501
5504 DR Veldhoven
The Netherlands
Mailing Address
P.O. Box 324
5500 AH Veldhoven
The Netherlands
United States Main Office
2650 W Geronimo Place
Chandler, AZ 85224
U.S.A.
Asia Main Office
Suites 3704-6, 37/F Tower Two, Times Square
1 Matheson Street
Causeway Bay, Hong Kong
Investor Relations
phone: +31 40 268 3938
email: investor.relations@asml.com
For additional contact information please visit our Website.
ASML INTEGRATED REPORT 2018
202
Appendix - Reference Table 20-F
|
Item
|
Form 20-F Caption
|
Location in this document
|
Page
|
|
Part I
|
|||
|
1
|
Identity of Directors, Senior Management and Advisors
|
||
|
Not applicable
|
|||
|
2
|
Offer Statistics and Expected Timetable
|
||
|
Not applicable
|
|||
|
3
|
Key Information
|
||
|
A. Selected Financial Data
|
|||
|
Other Appendices - Appendix - Selected Financial Data
|
|||
|
B. Capitalization and Indebtedness
|
|||
|
Not applicable
|
|||
|
C. Reasons for the Offer and Use of Proceeds
|
|||
|
Not applicable
|
|||
|
D. Risk Factors
|
|||
|
Management Board Report - Risk Factors
|
|||
|
4
|
Information on the Company
|
||
|
A. History and Development of the Company
|
|||
|
Management Board Report - Our Company
|
|||
|
Management Board Report - Our Company - A short company history
|
|||
|
Consolidated Financial Statements - Notes to the Consolidated Financial Statements - Note 2 Business combinations
|
|||
|
Consolidated Financial Statements - Notes to the Consolidated Financial Statements - Note 10 Equity method investments
|
|||
|
Other Appendices - Appendix - Property, Plant and Equipment
|
|||
|
Other Appendices - Appendix - ASML Worldwide Contact Information
|
|||
|
B. Business Overview
|
|||
|
Management Board Report - Our Company
|
|||
|
Management Board Report - The Role of Lithography
|
|||
|
Management Board Report - Business Strategy - Our markets
|
|||
|
Management Board Report - Products and Technology - Our products
|
|||
|
Management Board Report - Products and Technology - Innovation drives our business
|
|||
|
Management Board Report - Products and Technology - How we manage innovation
|
19
|
||
|
Management Board Report - Products and Technology - ASML’s ‘open innovation’ concept
|
19
|
||
|
Management Board Report - Products and Technology - Knowledge management
|
19
|
||
|
Management Board Report - Products and Technology - Protecting our intellectual property
|
|||
|
Management Board Report - People - Our flexible labor model - Paragraph 1
|
28
|
||
|
Management Board Report - Partners
|
|||
|
Consolidated Financial Statements - Notes to the Consolidated Financial Statements - Note 20 Legal contingencies
|
|||
|
Consolidated Financial Statements - Notes to the Consolidated Financial Statements - Note 22 Segment disclosure
|
|||
|
Consolidated Financial Statements - Notes to the Consolidated Financial Statements - Note 23 Revenue from contracts with customers
|
|||
|
Other Appendices - Appendix - Competition
|
|||
|
Other Appendices - Appendix - Government Regulation
|
|||
|
Management Board Report - Risk Factors
|
|||
|
C. Organizational Structure
|
|||
|
Corporate Governance - Other Information on Governance - General
|
|||
|
D. Property, Plant and Equipment
|
|||
|
Other Appendices - Appendix - Property, Plant and Equipment
|
|||
|
4A
|
Unresolved Staff Comments
|
||
|
Not applicable
|
|||
ASML INTEGRATED REPORT 2018
203
|
5
|
Operating and Financial Review and Prospects
|
||
|
Executive Summary
|
|||
|
Management Board Report - Business Strategy - Our vision and mission
|
|||
|
Management Board Report - Business Strategy - Our strategy
|
|||
|
Management Board Report - Business Strategy - Long-term growth opportunity
|
|||
|
Management Board Report - Financial Performance - ASML operations update on key performance indicators
|
|||
|
Management Board Report - Trend Information
|
|||
|
A. Operating Results
|
|||
|
Management Board Report - Financial Performance - Operating results
|
|||
|
Consolidated Financial Statements - Notes to the Consolidated Financial Statements - Note 1 General information / summary of significant accounting policies
|
|||
|
Other Appendices - Appendix - Results of Operations 2017 Compared to 2016
|
|||
|
B. Liquidity and Capital Resources
|
|||
|
Management Board Report - Financial Performance - Liquidity and capital resources
|
|||
|
C. Research and Development, Patents and Licenses, etc.
|
|||
|
Management Board Report - Risk Factors - Failure to adequately protect the intellectual property rights upon which we depend could harm our business
|
52
|
||
|
Management Board Report - Risk Factors - Defending against intellectual property claims brought by others could harm our business
|
53
|
||
|
Management Board Report - Products and Technology
|
|||
|
Management Board Report - Financial Performance - Operating results
|
|||
|
Other Appendices - Appendix - Results of Operations 2017 Compared to 2016
|
|||
|
D. Trend Information
|
|||
|
Management Board Report - Trend Information
|
|||
|
E. Off-Balance Sheet Arrangements
|
|||
|
Consolidated Financial Statements - Notes to the Consolidated Financial Statements - Note 10 Equity method investments
|
|||
|
F. Tabular Disclosure of Contractual Obligations
|
|||
|
Consolidated Financial Statements - Notes to the Consolidated Financial Statements - Note 18 Commitments, contingencies and guarantees
|
|||
|
G. Safe Harbor
|
|||
|
Special Note Regarding Forward-Looking Statements
|
|||
|
6
|
Directors, Senior Management and Employees
|
||
|
A. Directors and Senior Management
|
|||
|
Management Board Report - Board of Management
|
|||
|
Supervisory Board Report - Supervisory Board
|
|||
|
B. Compensation
|
|||
|
Supervisory Board Report - Remuneration Report
|
|||
|
Other Appendices - Appendix - Board of Management and Supervisory Board Remuneration
|
|||
|
C. Board Practices
|
|||
|
Management Board Report - Board of Management
|
|||
|
Supervisory Board Report - Supervisory Board
|
|||
|
Supervisory Board Report - Supervisory Board Committees
|
68
|
||
|
D. Employees
|
|||
|
Management Board Report - Risk Factors - Our business and future success depend on our ability to manage the growth of our organization and attract and retain a sufficient number of adequately educated and skilled employees
|
55
|
||
|
Management Board Report - People - Human rights and labor relations - Paragraphs 2 and 3
|
27
|
||
|
Consolidated Financial Statements - Notes to the Consolidated Financial Statements - Note 19 Employee benefits
|
|||
|
Consolidated Financial Statements - Notes to the Consolidated Financial Statements - Note 24 Selected operating expenses and additional information
|
|||
|
Non-Financial Statements - Non-financial Indicators - People - Talent Management - Number of FTEs (payroll and temporary)
|
165
|
||
ASML INTEGRATED REPORT 2018
204
|
E. Share Ownership
|
|||
|
Supervisory Board Report - Remuneration Report
|
|||
|
Corporate Governance - Other Information on Governance - Ordinary shares
|
|||
|
Consolidated Financial Statements - Notes to the Consolidated Financial Statements - Note 19 Employee benefits
|
|||
|
Other Appendices - Appendix - Board of Management and Supervisory Board Remuneration
|
|||
|
7
|
Major Shareholders and Related Party Transactions
|
||
|
A. Major Shareholders
|
|||
|
Corporate Governance - Other Information on Governance - Reporting obligations under the Act on the supervision of financial markets (‘Wet op het financieel toezicht’, the FMSA) and under US securities laws
|
90
|
||
|
B. Related Party Transactions
|
|||
|
Consolidated Financial Statements - Notes to the Consolidated Financial Statements - Note 30 CCIP
|
|||
|
Consolidated Financial Statements - Notes to the Consolidated Financial Statements - Note 31 Related party transactions
|
|||
|
C. Interests of Experts & Counsel
|
|||
|
Not applicable
|
|||
|
8
|
Financial Information
|
||
|
A. Consolidated Statements and Other Financial Information
|
|||
|
Consolidated Financial Statements
|
|||
|
B. Significant Changes
|
|||
|
Management Board Report - Trend Information
|
|||
|
Consolidated Financial Statements - Notes to the Consolidated Financial Statements - Note 32 Subsequent events
|
|||
|
9
|
The Offer and Listing
|
||
|
A. Offer and Listing Details
|
|||
|
Other Appendices - Appendix - Offer and Listing Details
|
|||
|
B. Plan of Distribution
|
|||
|
Not applicable
|
|||
|
C. Markets
|
|||
|
Other Appendices - Appendix - Offer and Listing Details
|
|||
|
D. Selling Shareholders
|
|||
|
Not applicable
|
|||
|
E. Dilution
|
|||
|
Not applicable
|
|||
|
F. Expenses of the Issue
|
|||
|
Not applicable
|
|||
|
10
|
Additional Information
|
||
|
A. Share Capital
|
|||
|
Not applicable
|
|||
|
B. Memorandum and Articles of Association
|
|||
|
Corporate Governance - Other Information on Governance - Appointment of Board of Management and Supervisory Board - Articles of Association
|
91
|
||
|
C. Material Contracts
|
|||
|
Other Appendices - Appendix - Material Contracts
|
|||
|
D. Exchange Controls
|
|||
|
Other Appendices - Appendix - Exchange Controls
|
|||
|
E. Taxation
|
|||
|
Other Appendices - Appendix - Taxation
|
|||
|
F. Dividends and Paying Agents
|
|||
|
Not applicable
|
|||
|
G. Statement by Experts
|
|||
|
Not applicable
|
|||
|
H. Documents on Display
|
|||
|
Other Appendices - Appendix - Documents on Display
|
|||
|
I. Subsidiary Information
|
|||
|
Corporate Governance - Other Information on Governance - General
|
|||
ASML INTEGRATED REPORT 2018
205
|
11
|
Quantitative and Qualitative Disclosures About Market Risk
|
||
|
Consolidated Financial Statements - Notes to the Consolidated Financial Statements - Note 3 Fair value measurement - Paragraph on valuation techniques used
|
|||
|
Consolidated Financial Statements - Notes to the Consolidated Financial Statements - Note 4 Financial risk management
|
|||
|
Consolidated Financial Statements - Notes to the Consolidated Financial Statements - Note 5 Cash and cash equivalents and short-term investments
|
|||
|
12
|
Description of Securities Other Than Equity Securities
|
||
|
Not applicable
|
|||
|
Part II
|
|||
|
13
|
Defaults, Dividend Arrearages and Delinquencies
|
||
|
None
|
|||
|
14
|
Material Modifications to the Rights of Security Holders and Use of Proceeds
|
||
|
None
|
|||
|
15
|
Controls and Procedures
|
||
|
Other Appendices - Appendix - Controls and Procedures
|
|||
|
16A
|
Audit Committee Financial Expert
|
||
|
Corporate Governance - Supervisory Board - Composition and role of the four committees of the Supervisory Board - Audit Committee - Paragraph 1
|
83
|
||
|
16B
|
Code of Ethics
|
||
|
Management Board Report - Business Ethics and Compliance
|
|||
|
16C
|
Principal Accountant Fees and Services
|
||
|
Other Appendices - Appendix - Principal Accountant Fees and Services
|
|||
|
16D
|
Exemptions from the Listing Standards for Audit Committees
|
||
|
Not applicable
|
|||
|
16E
|
Purchases of Equity Securities by the Issuer and Affiliated Purchasers
|
||
|
Consolidated Financial Statements - Notes to the Consolidated Financial Statements - Note 29 Purchases of equity securities by the issuer and affiliated purchasers
|
|||
|
16F
|
Change in Registrant’s Certifying Accountant
|
||
|
None
|
|||
|
16G
|
Corporate Governance
|
||
|
Corporate Governance - Other Information on Governance - NASDAQ Corporate Governance Standards
|
91
|
||
|
16H
|
Mine Safety Disclosure
|
||
|
Not applicable
|
|||
|
Part III
|
|||
|
17
|
Financial Statements
|
||
|
Not applicable
|
|||
|
18
|
Financial Statements
|
||
|
Consolidated Financial Statements
|
|||
|
19
|
Exhibits
|
||
|
Exhibit Index
|
|||
|
Definitions
|
|||
|
Definitions
|
|||
This document contains information required for the Annual Report on Form 20-F for the year ended December 31,
2018
of ASML Holding N.V. Reference is made to the Form 20-F cross reference table contained herein under
‘
Reference Table - 20-F
’
. Only the information in this document that is referenced in the Form 20-F cross reference table and this paragraph shall be deemed to be filed with the Securities and Exchange Commission for any purpose. Any additional information in this document which is not referenced in the Form 20-F cross reference table, or the Exhibits themselves, shall not be deemed to be incorporated by reference, shall not be part of the
2018
Annual Report on Form 20-F and is furnished to the Securities and Exchange Commission for information only.
ASML INTEGRATED REPORT 2018
206
ASML INTEGRATED REPORT 2018
207

ASML INTEGRATED REPORT 2018
208
|
|
|
|
|
Name
|
|
Description
|
|
3TG
|
|
Tin, tantalum, tungsten and gold
|
|
|
|
|
|
AFM
|
|
Autoriteit Financiële Markten; Authority for the Financial Markets of the Netherlands
|
|
|
|
|
|
AGM
|
|
Annual General Meeting of Shareholders
|
|
|
|
|
|
ArF
|
|
Argon Fluoride
|
|
|
|
|
|
ArFi
|
|
Argon Fluoride Immersion
|
|
|
|
|
|
ASC
|
|
Accounting Standards Codification
|
|
|
|
|
|
ASML
|
|
ASML Holding N.V. and / or any of its subsidiaries and / or any equity method investments, as the context may require
|
|
|
|
|
|
ASML Foundation
|
The ASML Foundation supports projects in the regions where ASML operates. It’s aim is to increase the self-sufficiency of disadvantaged youngsters (4 - 18 years old) through educational initiatives that develop their talents and unlock their potential
|
|
|
ASU
|
|
Accounting Standards Update
|
|
BEAT
|
|
Base Erosion Anti-Abuse Tax regime
|
|
|
|
|
|
BEPS
|
|
Base Erosion and Profit Shifting
|
|
|
|
|
|
BoM
|
|
Board of Management
|
|
|
|
|
|
Brion
|
|
Brion Technologies, Inc.
|
|
|
|
|
|
Business Principles
|
|
Business principles of ASML
|
|
|
|
|
|
Canon
|
|
Canon Kabushiki Kaisha
|
|
|
|
|
|
CCIP
|
|
Customer Co-Investment Program
|
|
|
|
|
|
CEO
|
|
Chief Executive Officer
|
|
|
|
|
|
CFO
|
|
Chief Financial Officer
|
|
|
|
|
|
Code
|
|
Dutch Corporate Governance Code
|
|
|
|
|
|
Code of Conduct
|
|
Code of ethics and conduct
|
|
|
|
|
|
Company
|
|
ASML Holding N.V.
|
|
|
|
|
|
CO
2
|
|
Carbon Dioxide
|
|
|
|
|
|
CO
2
footprint - direct scope 1
|
Consists of the combustion of natural gas and purchased CO
2
|
|
|
CO
2
footprint - indirect scope 2
|
Calculated by multiplying electricity consumptions of the manufacturing locations by the local conversion factors
|
|
|
COO
|
|
Chief Operations Officer
|
|
|
|
|
|
CPU
|
Central Processing Unit
|
|
|
|
|
|
|
CTO
|
|
Chief Technology Officer
|
|
|
|
|
|
Cymer
|
|
Cymer Inc., Cymer LLC and its subsidiaries
|
|
|
|
|
|
D&E
|
|
Development and Engineering
|
|
|
|
|
|
DAP
|
|
Development Action Plan
|
|
|
|
|
|
DRAM
|
|
Dynamic Random Access Memory (often called performance memory)
|
|
|
|
|
|
DSP
|
Digital Signal Processor
|
|
|
|
|
|
|
Dutch Central Bank
|
|
The Dutch Central Bank (De Nederlandsche Bank), which is the supervisor of all pension companies in the Netherlands
|
|
|
|
|
|
DUV
|
|
Deep Ultraviolet
|
|
|
|
|
|
EEA
|
|
European Economic Area
|
|
EGM
|
|
Extraordinary General Meeting
|
|
|
|
|
|
EHS
|
|
Environment, Health and Safety
|
|
|
|
|
|
EHS Competence Center
|
|
Defines EHS standards for ASML, gathers best-known practices and helps managers across the business to implement these
|
|
|
|
|
|
EMEA
|
|
Europe, the Middle East and Africa
|
|
|
|
|
ASML INTEGRATED REPORT 2018
209
|
|
|
|
|
Name
|
|
Description
|
|
EPS
|
|
Earnings Per Share
|
|
ERM
|
|
Enterprise Risk Management
|
|
|
|
|
|
ESOP
|
|
Employee Stock and Stock Option Plans
|
|
|
|
|
|
EURIBOR
|
|
Euro Interbank Offered Rate
|
|
|
|
|
|
Eurobonds
|
|
A bond that is denominated in Euro
|
|
|
|
|
|
Euroclear Nederland
|
|
Nederlands Centraal Instituut voor Giraal Effectenverkeer B.V.
|
|
|
|
|
|
Euronext Amsterdam
|
|
Euronext Amsterdam N.V.
|
|
|
|
|
|
EU
|
|
European Union
|
|
|
|
|
|
EUV
|
|
Extreme Ultraviolet
|
|
|
|
|
|
Exchange Act
|
|
US Securities Exchange Act of 1934
|
|
|
|
|
|
Fab
|
|
Fabrication plant (semiconductors)
|
|
|
|
|
|
FASB
|
|
Financial Accounting Standards Board
|
|
|
|
|
|
FAT
|
|
Factory Acceptance Test
|
|
|
|
|
|
FMO
|
|
Future Modus of Operations
|
|
|
|
|
|
FMSA
|
|
Financial Markets Supervision Act (Wet op het financieel toezicht (Wft))
|
|
|
|
|
|
Foundation
|
|
Stichting Preferente Aandelen ASML
|
|
|
|
|
|
Foundry
|
|
Contract Manufacturers of Logic Chips
|
|
|
|
|
|
FTEs
|
|
Full-time equivalents
|
|
|
|
|
|
Functional Ownership
|
|
Functional Ownership maturity measures the level of required knowledge among our teams of experts about the system functions they are responsible for
|
|
GDPR
|
|
General Data Protection Regulation
|
|
|
|
|
|
GPU
|
|
Graphics Processing Unit
|
|
|
|
|
|
GRI
|
|
Global Reporting Initiative
|
|
|
|
|
|
GRI standards
|
|
GRI Sustainability Reporting Standards
|
|
GILTI
|
|
Global Intangible Low-Tax regime
|
|
|
|
|
|
H
2
|
|
Hydrogen
|
|
|
|
|
|
High NA
|
|
High Numerical Aperture
|
|
|
|
|
|
HMI
|
|
Hermes Microvision, Inc.
|
|
|
|
|
|
Holistic Lithography
|
|
Adjusting the patterning process steps as a whole, in order to support optimization of the entire chip making process
|
|
|
|
|
|
IC
|
|
Integrated Circuit
|
|
IDM
|
|
Integrated device manufacturer
|
|
|
|
|
|
i-line
|
|
Lithography system with a mercury lamp as light source
|
|
|
|
|
|
IFRS
|
|
International Financial Reporting Standards
|
|
|
|
|
|
IFRS-EU
|
|
International Financial Reporting Standards as adopted by the European Union
|
|
|
|
|
|
Imaging
|
|
Transferring the pattern structure on the wafer
|
|
|
|
|
|
imec
|
|
Interuniversitair Micro-Elektronica Centrum
|
|
|
|
|
|
Installed Base Management
|
Net service and field option sales
|
|
|
Intel
|
|
Intel Corporation
|
|
|
|
|
|
Internet of Things (IoT)
|
|
The internetworking of physical devices, vehicles, buildings and other items—embedded with electronics, software, sensors, actuators, and network connectivity that enable these objects to collect and exchange data
|
|
|
|
|
|
IRS
|
|
Internal Revenue Service
|
|
|
|
|
|
ISO
|
|
International Organization for Standardization
|
ASML INTEGRATED REPORT 2018
210
|
|
|
|
|
Name
|
|
Description
|
|
|
|
|
|
KPI
|
|
Key Performance Indicator
|
|
|
|
|
|
KPMG
|
|
KPMG Accountants N.V.
|
|
|
|
|
|
KrF
|
|
Krypton Fluoride
|
|
|
|
|
|
kWh
|
|
kilo Watt hour
|
|
|
|
|
|
LGBTI
|
|
Lesbian, gay, bisexual, transgender and intersex
|
|
|
|
|
|
LIBOR
|
|
London Interbank Offered Rate
|
|
|
|
|
|
Logic
|
|
Integrated Device Manufacturers and Foundries
|
|
|
|
|
|
LTI
|
|
Long-Term Incentive
|
|
|
|
|
|
Memory
|
|
NAND-Flash Memory and DRAM Memory chip makers
|
|
|
|
|
|
mm
|
|
Millimeter (one thousandth of a meter)
|
|
MOU
|
Memorandum of Understanding
|
|
|
|
|
|
|
MRI
|
|
Magnetic Resonance Imaging
|
|
|
|
|
|
NAND
|
|
A binary operator composite of ‘NOT AND’ (often called storage memory)
|
|
|
|
|
|
NASDAQ
|
|
NASDAQ Stock Market LLC
|
|
|
|
|
|
New York Transfer Agent
|
|
J.P. Morgan Chase Bank, N.A.
|
|
|
|
|
|
Nikon
|
|
Nikon Corporation
|
|
|
|
|
|
Nikon Cross-License Agreement
|
|
The patent Cross-License agreement between Nikon and ASML related to lithography equipment used to manufacture semiconductor devices
|
|
|
|
|
|
nm
|
|
Nanometer (one billionth of a meter)
|
|
|
|
|
|
Node
|
|
The ‘technology node’ (also known as the ‘process node’ or simply ‘node’) is a common metric used in the semiconductor industry to describe and differentiate the technologies used in fabricating microchips. Generally, a smaller technology node means a smaller feature size, allowing the production of smaller transistors which are both faster and use less power. Marketing claims and discrepancies among chip producers (foundries) means that the numbers assigned to a node - such as 45 nm, 32 nm, 22 nm, 16 nm, 14 nm, or 10 nm - have lost the exact meaning they once held. The numbers now refer more to a specific generation of chips, made using a particular technology.
|
|
|
|
|
|
Non-GAAP
|
A numerical measure of a company’s historical or future financial performance, financial position, or cash flows which are not calculated or presented in accordance with the most comparable Generally Accepted Accounting Principles (GAAP) measure
|
|
|
Non-Resident Holder
|
|
A holder of ordinary shares who is not, or is not deemed to be, a resident of the Netherlands for Dutch tax purposes
|
|
|
|
|
|
NPU
|
Neural Processing Unit
|
|
|
|
|
|
|
NRE
|
|
Non Recurring Engineering
|
|
|
|
|
|
NRE Funding Agreements
|
|
The Intel NRE Funding Agreements, the Samsung NRE Funding Agreement and the TSMC NRE Funding Agreements
|
|
|
|
|
|
NXE
|
|
NXE platform; a new platform utilizing the concepts of the TWINSCAN platform with complete new technologies in three areas: light source, lens system, and vacuum body
|
|
|
|
|
|
NXT
|
|
TWINSCAN NXT systems; an improved version of the TWINSCAN systems, introducing new stages and stage position control technology, which enables improved imaging and overlay
|
|
|
|
|
|
OCI
|
|
Other Comprehensive Income
|
|
|
|
|
|
OECD
|
|
Organization for Economic Co-operation and Development
|
|
|
|
|
|
Overlay
|
|
The layer-to-layer alignment of patterning structures
|
|
|
|
|
|
Participating Customers
|
|
The participants in the Customer Co-Investment Program: Intel, TSMC, and Samsung
|
|
|
|
|
|
Patent Selection
|
|
As included in the Nikon Cross-License Agreement, a selection of a limited number of the other party’s patents, where the license for such patents expired in 2009, which is subject to a permanent covenant not to sue in respect of patent infringement claims
|
|
Pattern Fidelity
|
|
Improving how accurately a structure is printed and transferred compared to the design by use of metrology solutions (e.g. ASML YieldStar), inspection solutions (e.g. HMI e-beam tools) and statistical modeling to guide inspection on the wafer
|
|
|
|
|
|
Pattern Fidelity Control
|
|
Measuring how good a structure is printed and etched compared to the structure on the reticle
|
ASML INTEGRATED REPORT 2018
211
|
|
|
|
|
Name
|
|
Description
|
|
|
|
|
|
Patterning
|
|
The interaction of lithography and resist with etching, deposition, cleaning and metrology in order to produce a pattern on the wafer
|
|
PME
|
|
Bedrijfstakpensioenfonds Metalektro
|
|
|
|
|
|
PPM
|
|
People Performance Management process
|
|
|
|
|
|
Preference Share Option
|
|
An option to acquire cumulative preference shares in our capital
|
|
|
|
|
|
R&D
|
|
Research and Development
|
|
|
|
|
|
RBA
|
|
Responsible Business Alliance
|
|
|
|
|
|
RDA
|
|
Research and Development Deduction ("Research and Development Aftrek")
|
|
|
|
|
|
REACH
|
|
Registration, Evaluation, Authorization, and Restriction of Chemicals
|
|
|
|
|
|
Remuneration Policy
|
|
Remuneration Policy applicable to the Board of Management of ASML Holding N.V.
|
|
|
|
|
|
Reticle
|
|
Also known as Mask
|
|
|
|
|
|
ROAIC
|
|
Return on Average Invested Capital
|
|
|
|
|
|
RoHS
|
|
Restriction of Hazardous Substances
|
|
|
|
|
|
Reporting Unit ASML
|
|
Reporting Unit ASML (which is ASML excluding Reporting Unit Cymer Light Sources)
|
|
|
|
|
|
Samsung
|
|
Samsung Electronics Corporation
|
|
|
|
|
|
Sarbanes-Oxley Act
|
|
The Sarbanes-Oxley Act of 2002
|
|
SAT
|
Site Acceptance Test
|
|
|
|
|
|
|
SB
|
|
Supervisory Board of ASML
|
|
|
|
|
|
SDG
|
|
United Nations Sustainable Development Goals
|
|
|
|
|
|
SEC
|
|
The United States Securities and Exchange Commission
|
|
|
|
|
|
SEMI
|
|
Semiconductor Equipment and Materials International
|
|
|
|
|
|
SEMI S2
|
|
The SEMI S2 Safety Guideline,
Environmental, Health, and Safety Guideline for Semiconductor Manufacturing Equipment
, is intended as a set of performance-based EHS considerations for semiconductor manufacturing equipment.
|
|
|
|
|
|
SEMI S23
|
|
SEMI S23 Guide for Conservation of Energy, Utilities, and Materials Used by Semiconductor Manufacturing Equipment prescribes a method to collect, analyze, and report energy-consuming semiconductor manufacturing equipment utility data.
|
|
|
|
|
|
SG&A
|
|
Selling, General and Administrative
|
|
|
|
|
|
Shrink
|
|
Shrink is the process of developing smaller transistors on chips, using increasingly sophisticated lithography techniques
|
|
|
|
|
|
Silicon Valley Group
|
|
Silicon Valley Group, Inc. (SVG)
|
|
|
|
|
|
SoC
|
System on a Chip
|
|
|
STEM
|
|
Science, technology, engineering and maths
|
|
|
|
|
|
STI
|
|
Short-Term Incentive
|
|
|
|
|
|
Technical Competence
|
|
Technical Competence maturity gauges the capabilities and spread of technical competences among our people and also the extent to which they are embedded in our processes and operations
|
|
|
|
|
|
Transistor
|
|
The transistor is the fundamental building block of modern electronic devices, and is ubiquitous in modern electronic systems. A transistor is a semiconductor device used to amplify or switch electronic signals and electrical power. It is composed of semiconductor material usually with at least three terminals for connection to an external circuit. A voltage or current applied to one pair of the transistor’s terminals controls the current through another pair of terminals. Because the controlled (output) power can be higher than the controlling (input) power, a transistor can amplify a signal. Transistors are in general found embedded in integrated circuits.
|
|
|
|
|
|
Throughput
|
|
The number of wafers a system can process per hour
|
|
|
|
|
|
TJ
|
|
Terajoule, the unit of energy
|
|
|
|
|
|
Transfer Agent Agreement
|
|
Agreement about transfer, registrar and dividend disbursement
|
|
|
|
|
|
TSMC
|
|
Taiwan Semiconductor Manufacturing Company Ltd.
|
|
|
|
|
ASML INTEGRATED REPORT 2018
212
|
|
|
|
|
Name
|
|
Description
|
|
US
|
|
United States
|
|
|
|
|
|
US GAAP
|
|
Generally Accepted Accounting Principles in the United States of America
|
|
|
|
|
|
VAT
|
|
Value-added tax
|
|
|
|
|
|
Variable interest entity shareholders
|
|
Syndicate of three banks formed solely for the purpose of leasing the headquarter in Veldhoven
|
|
|
|
|
|
VLSI
|
|
An independent industry research firm that surveyed customers representing 95.0 percent of the world’s total semiconductor market
|
|
|
|
|
|
WACC
|
|
Weighted Average Cost of Capital
|
|
|
|
|
|
Wavelength
|
|
The frequency of light going through projection lenses; the shorter the wavelength, the smaller the line-width and the finer the pattern on the IC
|
|
|
|
|
|
Website
|
|
www.asml.com.
Information on our website is not incorporated into, and does not form part of this Integrated Report.
|
|
|
|
|
|
Works Council
|
|
Works Council of ASML Netherlands B.V.
|
|
XBRL
|
|
Extensible Business Reporting Language
|
|
|
|
|
|
YieldStar
|
|
Advanced wafer metrology system
|
ASML INTEGRATED REPORT 2018
213
ASML Holding N.V. hereby certifies that it meets all of the requirements for filing on Form 20-F and that it has duly caused and authorized the undersigned to sign this Annual Report on Form 20-F on its behalf.
ASML Holding N.V. (Registrant)
/s/ Peter T.F.M. Wennink
Name: Peter T.F.M. Wennink
Title: President, CEO and member of the Board of Management
Dated:
February 5, 2019
/s/ Roger J.M. Dassen
Name: Roger J.M. Dassen
Title: Executive Vice President, CFO and member of the Board of Management
Dated:
February 5, 2019
ASML INTEGRATED REPORT 2018
214
ASML INTEGRATED REPORT 2018
215

ASML INTEGRATED REPORT 2018
216
Exhibit Index
|
|
|
|
|
Exhibit No.
|
Description
|
|
|
1
|
||
|
4.1
|
Agreement between ASM Lithography B.V. and Carl Zeiss, dated March 17, 2000 (Incorporated by reference to the Registrant’s Annual Report on Form 20-F for the fiscal year ended December 31, 2000)
1
|
|
|
4.2
|
||
|
4.3
|
||
|
4.4
|
||
|
4.5
|
||
|
4.6
|
||
|
4.7
|
||
|
4.8
|
||
|
4.9
|
||
|
4.10
|
||
|
4.11
|
||
|
4.12
|
||
|
8.1
|
||
|
12.1
|
||
|
13.1
|
||
|
15.1
|
||
|
101.INS
|
XBRL Instance Document
2
|
|
|
101.SCH
|
XBRL Taxonomy Extension Schema Document
2
|
|
|
101.CAL
|
XBRL Taxonomy Extension Calculation Linkbase Document
2
|
|
|
101.DEF
|
XBRL Taxonomy Extension Definition Linkbase Document
2
|
|
|
101.LAB
|
XBRL Taxonomy Extension Label Linkbase Document
2
|
|
|
101.PRE
|
XBRL Taxonomy Extension Presentation Linkbase Document
2
|
|
|
1.
|
Certain information omitted pursuant to a request for confidential treatment filed separately with the SEC.
|
|
2.
|
Filed at the SEC herewith.
|
ASML is party to 4 debt instruments under which the total amount of securities under each debt instrument does not exceed 10 percent of the total assets of ASML and its subsidiaries on a consolidated basis. Pursuant to paragraph 2(b) (i) of the instructions to the exhibits to Form 20-F, ASML agrees to furnish a copy of such instruments to the SEC upon request.
ASML INTEGRATED REPORT 2018
217

ASML ANNUAL REPORT 2016
219
TABLE OF CONTENTS
Item 17 ( ) Item 18 ( )Note 20 Legal ContingenciesNote 10 Equity Method InvestmentsNote 1 General Information / Summary Of Significant Accounting PoliciesNote 13 Property, Plant and EquipmentNote 2 Business CombinationsNote 16 Long-term DebtNote 4 Financial Risk ManagementNote 5 Cash and Cash Equivalents and Short-term InvestmentsNote 11 GoodwillNote 12 Other Intangible AssetsNote 3 Fair Value MeasurementNote 9 Other AssetsNote 19 Employee BenefitsNote 18 Commitments, Contingencies and GuaranteesNote 14 Right-of-use Assets and Lease LiabilitiesNote 15 Accrued and Other LiabilitiesNote 23 Revenue From Contracts with CustomersNote 31 Related Party TransactionsNote 29 Purchases Of Equity Securities By The Issuer and Affiliated Purchasers