ALTISOURCE PORTFOLIO SOLUTIONS S.A.
10-Ks and 10-Qs
UNITED STATES
SECURITIES AND EXCHANGE COMMISSION
Washington, D.C. 20549
FORM 10-K
|
(Mark One)
|
|
|
þ
|
ANNUAL REPORT PURSUANT TO SECTION 13 OR 15(d) OF THE SECURITIES EXCHANGE ACT OF 1934
|
For the fiscal year ended December 31,
2019
OR
|
o
|
TRANSITION REPORT PURSUANT TO SECTION 13 OR 15(d) OF THE SECURITIES EXCHANGE ACT OF 1934
|
For the transition period from to
Commission File Number: 1-34354
ALTISOURCE PORTFOLIO SOLUTIONS S.A.
(Exact name of registrant as specified in its Charter)
|
Luxembourg
|
98-0554932
|
|
|
(State or other jurisdiction of incorporation or organization)
|
(I.R.S. Employer Identification No.)
|
|
40, avenue Monterey
L-2163 Luxembourg
Grand Duchy of Luxembourg
(352) 24 69 79 00
(Address and telephone number, including area code, of registrant’s principal executive offices)
Securities registered pursuant to Section 12(b) of the Act:
|
Title of each class
|
Trading Symbol
|
Name of each exchange on which registered
|
||
|
Common Stock, $1.00 par value
|
ASPS
|
NASDAQ Global Select Market
|
||
Securities registered pursuant to Section 12(g) of the Act:
None
Indicate by check mark if the registrant is a well-known seasoned issuer, as defined in Rule 405 of the Securities Act. Yes
o
No
þ
Indicate by check mark if the registrant is not required to file reports pursuant to Section 13 or Section 15(d) of the Act. Yes
o
No
þ
Indicate by check mark whether the registrant (1) has filed all reports required to be filed by Section 13 or 15(d) of the Securities Exchange Act of 1934 during the preceding 12 months (or for such shorter period that the registrant was required to file such reports), and (2) has been subject to such filing requirements for the past 90 days. Yes
þ
No
o
Indicate by check mark whether the registrant has submitted electronically every Interactive Data File required to be submitted pursuant to Rule 405 of Regulation S-T (§232.405 of this chapter) during the preceding 12 months (or for such shorter period that the registrant was required to submit such files). Yes
þ
No
o
Indicate by check mark whether the registrant is a large accelerated filer, an accelerated filer, a non-accelerated filer, a smaller reporting company, or an emerging growth company. See definitions of “large accelerated filer,” “accelerated filer,” “smaller reporting company,” and “emerging growth company” in Rule 12b-2 of the Exchange Act.
|
Large accelerated filer
o
|
Accelerated filer
þ
|
|
Non-accelerated filer
o
|
Smaller reporting company
o
|
|
Emerging growth company
o
|
|
If an emerging growth company, indicate by check mark if the registrant has elected not to use the extended transition period for complying with any new or revised financial accounting standards provided pursuant to Section 13(a) of the Exchange Act.
o
Indicate by check mark whether the registrant is a shell company (as defined in Rule 12b-2 of the Act). Yes
o
No
þ
The aggregate market value of the voting stock held by non-affiliates of the registrant as of June 30, 2019 was
$241,235,101
based on the closing share price as quoted on the NASDAQ Global Select Market on that day and the assumption that all directors and executive officers of the Company are affiliates. This determination of affiliate status is not necessarily a conclusive determination for any other purpose.
As of
February 28, 2020
, there were
15,519,003
outstanding shares of the registrant’s common stock (excluding
9,893,745
shares held as treasury stock).
DOCUMENTS INCORPORATED BY REFERENCE
Portions of the registrant’s Definitive Proxy Statement to be filed subsequent to the date hereof with the Securities and Exchange Commission pursuant to Regulation 14A in connection with the registrant’s Annual Meeting of Shareholders to be held on
May 19, 2020
are incorporated by reference into Part III of this report. Such Definitive Proxy Statement will be filed with the Securities and Exchange Commission not later than 120 days after the conclusion of the registrant’s fiscal year ended
December 31, 2019
.
TABLE OF CONTENTS
ALTISOURCE PORTFOLIO SOLUTIONS S.A.
FORM 10-K
|
Page
|
|||
|
|
|||
|
|
|||
|
|
|||
|
|
|||
|
|
|||
|
|
|||
2
FORWARD-LOOKING STATEMENTS
This Annual Report on Form 10-K and certain information incorporated herein by reference contain forward-looking statements within the safe harbor provisions of the Private Securities Litigation Reform Act of 1995. These statements may relate to, among other things, future events or our future performance or financial condition. Words such as “anticipate,” “intend,” “expect,” “may,” “could,” “should,” “would,” “plan,” “estimate,” “believe,” “predict,” “potential” or “continue” or the negative of these terms and comparable terminology are intended to identify such forward-looking statements. Such statements are based on expectations as to the future and are not statements of historical fact. Furthermore, forward-looking statements are not guarantees of future performance and involve a number of assumptions, risks and uncertainties that could cause actual results to differ materially. Important factors that could cause actual results to differ materially from those suggested by the forward-looking statements include, but are not limited to, the risks discussed in Item 1A of Part I “Risk Factors.” We caution you not to place undue reliance on these forward-looking statements which reflect our view only as of the date of this report. We are under no obligation (and expressly disclaim any obligation) to update or alter any forward-looking statements contained herein to reflect any change in our expectations with regard thereto or change in events, conditions or circumstances on which any such statement is based.
PART I
Except as otherwise indicated or unless the context requires otherwise “Altisource,” the “Company,” “we,” “us,” or “our” refer to Altisource Portfolio Solutions S.A., a Luxembourg société anonyme, or public limited liability company, together with its subsidiaries.
|
ITEM 1.
|
BUSINESS
|
The Company
Altisource
®
is an integrated service provider and marketplace for the real estate and mortgage industries. Combining operational excellence with a suite of innovative services and technologies, Altisource helps solve the demands of the ever-changing markets we serve.
We are publicly traded on the NASDAQ Global Select Market under the symbol “ASPS.” We are organized under the laws of the Grand Duchy of Luxembourg.
We have prepared our consolidated financial statements in accordance with accounting principles generally accepted in the United States of America (“GAAP”).
Effective January 1, 2019, the Company reorganized its internal reporting structure in connection with Project Catalyst, a project initiated in August 2018 to optimize our operations and reduce costs to better align our cost structure with our anticipated revenues and improve our operating margins. The internal reorganization included, among other changes, the replacement of segment presidents with a chief operating officer, who is responsible for products, services and operations for the Company’s Mortgage Market and Real Estate Market businesses, reporting to our Chairman and Chief Executive Officer (our chief operating decision maker) who manages our businesses, regularly reviews operating results and profitability, allocates resources and evaluates performance on a consolidated basis. Prior to January 1, 2019, the Company reported our operations through
two
reportable segments:
Mortgage Market
and
Real Estate Market
. In addition, we reported
Other Businesses, Corporate and Eliminations
separately. The prior years’ presentation has been reclassified to conform to the current year presentation.
Our principal revenue generating activities are as follows:
Core Businesses
Field Services
|
•
|
Property preservation and inspection services, including vendor management, marketplace transaction management, payment management technologies and a vendor management oversight software-as-a-service (“SaaS”) platform
|
Marketplace
|
•
|
Hubzu
®
online real estate auction platform, real estate auction, real estate brokerage and asset management
|
|
•
|
Equator
®
, a SaaS-based technology to manage real estate owned (“REO”), short sales, foreclosure, bankruptcy and eviction processes
|
3
Mortgage and Real Estate Solutions
|
•
|
Mortgage origination loan fulfillment, certification and certification insurance services and technologies
|
|
•
|
Title insurance (as an agent), settlement and valuation services
|
|
•
|
Residential and commercial construction inspection and risk mitigation services
|
|
•
|
Management of the Best Partners Mortgage Cooperative, Inc., doing business as Lenders One
®
(“Lenders One”), mortgage banking cooperative
|
|
•
|
Foreclosure trustee services
|
Other Businesses
Earlier Stage Business
|
•
|
Pointillist
®
customer journey analytics platform
|
Other
|
•
|
Financial Services business, including post-charge-off consumer debt and mortgage charge-off collection services and customer relationship management services (sold on July 1, 2019)
|
|
•
|
Buy-Renovate-Lease-Sell (“BRS”) business (wind down completed in 2019)
|
|
•
|
Residential loan servicing technologies, document management platform and information technology (“IT”) infrastructure management services (wind down completed in 2019 following Ocwen’s transition to another servicing platform)
|
|
•
|
Commercial loan servicing technology
|
|
•
|
Owners.com
®
technology-enabled real estate brokerage and provider of related mortgage brokerage and title services (discontinued in the fourth quarter of 2019)
|
We classify revenue in three categories: service revenue, revenue from reimbursable expenses and non-controlling interests. In evaluating our performance, we focus on service revenue. Service revenue consists of amounts attributable to our fee-based services and sales of short-term investments in real estate. Reimbursable expenses and non-controlling interests are pass-through items for which we earn no margin. Reimbursable expenses consist of amounts we incur on behalf of our customers in performing our fee-based services that we pass directly on to our customers without a markup. Non-controlling interests represent the earnings of Lenders One. Lenders One is a mortgage cooperative managed, but not owned, by Altisource. Lenders One is included in revenue and reduced from net income to arrive at net income attributable to Altisource.
2019
Highlights
Streamlining Altisource
|
•
|
Sold the Financial Services business, consisting of our Asset Recovery Management, Customer Relationship Management and Mortgage Charge-Off Collections businesses, for
$44.0 million
, consisting of an up-front payment of
$40.0 million
less adjustments and an additional
$4.0 million
scheduled to be paid on the one year anniversary of the closing
|
|
•
|
Sold the remaining BRS inventory for net proceeds of
$41.2 million
|
|
•
|
Closed the Owners.com business, reducing the cash burn associated with this business
|
|
•
|
Sold
690,745
Front Yard Residential Corporation (“RESI”) shares for net proceeds of
$8.0 million
|
|
•
|
Repaid $45.0 million of the senior secured term loan from the sale of the Financial Services business and RESI shares
|
|
•
|
Executed Project Catalyst resulting in approximately $80 million, or 23% lower compensation and benefits, technology and telecommunications, professional services and occupancy related costs compared to 2018
|
Financial
|
•
|
Ended 2019 with $125.4 million of cash, cash equivalents and investment in equity securities
|
|
•
|
Ended 2019 with $168.5 million of net debt less investment in equity securities, 31% lower than December 31, 2018
|
|
•
|
Repurchased 982,162 shares of Altisource common stock at an average price of $20.33 per share
|
Business Highlights
Field Services
|
•
|
Grew Field Services revenue from customers other than Ocwen Financial Corporation (together with its subsidiaries, “Ocwen”), New Residential Investment Corp. (individually, together with one or more of its subsidiaries or one or more of its subsidiaries individually, “NRZ”) and RESI by 55% in 2019 compared to 2018
|
4
Marketplace
|
•
|
Grew Hubzu revenue from customers other than Ocwen, NRZ and RESI by 9% in 2019 compared to 2018
|
|
•
|
Grew Hubzu inventory from customers other than Ocwen, NRZ and RESI by 50% since December 31, 2018, with such inventory representing 35% of total Hubzu inventory as of December 31, 2019
|
Mortgage and Real Estate Solutions
|
•
|
Grew Mortgage and Real Estate Solutions revenue from customers other than Ocwen, NRZ and RESI by 6% in 2019 compared to 2018
|
Pipeline and Customers
|
•
|
Ended the year with a deep sales pipeline and over 500 active customers including all five of the top five servicers, five of the top ten originators, and over 210 Lenders One members
|
Customers
Overview
Our customers include some of the largest financial institutions in the United States, government-sponsored enterprises (“GSEs”), commercial banks, servicers, investors, originators and correspondent lenders and mortgage bankers.
Customer Concentration
Ocwen
Ocwen is a residential mortgage loan servicer of mortgage servicing rights (“MSRs”) it owns, including those MSRs in which others have an economic interest, and a subservicer of MSRs owned by others.
During the year ended
December 31, 2019
, Ocwen was our largest customer, accounting for
56%
of our total revenue. Ocwen purchases certain mortgage services from us under the terms of services agreements and amendments thereto (collectively, the “Ocwen Services Agreements”) with terms extending through August 2025. Certain of the Ocwen Services Agreements contain a “most favored nation” provision and also grant the parties the right to renegotiate pricing, among other things.
In February 2019, Altisource and Ocwen entered into agreements that, among other things, facilitate Ocwen’s transition from REALServicing
®
and related technologies to another mortgage servicing software platform, establish a process for Ocwen to review and approve the assignment of one or more of our agreements to potential buyers of Altisource’s business lines, requiring Ocwen to use Altisource as service provider for certain service referrals totaling an amount equal to 100% of the applicable service referrals on certain portfolios plus an amount equal to not less than 90% of applicable service referrals from certain other portfolios (determined on a service by service basis), subject to certain additional restrictions and limitations, and affirm Altisource’s role as a strategic service provider to Ocwen through August 2025. In connection with these agreements, Altisource expressly preserved and did not waive any of its existing contractual rights relating to service referrals, other than with respect to Ocwen transitioning from the REALServicing and related technologies. If Altisource fails certain performance standards for specified periods of time, then Ocwen may terminate Altisource as a provider for the applicable service(s), subject to certain limitations and Altisource’s right to cure. Ocwen’s transition to another mortgage servicing platform was completed during 2019. We are not experiencing a significant impact of the servicing technology transition on the other services we provide to Ocwen, other than what we believe is a temporary impact on default related referral volume and REO inventory conversion rates from Ocwen’s transition to another servicing system. We believe the REO conversion rates will return to historical levels during the first half of 2020. For the years ended
December 31, 2019
,
2018
and
2017
, service revenue from REALServicing and related technologies was
$14.1 million
,
$35.1 million
and
$37.2 million
, respectively.
Revenue from Ocwen primarily consists of revenue earned from the loan portfolios serviced and subserviced by Ocwen when Ocwen engages us as the service provider, and revenue earned directly from Ocwen, pursuant to the Ocwen Services Agreements. For the years ended
December 31, 2019
,
2018
and
2017
, we recognized revenue from Ocwen of
$362.7 million
,
$437.4 million
and
$542.0 million
, respectively. Revenue from Ocwen as a percentage of consolidated revenue was
56%
,
52%
and
58%
for the years ended
December 31, 2019
,
2018
and
2017
, respectively.
We earn additional revenue related to the portfolios serviced and subserviced by Ocwen when a party other than Ocwen or the MSR owner selects Altisource as the service provider. For the years ended
December 31, 2019
,
2018
and
2017
, we recognized revenue of
$37.5 million
,
$47.1 million
and
$148.5 million
, respectively, related to the portfolios serviced by Ocwen when a party
5
other than Ocwen or the MSR owner selected Altisource as the service provider. These amounts are not included in deriving revenue from Ocwen and revenue from Ocwen as a percentage of revenue discussed above.
As of December 31, 2019, accounts receivable from Ocwen totaled
$19.1 million
,
$15.7 million
of which was billed and
$3.4 million
of which was unbilled. As of
December 31, 2018
, accounts receivable from Ocwen totaled
$15.2 million
,
$11.6 million
of which was billed and
$3.6 million
of which was unbilled.
NRZ
NRZ is a real estate investment trust that invests in and manages investments primarily related to residential real estate, including MSRs and excess MSRs.
Ocwen has disclosed that NRZ is its largest client. As of December 31, 2019, NRZ owned MSRs or rights to MSRs relating to approximately
56%
of loans serviced and subserviced by Ocwen (measured in unpaid principal balance (“UPB”)). In July 2017 and January 2018, Ocwen and NRZ entered into a series of agreements pursuant to which the parties agreed, among other things, to undertake certain actions to facilitate the transfer from Ocwen to NRZ of Ocwen’s legal title to certain of its MSRs (the “Subject MSRs”) and under which Ocwen will subservice mortgage loans underlying the Subject MSRs for an initial term of five years.
On August 28, 2017, Altisource, through its licensed subsidiaries, entered into a Cooperative Brokerage Agreement, as amended, and related letter agreement (collectively, the “Brokerage Agreement”) with NRZ which extends through August 2025. Under this agreement and related amendments, Altisource remains the exclusive provider of brokerage services for REO associated with the Subject MSRs, irrespective of the subservicer, subject to certain limitations. NRZ’s brokerage subsidiary receives a cooperative brokerage commission on the sale of certain REO properties from these portfolios subject to certain exceptions.
The Brokerage Agreement can, at Altisource’s discretion, be terminated by Altisource, if a services agreement is not signed by Altisource and NRZ. A services agreement has not been signed. The parties continue to operate under the Brokerage Agreement. The Brokerage Agreement may otherwise only be terminated upon the occurrence of certain specified events. Termination events include, but are not limited to, a breach of the terms of the Brokerage Agreement (including, without limitation, the failure to meet performance standards and non-compliance with law in a material respect), the failure to maintain licenses which failure materially prevents performance of the contract, regulatory allegations of non-compliance resulting in an adversarial proceeding against NRZ, voluntary or involuntary bankruptcy, appointment of a receiver, disclosure in a Form 10-K or Form 10-Q that there is significant uncertainty about Altisource’s ability to continue as a going concern, failure to maintain a specified level of cash and an unapproved change of control.
For the years ended
December 31, 2019
,
2018
and
2017
, we recognized revenue from NRZ of
$12.5 million
,
$28.7 million
and
$2.4 million
, respectively, under the Brokerage Agreement. For the years ended
December 31, 2019
,
2018
and
2017
, we recognized additional revenue of
$60.0 million
,
$83.6 million
and
$3.9 million
, respectively, relating to the Subject MSRs when a party other than NRZ selects Altisource as the service provider.
Other
Our services are provided to customers located in the United States.
Sales and Marketing
Our enterprise sales and marketing team has extensive relationship management and industry experience. These individuals cultivate and maintain relationships throughout the industry sectors we serve. We sell our suite of services to mortgage servicers, mortgage originators, GSEs, buyers and sellers of homes for investment use and financial services firms.
Our primary sales and marketing focus areas are to:
|
•
|
Expand relationships with existing customers by cross-selling additional services and growing the volume of existing services we provide. We believe our customer relationships represent meaningful growth opportunities for us;
|
|
•
|
Develop new customer relationships by leveraging our comprehensive suite of services, performance and controls. We believe there are meaningful growth opportunities to sell our suite of services to new customers; and
|
|
•
|
Sell new offerings to existing customers and prospects. Some of our newer offerings include our suite of support services for Federal Housing Administration (“FHA”) mortgages, Vendorly™, a SaaS-based vendor management platform, and residential and commercial loan disbursement processing, risk mitigation and construction inspection services.
|
Given the highly regulated nature of the industries that we serve and the comprehensive purchasing process that our institutional customers and prospects follow, the time and effort we spend in expanding relationships or winning new relationships is significant. For example, it can often take more than one year from the request for proposal or qualified lead stage to the selection of Altisource
6
as a service provider. Furthermore, following the selection of Altisource, it is not unusual for it to take an additional six to twelve months or more to negotiate the services agreement(s), complete the implementation procedures and begin receiving referrals.
Intellectual Property and Data
We rely on a combination of contractual restrictions, internal security practices, patents, trademarks and copyrights to establish and protect our trade secrets, intellectual property, software, technology and expertise. We also own or, as necessary and appropriate, have obtained licenses from third parties to intellectual property relating to our services, processes and businesses. These intellectual property rights are important factors in the success of our businesses.
As of December 31, 2019, we have been awarded one patent that expires in 2023, two patents that expire in 2024, eight patents that expire in 2025, three patents that expire in 2026, two patents that expire in 2027, two patents that expire in 2029, one patent that expires in 2030, one patent that expires in 2033, three patents that expire in 2034 and one patent that expires in 2036. In addition, we have registered trademarks in a number of jurisdictions including the United States, the European Union (“EU”), India and nine other jurisdictions. These trademarks generally can be renewed indefinitely, provided they are being used in commerce.
We actively protect our rights and intend to continue our policy of taking the measures we deem reasonable and necessary to develop and protect our patents, trademarks, copyrights, trade secrets and other intellectual property rights.
In addition, we may make use of data in connection with certain of our services. This data generally relates to mortgage information, real property information and consumer information. We gather this data from a variety of third party sources, including from governmental entities and, subject to licensed usage rights, we use this data in connection with the delivery of our services, including combining it with proprietary data we generate to further enhance data and metrics in connection with our services.
Market and Competition
We sell our suite of services to mortgage servicers, mortgage originators, GSEs, buyers and sellers of homes for investment use and financial services firms. The mortgage and real estate markets are very large and are influenced by macroeconomic factors such as credit availability, interest rates, home prices, inflation, unemployment rates and consumer confidence.
The markets to provide services for mortgage servicers and mortgage originators are highly competitive and generally consist of national companies, in-house providers and a large number of regional and local providers. We typically compete based upon product and service awareness and offerings, product and service delivery, quality and control environment, technology integration and support, price and financial strength.
The markets to provide services for buyers and sellers of homes for investment are highly competitive and generally consist of several national companies, a large number of regional and local providers and start-up companies. We typically compete based upon product and service awareness and offerings, product and service delivery, ease of transacting, price and personal service.
Our competitors may have greater financial resources, brand recognition, alternative or disruptive products and technology and other competitive advantages. We cannot determine our market share with certainty, but believe for mortgage servicers we have a modest share of the market, and for the others we have a relatively small market share.
7
Employees
As of
December 31, 2019
, we had the following number of employees:
|
United States
|
India
|
Philippines
|
Uruguay
|
Luxembourg
|
Consolidated Altisource
|
|||||||||||||
|
Total employees
|
748
|
|
2,289
|
|
110
|
|
118
|
|
18
|
|
3,283
|
|
||||||
We have not experienced any work stoppages and we consider our relations with employees to be good. We believe our future success will depend, in part, on our continuing ability to attract, hire and retain skilled and experienced personnel.
Seasonality
Certain of our revenues can be impacted by seasonality. Specifically, revenues from property sales, loan originations and certain property preservation services in Field Services typically tend to be at their lowest level during the fall and winter months and at their highest level during the spring and summer months.
Government Regulation
Our business and the business of our customers are or may be subject to extensive scrutiny and regulation by federal, state and local governmental authorities including the Federal Trade Commission (“FTC”), the Consumer Financial Protection Bureau (“CFPB”), the Securities and Exchange Commission (“SEC”), the Department of Housing and Urban Development (“HUD”), various federal and state banking, financial and consumer regulators and the state and local agencies that license or oversee certain of our auction, real estate brokerage, mortgage and debt collection services, trustee services, property management services and insurance services. We also must comply with a number of federal, state and local laws, which may include, among others:
|
•
|
the Americans with Disabilities Act (“ADA”);
|
|
•
|
the Bank Secrecy Act (“BSA”);
|
|
•
|
the California Consumer Privacy Act (“CCPA”);
|
|
•
|
the California Homeowner Bill of Rights (“CHBR”);
|
|
•
|
the Controlling the Assault of Non-Solicited Pornography And Marketing Act (“CAN-SPAM”);
|
|
•
|
the Equal Credit Opportunity Act (“ECOA”);
|
|
•
|
the Fair and Accurate Credit Transactions Act (“FACTA”);
|
|
•
|
the Fair Credit Reporting Act (“FCRA”);
|
|
•
|
the Fair Housing Act;
|
|
•
|
the Federal Trade Commission Act (“FTC Act”);
|
|
•
|
the Gramm-Leach-Bliley Act (“GLBA”);
|
|
•
|
the Home Affordable Refinance Program (“HARP”);
|
|
•
|
the Home Mortgage Disclosure Act (“HMDA”);
|
|
•
|
the Home Ownership and Equity Protection Act (“HOEPA”);
|
|
•
|
the National Housing Act (“NHA”);
|
|
•
|
the New York Real Property Actions and Proceedings Law (“RPAPL”);
|
|
•
|
the Real Estate Settlement Procedures Act (“RESPA”);
|
|
•
|
the Secure and Fair Enforcement for Mortgage Licensing (“SAFE”) Act;
|
|
•
|
the Servicemembers Civil Relief Act (“SCRA”);
|
|
•
|
the Telephone Consumer Protection Act (“TCPA”);
|
|
•
|
the Truth in Lending Act (“TILA”); and
|
|
•
|
Unfair, Deceptive or Abusive Acts and Practices statutes (“UDAAP”).
|
We are also subject to the requirements of the Foreign Corrupt Practices Act (“FCPA”) and comparable foreign laws, due to our activities in foreign jurisdictions.
In addition to federal and state laws regarding privacy and data security, we are also subject to data protection laws in the countries in which we operate. Additionally, certain of our entities are or may be subject to the European Union General Data Protection Regulation (“GDPR”).
Legal requirements can and do change as statutes and regulations are enacted, promulgated or amended. One such enacted regulation is the Dodd-Frank Wall Street Reform and Consumer Protection Act (“Dodd-Frank Act”). The Dodd-Frank Act is extensive and includes reform of the regulation and supervision of financial institutions, as well as the regulation of derivatives, capital market activities and consumer financial services. The Dodd-Frank Act, among other things, created the CFPB, a federal entity responsible
8
for regulating consumer financial services and products. Title XIV of the Dodd-Frank Act contains the Mortgage Reform and Anti-Predatory Lending Act (“Mortgage Act”). The Mortgage Act imposes a number of additional requirements on lenders and servicers of residential mortgage loans by amending and expanding certain existing regulations. The interpretation or enforcement by regulatory authorities of applicable laws and regulations also may change over time. In addition, the creation of new regulatory authorities or changes in the regulatory authorities overseeing applicable laws and regulations may also result in changing interpretation or enforcement of such laws or regulations.
Our failure or the failure of our customers or vendors to comply with applicable laws or regulations or changing interpretation of such laws or regulations could subject the Company to criminal or civil liability, significant penalties, fines, settlements, costs and consent orders affecting us or our customers that may curtail or restrict the business as it is currently conducted and could have a material adverse effect on our financial condition or results of operations.
Furthermore, certain of our services are provided at the direction of, and pursuant to, the identified requirements of our customers. The failure of our customers to properly identify or account for regulatory requirements applicable to such services could expose us to significant penalties, fines, settlements, costs and consent orders that could have an adverse effect on our financial condition or results of operations.
We may be subject to licensing and regulation as a provider of certain services including, among others, services as a mortgage origination underwriter, mortgage broker, valuation provider, appraisal management company, asset manager, property renovator, title insurance agent, insurance broker and underwriter, real estate broker, auctioneer and foreclosure trustee in a number of jurisdictions. Our employees and subsidiaries may be required to be licensed by or registered with various jurisdictions for the particular type of service sold or provided and to participate in regular continuing education programs. Periodically, we are subject to audits, examinations and investigations by federal, state and local governmental authorities and receive subpoenas, civil investigative demands or other requests for information from such governmental authorities in connection with their regulatory or investigative authority. Due to the inherent uncertainty of such actions, it is often difficult to predict the potential outcome or estimate any potential financial impact in connection with any such inquiries.
Available Information
We file Annual Reports on Form 10-K, Quarterly Reports on Form 10-Q, Current Reports on Form 8-K and other information with the SEC. These filings are available to the public on the SEC’s website at
www.sec.gov
.
Our principal Internet address is
www.altisource.com
and we encourage investors to use it as a way to easily find information about us. We promptly make the reports we file or furnish with the SEC, corporate governance information (including our Code of Business Conduct and Ethics), select press releases and other related information available on this website. The contents of our website are available for informational purposes only and shall not be deemed incorporated by reference in this report.
|
ITEM 1A.
|
RISK FACTORS
|
The following risk factors and other information included in this Annual Report on Form 10-K should be carefully considered. The risks and uncertainties described below are not the only ones we face.
Additional risks and uncertainties not presently known to us or that we presently deem less significant may also impair our business operations. If any of the following risks, or other events related to such risks, or additional risks and uncertainties not presently known to us or that we currently deem immaterial, actually occur or become material, our business, reputation, results of operations and financial condition could be adversely affected. Furthermore, the risk factors described below may not describe the full nature or scope of such risks.
Risks Related to Our Business and Industry
Negative or positive changes in economic conditions and in the United States housing market can affect demand for various of our services, which could reduce our revenues and adversely affect our business and results of operations.
The performance and growth of certain of our businesses are dependent on the number of outstanding mortgages, mortgage delinquency rates, volume of residential loan originations and single-family residential real estate transactions in the United States. In the event of an economic slowdown, increase in interest rates or any other factor that would lead to a decrease in the volume of residential real estate transactions, our origination services, businesses related to the purchase or sale of closed residential mortgages and insurance services businesses could be adversely affected. Conversely, a strengthening economy and housing market, or changes in applicable regulations or requirements in dealing with delinquent borrowers or regarding foreclosure practices, may result in lower delinquencies or foreclosures, resulting in a decline in demand for our default-related businesses. Further, in the event that adverse economic conditions or other factors lead to a decline in levels of home ownership and a reduction in the aggregate number of United States mortgage loans outstanding, our business and results of operations could be adversely affected.
9
Our business is subject to substantial competition which may adversely affect our business and results of operations.
The markets for our services are very competitive. Our competitors vary in size and in the scope, breadth and combination of the services they offer. We compete for existing and new customers against both third parties and the in-house capabilities of our customers and potential customers. Some of our competitors are more established, better known, have a stronger reputation and greater resources, or provide services, performance or pricing that may be more attractive to potential customers, and some have widely-used technology platforms which they seek to use as a competitive advantage to drive sales of other competing products and services. We may not be able to compete successfully against current or future competitors. Competitive pressures we face in the markets in which we operate may adversely affect our business and results of operations.
Ocwen is currently our largest customer and the loss of Ocwen as a customer or a significant reduction in the volume of services that we provide to Ocwen could adversely affect our business and results of operations.
During the year ended
December 31, 2019
, Ocwen was our largest customer, accounting for
56%
of our total revenue. Additionally,
6%
of our revenue for the year ended
December 31, 2019
was earned on the loan portfolios serviced by Ocwen, when a party other than Ocwen or the MSR owner selected Altisource as the service provider.
Ocwen has disclosed that it is subject to a number of ongoing federal and state regulatory examinations, consent orders, inquiries, subpoenas, civil investigative demands, requests for information and other actions and is subject to pending legal proceedings, some of which include claims against Ocwen for substantial monetary damages. While not inclusive, regulatory actions to date have included subjecting Ocwen to independent oversight of its operations and placing certain restrictions on its ability to acquire servicing rights. Ocwen may become subject to future federal and state regulatory investigations, inquiries, requests for information and legal proceedings, any of which could also result in adverse regulatory or other actions against Ocwen.
The foregoing may have significant adverse effects on Ocwen’s business and/or our continuing relationship with Ocwen. For example, Ocwen may be required to alter the way it conducts business, including the parties with which it contracts for services, it may be required to seek changes to its existing pricing structure with us, it may lose its non-GSE servicing rights or subservicing arrangements or may lose one or more of its state servicing or origination licenses. Additional regulatory actions or adverse financial developments may impose additional restrictions on or require changes in Ocwen’s business that could require it to sell assets or change its business operations. Any or all of these effects could result in our eventual loss of Ocwen as a customer or a reduction in the number and/or volume of services Ocwen purchases from us, which may adversely affect our business and results of operations.
If any of the following events with respect to our relationship with Ocwen occurred, Altisource’s revenue could be significantly lower and our business and results of operations could be adversely affected, including from the possible impairment or write-off of goodwill, intangible assets, property and equipment, other assets and accounts receivable:
|
•
|
Altisource loses Ocwen as a customer or there is a significant reduction in the volume of services they purchase from us
|
|
•
|
We could also be impacted if Ocwen loses, sells or transfers a significant portion of its GSE and FHA servicing rights or subservicing arrangements or remaining non-GSE servicing rights or subservicing arrangements and Altisource fails to be retained as a service provider
|
|
•
|
The contractual relationship between Ocwen and NRZ changes significantly and this change results in a change in our status as a provider of services related to the Subject MSRs
|
|
•
|
Ocwen loses state servicing licenses in states with a significant number of loans in Ocwen’s servicing portfolio
|
|
•
|
The contractual relationship between Ocwen and Altisource changes significantly or there are significant changes to our pricing to Ocwen for services from which we generate material revenue
|
|
•
|
Altisource otherwise fails to be retained as a service provider
|
There may be other events that could cause the loss of Ocwen as a customer or reduce the size of our relationship with Ocwen, or that could otherwise adversely affect the revenues we earn from Ocwen, and could adversely affect our business and results of operations.
We entered into the Brokerage Agreement with NRZ’s licensed brokerage subsidiary with respect to the Subject MSRs. If the Brokerage Agreement is terminated, or if there is a significant reduction in the volume of services that we provide pursuant to such agreement, our business and results of operations could be adversely affected.
On August 28, 2017, Altisource, through its licensed subsidiaries, entered into the Brokerage Agreement with NRZ which extends through August 2025. Under this agreement and related amendments, Altisource is the exclusive provider of brokerage services for REO associated with the Subject MSRs, irrespective of the subservicer, as long as NRZ owns such MSRs. NRZ’s brokerage subsidiary receives a cooperative brokerage commission on the sale of certain REO properties from these portfolios subject to
10
certain exceptions. The Brokerage Agreement may be terminated by NRZ upon the occurrence of certain specified events. Termination events include, but are not limited to, a breach of the terms of the Brokerage Agreement (including, without limitation, the failure to meet performance standards and non-compliance with law in a material respect), the failure to maintain licenses which failure materially prevents performance of the contract, regulatory allegations of non-compliance resulting in an adversarial proceeding against NRZ, voluntary or involuntary bankruptcy, appointment of a receiver, disclosure in a Form 10-K or Form 10-Q that there is significant uncertainty about Altisource’s ability to continue as a going concern, failure to maintain a specified level of cash and an unapproved change of control. If any one of these termination events occurs and the Brokerage Agreement is terminated, this could have an adverse impact on business and results of operations.
In addition, NRZ operational changes or other action that reduces the number of properties achieving REO status could: (i) reduce the volume of services that we provide on the Subject MSRs pursuant to our agreements with Ocwen, and (ii) reduce the volume of services that we provide pursuant to the Brokerage Agreement; which could have an adverse impact on our business and results of operations.
We are providing other default-related services for the Subject MSRs subject to our agreements with Ocwen, and we do not have a services agreement with NRZ. If NRZ takes action that results in a significant reduction in the volume of default-related services for the Subject MSRs, our business and results of operations could be adversely affected.
Altisource provides services on the Subject MSRs pursuant to its agreements with Ocwen (other than brokerage services for REO associated with the Subject MSRs). However, NRZ could challenge our right to provide such services under the Ocwen agreements or exercise its purported right to assign other service providers such that the fee-based service referrals do not continue in whole or in part. If Altisource were no longer providing services for some or all of the Subject MSRs, this could have an adverse impact on our future revenue, business and results of operations.
Our continuing relationship with Ocwen could inhibit our ability to attract and retain other customers which could adversely affect our business and results of operations.
Given the significance of our relationship with Ocwen and the regulatory scrutiny of Ocwen and Altisource, we may encounter difficulties in attracting new customers and retaining existing customers. Should these and other potential customers view Altisource as part of Ocwen or as too closely related to or dependent upon Ocwen or view Altisource as being subject to or at risk of regulatory scrutiny, they may be unwilling to utilize our services and our non-Ocwen growth could be inhibited as a result and our business and results of operations could be adversely impacted.
We have key customer relationships, other than Ocwen and NRZ, the loss of which could adversely affect our business and results of operations.
Most of our customers are not contractually obligated to continue to use our services at historical levels or at all. The loss of any of these key customers or their failure to pay us could reduce our revenue and adversely affect our business and results of operations.
Technology disruptions, failures, defects or inadequacies, delays or difficulties in implementing software or hardware changes, acts of vandalism or the introduction of harmful code could damage our business operations and increase our costs, and could adversely affect our business and results of operations.
Disruptions, failures, defects or inadequacies in our technology or technology we acquire from third parties, delays in the development of our technology or acts of vandalism, system attacks or the introduction of malicious code to our technology or software, may interrupt or delay our ability to provide services to our customers or cause the loss, corruption or disclosure of data. Because of our reliance on technology to perform services and our storage and processing of consumer information in performance of services, we may be a particular target for network hackers or others with malicious intent. Any sustained and repeated disruptions in these services may have an adverse impact on our and our customers’ business and results of operations and, in the case of acts of vandalism or introduction of harmful code, could necessitate improvements to our physical and cyber security practices that may require an investment of money, time and resources.
11
Many of our services and processes require effective interoperation with internal and external technology platforms and services, and failures in such interoperation could have a negative impact on our operations and the operations of our customers, and could have an adverse impact on our business and results of operations.
Further, our customers may require changes and improvements to the systems we provide to them to manage the volume and complexity, laws or regulations of their businesses, or to interoperate with other systems, which changes and improvements may be unfeasible, unsuccessful, costly or time-consuming to implement or may create disruptions in our provision of services to customers. Our customers may refuse to agree to modifications to technology or infrastructure that we provide to them or that interoperate with the technology or infrastructure we provide to them that we may believe are desirable to improve the reliability, performance, efficiency and/or cost in delivering. Additionally, the improper implementation or use of Altisource technology by customers could adversely impact the operation of that technology, and potentially cause harm to our reputation, loss of customers, negative publicity or exposure to liability claims or government investigations or actions. The occurrence of any of the foregoing events could adversely impact our business and results of operations.
Failures of technology services and infrastructure providers could adversely impact Altisource’s business and results of operations.
Altisource relies on certain key technology vendors to provide systems and services critical to Altisource’s operations and services, including cloud service providers. The failure of such technology vendors to provide systems or services in accordance with applicable requirements could negatively impact our ability to perform services and meet our obligations. Such a failure could have an adverse impact on our business and results of operations.
We depend on our ability to access data from external sources to maintain and grow our businesses. If we are unable to access needed data from these sources or if the prices charged for these services significantly increase, the quality, pricing and availability of our products and services may be adversely affected, which could have an adverse impact on our business and results of operations.
We rely on data from public and private sources to maintain and grow some of our businesses (such as Hubzu and RentRange
®
) and to maintain our databases (such as multiple listing service data). In addition, we rely on certain technology services from vendors to provide certain infrastructure, technology and functionality critical to our services. Our data sources or vendors could cease providing or reduce the availability, type, details or other aspects of their data or services available to us, change the performance or functionality of technology services or increase the price we pay for their data. If a number of suppliers are no longer able or are unwilling to provide us with certain data or technology services, or if our sources of data or technology services become unavailable or too expensive, we may need to find alternative sources. If we are unable to identify and contract with suitable alternative suppliers and efficiently and effectively integrate these sources into our service offerings or infrastructure, we could experience service disruptions, increased costs and reduced quality of our services. In addition, new legal restrictions could limit the use or dissemination of data in a manner that adversely impacts our products, services or operations. Significant price increases or restrictions could have an adverse impact on our business and results of operations.
The Company’s databases contain our proprietary information, the proprietary information of third parties and personal information of our customers, vendors and employees. Our failure to comply with applicable collection, privacy, notice, disclosure, use, deletion or other requirements, or the unauthorized disclosure of such information, could subject us to adverse publicity, investigations, fines, costly government enforcement actions or private litigation and expenses, which could adversely affect our business and results of operations.
As part of our business and operation of our technology, we maintain proprietary information belonging to the Company or third parties in tangible and electronic forms and electronically receive, process, store and transmit personal information (“PI”) and confidential and sensitive business information of ourselves and of our customers, vendors and employees.
Customer and governmental authorities increasingly impose more stringent security obligations on us, our services and the security of our customers’ data and PI, and impose new liabilities for data breaches. We and our vendors rely on processes that are intended to provide necessary notices regarding the collection and use of PI, and to permit subjects to exercise their legal rights concerning their PI in our possession. If those processes are not sufficient, we or our vendors may fail to comply with applicable requirements concerning PI in our possession. In addition, we rely on the security of our facilities, networks, databases, systems and processes and, in certain circumstances, those of third parties, such as vendors, to protect our proprietary information and PI in our possession and information about our customers, vendors and employees. Hackers, criminals and others are constantly devising schemes to circumvent security safeguards and other large and small companies have suffered serious data security breaches. If our controls and those of our clients or vendors are not effective, are outdated or do not exist, or if we fail to detect or respond to attacks or intrusions, unauthorized parties may gain access to our networks or databases or information, or those of our customers or vendors with which we interconnect or share information, and they may be able to steal, publish, delete, or modify our sensitive proprietary information and sensitive third party information, including PI. In addition, employees may intentionally or inadvertently cause
12
data or security breaches that result in unauthorized release of such PI, proprietary or confidential information. In such circumstances, our business could suffer and we could be held liable to our customers, vendors, other parties or employees, as well as be subject to notification requirements or regulatory or other actions for breaching applicable laws or failing to adequately protect such information. This could result in costly investigations and litigation, civil or criminal penalties, large scale remediation requirements, operational changes or other response measures, significant penalties, fines, settlements, costs, consent orders, loss of consumer confidence in our security measures and negative publicity that could adversely affect our business and results of operations.
Our business is susceptible to disruption from natural disasters, labor unrest, civil unrest, intentional acts of destruction, physical intrusion and other business continuity risks that may render certain of our assets and business facilities unusable for an extended period of time, which could adversely affect our business and results of operations.
Our physical facilities and technology infrastructure, including infrastructure provided by third parties, is susceptible to disruption due to natural disasters, labor or civil unrest, intentional acts of destruction, physical intrusion and other business continuity risks that could impair or prevent our use of such facilities and infrastructure for an extended period of time. Current business continuity plans, back-up facilities and technology infrastructure may not be adequate or sufficient to remotely operate for an extended period of time, and current business interruption insurance may not be adequate to sufficiently compensate for any loss, in the event of a natural disaster, labor or civil unrest, intentional act of destruction or other business continuity risks. Furthermore, certain of our assets are concentrated in geographical areas that may be affected by natural disasters, labor or civil unrest, intentional acts of destruction, physical intrusion and other business continuity risks or extended recovery timelines, which may result in limited access to those assets, significant damage to such assets or destruction of such assets. Our Indian and Philippine facilities may be especially prone to weather-related disasters and civil unrest. Interruptions in our operations for an extended period of time and/or damage or destruction of assets and facilities could have an adverse effect on our business and results of operations.
Given the nature of the industry in which we operate, we have long development and sales cycles for many of our services, analytics and technology solutions and if we fail to close sales after expending significant time and resources to do so, our business and results of operations could
be adversely affected.
We have long development and sales cycles for many of our services, analytics and technology solutions. Our customers generally conduct lengthy bidding and contracting processes, and extensive due diligence, as part of contracting with services providers. The products and services that we provide are subject to extensive regulatory and client requirements which contribute to long development cycles. We may expend significant time and resources in pursuing a particular customer or customers that does not generate revenue or pursuing a particular service or solution for our existing customers that does not generate revenue. We may encounter delays when developing new services or technology solutions. Changes in relevant regulations or industry practices may render existing solutions or ongoing development efforts obsolete or require significant modifications. We may experience difficulties in installing or integrating our services and technologies on platforms used by our customers. Further, defects in our technology solutions, errors or delays in the processing of electronic transactions or other difficulties could result in interruption of business operations, delay in market acceptance, additional development and remediation costs, loss of customers, negative publicity or exposure to liability claims, and our business and results of operations could be adversely impacted.
Delays due to the length of our sales cycle or costs incurred that do not result in sales could have an adverse effect on our business and results of operations.
The failure of any of the insurance underwriting loss limitation methods we use could have adversely affect our business and results of operations.
Altisource, through its subsidiary Association of Certified Mortgage Originators Risk Retention Group, Inc., provides certified loan insurance to its customers. Altisource reduces a portion of its risk of insurance loss through third party reinsurance. The incidence and severity of claims against insurance policies are inherently unpredictable. Although we attempt to manage our exposure to insurance underwriting risk through the use of disciplined underwriting controls and the purchase of third party reinsurance, the frequency and severity of claims could be greater than contemplated in our pricing and risk management methods and our controls and mitigation efforts may not be effective or sufficient.
We also face counterparty risk when purchasing reinsurance from third party reinsurers. The insolvency or unwillingness of any of our present or future reinsurers to contract with us or make timely payments to us under the terms of our reinsurance agreements could have an adverse effect on us. Further, there is no certainty that we will be able to purchase the amount or type of reinsurance we desire in the future or that the reinsurance we desire will be available on terms we consider acceptable or with reinsurers with whom we want to do business. Any failure of our insurance underwriting loss limitation methods or similar insurance related risks described above could adversely affect our business and results of operations.
13
Under certain material agreements that we are currently a party to or may enter into in the future, the formation by shareholders of Altisource of a “group” (as that term is used in Section 13(d) and 14(d) of the Securities Exchange Act of 1934 (the “Exchange Act”)) with ownership of Altisource capital stock exceeding a defined percentage may give rise to a termination event or an event of default, which could result in an adverse impact on the Company’s future revenue, results of operations and financial position.
Under certain of the Company’s material agreements a change of control would be deemed to occur if, among other things, a “group” (as that term is used in Sections 13(d) and 14(d) of the Exchange Act) is formed by shareholders holding beneficial ownership of a defined percentage of the combined voting power and/or economic interest of the Company’s capital stock. The Company’s Brokerage Agreement with NRZ’s licensed brokerage subsidiary contains a similar provision, and the Company may enter into material agreements in the future that contain similar provisions. The formation of a “group” could occur without the involvement of or input by the Company, and the Company is not in a position to prevent such an event from occurring. Such a change of control could constitute a termination event or an event of default under these agreements. If any of these agreements were terminated, or if the event of default is not waived, this could have an adverse impact on the Company’s future revenue, results of operations and financial position.
Our business and the business of our customers are subject to extensive scrutiny and regulation, and the perceived failure or failure to comply with existing or new regulations or license requirements may adversely impact our business and results of operations.
Our business and the business of our customers are subject to extensive scrutiny and regulation by federal, state and local governmental authorities including the FTC, the CFPB, the SEC, the HUD and the state and local agencies that license or oversee certain of our auction, real estate brokerage, mortgage services, trustee services and insurance services. We also must comply with a number of federal, state and local consumer protection laws including, among others, ADA, CHBR, CAN-SPAM, CCPA, ECOA, FACTA, FCPA, FCRA, the Fair Housing Act, the FTC Act, GLBA, HARP, HMDA, HOEPA, RPAPL, RESPA, the SAFE Act, SCRA, TCPA, TILA, UDAAP and UDAP acts. We are also subject, or may in the future become subject, to various foreign laws and regulations as well, including those pertaining to data protection, such as the GDPR. These foreign, federal, state and local requirements can and do change as statutes and regulations are enacted, promulgated or amended. Furthermore, the interpretation or enforcement by regulatory authorities of these requirements may change over time. The creation of new regulatory authorities or changes in the regulatory authorities overseeing applicable laws and regulations may also result in changing interpretation or enforcement of such laws or regulations. We are also subject to licensing and regulation as a provider of certain services including, among others, services as a mortgage origination underwriter, valuation provider, appraisal management company, asset manager, property manager, title insurance agent, insurance broker and underwriter, real estate broker, auctioneer and foreclosure trustee in a number of states. Our employees and subsidiaries may be required to be licensed by various state commissions for the particular type of service provided and to participate in regular continuing education programs. We incur significant ongoing costs to comply with licensing requirements and governmental regulations and to respond to government and regulatory confidential inquiries, audits, regulatory examinations and other similar matters. We also may lose or fail to maintain required licenses necessary to continue to do business in certain of our markets.
Participants in the industries in which we operate are subject to a high level of government and regulatory scrutiny. This scrutiny has included review by federal and state governmental authorities of all aspects of the mortgage servicing and lending industries, including an increased legislative and regulatory focus on consumer protection practices. Our and our customers’ failure to comply with applicable laws, regulations, consent orders or settlements could subject us to civil and criminal liability, loss of licensure, damage to our reputation in the industry, significant penalties, fines, settlements, adverse publicity, litigation, including class action lawsuits or administrative enforcement actions, costs and consent orders against us or our customers that may curtail or restrict our business as it is currently conducted. If governmental authorities continue to impose new or more restrictive requirements or enhanced oversight, we may be required to increase or decrease our prices, modify our contracts or course of dealing and/or we may incur significant additional costs to comply with such requirements. Also, if we are unable to adapt our products and services to conform to the new laws and regulations, or if these laws and regulations have a negative impact on our clients, we may experience client losses or increased operating costs.
In addition, certain of our technology and other services are provided at the direction and pursuant to the identified requirements of our customers. The failure of our customers to properly identify or account for regulatory requirements applicable to such technology and services or to use such technology or services in a compliant manner could expose us to significant penalties, fines, settlements, costs and consent orders.
Periodically, we are subject to audits and examinations by federal, state and local governmental authorities and receive subpoenas, civil investigative demands or other requests for information from such governmental authorities in connection with their regulatory or investigative authority. We are currently responding to such inquiries from governmental authorities relating to certain aspects of our business, including as set forth in the Government Regulation section of Item 1 of Part I, “Business” above. Responding to such audits, examinations and inquiries will cause us to incur costs, including legal fees or other charges, which may be material
14
in amount, and in addition, may result in management distraction or may cause us to modify or terminate certain services we currently offer. If any such audits, examinations or inquiries result in allegations or findings of non-compliance, we could incur significant penalties, fines, settlements, costs and consent orders that may curtail, restrict or otherwise have an adverse effect on our business and results of operations. Furthermore, even if we believe we complied with applicable laws and regulations, we may choose to settle such allegations with the governmental authorities in order to avoid the potentially significant costs of defending such allegations and to further avoid the risk of increased damages if we ultimately were to receive an unfavorable outcome, but such settlements may also result in further claims or create issues for existing and potential customers.
Any of the foregoing outcomes could have an adverse effect on our business or results of operations. Furthermore, even if we believe we complied with such laws and regulations, we may choose to settle enforcement actions or lawsuits in order to avoid the potentially significant costs of defending such actions or lawsuits and to further avoid the risk of increased damages if we ultimately were to receive an unfavorable outcome; such action could adversely affect our business and results of operations.
In addition, national servicing standards and federal and state government scrutiny and regulation and other requirements require very specific loan modification and foreclosure procedures among others that have further reduced the number of loans entering the foreclosure process and have negatively impacted our default services revenue and profit. It is unclear when or if volumes will increase in the future.
Our customers are subject to government regulation, requiring our customers to, among other things, oversee their vendors and maintain documentation that demonstrates their oversight. If our performance does not meet or is perceived not to meet such requirements, our business and results of operations could be adversely affected.
Our customers are subject to a variety of federal, state and local government regulations, including regulations promulgated by the CFPB, banking regulators and others, as well as consent orders and settlements. The foregoing may require our customers to oversee their vendors and document the procedures performed to demonstrate that oversight. Altisource, as a vendor, is subject to oversight by our customers. If we do not meet the standards established by or imposed upon our customers, regulators allege that products or services provided by Altisource fail to meet applicable regulatory requirements, or if any other oversight procedures result in a negative outcome for Altisource, we may lose customers, may no longer be granted referrals for certain services, or may have to conform our business to address these standards, which could adversely affect our business and results of operations.
We may be subject to claims of legal violations or wrongful conduct from regulators, clients, our clients’ customers, vendors, competitors, third parties and/or other large groups of plaintiffs which may cause us to have unexpected litigation costs, damages or indemnifications, or modify our products or processes,
which could adversely affect our business and results of operations.
From time to time, we may be subject to costly and time-consuming regulatory or legal proceedings that claim legal violations or wrongful conduct, including claims for violations of consumer protection laws, laws concerning PI or third party intellectual property rights. These proceedings may involve regulators, clients, our clients’ customers, vendors, competitors, third parties and/or other large groups of plaintiffs and, if resulting in findings of violations, could result in substantial damages or indemnification obligations. Additionally, we may be forced to settle some claims and change existing Company practices, services processes or technologies that are currently revenue generating. Furthermore, even if we believe we have no liability for the alleged regulatory or legal violations or wrongful conduct, we may choose to settle such regulatory or legal proceedings in order to avoid the potentially significant costs of defending such allegations and to further avoid the risk of increased damages if we ultimately were to receive an unfavorable outcome. The foregoing could lead to unexpected costs or a loss of revenue, which could adversely affect our business and results of operations.
The tax regulations, and the interpretation thereof, in the countries, states and local jurisdictions in which we operate periodically change, which may adversely affect our results due to higher taxes, interest and penalties.
Certain of our subsidiaries provide services in the United States and several countries internationally. Those jurisdictions are subject to changing tax environments, which may result in higher operating expenses and/or taxes and which may introduce uncertainty as to the application of tax laws and regulations to our operations. Furthermore, we may determine that we owe additional taxes or may be required to pay taxes for services provided in prior periods as interpretations of tax laws and regulations are clarified or revised. Changes in laws concerning sales tax, gross recipient tax, dividends, retained earnings, and intercompany transactions and loans, among others, could impact us. We may not be able to raise our prices to customers or pass-through such taxes to our customers or vendors in response to changes, which could adversely affect our results of operations. In addition, if we fail to accurately anticipate or apply tax laws and regulations to our operations, we could be subject to liabilities and penalties.
15
We rely on third party vendors for many aspects of our business. If our vendor oversight activities are ineffective, we fail to meet customer or regulatory requirements or we face difficulties managing our relationships with third party vendors, our business and results of operations could be adversely affected.
We rely on third party vendors to provide goods and services in relation to many aspects of our operations
,
including certain providers of web based services or software as services. Our dependence on these vendors makes our operations vulnerable to the unavailability of such third parties, the pricing and quality of services offered by such third parties, solvency of those third parties and such third parties’ failure to perform adequately under our agreements with them. In addition, where a vendor provides services that we are required to provide under a contract with a client, we are generally responsible for such performance and could be held accountable by the client for any failure of performance by our vendors. We evaluate the competency and solvency of our key third party vendors. We perform ongoing vendor oversight activities to identify potential new vendors, review vendor pricing and to identify any performance or other issues related to current vendors. If our vendor oversight activities are ineffective or if a vendor fails to provide the services that we require or expect, or fails to meet contractual requirements, such as service levels or compliance with applicable laws, the failure could negatively impact our business by adversely affecting our ability to serve our customers and/or subjecting us to litigation and regulatory risk for ineffective vendor oversight. Furthermore, the failure to obtain services at anticipated pricing could impact our cost structure and the prices of services we provide. In addition, Altisource may be contractually required by its customers or by applicable regulations to oversee its vendors and document procedures performed to demonstrate that oversight. If we fail to meet such customer or regulatory requirements, or we face difficulties managing our relationships with third party vendors, we may lose customers or may no longer be granted referrals for certain services or could be subject to adverse regulatory action, which could adversely affect our business and results of operations.
If financial institutions at which we hold cash and cash equivalents as well as escrow funds fail, it could have an adverse impact on our business and results of operations.
We hold our cash and cash equivalents at various financial institutions. In addition, we hold customers’ deposits in escrow accounts at various financial institutions pending completion of certain real estate activities. These amounts are held in escrow accounts for limited periods of time and are not included in the accompanying consolidated balance sheets. We may become liable for funds owed to third parties as a result of the failure of one or more of these financial institutions, in addition to loss of our cash and cash equivalents, and there is no guarantee we would recover the funds deposited, whether through Federal Deposit Insurance Corporation coverage, private insurance or otherwise and our business and results of operations could be adversely impacted.
We generate significant cash from our operations that is deposited into our operating accounts at banks and also, in connection with real estate transactions (Mortgage and Real Estate Solutions and Marketplace offerings), in escrow accounts, which exposes us to risk of loss due to fraudulent or inadvertent misappropriation of cash.
We hold our cash and cash equivalents at various financial institutions. In addition, we hold customers’ deposits in escrow accounts at various financial institutions pending completion of certain real estate activities. These cash balances expose us to purposeful misappropriation of cash by employees or others and unintentional mistakes resulting in a loss of cash which may not be recoverable. In addition, we may become liable for funds owed to third parties as a result of such purposeful misappropriation of cash by employees or others and unintentional mistakes resulting in a loss of cash held in escrow accounts, and there is no guarantee we would recover the lost funds from the party or parties involved in a fraudulent or inadvertent misappropriation of cash and our business and results of operations could be adversely impacted.
Our primary source of liquidity is cash flows from operations. We seek to deploy cash generated in a disciplined manner, which may include repurchasing and repaying our senior secured term loan, repurchasing shares of our common stock, making capital investments making acquisitions and paying dividends. We may not deploy cash in the future as we have in the past.
While we have historically used cash from operations to repurchase and repay our senior secured term loan, repurchase shares of our common stock, make capital investments and make acquisitions, there is no guarantee that we will continue to do so or that we will do so at attractive prices. Furthermore, there is no guarantee that cash from operations will be available for repurchasing our senior secured term loan, repurchasing shares of our common stock, making capital investments and making acquisitions. Also, we may not repurchase our senior secured term loan and common stock, make capital investments and acquisitions at the same levels as in the past. In addition, while the Company has not historically declared dividends, the Company may decide in the future to declare a dividend rather than, or in addition to, repurchasing our senior secured term loan and/or repurchasing shares of our common stock, making capital investments and/or acquisitions. If we continue or increase such repurchases, make or increase capital investments and acquisitions or declare a dividend, we may not have sufficient cash for other opportunities that may arise.
16
Our senior secured term loan makes us more sensitive to the effects of economic change, including economic downturns and interest rate increases; our level of debt and provisions in our senior secured term loan agreement could limit our ability to react to changes in the economy or our industry,
which could adversely affect our business and results of operations.
Our senior secured term loan makes us more vulnerable to changes in our results of operations because a portion of our cash flows from operations is dedicated to servicing our debt and is not available for other purposes. Our senior secured term loan is secured by virtually all of our assets and from time to time may trade at a substantial discount to face value. Our ability to raise additional debt is largely limited and in many circumstances would be subject to lender approval and would require modification of certain senior secured term loan agreements, which could adversely affect our business and results of operations. Additionally, increases in interest rates will negatively impact our cash flows as the interest rate on our debt is variable, which could adversely affect our business and results of operations. The provisions of our senior secured term loan agreements could have other negative consequences to us including the following:
|
•
|
limiting our ability to borrow money for our working capital, capital expenditures and debt service requirements or other general corporate purposes;
|
|
•
|
limiting our flexibility in planning for, or reacting to, changes in our operations, our business or the industry in which we compete;
|
|
•
|
requiring us to use a portion of our consolidated excess cash flow, as specified in the senior secured term loan agreements, to repay debt in the event our net debt less marketable securities to earnings before interest, taxes, depreciation and amortization (“EBITDA”) ratio, as specified in the senior secured term loan agreements, exceed certain thresholds; and
|
|
•
|
placing us at a competitive disadvantage by limiting our ability to invest in our business.
|
Our ability to make payments on our indebtedness depends, in part, on our ability to generate cash in the future. If we do not generate sufficient cash flows and do not have sufficient cash on hand to meet our debt service and working capital requirements, we may need to seek additional financing, raise equity or sell assets. This may make it more difficult for us to obtain financing on terms that are acceptable to us, or at all. Without any such financing, we could be forced to sell assets to make up for any shortfall in our payment obligations under unfavorable circumstances. If necessary, we may not be able to sell assets quickly enough or for sufficient amounts to enable us to meet our obligations. Failure to meet our debt service requirements could result in an event of default under our senior secured term loan agreement which, if not cured or waived, could result in the holders of the defaulted debt causing all outstanding amounts with respect to that debt to be immediately due and payable and potentially permitting lenders to execute applicable security interests, which impact our future operations or ability to engage in other favorable business activities. The occurrence of any of the foregoing could adversely affect our business and results of operations.
In addition, certain senior secured term loan agreements contain covenants that limit our flexibility in planning for, or reacting to changes in, our business and our industry, including limitations on incurring additional indebtedness, making investments, adding new product lines, disposing or selling of assets, granting liens and merging or consolidating with other companies. Complying with these covenants may impair our ability to finance our future operations or capital needs or to engage in other favorable business activities, which could adversely affect our business and results of operations.
Our failure to comply with the covenants or terms contained in our senior secured term loan agreements, including as a result of events beyond our control, could result in an event of default which could adversely affect our business and results of operations.
Our senior secured term loan agreements require us to comply with various operational, reporting and other covenants or terms including, among other things, limiting us from engaging in certain types of transactions. If we experience an event of default under our senior secured term loan agreements that is not cured or waived, the holders of the defaulted debt could cause all amounts outstanding with respect to that debt to be immediately due and payable or choose to execute on applicable security interests. Our assets or cash flows may not be sufficient to fully repay borrowings under our outstanding senior secured term loan if accelerated upon an event of default and we may not be able to refinance or restructure the payments on the senior secured term loan. Such events could adversely affect our business and results of operations.
We may be unable to repay the balance of our senior secured term loan upon maturity in April 2024, particularly if cash from operations declines and assets are not readily available for sale,
which could adversely affect our business and results of operations.
Our senior secured term loan agreements require us to repay the outstanding balance due in April 2024 (
$283.3 million
, based on scheduled repayments through the maturity date). If our cash from operations declines, there can be no assurance that our cash balances and other assets readily available for sale would be sufficient to fully repay borrowings under our outstanding senior secured term loan upon maturity in April 2024 or that we will be able to refinance the remaining portion of the debt prior to the due date. Such events could adversely affect our business and results of operations.
17
Our failure to maintain the net debt less marketable securities to EBITDA ratio contained in our senior secured term loan agreements could result in required payments to the lenders of a percentage of our excess cash flows, which could adversely affect our ability to use our excess cash flows for other purposes.
Our senior secured term loan agreements require us to distribute to our lenders 50% of our consolidated excess cash flows, as specified in the senior secured term loan agreements, if our net debt less marketable securities to EBITDA ratio, as defined in the senior secured term loan agreements, exceed 3.50 to 1.00 and 25% of our consolidated excess cash flows if our net debt less marketable securities to EBITDA ratio is 3.50 to 1.00 or less, but greater than 3.00 to 1.00. If we were required to distribute a portion of our excess cash flows to our lenders, we may be limited in our ability to support our business, grow our business through acquisitions or investments in technology and we may be limited in our ability to repurchase our common stock, pay dividends or take other potentially advantageous actions. There can be no assurance that we will maintain net debt less marketable securities to EBITDA ratio at levels that will not require us to distribute a portion of our excess cash flows to lenders, which could adversely affect our business and results of operations.
If we fail to maintain adequate internal controls, our ability to prepare accurate and timely financial statements could be impaired, which could adversely affect investor confidence in our reported financial information
and which could adversely affect our business and results of operations.
We cannot be certain that we will be successful in implementing or maintaining adequate internal control over our financial reporting and financial processes. Material weaknesses in our internal control over financial reporting could materially adversely affect our ability to comply with applicable financial reporting requirements, which could adversely affect our business and results of operations.
We have significant investments in goodwill and intangible assets recorded as a result of prior acquisitions and an impairment of these assets would require a write-down that would reduce our net income,
which could adversely affect our business and results of operations.
Goodwill and intangible assets are assessed for impairment annually or sooner if circumstances indicate a possible impairment. Factors that could lead to impairment of goodwill and intangible assets include significant under-performance relative to historical or projected future operating results, a significant decline in our stock price and market capitalization and negative industry or economic trends, among other indications of impairment. In the event that the recorded values of goodwill and intangible assets are impaired, any such impairment would be charged to earnings in the period of impairment. In the event of significant volatility in the capital markets or a worsening of current economic conditions, we may be required to record an impairment charge, which would adversely affect our business and results of operations. Possible future impairment of goodwill and intangible assets may have a material adverse effect on our business and results of operations.
Risks Related to our Growth Strategy
Our ability to grow is affected by our ability to execute on our strategic businesses, retain and expand our existing customer relationships and our ability to attract new customers.
Our ability to retain existing customers and expand those relationships and attract new customers is subject to a number of risks including the risk that we do not:
|
•
|
execute on our strategic businesses;
|
|
•
|
maintain or improve the quality and legal, regulatory and contractual compliance of services we provide to our customers;
|
|
•
|
meet or exceed the expectations of our customers;
|
|
•
|
maintain a good reputation;
|
|
•
|
successfully leverage our existing customer relationships to sell additional services; and
|
|
•
|
attract new customers.
|
If our efforts to execute on our strategic businesses, retain and expand our customer relationships and attract new customers do not prove effective, it could have an adverse effect on our business and results of operations and our ability to maintain and grow our operations.
Our ability to expand existing relationships and attract new customers is also affected by broader economic factors and the strength of the overall housing market in the U.S., which can reduce demand for our services and increase competition for each customer’s business, and our results of operations could be adversely impacted, which could adversely affect our business and results of operations. See “The economy and the housing market can affect demand for our services.”
18
If we do not adapt our services to changes in technology or in the marketplace, changing requirements of governmental authorities, GSEs and clients or if our ongoing efforts to upgrade our technology and particularly our efforts to complete development of our technology are not successful, we could lose customers and have difficulty attracting new customers for our services, which could have an adverse effect on our business and results of operations.
The markets for our services are characterized by constant technological and other changes, our customers’ and competitors’ frequent introduction of new services and evolving industry standards and government regulation. We are currently in the process of, and from time to time will be, developing and introducing new services and technologies and improvements to existing services and technologies. Our future success will be significantly affected by our ability to complete our current efforts and in the future enhance, primarily through use of automation, econometrics and behavioral science principles, our services and develop and introduce new services that address the increasingly sophisticated needs of our customers and their customers, as well as our ability to reduce costs by relying on cloud architecture and other infrastructure advancements. These initiatives carry the risks associated with any new service development effort, including cost overruns, delays in delivery and performance effectiveness. There can be no assurance that we will be successful in developing, marketing and selling new and improved technologies and services. In addition, we may experience difficulties that could delay or prevent the successful development, introduction and marketing of these services. Our services and their enhancements may also not adequately meet the demands of the marketplace or governmental authorities and achieve market acceptance. Additionally, certain clients may refuse to consent to, or otherwise resist, such developments, modifications or changes in infrastructure, which may have an adverse impact on our business operations or results of operations.
Many of our institutional customers are consolidating the number of service providers, and we may lose customers or face significant pricing pressures,
which could adversely affect our business and results of operations.
Many institutional customers of our default-related services and origination services are undergoing vendor consolidation efforts, reducing the number of service providers employed. Such consolidation could reduce the demand for our services.
In addition, certain prices that we can charge may be dictated by GSEs and/or our institutional customers and we may not be able to reduce our vendor costs in order to maintain our profitability for those services. Any of these results could have a negative impact on our business and results of operations.
Our ability to meet our growth objectives is dependent on the timing and market acceptance of our existing and new service offerings and ability to scale in response to changing market conditions.
Our ability to grow may be adversely affected by difficulties or delays in service development, the inability to gain market acceptance of existing and new services to existing and new customers or our inability to timely scale our operations to permit us to respond to changing market conditions. There are no guarantees that existing and new services will prove to be commercially successful, that we will have sufficient scale or capabilities to satisfy all of the demand of existing or new customers, and our business and results of operations could be adversely impacted.
Some of our businesses are dependent on outsourcing.
Our continued growth at historical rates for some of our businesses is dependent on industry participants accepting of outsourcing. Organizations may elect to perform such services themselves or may be prevented from outsourcing services. A significant change in our customers’ preference or ability to outsource could have an adverse effect on our business and our results of operations.
Acquisitions to accelerate growth initiatives involve potential risks.
Historically, our strategy has included the acquisition of complementary businesses from time to time. Between 2014 and 2016, we entered into five acquisition transactions.
In the future, we may consider acquisitions of other businesses that could complement our business, offer us greater access in our current markets or offer us greater access and expertise in other asset types and markets that are related to ours but we do not currently serve. Our ability to pursue additional acquisitions in the future is dependent on our access to sufficient capital (equity and/or debt) to fund the acquisition and subsequent integration. Because of the obligations to maintain a minimum cash threshold in the Brokerage Agreement and restrictions in our senior secured term loan agreement, we may not be able to secure adequate capital as needed on terms that are acceptable to us, or at all.
When we acquire new businesses, we may face a number of integration risks, including a loss of focus on our daily operations, the need for additional management, constraints on operating resources, constraints on financial resources from integration and system conversion costs and the inability to maintain key pre-acquisition relationships with customers, suppliers and employees. We may have particular integration risks as we are a Luxembourg-domiciled company, resulting in numerous changes that may
19
need to be made immediately or promptly following closing of such an acquisition. In addition, any acquisition may result in the incurrence of additional amortization expense of related intangible assets, which could reduce our profitability. Our failure to effectively pursue or integrate acquisitions, and such acquisitions themselves, may have an adverse effect on our business and results of operations.
Failure to properly and timely integrate any acquired business may result in our inability to realize the expected value from the acquisition, which can lead us to sell or otherwise dispose of the acquired business at a loss, which could adversely affect our business and results of operations.
We may be unable to reduce our cost structure in a timely manner in connection with a significant loss of revenue and/or customers,
which could adversely affect our business and results of operations.
Our cost structure is composed of variable costs, which may be largely controllable with changes in revenue and/or our customer base, and fixed costs, which are less controllable with changes in revenue and/or our customer base, including interest associated with our senior secured term loan. Certain of our services require significant staffing and reduction of staffing levels may take time and cause us to incur costs. Our clients may have the ability to reduce the level of services acquired from us or otherwise terminate their contracts with us prior to us being able to adjust our staffing levels. If we are unable to timely reduce our cost structure consistent with a significant decline in revenue, our results of operations, cash flows and financial condition could be adversely affected.
Risks Related to International Business
Our international operations subject us to additional risks which could have an adverse effect on our business and results of operations.
We have attempted to control our operating expenses by utilizing lower cost labor in foreign countries such as India, the Philippines and Uruguay. As of
December 31, 2019
,
2,517
of our employees were based in India, the Philippines and Uruguay. These countries are subject to relatively higher degrees of political and social instability and may lack the infrastructure to withstand political unrest or natural disasters. The occurrence of natural disasters or political or economic instability in these countries could interfere with work performed by these labor sources, or could result in our having to replace or reduce these labor sources. Such disruptions could decrease efficiency, increase our costs and have an adverse effect on our business or results of operations.
Furthermore, the practice of utilizing labor based in foreign countries has come under increased scrutiny in the United States. Governmental authorities could seek to impose financial costs or restrictions on foreign companies providing services to customers in the United States. Governmental authorities may attempt to prohibit or otherwise discourage our United States-based customers from sourcing services from foreign companies and, as a result, some of our customers may require us to use labor based in the United States or cease doing business with Altisource. In addition, some of our customers may require us to use labor based in the United States for other reasons. To the extent that we are required to use labor based in the United States, we may not be able to pass on the increased costs of higher-priced United States-based labor to our customers, which ultimately could have an adverse effect on business and results of operations.
The FCPA and other applicable anti-corruption laws and regulations prohibit certain types of payments by our employees, vendors and agents. Any violation of the applicable anti-corruption laws or regulations by us, our subsidiaries or our local agents could expose us to significant penalties, fines, settlements, costs and consent orders that may curtail or restrict our business as it is currently conducted and could have an adverse effect on our business or results of operations.
Weakness of the United States dollar in relation to the currencies used in these foreign countries (e.g., Indian rupee) may also reduce the savings achievable through this strategy and could have an adverse effect on our business and our results of operations.
Altisource is a Luxembourg company and it may be difficult to obtain and enforce judgments against it or its directors and executive officers.
Altisource is a public limited liability company organized under the laws of, and headquartered in, Luxembourg. As a result, Luxembourg law and the articles of incorporation govern the rights of shareholders. The rights of shareholders under Luxembourg law may differ from the rights of shareholders of companies incorporated in other jurisdictions. A significant portion of the assets of Altisource are owned outside of the United States. It may be difficult for investors to obtain and enforce, in the United States, judgments obtained in United States courts against Altisource or its directors based on the civil liability provisions of the United States securities laws or to enforce, in Luxembourg, judgments obtained in other jurisdictions including the United States.
20
A significant challenge of the Luxembourg tax regime or of its interpretation by the Luxembourg tax authorities or others could adversely affect our
business and results of operations.
The Company received and historically operated under a tax ruling from the Luxembourg tax authorities, which would have expired in 2019 unless extended or renewed. In connection with an internal reorganization by the Company during 2017, the Company no longer operates under the tax ruling. The European Commission (“EC”) has initiated investigations into several EU member states, including Luxembourg, to determine whether these EU member states have provided tax advantages to companies on a basis not allowed by the EU. While the EC’s investigations continue, it has concluded that certain companies in certain EU member states, including Luxembourg, have been provided such tax advantages. The EC is requiring these EU member states to recover from certain companies the prior year tax benefits they received. Such a development could have an adverse effect on our business and results of operations.
The Company has a significant net operating loss recognized by one of Altisource’s Luxembourg subsidiaries, Altisource S.à r.l. The utilization of this net operating loss is dependent on future earnings of Altisource S.à r.l., which may not occur before the net operating loss expires, which could adversely affect our business and results of operations.
In connection with a merger of two of the Company’s wholly-owned subsidiaries in December 2017, which was recognized at fair value, a net operating loss of $1.3 billion with a 17 year life was generated, creating a deferred tax asset of $342.6 million. During 2019, the Company recognized a full valuation allowance with respect to this deferred tax asset. If Altisource S.à r.l. is unable to generate sufficient pretax income by 2034, the Company may not be able to fully utilize the net operating loss within this 17 year period which could have an adverse effect on our business.
Risks Related to Our Employees
Our success depends on members of our Board of Directors, our executive officers and other key personnel.
Our success is dependent on the efforts and abilities of members of our Board of Directors, our executive officers and other key employees, many of whom have significant experience in the real estate and mortgage, financial services and technology industries. In particular, we are dependent on the services of members of our Board of Directors and key executives at our corporate headquarters and personnel at each of our business units. The loss of the services of any of these members of our Board of Directors, executives or key personnel could have an adverse effect on our business and results of operations.
Our inability to attract, motivate and retain skilled employees could adversely affect our business and results of operations.
Our business is labor intensive and places significant importance on our ability to recruit, engage, train and retain skilled employees. Additionally, demand for qualified technical and software professionals conversant in certain technologies may exceed supply as additional skills are required to keep pace with evolving computer technology. Our ability to recruit and train employees is critical to achieving our growth objective. Our inability to attract and retain skilled employees or an increase in wages or other costs of attracting, training or retaining skilled employees could have a material adverse effect on our business and results of operations.
We make extensive use of independent contractors in certain of our lines of business. If we are required to reclassify independent contractors as employees, we may incur fines and penalties and additional costs and taxes which could adversely affect our business and results of operations.
A significant number of independent contractors provide services in our operations for whom we do not pay or withhold any federal, state or local employment tax or provide employee benefits. These independent contractors may be retained by us or retained by vendors providing services to us. There are a number of tests used in determining whether an individual is an employee or an independent contractor. There can be no assurance that legislative, judicial or regulatory (including tax) authorities will not introduce proposals or assert interpretations of existing rules and regulations that would change, or at least challenge, the classification of our independent contractors. Although we believe we have properly classified our independent contractors, and require our vendors to property classify independent contractors used in connection with providing services to us, the U.S. Internal Revenue Service or other U.S. federal or state authorities or similar authorities of a foreign government may determine that we or our vendors have misclassified our independent contractors for employment tax or other purposes and, as a result, seek additional taxes from us, require us to pay certain compensation or benefits to wrongly classified employees, or attempt to impose fines or penalties. In addition, independent contractors may assert claims that they are our employees and seek to recover compensation, benefits, damages and penalties from us. If we are required to pay employer taxes, pay backup withholding compensation, benefits, damages or penalties with respect to prior periods with respect to or on behalf of our independent contractors or those of our vendors, our operating costs will increase, which could adversely affect our business and results of operations.
21
Risks Related to Our Relationships
We could have conflicts of interest with Ocwen, NRZ, and certain of our shareholders, members of management, and members of our Board of Directors, which may be resolved in a manner adverse to us.
We have significant business relationships with and provide services to Ocwen and to NRZ. We are aware, based on public filings, that our largest shareholder, William C. Erbey, owns or controls common stock in Altisource and Ocwen. As of December 31, 2019 and February 28, 2020, based on public filings, Mr. Erbey reported beneficially owning or controlling approximately 39% of the common stock of Altisource and approximately 2% of the common stock of Ocwen. In addition, certain members of our management and independent members of our Board of Directors (or entities affiliated with such Board of Directors members) have direct or beneficial equity interests in Ocwen or in NRZ, including in one instance, equity interests in Ocwen (slightly less than 10%) as well as Ocwen’s debt, and equity interests in Altisource (approximately 20%) as well as Altisource debt. Such interests could create, or appear to create, potential conflicts of interest with respect to matters potentially or actually involving or affecting us and Ocwen or NRZ.
There can be no assurance that we will implement measures that will enable us to manage potential conflicts with Ocwen or NRZ. There can be no assurance that any current or future measures that may be implemented to manage potential conflicts will be effective or that we will be able to manage or resolve all potential conflicts with Ocwen or NRZ, and, even if we do, that the resolution will be no less favorable to us than if we were dealing with another third party that has none of the connections we have with Ocwen or NRZ.
|
ITEM 1B.
|
UNRESOLVED STAFF COMMENTS
|
None.
|
ITEM 2.
|
PROPERTIES
|
Our principal executive offices are located in leased office space in Luxembourg, Grand Duchy of Luxembourg. Our principal leased offices in other countries as of
December 31, 2019
include four offices in the United States, three offices in India and one office each in Uruguay and the Philippines.
We do not own any office facilities. We consider these facilities to be suitable and currently adequate for the management and operations of our businesses.
|
ITEM 3.
|
LEGAL PROCEEDINGS
|
Litigation
We are currently involved in legal actions in the course of our business, some of which seek monetary damages. We do not believe that the outcome of these proceedings, both individually and in the aggregate, will have a material impact on our financial condition, results of operations or cash flows.
Regulatory Matters
Periodically, we are subject to audits, examinations and investigations by federal, state and local governmental authorities and receive subpoenas, civil investigative demands or other requests for information from such governmental authorities in connection with their regulatory or investigative authority. We are currently responding to such inquiries from governmental authorities relating to certain aspects of our business. We believe it is premature to predict the potential outcome or to estimate any potential financial impact in connection with these inquiries.
Our businesses are also subject to extensive regulation which may result in regulatory proceedings or actions against us. For further information, see Item 1A of Part I, “
Risk Factors
” above and
Note 25
to the consolidated financial statements.
|
ITEM 4.
|
MINE SAFETY DISCLOSURES
|
Not applicable.
22
PART II
|
ITEM 5.
|
MARKET FOR REGISTRANT’S COMMON EQUITY, RELATED STOCKHOLDER MATTERS AND ISSUER PURCHASES OF EQUITY SECURITIES
|
Market Information
Our common stock is listed on the NASDAQ Global Select Market under the symbol “ASPS.”
The number of holders of record of our common stock as of
February 28, 2020
was
94
. The number of beneficial shareholders is substantially greater than the number of holders as a large portion of our common stock is held through brokerage firms.
Dividends
We have not historically declared or paid cash dividends on our common stock, but may declare dividends in the future. Under Luxembourg law, shareholders need to approve certain dividends. Such approval typically occurs during a company’s annual meeting of shareholders. Luxembourg law imposes limits on our ability to pay dividends based on annual net income and net income carried forward, less any amounts placed in reserve. The provisions of our senior secured term loan agreement, as amended, also limit our ability to pay dividends.
Stock Performance Graph
The graph below compares the cumulative total stockholder return on our common stock with the cumulative total return on the S&P 500 Index and the NASDAQ Composite Index for the five year period ending on
December 31, 2019
. The graph assumes an investment of $100 at the beginning of this period. The comparisons in the graph below are based upon historical data and are not indicative of, nor intended to forecast, future performance of our common stock.
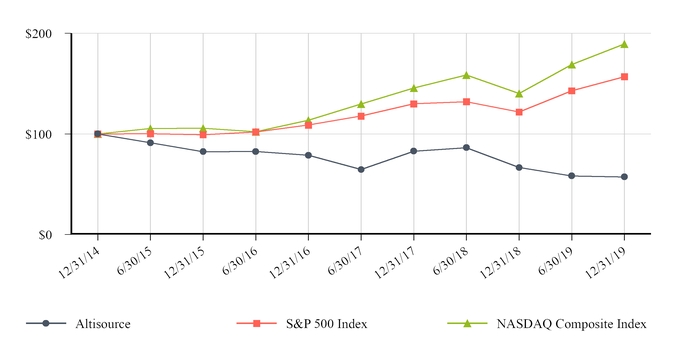
|
12/31/14
|
6/30/15
|
12/31/15
|
6/30/16
|
12/31/16
|
6/30/17
|
12/31/17
|
6/30/18
|
12/31/18
|
6/30/2019
|
12/31/19
|
||||||||||||||||||||||||||||||||||
|
Altisource
|
$
|
100.00
|
|
$
|
91.12
|
|
$
|
82.30
|
|
$
|
82.39
|
|
$
|
78.69
|
|
$
|
64.58
|
|
$
|
82.86
|
|
$
|
86.33
|
|
$
|
66.56
|
|
$
|
58.18
|
|
$
|
57.21
|
|
|||||||||||
|
S&P 500 Index
|
100.00
|
|
100.20
|
|
99.27
|
|
101.94
|
|
108.74
|
|
117.70
|
|
129.86
|
|
132.03
|
|
121.76
|
|
142.88
|
|
156.92
|
|
||||||||||||||||||||||
|
NASDAQ Composite Index
|
100.00
|
|
105.30
|
|
105.73
|
|
102.25
|
|
113.66
|
|
129.65
|
|
145.76
|
|
158.58
|
|
140.10
|
|
169.05
|
|
189.45
|
|
||||||||||||||||||||||
Securities Authorized for Issuance under Equity Compensation Plans
The information required by this item is incorporated herein by reference to our definitive proxy statement in connection with our
2020
annual meeting of shareholders to be filed pursuant to Regulation 14A under the Exchange Act.
23
Issuer Purchases of Equity Securities
On May 15, 2018, our shareholders approved the renewal and replacement of the share repurchase program previously approved by the shareholders on May 17, 2017. Under the program, we are authorized to purchase up to
4.3 million
shares of our common stock, based on a limit of
25%
of the outstanding shares of common stock on the date of approval, at a minimum price of
$1.00
per share and a maximum price of
$500.00
per share, for a period of
five
years from the date of approval. As of
December 31, 2019
, approximately
2.4 million
shares of common stock remain available for repurchase under the program. We purchased
1.0 million
shares of common stock at an average price of
$20.33
per share during the year ended
December 31, 2019
,
1.6 million
shares at an average price of
$25.53
per share during the year ended
December 31, 2018
and
1.6 million
shares at an average price of
$23.84
per share during the year ended
December 31, 2017
. Luxembourg law limits share repurchases to the balance of Altisource Portfolio Solutions S.A. (unconsolidated parent company) retained earnings, less the value of shares repurchased. As of
December 31, 2019
, we can repurchase up to approximately
$102 million
of our common stock under Luxembourg law. Our Credit Agreement also limits the amount we can spend on share repurchases, which limit was approximately
$463 million
as of
December 31, 2019
, and may prevent repurchases in certain circumstances.
The following table presents information related to the repurchases of our equity securities during the three months ended
December 31, 2019
:
|
Period
|
Total number of shares purchased
(1)
|
Weighted average price paid per share
|
Total number of shares purchased as part of publicly announced plans or programs
(2)
|
Maximum number of shares that may yet be purchased under the plans or programs
(2)
|
|||||||||
|
Common stock:
|
|||||||||||||
|
October 1 – 31, 2019
|
161,253
|
|
$
|
20.19
|
|
161,253
|
|
2,571,312
|
|
||||
|
November 1 – 30, 2019
|
170,375
|
|
18.02
|
|
170,375
|
|
2,400,937
|
|
|||||
|
December 1 – 31, 2019
|
14,501
|
|
18.21
|
|
14,501
|
|
2,386,436
|
|
|||||
|
346,129
|
|
$
|
19.04
|
|
346,129
|
|
2,386,436
|
|
|||||
______________________________________
|
(1)
|
In addition to the repurchases included in the table above, 9,526 common shares were withheld from employees to satisfy tax withholding obligations that arose from the vesting of restricted shares and restricted share units.
|
|
(2)
|
On May 15, 2018, our shareholders approved the renewal and replacement of the share repurchase program previously approved by the shareholders on May 17, 2017. Under the program, we are authorized to purchase up to
4.3 million
shares of our common stock in the open market, subject to certain parameters, for a period of five years from the date of approval.
|
24
|
ITEM 6.
|
SELECTED FINANCIAL DATA
|
The selected financial data as of and for the years ended
December 31, 2019
,
2018
,
2017
,
2016
and
2015
has been derived from our audited consolidated financial statements. The historical results may not be indicative of our future performance.
The selected consolidated financial data should be read in conjunction with the information contained in Item 7 of Part II,
“Management’s Discussion and Analysis of Financial Condition and Results of Operations”
and our consolidated financial statements and notes thereto in Item 8 of Part II,
“Financial Statements and Supplementary Data.”
|
For the years ended December 31,
|
||||||||||||||||||||
|
(in thousands, except per share data)
|
2019
|
2018
|
2017
|
2016
|
2015
|
|||||||||||||||
|
Revenue
|
$
|
648,651
|
|
$
|
838,202
|
|
$
|
942,213
|
|
$
|
997,303
|
|
$
|
1,051,466
|
|
|||||
|
Cost of revenue
|
493,256
|
|
622,165
|
|
699,865
|
|
690,045
|
|
687,327
|
|
||||||||||
|
Gross profit
|
155,395
|
|
216,037
|
|
242,348
|
|
307,258
|
|
364,139
|
|
||||||||||
|
Operating expenses (income):
|
||||||||||||||||||||
|
Selling, general and administrative expenses
|
141,076
|
|
175,670
|
|
192,642
|
|
214,155
|
|
220,868
|
|
||||||||||
|
Gain on sale of businesses
|
(17,814
|
)
|
(13,688
|
)
|
—
|
|
—
|
|
—
|
|
||||||||||
|
Restructuring charges
|
14,080
|
|
11,560
|
|
—
|
|
—
|
|
—
|
|
||||||||||
|
Litigation settlement loss, net of $4,000 insurance recovery
|
—
|
|
—
|
|
—
|
|
28,000
|
|
—
|
|
||||||||||
|
Impairment losses
|
—
|
|
—
|
|
—
|
|
—
|
|
71,785
|
|
||||||||||
|
Change in the fair value of Equator Earn Out
|
—
|
|
—
|
|
—
|
|
—
|
|
(7,591
|
)
|
||||||||||
|
Income from operations
|
18,053
|
|
42,495
|
|
49,706
|
|
65,103
|
|
79,077
|
|
||||||||||
|
Other income (expense), net:
|
||||||||||||||||||||
|
Interest expense
|
(21,393
|
)
|
(26,254
|
)
|
(22,253
|
)
|
(24,412
|
)
|
(28,208
|
)
|
||||||||||
|
Unrealized gain (loss) on investment in equity securities
(1)
|
14,431
|
|
(12,972
|
)
|
—
|
|
—
|
|
—
|
|
||||||||||
|
Other income (expense), net:
|
1,348
|
|
(1,870
|
)
|
7,922
|
|
3,630
|
|
2,191
|
|
||||||||||
|
Total other income (expense), net
|
(5,614
|
)
|
(41,096
|
)
|
(14,331
|
)
|
(20,782
|
)
|
(26,017
|
)
|
||||||||||
|
Income before income taxes and non-controlling interests
|
12,439
|
|
1,399
|
|
35,375
|
|
44,321
|
|
53,060
|
|
||||||||||
|
Income tax (provision) benefit
|
(318,296
|
)
|
(4,098
|
)
|
276,256
|
|
(12,935
|
)
|
(8,260
|
)
|
||||||||||
|
Net (loss) income
|
(305,857
|
)
|
(2,699
|
)
|
311,631
|
|
31,386
|
|
44,800
|
|
||||||||||
|
Net income attributable to non-controlling interests
|
(2,112
|
)
|
(2,683
|
)
|
(2,740
|
)
|
(2,693
|
)
|
(3,202
|
)
|
||||||||||
|
Net (loss) income attributable to Altisource
|
$
|
(307,969
|
)
|
$
|
(5,382
|
)
|
$
|
308,891
|
|
$
|
28,693
|
|
$
|
41,598
|
|
|||||
|
(Loss) earnings per share:
|
||||||||||||||||||||
|
Basic
|
$
|
(19.26
|
)
|
$
|
(0.32
|
)
|
$
|
16.99
|
|
$
|
1.53
|
|
$
|
2.13
|
|
|||||
|
Diluted
|
$
|
(19.26
|
)
|
$
|
(0.32
|
)
|
$
|
16.53
|
|
$
|
1.46
|
|
$
|
2.02
|
|
|||||
|
Weighted average shares outstanding:
|
||||||||||||||||||||
|
Basic
|
15,991
|
|
17,073
|
|
18,183
|
|
18,696
|
|
19,504
|
|
||||||||||
|
Diluted
|
15,991
|
|
17,073
|
|
18,692
|
|
19,612
|
|
20,619
|
|
||||||||||
|
Outstanding shares (at December 31)
|
15,454
|
|
16,276
|
|
17,418
|
|
18,774
|
|
19,021
|
|
||||||||||
|
Non-GAAP Financial Measures
(2)
|
||||||||||||||||||||
|
Adjusted net income attributable to Altisource
|
$
|
21,802
|
|
$
|
42,609
|
|
$
|
55,617
|
|
$
|
94,884
|
|
$
|
147,942
|
|
|||||
|
Adjusted diluted earnings per share
|
$
|
1.34
|
|
$
|
2.43
|
|
$
|
2.98
|
|
$
|
4.84
|
|
$
|
7.18
|
|
|||||
|
Adjusted EBITDA
|
$
|
70,800
|
|
$
|
118,279
|
|
$
|
130,687
|
|
$
|
184,501
|
|
$
|
224,544
|
|
|||||
25
|
December 31,
|
||||||||||||||||||||
|
(in thousands)
|
2019
|
2018
|
2017
|
2016
|
2015
|
|||||||||||||||
|
Cash and cash equivalents
|
$
|
82,741
|
|
$
|
58,294
|
|
$
|
105,006
|
|
$
|
149,294
|
|
$
|
179,327
|
|
|||||
|
Investment in equity securities
|
42,618
|
|
36,181
|
|
49,153
|
|
45,754
|
|
—
|
|
||||||||||
|
Accounts receivable, net
|
43,615
|
|
36,466
|
|
52,740
|
|
87,821
|
|
105,023
|
|
||||||||||
|
Short-term investments in real estate
|
—
|
|
39,873
|
|
29,405
|
|
13,025
|
|
—
|
|
||||||||||
|
Premises and equipment, net
|
24,526
|
|
45,631
|
|
73,273
|
|
103,473
|
|
119,121
|
|
||||||||||
|
Goodwill
|
73,849
|
|
81,387
|
|
86,283
|
|
86,283
|
|
82,801
|
|
||||||||||
|
Intangible assets, net
|
61,046
|
|
91,653
|
|
120,065
|
|
155,432
|
|
197,003
|
|
||||||||||
|
Total assets
|
385,119
|
|
741,700
|
|
865,164
|
|
689,212
|
|
721,798
|
|
||||||||||
|
Long-term debt (including current portion)
|
287,882
|
|
331,476
|
|
409,281
|
|
473,545
|
|
528,178
|
|
||||||||||
|
Total liabilities
|
406,476
|
|
445,032
|
|
525,179
|
|
627,018
|
|
669,528
|
|
||||||||||
|
Net debt less investment in equity securities
(2)
|
168,467
|
|
244,347
|
|
259,422
|
|
284,605
|
|
357,271
|
|
||||||||||
_________________________
|
(1)
|
Effective January 1, 2018, mark-to-market adjustments of our investment in equity securities are reflected in our results of operations in connection with the adoption of a new accounting principle (previously reflected in comprehensive income).
|
|
(2)
|
These are non-GAAP measures that are defined and reconciled to the corresponding GAAP measures on pages
27
to
31
.
|
Significant events affecting our historical earnings trends from
2017
through
2019
, are described in Item 7 of Part II,
“Management’s Discussion and Analysis of Financial Condition and Results of Operations.”
26
NON-GAAP MEASURES
Adjusted net income attributable to Altisource, adjusted diluted earnings per share, adjusted earnings before interest, taxes depreciation and amortization (“Adjusted EBITDA”) and net debt less investment in equity securities, which are presented elsewhere in this Annual Report on Form 10-K, are non-GAAP measures used by management, existing shareholders, potential shareholders and other users of our financial information to measure Altisource’s performance. These measures do not purport to be alternatives to net (loss) income attributable to Altisource, diluted (loss) earnings per share and long-term debt, including current portion, as measures of Altisource’s performance. We believe these measures are useful to management, existing shareholders, potential shareholders and other users of our financial information in evaluating operating profitability and cash flow generation more on the basis of continuing cost and cash flows as they exclude amortization expense related to acquisitions that occurred in prior periods and non-cash share-based compensation expense and/or depreciation expense, financing expense and income taxes, as well as the effect of more significant non-operational items from earnings and long-term debt net of cash on-hand and investment in equity securities. We believe these measures are also useful in evaluating the effectiveness of our operations and underlying business trends in a manner that is consistent with management’s evaluation of business performance. Furthermore, we believe the exclusion of more significant non-operational items enables comparability to prior period performance and trend analysis.
It is management’s intent to provide non-GAAP financial information to enhance the understanding of Altisource’s GAAP financial information, and it should be considered by the reader in addition to, but not instead of, the financial statements prepared in accordance with GAAP. Each non-GAAP financial measure is presented along with the corresponding GAAP measure so as not to imply that more emphasis should be placed on the non-GAAP measure. The non-GAAP financial information presented may be determined or calculated differently by other companies. The non-GAAP financial information should not be unduly relied upon.
Adjusted net income attributable to Altisource is calculated by removing intangible asset amortization expense (net of tax), share-based compensation expense (net of tax), loss on BRS portfolio sale (net of tax), gain on sale of businesses (net of tax), sales tax accrual, net of reimbursement (net of tax), restructuring charges (net of tax), write-off of net discount and debt issuance costs from debt refinancing (net of tax), goodwill and intangible and other assets write-off from business exits (net of tax), unrealized gain (loss) on investment in equity securities (net of tax), litigation settlement loss, net of insurance recovery (net of tax), impairment loss (net of tax), certain income tax related items relating to the Luxembourg deferred tax asset from the Luxembourg subsidiary merger in 2017 and increase in the valuation allowance in 2019, income tax rate changes in Luxembourg and the United States and increases in foreign income tax reserves (and related interest) and a gain associated with a reduction of the Equator, LLC (“Equator”) related contingent consideration (“Equator Earn Out”) (net of tax) from net (loss) income attributable to Altisource. Adjusted diluted earnings per share is calculated by dividing net (loss) income attributable to Altisource after removing intangible asset amortization expense (net of tax), share-based compensation expense (net of tax), loss on BRS portfolio sale (net of tax), gain on sale of businesses (net of tax), sales tax accrual, net of reimbursement (net of tax), restructuring charges (net of tax), write-off of net discount and debt issuance costs from debt refinancing (net of tax), goodwill and intangible and other assets write-off from business exits (net of tax), unrealized gain (loss) on investment in equity securities (net of tax), litigation settlement loss, net of insurance recovery (net of tax), impairment loss (net of tax), certain income tax related items described above and gain on Equator Earn Out (net of tax) by the weighted average number of diluted shares. Adjusted EBITDA is calculated by removing the income tax (provision) benefit, interest expense (net of interest income), depreciation and amortization, intangible asset amortization expense, share-based compensation expense, loss on BRS portfolio sale, unrealized gain (loss) on investment in equity securities, sales tax accrual, net of reimbursement, write-off of net discount and debt issuance costs from debt refinancing, restructuring charges, goodwill and intangible and other assets write-off from business exits, gain on sale of businesses, litigation settlement loss, net of insurance recovery, impairment loss and gain on Equator Earn Out from net (loss) income attributable to Altisource. Net debt less investment in equity securities is calculated as long-term debt, including current portion, less cash and cash equivalents and investment in equity securities.
27
Reconciliations of the non-GAAP measures to the corresponding GAAP measures are set forth in the following tables:
|
For the years ended December 31,
|
||||||||||||||||||||
|
(in thousands, except per share data)
|
2019
|
2018
|
2017
|
2016
|
2015
|
|||||||||||||||
|
Net (loss) income attributable to Altisource
|
$
|
(307,969
|
)
|
$
|
(5,382
|
)
|
$
|
308,891
|
|
$
|
28,693
|
|
$
|
41,598
|
|
|||||
|
Intangible asset amortization expense, net of tax
|
14,277
|
|
19,905
|
|
27,523
|
|
36,819
|
|
38,187
|
|
||||||||||
|
Share-based compensation expense, net of tax
|
8,913
|
|
7,141
|
|
3,311
|
|
4,789
|
|
4,467
|
|
||||||||||
|
Loss on BRS portfolio sale, net of tax
|
1,405
|
|
—
|
|
—
|
|
—
|
|
—
|
|
||||||||||
|
Gain on sale of businesses, net of tax
|
(10,642
|
)
|
(9,341
|
)
|
—
|
|
—
|
|
—
|
|
||||||||||
|
Sales tax accrual, net of reimbursement, net of tax
|
233
|
|
4,608
|
|
—
|
|
—
|
|
—
|
|
||||||||||
|
Restructuring charges, net of tax
|
10,666
|
|
8,966
|
|
—
|
|
—
|
|
—
|
|
||||||||||
|
Write-off of net discount and debt issuance costs from debt refinancing, net of tax
|
—
|
|
3,232
|
|
—
|
|
—
|
|
—
|
|
||||||||||
|
Goodwill and intangible and other assets write-off from business exits, net of tax
|
4,578
|
|
1,953
|
|
—
|
|
—
|
|
—
|
|
||||||||||
|
Unrealized (gain) loss on investment in equity securities, net of tax
|
(10,832
|
)
|
9,598
|
|
—
|
|
—
|
|
—
|
|
||||||||||
|
Certain income tax related items, net
|
311,173
|
|
1,588
|
|
(284,108
|
)
|
—
|
|
—
|
|
||||||||||
|
Net litigation settlement loss, net of tax
|
—
|
|
341
|
|
—
|
|
24,583
|
|
—
|
|
||||||||||
|
Impairment loss, net of tax
|
—
|
|
—
|
|
—
|
|
—
|
|
70,630
|
|
||||||||||
|
Gain on Equator Earn Out, net of tax
|
—
|
|
—
|
|
—
|
|
—
|
|
(6,940
|
)
|
||||||||||
|
Adjusted net income attributable to Altisource
|
$
|
21,802
|
|
$
|
42,609
|
|
$
|
55,617
|
|
$
|
94,884
|
|
$
|
147,942
|
|
|||||
|
Diluted (loss) earnings per share
|
$
|
(19.26
|
)
|
$
|
(0.32
|
)
|
$
|
16.53
|
|
$
|
1.46
|
|
$
|
2.02
|
|
|||||
|
Impact of using diluted share count instead of basic share count for a loss per share
|
0.34
|
|
0.01
|
|
—
|
|
—
|
|
—
|
|
||||||||||
|
Intangible asset amortization expense, net of tax, per diluted share
|
0.88
|
|
1.14
|
|
1.47
|
|
1.88
|
|
1.85
|
|
||||||||||
|
Share-based compensation expense, net of tax, per diluted share
|
0.55
|
|
0.41
|
|
0.18
|
|
0.24
|
|
0.22
|
|
||||||||||
|
Loss on BRS portfolio sale, net of tax, per diluted share
|
0.09
|
|
—
|
|
—
|
|
—
|
|
—
|
|
||||||||||
|
Gain on sale of businesses, net of tax, per diluted share
|
(0.65
|
)
|
(0.53
|
)
|
—
|
|
—
|
|
—
|
|
||||||||||
|
Sales tax accrual, net of reimbursement, net of tax, per diluted share
|
0.01
|
|
0.26
|
|
—
|
|
—
|
|
—
|
|
||||||||||
|
Restructuring charges, net of tax, per diluted share
|
0.66
|
|
0.51
|
|
—
|
|
—
|
|
—
|
|
||||||||||
|
Write-off of net discount and debt issuance costs from debt refinancing, net of tax, per diluted share
|
—
|
|
0.18
|
|
—
|
|
—
|
|
—
|
|
||||||||||
|
Goodwill and intangible and other assets write-off from business exits, net of tax, per diluted share
|
0.28
|
|
0.11
|
|
—
|
|
—
|
|
—
|
|
||||||||||
|
Unrealized (gain) loss on investment in equity securities, net of tax, per diluted share
|
(0.67
|
)
|
0.55
|
|
—
|
|
—
|
|
—
|
|
||||||||||
|
Certain income tax related items, net, per diluted share
|
19.12
|
|
0.09
|
|
(15.20
|
)
|
—
|
|
—
|
|
||||||||||
|
Net litigation settlement loss, net of tax, per diluted share
|
—
|
|
0.02
|
|
—
|
|
1.25
|
|
—
|
|
||||||||||
|
Impairment loss, net of tax, per diluted share
|
—
|
|
—
|
|
—
|
|
—
|
|
3.43
|
|
||||||||||
|
Gain on Equator Earn Out, net of tax, per diluted share
|
—
|
|
—
|
|
—
|
|
—
|
|
(0.34
|
)
|
||||||||||
|
Adjusted diluted earnings per share
|
$
|
1.34
|
|
$
|
2.43
|
|
$
|
2.98
|
|
$
|
4.84
|
|
$
|
7.18
|
|
|||||
28
|
For the years ended December 31,
|
||||||||||||||||||||
|
(in thousands, except per share data)
|
2019
|
2018
|
2017
|
2016
|
2015
|
|||||||||||||||
|
Calculation of the impact of intangible asset amortization expense, net of tax
|
||||||||||||||||||||
|
Intangible asset amortization expense
|
$
|
19,021
|
|
$
|
28,412
|
|
$
|
35,367
|
|
$
|
47,576
|
|
$
|
41,135
|
|
|||||
|
Tax benefit from intangible asset amortization
|
(4,744
|
)
|
(8,507
|
)
|
(7,844
|
)
|
(10,757
|
)
|
(2,948
|
)
|
||||||||||
|
Intangible asset amortization expense, net of tax
|
14,277
|
|
19,905
|
|
27,523
|
|
36,819
|
|
38,187
|
|
||||||||||
|
Diluted share count
|
16,277
|
|
17,523
|
|
18,692
|
|
19,612
|
|
20,619
|
|
||||||||||
|
Intangible asset amortization expense, net of tax, per diluted share
|
$
|
0.88
|
|
$
|
1.14
|
|
$
|
1.47
|
|
$
|
1.88
|
|
$
|
1.85
|
|
|||||
|
Calculation of the impact of share-based compensation expense, net of tax
|
||||||||||||||||||||
|
Share-based compensation expense
|
$
|
11,874
|
|
$
|
10,192
|
|
$
|
4,255
|
|
$
|
6,188
|
|
$
|
4,812
|
|
|||||
|
Tax benefit from share-based compensation expense
|
(2,961
|
)
|
(3,051
|
)
|
(944
|
)
|
(1,399
|
)
|
(345
|
)
|
||||||||||
|
Share-based compensation expense, net of tax
|
8,913
|
|
7,141
|
|
3,311
|
|
4,789
|
|
4,467
|
|
||||||||||
|
Diluted share count
|
16,277
|
|
17,523
|
|
18,692
|
|
19,612
|
|
20,619
|
|
||||||||||
|
Share-based compensation expense, net of tax, per diluted share
|
$
|
0.55
|
|
$
|
0.41
|
|
$
|
0.18
|
|
$
|
0.24
|
|
$
|
0.22
|
|
|||||
|
Calculation of the impact of loss on BRS portfolio sale, net of tax
|
||||||||||||||||||||
|
Loss on BRS portfolio sale
|
$
|
1,770
|
|
$
|
—
|
|
$
|
—
|
|
$
|
—
|
|
$
|
—
|
|
|||||
|
Tax benefit from loss on BRS portfolio sale
|
(365
|
)
|
—
|
|
—
|
|
—
|
|
—
|
|
||||||||||
|
Loss on BRS portfolio sale, net of tax
|
1,405
|
|
—
|
|
—
|
|
—
|
|
—
|
|
||||||||||
|
Diluted share count
|
16,277
|
|
17,523
|
|
18,692
|
|
19,612
|
|
20,619
|
|
||||||||||
|
Loss on BRS portfolio sale, net of tax, per diluted share
|
$
|
0.09
|
|
$
|
—
|
|
$
|
—
|
|
$
|
—
|
|
$
|
—
|
|
|||||
|
Calculation of the impact of gain on sale of businesses, net of tax
|
||||||||||||||||||||
|
Gain on sale of businesses
|
$
|
(17,814
|
)
|
$
|
(13,688
|
)
|
$
|
—
|
|
$
|
—
|
|
$
|
—
|
|
|||||
|
Tax provision from gain on sale of businesses
|
7,172
|
|
4,347
|
|
—
|
|
—
|
|
—
|
|
||||||||||
|
Gain on sale of businesses, net of tax
|
(10,642
|
)
|
(9,341
|
)
|
—
|
|
—
|
|
—
|
|
||||||||||
|
Diluted share count
|
16,277
|
|
17,523
|
|
18,692
|
|
19,612
|
|
20,619
|
|
||||||||||
|
Gain on sale of businesses, net of tax, per diluted share
|
$
|
(0.65
|
)
|
$
|
(0.53
|
)
|
$
|
—
|
|
$
|
—
|
|
$
|
—
|
|
|||||
|
Calculation of the impact of sales tax accrual, net of reimbursement, net of tax
|
||||||||||||||||||||
|
Sales tax accrual, net of reimbursement
|
$
|
311
|
|
$
|
6,228
|
|
$
|
—
|
|
$
|
—
|
|
$
|
—
|
|
|||||
|
Tax benefit from sales tax accrual, net of reimbursement
|
(78
|
)
|
(1,620
|
)
|
—
|
|
—
|
|
—
|
|
||||||||||
|
Sales tax accrual, net of reimbursement, net of tax
|
233
|
|
4,608
|
|
—
|
|
—
|
|
—
|
|
||||||||||
|
Diluted share count
|
16,277
|
|
17,523
|
|
18,692
|
|
19,612
|
|
20,619
|
|
||||||||||
|
Sales tax accrual, net of reimbursement, net of tax, per diluted share
|
$
|
0.01
|
|
$
|
0.26
|
|
$
|
—
|
|
$
|
—
|
|
$
|
—
|
|
|||||
29
|
For the years ended December 31,
|
||||||||||||||||||||
|
(in thousands, except per share data)
|
2019
|
2018
|
2017
|
2016
|
2015
|
|||||||||||||||
|
Calculation of the impact of restructuring charges, net of tax
|
||||||||||||||||||||
|
Restructuring charges
|
$
|
14,080
|
|
$
|
11,560
|
|
$
|
—
|
|
$
|
—
|
|
$
|
—
|
|
|||||
|
Tax benefit from restructuring charges
|
(3,414
|
)
|
(2,594
|
)
|
—
|
|
—
|
|
—
|
|
||||||||||
|
Restructuring charges, net of tax
|
10,666
|
|
8,966
|
|
—
|
|
—
|
|
—
|
|
||||||||||
|
Diluted share count
|
16,277
|
|
17,523
|
|
18,692
|
|
19,612
|
|
20,619
|
|
||||||||||
|
Restructuring charges, net of tax, per diluted share
|
$
|
0.66
|
|
$
|
0.51
|
|
$
|
—
|
|
$
|
—
|
|
$
|
—
|
|
|||||
|
Calculation of the impact of the write-off of net discount and debt issuance costs from debt refinancing, net of tax
|
||||||||||||||||||||
|
Write-off of net discount and debt issuance costs from debt refinancing
|
$
|
—
|
|
$
|
4,434
|
|
$
|
—
|
|
$
|
—
|
|
$
|
—
|
|
|||||
|
Tax benefit from the write-off of net discount and debt issuance costs from debt refinancing
|
—
|
|
(1,202
|
)
|
—
|
|
—
|
|
—
|
|
||||||||||
|
Write-off of net discount and debt issuance costs from debt refinancing, net of tax
|
—
|
|
3,232
|
|
—
|
|
—
|
|
—
|
|
||||||||||
|
Diluted share count
|
16,277
|
|
17,523
|
|
18,692
|
|
19,612
|
|
20,619
|
|
||||||||||
|
Write-off of net discount and debt issuance costs from debt refinancing, net of tax, per diluted share
|
$
|
—
|
|
$
|
0.18
|
|
$
|
—
|
|
$
|
—
|
|
$
|
—
|
|
|||||
|
Calculation of the impact of goodwill and intangible and other assets write-off from business exits, net of tax
|
||||||||||||||||||||
|
Goodwill and intangible and other assets write-off from business exits
|
$
|
6,102
|
|
$
|
2,640
|
|
$
|
—
|
|
$
|
—
|
|
$
|
—
|
|
|||||
|
Tax benefit from goodwill and intangible and other assets write-off from business exits
|
(1,524
|
)
|
(687
|
)
|
—
|
|
—
|
|
—
|
|
||||||||||
|
Goodwill and intangible and other assets write-off from business exits, net of tax
|
4,578
|
|
1,953
|
|
—
|
|
—
|
|
—
|
|
||||||||||
|
Diluted share count
|
16,277
|
|
17,523
|
|
18,692
|
|
19,612
|
|
20,619
|
|
||||||||||
|
Goodwill and intangible and other assets write-off from business exits, net of tax, per diluted share
|
$
|
0.28
|
|
$
|
0.11
|
|
$
|
—
|
|
$
|
—
|
|
$
|
—
|
|
|||||
|
Calculation of the impact of the unrealized (gain) loss on investment in equity securities, net of tax
|
||||||||||||||||||||
|
Unrealized (gain) loss on investment in equity securities
|
$
|
(14,431
|
)
|
$
|
12,972
|
|
$
|
—
|
|
$
|
—
|
|
$
|
—
|
|
|||||
|
Tax provision (benefit) from the unrealized (gain) loss on investment in equity securities
|
3,599
|
|
(3,374
|
)
|
—
|
|
—
|
|
—
|
|
||||||||||
|
Unrealized (gain) loss on investment in equity securities, net of tax
|
(10,832
|
)
|
9,598
|
|
—
|
|
—
|
|
—
|
|
||||||||||
|
Diluted share count
|
16,277
|
|
17,523
|
|
18,692
|
|
19,612
|
|
20,619
|
|
||||||||||
|
Unrealized (gain) loss on investment in equity securities, net of tax, per diluted share
|
$
|
(0.67
|
)
|
$
|
0.55
|
|
$
|
—
|
|
$
|
—
|
|
$
|
—
|
|
|||||
|
Certain income tax related items resulting from:
|
||||||||||||||||||||
|
Luxembourg deferred tax valuation allowance and Luxembourg subsidiaries merger, net
|
$
|
291,484
|
|
$
|
—
|
|
$
|
(300,908
|
)
|
$
|
—
|
|
$
|
—
|
|
|||||
|
Income tax rate changes
|
14,040
|
|
—
|
|
6,270
|
|
—
|
|
—
|
|
||||||||||
|
Foreign income tax reserves
|
5,649
|
|
1,588
|
|
10,530
|
|
—
|
|
—
|
|
||||||||||
|
Certain income tax related items, net
|
311,173
|
|
1,588
|
|
(284,108
|
)
|
—
|
|
—
|
|
||||||||||
|
Diluted share count
|
16,277
|
|
17,523
|
|
18,692
|
|
19,612
|
|
20,619
|
|
||||||||||
|
Certain income tax related items, net, per diluted share
|
$
|
19.12
|
|
$
|
0.09
|
|
$
|
(15.20
|
)
|
$
|
—
|
|
$
|
—
|
|
|||||
30
|
For the years ended December 31,
|
||||||||||||||||||||
|
(in thousands, except per share data)
|
2019
|
2018
|
2017
|
2016
|
2015
|
|||||||||||||||
|
Calculation of the impact of net litigation settlement loss, net of tax
|
||||||||||||||||||||
|
Net litigation settlement loss
|
$
|
—
|
|
$
|
500
|
|
$
|
—
|
|
$
|
28,000
|
|
$
|
—
|
|
|||||
|
Tax benefit from net litigation settlement loss
|
—
|
|
(159
|
)
|
—
|
|
(3,417
|
)
|
—
|
|
||||||||||
|
Net litigation settlement loss, net of tax
|
—
|
|
341
|
|
—
|
|
24,583
|
|
—
|
|
||||||||||
|
Diluted share count
|
16,277
|
|
17,523
|
|
18,692
|
|
19,612
|
|
20,619
|
|
||||||||||
|
Net litigation settlement loss, net of tax, per diluted share
|
$
|
—
|
|
$
|
0.02
|
|
$
|
—
|
|
$
|
1.25
|
|
$
|
—
|
|
|||||
|
Calculation of the impact of impairment loss, net of tax
|
||||||||||||||||||||
|
Impairment loss
|
$
|
—
|
|
$
|
—
|
|
$
|
—
|
|
$
|
—
|
|
$
|
71,785
|
|
|||||
|
Tax benefit from impairment loss
|
—
|
|
—
|
|
—
|
|
—
|
|
(1,155
|
)
|
||||||||||
|
Impairment loss, net of tax
|
—
|
|
—
|
|
—
|
|
—
|
|
70,630
|
|
||||||||||
|
Diluted share count
|
16,277
|
|
17,523
|
|
18,692
|
|
19,612
|
|
20,619
|
|
||||||||||
|
Impairment loss, net of tax, per diluted share
|
$
|
—
|
|
$
|
—
|
|
$
|
—
|
|
$
|
—
|
|
$
|
3.43
|
|
|||||
|
Calculation of gain on Equator Earn Out, net of tax
|
||||||||||||||||||||
|
Gain on Equator Earn Out
|
$
|
—
|
|
$
|
—
|
|
$
|
—
|
|
$
|
—
|
|
$
|
(7,591
|
)
|
|||||
|
Tax provision from the gain on Equator Earn Out
|
—
|
|
—
|
|
—
|
|
—
|
|
651
|
|
||||||||||
|
Gain on Equator Earn Out, net of tax
|
—
|
|
—
|
|
—
|
|
—
|
|
(6,940
|
)
|
||||||||||
|
Diluted share count
|
16,277
|
|
17,523
|
|
18,692
|
|
19,612
|
|
20,619
|
|
||||||||||
|
Gain on Equator Earn Out, net of tax, per diluted share
|
$
|
—
|
|
$
|
—
|
|
$
|
—
|
|
$
|
—
|
|
$
|
(0.34
|
)
|
|||||
|
Net (loss) income attributable to Altisource
|
$
|
(307,969
|
)
|
$
|
(5,382
|
)
|
$
|
308,891
|
|
$
|
28,693
|
|
$
|
41,598
|
|
|||||
|
Income tax provision (benefit)
|
318,296
|
|
4,098
|
|
(276,256
|
)
|
12,935
|
|
8,260
|
|
||||||||||
|
Interest expense (net of interest income)
|
21,051
|
|
25,514
|
|
21,983
|
|
24,321
|
|
28,075
|
|
||||||||||
|
Depreciation and amortization
|
18,509
|
|
30,799
|
|
36,447
|
|
36,788
|
|
36,470
|
|
||||||||||
|
Intangible asset amortization expense
|
19,021
|
|
28,412
|
|
35,367
|
|
47,576
|
|
41,135
|
|
||||||||||
|
Share-based compensation expense
|
11,874
|
|
10,192
|
|
4,255
|
|
6,188
|
|
4,812
|
|
||||||||||
|
Loss on BRS portfolio sale
|
1,770
|
|
—
|
|
—
|
|
—
|
|
—
|
|
||||||||||
|
Unrealized (gain) loss on investment in equity securities
|
(14,431
|
)
|
12,972
|
|
—
|
|
—
|
|
—
|
|
||||||||||
|
Sales tax accrual, net of reimbursement
|
311
|
|
6,228
|
|
—
|
|
—
|
|
—
|
|
||||||||||
|
Write-off of net discount and debt issuance costs from debt refinancing
|
—
|
|
4,434
|
|
—
|
|
—
|
|
—
|
|
||||||||||
|
Restructuring charges
|
14,080
|
|
11,560
|
|
—
|
|
—
|
|
—
|
|
||||||||||
|
Goodwill and intangible and other assets write-off from business exits
|
6,102
|
|
2,640
|
|
—
|
|
—
|
|
—
|
|
||||||||||
|
Gain on sale of businesses
|
(17,814
|
)
|
(13,688
|
)
|
—
|
|
—
|
|
—
|
|
||||||||||
|
Net litigation settlement loss
|
—
|
|
500
|
|
—
|
|
28,000
|
|
—
|
|
||||||||||
|
Impairment loss
|
—
|
|
—
|
|
—
|
|
—
|
|
71,785
|
|
||||||||||
|
Gain on Equator Earn Out
|
—
|
|
—
|
|
—
|
|
—
|
|
(7,591
|
)
|
||||||||||
|
Adjusted EBITDA
|
$
|
70,800
|
|
$
|
118,279
|
|
$
|
130,687
|
|
$
|
184,501
|
|
$
|
224,544
|
|
|||||
|
December 31,
|
||||||||||||||||||||
|
2019
|
2018
|
2017
|
2016
|
2015
|
||||||||||||||||
|
Senior secured term loan
|
$
|
293,826
|
|
$
|
338,822
|
|
$
|
413,581
|
|
$
|
479,653
|
|
$
|
536,598
|
|
|||||
|
Less: Cash and cash equivalents
|
(82,741
|
)
|
(58,294
|
)
|
(105,006
|
)
|
(149,294
|
)
|
(179,327
|
)
|
||||||||||
|
Less: Investment in equity securities
|
(42,618
|
)
|
(36,181
|
)
|
(49,153
|
)
|
(45,754
|
)
|
—
|
|
||||||||||
|
Net debt less investment in equity securities
|
$
|
168,467
|
|
$
|
244,347
|
|
$
|
259,422
|
|
$
|
284,605
|
|
$
|
357,271
|
|
|||||
____________________________________
Note: Amounts may not add to the total due to rounding.
31
|
ITEM 7.
|
MANAGEMENT’S DISCUSSION AND ANALYSIS OF FINANCIAL CONDITION AND RESULTS OF OPERATIONS
|
Management’s discussion and analysis of financial condition and results of operations (“MD&A”) is a supplement to the accompanying consolidated financial statements and is intended to provide a reader of our financial statements with a narrative from the perspective of management on our businesses, current developments, financial condition, results of operations and liquidity. Significant sections of the MD&A are as follows:
Overview.
This section, beginning below, provides a description of recent developments we believe are important in understanding our results of operations and financial condition as well as understanding anticipated future trends. It also provides a brief description of significant transactions and events that affect the comparability of financial results and a discussion of the progress being made on our strategic initiatives.
Results of Operations.
This section, beginning on page 37, provides an analysis of our consolidated results of operations for the three years ended
December 31, 2019
.
Liquidity and Capital Resources
. This section, beginning on page 43, provides an analysis of our cash flows for the three years ended
December 31, 2019
. We also discuss restrictions on cash movements, future commitments and capital resources.
Critical Accounting Policies, Estimates and Recent Accounting Pronouncements.
This section, beginning on page 45, identifies those accounting principles we believe are most important to our financial results and that require significant judgment and estimates on the part of management in application. We provide all of our significant accounting policies in
Note 2
to the accompanying consolidated financial statements.
Other Matters.
This section, beginning on page 48, provides a discussion of off-balance sheet arrangements to the extent they exist. In addition, we provide a tabular discussion of contractual obligations, discuss any significant commitments or contingencies and customer concentration.
OVERVIEW
Our Business
We are an integrated service provider and marketplace for the real estate and mortgage industries. Combining operational excellence with a suite of innovative services and technologies, Altisource helps solve the demands of the ever-changing markets we serve.
Effective January 1, 2019, the Company reorganized its internal reporting structure in connection with Project Catalyst, a project initiated in August 2018 to optimize our operations and reduce costs to better align our cost structure with our anticipated revenues and improve our operating margins. The internal reorganization included, among other changes, the replacement of segment presidents with a chief operating officer, who is responsible for products, services and operations for the Company’s Mortgage Market and Real Estate Market businesses, reporting to our Chairman and Chief Executive Officer (our chief operating decision maker) who manages our businesses, regularly reviews operating results and profitability, allocates resources and evaluates performance on a consolidated basis. Prior to January 1, 2019, the Company reported our operations through
two
reportable segments:
Mortgage Market
and
Real Estate Market
. In addition, we reported
Other Businesses, Corporate and Eliminations
separately. The prior years’ presentation has been reclassified to conform to the current year presentation.
We classify revenue in three categories: service revenue, revenue from reimbursable expenses and non-controlling interests. In evaluating our performance, we focus on service revenue. Service revenue consists of amounts attributable to our fee-based services and sales of short-term investments in real estate. Reimbursable expenses and non-controlling interests are pass-through items for which we earn no margin. Reimbursable expenses consist of amounts we incur on behalf of our customers in performing our fee-based services that we pass directly on to our customers without a markup. Non-controlling interests represent the earnings of Lenders One. Lenders One is a mortgage cooperative managed, but not owned, by Altisource. Lenders One is included in revenue and reduced from net income to arrive at net income attributable to Altisource.
Strategy and Core Businesses
We are focused on becoming one of the premier providers of mortgage and real estate marketplaces and related services to a broad and diversified customer base. The real estate and mortgage marketplaces represent large markets. We believe our scale and suite of offerings to these large markets provide us with competitive advantages that could support our growth.
Through our offerings that support residential loan servicers, we provide a suite of services and technologies intended to meet their growing and evolving needs. We are focused on growing referrals from our existing customer base and attracting new customers to our offerings. We have a customer base that includes Ocwen, GSEs, NRZ, several large bank and non-bank servicers
32
and asset managers. We believe we are one of only a few providers with a broad suite of servicer solutions, nationwide coverage and demonstrated scalability. Further, we believe we are well positioned to gain market share from existing and new customers as delinquency rates rise and customers and prospects consolidate to larger, full-service providers and outsource services that have historically been performed in-house.
We also provide services to loan originators (or other similar mortgage market participants) in originating, buying and selling residential mortgages. We provide a suite of services and technologies to meet the evolving and growing needs of lenders, mortgage purchasers and securitizers. We are focused on growing referrals from our existing customer base and attracting new customers to our offerings. We have a customer base that includes Lenders One cooperative mortgage bankers and mid-size and larger bank and non-bank loan originators. We believe our suite of services and technologies positions us to grow our relationships with our existing customer base by providing additional products, services and solutions to these customers. Further, we believe we are well positioned to gain market share from existing and new customers as origination volumes rise and customers and prospects consolidate to larger, full-service providers and outsource services that have historically been performed in-house.
Our earlier stage business consists of Pointillist, Inc. (“Pointillist”). The Pointillist business was developed by Altisource through our consumer analytics capabilities. We believe the Pointillist business is a potentially disruptive SaaS-based platform which provides unique customer journey analytics at scale and enables customers to engage through our intelligent platform. During 2019, we created Pointillist as a separate legal entity to position it for accelerated growth and outside investment and contributed the Pointillist business and $8.5 million to it. Pointillist is owned by Altisource and management of Pointillist. Management of Pointillist owns a non-controlling interest representing
12.1%
of the outstanding equity of Pointillist. Additional equity shares of Pointillist are available for issuance to management and board members of Pointillist. Altisource has an option, but no ongoing obligation, to participate in future funding of Pointillist.
We previously reported the results of Owners.com as an earlier stage business. In October 2019, the Company announced its plans to wind down and close the Owners.com business, which was completed by December 31, 2019.
Share Repurchase Program
On May 15, 2018, our shareholders approved the renewal and replacement of the share repurchase program previously approved by the shareholders on May 17, 2017. Under the program, we are authorized to purchase up to
4.3 million
shares of our common stock, based on a limit of
25%
of the outstanding shares of common stock on the date of approval, at a minimum price of
$1.00
per share and a maximum price of
$500.00
per share, for a period of
five
years from the date of approval. As of
December 31, 2019
, approximately
2.4 million
shares of common stock remain available for repurchase under the program. We purchased
1.0 million
shares of common stock at an average price of
$20.33
per share during the year ended
December 31, 2019
,
1.6 million
shares at an average price of
$25.53
per share during the year ended
December 31, 2018
and
1.6 million
shares at an average price of
$23.84
per share during the year ended
December 31, 2017
. Luxembourg law limits share repurchases to the balance of Altisource Portfolio Solutions S.A. (unconsolidated parent company) retained earnings, less the value of shares repurchased. As of
December 31, 2019
, we can repurchase up to approximately
$102 million
of our common stock under Luxembourg law. Our Credit Agreement also limits the amount we can spend on share repurchases, which limit was approximately
$463 million
as of
December 31, 2019
, and may prevent repurchases in certain circumstances.
Ocwen Related Matters
During the year ended
December 31, 2019
, Ocwen was our largest customer, accounting for
56%
of our total revenue for the year ended
December 31, 2019
. Additionally,
6%
of our revenue for the year ended
December 31, 2019
was earned on the loan portfolios serviced by Ocwen, when a party other than Ocwen or the MSR owner selected Altisource as the service provider.
Ocwen has disclosed that it is subject to a number of ongoing federal and state regulatory examinations, consent orders, inquiries, subpoenas, civil investigative demands, requests for information and other actions and is subject to pending legal proceedings, some of which include claims against Ocwen for substantial monetary damages. In addition to monetary damages, various complaints have sought to obtain permanent injunctive relief, consumer redress, refunds, restitution, disgorgement, civil penalties, costs and fees and other relief. Existing or future similar matters could result in, and in some cases, have resulted in, adverse regulatory or other actions against Ocwen. Previous regulatory actions against Ocwen have subjected Ocwen to independent oversight of its operations and placed certain restrictions on its ability to acquire servicing rights. In addition to the above, Ocwen may become subject to future adverse regulatory or other actions.
Ocwen has disclosed that NRZ is its largest client. As of December 31, 2019, NRZ owned MSRs or rights to MSRs relating to approximately
56%
of loans serviced and subserviced by Ocwen (measured in UPB). In July 2017 and January 2018, Ocwen and NRZ entered into a series of agreements pursuant to which the parties agreed, among other things, to undertake certain actions to facilitate the transfer from Ocwen to NRZ of Ocwen’s legal title to the Subject MSRs and under which Ocwen will subservice
33
mortgage loans underlying the MSRs for an initial term of five years. NRZ can terminate its sub-servicing agreement with Ocwen in exchange for the payment of a termination fee.
The existence or outcome of Ocwen regulatory matters or the termination of the NRZ sub-servicing agreement with Ocwen may have significant adverse effects on Ocwen’s business and/or our continuing relationship with Ocwen. For example, Ocwen may be required to alter the way it conducts business, including the parties it contracts with for services, it may be required to seek changes to its existing pricing structure with us, it may lose its non-GSE servicing rights or subservicing arrangements or may lose one or more of its state servicing or origination licenses. Additional regulatory actions or adverse financial developments may impose additional restrictions on or require changes in Ocwen’s business that could require it to sell assets or change its business operations. Any or all of these effects and others could result in our eventual loss of Ocwen as a customer or a reduction in the number and/or volume of services they purchase from us or the loss of other customers.
If any of the following events occurred, Altisource’s revenue could be significantly lower and our results of operations could be materially adversely affected, including from the possible impairment or write-off of goodwill, intangible assets, property and equipment, other assets and accounts receivable:
|
•
|
Altisource loses Ocwen as a customer or there is a significant reduction in the volume of services they purchase from us
|
|
•
|
We could also be impacted if Ocwen loses, sells or transfers a significant portion of its GSE and FHA servicing rights or subservicing arrangements or remaining non-GSE servicing rights or subservicing arrangements and Altisource fails to be retained as a service provider
|
|
•
|
The contractual relationship between Ocwen and NRZ changes significantly and this change results in a change in our status as a provider of services related to the Subject MSRs
|
|
•
|
Ocwen loses state servicing licenses in states with a significant number of loans in Ocwen’s servicing portfolio
|
|
•
|
The contractual relationship between Ocwen and Altisource changes significantly or there are significant changes to our pricing to Ocwen for services from which we generate material revenue
|
|
•
|
Altisource otherwise fails to be retained as a service provider
|
Management cannot predict whether any of these events will occur or the amount of any impact they may have on Altisource. However, in the event one or more of these events materially negatively impact Altisource, we believe the variable nature of our cost structure would allow us to realign our cost structure in line with remaining revenue and that current liquidity and cash flows from operations, would be sufficient to meet our working capital, capital expenditures, debt service and other cash needs. There can be no assurance that our plans will be successful or our operations will be profitable. We are also focused on diversifying and growing our revenue and customer base and we have a sales and marketing strategy to support these efforts.
Factors Affecting Comparability
The following items may impact the comparability of our results:
|
•
|
On July 1, 2019, Altisource sold its Financial Services business, consisting of post-charge-off consumer debt and mortgage charge-off collection services and customer relationship management services (the “Financial Services Business”) to Transworld Systems Inc. (“TSI”) for
$44.0 million
consisting of an upfront payment of
$40.0 million
, subject to a working capital adjustment (finalized during 2019) and transaction costs upon closing of the sale, and an additional
$4.0 million
payment on the one year anniversary of the sale closing. In connection with the sale, we recognized a
$17.8 million
pretax gain on sale for the year ended
December 31, 2019
. The parties also entered into a transition services agreement to provide for the management and orderly transition of certain services and technologies to TSI for periods ranging from
2 months
to
13 months
. For the years ended December 31, 2019, 2018 and 2017, service revenue from the Financial Services Business was $33.4 million, $64.1 million and $61.9 million, respectively. On July 17, 2019, Altisource used
$37.0 million
of the net up-front payment to repay a portion of its senior secured term loan.
|
|
•
|
In October 2019, the Company announced its plans to wind down and close the Owners.com business, which was completed by December 31, 2019. In connection with the wind down of the Owners.com business, the Company recognized a write-off of $5.9 million of goodwill and intangible assets in 2019 as well as wind down and severance costs. For the years ended December 31, 2019, 2018 and 2017, service revenue from Owners.com was $7.1 million, $8.6 million and $4.7 million, respectively.
|
|
•
|
In May 2019, the Company began selling its investment in RESI common stock. During the year ended
December 31, 2019
, the Company sold
0.7 million
shares for net proceeds of
$8.0 million
. As required by the senior secured term loan agreement, the Company used the net proceeds to repay a portion of its senior secured term loan.
|
|
•
|
Effective January 1, 2018, the Company adopted a new accounting standard on financial assets and financial liabilities, which requires certain equity investments to be measured at fair value with changes in fair value recognized in net income. Previously, changes in the fair value of the Company’s available for sale securities were included in comprehensive
|
34
income. During the years ended
December 31, 2019
and
2018
, we recognized an unrealized gain (loss) of
$14.4 million
and
$(13.0) million
, respectively, on our investment in RESI in other income (expense), net in the consolidated statements of operations and comprehensive income (loss) from a change in the market value of RESI common shares. During the year ended December 31, 2017, an unrealized gain on our investment in RESI of
$2.5 million
, net of income tax provision, was reflected in other comprehensive income in the consolidated statements of operations and comprehensive income (loss).
|
•
|
In November 2018, the Company announced its plans to sell its short-term investments in real estate and exit the Company’s BRS business and recognized a
$(2.6) million
write-off of goodwill attributable to the BRS business in 2018. In 2019, the Company sold its remaining short-term investments in real estate (“BRS Inventory”). For the years ended December 31, 2019, 2018 and 2017, service revenue from BRS was $42.5 million, $61.2 million and $32.2 million, respectively. In anticipation of receiving the majority of the proceeds from the sale of the BRS Inventory in 2019, the Company repaid
$49.9 million
of its senior secured term loan in the fourth quarter of 2018.
|
|
•
|
In February 2019, Altisource and Ocwen entered into agreements that, among other things, facilitate Ocwen’s transition from REALServicing and related technologies to another mortgage servicing software platform. The transition was completed during 2019. For the years ended December 31, 2019, 2018 and 2017, service revenue from REALServicing and related technologies was $14.1 million, $35.1 million and $37.2 million, respectively.
|
|
•
|
Effective January 1, 2019, the Company implemented a new accounting standard on leases which required the recognition of operating leases by companies as operating lease liabilities on their balance sheets and also required the recognition of right-of-use assets. Adoption of this new standard resulted in the recognition of
$42.1 million
of right-of-use assets in right-of-use assets under operating leases,
$45.5 million
of operating lease liabilities (
$16.7 million
in other current liabilities and
$28.8 million
in other non-current liabilities) and reduced accrued rent and lease incentives by
$3.4 million
in accounts payable and accrued liabilities and other non-current liabilities on the accompanying condensed consolidated balance sheets.
|
|
•
|
In August 2018, Altisource initiated Project Catalyst, a project intended to optimize its operations and reduce costs to better align its cost structure with its anticipated revenues and improve its operating margins. During the years ended
December 31, 2019
and
2018
, Altisource incurred
$14.1 million
and
$11.6 million
, respectively, of severance costs, professional services fees, facility consolidation costs, technology costs and business wind down costs related to the reorganization plan. Altisource expects to incur additional severance costs, professional services fees, technology costs and facility consolidation costs in connection with this internal reorganization, automation and other technology related activities and will expense those costs as incurred. Based on the Company’s analysis, it currently anticipates the future costs relating to Project Catalyst to be in the range of approximately
$10 million
to
$13 million
.
|
|
•
|
On June 21, 2018, the United States Supreme Court rendered a 5-4 majority decision in South Dakota v. Wayfair, Inc., holding that a state may require a remote seller with no physical presence in the state to collect and remit sales tax on goods and services provided to purchasers in the state, overturning certain existing court precedent. During the year ended
December 31, 2019
, the Company completed the analysis of its services for potential exposure to sales tax in various jurisdictions in the United States. The Company recognized a
$0.3 million
and
$6.2 million
loss for the years ended
December 31, 2019
and
2018
, respectively, in selling, general and administrative (“SG&A”) expenses in the accompanying consolidated statements of operations and comprehensive income (loss). During the third quarter of 2019, we recognized a net reimbursement from clients of $1.7 million of sales taxes. The Company began invoicing, collecting and remitting sales tax in applicable jurisdictions in 2019. The Company is also in the process of seeking additional reimbursements for sales tax payments from clients; however, there can be no assurance that the Company will be successful in collecting some or all of such additional reimbursements. Future changes in our estimated sales tax exposure could result in a material adjustment to our consolidated financial statements which would impact our financial condition and results of operations.
|
|
•
|
In August 2018, the Company sold its rental property management business to RESI for total transaction proceeds of
$18.0 million
,
$15.0 million
of which was received on the closing date of August 8, 2018 and
$3.0 million
of which will be received on the earlier of a RESI change of control or August 8, 2023. The Company recognized a
$13.7 million
pretax gain on the sale of this business during the year ended December 31, 2018 in the consolidated statements of operations and comprehensive income (loss) in connection with this transaction. For the years ended December 31, 2018 and 2017, service revenue from the rental property management business was $4.2 million and $5.5 million, respectively. In addition, the Company used the proceeds received from the sale of the rental property management business to RESI to repay
$15.0 million
of the Term B Loans.
|
|
•
|
On April 3, 2018, Altisource and its wholly-owned subsidiary, Altisource S.à r.l. entered into the Credit Agreement, pursuant to which, among other things, Altisource borrowed
$412.0 million
in the form of Term B Loans. Proceeds from the Term B Loans were used to repay the Company’s prior senior secured term loan. In connection with the refinancing, we recognized a loss of
$(4.4) million
from the write-off of unamortized debt issuance costs and debt discount for the year ended
December 31, 2018
. The comparative average interest rates under the Credit Agreement for the Term B Loans
|
35
and the prior credit agreement were 6.4%, 6.0% and 4.6% for the years ended December 31, 2019, 2018 and 2017, respectively.
|
•
|
During 2017, we repurchased portions of our senior secured term loan with an aggregate par value of
$60.1 million
at a weighted average discount of
10.7%
, recognizing a net gain of
$5.6 million
on the early extinguishment of debt in other income.
|
|
•
|
The Company recognized an income tax provision of $318.3 million for the year ended December 31, 2019, which included an increase in the valuation allowance in connection with the Luxembourg net operating loss (“NOL”) carryforward of $291.5 million, the impact of a decrease in the Luxembourg statutory income tax rate on deferred taxes of $14.0 million and foreign income tax reserves of $5.6 million. The resulting effective tax rate differs from the Luxembourg statutory income tax rate of 24.9% principally as a result of the increase in valuation allowance, the impact of the decrease in the Luxembourg statutory income tax rate on deferred taxes and foreign income tax reserves discussed above and the jurisdictional mix of income before income taxes and non-controlling interests. Certain of the Company’s India subsidiaries generated taxable income based on cost plus transfer pricing to our Luxembourg subsidiary for their services and certain US and Luxembourg subsidiaries generated taxable losses that did not result in a tax benefit due to a valuation allowance applied to the tax benefit.
|
|
•
|
The Company’s effective income tax rate for the year ended December 31, 2018 was
292.9%
, which differs from the Luxembourg statutory income tax rate of
26.0%
. In 2018, the Company’s effective income tax rate was unusually high because certain of the Company’s India and United States subsidiaries generated taxable income based on cost plus transfer pricing to our Luxembourg subsidiary for their services and the Luxembourg subsidiary incurred a taxable loss. As these jurisdictions have different effective income tax rates (i.e., India has a higher effective income tax rate than Luxembourg), and because of a
$1.6 million
foreign income tax reserve (and related interest), the Company recognized consolidated income tax expense that was greater than income before income taxes and non-controlling interests.
|
|
•
|
The effective income tax rate for the year ended December 31, 2017 was
(780.9)%
, impacted by three significant items. On December 27, 2017, two of the Company’s wholly-owned subsidiaries, Altisource Solutions S.à r.l. and Altisource Holdings S.à r.l., merged, with Altisource Holdings S.à r.l. as the surviving entity. Altisource Holdings S.à r.l. was subsequently renamed Altisource S.à r.l. The merger is part of a larger subsidiary restructuring plan designed to simplify the Company’s corporate structure, allow it to operate more efficiently and reduce administrative costs. For Luxembourg tax purposes, the merger was recognized at fair value and generated an NOL of
$1.3 billion
, with a 17 year life, and generated a deferred tax asset of
$342.6 million
as of December 31, 2017, before a valuation allowance of $41.6 million. This deferred tax asset was partially offset by the impact of other changes in U.S. and Luxembourg income tax rates of
$6.3 million
and an increase in certain foreign income tax reserves (and related interest) of
$10.5 million
for the year ended December 31, 2017.
|
36
RESULTS OF OPERATIONS
Following is a discussion of our results of operations for the years ended
December 31, 2019
,
2018
and
2017
.
The following table sets forth information on our consolidated results of operations for the years ended
December 31
:
|
(in thousands, except per share data)
|
2019
|
% Increase (decrease)
|
2018
|
% Increase (decrease)
|
2017
|
|||||||||||||
|
Service revenue
|
$
|
621,866
|
|
(23
|
)
|
$
|
805,480
|
|
(10
|
)
|
$
|
899,561
|
|
|||||
|
Reimbursable expenses
|
24,172
|
|
(20
|
)
|
30,039
|
|
(25
|
)
|
39,912
|
|
||||||||
|
Non-controlling interests
|
2,613
|
|
(3
|
)
|
2,683
|
|
(2
|
)
|
2,740
|
|
||||||||
|
Total revenue
|
648,651
|
|
(23
|
)
|
838,202
|
|
(11
|
)
|
942,213
|
|
||||||||
|
Cost of revenue
|
493,256
|
|
(21
|
)
|
622,165
|
|
(11
|
)
|
699,865
|
|
||||||||
|
Gross profit
|
155,395
|
|
(28
|
)
|
216,037
|
|
(11
|
)
|
242,348
|
|
||||||||
|
Operating expenses (income):
|
||||||||||||||||||
|
Selling, general and administrative expenses
|
141,076
|
|
(20
|
)
|
175,670
|
|
(9
|
)
|
192,642
|
|
||||||||
|
Gain on sale of businesses
|
(17,814
|
)
|
30
|
|
(13,688
|
)
|
N/M
|
|
—
|
|
||||||||
|
Restructuring charges
|
14,080
|
|
22
|
|
11,560
|
|
N/M
|
|
—
|
|
||||||||
|
Income from operations
|
18,053
|
|
(58
|
)
|
42,495
|
|
(15
|
)
|
49,706
|
|
||||||||
|
Other income (expense), net:
|
||||||||||||||||||
|
Interest expense
|
(21,393
|
)
|
(19
|
)
|
(26,254
|
)
|
18
|
|
(22,253
|
)
|
||||||||
|
Unrealized gain (loss) on investment in equity securities
|
14,431
|
|
211
|
|
(12,972
|
)
|
N/M
|
|
—
|
|
||||||||
|
Other income (expense), net:
|
1,348
|
|
172
|
|
(1,870
|
)
|
(124
|
)
|
7,922
|
|
||||||||
|
Total other income (expense), net:
|
(5,614
|
)
|
(86
|
)
|
(41,096
|
)
|
187
|
|
(14,331
|
)
|
||||||||
|
Income before income taxes and non-controlling interests
|
12,439
|
|
N/M
|
|
1,399
|
|
(96
|
)
|
35,375
|
|
||||||||
|
Income tax (provision) benefit
|
(318,296
|
)
|
N/M
|
|
(4,098
|
)
|
(101
|
)
|
276,256
|
|
||||||||
|
Net (loss) income
|
(305,857
|
)
|
N/M
|
|
(2,699
|
)
|
(101
|
)
|
311,631
|
|
||||||||
|
Net income attributable to non-controlling interests
|
(2,112
|
)
|
(21
|
)
|
(2,683
|
)
|
(2
|
)
|
(2,740
|
)
|
||||||||
|
Net (loss) income attributable to Altisource
|
$
|
(307,969
|
)
|
N/M
|
|
$
|
(5,382
|
)
|
(102
|
)
|
$
|
308,891
|
|
|||||
|
Margins:
|
|
|
||||||||||||||||
|
Gross profit/service revenue
|
25
|
%
|
|
|
27
|
%
|
27
|
%
|
||||||||||
|
Income from operations/service revenue
|
3
|
%
|
|
|
5
|
%
|
6
|
%
|
||||||||||
|
(Loss) earnings per share:
|
||||||||||||||||||
|
Basic
|
$
|
(19.26
|
)
|
N/M
|
|
$
|
(0.32
|
)
|
(102
|
)
|
$
|
16.99
|
|
|||||
|
Diluted
|
$
|
(19.26
|
)
|
N/M
|
|
$
|
(0.32
|
)
|
(102
|
)
|
$
|
16.53
|
|
|||||
|
Weighted average shares outstanding:
|
||||||||||||||||||
|
Basic
|
15,991
|
|
(6
|
)
|
17,073
|
|
(6
|
)
|
18,183
|
|
||||||||
|
Diluted
|
15,991
|
|
(6
|
)
|
17,073
|
|
(9
|
)
|
18,692
|
|
||||||||
_____________________________________
N/M — not meaningful.
37
Certain non-GAAP financial measures for the years ended December 31:
|
(in thousands, except per share data)
|
2019
|
% Increase (decrease)
|
2018
|
% Increase (decrease)
|
2017
|
|||||||||||||
|
Non-GAAP Financial Measures
(1)
|
||||||||||||||||||
|
Adjusted net income attributable to Altisource
|
$
|
21,802
|
|
(49
|
)
|
$
|
42,609
|
|
(23
|
)
|
$
|
55,617
|
|
|||||
|
Adjusted diluted earnings per share
|
$
|
1.34
|
|
(45
|
)
|
$
|
2.43
|
|
(18
|
)
|
$
|
2.98
|
|
|||||
|
Adjusted EBITDA
|
$
|
70,800
|
|
(40
|
)
|
$
|
118,279
|
|
(9
|
)
|
$
|
130,687
|
|
|||||
_____________________________________
|
(1)
|
These are non-GAAP measures that are defined and reconciled to the corresponding GAAP measures on pages
27
to
31
.
|
Revenue
Revenue by line of business consists of the following for the years ended December 31:
|
(in thousands, except per share data)
|
2019
|
% Increase (decrease)
|
2018
|
% Increase (decrease)
|
2017
|
|||||||||||||
|
Service revenue:
|
||||||||||||||||||
|
Field Services
|
$
|
271,924
|
|
(8
|
)
|
$
|
296,343
|
|
(16
|
)
|
$
|
354,559
|
|
|||||
|
Marketplace
|
127,093
|
|
(32
|
)
|
186,620
|
|
(19
|
)
|
231,213
|
|
||||||||
|
Mortgage and Real Estate Solutions
|
116,194
|
|
(10
|
)
|
128,926
|
|
(15
|
)
|
151,930
|
|
||||||||
|
Earlier Stage Business
|
1,551
|
|
N/M
|
|
293
|
|
179
|
|
105
|
|
||||||||
|
Other
|
105,104
|
|
(46
|
)
|
193,298
|
|
20
|
|
161,754
|
|
||||||||
|
Total service revenue
|
621,866
|
|
(23
|
)
|
805,480
|
|
(10
|
)
|
899,561
|
|
||||||||
|
Reimbursable expenses:
|
||||||||||||||||||
|
Field Services
|
9,290
|
|
(56
|
)
|
21,083
|
|
(28
|
)
|
29,087
|
|
||||||||
|
Marketplace
|
10,819
|
|
183
|
|
3,817
|
|
(33
|
)
|
5,719
|
|
||||||||
|
Mortgage and Real Estate Solutions
|
3,873
|
|
(21
|
)
|
4,900
|
|
(2
|
)
|
5,012
|
|
||||||||
|
Other
|
190
|
|
(21
|
)
|
239
|
|
154
|
|
94
|
|
||||||||
|
Total reimbursable expenses
|
24,172
|
|
(20
|
)
|
30,039
|
|
(25
|
)
|
39,912
|
|
||||||||
|
Non-controlling interests:
|
||||||||||||||||||
|
Mortgage and Real Estate Solutions
|
2,613
|
|
(3
|
)
|
2,683
|
|
(2
|
)
|
2,740
|
|
||||||||
|
Total revenue
|
$
|
648,651
|
|
(23
|
)
|
$
|
838,202
|
|
(11
|
)
|
$
|
942,213
|
|
|||||
N/M — not meaningful.
We recognized service revenue of
$621.9 million
for the year ended
December 31, 2019
, a
23%
decrease compared to the year ended
December 31, 2018
. Field Services, Marketplace and Mortgage and Real Estate Solutions were negatively impacted during 2019 by the reduction in the size of Ocwen’s portfolio and number of delinquent loans, NRZ’s more aggressive sale of homes at foreclosure auctions (which reduces our REO auction, brokerage, field services and title referral service revenue), RESI’s smaller portfolio of non-performing loans and REO and the temporary impact that Ocwen’s transition to another servicing system had on Ocwen and NRZ default related referral volume and Ocwen and NRZ REO inventory conversion rates. The Company estimates that revenue was approximately $7.2 million lower in the year ended
December 31, 2019
because of lower REO inventory conversion rates related to Ocwen’s transition to a new servicing system. The Company believes that the lower REO conversion rates are temporary and anticipates returning to historical conversion rates during the first half of 2020. These decreases were partially offset by an increase in Field Services and Mortgage and Real Estate Solutions revenue from higher volumes of orders and services from customers other than Ocwen, NRZ and RESI. In addition, Other service revenue declined from the July 1, 2019 sale of the Financial Services Business, lower REALServicing revenue from Ocwen’s second quarter 2019 migration to another servicing system and from the discontinuation of the BRS business.
We recognized service revenue of
$805.5 million
for the year ended
December 31, 2018
, a
10%
decrease compared to the year ended
December 31, 2017
. The decreases in Field Services, Marketplace and Mortgage and Real Estate Solutions were driven by the reduction in the size of Ocwen’s portfolio and number of delinquent loans in its portfolio resulting from loan repayments, loan modifications, short sales, REO sales and other forms of resolution and RESI’s smaller portfolio of non-performing loans and
38
REO, as RESI continues to sell off this portfolio and focus on directly acquiring, renovating and managing rental homes. These decreases were partially offset by growth in home sale revenue in the BRS and renovation management businesses.
We recognized reimbursable expense revenue of
$24.2 million
for the year ended
December 31, 2019
, a
20%
decrease compared to the year ended
December 31, 2018
. We recognized reimbursable expense revenue of
$30.0 million
for the year ended
December 31, 2018
, a
25%
decrease compared to the year ended
December 31, 2017
. The decrease in reimbursable expense revenue for the for the year ended
December 31, 2019
was primarily for the reasons discussed in service revenue above, partially offset by an increase in reimbursable expense revenue for Marketplace related to new early stage disposition services performed. The decrease in reimbursable expense revenue for the year ended
December 31, 2018
was primarily a result of a reduction in the size of Ocwen’s portfolio and number of delinquent loans in its portfolio resulting from loan repayments, loan modifications, short sales, REO sales and other forms of resolution, as discussed in service revenue above.
Certain of our revenues can be impacted by seasonality. More specifically, revenues from property sales, loan originations and certain property preservation services in Field Services typically tend to be at their lowest level during the fall and winter months and at their highest level during the spring and summer months.
Cost of Revenue and Gross Profit
Cost of revenue principally includes payroll and employee benefits associated with personnel employed in customer service and operations roles, fees paid to external providers related to the provision of services, cost of real estate sold, reimbursable expenses, technology and telecommunications costs and depreciation and amortization of operating assets.
Cost of revenue consists of the following for the years ended
December 31
:
|
(in thousands)
|
2019
|
% Increase (decrease)
|
2018
|
% Increase (decrease)
|
2017
|
|||||||||||||
|
Compensation and benefits
|
$
|
135,502
|
|
(32
|
)
|
$
|
200,486
|
|
(17
|
)
|
$
|
240,487
|
|
|||||
|
Outside fees and services
|
240,796
|
|
(14
|
)
|
278,380
|
|
(14
|
)
|
325,459
|
|
||||||||
|
Cost of real estate sold
|
42,763
|
|
(10
|
)
|
47,659
|
|
95
|
|
24,398
|
|
||||||||
|
Technology and telecommunications
|
36,302
|
|
(13
|
)
|
41,588
|
|
(2
|
)
|
42,340
|
|
||||||||
|
Reimbursable expenses
|
24,172
|
|
(20
|
)
|
30,039
|
|
(25
|
)
|
39,912
|
|
||||||||
|
Depreciation and amortization
|
13,721
|
|
(43
|
)
|
24,013
|
|
(12
|
)
|
27,269
|
|
||||||||
|
Total
|
$
|
493,256
|
|
(21
|
)
|
$
|
622,165
|
|
(11
|
)
|
$
|
699,865
|
|
|||||
We recognized cost of revenue of
$493.3 million
for the year ended
December 31, 2019
, a
21%
decrease compared to the year ended
December 31, 2018
. The decrease was primarily driven by lower revenue in Field Services, Marketplace and Mortgage and Real Estate Solutions businesses and the July 1, 2019 sale of the Financial Services Business. Compensation and benefits decreased at a greater percentage than the decline in service revenue due to lower headcount as a result of the Project Catalyst reorganization and the transfer of certain employees to SG&A functions in connection with the Project Catalyst reorganization. In addition, depreciation and amortization was lower from the completion of the depreciation periods of certain premises and equipment and the reduction in capital expenditures, and the decrease in reimbursable expenses was consistent with the decrease in reimbursable expense revenue discussed in the revenue section above.
We recognized cost of revenue of
$622.2 million
for the year ended
December 31, 2018
, an
11%
decrease compared to the year ended
December 31, 2017
. The decrease was primarily driven by lower service revenue from Ocwen’s portfolio, and related cost reduction initiatives and early benefits of Project Catalyst, partially offset by an increase in cost of real estate sold in the BRS business. The decrease in outside fees and services was driven by lower property preservation and inspection orders in Field Services from the reduction in the size of Ocwen’s portfolio, as discussed in the revenue section above. The decline in compensation and benefits in certain of our businesses resulted from lower headcount consistent with the revenue decline from the Ocwen and RESI portfolios and from the implementation of efficiency initiatives and early benefits of Project Catalyst. The decrease in reimbursable expenses was consistent with the decrease in reimbursable expense revenue discussed in the revenue section above. The increase in cost of real estate sold was due to growth in BRS home sale transactions.
Gross profit decreased to
$155.4 million
, representing
25%
of service revenue, for the year ended
December 31, 2019
compared to
$216.0 million
, representing
27%
of service revenue, for the year ended
December 31, 2018
. Gross profit as a percentage of service revenue in
2019
decreased compared to
2018
, primarily due to revenue mix with lower revenue from higher margin Marketplace businesses. The revenue mix change was partially impacted by Ocwen's servicing system transition, as discussed above. Absent the transition, we believe we would have had substantially higher Hubzu sale conversion rates generating more revenue at higher margins. These decreases were partially offset by our Project Catalyst cost reduction initiatives.
39
Gross profit decreased to
$216.0 million
, representing
27%
of service revenue, for the year ended
December 31, 2018
compared to
$242.3 million
, representing
27%
of service revenue, for the year ended
December 31, 2017
. Gross profit as a percentage of service revenue in
2018
was consistent with 2017, as the revenue declines were generally offset by lower cost of revenue, as discussed above.
Selling, General and Administrative Expenses
SG&A includes payroll for personnel employed in executive, sales and marketing, finance, law, compliance, human resources, vendor management, facilities and risk management roles. This category also includes professional services fees, occupancy costs, marketing costs, depreciation and amortization of non-operating assets and other expenses.
SG&A expenses consist of the following for the years ended
December 31
:
|
(in thousands)
|
2019
|
% Increase (decrease)
|
2018
|
% Increase (decrease)
|
2017
|
|||||||||||||
|
Compensation and benefits
|
$
|
49,875
|
|
(2
|
)
|
$
|
51,043
|
|
(12
|
)
|
$
|
58,157
|
|
|||||
|
Occupancy related costs
|
26,042
|
|
(16
|
)
|
30,851
|
|
(15
|
)
|
36,371
|
|
||||||||
|
Amortization of intangible assets
|
19,021
|
|
(33
|
)
|
28,412
|
|
(20
|
)
|
35,367
|
|
||||||||
|
Professional services
|
14,975
|
|
(12
|
)
|
16,950
|
|
26
|
|
13,421
|
|
||||||||
|
Marketing costs
|
11,212
|
|
(24
|
)
|
14,707
|
|
(9
|
)
|
16,171
|
|
||||||||
|
Depreciation and amortization
|
4,788
|
|
(29
|
)
|
6,786
|
|
(26
|
)
|
9,178
|
|
||||||||
|
Other
|
15,163
|
|
(44
|
)
|
26,921
|
|
12
|
|
23,977
|
|
||||||||
|
Selling, general and administrative expenses
|
$
|
141,076
|
|
(20
|
)
|
$
|
175,670
|
|
(9
|
)
|
$
|
192,642
|
|
|||||
SG&A for the year ended
December 31, 2019
of
$141.1 million
decreased by
20%
compared to the year ended
December 31, 2018
. The decrease was primarily driven by lower amortization of intangible assets and Other expenses. The decrease in amortization of intangible assets was driven by lower revenue generated by the Homeward Residential, Inc. (“Homeward”) and Residential Capital, LLC (“ResCap”) portfolios (revenue-based amortization) consistent with the reduction in the size of Ocwen’s portfolio, discussed in the revenue section above, and the July 1, 2019 sale of the Financial Services Business. Other expenses decreased primarily due to a $6.2 million contingent loss accrual for sales tax exposure in the United States recognized in 2018, lower travel and entertainment costs driven by lower headcount and lower bad debt expense.
SG&A for the year ended
December 31, 2018
of
$175.7 million
decreased by
9%
compared to the year ended
December 31, 2017
. The decrease was primarily driven by lower compensation and benefits, as we reduced headcount from the implementation of efficiency initiatives and early benefits of Project Catalyst, and by lower amortization of intangible assets, due to lower revenue generated by the Homeward and ResCap portfolios consistent with the reduction in the size of Ocwen’s portfolio, discussed in the revenue section above. Decreases in SG&A were also due to lower occupancy related costs, driven by initiatives to reduce our facilities footprint in 2017 and 2018. These decreases were partially offset by increases in Other from a $6.2 million contingent loss accrual for sales tax exposure in the United States and an increase in professional services, from increased legal and professional services costs in connection with certain legal and regulatory matters.
Other Operating Expenses (Income)
Other operating expenses (income) include the gain on sale of businesses and restructuring charges.
Other operating expenses (income) consist of the following for the years ended December 31:
|
(in thousands)
|
2019
|
% Increase (decrease)
|
2018
|
% Increase (decrease)
|
2017
|
|||||||||||
|
Gain on sale of businesses
|
$
|
(17,814
|
)
|
30
|
$
|
(13,688
|
)
|
N/M
|
$
|
—
|
|
|||||
|
Restructuring charges
|
14,080
|
|
22
|
11,560
|
|
N/M
|
—
|
|
||||||||
|
Other operating income, net
|
$
|
(3,734
|
)
|
75
|
$
|
(2,128
|
)
|
N/M
|
$
|
—
|
|
|||||
N/M — not meaningful.
40
On July 1, 2019, we sold the Financial Services Business to TSI for $44.0 million consisting of an up-front payment of $40.0 million, subject to a working capital adjustment (finalized in 2019) and transaction costs upon closing of the sale, and an additional $4.0 million payment on the one year anniversary of the sale closing. In connection with the sale, we recognized a $17.8 million pretax gain on sale for the year ended December 31, 2019. In addition, in August 2018, we sold our rental property management business to RESI for total transaction proceeds of $18.0 million, $15.0 million of which was received on the closing date of August 8, 2018 and $3.0 million of which will be received on the earlier of a RESI change of control or August 8, 2023. In connection with the sale, we recognized a $13.7 million pretax gain on sale for the year ended December 31, 2018.
In August 2018, we initiated Project Catalyst, a project intended to optimize our operations and reduce costs to better align our cost structure with our anticipated revenues and improve our operating margins. During the years ended
December 31, 2019
and
2018
, we incurred
$14.1 million
and
$11.6 million
, respectively, of severance costs, professional services fees, facility consolidation costs, technology costs and business wind down costs related to the reorganization plan. We expect to incur additional severance costs, professional services fees, technology costs and facility consolidation costs in connection with this internal reorganization, automation and other technology related activities and will expense those costs as incurred. Based on our analysis, we currently anticipate the future costs relating to Project Catalyst to be in the range of approximately
$10 million
to
$13 million
.
Income from Operations
Income from operations decreased to
$18.1 million
, representing
3%
of service revenue, for the year ended
December 31, 2019
compared to
$42.5 million
, representing
5%
of service revenue, for the year ended
December 31, 2018
. Income from operations as a percentage of service revenue decreased primarily as a result of lower gross margins and higher restructuring costs, partially offset by lower SG&A expenses, as discussed above. The effect of the higher gain on sale of businesses was largely offset by higher restructuring charges for the year ended December 31, 2019, as discussed above.
Income from operations decreased to
$42.5 million
, representing
5%
of service revenue, for the year ended
December 31, 2018
compared to
$49.7 million
, representing
6%
of service revenue, for the year ended
December 31, 2017
. Income from operations as a percentage of service revenue decreased slightly in 2018 compared to 2017, as SG&A did not decrease at the same rate as service revenue, driven by the sales tax accrual, as discussed above. The effect of the gain on sale of business was largely offset by restructuring charges.
Because Ocwen is our largest customer, declines in service revenue from Ocwen and the changes in mix of revenue from Ocwen have had a negative impact on our operating income.
Other Income (Expense), net
Other income (expense), net principally includes interest expense and other non-operating gains and losses. For the years ended December 31, 2019 and 2018, other income (expense), net also includes an unrealized gain (loss) on our investment in RESI (see Factors Affecting Comparability above for additional information).
Other income (expense), net was
$(5.6) million
for the year ended
December 31, 2019
compared to $(41.1) million for the year ended
December 31, 2018
. The decrease in other expense for the year ended
December 31, 2019
was primarily driven by a
$14.4 million
unrealized gain on our investment in RESI common shares in 2019 compared to a
$(13.0) million
unrealized loss on our investment in RESI in 2018. In addition, on April 3, 2018, Altisource and its wholly-owned subsidiary, Altisource S.à r.l. entered into the Credit Agreement, pursuant to which, among other things, Altisource borrowed
$412.0 million
in the form of Term B Loans. Proceeds from the Term B Loans were used to repay the Company’s prior senior secured term loan. In connection with the refinancing, we recognized a loss of $(4.4) million from the write-off of unamortized debt issuance costs and debt discount for the year ended
December 31, 2018
. Interest expense was lower for the year ended December 31, 2019 primarily due to lower average outstanding balances of the senior secured term loan as a result of repayments.
Other income (expense), net for the year ended
December 31, 2018
of $(41.1) million increased by 187% compared to the year ended
December 31, 2017
. The increase in expenses in 2018 was primarily due to a
$(13.0) million
unrealized loss on our investment in RESI, a $(4.4) million loss on debt refinancing and higher interest expense from higher average interest rates on the Credit Agreement, partially offset by lower average debt balances as a result of debt repayments and repurchases in the current and prior years. The increase in 2018 expenses was also from a net gain on the early extinguishment of debt recognized in 2017. The comparative average interest rates under the Credit Agreement for the Term B Loans and the prior credit agreement were 6.0% and 4.6% for the years ended December 31, 2018 and 2017, respectively. During 2017, we repurchased portions of our senior secured term loan with an aggregate par value of $60.1 million at a weighted average discount of 10.7%, recognizing a net gain of $5.6 million on the early extinguishment of debt in other income.
41
Income Tax (Provision) Benefit
We recognized an income tax (provision) benefit of
$(318.3) million
, $(4.1) million and $276.3 million for the years ended December 31, 2019, 2018 and 2017, respectively.
The Company recognized an income tax provision of $318.3 million for the year ended December 31, 2019, which included an increase in the valuation allowance in connection with the Luxembourg NOL carryforward of $291.5 million, the impact of a decrease in the Luxembourg statutory income tax rate on deferred taxes of $14.0 million and foreign income tax reserves of $5.6 million. The resulting effective tax rate differs from the Luxembourg statutory income tax rate of 24.9% principally as a result of the increase in valuation allowance, the impact of the decrease in the Luxembourg statutory income tax rate on deferred taxes and foreign income tax reserves discussed above and the jurisdictional mix of income before income taxes and non-controlling interests. Certain of the Company’s India subsidiaries generated taxable income based on cost plus transfer pricing to our Luxembourg subsidiary for their services and certain US and Luxembourg subsidiaries generated taxable losses that did not result in a tax benefit due to a valuation allowance applied to the tax benefit.
The Company’s effective income tax rate for the year ended December 31, 2018 was 292.9%, which differed from the Luxembourg statutory income tax rate of 26.0%. In 2018, the Company’s effective income tax rate was unusually high because certain of the Company’s India and United States subsidiaries generated taxable income based on cost plus transfer pricing to our Luxembourg subsidiary for their services and the Luxembourg subsidiary incurred a taxable loss. As these jurisdictions have different effective income tax rates (i.e., India has a higher effective income tax rate than Luxembourg), and because of a $1.6 million foreign income tax reserve (and related interest), the Company recognized consolidated income tax expense that was greater than income before income taxes and non-controlling interests.
The effective income tax rate for the year ended December 31, 2017 was impacted by three significant items. On December 27, 2017, two of the Company’s wholly-owned subsidiaries, Altisource Solutions S.à r.l. and Altisource Holdings S.à r.l., merged, with Altisource Holdings S.à r.l. as the surviving entity. Altisource Holdings S.à r.l. was subsequently renamed Altisource S.à r.l. The merger is part of a larger subsidiary restructuring plan designed to simplify the Company’s corporate structure, allow it to operate more efficiently and reduce administrative costs. For Luxembourg tax purposes, the merger was recognized at fair value and generated an NOL of $1.3 billion, with a 17 year life, and generated a deferred tax asset of $342.6 million as of December 31, 2017, before a valuation allowance of $41.6 million. This deferred tax asset was partially offset by the impact of other changes in U.S. and Luxembourg income tax rates of $6.3 million and an increase in certain foreign income tax reserves (and related interest) of $10.5 million for the year ended December 31, 2017.
42
LIQUIDITY AND CAPITAL RESOURCES
Liquidity
Our primary source of liquidity is cash flow from operations and cash on hand. We seek to deploy cash generated in a disciplined manner. Principally, we intend to use cash to develop and grow complementary services and businesses that we believe will generate attractive margins in line with our core capabilities and strategy. We use cash for repayments of our long-term debt, capital investments and seek to use cash from time to time to repurchase shares of our common stock. In addition, we consider and evaluate business acquisitions, dispositions, closures or other similar actions from time to time that are aligned with our strategy.
Credit Agreement
On April 3, 2018, Altisource entered into the Credit Agreement pursuant to which Altisource borrowed
$412.0 million
in the form of Term B Loans and obtained a
$15.0 million
revolving credit facility. The Term B Loans mature in April 2024 and the revolving credit facility matures in April 2023.
Proceeds from the Term B Loans were used to repay the Company’s prior senior secured term loan, which had an outstanding balance of
$412.1 million
as of April 3, 2018. As of
December 31, 2019
,
$293.8 million
of the Term B Loans were outstanding. There were no borrowings outstanding under the revolving credit facility as of December 31, 2019.
There are no mandatory repayments of the Term B Loans due until March 2023, when
$1.3 million
is due to be repaid. Thereafter, the Term B Loans must be repaid in consecutive quarterly principal installments of $3.1 million, with the balance due at maturity. All amounts outstanding under the Term B Loans will become due on the earlier of (i) April 3, 2024, and (ii) the date on which the loans are declared to be due and owing by the administrative agent at the request (or with the consent) of the Required Lenders (as defined in the Credit Agreement; other capitalized terms, unless defined herein, are defined in the Credit Agreement) or as otherwise provided in the Credit Agreement upon the occurrence of any event of default.
In addition to the scheduled principal payments, subject to certain exceptions, the Term B Loans are subject to mandatory prepayment upon issuances of debt, certain casualty and condemnation events and sales of assets, as well as from a percentage of Consolidated Excess Cash Flow if our leverage ratio is greater than
3.00
to
1.00
, as calculated in accordance with the provisions of the Credit Agreement (the percentage increases if our leverage ratio exceeds
3.50
to
1.00
). Certain mandatory prepayments reduce future contractual amortization payments by an amount equal to the mandatory prepayment.
The interest rate on the Term B Loans as of
December 31, 2019
was
5.94%
.
Altisource may incur incremental indebtedness under the Credit Agreement from one or more incremental lenders, which may include existing lenders, in an aggregate incremental principal amount not to exceed
$125.0 million
, subject to certain conditions set forth in the Credit Agreement, including a sublimit of
$80.0 million
with respect to incremental revolving credit commitments. The lenders have no obligation to provide any incremental indebtedness.
The Credit Agreement includes covenants that restrict or limit, among other things, our ability, subject to certain exceptions and baskets, to incur additional debt, pay dividends and repurchase shares of our common stock. In the event we require additional liquidity, our ability to obtain it may be limited by the Credit Agreement.
43
Cash Flows
The following table presents our cash flows for the years ended
December 31
:
|
(in thousands)
|
2019
|
% Increase (decrease)
|
2018
|
% Increase (decrease)
|
2017
|
|||||||||||||
|
Net (loss) income adjusted for non-cash items
|
$
|
39,182
|
|
(46
|
)
|
$
|
72,510
|
|
(23
|
)
|
$
|
93,769
|
|
|||||
|
Changes in operating assets and liabilities
|
7,506
|
|
283
|
|
(4,108
|
)
|
85
|
|
(27,687
|
)
|
||||||||
|
Cash flows provided by operating activities
|
46,688
|
|
(32
|
)
|
68,402
|
|
4
|
|
66,082
|
|
||||||||
|
Cash flows provided by (used in) investing activities
|
44,887
|
|
305
|
|
11,084
|
|
207
|
|
(10,326
|
)
|
||||||||
|
Cash flows used in financing activities
|
(69,038
|
)
|
44
|
|
(124,283
|
)
|
(24
|
)
|
(100,334
|
)
|
||||||||
|
Net increase (decrease) in cash, cash equ
ivalents and restricted cash
|
22,537
|
|
150
|
|
(44,797
|
)
|
—
|
|
(44,578
|
)
|
||||||||
|
Cash, cash equivalents and restricted cash at the beginn
ing of the period
|
64,046
|
|
(41
|
)
|
108,843
|
|
(29
|
)
|
153,421
|
|
||||||||
|
Cash, cash equivalents and restricted cash at the
end of the period
|
$
|
86,583
|
|
35
|
|
$
|
64,046
|
|
(41
|
)
|
$
|
108,843
|
|
|||||
Cash Flows from Operating Activities
Cash flows from operating activities generally consist of the cash effects of transactions and events that enter into the determination of net income. For the year ended
December 31, 2019
, cash flows provided by operating activities were
$46.7 million
, or approximately
$0.08
for every dollar of service revenue, compared to cash flows provided by operating activities of
$68.4 million
, or approximately
$0.08
for every dollar of service revenue, for the year ended
December 31, 2018
and
$66.1 million
of cash flows from operating activities, or approximately
$0.07
for every dollar of service revenue, for the year ended
December 31, 2017
. The decrease in cash provided by operating activities for the year ended
December 31, 2019
was driven by a decline in net income, adjusted for non-cash items of
$33.3 million
. The decrease in net income, adjusted for non-cash items, was partially driven by lower gross profit during the year ended
December 31, 2019
from lower service revenue and the Project Catalyst restructuring charges, partially offset by lower SG&A costs and decreases in expenses as a result of the Project Catalyst cost reduction initiatives. The decrease in cash provided by operating activities was partially offset by cash provided by operating activities related to changes in operating assets and liabilities of
$11.6 million
. The changes in operating assets and liabilities were driven by the decrease in short-term investments in real estate of
$39.9 million
in 2019 related to the sale of the remaining BRS Inventory, compared to an increase in short-term investments in real estate of
$10.5 million
in 2018. This increase in cash from operating activities was partially offset by an increase of
$12.2 million
in accounts receivable in 2019, compared to a decrease in accounts receivable of
$14.6 million
in 2018, largely driven by the timing of collections. During 2019, accounts receivable increased in part as a result of delays in receiving payments from Ocwen in connection with Ocwen’s transition to another mortgage servicing software platform. In addition, the decrease in accounts payable and accrued liabilities of
$16.3 million
in 2019 decreased cash from operating activities, largely driven by the timing of payments, and a $6.9 million payment of sales tax accruals in 2019.
The increase in cash flows from operations in
2018
compared to
2017
was primarily due to a decrease in cash used for changes in operating assets and liabilities, largely offset by a $21.3 million decrease in net income, adjusted for non-cash items compared to the year ended December 31, 2018. The decrease in net income, adjusted for non-cash items, was primarily driven by lower gross profit in 2018 as a result of decreasing service revenues, which were partially offset by corresponding reductions in expenses. The decrease in cash used for changes in operating assets and liabilities was principally driven by the $28.0 million net payment in
2017
of an accrued litigation settlement, a decrease in prepaid maintenance and income taxes receivable and a lower increase in short-term investments in real estate. These decreases were partially offset by a lower decrease in accounts receivable for the year ended December 31, 2018 due to service revenue mix and the timing of collections.
Operating cash flows can be negatively impacted because of the nature of some of our services and the mix of services provided. Certain services are performed immediately following or shortly after the referral, but the collection of the receivable does not occur until a specific event occurs (e.g., the foreclosure is complete, the REO asset is sold, etc.). Furthermore, lower margin services generate lower income and cash flows from operations. Consequently, our cash flows from operations may be negatively impacted when comparing one period to another.
Cash Flows from Investing Activities
Cash flows from investing activities generally include additions to premises and equipment, acquisitions and sales of businesses, and sales of equity securities. Cash flows provided by (used in) investing activities were
$44.9 million
,
$11.1 million
and
$(10.3)
44
million
for the years ended
December 31, 2019
,
2018
and
2017
, respectively. Cash flows from investing activities in 2019 included
$38.6 million
in proceeds from the sale of the Financial Services business and, in 2018,
$15.0 million
in proceeds from the sale of the rental property management business to RESI. In addition, in 2019, we sold
0.7 million
shares of RESI stock for net proceeds of
$8.0 million
. We used
$2.2 million
,
$3.9 million
and
$10.5 million
for the years ended
December 31, 2019
,
2018
and
2017
, respectively, for additions to premises and equipment primarily related to investments in the development of certain software applications, IT infrastructure and facility improvements. The decreases in additions to premises and equipment in 2019 and 2018 primarily related to the completion of several software development projects prior to 2018.
Cash Flows from Financing Activities
Cash flows from financing activities primarily include activities associated with long-term debt issuances, debt repayments, debt issuance costs, proceeds from stock option exercises, the purchase of treasury shares, distributions to non-controlling interests and payments of tax withholdings on issuance of restricted share units and restricted shares. Cash flows used in financing activities were
$(69.0) million
,
$(124.3) million
and
$(100.3) million
for the years ended
December 31, 2019
,
2018
and
2017
, respectively. We used
$(45.0) million
in 2019 for repayments of long-term debt, largely from proceeds from the sale of the Financial Services Business and RESI common shares, $(84.0) million in 2018 to refinance and reduce our debt, including debt issuance costs and repayments, and
$(59.8) million
in
2017
for repurchases and repayments of long-term debt. We received proceeds from stock option exercises of
$0.4 million
,
$3.6 million
and
$2.4 million
for the years ended
December 31, 2019
,
2018
and 2017, respectively. We also used
$(20.0) million
,
$(40.4) million
and
$(39.0) million
to repurchase shares of our common stock for the years ended December 31,
2019
,
2018
and 2017, respectively. We distributed
$(2.8) million
to non-controlling interests in each of the years ended
December 31, 2019
,
2018
and
2017
. In addition, we made payments of
$(1.7) million
,
$(0.8) million
and
$(1.2) million
for the years ended
December 31, 2019
,
2018
and
2017
, respectively, to satisfy employee tax withholding obligations on the issuance of restricted shares. These payments were made to tax authorities, at the employees’ direction, to satisfy the employees’ tax obligations rather than issuing a portion of vested restricted shares to employees.
Liquidity Requirements after
December 31, 2019
Our significant future liquidity obligations primarily pertain to long-term debt repayments and interest expense under the Credit Agreement (see Liquidity section above), lease payments and distributions to Lenders One members. During the next 12 months, we expect to pay $17.5 million of interest expense (assuming no further principal repayments and the
December 31, 2019
interest rate) under the Credit Agreement and make lease payments of $11.8 million.
We believe that our existing cash and cash equivalents balances, our anticipated cash flows from operations and availability under our revolving credit facility will be sufficient to meet our liquidity needs, including to fund required interest and lease payments, for the next 12 months.
CRITICAL ACCOUNTING POLICIES, ESTIMATES AND RECENT ACCOUNTING PRONOUNCEMENTS
We prepare our consolidated financial statements in accordance with GAAP. In applying many of these accounting principles, we need to make assumptions, estimates and judgments that affect the reported amounts of assets, liabilities, revenue and expenses in our consolidated financial statements. We base our estimates and judgments on historical experience and other assumptions that we believe are reasonable under the circumstances. These assumptions, estimates and judgments, however, are often subjective. Actual results may be negatively affected based on changing circumstances. If actual amounts are ultimately different from our estimates, the revisions are included in our results of operations for the period in which the actual amounts become known.
We have identified the critical accounting policies and estimates addressed below. We also have other key accounting policies, which involve the use of assumptions, estimates and judgments that are significant to understanding our results. For additional information, see
Note 2
to the consolidated financial statements. Although we believe that our assumptions, estimates and judgments are reasonable, they are based upon information presently available. Actual results may differ significantly from these estimates under different assumptions, judgments or conditions.
Revenue Recognition
We recognize revenue when we satisfy a performance obligation by transferring control of a product or service to a customer in an amount that reflects the consideration that we expect to receive. This revenue can be recognized at a point in time or over time. We invoice customers based on our contractual arrangements with each customer, which may not be consistent with the period that revenues are recognized. When there is a timing difference between when we invoice customers and when revenues are recognized, we record either a contract asset (unbilled accounts receivable) or a contract liability (deferred revenue or other current liabilities), as appropriate.
45
Descriptions of our principal revenue generating activities are as follows:
Core Businesses
Field Services
|
•
|
For property preservation and inspection services and payment management technologies, we recognize transactional revenue when the service is provided.
|
|
•
|
For vendor management transactions and our vendor management oversight SaaS platform, we recognize revenue over the period during which we perform the services.
|
|
•
|
Reimbursable expenses revenue related to our property preservation and inspection services is included in revenue with an equal amount recognized in cost of revenue. These amounts are recognized on a gross basis, principally because generally we have control over selection of vendors and the vendor relationships are with us, rather than with our customers.
|
Marketplace
|
•
|
For the real estate auction platform, real estate auction and real estate brokerage services, we recognize revenue on a net basis (i.e., the commission on the sale) as we perform services as an agent without assuming the risks and rewards of ownership of the asset and the commission earned on the sale is a fixed percentage or amount.
|
|
•
|
For SaaS based technology to manage REO, short sales, foreclosure, bankruptcy and eviction processes, we recognize revenue over the estimated average number of months the REO are on the platform. We generally recognize revenue for professional services over the contract period.
|
|
•
|
Reimbursable expenses revenue related to our real estate sales is included in revenue with an equal amount recognized in cost of revenue. These amounts are recognized on a gross basis, principally because generally we have control over selection of vendors and the vendor relationships are with us, rather than with our customers.
|
Mortgage and Real Estate Solutions
|
•
|
For the majority of the services we provide, we recognize transactional revenue when the service is provided.
|
|
•
|
For loan disbursement processing services, we recognize revenue over the period during which we perform the processing services with full recognition upon completion of the disbursements. For foreclosure trustee services, we recognize revenue over the period during which we perform the related services, with full recognition upon completion and/or recording the related foreclosure deed. We use judgment to determine the period over which we recognize revenue for certain of these services.
|
|
•
|
Reimbursable expenses revenue related to our title and foreclosure trustee services businesses is included in revenue with an equal amount recognized in cost of revenue. These amounts are recognized on a gross basis, principally because generally we have control over selection of vendors and the vendor relationships are with us, rather than with our customers.
|
Other Businesses
Earlier Stage Business
|
•
|
For our customer journey analytics platform, we recognize revenue primarily based on subscription fees. We recognize revenue associated with implementation services and maintenance services ratably over the contract term.
|
Other
|
•
|
For our Financial Services business (sold on July 1, 2019), we generally earned fees for our post-charge-off consumer debt collection services as a percentage of the amount we collected on delinquent consumer receivables and recognized revenue following collection from the borrowers. For mortgage charge-off collections performed on behalf of our clients, we recognized revenue as a percentage of amounts collected following collection from the borrowers. We provided customer relationship management services for which we typically earned and recognized revenue on a per-person, per-call or per-minute basis as the related services were performed.
|
|
•
|
For loan servicing technologies, we recognized revenue based on the number of loans on the system. We generally recognized revenue from professional services over the contract period.
|
|
•
|
For short-term investments in real estate (wind down completed in 2019), we recognized revenue associated with our sales of short-term investments in real estate on a gross basis (i.e., the selling price of the property) as we assumed the risks and rewards of ownership of the asset.
|
|
•
|
For our consumer real estate brokerage (discontinued in the fourth quarter of 2019), we recognized revenue on a net basis (i.e., the commission on the sale) as we performed services as an agent without assuming the risks and rewards of ownership of the asset and the commission earned on the sale was a fixed percentage or amount.
|
46
Goodwill and Identifiable Intangible Assets
Goodwill
We evaluate goodwill for impairment annually during the fourth quarter or more frequently when an event occurs or circumstances change in a manner that indicates the carrying value may not be recoverable. We first assess qualitative factors to determine whether it is more likely than not that the fair value of a reporting unit is less than its carrying value as a basis for determining whether we need to perform the quantitative two-step goodwill impairment test. Only if we determine, based on qualitative assessment, that it is more likely than not that a reporting unit’s fair value is less than its carrying value will we calculate the fair value of the reporting unit. We would then test goodwill for impairment by first comparing the book value of net assets to the fair value of the reporting unit. If the fair value is determined to be less than the book value, a second step is performed to compute the amount of impairment as the difference between the estimated fair value of goodwill and the carrying value. We estimate the fair value of the reporting units using discounted cash flows and market comparisons. The discounted cash flow method is based on the present value of projected cash flows. Forecasts of future cash flows are based on our estimate of future sales and operating expenses, based primarily on estimated pricing, sales volumes, market segment share, cost trends and general economic conditions. The estimated cash flows are discounted using a rate that represents our weighted average cost of capital. The market comparisons include an analysis of revenue and earnings multiples of guideline public companies compared to the Company.
Identifiable Intangible Assets
Identified intangible assets consist primarily of customer related intangible assets, operating agreements, trademarks and trade names and other intangible assets. We determine the useful lives of our identifiable intangible assets after considering the specific facts and circumstances related to each intangible asset. Factors we consider when determining useful lives include the contractual term of any arrangements, the history of the asset, our long-term strategy for use of the asset and other economic factors. We amortize intangible assets that we deem to have definite lives in proportion to actual and expected customer revenues or on a straight-line basis over their useful lives, generally ranging from 4 to 20 years.
We perform tests for impairment if conditions exist that indicate the carrying value may not be recoverable. When facts and circumstances indicate that the carrying value of intangible assets determined to have definite lives may not be recoverable, management assesses the recoverability of the carrying value by preparing estimates of cash flows of discrete intangible assets generally consistent with models utilized for internal planning purposes. If the sum of the undiscounted expected future cash flows is less than the carrying value, we recognize an impairment to the extent the carrying amount exceeds fair value.
Income Taxes
We record income taxes in accordance with Financial Accounting Standards Board Accounting Standards Codification Topic 740,
Income Taxes
(“ASC Topic 740”). We account for certain income and expense items differently for financial reporting purposes and income tax purposes. We recognize deferred income tax assets and liabilities for these differences between the financial reporting basis and the tax basis of our assets and liabilities as well as expected benefits of utilizing net operating loss and credit carryforwards. The most significant temporary differences relate to accrued compensation, amortization, loss carryforwards and valuation allowances. We measure deferred income tax assets and liabilities using enacted tax rates expected to apply to taxable income in the years in which we anticipate recovery or settlement of those temporary differences. The effect on deferred tax assets and liabilities of a change in tax rates is recognized in income in the period when the change is enacted. Deferred tax assets are reduced by a valuation allowance when it is more likely than not that some portion or all of the deferred tax assets will not be realized.
Tax laws are complex and subject to different interpretations by the taxpayer and respective governmental taxing authorities. Significant judgment is required in determining tax expense and in evaluating tax positions including evaluating uncertainties under ASC Topic 740. We recognize tax benefits from uncertain tax positions only if it is more likely than not that the tax position will be sustained on examination by the taxing authorities based on the technical merits of the position. The tax benefits recognized in the financial statements from such positions are then measured based on the largest benefit that has a greater than 50% likelihood of being realized upon ultimate settlement. Resolution of these uncertainties in a manner inconsistent with management’s expectations could have a material impact on our results of operations.
Recently Adopted and Future Adoption of New Accounting Pronouncements
See
Note 2
to the consolidated financial statements for a discussion of the recent adoption of a new accounting pronouncements and the future adoption of new accounting pronouncements.
47
OTHER MATTERS
Off-Balance Sheet Arrangements
Our off-balance sheet arrangements consist of escrow arrangements.
We hold customers’ assets in escrow accounts at various financial institutions pending completion of certain real estate activities. These amounts are held in escrow accounts for limited periods of time and are not included in the consolidated balance sheets. Amounts held in escrow accounts were
$12.3 million
and
$23.6 million
as of
December 31, 2019
and
2018
, respectively.
Contractual Obligations, Commitments and Contingencies
Our long-term contractual obligations generally include our long-term debt and operating lease payments on certain of our premises and equipment. The following table sets forth information relating to our contractual obligations as of
December 31, 2019
:
|
Payments due by period
|
||||||||||||||||||||
|
(in thousands)
|
Total
|
Less than 1 year
|
1-3 years
|
3-5 years
|
More than 5 years
|
|||||||||||||||
|
Senior secured term loan
|
$
|
293,826
|
|
$
|
—
|
|
$
|
—
|
|
$
|
293,826
|
|
$
|
—
|
|
|||||
|
Non-cancelable operating lease obligations
|
35,375
|
|
11,756
|
|
15,267
|
|
7,753
|
|
599
|
|
||||||||||
|
Contractual interest payments
(1)
|
73,975
|
|
17,467
|
|
34,934
|
|
21,574
|
|
—
|
|
||||||||||
|
Total
|
$
|
403,176
|
|
$
|
29,223
|
|
$
|
50,201
|
|
$
|
323,153
|
|
$
|
599
|
|
|||||
______________________________________
|
(1)
|
Represents estimated future interest payments on our Credit Agreement based on the interest rate as of
December 31, 2019
.
|
For further information, see
Note 14
and
Note 25
to the consolidated financial statements.
Customer Concentration
Ocwen
Revenue from Ocwen primarily consists of revenue earned from the loan portfolios serviced and subserviced by Ocwen when Ocwen engages us as the service provider, and revenue earned directly from Ocwen, pursuant to the Ocwen Services Agreements. For the years ended
December 31, 2019
,
2018
and
2017
, we recognized revenue from Ocwen of
$362.7 million
,
$437.4 million
and
$542.0 million
, respectively. Revenue from Ocwen as a percentage of consolidated revenue was
56%
,
52%
and
58%
for the years ended
December 31, 2019
,
2018
and
2017
, respectively.
We earn additional revenue related to the portfolios serviced and subserviced by Ocwen when a party other than Ocwen or the MSR owner selects Altisource as the service provider. For the years ended
December 31, 2019
,
2018
and
2017
, we recognized revenue of
$37.5 million
,
$47.1 million
and
$148.5 million
, respectively, related to the portfolios serviced by Ocwen when a party other than Ocwen or the MSR owner selected Altisource as the service provider. These amounts are not included in deriving revenue from Ocwen and revenue from Ocwen as a percentage of revenue discussed above.
In February 2019, Altisource and Ocwen entered into agreements that, among other things, facilitate Ocwen’s transition from REALServicing and related technologies to another mortgage servicing software platform, establish a process for Ocwen to review and approve the assignment of one or more of our agreements to potential buyers of Altisource’s business lines, requiring Ocwen to use Altisource as service provider for certain service referrals totaling an amount equal to 100% of the applicable service referrals on certain portfolios plus an amount equal to not less than 90% of applicable service referrals from certain other portfolios (determined on a service by service basis), subject to certain additional restrictions and limitations, and affirm Altisource’s role as a strategic service provider to Ocwen through August 2025. In connection with these agreements, Altisource expressly preserved and did not waive any of its existing contractual rights relating to service referrals, other than with respect to Ocwen transitioning from the REALServicing and related technologies. If Altisource fails certain performance standards for specified periods of time, then Ocwen may terminate Altisource as a provider for the applicable service(s), subject to certain limitations and Altisource’s right to cure. Ocwen’s transition to another mortgage servicing platform was completed during 2019. We are not experiencing a significant impact of the servicing technology transition on the other services we provide to Ocwen, other than what we believe is a temporary impact on default related referral volume and REO inventory conversion rates from Ocwen’s transition to another servicing system. We believe the REO conversion rates will return to historical levels during the first half of 2020. For the years ended
December 31, 2019
,
2018
and 2017, service revenue from REALServicing and related technologies was
$14.1 million
,
$35.1 million
and
$37.2 million
, respectively.
48
As of
December 31, 2019
, accounts receivable from Ocwen totaled
$19.1 million
,
$15.7 million
of which was billed and
$3.4 million
of which was unbilled. As of
December 31, 2018
, accounts receivable from Ocwen totaled
$15.2 million
,
$11.6 million
of which was billed and
$3.6 million
of which was unbilled.
NRZ
Ocwen has disclosed that NRZ is its largest client. As of December 31, 2019, NRZ owned MSRs or rights to MSRs relating to approximately
56%
of loans serviced and subserviced by Ocwen (measured in UPB). In July 2017 and January 2018, Ocwen and NRZ entered into a series of agreements pursuant to which the parties agreed, among other things, to undertake certain actions to facilitate the transfer from Ocwen to NRZ of Ocwen’s legal title to the Subject MSRs and under which Ocwen will subservice mortgage loans underlying the MSRs for an initial term of
five
years.
On August 28, 2017, Altisource, through its licensed subsidiaries, entered into the Cooperative Brokerage Agreement with NRZ which extends through August 2025. Under this agreement and related amendments, Altisource remains the exclusive provider of brokerage services for REO associated with the Subject MSRs, irrespective of the subservicer, subject to certain limitations. NRZ’s brokerage subsidiary receives a cooperative brokerage commission on the sale of REO properties from these portfolios subject to certain exceptions.
The Brokerage Agreement can, at Altisource’s discretion, be terminated by Altisource if a services agreement is not signed by Altisource and NRZ. A services agreement has not been signed. The parties continue to operate under the Brokerage Agreement. The Brokerage Agreement may otherwise only be terminated upon the occurrence of certain specified events. Termination events include, but are not limited to, a breach of the terms of the Brokerage Agreement (including, without limitation, the failure to meet performance standards and non-compliance with law in a material respect), the failure to maintain licenses which failure materially prevents performance of the contract, regulatory allegations of non-compliance resulting in an adversarial proceeding against NRZ, voluntary or involuntary bankruptcy, appointment of a receiver, disclosure in a Form 10-K or Form 10-Q that there is significant uncertainty about Altisource’s ability to continue as a going concern, failure to maintain a specified level of cash and an unapproved change of control.
For the years ended
December 31, 2019
,
2018
and 2017, we recognized revenue from NRZ of
$12.5 million
,
$28.7 million
and
$2.4 million
, respectively, under the Brokerage Agreement. For the years ended
December 31, 2019
,
2018
and 2017, we recognized additional revenue of
$60.0 million
,
$83.6 million
and
$3.9 million
, respectively, relating to the Subject MSRs when a party other than NRZ selects Altisource as the service provider.
|
ITEM 7A.
|
QUANTITATIVE AND QUALITATIVE DISCLOSURES ABOUT MARKET RISK
|
Market Risk
Our financial market risk consists primarily of interest rate and foreign currency exchange rate risk.
Interest Rate Risk
As of
December 31, 2019
, the interest rate charged on the Term B Loan was
5.94%
. The interest rate is calculated based on the Adjusted Eurodollar Rate (as defined in the senior secured term loan agreement) with a minimum floor of
1.00%
plus
4.00%
.
Based on the principal amount outstanding and the Adjusted Eurodollar Rate as of
December 31, 2019
, a one percentage point increase in the Eurodollar rate would increase our annual interest expense by approximately
$2.9 million
. There would be a
$2.9 million
decrease in our annual interest expense if there was a one percentage point decrease in the Eurodollar Rate.
Currency Exchange Risk
We are exposed to currency risk from potential changes in currency values of our non-United States dollar denominated expenses, assets, liabilities and cash flows. Our most significant currency exposure relates to the Indian rupee. Based on expenses incurred in Indian rupees for the year ended
December 31, 2019
, a one percentage point increase or decrease in value of the Indian rupee in relation to the United States dollar would increase or decrease our annual expenses by approximately
$0.5 million
.
49
|
ITEM 8.
|
FINANCIAL STATEMENTS AND SUPPLEMENTARY DATA
|
INDEX TO CONSOLIDATED FINANCIAL STATEMENTS
|
Page
|
|
50
Report of Independent Registered Public Accounting Firm
To the Board of Directors and
Shareholders of Altisource Portfolio Solutions S.A.:
Opinion on the Financial Statements
We have audited the accompanying consolidated balance sheets of Altisource Portfolio Solutions S.A. and subsidiaries (the “Company”) as of December 31, 2019 and 2018, and the related consolidated statements of operations and comprehensive income (loss), equity, and cash flows for the three years in the period ended December 31, 2019, and the related notes (collectively referred to as the “financial statements”). In our opinion, the consolidated financial statements present fairly, in all material respects, the financial position of the Company as of December 31, 2019 and 2018, and the results of its operations and its cash flows for the three years in the period ended December 31, 2019, in conformity with accounting principles generally accepted in the United States of America.
We also have audited, in accordance with the standards of the Public Company Accounting Oversight Board (United States) (“PCAOB”), the Company’s internal control over financial reporting as of December 31, 2019, based on criteria established in 2013 Internal Control - Integrated Framework issued by the Committee of Sponsoring Organizations of the Treadway Commission and our report dated March 5, 2020 expressed an unqualified opinion.
Adoption of New Accounting Standards
As discussed in Note 2 to the consolidated financial statements, the Company changed its method of accounting for leases as a result of the adoption of Accounting Standards Codification (“ASC”) Topic 842,
Leases,
effective January 1, 2019, under the modified retrospective transition approach.
As discussed in Note 18 to the consolidated financial statements, the Company changed its method of accounting for revenue from contracts with customers as a result of the adoption of ASC Topic 606,
Revenue from Contracts with Customers,
effective January 1, 2018, under the modified retrospective method.
Emphasis of Concentration of Revenue and Uncertainties
As discussed in Note 3 to the consolidated financial statements, Ocwen Financial Corporation (“Ocwen”) is the Company’s largest customer. Ocwen purchases certain mortgage services and technology services from the Company under agreements with terms extending through August 2025. Ocwen has disclosed that New Residential Investment Corp. (“NRZ”) is its largest client. In July 2017 and January 2018, Ocwen and NRZ entered into a series of agreements pursuant to which the parties agreed, among other things, to undertake certain actions to facilitate the transfer from Ocwen to NRZ of Ocwen’s legal title to certain mortgage servicing rights (“MSRs”) and under which Ocwen will subservice mortgage loans underlying these MSRs for an initial term of five years. As discussed in Note 25 to the consolidated financial statements, Ocwen has been and is subject to a number of federal and state regulatory matters and is subject to other challenges and uncertainties that could have significant adverse effects on Ocwen’s business. Note 25 also discusses the potential implications of these uncertainties to the Company including the loss of Ocwen as a customer, the termination of Ocwen’s subservicing agreement with NRZ, or a reduction in the number or volume of services Ocwen purchases from the Company.
Opinion on the Supplemental Information
The schedule listed in the index at Item 15 of the Form 10-K has been subjected to audit procedures performed in conjunction with the audit of the Company’s consolidated financial statements. The schedule listed in the index at Item 15 of the Form 10-K is the responsibility of the Company’s management. Our audit procedures included determining whether the schedule listed in the index at Item 15 of the Form 10-K reconciles to the consolidated financial statements or the underlying accounting and other records, as applicable, and performing procedures to test the completeness and accuracy of the information presented in the schedule listed in the index at Item 15 of the Form 10-K. In forming our opinion on the schedule listed in the index at Item 15 of the Form 10-K, we evaluated whether the schedule listed in the index at Item 15 of the Form 10-K, including its form and content, is presented in conformity with accounting principles generally accepted in the United States of America. In our opinion, the schedule listed in the index at Item 15 of the Form 10-K is fairly stated, in all material respects, in relation to the consolidated financial statements as a whole.
51
Basis for Opinion
These consolidated financial statements are the responsibility of the Company’s management. Our responsibility is to express an opinion on the Company’s consolidated financial statements based on our audits. We are a public accounting firm registered with the PCAOB and are required to be independent with respect to the Company in accordance with the U.S. federal securities laws and the applicable rules and regulations of the Securities and Exchange Commission and the PCAOB.
We conducted our audits in accordance with the standards of the PCAOB. Those standards require that we plan and perform the audit to obtain reasonable assurance about whether the consolidated financial statements are free of material misstatement, whether due to error or fraud. Our audits included performing procedures to assess the risks of material misstatement of the consolidated financial statements, whether due to error or fraud, and performing procedures that respond to those risks. Such procedures included examining, on a test basis, evidence regarding the amounts and disclosures in the consolidated financial statements. Our audits also included evaluating the accounting principles used and significant estimates made by management, as well as evaluating the overall presentation of the consolidated financial statements. We believe that our audits provide a reasonable basis for our opinion.
/s/
Mayer Hoffman McCann P.C.
We have served as the Company’s auditor since 2016.
March 5, 2020
Clearwater, Florida
52
Report of Independent Registered Public Accounting Firm
To the Board of Directors and
Shareholders of Altisource Portfolio Solutions S.A.:
Opinion on Internal Control Over Financial Reporting
We have audited Altisource Portfolio Solutions S.A. and subsidiaries’ (the “Company”) internal control over financial reporting as of December 31, 2019, based on criteria established in 2013 Internal Control - Integrated Framework issued by the Committee of Sponsoring Organizations of the Treadway Commission (“COSO”). In our opinion, the Company maintained, in all material respects, effective internal control over financial reporting as of December 31, 2019, based on criteria established in 2013 Internal Control - Integrated Framework issued by the COSO.
We also have audited, in accordance with the standards of the Public Company Accounting Oversight Board (United States) (“PCAOB”), the consolidated balance sheets and related consolidated statements of operations and comprehensive income (loss), consolidated statement of equity, cash flows and financial statement schedule as of December 31, 2019 and 2018 and for the three years in the period ended December 31, 2019 of the Company, and our report dated March 5, 2020, expressed an unqualified opinion on those financial statements and included explanatory paragraphs regarding the Company’s change in method of accounting for leases as a result of Accounting Standards Codification (“ASC”) Topic 842,
Leases,
effective January 1, 2019, and revenue from contracts from customers as a result of ASC Topic 606,
Revenue from Contracts with Customers
, effective January 1, 2018, and an emphasis of matter paragraph regarding concentration of revenue with Ocwen Financial Corporation (“Ocwen”) and uncertainties faced by Ocwen.
Basis for Opinion
The Company’s management is responsible for maintaining effective internal control over financial reporting, and for its assessment of the effectiveness of internal control over financial reporting, included in the accompanying Management’s Report on Internal Control over Financial Reporting. Our responsibility is to express an opinion on the Company’s internal control over financial reporting based on our audit. We are a public accounting firm registered with the PCAOB and are required to be independent with respect to the Company in accordance with the U.S. federal securities laws and the applicable rules and regulations of the Securities and Exchange Commission and the PCAOB.
We conducted our audit in accordance with the standards of the PCAOB. Those standards require that we plan and perform the audit to obtain reasonable assurance about whether effective internal control over financial reporting was maintained in all material respects. Our audit of internal control over financial reporting included obtaining an understanding of internal control over financial reporting, assessing the risk that a material weakness exists, and testing and evaluating the design and operating effectiveness of internal control based on the assessed risk. Our audit also included performing such other procedures as we considered necessary in the circumstances. We believe that our audit provides a reasonable basis for our opinion.
Definition and Limitations of Internal Control Over Financial Reporting
A company’s internal control over financial reporting is a process designed to provide reasonable assurance regarding the reliability of financial reporting and the preparation of financial statements for external purposes in accordance with accounting principles generally accepted in the United States of America. A company’s internal control over financial reporting includes those policies and procedures that (1) pertain to the maintenance of records that, in reasonable detail, accurately and fairly reflect the transactions and dispositions of the assets of the company; (2) provide reasonable assurance that transactions are recorded as necessary to permit preparation of financial statements in accordance with generally accepted accounting principles, and that receipts and expenditures of the company are being made only in accordance with authorizations of management and directors of the company; and (3) provide reasonable assurance regarding prevention or timely detection of unauthorized acquisition, use, or disposition of the company’s assets that could have a material effect on the financial statements.
53
Because of its inherent limitations, internal control over financial reporting may not prevent or detect misstatements. Also, projections of any evaluation of effectiveness to future periods are subject to the risk that controls may become inadequate because of changes in conditions, or that the degree of compliance with the policies or procedures may deteriorate.
/s/
Mayer Hoffman McCann P.C.
March 5, 2020
Clearwater, Florida
54
ALTISOURCE PORTFOLIO SOLUTIONS S.A.
Consolidated Balance Sheets
(in thousands, except per share data)
|
December 31,
|
||||||||
|
2019
|
2018
|
|||||||
|
ASSETS
|
||||||||
|
Current assets:
|
||||||||
|
Cash and cash equivalents
|
$
|
82,741
|
|
$
|
58,294
|
|
||
|
Investment in equity securities (Note 5)
|
42,618
|
|
36,181
|
|
||||
|
Accounts receivable, net
|
43,615
|
|
36,466
|
|
||||
|
Short-term investments in real estate (Note 8)
|
—
|
|
39,873
|
|
||||
|
Prepaid expenses and other current assets
|
15,214
|
|
30,720
|
|
||||
|
Total current assets
|
184,188
|
|
201,534
|
|
||||
|
Premises and equipment, net (Note 9)
|
24,526
|
|
45,631
|
|
||||
|
Right-of-use assets under operating leases (Notes 2 and 10)
|
29,074
|
|
—
|
|
||||
|
Goodwill
|
73,849
|
|
81,387
|
|
||||
|
Intangible assets, net
|
61,046
|
|
91,653
|
|
||||
|
Deferred tax assets, net (Note 22)
|
1,626
|
|
309,089
|
|
||||
|
Other assets
|
10,810
|
|
12,406
|
|
||||
|
Total assets
|
$
|
385,119
|
|
$
|
741,700
|
|
||
|
LIABILITIES AND EQUITY
|
||||||||
|
Current liabilities:
|
||||||||
|
Accounts payable and accrued expenses
|
$
|
67,671
|
|
$
|
87,240
|
|
||
|
Deferred revenue
|
5,183
|
|
10,108
|
|
||||
|
Other current liabilities (Notes 2 and 13)
|
14,724
|
|
7,030
|
|
||||
|
Total current liabilities
|
87,578
|
|
104,378
|
|
||||
|
Long-term debt
|
287,882
|
|
331,476
|
|
||||
|
Other non-current liabilities (Notes 2 and 15)
|
31,016
|
|
9,178
|
|
||||
|
Commitments, contingencies and regulatory matters (Note 25)
|
|
|
|
|
||||
|
Equity (deficit):
|
||||||||
|
Common stock ($1.00 par value; 100,000 shares authorized, 25,413 issued and 15,454 outstanding as of December 31, 2019; 16,276 outstanding as of December 31, 2018)
|
25,413
|
|
25,413
|
|
||||
|
Additional paid-in capital
|
133,669
|
|
122,667
|
|
||||
|
Retained earnings
|
272,026
|
|
590,655
|
|
||||
|
Treasury stock, at cost (9,959 shares as of December 31, 2019 and 9,137 shares as of December 31, 2018)
|
(453,934
|
)
|
(443,304
|
)
|
||||
|
Altisource equity (deficit)
|
(22,826
|
)
|
295,431
|
|
||||
|
Non-controlling interests
|
1,469
|
|
1,237
|
|
||||
|
Total equity (deficit)
|
(21,357
|
)
|
296,668
|
|
||||
|
Total liabilities and equity (deficit)
|
$
|
385,119
|
|
$
|
741,700
|
|
||
See accompanying notes to consolidated financial statements
.
55
ALTISOURCE PORTFOLIO SOLUTIONS S.A.
Consolidated Statements of Operations and Comprehensive Income (Loss)
(in thousands, except per share data)
|
For the years ended December 31,
|
||||||||||||
|
|
2019
|
2018
|
2017
|
|||||||||
|
Revenue
|
$
|
648,651
|
|
$
|
838,202
|
|
$
|
942,213
|
|
|||
|
Cost of revenue
|
493,256
|
|
622,165
|
|
699,865
|
|
||||||
|
Gross profit
|
155,395
|
|
216,037
|
|
242,348
|
|
||||||
|
Operating expenses (income):
|
||||||||||||
|
Selling, general and administrative expenses
|
141,076
|
|
175,670
|
|
192,642
|
|
||||||
|
Gain on sale of businesses (Note 4)
|
(17,814
|
)
|
(13,688
|
)
|
—
|
|
||||||
|
Restructuring charges (Note 24)
|
14,080
|
|
11,560
|
|
—
|
|
||||||
|
Income from operations
|
18,053
|
|
42,495
|
|
49,706
|
|
||||||
|
Other income (expense), net:
|
||||||||||||
|
Interest expense
|
(21,393
|
)
|
(26,254
|
)
|
(22,253
|
)
|
||||||
|
Unrealized gain (loss) on investment in equity securities (Note 5)
|
14,431
|
|
(12,972
|
)
|
—
|
|
||||||
|
Other income (expense), net
|
1,348
|
|
(1,870
|
)
|
7,922
|
|
||||||
|
Total other income (expense), net
|
(5,614
|
)
|
(41,096
|
)
|
(14,331
|
)
|
||||||
|
Income before income taxes and non-controlling interests
|
12,439
|
|
1,399
|
|
35,375
|
|
||||||
|
Income tax (provision) benefit
|
(318,296
|
)
|
(4,098
|
)
|
276,256
|
|
||||||
|
Net (loss) income
|
(305,857
|
)
|
(2,699
|
)
|
311,631
|
|
||||||
|
Net income attributable to non-controlling interests
|
(2,112
|
)
|
(2,683
|
)
|
(2,740
|
)
|
||||||
|
Net (loss) income attributable to Altisource
|
$
|
(307,969
|
)
|
$
|
(5,382
|
)
|
$
|
308,891
|
|
|||
|
(Loss) earnings per share:
|
||||||||||||
|
Basic
|
$
|
(19.26
|
)
|
$
|
(0.32
|
)
|
$
|
16.99
|
|
|||
|
Diluted
|
$
|
(19.26
|
)
|
$
|
(0.32
|
)
|
$
|
16.53
|
|
|||
|
Weighted average shares outstanding:
|
||||||||||||
|
Basic
|
15,991
|
|
17,073
|
|
18,183
|
|
||||||
|
Diluted
|
15,991
|
|
17,073
|
|
18,692
|
|
||||||
|
Comprehensive (loss) income:
|
||||||||||||
|
Net (loss) income
|
$
|
(305,857
|
)
|
$
|
(2,699
|
)
|
$
|
311,631
|
|
|||
|
Other comprehensive (loss) income, net of tax:
|
|
|||||||||||
|
Reclassification of unrealized gain on investment in equity securities, net of income tax provision of $200, to retained earnings from the cumulative effect of an accounting change (
Note 5
)
|
—
|
|
(733
|
)
|
—
|
|
||||||
|
Unrealized gain on investment in equity securities, net of income tax provision of $0, $0, $(921)
|
—
|
|
—
|
|
2,478
|
|
||||||
|
Comprehensive (loss) income, net of tax
|
(305,857
|
)
|
(3,432
|
)
|
314,109
|
|
||||||
|
Comprehensive income attributable to non-controlling interests
|
(2,112
|
)
|
(2,683
|
)
|
(2,740
|
)
|
||||||
|
Comprehensive (loss) income attributable to Altisource
|
$
|
(307,969
|
)
|
$
|
(6,115
|
)
|
$
|
311,369
|
|
|||
See accompanying notes to consolidated financial statements
.
56
ALTISOURCE PORTFOLIO SOLUTIONS S.A.
Consolidated Statements of Equity
(in thousands)
|
|
Altisource Equity (Deficit)
|
|||||||||||||||||||||||||||||
|
|
Common stock
|
Additional paid-in capital
|
Retained earnings
|
Accumulated other comprehensive income (loss)
|
Treasury stock, at cost
|
Non-controlling interests
|
Total
|
|||||||||||||||||||||||
|
|
Shares
|
|||||||||||||||||||||||||||||
|
Balance, January 1, 2017
|
25,413
|
|
$
|
25,413
|
|
$
|
107,288
|
|
$
|
333,786
|
|
$
|
(1,745
|
)
|
$
|
(403,953
|
)
|
$
|
1,405
|
|
$
|
62,194
|
|
|||||||
|
Comprehensive income:
|
||||||||||||||||||||||||||||||
|
Net income
|
—
|
|
—
|
|
—
|
|
308,891
|
|
—
|
|
—
|
|
2,740
|
|
311,631
|
|
||||||||||||||
|
Other comprehensive income, net of tax
|
—
|
|
—
|
|
—
|
|
—
|
|
2,478
|
|
—
|
|
—
|
|
2,478
|
|
||||||||||||||
|
Distributions to non-controlling interest holders
|
—
|
|
—
|
|
—
|
|
—
|
|
—
|
|
—
|
|
(2,772
|
)
|
(2,772
|
)
|
||||||||||||||
|
Share-based compensation expense
|
—
|
|
—
|
|
4,255
|
|
—
|
|
—
|
|
—
|
|
—
|
|
4,255
|
|
||||||||||||||
|
Cumulative effect of an accounting change (Note 17)
|
—
|
|
—
|
|
932
|
|
(932
|
)
|
—
|
|
—
|
|
—
|
|
—
|
|
||||||||||||||
|
Exercise of stock options and issuance of restricted shares
|
—
|
|
—
|
|
—
|
|
(13,491
|
)
|
—
|
|
15,865
|
|
—
|
|
2,374
|
|
||||||||||||||
|
Treasury shares withheld for the payment of tax on restricted share issuances
|
—
|
|
—
|
|
—
|
|
(1,654
|
)
|
—
|
|
490
|
|
—
|
|
(1,164
|
)
|
||||||||||||||
|
Repurchase of shares
|
—
|
|
—
|
|
—
|
|
—
|
|
—
|
|
(39,011
|
)
|
—
|
|
(39,011
|
)
|
||||||||||||||
|
Balance, December 31, 2017
|
25,413
|
|
25,413
|
|
112,475
|
|
626,600
|
|
733
|
|
(426,609
|
)
|
1,373
|
|
339,985
|
|
||||||||||||||
|
Net loss
|
—
|
|
—
|
|
—
|
|
(5,382
|
)
|
—
|
|
—
|
|
2,683
|
|
(2,699
|
)
|
||||||||||||||
|
Distributions to non-controlling interest holders
|
—
|
|
—
|
|
—
|
|
—
|
|
—
|
|
—
|
|
(2,819
|
)
|
(2,819
|
)
|
||||||||||||||
|
Share-based compensation expense
|
—
|
|
—
|
|
10,192
|
|
—
|
|
—
|
|
—
|
|
—
|
|
10,192
|
|
||||||||||||||
|
Cumulative effect of accounting changes (Notes 5 and 18)
|
—
|
|
—
|
|
—
|
|
(9,715
|
)
|
(733
|
)
|
—
|
|
—
|
|
(10,448
|
)
|
||||||||||||||
|
Exercise of stock options and issuance of restricted shares
|
—
|
|
—
|
|
—
|
|
(19,245
|
)
|
—
|
|
22,889
|
|
—
|
|
3,644
|
|
||||||||||||||
|
Treasury shares withheld for the payment of tax on restricted share issuances and stock option exercises
|
—
|
|
—
|
|
—
|
|
(1,603
|
)
|
—
|
|
778
|
|
—
|
|
(825
|
)
|
||||||||||||||
|
Repurchase of shares
|
—
|
|
—
|
|
—
|
|
—
|
|
—
|
|
(40,362
|
)
|
—
|
|
(40,362
|
)
|
||||||||||||||
|
Balance, December 31, 2018
|
25,413
|
|
25,413
|
|
122,667
|
|
590,655
|
|
—
|
|
(443,304
|
)
|
1,237
|
|
296,668
|
|
||||||||||||||
|
Net loss
|
—
|
|
—
|
|
—
|
|
(307,969
|
)
|
—
|
|
—
|
|
2,112
|
|
(305,857
|
)
|
||||||||||||||
|
Distributions to non-controlling interest holders
|
—
|
|
—
|
|
—
|
|
—
|
|
—
|
|
—
|
|
(2,752
|
)
|
(2,752
|
)
|
||||||||||||||
|
Share-based compensation expense
|
—
|
|
—
|
|
11,002
|
|
—
|
|
—
|
|
—
|
|
872
|
|
11,874
|
|
||||||||||||||
|
Exercise of stock options and issuance of restricted share units and restricted shares
|
—
|
|
—
|
|
—
|
|
(7,222
|
)
|
—
|
|
7,622
|
|
—
|
|
400
|
|
||||||||||||||
|
Treasury shares withheld for the payment of tax on restricted share unit and restricted share issuances and stock option exercises
|
—
|
|
—
|
|
—
|
|
(3,438
|
)
|
—
|
|
1,743
|
|
—
|
|
(1,695
|
)
|
||||||||||||||
|
Repurchase of shares
|
—
|
|
—
|
|
—
|
|
—
|
|
—
|
|
(19,995
|
)
|
—
|
|
(19,995
|
)
|
||||||||||||||
|
Balance, December 31, 2019
|
25,413
|
|
$
|
25,413
|
|
$
|
133,669
|
|
$
|
272,026
|
|
$
|
—
|
|
$
|
(453,934
|
)
|
$
|
1,469
|
|
$
|
(21,357
|
)
|
|||||||
See accompanying notes to consolidated financial statements
.
57
ALTISOURCE PORTFOLIO SOLUTIONS S.A.
Consolidated Statements of Cash Flows
(in thousands)
|
For the years ended December 31,
|
|||||||||||
|
2019
|
2018
|
2017
|
|||||||||
|
Cash flows from operating activities:
|
|
|
|
|
|||||||
|
Net (loss) income
|
$
|
(305,857
|
)
|
$
|
(2,699
|
)
|
$
|
311,631
|
|
||
|
Adjustments to reconcile net (loss) income to net cash provided by operating activities:
|
|
|
|
|
|||||||
|
Depreciation and amortization
|
18,509
|
|
30,799
|
|
36,447
|
|
|||||
|
Amortization of right-of-use assets under operating leases
|
11,769
|
|
—
|
|
—
|
|
|||||
|
Amortization of intangible assets
|
19,021
|
|
28,412
|
|
35,367
|
|
|||||
|
Unrealized (gain) loss on investment in equity securities
|
(14,431
|
)
|
12,972
|
|
—
|
|
|||||
|
Change in the fair value of acquisition related contingent consideration
|
—
|
|
—
|
|
24
|
|
|||||
|
Goodwill and intangible assets write-off from business exits (Note 11)
|
5,900
|
|
2,640
|
|
—
|
|
|||||
|
Share-based compensation expense
|
11,874
|
|
10,192
|
|
4,255
|
|
|||||
|
Bad debt expense
|
720
|
|
2,830
|
|
5,116
|
|
|||||
|
Gain on early extinguishment of debt
|
—
|
|
—
|
|
(5,637
|
)
|
|||||
|
Amortization of debt discount
|
666
|
|
717
|
|
301
|
|
|||||
|
Amortization of debt issuance costs
|
736
|
|
965
|
|
833
|
|
|||||
|
Deferred income taxes
|
307,339
|
|
(5,791
|
)
|
(297,336
|
)
|
|||||
|
Loss on disposal of fixed assets
|
750
|
|
727
|
|
2,768
|
|
|||||
|
Gain on sale of businesses (Note 4)
|
(17,814
|
)
|
(13,688
|
)
|
—
|
|
|||||
|
Loss on debt refinancing (Note 14)
|
—
|
|
4,434
|
|
—
|
|
|||||
|
Changes in operating assets and liabilities (excludes effect of sale of businesses):
|
|
|
|
|
|||||||
|
Accounts receivable
|
(12,207
|
)
|
14,556
|
|
29,965
|
|
|||||
|
Short-term investments in real estate
|
39,873
|
|
(10,468
|
)
|
(16,380
|
)
|
|||||
|
Prepaid expenses and other current assets
|
13,628
|
|
4,617
|
|
(5,754
|
)
|
|||||
|
Other assets
|
(132
|
)
|
2,278
|
|
770
|
|
|||||
|
Accounts payable and accrued expenses
|
(16,257
|
)
|
1,651
|
|
2,576
|
|
|||||
|
Current and non-current operating lease liabilities
|
(12,738
|
)
|
—
|
|
—
|
|
|||||
|
Other current and non-current liabilities
|
(4,661
|
)
|
(16,742
|
)
|
(38,864
|
)
|
|||||
|
Net cash provided by operating activities
|
46,688
|
|
68,402
|
|
66,082
|
|
|||||
|
Cash flows from investing activities:
|
|
|
|
|
|||||||
|
Additions to premises and equipment
|
(2,161
|
)
|
(3,916
|
)
|
(10,514
|
)
|
|||||
|
Proceeds from the sale of businesses (Note 4)
|
38,632
|
|
15,000
|
|
—
|
|
|||||
|
Proceeds received from sale of equity securities
|
7,994
|
|
—
|
|
—
|
|
|||||
|
Other investing activities
|
422
|
|
—
|
|
188
|
|
|||||
|
Net cash provided by (used in) investing activities
|
44,887
|
|
11,084
|
|
(10,326
|
)
|
|||||
|
Cash flows from financing activities:
|
|
|
|
|
|||||||
|
Proceeds from issuance of long-term debt
|
—
|
|
407,880
|
|
—
|
|
|||||
|
Repayments and repurchases of long-term debt
|
(44,996
|
)
|
(486,759
|
)
|
(59,761
|
)
|
|||||
|
Debt issuance costs
|
—
|
|
(5,042
|
)
|
—
|
|
|||||
|
Proceeds from stock option exercises
|
400
|
|
3,644
|
|
2,374
|
|
|||||
|
Purchase of treasury shares
|
(19,995
|
)
|
(40,362
|
)
|
(39,011
|
)
|
|||||
|
Distributions to non-controlling interests
|
(2,752
|
)
|
(2,819
|
)
|
(2,772
|
)
|
|||||
|
Payments of tax withholding on issuance of restricted share units and restricted shares
|
(1,695
|
)
|
(825
|
)
|
(1,164
|
)
|
|||||
|
Net cash used in financing activities
|
(69,038
|
)
|
(124,283
|
)
|
(100,334
|
)
|
|||||
|
Net increase (decrease) in cash, cash equivalents and restricted cash
|
22,537
|
|
(44,797
|
)
|
(44,578
|
)
|
|||||
|
Cash, cash equivalents and restricted cash at the beginning of the period
|
64,046
|
|
108,843
|
|
153,421
|
|
|||||
|
Cash, cash equivalents and restricted cash at the end of the period
|
$
|
86,583
|
|
$
|
64,046
|
|
$
|
108,843
|
|
||
|
Supplemental cash flow information:
|
|
|
|
|
|||||||
|
Interest paid
|
$
|
20,856
|
|
$
|
24,123
|
|
$
|
21,210
|
|
||
|
Income taxes paid, net
|
2,688
|
|
7,136
|
|
18,332
|
|
|||||
|
Acquisition of right-of-use assets with operating lease liabilities
|
13,775
|
|
—
|
|
—
|
|
|||||
|
Reduction of right-of-use assets from operating lease modifications or reassessments
|
(5,844
|
)
|
—
|
|
—
|
|
|||||
|
Non-cash investing and financing activities:
|
|
|
|
|
|||||||
|
Net decrease in payables for purchases of premises and equipment
|
$
|
(101
|
)
|
$
|
(32
|
)
|
$
|
(1,311
|
)
|
||
See accompanying notes to consolidated financial statements.
58
NOTE 1
—
ORGANIZATION
Description of Business
Altisource Portfolio Solutions S.A., together with its subsidiaries (which may be referred to as “Altisource,” the “Company,” “we,” “us” or “our”), is an integrated service provider and marketplace for the real estate and mortgage industries. Combining operational excellence with a suite of innovative services and technologies, Altisource helps solve the demands of the ever-changing markets we serve.
Effective January 1, 2019, the Company reorganized its internal reporting structure in connection with Project Catalyst, a project initiated in August 2018 to optimize our operations and reduce costs to better align our cost structure with our anticipated revenues and improve our operating margins (see Note 24). The internal reorganization included, among other changes, the replacement of segment presidents with a chief operating officer, who is responsible for products, services and operations for the Company’s Mortgage Market and Real Estate Market businesses, reporting to our Chairman and Chief Executive Officer (our chief operating decision maker) who manages our businesses, regularly reviews operating results and profitability, allocates resources and evaluates performance on a consolidated basis. Prior to January 1, 2019, the Company reported our operations through
two
reportable segments:
Mortgage Market
and
Real Estate Market
. In addition, we reported
Other Businesses, Corporate and Eliminations
separately. The prior years’ presentation has been reclassified to conform to the current year presentation.
NOTE 2
—
BASIS OF PRESENTATION AND SUMMARY OF SIGNIFICANT ACCOUNTING POLICIES
Basis of Accounting and Presentation
The consolidated financial statements are prepared in accordance with accounting principles generally accepted in the United States of America (“GAAP”). Intercompany transactions and accounts have been eliminated in consolidation.
Principles of Consolidation
The financial statements include the accounts of the Company, its wholly-owned subsidiaries and those entities in which we have a variable interest and are the primary beneficiary.
Altisource consolidates Best Partners Mortgage Cooperative, Inc., which is managed by The Mortgage Partnership of America, L.L.C. (“MPA”), a wholly-owned subsidiary of Altisource. Best Partners Mortgage Cooperative, Inc. is a mortgage cooperative doing business as Lenders One
®
(“Lenders One”). MPA provides services to Lenders One under a management agreement that ends on December 31, 2025 (with renewals for
three
successive
five
-year periods at MPA’s option).
The management agreement between MPA and Lenders One, pursuant to which MPA is the management company, represents a variable interest in a variable interest entity. MPA is the primary beneficiary of Lenders One as it has the power to direct the activities that most significantly impact the cooperative’s economic performance and the right to receive benefits from the cooperative. As a result, Lenders One is presented in the accompanying consolidated financial statements on a consolidated basis and the interests of the members are reflected as non-controlling interests. As of
December 31, 2019
, Lenders One had total assets of
$1.6 million
and total liabilities of
$0.3 million
. As of
December 31, 2018
, Lenders One had total assets of
$2.7 million
and total liabilities of
$1.3 million
.
In September 2019, Altisource announced the creation of Pointillist, Inc. (“Pointillist”) and contributed the Pointillist
®
customer journey analytics business and
$8.5 million
to it. Pointillist is owned by Altisource and management of Pointillist. Management of Pointillist owns a non-controlling interest representing
12.1%
of the outstanding equity of Pointillist. Altisource has no ongoing obligation to provide future funding to Pointillist. Pointillist is presented in the accompanying consolidated financial statements on a consolidated basis and the portion of Pointillist owned by Pointillist management is reported as non-controlling interests.
Use of Estimates
The preparation of financial statements in conformity with GAAP requires estimates and assumptions that affect the reported amounts of assets and liabilities, revenue and expenses and related disclosures of contingent liabilities in the consolidated financial statements and accompanying notes. Estimates are used for, but not limited to, determining share-based compensation, income taxes, collectability of receivables, valuation of acquired intangibles and goodwill, depreciable lives and valuation of fixed assets and contingencies. Actual results could differ materially from those estimates.
59
ALTISOURCE PORTFOLIO SOLUTIONS S.A.
Notes to Consolidated Financial Statements (
Continued
)
Cash and Cash Equivalents
We classify all highly liquid instruments with an original maturity of three months or less at the time of purchase as cash equivalents.
Accounts Receivable, Net
Accounts receivable are presented net of an allowance for doubtful accounts that represents an amount that we estimate to be uncollectible. We have estimated the allowance for doubtful accounts based on our historical write-offs, our analysis of past due accounts based on the contractual terms of the receivables and our assessment of the economic status of our customers, if known. The carrying value of accounts receivable, net, approximates fair value.
Premises and Equipment, Net
We report premises and equipment, net at cost or estimated fair value at acquisition for premises and equipment recorded in connection with a business combination and depreciate these assets over their estimated useful lives using the straight-line method as follows:
|
Furniture and fixtures
|
5 years
|
|
Office equipment
|
5 years
|
|
Computer hardware
|
3-5 years
|
|
Computer software
|
3-7 years
|
|
Leasehold improvements
|
Shorter of useful life, 10 years or the term of the lease
|
Maintenance and repair costs are expensed as incurred. We capitalize expenditures for significant improvements and new equipment and depreciate the assets over the shorter of the capitalized asset’s life or the life of the lease.
We review premises and equipment for impairment following events or changes in circumstances that indicate the carrying amount of an asset or asset group may not be recoverable. We measure recoverability of assets to be held and used by comparing the carrying amount of an asset or asset group to estimated undiscounted future cash flows expected to be generated by the asset or asset group. If the carrying amount of an asset or asset group exceeds its estimated future cash flows, we recognize an impairment charge for the amount that the carrying value of the asset or asset group exceeds the fair value of the asset or asset group.
Computer software includes the fair value of software acquired in business combinations, capitalized software development costs and purchased software. Capitalized software development and purchased software are recorded at cost and amortized using the straight-line method over their estimated useful lives. Software acquired in business combinations is recorded at fair value and amortized using the straight-line method over its estimated useful life.
Business Combinations
We account for acquisitions using the purchase method of accounting in accordance with Financial Accounting Standards Board (“FASB”) Accounting Standards Codification (“ASC”) Topic 805,
Business Combinations
. The purchase price of an acquisition is allocated to the assets acquired and liabilities assumed using their fair value as of the acquisition date.
Goodwill
Goodwill represents the excess cost of an acquired business over the fair value of the identifiable tangible and intangible assets acquired and liabilities assumed in a business combination. We evaluate goodwill for impairment annually during the fourth quarter or more frequently when an event occurs or circumstances change in a manner that indicates the carrying value may not be recoverable. We first assess qualitative factors to determine whether it is more likely than not that the fair value of a reporting unit is less than its carrying value as a basis for determining whether we need to perform the quantitative two-step goodwill impairment test. Only if we determine, based on qualitative assessment, that it is more likely than not that a reporting unit’s fair value is less than its carrying value will we calculate the fair value of the reporting unit. We would then test goodwill for impairment by first comparing the book value of net assets to the fair value of the reporting unit. If the fair value is determined to be less than the book value, a second step is performed to compute the amount of impairment as the difference between the estimated fair value of goodwill and the carrying value. We estimate the fair value of the reporting unit using discounted cash flows and market comparisons. The discounted cash flow method is based on the present value of projected cash flows. Forecasts of future cash flows are based on our estimate of future sales and operating expenses, based primarily on estimated pricing, sales volumes, market segment share, cost trends and general economic conditions. The estimated cash flows are discounted using a rate that represents our weighted average cost of capital. The market comparisons include an analysis of revenue and earnings multiples of guideline public companies compared to the Company.
60
ALTISOURCE PORTFOLIO SOLUTIONS S.A.
Notes to Consolidated Financial Statements (
Continued
)
Intangible Assets, Net
Identified intangible assets consist primarily of customer related intangible assets, operating agreements, trademarks and trade names and other intangible assets. Identifiable intangible assets acquired in business combinations are recorded based on their fair values at the date of acquisition. We determine the useful lives of our identifiable intangible assets after considering the specific facts and circumstances related to each intangible asset. Factors we consider when determining useful lives include the contractual term of any arrangements, the history of the asset, our long-term strategy for use of the asset and other economic factors. We amortize intangible assets that we deem to have definite lives in proportion to actual and expected customer revenues or on a straight-line basis over their useful lives, generally ranging from
4
to
20
years.
We perform tests for impairment if conditions exist that indicate the carrying value may not be recoverable. When facts and circumstances indicate that the carrying value of intangible assets determined to have definite lives may not be recoverable, management assesses the recoverability of the carrying value by preparing estimates of cash flows of discrete intangible assets generally consistent with models utilized for internal planning purposes. If the sum of the undiscounted expected future cash flows is less than the carrying value, we recognize an impairment to the extent the carrying amount exceeds fair value.
Long-Term Debt
Long-term debt is reported net of applicable discount or premium and net of debt issuance costs. The debt discount or premium and debt issuance costs are amortized to interest expense through maturity of the related debt using the effective interest method.
Fair Value Measurements
Fair value is defined as an exit price, representing the amount that would be received for an asset or paid to transfer a liability in an orderly transaction between market participants at the measurement date. The three-tier hierarchy for inputs used in measuring fair value, which prioritizes the inputs used in the methodologies of measuring fair value for assets and liabilities, is as follows:
Level 1
—
Quoted prices in active markets for identical assets and liabilities
Level 2
—
Observable inputs other than quoted prices included in Level 1
Level 3
—
Unobservable inputs that are supported by little or no market activity and that are significant to the fair value of assets or liabilities.
Financial assets and financial liabilities are classified based on the lowest level of input that is significant to the fair value measurements. Our assessment of the significance of a particular input to the fair value measurements requires judgment and may affect the valuation of the assets and liabilities being measured and their placement within the fair value hierarchy.
Functional Currency
The currency of the primary economic environment in which our operations are conducted is the United States dollar. Therefore, the United States dollar has been determined to be our functional and reporting currency. Non-United States dollar transactions and balances have been measured in United States dollars in accordance with ASC Topic 830,
Foreign Currency Matters
. All transaction gains and losses from the measurement of monetary balance sheet items denominated in non-United States dollar currencies are reflected in the consolidated statements of operations and comprehensive income (loss) as income or expenses, as appropriate.
Defined Contribution 401(k) Plan
Some of our employees currently participate in a defined contribution 401(k) plan under which we may make matching contributions equal to a discretionary percentage determined by us. We recorded expenses of
$0.9 million
,
$1.2 million
and
$1.2 million
for the years ended December 31, 2019, 2018 and 2017, respectively, related to our discretionary contributions.
61
ALTISOURCE PORTFOLIO SOLUTIONS S.A.
Notes to Consolidated Financial Statements (
Continued
)
Revenue Recognition
We recognize revenue when we satisfy a performance obligation by transferring control of a product or service to a customer in an amount that reflects the consideration that we expect to receive. This revenue can be recognized at a point in time or over time. We invoice customers based on our contractual arrangements with each customer, which may not be consistent with the period that revenues are recognized. When there is a timing difference between when we invoice customers and when revenues are recognized, we record either a contract asset (unbilled accounts receivable) or a contract liability (deferred revenue or other current liabilities), as appropriate. Descriptions of our principal revenue generating activities are as follows:
Core Businesses
Field Services
|
•
|
For property preservation and inspection services and payment management technologies, we recognize transactional revenue when the service is provided.
|
|
•
|
For vendor management transactions and our vendor management oversight software-as-a-service (“SaaS”) platform, we recognize revenue over the period during which we perform the services.
|
|
•
|
Reimbursable expenses revenue related to our property preservation and inspection services is included in revenue with an equal amount recognized in cost of revenue. These amounts are recognized on a gross basis, principally because generally we have control over selection of vendors and the vendor relationships are with us, rather than with our customers.
|
Marketplace
|
•
|
For the real estate auction platform, real estate auction and real estate brokerage services, we recognize revenue on a net basis (i.e., the commission on the sale) as we perform services as an agent without assuming the risks and rewards of ownership of the asset and the commission earned on the sale is a fixed percentage or amount.
|
|
•
|
For SaaS based technology to manage real estate owned (“REO”), short sales, foreclosure, bankruptcy and eviction processes, we recognize revenue over the estimated average number of months the REO are on the platform. We generally recognize revenue for professional services over the contract period.
|
|
•
|
Reimbursable expenses revenue related to our real estate sales is included in revenue with an equal amount recognized in cost of revenue. These amounts are recognized on a gross basis, principally because generally we have control over selection of vendors and the vendor relationships are with us, rather than with our customers.
|
Mortgage and Real Estate Solutions
|
•
|
For the majority of the services we provide, we recognize transactional revenue when the service is provided.
|
|
•
|
For loan disbursement processing services, we recognize revenue over the period during which we perform the processing services with full recognition upon completion of the disbursements. For foreclosure trustee services, we recognize revenue over the period during which we perform the related services, with full recognition upon completion and/or recording the related foreclosure deed. We use judgment to determine the period over which we recognize revenue for certain of these services.
|
|
•
|
Reimbursable expenses revenue related to our title and foreclosure trustee services businesses is included in revenue with an equal amount recognized in cost of revenue. These amounts are recognized on a gross basis, principally because generally we have control over selection of vendors and the vendor relationships are with us, rather than with our customers.
|
Other Businesses
Earlier Stage Business
|
•
|
For our customer journey analytics platform, we recognize revenue primarily based on subscription fees. We recognize revenue associated with implementation services and maintenance services ratably over the contract term.
|
Other
|
•
|
For our Financial Services business (sold on July 1, 2019, see Note 4), we generally earned fees for our post-charge-off consumer debt collection services as a percentage of the amount we collected on delinquent consumer receivables and recognized revenue following collection from the borrowers. For mortgage charge-off collections performed on behalf of our clients, we recognized revenue as a percentage of amounts collected following collection from the borrowers. We provided customer relationship management services for which we typically earned and recognized revenue on a per-person, per-call or per-minute basis as the related services were performed.
|
|
•
|
For loan servicing technologies, we recognized revenue based on the number of loans on the system. We generally recognized revenue from professional services over the contract period.
|
62
ALTISOURCE PORTFOLIO SOLUTIONS S.A.
Notes to Consolidated Financial Statements (
Continued
)
|
•
|
For short-term investments in real estate (wind down completed in 2019, see
Note 8
), we recognized revenue associated with our sales of short-term investments in real estate on a gross basis (i.e., the selling price of the property) as we assumed the risks and rewards of ownership of the asset.
|
|
•
|
For our consumer real estate brokerage (discontinued in the fourth quarter of 2019, see
Note 8
), we recognized revenue on a net basis (i.e., the commission on the sale) as we performed services as an agent without assuming the risks and rewards of ownership of the asset and the commission earned on the sale was a fixed percentage or amount.
|
Share-Based Compensation
Share-based compensation is accounted for under the provisions of ASC Topic 718,
Compensation - Stock Compensation
(“ASC Topic 718”). Under ASC Topic 718, the cost of services received in exchange for an award of equity instruments is generally measured based on the grant date fair value of the award. Share-based awards that do not require future service are expensed immediately. Share-based awards that require future service are recognized over the relevant service period. The Company has made an accounting policy election to account for forfeitures in compensation expense as they occur.
Income Taxes
We record income taxes in accordance with ASC Topic 740,
Income Taxes
(“ASC Topic 740”). We account for certain income and expense items differently for financial reporting purposes and income tax purposes. We recognize deferred income tax assets and liabilities for these differences between the financial reporting basis and the tax basis of our assets and liabilities as well as expected benefits of utilizing net operating loss and credit carryforwards. The most significant temporary differences relate to accrued compensation, amortization, loss carryforwards and valuation allowances. We measure deferred income tax assets and liabilities using enacted tax rates expected to apply to taxable income in the years in which we anticipate recovery or settlement of those temporary differences. The effect on deferred tax assets and liabilities of a change in tax rates is recognized in income in the period when the change is enacted. Deferred tax assets are reduced by a valuation allowance when it is more likely than not that some portion or all of the deferred tax assets will not be realized.
Tax laws are complex and subject to different interpretations by the taxpayer and respective governmental taxing authorities. Significant judgment is required in determining tax expense and in evaluating tax positions including evaluating uncertainties under ASC Topic 740. We recognize tax benefits from uncertain tax positions only if it is more likely than not that the tax position will be sustained on examination by the taxing authorities based on the technical merits of the position. The tax benefits recognized in the financial statements from such positions are then measured based on the largest benefit that has a greater than 50% likelihood of being realized upon ultimate settlement. Resolution of these uncertainties in a manner inconsistent with management’s expectations could have a material impact on our results of operations.
Earnings Per Share
We compute earnings per share in accordance with ASC Topic 260,
Earnings Per Share
. Basic net income per share is computed by dividing net income attributable to Altisource by the weighted average number of shares of common stock outstanding for the period. Diluted net income per share reflects the assumed conversion of all dilutive securities using the treasury stock method.
Recently Adopted Accounting Pronouncements
In February 2016, the FASB issued Accounting Standards Update (“ASU”) No. 2016-02,
Leases (Topic 842)
and in July 2018, the FASB issued ASU No. 2018-10,
Codification Improvements to Topic 842, Leases
and ASU No. 2018-11,
Leases (Topic 842): Targeted Improvements
(collectively “Topic 842”). Topic 842 introduces a new lessee model that brings substantially all leases on the balance sheet. This standard requires lessees to recognize lease assets and lease liabilities on their balance sheets and disclose key information about leasing arrangements in their financial statements. The Company adopted Topic 842 effective January 1, 2019 using the modified retrospective transition approach. In addition, the Company elected the practical expedients permitted under the transition guidance within the new standard, including allowing the Company to carry forward its historical lease classification, using hindsight to determine the lease term for existing leases, combining fixed lease and non-lease components and excluding short-term leases. Adoption of this new standard resulted in the recognition of
$42.1 million
of right-of-use assets in right-of-use assets under operating leases,
$45.5 million
of operating lease liabilities (
$16.7 million
in other current liabilities and
$28.8 million
in other non-current liabilities) and reduced accrued rent and lease incentives of
$3.4 million
in accounts payable and accrued expenses and other non-current liabilities on the accompanying consolidated balance sheets.
Future Adoption of New Accounting Pronouncements
In January 2017, the FASB issued ASU No. 2017-04,
Intangibles-Goodwill and Other (Topic 350): Simplifying the Test for Goodwill Impairment.
This standard will simplify the subsequent measurement of goodwill by eliminating Step 2 from the goodwill
63
ALTISOURCE PORTFOLIO SOLUTIONS S.A.
Notes to Consolidated Financial Statements (
Continued
)
impairment test. Current guidance requires that companies compute the implied fair value of goodwill under Step 2 by performing procedures to determine the fair value at the impairment testing date of its assets and liabilities (including unrecognized assets and liabilities) following the procedure that would be required in determining the fair value of assets acquired and liabilities assumed in a business combination. This standard will require companies to perform annual or interim goodwill impairment tests by comparing the fair value of a reporting unit with its carrying amount. An entity should recognize an impairment charge for the amount by which the carrying amount exceeds the reporting unit’s fair value; however, the loss recognized should not exceed the total amount of goodwill allocated to that reporting unit. This standard will be effective for annual periods beginning after December 15, 2019, including interim periods within that reporting period, and will be applied prospectively. Early adoption of this standard is permitted. The Company currently does not expect the adoption of this guidance to have an impact on its consolidated financial statements. Furthermore, adoption of this standard as of December 31, 2019 would not have had any impact on the Company’s consolidated financial statements.
In August 2018, the FASB issued ASU No. 2018-13,
Fair Value Measurement (Topic 820): Disclosure Framework—Changes to the Disclosure Requirements for Fair Value Measurement
. This standard modifies certain disclosure requirements such as the valuation processes for Level 3 fair value measurements. This standard also requires new disclosures such as the disclosure of certain assumptions used to develop significant unobservable inputs for Level 3 fair value measurements. This standard will be effective for annual periods beginning after December 15, 2019, including interim periods within that reporting period. Early adoption of either the entire standard or only the provisions that eliminate or modify requirements is permitted. The Company currently does not expect the adoption of this guidance to have an impact on its consolidated financial statements.
In August 2018, the FASB issued ASU No. 2018-15,
Intangibles—Goodwill and Other—Internal-Use Software (Subtopic 350-40): Customer’s Accounting for Implementation Costs Incurred in a Cloud Computing Arrangement That Is a Service Contract (a consensus of the FASB Emerging Issues Task Force)
. This standard aligns the requirements for capitalizing implementation costs in a hosting arrangement service contract with the existing guidance for capitalizing implementation costs incurred for an internal-use software license. This standard also requires capitalizing or expensing implementation costs based on the nature of the costs and the project stage during which they are incurred and establishes additional disclosure requirements. This standard will be effective for annual periods beginning after December 15, 2019, including interim periods within that reporting period. Early adoption of this standard is permitted. The Company currently plans to adopt the standard prospectively and is currently evaluating the impact this guidance may have on its consolidated financial statements.
In December 2019, the FASB issued ASU No. 2019-12,
Income Taxes (Topic 740): Simplifying the Accounting for Income Taxes
. This standard is part of the FASB’s initiative to reduce complexity in accounting standards by instituting several simplifying provisions and removing several exceptions pertaining to income tax accounting. This standard will be effective for annual periods beginning after December 15, 2020, including interim periods within that reporting period. Early adoption of this standard is permitted. The Company is currently evaluating the impact this guidance may have on its consolidated financial statements.
NOTE 3
—
CUSTOMER CONCENTRATION
Ocwen
Ocwen Financial Corporation (together with its subsidiaries, “Ocwen”) is a residential mortgage loan servicer of mortgage servicing rights (“MSRs”) it owns, including those MSRs in which others have an economic interest, and a subservicer of MSRs owned by others.
During the year ended December 31, 2019, Ocwen was our largest customer, accounting for
56%
of our total revenue. Ocwen purchases certain mortgage services from us under the terms of services agreements and amendments thereto (collectively, the “Ocwen Services Agreements”) with terms extending through August 2025. Certain of the Ocwen Services Agreements contain a “most favored nation” provision and also grant the parties the right to renegotiate pricing, among other things.
In February 2019, Altisource and Ocwen entered into agreements that, among other things, facilitate Ocwen’s transition from REALServicing and related technologies to another mortgage servicing software platform, establish a process for Ocwen to review and approve the assignment of one or more of our agreements to potential buyers of Altisource’s business lines, requiring Ocwen to use Altisource as service provider for certain service referrals totaling an amount equal to 100% of the applicable service referrals on certain portfolios plus an amount equal to not less than 90% of applicable service referrals from certain other portfolios (determined on a service by service basis), subject to certain additional restrictions and limitations, and affirm Altisource’s role as a strategic service provider to Ocwen through August 2025. In connection with these agreements, Altisource expressly preserved and did not waive any of its existing contractual rights relating to service referrals, other than with respect to Ocwen transitioning from the REALServicing and related technologies. If Altisource fails certain performance standards for specified periods of time, then Ocwen may terminate Altisource as a provider for the applicable service(s), subject to certain limitations and Altisource’s right to cure. Ocwen’s transition to another mortgage servicing platform was completed during 2019. We are not experiencing a
64
ALTISOURCE PORTFOLIO SOLUTIONS S.A.
Notes to Consolidated Financial Statements (
Continued
)
significant impact of the servicing technology transition on the other services we provide to Ocwen, other than what we believe is a temporary impact on default related referral volume and REO inventory conversion rates from Ocwen’s transition to another servicing system. We believe the REO conversion rates will return to historical levels during the first half of 2020. For the years ended
December 31, 2019
,
2018
and
2017
, service revenue from REALServicing and related technologies was
$14.1 million
,
$35.1 million
and
$37.2 million
, respectively.
Revenue from Ocwen primarily consists of revenue earned from the loan portfolios serviced and subserviced by Ocwen when Ocwen engages us as the service provider, and revenue earned directly from Ocwen, pursuant to the Ocwen Services Agreements. For the years ended
December 31, 2019
,
2018
and
2017
, we recognized revenue from Ocwen of
$362.7 million
,
$437.4 million
and
$542.0 million
, respectively. Revenue from Ocwen as a percentage of consolidated revenue was
56%
,
52%
and
58%
for the years ended
December 31, 2019
,
2018
and
2017
, respectively.
We earn additional revenue related to the portfolios serviced and subserviced by Ocwen when a party other than Ocwen or the MSR owner selects Altisource as the service provider. For the years ended
December 31, 2019
,
2018
and
2017
, we recognized revenue of
$37.5 million
,
$47.1 million
and
$148.5 million
, respectively, related to the portfolios serviced by Ocwen when a party other than Ocwen or the MSR owner selected Altisource as the service provider. These amounts are not included in deriving revenue from Ocwen and revenue from Ocwen as a percentage of revenue discussed above.
As of
December 31, 2019
, accounts receivable from Ocwen totaled
$19.1 million
,
$15.7 million
of which was billed and
$3.4 million
of which was unbilled. As of
December 31, 2018
, accounts receivable from Ocwen totaled
$15.2 million
,
$11.6 million
of which was billed and
$3.6 million
of which was unbilled.
NRZ
New Residential Investment Corp. (individually, together with one or more of its subsidiaries or one or more of its subsidiaries individually, “NRZ”) is a real estate investment trust that invests in and manages investments primarily related to residential real estate, including MSRs and excess MSRs.
Ocwen has disclosed that NRZ is its largest client. As of December 31, 2019, NRZ owned MSRs or rights to MSRs relating to approximately
56%
of loans serviced and subserviced by Ocwen (measured in unpaid principal balance (“UPB”)). In July 2017 and January 2018, Ocwen and NRZ entered into a series of agreements pursuant to which the parties agreed, among other things, to undertake certain actions to facilitate the transfer from Ocwen to NRZ of Ocwen’s legal title to certain of its MSRs (the “Subject MSRs”) and under which Ocwen will subservice mortgage loans underlying the MSRs for an initial term of
five
years.
On August 28, 2017, Altisource, through its licensed subsidiaries, entered into a Cooperative Brokerage Agreement, as amended, and related letter agreement (collectively, the “Brokerage Agreement”) with NRZ which extends through August 2025. Under this agreement and related amendments, Altisource remains the exclusive provider of brokerage services for REO associated with the Subject MSRs, irrespective of the subservicer, subject to certain limitations. NRZ’s brokerage subsidiary receives a cooperative brokerage commission on the sale of REO properties from these portfolios subject to certain exceptions.
The Brokerage Agreement can, at Altisource’s discretion, be terminated by Altisource if a services agreement is not signed by Altisource and NRZ. A services agreement has not been signed. The parties continue to operate under the Brokerage Agreement. The Brokerage Agreement may otherwise only be terminated upon the occurrence of certain specified events. Termination events include, but are not limited to, a breach of the terms of the Brokerage Agreement (including, without limitation, the failure to meet performance standards and non-compliance with law in a material respect), the failure to maintain licenses which failure materially prevents performance of the contract, regulatory allegations of non-compliance resulting in an adversarial proceeding against NRZ, voluntary or involuntary bankruptcy, appointment of a receiver, disclosure in a Form 10-K or Form 10-Q that there is significant uncertainty about Altisource’s ability to continue as a going concern, failure to maintain a specified level of cash and an unapproved change of control.
For the years ended
December 31, 2019
,
2018
and
2017
, we recognized revenue from NRZ of
$12.5 million
,
$28.7 million
and
$2.4 million
, respectively, under the Brokerage Agreement. For the years ended
December 31, 2019
,
2018
and
2017
, we recognized additional revenue of
$60.0 million
,
$83.6 million
and
$3.9 million
, respectively, relating to the Subject MSRs when a party other than NRZ selects Altisource as the service provider.
NOTE 4
—
SALE OF BUSINESSES
Financial Services Business
On July 1, 2019, Altisource sold its Financial Services business, consisting of its post-charge-off consumer debt and mortgage charge-off collection services and customer relationship management services (the “Financial Services Business”) to Transworld
65
ALTISOURCE PORTFOLIO SOLUTIONS S.A.
Notes to Consolidated Financial Statements (
Continued
)
Systems Inc. (“TSI”) for
$44.0 million
consisting of an up-front payment of
$40.0 million
, subject to a working capital adjustment (finalized during 2019) and transaction costs upon closing of the sale, and an additional
$4.0 million
payment on the one year anniversary of the sale closing. In connection with the sale, we recognized a
$17.8 million
pretax gain on sale for the year ended
December 31, 2019
. The parties also entered into a transition services agreement to provide for the management and orderly transition of certain services and technologies to TSI for periods ranging from
2 months
to
13 months
. These services include support for information technology systems and infrastructure, facilities management, finance, compliance and human resources functions and are charged to TSI on a fixed fee or hourly basis. On July 17, 2019, Altisource used
$37.0 million
of the net up-front payment to repay a portion of its senior secured term loan.
Rental Property Management Business
In August 2018, Altisource entered into an amendment to its agreements with Front Yard Residential Corporation (“RESI”) to sell Altisource’s rental property management business to RESI and permit RESI to internalize certain services that had been provided by Altisource. These services were historically provided under an agreement between RESI and Altisource, in which Altisource was the sole provider of rental property management services to RESI through December 2027, subject to certain exceptions. The proceeds from the transaction totaled
$18.0 million
, payable in
two
installments. The first installment of
$15.0 million
was received on the closing date of August 8, 2018. The second installment of
$3.0 million
will be received on the earlier of a RESI change of control or on August 8, 2023 (see Note 5 for a discussion of the February 17, 2020 RESI merger and resulting potential change of control of RESI). The present value of the second installment is included in other assets in the accompanying consolidated balance sheets and has a discounted value of
$2.4 million
and
$2.2 million
as of
December 31, 2019
and December 31, 2018, respectively. In connection with the sale of the rental property management business, the Company recognized a pretax gain of
$13.7 million
for the year ended December 31, 2018 in the accompanying consolidated statements of operations and comprehensive income (loss).
NOTE 5
—
INVESTMENT IN EQUITY SECURITIES
During
2016
, we purchased
4.1 million
shares of RESI common stock. This investment is reflected in the accompanying consolidated balance sheets at fair value and changes in fair value are included in other income (expense), net in the accompanying consolidated statements of operations and comprehensive income (loss). As of
December 31, 2019
and
2018
, we held
3.5 million
and
4.1 million
shares, respectively, of RESI common stock. As of
December 31, 2019
and
2018
, the fair value of our investment was
$42.6 million
and
$36.2 million
, respectively. During the years ended
December 31, 2019
and
2018
, we recognized an unrealized gain (loss) from the change in fair value of
$14.4 million
and
$(13.0) million
, respectively, in the consolidated statements of operations and comprehensive income (loss). During the year ended December 31, 2017, we recognized an unrealized gain on our investment in RESI of
$2.5 million
, net of income tax provision, in other comprehensive income in the consolidated statements of operations and comprehensive income (loss).
In January 2016, the FASB issued ASU No. 2016-01,
Financial Instruments - Overall (Subtopic 825-10): Recognition and Measurement of Financial Assets and Financial Liabilities
, that required equity investments (except those accounted for under the equity method of accounting or those that result in consolidation of the investee) to be measured at fair value with changes in fair value recognized in net income. This standard was effective for the Company on January 1, 2018. The adoption of this standard resulted in a cumulative effect adjustment to increase retained earnings and decrease accumulated other comprehensive income by
$0.7 million
, net of income tax provision, on January 1, 2018.
The unrealized gain for year ended
December 31, 2019
included a
$2.0 million
net gain, recognized on RESI shares sold during the period. During the years ended
December 31, 2019
,
2018
and
2017
, we earned dividends of
$1.7 million
,
$2.5 million
and
$2.5 million
, respectively, related to this investment.
Pursuant to the agreement between Altisource and RESI to sell the rental property management business to RESI (see
Note 4
for additional information), Altisource was subject to a lock-up period with respect to the sale or transfer of the shares of common stock of RESI owned by Altisource (the “Shares”) through
December 31, 2018
. In addition, during each quarter of 2019, Altisource was permitted to sell or transfer no more than
25%
of the Shares, subject to certain exceptions. In May 2019, the Company began selling its investment in RESI common stock. During the year ended
December 31, 2019
, the Company sold
0.7 million
shares for net proceeds of
$8.0 million
. As required by our senior secured term loan agreement, the Company used the net proceeds to repay a portion of its senior secured term loan.
On February 17, 2020, RESI entered into a merger agreement to be acquired by affiliates of Amherst Single Family Residential Partners VI, LP (“Amherst”) for
$12.50
in cash per share. Also on February 17, 2020, the Company entered into a Voting and Support Agreement with an affiliate of Amherst pursuant to which the Company agreed, among other things and subject to the terms and conditions of the Voting and Support Agreement, to vote its shares in favor of the merger. Concurrently with the execution of the Voting and Support Agreement, the Company entered into a side letter with RESI pursuant to which RESI agreed, among
66
ALTISOURCE PORTFOLIO SOLUTIONS S.A.
Notes to Consolidated Financial Statements (
Continued
)
other things and subject to the terms and conditions of the side letter, to reimburse the Company for: (a) certain out-of-pocket legal fees and legal expenses should the Company or its officers, directors, employees or other representatives (collectively, the “Indemnified Parties”) incur such costs or expenses in connection with any stockholder’s claims or proceedings against RESI or derivatively on behalf of RESI, in which the Indemnified Parties or their representatives are named parties, with respect to any of the merger agreement, the Voting and Support Agreement, the merger or other transactions contemplated thereby; and (b) any amounts for which the Indemnified Parties are found liable or are required to pay pursuant to any settlement or other voluntary disposition with respect to any such proceeding.
NOTE 6
—
ACCOUNTS RECEIVABLE, NET
Accounts receivable, net consists of the following as of December 31:
|
(in thousands)
|
2019
|
2018
|
||||||
|
Billed
|
$
|
35,921
|
|
$
|
35,590
|
|
||
|
Unbilled
|
12,166
|
|
11,759
|
|
||||
|
48,087
|
|
47,349
|
|
|||||
|
Less: Allowance for doubtful accounts
|
(4,472
|
)
|
(10,883
|
)
|
||||
|
Total
|
$
|
43,615
|
|
$
|
36,466
|
|
||
Unbilled accounts receivable consist primarily of certain real estate asset management, REO sales, title and closing services for which we generally recognize revenue when the service is provided but collect upon closing of the sale, and foreclosure trustee services, for which we generally recognize revenues over the service delivery period but bill following completion of the service. We also include amounts in unbilled accounts receivable that are earned during a month and billed in the following month.
Bad debt expense amounted to
$0.7 million
,
$2.8 million
and
$5.1 million
for the years ended
December 31, 2019
,
2018
and
2017
, respectively, and is included in selling, general and administrative expenses in the consolidated statements of operations and comprehensive income (loss).
NOTE 7
—
PREPAID EXPENSES AND OTHER CURRENT ASSETS
Prepaid expenses and other current assets consist of the following as of
December 31
:
|
(in thousands)
|
2019
|
2018
|
||||||
|
Maintenance agreements, current portion
|
$
|
1,923
|
|
$
|
5,600
|
|
||
|
Income taxes receivable
|
5,098
|
|
7,940
|
|
||||
|
Prepaid expenses
|
3,924
|
|
7,484
|
|
||||
|
Other current assets
|
4,269
|
|
9,696
|
|
||||
|
Total
|
$
|
15,214
|
|
$
|
30,720
|
|
||
NOTE 8
—
DISCONTINUATION OF LINES OF BUSINESS
Owners.com
In October 2019, the Company announced its plans to wind down and close the Owners.com business, which was completed by December 31, 2019. Owners.com was a technology-enabled real estate brokerage and provider of related mortgage brokerage and title services. Owners.com was not material in relation to the Company’s results of operations or financial position. In connection with the wind down of Owners.com, the Company wrote off
$5.2 million
of goodwill and
$0.7 million
of intangible assets (see
Note 11
). In addition, wind down expenses were included in the Project Catalyst restructuring charges (see Note 24).
Buy-Renovate-Lease-Sell
On November 26, 2018, the Company announced its plans to sell its short-term investments in real estate (“BRS Inventory”) and discontinue the Company’s Buy-Renovate-Lease-Sell (“BRS”) business. Altisource’s BRS business focused on buying, renovating, leasing and selling single-family homes to real estate investors. The BRS business was not material in relation to the Company’s results of operations or financial position. In anticipation of receiving the majority of the proceeds from the sale of the BRS
67
ALTISOURCE PORTFOLIO SOLUTIONS S.A.
Notes to Consolidated Financial Statements (
Continued
)
Inventory in 2019, the Company repaid
$49.9 million
of its senior secured term loan in the fourth quarter of 2018. The Company completed the sale of the BRS Inventory during the year ended December 31, 2019.
NOTE 9
—
PREMISES AND EQUIPMENT, NET
Premises and equipment, net consists of the following as of
December 31
:
|
(in thousands)
|
2019
|
2018
|
||||||
|
Computer hardware and software
|
$
|
144,608
|
|
$
|
182,215
|
|
||
|
Leasehold improvements
|
23,800
|
|
29,781
|
|
||||
|
Furniture and fixtures
|
8,775
|
|
13,313
|
|
||||
|
Office equipment and other
|
4,004
|
|
7,384
|
|
||||
|
|
181,187
|
|
232,693
|
|
||||
|
Less: Accumulated depreciation and amortization
|
(156,661
|
)
|
(187,062
|
)
|
||||
|
Total
|
$
|
24,526
|
|
$
|
45,631
|
|
||
Depreciation and amortization expense amounted to
$18.5 million
,
$30.8 million
and
$36.4 million
for the years ended
December 31, 2019
,
2018
and
2017
, respectively, and is included in cost of revenue for operating assets and in selling, general and administrative expenses for non-operating assets in the consolidated statements of operations and comprehensive income (loss).
Premises and equipment, net consist of the following, by country, as of December 31:
|
(in thousands)
|
2019
|
2018
|
||||||
|
United States
|
$
|
13,426
|
|
$
|
25,693
|
|
||
|
Luxembourg
|
10,295
|
|
14,975
|
|
||||
|
India
|
671
|
|
3,154
|
|
||||
|
Philippines
|
95
|
|
1,754
|
|
||||
|
Other
|
39
|
|
55
|
|
||||
|
Total
|
$
|
24,526
|
|
$
|
45,631
|
|
||
NOTE 10
—
RIGHT-OF-USE ASSETS UNDER OPERATING LEASES, NET
Right-of-use assets under operating leases consist of the following as of
December 31
:
|
(in thousands)
|
2019
|
2018
|
||||||
|
Right-of-use assets under operating leases
|
$
|
39,729
|
|
$
|
—
|
|
||
|
Less: Accumulated amortization
|
(10,655
|
)
|
—
|
|
||||
|
Total
|
$
|
29,074
|
|
$
|
—
|
|
||
The Company adopted Topic 842 effective January 1, 2019, which resulted in the recognition of
$42.1 million
of right-of-use assets upon adoption for operating leases, primarily for office space (see
Note 2
). Amortization of operating leases was
$11.8 million
for the year ended
December 31, 2019
(
no
comparative amounts for the years ended
December 31, 2018
and
2017
), and is included in cost of revenue for operating assets and in selling, general and administrative expenses for non-operating assets in the consolidated statements of operations and comprehensive income (loss).
68
ALTISOURCE PORTFOLIO SOLUTIONS S.A.
Notes to Consolidated Financial Statements (
Continued
)
NOTE 11
—
GOODWILL AND INTANGIBLE ASSETS, NET
Goodwill
Changes in goodwill during the years ended
December 31, 2019
and
2018
are summarized below:
|
(in thousands)
|
Total
|
||
|
Balance as of January 1, 2018
|
$
|
86,283
|
|
|
Disposition
(1)
|
(2,256
|
)
|
|
|
Write-off
(2)
|
(2,640
|
)
|
|
|
Balance as of December 31, 2018
|
81,387
|
|
|
|
Disposition
(1)
|
(2,378
|
)
|
|
|
Write-off
(2)
|
(5,160
|
)
|
|
|
Balance as of December 31, 2019
|
$
|
73,849
|
|
|
(1)
|
During 2018, goodwill was reduced by
$2.3 million
in connection with the sale of the rental property management business to RESI (see
Note 4
). During 2019, the Company sold the Financial Services Business (see
Note 4
) which had
$2.4 million
of goodwill attributed to it.
|
|
(2)
|
During 2018, we recorded a
$2.6 million
write-off of goodwill attributable to the BRS business, as a result of our decision to discontinue the BRS business in the fourth quarter of 2018 (see
Note 8
). During 2019, we recorded a
$5.2 million
write-off of goodwill attributable to the Owners.com business, as a result of our decision to wind down and close the business (see
Note 8
).
|
Intangible Assets, Net
Intangible assets, net consist of the following as of
December 31
:
|
Weighted average estimated useful life
(in years)
|
Gross carrying amount
|
Accumulated amortization
|
Net book value
|
|||||||||||||||||||||||
|
(in thousands)
|
2019
|
2018
|
2019
|
2018
|
2019
|
2018
|
||||||||||||||||||||
|
Definite lived intangible assets:
|
||||||||||||||||||||||||||
|
Customer related intangible assets
|
9
|
$
|
214,973
|
|
$
|
273,172
|
|
$
|
(176,043
|
)
|
$
|
(207,639
|
)
|
$
|
38,930
|
|
$
|
65,533
|
|
|||||||
|
Operating agreement
|
20
|
35,000
|
|
35,000
|
|
(17,376
|
)
|
(15,632
|
)
|
17,624
|
|
19,368
|
|
|||||||||||||
|
Trademarks and trade names
|
16
|
9,709
|
|
11,349
|
|
(5,893
|
)
|
(6,244
|
)
|
3,816
|
|
5,105
|
|
|||||||||||||
|
Non-compete agreements
|
4
|
1,230
|
|
1,230
|
|
(1,215
|
)
|
(1,026
|
)
|
15
|
|
204
|
|
|||||||||||||
|
Intellectual property
|
10
|
300
|
|
300
|
|
(175
|
)
|
(145
|
)
|
125
|
|
155
|
|
|||||||||||||
|
Other intangible assets
|
5
|
3,745
|
|
3,745
|
|
(3,209
|
)
|
(2,457
|
)
|
536
|
|
1,288
|
|
|||||||||||||
|
Total
|
$
|
264,957
|
|
$
|
324,796
|
|
$
|
(203,911
|
)
|
$
|
(233,143
|
)
|
$
|
61,046
|
|
$
|
91,653
|
|
||||||||
Amortization expense for definite lived intangible assets was
$19.0 million
,
$28.4 million
and
$35.4 million
for the years ended
December 31, 2019
,
2018
and
2017
, respectively
.
Expected annual definite lived intangible asset amortization expense for
2020
through
2024
is
$13.5 million
,
$10.6 million
,
$5.2 million
,
$5.1 million
and
$5.1 million
, respectively.
69
ALTISOURCE PORTFOLIO SOLUTIONS S.A.
Notes to Consolidated Financial Statements (
Continued
)
NOTE 12
—
OTHER ASSETS
Other assets consist of the following as of
December 31
:
|
(in thousands)
|
2019
|
2018
|
||||||
|
Security deposits
|
$
|
3,473
|
|
$
|
3,972
|
|
||
|
Restricted cash
|
3,842
|
|
5,752
|
|
||||
|
Other
|
3,495
|
|
2,682
|
|
||||
|
Total
|
$
|
10,810
|
|
$
|
12,406
|
|
||
NOTE 13
—
ACCOUNTS PAYABLE, ACCRUED EXPENSES AND OTHER CURRENT LIABILITIES
Accounts payable and accrued expenses consist of the following as of
December 31
:
|
(in thousands)
|
2019
|
2018
|
||||||
|
Accounts payable
|
$
|
22,431
|
|
$
|
27,853
|
|
||
|
Accrued expenses - general
|
24,558
|
|
27,866
|
|
||||
|
Accrued salaries and benefits
|
18,982
|
|
31,356
|
|
||||
|
Income taxes payable
|
1,700
|
|
165
|
|
||||
|
Total
|
$
|
67,671
|
|
$
|
87,240
|
|
||
Other current liabilities consist of the following as of
December 31
:
|
(in thousands)
|
2019
|
2018
|
||||||
|
Operating lease liabilities
|
$
|
11,398
|
|
$
|
—
|
|
||
|
Unfunded cash account balances
|
1,820
|
|
4,932
|
|
||||
|
Other
|
1,506
|
|
2,098
|
|
||||
|
Total
|
$
|
14,724
|
|
$
|
7,030
|
|
||
NOTE 14
—
LONG-TERM DEBT
Long-term debt consists of the following as of
December 31
:
|
(in thousands)
|
2019
|
2018
|
||||||
|
Senior secured term loans
|
$
|
293,826
|
|
$
|
338,822
|
|
||
|
Less: Debt issuance costs, net
|
(3,119
|
)
|
(3,855
|
)
|
||||
|
Less: Unamortized discount, net
|
(2,825
|
)
|
(3,491
|
)
|
||||
|
Long-term debt
|
$
|
287,882
|
|
$
|
331,476
|
|
||
On April 3, 2018, Altisource Portfolio Solutions S.A. and its wholly-owned subsidiary, Altisource S.à r.l. entered into a credit agreement (the “Credit Agreement”) with Morgan Stanley Senior Funding, Inc., as administrative agent and collateral agent, and certain lenders. Under the Credit Agreement, Altisource borrowed
$412.0 million
in the form of Term B Loans and obtained a
$15.0 million
revolving credit facility. The Term B Loans mature in April 2024 and the revolving credit facility matures in April 2023. Altisource Portfolio Solutions S.A. and certain subsidiaries are guarantors of the term loan and the revolving credit facility (collectively, the “Guarantors”).
Proceeds from the Term B Loans were used to repay the Company’s prior senior secured term loan, which had an outstanding balance of
$412.1 million
as of April 3, 2018. In connection with the refinancing, we recognized a loss of
$4.4 million
from the write-off of unamortized debt issuance costs and debt discount in the second quarter of 2018. This loss was included in other income (expense), net in the consolidated statements of operations and comprehensive income (loss).
70
ALTISOURCE PORTFOLIO SOLUTIONS S.A.
Notes to Consolidated Financial Statements (
Continued
)
There are no mandatory repayments of the Term B Loans due until March 2023, when
$1.3 million
is due to be repaid. Thereafter, the Term B Loans must be repaid in consecutive quarterly principal installments of
$3.1 million
, with the balance due at maturity.
During 2019, the Company used net proceeds of
$37.0 million
from the sale of the Financial Services Business to TSI (see
Note 4
) to repay a portion of the senior secured term loan. Also during 2019, the Company sold
0.7 million
RESI shares for net proceeds of
$8.0 million
and used the net proceeds to repay a portion of the senior secured term loan. In addition, the Company repaid
$49.9 million
of the Term B Loans in the fourth quarter of 2018 from proceeds from the sale certain of the BRS Inventory received during December 2018 and in anticipation of receiving additional proceeds during the first half of 2019 (see
Note 8
). Also during 2018, the Company used the proceeds received from the sale of the rental property management business to RESI (see
Note 4
) to repay
$15.0 million
of the Term B Loans. These repayments were applied to contractual amortization payments in the direct order of maturity. All amounts outstanding under the Term B Loans will become due on the earlier of (i) April 3, 2024, and (ii) the date on which the loans are declared to be due and owing by the administrative agent at the request (or with the consent) of the Required Lenders (as defined in the Credit Agreement; other capitalized terms, unless defined herein, are defined in the Credit Agreement) or as otherwise provided in the Credit Agreement upon the occurrence of any event of default.
During
2017
, we repurchased portions of our senior secured term loan with an aggregate par value of
$60.1 million
at a weighted average discount of
10.7%
, recognizing a net gain of
$5.6 million
on the early extinguishment of debt. There were
no
similar repurchases in
2019
and
2018
. This net gain is included in other income (expense), net in the consolidated statements of operations and comprehensive income (loss) (see
Note 21
).
In addition to the scheduled principal payments, subject to certain exceptions, the Term B Loans are subject to mandatory prepayment upon issuances of debt, certain casualty and condemnation events and sales of assets, as well as from a percentage of Consolidated Excess Cash Flow if our leverage ratio is greater than
3.00
to
1.00
, as calculated in accordance with the provisions of the Credit Agreement (the percentage increases if the leverage ratio exceeds
3.50
to
1.00
). Certain mandatory prepayments reduce future contractual amortization payments in direct order of maturity by an amount equal to the mandatory prepayment.
Altisource may incur incremental indebtedness under the Credit Agreement from
one
or more incremental lenders, which may include existing lenders, in an aggregate incremental principal amount not to exceed
$125.0 million
, subject to certain conditions set forth in the Credit Agreement, including a sublimit of
$80.0 million
with respect to incremental revolving credit commitments. The lenders have no obligation to provide any incremental indebtedness.
The Term B Loans bear interest at rates based upon, at our option, the
Adjusted Eurodollar Rate
or the
Base Rate
.
Adjusted Eurodollar Rate
term loans bear interest at a rate per annum equal to the sum of (i) the greater of (x) the
Adjusted Eurodollar Rate
for a three month interest period and (y)
1.00%
plus (ii)
4.00%
.
Base Rate
term loans bear interest at a rate per annum equal to the sum of (i) the greater of (x) the
Base Rate
and (y)
2.00%
plus (ii)
3.00%
. The interest rate as of
December 31, 2019
was
5.94%
.
Loans under the revolving credit facility bear interest at rates based upon, at our option, the
Adjusted Eurodollar Rate
or the
Base Rate
.
Adjusted Eurodollar Rate
revolving loans bear interest at a rate per annum equal to the sum of (i) the
Adjusted Eurodollar Rate
for a three month interest period plus (ii)
4.00%
.
Base Rate
revolving loans bear interest at a rate per annum equal to the sum of (i) the
Base Rate
plus (ii)
3.00%
. The unused commitment fee is
0.50%
. There were
no
borrowings outstanding under the revolving credit facility as of
December 31, 2019
.
The payment of all amounts owing by Altisource under the Credit Agreement is guaranteed by the Guarantors and is secured by a pledge of all equity interests of certain subsidiaries of Altisource, as well as a lien on substantially all of the assets of Altisource S.à r.l. and the Guarantors, subject to certain exceptions.
The Credit Agreement includes covenants that restrict or limit, among other things, our ability, subject to certain exceptions and baskets, to incur indebtedness; incur liens on our assets; sell, transfer or dispose of assets; make Restricted Junior Payments including share repurchases, dividends and repayment of junior indebtedness; make investments; dispose of equity interests of any Material Subsidiaries; engage in a line of business substantially different than existing businesses and businesses reasonably related, complimentary or ancillary thereto; amend material debt agreements or other material contracts; engage in certain transactions with affiliates; enter into sale/leaseback transactions; grant negative pledges or agree to such other restrictions relating to subsidiary dividends and distributions; make changes to our fiscal year; and engage in mergers and consolidations; and to the extent any Revolving Credit Loans are outstanding on the last day of a fiscal quarter, permit the Total Leverage Ratio to be greater than
3.50
:
1.00
as of the last day of such fiscal quarter, subject to a customary cure provision (the “Revolving Financial Covenant”).
The Credit Agreement contains certain events of default including (i) failure to pay principal when due or interest or any other amount owing on any other obligation under the Credit Agreement within five days of becoming due, (ii) material incorrectness of representations and warranties when made, (iii) breach of certain other covenants, subject to cure periods described in the Credit Agreement, (iv) a breach of the Revolving Financial Covenant, subject to a customary cure provision and not an Event of Default with respect to the Term Loans unless and until the Required Revolving Lenders accelerate the Revolving Credit Loans, (v) failure
71
ALTISOURCE PORTFOLIO SOLUTIONS S.A.
Notes to Consolidated Financial Statements (
Continued
)
to pay principal or interest on any other debt that equals or exceeds
$40.0 million
when due, (vi) default on any other debt that equals or exceeds
$40.0 million
that causes, or gives the holder or holders of such debt the ability to cause, an acceleration of such debt, (vii) occurrence of a Change of Control, (viii) bankruptcy and insolvency events, (ix) entry by a court of one or more judgments against us in an amount in excess of
$40.0 million
that remain unbonded, undischarged or unstayed for a certain number of days after the entry thereof, (x) the occurrence of certain ERISA events and (xi) the failure of certain Loan Documents to be in full force and effect. If any event of default occurs and is not cured within applicable grace periods set forth in the Credit Agreement or waived, all loans and other obligations could become due and immediately payable and the facility could be terminated.
As of
December 31, 2019
, debt issuance costs were
$3.1 million
, net of
$1.4 million
of accumulated amortization. As of
December 31, 2018
, debt issuance costs were
$3.9 million
, net of
$0.7 million
of accumulated amortization.
Interest expense on the senior secured term loans, including amortization of debt issuance costs and the net debt discount, totaled
$21.4 million
,
$26.3 million
and
$22.3 million
for the years ended
December 31, 2019
,
2018
and
2017
, respectively.
Maturities of our long-term debt are as follows:
|
(in thousands)
|
Maturities
|
|||
|
2020
|
$
|
—
|
|
|
|
2021
|
—
|
|
||
|
2022
|
—
|
|
||
|
2023
|
10,576
|
|
||
|
2024
|
283,250
|
|
||
|
$
|
293,826
|
|
||
NOTE 15
—
OTHER NON-CURRENT LIABILITIES
Other non-current liabilities consist of the following as of
December 31
:
|
(in thousands)
|
2019
|
2018
|
||||||
|
Operating lease liabilities
|
$
|
19,707
|
|
$
|
—
|
|
||
|
Income tax liabilities
|
10,935
|
|
7,069
|
|
||||
|
Deferred revenue
|
88
|
|
19
|
|
||||
|
Other non-current liabilities
|
286
|
|
2,090
|
|
||||
|
Total
|
$
|
31,016
|
|
$
|
9,178
|
|
||
NOTE 16
—
FAIR VALUE MEASUREMENTS AND FINANCIAL INSTRUMENTS
The following table presents the carrying amount and estimated fair value of financial instruments and certain liabilities measured at fair value as of
December 31, 2019
and
2018
. The following fair values are estimated using market information and what the Company believes to be appropriate valuation methodologies under GAAP:
|
December 31, 2019
|
December 31, 2018
|
|||||||||||||||||||||||||||||||
|
(in thousands)
|
Carrying amount
|
Fair value
|
Carrying amount
|
Fair value
|
||||||||||||||||||||||||||||
|
Level 1
|
Level 2
|
Level 3
|
Level 1
|
Level 2
|
Level 3
|
|||||||||||||||||||||||||||
|
Assets:
|
||||||||||||||||||||||||||||||||
|
Cash and cash equivalents
|
$
|
82,741
|
|
$
|
82,741
|
|
$
|
—
|
|
$
|
—
|
|
$
|
58,294
|
|
$
|
58,294
|
|
$
|
—
|
|
$
|
—
|
|
||||||||
|
Restricted cash
|
3,842
|
|
3,842
|
|
—
|
|
—
|
|
5,752
|
|
5,752
|
|
—
|
|
—
|
|
||||||||||||||||
|
Investment in equity securities
|
42,618
|
|
42,618
|
|
—
|
|
—
|
|
36,181
|
|
36,181
|
|
—
|
|
—
|
|
||||||||||||||||
|
Long-term receivable (Note 4)
|
2,371
|
|
—
|
|
—
|
|
2,371
|
|
2,221
|
|
—
|
|
—
|
|
2,221
|
|
||||||||||||||||
|
Liabilities:
|
||||||||||||||||||||||||||||||||
|
Senior secured term loan
|
293,826
|
|
—
|
|
277,666
|
|
—
|
|
338,822
|
|
—
|
|
330,351
|
|
—
|
|
||||||||||||||||
72
ALTISOURCE PORTFOLIO SOLUTIONS S.A.
Notes to Consolidated Financial Statements (
Continued
)
Fair Value Measurements on a Recurring Basis
Cash and cash equivalents and restricted cash are carried at amounts that approximate their fair values due to the highly liquid nature of these instruments and were measured using Level 1 inputs.
Investment in equity securities is carried at fair value and consists of
3.5 million
and
4.1 million
shares of RESI common stock as of
December 31, 2019
and
2018
, respectively. The investment in equity securities is measured using Level 1 inputs as these securities have quoted prices in active markets.
The fair value of our senior secured term loan is based on quoted market prices. Based on the frequency of trading, we do not believe that there is an active market for our debt. Therefore, the quoted prices are considered Level 2 inputs.
In connection with the sale of the rental property management business in August 2018, Altisource will receive
$3.0 million
on the earlier of a RESI change of control or on August 8, 2023 (see
Note 4
for additional information). We measure long-term receivables without a stated interest rate based on the present value of the future payments.
There were no transfers between different levels during the periods presented.
Concentrations of Credit Risk
Financial instruments that subject us to concentrations of credit risk primarily consist of cash and cash equivalents and accounts receivable. Our policy is to deposit our cash and cash equivalents with larger, highly rated financial institutions. The Company derives over
50%
of its revenues from Ocwen (see
Note 3
for additional information on Ocwen revenues and accounts receivable balance). The Company strives to mitigate its concentrations of credit risk with respect to accounts receivable by actively monitoring past due accounts and the economic status of larger customers, if known.
NOTE 17
—
SHAREHOLDERS’ EQUITY AND SHARE-BASED COMPENSATION
Common Stock
As of
December 31, 2019
, we had
100.0 million
shares authorized,
25.4 million
shares issued and
15.5 million
shares of common stock outstanding. As of
December 31, 2018
, we had
100.0 million
shares authorized,
25.4 million
shares issued and
16.3 million
shares of common stock outstanding. The holders of shares of Altisource common stock generally are entitled to
one
vote for each share on all matters voted on by shareholders, and the holders of such shares generally will possess all voting power.
Equity Incentive Plan
Our 2009 Equity Incentive Plan (the “Plan”) provides for various types of equity awards, including stock options, stock appreciation rights, stock purchase rights, restricted shares, restricted share units and other awards, or a combination of any of the above. Under the Plan, we may grant up to
6.7 million
Altisource share-based awards to officers, directors, employees and to employees of our affiliates. As of
December 31, 2019
,
0.8 million
share-based awards were available for future grant under the Plan. Expired and forfeited awards are available for reissuance.
Share Repurchase Program
On May 15, 2018, our shareholders approved the renewal and replacement of the share repurchase program previously approved by the shareholders on May 17, 2017. Under the program, we are authorized to purchase up to
4.3 million
shares of our common stock, based on a limit of
25%
of the outstanding shares of common stock on the date of approval, at a minimum price of
$1.00
per share and a maximum price of
$500.00
per share, for a period of
five
years from the date of approval. As of
December 31, 2019
, approximately
2.4 million
shares of common stock remain available for repurchase under the program. We purchased
1.0 million
shares of common stock at an average price of
$20.33
per share during the year ended
December 31, 2019
,
1.6 million
shares at an average price of
$25.53
per share during the year ended
December 31, 2018
and
1.6 million
shares at an average price of
$23.84
per share during the year ended
December 31, 2017
. Luxembourg law limits share repurchases to the balance of Altisource Portfolio Solutions S.A. (unconsolidated parent company) retained earnings, less the value of shares repurchased. As of
December 31, 2019
, we can repurchase up to approximately
$102 million
of our common stock under Luxembourg law. Our Credit Agreement also limits the amount we can spend on share repurchases, which limit was approximately
$463 million
as of
December 31, 2019
, and may prevent repurchases in certain circumstances.
Share-Based Compensation
We issue share-based awards in the form of stock options, restricted shares and restricted share units for certain employees, officers and directors. We recognized share-based compensation expense of
$11.9 million
,
$10.2 million
and
$4.3 million
for the years
73
ALTISOURCE PORTFOLIO SOLUTIONS S.A.
Notes to Consolidated Financial Statements (
Continued
)
ended
December 31, 2019
,
2018
and
2017
, respectively. As of
December 31, 2019
, estimated unrecognized compensation costs related to share-based awards amounted to
$8.9 million
, which we expect to recognize over a weighted average remaining requisite service period of approximately
1.52 years
.
In connection with the January 1, 2017 adoption of ASU No. 2016-09, the Company made an accounting policy election to account for forfeitures in compensation expense as they occur, rather than continuing to apply the Company’s previous policy of estimating forfeitures. Prior to this accounting change, share-based compensation expense for stock options and restricted shares was recorded net of estimated forfeiture rates ranging from
0%
to
40%
. This policy election resulted in a cumulative effect adjustment of
$0.9 million
to retained earnings and additional paid-in capital as of January 1, 2017 using the modified retrospective transition method.
Stock Options
Stock option grants are composed of a combination of service-based, market-based and performance-based options.
Service-Based Options.
These options generally vest over
three
or
four years
with equal annual vesting and generally expire on the earlier of
ten years
after the date of grant or following termination of service. A total of
426 thousand
service-based options were outstanding as of
December 31, 2019
.
Market-Based Options
. These option grants generally have
two
components, each of which vests only upon the achievement of certain criteria. The first component, which we refer to as “ordinary performance” grants, generally consists of
two-thirds
of the market-based grant and begins to vest if the stock price is at least
double
the exercise price, as long as the stock price realizes a compounded annual gain of at least
20%
over the exercise price. The remaining
third
of the market-based options, which we refer to as “extraordinary performance” grants, generally begins to vest if the stock price is at least
triple
the exercise price, as long as the stock price realizes a compounded annual gain of at least
25%
over the exercise price. Market-based options vest in
three
or
four
year installments with the first installment vesting upon the achievement of the criteria and the remaining installments vesting thereafter in equal annual installments. Market-based options generally expire on the earlier of
ten
years after the date of grant or following termination of service, unless the performance criteria is met prior to termination of service or in the final
three
years of the option term, in which case vesting will generally continue in accordance with the provisions of the award agreement. A total of
578 thousand
market-based options were outstanding as of
December 31, 2019
.
Performance-Based Options.
These option grants generally will vest if certain specific financial measures are achieved;
one-fourth
vests on each anniversary of the grant date. For certain other financial measures, options cliff-vest upon the achievement of the specific performance during the period from
2019
through
2021
. The award of performance-based options is adjusted based on the level of achievement specified in the award agreements. If the performance criteria achieved is above threshold performance levels, participants have the opportunity to vest in
50%
to
200%
of the option grants, depending upon performance achieved. If the performance criteria achieved is below a certain threshold, the options are canceled. The options generally expire on the earlier of
ten years
after the date of grant or following termination of service. There were
464 thousand
performance-based options outstanding as of
December 31, 2019
.
There were
no
stock options granted during
2019
. Outstanding stock options increased by
228 thousand
in February 2019 in connection with the determination of the level of achievement for certain performance-based options granted in
2018
. The Company granted
277 thousand
stock options (at a weighted average exercise price of
$25.15
per share) and
244 thousand
stock options (at a weighted average exercise price of
$33.28
per share) during the years ended
December 31, 2018
and
2017
, respectively.
The fair values of the service-based options and performance-based options are determined using the Black-Scholes option pricing model and the fair values of the market-based options were determined using a lattice (binomial) model. The following assumptions were used to determine the fair values as of the grant date for the years ended December 31:
|
|
2018
|
2017
|
|||||||||
|
|
Black-Scholes
|
Binomial
|
Black-Scholes
|
Binomial
|
|||||||
|
Risk-free interest rate (%)
|
2.66 – 3.10
|
|
1.64 – 3.22
|
|
1.89 – 2.29
|
|
0.77 – 2.38
|
|
|||
|
Expected stock price volatility (%)
|
70.31 – 71.86
|
|
71.36 – 71.86
|
|
61.49 – 71.52
|
|
66.68 – 71.52
|
|
|||
|
Expected dividend yield
|
—
|
|
—
|
|
—
|
|
—
|
|
|||
|
Expected option life (in years)
|
6.00 – 6.25
|
|
2.56 – 4.33
|
|
6.00 – 7.50
|
|
2.55 – 4.82
|
|
|||
|
Fair value
|
$16.17 – $19.68
|
|
$14.67 – $20.26
|
|
$13.57 – $24.80
|
|
$11.94 – $24.30
|
|
|||
74
ALTISOURCE PORTFOLIO SOLUTIONS S.A.
Notes to Consolidated Financial Statements (
Continued
)
We determined the expected option life of all service-based stock option grants using the simplified method, determined based on the graded vesting term plus the contractual term of the options, divided by two. We use the simplified method because we believe that our historical data does not provide a reasonable basis upon which to estimate expected option life.
The following table summarizes the weighted average grant date fair value of stock options granted per share, the total intrinsic value of stock options exercised and the grant date fair value of stock options that vested during the years ended
December 31
:
|
(in thousands, except per share data)
|
2019
|
2018
|
2017
|
|||||||||
|
Weighted average grant date fair value of stock options granted per share
|
$
|
—
|
|
$
|
16.31
|
|
$
|
20.44
|
|
|||
|
Intrinsic value of options exercised
|
54
|
|
4,609
|
|
3,028
|
|
||||||
|
Grant date fair value of stock options that vested
|
3,053
|
|
1,760
|
|
2,279
|
|
||||||
The following table summarizes the activity related to our stock options:
|
|
Number of options
|
Weighted average exercise price
|
Weighted average contractual term
(in years)
|
Aggregate intrinsic value
(in thousands)
|
||||||||
|
Outstanding as of December 31, 2018
|
1,440,566
|
|
$
|
30.78
|
|
5.04
|
$
|
945
|
|
|||
|
Performance criteria achieved
|
227,849
|
|
24.98
|
|
||||||||
|
Exercised
|
(21,052
|
)
|
18.79
|
|
|
|
||||||
|
Forfeited
|
(179,317
|
)
|
37.85
|
|
||||||||
|
Outstanding as of December 31, 2019
|
1,468,046
|
|
29.19
|
|
4.60
|
94
|
|
|||||
|
Exercisable as of December 31, 2019
|
926,174
|
|
26.46
|
|
3.03
|
92
|
|
|||||
In 2018, the Company modified the performance thresholds that are required to be met in order for vesting to occur for
263 thousand
stock options granted to
16
employees during the year ended December 31, 2018. The award modification did not change the inputs into the valuation model or the Company’s assessment of the probability of vesting as of the effective date of the modifications. Consequently, no incremental compensation expense was required as a result of this modification.
The following table summarizes information about stock options outstanding and exercisable as of
December 31, 2019
:
|
Options outstanding
|
Options exercisable
|
|||||||||||||||||
|
Exercise price range
(1)
|
Number
|
Weighted average remaining contractual life
(in years)
|
Weighted average exercise price
|
Number
|
Weighted average remaining contractual life
(in years)
|
Weighted average exercise price
|
||||||||||||
|
$10.01 — $20.00
|
174,784
|
|
5.18
|
$
|
18.79
|
|
169,457
|
|
5.18
|
$
|
18.79
|
|
||||||
|
$20.01 — $30.00
|
1,057,212
|
|
4.39
|
24.44
|
|
656,287
|
|
2.26
|
24.01
|
|
||||||||
|
$30.01 — $40.00
|
107,550
|
|
6.60
|
34.39
|
|
39,055
|
|
5.24
|
32.79
|
|
||||||||
|
$60.01 — $70.00
|
58,500
|
|
2.20
|
60.76
|
|
43,875
|
|
2.20
|
60.76
|
|
||||||||
|
$80.01 — $90.00
|
25,000
|
|
4.60
|
86.69
|
|
6,250
|
|
4.60
|
86.69
|
|
||||||||
|
$90.01 — $100.00
|
45,000
|
|
4.19
|
95.67
|
|
11,250
|
|
4.19
|
95.67
|
|
||||||||
|
1,468,046
|
|
926,174
|
|
|||||||||||||||
______________________________________
|
(1)
|
These options contain market-based and performance-based components as described above.
|
75
ALTISOURCE PORTFOLIO SOLUTIONS S.A.
Notes to Consolidated Financial Statements (
Continued
)
The following table summarizes the market prices necessary in order for the market-based options to begin to vest:
|
Market-based options
|
||||||||
|
Vesting price
|
Ordinary performance
|
Extraordinary performance
|
||||||
|
$40.01 — $50.00
|
3,125
|
|
—
|
|
||||
|
$50.01 — $60.00
|
44,796
|
|
5,327
|
|
||||
|
$60.01 — $70.00
|
14,815
|
|
6,250
|
|
||||
|
$70.01 — $80.00
|
—
|
|
11,500
|
|
||||
|
$80.01 — $90.00
|
—
|
|
11,397
|
|
||||
|
$90.01 — $100.00
|
—
|
|
6,908
|
|
||||
|
$100.01 — $110.00
|
—
|
|
1,000
|
|
||||
|
$170.01 — $180.00
|
12,500
|
|
—
|
|
||||
|
$180.01 — $190.00
|
7,500
|
|
14,625
|
|
||||
|
Over $190.00
|
15,000
|
|
17,500
|
|
||||
|
Total
|
97,736
|
|
74,507
|
|
||||
|
Weighted average share price
|
$
|
51.06
|
|
$
|
48.53
|
|
||
Other Share-Based Awards
The Company’s other share-based and similar types of awards are composed of restricted shares and restricted share units. The restricted shares and restricted share units are composed of a combination of service-based awards and performance-based awards.
Service-Based Awards.
These awards generally vest over
two
to
four
year periods with (a) vesting in equal annual installments, or (b) vesting of all of the restricted shares and restricted share units at the end of the vesting period. A total of
487 thousand
service-based awards were outstanding as of
December 31, 2019
. Beginning in 2019, service-based restricted share units were awarded as a component of most employees’ annual incentive compensation rather than cash.
Performance-Based Awards.
These awards generally will vest if certain specific financial measures are achieved;
one-third
vests on each anniversary of the grant date or cliff-vest on the third anniversary of the grant date. The number of performance-based restricted shares and restricted share units that may vest will be based on the level of achievement, as specified in the award agreements. If the performance criteria achieved is above certain financial performance levels and Altisource’s share performance is above certain established criteria, participants have the opportunity to vest in up to
225%
of the restricted share unit award for certain awards, depending on performance achieved. If the performance criteria achieved is below a certain threshold, the award is canceled. A total of
149 thousand
performance-based awards were outstanding as of
December 31, 2019
.
The Company granted
401 thousand
restricted share units (at a weighted average grant date fair value of
$24.61
per share) during the year ended
December 31, 2019
.
The following table summarizes the activity related to our restricted shares and restricted share units:
|
|
Number of restricted shares and restricted
share units |
|
|
Outstanding as of December 31, 2018
|
485,806
|
|
|
Granted
|
401,458
|
|
|
Issued
|
(138,504
|
)
|
|
Forfeited/canceled
|
(112,614
|
)
|
|
Outstanding as of December 31, 2019
|
636,146
|
|
In 2018, the Company modified the vesting condition to remove the requirement that a certain employee be employed by the Company in order for the restricted shares to vest for
31 thousand
restricted shares granted in the fourth quarter of 2017 and the first quarter of 2018. The award modification did not change the inputs into the valuation model or the Company’s assessment of
76
ALTISOURCE PORTFOLIO SOLUTIONS S.A.
Notes to Consolidated Financial Statements (
Continued
)
the probability of vesting as of the effective date of the modifications. Consequently, no incremental compensation expense was required as a result of this modification.
During the year ended December 31, 2019, Pointillist issued
1.1 million
shares of its common stock, or
12.1%
of Pointillist equity to Pointillist management in exchange for their services. The fair value of the Pointillist shares of
$0.9 million
was recognized as share-based compensation expense for the year ended December 31, 2019.
NOTE 18
—
REVENUE
We classify revenue in three categories: service revenue, revenue from reimbursable expenses and non-controlling interests. Service revenue consists of amounts attributable to our fee-based services and sales of short-term investments in real estate. Reimbursable expenses and non-controlling interests are pass-through items for which we earn no margin. Reimbursable expenses consist of amounts we incur on behalf of our customers in performing our fee-based services that we pass directly on to our customers without a markup. Non-controlling interests represent the earnings of Lenders One, a consolidated entity that is a mortgage cooperative managed, but not owned, by Altisource. Lenders One is included in revenue and reduced from net income to arrive at net income attributable to Altisource (see
Note 2
). Our services are provided to customers located in the United States. The components of revenue were as follows for the years ended
December 31
:
|
(in thousands)
|
2019
|
2018
|
2017
|
|||||||||
|
Service revenue
|
$
|
621,866
|
|
$
|
805,480
|
|
$
|
899,561
|
|
|||
|
Reimbursable expenses
|
24,172
|
|
30,039
|
|
39,912
|
|
||||||
|
Non-controlling interests
|
2,613
|
|
2,683
|
|
2,740
|
|
||||||
|
Total
|
$
|
648,651
|
|
$
|
838,202
|
|
$
|
942,213
|
|
|||
The Company adopted ASU No. 2014-09,
Revenue from Contracts from Customers (Topic 606)
, and related interpretations (“Topic 606”), effective January 1, 2018 retrospectively with the cumulative effect recognized on the date of initial application (the modified retrospective approach) for all contracts. As a result of this adoption, the Company recognized an
$11.2 million
increase in deferred revenue, a
$1.1 million
increase in unbilled accounts receivable, a
$0.3 million
increase in other current liabilities and a
$10.4 million
decrease in retained earnings as of January 1, 2018. Because the Company adopted Topic 606 retrospectively with a cumulative effect as of January 1, 2018, the comparative results as of and for the year ended December 31, 2017 have not been restated and continue to be reported under ASC Topic 605,
Revenue Recognition
and SEC Staff Accounting Bulletin Topic 13,
Revenue Recognition
.
Disaggregation of Revenue
Disaggregation of total revenues by major source is as follows:
|
(in thousands)
|
Revenue recognized when services are performed or assets are sold
|
Revenue related to technology platforms and professional services
|
Reimbursable expenses revenue
|
Total revenue
|
||||||||||||
|
For the year ended December 31, 2019
|
$
|
579,929
|
|
$
|
44,550
|
|
$
|
24,172
|
|
$
|
648,651
|
|
||||
|
For the year ended December 31, 2018
|
719,739
|
|
88,424
|
|
30,039
|
|
838,202
|
|
||||||||
Contract Balances
Our contract assets consist of unbilled accounts receivable (see
Note 6
). Our contract liabilities consist of current deferred revenue as reported on the accompanying consolidated balance sheets and non-current deferred revenue (see
Note 15
). Revenue recognized that was included in the contract liability at the beginning of the period, including amounts added to the contract liability as part of the cumulative effect of adopting Topic 606 was
$9.8 million
and
$20.6 million
for the years ended
December 31, 2019
and 2018, respectively.
77
ALTISOURCE PORTFOLIO SOLUTIONS S.A.
Notes to Consolidated Financial Statements (
Continued
)
NOTE 19
—
COST OF REVENUE
Cost of revenue principally includes payroll and employee benefits associated with personnel employed in customer service and operations roles, fees paid to external providers related to the provision of services, cost of real estate sold, reimbursable expenses, technology and telecommunications costs as well as depreciation and amortization of operating assets. The components of cost of revenue were as follows for the years ended
December 31
:
|
(in thousands)
|
2019
|
2018
|
2017
|
|||||||||
|
Compensation and benefits
|
$
|
135,502
|
|
$
|
200,486
|
|
$
|
240,487
|
|
|||
|
Outside fees and services
|
240,796
|
|
278,380
|
|
325,459
|
|
||||||
|
Cost of real estate sold
|
42,763
|
|
47,659
|
|
24,398
|
|
||||||
|
Technology and telecommunications
|
36,302
|
|
41,588
|
|
42,340
|
|
||||||
|
Reimbursable expenses
|
24,172
|
|
30,039
|
|
39,912
|
|
||||||
|
Depreciation and amortization
|
13,721
|
|
24,013
|
|
27,269
|
|
||||||
|
Total
|
$
|
493,256
|
|
$
|
622,165
|
|
$
|
699,865
|
|
|||
NOTE 20
—
SELLING, GENERAL AND ADMINISTRATIVE EXPENSES
Selling, general and administrative expenses include payroll and employee benefits associated with personnel employed in executive, sales and marketing, finance, law, compliance, human resources, vendor management, facilities and risk management roles. This category also includes professional services fees, occupancy costs, marketing costs, depreciation and amortization of non-operating assets and other expenses. The components of selling, general and administrative expenses were as follows for the years ended
December 31
:
|
(in thousands)
|
2019
|
2018
|
2017
|
|||||||||
|
Compensation and benefits
|
$
|
49,875
|
|
$
|
51,043
|
|
$
|
58,157
|
|
|||
|
Occupancy related costs
|
26,042
|
|
30,851
|
|
36,371
|
|
||||||
|
Amortization of intangible assets
|
19,021
|
|
28,412
|
|
35,367
|
|
||||||
|
Professional services
|
14,975
|
|
16,950
|
|
13,421
|
|
||||||
|
Marketing costs
|
11,212
|
|
14,707
|
|
16,171
|
|
||||||
|
Depreciation and amortization
|
4,788
|
|
6,786
|
|
9,178
|
|
||||||
|
Other
|
15,163
|
|
26,921
|
|
23,977
|
|
||||||
|
Total
|
$
|
141,076
|
|
$
|
175,670
|
|
$
|
192,642
|
|
|||
NOTE 21
—
OTHER INCOME (EXPENSE), NET
Other income (expense), net consists of the following for the years ended
December 31
:
|
(in thousands)
|
2019
|
2018
|
2017
|
|||||||||
|
Interest income
|
$
|
342
|
|
$
|
740
|
|
$
|
270
|
|
|||
|
Loss on debt refinancing
|
—
|
|
(4,434
|
)
|
—
|
|
||||||
|
Gain on early extinguishment of debt
|
—
|
|
—
|
|
5,637
|
|
||||||
|
Other, net
|
1,006
|
|
1,824
|
|
2,015
|
|
||||||
|
Total
|
$
|
1,348
|
|
$
|
(1,870
|
)
|
$
|
7,922
|
|
|||
78
ALTISOURCE PORTFOLIO SOLUTIONS S.A.
Notes to Consolidated Financial Statements (
Continued
)
NOTE 22
—
INCOME TAXES
The components of income before income taxes and non-controlling interests consist of the following for the years ended
December 31
:
|
(in thousands)
|
2019
|
2018
|
2017
|
|||||||||
|
Domestic - Luxembourg
|
$
|
8,919
|
|
$
|
(22,513
|
)
|
$
|
9,123
|
|
|||
|
Foreign - U.S.
|
(12,602
|
)
|
8,398
|
|
7,967
|
|
||||||
|
Foreign - non-U.S.
|
16,122
|
|
15,514
|
|
18,285
|
|
||||||
|
Total
|
$
|
12,439
|
|
$
|
1,399
|
|
$
|
35,375
|
|
|||
The income tax (provision) benefit consists of the following for the years ended
December 31
:
|
(in thousands)
|
2019
|
2018
|
2017
|
|||||||||
|
Current:
|
||||||||||||
|
Domestic - Luxembourg
|
$
|
—
|
|
$
|
(275
|
)
|
$
|
(737
|
)
|
|||
|
Foreign - U.S. federal
|
187
|
|
(1,838
|
)
|
(2,405
|
)
|
||||||
|
Foreign - U.S. state
|
(174
|
)
|
(336
|
)
|
(364
|
)
|
||||||
|
Foreign - non-U.S.
|
(10,970
|
)
|
(7,440
|
)
|
(17,574
|
)
|
||||||
|
$
|
(10,957
|
)
|
$
|
(9,889
|
)
|
$
|
(21,080
|
)
|
||||
|
Deferred:
|
||||||||||||
|
Domestic - Luxembourg
|
$
|
(308,657
|
)
|
$
|
4,927
|
|
$
|
295,318
|
|
|||
|
Foreign - U.S. federal
|
329
|
|
291
|
|
111
|
|
||||||
|
Foreign - U.S. state
|
341
|
|
(134
|
)
|
210
|
|
||||||
|
Foreign - non-U.S.
|
648
|
|
707
|
|
1,697
|
|
||||||
|
$
|
(307,339
|
)
|
$
|
5,791
|
|
$
|
297,336
|
|
||||
|
Income tax (provision) benefit
|
$
|
(318,296
|
)
|
$
|
(4,098
|
)
|
$
|
276,256
|
|
|||
In June 2010, the Company received a tax ruling regarding the treatment of certain intangibles that existed for determining the Company’s taxable income, which was scheduled to expire in 2019 unless extended, renewed or terminated by the Company. On December 27, 2017,
two
of the Company’s wholly-owned subsidiaries, Altisource Solutions S.à r.l. and Altisource Holdings S.à r.l., merged, with Altisource Holdings S.à r.l. as the surviving entity. Altisource Holdings S.à r.l. was subsequently renamed Altisource S.à r.l. The merger is part of a larger subsidiary restructuring plan designed to simplify the Company’s corporate structure, allow it to operate more efficiently and reduce administrative costs. For Luxembourg tax purposes, the merger was recognized at fair value and generated a net operating loss (“NOL”) of
$1.3 billion
, with a
17
year life, and generated a deferred tax asset of
$342.6 million
as of December 31, 2017, before a valuation allowance of
$41.6 million
. This deferred tax asset was partially offset by the impact of other changes in U.S. and Luxembourg income tax rates of
$6.3 million
and an increase in certain foreign income tax reserves (and related interest) of
$10.5 million
for the year ended December 31, 2017. The Company’s June 2010 tax ruling was terminated in connection with the merger of the Company’s Luxembourg subsidiaries.
In determining whether a valuation allowance is needed on a deferred tax asset, extensive analysis is required, including an assessment of the likelihood of sufficient future taxable income. When there is a cumulative pretax loss for financial reporting for the current and two preceding years (i.e., a three year cumulative loss), this is a significant element of negative evidence that would be difficult to overcome on a more likely than not or any other basis, based on the guidance in ASC Topic 740. The Company’s Luxembourg entities recognized a cumulative loss before income taxes for the three year period ended December 31, 2019. Consequently, the Company recognized a full valuation allowance of
$291.5 million
and an increase in the income tax provision related to the Luxembourg net deferred assets. In addition, Luxembourg reduced its corporate tax rate from
26.01%
to
24.94%
during 2019, resulting in a reduction in the Luxembourg net deferred tax assets and an increase in the Company’s income tax provision of
$14.0 million
.
We operate under tax holidays in certain geographies in India and Uruguay. The Philippines tax holiday expired on June 30, 2019. The India tax holidays are effective through March 2020. We operate in a Uruguay free trade zone that provides an indefinite future tax benefit. The tax holidays are conditioned upon our meeting certain employment and investment thresholds. The impact
79
ALTISOURCE PORTFOLIO SOLUTIONS S.A.
Notes to Consolidated Financial Statements (
Continued
)
of these tax holidays decreased foreign taxes by
$0.3 million
(
$0.02
per diluted share),
$0.7 million
(
$0.04
per diluted share) and
$0.9 million
(
$0.05
per diluted share) for the years ended
December 31, 2019
,
2018
and
2017
, respectively.
The Company accounts for certain income and expense items differently for financial reporting purposes and income tax purposes. We recognize deferred income tax assets and liabilities for these differences between the financial reporting basis and the tax basis of our assets and liabilities as well as expected benefits of utilizing net operating loss and credit carryforwards. We measure deferred income tax assets and liabilities using enacted tax rates expected to apply to taxable income in the years in which we expect to recover or settle those temporary differences.
A summary of the tax effects of the temporary differences is as follows for the years ended
December 31
:
|
(in thousands)
|
2019
|
2018
|
||||||
|
Non-current deferred tax assets:
|
||||||||
|
Net operating loss carryforwards
|
$
|
338,403
|
|
$
|
353,209
|
|
||
|
U.S. federal and state tax credits
|
189
|
|
314
|
|
||||
|
Other non-U.S. deferred tax assets
|
13,980
|
|
6,161
|
|
||||
|
Share-based compensation
|
2,010
|
|
1,586
|
|
||||
|
Accrued expenses
|
2,691
|
|
5,242
|
|
||||
|
Unrealized losses
|
9,011
|
|
3,131
|
|
||||
|
Other
|
526
|
|
—
|
|
||||
|
Non-current deferred tax liabilities:
|
||||||||
|
Intangible assets
|
(8,325
|
)
|
(9,855
|
)
|
||||
|
Depreciation
|
(302
|
)
|
(1,225
|
)
|
||||
|
Other non-U.S. deferred tax liability
|
(998
|
)
|
(1,769
|
)
|
||||
|
Other
|
—
|
|
(954
|
)
|
||||
|
357,185
|
|
355,840
|
|
|||||
|
Valuation allowance
|
(355,559
|
)
|
(46,751
|
)
|
||||
|
Non-current deferred tax assets, net
|
$
|
1,626
|
|
$
|
309,089
|
|
||
A valuation allowance is provided when it is deemed more likely than not that some portion or all of a deferred tax asset will not be realized. In determining whether a valuation allowance is needed requires an extensive analysis of positive and negative evidence regarding realization of the deferred tax assets and, inherent in that, an assessment of the likelihood of sufficient future taxable income. When there is a cumulative pretax loss for financial reporting for the current and two preceding years (i.e., a three year cumulative loss), this is a significant element of negative evidence that would be difficult to overcome on a more likely than not or any other basis. Therefore, the net increase in valuation allowance of
$308.8 million
during
2019
is primarily related to the portion of the Luxembourg NOL that we project will not be utilized prior to expiration.
We have not recognized deferred taxes on cumulative earnings of non-Luxembourg affiliates as we have chosen to indefinitely reinvest these earnings, except for the Philippines. Taxes of
$0.9 million
were provided on the Philippines earnings. The other non-Luxembourg earnings reinvested as of
December 31, 2019
were approximately
$81.0 million
, which if distributed would result in additional tax due totaling approximately
$15.9 million
.
The Company had a deferred tax asset of
$338.4 million
as of
December 31, 2019
relating to Luxembourg, U.S. federal, state and foreign net operating losses compared to
$353.2 million
as of
December 31, 2018
. As of
December 31, 2019
and
2018
, a valuation allowance of
$337.7 million
and
$45.0 million
, respectively, has been established related to Luxembourg NOLs and a valuation allowance of
$0.6 million
and
$1.5 million
, respectively, has been established related to state NOLs. The gross amount of net operating losses available for carryover to future years is approximately
$1,355.4 million
as of
December 31, 2019
and approximately
$1,355.5 million
as of
December 31, 2018
. These losses are scheduled to expire between the years 2023 and 2039. As of December 31,
2018
,
$7.4 million
of our NOLs are subject to Section 382 of the Internal Revenue Code which limits the application of these NOLs against federal taxable income to approximately
$1.3 million
per year. The remaining NOLs subject to the Section 382 limitation were included in the sale of the Financial Services Business on July 1, 2019.
As part of the sale of the Financial Services Business, a capital loss deferred tax assets of
$9.6 million
was created in the U.S. Because it is not more likely than not the Company will have sufficient taxable income of the appropriate character (a capital gain) in the carryforward period, a full valuation allowance has been established related to the capital loss.
80
ALTISOURCE PORTFOLIO SOLUTIONS S.A.
Notes to Consolidated Financial Statements (
Continued
)
On April 25, 2019, the Luxembourg Parliament voted to approve the 2019 Budget Law. The new legislation reduced the overall effective corporate income tax rate from
26.01%
to
24.94%
for accounting periods beginning on or after January 1, 2019. The Company remeasured certain deferred tax assets and liabilities based on the rates at which they are expected to reverse in the future, which is generally
24.94%
. As of December 31, 2019, the amount recorded related to remeasurement of our deferred tax balance was
$14.0 million
.
On December 22, 2017, the Jobs Act was enacted, which reforms corporate tax legislation in the United States and related laws. One of the provisions of the new tax law reduces the U.S. federal corporate tax rate from
35.0%
to
21.0%
. The Company remeasured certain deferred tax assets and liabilities based on the rates at which they are expected to reverse in the future, which is generally
21.0%
. As of December 31, 2018, the amount recorded related to the remeasurement of our deferred tax balance was
$(0.2) million
.
In addition, the Company had a deferred tax asset of
$0.2 million
and
$0.3 million
as of
December 31, 2019
and
2018
, respectively, relating to state tax credits. The state tax credit carryforward is scheduled to expire with the filing of state income tax returns for the tax years 2019 through 2028.
Income tax computed by applying the Luxembourg statutory rate differs from income tax computed at the effective tax rate primarily from differences between the Luxembourg statutory and foreign statutory tax rates applied to entities in different jurisdictions, shown in the tax rate reconciliation table below as tax rate differences on foreign earnings, increases in uncertain tax positions, state taxes, remeasurement of deferred taxes related to tax rate changes, recognition of net operating losses created by the December 27, 2017 legal entity merger (see above), an increase in unrecognized tax benefits and a valuation allowance against deferred tax assets the Company believes it is more likely than not will not be realized.
The following table reconciles the Luxembourg statutory tax rate to our effective tax rate for the years ended
December 31
:
|
2019
|
2018
|
2017
|
|||||||
|
Statutory tax rate
|
24.94
|
%
|
26.01
|
%
|
27.08
|
%
|
|||
|
Change in valuation allowance
|
2,526.53
|
|
43.08
|
|
119.20
|
|
|||
|
State tax expense
|
(1.63
|
)
|
28.58
|
|
0.50
|
|
|||
|
Tax credits
|
—
|
|
—
|
|
(2.13
|
)
|
|||
|
Uncertain
tax positions
|
39.60
|
|
114.18
|
|
30.16
|
|
|||
|
Unrecognized tax loss
|
(67.18
|
)
|
—
|
|
(1,008.20
|
)
|
|||
|
Income tax rate change
|
—
|
|
—
|
|
57.36
|
|
|||
|
Tax rate differences on foreign earnings
|
28.75
|
|
73.11
|
|
—
|
|
|||
|
Other
|
7.85
|
|
7.96
|
|
(4.91
|
)
|
|||
|
Effective tax rate
|
2,558.86
|
%
|
292.92
|
%
|
(780.94
|
)%
|
|||
The Company follows ASC Topic 740 which clarifies the accounting and disclosure for uncertainty in tax positions. We analyzed our tax filing positions in the domestic and foreign tax jurisdictions where we are required to file income tax returns as well as for all open tax years subject to audit in these jurisdictions. The Company has open tax years in the United States (2016 through 2018), India (2011 through 2019) and Luxembourg (2014 through 2018).
The following table summarizes changes in unrecognized tax benefits during the years ended
December 31
:
|
(in thousands)
|
2019
|
2018
|
||||||
|
Amount of unrecognized tax benefits as of the beginning of the year
|
$
|
9,687
|
|
$
|
8,892
|
|
||
|
Decreases as a result of tax positions taken in a prior period
|
(192
|
)
|
(956
|
)
|
||||
|
Increases as a result of tax positions taken in a prior period
|
22
|
|
1
|
|
||||
|
Increases as a result of tax positions taken in the current period
|
250
|
|
1,750
|
|
||||
|
Amount of unrecognized tax benefits as of the end of the year
|
$
|
9,767
|
|
$
|
9,687
|
|
||
The total amount of unrecognized tax benefits including interest and penalties that, if recognized, would affect the effective tax rate is
$13.5 million
and
$13.0 million
as of
December 31, 2019
and
2018
, respectively. The Company recognizes interest, if any, related to unrecognized tax benefits as a component of income tax expense. As of
December 31, 2019
and
2018
, the Company had recorded accrued interest and penalties related to unrecognized tax benefits of
$3.7 million
and
$3.3 million
, respectively.
81
ALTISOURCE PORTFOLIO SOLUTIONS S.A.
Notes to Consolidated Financial Statements (
Continued
)
NOTE 23
—
EARNINGS PER SHARE
Basic (loss) earnings per share is computed by dividing net (loss) income available to common shareholders by the weighted average number of common shares outstanding for the period. Diluted earnings per share reflects the assumed conversion of all dilutive securities using the treasury stock method. Diluted net loss per share excludes all dilutive securities because their impact would be anti-dilutive, as described below.
Basic and diluted (loss) earnings per share are calculated as follows for the years ended
December 31
:
|
(in thousands, except per share data)
|
2019
|
2018
|
2017
|
|||||||||
|
Net (loss) income attributable to Altisource
|
$
|
(307,969
|
)
|
$
|
(5,382
|
)
|
$
|
308,891
|
|
|||
|
Weighted average common shares outstanding, basic
|
15,991
|
|
17,073
|
|
18,183
|
|
||||||
|
Dilutive effect of stock options, restricted shares and
restricted share units |
—
|
|
—
|
|
509
|
|
||||||
|
Weighted average common shares outstanding, diluted
|
15,991
|
|
17,073
|
|
18,692
|
|
||||||
|
(Loss) earnings per share:
|
||||||||||||
|
Basic
|
$
|
(19.26
|
)
|
$
|
(0.32
|
)
|
$
|
16.99
|
|
|||
|
Diluted
|
$
|
(19.26
|
)
|
$
|
(0.32
|
)
|
$
|
16.53
|
|
|||
For the years ended
December 31, 2019
,
2018
and
2017
,
1.6 million
,
1.2 million
and
0.8 million
, respectively, stock options, restricted shares and restricted share units were excluded from the computation of diluted (loss) earnings per share, as a result of the following:
|
•
|
As a result of the net loss attributable to Altisource for the years ended
December 31, 2019
and
2018
,
0.3 million
and
0.5 million
stock options, restricted shares and restricted share units were excluded from the computation of diluted loss per share, as their impacts were anti-dilutive
|
|
•
|
For the years ended
December 31, 2019
,
2018
and
2017
,
0.5 million
,
0.3 million
and
0.5 million
, respectively, stock options were anti-dilutive and have been excluded from the computation of diluted (loss) earnings per share because their exercise price was greater than the average market price of our common stock
|
|
•
|
For the years ended
December 31, 2019
,
2018
and
2017
,
0.8 million
,
0.5 million
and
0.4 million
, respectively, stock options, restricted shares and restricted share units, which begin to vest upon the achievement of certain market criteria related to our common stock price, performance criteria and an annualized rate of return to shareholders that have not yet been met have been excluded from the computation of diluted (loss) earnings per share.
|
NOTE 24
—
RESTRUCTURING CHARGES
In August 2018, Altisource initiated Project Catalyst, a project intended to optimize its operations and reduce costs to better align its cost structure with its anticipated revenues and improve its operating margins. During the years ended
December 31, 2019
and
2018
, Altisource incurred
$14.1 million
and
$11.6 million
, respectively, of severance costs, professional services fees, facility consolidation costs, technology costs and business wind down costs related to the reorganization plan. We expect to incur additional severance costs, professional services fees, technology costs and facility consolidation costs in connection with this internal reorganization, automation and other technology related activities and will expense those costs as incurred. Based on our analysis, we currently anticipate the future costs relating to Project Catalyst to be in the range of approximately
$10 million
to
$13 million
.
NOTE 25
—
COMMITMENTS, CONTINGENCIES AND REGULATORY MATTERS
We record a liability for contingencies if an unfavorable outcome is probable and the amount of loss can be reasonably estimated, including expected insurance coverage. For proceedings where the reasonable estimate of loss is a range, we record a best estimate of loss within the range.
Litigation
We are currently involved in legal actions in the course of our business, some of which seek monetary damages. We do not believe that the outcome of these proceedings, both individually and in the aggregate, will have a material impact on our financial condition, results of operations or cash flows.
82
ALTISOURCE PORTFOLIO SOLUTIONS S.A.
Notes to Consolidated Financial Statements (
Continued
)
Regulatory Matters
Periodically, we are subject to audits, examinations and investigations by federal, state and local governmental authorities and receive subpoenas, civil investigative demands or other requests for information from such governmental authorities in connection with their regulatory or investigative authority. We are currently responding to such inquiries from governmental authorities relating to certain aspects of our business. We believe it is premature to predict the potential outcome or to estimate any potential financial impact in connection with these inquiries.
Sales Taxes
On June 21, 2018, the United States Supreme Court rendered a 5-4 majority decision in South Dakota v. Wayfair, Inc., holding that a state may require a remote seller with no physical presence in the state to collect and remit sales tax on goods and services provided to purchasers in the state, overturning existing court precedent. During the year ended December 31, 2019, the Company completed the analysis of its services for potential exposure to sales tax in various jurisdictions in the United States. The Company recognized a
$0.3 million
and
$6.2 million
net loss for the years ended December 31, 2019 and 2018, respectively in selling, general and administrative expenses in the accompanying consolidated statements of operations and comprehensive income (loss). During the year ended December 31, 2019, we recognized a net reimbursement from clients of
$1.7 million
of sales taxes previously accrued and paid. The Company began invoicing, collecting and remitting sales tax in applicable jurisdictions in 2019. The Company is also in the process of seeking additional reimbursements for sales tax payments from clients; however, there can be no assurance that the Company will be successful in collecting some or all of such additional reimbursements. Future changes in our estimated sales tax exposure could result in a material adjustment to our consolidated financial statements, which would impact our financial condition and results of operations.
Ocwen Related Matters
As discussed in
Note 3
, during the year ended
December 31, 2019
, Ocwen was our largest customer, accounting for
56%
of our total revenue. Additionally,
6%
of our revenue for the year ended
December 31, 2019
was earned on the loan portfolios serviced by Ocwen, when a party other than Ocwen or the MSR owner selected Altisource as the service provider.
Ocwen has disclosed that it is subject to a number of ongoing federal and state regulatory examinations, consent orders, inquiries, subpoenas, civil investigative demands, requests for information and other actions and is subject to pending legal proceedings, some of which include claims against Ocwen for substantial monetary damages. In addition to monetary damages, various complaints have sought to obtain permanent injunctive relief, consumer redress, refunds, restitution, disgorgement, civil penalties, costs and fees and other relief. Existing or future similar matters could result in, and in some cases, have resulted in, adverse regulatory or other actions against Ocwen. Previous regulatory actions against Ocwen have subjected Ocwen to independent oversight of its operations and placed certain restrictions on its ability to acquire servicing rights. In addition to the above, Ocwen may become subject to future adverse regulatory or other actions.
Ocwen has disclosed that NRZ is its largest client. As of December 31,
2019
, NRZ owned MSRs or rights to MSRs relating to approximately
56%
of loans serviced and subserviced by Ocwen (measured in UPB). In July 2017 and January 2018, Ocwen and NRZ entered into a series of agreements pursuant to which the parties agreed, among other things, to undertake certain actions to facilitate the transfer from Ocwen to NRZ of Ocwen’s legal title to the Subject MSRs and under which Ocwen will subservice mortgage loans underlying the Subject MSRs for an initial term of
five
years. NRZ can terminate its sub-servicing agreement with Ocwen in exchange for the payment of a termination fee.
The existence or outcome of Ocwen regulatory matters or the termination of the NRZ sub-servicing agreement with Ocwen may have significant adverse effects on Ocwen’s business and/or our continuing relationship with Ocwen. For example, Ocwen may be required to alter the way it conducts business, including the parties it contracts with for services, it may be required to seek changes to its existing pricing structure with us, it may lose its non-government-sponsored enterprise (“GSE”) servicing rights or subservicing arrangements or may lose one or more of its state servicing or origination licenses. Additional regulatory actions or adverse financial developments may impose additional restrictions on or require changes in Ocwen’s business that could require it to sell assets or change its business operations. Any or all of these effects and others could result in our eventual loss of Ocwen as a customer or a reduction in the number and/or volume of services they purchase from us or the loss of other customers.
83
ALTISOURCE PORTFOLIO SOLUTIONS S.A.
Notes to Consolidated Financial Statements (
Continued
)
If any of the following events occurred, Altisource’s revenue could be significantly lower and our results of operations could be materially adversely affected, including from the possible impairment or write-off of goodwill, intangible assets, property and equipment, other assets and accounts receivable:
|
•
|
Altisource loses Ocwen as a customer or there is a significant reduction in the volume of services they purchase from us
|
|
•
|
We could also be impacted if Ocwen loses, sells or transfers a significant portion of its GSE and Federal Housing Administration servicing rights or subservicing arrangements or remaining non-GSE servicing rights or subservicing arrangements and Altisource fails to be retained as a service provider
|
|
•
|
The contractual relationship between Ocwen and NRZ changes significantly and this change results in a change in our status as a provider of services related to the Subject MSRs
|
|
•
|
Ocwen loses state servicing licenses in states with a significant number of loans in Ocwen’s servicing portfolio
|
|
•
|
The contractual relationship between Ocwen and Altisource changes significantly or there are significant changes to our pricing to Ocwen for services from which we generate material revenue
|
|
•
|
Altisource otherwise fails to be retained as a service provider
|
Management cannot predict whether any of these events will occur or the amount of any impact they may have on Altisource. However, in the event one or more of these events materially negatively impact Altisource, we believe the variable nature of our cost structure would allow us to realign our cost structure in line with remaining revenue and that current liquidity and cash flows from operations, would be sufficient to meet our working capital, capital expenditures, debt service and other cash needs. There can be no assurance that our plans will be successful or our operations will be profitable. We are also focused on diversifying and growing our revenue and customer base and we have a sales and marketing strategy to support these efforts.
Leases
We lease certain premises and equipment, primarily consisting of office space and information technology equipment. Effective January 1, 2019, we adopted the provisions of Topic 842, resulting in recognition of
$42.1 million
of right-of-use assets in right-of-use-assets under operating leases and
$45.5 million
of operating lease liabilities (see Note 2). Certain of our leases include options to renew at our discretion or terminate leases early, and these options are considered in our determination of the expected lease term. Certain of our lease agreements include rental payments adjusted periodically for inflation. Our lease agreements generally do not contain any material residual value guarantees or material restrictive covenants. We sublease certain office space to third parties. Sublease income was
$1.7 million
,
$1.6 million
and
$1.3 million
for the years ended
December 31, 2019
,
2018
and
2017
, respectively. The amortization period of right-of-use assets are generally limited by the expected lease term. Our leases generally have expected lease terms at adoption of
one
to
six
years.
Information about our lease terms and our discount rate assumption is as follows:
|
As of December 31, 2019
|
|||
|
Weighted average remaining lease term (in years)
|
3.23
|
|
|
|
Weighted average discount rate
|
7.11
|
%
|
|
Our lease activity during the year ended December 31, 2019 is as follows:
|
(in thousands)
|
||||||
|
Operating lease costs:
|
||||||
|
Selling, general and administrative expense
|
$
|
10,698
|
|
|||
|
Cost of revenue
|
2,757
|
|
||||
|
Cash used in operating activities for amounts included in the measurement
of lease liabilities |
$
|
15,446
|
|
|||
|
Short-term (less than one year) lease costs
|
4,999
|
|
||||
84
ALTISOURCE PORTFOLIO SOLUTIONS S.A.
Notes to Consolidated Financial Statements (
Continued
)
Maturities of our lease liabilities as of December 31, 2019 are as follows:
|
(in thousands)
|
Operating lease obligations
|
|||
|
2020
|
$
|
11,756
|
|
|
|
2021
|
9,077
|
|
||
|
2022
|
6,190
|
|
||
|
2023
|
4,818
|
|
||
|
2024
|
2,935
|
|
||
|
Thereafter
|
599
|
|
||
|
Total lease payments
|
35,375
|
|
||
|
Less interest
|
(4,270
|
)
|
||
|
Present value of lease liabilities
|
$
|
31,105
|
|
|
We have executed
four
standby letters of credit totaling
$1.0 million
related to
four
office leases that are secured by restricted cash balances.
Escrow Balances
We hold customers’ assets in escrow accounts at various financial institutions pending completion of certain real estate activities. These amounts are held in escrow accounts for limited periods of time and are not included in the consolidated balance sheets. Amounts held in escrow accounts were
$12.3 million
and
$23.6 million
as of
December 31, 2019
and
2018
, respectively.
NOTE 26
—
QUARTERLY FINANCIAL DATA (UNAUDITED)
The following tables contain selected unaudited statement of operations information for each quarter of
2019
and
2018
. The following information reflects all recurring adjustments necessary for a fair presentation of the information for the periods presented. The operating results for any quarter are not necessarily indicative of results for any future period. Our business can be affected by seasonality.
|
2019 quarter ended (1)(2)(3)(4)(5)(6)(7)
|
||||||||||||||||
|
(in thousands, except per share data)
|
March 31,
|
June 30,
|
September 30,
|
December 31,
|
||||||||||||
|
Revenue
|
$
|
169,935
|
|
$
|
196,535
|
|
$
|
141,493
|
|
$
|
140,688
|
|
||||
|
Gross profit
|
45,831
|
|
43,894
|
|
30,587
|
|
35,083
|
|
||||||||
|
(Loss) income before income taxes and non-controlling interests
|
(3,966
|
)
|
11,909
|
|
12,955
|
|
(8,459
|
)
|
||||||||
|
Net (loss) income
|
(2,744
|
)
|
(4,604
|
)
|
7,576
|
|
(306,085
|
)
|
||||||||
|
Net (loss) income attributable to Altisource
|
(3,184
|
)
|
(5,844
|
)
|
7,165
|
|
(306,106
|
)
|
||||||||
|
(Loss) earnings per share:
|
||||||||||||||||
|
Basic
|
$
|
(0.20
|
)
|
$
|
(0.36
|
)
|
$
|
0.45
|
|
$
|
(19.66
|
)
|
||||
|
Diluted
|
$
|
(0.20
|
)
|
$
|
(0.36
|
)
|
$
|
0.44
|
|
$
|
(19.66
|
)
|
||||
|
Weighted average shares outstanding:
|
||||||||||||||||
|
Basic
|
16,292
|
|
16,214
|
|
15,897
|
|
15,568
|
|
||||||||
|
Diluted
|
16,292
|
|
16,214
|
|
16,151
|
|
15,568
|
|
||||||||
85
ALTISOURCE PORTFOLIO SOLUTIONS S.A.
Notes to Consolidated Financial Statements (
Continued
)
|
2018 quarter ended (1)(2)(3)(4)(5)(6)(7)(8)
|
||||||||||||||||
|
(in thousands, except per share data)
|
March 31,
|
June 30,
|
September 30,
|
December 31,
|
||||||||||||
|
Revenue
|
$
|
197,438
|
|
$
|
218,556
|
|
$
|
204,575
|
|
$
|
217,633
|
|
||||
|
Gross profit
|
50,244
|
|
55,350
|
|
56,995
|
|
53,448
|
|
||||||||
|
(Loss) income before income taxes and non-controlling interests
|
(4,972
|
)
|
3,071
|
|
16,129
|
|
(12,829
|
)
|
||||||||
|
Net (loss) income
|
(3,607
|
)
|
2,255
|
|
9,521
|
|
(10,868
|
)
|
||||||||
|
Net (loss) income attributable to Altisource
|
(4,132
|
)
|
1,568
|
|
8,667
|
|
(11,485
|
)
|
||||||||
|
(Loss) earnings per share:
|
||||||||||||||||
|
Basic
|
$
|
(0.24
|
)
|
$
|
0.09
|
|
$
|
0.51
|
|
$
|
(0.69
|
)
|
||||
|
Diluted
|
$
|
(0.24
|
)
|
$
|
0.09
|
|
$
|
0.49
|
|
$
|
(0.69
|
)
|
||||
|
Weighted average shares outstanding:
|
||||||||||||||||
|
Basic
|
17,378
|
|
17,142
|
|
17,033
|
|
16,745
|
|
||||||||
|
Diluted
|
17,378
|
|
17,553
|
|
17,575
|
|
16,745
|
|
||||||||
______________________________________
|
(1)
|
The sum of quarterly amounts, including per share amounts, may not equal amounts reported for year-to-date periods. This is due to the effects of rounding and changes in the number of weighted average shares outstanding for each period.
|
|
(2)
|
During the fourth quarter of 2019, we recognized net income tax provision of
$318.3 million
, which included an increase in the valuation allowance in connection with the Luxembourg net operating loss carryforward of
$291.5 million
, the impact of a decrease in the Luxembourg statutory income tax rate on deferred taxes of
$1.7 million
and foreign income tax reserves of
$5.6 million
. During the second quarter of 2019, we recognized
$12.3 million
as a result of the change in the Luxembourg statutory income tax rate on deferred taxes. In addition, during the third quarter of 2018, we recognized foreign income tax reserves of
$1.6 million
. See
Note 22
.
|
|
(3)
|
In July 2019, we sold the Financial Services business to TSI for
$44.0 million
consisting of an up-front payment of
$40.0 million
, subject to a working capital adjustment and transaction costs upon closing of the sale, and an additional
$4.0 million
payment on the one year anniversary of the sale closing. We recognized a
$17.6 million
pretax gain on sale in the third quarter of 2019 and a working capital true-up gain of an additional
$0.3 million
in the fourth quarter of 2019. In August 2018, we sold our rental property management business to RESI for total transaction proceeds of
$18.0 million
,
$15.0 million
of which was received on the closing date of August 8, 2018 and
$3.0 million
of which will be received on the earlier of a RESI change of control or August 8, 2023. We recognized a
$13.7 million
pretax gain on the sale of this business in the third quarter of 2018. See
Note 4
.
|
|
(4)
|
During the first quarter of 2019, second quarter of 2019, third quarter of 2019 and fourth quarter of 2019, we recognized unrealized (losses) gains from our investment in RESI common shares of
$2.2 million
,
$11.8 million
,
$(2.3) million
and
$2.7 million
, respectively. During the first quarter of 2018, second quarter of 2018, third quarter of 2018 and fourth quarter of 2018, we recognized unrealized (losses) gains from our investment in RESI common shares of
$(7.5) million
,
$1.5 million
,
$1.8 million
and
$(8.8) million
, respectively. See
Note 5
.
|
|
(5)
|
In August 2018, we initiated Project Catalyst, a restructuring plan intended to optimize our operations and reduce costs to align our cost structure with our anticipated revenues and improve our operating margins. During the first quarter of 2019, second quarter of 2019, third quarter of 2019 and fourth quarter of 2019, we recognized
$4.4 million
,
$1.9 million
,
$2.8 million
and
$5.0 million
, respectively, of severance costs, professional services fees, facility consolidation costs, technology costs and business wind down costs related to the restructuring plan. During the third quarter of 2018 and fourth quarter of 2018 we recognized
$3.4 million
and
$8.1 million
, respectively, of severance costs, professional services fees and facility consolidation costs related to the restructuring plan. See
Note 24
.
|
|
(6)
|
In connection with the wind down of Owners.com, we wrote off
$5.2 million
of goodwill and
$0.7 million
of intangible assets during the fourth quarter of 2019. In November 2018, we announced our plans to sell the BRS Inventory and discontinue the BRS business. During the second quarter of 2019, we recognized a loss on the sale of the BRS Inventory of
$1.8 million
. We recognized a write-off of goodwill related to our plan to discontinue the BRS business of
$2.6 million
during the fourth quarter of 2018. See
Note 8
.
|
|
(7)
|
In connection with a United States Supreme Court decision in June 2018, we analyzed our services for potential exposure to sales tax in various jurisdictions in the United States and recognized an estimated probable loss of
$5.9 million
and
$0.4 million
during the third quarter of 2018 and fourth quarter of 2018, respectively. In addition, we recognized and additional loss of
$2.1 million
during the first quarter of 2019 and recognized a net reimbursement from clients of
$1.7 million
in the third quarter of 2019. See
Note 25
.
|
86
ALTISOURCE PORTFOLIO SOLUTIONS S.A.
Notes to Consolidated Financial Statements (
Continued
)
|
(8)
|
In April 2018, we entered into the Credit Agreement, pursuant to which, among other things, we borrowed
$412 million
in the form of Term B Loans. Proceeds from the Term B Loans were used to repay our prior senior secured term loan. In connection with the refinancing, we recognized a loss of
$4.4 million
from the write-off of the unamortized debt issuance costs and debt discount in the second quarter of 2018. See
Note 14
.
|
87
|
ITEM 9.
|
CHANGES IN AND DISAGREEMENTS WITH ACCOUNTANTS ON ACCOUNTING AND FINANCIAL DISCLOSURE
|
None.
|
ITEM 9A.
|
CONTROLS AND PROCEDURES
|
Evaluation of Disclosure Controls and Procedures
Our disclosure controls and procedures are designed to ensure that information required to be disclosed by us in the reports that we file or submit under the Securities Exchange Act of 1934, as amended (the “Exchange Act”), is recorded, processed, summarized and reported within the time periods specified in the SEC’s rules and forms. Disclosure controls and procedures include, without limitation, controls and procedures designed to ensure that information required to be disclosed by us in reports we file or submit under the Exchange Act is accumulated and communicated to our management, including the Chief Executive Officer and Chief Financial Officer, as appropriate, to allow timely decisions regarding required disclosure.
As of
December 31, 2019
, an evaluation was conducted under the supervision and with the participation of our management, including our Chief Executive Officer and Chief Financial Officer, of the effectiveness of our disclosure controls and procedures (as defined in Rule 13a-15(e) and Rule 15d-15(e) of the Exchange Act). Based on this evaluation, such officers have concluded that our disclosure controls and procedures were effective as of
December 31, 2019
.
Management’s Report on Internal Control over Financial Reporting
Management is responsible for establishing and maintaining adequate internal control over financial reporting, as defined in Rules 13a-15(f) and 15d-15(f) of the Exchange Act. Management has assessed the effectiveness of our internal control over financial reporting as of
December 31, 2019
based on criteria established in
Internal Control-Integrated Framework (2013)
issued by the Committee of Sponsoring Organizations of the Treadway Commission. As a result of this assessment, management concluded that, as of
December 31, 2019
, our internal control over financial reporting was effective in providing reasonable assurance regarding the reliability of financial reporting and the preparation of financial statements for external purposes in accordance with generally accepted accounting principles. Mayer Hoffman McCann P.C. has independently assessed the effectiveness of our internal control over financial reporting and its report is included herein.
Changes in Internal Control over Financial Reporting
There were no changes in our internal control over financial reporting (as defined in the Exchange Act Rules 13a-15(f) and 15d-15(f)) that occurred during the quarter ended
December 31, 2019
, that have materially affected, or are reasonably likely to materially affect, our internal control over financial reporting.
Limitations on Controls
Our disclosure controls and procedures and internal control over financial reporting are designed to provide reasonable assurance of achieving their objectives as specified above. Management does not expect, however, that our disclosure controls and procedures or our internal control over financial reporting will prevent or detect all error and fraud. Any control system, no matter how well designed and operated, is based upon certain assumptions and can provide only reasonable, not absolute, assurance that its objectives will be met. Further, no evaluation of controls can provide absolute assurance that misstatements due to error or fraud will not occur or that all control issues and instances of fraud, if any, within the Company have been detected.
|
ITEM 9B.
|
OTHER INFORMATION
|
None.
88
PART III
|
ITEM 10.
|
DIRECTORS, EXECUTIVE OFFICERS AND CORPORATE GOVERNANCE
|
The information required by this item is incorporated herein by reference to our definitive proxy statement in connection with our
2020
annual meeting of shareholders to be filed pursuant to Regulation 14A under the Exchange Act.
|
ITEM 11.
|
EXECUTIVE COMPENSATION
|
The information required by this item is incorporated herein by reference to our definitive proxy statement in connection with our
2020
annual meeting of shareholders to be filed pursuant to Regulation 14A under the Exchange Act.
|
ITEM 12.
|
SECURITY OWNERSHIP OF CERTAIN BENEFICIAL OWNERS AND MANAGEMENT AND RELATED STOCKHOLDER MATTERS
|
The information required by this item is incorporated herein by reference to our definitive proxy statement in connection with our
2020
annual meeting of shareholders to be filed pursuant to Regulation 14A under the Exchange Act.
|
ITEM 13.
|
CERTAIN RELATIONSHIPS AND RELATED TRANSACTIONS, AND DIRECTOR INDEPENDENCE
|
The information required by this item is incorporated herein by reference to our definitive proxy statement in connection with our
2020
annual meeting of shareholders to be filed pursuant to Regulation 14A under the Exchange Act.
|
ITEM 14.
|
PRINCIPAL ACCOUNTING FEES AND SERVICES
|
The information required by this item is incorporated herein by reference to our definitive proxy statement in connection with our
2020
annual meeting of shareholders to be filed pursuant to Regulation 14A under the Exchange Act.
89
PART IV
|
ITEM 15.
|
EXHIBITS, FINANCIAL STATEMENT SCHEDULES
|
|
(a)
|
The following documents are filed as part of this annual report.
|
|
|
1.
|
Financial Statements
|
|
|
See Item 8 above.
|
||
|
2.
|
Financial Statement Schedules:
|
|
|
Schedule II -
Valuation and Qualifying Accounts
- included below.
|
||
|
3.
|
Exhibits
:
|
|
|
Exhibit Number
|
Exhibit Description
|
|
|
4.1
*
|
||
90
91
|
10.32
**
|
||
92
93
94
|
23.1
*
|
||
|
31.1
*
|
||
|
31.2
*
|
||
|
32.1
*
|
||
|
101*
|
Pursuant to Rule 405 of Regulation S-T, the following financial information from the Company’s Annual Report on Form 10-K for the year ended December 31, 2019 is formatted in XBRL interactive data files: (i) Consolidated Balance Sheets as of December 31, 2019 and December 31, 2018; (ii) Consolidated Statements of Operations and Comprehensive Income (Loss) for each of the years in the three-year period ended December 31, 2019; (iii) Consolidated Statements of Equity for each of the years in the three-year period ended December 31, 2019 (iv) Consolidated Statements of Cash Flows for each of the years in the three-year period ended December 31, 2019; (v) Notes to Consolidated Financial Statements; and (vi) Financial Statement Schedule.
|
|
______________________________________
|
*
|
Filed herewith
|
|
|
**
|
Portions of this exhibit have been redacted pursuant to a request for confidential treatment. The non-public information has been filed separately with the Securities and Exchange Commission.
|
|
|
†
|
Denotes management contract or compensatory arrangement
|
|
95
|
SCHEDULE II.
|
VALUATION AND QUALIFYING ACCOUNTS
|
For the years ended
December 31, 2019
,
2018
and
2017
:
|
Additions
|
||||||||||||||||||||
|
(in thousands)
|
Balance at Beginning of Period
|
Charged to Expenses
|
Charged to Other Accounts Note
(1)
|
Deductions Note
(2)
|
Balance at End of Period
|
|||||||||||||||
|
Deductions from asset accounts:
|
||||||||||||||||||||
|
Allowance for doubtful accounts:
|
||||||||||||||||||||
|
Year 2019
|
$
|
10,883
|
|
|
$
|
720
|
|
|
$
|
(70
|
)
|
|
$
|
7,061
|
|
|
$
|
4,472
|
|
|
|
Year 2018
|
10,579
|
|
2,830
|
|
(7
|
)
|
2,519
|
|
10,883
|
|
||||||||||
|
Year 2017
|
10,424
|
|
5,116
|
|
(3,107
|
)
|
1,854
|
|
10,579
|
|
||||||||||
|
Valuation allowance for deferred tax assets:
|
||||||||||||||||||||
|
Year 2019
|
|
$
|
46,751
|
|
|
$
|
308,808
|
|
|
$
|
—
|
|
|
$
|
—
|
|
|
$
|
355,559
|
|
|
Year 2018
|
46,283
|
|
468
|
|
—
|
|
—
|
|
46,751
|
|
||||||||||
|
Year 2017
|
3,467
|
|
42,816
|
|
—
|
|
—
|
|
46,283
|
|
||||||||||
______________________________________
|
(1)
|
For allowance for doubtful accounts, primarily includes amounts previously written off which were credited directly to this account when recovered.
|
|
(2)
|
For allowance for doubtful accounts, amounts written off as uncollectible or transferred to other accounts or utilized.
|
96
SIGNATURES
Pursuant to the requirements of Section 13 or 15(d) of the Securities Exchange Act of 1934, the Registrant has duly caused this report to be signed on its behalf by the undersigned, thereunto duly authorized.
Date:
March 5, 2020
|
Altisource Portfolio Solutions S.A.
|
|||
|
By:
|
/s/ William B. Shepro
|
||
|
Name:
|
William B. Shepro
|
||
|
Title:
|
Chairman and Chief Executive Officer
|
||
|
(Principal Executive Officer)
|
|||
|
By:
|
/s/ Michelle D. Esterman
|
||
|
Name:
|
Michelle D. Esterman
|
||
|
Title:
|
Chief Financial Officer
|
||
|
(Principal Financial Officer and Principal Accounting Officer)
|
|||
Pursuant to the requirements of the Securities Exchange Act of 1934, this report has been signed below by the following persons on behalf of the registrant and in the capacities and on the dates indicated.
|
Signature
|
Title
|
Date
|
||
|
/s/ William B. Shepro
|
Chairman and Chief Executive Officer
|
March 5, 2020
|
||
|
William B. Shepro
|
(Principal Executive Officer)
|
|||
|
/s/ Scott E. Burg
|
Lead Independent Director
|
March 5, 2020
|
||
|
Scott E. Burg
|
||||
|
/s/ Joseph L. Morettini
|
Director
|
March 5, 2020
|
||
|
Joseph L. Morettini
|
||||
|
/s/ Roland Müller-Ineichen
|
Director
|
March 5, 2020
|
||
|
Roland Müller-Ineichen
|
||||
|
/s/ Michelle D. Esterman
|
Chief Financial Officer
|
March 5, 2020
|
||
|
Michelle D. Esterman
|
(Principal Financial Officer and Principal Accounting Officer)
|
|||
97
TABLE OF CONTENTS
Part IItem 1. BusinessItem 1A. Risk FactorsItem 1B. Unresolved Staff CommentsItem 2. PropertiesItem 3. Legal ProceedingsItem 4. Mine Safety DisclosuresPart IIItem 5. Market For Registrant S Common Equity, Related Stockholder Matters and Issuer Purchases Of Equity SecuritiesItem 6. Selected Financial DataItem 7. Management S Discussion and Analysis Of Financial Condition and Results Of OperationsItem 7A. Quantitative and Qualitative Disclosures About Market RiskItem 8. Financial Statements and Supplementary DataNote 1 OrganizationNote 2 Basis Of Presentation and Summary Of Significant Accounting PoliciesNote 3 Customer ConcentrationNote 4 Sale Of BusinessesNote 5 Investment in Equity SecuritiesNote 6 Accounts Receivable, NetNote 7 Prepaid Expenses and Other Current AssetsNote 8 Discontinuation Of Lines Of BusinessNote 9 Premises and Equipment, NetNote 10 Right-of-use Assets Under Operating Leases, NetNote 11 Goodwill and Intangible Assets, NetNote 12 Other AssetsNote 13 Accounts Payable, Accrued Expenses and Other Current LiabilitiesNote 14 Long-term DebtNote 15 Other Non-current LiabilitiesNote 16 Fair Value Measurements and Financial InstrumentsNote 17 Shareholders Equity and Share-based CompensationNote 18 RevenueNote 19 Cost Of RevenueNote 20 Selling, General and Administrative ExpensesNote 21 Other Income (expense), NetNote 22 Income TaxesNote 23 Earnings Per ShareNote 24 Restructuring ChargesNote 25 Commitments, Contingencies and Regulatory MattersNote 26 Quarterly Financial Data (unaudited)Item 9. Changes in and Disagreements with Accountants on Accounting and Financial DisclosureItem 9A. Controls and ProceduresItem 9B. Other InformationPart IIIItem 10. Directors, Executive Officers and Corporate GovernanceItem 11. Executive CompensationItem 12. Security Ownership Of Certain Beneficial Owners and Management and Related Stockholder MattersItem 13. Certain Relationships and Related Transactions, and Director IndependenceItem 14. Principal Accounting Fees and ServicesPart IVItem 15. Exhibits, Financial Statement Schedules