UNITED STATES
SECURITIES AND EXCHANGE COMMISSION
Washington, D.C. 20549
FORM 20-F
(Mark One)
| REGISTRATION STATEMENT PURSUANT TO SECTION 12(b) OR 12(g) OF THE SECURITIES EXCHANGE ACT OF 1934 |
OR
| ANNUAL REPORT PURSUANT TO SECTION 13 OR 15(d) OF THE SECURITIES EXCHANGE ACT OF 1934 |
For the fiscal year ended December 31 , 2021
OR
| TRANSITION REPORT PURSUANT TO SECTION 13 OR 15(d) OF THE SECURITIES EXCHANGE ACT OF 1934 |
OR
| SHELL COMPANY REPORT PURSUANT TO SECTION 13 OR 15(d) OF THE SECURITIES ACT OF 1934 |
Commission file number: 001-16125
日月光投資控股股份有限公司
(Exact name of Registrant as specified in its charter)
(Translation of Registrant’s name into English)
(Jurisdiction of incorporation or organization)
Republic of China
(Address of principal executive offices)
Republic of China
Tel: 886-2 -6636-5678
Fax: 882-2-2757-6121
Email: ir@aseglobal.com
(Name, Telephone,
E-mail
and/or Facsimile number and Address of Company Contact Person) Securities registered or to be registered pursuant to Section 12(b) of the Act:
| Title of Each Class |
Trading Symbol(s) |
Name of Each Exchange on which Registered | ||
| * | Traded in the form of American Depositary Receipts evidencing American Depositary Shares (the “ADSs”), each representing two common shares of ASE Technology Holding Co., Ltd. |
Securities registered or to be registered pursuant to Section 12(g) of the Act:
None
Securities for which there is a reporting obligation pursuant to Section 15(d) of the Act:
None
Indicate the number of outstanding shares of each of the issuer’s classes of capital or common stock as of the close of the period covered by the annual report.
As of December 31, 2021, 4,408,018,732 Common Shares, par value NT$10 each were outstanding.**
Indicate by check mark if the registrant is a well-known seasoned issuer, as defined in Rule 405 of the Securities Act.
If this report is an annual or transition report, indicate by check mark if the registrant is not required to file reports pursuant to Section 13 or 15(d) of the Securities Exchange Act of 1934.
Yes ☐ No ☒
Indicate by check mark whether the registrant (1) has filed all reports required to be filed by Section 13 or 15(d) of the Securities Exchange Act of 1934 during the preceding 12 months (or for such shorter period that the registrant was required to file such reports), and (2) has been subject to such filing requirements for the past 90 days.
Indicate by check mark whether the registrant has submitted electronically every Interactive Data File required to be submitted pursuant to Rule 405 of Regulation
S-T
(§232.405 of this chapter) during the preceding 12 months (or for such shorter period that the registrant was required to submit such files). Indicate by check mark whether the Registrant is a large accelerated filer, an accelerated filer, or a
non-accelerated
filer, or an emerging growth company. See definition of “large accelerated filer,” “accelerated filer, and “emerging growth company” in Rule 12b-2
of the Exchange Act. (Check one): | ☒ | Accelerated Filer | ☐ | Non-accelerated Filer |
☐ | ||||||
| Emerging growth company | ||||||||||
If an emerging growth company that prepares its financial statements in accordance with U.S. GAAP, indicate by check mark if the registrant has elected not to use the extended transition period for complying with any new or revised financial accounting standards† provided pursuant to Section 13(a) of the Exchange Act. ☐
† The term “new or revised financial accounting standard” refers to any update issued by the Financial Accounting Standards Board to its Accounting Standards Codification after April 5, 2012.
Indicate by check mark whether the registrant has filed a report on and attestation to its management’s assessment of the effectiveness of its internal control over financial reporting under Section 404(b) of the Sarbanes-Oxley Act (15 U.S.C. 7262(b)) by the registered public accounting firm that prepared or issued its audit report. ☒
Indicate by check mark which basis of accounting the registrant has used to prepare the financial statements included in this filing:
| U.S. GAAP ☐ | |
Other ☐ | ||||||
| by the International Accounting Standards Board | ☒ |
If “Other” has been checked in response to the previous question, indicate by check mark which financial statement item the registrant has elected to follow.
☐ Item 17 ☐ Item 18
If this is an annual report, indicate by check mark whether the registrant is a shell company (as defined in Rule
12b-2
of the Exchange Act). Yes ☐ No ☒
** As a result of the exercise of employee stock options subsequent to December 31, 2021, as of January 31, 2022, we had 4,410,443,432 Common Shares outstanding.
TABLE OF CONTENTS
Page |
||||
1 |
||||
5 |
||||
6 |
||||
6 |
||||
6 |
||||
6 |
||||
6 |
||||
6 |
||||
6 |
||||
29 |
||||
29 |
||||
32 |
||||
55 |
||||
57 |
||||
62 |
||||
62 |
||||
62 |
||||
69 |
||||
72 |
||||
73 |
||||
74 |
||||
74 |
||||
74 |
||||
80 |
||||
82 |
||||
82 |
||||
83 |
||||
83 |
||||
83 |
||||
85 |
||||
86 |
||||
86 |
||||
86 |
||||
88 |
||||
88 |
||||
88 |
||||
88 |
||||
88 |
||||
88 |
||||
89 |
||||
89 |
||||
89 |
||||
89 |
||||
89 |
||||
94 |
||||
96 |
||||
98 |
||||
98 |
||||
102 |
||||
102 |
||||
102 |
||||
102 |
||||
103 |
||||
i
106 |
||||
106 |
||||
106 |
||||
106 |
||||
106 |
||||
108 |
||||
108 |
||||
108 |
||||
108 |
||||
112 |
||||
112 |
||||
112 |
||||
112 |
||||
113 |
||||
113 |
||||
114 |
||||
114 |
||||
118 |
||||
118 |
||||
119 |
||||
119 |
||||
119 |
||||
119 |
ii
USE OF CERTAIN TERMS
Unless the context otherwise requires, references in this annual report to:
| ● | “Advanced Shanghai” are to ASE Advanced Semiconductor (Shanghai) Limited, a company incorporated under the laws of the P.R.C. that spun off from ASESH AT in November 2020 and was disposed of in December 2021; |
| ● | “ASDI” are to ASDI Assistance Direction S.A.S., a simplified limited liability company (societe par actions simplifiee) organized under the laws of France; |
| ● | “ASE,” “ASE Inc.” or “ASE Group” are to Advanced Semiconductor Engineering Inc. and, unless the context requires otherwise, its subsidiaries; |
| ● | “ASE Chung Li” are to ASE (Chung Li) Inc., a company previously incorporated under the laws of the R.O.C. that merged into ASE Inc. in 2004; |
| ● | “ASE Electronics” are to ASE Electronics Inc., a company incorporated under the laws of the R.O.C.; |
| ● | “ASE Japan” are to ASE Japan Co. Ltd., a company incorporated under the laws of Japan; |
| ● | “ASE Korea” are to ASE (Korea) Inc., a company incorporated under the laws of the Republic of Korea; |
| ● | “ASE Material” are to ASE Material Inc., a company previously incorporated under the laws of the R.O.C. that merged into ASE Inc. in 2004; |
| ● | “ASE Shanghai” are to ASE (Shanghai) Inc., a company incorporated under the laws of the P.R.C.; |
| ● | “ASE Test” are to ASE Test Limited, a company incorporated under the laws of Singapore; |
| ● | “ASE Malaysia” are to ASE Electronics (M) Sdn. Bhd., a company incorporated under the laws of Malaysia; |
| ● | “ASE Test Taiwan” are to ASE Test, Inc., a company incorporated under the laws of the R.O.C.; |
| ● | “ASEEE” are to ASE Embedded Electronics Inc., a company incorporated under the laws of the R.O.C. that merged into ASE Inc. in February 2020; |
| ● | “ASEH,” the “Company,” “ASE Technology Holding,” “we,” “us” or “our” are to ASE Technology Holding Co., Ltd. and, unless the context requires otherwise, its subsidiaries; |
| ● | “ASEKS” are to ASE (Kunshan) Inc., a company incorporated under the laws of the P.R.C. and was disposed of in December 2021; |
| ● | “ASEN” are to Suzhou ASEN Semiconductors Co., Ltd., a company incorporated under the laws of the P.R.C. and was disposed of in December 2021; |
| ● | “ASESH AT” are to ASE Assembly Test (Shanghai) Limited, formerly known as Global Advanced Packaging Technology Limited, or GAPT, a company incorporated under the laws of the P.R.C.; |
| ● | “ASEWH” are to ASE (Weihai), Inc., a company incorporated under the laws of the P.R.C. and was disposed of in December 2021; |
| ● | “Deposit Agreement” are to the deposit agreement, dated April 30, 2018, by and among ASE Technology Holding Co., Ltd., a company organized under the laws of the R.O.C. and previously known as “ASE Industrial Holding Co., Ltd.,” Citibank, N.A., as Depositary, and the Holders and Beneficial Owners of American Depositary Shares issued thereunder; |
1
| ● | “EEMS Test Singapore” are to EEMS Test Singapore Pte. Ltd., a company incorporated under the laws of Singapore, which changed its name to ASE Singapore II Pte. Ltd. and was subsequently merged into ASE Singapore Pte. Ltd. in 2011; |
| ● | “EMS” are to electronic manufacturing services; |
| ● | “EU” are to the European Union; |
| ● | “Exchange Act” are to the U.S. Securities Exchange Act of 1934, as amended; |
| ● | “FAFG” or “FAFG Group” are to Financiere AFG S.A.S., a simplified limited liability company (societe par actions simplifiee) organized under the laws of France and, unless the context requires otherwise, its subsidiaries; |
| ● | “FSC” are to the Financial Supervisory Commission of the Republic of China; |
| ● | “Hung Ching” are to Hung Ching Development Construction Co. Ltd., a company incorporated under the laws of the R.O.C.; |
| ● | “IFRS” are to International Financial Reporting Standards, International Accounting Standards and Interpretations as issued by the International Accounting Standards Board; |
| ● | “ISE Shanghai” are to ISE Labs, China, Ltd., a company incorporated under the laws of the P.R.C.; |
| ● | “ISE Labs” are to ISE Labs, Inc., a corporation incorporated under the laws of the State of California; |
| ● | “Initial SPIL Tender Offer” are to ASE’s offer to purchase 779,000,000 common shares (including common shares represented by outstanding American depositary shares) of SPIL through concurrent tender offers in the R.O.C. and the U.S., at a price of NT$45 per SPIL common share and NT$225 per SPIL American depositary share, commenced on August 24, 2015 and expired on September 22, 2015; |
| ● | “Joint Share Exchange Agreement” are to the joint share exchange agreement entered into between ASE and SPIL on June 30, 2016; |
| ● | “Korea” or “South Korea” are to the Republic of Korea; |
| ● | “MOEAIC” are to the Investment Commission of the R.O.C. Ministry of Economic Affairs; |
| ● | “NYSE” are to New York Stock Exchange; |
| ● | “PCAOB” are to Public Company Accounting Oversight Board (United States); |
| ● | “PowerASE” are to PowerASE Technology Inc., a company incorporated under the laws of the R.O.C., which was merged into ASE Inc. in 2012; |
| ● | “PPA Effects” are the earnings effects from purchase price allocation (“PPA”). “PPA of SPIL Acquisition” is the allocation of ASEH’s purchase price of SPIL into identifiable assets acquired and liabilities assumed from SPIL based on their fair values. The fair value write-up results in earnings effects over time which generates increased operating costs, operating expenses, other operating income and expenses and non-operating expenses; |
| ● | “P.R.C.” are to the People’s Republic of China, excluding Taiwan, Macau and Hong Kong; |
| ● | “P.R.C. Regulations” are to the Regulations Governing Securities Investment and Futures Trading in Taiwan by Mainland Area Investors; |
| ● | “QDII” are to qualified domestic institutional investors; |
2
| ● | “Republic of China,” the “R.O.C.” and “Taiwan” are to the Republic of China, including Taiwan and certain other possessions; |
| ● | “R.O.C. Trading Day” are to a day when TWSE is open for business; |
| ● | “SEC” are to the Securities and Exchange Commission of the U.S.; |
| ● | “Second SPIL Tender Offer” are to ASE’s offer to purchase 770,000,000 common shares (including common shares represented by outstanding American depositary shares) of SPIL through concurrent tender offers in the R.O.C. and the U.S., at a price of NT$55 per SPIL common share and NT$275 per SPIL American depositary share, commenced on December 29, 2015 and expired on March 17, 2016 due to failure to obtain regulatory approval from the Taiwan Fair Trade Commission (“TFTC”) prior to the expiration of the Second SPIL Tender Offer; |
| ● | “Securities Act” are to the U.S. Securities Act of 1933, as amended; |
| ● | “Share Exchange” is the statutory share exchange pursuant to the laws of the Republic of China, through which ASEH (i) acquired all issued shares of ASE in exchange for shares of ASEH using the share exchange ratio and (ii) acquired all issued shares of SPIL using the cash consideration; |
| ● | “SiP” are to system-in-package; |
| ● | “SPIL” or “SPIL Group” are to Siliconware Precision Industries Co., Ltd., and, unless the context requires otherwise, its subsidiaries; |
| ● | “SPIL Acquisition” are to ASEH’s effort to effect an acquisition of 100% of the common shares and American depositary shares of SPIL pursuant to the Joint Share Exchange Agreement; |
| ● | “SZ” are to Siliconware Technology (Suzhou) Limited, a company incorporated under the laws of the P.R.C.; |
| ● | “Taiwan-IFRS” are to the Regulations Governing the Preparation of Financial Reports by Securities Issuers, the IFRS as well as related guidance translated by Accounting Research and Development Foundation and endorsed by the FSC; |
| ● | “Tessera” are to Tessera Technologies, Inc. and its subsidiaries; |
| ● | “TWSE” are to Taiwan Stock Exchange; |
| ● | “UGJQ” are to Universal Global Technology (Shanghai) Co., Ltd., a company incorporated under the laws of the P.R.C.; |
| ● | “UGKS” are to Universal Global Technology (Kunshan) Co. Ltd., a company incorporated under the laws of the P.R.C.; |
| ● | “USIPL” are to Universal Scientific Industrial Poland Sp. z o.o., a company incorporated under the laws of Poland and former name was Chung Hong Electronics Poland Sp. z o.o.; |
| ● | “UGTW” are to Universal Global Scientific Industrial Co. Ltd., a company incorporated under the laws of the R.O.C.; |
| ● | “Universal Scientific Industrial” or “USI” are to Universal Scientific Industrial Co., Ltd., a company incorporated under the laws of the R.O.C.; |
| ● | “USIFR” are to Universal Scientific Industrial (France), a simplified limited liability company (societe par actions simplifiee) organized under the laws of France; |
| ● | “USI Shanghai” are to Universal Scientific Industrial (Shanghai) Co., Ltd., a company incorporated under the laws of the P.R.C.; |
3
| ● | “U.S.” refers to the United States of America; |
| ● | “U.S. GAAP” are to accounting principles generally accepted in the U.S.; |
| ● | “USI Group” are to USI Inc. and its subsidiaries; |
| ● | “USI Inc.” are to USI Inc., a company incorporated under the laws of the R.O.C.; |
| ● | “USI Mexico” are to Universal Scientific Industrial de Mexico S.A. DE C.V., a company incorporated under the laws of Mexico; |
| ● | “USISZ” are to USI Electronics (Shenzhen) Co. Ltd., a company incorporated under the laws of the P.R.C.; and |
| ● | “Wuxi Tongzhi” are to Wuxi Tongzhi Microelectronics Co., Ltd., a company incorporated under the laws of the P.R.C. |
We publish our financial statements in New Taiwan dollars, the lawful currency of the R.O.C. In this annual report, references to “United States dollars,” “U.S. dollars” and “US$” are to the currency of the United States; references to “New Taiwan dollars,” “NT dollars” and “NT$” are to the currency of the R.O.C.; references to “RMB” are to the currency of the P.R.C.; references to “JP¥” are to the currency of Japan; references to “MYR” are to the currency of Malaysia; references to “SGD” are to the currency of the Republic of Singapore; references to “KRW” are to the currency of the Republic of Korea; references to “EUR” are to the currency of the EU; and references to “PLN” are to the currency of the Poland. Unless otherwise noted, all translations from NT dollars to U.S. dollars were made at the exchange rate as set forth in the H.10 weekly statistical release of the Federal Reserve System of the United States (the “Federal Reserve Board”) as of December 30, 2021, which was NT$27.74=US$1.00, and all translations from RMB to U.S. dollars were made at the exchange rate as set forth in the H.10 weekly statistical release of the Federal Reserve Board as of December 31, 2021, which was RMB6.3726=US$1.00. All amounts translated into U.S. dollars in this annual report are provided solely for your convenience and no representation is made that the NT dollar, RMB or U.S. dollar amounts referred to herein could have been or could be converted into U.S. dollars or NT dollars/RMB, as the case may be, at any particular rate or at all. On March 18, 2022, the exchange rate between NT dollars and U.S. dollars as set forth in the H.10 weekly statistical release by the Federal Reserve Board was NT$28.35=US$1.00. On March 18, 2022, the exchange rate between RMB and U.S. dollars as set forth in the H.10 weekly statistical release by the Federal Reserve Board was RMB6.3609=US$1.00.
4
SPECIAL NOTE REGARDING FORWARD-LOOKING STATEMENTS
This annual report on Form
20-F
contains “forward-looking statements” within the meaning of Section 27A of the Securities Act and Section 21E of the Exchange Act. Although these forward-looking statements, which may include statements regarding our future results of operations, financial condition or business prospects, are based on our own information and information from other sources we believe to be reliable, you should not place undue reliance on these forward-looking statements, which apply only as of the date of this annual report. The words “anticipate,” “believe,” “estimate,” “expect,” “intend,” “plan” and similar expressions, as they relate to us, are intended to identify these forward-looking statements in this annual report. Our actual results of operations, financial condition or business prospects may differ materially from those expressed or implied in these forward-looking statements for a variety of reasons, including risks associated with cyclicality and market conditions in the semiconductor or electronics industry; changes in our regulatory environment, including our ability to comply with new or stricter environmental regulations and to resolve environmental liabilities; demand for the outsourced semiconductor packaging, testing and EMS we offer and for such outsourced services generally; the highly competitive semiconductor or manufacturing industry we are involved in; our ability to introduce new technologies in order to remain competitive; international business activities; our business strategy; our future expansion plans and capital expenditures; the strained relationship between the R.O.C. and the P.R.C.; general economic and political conditions; the recent global economic crisis; possible disruptions in commercial activities caused by natural or human-induced disasters; fluctuations in foreign currency exchange rates; and other factors. For a discussion of these risks and other factors, see “Item 3. Key Information—Risk Factors.” 5
PART I
Item 1. Identity of Directors, Senior Management and Advisers
Not applicable.
Item 2. Offer Statistics and Expected Timetable
Not applicable.
Item 3. Key Information
SELECTED FINANCIAL DATA
[Reserved]
CAPITALIZATION AND INDEBTEDNESS
Not applicable.
REASON FOR THE OFFER AND USE OF PROCEEDS
Not applicable.
RISK FACTORS
Below please find a summary of the principal risks we face, organized under relevant headings.
Risks Relating to Our Business
| ● | Since we are dependent on the highly cyclical semiconductor and electronics industries and conditions in the markets for the end-use applications of our products, our revenues and net income may fluctuate significantly. |
| ● | A reversal or slowdown in the outsourcing trend for semiconductor packaging and testing services and EMS could adversely affect our growth prospects and profitability. |
| ● | Inflation could adversely affect our business, financial condition, results of operations and cash flows. |
| ● | If we are unable to compete favorably in the highly competitive markets of semiconductor packaging and testing and EMS, our revenues and net income may decrease. |
| ● | Our profitability depends on our ability to respond to rapid technological changes in the semiconductor industry. |
| ● | Our operating results are subject to significant fluctuations, which could adversely affect the market value of your investment. |
| ● | If we are unable to manage our expansion or investments effectively, our growth prospects may be limited and our future profitability and core business operations may be adversely affected. |
| ● | The packaging and testing businesses are capital intensive. If we cannot obtain additional capital when we need it, our growth prospects and future profitability may be adversely affected. |
| ● | System security risks, data protection breaches or unexpected system outage or failures could harm our business, financial condition and results of operations. |
| ● | A cybersecurity breach could interfere with our business operations, compromise confidential information, adversely impact our reputation and operating results and potentially lead to litigation and other liabilities. |
6
| ● | Any impairment charges may have a material adverse effect on our income. |
| ● | Any attempt by the U.S. government to withdraw from or materially modify existing international trade agreements or take further actions against certain P.R.C. technology companies could adversely affect our business, financial condition and results of operations. |
Risks Relating to the SPIL Acquisition
| ● | There may be risks associated with the impacts of the SPIL Acquisition on our subgroups and our holding company structure. |
Risks Relating to Taiwan, R. O. C.
| ● | Strained relations between the R.O.C. and the P.R.C. and disruptions in Taiwan’s political environment caused by domestic political events could negatively affect our business and the market value of your investment. |
| ● | As a substantial portion of our business and operations is located in Taiwan, we are vulnerable to natural disasters including earthquakes, typhoons, drought, as well as power outages and other industrial incidents, which could severely disrupt the normal operation of our business and adversely affect our results of operations. |
Risks Relating to Ownership of Our Common Shares and the ADSs
| ● | The market for our common shares and the ADSs may not be liquid. |
| ● | If a non-R.O.C. holder of ADSs withdraws and holds common shares, such holder of ADSs will be required to appoint a tax guarantor, local agent and custodian in the R.O.C. and register with the TWSE or the Taipei Exchange in order to buy and sell securities on the TWSE. |
| ● | We may not continue to declare cash dividends in any particular amount. |
| ● | Holders of common shares and ADSs may experience dilution if we issue stock bonuses, stock options and restricted stocks to employees or sell additional equity or equity-linked securities. |
Below please find the detailed analysis of the principal risks we face.
Risks Relating to Our Business
Since we are dependent on the highly cyclical semiconductor and electronics industries and conditions in the markets for the
end-use
applications of our products, our revenues and net income may fluctuate significantly. Our business is affected by market conditions in the highly cyclical semiconductor and electronics industries. Most of our customers operate in this industry, and variations in order levels from our customers and service fee rates may result in volatility in our revenues and net income. From time to time, the semiconductor and electronics industries have experienced significant, and sometimes prolonged, downturns. As our business is, and will continue to be, dependent on the requirements for independent packaging, testing and EMS, any future downturn in the industry would reduce demand for our services. If we cannot reduce our costs or adjust our product mix to sufficiently offset any decline in sales volumes, our profitability will suffer, and we may incur losses.
Market conditions in the semiconductor and electronics industries depend to a large degree on conditions in the markets for the
end-use
applications of various products, such as communications, computing and consumer electronics products. Any deterioration of conditions in the markets for the end-use
applications would reduce demand for our services, and would likely have a material adverse effect on our financial condition and results of operations. In 2021, approximately 50.1%, 14.9% and 35.0% of our operating revenues from packaging and testing were attributed to the packaging and testing of semiconductors used in communications, computing and consumer electronics/industrial/automotive/other applications, respectively. In the same year, approximately 38.4%, 8.8%, 33.6%, 13.0% and 6.2% of our operating revenues from EMS were attributed to the communications, computing, consumer electronics applications, industrial, and automotive applications and other, respectively. Across end-use
applications, our customers face intense competition and significant shifts in demand, which could put pricing pressure on our services and may adversely affect our revenues and net income. 7
A reversal or slowdown in the outsourcing trend for semiconductor packaging and testing services and EMS could adversely affect our growth prospects and profitability.
Semiconductor manufacturers that have their own requirements. In addition, the availability of advanced independent semiconductor manufacturing services has also enabled the growth of
in-house
packaging and testing capabilities, known as integrated device manufacturers and original equipment manufacturers, have increasingly outsourced stages of the production process, including packaging, testing, electronic manufacturing and assembly, to independent companies in order to reduce costs, eliminate product complexity and meet fast-to-market
so-called
“fabless” semiconductor companies that focus exclusively on design and marketing and outsource their manufacturing, packaging and testing requirements to independent companies. We cannot assure you that these manufacturers and companies will continue to outsource their packaging, testing and manufacturing requirements to third parties like us. Furthermore, during an economic downturn, these integrated device manufacturers typically rely more on their own in-house
packaging and testing capabilities, therefore decreasing their need to outsource. A reversal of, or a slowdown in, this outsourcing trend could result in reduced demand for our services and adversely affect our growth prospects and profitability. Any global economic downturn could adversely affect the demand for our products and services, and a protracted global economic crisis would have a material adverse effect on us.
The global financial markets experienced significant disruptions in 2008 and the U.S., Europe and other economies went into a recession. The recovery from the lows of 2008 and 2009 was uneven and it was facing new challenges, including a European sovereign debt crisis that began in 2011, the withdrawal of the United Kingdom from the EU, or the Brexit, and continuing high unemployment rates in much of the world. It is unclear what the long-term impact of the European sovereign debt crisis will be and uncertainty remains over the long-term effects of the expansionary monetary and fiscal policies that have been adopted by the central banks and financial authorities of some of the world’s leading economies. It remains unclear how Brexit will affect the fiscal, monetary and regulatory landscape of the United Kingdom, the EU and the rest of the world. Any economic downturn or crisis may cause our customers to cancel or reduce planned expenditures for our products and services. Any uncertainty or significant volatility in global economic conditions, including the continuing global supply chain crisis, economic sanctions and restrictive measures in response to the Russia-Ukraine conflict and tight monetary policy in the U.S. due to inflation, may negatively affect our business, results of operations, and financial condition.
Inflation could adversely affect our business, financial condition, results of operations and cash flows.
We are exposed to economic and political conditions in the countries and regions where we operate. Like other companies with wide operations, we are exposed to risks from fluctuations in inflation. We are also affected by governmental policies regarding spending and investment, exchange controls, regulatory and taxation changes, and other adverse political, economic or social developments of the countries and regions in which we operate.
In particular, high inflation rates may adversely affect our business by increasing the cost of the raw materials, energy, labor and transportation. Current or future efforts by government to stimulate the economy may increase the risk of significant inflation. In the event of an increase in inflation, we may seek to increase the sales prices of our services in order to maintain satisfactory profits, however such increases may not be accepted by our customers, may not be sufficient to compensate for the negative impact of inflation. On the other hand, at a global level, inflation might reduce households’ disposable income and erode the value of people’s savings, which may decrease the demand discretionary items, and thus negatively impact the sales of our customers’ products and their demand for our manufacturing services. If we are not able to fully offset the effects of increased inflation, it could have a material adverse effect on our business, financial condition, results of operations and cash flows.
If we are unable to compete favorably in the highly competitive markets of semiconductor packaging and testing and EMS, our revenues and net income may decrease.
The markets of semiconductor packaging and testing and EMS are very competitive. We face competition from a number of sources, including other independent semiconductor packaging and testing companies, integrated device manufacturers, and other EMS providers with large-scale manufacturing capabilities who can quickly react to market changes. In addition, some foundry players have actively invested and expanded their advanced packaging capacity, and have gained some customer tractions of their services and solutions.
8
We believe that the principal competitive factors in our industry are:
| ● | technological expertise; |
| ● | ability to provide total solutions to our customers, including integrated design, manufacturing, packaging and testing and EMS; |
| ● | ability to offer interconnect technologies at an optimal scale for our businesses; |
| ● | range of package types and testing platforms available; |
| ● | ability to work closely with our customers at the product development stage; |
| ● | responsiveness and flexibility; |
| ● | fast-to-market |
| ● | capacity; |
| ● | diversity in facility locations; |
| ● | production yield; and |
| ● | prices. |
We face increasing competition, as most of our customers obtain services from more than one source. Rapid technological advancements and aggressive pricing strategies by our competitors may continue to increase competition. Our ability to compete depends on factors both within and outside of our control and may be constrained by the distinct characteristics and production requirements of individual products. We cannot assure you that we will be able to continue to improve production efficiency and maintain reasonable profit for all of our products.
In addition, some of our competitors may have superior financial, marketing, manufacturing, research and development and technological resources than we do. For example, the central government of the P.R.C., as well as provincial and municipal governments have provided various incentives to domestic companies in the semiconductor industry, including major semiconductor testing and packaging providers, such as Jiangsu Changjiang Electronics Technology Co., Ltd. Similarly, our customers may face competition from their competitors in the P.R.C., and such competitors may also receive significant subsidies from the P.R.C. government. As we are upstream providers, the impact of such government policies on competition and price pressure of our customers may negatively impact our own business. Increasing competition may lead to declines in product prices and profitability and could have a material adverse effect on our business, financial condition, results of operations and future prospects.
Our profitability depends on our ability to respond to rapid technological changes in the semiconductor industry.
The semiconductor industry is characterized by rapid increases in the diversity and complexity of semiconductors. As a result, we expect that we will need to constantly offer more sophisticated packaging and testing technologies and processes in order to respond to competitive industry conditions and customer requirements. We have successfully combined our packaging, testing and materials technologies with the expertise of EMS at the systems level to develop our SiP business. We also entered into multiple technology license agreements with DECA Technologies Inc. to advance our
fan-out
technology. There is, however, no assurance that our development efforts for our SiP business or the use of licensed technology to further advance our fan-out
technology will be successful. We continue to develop new products in anticipation of future demand. However, there is no assurance that the launch of any new product will be successful or that we will be able to produce sufficient quantities of these products to meet market demand. If we fail to develop, or obtain access to, advances in packaging or testing technologies or processes, we may become less competitive and less profitable. In addition, advances in technology typically lead to declining average selling prices for semiconductors packaged or tested with older technologies or processes. As a result, if we cannot reduce the costs associated with our services, the profitability of a given service and our overall profitability may decrease over time.
9
Our operating results are subject to significant fluctuations, which could adversely affect the market value of your investment.
Our operating results have varied significantly from period to period and may continue to vary in the future. Downward fluctuations in our operating results may result in decreases in the market price of our common shares and the ADSs. Among the more important factors affecting our quarterly and annual operating results are the following:
| ● | changes in general economic and business conditions, particularly the cyclical nature of the semiconductor and electronics industries and the markets served by our customers; |
| ● | our ability to quickly adjust to unanticipated declines or shortfalls in demand and market prices; |
| ● | changes in prices for our products or services; |
| ● | volume of orders relative to our packaging, testing and manufacturing capacity; |
| ● | changes in costs and availability of raw materials, equipment and labor; |
| ● | our ability to obtain or develop substitute raw materials with lower cost; |
| ● | our ability to successfully develop or market new products or services; |
| ● | our ability to successfully manage product mix in response to changes in market demand and differences in margin associated with different products; |
| ● | timing of capital expenditures in anticipation of future orders; |
| ● | our ability to acquire or design and produce cost-competitive interconnect materials, and provide integrated solutions for EMS; |
| ● | fluctuations in the exchange rate; |
| ● | fluctuations in interest rates, including the potential impact of the phase-out of LIBOR on our variable rate borrowings; and |
| ● | typhoons, earthquakes, droughts, epidemics, tsunamis and other natural disasters, as well as industrial and other incidents such as fires and power outages. |
Due to the factors listed above, our future operating results or growth rates may be below the expectations of research analysts and investors. If so, the market price of our common shares and the ADSs, and thus the market value of your investment, may fall.
Due to our high percentage of fixed costs, we may be unable to maintain our gross margin at past levels if we are unable to achieve relatively high capacity utilization rates.
Our operations, in particular our testing operations, are characterized by relatively high fixed costs. We expect to continue to incur substantial depreciation and other expenses in connection with our acquisitions of equipment and facilities. Our profitability depends not only on the pricing levels for our services or products, but also on utilization rates for our machinery and equipment, commonly referred to as “capacity utilization rates.” In particular, increases or decreases in our capacity utilization rates can significantly affect gross margins since the unit cost generally decreases as fixed costs are allocated over a larger number of units. In periods of low demand, we experience relatively low capacity utilization rates in our operations, which lead to reduced margins. We cannot assure you that we will be able to maintain or surpass our past gross margin levels if we cannot consistently achieve or maintain relatively high capacity utilization rates.
10
If we are unable to manage our expansion or investments effectively, our growth prospects may be limited and our future profitability and core business operations may be adversely affected.
We have significantly expanded our operations through acquisitions and joint ventures in recent years. For our expansion or investments, see “Item 4. Information on the Company— Business Overview—Strategy—Strategically Expand and Streamline Production Capacity.”
While we expect that we will continue to expand our operations in the future to broaden our product offerings, rapid expansion may strain our managerial, technical, financial, operational and other resources. As a result of our expansion, we have implemented and will continue to implement additional operational and financial controls and hire and train additional personnel. Any failure to manage our growth effectively could lead to inefficiencies and redundancies and result in reduced growth prospects and profitability.
In addition, we have made several investments in the real estate development businesses in China. The P.R.C. property market is volatile and may experience undersupply or oversupply and property price fluctuations. The central and local governments frequently adjust monetary and other fiscal policies to prevent and curtail the overheating of the economy. Such policies may lead to changes in market conditions, including price instability and imbalance of supply and demand in respect of office, residential, retail, entertainment, cultural and intellectual properties. Our exposure to risks related to real estate development may also increase over time as a result of our expansion into such a business. We may continue to make investments in this area in the future and our diversification in this industry may put pressure on our managerial, financial, operational and other resources. There can be no assurance that our investments in such a business will yield the anticipated returns and that our expansion into such a business, including the resulting diversion of management’s attention, will not adversely affect our core business operations.
The financial performance of our equity method investments could adversely affect our results of operations.
As part of our business strategy, we have and may continue to pursue acquisitions of businesses and assets, strategic alliances and joint ventures. We currently have equity investments in certain entities and the accounting treatment applied for these investments varies depending on a number of factors, including, but not limited to, our percentage ownership, our percentage of membership of investee’s board and the level of influence we have over the relevant entity. Any losses experienced by these entities could adversely affect our results of operations and the value of our investment. In addition, if these entities were to fail and cease operations, we may lose the entire value of our investment and the stream of any shared profits.
There can be no assurance that we will be able to maintain or enhance the value or performance of our investee companies or that we will achieve the returns or benefits sought from such investments. If our interests differ from those of other investors in our investee companies, we may not be able to enjoy synergies with the investee and it may adversely affect our financial results or financial condition.
We recognized impairment charges of NT$400.2 million in 2019 and nil in both 2020 and 2021 in our investments under the equity method.
The packaging and testing businesses are capital intensive. If we cannot obtain additional capital when we need it, our growth prospects and future profitability may be adversely affected.
The packaging and testing business is capital intensive. We will need capital to fund the expansion of our facilities as well as fund our research and development activities in order to remain competitive. We believe that our existing cash, marketable securities, expected cash flow from operations and existing credit lines under our loan facilities will be sufficient to meet our capital expenditures, working capital, cash obligations under our existing debt and lease arrangements, and other requirements for at least the next 12 months. However, future capacity expansions or market or other developments may cause us to require additional funds. Our ability to obtain external financing in the future is subject to a variety of uncertainties, including:
| ● | our future financial condition, results of operations and cash flows; |
| ● | general market conditions for financing activities by semiconductor or electronics companies; and |
| ● | economic, political and other conditions in Taiwan and elsewhere. |
11
If we are unable to obtain funding in a timely manner or on acceptable terms, our results of operations and financial conditions may be materially and adversely affected.
Restrictive covenants and broad default provisions in our existing debt agreements may materially restrict our operations as well as adversely affect our liquidity, financial condition and results of operations.
We are a party to numerous loans and other agreements relating to the incurrence of debt, which may include restrictive covenants and broad default provisions. In general, covenants in the agreements governing our existing debt, and debt we may incur in the future, may materially restrict our operations, including our ability to incur debt, pay dividends, make certain investments and payments, other than in connection with restructurings of consolidated entities, and encumber or dispose of assets. In addition, any global economic deterioration or ineffective expansion may cause us to incur significant net losses or force us to assume considerable liabilities. We cannot assure you that we will be able to remain in compliance with our financial covenants, which, as a result, may lead to a default. This may thereby restrict our ability to access unutilized credit facilities or the global capital markets to meet our liquidity needs. Furthermore, a default under any agreement by us or our subsidiaries may trigger cross-defaults under our other agreements. In the event of default, we may not be able to cure the default or obtain a waiver on a timely basis. An event of default under any agreement timely governing our existing or future debt, if not cured or waived, could have a material adverse effect on our liquidity, financial condition and results of operations.
We have on occasion failed to comply with certain financial covenants in some of our loan agreements. Such
non-compliance
may also have, through broadly worded cross-default provisions, resulted in default under some of the agreements governing our other existing debt. If we are unable to timely rectify any possible non-compliance
under such loan agreements or obtain applicable waivers or amendments, we would breach our financial covenants and our financial condition would be adversely affected. As of December 31, 2021, we were not in breach of any of the financial covenants under our existing loan agreements, although we cannot provide any assurance that we will not breach any of such financial covenants in the future. We depend on select personnel and could be affected by the loss of their services.
We depend on the continued service of our executive officers and skilled technical personnel. Our business could suffer if we lose the services of any of these personnel and cannot adequately replace them. Although some of these management personnel have entered into employment agreements with us, they may nevertheless leave before the expiration of these agreements. We are not insured against the loss of the services of any of our personnel. In addition, these proceedings may divert these and other employees’ attention from our business operations.
We may be required to increase substantially the number of these employees in connection with our expansion plans, and there is intense competition for their services in this industry. We may not be able to either retain our present personnel or attract additional qualified personnel as and when needed. In addition, we may need to increase employee compensation levels in order to attract and retain our existing officers and employees and the additional personnel that we expect to require. Recently, some companies have accelerated efforts to maliciously poach talented Taiwan semiconductor experts by offering a high position with handsome pay. If such malicious acts involving technology theft growing worse, Taiwan’s semiconductor industry would be seriously affected and our business would be adversely jeopardized.
Furthermore, a portion of the workforce at our facilities in Taiwan is foreign workers employed under work permits, which are subject to government regulations on renewal and other terms. Consequently, our business could also suffer if the Taiwan regulations relating to the employment of foreign workers were to become significantly more restrictive or if we are otherwise unable to attract or retain these workers at a reasonable cost.
12
The ongoing proceeding involving Dr. Tien Wu may have an adverse impact on our business and cause our common shares and ADS price to decline.
Dr. Tien Wu, our director and chief operating officer, was involved in a criminal proceeding brought by the Taiwan Kaohsiung District Prosecutors Office. The indictment alleged that Dr. Tien Wu violated Article
157-1
of the R.O.C. Securities and Exchange Act for insider trading activities involving SPIL’s common shares conducted during the Initial SPIL Tender Offer, the Second SPIL Tender Offer and negotiations of the memorandum of understanding in connection with the SPIL Acquisition. Dr. Tien Wu was accused of tipping off a friend about the aforementioned tender offers and negotiation ahead of the public announcements. After an investigation that spanned over two years, the Taiwan Kaohsiung District Court, on February 5, 2020, found Dr. Tien Wu NOT guilty. On March 20, 2020, the Taiwan Kaohsiung District Prosecutors Office filed an appeal against the February 5, 2020 judgment, and the appeal was rejected by the Taiwan High Court Kaohsiung Branch Court on June 9, 2021. On July 2, 2021, the Kaohsiung Branch, Taiwan High Prosecutors Office filed another appeal against the June 9 judgment. The Supreme Court of the R.O.C. reversed the June 9 judgment and remanded this case to the Taiwan High Court Kaohsiung Branch Court on January 6, 2022. This matter is now being tried by the Taiwan High Court Kaohsiung Branch Court. We have strengthened internal control measures after this incident, and no other director of us is expected to become a party to any current or future litigation in connection with Dr. Tien Wu. On October 26, 2018, the R.O.C. Securities and Futures Investors Protection Center (“SFIPC”) filed a civil lawsuit against Dr. Tien Wu and ASEH, requesting the court to remove Dr. Tien Wu from ASEH’s board of directors based on Article
10-1
of the R.O.C. Securities Investor and Futures Trader Protection Act (the “Director Removal Case”). On August 25, 2020, the Taiwan Ciaotou District Court ruled in favor of Dr. Tien Wu. SFIPC filed an appeal against the August 25, 2020 judgment and the appeal was rejected by the Taiwan High Court Kaohsiung Branch Court on September 29, 2021. On October 20, 2021, SFIPC filed another appeal against the September 29 judgment. This matter is now being tried by the Supreme Court of the R.O.C. In addition to the Director Removal Case, on July 8, 2021, SFIPC filed an additional class action to request Dr. Tien Wu and other three defendants of the aforementioned criminal proceeding of insider trading to be jointly liable for the damages caused by the alleging insider trading activities. This matter is now being tried by the Intellectual Property and Commercial Court of the R.O.C. The proceedings in connection with this incident, or potential regulatory scrutiny might attract further media attentions. Any negative publicity in connection with the legal proceedings may adversely affect our brand and reputation, which might result in a material adverse impact on our business operations and prospects. As we depend on the continuing service of our directors and executive officers, and we are not insured against the loss of service of any of our personnel, our business operations could suffer from the loses of services of any director or executive officer, including Dr. Tien Wu. There is no assurance that we will be able to replace the director or executive officer with suitable candidate in time. If we are unable to obtain new or additional land or land use rights, additional packaging and testing equipment or facilities in a timely manner and at a reasonable cost, our competitiveness and future profitability may be adversely affected.
In order to meet customer demand, we need to expand existing facilities or obtain suitable land. Expansion of existing facilities and construction of facilities are currently underway, or being contemplated. Such expansion or construction requires us to obtain land use or development rights. If we are unable to obtain new or additional land or use rights in a timely manner, we could experience significant fulfillment delays in our customers’ orders, resulting in negative impacts on our results of operations. In addition, the semiconductor packaging and testing businesses are capital intensive and require significant investment in expensive equipment manufactured by a limited number of suppliers. The market for semiconductor packaging and testing equipment is characterized, from time to time, by intense demand, limited supply and long delivery cycles. Our operations and expansion plans depend on our ability to obtain a significant amount of such equipment from a limited number of suppliers. From time to time we have also leased certain equipment. We have no binding supply agreements with any of our suppliers and acquire our packaging and testing equipment on a purchase order basis, which exposes us to changing market conditions and other substantial risks. For example, shortages of capital equipment could result in an increase in the price of equipment and longer delivery times. Semiconductor packaging and testing also require us to operate sizeable facilities. If we are unable to obtain equipment or facilities in a timely manner, we may be unable to fulfill our customers’ orders, which could adversely affect our growth prospects as well as financial condition and results of operations. See “Item 4. Information on the Company—Business Overview—Equipment.”
13
Fluctuations in exchange rates could result in foreign exchange losses.
The majority of our revenues are denominated in U.S. dollars, with a portion denominated in NT dollars and Japanese yen. Our operating costs and operating expenses, on the other hand, are incurred in several currencies, primarily NT dollars, U.S. dollars, RMB, Japanese yen, Korean won, as well as, to a lesser extent, Singapore dollars and Malaysian ringgit, Polish zloty and EUR. In addition, a substantial portion of our capital expenditures, primarily for the purchase of packaging and testing equipment, has been, and is expected to continue to be, denominated in U.S. dollars, with the remainder in Japanese yen. Fluctuations in exchange rates, primarily among the U.S. dollar and Japanese yen against the NT dollar, RMB and EUR, will affect our costs and operating margins. In addition, these fluctuations could result in exchange losses and increased costs in NT dollar and other local currency terms. Despite hedging and mitigating techniques implemented by us, fluctuations in exchange rates have affected, and may continue to affect, our financial condition and results of operations. We recorded net foreign exchange gains of NT$1,125.7 million, NT$1,005.4 million and NT$1,395.1 million (US$50.3 million) in 2019, 2020 and 2021, respectively. We cannot assure you that we will achieve foreign exchange gains in the future. See “Item 11. Quantitative and Qualitative Disclosures about Market Risk— Market Risk—Foreign Currency Exchange Rate Risk.”
The loss of a large customer or disruption of our strategic alliance or other commercial arrangements with semiconductor foundries and providers of other complementary semiconductor manufacturing services may result in a decline in our revenues and profitability.
Although we have a large customer base, we have derived and expect to continue to derive a large portion of our revenues from a small group of customers during any particular period due in part to the concentration of market share in the semiconductor and electronics industries. Our five largest customers together accounted for approximately 51.1%, 54.5% and 49.6% of our operating revenues in 2019, 2020 and 2021, respectively. Two of our customers individually accounted for more than 10.0% of our operating revenues in 2019, and one customer accounted for more than 10.0% of our operating revenues in 2020 and 2021. The demand for our services from a customer is directly dependent upon that customer’s level of business activity, which could vary significantly from year to year. Our key customers typically operate in the cyclical semiconductor and electronic business and, in the past, have varied, and may vary in the future, order levels significantly from period to period. Some of these companies are relatively small, have limited operating histories and financial resources, and are highly exposed to the cyclicality of the industry. We cannot assure you that these customers or any other customers will continue to place orders with us in the future at the same levels as in past periods. The loss of one or more of our significant customers, or reduced orders by any one of them, and our inability to replace these customers or make up for such orders, could adversely affect our revenues and profitability. In addition, we have in the past reduced, and may in the future be requested to reduce, our prices to limit the level of order cancellations. Any price reduction would likely reduce our margins and profitability.
Since 1997, we have maintained a strategic alliance with Taiwan Semiconductor Manufacturing Company Limited, or TSMC, one of the world’s largest dedicated semiconductor foundries. TSMC designates us as its nonexclusive preferred provider of packaging and testing services for semiconductors manufactured by TSMC. Such strategic alliances, as well as our other commercial arrangements with providers of other complementary semiconductor manufacturing services, enable us to offer total semiconductor manufacturing solutions to our customers. These strategic alliances and other commercial arrangements may not achieve their anticipated commercial benefits and may be terminated at any time. Any failure in successfully maintaining such alliances, any termination of such alliances or our failure to enter into substantially similar strategic alliances or commercial arrangements may adversely affect our competitiveness and our revenues and profitability.
We rely on a limited number of key customers in certain products for our revenues, and our results of operations may be adversely affected by a reduction of business from our key customers.
Our results of operations also depend on the performance and business of our key customers. Accordingly, risks that could seriously harm our key customers could harm us as well, including:
| ● | loss of market share for our key customers’ products; |
| ● | recession in our key customers’ markets; |
| ● | failure of their products to gain widespread commercial acceptance; and |
| ● | our key customers’ inability to manage their operations efficiently and effectively. |
14
The launch and market acceptance of our individual key customers’ products could significantly impact our product and customer mix, resulting in significant volatility in the demand for the solutions we offer and our results of operations. It is also possible that a key customer’s market share with respect to its product may decline as its competitors introduce new products, which could adversely affect our results of operations, particularly if we are unable to sell our solutions to such competitors. Furthermore, sales of our key customers’ products are subject to seasonal fluctuation.
Our revenues and profitability may decline if we are unable to obtain adequate supplies of raw materials in a timely manner and at a reasonable price.
Our operations, such as packaging operations, substrate operations and EMS, require that we obtain adequate supplies of raw materials on a timely basis. Shortages in the supply of raw materials have in the past resulted in occasional price increases and delivery delays. In addition, the operations of some of our suppliers are vulnerable to natural disasters, such as earthquakes and typhoons, the occurrences of which may deteriorate and prolong the shortage or increase the uncertainty of the supply of raw materials. We experienced a disruption to the supply of raw materials from Japan for about three to four weeks due to the fear of radiation contamination and the reduction or postponement in production by some of our Japanese suppliers. Although the purchase of supplies from Japan has been restored to the previous level, we cannot assure you that we will not suffer in the long term from the impact of the earthquake and the tsunami. In addition, further earthquakes, aftershocks thereof or other disasters in Japan or other regions in which we operate may cause a decline in our sales. Any of the above events or developments may have a material adverse effect on our business, results of operations and financial condition.
Raw materials such as IC substrates are prone to supply shortages since such materials are produced by a limited number of suppliers, such as Kinsus Interconnect Technology Corporation, Nan Ya Printed Circuit Board Corporation, LG Innotek Co., Ltd., Samsung Electro-Mechanics Co. Ltd. and Unimicron Technology Corporation. Our operations conducted through our wholly owned subsidiaries ASE Electronics and ASE Shanghai have improved our ability to obtain IC substrates on a timely basis and at a reasonable cost. In 2021, our interconnect materials operations supplied approximately 10.6% of our consolidated substrate requirements by value. We do not expect that our internal interconnect materials operations will be able to meet all of our interconnect materials requirements. Consequently, we will remain dependent on market supply and demand for our raw materials. In addition, recent fluctuations in prices of precious metals, such as gold, have also affected the price at which we have been able to purchase the principal raw materials we use in our packaging processes. We cannot guarantee that we will not experience shortages in the near future or that we will be able to obtain adequate supplies of raw materials in a timely manner or at a reasonable price. Our revenues and net income could decline if we are unable to obtain adequate supplies of high quality raw materials in a timely manner or if there are significant increases in the costs of raw materials that we cannot pass on to our customers.
Regulations related to conflict minerals could adversely affect our business, financial condition and results of operations.
The Dodd-Frank Wall Street Reform and Consumer Protection Act contains provisions to improve transparency and accountability concerning the supply of certain minerals, known as conflict minerals, which are defined as cassiterite, columbite-tantalite, gold, wolframite or their derivatives and other minerals determined by the U.S. government to be financing conflict in the Democratic Republic of Congo and adjoining countries. As a result, in August 2012 the SEC adopted annual disclosure and reporting requirements for those companies who use conflict minerals in their products. These rules require companies that manufacture or contract to manufacture products for which conflict minerals are necessary to the functionality or production to begin scrutinizing the origin of conflict minerals in their products starting from January 1, 2013, and file a new form, Form SD, containing the conflict minerals disclosure by May 31 for the prior calendar year, beginning May 31, 2014. We filed a specialized disclosure report on Form SD since the reporting period of 2013 and we have retained an independent auditing firm to conduct audits on our due diligence framework to provide a private sector report for our specialized disclosure report on Form SD since the reporting period of 2014. As a result, there will be costs associated with complying with these disclosure requirements, including costs for diligence to determine the sources of conflict minerals used in our products and other potential changes to products, processes or sources of supply as a consequence of such verification activities. The implementation of these rules could adversely affect the sourcing, supply and pricing of materials used in our products.
15
As there may be only a limited number of suppliers offering “conflict free” minerals, we cannot be sure that we will be able to obtain necessary “conflict free” minerals from such suppliers in sufficient quantities or at competitive prices. Also, we may face adverse effects to our reputation if we determine that certain of our products contain minerals not determined to be conflict free or if we are unable to sufficiently verify the origins for all conflict minerals used in our products through the procedures we may implement.
System security risks, data protection breaches or unexpected system outage or failures could harm our business, financial condition and results of operations.
We rely on the efficient and uninterrupted operation of complex information technology applications, systems and networks to operate our business. Our systems are vulnerable to damage or interruption from earthquakes, terrorist attacks, floods, fires, power loss, telecommunications failures, cyberattacks, computer viruses, computer denial of service attacks or other attempts to harm our system, and similar events. In recent years, the risks that we face from cyberattacks have increased significantly. Some of these attacks may originate from well-organized, highly skilled organizations. Although there have not been reported major cyberattacks against our systems in recent years, any such attack or system or network disruption could result in a loss of our intellectual property, the release of commercially sensitive information, customer or employee personal data. Failures to protect the privacy of customer and employee confidential data against breaches of network security could result in damage to our reputation.
Furthermore, some of our data centers are located in areas with a high risk of major earthquakes. Our data centers are also subject to
break-ins,
sabotage and intentional acts of vandalism, and to potential disruptions if the operators of these facilities have financial difficulties. Some of our systems are not fully redundant, and our disaster recovery planning cannot account for all eventualities. The occurrence of a natural disaster, a decision to close a facility we are using without adequate notice for financial reasons or other unanticipated problems at our data centers could result in loss of production capabilities and lengthy interruptions in our service. Any damage to or failure of our systems could result in interruptions in our service. Interruptions in our service could materially and adversely affect our business, financial condition and results of operations. A cybersecurity breach could interfere with our business operations, compromise confidential information, adversely impact our reputation and operating results and potentially lead to litigation and other liabilities.
Cybersecurity threats continue to expand and evolve globally. The Information Security Management Committee established by our Corporate Sustainability Committee (the “CSC”) is responsible for overall information security across all subsidiaries. It dedicated to enhancing information security, preventing and mitigating information security threats and risks by developing strategic plans for information security, establishing benchmarks for information security maturity assessments, promoting information security risk management in our subsidiaries, and coordinating internal and external technologies, resources and information. Our chief information security officer is responsible for regular reviews of all our subsidiaries’ information security management and incident response plans, and submits the information security governance report to the board of directors in the fourth quarter of each year. In 2020, initiated by the Information Security Management Committee of the CSC, to work together information security committees of our subsidiaries to integrate and strengthen the information security protection of each subsidiary. They also set up an information security risk alert system, through which we could conduct
on-site
operational inspections to minimize information security risks by hiring third party experts. In addition, our major subsidiaries have obtained ISO 27001 certification (for information security management system) and ISO 22301 certification to strengthen crisis management and disaster response. We also have established management procedures for the reporting and handling of information security incidents which allow employees to report any security incidents to ensure prompt handling, followed by efficient responses that will mitigate information security risks. In addition, we conduct an annual disaster recovery drill to mitigate the risk of service disruptions caused by impacts from major crisis events to our information systems. All employees participate in our annual proprietary information protection training courses, which include training on information security policy, management framework, and control measures. 16
Furthermore, we employ certain third-party auditor to conduct an annual audit and review of our information security performance. In the event of a sudden external cyberattack, our
on-site
safety teams immediately hold a meeting to share information, discuss responses and countermeasures; external experts would be invited to join the meeting to conduct reviews and analyses if necessary. While we actively take measures to manage information technology security risks, there can be no assurance that these measures will be sufficient to mitigate all potential risks to our system, networks and data. Although we protect our trade secrets and customer data through strict enforcement and protection protocols, a failure or breach in security could expose us and our customers, dealers and suppliers to risks of unauthorized access to information technology systems, misuse and compromise of confidential information, manipulation and destruction of data, which could potentially result in disruption of our business operations and adversely affect our reputation, competitive position, financial condition and results of operations. Security breaches could also result in litigation with third parties, regulatory actions and higher costs of implementing additional data protection measures.
Negative publicity may adversely affect our brand and reputation, which may result in a material adverse impact on our business, results of operations and business prospects and cause fluctuations in the price of our common shares and ADSs.
Any negative publicity may damage our brand and reputation, harm our ability to attract and retain customers and have a material adverse impact on our results of operations as well as cause fluctuations in the trading price of our common shares and ADSs. In addition, any change in policy or the direction in which we carry out our corporate social responsibility or corporate sustainability activities may also have an adverse effect on our business reputation. In recent years, we have experienced and may continue to experience negative publicity in connection with administrative penalties and criminal charges related to alleged violations of environmental regulations and laws. For further details, see “Item 4. Information on the Company—Business Overview—Environmental Matters,” and “Item 8. Financial Information—Consolidated Statements and Other Financial Information—Legal Proceedings.”
Any environmental claims or failure to comply with any present or future environmental regulations, as well as any fire or other industrial accident, may require us to spend additional funds and may materially and adversely affect our financial condition and results of operations.
We are subject to various laws and regulations relating to the use, storage, discharge and disposal of chemical
by-products
of, and water used in, our packaging and interconnect materials production processes, and the emission of volatile organic compounds and the discharge and disposal of solid industrial wastes from EMS operations. In recent years, we have been subject to environmental administrative actions and judicial proceedings related to certain wastewater discharge incidents that occurred at our facilities. As a result of these proceedings, we have been subject to monetary fines as well as sanctions, including orders to suspend or limit our operations and criminal charges against us. For further details, see “Item 4. Information on the Company—Business Overview—Environmental Matters,” and “Item 8. Financial Information—Consolidated Statements and Other Financial Information—Legal Proceedings.” Climate change, water shortage and other environmental concerns could negatively affect our business and financial planning.
There is concern that without substantial remediation, increasing anthropogenic greenhouse gas emissions could adversely affect the global economy irreversibly. A modest change in average global temperatures would result in increased coastal flooding, altered precipitation patterns and increased risk of biodiversity loss for the vulnerable species. Extreme weather conditions, such as heat, droughts and floods, which occur due to climate change can also impact our business operations and financial performance. For example, since our business operations depend on adequate supplies of water, an extended drought may affect our ability to obtain sufficient amounts of water and threaten our production capability.
We believe that we should play our part in the mitigation of
man-made
climate change. For instance, we have incorporated green design standards and building concepts into the construction of our facilities. Since 2012, we have transformed existing facilities and built new facilities and offices that comply with international low carbon building standards. Through quantifying and analyzing the entire lifecycle of building carbon emissions, carbon reduction was driven from the design stage and promoted along the value chain to build sustainable factories. Public expectations for reductions in greenhouse gas emissions could result in increased energy, transportation and raw material costs. Scientific examination of, political attention to and rules and regulations on issues surrounding the existence and extent of
man-made
climate change may result in an increase in the cost of production due to increase in the prices of energy and introduction of energy or carbon tax. Various regulatory developments have been introduced that focus on restricting or managing emissions of greenhouse gases. Enterprises may need to purchase at higher costs emission credits, new equipment or raw materials with lower carbon footprints. These developments and further legislation that is likely to be enacted could negatively affect our operations and financial performance. Also, changes in environmental regulations, such as those that concern the use of perfluorinated compounds (commonly known as the PFCs), could increase our production costs, which may adversely affect our results of operation and financial results. 17
Stable water supply of sufficient amounts of good quality freshwater plays a critical role for ASEH. Taiwan is also susceptible to typhoons and droughts, which may cause damage and business interruptions to facilities. Since our business operations depend on adequate supplies of water, an extended drought may affect our ability to obtain sufficient water and threaten our production capability. Although we have not been directly affected by droughts, we are dependent upon water for our packaging and substrates operations and a drought could interrupt such operations. Not only freshwater supply is key to our business operations, we also have established a sustainable water recycling system and implemented water management strategies to identify and prevent water shortage related risks. We operate one of the industry’s largest water recycling facility in Taiwan, allowing us to reuse each drop of water more than three times and avoid disruptions caused by water shortages. Our eight main facilities in Taiwan are also tapping on scientific data from the World Resources Institute to conduct climate risk assessments and develop robust water risk management strategies. These actions will enable the company to respond effectively to climate change in the next decade.
We may be subject to intellectual property rights disputes, which could adversely affect our business.
Our ability to compete successfully and achieve future growth depends, in part, on our ability to develop and protect our proprietary technologies and to secure on commercially acceptable terms certain technologies that we do not own. We cannot assure you that we will be able to independently develop, obtain patents for, protect or secure from any third party, the technologies required. Our failure to successfully obtain such technology may seriously harm our competitive position.
Our ability to compete successfully also depends, in part, on our ability to operate without infringing the proprietary rights of others. We have no means of knowing what patent applications have been filed in the U.S. or elsewhere until they are granted or published. In particular, the semiconductor and electronics industries are characterized by frequent litigation regarding patent and other intellectual property rights. It is common for patent owners to assert their patents against semiconductor manufacturers. We have received from time to time communication from third parties asserting patents that cover certain of our technologies and alleging infringement of intellectual property rights of others, and we may continue receiving such communication in the future. In the event that any third party makes a valid claim against us or against our customers, we could be required to:
| ● | seek to acquire licenses to the infringed technology which may not be available on commercially reasonable terms, if at all; |
| ● | discontinue using certain process technologies, which could cause us to stop manufacturing certain semiconductors; |
| ● | pay substantial monetary damages; and/or |
| ● | seek to develop non-infringing technologies, which may not be feasible. |
Any one of these developments could place substantial financial and administrative burden on us and hinder our business. For example, in connection to the 2016 patent dispute between Broadcom and Tessera, we recognized settlement amount of US$5.0 million in our consolidated financial statements for the year ended December 31, 2019, which fully settled in February 2020 between SPIL and Broadcom. See “Item 8. Financial Information—Consolidated Statements and Other Financial Information—Legal Proceedings” for more information about the Broadcom Patent Dispute.
Any litigation, whether as plaintiff or defendant and regardless of the outcome, is costly and diverts company resources. Any of the foregoing could harm our competitive position and render us unable to provide some of our services operations.
18
Our major shareholders may take actions that are not in, or may conflict with, our public shareholders’ best interest.
Members of the Chang family own, directly or indirectly, a significant interest in our outstanding common shares. See “Item 7. Major Shareholders and Related Party Transactions— Major Shareholders.” Accordingly, these shareholders will continue to have the ability to exercise a significant influence over our business, including matters relating to:
| ● | our operation, management and policies; |
| ● | the timing and distribution of dividends; and |
| ● | the election of our directors. |
Members of the Chang family may take actions that you may not agree with or that are not in our or our public shareholders’ best interests.
We are an R.O.C. company and, because the rights of shareholders under R.O.C. law differ from those under U.S. law and the laws of certain other countries, you may have difficulty protecting your shareholder rights.
Our corporate affairs are governed by our Articles of Incorporation and by the laws governing corporations incorporated in the R.O.C. The rights of shareholders and the responsibilities of management and the members of the board of directors under R.O.C. law are different from those applicable to a corporation incorporated in the U.S. and certain other countries. As a result, public shareholders of R.O.C. companies may have more difficulty in protecting their interests in connection with actions taken by management or members of the board of directors than they would as public shareholders of a corporation in the U.S. or certain other countries.
We have made investments in, and are exploring the possibility of expanding our businesses and operations to, or making additional investments in, the P.R.C., which may expose us to additional political, regulatory, economic and foreign investment risks.
We currently maintain packaging and testing facilities and EMS sites in the P.R.C. We also made substantial investments in P.R.C. real estate development through our subsidiaries in the P.R.C. Under P.R.C. laws and regulations, foreign investment projects, such as our subsidiaries, must obtain certain approvals from the relevant governmental authorities in the provinces or special economic zones in which they are located and, in some circumstances, from the relevant authorities in the P.R.C. central government. Foreign investment projects must also comply with certain regulatory requirements. However, P.R.C. laws and regulations are often subject to varying interpretations and means of enforcement, and additional approvals from the relevant governmental authorities may be required for the operations of our P.R.C. subsidiaries. If required, we cannot assure you that we will be able to obtain these approvals in a timely manner, if at all. Because the P.R.C. government holds significant discretion in determining matters relating to foreign investment, we cannot assure you that the relevant governmental authorities will not take action that is materially adverse to our P.R.C. operations.
In addition, the P.R.C. stock market is subject to extreme price and volume fluctuations. We are the controlling shareholder of USI Shanghai, which is an entity currently listed on the Shanghai Stock Exchange. The P.R.C. securities markets have recently experienced, and may experience in the future, significant volatility. Any volatility may have a significant effect on USI Shanghai’s share price and may indirectly affect the market price of our common shares and ADSs.
Our global manufacturing and sales activities subject us to risks associated with legal, political, economic or other conditions or developments in various jurisdictions, including in particular the R.O.C. and the P.R.C., which could negatively affect our business and financial status and therefore the market value of your investment.
Our principal executive office and our principal production facilities are located in the R.O.C., and a substantial majority of our net revenues are derived from our operations in the R.O.C. and the P.R.C. In addition, we have operations worldwide and a significant percentage of our revenue comes from sales to locations outside the R.O.C. or the P.R.C. Operating in the R.O.C., P.R.C. and other overseas locations exposes us to changes in policies and laws, including environmental regulations, as well as the general political and economic conditions, security risks, health conditions and possible disruptions in transportation networks, in the various countries in which we operate, which could result in an adverse effect on our business operations in such countries. If any of our global operations are affected by the legal, political, economic or other conditions in the jurisdiction we operate, our results of operations as well as market price and the liquidity of our ADSs and common shares may be materially and adversely affected.
19
Any impairment charges may have a material adverse effect on our net income.
Under IFRS, we are required to evaluate our assets, such as property, plant and equipment, investment properties, intangible assets, including goodwill, and investments in financial instruments, for possible impairment at least annually or whenever there is an indication of impairment. If certain criteria are met, we are required to record an impairment charge.
With respect to assets, we recognized impairment charges of NT$601.2 million, NT$992.3 million and NT$126.8 million (US$4.6 million) in 2019, 2020 and 2021, respectively, primarily as a result of impairment charges related to property, plant and equipment and investments under the equity method.
We are unable to estimate the extent and timing of any impairment charges for future years and we cannot give any assurance that impairment charges will not be required in periods subsequent to December 31, 2021. Any impairment charge could have a material adverse effect on our net income. The determination of an impairment charge at any given time is based significantly on our expected results of operations over a number of years in the future. As a result, an impairment charge is more likely to occur during a period in which our operating results and outlook are otherwise already depressed.
Any failure to achieve and maintain effective internal controls could have a material adverse effect on our business and results of operations.
We are subject to reporting obligations under the U.S. securities laws. The SEC as required by Section 404 of the Sarbanes-Oxley Act of 2002 adopted rules requiring every public company to include a management report on the effectiveness of such company’s internal control over financial reporting in its annual report. In addition, an independent registered public accounting firm must report on such company’s internal control over financial reporting.
As effective internal control over financial reporting is necessary for us to produce reliable financial reports and is important to help prevent fraud, any failure to maintain effective internal control over financial reporting could harm our business and result in a loss of investor confidence in the reliability of our financial statements, which in turn could negatively impact the trading price of our common shares and ADSs. Furthermore, we may need to incur additional costs and use additional management and other resources in an effort to comply with Section 404 of the Sarbanes-Oxley Act and other requirements going forward. Please refer to “Item 15. Controls and Procedures” for details on our internal control over financial reporting.
Our insurance coverage may be inadequate to cover all of our business risks.
Although we seek to obtain insurance for some of our main operational risks, the amount of our insurance coverage may not be adequate to cover all potential claims or liabilities, and we may be forced to bear substantial costs resulting from risks and uncertainties of our business. There is also no guarantee that we will be able to obtain insurance coverage when desired or that insurance will be available on commercially attractive terms. Any failure to obtain adequate insurance coverage on terms favorable to us, or at all, could have a material adverse effect on our business, financial condition and results of operations.
We could potentially face tax uncertainties arising from the decisions, activities and operations undertaken by us.
There are many business activities that may give rise to tax issues in our daily operations, ranging from procurement, research and development activities, manufacturing to product storage and distribution, among other activities. Additional tax liabilities such as double taxation, inapplicability of tax incentives, tax adjustment and related interest and penalties may arise if all these tax issues are not dealt with properly. The development and evolution of tax laws and regulations present considerable uncertainties in interpretation and enforcement, which could call for more onerous compliance measures and tax audits in the jurisdictions in which we operate. Failure to comply with any change in tax laws could result in unfavorable tax consequences to us and have an adverse impact on our business, financial condition and results of operations. For instance, we were subject to an estimated tax penalty of US$843 due to delay on the tax installment for the fourth quarter of 2021. We made remediation by applying for deferment and made the tax payment within the deferment period. We are not aware of any further penalties or enforcement actions as of the date of this annual report.
20
We have business operations in multiple countries and our worldwide operations are taxed under the laws of the jurisdictions in which we operate. However, the integrated nature of our worldwide operations can produce conflicting claims from revenue authorities in different countries as to the profits to be taxed in the individual countries. Recently, tax authorities around the world have heightened their scrutiny of company tax filings and have adopted a more rigid regulatory posture. As part of this shift, the Organization for Economic
Co-operation
and Development has proposed a number of tax law changes under its Base Erosion and Profit Shifting Action Plans to address issues of transparency, coherence and substance. The EU list of non-cooperative
jurisdictions for tax purposes is part of the EU’s external strategy for taxation and aims to contribute to ongoing efforts to promote tax good governance worldwide. If the countries where our operations are based be added into EU list of non-cooperative
jurisdictions for tax purposes could adversely affect our operations. We face risks related to public health epidemics, including the recent novel coronavirus outbreaks.
Our financial condition and results of operations may be adversely affected if a public health epidemic interferes with our ability, or that of our employees, suppliers, customers and other business partners to perform our and their respective responsibilities and obligations related to the conduct of our business. Since November 2019, a novel strain of coronavirus, or factors, including facility shutdowns mandated by national, regional and local governments, could also prevent our sites from operating at full capacity and adversely affect our financial position. The potential impact brought by and the duration of the
COVID-19,
has spread across the world. On March 11, 2020, the World Health Organization declared COVID-19
a global pandemic. To date, COVID-19
outbreak has caused significant disruption to the financial markets and international supply chains, which can substantially depress global business activities, restrict access to capital and result in a long-term economic downturn that would negatively affect our operating results. Any interruption to our supply chain can cause shortages in materials and labor supplies that are key to our commercial operations and negatively impact our business results. COVID-19-related
COVID-19
outbreak is difficult to assess or predict and the full impact of the virus on our operations will depend on many factors beyond our control, including the extent of resurgences of the disease and its variants, vaccine distribution and other actions in response to the virus or to contain its impact. To combat the impact of
COVID-19,
we continually update our preventative policies for our manufacturing facilities and provide constant monitoring of our operations. We go beyond just adopting control measures to comply with local government health and safety regulations. For example, we have implemented enhanced health and safety protocols across our sites, including temperature screening, mandatory and self-quarantine protocols, suspension of non-critical
overseas business travel, remote work arrangements and social distancing guidelines in our employee cafeteria, changing rooms, conference rooms as well as other public common areas to reduce the risk of disease exposure. We built a class 100K clean room facility to manufacture high-quality surgical face masks and provide them free of charge to employees in Taiwan to help prevent transmission. While we have leveraged corporate resources across our business platform and manufacturing sites to mitigate the potential impact that COVID-19
might have on our operations and there have been intensifying efforts to contain the spread of COVID-19
by the governments of the countries and territories affected, the extent to which COVID-19
impacts our results remains highly uncertain and depends on future developments, such as the variants of COVID-19.
We face uncertainties relating to the
phasing-out
of LIBOR. On July 27, 2017, the United Kingdom’s Financial Conduct Authority, which regulates London Interbank Offered Rate, or the LIBOR, announced that it intends to phase out LIBOR by the end of 2021. It is unclear if LIBOR will cease to exist at that time or if new methods of calculating LIBOR will be established such that it continues to exist after 2021. On November 30, 2020, ICE Benchmark Administration, or the IBA, the administrator of LIBOR, with the support of the United States Federal Reserve and the United Kingdom’s Financial Conduct Authority, announced plans to consult on ceasing publication of USD LIBOR on December 31, 2021 for only the one week and two month USD LIBOR tenors, and on June 30, 2023 for all other USD LIBOR tenors. While this announcement extends the transition period to June 2023, the United States Federal Reserve concurrently issued a statement advising banks to stop new USD LIBOR issuances by the end of 2021. In light of these recent announcements, the future of LIBOR at this time is uncertain and any changes in the methods by which LIBOR is determined or regulatory activity related to LIBOR’s
phase-out
could cause LIBOR to perform differently than in the past or cease to exist. Discontinuation of LIBOR and uncertainty as to the nature of such potential changes, alternative reference rates or other reforms may impact the amounts of interest we pay under our debt arrangements and to the extent that the impact on our operation due to such transition remains uncertain. 21
Escalation of tensions between South Korea and North Korea could have an adverse effect on our operations in South Korea and the market value of our shares.
The political relationship between South Korea and North Korea has been tense throughout Korea’s modern history. The level of tension between the two countries has heightened and may increase abruptly as a result of current and future events. In recent years, there have been increasing security concerns stemming from North Korea’s nuclear weapons and ballistic missile programs and uncertainty regarding North Korea’s actions and possible responses from the international community. Although we do not derive any revenue from, nor sell any products in, North Korea, any further increase in tension between North and South Korea, for example, if North Korea experiences a leadership crisis, high-level contacts between South Korea and North Korea break down or military hostilities occur, could have a material adverse effect on our South Korea subsidiary, our business, financial condition, results of operations and the market value of our common stock.
Any attempt by the U.S. government to withdraw from or materially modify existing international trade agreements or take further actions against certain P.R.C. technology companies could adversely affect our business, financial condition and results of operations.
The political changes in the U.S. have created uncertainty regarding future U.S. trade policies. The U.S. government has made certain comments that suggest the U.S. is not supportive of certain existing international trade agreements, such as the North America Free Trade Agreement. The U.S. government has also issued executive orders to withdraw the U.S. from the Trans-Pacific Partnership. The U.S. government has shown inclinations to withdraw the U.S. from the World Trade Organization, which can lead to greater economic instability. If the U.S. were to withdraw from or materially modify certain international trade agreements to which it is a party, or if tariffs continue to be raised on foreign-sourced goods imported to the U.S., our U.S. customers may seek new suppliers in the U.S. or other countries, and our business, financial condition and results of operations could be adversely affected.
In addition, the U.S. government has also escalated disputes with certain P.R.C. technology companies, some of which are our customers, over issues in cybersecurity. Since
mid-2018,
political tension has increased between the U.S. and the P.R.C. and has escalated into a tariff war. On January 15, 2020, the U.S. and the P.R.C. signed the Phase One trade deal, which officially agreed to the rollback of tariffs, expansion of trade purchases, and renewed commitments on intellectual property, technology transfer, and currency practices. The progress of trade talks between China and the United States faces uncertainties, and there can be no assurance as to whether the United States will maintain or reduce tariffs or impose additional tariffs on Chinese products in the near future. Furthermore, there was no Phase Two trade deal implemented to date and most of the tariffs imposed remain in place. Any future re-adoption
or expansion of the U.S. trade restrictions and tariffs, quotas and embargoes, or further escalation of the U.S. and the P.R.C. trade war can adversely impact our business operations. On the other hand, U.S. trade restrictions against the P.R.C. could further accelerate the P.R.C.’s move on self-sufficiency and efforts in reducing the reliance on foreign suppliers, leading to uncertainty of our business related to the P.R.C. supply chain.
We may not be successful in pursuing mergers and acquisitions. Any mergers or acquisitions we make may lead to a diversion of management resources.
Our future success may depend on acquiring businesses and technologies, making investments or forming joint ventures that complement, enhance or expand our current product offerings or otherwise offer us growth opportunities. In pursuing such acquisitions, we may face competition from other companies in the semiconductor industry. Our ability to acquire or invest in suitable targets may be limited by applicable laws and regulations in the R.O.C., P.R.C., the United States, European countries and other jurisdictions where we do business. Even if we are successful in making such acquisitions or investments, we may have to expend substantial amounts of cash, incur debt, assume loss-making divisions and incur other types of expenses. We may also face challenges in successfully integrating any acquired companies into our existing organization or in creating the anticipated synergistic benefits. Each of these risks could have a material adverse effect on our business, financial condition and results of operations.
22
Risks Relating to the SPIL Acquisition
There may be risks associated with the impacts of the SPIL Acquisition on our subgroups and our holding company structure.
ASE entered into a Joint Share Exchange Agreement with SPIL in June 2016, pursuant to which ASEH, a holding company in Taiwan, holds 100% of the equity interests in both ASE and SPIL such that ASE and SPIL became wholly owned subsidiaries of ASEH. The common shares of ASE and SPIL were delisted from the TWSE. The ADSs of ASE and SPIL were delisted from NYSE and NASDAQ, respectively, and became eligible for deregistration under the Exchange Act. Subsequently, the common shares of ASEH were listed on the TWSE, and the ADSs of ASEH were listed on the NYSE.
The implementation of such corporate structure restructuring plan led to two subgroups, ASE Group and SPIL Group, of our holding company structure, and each subgroup may experience difficulties in creating strategic and operational synergies with each other and may further result in contingent risks, including increase in tax liabilities or trading discounts relating to a holding company discount that may become apparent in the future. For details about the Joint Share Exchange Agreement, see “Item 10. Additional Information— Material Contract.”
Risks Relating to Taiwan, R.O.C.
Strained relations between the R.O.C. and the P.R.C. and disruptions in Taiwan’s political environment caused by domestic political events could negatively affect our business and the market value of your investment.
Our principal executive offices and our principal facilities are located in Taiwan and approximately 58.7%, 56.3% and 57.0% of our operating revenues in 2019, 2020 and 2021, respectively, were derived from our operations in Taiwan. Accordingly, our business and financial condition may be affected by changes in local governmental policies and political and social instability.
The R.O.C. has a unique international political status. The government of the P.R.C. asserts sovereignty over all of China, including Taiwan, and does not recognize the legitimacy of the R.O.C. government. Although significant economic and cultural relations have been established in recent years between the R.O.C. and the P.R.C., relations have often been strained. Any major change in the Taiwanese political environment, including the outcome of presidential or municipal elections, or potential shifts in government policy, may affect the direction of economic and political developments and negatively impact the economic and political environment in Taiwan. Past developments related to the interaction between the R.O.C. and the P.R.C., domestic political events or election results have on occasion depressed the market prices of the securities of Taiwanese or Taiwan-related companies, including our own. Relations between the R.O.C. and the P.R.C. and other factors affecting the political or economic conditions in Taiwan could have a material adverse effect on our financial condition and results of operations, as well as the market price and the liquidity of our common shares and ADSs.
We manufacture interconnect materials in the P.R.C. through our wholly owned subsidiary, ASE Shanghai. We also provide packaging and testing services in the P.R.C. through some of our subsidiaries. In addition, we engage in the P.R.C. in real estate development and the manufacture of computer peripherals and electronic components through our subsidiaries in the P.R.C. See “Item 4. Information on the Company—Organizational Structure—Our Consolidated Subsidiaries.” In the past, R.O.C. companies, including ourselves, were prohibited from investing in facilities for the packaging and testing of semiconductors in the P.R.C. Although the prohibitions have been relaxed since February 2010, the R.O.C. government currently still restricts certain types of investments by R.O.C. companies, including ourselves, in the P.R.C. We do not know when or if such laws and policies governing investment in the P.R.C. will be amended, and we cannot assure you that such R.O.C. investment laws and policies will permit us to make further investments of certain types in the P.R.C. in the future that we consider beneficial to us. Our growth prospects and profitability may be adversely affected if we are restricted from making certain additional investments in the P.R.C. and are not able to fully capitalize on the growth of the semiconductor industry in the P.R.C.
23
As a substantial portion of our business and operations is located in Taiwan, we are vulnerable to natural disasters including earthquakes, typhoons, droughts, as well as power outages and other industrial incidents, which could severely disrupt the normal operation of our business and adversely affect our results of operations.
Taiwan is susceptible to earthquakes and has experienced severe earthquakes which caused significant property damage and loss of life. Earthquakes have damaged production facilities and adversely affected the operations of many companies involved in the semiconductor and other industries. Recently, we have never experienced structural damage to our facilities or damage to our machinery and equipment due to earthquakes, however, in the past, we have experienced interruptions to our production schedule primarily as a result of power outages caused by earthquakes.
The supply of electrical power in Taiwan, which is primarily provided by Taiwan Power Company, is susceptible to power disruptions that could be prolonged and frequent, caused by overload as a result of high demand or other reasons. Such power disruptions could further be exacerbated with the government of Taiwan set the target of achieving a nuclear-free homeland by 2025. On March 3, 2022, for example, Taiwan experienced a massive power blackout, which left millions of homes, offices and factories without power. Although the power blackout did not have a material impact on our operations, future power blackout may disrupt our business operations and adversely affect our results of operations.
Taiwan is also susceptible to typhoons, which may cause damage and business interruptions to companies with facilities located in Taiwan. Taiwan has also experienced severe droughts in the past. Our manufacturing process uses extensive amounts of freshwater. Our primary water recycling methods are ultra-filtration systems, chemical mechanical polishing wastewater recycling, and reverse osmosis water recycling. We also harvest rainwater for scrubbing towers and cooling towers. In addition, we take responsive measures for water supply levels such as to regularly check water storage and recycling equipment, prepare truckloads of water for meeting future water demand and refine manufacturing capacity in responding to water allocation. Although we have not been directly affected by droughts, we are dependent upon water for our packaging and substrates operations and a drought could interrupt such operations. In addition, a drought could interrupt the manufacturing process of the foundries, in turn disrupting some of our customers’ production, which could result in a decline in the demand for our services. While we aim to minimize the impact of water risks and plan ahead to soften the impact, we cannot assure that water storage will not affect our operations.
In addition, we are also subject to the risk of industrial and workplace accidents that could lead to injury or loss of life, damages to our facilities, and adversely impact our business reputation, commercial prospects and operations, as well as our share price and dividends.
Our production facilities as well as many of our suppliers and customers and providers of complementary semiconductor manufacturing services, including wafer foundries, are located in Taiwan. If our customers are impacted by natural disasters including earthquakes, typhoons, droughts or industrial incidents including power outage and labor strikes, these events could cause a decline in the demand for our services. If our suppliers or providers of complementary semiconductor manufacturing services are affected by the aforementioned events, our production schedule could be interrupted, which can adversely impact our financial condition and results of operations.
Although the audit report was issued by an independent registered public accounting firm who is currently subject to the inspection by the PCAOB, if it is later determined that the PCAOB is unable to inspect or investigate our auditor completely, investors would be deprived of the benefits of such inspection and our ordinary shares may be delisted or prohibited from trading.
The recent joint statement by the SEC and PCAOB and the Holding Foreign Companies Accountable Act (the “HFCAA”) all call for additional and more stringent criteria to be applied to emerging market companies upon assessing the qualification of their auditors, especially the
non-U.S.
auditors who are not inspected by the PCAOB. These developments could add uncertainties to us. The audit report was issued by Deloitte Touche and PricewaterhouseCoopers, Taiwan, both of which are independent public accounting firms that are registered with the PCAOB. As auditors of companies that are registered with the SEC and publicly traded in the United States and a firm registered with the PCAOB, our auditors are required under the laws of the United States to undergo regular inspections by the PCAOB to assess its compliance with the laws of the United States and professional standards.
24
There have been recent deliberations within the U.S. government regarding limiting or restricting China-based companies from accessing U.S. capital markets. On December 18, 2020, the HFCAA was signed into law. The HFCAA includes requirements for the SEC to identify issuers whose audit work is performed by auditors that the PCAOB is unable to inspect or investigate completely because of a restriction imposed by a
non-U.S.
authority in the auditor’s local jurisdiction. Additionally, in July 2020, the U.S. President’s Working Group on Financial Markets issued recommendations for actions that can be taken by the executive branch, the SEC, the PCAOB or other federal agencies and department with respect to Chinese companies listed on U.S. stock exchanges and their audit firms, in an effort to protect investors in the United States. In response, on November 23, 2020, the SEC issued guidance highlighting certain risks (and their implications to U.S. investors) associated with investments in China-based issuers and summarizing enhanced disclosures the SEC recommends China-based issuers make regarding such risks. On December 2, 2021, the SEC adopted final rules relating to the implementation of certain disclosure and documentation requirements of the HFCAA. The SEC is assessing how to implement the requirements of the HFCAA, including the listing and trading prohibition requirements described above. Under the HFCAA, our securities may be prohibited from trading on the NYSE if our auditor is not inspected by the PCAOB for three consecutive years, and this ultimately could result in our common shares being delisted. Furthermore, on June 22, 2021, the U.S. Senate passed the Accelerating Holding Foreign Companies Accountable Act (“AHFCAA”), which, if enacted, would amend the HFCAA and require the SEC to prohibit an issuer’s securities from trading on any U.S. stock exchanges if its auditor is not subject to PCAOB inspections for two consecutive years instead of three. On September 22, 2021, the PCAOB adopted a final rule implementing the HFCAA, which provides a framework for the PCAOB to use when determining, as contemplated under the HFCAA, whether the Board is unable to inspect or investigate completely registered public accounting firms located in a foreign jurisdiction because of a position taken by one or more authorities in that jurisdiction. On December 16, 2021, the PCAOB issued a Determination Report which found that the PCAOB is unable to inspect or investigate completely registered public accounting firms headquartered in: (1) mainland China of the People’s Republic of China, because of a position taken by one or more authorities in mainland China; and (2) Hong Kong, a Special Administrative Region and dependency of the P.R.C., because of a position taken by one or more authorities in Hong Kong. The lack of access to the PCAOB inspection in China prevents the PCAOB from fully evaluating audits and quality control procedures of the auditors based in China. As a result, the investors may be deprived of the benefits of such PCAOB inspections. The inability of the PCAOB to conduct inspections of auditors in China makes it more difficult to evaluate the effectiveness of these accounting firms’ audit procedures or quality control procedures as compared to auditors outside of China that are subject to the PCAOB inspections, which could cause existing and potential investors in our stock to lose confidence in our audit procedures and reported financial information and the quality of our financial statements.
The recent developments would add uncertainties to us and we cannot assure you whether regulatory authorities would apply additional and more stringent criteria to us after considering the effectiveness of our auditors’ audit procedures and quality control procedures, adequacy of personnel and training, or sufficiency of resources, geographic reach or experience as it relates to the audit of our financial statements.
Should the PCAOB be unable to fully conduct inspection of our auditor’s work papers in China, it may make it difficult to evaluate the effectiveness of our auditors’ audit procedures or equity control procedures. Investors may consequently lose confidence in our reported financial information and procedures or quality of the financial statements, which would adversely affect us and out securities. In addition, by reason of the regulations described above, our common stock could be delisted or excluded from trading on any U.S. platform.
Risks Relating to Ownership of Our Common Shares and the ADSs
The market for our common shares and the ADSs may not be liquid.
Active, liquid trading markets generally result in lower price volatility and more efficient execution of buy and sell orders for investors, compared to less active and less liquid markets. Liquidity of a securities market is often a function of the volume of the underlying shares that are publicly held by unrelated parties.
25
There has been no trading market outside the R.O.C. for our common shares and the only trading market for our common shares is the TWSE. The outstanding ADSs are listed on the NYSE. There is no assurance that the market for our common shares or the ADSs will be active or liquid.
Although ADS holders are entitled to withdraw our common shares underlying the ADSs from the depositary at any time, R.O.C. law requires that our common shares be held in an account in the R.O.C. or sold for the benefit of the holder on the TWSE. In connection with any withdrawal of common shares from our ADS facility, the ADSs evidencing these common shares will be canceled. Unless additional ADSs are issued, the effect of withdrawals will be to reduce the number of outstanding ADSs. If a significant number of withdrawals are affected, the liquidity of our ADSs will be substantially reduced. We cannot assure you that the ADS depositary will be able to arrange for a sale of deposited shares in a timely manner or at a specified price, particularly during periods of illiquidity or volatility.
If a
non-R.O.C.
holder of ADSs withdraws and holds common shares, such holder of ADSs will be required to appoint a tax guarantor, local agent and custodian in the R.O.C. and register with the TWSE or the Taipei Exchange in order to buy and sell securities on the TWSE. When a
non-R.O.C.
holder of ADSs elects to withdraw and hold common shares represented by ADSs, such holder of the ADSs will be required to appoint an agent for filing tax returns and making tax payments in the R.O.C. Such agent will be required to meet the qualifications set by the R.O.C. Ministry of Finance and, upon appointment, becomes the guarantor of the withdrawing holder’s tax payment obligations. Evidence of the appointment of a tax guarantor, the approval of such appointment by the R.O.C. tax authorities and tax clearance certificates or evidentiary documents issued by such tax guarantor may be required as conditions to such holder repatriating the profits derived from the sale of common shares. We cannot assure you that a withdrawing holder will be able to appoint, and obtain approval for, a tax guarantor in a timely manner. In addition, under current R.O.C. law, such withdrawing holder is required to register with the TWSE or the Taipei Exchange and appoint a local agent in the R.O.C. to, among other things, open a bank account and open a securities trading account with a local securities brokerage firm, pay taxes, remit funds and exercise such holder’s rights as a shareholder. Furthermore, such withdrawing holder must appoint a local bank or a local securities firm to act as custodian for confirmation and settlement of trades, safekeeping of securities and cash proceeds and reporting and declaration of information. Without satisfying these requirements,
non-R.O.C.
withdrawing holders of ADSs would not be able to hold or otherwise subsequently sell our common shares on the TWSE or otherwise. Pursuant to P.R.C. Regulations, only QDIIs or persons that have otherwise obtained the approval from the MOEAIC and registered with the TWSE are permitted to withdraw and hold our shares from a depositary receipt facility. In order to hold our shares, such QDIIs are required to appoint an agent and custodian as required by the P.R.C. Regulations. If the aggregate amount of our shares held by any QDII or shares received by any QDII upon a single withdrawal or in the aggregate accounts for 10.0% of our total issued and outstanding shares, such QDII must obtain the prior approval from the MOEAIC. We cannot assure you that such approval would be granted.
The market value of your investment may fluctuate due to the volatility of the R.O.C. securities market.
The trading price of our ADSs may be affected by the trading price of our common shares on the TWSE. The R.O.C. securities market is smaller and more volatile than the securities markets in the U.S. and in many European countries. The TWSE has experienced substantial fluctuations in the prices and volumes of sales of listed securities and there are currently limits on the range of daily price movements on the TWSE. During 2021, the TWSE Weighted Index peaked at 18,248.28 on December 29, 2021, and reached a low of 14,902.03 on January 4, 2021, and the trading price of our common shares ranged from NT$81.8 per share to NT$133.5 per share. On March 18, 2022, the TWSE Weighted Index closed at 17,456.52 and the closing value of our common shares was NT$104.5 per share.
The TWSE is particularly volatile during times of political instability, including when relations between Taiwan and the P.R.C. are strained. Several investment funds affiliated with the R.O.C. government have also from time to time purchased securities from the TWSE to support the trading level of the TWSE. Moreover, the TWSE has experienced problems such as market manipulation, insider trading and settlement defaults. The recurrence of these or similar problems could have an adverse effect on the market price and liquidity of the securities of R.O.C. companies, including our common shares and ADSs, in both the domestic and international markets.
26
We may not continue to declare cash dividends in any particular amount.
We intend to continue to pay dividends. However, future dividends may be affected by, among other things, the best interests of our Company and our shareholders, our results of operations, cash balances and future cash requirements, financial condition, investments and acquisitions, legal risks, and other factors that the board of directors may consider relevant. Our dividend payments may change from time to time, and we cannot assure that we will continue to declare dividends in any particular amounts. A reduction in, a delay of, or elimination of our dividend payments could adversely affect our share price.
Holders of common shares and ADSs may experience dilution if we issue stock bonuses, stock options and restricted stocks to employees or sell additional equity or equity-linked securities.
Similar to other R.O.C. technology companies, we issue bonuses from time to time in the form of common shares. Bonuses in the form of our common shares are valued at the closing price of our common shares on the day prior to our meeting of the board of directors. Therefore, the issuance of our common shares pursuant to stock bonuses, stock options and restricted stock awards may have a dilutive effect on the holders of outstanding common shares and ADSs. In addition, the issuance of additional equity or equity-linked securities may result in additional dilution to our shareholders.
As of December 31, 2021, a total of approximately 96,802 thousand options assumed and granted by ASEH were outstanding. See “Item 6. Directors, Senior Management and Employees—Compensation—Share-Based Payment Arrangements.”
In August 2021, the shareholders’ meetings approved to issue gratuitous employee restricted stock awards. As of December 31, 2021, a total of 15,000 thousand restricted stocks were issued. See “Item 6. Directors, Senior Management and Employees—Compensation—Share-Based Payment Arrangements.”
Restrictions on the ability to deposit our common shares into our ADS facility may adversely affect the liquidity and price of our ADSs.
The ability to deposit common shares into our ADS facility is restricted by R.O.C. law. A significant number of withdrawals of common shares underlying our ADSs would reduce the liquidity of the ADSs by reducing the number of ADSs outstanding. As a result, the prevailing market price of our ADSs may differ from the prevailing market price of our common shares on the TWSE. Under current R.O.C. law, no person or entity, including you and us, may deposit our common shares in our ADS facility without specific approval of the FSC, unless:
| (1) | we pay stock dividends on our common shares; |
| (2) | we make a free distribution of common shares; |
| (3) | holders of ADSs exercise preemptive rights in the event of capital increases; or |
| (4) | to the extent permitted under the deposit agreement and the relevant custody agreement and within the amount of depositary receipts which have been withdrawn, investors purchase our common shares, directly or through the depositary, on the TWSE, and deliver our common shares to the custodian for deposit into our ADS facility, or our existing shareholders deliver our common shares to the custodian for deposit into our ADS facility. |
With respect to item (4) above, the depositary may issue ADSs against the deposit of those common shares only if the total number of ADSs outstanding following the deposit will not exceed the number of ADSs previously approved by the FSC, plus any ADSs issued pursuant to the events described in items (1), (2) and (3) above.
In addition, in the case of a deposit of our common shares requested under item (4) above, the depositary will refuse to accept deposit of our common shares if such deposit is not permitted under any legal, regulatory or other restrictions notified by us to the depositary from time to time, which restrictions may include blackout periods during which deposits may not be made, minimum and maximum amounts and frequency of deposits.
27
The depositary will not offer holders of ADSs preemptive rights unless the distribution of both the rights and the underlying common shares to our ADS holders are either registered under the Securities Act or exempt from registration under the Securities Act.
Holders of ADSs will not have the same voting rights as our shareholders, which may affect the value of their ADSs.
The voting rights of a holder of ADSs as to our common shares represented by its ADSs are governed by the deposit agreement. Holders of ADSs will not be able to exercise voting rights on an individual basis. If holders representing at least 51% of the ADSs outstanding at the relevant record date instruct the depositary to vote in the same manner regarding a resolution, including the election of directors, the depositary will cause all common shares represented by the ADSs to be voted in that manner. If the depositary does not receive timely instructions representing at least 51% of the ADSs outstanding at the relevant record date to vote in the same manner for any resolution, including the election of directors, holders of ADSs will be deemed to have instructed the depositary or its nominee to authorize all our common shares represented by the ADSs to be voted at the discretion of our chairman or his designee, which may not be in the interest of holders of ADSs. Moreover, while shareholders who own 1% or more of our outstanding shares are entitled to submit one proposal to be considered at our annual general meetings of shareholders, only holders representing at least 51% of our ADSs outstanding at the relevant record date are entitled to submit one proposal to be considered at our annual general meetings of shareholders. Hence, only one proposal may be submitted on behalf of all ADS holders.
The right of holders of ADSs to participate in our rights offerings is limited, which could cause dilution to your holdings.
We may from time to time distribute rights to our shareholders, including rights to acquire our securities. Under the deposit agreement, the depositary will not offer holders of ADSs those rights unless both the distribution of the rights and the underlying securities to all our ADS holders are either registered under the Securities Act or exempt from registration under the Securities Act. Although we may be eligible to take advantage of certain exemptions under the Securities Act available to certain foreign issuers for rights offerings, we can give no assurances that we will be able to establish an exemption from registration under the Securities Act, and we are under no obligation to file a registration statement for any of these rights. Accordingly, holders of ADSs may be unable to participate in our rights offerings and may experience dilution of their holdings.
If the depositary is unable to sell rights that are not exercised or not distributed or if the sale is not lawful or reasonably practicable, it will allow the rights to lapse, in which case holders of ADSs will receive no value for these rights.
Changes in exchange controls, which restrict your ability to convert proceeds received from your ownership of ADSs, may have an adverse effect on the value of your investment.
Under current R.O.C. law, the depositary, without obtaining approvals from the Central Bank of the Republic of China (Taiwan) or any other governmental authority or agency of the R.O.C., may convert NT dollars into other currencies, including U.S. dollars, for:
| ● | the proceeds of the sale of common shares represented by ADSs or received as stock dividends from our common shares and deposited into the depositary receipt facility; and |
| ● | any cash dividends or distributions received from our common shares. |
In addition, the depositary may also convert into NT dollars incoming payments for purchases of common shares for deposit in the ADS facility against the creation of additional ADSs. The depositary may be required to obtain foreign exchange approval from the Central Bank of the Republic of China (Taiwan) on a basis for conversion from NT dollars into foreign currencies of the proceeds from the sale of subscription rights for new common shares. Although it is expected that the Central Bank of the Republic of China (Taiwan) will grant this approval as a routine matter, we cannot assure you that in the future any approval will be obtained in a timely manner, or at all.
payment-by-payment
Under the R.O.C. Foreign Exchange Control Act, the Executive Yuan of the R.O.C. government may, without prior notice but subject to subsequent legislative approval, impose foreign exchange controls in the event of, among other things, a material change in international economic conditions. We cannot assure you that foreign exchange controls or other restrictions will not be introduced in the future.
28
The value of your investment may be reduced by possible future sales of common shares or ADSs by us or our shareholders.
While we are not aware of any plans by any major shareholders to dispose of significant numbers of common shares, we cannot assure you that one or more existing shareholders or owners of securities convertible or exchangeable into or exercisable for our common shares or ADSs will not dispose of significant numbers of common shares or ADSs. In addition, several of our subsidiaries and affiliates hold common shares, depositary shares representing common shares and options to purchase common shares or ADSs. They may decide to sell those securities in the future. See “Item 7. Major Shareholders and Related Party Transactions—Major Shareholders” for a description of our significant shareholders and affiliates that hold our common shares.
We cannot predict the effect, if any, that future sales of common shares or ADSs, or the availability of common shares or ADSs for future sale, will have on the market price of our common shares or the ADSs prevailing from time to time. Sales of substantial numbers of common shares or ADSs in the public market, or the perception that such sales may occur, could depress the prevailing market prices of our common shares or the ADSs.
Techniques employed by short sellers may drive down the trading price of the ADSs.
Short selling is the practice of selling securities that the seller does not own but rather has borrowed from a third-party with the intention of buying identical securities back at a later date to return to the lender. The short seller hopes to profit from a decline in the value of the securities between the sale of the borrowed securities and the purchase of the replacement shares, as the short seller expects to pay less in that purchase than it received in the sale. As it is in the short seller’s interest for the price of the security to decline, many short sellers publish, or arrange for the publication of, negative opinions regarding the relevant issuer and its business prospects in order to create negative market momentum and generate profits for themselves after selling a security short. These short attacks have, in the past, led to selling of shares in the market.
Amongst others, public companies listed in the United States that have material operations in the P.R.C. have on occasions been the subject of short selling. Much of the scrutiny and negative publicity has centered on allegations of a lack of effective internal control over financial reporting resulting in financial and accounting irregularities and mistakes, inadequate corporate governance policies or a lack of adherence thereto and, in many cases, allegations of fraud. As a result, many of these companies are now conducting internal and external investigations into the allegations and, in the interim, are subject to shareholder lawsuits and/or SEC enforcement actions.
It is not clear what effect such negative publicity could have on us. If we were to become the subject of any unfavorable allegations, whether such allegations are proven to be true or untrue, we could have to expend a significant amount of resources to investigate such allegations and/or defend ourselves. While we would strongly defend against any such short seller attacks, we may be constrained in the manner in which we can proceed against the relevant short seller by principles of freedom of speech, applicable state law or issues of commercial confidentiality. Such a situation could be costly and time-consuming and could distract our management from growing our business. Even if such allegations are ultimately proven to be groundless, allegations against us could severely impact in the ADSs could be greatly reduced or rendered worthless.
Item 4. Information on the Company
HISTORY AND DEVELOPMENT OF THE COMPANY
ASE Technology Holding CoLtd. was jointly established on April 30, 2018 as a company limited by shares under the R.O.C. Company Law, by the combination of Advanced Semiconductor Engineering, Inc., which was incorporated on March 23, 1984, and Siliconware Precision Industries Co., Ltd., which was incorporated on May 17, 1984.
.,
ASEH directly controls ASE Group, SPIL Group and USI Group. ASEH’s main manufacturing facilities are located in Taiwan, China, South Korea, Japan, Singapore, Malaysia, Vietnam, Mexico, America, Poland, France, the United Kingdom, Germany, Tunisia and Czech Republic. Our principal executive offices are located at 26, Chin 3rd Road, Kaohsiung, Taiwan, R.O.C. and our telephone number at the above address is (886) Our common shares have been listed on the TWSE under the symbol “3711” and ADSs representing our common shares have been listed on the NYSE under the ticker symbol “ASX” since April 2018.
7-361-7131.
29
SPIL Acquisition
In August 2015, ASE announced an offer to purchase 779,000,000 common shares (including those represented by American depositary shares) of SPIL through concurrent tender offers in the R.O.C. and the U.S., at a price of NT$45 per SPIL common share and NT$225 per SPIL American depositary share. The Initial SPIL Tender Offer expired on September 22, 2015, with 1,147,898,165 common shares (including those represented by American depositary shares) validly tendered and not validly withdrawn, exceeding the offer cap, and as a result, after proration, 725,749,060 SPIL common shares and 10,650,188 SPIL American depositary shares were accepted for purchase. On October 1, 2015, ASE became a shareholder holding approximately 24.99% of the issued and outstanding share capital in SPIL.
In December 2015, following an announcement by SPIL that it plans to issue 1,033 million shares, if approved by SPIL shareholders, to a third party pursuant to a share placement agreement, ASE submitted a written proposal to SPIL’s board proposing to acquire all SPIL shares not otherwise owned by ASE, contingent upon the termination of the share placement agreement. The board of directors of SPIL did not respond to our acquisition proposal. Subsequently, ASE launched an offer to purchase 770,000,000 common shares (including those represented by American depositary shares) of SPIL through concurrent tender offers in the R.O.C. and the U.S., at a price of NT$55 per SPIL common share and NT$275 per SPIL American depositary share. The Second SPIL Tender Offer expired on March 17, 2016. Because the TFTC did not render a decision before the expiration of the Second SPIL Tender Offer, resulting in the failure to satisfy one of the tender offer conditions, the Second SPIL Tender Offer was not successful. The TFTC subsequently suspended its review on March 23, 2016.
Notwithstanding the failure of the Second SPIL Tender Offer, ASE continued to seek control of SPIL, with the purpose of effecting an acquisition of 100% of the common shares and American depositary shares of SPIL. Simultaneously with the acquisition of SPIL, ASE planned to establish a holding company in Taiwan that would hold 100% of the equity interests of both ASE and SPIL such that ASE and SPIL would be wholly owned subsidiaries of such holding company, which would maintain all current operations of ASE and SPIL.
In March and April 2016, ASE acquired an additional 258,300,000 common shares of SPIL (including those represented by American depositary shares) through open market purchases.
In June 2016, ASE entered into the Joint Share Exchange Agreement with SPIL, pursuant to which ASEH was formed by means of a statutory share exchange pursuant to the laws of the Republic of China, and ASEH (i) acquired all issued shares of ASE in exchange for shares of ASEH, and (ii) acquired all issued shares of SPIL using cash consideration.
The Share Exchange was conditionally approved by the Anti-Monopoly Bureau under the State Administration for Market Regulation on November 23, 2017. Among other restrictive conditions imposed by the Anti-Monopoly Bureau, ASE and SPIL had to maintain independent operations for 24 months.
On January 16, 2018, ASE converted 9,690,452 American depositary shares of SPIL that it owned into 48,452,260 common shares.
On February 12, 2018, ASE and SPIL, respectively, held extraordinary general shareholders’ meetings and each approved the proposed Joint Share Exchange, pursuant to which, ASEH acquires 100% of both ASE and SPIL shares.
The Share Exchange consummated on April 30, 2018, and ASE and SPIL became privately held and wholly owned subsidiaries of ASEH concurrently. The common shares of ASE and SPIL were delisted from the TWSE and their respective ADSs were delisted from NYSE and NASDAQ.
On March 25, 2020, the Anti-Monopoly Bureau officially lifted all restrictive conditions imposed on the Share Exchange.
30
USI Group and USI Group Restructuring
USI Group engages primarily in EMS in relation to computing, consumer electronics, communications, industrial and automotive, among other services and businesses.
We have been purchasing the shares of Universal Scientific Industrial since 1999. Upon several acquisitions through cash and stock tender offer, Universal Scientific Industrial became our subsidiary in 2010. In 2012, USI Shanghai completed its IPO on the Shanghai Stock Exchange with the symbol “601231.” In 2015, Universal Scientific Industrial completed a
spin-off
of USI Inc. Following the completion of a series of share transfers, USI Inc. became the parent company of the USI Group in 2016. In October 2018, to enhance operational flexibility through organizational restructure, ASE’s board of directors resolved to spin off ASE’s investment department, which is responsible for managing the ordinary shares and assets of USI Inc., into USI Global, a newly established company. USI Global issued new ordinary shares to us as consideration for the
spin-off.
The spin-off
consummated in November 2018 and we obtained control over ASE and USI Global. In December 2018, our board of directors and the board of director of USI Global resolved to merge USI Global and ASE Technology Holding Co., Ltd. The merger consummated in January 2019 and ASE Technology Holding Co., Ltd. became the surviving entity after the merger and USI Global was thereby dissolved. Our financial position or financial performance was not materially affected by USI Global’s spin-off
from ASE Inc. or USI Global’s merger with ASE Technology Holding Co., Ltd. On December 12, 2019, USIFR, FAFG and the shareholders of FAFG entered into a share purchase agreement (the “FAFG Share Purchase Agreement”), and USI Shanghai and ASDI, one of the shareholders of FAFG and privately held company owned by FAFG’s founder, entered into a framework agreement for purchasing asset through issuing shares, pursuant to which USIFR and USI Shanghai will ultimately acquire 100.0% of the share capital of FAFG by way of a share purchase (the “FAFG Transaction”). The FAFG Transaction is a
two-step
transaction. In the first step, USIFR will directly purchase 89.6% of FAFG’s share capital in exchange for a cash payment. In the second step, USI Shanghai will acquire the remaining 10.4% of FAFG’s share capital from ASDI in exchange for newly issued shares of USI Shanghai. At the conclusion of both steps, USI Shanghai will directly or indirectly own 100% of the share capital of FAFG. On March 26, 2020, the issuance of new shares for the FAFG Transaction was approved unconditionally by the MA and Restructuring Committee of China Securities Regulatory Commission. On December 1, 2020, the transaction was completed and as a result, USI acquired 100% of FAFG’s total issued shares, 79,848 thousand shares. The consideration transferred amounting to NT$12,443.6 million. For details about the FAFG Share Purchase Agreement, see “Item 10. Additional information—Material Contract” and refer to Note 29 to our consolidated financial statements included in this annual report for more information. China Site Dispositions
ASEH and Beijing Wise Road Asset Management Co., Ltd. (“Wise Road Capital”) have entered into a Sale and Purchase Agreement by which ASEH to sell shares and equity interests in GAPT Holding Limited (GAPT Holding Limited directly or indirectly holds 100.0% equity interests in Global Advanced Packaging Test (Hong Kong) Limited, ASEWH, ASEN and Advanced Shanghai) and ASEKS to Wise Road Capital or its designated affiliate in exchange for a cash consideration in an aggregate amount of NT$36,939.1 million (US$1,331.6 million). For details about the China site dispositions, see “Item 10. Additional information—Material Contract” and refer to Note 30 to our consolidated financial statements included in this annual report for more information.
Capital Expenditures
Our principal capital expenditures for the years ended December 31, 2019, 2020 and 2021 have been for machinery and equipment procurements and investments in buildings and improvement in connection with the expansion of our capacity expansion, for which we spent NT$63,073.9 million, NT$59,024.2 million and NT$74,417.5 (US$2,682.7 million), respectively. We had commitments for capital expenditures of approximately NT$52,678.6 million (US$1,899.0 million), of which NT$3,761.1 million (US$135.6 million) had been prepaid as of December 31, 2021, mainly in connection with the expansion of our packaging and testing services operations primarily in the R.O.C. and the P.R.C. Any future expansion of our operating activities could result in additional capital expenditures. We anticipate our capital expenditures in 2022 will be financed through our existing cash, expected cash flow from operations and existing credit lines under our loan facilities and will consist of, among other things, additional machinery and equipment procurements for our capacity expansions. See “Item 5. Operating and Financial Review and Prospects—Liquidity and Capital Resources” for more information. There was no significant financial investments or divestitures in 2019, 2020 and 2021.
31
For more information on our history and development, see “—Organizational Structure.”
BUSINESS OVERVIEW
ASEH is a leading provider of semiconductor manufacturing services in assembly and testing. Our services include semiconductor packaging, production of interconnect materials,
front-end
engineering testing, wafer probing and final testing services, as well as integrated solutions for EMS in relation to computing, peripherals, communications, industrial, automotive and server applications. We believe that, as a result of the following strengths, we are able to compete effectively to meet customers’ requirements across a wide range of applications:
| ● | our ability to provide a broad range of cost-effective semiconductor packaging and testing services on a large-scale turnkey basis within key centers of semiconductor manufacturing; |
| ● | our expertise in developing and providing cost-effective packaging, interconnect materials and testing technologies and solutions; |
| ● | our ability to provide proactive original design manufacturing services using innovative solution-based designs; |
| ● | our commitment to investing in capacity expansion and research and development, as well as selective acquisitions, that will benefit customers and our business; |
| ● | our geographic presence in key centers of outsourced semiconductor and electronics manufacturing; and |
| ● | our long-term relationships with providers of complementary semiconductor manufacturing services, including our strategic alliance with TSMC. |
We believe that it is still the trend for semiconductor companies to outsource their packaging, testing and manufacturing requirements as semiconductor companies rely on independent providers of foundry, packaging and testing and EMS. In response to the increased pace of new product development and shortened product life and production cycles, semiconductor companies are increasingly seeking both independent packaging and testing companies that can provide turnkey services in order to reduce time to market and electronic manufacturing companies with proactive original design capabilities that can provide large-scale production. We believe that our technological expertise and scale and our ability to integrate our broad range of solutions into turnkey services and EMS allow us to benefit from the accelerated outsourcing trend and better serve our existing and potential customers.
We believe that we have benefited, and will continue to benefit, from our geographic location in Taiwan. Taiwan is currently the largest center for outsourced semiconductor manufacturing in the world and has a high concentration of EMS providers. Our close proximity to foundries and other providers of complementary semiconductor manufacturing services is attractive to our customers who wish to take advantage of the efficiencies of a total semiconductor manufacturing solution by outsourcing several stages of their manufacturing requirements. We believe that, as a result, we are well positioned to meet the advanced semiconductor engineering and manufacturing requirements of our customers.
Industry Background
General
Semiconductors are the building blocks used to create an increasing variety of electronic products and systems. Continuous improvements in semiconductor process and design technologies have led to smaller, more complex and more reliable semiconductors at a lower cost per function. These improvements have resulted in significant performance and price benefits to manufacturers of electronic products. As a result, semiconductor demand has grown substantially in our primary
end-user
markets for communications, computing and consumer electronics, and has experienced increased growth in other markets such as automotive products and industrial automation and control systems. 32
The semiconductor industry is characterized by strong long-term growth, with periodic and sometimes severe cyclical downturns. The Semiconductor Industry Association reported that worldwide sales of semiconductors increased from approximately US$51.0 billion in 1990 to approximately US$555.9 billion in 2021. We believe that overall growth and cyclical fluctuations will continue over the long-term in the semiconductor industry.
EMS
EMS providers typically achieve large economies of scale in manufacturing by pooling together product design techniques and also provide value-added services such as warranties and repairs. Companies who do not need to manufacture a constant supply of products have increasingly outsourced their manufacturing to these service providers so that they can respond quickly and efficiently to sudden spikes in demand without having to maintain large inventories of products.
EMS are sought by companies in a wide range of industries including, among others, information, communications, computing, consumer electronics, automotive electronics, medical treatment, industrial applications, aviation, navigation, national defense and transportation. Although affected by global economic fluctuations, we expect the EMS industry to continue to grow in the long term, and we have enhanced our presence in the industry through USI Group.
Outsourcing Trends in Semiconductor Manufacturing
Historically, semiconductor companies designed, manufactured, packaged and tested semiconductors primarily within their own facilities. However, there is a clear trend in the industry to outsource the manufacturing process. Virtually every significant stage of the manufacturing process can be outsourced. Wafer foundry services, semiconductor packaging and testing services, and EMS are currently the largest segments of the independent semiconductor manufacturing services market.
The availability of technologically advanced independent manufacturing services has also enabled the growth of “fabless” semiconductor companies that focus on semiconductor design and marketing, while outsourcing their wafer fabrication, packaging and testing requirements to independent companies. We believe that the growth in the number and scale of fabless semiconductor companies that rely solely on independent companies to meet their manufacturing requirements will continue to be a driver of growth for us. Similarly, the availability of technologically advanced independent manufacturing services has encouraged integrated device manufacturers, which traditionally have relied on
in-house
semiconductor manufacturing capacity, to increasingly outsource their manufacturing requirements to independent semiconductor manufacturing companies. We believe the outsourcing of semiconductor manufacturing services will increase in the future for many reasons, including the following:
| ● | Technological Expertise and Significant Capital Expenditure. in-house facilities are becoming less desirable to integrated device manufacturers because of the high investment costs as well as the inability to achieve sufficient economies of scale and utilization rates necessary to be competitive with the independent service providers. Independent packaging, testing, wafer foundry and EMS companies, on the other hand, are able to realize the benefits of specialization and achieve economies of scale by providing services to a large base of customers across a wide range of products. This enables them to reduce costs and shorten production cycles through high capacity utilization and process expertise. In the process, they are also able to focus on discrete stages of semiconductor manufacturing and deliver services of superior quality. Some semiconductor companies with in-house operations are under increasing pressure to rationalize these operations by relocating to locations with lower costs or better infrastructure, in order to lower manufacturing costs and shorten production cycle time. We expect semiconductor companies to increasingly outsource their requirements to take advantage of the advanced technology and scale of operations of independent packaging and testing companies and EMS providers. |
33
| ● | Focus on Core Competencies. |
| ● | Time-to-Market time-to-market |
| ● | Capitalize on the High Growth Rates in Emerging Markets. in-house will be increasingly outsourced in order to improve efficiency. |
Trends of Mergers and Acquisitions in the Semiconductor Industry
The global semiconductor industry is highly competitive, and such competitive landscape is changing as a result of a trend toward consolidation within the industry. In particular, packaging and testing service providers in the semiconductor industry have engaged in cross-border mergers and acquisitions in recent years as part of their expansion strategy, which has gradually changed the ecosystem of the semiconductor industry.
Examples of mergers and acquisitions in recent years include mergers and acquisitions by and among semiconductor design companies or integrated device manufacturers, including Intel Corporation’s acquisition of Altera Corporation, ON Semiconductor Corporation’s acquisition of Fairchild Semiconductor International, Inc., NXP Semiconductors N.V.’s acquisition of Freescale Semiconductor, Inc., Avago Technologies Ltd.’s acquisition of Broadcom Corporation, several acquisitions of semiconductor design companies by MediaTek, Inc., Bain Capital’s acquisition of Toshiba Corporation’s memory chip business, Microchip Technology Inc.’s acquisition of Atmel Corporation and Microsemi Corporation, Qualcomm Incorporated’s attempted acquisition of NXP Semiconductors, Broadcom Limited’s attempted acquisition of Qualcomm Incorporated, Infineon’s acquisition of Cypress, NXP Semiconductors N.V.’s acquisition of Marvell’s
Wi-Fi
Connectivity Business, ON Semiconductor Corporation’s acquisition of Quantenna, NVIDIA’s acquisition of ARM Limited from SoftBank Group Corp., Analog Devices, Inc.’s acquisition of Maxim Integrated Products, Inc., and AMD’s acquisition of Xilinx. Examples of mergers and acquisitions by and among semiconductor packaging and testing companies, including Jiangsu Changjiang Electronics Technology Co., Ltd.’s acquisition of STATS ChipPAC Ltd., Nantong Fujitsu Microelectronics Co., Ltd.’s acquisition of the packaging and testing factory of Advanced Micro Devices, Inc., Amkor Technology, Inc.’s acquisition of
J-Devices
Corporation, and Tianshui Huatian Technology’s acquisition of Unisem. As a result of the aforementioned mergers and acquisitions, our competitors were able to further strengthen their competitive position by expanding their product offerings and combining their financial resources. We expect this consolidation trend to continue.
Overview of Semiconductor Manufacturing Process
The manufacturing of semiconductors is a complex process that requires increasingly sophisticated engineering and manufacturing expertise. The manufacturing process can be generally divided into the following stages:
34
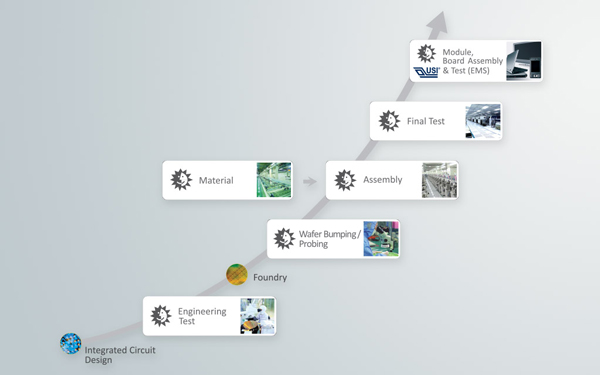
We are involved in all stages of the semiconductor manufacturing process except circuit design and wafer fabrication.
| Process |
Description | |
| 1. Circuit Design |
The design of a semiconductor is developed by laying out circuit components and interconnections. | |
| 2. Engineering Test |
Throughout and following the design process, prototype semiconductors undergo engineering testing, which involves software development, electrical design validation, and reliability and failure analysis. | |
| 3. Wafer Fabrication |
Process begins with the generation of a photomask through the definition of the circuit design pattern on a photographic negative, known as a mask, by an electron beam or laser beam writer. These circuit patterns are transferred to the wafers using various advanced processes. | |
| 4. Wafer Probe |
Each individual die is electrically tested, or probed, for defects. Dies that fail this test are marked to be discarded. | |
| 5. Packaging (or Assembly) |
Packaging, also called assembly, is the processing of bare semiconductors into finished semiconductors and serves to protect the die and facilitate electrical connections and heat dissipation. | |
| 6. Final Test |
Final testing is conducted to ensure that the packaged semiconductor meets performance specifications. Final testing involves using sophisticated testing equipment, known as testers, and customized software to electrically test a number of attributes of packaged semiconductors, including functionality, speed, predicted endurance and power consumption. The final testing of semiconductors is categorized by the functions of the semiconductors tested into logic/mixed-signal/RF/3D IC/discrete final testing and memory final testing. Memory final testing typically requires simpler test software but longer testing time per device tested. | |
| 7. Module, Board Assembly and Test |
Module, board assembly and test refers to the combination of one or more packaged semiconductors with other components in an integrated module or board to enable increased functionality. | |
| 8. Material |
Material refers to the interconnection of materials which connect the input/output on the semiconductor dies to the printed circuit board, such as substrate, leadframe and flip chip. | |
35
Strategy
Our objective is to provide integrated solutions that set industry standards, including packaging, testing services, interconnect materials design and production capabilities, and to lead and facilitate the industry trend toward outsourcing semiconductor manufacturing requirements. The principal elements of our strategy are to:
Grow Our Packaging Services and Expand Our Range of Offerings
We believe that an important factor to attracting leading semiconductor companies as our customers has been our ability to fulfill demand for a broad range of packaging solutions on a large scale. We intend to continue to develop process and product technologies to meet the packaging requirements of clients. Our expertise in packaging technology has enabled us to develop sophisticated solutions such as flip chip packaging, bump chip carrier packaging, stacked die packaging and fine-pitch wire bonding. We are continuously investing in research and development in response to and in anticipation of migrations in technology and intend to continue to acquire access to new technologies through strategic alliances and licensing arrangements.
The increasing miniaturization of semiconductors and the growing complexity of interconnect technology have also resulted in the convergence of assembly processes at different levels of integration: chip, module, board and system. In response to this miniaturization and growing complexity, we have focused on providing module assembly services and, in addition, our subsidiary USI Group has provided us with access to process and product technologies at the levels of module, board and system assembly and testing, which helps us to better anticipate industry trends and take advantage of potential growth opportunities. We expect to continue to combine our packaging, testing and materials technologies with the expertise of USI Group at the systems level to develop our SiP business.
Strategically Expand and Streamline Production Capacity
To capitalize on the growing demand, we intend to strategically expand our production capacity, both through internal growth and selective acquisitions and joint ventures, with a focus on providing cost-competitive and innovative packaging and testing services.
We intend to invest in trends that are essential to the development of the industry. We plan to expand our capacity to meet demand for smaller form factors, higher performance and higher packaging density.
In addition, we intend to promote our copper wire solutions to our customers in addition to gold wire. Gold wire is a significant raw material for us. Gold prices, however, are subject to intense fluctuations and have in the past impacted our profitability. We believe that replacing gold wire in some of our packages with copper wire technology will not only improve our profitability but will also enable us to provide more value to our customers by providing lower cost solutions, which could enhance our competitiveness and market share. We are currently the industry leader in terms of copper wire capacity. We thus plan to capitalize on the overall industry trend of copper conversion by maintaining our leadership and focusing on integrating copper wire into a wider range of traditional leadframe-based packages and
higher-end
substrate-based packages. We expect to focus on providing cost-competitive services through better management of capacity utilization and efficiency improvements and offer our services on a large scale with the intention of driving more integrated device manufacturer outsourcing in the long run.
We evaluate acquisition and joint venture opportunities on the basis of access to new markets and technology, the enhancement of our production capacity, improvement of research and development capabilities, economies of scale and management resources, and closer proximity to existing and potential customers. The table below sets forth our recent major investments.
36
| Year |
Investments | |||
| 2019 | ● We entered into a project investment agreement with China Merchants Group of Huizhou Daya Bay Economic and Technological Development Zone of Guangdong Province to set up a subsidiary to address the growing needs of our capacity expansion and the development of our business in South China. ● We obtained control over Advanced Microelectronic Products Inc. to diversify our business in manufacturing of integrated circuit. | |||
| 2020 | ● We set up a Vietnam-based subsidiary, UNIVERSAL SCIENTIFIC INDUSTRIAL (VIETNAM) CO., LTD., to fulfill international customer orders and strengthen supply chain management. ● We acquired 100% of FAFG to further enhance our manufacturing capabilities, expand our EMS customer base and capture a wider range of opportunities throughout the product development lifecycle. | |||
| 2021 | ● We obtained 20.82% shareholdings in Chipletz, Inc., which was founded by well-experienced experts in chiplet technology. | |||
Continue to Leverage Our Presence in Key Centers of Semiconductor and Electronics Manufacturing
We intend to continue leveraging our presence in key centers of semiconductor and electronics manufacturing to further grow our business. We have significant packaging, testing and EMS operations in Taiwan, currently one of the leading centers for outsourced semiconductor and electronics manufacturing in the world. This presence enables our engineers to work closely with our customers as well as wafer foundries and other providers of complementary semiconductors and EMS early in the design process, enhances our responsiveness to the requirements of our customers and shortens production cycles. In addition, as a turnkey service provider, we are able to offer our products to our customers and complementary service providers within relatively close geographic proximity. Besides our current operations in Taiwan, we intend to expand our operations in our other subsidiaries.
We have primary operations in the following locations in addition to our locations in Taiwan:
| ● | P.R.C. — a fast-growing market for semiconductor and electronics manufacturing in the world; |
| ● | Korea — an important center for the manufacturing of memory and communications devices; |
| ● | Malaysia, Singapore and Vietnam— a center for outsourced semiconductor and electronics manufacturing in Southeast Asia; |
| ● | Silicon Valley in California — the preeminent center for semiconductor design, with a concentration of fabless customers; |
| ● | Japan — an emerging market for packaging and testing outsourcing services as Japanese integrated device manufacturers increasingly outsource their semiconductor manufacturing requirements; |
| ● | Mexico — a development and manufacturing center for electronic products across different industries with an auxiliary service depot to provide technical services; |
| ● | Africa — a strategic location for electronic components manufacturing and assembly; and |
| ● | Europe — an original equipment manufacturing solutions for the electronics industry. |
Strengthen and Develop Strategic Relationships with Our Customers and Providers of Complementary Semiconductor Manufacturing Services
We intend to strengthen existing and develop new strategic relationships with our customers and providers of other complementary semiconductor manufacturing services, such as wafer foundries, as well as equipment vendors, raw material suppliers and technology research institutes, in order to offer our customers total semiconductor manufacturing solutions covering all stages of the manufacturing of their products from design to shipment. In addition, we are working with our customers to
co-develop
new packaging technologies and designs. 37
Since 1997, we have maintained a strategic alliance with TSMC, which designates us as their nonexclusive preferred provider of packaging and testing services for semiconductors manufactured by TSMC. Through our strategic alliance with and close geographic proximity to TSMC, we are able to offer our customers a total semiconductor manufacturing solution that includes access to foundry services in addition to our packaging, testing and direct shipment services.
Principal Products and Services
We offer a broad range of semiconductor packaging and testing services. In addition, we have provided EMS through USI Group. Our package types generally employ either leadframes or substrates as interconnect materials. The semiconductors we package are used in a wide range of
end-use
applications, including communications, computing, consumer electronics, industrial, automotive and other applications. Our testing services include front-end
engineering testing, which is performed during and following the initial circuit design stage of the semiconductor manufacturing process, wafer probe, final testing and other related semiconductor testing services. We focus on packaging and testing semiconductors. We offer our customers turnkey services, which consist of packaging, testing and direct shipment of semiconductors to end users designated by our customers. Our EMS are used in a wide range of end-use
applications, including, but not limited to, computing, peripherals, communications, industrial applications, automotive electronics, and server applications. In 2021, our revenues generated from packaging, testing and EMS accounted for 47.8%, 8.8% and 42.0% of our operating revenues, respectively. Packaging Services
We offer a broad range of package types to meet the requirements of our customers, including flip chip BGA, flip chip CSP, aCSP (advanced chip scale packages), quad flat packages (QFP), low profile and thin quad flat packages (LQFP/TQFP), bump chip carrier (BCC), quad flat
no-lead
(QFN) packages, aQFN (advanced QFN) and Plastic BGA. In addition, we provide 3D chip packages, such as aMAP POP (advanced, laser ablation type), which enable our customers to mount packages more easily, and HB PoP (High-Band package on Package) for higher performance orientation and marketing requirement. We also offer other forms of stacked die solutions in different package types, e.g., stacked die QFN, hybrid BGAs containing stacked wire bond and FC die. Meanwhile, we are developing the cost-effective solutions to 3D packages, such as 2.1D (substrate layer modification) and 2.5D (silicon interposer), to fulfill current low-cost
and high-performance requirements in parallel with 3D IC with TSV (Through Silicon Via) technology. In addition, to meet current trends toward low-cost
solutions, we provide copper wire bonding solutions which can be applied to traditional gold wire products. We also provide a high-volume manufacturing experience with silver wire bonding for FCCSP Hybrid packages. Furthermore, we are one of the key providers of IoT (Internet of Things), server and automotive services. We believe we are among the leaders in such packaging processes and technologies and are well positioned to lead the technology migration in the semiconductor packaging industry. To address the new demands of 5G wireless technology, we survey new material and structure based on developed package structures and focus our efforts on developing more integration solutions, such as AP (Application Processor) module and RFFE (RF front end) with customized SiP services.
Wirebonding.
pin-counts.
Our expertise in BGA packages also includes capabilities in stacked-die
BGA, which assembles multiple dies into a single package. 38
3D packaging has recently gained a lot of publicity because of the advent of TSV (Through Silicon Via) based chip stacking. Chip stacking has been implemented for many years, albeit without TSVs. Wire bond die is routinely stacked on leadframes as well as BGA substrates. A more recent implementation is the stacking of packages as package on package (PoP) and the more specialized package in package (PiP). We have advanced PoP by the invention of aMAPPoP which provides the package interconnects by exposing a molded in solder ball with a laser via. Aside from being cost-effective due to block molding, this PoP also has much lower warpage, greatly improving the stacking yield.
The following table sets forth our principal wirebonding packages.
| Package Types |
Number of Leads |
Description |
End-Use Applications | |||
| Advanced Quad Flat No-Lead Package (aQFN) |
104-276 |
aQFN allows for leadless, multi-row and fine-pitch leadframe packaging and is characterized by enhanced thermal and electrical performance. aQFN is a cost-effective packaging solution due to its cost-effective materials and simpler packaging process. |
Telecommunications products, wireless local access networks, personal digital assistants, digital cameras, low to medium lead count packaging information appliances. | |||
| Quad Flat Package (QFP)/Low 44-256 profile and Thin Quad Flat Package (LQFP/TQFP) |
44-256 |
Designed for advanced processors and controllers, application-specific integrated circuits and digital signal processors. | Multimedia applications, cellular phones, personal computers, automotive and industrial products, hard disk drives, communication boards such as ethernet, integrated services digital networks and notebook computers. | |||
| Quad Flat No-Lead Package (QFN)/ Dual-Row QFN (DR-QFN)/ Microchip Carrier (MCC) |
8-176 | QFN/DRQFN, also known as types of MCC, uses half-encapsulation technology to expose the rear side of the die pad and the tiny fingers, which are used to connect the chip and bonding wire with printed circuit boards. Dual-Row is to increase the lead counts for product requirement. |
Cellular phones, wireless local access networks, personal digital assistant devices and digital cameras. | |||
| Small Outline Plastic Package (SOP)/Thin Small Outline Plastic Package (TSOP) | 8-56 |
Designed for memory devices including static random access memory, or SRAM, dynamic random access memory, or DRAM, fast static RAM, also called FSRAM, and flash memory devices. | Consumer audio/video and entertainment products, cordless telephones, pagers, fax machines, printers, copiers, personal computer peripherals, automotive parts, telecommunications products, recordable optical disks and hard disk drives. | |||
| Small Outline Plastic J-Bend Package (SOJ) |
20-44 |
Designed for memory and low pin-count applications. |
DRAM memory devices, microcontrollers, digital analog conversions and audio/video applications. | |||
| Plastic Leaded Chip Carrier (PLCC) | 28-84 |
Designed for applications that do not require low-profile packages with high density of interconnects. |
Personal computers, scanners, electronic games and monitors. | |||
| Plastic Dual In-line Package (PDIP) |
8-64 |
Designed for consumer electronic products. | Telephones, televisions, audio/video applications and computer peripherals. | |||
39
| Package Types |
Number of Leads |
Description |
End-Use Applications | |||
| Plastic BGA | 119-1520 |
Designed for semiconductors which require the enhanced performance provided by plastic BGA, including personal computer chipsets, graphic controllers and microprocessors, application-specific integrated circuits, digital signal processors and memory devices. | Telecommunications products, global positioning systems, notebook computers, disk drives and video cameras. | |||
Stacked-Die BGA |
120-1520 |
Combination of multiple dies in a single package enables package to have multiple functions within a small surface area. | Telecommunications products, local area networks, graphics processor applications, digital cameras and pagers. | |||
Package-on-Package |
136-904 |
This technology places one package on top of another to integrate different functionalities while maintaining a compact size. It offers procurement flexibility, low cost of ownership, better total system cost and faster time to market. Designers typically use the topmost package for memory applications and the bottommost package for ASICs. By using this technology, the memory known good die issue can be mitigated and the development cycle time and cost can be reduced. | Cellular phones, personal digital assistants and system boards. | |||
| Land Grid Array (LGA) | 10-72 |
Leadless package, which is essentially a BGA package without the solder balls. Based on laminate substrate, land grid array packages allow flexible routing and are capable of multichip module functions. | High-frequency integrated circuits such as wireless communications products, computers servers, personal computer peripherals and MEMS sensors. | |||
Advanced Packages.
We have focused on developing our capabilities in certain packaging solutions, such as aCSP (wafer-level chip scale package), flip chip BGA, Heat-Spreader FCBGA, flip-chip CSP, Hybrid FCCSP (Flip Chip + W/B), Flip Chip PiP (Package in Package), Flip Chip PoP (Package on Package), aS
3TM
(Advanced Single Sided Substrate), HB POP (High-Bandwidth POP), Fan-Out
Wafer-Level Packaging, SESUB and 2.5D. Flip-chip BGA technology replaces wire bonding with wafer bumping for interconnections within the package. Wafer bumping involves the placing of tiny solder balls, instead of wires, on top of dies for connection to substrates. As compared with more traditional packages, which allow input/output connection only on the boundaries of the dies, flip chip or wafer-level package solutions significantly enhance the input/output flow by allowing input/output connections over the entire surface of the dies. Chip scale packages typically have an area no greater than 120% of the silicon die. For wafer-level package, the electrical connections are plated or printed directly onto the wafer itself, resulting in a package very close to the size of the silicon die. Wafer-level packages do not include an interposer so they are unlike substrate-based packages, where the die is usually mounted on an interposer which contains electrical connections in the form of small bumps or balls.
40
aEASI (Advance Embedded Assembly Substrate Integration) is a technology which allows the embedding thin chips into substrate
build-up
layers. aEASI can be used in various technologies tailored to clients’ demand, such as package solution of miniaturization, and has also been proven to have better electrical/thermal performance. It also provides flexibility in design (such as for MicroSiP), and the electrical contacts to the chips are realized by laser-drilled and metallized micro-vias to replace the traditional wire bonding process. aEASI is mainly used in power management applications. WL MEMs (Wafer-Level MEMs) is advanced assembly for MEMs in wafer-level type instead of current LGA or leadframe types using TSV or technology. WL MEMs are mainly used in applications such as pressure, temperature, humidity and gyroscope sensors, among others.
chip-to-wafer
FOWLP
(Fan-Out
Wafer-Level Packages) provides an extended solution and package type to integrate different functional chips or packages and to have good reduction in resistance and inductance over FCCSP, better thermal performance and smaller form factors of packages. FOWLP can be applied for different stack and SiP solutions. We provide numerous technologies to meet various customer demands. The following table sets forth our principal advanced packages.
| Package Types |
Number of Leads |
Description |
End-Use Applications | |||
| Wafer-Level Chip Scale Package (aCSP) | 4-792 | A wafer-level chip scale package that can be directly attached to the circuit board. Provides shortest electrical path from the die pad to the circuit board, thereby enhancing electrical performance. | Cellular phones, personal digital assistants, watches, MP3 players, digital cameras and camcorders. | |||
| Flip Chip Scale Package (FC-CSP, a-fcCSP) |
16-1287 | A lightweight package with a small, thin profile provides better protection for chips and better solder joint reliability than other comparable package types. | RFICs and memory ICs such as digital cameras, DVDs, devices that utilize wireless technology, cellular phones, GPS devices and personal computer peripherals. | |||
| Flip Chip PiP (Package in Package) (FC-CSP PiP) |
500-980 |
System-in-Package |
Application processor for smartphone and data modem on portable devices. | |||
| Flip Chip PoP (Package on Package) (FC-CSP PoP) |
500-1300 |
SoC (System-on-Chip) |
High-tier application processor for smartphones and data modem on portable devices. | |||
| Flip Chip BGA/ HF FCBGA(High Performance / Heat Spreader / FCBGA) | 16-5475 | Using advanced interconnect technology, the flip chip BGA packages allow higher density of input/output connection over the entire surface of the dies. HF FCBGA is designed for the semiconductor high-performance requirement of high density of interconnects. | High-performance networking, graphics, server and data center processor applications. | |||
| Hybrid (Flip Chip and Wire Bonding) | 49-608 |
A package technology that stacks a die on top of a probed good die to integrate ASIC and memory (flash, SRAM and DDR) into one package and interconnects them with wire bonding and molding. This technology suffers from known good die issues (i.e., one bad die will ruin the entire module). Rework is also not an option in hybrid packages. | Digital cameras, smartphones, bluetooth applications and personal digital assistants. | |||
41
| Package Types |
Number of Leads |
Description |
End-Use Applications | |||
| aS 3 |
up to 300 | Ultra-thin profile package which is an excellent on middle pin-count alternative solution; standard BT material and manufacturing equipment; and lower cost via on pad. |
High I/O and short wire length package solution in high-performance requirement. | |||
| Integrated Passive Device (IPD) | ~ 20 | IPD can provide a high-performance/high Q-factor inductor and single/double layers for lower cost and turnkey solutions and integrate passives into one IPD chip. IPD requires less involvement in the Surface Mount Technology (“SMT”) process, and is considered to be more compatible with current assembly process and suitable for all package solutions. |
Cellular phones, Wi-Fi module, TV and personal digital assistants. | |||
| HBPoP (High-Bandwidth Package On Package) | ~ 1240 | High-Bandwidth POP can provide a data rate and good signal integrity for Cellular AP, an integration solution for ASIC and memory, decoupling functions for multiple memory mount applications. | Cellular phones and application processors. | |||
| FOWLP (Fan-Out Wafer-Level Package) |
~ 1,500+ | FOWLP provides an extended solution/package type to integrate most different functional chips or packages and to have good reduction in resistance and inductance over FCCSP, better thermal performance and smaller form factors of packages, and can be applied for different stack or SiP solutions. | Cellular phones, logic devices, power management, RF, Codec, IoT, wearables and networking. | |||
Heterogeneous Integration.
| ● | SiP and Modules |
The drive towards semiconductor miniaturization and integration is expanding the commercial potential of SiP, a package or module containing a functional electronic system or subsystem that is integrated and miniaturized through IC greater assembly technologies. With attributes that deliver higher performance, cost-effectiveness, and shorter time to market, SiP technology is enabling functionality and creating more commercial opportunities across a broader variety of electronics applications.
ASEH is a market leader in SiP technologies from design to assembly and high-volume manufacturing. SiP involves the integration of multiple components from IC chips and components including ASICs, Memory, Analog mixed signals devices, passives, MEMs, sensors, antennas and other devices into one single package. SiP and Modules products are gaining significant traction within the industry, given growing demand for miniaturized electronic devices that deliver more functions and higher performance, lower power, greater speed and increased bandwidth. ASEH’s SiP portfolio includes flip chip and wirebond multichip packaging, embedding technologies such as SESUB and aEASI, and wafer-level technologies including
fan-out
and IPD. IPD uses a wafer-level process to integrate passive components on an individual substrate. Recent IPD innovation involves the extension of the RDL (Redistribution) process to build a high-quality factor (Q) inductor and RF circuits on top of silicon wafers. It can be used in the following three approaches to enhance product performance: several solutions to replace discrete components such as Balun and Filter, or to integrate other passive components and act as interposer, or to replace PWB and act as a substrate of the module. In addition, we leverage some of our SMT-based
technologies, such as compartment shielding, double-sided module and antenna integration. 42
We also offer module assembly services, which combine one or more packaged semiconductors with other components in an integrated module to enable increased functionality for system-level assembly.
End-use
applications for modules include cellular phones and wireless LAN applications, Bluetooth applications, camera modules, automotive applications, toys, networking, storage and power management. | ● | Fan-Out. |
Fan-out
packaging continues to gain major prominence within the industry, based on significant technical advantages that have led to its broad commercialization. This advanced packaging platform is evolving to meet application demands for smaller form factors and improved electrical and thermal performance. With the packaging done on singulated die formed into a reconstituted molded wafer or panel,
fan-out
packaging enables multi-die
packages, through partitioning with different nodes and functionality. Fan-out
can be done either chip first or chip last, with both options resulting in much higher-density interconnect and improved cost efficiency. Initially fan-out
was used primarily for smaller, lower I/O count packages, until we introduced a very high-density fan-out
alternative to 2.5D Interposer packages, Fan-out
Chip on Substrate (FOCoS), a hybrid fan-out/FCBGA
package. Today, fan-out
is in high-volume applications for a wide variety of products, including PMICs, RF packages, Baseband processors and high-end
networking systems. Key attributes include: | ● | Parallel Manufacturing Process in Wafer Form |
| ● | Smallest Package in X, Y and Z |
| ● | Excellent Mechanical, Electrical and Thermal Performance |
| ● | 2.5D 3D Packaging. |
As 5G, AI, and high-performance computing continue to make inroads into our world, we believe there is an increased demand for semiconductor devices that deliver enhanced performance, lower latency, increased bandwidth and greater power efficiency. ASEH strives to meet this demand by innovating 2.5D 3D technologies that we believe are becoming more central within the semiconductor industry. We have established ourselves as a leader in 2.5D technology through our successful pioneering of 2.5D solutions that helped bring advanced ASIC and HBM products to the marketplace. In addition, ASEH is introducing high-density
fan-out
technology for multi-die
solutions to achieve high bandwidth high-performance across the market landscape, addressing demand from high density data centers to consumer and mobile space. Automotive Electronics
.
end-users,
including most types of industrial package solutions together with tailor-made solutions to meet customers’ and end-users’
requirements on automotive specifications. Having accumulated production experience in using gold wire for automotive devices over several years, we collaborate with certain customers to develop and release copper wire for advanced wafer process (65nm for QFP and 40 nm for BGA) development that will fulfill criteria in
AEC-Q100
and in the early development of the 28 nm wafer process with hybrid packaging structure (FC bonding + wirebonding). In addition, we offer the FOWLP solution for radar products according to requests from some tier 1 customers. Interconnect Materials
.
43
The demand for higher-performance semiconductors in smaller packages will continue to spur the development of IC substrates that can support the advancement in circuit design and fabrication. As a result, we believe that the market for substrates will grow and the cost of substrates as a percentage of the total packaging process will increase. In the past, substrates we designed for our customers were produced by independent substrate manufacturers. Since 1997, we have been designing and producing a portion of our interconnect materials
in-house.
In 2021, our interconnect materials operations supplied approximately 10.6% of our consolidated substrate requirements by value. The following table sets forth, for the periods indicated, the percentage of our packaging revenues accounted for by each principal type of packaging products or services.
Year Ended December 31, |
||||||||||||
2019 |
2020 |
2021 |
||||||||||
| |
||||||||||||
| Bumping, Flip Chip, WLP, and SiP |
41.7% | 42.3% | 41.2% | |||||||||
| Wirebonding (1) |
48.2% | 46.8% | 48.5% | |||||||||
| Discrete and other |
10.1% | 10.9% | 10.3% | |||||||||
| |
|
|
|
|
|
|||||||
| Total |
100.0% | 100.0% | 100.0% | |||||||||
| |
|
|
|
|
|
|||||||
| (1) | Includes leadframe-based packages such as QFP/TQFP, QFN/MCC and PLCC/PDIP and substrate-based packages, such as various BGA package types and LGA. |
Testing Services
We provide a complete range of semiconductor testing services, including
front-end
engineering testing, wafer probing, final testing of logic/mixed-signal/RF/(2.5D/3D) packages and SiP/MEMS/Discrete modules and other test-related services. The testing of semiconductors requires technical expertise and knowledge of the specific applications and functions of the semiconductors tested as well as the testing equipment utilized. We believe that our testing services employ technology and expertise which are among the most sophisticated in the semiconductor industry. In addition to maintaining different types of testing equipment, which enables us to test a variety of semiconductor functions, we work closely with our customers to design effective testing solutions on multiple equipment platforms for particular semiconductors.
In recent years, complex, high-performance logic/mixed-signal/RF/(2.5D/3D) packages and SiP/MEMS modules have accounted for an increasing portion of our testing revenues.
Front-End
Engineering Testing.
front-end
engineering testing services, including customized software development, electrical design validation, and reliability and failure analysis. | ● | Customized Software Development . |
| ● | Electrical Design Validation . |
| ● | Reliability Analysis . “burn-in” services, which electrically stress a device, usually at high temperature and voltage, for a period of time long enough to cause the failure of marginal devices. |
44
| ● | Failure Analysis |
Wafer Probing
.
Logic/Mixed-signal/RF/(2.5D/3D) Module and SiP/Discrete Final Testing
.
Other Test-Related Services
.
| ● | Electric Interface Board and Mechanical Test Tool Design . |
| ● | Program Conversion . one-test platform to different test platforms to reduce testing costs or optimize testing capacity. |
| ● | Program Efficiency Improvement . |
| ● | Burn-In Testing. Burn-in testing is the process of electrically stressing a device, usually at high temperature and voltage, for a period of time to simulate the continuous use of the device to determine whether this use would cause the failure of marginal devices. |
| ● | Module and SiP Testing . |
| ● | Tape and Reel . |
Drop Shipment Services
.
45
The following table sets forth, for the periods indicated, the percentage of our testing revenues accounted for by each type of testing service.
Year Ended December 31, |
||||||||||||
2019 |
2020 |
2021 |
||||||||||
| |
||||||||||||
| Front-end engineering testing |
1.8% | 2.0% | 2.0% | |||||||||
| Wafer probing |
26.2% | 31.8% | 33.5% | |||||||||
| Final testing |
72.0% | 66.2% | 64.5% | |||||||||
| |
|
|
|
|
|
|||||||
| Total |
100.0% | 100.0% | 100.0% | |||||||||
| |
|
|
|
|
|
|||||||
EMS
We provide integrated solutions for EMS in relation to computing, peripherals, communications, industrial, automotive and server applications through USI Group. The key products and services we offer to our customers, for instance, include:
| ● | Computing: motherboards for server and desktop PC; peripheral; port replicator; network attached system; network video recorder; solid state drive; |
| ● | Communications: Wi-Fi; SiP; |
| ● | Consumer products: control boards for flat panel devices; SiP; |
| ● | Automotive electronics: automotive EMS; car LED lighting; regulator/rectifier; |
| ● | Industrial products: point-of-sale |
| ● | Others: field replacement unit; return material authorization. |
Seasonality
See “Item 5. Operating and Financial Review and Prospects—Operating Results—Quarterly Operating Revenues, Gross Profit and Gross Margin.”
Sales and Marketing
Sales and Marketing Presence
We maintain sales and marketing offices in Taiwan, the U.S., Belgium, Singapore, the P.R.C., Korea, Malaysia, Japan and a number of other countries. We also have sales representatives operating in certain other countries in which we do not have offices. Our sales and marketing offices in Taiwan are located in Hsinchu, Taichung and Kaohsiung. We conduct marketing research through our customer service personnel and through our relationships with our customers and suppliers to keep abreast of market trends and developments. We also provide advice in the area of production process technology to our major customers planning the introduction of new products. In placing orders with us, our customers specify which of our facilities these orders will go to. Our customers conduct separate qualification and correlation processes for each of our facilities that they use. See “—Qualification and Correlation by Customers.”
Customers
Our five largest customers together accounted for approximately 51.1%, 54.5% and 49.6% of our operating revenues in 2019, 2020 and 2021, respectively. Two of our customers individually accounted for more than 10.0% of our operating revenues in 2019, and one customer accounted for more than 10.0% of our operating revenues in 2020 and 2021.
The U.S. Bureau of Industry and Security (“US BIS”) added Huawei and its affiliates to the entity list under the Export Administration Regulation (the “EAR”), published on August 20, 2020. As of September 15, 2020, we were no longer allowed to do business directly or indirectly with Huawei and its affiliates. HiSilicon, a Huawei affiliate, was one of our top customers during 2019 and the first half of 2020; and, as a result, this US BIS action adversely affected our results. Further, because of the EAR, we had unusable raw materials and reduced loading on our capitalized equipment which resulted in an inventory
write-off
and an impairment loss to other operating expense during the third quarter of 2020. 46
We package and test for our customers a wide range of products with
end-use
applications in the communications, computing and consumer electronics/industrial/automotive sectors. The following table sets forth a breakdown of the percentage of our operating revenues generated from our packaging and testing services, for the periods indicated, by the principal end-use
applications of the products that we packaged and tested.Year Ended December 31, |
||||||||||||
2019 |
2020 |
2021 |
||||||||||
| Communications |
52.5% | 53.3% | 50.1% | |||||||||
| Computing |
14.6% | 14.1% | 14.9% | |||||||||
| Consumer electronics/industrial/automotive/other |
32.9% | 32.6% | 35.0% | |||||||||
| |
|
|
|
|
|
|||||||
| Total |
100.0% | 100.0% | 100.0% | |||||||||
| |
|
|
|
|
|
|||||||
Our EMS provides a wide range of products with
end-use
applications. The following table sets forth a breakdown of the percentage of our operating revenues generated from our EMS for the periods indicated by the principal end-use
applications. Year Ended December 31, |
||||||||||||
2019 |
2020 |
2021 |
||||||||||
| Communications |
37.4% | 42.5% | 38.4% | |||||||||
| Computing |
11.3% | 8.0% | 8.8% | |||||||||
| Consumer electronics |
34.6% | 36.2% | 33.6% | |||||||||
| Industrial |
11.3% | 9.1% | 13.0% | |||||||||
| Automotive |
4.8% | 3.6% | 4.7% | |||||||||
| Other |
0.6% | 0.6% | 1.5% | |||||||||
| |
|
|
|
|
|
|||||||
| Total |
100.0% | 100.0% | 100.0% | |||||||||
| |
|
|
|
|
|
|||||||
We categorize our operating revenues geographically based on the country in which the customer is headquartered. The following table sets forth, for the periods indicated, the percentage breakdown by geographic regions of our operating revenues.
Year Ended December 31, |
||||||||||||
2019 |
2020 |
2021 |
||||||||||
| United States |
59.4% | 62.3% | 62.0% | |||||||||
| Taiwan |
12.4% | 13.6% | 16.6% | |||||||||
| Asia |
18.4% | 15.6% | 11.0% | |||||||||
| Europe |
9.4% | 8.3% | 10.2% | |||||||||
| Other |
0.4% | 0.2% | 0.2% | |||||||||
| |
|
|
|
|
|
|||||||
| Total |
100.0% | 100.0% | 100.0% | |||||||||
| |
|
|
|
|
|
|||||||
Qualification and Correlation by Customers
Customers generally require that our facilities undergo a stringent qualification process during which the customer evaluates our operations and production processes, including engineering, delivery control and testing capabilities. The qualification process typically takes up to several weeks, but can take longer depending on the requirements of the customer. In the case of our testing operations, after we have been qualified by a customer and before the customer delivers semiconductors to us for testing in volume, a process known as correlation is undertaken. During the correlation process, the customer provides us with sample semiconductors to be tested and either provides us with the test program or requests that we develop a conversion program. In some cases, the customer also provides us with a data log of results of any testing of the semiconductors that the customer may have conducted previously. The correlation process typically takes up to two weeks, but can take longer depending on the requirements of the customer. We believe our ability to provide turnkey services reduces the amount of time spent by our customers in the qualification and correlation process. As a result, customers utilizing our turnkey services are able to achieve shorter production cycles.
47
Pricing
We price our packaging services and EMS, taking into account the actual costs, with reference to prevailing market prices. We price our testing services primarily on the basis of the amount of time, measured in central processing unit seconds, taken by the automated testing equipment to execute the test programs specific to the products being tested, as well as the cost of the equipment, with reference to prevailing market prices. Prices for our packaging, testing and EMS are confirmed at the time orders are received from customers, which is typically several weeks before delivery.
Raw Materials and Suppliers
Packaging
The principal raw materials used in our packaging processes are interconnect materials such as leadframes and substrates, gold wire and molding compound. The silicon die, which is the functional unit of the semiconductor to be packaged, is supplied in the form of silicon wafers. Each silicon wafer contains a number of identical dies. We receive the wafers from the customers or the foundries on a consignment basis. Consequently, we generally do not incur inventory costs relating to the silicon wafers used in our packaging process.
We do not maintain large inventories of leadframes, substrates, gold wire or molding compound, but generally maintain sufficient stock of each principal raw material based on blanket orders and rolling forecasts of near-term requirements received from customers. In addition, several of our principal suppliers dedicate portions of their inventories as reserves to meet our production requirements. However, shortages in the supply of materials experienced by the semiconductor industry have in the past resulted in occasional price adjustments and delivery delays. In order to reduce the adverse impact caused by the price fluctuations of raw materials, we have developed substitute raw materials, such as copper wire, the cost of which is much cheaper than that of gold wire. However, we cannot guarantee that we will not experience shortages or price increase in the near future or that we will be able to obtain adequate supplies of raw materials in a timely manner and at a reasonable price or to develop any substitute raw materials. In the event of a shortage and/or price increase, we generally inform our customers and work together to accommodate changes in delivery schedules and/or the price increase of raw materials.
We produce substrates for use in our packaging operations. In 2021, our interconnect materials operations supplied approximately 10.6% of our consolidated substrate requirements by value. See “—Principal Products and Services—Interconnect Materials.”
In response to RoHS, we have adjusted our purchases of raw materials and our production processes in order to use raw materials that comply with this legislation for part of our production. This legislation restricts the use in the EU of certain substances that the EU deems harmful to consumers including certain grades of molding compounds, solder and other raw materials that are used in our products. Manufacturers of electrical and electronic equipment must comply with this legislation in order to sell their products in an EU member state. Any failure by us to comply with regulatory environmental standards such as RoHS and REACH may have a material adverse effect on our results of operations.
Testing
For the functional and
burn-in
testing of semiconductors, no other raw materials are needed. However, we often design and outsource the manufacturing of test interface products such as load boards, probe cards and burn-in
boards. EMS
Our manufacturing processes use many raw materials in our EMS. For 2021, raw materials costs accounted for 80.3% of our operating revenues from EMS. Our principal raw materials include, among others, printed circuit boards, integrated chips, ink, semiconductor devices, computer peripherals and related accessories and electronic components. Our principal raw materials varied in the past, depending on the
end-use
products we provided. 48
To ensure quality,
on-time
delivery and pricing competitiveness, we have established both a standardized supplier assessment system and an evaluation mechanism, continued to maintain close working relationships with our suppliers, and jointly created a stable and sustainable supply chain. In addition, we adjusted the procurement strategy in line with industry trends as well as the nature of raw materials, and we decentralized the sources of raw materials to lower our supply concentration risk. However, we cannot assure you that we will not experience any shortages or price increases in the near future. See “Item 3. Key Information—Risk Factors—Risks Relating to Our Business—Our revenues and profitability may decline if we are unable to obtain adequate supplies of raw materials in a timely manner and at a reasonable price.” Equipment
Packaging
The wire bonding process is important for routing signal out of die to the system for the IC wire-bonding solutions. Thus, wire bonder is the important equipment used for such process. As products become finer and finer pitch, bumping process will replace wire bonding process for the signal routing purpose. Thus, sputter and plater will be the crucial equipment for this type of process.
Wire bonders connect the input/output terminals on the silicon die using extremely fine gold or copper wire to leads on leadframes or substrates. Typically, a wire bonder may be used, with minor modifications, for the packaging of different products. As of January 31, 2022, we operated an aggregate of 25,782 wire bonders, of which 25,242 were fine-pitch wire bonders. As of the same date, 34 of the wire bonders operated by us were consigned by customers. For the packaging of certain types of substrate-based packages, die bonders are used in place of wire bonders. The number of bonders at a given facility is commonly used as a measure of the packaging capacity of the facility. In addition to bonders, we maintain a variety of other types of packaging equipment, such as wafer grind, wafer mount, wafer saw, heat sink placement, automated molding machines, laser markers, solder plate, pad printers, dejunkers, trimmers, formers, substrate saws and scanners. We purchase our packaging equipment from major international manufactures, including Hanmi Semiconductor Co., Ltd., Kulicke Soffa Pte. Ltd., DISCO Corporation, TOWA Corporation, and Marketech International Corp.
Testing
Testing equipment is the most capital-intensive component of the testing process. We generally seek to purchase testers from different suppliers with similar functionality and acquire the ability to test a variety of different semiconductors. We purchase testers from major international manufacturers, including Teradyne, Inc., Advantest Corporation,
K-shine
Technology Corp., Tokyo Electron Limited, and Hon Precision, Inc. Upon acquisition of new testers, we install, configure, calibrate, perform burn-in
diagnostic tests on and establish parameters for the testers based on the anticipated requirements of existing and potential customers and considerations relating to market trends. As of January 31, 2022, we operated an aggregate of 4,918 testers, of which 1,944 were consigned by customers and 7 were leased. In addition to testers, we maintain a variety of other types of testing equipment, such as automated handlers and probers (special handlers for wafer probing), scanners, reformers and computer workstations for use in software development. Each tester may be attached to a handler or prober. Handlers attach to testers and transport individual packaged semiconductors to the tester interface. Probers similarly attach to the tester and align each individual die on a wafer with the interface to the tester.For the majority of our testing equipment, we often base our purchases on prior discussions with our customers about their forecast requirements. The balance consists of testing equipment on consignment from customers, which is dedicated exclusively to the testing of these customers’ specific products.
Test programs, which consist of the software that drives the testing of specific semiconductors, are written for a specific testing platform. We sometimes perform test program conversions that enable us to test semiconductors on multiple test platforms. This portability between testers enables us to allocate semiconductors tested across our available test capabilities and thereby improve capacity utilization rates. In cases where a customer requires the testing of a semiconductor product that is not yet fully developed, the customer may provide computer workstations to us to test specific functions. In cases where a customer has specified testing equipment that was not widely applicable to other products that we test, we have required the customer to furnish the equipment on a consignment basis.
49
EMS
The SMT assembly line is the key facility of our electronic manufacturing operations and generally includes a printer and one or two high-speed mounters and/or a multifunction mounter. The SMT assembly process primarily consists of the following three manufacturing steps: (i) solder paste stencil printing, (ii) component placement and (iii) solder reflow. High-speed SMT assembly systems offer both economic and technical advantages that may reduce both production cost and time while meeting quality requirements. Thus, SMT has become the most popular assembly method for sophisticated electronic devices. We had 227 SMT lines as of January 31, 2022.
Intellectual Property
As of January 31, 2022, we held 2,278 Taiwan patents, 1,765 U.S. patents, 1,679 P.R.C., patents, 13 Europe patents and 27 patents in other countries related to various semiconductor packaging technologies and invention, utility and design on our EMS. In addition, as of January 31, 2022, we also had a total of 1,792 pending patent applications, of which 158 in Taiwan, 541 in the U.S., 1,073 in P.R.C., 11 in Europe and 9 in other countries. Moreover, we filed several trademarks applications in Taiwan, the U.S., China and the EU. For example, “ASE,” “aCSP,” “
a-EASI,”
“a-fcCSP,”
“aQFN,” “a-QFN,”
“a-S
3
, “ “a-TiV,”
“aWLP,” “a-WLP,”
“iSiP,” “iWLP,” “aSiM,” “SiP-id”
“SPIL,” “HSiP,” “XnBay,” and “Emerald” have been registered in Taiwan. We have also entered into various nonexclusive technology license agreements with other companies involved in the semiconductor manufacturing process, including Fujitsu Limited, Flip Chip International, L.L.C., Infineon Technologies AG, TDK Corporation and DECA Technologies Inc. The technology we license from these companies includes solder bumping, redistribution, ultra CSP assembly, advanced QFN assembly, wafer-level packaging and other technologies used in the production of package types, such as BCC, flip chip BGA, film BGA, aQFN and chip embedding. Our license agreements with Flip Chip International, L.L.C. will not expire until the expiration of the patents licensed by the agreement. One of our license agreements with Infineon Technologies AG will remain in effect until expiration of the patents licensed by the agreement, and the other automatically renews each year unless the parties to the agreement agree otherwise. Our license agreement with Fujitsu Limited renews automatically each year unless the parties to the agreement agree otherwise. Our license agreement with TDK Corporation will remain in effect until expiration of the TDK’s patents licensed by the agreement. Our license agreement with DECA will expire on January 13, 2026.
In addition, we improve our technological platform by licensing innovative package technologies. For example, through wafer bumping and redistribution technology, we are able to form and redistribute bumps on the chip to make a silicon die by directly attaching the substrate using bumps rather than wire bonding, and through wafer level CSP technology, we are able to produce a chip scale package at the stage of wafer level.
Our success depends in part on our ability to obtain, maintain and protect our patents, licenses and other intellectual property rights, including rights under our license agreements with third parties.
Quality Control
We believe that our process technology and reputation for high quality and reliable services have been important factors in attracting and retaining leading international semiconductor companies as customers for our services and/or products. We maintain a quality control staff at each of our facilities. Our quality control staff typically includes engineers, technicians and other employees who monitor the processes in order to ensure high quality. Our quality assurance systems impose strict process controls, statistical
in-line
monitors, supplier control, data review and management, quality controls and corrective action systems. Our quality control employees operate quality control stations along production lines, monitor clean room environments, and follow up on quality through outgoing product inspection and interaction with customer service staff. We have established quality control systems that are designed to ensure high-quality products/service to customers, high-testing reliability and high production yields at our facilities. We also have established an environmental management system in order to ensure that we can comply with the environmental standards of our customers and the countries within which they operate. See “—Raw Materials and Suppliers—Packaging.” In addition, our facilities have been qualified by all of our major customers after satisfying stringent quality standards prescribed by these customers. Our packaging and testing operations are undertaken in clean rooms where air purity, temperature and humidity are controlled. To ensure stability and integrity of our operations, we maintain clean rooms at our facilities that meet U.S. Federal Standard 209E class 1,000, 10,000 and 100,000 standards.
50
ISE Labs’ testing facilities in Fremont, California are considered suitably equipped by the Defense Logistics Agency to perform the tests on monolithic microcircuits in accordance with the requirements of military specification
MIL-STD-883
MIL-PRF-38535.
We have also obtained many certifications on our packaging, testing and interconnect materials facilities. Some of these certifications are required by some semiconductor manufacturers as a threshold indicator of a company’s quality control standards or needed by many countries in connection with sales of industrial products. The table below sets forth the main certifications we have for our packaging, testing and interconnect materials.
| Location |
IATF 16949 (1) |
ISO 9001 (2) |
ISO 14001 (3) |
ISO 17025 (4) |
ISO 14064-1 (5) |
ISO 14067 (6) |
IECQ HSPM QC 080000 (7) |
Sony Green Partner (8) |
OHSAS 18001/ ISO 45001 (9) |
TOSHMS (10) |
ISO 50001 (11) |
ISO 13485 (12) |
ISO 28000 (13) |
ISO 26262 (14) |
ISO 15408- EAL6 (15) |
TL 9000 (16) |
ISO 22301 (17) |
RBA Edition (18) |
ISO/IEC 27001 (19) |
GSMA- SAS for UICC Production (20) |
ISO 46001 (21) |
ISO 21434 (22) | ||||||||||||||||||||||
| Taiwan |
✓ | ✓ | ✓ | ✓ | ✓ | ✓ | ✓ | ✓ | ✓ | ✓ | ✓ | ✓ | ✓ | ✓ | ✓ | ✓ | ✓ | ✓ | ✓ | ✓ | ✓ | ✓ | ||||||||||||||||||||||
| China |
✓ | ✓ | ✓ | ✓ | ✓ | ✓ | ✓ | ✓ | ✓ | ✓ | ✓ | ✓ | ||||||||||||||||||||||||||||||||
| Korea |
✓ | ✓ | ✓ | ✓ | ✓ | ✓ | ✓ | ✓ | ||||||||||||||||||||||||||||||||||||
| Japan |
✓ | ✓ | ✓ | ✓ | ✓ | ✓ | ||||||||||||||||||||||||||||||||||||||
| Malaysia |
✓ | ✓ | ✓ | ✓ | ✓ | ✓ | ✓ | |||||||||||||||||||||||||||||||||||||
| Singapore |
✓ | ✓ | ✓ | ✓ | ✓ | ✓ | ||||||||||||||||||||||||||||||||||||||
| U.S. |
✓ | ✓ | ✓ |
| (1) | IATF 16949:2016 standards were originally created by the International Automotive Task Force in conjunction with the International Standards Organization (ISO). These standards provide for continuous improvement with an emphasis on the prevention of defects and reduction of variation and waste in the supply chain. |
| (2) | ISO 9001 quality standards are related to quality management systems and designed to help organizations ensure that they meet the needs of customers and other stakeholders while meeting statutory and regulatory requirements related to the product. |
| (3) | ISO 14001 sets out the criteria for an environmental management system. It can be used by any organization that wants to improve resource efficiency, reduce waste and drive down costs. |
| (4) | ISO 17025 is the main ISO standard used by testing and calibration laboratories. |
| (5) | ISO 14064-1 standard provides governments, businesses, regions and other organizations with a complementary set of tools for programs to quantify, monitor, report and verify greenhouse gas emissions. |
| (6) | ISO 14067 is a standard for the quantification and communication of the carbon footprint of a product based on International Standards on life cycle assessment for quantification and on environmental labels and declarations for communication. |
| (7) | IECQ HSPM QC080000 is a certification designed to manage, reduce and eliminate hazardous substances. |
| (8) | “Sony Green Partner” indicates our compliance with the “Sony Green Package” standard requirements. |
| (9) | ISO 45001 is a standard for an occupational health and safety management system that gives guidance for organizations to provide safe and healthy workplaces by preventing work-related injury and ill health and proactively improving its occupational health and safety performance. It replaced OHSAS 18001 over three years following its publication in March 2018. |
| (10) | TOSHMS is the Taiwan Occupational and Health Management System. |
| (11) | ISO 50001 is a standard for an energy management system. It can be used by any organization that wants to reduce energy costs and use energy more efficiently. |
| (12) | ISO 13485 quality management system sets forth the quality requirements for organizations that are required to consistently meet customers’ requirements and regulatory requirements in the medical devices and related services industry. |
| (13) | ISO 28000 is a standard for security management system dealing with security assurance in a supply chain. |
| (14) | ISO 26262 is a standard for functional safety of electrical and electronic systems in production automobiles. |
| (15) | ISO 15408-EAL6 is a framework that outlines the criteria for globally recognized standards and security inspections for IT products. It is designed for products and applications that are targeted for high-security-intensive markets, such as the government, banking or defense sectors. |
| (16) | TL 9000 quality management system sets forth the supply chain quality requirements of the global communications industry. |
| (17) | ISO 22301 is a standard for requirements to plan, establish, implement, operate, monitor, review, maintain and continually improve a documented management system to protect against, reduce the likelihood of occurrence, prepare for, respond to, and recover from disruptive incidents when they arise. |
| (18) | The Responsible Business Alliance (RBA) is the world’s largest industry coalition dedicated to corporate social responsibility in global supply chains. |
| (19) | ISO/IEC 27001 is a standard for information security. |
| (20) | The GSMA Security Accreditation Scheme (SAS) for Universal Integrated Circuit Card (UICC) Production is a scheme through which UICC suppliers subject their production sites to a comprehensive security audit which ensures that UICC suppliers have implemented adequate security measures to protect the interests of mobile network operators. |
| (21) | ISO 46001 is a standard for water resource management. |
| (22) | ISO 21434 is a standard for engineering requirements for cybersecurity risk management. |
51
We also have strict process controls in our EMS business. UGTW’s facilities in Nantou, Taiwan, are considered suitably equipped by the Defense Logistics Agency to perform the tests on assemble, seal, and test hybrid microcircuits in compliance with Classes H and K. USIPL is in compliance with VDA 6.3 audit, which focuses on process audit for planning and manufacturing of products and services, and VDA 6.5, which is a qualification for product audit. The table below sets forth the certifications we have obtained for our EMS facilities.
MIL-STD-883
MIL-PRF-38534
| Location |
IATF 16949 |
ISO 9001 |
ISO 14001 |
ISO 17025 |
ISO 14064-1 |
IECQ HSPM QC 080000 |
IS 45001 |
TOSHMS | ISO 50001 |
ISO 13485 |
ISO 26262 |
TL 9000 |
AS/EN 9100: 2016 (1) |
IRIS ISO/TS 22163 (2) | ||||||||||||||
| Taiwan |
✓ | ✓ | ✓ | ✓ | ✓ | ✓ | ✓ | ✓ | ||||||||||||||||||||
| China |
✓ | ✓ | ✓ | ✓ | ✓ | ✓ | ✓ | ✓ | ✓ | ✓ | ✓ | |||||||||||||||||
| Mexico |
✓ | ✓ | ✓ | ✓ | ✓ | ✓ | ✓ | ✓ | ||||||||||||||||||||
| Poland |
✓ | ✓ | ✓ | |||||||||||||||||||||||||
| United Kingdom |
✓ | ✓ | ✓ | |||||||||||||||||||||||||
| U.S. |
✓ | ✓ | ✓ | ✓ | ||||||||||||||||||||||||
| France |
✓ | ✓ | ✓ | ✓ | ✓ | |||||||||||||||||||||||
| Germany |
✓ | ✓ | ✓ | ✓ | ||||||||||||||||||||||||
| Czech Republic |
✓ | ✓ | ✓ | |||||||||||||||||||||||||
| Tunisia |
✓ | ✓ | ✓ | ✓ |
| (1) | AS/EN 9100: 2016 quality standards are for aviation, space and defense industry in management of development, production, manufacturing, installation, construction, and maintenance as well as trade and distribution. |
| (2) | IRIS ISO/TS 22163 quality standards define quality management system requirements for the rail sector that can be applied throughout the supply chain—including design and development, manufacturing, and maintenance. |
The global market for semiconductor packaging and testing markets is highly competitive. We face competition from a number of sources and integrated device manufacturers with
in-house
packaging and testing capabilities and fabless semiconductor design companies with their own in-house
testing capabilities. Some of these integrated device manufacturers have commenced, or may commence, in-house
packaging and testing operations in Asia. Substantially all of packaging and testing companies that compete with us have established operations in Taiwan and across the region. Integrated device manufacturers that use our services continuously evaluate our performance against their own
in-house
packaging and testing capabilities. These integrated device manufacturers may have access to more sophisticated technologies and greater financial and other resources than we do. We believe, however, that we can offer greater efficiency at lower cost while maintaining equivalent or higher quality for several reasons. First, as we benefit from specialization and economies of scale by providing services to a large base of customers across a wide range of products, we are better able to reduce costs and shorten production cycles through high-capacity utilization and process expertise. Second, as a result of our customer base and product offerings, our equipment generally has a longer useful life. Third, as a result of the continuing reduction of investments in in-house
packaging and testing capacity and technology at integrated device manufacturers, we are better positioned to meet their packaging and testing requirements on a large scale. Our packaging and testing business also faces actual and potential competition from companies at other levels of the supply chain, which have the financial resources and technical capabilities to enter and compete effectively with us. For example, TSMC has launched integrated
fan-out
(“InFO”) technology, which it put into mass production in 2016. InFO is expected to further intensify the competition in the packaging and testing industry. Our EMS business faces significant competition from other EMS providers, such as Hon Hai Precision Ind. Co., Ltd., with comprehensive integration, wide geographic coverage and large production capabilities that enable them to achieve economies of scale. We believe, however, that we can still achieve satisfactory performance in the market given that we have been able to provide products with high quality and we are capable of designing new products by cooperating with our customers.
52
Environmental Matters
Our operations of packaging, interconnect materials and EMS generate both hazardous and
non-hazardous
wastes. We have installed various types of anti-pollution equipment for the treatment of liquid and gaseous chemical waste. We have adopted comprehensive antipollution measures for the effective management of environmental protection that we believe are consistent with international standards. In addition, we believe we are in compliance in all material respects with present environmental laws and regulations applicable to all our operations and facilities. Our estimated environmental capital expenditures for 2022 will be approximately US$20.5 million, of which 47.8% will be used in climate change adaptation. In order to demonstrate our commitment to environmental protection, in December 2013, ASE’s board of directors approved contributions to environmental protection efforts in Taiwan in a total amount of not less than NT$3,000.0 million, to be made in the following 30 years. For the year ended December 31, 2019, we made contributions in the amount of NT$100.0 million through ASE Cultural and Educational Foundation to fund various environmental projects. On December 10, 2020, we established the ASE Environmental Protection and Sustainability Foundation for promotion of public interest related to environmental protection. We have made contributions in the amount of NT$100.0 million (US$3.6 million) for each of the years 2020 and 2021 through the ASE Environmental Protection and Sustainability Foundation to continuously implement the activities related to environmental protection projects. On January 26, 2022, we have made contributions in the amount of NT$100.0 million (US$3.6 million), through the ASE Environmental Protection and Sustainability Foundation to continuously implement the activities related to environmental protection projects in 2022.
In 2019, we issued unsecured international corporate bonds in the aggregate amount of US$300.0 million with par value of US$1.0 million. The proceeds from this bonds offering were used to subscribe for a total of 465,360,000 new shares of ASE at NT$20 per share issued through a private placement to support ASE’s investment in green projects.
Our operations involving wafer-level process and requiring wastewater treatment at our Kaohsiung facility have been subject to scrutiny by the Kaohsiung City Environmental Protection Bureau as a result of alleged water pollution violations that occurred in 2013. In addition, five employees of a China subsidiary were accused by China People’s Procuratorate (the “Procuratorate”) for committing the crime of environmental pollution that occurred in 2018 and such case was concluded on April 7, 2021. For additional details of these administrative actions and judicial proceedings related to our environment claims, see “Item 8. Financial Information—Consolidated Statements and Other Financial Information—Legal Proceedings.”
Defending against any of the pending or future actions will likely be costly and time-consuming and could significantly divert our management team’s efforts and resources. Any future suspension of operations at our facilities may adversely affect our business, financial condition, results of operations and cash flows. See “Item 3. Key Information—Risk Factors— Risks Relating to Our Business—Any environmental claims or failure to comply with any present or future environmental regulations, as well as any fire or other industrial accident, may require us to spend additional funds and may materially and adversely affect our financial condition and results of operations.”
Climate Change Management
To strengthen our focus on
low-carbon
development in response to climate change, we have established the CSC as the highest level of management for sustainability management. The CSC is chaired by our chairman and comprises of senior management executives, including five directors. The CSC is responsible for supervising corporate-wide sustainability affairs, including climate change and water-related issues, and reports directly to the board of directors. We are committed to reducing the emission of greenhouse gases from our business operations. We aim to address and integrate climate change into our business strategies by (i) establishing an overall carbon management system to implement
low-carbon
strategies and policies in accordance with our three guiding principles of energy saving, green energy and energy storage; (ii) investing in renewable energy; (iii) innovating and promoting low-carbon
products and services; (iv) identifying our vulnerabilities to climate change and developing adaptation strategies; and (v) cultivating a “green” corporate culture and becoming a leading provider of low-carbon
solutions. 53
We believe that there are opportunities associated with climate change related risks and have implemented the following strategies to evaluate the risks and identify the opportunities:
| ● | Management procedures. |
| ● | Identification processes for risks and opportunities. |
| ● | Prioritize the risks and opportunities identified. |
Transition to
low-carbon
economy Our climate leadership stems from bringing low carbon solutions to the global market and through balancing operational growth and
low-carbon
transformation targets that meet stakeholders’ expectations. When developing our business strategies, we strive to reflect industry leading awareness of environmental protection and low-carbon
transition planning. Climate change and energy resource management present a host of challenges and opportunities, and developments in climate policy, technology, and decarbonization as well as natural disasters can drastically impact our operations. We also explore potential pathways with environmental specialists to achieve carbon reduction targets and establish response systems to adapt to climate change. We are dedicated to providing high efficiency products as well as investing in the research and development of
eco-friendly
design. Starting from the product design stage, we actively incorporate environmentally friendly materials into production processes. We have also maintained a multi-site certification for ISO 14001, ISO 14064-1
and ISO 50001, which regularly examines the effectiveness of our environment and energy management systems. Global warming and climate change are contributing to extreme weather patterns and causing more stress to the environment. As a global citizen, we are taking measurable actions to support and promote environmental sustainability. We have signed up with a major customer’s ‘Supplier Clean Energy Program’ to increase our energy efficiency and transition to clean and renewable electricity. We have also established a clear set of goals by working with the Science Based Targets initiative to reduce greenhouse gas emissions. We have committed to net-zero
GHG emissions for all offices by 2030 and all manufacturing facilities by 2050 and have also joined the Taiwan Institute for Sustainable Energy’s Net-zero
Emission Alliance in pledging commitment to Net-zero
2030/2050, to build a supply chain that is resilient, transformative and progressive. We believe proactively engaging in supplier development is key to the sustainable development of our supply chain. We provide trainings, workshops, seminars and consultation to reinforce our suppliers’ capabilities to address sustainability issues and enhance their awareness of best practices for sustainability. In 2015, we joined the RBA, previously known as the Electronic Industry Citizens Coalition, and every year all of our facilities complete the RBA’s Self-Assessment Questionnaire to identify the labor, environmental, and ethical risks in their respective operations. For internal management, we have adopted the guidelines set out by the United Nations Framework Convention on Climate Change and encourage all our sites to submit their own self-initiated goals that are set according to their respective operation scale and capabilities. To improve overall energy management, we established a green energy platform that comprises of multiple departments of our Group as well as teams based in Taiwan in 2021. We selected qualified renewable energy suppliers and signed letters of intent for cooperation with them. Our subsidiaries also entered into the renewable energy purchase agreements with such suppliers. As of December 31, 2021, we have preliminarily satisfied the requirements of the Regulations for the Management of Setting up Renewable Energy Power Generation Equipment of Power Users above a Certain Contract Capacity in Taiwan. We will continue to take into consideration the supply and demand trends in the renewable energy market and increase our purchase of renewable energy correspondingly to achieve our targets on sustainability. We aim to achieve zero carbon emission.
face-to-face
54
Risk Management
Our board of directors established a risk management committee and approved the “Risk Management Policies and Procedures” as the ultimate guiding risks management principle. Awareness in risk management forms an integral part of our management, and risk management has been duly incorporated into our business strategies and organizational culture. We conduct risk assessments on an annual basis. For major risks, we formulate specific management plans covering goals, organizational structure and responsibilities, and risk management procedures. These plans have been developed to identify, measure, monitor and control various risk exposures effectively. We also conduct a comprehensive evaluation on the probability impacts of various risks faced during the ordinary course of business, and take appropriate measures to continuously make improvements to respond to natural disasters and other disruptive events such as cyberattacks or energy crisis that could adversely affect the operation of our business.
We proactively implement risk management plans and report to the board of directors on a yearly basis. For example, in 2021, risk management committee have reported on major risks including the management of
COVID-19,
water shortage and power restrictions. For a discussion of these risks and other factors, see “Item 3. Key Information —Risk Factors.” Insurance
We have insurance policies covering property damage and damage to our production facilities, buildings and machinery. In addition, we have liability insurance policies, including but not limited to general liability insurance policies, product liability insurance policies for specified clients and products, and directors’ and officers’ insurance policies.
We are not insured against the loss of key personnel.
ORGANIZATIONAL STRUCTURE
The following chart illustrates our corporate structure, including our principal packaging and testing manufacturing subsidiaries and EMS subsidiaries as of January 31, 2022. The following chart does not include intermediate holding companies, internal trading companies as well as those companies without operations and in the process of construction.
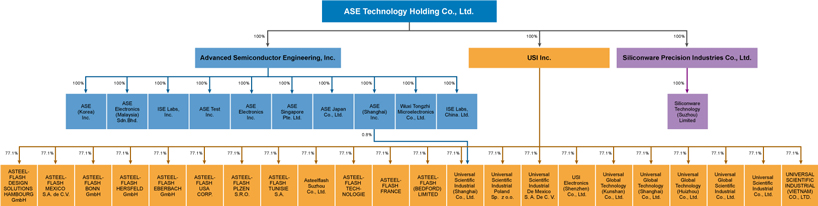
55
Our Consolidated Subsidiaries
ASE Group
ASE Inc.
ASE Inc., which was established on March 23, 1984, is our wholly owned subsidiary. It is incorporated in Taiwan and is dedicated to providing packaging and testing services, wafer sort testing, final testing service, substrate design and manufacturing.
ASE Test Taiwan
ASE Test Taiwan, which was acquired in 1990, is our wholly owned subsidiary. It is incorporated in Taiwan and is engaged in the testing of integrated circuits.
ASE Malaysia
ASE Malaysia, which was established in 1991, is our wholly owned subsidiary. It is incorporated in Malaysia and is engaged in the packaging and testing of integrated circuits.
ISE Labs
ISE Labs is our wholly owned subsidiary. It is a semiconductor company specializing in
front-end
engineering testing that is incorporated in the U.S. and has its principal facilities located in Fremont, California. We acquired 70.0% of the outstanding shares of ISE Labs in 1999 through ASE Test, and increased our holding to 100.0% through purchases made in 2000 and 2002. ASE Singapore Pte. Ltd.
ASE Singapore Pte. Ltd., our wholly owned subsidiary, is incorporated in Singapore and provides packaging and testing services. We acquired ASE Singapore Pte. Ltd., which was wholly owned by ISE Labs, through our acquisition of ISE Labs in 1999. In January 2011, ASE Singapore II Pte. Ltd. (previously known as EEMS Test Singapore) merged into ASE Singapore Pte. Ltd. after we acquired ASE Singapore II Pte. Ltd. in August 2010.
ASE Electronics
ASE Material was established in 1997 as an R.O.C. company for the production of interconnect materials, such as substrates, used in the packaging of semiconductors. We initially held a majority stake in ASE Material, but acquired the remaining equity by means of a merger of ASE Material with and into us in August 2004. In August 2006, we spun off the operations originally conducted through ASE Material into our wholly owned subsidiary ASE Electronics. ASE Electronics currently supplies our packaging operations with a substantial portion of our substrate requirements. The facilities of ASE Electronics are primarily located in the Nanzih Technology Industrial Park near our packaging and testing facilities in Kaohsiung, Taiwan.
ASE Chung Li and ASE Korea
In July 1999, we purchased Motorola’s Semiconductor Products Sector operations in Chung Li, Taiwan and Paju, South Korea for the packaging and testing of semiconductors, thereby forming ASE Chung Li and ASE Korea. In August 2004, we acquired the remaining outstanding shares of ASE Chung Li that we did not already own and merged ASE Chung Li into us.
ASE Japan
ASE Japan, which we acquired from NEC Electronics Corporation in May 2004, is our wholly owned subsidiary. It is incorporated in Japan and is engaged in the packaging and testing of semiconductors.
ASE Shanghai
ASE Shanghai was established in 2001 as a wholly owned subsidiary of ASE Inc. and began operations in June 2004. ASE Shanghai primarily manufactures and supplies interconnect materials for our packaging operations.
56
Wuxi Tongzhi
In May 2013, we, through our subsidiary ASESH AT, acquired 100.0% of the shares of Wuxi Tongzhi from Toshiba Semiconductor (Wuxi) Co., Ltd. Wuxi Tongzhi is based in Wuxi, China and is engaged in semiconductor packaging and testing.
ISE Shanghai
ISE Shanghai was established in 2018 and began operating in 2019. ISE Shanghai is based in Shanghai, China and is engaged in semiconductor testing.
SPIL Group
SPIL is a provider of semiconductor packaging and testing services. SPIL offers a full range of packaging and testing solutions, including advanced packages, substrate packages and leadframe packages, as well as testing for logic and mixed signal devices. SPIL also provides turnkey services, from packaging and testing to shipment service.
SPIL and ASE entered into a Joint Share Exchange Agreement on June 30, 2016, pursuant to which ASE established ASEH through a statutory exchange, and ASEH acquired all issued and outstanding shares of both ASE and SPIL. For details about the Joint Share Exchange Agreement, see “Item 10. Additional information—Material Contract.”
The Share Exchange consummated on April 30, 2018, and SPIL’s shares concurrently delisted from TWSE and NASDAQ on April 30, 2018. On April 30, 2018, ASE and SPIL became privately held wholly owned subsidiaries of ASEH. For details about the SPIL Acquisition, see “Item 4. Information on the Company— SPIL Acquisition.”
The board of directors of the subsidiary, SPIL (Cayman) Holding Limited, resolved in September 2020 to dispose its 100% shareholdings in Siliconware Electronics (Fujian) Co., Limited to Shenzhen Hiwin System Limited with a consideration of RMB966,000 thousand. The disposal was completed in October 2020. See Note 30 to our consolidated financial statements included in this annual report. The principal operating subsidiaries under SPIL Group are Siliconware Precision Industries Co., Ltd., and SZ.
USI Group
USI Group engages primarily in EMS in relation to computing, consumer electronics, communications, industrial and automotive, among other services and businesses.
As of January 31, 2022, we held 100.0% interest in USI Inc. and held 77.9% interest in USI Shanghai through our subsidiaries USI Inc. and ASE Shanghai. In addition, as of January 31, 2022, we held 100.0% interest in FAFG through our subsidiaries USIFR and USI Shanghai. See “Item 4. Information on the Company—Information on the Company—History and Development of the Company— USI Group and USI Group Restructuring” for more information.
PROPERTY, PLANTS AND EQUIPMENT
We operate a number of packaging, testing and electronic manufacturing facilities in Asia, Africa, the U.S. and Europe. Our facilities provide varying types or levels of services with respect to different
end-product
focus, customers, technologies and geographic locations. With our diverse facilities we are able to tailor our packaging, testing and electronic manufacturing solutions closely to our customers’ needs. The following table sets forth the location, commencement of operation, primary use, approximate floor space and ownership of our principal facilities in operation as of January 31, 2022. 57
| Facility |
Location |
Commencement of Operation |
Primary Use |
Approximate Floor Space (in sq. ft.) |
Owned or Leased | |||||
| ASE Inc. | Kaohsiung, R.O.C. | March 1984 | Our primary packaging facility, which offers complete semiconductor manufacturing solutions in conjunction with ASE Test Taiwan and foundries located in Taiwan. Focuses primarily on packaging services such as flip chip, wafer bumping and fine-pitch wire bonding. | 7,793,000 | Land: leased Buildings: owned and leased | |||||
| Chung Li, R.O.C. | Acquired in July 1999 | An integrated packaging and testing facility that specializes in semiconductors for communications and consumer applications. | 4,367,000 | Land and buildings: owned | ||||||
| ASE Test Taiwan | Kaohsiung, R.O.C. | Acquired in April 1990 | Our primary testing facilities, which offer complete semiconductor manufacturing solutions in conjunction with ASE Inc.’s facility in Kaohsiung and foundries located in Taiwan. Focuses primarily on advanced logic/mixed-signal/RF/3D IC testing for integrated device manufacturers, fabless design companies and system companies. | 1,230,000 | Land: leased Buildings: owned and leased | |||||
| ASE Malaysia | Penang, Malaysia | February 1991 | An integrated packaging and testing facility that focuses primarily on the requirements of integrated device manufacturers. | 1,102,000 | Land: leased Buildings: owned | |||||
| ASE Korea | Paju, Korea | Acquired in July 1999 | An integrated packaging and testing facility that specializes in semiconductors for radio frequency, sensor and automotive applications. | 1,294,000 | Land and buildings: owned | |||||
| ISE Labs | California, U.S. | Acquired in May 1999 | Front-end engineering and final testing facilities located in Northern California in close proximity to some of the world’s largest fabless design companies. |
80,000 | Land and buildings: owned | |||||
| ASE Singapore | Singapore | Acquired in May 1999 | An integrated packaging and testing facility that specializes in semiconductors for communication, computers and consumer applications. | 282,000 | Land: leased Buildings: owned and leased | |||||
| ASE Shanghai | Shanghai, China | June 2004 | Design and production of semiconductor packaging materials. | 1,792,000 | Land: leased Buildings: owned | |||||
58
| Facility |
Location |
Commencement of Operation |
Primary Use |
Approximate Floor Space (in sq. ft.) |
Owned or Leased | |||||
| ASE Japan | Takahata, Japan | Acquired in May 2004 | An integrated packaging and testing facility that specializes in semiconductors for cellular phone, household appliance and automotive applications. | 108,000 | Land and buildings: leased | |||||
| ASE Electronics | Kaohsiung, R.O.C. | August 2006 | Facilities for the design and production of interconnect materials such as substrates used in the packaging of semiconductors. | 612,000 | Land: leased Buildings: owned | |||||
| Wuxi Tongzhi | Wuxi, China | Acquired in May 2013 | An integrated packaging and testing facility that specializes in semiconductors for MP3, vehicle, household appliance and communications applications. | 78,000 | Land and buildings: leased | |||||
| ISE Shanghai | Shanghai, China | October 2018 | Testing facility for semiconductors. | 47,000 | Land and buildings: leased | |||||
| Universal Scientific Industrial | Nantou, R.O.C. | Acquired in February 2010 | Manufacture and marketing of electronic components, accessories and related products. | 418,000 | Land: owned Buildings: owned and leased | |||||
| USI Mexico | Guadalajara, Mexico | Acquired in February 2010 | Manufacturing site, which offers motherboard manufacture and system assembly. | 786,000 | Land and buildings: owned | |||||
| USISZ | Shenzhen, China | Acquired in February 2010 | Manufacturing site for design, manufacture and marketing of motherboards, electronic components, accessories and related products in China. | 683,000 | Land: leased Buildings: owned | |||||
| USI Shanghai | Shanghai, China | Acquired in February 2010 | Manufacturing site for design, manufacture and marketing of motherboards, electronic components, accessories and related products in China. | 1,782,000 | Land: leased Buildings: owned and leased | |||||
| UGKS | Kunshan, China | August 2011 | Manufacturing site for design, manufacture and marketing of motherboards, electronic components, accessories and related products in China. | 1,106,000 | Land and buildings: leased | |||||
| UGTW | Nantou, R.O.C. | February 2010 | Design, manufacture and marketing of electronic components, accessories and related products, and related research and development services. | 1,360,000 | Land: owned Buildings: owned and leased | |||||
59
| Facility |
Location |
Commencement of Operation |
Primary Use |
Approximate Floor Space (in sq. ft.) |
Owned or Leased | |||||
| UGJQ | Shanghai, China | Established in September 2013 | Design, manufacture and marketing of motherboards, electronic components, accessories and related products in China. | 1,012,000 | Land and buildings: leased | |||||
| USIPL | Wroclaw-Kobierzyce, Poland | Acquired in October 2019 | Design, manufacture miniaturization, material sourcing, logistics operations, and provides after sales services of electronic devices and modules. | 363,000 | Land and buildings: owned | |||||
| Universal Global Technology (Huizhou) Co., Ltd. |
Huizhou, China | October 2021 | Research and manufacturing of new electronic applications, communications, computers and other electronics products and also provided auxiliary technical services as well as import and export services. | 1,967,000 | Land: leased Buildings: owned | |||||
| UNIVERSAL SCIENTIFIC INDUSTRIAL (VIETNAM) CO., LTD. |
Haiphong, Vietnam | July 2021 | IC assembly for wearable devices | 1,286,000 | Land and buildings: owned | |||||
| ASTEELFLASH (BEDFORD) LIMITED |
Bedford, United Kingdom | Acquired in December 2020 | Manufacturing site for design and manufacture of electronic components, and specializes in industrial, telecommunication, internet of things, data processing, consumer electronics and aerospace related devices. | 51,000 | Land and buildings: leased | |||||
| ASTEELFLASH FRANCE |
Soissons, Normandie, Lorraine, Duttlenhei, Langon and Grenoble, France | Acquired in December 2020 | Manufacture of electronic components such as complex mechatronic subsets (analog and digital) and design of electronic boards and mechatronic subsets engineering, electronic manufacturing services, expertise in high mix and low volume products. | 910,000 | Land and buildings: owned | |||||
| ASTEELFLASH TUNISIE S.A. |
La Soukra, Tunisia | Acquired in December 2020 | Design and manufacture of electronic components, such as PCBA assembly, coating, varnishing and in-circuit testing capabilities. |
236,000 | Land and buildings: leased | |||||
| ASTEELFLASH TECHNOLOGIE | Alencon, France | Acquired in December 2020 | Design and manufacture of mechatronic part, specifically targeted to automotive. | 173,000 | Land and buildings: owned | |||||
60
| Facility |
Location |
Commencement of Operation |
Primary Use |
Approximate Floor Space (in sq. ft.) |
Owned or Leased | |||||
| Asteelflash Suzhou Co., Ltd. | Suzhou, China | Acquired in December 2020 | Manufacturing site specialized in SMT assembly for PCBA and system assembly/box build for module/final product in different segments. | 1,452,000 | Land and buildings: owned | |||||
| ASTEELFLASH HERSFELD GmbH | Bad Hersfeld, Germany | Acquired in December 2020 | Manufacturing site for PCB assembly, mainly automotive business, mid and high volume, products linked to high security level, box build. | 742,000 | Land and buildings: owned | |||||
| ASTEELFLASH EBERBACH GmbH | Eberbach, Germany | Acquired in December 2020 | Manufacturing site that offers high/medium mix to low/medium volume electronic manufacturing services and focuses on smart building, smart home, green technologies, industrial and medical devices and equipment. | 85,000 | Land and buildings: leased | |||||
| ASTEELFLASH BONN GmbH | Bonn, Germany | Acquired in December 2020 | Manufacturing site that offers high/medium mix to low/medium volume electronic manufacturing services. Focused on smart building, smart home, green technologies, internet of things and telecommunication devices and equipment. | 91,000 | Land and buildings: leased | |||||
| ASTEELFLASH DESIGN SOLUTIONS HAMBOURG GmbH | Hamburg, Germany | Acquired in December 2020 | Manufacture and design for low/mid volumes with mid/high complexity products for industrial, medical, railway and IoT products. | 38,000 | Buildings: leased | |||||
| ASTEELFLASH PLZEN S.R.O. | Pilsen, Czech Republic | Acquired in December 2020 | Manufacturing site that offers solder paste printers, in-line solder paste inspection, full SMT lines, in-line automated optical inspection, wave soldering, and flying probe testing. |
40,000 | Land and buildings: leased | |||||
| ASTEELFLASH USA CORP. | California, U.S. | Acquired in December 2020 | Manufacturing site that offers solder paste printers, in-line solder paste inspection, full SMT lines, in-line automated optical inspection, wave soldering, flying probe testing, X- Ray capabilities and potting. |
130,000 | Land and buildings: leased | |||||
| ASTEELFLASH MEXICO S.A. de C.V. | Tijuana, Mexico | Acquired in December 2020 | Manufacturing site which specializes in automotive, medical, aerospace and commercial customers. | 133,000 | Land and buildings: leased | |||||
61
| Facility |
Location |
Commencement of Operation |
Primary Use |
Approximate Floor Space (in sq. ft.) |
Owned or Leased | |||||
| Siliconware Precision Industries Co., Ltd. | Taichung, Changhua and Hsinchu, R.O.C. | Acquired in April 2018 | Packaging and Testing facility, which offers semiconductor packaging and testing turnkey services. | 8,713,000 | Land: owned and leased Buildings: owned | |||||
| SZ | Suzhou, China | Acquired in April 2018 | An integrated packaging and testing facility. This facility focuses primarily on packaging services. | 1,447,000 | Land: leased Buildings: owned | |||||
We have leased land in the Kaohsiung Nanzih Technology Industrial Park from the Export Processing Zone Administration (the “EPZA”) with different lease terms for several years that will expire in August 2061. We have leased land from the Central Taiwan Science Park Administration in Taichung with 19-year to
20-year
terms that will expire in December 2040. We have leased land from Hsinchu Science Park Administrations in Hsinchu with 14-year
to 40-year
terms that will expire in December 2034. No sublease or lending of the land is allowed. The EPZA, the Central Taiwan Science Park Administration, and the Hsinchu Science Park Administrations have the right to adjust the rental price in the event the government revalues the land. The leases are typically renewable with one-month
to three-month notice prior to the termination date. Kaohsiung facility is our operation headquarters and houses our industry-leading RD center, which is dedicated to providing world-class assembly, wafer bumping and test services and also offers full turnkey services, including substrate design and manufacturing capabilities. In a world first, our 5G smart factory, which is acollaboration among us, Chunghwa Telecom and Qualcomm Technologies, Inc., has commenced operation at Kaohsiung facility since December 2020. The smart factory features the extensive scope and sophistication of 5G technology application that accelerates the transformation of smart manufacturing and automation.
For administrative actions and judicial proceedings related to Kaohsiung Facility, see “Item 8. Financial Information—Consolidated Statements and Other Financial Information— Legal Proceedings.”
We currently do not have plans for significant expansion, but will reevaluate our need for future expansion based on market condition and future demand requirements to meet our expected future growth. For information on the aggregate capacity of our facilities we operate, see “—Business Overview—Equipment.”
Item 4A. Unresolved Staff Comments
None.
Item 5. Operating and Financial Review and Prospects
OPERATING RESULTS
The following discussion of our business, financial condition and results of operations should be read in conjunction with our consolidated financial statements, which are included elsewhere in this annual report. This discussion contains forward-looking statements that reflect our current views with respect to future events and financial performance. Our actual results may differ materially from those anticipated in these forward-looking statements as a result of any number of factors, such as those set forth under “Item 3. Key Information—Risk Factors” and elsewhere in this annual report. See “Special Note Regarding Forward-Looking Statements. “ Please refer to our Form
20-F
dated April 6, 2021 (File No. 001-16125), as amended, for our discussion of financial information and operating results for 2020. Overview
We offer a broad range of semiconductor packaging and testing services, and we also offer EMS through USI Group. In addition to offering each service separately, we also offer turnkey services, which include integrated packaging, testing and direct shipment of semiconductors to end users designated by our customers and solution-based proactive original design manufacturing, for our customers. In addition, we have been generating revenues from our real estate business and from the manufacturing of integrated circuits since 2019. Our operating revenues increased from NT$476,978.7 million in 2020 to NT$569,997.1 million (US$20,547.8 million) in 2021.
62
Discussed below are several factors that have had a significant influence on our financial results in recent years.
Pricing and Revenue Mix
We price our services taking into account the actual costs involved in providing these services, with reference to prevailing market prices. The majority of our prices and revenues is denominated in U.S. dollars. Any significant fluctuation in exchange rates, especially between NT dollars and U.S. dollars, will affect our costs and, in turn, our revenues.
In the case of semiconductor packaging, the cost of the silicon die, typically the most costly component of the packaged semiconductor, is usually not reflected in our costs (or revenues) since it is generally supplied by our customers on a consignment basis.
The semiconductor industry is characterized by a general trend toward declining prices for products and services of a given technology over time. In addition, during periods of intense competition and adverse conditions in the semiconductor industry, the pace of this decline may be more rapid than in other years. The average selling prices of our packaging and testing services have experienced sharp declines during such periods as a result of intense price competition from other market participants that attempt to maintain high-capacity utilization levels in the face of reduced demand.
Declines in average selling prices have been partially offset historically by changes in our revenue mix, and typically the selling price is largely dependable on the complexity of the services. In particular, revenues derived from more advanced package types, such as flip chip BGA, higher-density packages with finer spacing, or pitch, and testing of more complex, high-performance semiconductors have increased as a percentage of total revenues. We intend to continue to focus on package types such as bumping, flip chip BGA and SiP, developing and offering new technologies in packaging and testing services and expanding our capacity to achieve economies of scale, as well as improving production efficiencies for older technologies, in order to mitigate the effects of declining average selling prices on our profitability.
lead-to-lead
Our profitability for a specific package type does not depend linearly on its average selling price. Some of our more traditional package types, which typically have low average selling prices, may well command steadier and sometimes higher margins than more advanced package types with higher average selling prices.
High Fixed Costs
Our operations, in particular our testing operations, are characterized by relatively high fixed costs. We expect to continue to incur substantial depreciation and other expenses especially from our acquisitions of packaging and testing equipment and facilities. Our profitability depends in part not only on absolute pricing levels for our products/services, but also on utilization rates on equipment, commonly referred to as “capacity utilization rates.” In particular, increases or decreases in our capacity utilization rates could have a significant effect on gross margins since the unit cost of our products and/or services generally decreases as fixed costs are allocated over a larger number of units. The capacity utilization rates of the machinery and equipment installed at our production facilities typically depend on factors such as the volume and variety of products, the efficiency of our operations in terms of the loading and adjustment of machinery and equipment for different products, the complexity of the different products to be packaged or tested, the amount of time set aside for the maintenance and repair of the machinery and equipment, and the experience and schedule of work shifts of operators.
In 2020 and 2021, our depreciation, amortization and rental expenses included in operating costs as a percentage of operating revenues was 9.8% and 8.7%, respectively. The decrease in depreciation, amortization and rental expenses as a percentage of operating revenues in 2021 compared to 2020 was primarily a result of an increase in our operating revenues. We begin depreciating our equipment when the machinery is placed into service. There may sometimes be a time lag between when our equipment is available for use and when it achieves high levels of utilization. In periods of depressed industry conditions, such as the fourth quarter of 2008, we experienced lower than expected demand from customers, resulting in an increase in depreciation relative to operating revenues. In particular, the capacity utilization rates for our testing equipment are more severely affected during an industry downturn as a result of a decrease in outsourcing demand from integrated device manufacturers, which typically maintain larger
in-house
testing capacity than in-house
packaging capacity. 63
In addition to purchasing testers, we also lease a portion of our testers, which we believe allows us to better manage our capacity utilization rates and cash flow. Since leased testers can be replaced with more advanced testers upon the expiration of the lease, we believe that these leases have enabled us to improve our capacity utilization rates by allowing us to better align our capacity with changes in equipment technology and the needs of our customers. For more information about our testers, including the number of testers under lease, see “Item 4. Information on the Company—Business Overview—Equipment—Testing.”
Raw Material Costs
Substantially all of our raw material costs are accounted for by packaging, the production of interconnect materials and EMS. In particular, our EMS requires more significant quantities of raw materials than our packaging and production of interconnect materials. In 2021, raw material costs accounted for 80.3% of our operating revenues from EMS, and our revenues generated from EMS contributed to 42.0% of our operating revenues. In 2020 and 2021, raw material cost as a percentage of our operating revenues was 50.4% and 49.3%, respectively.
We have developed copper wire to gradually replace gold wire in the packaging processes in order to benefit from the lower material cost of copper. However, gold wire is still and will continue to be one of the principal raw materials for us in our packaging processes. It may be difficult for us to adjust our average selling prices to account for fluctuations in the price of gold. Thus we expect our raw material costs to continue to be affected by fluctuations in the price of gold.
Recent Accounting Pronouncements
Please refer to Note 3 to our consolidated financial statements included in this annual report.
Critical Accounting Estimates
Preparation of our consolidated financial statements requires us to make estimates and judgments in applying our critical accounting policies that have a significant impact on the results we report in our consolidated financial statements. Our critical accounting judgments and key sources of estimation uncertainty are set forth in detail in Note 5 to our consolidated financial statements included in this annual report.
Business
Combinations
When we acquire businesses, goodwill is measured as the excess of the sum of the consideration transferred, the amount of any
non-controlling
interests in the acquiree, and the fair value of the acquirer’s previously held equity interest in the acquiree (if any) over the fair value of the identifiable assets and liabilities at the acquisition date. The allocation of the purchase price requires management to make significant estimates in determining the fair values of assets and liabilities at the acquisition date, especially with respect to intangible assets. These estimates are based on historical experience, information obtained from the management of the acquired companies and independent external service providers’ reports. These estimates can include, but are not limited to, the cash flows that an asset is expected to generate in the future, the appropriate weighted-average cost of capital, and the synergistic benefits expected to be derived from the acquired business. These estimates are inherently uncertain and unpredictable. In addition, unanticipated events and circumstances may occur, which may affect the accuracy or validity of such estimates. For the acquisition of a subsidiary, we identify the difference between investment cost and our share of net fair value of the subsidiary’s identifiable assets and liabilities after the acquisition of a subsidiary. It involves critical judgments and estimations when determining aforementioned net fair values. The management engaged independent external appraisers to assist them in identifying and evaluating the subsidiary’s identifiable tangible assets, intangible assets and liabilities. The scope of such evaluation includes the type of intangible assets that may be identified and the related estimated cash flow or relief cost expenses. If the initial accounting for a business combination is incomplete by the end of the reporting period in which the combination occurs, the Group reports provisional amounts for the items for which the accounting is incomplete. Those provisional amounts are adjusted retrospectively during the measurement period, or additional assets or liabilities are recognized, to reflect new information obtained about facts and circumstances that existed at the acquisition date that, if known, would have affected the amounts recognized at that date.
64
The excess of the fair value over the carrying amount of identified tangible assets and intangible assets on the acquisition date will be depreciated or amortized over their remaining useful lives or expected future economic benefit lives. The management believes the related estimation and assumption appropriately reflect the net fair value of identifiable assets acquired and liabilities assumed. The total PPA effect, however, may still fluctuate due to shifts in general economic conditions of the semiconductor manufacturing industry.
In relation to the SPIL Acquisition, we identified the difference between investment cost and our share of net fair value of SPIL’s identifiable assets and liabilities, or PPA effects of SPIL Acquisition, which caused the increase in the total of NT$5,918.2 million, NT$4,820.7 million and NT$4,605.6 million (US$166.0 million), of which an increase of NT$4,797.3 million, NT$3,708.0 million and NT$3,522.2 million (US$127.0 million) to depreciation and amortization in operating costs NT$1,012.7 million, NT$1,012.7 million and NT$1,004.2 million (US$36.2 million) to amortization in operating expenses and NT$108.2 million, NT$100.0 million and NT$79.2 million (US$2.8 million) to other operating income and expenses, net in 2019, 2020 and 2021, respectively.
We acquired 100.0% shareholdings of FAFG Group in 2020 and has completed the identification of the differences between the cost of the investment and our share of FAFG Group’s net fair value of identifiable assets and liabilities in 2021, therefore we has retrospectively adjusted the comparative financial statement as of and for the year ended December 31, 2020. See Note 29 to our consolidated financial statements included in this annual report.
Results of Operations
The following table sets forth, for the periods indicated, financial data from our consolidated statements of comprehensive income.
Year Ended December 31, |
||||||||||||||||||||||||||||
2019 |
2020 |
2021 |
||||||||||||||||||||||||||
NT$ |
Percentage |
NT$ |
Percentage |
NT$ |
US$ |
Percentage |
||||||||||||||||||||||
(in millions, except percentages) |
||||||||||||||||||||||||||||
| Operating revenues |
413,182.2 | 100.0% | 476,978.7 | 100.0% | 569,997.1 | 20,547.8 | 100.0% | |||||||||||||||||||||
| Operating costs |
(348,871.4) | (84.4)% | (398,994.4) | (83.7)% | (459,628.3) | (16,569.1) | (80.6)% | |||||||||||||||||||||
| |
|
|
|
|
|
|
|
|
|
|
|
|
|
|||||||||||||||
| Gross profit |
64,310.8 | 15.6% | 77,984.3 | 16.3% | 110,368.8 | 3,978.7 | 19.4% | |||||||||||||||||||||
| Operating expenses |
(40,784.4) | (9.9)% | (43,108.2) | (9.0)% | (48,244.4) | (1,739.2) | (8.5)% | |||||||||||||||||||||
| Other operating income and expenses, net |
(268.6) | (0.1)% | 502.5 | 0.1% | 1,189.8 | 42.9 | 0.2% | |||||||||||||||||||||
| |
|
|
|
|
|
|
|
|
|
|
|
|
|
|||||||||||||||
| Profit from operations |
23,257.8 | 5.6% | 35,378.6 | 7.4% | 63,314.2 | 2,282.4 | 11.1% | |||||||||||||||||||||
| Non-operating income, net |
22.0 | 0.0% | 390.2 | 0.1% | 16,879.6 | 608.5 | 3.0% | |||||||||||||||||||||
| |
|
|
|
|
|
|
|
|
|
|
|
|
|
|||||||||||||||
| Profit before income tax |
23,279.8 | 5.6% | 35,768.8 | 7.5% | 80,193.8 | 2,890.9 | 14.1% | |||||||||||||||||||||
| Income tax expense |
(5,011.2) | (1.2)% | (7,116.9) | (1.5)% | (17,943.8) | (646.8) | (3.1)% | |||||||||||||||||||||
| |
|
|
|
|
|
|
|
|
|
|
|
|
|
|||||||||||||||
| Profit for the year |
18,268.6 | 4.4% | 28,651.9 | 6.0% | 62,250.0 | 2,244.1 | 11.0% | |||||||||||||||||||||
| |
|
|
|
|
|
|
|
|
|
|
|
|
|
|||||||||||||||
| Attributable to |
||||||||||||||||||||||||||||
| Owners of the Company |
17,060.6 | 4.1% | 26,970.6 | 5.7% | 60,150.2 | 2,168.4 | 10.6% | |||||||||||||||||||||
| Non-controlling interests |
1,208.0 | 0.3% | 1,681.3 | 0.3% | 2,099.8 | 75.7 | 0.4% | |||||||||||||||||||||
| |
|
|
|
|
|
|
|
|
|
|
|
|
|
|||||||||||||||
| 18,268.6 | 4.4% | 28,651.9 | 6.0% | 62,250.0 | 2,244.1 | 11.0% | ||||||||||||||||||||||
| |
|
|
|
|
|
|
|
|
|
|
|
|
|
|||||||||||||||
| Other comprehensive income (loss) for the year, net of income tax |
(4,370.6) | (1.0)% | 495.3 | 0.1% | 406.0 | 14.6 | 0.0% | |||||||||||||||||||||
| |
|
|
|
|
|
|
|
|
|
|
|
|
|
|||||||||||||||
| Total comprehensive income for the year |
13,898.0 | 3.4% | 29,147.2 | 6.1% | 62,656.0 | 2,258.7 | 11.0% | |||||||||||||||||||||
| |
|
|
|
|
|
|
|
|
|
|
|
|
|
|||||||||||||||
| Attributable to |
||||||||||||||||||||||||||||
| Owners of the Company |
13,122.2 | 3.2% | 27,440.7 | 5.7% | 60,630.2 | 2,185.7 | 10.6% | |||||||||||||||||||||
| Non-controlling interests |
775.8 | 0.2% | 1,706.5 | 0.4% | 2,025.8 | 73.0 | 0.4% | |||||||||||||||||||||
| |
|
|
|
|
|
|
|
|
|
|
|
|
|
|||||||||||||||
| 13,898.0 | 3.4% | 29,147.2 | 6.1% | 62,656.0 | 2,258.7 | 11.0% | ||||||||||||||||||||||
| |
|
|
|
|
|
|
|
|
|
|
|
|
|
|||||||||||||||
65
The following table sets forth, for the periods indicated, earnings per common share and ADS.
Year Ended December 31, |
||||||||||||||||
2019 |
2020 |
2021 |
||||||||||||||
| Earnings per common share (NT$) (1) : |
||||||||||||||||
| Basic |
4.01 |
6.32 |
13.97 |
0.50 |
||||||||||||
| Diluted |
3.91 |
6.17 |
13.54 |
0.49 |
||||||||||||
| Earnings per equivalent ADS (NT$) (1) : |
||||||||||||||||
| Basic |
8.02 |
12.65 |
27.94 |
1.01 |
||||||||||||
| Diluted |
7.82 |
12.33 |
27.07 |
0.98 |
||||||||||||
| Number of common shares (in million shares) (2) : |
||||||||||||||||
| Basic |
4,252.0 |
4,265.7 |
4,305.3 |
4,305.3 |
||||||||||||
| Diluted |
4,262.8 |
4,288.6 |
4,365.7 |
4,365.7 |
||||||||||||
| Number of equivalent ADSs (3) |
||||||||||||||||
| Basic |
2,126.0 |
2,132.9 |
2,152.7 |
2,152.7 |
||||||||||||
| Diluted |
2,131.4 |
2,144.3 |
2,182.8 |
2,182.8 |
||||||||||||
| (1) | The denominators for diluted earnings per common share and diluted earnings per equivalent ADS are calculated to account for the potential diluted factors, such as employees’ compensation, the exercise of options and the issuance of employee restricted stock awards. |
| (2) | Represents the weighted average number of shares after retroactive adjustments to give effect to stock dividends. Common shares held by consolidated subsidiaries are classified as “treasury stock,” and are deducted from the number of common shares outstanding. |
| (3) | For the computation of earnings per ADS, the denominators were the half of the aforementioned weighted average outstanding shares (1 ADS represents 2 ordinary shares). |
The following table sets forth, for the periods indicated, segment results. Gross margin is calculated by dividing gross profit by their respective operating revenues.
Year Ended December 31, |
||||||||||||||||||||||||||||
2019 |
2020 |
2021 |
||||||||||||||||||||||||||
NT$ |
Percentage |
NT$ |
Percentage |
NT$ |
US$ |
Percentage |
||||||||||||||||||||||
(in millions, except percentages) |
||||||||||||||||||||||||||||
| Operating revenues: |
||||||||||||||||||||||||||||
| Packaging |
198,916.8 | 48.2% | 218,666.1 | 45.9% | 272,543.9 | 9,824.9 | 47.8% | |||||||||||||||||||||
| Testing |
42,658.7 | 10.3% | 47,271.1 | 9.9% | 49,978.7 | 1,801.7 | 8.8% | |||||||||||||||||||||
| EMS |
165,789.5 | 40.1% | 204,690.6 | 42.9% | 239,488.3 | 8,633.3 | 42.0% | |||||||||||||||||||||
| Gross profit: |
||||||||||||||||||||||||||||
| Packaging |
34,539.0 | 17.4% | 43,251.7 | 19.8% | 69,985.5 | 2,522.9 | 25.7% | |||||||||||||||||||||
| Testing |
14,536.9 | 34.1% | 15,257.3 | 32.3% | 17,404.5 | 627.4 | 34.8% | |||||||||||||||||||||
| EMS |
14,491.4 | 8.7% | 18,825.9 | 9.2% | 21,384.7 | 770.9 | 9.0% | |||||||||||||||||||||
The following table sets forth, for the periods indicated, a breakdown of our total operating costs and operating expenses, expressed as a percentage of operating revenues.
Year Ended December 31, |
||||||||||||
2019 |
2020 |
2021 |
||||||||||
| Operating costs |
||||||||||||
| Raw materials |
49.3% |
50.4% |
49.3% |
|||||||||
| Labor |
12.4% |
11.6% |
11.5% |
|||||||||
| Depreciation, amortization and rental expense |
11.2% |
9.8% |
8.7% |
|||||||||
| Others |
11.5% |
11.9% |
11.1% |
|||||||||
| Total operating costs |
84.4% |
83.7% |
80.6% |
|||||||||
| Operating expenses |
||||||||||||
| Selling |
1.4% |
1.2% |
1.2% |
|||||||||
| General and administrative |
4.0% |
3.8% |
3.6% |
|||||||||
| Research and development |
4.5% |
4.0% |
3.7% |
|||||||||
| Total operating expenses |
9.9% |
9.0% |
8.5% |
|||||||||
Year Ended December 31, 2021 Compared to Year Ended December 31, 2020
Operating Revenues
.
66
Gross Profit
.
Profit from Operations
.
Non-Operating
Income and Expenses.non-operating
income of NT$16,879.6 million (US$608.5 million) in 2021 compared to a net non-operating
income of NT$390.2 million in 2020. This increase of NT$ 16,489.4 (US$594.4 million) was primarily due to the gain from China site dispositions. Net Profit
.
non-controlling
interests, increased by 123.0% to NT$60,150.2 million (US$2,168.4 million) in 2021 compared to NT$26,970.6 million in 2020. Our diluted earnings per ADS increased to NT$27.07 (US$0.98) in 2021 compared to diluted earnings per ADS of NT$12.33 in 2020. Our income tax expenses increased by 152.1% to NT$17,943.8 million (US$646.9 million) in 2021 compared to NT$7,116.9 million in 2020. This increase was primarily attributed to higher corporate income tax due to higher taxable income and higher additional income tax on unappropriated earnings due to higher 2021 earnings as well as capital gains tax, which resulted from the gain on China site dispositions. Year Ended December 31, 2020 Compared to Year Ended December 31, 2019
For a detailed description of the comparison of our operating results for the year ended December 31, 2020 to the year ended December 31, 2019, please refer to “Item 5. Operating and Financial Review and Prospects— Operating Results and Trend Information—Results of Operations—Year Ended December 31, 2020 Compared to Year Ended December 31, 2019” of our annual report on Form
20-F
filed with the Securities and Exchange Commission on April 6, 2021, as amended. Quarterly Operating Revenues, Gross Profit and Gross Margin
The following table sets forth our unaudited consolidated operating revenues, gross profit and gross margin for the quarterly periods indicated. The unaudited quarterly results reflect all adjustments, consisting of normal recurring adjustments that, in the opinion of management, are necessary for a fair presentation of the amounts, on a basis consistent with the audited consolidated financial statements included elsewhere in this annual report. You should read the following table in conjunction with the audited consolidated financial statements and related notes included elsewhere in this annual report.
67
Our operating revenues, gross profit and gross margin for any quarter are not necessarily indicative of the results for any future period. Our quarterly operating revenues, gross profit and gross margin may fluctuate significantly.
Quarter Ended, |
||||||||||||||||||||||||||||||||
Mar. 31, |
Jun. 30, |
Sep. 30, |
Dec. 31, |
Mar. 31, |
Jun. 30, |
Sep. 30, |
Dec. 31, |
|||||||||||||||||||||||||
2020 |
2020 |
2020 |
2020 |
2021 |
2021 |
2021 |
2021 |
|||||||||||||||||||||||||
NT$ |
NT$ |
NT$ |
NT$ |
NT$ |
NT$ |
NT$ |
NT$ |
|||||||||||||||||||||||||
(in millions, except percentages) |
||||||||||||||||||||||||||||||||
| Operating Revenues |
||||||||||||||||||||||||||||||||
| Packaging |
51,612.9 |
53,621.6 |
56,171.9 |
57,259.7 |
59,033.4 |
64,149.3 |
73,995.8 |
75,365.4 |
||||||||||||||||||||||||
| Testing |
11,562.9 |
12,690.4 |
12,351.1 |
10,666.7 |
11,129.9 |
11,676.4 |
13,416.1 |
13,756.3 |
||||||||||||||||||||||||
| EMS |
32,721.3 |
39,702.7 |
53,125.7 |
79,141.0 |
47,683.9 |
49,147.0 |
61,116.2 |
81,541.2 |
||||||||||||||||||||||||
| Others |
1,460.0 |
1,534.1 |
1,546.7 |
1,810.0 |
1,622.6 |
1,953.6 |
2,136.7 |
2,273.3 |
||||||||||||||||||||||||
| |
|
|
|
|
|
|
|
|
|
|
|
|
|
|
|
|||||||||||||||||
| Total |
97,357.1 |
107,548.8 |
123,195.4 |
148,877.4 |
119,469.8 |
126,926.3 |
150,664.8 |
172,936.2 |
||||||||||||||||||||||||
| |
|
|
|
|
|
|
|
|
|
|
|
|
|
|
|
|||||||||||||||||
| Gross Profit |
||||||||||||||||||||||||||||||||
| Packaging |
9,297.3 |
10,581.3 |
10,469.1 |
12,903.9 |
14,241.6 |
16,212.7 |
19,311.0 |
20,220.2 |
||||||||||||||||||||||||
| Testing |
3,730.3 |
4,329.1 |
3,984.2 |
3,213.7 |
3,395.4 |
3,733.1 |
5,123.1 |
5,152.9 |
||||||||||||||||||||||||
| EMS |
3,024.4 |
3,709.6 |
5,119.1 |
6,972.8 |
3,988.7 |
4,453.7 |
5,855.5 |
7,086.8 |
||||||||||||||||||||||||
| Others |
103.6 |
189.4 |
147.4 |
209.1 |
260.7 |
404.7 |
494.3 |
434.4 |
||||||||||||||||||||||||
| |
|
|
|
|
|
|
|
|
|
|
|
|
|
|
|
|||||||||||||||||
| Total |
16,155.6 |
18,809.4 |
19,719.8 |
23,299.5 |
21,886.4 |
24,804.2 |
30,783.9 |
32,894.3 |
||||||||||||||||||||||||
| |
|
|
|
|
|
|
|
|
|
|
|
|
|
|
|
|||||||||||||||||
| Gross Profit (%) |
||||||||||||||||||||||||||||||||
| Packaging |
18.0% |
19.7% |
18.6% |
22.5% |
24.1% |
25.3% |
26.1% |
26.8% |
||||||||||||||||||||||||
| Testing |
32.3% |
34.1% |
32.3% |
30.1% |
30.5% |
32.0% |
38.2% |
37.5% |
||||||||||||||||||||||||
| EMS |
9.2% |
9.3% |
9.6% |
8.8% |
8.4% |
9.1% |
9.6% |
8.7% |
||||||||||||||||||||||||
| Overall |
16.6% |
17.5% |
16.0% |
15.7% |
18.3% |
19.5% |
20.4% |
19.0% |
||||||||||||||||||||||||
Our results of operations are affected by seasonality. In general, our first quarter operating revenues have historically decreased over the preceding fourth quarter, primarily due to the combined effects of holidays in the U.S., Taiwan and elsewhere in Asia. Moreover, the increase or decrease in operating revenues of a particular quarter as compared with the immediately preceding quarter varies significantly. See “Item 3. Key Information—Risk Factors—Risks Relating to Our Business—Our operating results are subject to significant fluctuations, which could adversely affect the market value of your investment.”
Exchange Rate Fluctuations
Fluctuations in the exchange rate between NT dollars and U.S. dollars will affect the U.S. dollar equivalent of the NT dollar price of our common shares on the TWSE and, as a result, will likely affect the market price of the ADSs. Fluctuations will also affect the U.S. dollar conversion by the depositary under our ADS deposit agreement referred to below of cash dividends paid in NT dollars on, and the NT dollar proceeds received by the depositary from any sale of, common shares represented by ADSs, in each case, according to the terms of the deposit agreement dated April 30, 2018, Citibank N.A. as depositary, and the holders and beneficial owners from time to time of the ADSs, which we refer to as the deposit agreement.
For quantitative and qualitative disclosure of our exposure to foreign currency exchange rate risk, see “Item 11. Quantitative and Qualitative Disclosures about Market Risk—Market Risk—Foreign Currency Exchange Rate Risk.”
68
Taxation
The corporate income tax rate in the R.O.C. decreased from 25% to 17%, effective since January 1, 2010. The R.O.C. Statute for Upgrading Industries, which provided various tax incentives, including investment tax credits, tax exemptions and tax holidays for companies, expired on December 31, 2009. Under this statute, we had been granted tax holidays covering the portion of our income attributable to eligible machinery and equipment that were procured with cash infusions from our shareholders or after the capitalization of retained earnings through the issuance of stock dividends, and tax credits of 7% for the purchase of qualifying manufacturing equipment. We can continue to enjoy the tax holidays that have been granted to us by the R.O.C. tax authority. On April 16, 2010, the Legislative Yuan of R.O.C. passed the Industrial Innovation Act. Under the prevailing Industrial Innovation Act, effective from January 1, 2010 to December 31, 2029, a profit-seeking enterprise may deduct up to (i) 15% of its research and development expenditures from its income tax payable for the fiscal year in which these expenditures are incurred; or (ii) 10% of its research and development expenditures from its income tax payable for the fiscal year in which these expenditures are incurred or the following two years. However, the deduction may not exceed 30% of the income tax payable for that fiscal year. Under the Alternative Minimum Tax Act (the “AMT Act”) which took effect in January 2006 and was amended in August 2012, May 2017 and January 2021, when the amount of the regular income tax calculated pursuant to the Income Tax Law of the R.O.C. (the “Income Tax Law”) is below the amount of the alternative minimum tax, or the AMT, a taxpayer is required to pay the difference between the AMT and the said regular income tax, which becomes the AMT payable. Taxable income for calculating the AMT includes most sources of income that are exempted from income tax under various legislations such as tax holidays. However, there are grandfathered treatments for the tax holidays approved by the tax authority before the AMT Act took effect. Under the amended AMT Act, the standard deduction for taxable income that applies to business entities decreased from NT$2.0 million to NT$0.5 million and the tax rate that applies to business entities increased from 10% to 12%. The amendment to the AMT Act became effective on January 1, 2013. Under the amendment to the Income Tax Law, which became effective on January 1, 2018, the corporate income tax rate increased from 17% to 20%.
We are eligible for five-year tax holidays for income generated from construction and capacity expansions of production facilities. Since we have facilities located in export processing zones and bonded factories in Taiwan, we enjoy exemptions from various import duties, commodity taxes and business taxes on imported machinery, equipment, raw materials and components which are directly used for manufacturing finished goods. We also enjoy exemptions from commodity and business taxes on finished goods exported or sold to others within the zones. In addition, some of our P.R.C. subsidiaries qualified as high technology enterprises were entitled to a reduced income tax rate of 15% and were eligible to deduct certain research and development expenses from their taxable income.
We have filed a consolidated corporate income tax return starting from 2019 and a consolidated undistributed earnings tax since 2018 for all qualified domestic subsidiary companies with the tax authority in accordance with Article 45 of the R.O.C. Business Mergers and Acquisitions Act.
Before December 31, 2018, when we declare a dividend out of those undistributed earnings on which the 10% undistributed earnings tax had been paid, up to 50% of such undistributed earnings tax may be credited against the withholding tax imposed on the dividends paid to foreign shareholders. Under the amended Income Tax Law, which became effective on January 1, 2018, the tax rate on unappropriated earnings is reduced from 10% to 5%. In addition, to encourage profit-seeking enterprises to use their earnings to make substantial investment or upgrade production technology or the quality of products or services, a company uses a certain amount of its undistributed earnings to construct or purchase buildings, software or hardware equipment, or technology for use in production or operation as needed for operation of its business or ancillary business within three years from the year after such earnings are derived, such investment amounts may be deducted from the undistributed earnings in calculation of the current year’s undistributed earnings for assessment of additional profit-seeking enterprise income tax leviable on undistributed earnings from the year 2018 under Article
66-9
of the Income Tax Act. We have only deducted the amount of capital expenditure from the unappropriated earnings that has been reinvested when calculating the tax on unappropriated earnings based on this new amendment. However, we did not deduct such investment amounts from the undistributed earnings in calculation of income tax on unappropriated earnings in 2020 and 2021. In 2021, our effective income tax rate increased to 22% from 20% in 2020 primarily due to the higher additional income tax imposed on unappropriated earnings and capital gains tax that resulted from the gain on China site dispositions. We believe that our future estimated taxable income will be sufficient to utilize our deferred tax assets recorded as of December 31, 2021.
Our
non-R.O.C.
subsidiaries are subject to taxation in their respective jurisdiction. LIQUIDITY AND CAPITAL RESOURCES
As of December 31, 2021, our primary source of liquidity was NT$76,073.3 million (US$2,742.4 million) of cash and cash equivalents and NT$2,933.4 million (US$105.7 million) of financial assets – current, consisting mainly of quoted ordinary shares, unquoted preferred shares,
open-end
mutual funds, target redemption forward contracts, swap contracts and forward exchange contracts. As of December 31, 2021, we had total unused credit lines of NT$278,795.7 million (US$10,050.3 million). As of December 31, 2021, we had working capital of NT$75,112.4 million (US$2,707.7 million). 69
As of December 31, 2021, we had total debts of NT$227,176.1 million (US$8,189.5 million), of which NT$41,036.4 million (US$1,479.3 million) were short-term debts, NT$15,238.9 million (US$549.4 million) were current portion of long-term debts and NT$170,900.8 million (US$6,160.8 million) were long-term debts. In 2021, the maximum amount of our short-term and current portion of debts was NT$85,157.2 million (US$3,069.8 million) and the average amount of our short-term and current portion of debts was NT$58,582.0 million (US$2,111.8 million). The fluctuation was primarily because our working capital balance fluctuated during 2021 from time to time. The annual interest rate for borrowings under our short-term borrowings ranged from 0.40% to 3.75% as of December 31, 2021. Our short-term bank loans are primarily revolving facilities with a term of one year, each of which may be extended on an annual basis with lender consent. Our long-term debts consist of bonds payable, long-term debts (including bank borrowings and bills payable), and financial liabilities for hedging –
non-current
and lease liabilities – non-current.
Our long-term borrowings, including bank loans, bills payable and bonds payable, typically carried variable annual interest rates which ranged from 0.40% to 4.55% as of December 31, 2021. For the maturity information and interest rates by currencies, see “Item 11—Quantitative and Qualitative Disclosures about Market Risk—Market Risk—Interest Rate Risk.” We have historically been able to satisfy our working capital needs from our cash flow from operations. We have historically funded our capacity expansion from internally generated cash and, to the extent necessary, the issuance of equity securities and borrowings. If adequate funds are not available on satisfactory terms, we may be forced to curtail our expansion plans. Moreover, our ability to meet our working capital needs from cash flow from operations will be affected by the demand for our packaging services, testing services and EMS, which in turn may be affected by several factors. Many of these factors are outside of our control, such as economic downturns and declines in the prices of our services or products caused by a downturn in the industry. See “Item 3. Key Information—Risk Factors—Risks Relating to Our Business—Our operating results are subject to significant fluctuations, which could adversely affect the market value of your investment.” To the extent we do not generate sufficient cash flow from our operations to meet our cash requirements, we will have to rely on external financing.
We have provided a portion of our assets, with a carrying value of NT$23,942.7 million (US$863.1 million) as of December 31, 2021, as collateral to secure our obligations under our bank borrowings, tariff guarantees of imported raw materials or collateral.
Cash Flows
Year Ended December 31, |
||||||||||||||||
2019 |
2020 |
2021 |
||||||||||||||
NT$ |
NT$ |
NT$ |
US$ |
|||||||||||||
(in millions) |
||||||||||||||||
| Capital expenditures |
(56,810.2) |
(62,077.4) |
(70,905.7) |
(2,556.1) |
||||||||||||
| Net cash flows generated from (used in): |
||||||||||||||||
| Operating activities |
72,303.3 |
75,060.6 |
81,733.9 |
2,946.4 |
||||||||||||
| Investing activities |
(54,579.1) |
(60,946.3) |
(49,091.6) |
(1,769.7) |
||||||||||||
| Financing activities |
(6,498.8) |
(21,995.3) |
(5,870.8) |
(211.6) |
||||||||||||
Net cash generated from operating activities amounted to NT$81,733.9 million (US$2,946.4 million) in 2021, primarily as a result of (i) our operating performance with profit before income tax of NT$80,193.8 million (US$2,890.9 million) and (ii) our
non-cash
depreciation and amortization in the amount of NT$54,524.3 million (US$1,965.5 million), partially offset by the non-cash
gain on disposal of China subsidiaries of NT$17,340.4 million (US$625.1 million), and (iii) the changes in trade receivables, inventories and trade payables of NT$37,628.6 million (US$1,365.5 million). Net cash provided by operating activities amounted to NT$75,060.6 million in 2020, primarily as a result of (i) our operating performance with profit before income tax of NT$35,768.8 million and (ii) our non-cash
depreciation and amortization in the amount of NT$51,259.1 million. The increase in net cash generated from operating activities in 2021 compared to 2020 was primarily due to an increase in profit before income tax and cash inflows from increase in other current liabilities, partially offset by decrease in non-cash
gain on disposal of China subsidiaries and cash outflows from an increase in trade receivables and inventories. 70
Net cash used in investing activities amounted to NT$49,091.6 million (US$1,769.7 million) in 2021, primarily due to our net payment for property, plant and equipment of NT$69,300.7 million (US$2,498.2 million), partially offset by our proceeds from disposal of China subsidiaries of NT$23,941.3 million (US$863.1 million). Net cash used in investing activities amounted to NT$60,946.3 million in 2020, primarily due to our acquisition of subsidiaries of NT$8,745.6 million and our net payment for property, plant and equipment of NT$57,628.3 million partially offset by proceeds from disposal of subsidiaries and our investments accounted for using the equity method of NT$5,988.7 million.
Net cash used in financing activities amounted to NT$5,870.8 million (US$211.6 million) in 2021. This amount comprises net proceeds from short-term and long-term bank loans, bills payable and bonds payable in the amount of NT$22,343.2 million (US$805.5 million), the decrease in
non-controlling
interests in the amount of NT$6,400.2 million (US$230.7 million) primarily due to the financial cost from the USI Group repurchase of its outstanding shares, and the distribution of cash dividends in the amount of NT$18,082.5 million (US$651.9 million) as well as the payments for repurchase of ordinary shares of NT$5,529.3 million (US$199.3 million). Net cash used in financing activities amounted to NT$21,995.3 million in 2020. This amount comprises of net proceeds from short-term and long-term bank loans, bills payable and bonds payable in the amount of NT$8,285.3 million, decrease in non-controlling
interests in the amount of NT$6,291.1 million primarily due to the financial cost from the repurchases made by USI Enterprise Limited and USI Shanghai of their respective outstanding shares, as well as the distribution of cash dividends in the amount of NT$8,521.0 million. Contractual Obligations
The following table sets forth the maturity of our contractual obligations as of December 31, 2021.
Payments due to period |
||||||||||||||||||||
Total |
Less than 1 Year |
1 to 3 Years |
3 to 5 Years |
More than 5 Years |
||||||||||||||||
(in NT$ millions) |
||||||||||||||||||||
| Contractual Obligations: |
||||||||||||||||||||
| Long-term debt (1) |
185,063.5 | 16,215.9 | 132,046.5 | 23,885.1 | 12,916.0 | |||||||||||||||
| Lease liabilities (2) |
8,445.0 | 929.8 | 1,461.0 | 1,124.6 | 4,929.6 | |||||||||||||||
| Purchase obligations (3) |
35,992.9 | 35,992.9 | - | - | - | |||||||||||||||
| |
|
|
|
|
|
|
|
|
|
|||||||||||
| Total (4)(5)(6) |
229,501.4 | 53,138.6 | 133,507.5 | 25,009.7 | 17,845.6 | |||||||||||||||
| |
|
|
|
|
|
|
|
|
|
|||||||||||
| (1) | Includes long-term and current portion of borrowings, bills payable, bonds payable and financial liabilities for hedging – non-current (before the deduction of unamortized arrangement fees, unamortized issuance cost and discounts on bonds payable) and interest payments. |
| (2) | Represents our commitments under leases liabilities and imputed interest which are mainly from land and buildings and improvements. See Note 16 to our consolidated financial statements included in this annual report. |
| (3) | Represents material commitments to purchase machinery and equipment of approximately NT$37,208.3 million (US$1,341.3 million), of which NT$1,215.4 million (US$43.8 million) had been paid as of December 31, 2021. |
| (4) | Excludes material commitments for construction of approximately NT$15,470.3 million (US$557.7 million), of which NT$2,545.7 million (US$91.8 million) had been paid as of December 31, 2021 and the unpaid amounts that we were contracted for the construction related to our real estate business of approximately NT$0.1 million (US$0.0 million) as of December 31, 2021, since the schedule of payments is difficult to determine. |
| (5) | Excludes our unfunded defined benefit obligation since the schedule of payments is difficult to determine. Under defined benefit pension plans, we made pension contributions of approximately NT$542.6 million (US$19.6 million) in 2021, and we estimate that we will contribute approximately NT$595.9 million (US$21.5 million) in 2022. See Note 23 to our consolidated financial statements included in this annual report. |
| (6) | Excludes uncertain tax liabilities. We recognized additional taxes payable of NT$150.6 million (US$5.4 million) and accrued interest and penalties of NT$15.8 million (US$0.6 million) related to uncertain tax positions as of or for the year ended December 31, 2021. Because we were unable to make a reasonable estimate of the timing of the tax audits, such balances were not included in the table. |
We have in the past failed to comply with certain financial covenants in some of our loan agreements. Such noncompliance may also have, through broadly worded cross-default provisions, resulted in default under some of the agreements governing our other existing debt. As of December 31, 2021, we were not in breach of any of the financial covenants under our existing loan agreements. If we are unable to timely remedy any of our noncompliance under such loan agreements or obtain applicable waivers or amendments, we would breach our financial covenants and our financial condition would be adversely affected. See “Item 3. Key Information—Risk Factors—Risks Relating to Our Business—Restrictive covenants and broad default provisions in our existing debt agreements may materially restrict our operations as well as adversely affect our liquidity, financial condition and results of operations.”
71
As of December 31, 2021, we have no contingent obligations, which normally consist of guarantees provided by us to our subsidiaries.
Capital Expenditures
We have made, and expect to continue to make, substantial capital expenditures in connection with the expansion of our production capacity. The table below sets forth our principal capital expenditures incurred for the periods indicated.
Year Ended December 31, |
||||||||||||
2019 |
2020 |
2021 |
||||||||||
NT$ |
NT$ |
NT$ |
||||||||||
(in millions) |
||||||||||||
| Land |
- |
- |
1,126.0 |
|||||||||
| Building and improvements |
48,708.8 |
50,237.1 |
56,546.4 |
|||||||||
| Machinery and equipment |
14,365.1 |
8,787.1 |
16,745.1 |
|||||||||
| |
|
|
|
|
|
|||||||
| Total |
63,073.9 |
59,024.2 |
74,417.5 |
|||||||||
| |
|
|
|
|
|
|||||||
We had commitments for capital expenditures of approximately NT$52,678.6 million (US$1,899.0 million), of which NT$3,761.1 million (US$135.6 million) had been prepaid as of December 31, 2021, primarily in connection with the expansion of our packaging and testing services operations. We estimate that our environmental capital expenditures for 2022 will be approximately US$20.5 million, of which 47.8% will be used in climate change adaptation. We may adjust our capital expenditures based on market conditions, the progress of our expansion plans and cash flow from operations. In addition, due to the rapid changes in technology in the semiconductor industry, we frequently need to invest more in the land, building, factory as well as machinery and equipment, which may require us to raise additional capital. We cannot assure you that we will be able to raise additional capital should it become necessary on terms acceptable to us or at all. See “Item 3. Key Information—Risk Factors—Risks Relating to Our Business—The packaging and testing businesses are capital intensive. If we cannot obtain additional capital when we need it, our growth prospects and future profitability may be adversely affected.”
We believe that our existing cash, marketable securities, expected cash flow from operations and existing credit lines under our loan facilities will be sufficient to meet our capital expenditures, working capital, cash obligations under our existing debt and lease arrangements, and other requirements for at least the next 12 months. We currently hold cash primarily in U.S. dollars, RMB, New Taiwan dollars, Korean Won, Japanese yen and EUR. As of December 31, 2021, we had contractual obligations of NT$186,646.1 million (US$6,728.4 million) due in the next three years. We currently expect to meet our payment obligations through the expected cash flow from operations, long-term borrowings and the issuance of additional equity. We will continue to evaluate our capital structure and may decide from time to time to increase or decrease our financial leverage through equity offerings or borrowings. The issuance of additional equity securities may result in additional dilution to our shareholders.
From time to time, we evaluate possible investments, acquisitions or divestments and may, if a suitable opportunity arises, make an investment, acquisition or divestment.
Our exposure to financial market risks relates primarily to changes in interest rates and foreign currency exchange rates that arise from ordinary business operations. To mitigate these risks, we utilize derivative instruments. All derivative transactions entered into by us were designated as either hedging or trading. We have, from time to time, entered into interest rate swap transactions to hedge our interest rate exposure. In addition, we have, from time to time, entered into forward exchange contracts, swap contracts, cross-currency swap contracts and foreign currency options contracts to hedge our existing assets and liabilities denominated in foreign currencies. See “Item 11. Quantitative and Qualitative Disclosures about Market Risk” and Notes 7, 8 and 34 to our consolidated financial statements included in this annual report.
RESEARCH AND DEVELOPMENT
For 2020 and 2021, our research and development expenditures totaled approximately NT$19,302.4 million and NT$21,053.6 million (US$759.0 million), respectively. These expenditures represented approximately 4.0% and 3.7% of operating revenues in 2020 and 2021, respectively. As of December 31, 2021, we had a research and development team of 9,928 employees. We cultivate and maintain a research and development engineering team that continuously surveys and adapts to the latest trends in technology. Our research and development activities are primarily directed toward optimizing relevant technologies in key components, manufacturing processes, and product development. Our research and development objective is to enhance the performance of our products and drive greater business growth. To incentivize innovation and encourage our employees to engage in research and development, we offer cash rewards to employees that contribute significantly to our research efforts.
72
Packaging
We centralize our research and development efforts in packaging technology in our Kaohsiung and Taichung facilities in Taiwan. After initial phases of development, we conduct pilot runs in one of our facilities before new technologies or processes are implemented commercially at other sites. Facilities with special product expertise, such as ASE Korea, also conduct research and development of these specialized products and technologies at their sites. One of the areas of emphasis for our research and development efforts is improving the efficiency and technology of our packaging processes and these efforts are expected to continue. We are also investing significant research and development efforts into the development and adoption of innovative technology. We work closely with manufacturers of our packaging equipment and materials in designing and developing the equipment and materials used in our production process. We also collaborate with our significant customers to jointly develop new product and process technologies.
In addition to investing in the development of more advanced packaging technology and improving production efficiency, a significant portion of our research and development efforts is focused on the development of IC substrate production technology for BGA packaging. Substrate is the principal raw material for BGA packages. Development and production of IC substrates involve complex technology. We are currently working closely with certain first-tier substrate suppliers in Asia, primarily including those located in Japan, Taiwan, Korea and the P.R.C. We believe that our successful cooperation with substrate suppliers to enhance the overall substrate production capability and to meet future package requirements has enabled us to capture an increasingly important value-added component of the packaging process, helped ensure a stable and cost-effective supply of substrates for our BGA packaging operations and shortened time to market.
Testing
Our research and development efforts in testing have focused primarily on developing advanced testing solutions for mmWave, SiP, silicon photonics and optical sensor modules; characterization of semiconductors, layout design and electrical simulation for high-frequency test board and developing software of parametric test data analysis. With the maturity of advanced processes, the reliability becomes more and more stringent. High-power cooling system of “burn in” is developed to improve the reliability of products for customers. We also develop WiFi6e
low-cost
test technology, optical communication and millimeter wave test technology to meet the development needs of today’s wireless communication technology. Besides working closely with our customers on the leading-edge test technologies, our research and development operations also include an equipment development group, which currently designs testing hardware and software for specific semiconductors to offer our customers cost-effective test solutions. EMS
To further enhance the quality of our services and products, we focus on developing diversified and innovative products to improve our competitiveness. By leveraging our proprietary research and development expertise, we are able to optimize our product design, engineering and manufacturing capabilities to provide our customers with high-performance and cost-effective products and services. During the process of designing, as well as developing the technology for, our software and hardware, our research and development team also dedicates itself to discovering new
know-how,
and then applying such know-how
to create new, advanced and improved products, processes, methodology and services. We are currently investing in the development of products used in EMS in relation to computing and peripherals, communications, consumer products, automotive, industrial and server applications. TREND INFORMATION
Other than as disclosed elsewhere in this annual report, we are not aware of any trends, uncertainties, demands, commitments or events for the period from January 1, 2021 to December 31, 2021 that are reasonably likely to have a material effect on our operating revenues, income, profitability, liquidity or capital resources, or that caused the disclosed financial information to be not necessarily indicative of future operating results or financial conditions.
73
SAFE HARBOR
Please see the section entitled “Special Note Regarding Forward-Looking Statements.”
Item 6. Directors, Senior Management and Employees
DIRECTORS AND SENIOR MANAGEMENT
Directors
Our board of directors is elected by our shareholders in a shareholders’ meeting at which a quorum, consisting of a majority of all issued and outstanding common shares, not including treasury stocks and common shares held by our subsidiaries, is present. The chairman is elected by the board from among the directors. Our
13-member
board of directors, including three independent directors, is responsible for the management of our business. We currently have 13 directors, serving a three-year term. The current board of directors was elected in an annual general shareholders’ meeting on August 12, 2021 and began serving on August 13, 2021. Directors may serve any number of consecutive terms and may be removed from office at any time by a resolution adopted at a meeting of shareholders. Normally, all board members are elected at the same meeting of shareholders, except where the posts of
one-third
or more of the directors are vacant, at which time an extraordinary general shareholders’ meeting shall be convened to elect directors to fill the vacancies. We and our subsidiaries do not have service contracts with our directors that provide for benefits upon termination of employment. Audit Committee
Pursuant to the Article
14-4
of the R.O.C. Securities and Exchange Act, our audit committee was established on June 22, 2018 in lieu of supervisors to exercise the powers and duties of supervisors stipulated in the R.O.C. Company Law and other applicable laws and regulations. Our audit committee meets at least once every quarter but may meet at any time deemed necessary. Our board of directors has adopted an audit committee charter for the audit committee. Our audit committee’s responsibilities and powers include, but are not limited to, assistance with the board of directors in fulfilling its quality and integrity in supervising the implementation of relevant accounting, internal auditing, financial reporting procedures, and financial controls. In addition, in order to enhance corporate governance, the audit committee also takes responsibility for overseeing the policy and procedures for complaints and concerns regarding accounting, internal accounting controls, auditing matters, violations of Code of Business Conduct and Ethics or unethical conduct. Our audit committee currently consists of our independent directors, Shen-Fu Yu, Mei-Yueh
Ho and Wen-Chyi
Ong, who are independent under Rule 10A-3
and the R.O.C. Securities and Exchange Act and are financially literate with accounting or related financial management expertise, and our audit committee is entrusted with the same duties and responsibilities as set out in Rule 10A-3(b)
under the Exchange Act. Compensation Committee
Our compensation committee currently consists of
Shen-Fu
Yu and Wen-Chyi
Ong, our independent directors, and Hsiao-Ying Ku. Our board of directors established a compensation committee to satisfy the requirements under the R.O.C. Securities and Exchange Act. According to the Taiwan Stock Exchange Corporation Operation Directions for Compliance with the Establishment of Board of Directors by TWSE Listed Companies and the Board’s Exercise of Powers, a majority of compensation committee’s members shall be independent directors. In addition, according to the R.O.C Securities and Exchange Act and the Regulations Governing the Appointment and Exercise of Powers by the Remuneration Committee of a Company Whose Stock Is Listed on the TWSE or the Taipei Exchange, compensation committee members shall have at least one independent director. We do not assess the independence of our compensation committee member(s) under the independence requirements of the NYSE listing standards but adopt the independence standard as promulgated under the R.O.C. Regulations Governing the Appointment and Exercise of Powers by the Remuneration Committee of a Company Whose Stock Is Listed on the TWSE or the Taipei Exchange. See “Item 16G. Corporate Governance” for more information. Our compensation committee meets at least twice a year. Our board of directors has adopted a compensation committee charter for our compensation committee. The compensation committee has responsibility for, among other things, setting forth and reviewing policies, systems, standards and structures regarding performance evaluation and compensation of the directors, managerial personnel, and evaluating compensation of the directors and managerial personnel. 74
Risk Management Committee
Our risk management committee currently consists of
Shen-Fu
Yu, our independent director and the chair of our audit committee and compensation committee, Mei-Yueh
Ho, our independent director and member of our audit committee, and Du-Tsuen
Uang, our chief administration officer and chief corporate governance officer. In December 2019, our board of directors established a risk management committee, which comprises a majority of independent directors, and approved its charter to enable us to discover and preempt internal and external operational risks. On September 30, 2021, our board of directors reappointed the aforementioned committee members as the members of the second risk management committee. The risk management committee is responsible for overseeing overall risk management, implementing the decisions of the board of directors in connection to risk management, coordinating and promoting interdepartmental risk management plans, supervising and managing overall risk control and remedial mechanisms, and auditing and integrating each risk control report. The risk management committee files an annual report to our board of directors to inform the board about the status of risk management implementation and share insights for optimization. The following table sets forth information regarding all of our directors as of January 31, 2022. In accordance with R.O.C. law, each of our directors is elected either in his or her capacity as an individual or as an individual representative of a corporation or government. Persons designated to represent corporate or government shareholders as directors are nominated by such shareholders at the shareholders’ meeting and may be replaced as representatives by such shareholders at will. Of the current directors, nine represent ASE Enterprises Limited. The remaining directors serve in their capacity as individuals.
| Name |
Position |
Director Since |
Age |
Other Significant Positions Held Outside of ASEH | ||||
| Jason C.S. Chang (1)(2) |
Director and Chairman | 2018 | 77 | None | ||||
| Richard H.P. Chang (1)(2) |
Director, Vice Chairman and President | 2018 | 75 | Chairman, Sino Horizon Holdings Ltd. | ||||
| Chi-Wen Tsai(2) |
Director; Chairman and President, SPIL | 2018 | 74 | None | ||||
| Yen-Chun Chang(2) |
Director; Chief Operating Officer, SPIL | 2021 | 66 | None | ||||
| Tien Wu (2) |
Director and Chief Operating Officer | 2018 | 64 | None | ||||
| Joseph Tung (2) |
Director and Chief Financial Officer | 2018 | 63 | None | ||||
| Raymond Lo (2) |
Director; General Manager, Kaohsiung packaging facility | 2018 | 67 | None | ||||
| Tien-Szu Chen(2) |
Director; General Manager, ASE Inc. Chung-Li branch |
2018 | 60 | None | ||||
| Jeffrey Chen (2) |
Director; Chairman, Universal Scientific Industrial (Shanghai) Co., Ltd. | 2018 | 57 | Independent Director and a member of the compensation committee, Mercuries Associates Holding Ltd. | ||||
| Rutherford Chang (3) |
Director; General Manager, China Region of ASE Inc. | 2018 | 42 | None | ||||
| Shen-Fu Yu |
Independent Director and Member, Audit Committee, Compensation Committee and Risk Management Committee | 2018 | 77 | Independent Director, TaiGen Biopharmaceuticals Holdings Ltd. | ||||
| Mei-Yueh Ho |
Independent Director and Member, Audit Committee and Risk Management Committee | 2018 | 71 | Independent Director, KINPO Electronics Inc., AU Optronics Corp., Center Laboratories, Inc. and Onward Therapeutics SA | ||||
| Wen-Chyi Ong |
Independent Director and Member, Audit Committee and Compensation Committee | 2021 | 62 | Independent Director, Formosa Plastics Corporation |
75
| (1) | Jason C.S. Chang and Richard H.P. Chang are brothers. |
| (2) | Representative of ASE Enterprises Limited, a company organized under the laws of Hong Kong, which held 15.52% of our total outstanding shares as of January 31, 2022. All of the outstanding shares of ASE Enterprises Limited are held through intermediary holding companies and under a revocable trust established under the laws of the Bailiwick of Guernsey for the benefit of our Chairman, Jason C.S. Chang, and his family. |
| (3) | Rutherford Chang is the son of Jason C.S. Chang. |
Audit Committee
For a discussion of our audit committee, see “—Directors and Senior Management—Directors.”
Executive Officers
The following table sets forth information regarding all of our executive officers as of January 31, 2022.
| Name |
Position |
Years with the Company |
Age | |||
| Jason C.S. Chang |
Chairman |
37 | 77 | |||
| Richard H.P. Chang |
Vice Chairman and President |
37 | 75 | |||
| Chi-Wen Tsai |
Chairman and President, SPIL |
37 | 74 | |||
| Yen-Chun Chang |
Director and Chief Operating Officer, SPIL |
37 | 66 | |||
| Tien Wu |
Chief Operating Officer |
21 | 64 | |||
| Joseph Tung |
Chief Financial Officer |
27 | 63 | |||
| Raymond Lo |
General Manager, ASE Test Taiwan and Kaohsiung packaging facility |
35 | 67 | |||
| Tien-Szu Chen |
General Manager, ASE Inc. Chung-Li branch |
33 | 60 | |||
| Rutherford Chang |
General Manager, China Region of ASE Inc. |
16 | 42 | |||
| Du-Tsuen Uang |
Chief Administration Officer |
19 | 62 | |||
| Chun-Che Lee |
General Manager, ASE Electronics |
37 | 62 | |||
| Chung Lin |
General Manager, ASE Shanghai |
17 | 58 | |||
| Gichol Lee |
General Manager, ASE Korea |
24 | 59 | |||
| Chih-Hsiao Chung |
General Manager, ASE Japan and Wuxi Tongzhi |
22 | 57 | |||
| Kwai Mun Lee |
President, ASE South-East Asia operations |
23 | 59 | |||
| Yean Peng Chen |
General Manager, ASE Singapore Pte. Ltd. |
23 | 50 | |||
| Heng Ee Ooi |
General Manager, ASE Malaysia |
27 | 53 | |||
| Kenneth Hsiang |
Chief Executive Officer, ISE Labs and ISE Shanghai |
22 | 51 | |||
| Randy Hsiao-Yu Lo |
General Manager, Siliconware USA, Inc. |
21 | 65 | |||
| Kevin Yu |
General Manager, SZ |
26 | 48 | |||
| Jeffrey Chen |
Chairman, Universal Scientific Industrial (Shanghai) Co., Ltd. |
27 | 57 | |||
| Chen-Yen Wei |
Chairman, Universal Scientific Industrial Co., Ltd.; President, Universal Scientific Industrial; General Manager, UGTW | 42 | 67 | |||
| Jing Cao |
(Shanghai) Co., Ltd. General Manager, UGJQ |
6 | 62 | |||
| Ta-I Lin |
General Manager, UGKS |
34 | 58 | |||
| Yueh-Ming Lin |
General Manager, USISZ |
26 | 56 | |||
| Hui-Min Liu |
General Manager, UNIVERSAL SCIENTIFIC INDUSTRIAL (VIETNAM) CO., LTD. |
18 | 49 | |||
| Bernardo Santos Balderrama |
General Manager, USI Mexico |
2 | 53 | |||
| Gilles Benhamou |
Chief Executive Officer, ASTEELFLASH TECHNOLOGIE and Chairman, Asteelflash Suzhou Co., Ltd. | 22 | 68 | |||
| Ying Pin Wu |
General Manager, Asteelflash Suzhou Co., Ltd. |
13 | 55 |
Biographies of Directors and Executive Officers
Jason C.S. Chang
Richard H.P. Chang
76
Chi-Wen
TsaiYen-Chun
ChangTien Wu
Joseph Tung
Raymond Lo
Tien-Szu
ChenChung-Li
branch since August 2015. He has also served as a supervisor of ASE Inc. from June 2006 to June 2015 and president of PowerASE Technology Inc. from June 2006 to May 2012. Prior to joining ASE Inc. in June 1988, Mr. Chen worked at TSMC and Philips Semiconductor Kaohsiung. Mr. Chen holds a bachelor’s degree in Industrial Engineering from Chung Yuan Christian University in Taiwan. Jeffrey Chen
Rutherford Chang
Shen-Fu
YuMei-Yueh
Ho77
Wen-Chyi
OngDu-Tsuen
UangCheng-Chi
University in Taiwan. Chun-Che
LeeChung Lin
Gichol Lee
Chih-Hsiao Chung
Kwai Mun Lee
Yean Peng Chen
78
Heng Ee Ooi
Kenneth Hsiang
Randy
Hsiao-Yu
LoKevin Yu
Chen-Yen
WeiJing Cao
Ta-I
LinYueh-Ming Lin
Hui-Min
LiuBernardo Santos Balderrama
Gilles Benhamou
Ying Pin Wu
79
The business address of our directors and executive officers is our registered office.
COMPENSATION
In 2021, we recorded expenses of approximately NT$1,912.1 million (US$68.9 million) as remuneration to our directors and executive officers. In 2021, we accrued pension costs of NT$32.8 million (US$1.2 million) for retirement benefits for our management.
According to our Articles of Incorporation, the remuneration of our independent directors is set at NT$3.0 million (US$0.1 million) per person per year. We set aside 0.01% to 1.00% of net profit before income tax, employees’ compensation and remuneration to the directors as employees’ compensation and no more than 0.75% as remuneration to the directors. We recorded NT$195.1 million (US$7.0 million) as compensation to our employees for the year ended December 31, 2021. If there is a change in the proposed amounts after the consolidated financial statement authorized for issue, the differences are recorded as a change in accounting estimate and will be adjusted in the following year. We have not provided any loans to, or guarantees for, the benefit of any of our directors or executive officers. For information regarding our pension and other retirement plans and those of our subsidiaries, see Note 23 to our consolidated financial statements included in this annual report.
Employee Compensation
We award bonuses to employees of ASEH and its subsidiaries who are located in Taiwan based on overall income and individual performance targets. Employees are eligible to receive bonuses in the form of our common shares valued at the closing price (after adjustment with consideration of the effects on the share price, if any, brought by cash and stock dividends resolved at shareholders’ meetings) of our common shares on the day prior to our meeting of the board of directors. Actual amounts of compensation to individual employees are determined based upon the employee meeting specified individual performance objectives. We recorded NT$121.9 million (US$4.4 million) as compensation to our employees for the year ended December 31, 2021. If there is a change in the proposed amounts after the consolidated financial statement authorized for issue, the differences are recorded as a change in accounting estimate and will be adjusted in the following year.
Share-Based Payment Arrangements
ASEH Employee Share Option Plans
ASE maintained 2010 and 2015 employee stock option plans before the SPIL Acquisition. ASEH assumed ASE’s obligations of share options, which were granted before entering into and executing the Joint Share Exchange Agreement on April 30, 2018. In August 2018, our board of directors and FSC both approved the first ASEH employee share option plan, under which 131,863 thousand options were granted in November 2018. The total number of options registered under this option plan is 150,000 thousand options. The 2010 employee stock option plan has been forfeited or exercised during 2021, as a result, ASEH currently maintains two employee stock option plans, adopted in 2015 and 2018.
Pursuant to these plans, our full-time employees are eligible to receive stock option grants. Each share option represents the right to purchase one ordinary share of the Company when exercised. Under the terms of the plan, share options are granted at an exercise price equal to or not less than the closing price of the ordinary shares listed on the TWSE at the issue date. The right of those share options granted under the plan is valid for 10 years,
non-transferable
and exercisable at certain percentages subsequent to the second anniversary of the grant date. For any subsequent changes in the Company’s capital structure or when cash dividend per ordinary share exceeds 1.5% of the market price per ordinary share, the exercise price is accordingly adjusted. As of December 31, 2021, a total of 10,173 thousand options were outstanding with an exercise price of NT$73.0 per share under the 2015 plan. As of December 31, 2021, a total of 86,629 thousand options were outstanding with an exercise price of NT$51.0 per share under the 2018 plan.
80
ASEH Employee Restricted Stock Awards Plan
In August 2021, ASEH adopted the 2021 restricted stock awards plan, or the 2021 RSA Plan, and proposed to grant up to 15 million common shares, or the 2021 RSAs, at gratitude, to its employees, including domestic and foreign subsidiaries. Directors who are
non-employees
and/or individual(s) holding more than 10% of the common shares of ASEH are not eligible to participate in the 2021 RSA Plan. The 2021 RSAs granted to eligible participants will be issued in the name of a custodian and deposit in a trust account pursuant to (i) a custodian agreement entered between the trustee and ASEH and (ii) a power of attorney issued by the eligible participant to ASEH in relation to the custodian agreement. The 2021 RSAs deposited in the trust account are subject to forfeiture restrictions, for example, they are
non-transferrable,
redeemable or revocable by ASEH upon termination of employment and/or upon material breach of employment agreement, or if the eligible participant failing to reach specific performance targets. Vesting of the 2021 RSAs to the eligible participant is subject to personal performance targets and ASEH’s operation objectives, as specified under the 2021 RSA Plan. In three years after the date of issuance, the maximum number of 2021 RSAs that can vest each year is limited to one-third
of the total 2021 RSAs granted for each participant. Eligible participants will be entitled to certain economic benefits, same as the other common shares’ holders, of the unvested 2021 RSAs, including stock dividends, cash dividends, rights to receive from legal reserve and capital surplus, and stock options at cash capital increase, which benefits will be accrued in the trust account and transfer to the participant upon vesting. As of December 31, 2021, all of the 2021 RSAs under the 2021 RSA Plan have been granted to the eligible participants and issued pursuant to the custodian agreement, of which a total of 15 million 2021 RSAs remain unvested. USI Enterprise Limited Share Option Plans
USI Enterprise Limited maintained three option plans adopted in 2007, 2010 and 2011, under which certain employees of Universal Scientific Industrial and our employees were granted options to purchase common shares of USI Enterprise Limited. Each option under these three plans is valid for 10 to 13 years from the date of the grant. All options granted under this plan have been forfeited or exercised during 2020.
USI Shanghai Option Plans and Restricted Stock Plans
As of December 31, 2021, USI Shanghai maintained six option plans: three share option plans in 2015, 2019 and 2020, as well as, three restricted stock plans in 2019, 2020 and 2021.
Under the share option plan in 2015, certain employees of USI Shanghai are granted options to purchase ordinary shares of USI Shanghai at an exercise price of RMB15.5 per share. Each option is valid for 10 years from the date of the grant.
In November 2019, USI Shanghai adopted the first share option plan and granted 17,167 thousand share options to its employees. Each unit represents the right to purchase one ordinary share of USI Shanghai when exercised. The options are valid for 3.0 years, 4.0 years and 5.0 years, respectively, and are exercisable at certain percentages within 12 months subsequent to the second, the third and the fourth anniversary of the grant date under the satisfaction of certain performance conditions within each respective vesting period.
In November 2019, USI Shanghai adopted the first restricted stock plan and granted 6,156 thousand ordinary shares to its directors (excluding independent directors), supervisors and employees. In April 2020, the board of directors further resolved to grant 6,403 thousand ordinary shares instead, while other terms remain constant. The plan was of three phases starting from 2019 and each phase lasts for one year with a valid period of 4.5 years, 3.5 years and 2.5 years, respectively. Upon satisfaction of certain performance conditions in each phase, participants are entitled to subscribe a certain percentage of the total USI Shanghai’s ordinary shares issued under the plan with a
lock-up
period of one year. The valid period may be terminated early or extended prior to one month of the expiration date depending on the conditions of ordinary shares granted. In the event that USI Shanghai increases share capital by capital surplus or by cash, or distributes share dividends or cash dividends, the exercise price is accordingly adjusted. In September 2020, USI Shanghai adopted the second share option plan and granted 1,140 thousand share options to its employees. The conditions of these issued share options are the same as share options plan that issued in 2019, except that the options are valid for 2.2 years, 3.2 years and 4.2 years, respectively and with each respective vesting period of 1.2 years, 2.2 years and 3.2 years.
81
In September 2020, USI Shanghai adopted the second restricted stock plan and granted 425 thousand ordinary shares to its employees. The conditions of these issued restricted stocks are the same as the restricted stocks plan that issued in 2019, except that the restricted stocks are valid for 2 years and the ordinary shares that USI Shanghai would issue to participants are with a
lock-up
period of 1.3 years. In September 2021, USI Shanghai adopted the third restricted stock plan and granted 281 thousand ordinary shares to its expatriate staff. The conditions of issued 2021 restricted stocks are the same as 2020 restricted stocks plan.
As of December 31, 2021, USI Shanghai had 33,051 thousand options outstanding which consists of (i) 29,486 thousand options which were outstanding under the share option plan, 12,919 thousand options of which had an exercise price of RMB15.5 per share under the share option plan in 2015, 15,577 thousand options of which has an exercise price of RMB12.7 per share under the share option plan in 2019 and 990 thousand options of which has an exercise price of RMB21.2 per share under the share option plan in 2020 and (ii) 3,565 thousand options were outstanding under restricted stock plan, 2,881 thousand options of which has an exercise price of RMB12.7 per share under the share option plan in 2019, 403 thousand options of which has an exercise price of nil per share under the restricted stock plan in 2020 and 281 thousand options of which has an exercise price of nil per share under the restricted stock plan in 2021.
BOARD PRACTICES
General
For a discussion of the term of office of the board of directors, see “—Directors and Senior Management.” No benefits are payable to members of the board or the executive officers upon termination of their relationship with us.
Compensation Committee
For a discussion of our compensation committee, see “—Directors and Senior Management—Directors.”
EMPLOYEES
The following table sets forth certain information concerning our employees as of the dates indicated.
| As of December 31, |
||||||||||||
| 2019 |
2020 |
2021 |
||||||||||
| Total |
96,528 | 101,981 | 95,727 | |||||||||
| Function |
||||||||||||
| Direct labor |
51,389 | 55,878 | 50,352 | |||||||||
| Indirect labor (manufacturing) |
26,335 | 26,673 | 27,446 | |||||||||
| Indirect labor (administration) |
8,036 | 8,540 | 8,001 | |||||||||
| Research and development |
10,768 | 10,890 | 9,928 | |||||||||
| Location |
||||||||||||
| Taiwan |
57,543 | 58,421 | 59,315 | |||||||||
| P.R.C. |
28,920 | 30,025 | 21,816 | |||||||||
| Korea |
2,472 | 2,765 | 2,638 | |||||||||
| Malaysia |
3,493 | 3,403 | 3,590 | |||||||||
| Mexico |
2,419 | 2,716 | 2,776 | |||||||||
| Singapore |
781 | 795 | 797 | |||||||||
| Japan |
362 | 410 | 545 | |||||||||
| Vietnam |
– | – | 573 | |||||||||
| United States |
426 | 594 | 560 | |||||||||
| Poland |
112 | 141 | 159 | |||||||||
| Tunisia |
– | 1,051 | 1,155 | |||||||||
| Germany |
– | 575 | 561 | |||||||||
| France |
– | 829 | 955 | |||||||||
| Czech Republic |
– | 148 | 182 | |||||||||
| United Kingdom |
– | 108 | 100 | |||||||||
| Belgium |
– | – | 5 | |||||||||
Eligible employees may participate in our employee share bonus plan, stock option plans, restricted stock awards plan, and our subsidiaries’ share option plans, such as the option plans adopted by USI Shanghai. See “—Compensation.”
82
We have never experienced a work stoppage caused by our employees. We believe that our relationship with our employees is good.
SHARE OWNERSHIP
The following table sets forth certain information with respect to our common shares and options of ASEH exercisable for our common shares held by our directors and executive officers as of January 31, 2022. Percentage of beneficial ownership is based on 4,410,443,432 common shares outstanding as of January 31, 2022.
| Director or Executive Officer |
Number of ASEH Common Shares Beneficially Held (1) |
Percentage of ASEH Total Common Shares Issued and Outstanding |
Number of Options Exercisable (2) |
Exercise Price of Options (NT$) |
Expiration Date of Options | |||||||||||
| Jason C.S. Chang |
949,352,706 (3) |
21.53% | 1,800,000 | 51 | 2028/11/23 | |||||||||||
| Richard H. P. Chang |
124,175,228 | 2.82% | 1,800,000 | 51 | 2028/11/23 | |||||||||||
| Chi-Wen Tsai |
13,400,000 | * | 0 | – | – | |||||||||||
| Yen-Chun Chang |
940,000 | * | * | 51 | 2028/11/23 | |||||||||||
| Tien Wu |
3,877,473 | * | * | 51 | 2028/11/23 | |||||||||||
| Joseph Tung |
2,740,411 | * | * | 51 | 2028/11/23 | |||||||||||
| Raymond Lo |
2,283,430 | * | * | 51 | 2028/11/23 | |||||||||||
| Tien-Szu Chen |
1,581,821 | * | 0 | – | – | |||||||||||
| Jeffrey Chen |
1,083,000 | * | * | 51 | 2028/11/23 | |||||||||||
| Rutherford Chang |
1,577,647 | * | * | 51 | 2028/11/23 | |||||||||||
| Shen-Fu Yu |
2,388 | * | 0 | – | – | |||||||||||
| Mei-Yueh Ho |
0 | 0.00% | 0 | – | – | |||||||||||
| Wen-Chyi Ong |
0 | 0.00% | 0 | – | – | |||||||||||
| Du-Tsuen Uang |
90,000 | * | * | 51 | 2028/11/23 | |||||||||||
| Chun-Che Lee |
2,662,251 | * | 0 | – | – | |||||||||||
| Chung Lin |
17,278 | * | * | 51 | 2028/11/23 | |||||||||||
| Gichol Lee |
0 | 0.00% | 0 | – | – | |||||||||||
| Chih-Hsiao Chung |
340,489 | * | * | 51 | 2028/11/23 | |||||||||||
| Kwai Mun Lee |
0 | 0.00% | 0 | – | – | |||||||||||
| Yean Peng Chen |
0 | 0.00% | 0 | – | – | |||||||||||
| Heng Ee Ooi |
0 | 0.00% | 0 | – | – | |||||||||||
| Kenneth Hsiang |
0 | 0.00% | * | 51 | 2028/11/23 | |||||||||||
| Randy Hsiao-Yu Lo |
0 | 0.00% | * | 51 | 2028/11/23 | |||||||||||
| Kevin Yu |
132,000 | * | * | 51 | 2028/11/23 | |||||||||||
| Chen-Yen Wei |
366,115 | * | 0 | – | – | |||||||||||
| Jing Cao |
0 | 0.00% | 0 | – | – | |||||||||||
| Ta-I Lin |
0 | 0.00% | 0 | – | – | |||||||||||
| Yueh-Ming Lin |
0 | 0.00% | 0 | – | – | |||||||||||
| Hui-Min Liu |
0 | 0.00% | 0 | – | – | |||||||||||
| Bernardo Santos Balderrama |
0 | 0.00% | 0 | – | – | |||||||||||
| Gilles Benhamou |
0 | 0.00% | 0 | – | – | |||||||||||
| Ying Pin Wu |
0 | 0.00% | 0 | – | – | |||||||||||
| (1) | Including shares directly held and shares beneficially owned through spouse and minor children. |
| (2) | Each option may be converted into one of our common shares. The figures referred herein include options convertible into our common shares scheduled to vest within 60 days as of the date hereof. |
| (3) | Including 684,327,886 common shares Jason C.S. Chang beneficially owned through ASE Enterprises Limited, Aintree Limited and JC Holdings Limited and 265,024,820 common shares beneficially owned through Value Tower Limited and JC Holdings Limited. See “Item 7. Major Shareholders and Related Party Transactions—Major Shareholders.” |
| * | The sum of the number of common shares held and the number of common shares issuable upon exercise of all options held is less than 1.0% of our total outstanding shares |
Item 7. Major Shareholders and Related Party Transactions
MAJOR SHAREHOLDERS
The following table sets forth information known to us with respect to the beneficial ownership of our common shares, as of January 31, 2022, by each shareholder known by us to beneficially own more than 5.0% of our total outstanding shares.
83
Beneficial ownership is determined in accordance with the rules and regulations of the SEC. Percentage of beneficial ownership is calculated based on 4,410,443,432 common shares outstanding as of January 31, 2022. In addition, in computing the number of shares beneficially owned by a person and the percentage ownership of that person, we have included shares that the person has the right to acquire within 60 days, including through the exercise of any option, warrant or other right or the conversion of any other security. These shares, however, are not included in the computation of the percentage ownership of any other person.
| Name of Shareholder |
Common Shares Beneficially Owned |
|||||||
Number |
Percentage |
|||||||
| Jason C.S. Chang (1) |
949,352,706 | 21.53% | ||||||
| (1) | Jason C.S. Chang is our chairman. Jason C.S. Chang beneficially owned 684,327,886 common shares through ASE Enterprises Limited, Aintree Limited and JC Holdings Limited, and 265,024,820 common shares through Value Tower Limited and JC Holdings Limited. As a result, Jason C.S. Chang beneficially owned 949,352,706 common shares, representing 21.53% of our total outstanding shares (based on 4,410,443,432 common shares as of January 31, 2022). ASE Enterprises Limited is a company organized under the laws of Hong Kong. All of the outstanding shares of ASE Enterprises Limited are held by Aintree Limited. Aintree Limited is a company organized under the laws of the British Virgin Islands. All of the shares of Aintree Limited are held by JC Holdings Limited. Value Tower Limited is a company organized under the laws of the British Virgin Islands. Jason C.S. Chang is the sole director of Value Tower Limited and JC Holdings Limited is the sole shareholder of Value Tower Limited. The shares of JC Holdings Limited are held through intermediary holding companies and under a revocable trust established under the laws of the Bailiwick of Guernsey for the benefit of our chairman, Jason C.S. Chang, and his family. There were no significant changes in the percentage of ownership beneficially owned by Jason C.S. Chang in 2019, 2020 and 2021. |
The following table sets forth information relating to our common shares held directly by our consolidated subsidiaries and our equity method investee as of January 31, 2022.
| Name of Shareholder |
Common Shares Beneficially Owned |
|||||||
Number |
Percentage |
|||||||
| ASE Test (1) |
44,100,236 | 1.00% | ||||||
| ASE Test Taiwan (2) |
5,489,388 | 0.12% | ||||||
| JR Holding Limited (3) |
23,351,881 | 0.53% | ||||||
| Hung Ching (4) |
44,130,751 | 1.00% | ||||||
| (1) | ASE Test is our wholly owned subsidiary. ASE Test’s ownership of our common shares is the result of the merger of ASE Chung Li with and into us in August 2004, and subsequent dividends upon shares received in connection with this merger. In order to comply with Singapore Companies Act, a trust was established to hold and dispose our common shares issued to ASE Test, a Singaporean Company, upon completion of the merger. The trustee appointed under such trust arrangement is currently a registered shareholder for our common shares issued to ASE Test. See “—Related Party Transactions.” |
| (2) | ASE Test Taiwan is our wholly owned subsidiary. ASE Test Taiwan’s ownership of our common shares is mainly the result of the merger of ASE Material with and into us in August 2004, and subsequent dividends upon shares received in connection with this merger. In order to comply with Singapore Companies Act, a trust had been established to hold and dispose our common shares issued to ASE Test Taiwan, which had been a subsidiary of ASE Test, upon completion of the merger. In December 2014, the trust established to hold the common shares issued to ASE Test Taiwan had been terminated because ASE Test Taiwan was no longer a subsidiary owned by ASE Test and therefore no longer subject to Singapore Companies Act requirements. As a result, ASE Test Taiwan directly owned 5,489,388 of our common shares as of January 31, 2022. See “—Related Party Transactions.” |
| (3) | JR Holding Limited is our wholly owned subsidiary. JR Holding Limited’s ownership of our common shares is the result of the merger of ASE Chung Li with and into us in August 2004, and subsequent dividends upon shares received in connection with this merger. |
84
| (4) | Hung Ching is our equity method investee. As of January 31, 2022, we held 26.2% of the outstanding shares of Hung Ching. Hung Ching acquired our common shares in open market transactions, subsequent dividends upon the acquired shares and shares purchased pursuant to the rights offered by the Company. |
As of January 31, 2022, none of our major shareholders had voting rights different from those of our other shareholders. We are not aware of any arrangement that may at a subsequent date result in a change of control of us. Furthermore, other than disclosed above, we are not aware of any significant changes in the percentage of ownership held by our major shareholders in 2019, 2020 and 2021.
As of January 31, 2022, a total of 4,410,443,432 common shares were outstanding. With certain limited exceptions, holders of common shares that are not R.O.C. persons are required to hold their common shares through a brokerage account in the R.O.C. As of January 31, 2022, 314,328,372 common shares were registered in the name of a nominee of Citibank, N.A. the depositary under our ADS deposit agreement. Citibank, N.A., has advised us that, as of January 31, 2022, 157,164,010 ADSs, representing 314,328,020 common shares, were held of record by Cede Co., and 176 ADSs, representing 352 common shares, were held by six other U.S. persons.
RELATED PARTY TRANSACTIONS
In recent years, we have awarded cash bonuses to the employees of our subsidiaries as part of their compensation, based in part on our consolidated net income and the subsidiaries’ contribution to our consolidated income. We expect to continue this practice in the future.
In order to comply with Singapore law and other applicable laws and regulations, trusts organized under R.O.C. law were established to hold and dispose of our common shares issued to ASE Test and ASE Test Taiwan in connection with the merger of ASE Chung Li and ASE Material into our company in August 2004. Under Section 76(1)(b)(ii) of Singapore’s Companies Act, Chapter 50, ASE Test, a Singapore company, may not purport to acquire, directly or indirectly, shares or units of shares in our company, ASE Test’s parent company. Pursuant to the applicable trust agreements, the trustee under each trust is (1) the registered owner of our common shares, (2) authorized to exercise all of the rights as a shareholder of our common shares, (3) authorized to sell our common shares, subject to market conditions, when such common shares become available for resale under R.O.C. law and in accordance with volume limitations under R.O.C. law, at its sole discretion; provided such common shares are sold (i) in compliance with R.O.C. laws and regulations, (ii) in an orderly manner in order to minimize the impact on the trading price of our common shares, and (iii) in a manner consistent with its fiduciary duties owed to ASE Test, and (4) able to transfer and deliver to ASE Test or ASE Test Taiwan the proceeds from the sale of our common shares and any cash dividends distributed, as the case may be. In February 2010, to complete the tender offer to acquire Universal Scientific Industrial, ASE Test transferred 141,808,499 shares to the shareholders of Universal Scientific Industrial. Neither ASE Test nor ASE Test Taiwan have any rights with respect to our common shares held in trust pursuant to the applicable trust agreements other than the right to receive the proceeds from the sale of such common shares and cash dividends declared while the shares remain in trust. In December 2014, the trust established to hold the common shares issued to ASE Test Taiwan had been terminated because ASE Test Taiwan was no longer a subsidiary owned by ASE Test and therefore no longer subject to the Singapore Companies Act requirements. As a result, ASE Test Taiwan directly owned 5,489,388 of our common shares as of January 31, 2022 and the trust established to hold the common shares issued to ASE Test held 44,100,236 of our common shares.
In order to demonstrate our commitment to environmental protection, in December 2013, ASE’s board of directors approved contributions to environmental protection efforts in Taiwan in a total amount of not less than NT$3,000.0 million, to be made in the next 30 years. For of the year ended 2021, we have made contributions in the amount of NT$100.0 million (US$3.6 million) through the ASE Environmental Protection and Sustainability Foundation to continuously implement the activities related to environmental protection projects.
In 2021, in consideration of corporate social responsibility, the board of directors approved the contributions of NT$10.0 million (US$0.4 million) to ASE Cultural and Educational Foundation for promoting the cultural and educational public welfare activities.
In the third quarter of 2021, ASE purchased real estate properties from HC, with an amount of NT$2,362.0 million (US$85.1 million) (tax excluded) which was primarily based on the independent professional appraisal reports and has been fully paid.
85
The subsidiaries, ASE and ASEE, separately entered into a joint construction and allocation of housing units agreement with HC in August 2021. The agreement stipulates that ASE and ASEE will provide land or leasehold land and fund to HC for plant construction and to allocate those housing units based on the independent professional appraisal reports. After the completion of the plant construction, ASE, ASEE and its affiliates will have the priority to purchase the plant.
USIE repurchased its own 2,271 thousand ordinary shares from the Group’s key management personnel with approximately NT$1,081.2 million (US$39.0 million) in December 2021.
INTERESTS OF EXPERTS AND COUNSEL
Not applicable.
Item 8. Financial Information
CONSOLIDATED STATEMENTS AND OTHER FINANCIAL INFORMATION
Consolidated financial statements are set forth under “Item 18. Financial Statements.”
Export Sales
We categorize our revenues geographically based on the country in which the customer is headquartered. Revenues from our export sales were NT$361,937.7 million, NT$412,149.4 million and NT$475,399.1 million (US$17,137.7 million) in 2019, 2020 and 2021, respectively, which contributed 87.6%, 86.4% and 83.4% of our total sales volume for those periods, respectively. See “Item 4. Information on the Company—Business Overview—Sales and Marketing” for information on our export sales.
Legal Proceedings
K7 Plant Wastewater Discharge
On December 20, 2013, the KEPB imposed an administrative fine of NT$102.0 million (the “Original Fine”) upon us for violation of the Water Pollution Control Act. After we sought administrative remedies against the Original Fine, the Original Fine was revoked by final judgment of Supreme Administrative Court on June 8, 2017, and KEPB was ordered to refund the Original Fine to us. On December 27, 2019, KEPB refunded NT$55.1 million to us. On February 10, 2020, KEPB reimposed an administrative fine of NT$47.0 million (the “New Fine”) upon us and offset the New Fine by the remaining amount which shall be refunded to us, therefore no additional payment that we should make for the New Fine. After we filed an administrative appeal against the New Fine, the Administrative Appeal Review Committee of Kaohsiung City Government has revoked the New Fine on December 15, 2020 and remanded to KEPB for another legitimate administrative action.
Broadcom Patent Dispute
In May 2019, Broadcom Corporation, Broadcom Singapore Pte. Ltd. and Broadcom Limited (collectively “Broadcom”) filed a request for arbitration with the American Arbitration Association for a dispute over a Semiconductor Packaging Agreement that Broadcom and SPIL entered into in September 2012 (the “Semiconductor Packaging Agreement”). The Semiconductor Packaging Agreement stipulates that in the event the products provided by SPIL to Broadcom infringe upon third-party patent rights, SPIL must indemnify Broadcom for relevant loss suffered. In connection to the 2016 patent dispute between Broadcom and Tessera, Broadcom requested SPIL to indemnify Broadcom pursuant to the Semiconductor Packaging Agreement. In February 2020, Broadcom and SPIL settled this matter for a total amount of US$5.0 million.
Waste Disposal Discharge
Five employees and a waste disposal supplier of a subsidiary in China were accused by the Procuratorate of committing the crime of environmental pollution in 2018. During the trial, the Procuratorate claimed that the subsidiary should also be charged with corporate crime which caused the subsidiary received a change and addition indictment in October 2019. In June 2020, in the first trial, the court of first instance ruled that the subsidiary shall be imposed a fine of RMB400 thousand and return the benefit (RMB344 thousand) generated from such violation. Both of the fine and the return of benefit from violation were recognized by the subsidiary under the line item of other gains and losses. Because some of
co-defendants
have filed an appeal against the judgment and, pursuant to local applicable law, the whole case will be deemed appealed. This case was denied by the court of second instance, which affirmed the judgment of the first instance, on April 7, 2021. The case was concluded. 86
Any penalties, fines, damages or settlements made in connection with these criminal, civil, and/or administrative investigations and/or lawsuits may divert management’s attention and resources, which may cause a material adverse effect on our results of operations, financial condition and business. We are also unable to quantify the harm to our reputation should any adverse findings be made against us. See “Item 3. Key Information—Risk Factors—Risks Relating to Our Business—Any environmental claims or failure to comply with any present or future environmental regulations, as well as any fire or other industrial accident, may require us to spend additional funds and may materially and adversely affect our financial condition and results of operations,” and “Item 4. Information on the Company—Business Overview—Environmental Matters.”
Dividends and Dividend Policy
The following table sets forth the stock dividends paid during each of the years indicated and related information.
Cash Dividends per Common Share |
Stock Dividends per Common Share |
Total Common Shares Issued as Stock Dividends |
Outstanding Common Shares on Record Date (1) |
Percentage of Outstanding Common Shares Represented by Stock Dividends | ||||||||
NT$ |
NT$ |
|||||||||||
| 2017 |
1.40 | – | – | 8,405,972,044 | – | |||||||
| 2018 |
2.50 (2) |
– | – | 4,319,674,282 | – | |||||||
| 2019 |
2.50 | – | – | 4,324,861,082 | – | |||||||
| 2020 |
2.00 | – | – | 4,338,439,132 | – | |||||||
| 2021 |
4.20 | – | – | 4,378,537,032 | – | |||||||
| (1) | Aggregate number of common shares outstanding on the record date applicable to the dividend payment. Includes common shares issued in the previous year under our employee bonus plan. |
| (2) | Cash dividend from capital surplus. ASEH, the continuing entity of ASE, was established on April 30, 2018 and as such has no retained earnings. In June 2018, to protect shareholder’s interest, we resolved to distribute cash from capital surplus that was assumed from ASE’s retained earnings and generated from the Share Exchange process. |
In order to meet the needs of our present and future capital expenditures, we anticipate paying both stock and cash dividends in the future. The form, frequency and amount of future cash or stock dividends on our common shares will depend upon our net income, cash flow, financial condition, shareholders’ requirement for cash inflow and other factors. According to our Articles of Incorporation, we have a general policy that cash dividend distribution shall not be less than 30% of the total dividend amount and the residual dividends shall be distributed in form of stocks in accordance with the distribution plan proposed by the board of directors and resolved by the general shareholders’ meeting.
In general, we are not permitted to distribute dividends or make other distributions to shareholders in any given year in which we did not have either earnings or retained earnings. Before distribution of dividends, we shall offset the losses incurred in prior years and set aside 10% of remaining net earnings as a legal reserve until the accumulated legal reserve equals our
paid-in
capital, and then allocate or reverse a special surplus reserve in accordance with laws or regulations set forth by the authorities concerned. The remainder plus the undistributed earnings shall be distributed in accordance with the proposal submitted by the board of directors and adopted by the general meeting of shareholders. However, when earnings are distributed as cash dividends, this may be approved by the majority of the directors at a Board meeting in which over two-thirds
of the directors are present, and then reported to the shareholders’ meeting. 87
According to our Articles of Incorporation, the remuneration of our independent directors is set at NT$3.0 million (US$0.1 million) per person per year. For those that do not serve a full year, the remuneration will be calculated in proportion to the number of days of the term that were actually served. The additional remuneration of the Company’s independent directors who are also the members of the Company’s compensation committee is set at NT$360 thousand per person annually. For those that do not serve a full year, the additional remuneration will be calculated in proportion to the number of days of the term that were actually served. In addition if we are profitable, we set aside 0.01% to 1.00% of the profits as compensation to employees and 0.75% or less of the profits should be allocated as compensation to directors. While we have accumulated losses, the profit shall be set aside to compensate losses before distribution.
See “Item 10. Additional information—Articles of Incorporation—Dividends and Distributions.”
Holders of ADSs will be entitled to receive dividends, subject to the terms of the deposit agreement, to the same extent as the holders of our common shares. Cash dividends will be paid to the depositary in NT dollars and, except as otherwise provided in the deposit agreement, will be converted by the depositary into U.S. dollars and paid to holders of ADSs according to the terms of the deposit agreement. Stock dividends will be distributed to the depositary and, except as otherwise provided in the deposit agreement, will be distributed by the depositary, in the form of additional ADSs, to holders of ADSs according to the terms of the deposit agreement.
Holders of outstanding common shares on a dividend record date will be entitled to the full dividend declared without regard to any prior or subsequent transfer of common shares. Holders of outstanding ADSs are entitled to receive dividends, subject to the terms of the deposit agreement, to the same extent as the holders of outstanding common shares.
For information relating to R.O.C. withholding taxes payable on dividends, see “Item 10. Additional Information—Taxation—R.O.C. Taxation—Dividends.”
SIGNIFICANT CHANGES
Other than as disclosed elsewhere in this annual report, we have not experienced any significant changes since the date of the annual financial statements.
Item 9. The Offer and Listing
OFFER AND LISTING DETAILS
Our common shares have been listed on the TWSE under the symbol “3711” since April 30, 2018. The TWSE is an auction market where the securities traded are priced according to supply and demand through announced bid and ask prices. As of January 31, 2022, there was an aggregate of 4,410,443,432 of our common shares outstanding.
The performance of the TWSE has in recent years been characterized by extreme price volatility. There are currently limits on the range of daily price movements on the TWSE. In the case of equity securities traded on the TWSE, such as our common shares, fluctuations in the price of a particular security may not exceed a 10.0% change either above or below the previous day’s closing price of such security.
Our ADSs have been listed on the NYSE under the symbol “ASX” since April 30, 2018. The outstanding ADSs are identified by the CUSIP number 00215W100. As of January 31, 2022, a total of 157,164,186 ADSs were outstanding.
PLAN OF DISTRIBUTION
Not applicable.
MARKETS
The principal trading market for our common shares is the TWSE and the principal trading market for ADSs representing our common shares is the NYSE.
SELLING SHAREHOLDERS
Not applicable.
88
DILUTION
Not applicable.
EXPENSES OF THE ISSUE
Not applicable.
Item 10. Additional Information
SHARE CAPITAL
Not applicable.
ARTICLES OF INCORPORATION
General
We are a company limited by shares organized under the laws of the R.O.C. Our organizational document is our Articles of Incorporation. We have no
by-laws.
Our Articles of Incorporation provide, in Article 2, that we may engage in the General Investment Business, which includes investments in various businesses including agriculture, forestry, fishery, animal husbandry, industry, mining and merchandising business, investments in service companies, securities companies, bank insurance companies, trading companies, cultural companies, construction of residential buildings, commercial building, recreation businesses and tourist hotels-related business.
We were incorporated on April 30, 2018 as a company limited by shares under the R.O.C. Company Law. Our authorized share capital was NT$55,000,000,000, divided into 5,500,000,000 common shares with a par value of NT$10 per share. We do not have any equity in the form of preference shares or otherwise outstanding as of the date of this annual report.
Subject to limited exceptions, with the approval of our board of directors and the FSC, we may grant stock options to our employees; stock options worth NT$4,000,000,000 are reserved for employee subscription. We may issue new shares to employees with restricted rights after the resolutions of the shareholders’ meeting. See “Item 6. Directors, Senior Management and Employees—Compensation.”
Directors
Our Articles of Incorporation provide that we are to have nine directors, three independent directors and six
non-independent
directors, who will be elected by the general shareholders’ meeting from candidates with legal capacity. Each director shall hold office for a term of three years, and may continue to serve in the office if re-elected.
The election of the directors of the Company shall be conducted pursuant to the R.O.C. Company Act and relevant regulations. The election of independent directors and non-independent
directors should be held concurrently, with the exception that the number of independent directors and non-independent
directors elected shall be calculated separately; those who receive votes representing more voting rights will be elected as independent directors or non-independent
directors. Our audit committee replaced the function of supervisors in accordance with the R.O.C. Securities and Exchange Act to exercise the powers and duties of supervisors. The audit committee shall comprise solely of independent directors.
The candidate nomination system is used in the election of directors. Shareholders who hold 1% or more of our issued shares and the board of directors may nominate a list of candidates for directors.
Re-elections
are allowed. The board of directors have certain powers and duties, including (1) preparing business plans; (2) preparing surplus distribution or loss make-up
proposals; (3) preparing proposals to increase or decrease capital; (4) reviewing material internal rules and contracts; (5) hiring and discharging the general manager; (6) establishing and dissolving branch offices; (7) reviewing budgets and audited financial statements; and (8) other duties and powers granted by or in accordance with the R.O.C. Company Act or shareholders’ resolutions. 89
The board of directors is constituted of directors, and the Chairman and Vice Chairman are elected by more than half of the directors at a board meeting at which
two-thirds
or more of the directors are present. If the Chairman is absent or unable to discharge his or her duties for any reason, his or her acting proxy shall be elected in accordance with the R.O.C. Company Act. Board meetings may be held in the R.O.C. or at any location that is convenient for the directors to attend and appropriate for the meeting to be convened, or by video conference. A director may appoint another director to attend a board meeting and vote by proxy, but only one proxy may be accepted. Dividends and Distributions
In general, we are not permitted to distribute dividends or make other distributions to shareholders in any given year in which we did not have either earnings or retained earnings. Before distribution of dividends, we shall offset the losses incurred in prior years and set aside 10% of remaining net earnings as a legal reserve until the accumulated legal reserve equals our
paid-in
capital, and then allocate or reverse a special surplus reserve in accordance with laws or regulations set forth by the authorities concerned. The remainder plus the undistributed earnings shall be distributed in accordance with the proposal submitted by the board of directors and adopted by the general meeting of shareholders. However, when earnings are distributed as cash dividends that may be approved by the majority of the directors at a board meeting, in which over two-thirds
of the directors are present, and then reported to the shareholders’ meeting. According to our Articles of Incorporation, the remuneration of our independent directors is set at NT$3.0 million per person per year. For those that do not serve a full year, the remuneration will be calculated in proportion to the number of days of the term that were actually served. The additional remuneration of our independent directors who are also the members of our compensation committee is set at NT$360.0 thousand per person per year. For those that do not serve a full year, the additional remuneration will be calculated in proportion to the number of days of the term that were actually served.
If we are profitable, we set aside 0.01% to 1.00% of the profits as compensation to employees and 0.75% or less of the profits should be allocated as compensation to directors. While we have accumulated losses, the profit shall set aside to compensate losses before distribution.
At the annual general meeting of shareholders, our board of directors submits to the shareholders for their approval any proposal for the distribution of dividends or the making of any other distribution to shareholders from our net income for the preceding fiscal year. All common shares outstanding and fully paid as of the relevant record date are entitled to share equally in any dividend or other distribution so approved. Dividends may be distributed in cash, in the form of common shares or a combination of the two, as determined by the shareholders at the meeting. According to our Articles of Incorporation, we have a general policy that cash dividend distribution shall not be less than 30% of the total dividend amount and the residual dividends shall be distributed in form of stocks in accordance with the distribution plan proposed by the board of directors and resolved by the general shareholders’ meeting. See “Item 8. Financial Information—Consolidated Statements and Other Financial Information—Dividends and Dividend Policy.”
The compensation being distributed to employees in the form of stock or cash shall be approved by more than half of the directors at a board meeting at which
two-thirds
or more of the directors are present and report to the general shareholders’ meeting. In addition to permitting dividends to be paid out of earnings or retained earnings, R.O.C. Company Act permits us to make distributions to our shareholders in cash or in the form of common shares from capital surplus and the legal reserve. While legal reserve is distributed by issuing new shares or by cash, only the portion of legal reserve which exceeds 25% of our paid-in
capital can be distributed. . We distribute profit to employees in the form of shares by a resolution of a meeting of board of directors may resolve, at the same meeting of the board of directors, to distribute the shares by way of new shares to be issued by us or existing shares to be repurchased by us. For information on the dividends we paid in recent years, see “Item 8. Financial Information—Consolidated Statements and Other Financial Information—Dividends and Dividend Policy.” For information as to R.O.C. taxes on dividends and distributions, see “—Taxation—R.O.C. Taxation—Dividends.”
90
Preemptive Rights
Under the R.O.C. Company Law, when an R.O.C. company issues new shares for cash, existing shareholders who are listed on the shareholders’ register as of the record date have preemptive rights to subscribe for the new issue in proportion to their existing shareholdings, while a company’s employees, whether or not they are shareholders of the company, have rights to subscribe for 10% to 15% of the new issue. Any new shares that remain unsubscribed at the expiration of the subscription period may be freely offered, subject to compliance with applicable R.O.C. law.
In addition, in accordance with the R.O.C. Securities and Exchange Act, a public company that intends to offer new shares for cash must offer to the public at least 10% of the shares to be sold, except under certain circumstances or when exempted by the FSC. This percentage can be increased by a resolution passed at a shareholders’ meeting, which would diminish the number of new shares subject to the preemptive rights of existing shareholders.
These preemptive rights provisions do not apply to offerings of new shares through a private placement approved at a shareholders’ meeting.
Meetings of Shareholders
General shareholders’ meetings include both annual general meetings and extraordinary general meetings. We are required to hold an annual general meeting of our shareholders within six months following the end of each fiscal year. These meetings are generally held in Kaohsiung, Taiwan. Any shareholder who holds 1% or more of our issued and outstanding shares may submit one proposal for discussion at our annual general meeting. Extraordinary general shareholders’ meetings may be convened by resolution of the board of directors or by the board of directors upon the written request of any shareholder or shareholders who have held 3% or more of the outstanding common shares for a period of one year or longer or shareholders who have held more than 50% of the outstanding common shares for three months or longer. Shareholders’ meetings may also be convened by member(s) of the audit committee. Notice in writing of meetings of shareholders, stating the place, time and purpose, must be dispatched to each shareholder at least 30 days, in the case of annual general meetings, and 15 days, in the case of extraordinary meetings, before the date set for each meeting. A majority of the holders of all issued and outstanding common shares present at a shareholders’ meeting constitutes a quorum for meetings of shareholders.
Voting Rights
Under the R.O.C. Company Law, except under limited circumstances, shareholders have one vote for each common share held. Under the R.O.C. Company Law, our directors are elected at a shareholders’ meeting through cumulative voting.
In general, a resolution can be adopted by the holders of at least a majority of our common shares represented at a shareholders’ meeting at which the holders of a majority of all issued and outstanding common shares are present. Under R.O.C. Company Law, the approval by at least a majority of our common shares represented at a shareholders’ meeting in which a quorum of at least
two-thirds
of all issued and outstanding common shares are represented is required for major corporate actions, including: | ● | amendment to the Articles of Incorporation, including increase of authorized share capital and any changes of the rights of different classes of shares; |
| ● | execution, amendment or termination of any contract through which the company leases its entire business to others, or the company appoints others to operate its business, or the company operates its business with others on a continuous basis; |
| ● | transfer of its entire business or assets or a substantial part of its business or assets; |
| ● | acquisition of the entire business or assets of any other company, which would have a significant impact on the company’s operations; |
| ● | distribution of any stock dividend; |
| ● | dissolution, merger or spin-off of the company; |
91
| ● | issuance of restricted stocks to employees; and |
| ● | removal of the directors. |
However, in the case of a listed company such as us, the resolution may be adopted by the holders of at least
two-thirds
of our issued and outstanding common shares represented at a shareholders’ meeting at which the holders of at least a majority of all issued and outstanding common shares are present. A shareholder may be represented at an annual general or extraordinary meeting by proxy if a valid proxy form is delivered to us five days before the commencement of the annual general or extraordinary general shareholders’ meeting. Shareholders may exercise their voting rights by way of a written ballot or by way of electronic transmission if the voting decision is delivered to us two days before the commencement of the annual general or extraordinary general shareholders’ meeting.
Holders of ADSs do not have the right to exercise voting rights with respect to the underlying common shares, except as described in the deposit agreement.
Other Rights of Shareholders
Under the R.O.C. Company Law, dissenting shareholders are entitled to appraisal rights in certain major corporate actions such as a proposed amalgamation by the company. If agreement with the company cannot be reached, dissenting shareholders may seek a court order for the company to redeem all of their shares. Shareholders may exercise their appraisal rights by serving written notice on the company prior to or at the related shareholders’ meeting and/or by raising and registering an objection at the shareholders’ meeting. In addition to appraisal rights, shareholders have the right to sue for the annulment of any resolution adopted at a shareholders’ meeting where the procedures were legally defective within 30 days after the date of the shareholders’ meeting. One or more shareholders who have held 1% or more of the issued and outstanding shares of a company for a period of six months or longer may require an independent director to bring a derivative action on behalf of the company against a director as a result of the director’s unlawful actions or failure to act.
Rights of Holders of Deposited Securities
Except as described below, holders of ADSs generally have no right under the deposit agreement to instruct the depositary to exercise the voting rights for our common shares represented by the ADSs. Instead, by accepting ADSs or any beneficial interest in ADSs, holders of ADSs are deemed to have authorized and directed the depositary to appoint our chairman or his designee to represent them at our shareholders’ meetings and to vote our common shares deposited with the custodian according to the terms of the deposit agreement.
The depositary will mail to holders of ADSs any notice of a shareholders’ meeting received from us together with information explaining how to instruct the depositary to exercise the voting rights of the securities represented by ADSs.
If we fail to timely provide the depositary with an English-language translation of our notice of meeting or other materials related to any meeting of owners of common shares, the depositary will endeavor to cause all the deposited securities represented by ADSs to be present at the applicable meeting, insofar as practicable and permitted under applicable law, but will not cause those securities to be voted.
If the depositary timely receives voting instructions from owners of at least 51.0% of the outstanding ADSs to vote in the same direction regarding one or more resolutions to be proposed at the meeting including election of directors the depositary will notify our chairman or his designee to attend the meeting and vote all the securities represented by the holders’ ADSs in accordance with the direction received from owners of at least 51.0% of the outstanding ADSs.
If we have timely provided the depositary with the materials described in the deposit agreement and the depositary has not timely received instructions from holders of at least 51.0% of the outstanding ADSs to vote in the same direction regarding any resolution to be considered at the meeting, then holders of ADSs will be deemed to have authorized and directed the depositary bank to give a discretionary proxy to our chairman or his designee to attend and vote at the meeting our common shares represented by the ADSs in any manner our chairman or his designee may wish, which may not be in the interests of holders.
92
The ability of the depositary to carry out voting instructions may be limited by practical and legal limitations and the terms of the securities on deposit. We cannot assure ADS holders that they will receive voting materials in time to enable them to return voting instructions to the depositary in a timely manner.
While shareholders who own 1% or more of our outstanding shares are entitled to submit one proposal to be considered at our annual general meetings, only holders representing at least 51% of our ADSs outstanding at the relevant record date are entitled to submit one proposal to be considered at our annual general meetings. Hence, only one proposal may be submitted on behalf of all ADS holders.
Register of Shareholders and Record Dates
Our share registrar, President Securities Corp., maintains our register of shareholders at its offices in Taipei, Taiwan. Under the R.O.C. Company Law and our Articles of Incorporation, we may, by giving advance public notice, set a record date and close the register of shareholders for a specified period in order for us to determine the shareholders or pledgees that are entitled to rights pertaining to our common shares. The specified period required is as follows:
| ● | annual general meeting—60 days; |
| ● | extraordinary general shareholders’ meeting—30 days; and |
| ● | relevant record date for distribution of dividends, bonuses or other interests—5 days. |
Annual Financial Statements
At least 10 days before the annual general meeting, our annual financial statements, which are prepared in conformity with Taiwan-IFRS, must be available at our principal executive office in Kaohsiung, Taiwan for inspection by the shareholders. According to the regulations of the FSC, we are required to publish our annual and quarterly financial statements on a consolidated basis. In addition, the R.O.C. Securities and Exchange Act requests a public company, such as us, publicly announces its audited annual financial report within three months after the close of each fiscal year.
Transfer of Common Shares
The transfer of common shares in registered form is effected by endorsement and delivery of the related share certificates, but, in order to assert shareholders’ rights against us, the transferee must have his name and address registered on our register of shareholders. Shareholders are required to file their respective specimen seals, also known as chops, with us. Chops are official stamps widely used in Taiwan by individuals and other entities to authenticate the execution of official and commercial documents. The settlement of trading in our common shares is normally carried out on the book-entry system maintained by the Taiwan Depository Clearing Corporation.
Acquisition of Common Shares by ASEH
Under the R.O.C. Securities and Exchange Act, we may purchase our own common shares for treasury stock under limited circumstances, including:
| ● | to transfer shares to our employees; |
| ● | to deliver shares upon the conversion or exercise of bonds with warrants, preferred shares with warrants, convertible bonds, convertible preferred shares or warrants issued by us; and |
| ● | to maintain our credit and our shareholders’ equity, provided that the shares so purchased shall be canceled. |
We may purchase our common shares on the TWSE or by means of a public tender offer. These transactions require the approval of a majority of our board of directors at a meeting in which at least
two-thirds
of the directors are in attendance. The total amount of common shares purchased for treasury stock may not exceed 10.0% of the total issued shares. In addition, the total cost of the purchased shares shall not exceed the aggregate amount of our retained earnings, any premium from share issuances and the realized portion of our capital reserve. 93
We may not pledge or hypothecate any of our shares purchased by us. In addition, we may not exercise any shareholders’ right attaching to such shares. In the event that we purchase our shares on the TWSE, our affiliates, directors, managers and shareholders, together with their respective spouse, minor children and/or nominees who hold 10.0% or more of our total issued shares (as well as such respective spouses, minor children and/or nominees) are prohibited from selling any of our shares during the period in which we are purchasing our shares.
Pursuant to the R.O.C. Company Law, an entity in which our company directly or indirectly owns more than 50.0% of the voting shares or
paid-in
capital, which is referred to as a controlled entity, may not purchase our shares. Also, if our company and a controlled entity jointly own, directly or indirectly, more than 50.0% of the voting shares or paid-in
capital of another entity, which is referred to as a third entity, the third entity may not purchase shares in either our company or a controlled entity. Liquidation Rights
In the event of our liquidation, the assets remaining after payment of all debts, liquidation expenses and taxes will be distributed pro rata to the shareholders in accordance with the relevant provisions of the R.O.C. Company Law.
Transfer Restrictions
Substantial Shareholders
The R.O.C. Securities and Exchange Act currently requires:
| ● | each director, manager, or substantial shareholder (that is, a shareholder who holds more than 10.0% of the shares of a company), together with their respective spouses, minor children or nominees, to report any change in that person’s shareholding (as well as such respective spouses, minor children or nominees), on a monthly basis, to the issuer of the shares; and |
| ● | each director, manager, or substantial shareholder, together with their respective spouses, minor children or nominees, after acquiring the status of director, manager, or substantial shareholder for a period of six months, to report his or her intent to transfer any shares (as well as such respective spouses, minor children or nominees) on the TWSE or on the Taipei Exchange to the FSC at least three days before the intended transfer, unless the number of shares to be transferred does not exceed 10,000 shares. |
In addition, the number of shares that can be sold or transferred on the TWSE or on the Taipei Exchange by any person subject to the restrictions described above on any given day may not exceed the greater of:
| ● | 0.2% of the outstanding shares of the company in the case of a company with no more than 30 million outstanding shares; or |
| ● | 0.2% of 30 million shares plus 0.1% of the outstanding shares exceeding 30 million shares in the case of a company with more than 30 million outstanding shares; and |
| ● | 5.0% of the average trading volume (number of shares) on the TWSE for the 10 consecutive trading days preceding the reporting day on which the director, manager or substantial shareholder reports the intended share transfer to the FSC. |
These restrictions do not apply to sales or transfers of our ADSs.
MATERIAL CONTRACT
Disposal of Advanced Shanghai, ASEKS, ASEN and ASEWH
The disposal agreement for Advanced Shanghai, ASEKS, ASEN and ASEWH, or collectively, the China Sites, was entered into on December 1, 2021 between ASEH and certain of its subsidiaries, as sellers, and Beijing Wise Road Asset Management Co., Ltd., or Wise Road Capital, as purchaser. Pursuant to the disposal agreement, Wise Road Capital acquired the entire equity interest in GAPT Holding Limited, Global Advanced Packaging Test (HongKong) Limited and the China Sites, or collectively, the Disposed Companies, from ASEH and certain of its subsidiaries. The transaction completed on December 16, 2021.
94
The total consideration for the sale of the Disposed Companies was US$1.33 billion, comprising of (i) US$1.08 billion in cash, plus the cash held by the Disposed Companies, less the debt held by the Group Companies, at closing with further adjustment post-completion; and
(ii) follow-on
cash consideration of US$380 million, payable following the expiry of a six-month
period from the date of completion or a longer period as agreed by the parties. Under the disposal agreement, ASEH and certain of its subsidiaries gave Wise Road Capital certain warranties and indemnities in relation to the shares, equity interests and assets that were the subject of the disposal. In addition, ASEH and certain of its subsidiaries provided an indemnity in relation to the potential liabilities of the Disposed Companies arising out of litigation, tax, third-party software license and social security and housing fund matters. Pursuant to the disposal agreement, Wise Road Capital shall procure that the Disposed Companies shall, as soon as practicable, but in any event by June 30, 2022, remove from each of their company or trading name, domain name, logo or trade or service mark (whether registered or unregistered) references to us.
The disposal of the China Sites would realign the Group’s resources to focus on the major operations in the P.R.C., such as SPIL, and to generate more cash resources for organic expansion and strategic investments to address other opportunities in the P.R.C.
Share Purchase Agreement between USI Shanghai and the Shareholders of Financiere AFG S.A.S.
On December 12, 2019, the shareholders of FAFG and USI Shanghai entered into a share purchase agreement and a framework agreement pursuant to which the shareholders of FAFG undertook to sell the control of FAFG to USI Shanghai under the following terms and conditions:
| ● | pursuant to the FAFG Share Purchase Agreement, USIFR would acquire 71,530,174 shares, representing approximately 89.6% of the share capital and voting rights of FAFG, as of the closing date (“First FAFG Closing Date”) provided under the FAFG Share Purchase Agreement for the transfer of such shares (“FAFG First Transaction”); |
| ● | pursuant to the framework agreement, as from the First FAFG Closing Date, ASDI would keep 8,317,462 shares, representing approximately 10.4% of the share capital and voting rights of FAFG, which would be (i) subsequently exchanged by ASDI against new shares issued by USI Shanghai, (ii) or alternatively, if such exchange is not possible, against a cash payment in an amount corresponding to the price per FAFG share used in the context of the First FAFG Transaction (the “Second FAFG Transaction” and, together with the First FAFG Transaction, the “FAFG Transaction”). In case of exchange of shares, the USI Shanghai shares granted to ASDI would be locked up for a period of time to be agreed upon with the Chinese listing authorities, but which shall not exceed 36 months as from the completion of the Second FAFG Transaction. |
On December 1, 2020, USI Shanghai and USIFR successfully completed the acquisition of 100% of the shares of FAFG. Upon making payment of the cash consideration, USIFR paid NT$10,800,558 thousand to acquire 71,530 thousand shares of FAFG (approximately 89.6% of the issued shares of FAFG) and USI Shanghai issued its 25,940 thousand new ordinary shares, which amounted to NT$1,734,570 thousand, as share consideration in exchange for 8,318 thousand shares of FAFG (approximately 10.4% of the issued shares of FAFG). As a result, USI has acquired 100% of FAFG’s total issued shares, 79,848 thousand shares. In addition, USIFR is obliged to pay an additional amount up to US$42,805 thousand, in 2023 if FAFG’s net profit in 2021 and 2022 reaches the predetermined target. In December 2020, USIFR deposited NT$294,244 thousand (equivalent to US$10,122 thousand) in advance to trust account. Based on the fair value report of the contingent consideration, USIFR will be able to receive NT$385,735 thousand back, of which NT$294,244 thousand will be received from trust account while NT$91,491 thousand will be received additionally.
Joint Share Exchange Agreement between ASE and SPIL
ASE and SPIL entered into the Joint Share Exchange Agreement pursuant to which a holding company, ASEH, was formed by means of a statutory share exchange, and ASEH (i) acquired all issued shares of ASE in exchange for shares of ASEH using the Exchange Ratio as described below, and (ii) acquired all issued shares of SPIL using the Cash Consideration as described below. Upon the consummation of the Share Exchange, ASE and SPIL became wholly owned subsidiaries of ASEH concurrently.
95
Pursuant to the terms and subject to the conditions set forth in the Joint Share Exchange Agreement, at the effective time of the Share Exchange (the “Effective Time”):
| i. | for SPIL shareholders: |
| ● | each SPIL common share, par value NT$10 per share, was issued immediately prior to the Effective Time (including SPIL’s treasury shares and the common shares of SPIL beneficially owned by ASE) and was transferred to ASEH in consideration for the right to receive NT$51.2, which represented NT$55 minus |
| ● | each SPIL American depositary share, representing five common shares of SPIL was canceled in exchange for the right to receive through JPMorgan Chase Bank, N.A., as depositary for the SPIL American depositary shares (“SPIL Depositary”), the U.S. dollar equivalent of NT$256 (representing five times of the SPIL Common Shares Cash Consideration) minus |
| ii. | for ASE shareholders: |
| ● | each common share of ASE, par value NT$10 per share, issued immediately prior to the Effective Time (including ASE’s treasury shares), was transferred to ASE Technology Holding in consideration for the right to receive 0.5 ASE Technology Holding common shares, par value NT$10 per share; and |
| ● | each ASE ADS, representing five common shares of ASE, represented the right to receive 1.25 ASEH ADS. Each ASEH ADS represents two ASEH common shares upon surrender for cancellation to Citibank, N.A., as depositary for the ASE ADSs, after the Effective Time. The ratio at which the common shares of ASE were exchanged for the common shares of ASEH and ASE ADSs were exchanged for ASEH American depositary shares is hereinafter referred to as the “Exchange Ratio.” |
Under Republic of China law, if any fractional ASEH common shares that represented less than one common share was otherwise allotted to former holders of ASE common shares in connection with the Share Exchange, those fractional shares would not be issued to those shareholders. Pursuant to the Joint Share Exchange Agreement, ASE aggregated the fractional entitlements and sold the aggregated ASE common shares using the closing price of ASE common shares on the TWSE on the ninth R.O.C. Trading Day prior to the Effective Time, to an appointee of the Chairman of ASEH. The cash proceeds from the sale were distributed to the former holders of ASE common shares by ASEH on a proportionate basis in accordance with their respective fractions at the Effective Time.
On February 12, 2018, ASE held an extraordinary general shareholders’ meeting and approved the Joint Share Exchange Agreement and approved ASEH’s share capital to be NT$50,000,000,000.
On March 26, 2018, TWSE approved the delisting of common shares of ASE and SPIL on April 30, 2018 and the listing of common shares of ASEH on the same day. On April 30, 2018, the Share Exchange consummated, ASE and SPIL became wholly owned subsidiaries of ASEH, and ASEH began trading on TWSE under the stock symbol “3711” and on NYSE under the same ticker symbol “ASX.”
FOREIGN INVESTMENT IN THE R.O.C.
Historically, foreign investment in the R.O.C. securities market has been restricted. Since 1983, the R.O.C. government has from time to time enacted legislation and adopted regulations to permit foreign investment in the R.O.C. securities market.
96
On September 30, 2003, the Executive Yuan approved an amendment to the Regulations Governing Investment in Securities by Overseas Chinese and Foreign National, or the Regulations, which took effect on October 2, 2003. Pursuant to the Regulations, the FSC abolished the mechanism of the “qualified foreign institutional investors” and “general foreign investors” as stipulated in the Regulations before the amendment.
Under the Regulations, foreign investors (other than P.R.C. persons) are classified as either “onshore foreign investors” or “offshore foreign investors” according to their respective geographical location. Both onshore and offshore foreign investors are allowed to invest in R.O.C. securities after they register with the TWSE or the Taiwan Futures Exchange. The Regulations further classify foreign investors into foreign institutional investors and foreign individual investors. “Foreign institutional investors” refer to those investors incorporated and registered in accordance with foreign laws outside of the R.O.C. (i.e., offshore foreign institutional investors) or their branches set up and recognized within the R.O.C. (i.e., onshore foreign institutional investors). Offshore overseas Chinese and foreign individual investors may be subject to a maximum investment ceiling that will be separately determined by the FSC, after consultation with the Central Bank of the Republic of China (Taiwan). Currently, there is no maximum investment ceiling for offshore overseas Chinese and foreign individual investors. On the other hand, foreign institutional investors are not subject to any ceiling for investment in the R.O.C. securities market.
Except for certain specified industries, such as telecommunications, investments in R.O.C. listed companies by foreign investors are not subject to individual or aggregate foreign ownership limits. Custodians for foreign investors are required to submit to the Central Bank of the Republic of China (Taiwan) and the TWSE a monthly report of trading activities and status of assets under custody and other matters. Capital remitted to the R.O.C. under these guidelines may be remitted out of the R.O.C. at any time after the date the capital is remitted to the R.O.C. Capital gains and income on investments may be remitted out of the R.O.C. at any time.
Foreign investors (other than P.R.C. persons) who wish to make (i) direct investments in the shares of R.O.C. private companies or (ii) investment in 10.0% or more of the equity interest of a R.O.C. company listed on the TWSE or the Taipei Exchange in any single transaction are required to submit a foreign investment approval application to the MOEAIC or other applicable government authority. The MOEAIC or such other government authority reviews each foreign investment approval application and approves or disapproves each application after consultation with other governmental agencies (such as the Central Bank of the Republic of China (Taiwan) and the FSC).
Under current R.O.C. law, any
non-R.O.C.
person possessing a foreign investment approval may remit capital for the approved investment and is entitled to repatriate annual net profits, interest and cash dividends attributable to the approved investment. Dividends attributable to such investment may be repatriated upon submitting certain required documents to the remitting bank, and investment capital and capital gains attributable to such investment may be repatriated after approvals of the MOEAIC or other government authorities have been obtained. In addition to the general restriction against direct investment by foreign investors in securities of R.O.C. companies, foreign investors (except in certain limited cases) are currently prohibited from investing in certain industries in the R.O.C. pursuant to a “negative list,” as amended by the Executive Yuan. The prohibition on foreign investment in the prohibited industries specified in the negative list is absolute in the absence of a specific exemption from the application of the negative list. Pursuant to the negative list, certain other industries are restricted so that foreign investors (except in limited cases) may invest in these industries only up to a specified level and with the special approval of the relevant competent authority that is responsible for enforcing the relevant legislation that the negative list is intended to implement.
The FSC announced the P.R.C. Regulations on April 30, 2009. According to the P.R.C. Regulations, a P.R.C. QDII is allowed to invest in R.O.C. securities (including less than 10.0% (or less in certain industries) of shareholding of a R.O.C. company listed on the TWSE or the Taipei Exchange), provided that the total investment amount of any QDII does not exceed US$500 million. The custodians of QDIIs must apply with the TWSE for the remittance amount for each QDII, which cannot exceed US$100 million, and QDII can only invest in R.O.C. securities at an amount approved by the TWSE. In addition, QDIIs are currently prohibited from investing in certain industries, and their investment in any company of certain other industries is restricted to a certain percentage pursuant to a list promulgated by the FSC and amended from time to time. P.R.C. investors other than QDII are prohibited from making investments in a R.O.C. company listed on the TWSE or the Taipei Exchange if the investment is less than 10.0% of the equity interest of such R.O.C. company.
97
In addition to investments permitted under the P.R.C. Regulations, P.R.C. investors who wish to make (i) a direct investment in the shares of R.O.C. private companies or (ii) investments, individually or in the aggregate, in 10.0% or more of the equity interest of a R.O.C. company listed on the TWSE or the Taipei Exchange, are required to submit an investment approval application to the MOEAIC or other government authority. The MOEAIC or such other government authority reviews each investment approval application and approves or disapproves each application after consultation with other governmental agencies.
In addition to the general restriction against a direct investment by P.R.C. investors in securities of R.O.C. companies, P.R.C. investors may only invest in certain industries on the “positive list” promulgated by the Executive Yuan. Furthermore, a P.R.C. investor who wishes to be elected as a R.O.C. company’s director or supervisor shall submit an investment approval application to the MOEAIC or other government authority for approval.
EXCHANGE CONTROLS
R.O.C. Exchange Controls
The R.O.C. Foreign Exchange Control Act and regulations provide that all foreign exchange transactions must be executed by banks designated by the FSC and by the Central Bank of the Republic of China (Taiwan) to engage in such transactions. Current regulations favor trade-related or service-related foreign exchange transactions. Consequently, foreign currency earned from exports of merchandise and services may now be retained and used freely by exporters, and all foreign currency needed for the importation of merchandise and services may be purchased freely from the designated foreign exchange banks.
Apart from trade-related or service-related foreign exchange transactions, R.O.C. companies and individual residents of the R.O.C. reaching the age of 20 years old may, without foreign exchange approval, remit foreign currency of up to US$50 million (or its equivalent) and US$5 million (or its equivalent) to and from the R.O.C. (or such other amount as determined by the Central Bank of the Republic of China (Taiwan) from time to time at its discretion in consideration of the economic and financial conditions of the R.O.C. or the needs to maintain the order of the foreign exchange market in the R.O.C.), respectively, in each calendar year. The above limits apply to remittances involving either a conversion of NT dollars into a foreign currency or a conversion of foreign currency into NT dollars. In addition, a requirement is also imposed on all enterprises incorporated or registered in the R.O.C. to register their medium- and long-term foreign debts with the Central Bank of the Republic of China (Taiwan).
In addition, foreign persons may, subject to specified requirements, but without foreign exchange approval of the Central Bank of the Republic of China (Taiwan), remit to and from the R.O.C. foreign currencies of up to US$100,000 (or its equivalent) per remittance if the required documentation is provided to the R.O.C. authorities. The above limit applies to remittances involving either a conversion of NT dollars into a foreign currency or a conversion of foreign currency into NT dollars. The above limit does not, however, apply to the conversion of NT dollars into other currencies, including U.S. dollars, from the proceeds of a sale of any underlying shares withdrawn from a depositary receipt facility.
TAXATION
R.O.C. Taxation
The following discussion describes the material R.O.C. tax consequences of the ownership and disposition of our common shares or ADSs by and to a nonresident individual or nonresident entity holder that owns our common shares or ADSs (referred to here as a
“non-R.O.C.
holder”). As used in the preceding sentence, a “nonresident individual” is a non-R.O.C.
national who owns our common shares or ADSs and is not physically present in the R.O.C. for 183 days or more during any calendar year, and a “nonresident entity” is a corporation or a non-corporate
body that owns our common shares or ADSs, is organized under the laws of a jurisdiction other than the R.O.C. and has no fixed place of business or business agent in the R.O.C. Dividends
Dividends (whether in cash or common shares) declared by us out of retained earnings and distributed to a
non-R.O.C.
holder are subject to R.O.C. withholding tax at 21% (unless a preferable tax rate is provided under a tax treaty between the R.O.C. and the jurisdiction where the non-R.O.C.
holder is a resident) on the amount of the distribution (in the case of cash dividends) or on the par value of the distributed common shares (in the case of stock dividends). 98
Distributions of common shares or cash out of capital reserves will not be subject to withholding tax, except under limited circumstances.
Capital Gains
Starting from January 1, 2016, capital gains realized upon the sale or other disposition of common shares are exempt from R.O.C. income tax.
Sales of ADSs are not regarded as sales of R.O.C. securities, and thus any gains derived from transfers of ADSs by
non-R.O.C.
holders are not currently subject to R.O.C. income tax. Securities Transaction Tax
Securities transaction tax will be imposed on the seller at the rate of 0.3% of the transaction price upon a sale of common shares. Transfers of ADSs are not subject to R.O.C. securities transaction tax. During the
one-year
period from April 28, 2017 to April 27, 2018, the tax rate for day trading of shares meeting certain criteria was reduced to 0.15%. The Legislative Yuan approved on April 13, 2018 is an extension of the aforesaid reduction in the tax rate. Under the amended Securities Transaction Tax Act, which became effective on April 27, 2018, the aforesaid reduction in the tax rate applies until December 31, 2024. Subscription Rights
Distributions of statutory subscription rights for our common shares in compliance with the R.O.C. Company Law are currently not subject to R.O.C. tax. Sales of statutory subscription rights evidenced by securities are subject to securities transaction tax, currently at the rate of 0.3% of the gross amount received. Holders are exempt from income tax on capital gains from the sale of statutory subscription rights evidenced by securities. Proceeds derived from sales of statutory subscription rights, which are not evidenced by securities, are not subject to securities transaction tax but are subject to income tax at a fixed rate of 20% of the income if the seller is a
non-R.O.C.
holder. Subject to compliance with R.O.C. law, we, in our sole discretion, may determine whether statutory subscription rights are evidenced by securities. Estate and Gift Tax
R.O.C. estate tax is payable on any property within the R.O.C. left by a deceased nonresident individual, and R.O.C. gift tax is payable on any property within the R.O.C. donated by a nonresident individual. Estate tax and gift tax are currently imposed at the progressive rates of 10%, 15% and 20%. Under the R.O.C. Estate and Gift Tax Act, common shares issued by R.O.C. companies are deemed property located in the R.O.C. without regard to the location of the owner. It is unclear whether a holder of ADSs will be considered to own common shares for this purpose.
Tax Treaty
At present, the R.O.C. has income tax treaties with Indonesia, Singapore, New Zealand, Australia, the United Kingdom, South Africa, Gambia, eSwatini (Swaziland), Malaysia, North Macedonia, the Netherlands, Senegal, Sweden, Belgium, Denmark, Israel, Vietnam, Paraguay, Hungary, France, India, Slovakia, Switzerland, Germany, Thailand, Kiribati, Luxembourg, Austria, Italy, Japan, Canada, Poland, Czech Republic and Saudi Arabia. These tax treaties may limit the rate of R.O.C. withholding tax on dividends paid with respect to common shares issued by R.O.C. companies. A
non-R.O.C.
holder of ADSs may or may not be considered as the beneficial owner of common shares for the purposes of such treaties. Accordingly, holders of ADSs who wish to apply a reduced withholding tax rate that is provided under a tax treaty should consult their own tax advisers concerning such application. The U.S. does not have an income tax treaty with the R.O.C. United States Federal Income Taxation
The following discussion describes material U.S. federal income tax consequences of the ownership and disposition of our common shares or ADSs to the U.S. Holders described below that hold such common shares or ADSs as capital assets for U.S. federal income tax purposes. As used herein, a “U.S. Holder” is a person that, for U.S. federal income tax purposes, is a beneficial owner of our common shares or ADSs and:
99
| ● | a citizen or individual resident of the U.S.; |
| ● | a corporation, or other entity taxable as a corporation, created or organized under the laws of the U.S. or of any political subdivision of the U.S.; or |
| ● | an estate or trust the income of which is subject to U.S. federal income taxation regardless of its source. |
This discussion does not describe all of the tax consequences that may be relevant in light of a U.S. Holder’s particular circumstances, including alternative minimum tax consequences, the provisions of the Internal Revenue Code of 1986, as amended (the “Code”) known as the Medicare contribution tax, and tax consequences that may be relevant to U.S. Holders subject to special rules, including:
| ● | insurance companies; |
| ● | tax-exempt entities, “individual retirement accounts” or “Roth IRAs”; |
| ● | dealers or traders in securities that use a mark-to-market |
| ● | certain financial institutions; |
| ● | partnerships or other entities classified as partnerships for U.S. federal income tax purposes; |
| ● | persons holding common shares or ADSs in connection with a trade or business conducted outside of the U.S.; |
| ● | persons that hold or will hold common shares or ADSs as part of a straddle, hedge, conversion transaction, integrated transaction or similar transaction; |
| ● | persons whose functional currency for U.S. federal income tax purposes is not the U.S. dollar; |
| ● | persons that own or are deemed to own 10% or more of the voting power or value of our stock; or |
| ● | persons that acquired our common shares or ADSs pursuant to the exercise of any employee stock option or otherwise as compensation. |
If an entity that is classified as a partnership for U.S. federal income tax purposes holds our common shares or ADSs, the U.S. federal income tax treatment of a partner will generally depend on the status of the partner and the activities of the partnership. Partnerships holding our common shares or ADSs and their partners should consult their tax advisers as to the particular U.S. federal income tax consequences of holding and disposing of our common shares or ADSs.
This discussion is based on the Code, final, temporary and proposed Treasury regulations, administrative pronouncements and judicial decisions, all as of the date hereof. These laws and regulations are subject to change, possibly with retroactive effect.
In general, for U.S. federal income tax purposes, a U.S. Holder that owns ADSs should be treated as the owner of the common shares represented by the ADSs. Accordingly, no gain or loss should be recognized if a U.S. Holder exchanges ADSs for the common shares represented by those ADSs.
U.S. Holders should consult their tax advisers with regard to the application of the U.S. federal income tax laws to their common shares or ADSs, as well as any tax consequences arising under the laws of any state, local or
non-U.S.
taxing jurisdiction. 100
Dividends
Distributions paid on our common shares or ADSs, other than certain pro rata distributions of our common shares to all holders of our common shares and ADSs, generally will constitute dividend income to the extent paid out of our current or accumulated earnings and profits, as determined in accordance with U.S. federal income tax principles. Because we do not maintain calculations of our earnings and profits under U.S. federal income tax principles, it is expected that distributions generally will be reported to U.S. Holders as dividends. The amount a U.S. Holder will be required to include in income with respect to any dividend paid in NT dollars will be equal to the U.S. dollar value of the NT dollars paid, calculated by reference to the exchange rate in effect on the date the payment is received by the depositary (in the case of ADSs) or by a U.S. Holder (in the case of common shares), regardless of whether the payment is in fact converted into U.S. dollars on the date of receipt. If a U.S. Holder does not convert the NT dollars so received into U.S. dollars on the date of receipt, any gain or loss recognized on a subsequent sale or other disposition of the NT dollars generally will be U.S.-source ordinary income or loss. The amount of any taxable distribution of property other than cash will be the fair market value of such property on the date of distribution. Dividends will not be eligible for the dividends-received deduction generally available to U.S. corporations under the Code.
Subject to applicable limitations, certain dividends paid by “qualified foreign corporations” to certain
non-corporate
U.S. Holders are taxable at the preferential rates applicable to long-term capital gain. A non-U.S.
corporation is treated as a qualified foreign corporation with respect to dividends it pays on shares (or depositary shares representing such shares) that are readily tradable on a securities market in the U.S., such as the NYSE, where our ADSs are traded. Non-corporate
U.S. Holders should consult their tax advisers to determine whether these preferential rates may apply to dividends they receive and whether they are subject to any special rules that limit their ability to be taxed at these preferential rates. Dividend income will be foreign-source and will include the amount of any R.O.C. taxes withheld thereon (reduced by any credit against the withholding tax on account of the retained earnings tax imposed on us). Subject to applicable limitations and restrictions, some of which vary depending upon the U.S. Holder’s circumstances (such as a requirement to satisfy certain minimum holding periods), R.O.C. taxes withheld from dividend distributions (reduced by any credit against the withholding tax on account of the retained earnings tax imposed on us) generally will be eligible for credit against the U.S. Holder’s U.S. federal income tax liability if such taxes were paid or accrued in a taxable year beginning before December 28, 2021. For other taxable years, recently issued Treasury regulations impose additional requirements for
non-U.S.
taxes to be eligible for credit, and we have not determined whether R.O.C. withholding taxes would satisfy the requirements of these regulations. The limitation on foreign taxes eligible for credit is calculated separately with respect to specific classes of income. In lieu of claiming a credit, U.S. Holders may, at their election, deduct otherwise creditable R.O.C. taxes in computing their taxable income, subject to generally applicable limitations. An election to deduct foreign taxes instead of claiming foreign tax credits applies to all non-U.S.
taxes paid or accrued in the taxable year. The rules governing foreign tax credits are complex and U.S. Holders should consult their tax advisers regarding the creditability or deductibility of any R.O.C. tax generally (including under the Treasury regulations mentioned above) and in their particular circumstances. Certain distributions of common shares by us to all our shareholders (including ADS holders) will not be subject to U.S. federal income tax. Accordingly, these distributions will not give rise to U.S. federal income against which the R.O.C. tax imposed on these distributions may be credited. U.S. Holders should consult their tax advisers as to whether any R.O.C. tax imposed on such distributions may be creditable in general, and if so, the extent to which such R.O.C. tax may be creditable against their U.S. federal income tax on foreign-source income from other sources.
pro rata
Capital Gains
A U.S. Holder generally will recognize U.S.-source capital gain or loss for U.S. federal income tax purposes on the sale or exchange of our common shares or ADSs, which will be long-term capital gain or loss if our common shares or ADSs have been held by the U.S. Holder for more than one year. The amount of gain or loss will be equal to the difference between the U.S. Holder’s tax basis in our common shares or ADSs disposed of and the amount realized on disposition, in each case as determined in U.S. dollars. A U.S. Holder’s basis in our common shares or ADSs acquired for cash will generally equal the U.S. Holder’s cost of such common shares or ADSs. U.S. Holders should consult their tax advisers about the treatment of capital gains, which may be taxed at lower rates than ordinary income for
non-corporate
taxpayers, and capital losses, the deductibility of which may be limited. 101
The R.O.C. securities transaction tax imposed upon a sale of common shares (as discussed above under “R.O.C. Taxation—Securities Transaction Tax”) will not be treated as creditable foreign tax for U.S. federal income tax purposes. However, such tax may be deductible or reduce the amount realized by a U.S. Holder upon a disposition of our common shares.
Passive Foreign Investment Company Rules
We believe that we were not a passive foreign investment company (a “PFIC”) for U.S. federal income tax purposes for our 2021 taxable year. However, since PFIC status depends upon the composition of a company’s income and assets and the market value of its assets (including its equity investments) from time to time, there can be no assurance that we will not be a PFIC for any taxable year.
If we are a PFIC for any taxable year during which a U.S. Holder owns a common share or an ADS, certain adverse consequences could apply to that U.S. Holder, such as an increased U.S. federal income tax liability on gains from depositions of our common shares or ADSs, or on certain excess distributions. In addition, if we are a PFIC for any taxable year during which a U.S. Holder owns a common share or an ADS, such U.S. Holder will generally be required to file Internal Revenue Service Form 8621 with its annual U.S. federal income tax returns, subject to certain exceptions. Furthermore, if we are a PFIC for any taxable year in which we pay a dividend or the preceding taxable year, any preferential tax that may have otherwise applied in the case of
non-corporate
U.S. Holders will not be available. U.S. Holders should consult their tax advisers regarding the potential application of the PFIC rules to their ownership or disposition of our common shares or ADSs. Information Reporting and Backup Withholding
Payments of dividends and sales proceeds that are made within the U.S. or through certain U.S.-related financial intermediaries generally are subject to information reporting, and may be subject to backup withholding, unless (i) the U.S. Holder is an exempt recipient or (ii) in the case of backup withholding, the U.S. Holder provides a correct taxpayer identification number and certifies that it is not subject to backup withholding.
The amount of any backup withholding from a payment to a U.S. Holder will be allowed as a credit against the U.S. Holder’s U.S. federal income tax liability and may entitle it to a refund, provided that the required information is timely furnished to the Internal Revenue Service.
DIVIDENDS AND PAYING AGENTS
Not applicable
STATEMENT BY EXPERTS
Not applicable.
DOCUMENTS ON DISPLAY
We file annual reports on Form for further information on the operation of the Public Reference Room. The reports and other information we file electronically with the SEC are also available to the public from the SEC’s website at Information about ASEH is also available to the public on our website at
20-F
and periodic reports on Form 6-K
with the SEC. You can read and copy these reports and other information at the SEC’s Public Reference Room at 450 Fifth Street, N.W., Washington, D.C. 20549. You can also request copies of the documents, upon payment of a duplicating fee, by writing to the Public Reference Section of the SEC. Please call the SEC at 1-800-SEC-0330
https://www.sec.gov
.https://www.aseglobal.com
.
SUBSIDIARY INFORMATION
Not applicable.
102
Item 11. Quantitative and Qualitative Disclosures about Market Risk
The derivative instruments used by us were to mitigate risks arising from ordinary business operations. Our risk management department monitored risks to mitigate risk exposures, and reported unsettled positions, transaction balances and related gains or losses to our chief financial officer on monthly basis. See Note 34 to our consolidated financial statements included in this annual report for details.
Market Risk
Our exposure to financial market risks relates primarily to changes in interest rates and foreign currency exchange rates. Gains or losses arising from fluctuations in foreign currency exchange rates of a variety of derivative financial instruments were approximately offset by those of hedged items. Interest rate risk was not significant due to the cost of capital was expected to be fixed.
Interest Rate Risk.
For assets and liabilities with floating interest rates, a 100 basis point increase or decrease was used when reporting interest rate risk internally to key management personnel. If interest rates had been 100 basis points (1%) higher or lower and all other variables held constant, our profit before income tax for the year ended 2021 would have decreased or increased approximately by NT$959.0 million (US$34.6 million). Hedging contracts and hedged items have been taken into account while measuring the changes in profit before income tax. The abovementioned sensitivity analysis mainly focused on the interest rate items at the end of year. As the
year-end
exposure did not reflect the exposure for the year ended December 31, 2021, the abovementioned sensitivity analysis was unrepresentative of 2021. The tables below set forth information relating to our significant obligations, including short-term borrowings and long-term borrowings, including bank loans, bills payable and bonds payable as of December 31, 2021.
Expected Maturity Date
Expected Maturity Date |
||||||||||||||||||||||||||||||||||||||||
2022 |
2023 |
2024 |
2025 |
2026 |
Thereafter |
Total |
Fair Value | |||||||||||||||||||||||||||||||||
(in millions, except percentages) | ||||||||||||||||||||||||||||||||||||||||
| Short-term borrowings: |
||||||||||||||||||||||||||||||||||||||||
| Variable rate (NT$) |
9,103.0 | - | - | - | - | - | 9,103.0 | 9,103.0 | ||||||||||||||||||||||||||||||||
| Average interest rate |
1.29% | - | - | - | - | - | 1.29% | - | ||||||||||||||||||||||||||||||||
| Fixed rate (NT$) |
6,600.0 | - | - | - | - | - | 6,600.0 | 6,600.0 | ||||||||||||||||||||||||||||||||
| Average interest rate |
0.94% | - | - | - | - | - | 0.94% | - | ||||||||||||||||||||||||||||||||
| Variable rate (US$) |
306.7 | - | - | - | - | - | 306.7 | 306.7 | ||||||||||||||||||||||||||||||||
| Average interest rate |
1.69% | - | - | - | - | - | 1.69% | - | ||||||||||||||||||||||||||||||||
| Fixed rate (US$) |
113.3 | - | - | - | - | - | 113.3 | 113.3 | ||||||||||||||||||||||||||||||||
| Average interest rate |
1.02% | - | - | - | - | - | 1.02% | - | ||||||||||||||||||||||||||||||||
| Variable rate (RMB) |
965.4 | - | - | - | - | - | 965.4 | 965.4 | ||||||||||||||||||||||||||||||||
| Average interest rate |
3.57% | - | - | - | - | - | 3.57% | - | ||||||||||||||||||||||||||||||||
| Fixed rate (RMB) |
129.0 | - | - | - | - | - | 129.0 | 129.0 | ||||||||||||||||||||||||||||||||
| Average interest rate |
3.55% | - | - | - | - | - | 3.55% | - | ||||||||||||||||||||||||||||||||
| Variable rate (EUR) |
138.4 | - | - | - | - | - | 138.4 | 138.4 | ||||||||||||||||||||||||||||||||
| Average interest rate |
0.82% | - | - | - | - | - | 0.82% | - | ||||||||||||||||||||||||||||||||
| Fixed rate (EUR) |
53.0 | - | - | - | - | - | 53.0 | 53.0 | ||||||||||||||||||||||||||||||||
| Average interest rate |
0.79% | - | - | - | - | - | 0.79% | - | ||||||||||||||||||||||||||||||||
| Variable rate (HKD) |
832.6 | - | - | - | - | - | 832.6 | 832.6 | ||||||||||||||||||||||||||||||||
| Average interest rate |
2.08% | - | - | - | - | - | 2.08% | - | ||||||||||||||||||||||||||||||||
| Long-term borrowings: |
||||||||||||||||||||||||||||||||||||||||
| Variable rate (NT$) |
419.3 | 54,308.8 | 1,608.7 | 1,600.4 | 1,100.4 | 2,196.9 | 61,234.5 | 61,234.5 | ||||||||||||||||||||||||||||||||
| Average interest rate |
0.33% | 1.06% | 0.56% | 0.52% | 0.44% | -0.48% | 0.96% | - | ||||||||||||||||||||||||||||||||
| Fixed rate (NT$) |
9,904.8 | 5,000.0 | 13,902.4 | 15,000.0 | 3,500.0 | 2,000.0 | 49,307.2 | 49,307.2 | ||||||||||||||||||||||||||||||||
| Average interest rate |
0.47% | 1.03% | 1.43% | 0.88% | 1.03% | 0.95% | 0.98% | - | ||||||||||||||||||||||||||||||||
| Variable rate (US$) |
92.6 | 1,359.7 | 353.2 | - | - | - | 1,805.5 | 1,805.5 | ||||||||||||||||||||||||||||||||
103
Expected Maturity Date |
||||||||||||||||||||||||||||||||||||||||
2022 |
2023 |
2024 |
2025 |
2026 |
Thereafter |
Total |
Fair Value | |||||||||||||||||||||||||||||||||
(in millions, except percentages) | ||||||||||||||||||||||||||||||||||||||||
| Average interest rate |
1.93% | 1.97% | 2.04% | - | - | - | 1.98% | - | ||||||||||||||||||||||||||||||||
| Fixed rate (EUR) |
- | 152.5 | - | - | - | - | 152.5 | 152.5 | ||||||||||||||||||||||||||||||||
| Average interest rate |
- | 0.40% | - | - | - | - | 0.40% | - | ||||||||||||||||||||||||||||||||
| Variable rate (RMB) |
357.5 | 477.8 | 221.7 | 208.9 | 222.9 | 1,003.2 | 2,492.0 | 2,492.0 | ||||||||||||||||||||||||||||||||
| Average interest rate |
4.07% | 4.34% | 4.60% | 4.92% | 5.01% | 1.85% | 3.43% | - | ||||||||||||||||||||||||||||||||
| Fixed rate (RMB) |
- | - | - | - | - | 779.8 | 779.8 | 779.8 | ||||||||||||||||||||||||||||||||
| Average interest rate |
- | - | - | - | - | 0.10% | 0.10% | - | ||||||||||||||||||||||||||||||||
Foreign Currency Exchange Rate Risk.
We use 1% fluctuation when reporting foreign currency exchange rate risk internally to key management personnel and represents management’s assessment of the reasonably possible change in foreign currency exchange rates. The sensitivity analysis included financial assets and liabilities and intercompany receivables and payables within the Group. The changes in profit before income tax due to a 1% change in U.S. dollar and Japanese yen against NT dollar, RMB and EUR would be NT$38.0 million (US$1.4 million) for the year ended December 31, 2021. The abovementioned sensitivity analysis mainly focused on the foreign currency monetary items at each balance sheet date. As the
period-end
exposure did not reflect the exposure for the year ended December 31, 2021, the abovementioned sensitivity analysis was unrepresentative. To protect against reductions in value and the volatility of future cash flows caused by changes in foreign currency exchange rates, we entered into a variety of
non-derivative
financial instruments and derivative financial instruments to minimize the impact of foreign currency fluctuations on our results of operations. Despite hedging and mitigating techniques implemented by us, fluctuations in exchange rates have affected, and may continue to affect, our financial condition and results of operations. Our hedging strategy was to lift borrowings denominated in foreign currencies to avoid exchange rate exposure from its investments in equity instruments denominated in foreign currencies (recognized under the line item of financial assets at FVTPL) and net investment in foreign subsidiary, USIFR, which has EUR as its functional currency. Those transactions were designated as fair value hedges and a hedge of net investment in foreign operation, respectively. Hedge adjustments were made to totally offset the foreign exchange gains or losses from those equity instruments denominated in foreign currencies and foreign operations when they were evaluated based on the exchange rates on each balance sheet date. The hedge ineffectiveness in these hedging relationships arose from the material difference between the notional amounts of borrowings denominated in foreign currencies and the original investments in equity instruments denominated in foreign currencies and net investment in foreign operations. No other source of ineffectiveness is expected to emerge from these hedging relationships.
The table below sets forth our outstanding forward exchange contracts, swap contracts and target redemption forward contracts, for which the expected maturity dates are in 2022, in aggregate terms by type of contract as of December 31, 2021.
104
| Forward Exchange Contracts |
Swap Contracts |
Target Redemption Forward Contracts | ||||
| Buy US$ against NT$ | ||||||
| Notional Amount | US$125.0 million | US$1,903.0 million | - | |||
| Weighted Average Strike Price | US$/NT$27.726 | US$/NT$27.807 | - | |||
| Fair Value | Negative US$0.882 million | Negative US$11.180 million | - | |||
| Buy US$ against RMB | ||||||
| Notional Amount | US$114.0 million | US$409.0 million | - | |||
| Weighted Average Strike Price | US$/RMB6.383 | US$/RMB6.400 | - | |||
| Fair Value | US$0.005 million | Negative US$1.002 million | - | |||
| Buy JP¥ against RMB | ||||||
| Notional Amount | JP¥630.0 million | - | - | |||
| Weighted Average Strike Price | JP¥/RMB0.056 | - | - | |||
| Fair Value | Negative US$0.024 million | - | - | |||
| Buy US$ against EUR | ||||||
| Notional Amount | - | - | US$3.5 million | |||
| Weighted Average Strike Price | - | - | US$/EUR0.858 | |||
| Fair Value | - | - | US$0.018 million | |||
| Sell US$ against NT$ | ||||||
| Notional Amount | US$10.0 million | US$570.1 million | - | |||
| Weighted Average Strike Price | US$/NT$27.774 | US$/NT$27.792 | - | |||
| Fair Value | US$0.033 million | US$2.300 million | - | |||
| Sell US$ against RMB | ||||||
| Notional Amount | US$265.0 million | US$54.4 million | - | |||
| Weighted Average Strike Price | US$/RMB6.421 | US$/RMB6.428 | - | |||
| Fair Value | US$0.534 million | US$0.300 million | - | |||
| Sell US$ against JP¥ | ||||||
| Notional Amount | US$94.7 million | US$17.7 million | - | |||
| Weighted Average Strike Price | US$/JP¥113.881 | US$/JP¥113.178 | - | |||
| Fair Value | Negative US$0.977 million | Negative US$0.291 million | - | |||
| Sell US$ against MYR | ||||||
| Notional Amount | US$8.0 million | - | - | |||
| Weighted Average Strike Price | US$/MYR4.179 | - | - | |||
| Fair Value | US$0.032 million | - | - | |||
| Sell US$ against SGD | ||||||
| Notional Amount | US$16.9 million | - | - | |||
| Weighted Average Strike Price | US$/SGD1.357 | - | - | |||
| Fair Value | US$0.080 million | - | - | |||
| Sell US$ against KRW | ||||||
| Notional Amount | - | US$37.5 million | - | |||
| Weighted Average Strike Price | - | US$/KRW1,184.500 | - | |||
| Fair Value | - | Negative US$0.047 million | - | |||
| Sell US$ against EUR | ||||||
| Notional Amount | US$0.5 million | - | - | |||
| Weighted Average Strike Price | US$/EUR0.884 | - | - | |||
| Fair Value | US$0.000 million | - | - |
105
Other Market Risk.
non-derivative
financial assets at FVTPL which include quoted ordinary shares, open-end
mutual funds, unquoted preferred shares, private-placement funds, and investments in equity instruments at FVTOCI, which include unquoted ordinary shares, unquoted preferred shares and limited partnerships. The value of these investments may fluctuate based on various factors including prevailing market conditions. Moreover, the fair value of investments in unlisted securities may be significantly different from their carrying value. As of December 31, 2021, our investments in quoted ordinary shares, open-end
mutual funds, unquoted preferred shares and private-placement funds classified as financial assets at FVTPL were NT$4,923.4 million (US$177.5 million). As of December 31, 2021, our investments in equity instruments at FVTOCI were NT$943.4 million (US$34.0 million). If equity price was 1.0% higher or lower, profit before income tax would have increased or decreased approximately by NT$49.0 million (US$1.7 million) for the same period and other comprehensive income before income tax would have increased or decreased approximately by NT$9.0 million (US$0.3 million) for the same period. Furthermore, fluctuations in gold prices may also affect the price at which we have been able to purchase gold wire. How this will impact the results of our operations depends on whether such costs can be transferred onto our customers. Item 12. Description of Securities Other Than Equity Securities
DEBT SECURITIES
Not applicable.
WARRANTS AND RIGHTS
Not applicable.
OTHER SECURITIES
Not applicable.
AMERICAN DEPOSITARY SHARES
Depositary Fees and Charges
As an ADS holder, you will be required to pay the following fees under the terms of the deposit agreement:
| Service |
Fees | |
| Issuance of ADSs (e.g., an issuance upon a deposit of shares, upon a change in ADS(s)-to-common |
Up to U.S. $5.00 per 100 ADSs issued | |
| Cancellation of ADSs (e.g., a cancellation of ADSs for delivery of deposited common shares, upon a change in the ADS(s)-to-common |
Up to U.S. $5.00 per 100 ADSs cancelled | |
| Distribution of cash dividends or other cash distributions (e.g., upon a sale of rights and other entitlements) |
Up to U.S. $5.00 per 100 ADSs held | |
| Distribution of ADSs pursuant to (i) stock dividends or other free stock distributions, or (ii) exercise of rights to purchase additional ADSs |
Up to U.S. $5.00 per 100 ADSs held | |
| Distribution of securities other than ADSs or rights to purchase additional ADSs (e.g., upon a spin-off) |
Up to U.S. $5.00 per 100 ADSs held | |
| ADS Services |
Up to U.S. $5.00 per 100 ADSs held on the applicable record date(s) established by the Depositary | |
As an ADS holder you will also be responsible to pay certain charges such as:
| ● | taxes (including applicable interest and penalties) and other governmental charges; |
| ● | the registration fees as may from time to time be in effect for the registration of common shares on the share register and applicable to transfers of common shares to or from the name of the custodian, the Depositary or any nominees upon the making of deposits and withdrawals, respectively; |
106
| ● | certain cable, telex and facsimile transmission and delivery expenses; |
| ● | the expenses and charges incurred by the Depositary in the conversion of foreign currency; |
| ● | the fees and expenses incurred by the Depositary in connection with compliance with exchange control regulations and other regulatory requirements applicable to common shares, ADSs and ADRs; and |
| ● | the fees and expenses incurred by the Depositary, the custodian or any nominee in connection with the servicing or delivery of deposited property. |
ADS fees and charges payable upon (i) the issuance of ADSs and (ii) cancellation of ADSs will be payable by the person to whom the ADSs are so issued (in the case of ADS issuances) and by the person whose ADSs are being cancelled (in the case of ADS cancellations). In the case of ADSs issued by the Depositary into DTC or held via DTC, the ADS issuance and cancellation fees and charges will be payable by the DTC participant(s) receiving the ADSs or whose ADSs are being cancelled, as the case may be, on behalf of the beneficial owner(s) and will be charged by the DTC participant(s) to the account(s) of the applicable beneficial owner(s) in accordance with the procedures and practices of the DTC participant(s) as in effect at the time. ADS fees and charges in respect of distributions and the ADS service fee are charged to the holders as of the applicable ADS record date. In the case of distributions of cash, the amount of the applicable ADS fees and charges is deducted from the funds being distributed. In the case of (i) distributions other than cash and (ii) the ADS service fee, holders as of the ADS record date will be invoiced for the amount of the ADS fees and charges and such ADS fees and charges may be deducted from distributions made to holders of ADSs. For ADSs held through DTC, the ADS fees and charges for distributions other than cash and the ADS service fee may be deducted from distributions made through DTC, and may be charged to the DTC participants in accordance with the procedures and practices prescribed by DTC and the DTC participants in turn charge the amount of such ADS fees and charges to the beneficial owners for whom they hold ADSs.
In the event of refusal to pay the Depositary fees, the Depositary may, under the terms of the Deposit Agreement, refuse the requested service until payment is received or may set off the amount of the Depositary fees from any distribution to be made to the ADS holder. Certain of the depositary fees and charges (such as the ADS services fee) may become payable shortly after the Closing Date. Note that the fees and charges you may be required to pay may vary over time and may be changed by us and by the Depositary. You will receive prior notice of such changes. The Depositary may reimburse us for certain expenses incurred by us in respect of the ADR program, by making available a portion of the ADS fees charged in respect of the ADR program or otherwise, upon such terms and conditions as we and the Depositary agree from time to time.
Depositary Payments
In 2021, we received the following payments from Citibank, N.A., the depositary bank for our ADR programs. The table below sets forth details of the amount we received from Citibank, N.A.
| Items |
Depositary Payments |
|||
US$ |
||||
| Reimbursement of Legal Fees |
8,430.24 | |||
| Direct reimbursement |
2,349,377.37 | |||
| |
|
|||
| Net payment received by us (1) |
2,357,807.61 | |||
| |
|
|||
| (1) | Net of U.S. withholding tax. |
107
PART II
Item 13. Defaults, Dividend Arrearages and Delinquencies
Not applicable.
Item 14. Material Modifications to the Rights of Security Holders and Use of Proceeds
Not applicable.
Item 15. Controls and Procedures
Disclosure Controls and Procedures
As of December 31, 2021, our management, with the participation of our principal executive officer and chief financial officer, evaluated the effectiveness of our disclosure controls and procedures as defined in Rules
13a-15(e)
and 15(d)-15(e)
under the Exchange Act. Our management necessarily applied its judgment in assessing the costs and benefits of such controls and procedures, which by their nature can provide only reasonable assurance regarding management’s control objectives. Based on this evaluation, our principal executive officer and chief financial officer concluded that our disclosure controls and procedures are effective for recording, processing, summarizing and reporting, within the time periods specified in the SEC’s rules and forms, for information required to be disclosed in the reports we file or submit under the Exchange Act, and for accumulating and communicating such information to our management, including our principal executive officer and chief financial officer, as appropriate to allow timely decisions regarding required disclosure. Management’s Annual Report on Internal Control over Financial Reporting
Our management is responsible for establishing and maintaining adequate internal control over financial reporting, as defined in Rule
13a-15(f)
and 15d-15(f)
promulgated under the Securities Exchange Act of 1934. Because of its inherent limitations, internal control over financial reporting may not prevent or detect misstatements. Projections of any evaluation of effectiveness to future periods are subject to the risk that controls may become inadequate because of changes in conditions or that the degree of compliance with the policies or procedures may deteriorate.
Our management assessed the effectiveness of our internal control over financial reporting as of December 31, 2021. In making this assessment, our management used the criteria set forth by the Committee of Sponsoring Organizations of the Treadway Commission (COSO) in .
Internal Control-Integrated Framework (2013)
Based on this assessment, management concluded that, as of December 31, 2021, our internal control over financial reporting is effective based on those criteria.
Our independent registered public accounting firm, Deloitte Touche, assessed the effectiveness of our internal control over financial reporting. Deloitte Touche has issued an attestation report, which is included below. SPIL’s independent registered public accounting firm, PricewaterhouseCoopers, Taiwan, assessed the effectiveness of SPIL’s internal control over financial reporting. PricewaterhouseCoopers, Taiwan has issued an attestation report, which is included below.
108
REPORT OF INDEPENDENT REGISTERED PUBLIC ACCOUNTING FIRM
To the shareholders and the Board of Directors of
ASE Technology Holding Co., Ltd.
Opinion on Internal Control over Financial Reporting
We have audited the internal control over financial reporting of ASE Technology Holding Co., Ltd. (a Republic of China corporation) and its subsidiaries (collectively, the “Group”) as of December 31, 2021, based on criteria established in issued by the Committee of Sponsoring Organizations of the Treadway Commission (COSO). In our opinion, based on our audit and the report of other auditors, the Group maintained, in all material respects, effective internal control over financial reporting as of December 31, 2021, based on criteria established in issued by COSO.
Internal Control - Integrated Framework (2013)
Internal Control - Integrated Framework (2013)
We did not audit the effectiveness of internal control over financial reporting of Siliconware Precision Industries Co., Ltd. and its subsidiaries (collectively, “SPIL”), a wholly-owned subsidiary, whose consolidated financial statements reflect total assets and operating revenues constituting 22% and 19%, respectively, of the related consolidated financial statement amounts as of and for the year ended December 31, 2021. The effectiveness of SPIL’s internal control over financial reporting was audited by other auditors whose report has been furnished to us, and our opinion, insofar as it relates to the effectiveness of SPIL’s internal control over financial reporting, is based solely on the report of other auditors.
We have also audited, in accordance with the standards of the Public Company Accounting Oversight Board (United States) (PCAOB), the consolidated financial statements as of and for the year ended December 31, 2021 of the Group and our report dated March 25, 2022, expressed an unqualified opinion on those consolidated financial statements based on our audit and the report of other auditors.
Basis for Opinion
The Group’s management is responsible for maintaining effective internal control over financial reporting and for its assessment of the effectiveness of internal control over financial reporting, included in the accompanying Management’s Annual Report on Internal Control Over Financial Reporting. Our responsibility is to express an opinion on the Group’s internal control over financial reporting based on our audit. We are a public accounting firm registered with the PCAOB and are required to be independent with respect to the Group in accordance with the U.S. federal securities laws and the applicable rules and regulations of the Securities and Exchange Commission and the PCAOB.
We conducted our audit in accordance with the standards of the PCAOB. Those standards require that we plan and perform the audit to obtain reasonable assurance about whether effective internal control over financial reporting was maintained in all material respects. Our audit included obtaining an understanding of internal control over financial reporting, assessing the risk that a material weakness exists, testing and evaluating the design and operating effectiveness of internal control based on the assessed risk, and performing such other procedures as we considered necessary in the circumstances. We believe that our audit and the report of other auditors provide a reasonable basis for our opinion.
Definition and Limitations of Internal Control over Financial Reporting
A company’s internal control over financial reporting is a process designed to provide reasonable assurance regarding the reliability of financial reporting and the preparation of financial statements for external purposes in accordance with generally accepted accounting principles. A company’s internal control over financial reporting includes those policies and procedures that (1) pertain to the maintenance of records that, in reasonable detail, accurately and fairly reflect the transactions and dispositions of the assets of the company; (2) provide reasonable assurance that transactions are recorded as necessary to permit preparation of financial statements in accordance with generally accepted accounting principles, and that receipts and expenditures of the company are being made only in accordance with authorizations of management and directors of the company; and (3) provide reasonable assurance regarding prevention or timely detection of unauthorized acquisition, use, or disposition of the company’s assets that could have a material effect on the financial statements.
109
Because of its inherent limitations, internal control over financial reporting may not prevent or detect misstatements. Also, projections of any evaluation of effectiveness to future periods are subject to the risk that controls may become inadequate because of changes in conditions, or that the degree of compliance with the policies or procedures may deteriorate.
| /s/ Deloitte Touche |
| Taipei, Taiwan |
| Republic of China |
| March 25, 2022 |
110
Report of Independent Registered Public Accounting Firm
To the Board of Directors and Shareholder of
Siliconware Precision Industries Co., Ltd.
Opinions on the Financial Statements and Internal Control over Financial Reporting
We have audited the accompanying consolidated balance sheets of Siliconware Precision Industries Co., Ltd. and its subsidiaries (the “Company”) as of December 31, 2021 and 2020, and the related consolidated statements of comprehensive income, of changes in equity and of cash flows for each of the three years in the period ended December 31, 2021, including the related notes (collectively referred to as the “consolidated financial statements”) (not presented herein). We also have audited the Company’s internal control over financial reporting as of December 31, 2021, based on criteria established in issued by the Committee of Sponsoring Organizations of the Treadway Commission (COSO).
Internal Control - Integrated Framework (2013)
In our opinion, the consolidated financial statements referred to above present fairly, in all material respects, the financial position of the Company as of December 31, 2021 and 2020, and the results of its operations and its cash flows for each of the three years in the period ended December 31, 2021 in conformity with International Financial Reporting Standards as issued by the International Accounting Standards Board. Also in our opinion, the Company maintained, in all material respects, effective internal control over financial reporting as of December 31 ,2021, based on criteria established in issued by the COSO.
Internal Control - Integrated Framework (2013)
Basis for Opinions
The Company’s management is responsible for these consolidated financial statements, for maintaining effective internal control over financial reporting, and for its assessment of the effectiveness of internal control over financial reporting, included in Management’s Annual Report on Internal Control over Financial Reporting (not presented herein). Our responsibility is to express opinions on the Company’s consolidated financial statements and on the Company’s internal control over financial reporting based on our audits. We are a public accounting firm registered with the Public Company Accounting Oversight Board (United States) (PCAOB) and are required to be independent with respect to the Company in accordance with the U.S. federal securities laws and the applicable rules and regulations of the Securities and Exchange Commission and the PCAOB.
We conducted our audits in accordance with the standards of the PCAOB. Those standards require that we plan and perform the audits to obtain reasonable assurance about whether the consolidated financial statements are free of material misstatement, whether due to error or fraud, and whether effective internal control over financial reporting was maintained in all material respects.
Our audits of the consolidated financial statements included performing procedures to assess the risks of material misstatement of the consolidated financial statements, whether due to error or fraud, and performing procedures that respond to those risks. Such procedures included examining, on a test basis, evidence regarding the amounts and disclosures in the consolidated financial statements. Our audits also included evaluating the accounting principles used and significant estimates made by management, as well as evaluating the overall presentation of the consolidated financial statements. Our audit of internal control over financial reporting included obtaining an understanding of internal control over financial reporting, assessing the risk that a material weakness exists, and testing and evaluating the design and operating effectiveness of internal control based on the assessed risk. Our audits also included performing such other procedures as we considered necessary in the circumstances. We believe that our audits provide a reasonable basis for our opinions.
Definition and Limitations of Internal Control over Financial Reporting
A company’s internal control over financial reporting is a process designed to provide reasonable assurance regarding the reliability of financial reporting and the preparation of financial statements for external purposes in accordance with generally accepted accounting principles. A company’s internal control over financial reporting includes those policies and procedures that (i) pertain to the maintenance of records that, in reasonable detail, accurately and fairly reflect the transactions and dispositions of the assets of the company; (ii) provide reasonable assurance that transactions are recorded as necessary to permit preparation of financial statements in accordance with generally accepted accounting principles, and that receipts and expenditures of the company are being made only in accordance with authorizations of management and directors of the company; and (iii) provide reasonable assurance regarding prevention or timely detection of unauthorized acquisition, use, or disposition of the company’s assets that could have a material effect on the financial statements.
111
Because of its inherent limitations, internal control over financial reporting may not prevent or detect misstatements. Also, projections of any evaluation of effectiveness to future periods are subject to the risk that controls may become inadequate because of changes in conditions, or that the degree of compliance with the policies or procedures may deteriorate.
Critical Audit Matters
Critical audit matters are matters arising from the current period audit of the consolidated financial statements that were communicated or required to be communicated to the Board of Directors and that (i) relate to accounts or disclosures that are material to the consolidated financial statements and (ii) involved our especially challenging, subjective, or complex judgments. We determined that there are no critical audit matters.
/s/PricewaterhouseCoopers, Taiwan
Taipei, Taiwan
Republic of China
March 16, 2022
Changes in Internal Control over Financial Reporting
There has been no change in our internal control over financial reporting that occurred during the period covered by this annual report that has materially affected, or is reasonably likely to materially affect, our internal control over financial reporting during 2021.
Item 16. Reserved
Item 16A. Audit Committee Financial Expert
Our board of directors determined that
Shen-Fu
Yu, Mei-Yueh
Ho and Wen-Chyi
Ong are audit committee financial experts as defined under the applicable rules of the SEC issued pursuant to Section 407 of the Sarbanes-Oxley Act of 2002 and are independent for the purposes of Rule 10A-3
of the Exchange Act. Item 16B. Code of Ethics
We have adopted a Code of Business Conduct and Ethics (the “Code of Ethics”), which satisfies the requirements of Item 16B of Form
20-F
and applies to all employees, officers, supervisors and directors of our Company and subsidiaries, including our principal executive officer, chief financial officer and principal accounting officer. The Code of Ethics contains the policies with respect to anti-corruption, fair competition, anti-money laundering, whistleblowing and regulatory compliance. The Code of Ethics has built robust and effective policies and procedures to enable high ethical standards of business conduct that can be persistently maintained. We have continued to implement the Code of Ethics through promoting awareness and educational activities among our employees, officers, supervisors and directors of our Company and subsidiaries in daily operation. The Code of Ethics is available on our website at: https://ir.aseglobal.com/html/ir_doc.php. Item 16C. Principal Accountant Fees and Services
Policy on
Pre-Approval
of Audit and Non-Audit
Services of Independent Registered Public Accounting Firm Our audit committee basis.
pre-approves
all audit and non-audit
services provided by our independent registered public accounting firm, including audit services, audit-related services, tax services and other services, on a case-by-case
112
Independent Registered Public Accounting Firm’s Fees
The following table sets forth the aggregate fees by categories specified below in connection with certain professional services rendered by Deloitte Touche (Firm ID: 1060 ) and its affiliated firms.
Year Ended December 31, |
||||||||||||||||
2019 |
2020 |
2021 |
||||||||||||||
NT$ |
NT$ |
NT$ |
US$ |
|||||||||||||
(in thousands) |
||||||||||||||||
Audit fees (1) |
168,874.7 |
173,103.6 |
186,435.0 |
6,720.8 |
||||||||||||
Audit-related fees (2) |
41,035.3 |
2,377.9 |
2,393.1 |
86.3 |
||||||||||||
Tax fees (3) |
23,532.4 |
27,433.5 |
20,013.1 |
721.4 |
||||||||||||
All other fees (4) |
7,063.0 |
4,125.4 |
6,094.1 |
219.7 |
||||||||||||
Total |
240,505.4 |
207,040.4 |
214,935.3 |
7,748.2 |
||||||||||||
(1) |
Audit fees are defined as the standard audit and review work that needs to be performed each year in order to issue an opinion on our consolidated financial statements and to issue reports on the local statutory financial statements. It also includes services that can only be provided by our auditor such as statutory audits required by the Tax Bureau of the R.O.C. and the Customs Bureau of the R.O.C., consents, and comfort letters and any other audit services required for SEC or other regulatory filings. |
(2) |
Audit-related fees consist of assurance and related services by Deloitte Touche and its affiliated firms that are reasonably related to the performance of the audit or review of our financial statements and are not reported above under Audit Fees. The service for the fees disclosed under this category relate to cash capital increase and bonds offering. |
(3) |
Tax fees consist of professional services rendered by Deloitte Touche and its affiliated firms for tax compliance and tax advice. The services for the fees disclosed under this category include tax return preparation and technical tax advice. |
(4) |
Other fees primarily consist of a risk management advisory fee and a business operation and process advisory fee, among others. |
Item 16D. Exemptions from the Listing Standards for Audit Committees
Not applicable.
Item 16E. Purchases of Equity Securities by the Issuer and Affiliated Purchasers
Share Repurchase
In March 2018, pursuant to the R.O.C. Business Mergers and Acquisitions Act, ASE’s board of directors resolved to repurchase 1,852,000 common shares at the price of NT$38.5 per share from dissenting shareholders of the Share Exchange. All of the repurchased common shares from dissenting shareholders of the Share Exchange were canceled in April 2018.
On November 5, 2021, we announced a share repurchase program, or the “First Share Repurchase Program,” which is approved by our board of directors to repurchase our common shares during the period from November 8, 2021 to January 7, 2022. The repurchase price under the First Share Repurchase Program was between NT$90.0 to NT$150.0 per common share. The maximum number of common shares allowed to be repurchased pursuant to the First Share Repurchase Program was 55.0 million, equal to 1.25% of our issued and outstanding common shares.
The First Share Repurchase Program was early concluded on December 30, 2021, with a total number of 55.0 million common shares being repurchased for an aggregate purchase price of NT$8,250 million. February 25, 2022 was the record date for capital reduction and we completed the cancellation of those repurchased ordinary shares.
113
The table below sets forth detailed information about the First Share Repurchase Program.
Period |
Total Number of Common Shares Purchased |
Average Price Paid Per Common Share (NT$) |
Total Number of Common Shares Purchased as Part of Publicly Announced Programs |
Maximum Number (or Approximate Dollar Value) of Common Shares that May Still Be Purchased Under the Programs | ||||||||||||||||
First Share Repurchase |
||||||||||||||||||||
November 2021 (November 9, 2021 – December 30, 2021) |
55,000,000 |
104.27 |
55,000,000 |
– |
||||||||||||||||
Item 16F. Change in Registrant’s Certifying Accountant
Deloitte Touche is our principal accountants, who have audited our and our subsidiaries’ consolidated balance sheets as of December 31, 2020 and 2021, the related consolidated statements of comprehensive income, changes in equity, cash flows, and the related notes for each of the three years ended December 31, 2019, 2020 and 2021, respectively. In delivering its audit opinion, Deloitte Touche has historically relied on the opinions of PricewaterhouseCoopers, Taiwan, principally in respect of our subsidiary, SPIL.
PricewaterhouseCoopers, Taiwan have audited the consolidated financial statements of SPIL and its subsidiaries, a wholly-owned subsidiary, which statements reflect total assets constituting 22% and 22% of our consolidated total assets as of December 31, 2020 and 2021, respectively, and total revenue constituting 22%, 21% and 19% of our consolidated revenues for the years ended December 31, 2019, 2020 and 2021, respectively.
In order to align the geographical location of our key corporate and accounting functions with our principal accountants, the board of director of SPIL approved the dismissal of PricewaterhouseCoopers, Taiwan on December 23, 2021, such dismissal will become effective upon completion by PricewaterhouseCoopers, Taiwan of its procedures on the financial statements of SPIL as of and for the year ended December 31, 2021. As a result, Deloitte Touche will serve as the sole independent auditor for us, commencing the fiscal year 2022.
Our subsidiaries’ report of PricewaterhouseCoopers, Taiwan for the fiscal years ended December 31, 2020 and 2021 did not contain any adverse opinion or disclaimer of opinion, and were not qualified or modified as to uncertainty, audit scope or accounting principle. During the fiscal year ended December 31, 2020 and the subsequent interim periods through December 23, 2021, there were no: (1) disagreements with PricewaterhouseCoopers, Taiwan on any matters of accounting principles or practices, financial statement disclosure, or auditing scope or procedure, which disagreements if not resolved to the satisfaction of PricewaterhouseCoopers, Taiwan would have caused PricewaterhouseCoopers, Taiwan to make reference thereto in their report on our financial statements for such fiscal period, and (2) no “reportable events” (as defined in SEC Regulation
S-K
Item 304(a)(1)(v)). Item 16G. Corporate Governance
As a company listed on the NYSE, we are subject to certain corporate governance rules of the NYSE. The application of the NYSE’s corporate governance rules is limited for foreign private issuers, recognizing that they have to comply with domestic requirements. As a foreign private issuer, we must comply with the following NYSE corporate governance rules: 1) satisfy the audit committee requirements of the SEC; 2) the principal executive officer must promptly notify the NYSE in writing upon becoming aware of any material noncompliance with applicable NYSE corporate governance rules; 3) submit annual and interim affirmations to the NYSE regarding compliance with applicable NYSE corporate governance requirements; and 4) provide a brief description of any significant differences between our corporate governance practices and those required of U.S. companies under the NYSE listing standards. The table below sets forth the significant differences between our corporate governance practices and those required of U.S. companies under the NYSE listing standards.
114
New York Stock Exchange Corporate Governance Rules Applicable to U.S. Companies |
Description of Significant Differences Between Our Governance Practices and the NYSE Corporate Governance Rules Applicable to U.S. Companies | |
Director independence |
||
Listed companies must have a majority of independent directors, as defined under the NYSE listing standards. |
Three members of our board of directors are independent as defined in Rule 10A-3 under the Exchange Act. We do not assess the independence of our directors under the independence requirements of the NYSE listing standards. Pursuant to relevant laws and regulations of the R.O.C., we have three independent directors on our board of directors that were elected through the candidate nomination system at our annual general shareholders’ meeting on August 12, 2021. | |
To empower non-management directors to serve as a more effective check on management, the non-management directors of each company must meet at regularly scheduled executive sessions without management. |
All of our directors attend the meetings of the board of directors. Our non-management directors do not meet at regularly scheduled executive sessions without management. The R.O.C. Company Law does not require companies incorporated in the R.O.C. to have their non-management directors meet at regularly scheduled executive sessions without management. | |
Nominating/Corporate governance committee |
||
Listed companies must have a nominating/corporate governance committee composed entirely of independent directors and governed by a written charter that provides for certain responsibilities of the committee set out in the NYSE listing standards. |
We do not have a nominating/corporate governance committee. The R.O.C. Company Law does not require companies incorporated in the R.O.C. to have a nominating/corporate governance committee. Currently, our board of directors performs the duties of a corporate governance committee and regularly reviews our corporate governance principles and practices. The R.O.C. Company Law requires that directors be elected by shareholders. Under R.O.C. law and regulations, companies that have independent directors are required to adopt a candidate nomination system for the election of independent directors. Our three independent directors were elected through the candidate nomination system provided in our Articles of Incorporation. However, starting from 2021, the directors (including independent directors) of the company listed on the TWSE or the Taipei Exchange shall be nominated by adopting the candidate nomination system. | |
Compensation committee |
||
Listed companies must have a compensation committee composed entirely of independent directors and governed by a written charter that provides for certain responsibilities of the committee set out in the NYSE listing standards. |
We have a compensation committee as required by the regulations promulgated by the FSC. The charter of such committee contains similar responsibilities as those provided under NYSE listing standards. | |
In addition to any requirement of Rule 10A-3(b)(1), all compensation committee members must satisfy the independence requirements for independent directors set out in the NYSE listing standards. |
We do not assess the independence of our compensation committee member under the independence requirements of the NYSE listing standards but adopt the independence standard as promulgated under the R.O.C. Regulations Governing the Appointment and Exercise of Powers by the Remuneration Committee of a Company Whose Stock is Listed on the TWSE or the Taipei Exchange. | |
115
New York Stock Exchange Corporate Governance Rules Applicable to U.S. Companies |
Description of Significant Differences Between Our Governance Practices and the NYSE Corporate Governance Rules Applicable to U.S. Companies | |
Audit committee |
||
Listed companies must have an audit committee that satisfies the requirements of Rule 10A-3 under the Exchange Act. |
We have an audit committee that satisfies the requirements of Rule 10A-3 under the Exchange Act and the requirements under R.O.C. Securities and Exchange Act. | |
The audit committee must have a minimum of three members. In addition to any requirement of Rule 10A-3(b)(1), all audit committee members must satisfy the independence requirements for independent directors set out in the NYSE listing standards. |
We currently have three members on our audit committee. Our audit committee members satisfy the independence requirements of Rule 10A-3 under the Exchange Act. We do not assess the independence of our audit committee member under the independence requirements of the NYSE listing standards. | |
The audit committee must have a written charter that provides for the duties and responsibilities set out in Rule 10A-3 and addresses certain other matters required by the NYSE listing standards. |
Our audit committee charter provides for the audit committee to assist our board of directors in its oversight of (i) the integrity of our financial statements, (ii) the qualifications, independence and performance of our independent auditor and (iii) our compliance with legal and regulatory requirements and provides for the duties and responsibilities set out in Rule 10A-3. Our audit committee charter does not address all the matters required by the NYSE listing standards beyond the requirements of Rule 10A-3. | |
Because the appointment and retention of our independent auditor are the responsibility of our entire board of directors under R.O.C. law and regulations, our audit committee charter provides that the audit committee shall make recommendations to the board of directors with respect to these matters. | ||
Each listed company must have an internal audit function. |
We have an internal audit function. Under the R.O.C. Regulations for the Establishment of Internal Control Systems by Public Companies, a public company is required to set out its internal control systems in writing, including internal audit implementation rules, which must be approved by the board of directors. Our entire board of directors and the principal executive officer are responsible for the establishment of the internal audit functions, compliance with the internal audit implementation rules and oversight of our internal control systems, including the appointment and retention of our independent auditor. | |
Equity compensation plans |
||
Shareholders must be given the opportunity to vote on all equity compensation plans and material revisions thereto, except for employment inducement awards, certain grants, plans and amendments in the context of mergers and acquisitions, and certain specific types of plans. |
The board of directors has authority under R.O.C. laws and regulations to approve (i) the distribution of employee compensation and (ii) employee stock option plans by a majority vote of the board of directors at a meeting where at least two-thirds of all directors are present and to grant options to employees pursuant to such plans, provided that shareholders’ approval is required if the exercise price of an option would be less than the closing price of the common shares on the TWSE on the grant date of the option, subject to the approval of the Securities and Futures Bureau of the FSC, and to approve treasury stock programs and the transfer of shares to employees under such programs by a majority vote of the board of directors in a meeting where at least two-thirds of all directors are present. | |
116
New York Stock Exchange Corporate Governance Rules Applicable to U.S. Companies |
Description of Significant Differences Between Our Governance Practices and the NYSE Corporate Governance Rules Applicable to U.S. Companies | |
Corporate governance guidelines |
||
Listed companies must adopt and disclose corporate governance guidelines. |
We currently comply with the domestic nonbinding Corporate Governance Best-Practice Principles for TWSE and Taipei Exchange Listed Companies promulgated by the TWSE and the Taipei Exchange, and we provide an explanation of the differences between our practice and the principles, if any, in our R.O.C. annual report. Also, we have a dedicated section on our website to disclose the relevant information and inform investors how to access such principles. | |
Code of ethics for directors, officers and employees |
||
Listed companies must adopt and disclose a code of business conduct and ethics for directors, officers and employees, and promptly disclose any waivers of the code for directors or executive officers. |
We have adopted a code of ethics that satisfies the requirements of Item 16B of Form 20-F and applies to all employees, officers, supervisors and directors of our company and our subsidiaries and will disclose any waivers of the code as required by Item 16B of Form 20-F. We have posted our code of ethics on our website. | |
Description of significant differences |
||
Listed foreign private issuers must disclose any significant ways in which their corporate governance practices differ from those followed by domestic companies under NYSE listing standards. |
This table contains the significant differences between our corporate governance practices and those required of U.S. companies under the NYSE listing standards. | |
Principal Executive Officer certification |
||
Each listed company principal executive officer must certify to the NYSE each year that he or she is not aware of any violation by the company of NYSE corporate governance listing standards, qualifying the certification to the extent necessary. |
As a foreign private issuer, we are not required to comply with this rule; however, our principal executive officer provides certifications under Sections 302 and 906 of the Sarbanes-Oxley Act. | |
Each listed company principal executive officer must promptly notify the NYSE in writing after any executive officer of the listed company becomes aware of any material non-compliance with any applicable provisions of Section 303A. |
We intend to comply with this requirement. | |
Each listed company must submit an executed Written Affirmation annually to the NYSE. In addition, each listed company must submit an interim Written Affirmation each time a change occurs to the board or any of the committees subject to Section 303A. The annual and interim Written Affirmations must be in the form specified by the NYSE. |
We have complied with this requirement to date and intend to continue to comply going forward. | |
117
New York Stock Exchange Corporate Governance Rules Applicable to U.S. Companies |
Description of Significant Differences Between Our Governance Practices and the NYSE Corporate Governance Rules Applicable to U.S. Companies | |
Website |
||
Listed companies must have and maintain a publicly accessible website. |
We have and maintain a publicly accessible website. | |
Item 16H. Mine Safety Disclosure
Not applicable.
Item 16I. Disclosure Regarding Foreign Jurisdictions that Prevent Inspections
Not applicable.
118
PART III
Item 17. Financial Statements
The Company has elected to provide financial statements for fiscal year 2021 and the related information pursuant to Item 18.
Item 18. Financial Statements
Reference is made to pages
F-1
to F-131 of this annual report. The consolidated financial statements of the Company and the report thereon by its independent registered public accounting firm listed below are attached hereto as follows:
(a) |
Report of Independent Registered Public Accounting Firm of the Company dated March 25, 2022 (pages F-2 to F-4). |
(b) |
Report of Independent Registered Public Accounting Firm of SPIL dated March 16, 2022 (pages F-5 to F-6). |
(c) |
Consolidated Balance Sheets of the Company and subsidiaries as of December 31, 2020 and 2021 (pages F-7 to F-8). |
(d) |
Consolidated Statements of Comprehensive Income of the Company and subsidiaries for the years ended December 31, 2019, 2020 and 2021 (pages F-9 to F-10). |
(e) |
Consolidated Statements of Changes in Equity of the Company and subsidiaries for the years ended December 31, 2019, 2020 and 2021 (pages F-11 to F-12). |
(f) |
Consolidated Statements of Cash Flows of the Company and subsidiaries for the years ended December 31, 2019, 2020 and 2021 (pages F-13 to F-15). |
(g) |
Notes to Consolidated Financial Statements of the Company and subsidiaries (pages F-16 to F-131). |
Item 19. Exhibits
1. |
||||
2. |
||||
(a) |
||||
(b) |
||||
4. |
||||
(a) |
^Asset Purchase Agreement dated July 3, 1999 among ASE (Chung Li) Inc., ASE Inc., Motorola Electronics Taiwan, Ltd. and Motorola, Inc. (incorporated by reference to Exhibit 10.2 to ASE Test’s registration statement on Form F-3 (File No. 333-10892) filed on September 27, 1999 (the “ASE Test 1999 Form-3”)). | |||
119
(b) |
||||
(c) |
^Stock Purchase Agreement dated July 3, 1999 among ASE Investment (Labuan) Inc., ASE Inc., Motorola Asia Ltd. and Motorola, Inc. relating to the purchase and sale of 100.0% of the common stock of Motorola Korea Ltd. (incorporated by reference to Exhibit 10.3 to the ASE Test 1999 Form F-3). | |||
(d) |
||||
(e) |
||||
(f) |
||||
(g) |
||||
(h) |
||||
(i) |
||||
(j) |
||||
(k) |
||||
(l) |
||||
(m) |
||||
120
121
| 8. | *List of Subsidiaries | |||
| 12. | ||||
| (a) | *Certification of Jason C.S. Chang, required by Rule 13a-14(a) of the Exchange Act. | |||
| (b) | *Certification of Joseph Tung, required by Rule 13a-14(a) of the Exchange Act. | |||
| 13. | *Certification of the Principal Executive Officer and the Chief Financial Officer of ASE Technology Holdings Co. Ltd. required by Rule 13a-14(b) of the Exchange Act and Section 1350 of Chapter 63 of Title 18 of the United States Code. | |||
| 15. | ||||
| (a) | *Consent of Deloitte Touche. | |||
| (b) | *Consent of PricewaterhouseCoopers, Taiwan. | |||
| (c) | *Letter from PricewaterhouseCoopers, Taiwan to the U.S. Securities and Exchange Commission, dated March 29, 2022. | |||
| 101.INS* | Inline XBRL Instance Document—this instance document does not appear in the Interactive Data File because its XBRL tags embedded within the Inline XBRL document | |||
| 101.SCH* | Inline XBRL Taxonomy Extension Schema Document | |||
| 101.CAL* | Inline XBRL Taxonomy Extension Calculation Linkbase Document | |||
| 101.DEF* | Inline XBRL Taxonomy Extension Definition Linkbase Document | |||
| 101.LAB* | Inline XBRL Taxonomy Extension Label Linkbase Document | |||
| 101.PRE* | Inline XBRL Taxonomy Extension Presentation Linkbase Document | |||
| 104 | Cover Page Interactive Data File (embedded within the Inline XBRL document) | |||
| † | Does not contain portions for which confidential treatment has been granted. |
^ |
Filed in paper. |
| * | Filed herewith. |
The Company agrees to furnish to the SEC upon request a copy of any instrument which defines the rights of holders of long-term debt of the Company and its consolidated subsidiaries.
122
SIGNATURES
The registrant hereby certifies that it meets all of the requirements for filing on Form
20-F
and that it has duly caused and authorized the undersigned to sign this annual report on its behalf. | ASE TECHNOLOGY HOLDING CO., LTD. | ||
| By: | /s/ Joseph Tung | |
| Name: Title: |
Joseph Tung Chief Financial Officer | |
Date: March 29, 2022
123
ASE Technology Holding Co., Ltd.
and Subsidiaries
Consolidated Financial Statements as of December 31,
2020 and 2021 and for the Years Ended December 31,
2019, 2020 and 2021 and
Reports of Independent Registered Public
Accounting Firms
F-1
REPORT OF INDEPENDENT REGISTERED PUBLIC ACCOUNTING FIRM
To the shareholders and the Board of Directors of
ASE Technology Holding Co., Ltd.
Opinion on the Financial Statements
We have audited the accompanying consolidated balance sheets of ASE Technology Holding Co., Ltd. (a corporation incorporated under the laws of the Republic of China) and its subsidiaries (collectively, the “Group”) as of December 31, 2020 and 2021, the related consolidated statements of comprehensive income, changes in equity and cash flows for each of the three years in the period ended December 31, 2021, and the related notes (collectively referred to as the “Consolidated Financial Statements”) (all expressed in New Taiwan Dollars). In our opinion, based on our audits and the report of other auditors, the Consolidated Financial Statements present fairly, in all material respects, the financial position of the Group as of December 31, 2020 and 2021, and the results of its operations and its cash flows for each of the three years in the period ended December 31, 2021, in conformity with International Financial Reporting Standards as issued by the International Accounting Standards Board.
We did not audit the consolidated financial statements of Siliconware Precision Industries Co., Ltd. and its subsidiaries (collectively, “SPIL”), a wholly owned subsidiary, which statements reflect total assets constituting 22% and 22% of the Group’s consolidated total assets as of December 31, 2020 and 2021, respectively, and total revenue constituting 22%, 21% and 19% of the Group’s consolidated revenues for the years ended December 31, 2019, 2020 and 2021, respectively. The consolidated financial statements of SPIL were audited by other auditors whose report has been furnished to us, and our opinion, insofar as it relates to the amounts included for SPIL, is based solely on the report of other auditors.
Our audits also comprehended the translation of New Taiwan dollar amounts into U.S. dollar amounts and, in our opinion, such translation has been made in conformity with the basis stated in Note 4 to the Consolidated Financial Statements. Such U.S. dollar amounts are presented solely for the convenience of the readers outside the Republic of China.
We have also audited, in accordance with the standards of the Public Company Accounting Oversight Board (United States) (PCAOB), the Group’s internal control over financial reporting as of December 31, 2021, based on criteria established in issued by the Committee of Sponsoring Organizations of the Treadway Commission and our report dated March 25, 2022, expressed an unqualified opinion on the Group’s internal control over financial reporting based on our audit and the report of other auditors.
Internal Control—Integrated Framework (2013)
F-2
Basis for Opinion
These Consolidated Financial Statements are the responsibility of the Group’s management. Our responsibility is to express an opinion on the Group’s Consolidated Financial Statements based on our audits. We are a public accounting firm registered with the PCAOB and are required to be independent with respect to the Group in accordance with the U.S. federal securities laws and the applicable rules and regulations of the Securities and Exchange Commission and the PCAOB.
We conducted our audits in accordance with the standards of the PCAOB. Those standards require that we plan and perform the audit to obtain reasonable assurance about whether the Consolidated Financial Statements are free of material misstatement, whether due to error or fraud. Our audits included performing procedures to assess the risks of material misstatement of the Consolidated Financial Statements, whether due to error or fraud, and performing procedures that respond to those risks. Such procedures included examining, on a test basis, evidence regarding the amounts and disclosures in the Consolidated Financial Statements. Our audits also included evaluating the accounting principles used and significant estimates made by management, as well as evaluating the overall presentation of the Consolidated Financial Statements. We believe that our audits and the report of other auditors provide a reasonable basis for our opinion.
Critical Audit Matter
The critical audit matter communicated below is a matter arising from the current-period audit of the Consolidated Financial Statements that was communicated or required to be communicated to the audit committee and that (1) relates to accounts or disclosures that are material to the financial statements and (2) involved our especially challenging, subjective, or complex judgments. The communication of critical audit matters does not alter in any way our opinion on the Consolidated Financial Statements, taken as a whole, and we are not, by communicating the critical audit matter below, providing a separate opinion on the critical audit matter or on the accounts or disclosures to which it relates.
Goodwill - Packaging and Testing Segments - Refer to Notes 4, 5, 18, 29 and 30 to the Consolidated Financial Statements
Critical Audit Matter Description
The Group’s evaluation of goodwill for impairment involves the comparison of the value in use of each segment to its carrying value. The Group used the discounted cash flow model to estimate value in use, which requires management to make significant estimates and assumptions related to discount rates and forecasts of future revenues. Changes in these assumptions could have a significant impact on either the value in use, the amount of any goodwill impairment charge, or both. The goodwill balance was NT$52,072,413 thousand (US$1,877,161 thousand) as of December 31, 2021, of which NT$35,412,424 thousand (US$1,276,584 thousand) and NT$13,304,040 thousand (US$479,598 thousand) were allocated to the packaging and testing segments, respectively. The value in use of the packaging and testing segments exceeded their carrying values as of the measurement date and, therefore, no impairment was recognized.
We identified the valuation of goodwill for the Group’s packaging and testing segments as a critical audit matter due to the significant estimates and assumptions management makes to estimate the value in use of the packaging and testing segments and the sensitivity of their operations to changes in demand. Auditing management’s judgments related to the selection of the discount rates and forecasts of future revenues for the packaging and testing segments required a high degree of auditor judgment and an increased extent of effort, including the need to involve our fair value specialists.
F-3
How the Critical Audit Matter Was Addressed in the Audit
Our audit procedures related to the discount rates and forecasts of future revenues used by management to estimate the value in use of the packaging and testing segments included the following, among others:
• |
We tested the design and operating effectiveness of controls over management’s goodwill impairment evaluation, including those over the determination of the value in use of the packaging and testing segments, such as controls related to management’s selection of the discount rate and assessment on the reasonableness of forecasts of future revenue. |
• |
We evaluated management’s ability to accurately forecast future revenues of the packaging and testing segments by comparing their actual results to management’s historical forecasts. |
• |
We performed sensitivity analyses to evaluate the risk of impairment if key assumptions are changed. |
• |
With the assistance of our fair value specialists, we evaluated the reasonableness of the discount rates by performing certain procedures, including: |
- |
Testing the source information underlying the determination of the discount rates and the mathematical accuracy of the calculation. |
- |
Developing a range of independent estimates and comparing those to the discount rates selected by management. |
/s/ Deloitte Touche
Republic of China
March 25, 2022
We have served as the Group’s auditor since 1984.
F-4
| Report of Independent Registered Public Accounting Firm |
To the Board of Directors and Shareholder of
Siliconware Precision Industries Co., Ltd.
Opinions on the Financial Statements and Internal Control over Financial Reporting
We have audited the accompanying consolidated balance sheets of Siliconware Precision Industries Co., Ltd. and its subsidiaries (the “Company”) as of December 31, 2021 and 2020, and the related consolidated statements of comprehensive income, of changes in equity and of cash flows for each of the three years in the period ended December 31, 2021, including the related notes (collectively referred to as the “consolidated financial statements”) (not presented herein). We also have audited the Company’s internal control over financial reporting as of December 31, 2021, based on criteria established in issued by the Committee of Sponsoring Organizations of the Treadway Commission (COSO).
Internal Control—Integrated Framework
(2013)
In our opinion, the consolidated financial statements referred to above present fairly, in all material respects, the financial position of the Company as of December 31, 2021 and 2020, and the results of its operations and its cash flows for each of the three years in the period ended December 31, 2021 in conformity with International Financial Reporting Standards as issued by the International Accounting Standards Board. Also in our opinion, the Company maintained, in all material respects, effective internal control over financial reporting as of December 31, 2021, based on criteria established in issued by the COSO.
Internal Control—Integrated Framework
(2013)
Basis for Opinions
The Company’s management is responsible for these consolidated financial statements, for maintaining effective internal control over financial reporting, and for its assessment of the effectiveness of internal control over financial reporting, included in Management’s Annual Report on Internal Control over Financial Reporting (not presented herein). Our responsibility is to express opinions on the Company’s consolidated financial statements and on the Company’s internal control over financial reporting based on our audits. We are a public accounting firm registered with the Public Company Accounting Oversight Board (United States) (PCAOB) and are required to be independent with respect to the Company in accordance with the U.S. federal securities laws and the applicable rules and regulations of the Securities and Exchange Commission and the PCAOB.
We conducted our audits in accordance with the standards of the PCAOB. Those standards require that we plan and perform the audits to obtain reasonable assurance about whether the consolidated financial statements are free of material misstatement, whether due to error or fraud, and whether effective internal control over financial reporting was maintained in all material respects.
F-5
Our audits of the consolidated financial statements included performing procedures to assess the risks of material misstatement of the consolidated financial statements, whether due to error or fraud, and performing procedures that respond to those risks. Such procedures included examining, on a test basis, evidence regarding the amounts and disclosures in the consolidated financial statements. Our audits also included evaluating the accounting principles used and significant estimates made by management, as well as evaluating the overall presentation of the consolidated financial statements. Our audit of internal control over financial reporting included obtaining an understanding of internal control over financial reporting, assessing the risk that a material weakness exists, and testing and evaluating the design and operating effectiveness of internal control based on the assessed risk. Our audits also included performing such other procedures as we considered necessary in the circumstances. We believe that our audits provide a reasonable basis for our opinions.
Definition and Limitations of Internal Control over Financial Reporting
A company’s internal control over financial reporting is a process designed to provide reasonable assurance regarding the reliability of financial reporting and the preparation of financial statements for external purposes in accordance with generally accepted accounting principles. A company’s internal control over financial reporting includes those policies and procedures that (i) pertain to the maintenance of records that, in reasonable detail, accurately and fairly reflect the transactions and dispositions of the assets of the company; (ii) provide reasonable assurance that transactions are recorded as necessary to permit preparation of financial statements in accordance with generally accepted accounting principles, and that receipts and expenditures of the company are being made only in accordance with authorizations of management and directors of the company; and (iii) provide reasonable assurance regarding prevention or timely detection of unauthorized acquisition, use, or disposition of the company’s assets that could have a material effect on the financial statements.
Because of its inherent limitations, internal control over financial reporting may not prevent or detect misstatements. Also, projections of any evaluation of effectiveness to future periods are subject to the risk that controls may become inadequate because of changes in conditions, or that the degree of compliance with the policies or procedures may deteriorate.
Critical Audit Matters
Critical audit matters are matters arising from the current period audit of the consolidated financial statements that were communicated or required to be communicated to the Board of Directors and that (i) relate to accounts or disclosures that are material to the consolidated financial statements and (ii) involved our especially challenging, subjective, or complex judgments. We determined that there are no critical audit matters.
/s/ PricewaterhouseCoopers, Taiwan
Republic of China
March 16, 2022
We have served as the Company’s auditor since 1994.
F-6
ASE TECHNOLOGY HOLDING CO., LTD. AND SUBSIDIARIES
CONSOLIDATED BALANCE SHEETS
(Amounts in Thousands)
December 31, 2020 |
||||||||||||
(Retrospectively |
||||||||||||
Adjusted) |
December 31, 2021 |
|||||||||||
ASSETS |
NT$ |
NT$ |
US$ (Note 4) |
|||||||||
| CURRENT ASSETS |
||||||||||||
| Cash and cash equivalents (Note 6) |
$ | $ | $ | |||||||||
| Financial assets at fair value through profit or loss - current (Note 7) |
||||||||||||
| Contract assets - current (Note 4 0 ) |
||||||||||||
| Trade receivables, net (Note 10) |
||||||||||||
| Other receivables (Notes 10 and 3 0 ) |
||||||||||||
| Current tax assets (Note 26) |
||||||||||||
| Inventories (Note 11) |
||||||||||||
| Inventories related to real estate business (Notes 12 and 36) |
||||||||||||
| Other financial assets - current (Notes 13 and 36) |
||||||||||||
| Other current assets |
||||||||||||
| |
|
|
|
|
|
|||||||
| Total current assets |
||||||||||||
| |
|
|
|
|
|
|||||||
| NON-CURRENT ASSETS |
||||||||||||
| Financial assets at fair value through profit or loss - non-current (Note 7) |
||||||||||||
| Financial assets at fair value through other comprehensive income - non-current (Note 8) |
||||||||||||
| Investments accounted for using the equity method (Note 14) |
||||||||||||
| Property, plant and equipment (Notes 15, 25, 36 and 37) |
||||||||||||
| Right-of-use |
||||||||||||
| Investment properties (Notes 17, 25 and 36) |
||||||||||||
| Goodwill (Note 18) |
||||||||||||
| Other intangible assets (Notes 19 and 25) |
||||||||||||
| Deferred tax assets (Note 26) |
||||||||||||
| Other financial assets - non-current (Notes 13 and 36) |
||||||||||||
| Other non-current assets |
||||||||||||
| |
|
|
|
|
|
|||||||
| Total non-current assets |
||||||||||||
| |
|
|
|
|
|
|||||||
| TOTAL |
$ | $ | |
$ | |
|||||||
| |
|
|
|
|
|
|||||||
(Continued)
F-7
ASE TECHNOLOGY HOLDING CO., LTD. AND SUBSIDIARIES
CONSOLIDATED BALANCE SHEETS
(Amounts in Thousands)
December 31, 2020 |
||||||||||||
(Retrospectively |
||||||||||||
Adjusted) |
December 31, 2021 |
|||||||||||
LIABILITIES AND EQUITY |
NT$ |
NT$ |
US$ (Note 4) |
|||||||||
| CURRENT LIABILITIES |
||||||||||||
| Short-term borrowings (Note 20) |
$ | $ | $ | |||||||||
| Financial liabilities at fair value through profit or loss - current (Note 7) |
||||||||||||
| Financial liabilities for hedging - current (Notes 20 and 34) |
||||||||||||
| Trade payables |
||||||||||||
| Other payables (Note 22) |
||||||||||||
| Current tax liabilities (Note 26) |
||||||||||||
| Lease liabilities - current (Note 16) |
||||||||||||
| Current portion of bonds payable (Note 21) |
||||||||||||
| Current portion of long-term borrowings (Notes 20 and 36) |
||||||||||||
| Other current liabilities |
||||||||||||
| |
|
|
|
|
|
|||||||
| Total current liabilities |
||||||||||||
| |
|
|
|
|
|
|||||||
| NON-CURRENT LIABILITIES |
||||||||||||
| Financial liabilities for hedging - non-current (Notes 20 and 34) |
||||||||||||
| Bonds payable (Note 21) |
||||||||||||
| Long-term borrowings (Notes 20 and 36) |
||||||||||||
| Deferred tax liabilities (Note 26) |
||||||||||||
| Lease liabilities - non-current (Note 16) |
||||||||||||
| Net defined benefit liabilities (Note 23) |
||||||||||||
| Other non-current liabilities |
||||||||||||
| |
|
|
|
|
|
|||||||
| Total non-current liabilities |
||||||||||||
| |
|
|
|
|
|
|||||||
| Total liabilities |
||||||||||||
| |
|
|
|
|
|
|||||||
| EQUITY ATTRIBUTABLE TO OWNERS OF THE COMPANY (Note 24) |
||||||||||||
| Share capital |
||||||||||||
| Ordinary shares |
||||||||||||
| Shares subscribed in advance |
||||||||||||
| |
|
|
|
|
|
|||||||
| Total share capital |
||||||||||||
| |
|
|
|
|
|
|||||||
| Capital surplus |
||||||||||||
| |
|
|
|
|
|
|||||||
| Retained earnings |
||||||||||||
| Legal reserve |
||||||||||||
| Special reserve |
||||||||||||
| Unappropriated earnings |
||||||||||||
| |
|
|
|
|
|
|||||||
| Total retained earnings |
||||||||||||
| |
|
|
|
|
|
|||||||
| Other equity |
( |
) | ( |
) | ( |
) | ||||||
| |
|
|
|
|
|
|||||||
| Treasury shares |
( |
) | ( |
) | ( |
) | ||||||
| |
|
|
|
|
|
|||||||
| Equity attributable to owners of the Company |
||||||||||||
| NON-CONTROLLING INTERESTS (Note 24) |
||||||||||||
| |
|
|
|
|
|
|||||||
| Total equity |
||||||||||||
| |
|
|
|
|
|
|||||||
| TOTAL |
$ | $ | |
$ | |
|||||||
| |
|
|
|
|
|
|||||||
The accompanying notes are an integral part of the consolidated financial statements. |
(Concluded) |
F-8
ASE TECHNOLOGY HOLDING CO., LTD. AND SUBSIDIARIES
CONSOLIDATED STATEMENTS OF COMPREHENSIVE INCOME
(Amounts in Thousands Except Earnings Per Share)
For the Year Ended December 31 |
||||||||||||||||
2019 |
2020 |
2021 |
||||||||||||||
NT$ |
NT$ |
NT$ |
US$ (Note 4) |
|||||||||||||
| OPERATING REVENUES (Note 4 0 ) |
$ | |
$ | |
$ | |
$ | |
||||||||
| OPERATING COSTS (Notes 11 and 25) |
||||||||||||||||
| |
|
|
|
|
|
|
|
|||||||||
| GROSS PROFIT |
||||||||||||||||
| |
|
|
|
|
|
|
|
|||||||||
| OPERATING EXPENSES (Note 25) |
||||||||||||||||
| Selling and marketing expenses |
||||||||||||||||
| General and administrative expenses |
||||||||||||||||
| Research and development expenses |
||||||||||||||||
| |
|
|
|
|
|
|
|
|||||||||
| Total operating expenses |
||||||||||||||||
| |
|
|
|
|
|
|
|
|||||||||
| OTHER OPERATING INCOME AND EXPENSES, NET (Note 25) |
( |
) | ||||||||||||||
| |
|
|
|
|
|
|
|
|||||||||
| PROFIT FROM OPERATIONS |
||||||||||||||||
| |
|
|
|
|
|
|
|
|||||||||
| NON-OPERATING INCOME AND EXPENSES |
||||||||||||||||
| Other income (Note 25) |
||||||||||||||||
| Other gains and losses (Note 25) |
||||||||||||||||
| Finance costs (Note 25) |
( |
) | ( |
) | ( |
) | ( |
) | ||||||||
| Share of the profit or loss of associates and joint ventures |
||||||||||||||||
| |
|
|
|
|
|
|
|
|||||||||
| Total non-operating income and expenses |
||||||||||||||||
| |
|
|
|
|
|
|
|
|||||||||
| PROFIT BEFORE INCOME TAX |
||||||||||||||||
| INCOME TAX EXPENSE (Note 26) |
||||||||||||||||
| |
|
|
|
|
|
|
|
|||||||||
| PROFIT FOR THE YEAR |
||||||||||||||||
| |
|
|
|
|
|
|
|
|||||||||
| OTHER COMPREHENSIVE INCOME (LOSS) |
||||||||||||||||
| Items that will not be reclassified subsequently to profit or loss: |
||||||||||||||||
| Remeasurement of defined benefit obligation |
( |
) | ( |
) | ||||||||||||
| Unrealized gain (loss) on equity instruments at fair value through other comprehensive income |
( |
) | ( |
) | ||||||||||||
| Share of other comprehensive income of associates and joint ventures |
||||||||||||||||
| Income tax relating to items that will not be reclassified subsequently to profit or loss |
( |
) | ( |
) | ( |
) | ( |
) | ||||||||
| |
|
|
|
|
|
|
|
|||||||||
| |
|
|
|
|
|
|
|
|||||||||
(Continued)
F-9
ASE TECHNOLOGY HOLDING CO., LTD. AND SUBSIDIARIES
CONSOLIDATED STATEMENTS OF COMPREHENSIVE INCOME
(Amounts in Thousands Except Earnings Per Share)
For the Year Ended December 31 |
||||||||||||||||
2019 |
2020 |
2021 |
||||||||||||||
NT$ |
NT$ |
NT$ |
US$ (Note 4) |
|||||||||||||
| Items that may be reclassified subsequently to profit or loss: |
||||||||||||||||
| Exchange differences on translating foreign operations |
$ | ( |
) | $ | ( |
) | $ | ( |
) | $ | ( |
) | ||||
| Unrealized gain (loss) on debt investments at fair value through other comprehensive income |
( |
) | ( |
) | ||||||||||||
| Gain (loss) on hedging instruments |
- | ( |
) | |||||||||||||
| Share of other comprehensive income (loss) of associates and joint ventures |
( |
) | ||||||||||||||
| |
|
|
|
|
|
|
|
|||||||||
| ( |
) | ( |
) | ( |
) | ( |
) | |||||||||
| |
|
|
|
|
|
|
|
|||||||||
| Other comprehensive income (loss) for the year, net of income tax |
( |
) | ||||||||||||||
| |
|
|
|
|
|
|
|
|||||||||
| TOTAL COMPREHENSIVE INCOME FOR THE YEAR |
$ | |
$ | |
$ | |
$ | |||||||||
| |
|
|
|
|
|
|
|
|||||||||
| NET PROFIT ATTRIBUTABLE TO: |
||||||||||||||||
| Owners of the Company |
$ | $ | $ | $ | ||||||||||||
| Non-controlling interests |
||||||||||||||||
| |
|
|
|
|
|
|
|
|||||||||
| $ | $ | $ | $ | |||||||||||||
| |
|
|
|
|
|
|
|
|||||||||
| TOTAL COMPREHENSIVE INCOME ATTRIBUTABLE TO: |
||||||||||||||||
| Owners of the Company |
$ | $ | $ | $ | ||||||||||||
| Non-controlling interests |
||||||||||||||||
| |
|
|
|
|
|
|
|
|||||||||
| $ | $ | $ | $ | |||||||||||||
| |
|
|
|
|
|
|
|
|||||||||
| EARNINGS PER SHARE (Note 27) |
||||||||||||||||
| Basic |
$ | $ | $ | $ | ||||||||||||
| |
|
|
|
|
|
|
|
|||||||||
| Diluted |
$ | $ | $ | $ | ||||||||||||
| |
|
|
|
|
|
|
|
|||||||||
| EARNINGS PER AMERICAN DEPOSITARY SHARE (“ADS”) (Note 27) |
||||||||||||||||
| Basic |
$ | $ | $ | $ | ||||||||||||
| |
|
|
|
|
|
|
|
|||||||||
| Diluted |
$ | $ | $ | $ | ||||||||||||
| |
|
|
|
|
|
|
|
|||||||||
| The accompanying notes are an integral part of the consolidated financial statements. | (Concluded) |
F-10
ASE TECHNOLOGY HOLDING CO., LTD. AND SUBSIDIARIES
CONSOLIDATED STATEMENTS OF CHANGES IN EQUITY
(Amounts in Thousands)
Equity Attributable to Owners of the Company |
||||||||||||||||||||||||||||||||||||||||||||||||||||||||||||||||
Other Equity |
||||||||||||||||||||||||||||||||||||||||||||||||||||||||||||||||
Unrealized Gain |
||||||||||||||||||||||||||||||||||||||||||||||||||||||||||||||||
Exchange |
(Loss) on Financial |
|||||||||||||||||||||||||||||||||||||||||||||||||||||||||||||||
Differences on |
Assets at Fair Value |
|||||||||||||||||||||||||||||||||||||||||||||||||||||||||||||||
Share Capital |
Retained Earnings |
Translating |
Through Other |
Gain (Loss) |
Unearned |
Non- |
||||||||||||||||||||||||||||||||||||||||||||||||||||||||||
Shares |
Capital |
Legal |
Special |
Unappropriated |
Foreign |
Comprehensive |
on Hedging |
Employee |
Treasury |
controlling |
||||||||||||||||||||||||||||||||||||||||||||||||||||||
(In Thousands) |
Amounts |
Surplus |
Reserve |
Reserve |
Earnings |
Total |
Operations |
Income |
Instruments |
Compensation |
Total |
Shares |
Total |
Interests |
Total Equity |
|||||||||||||||||||||||||||||||||||||||||||||||||
| BALANCE AT JANUARY 1, 2019 |
$ | $ | $ | — | $ | $ | $ | $ | ( |
) | $ | ( |
) | $ | — | $ | — | $ | ( |
) | $ | ( |
) | $ | $ | $ | ||||||||||||||||||||||||||||||||||||||
| |
|
|
|
|
|
|
|
|
|
|
|
|
|
|
|
|
|
|
|
|
|
|
|
|
|
|
|
|
|
|
|
|||||||||||||||||||||||||||||||||
| Appropriation of 2018 earnings |
||||||||||||||||||||||||||||||||||||||||||||||||||||||||||||||||
| Legal reserve |
— | — | — | — | ( |
) | — | — | — | — | — | — | — | — | — | — | ||||||||||||||||||||||||||||||||||||||||||||||||
| Special reserve |
— | — | — | — | ( |
) | — | — | — | — | — | — | — | — | — | — | ||||||||||||||||||||||||||||||||||||||||||||||||
| Cash dividends distributed by the Company |
— | — | — | — | — | ( |
) | ( |
) | — | — | — | — | — | — | ( |
) | — | ( |
) | ||||||||||||||||||||||||||||||||||||||||||||
| |
|
|
|
|
|
|
|
|
|
|
|
|
|
|
|
|
|
|
|
|
|
|
|
|
|
|
|
|
|
|
|
|||||||||||||||||||||||||||||||||
| — | — | — | ( |
) | ( |
) | — | — | — | — | — | — | ( |
) | — | ( |
) | |||||||||||||||||||||||||||||||||||||||||||||||
| |
|
|
|
|
|
|
|
|
|
|
|
|
|
|
|
|
|
|
|
|
|
|
|
|
|
|
|
|
|
|
|
|||||||||||||||||||||||||||||||||
| Change from investments in associates accounted for using the equity method |
— | — | — | — | — | — | — | — | — | — | — | — | — | |||||||||||||||||||||||||||||||||||||||||||||||||||
| |
|
|
|
|
|
|
|
|
|
|
|
|
|
|
|
|
|
|
|
|
|
|
|
|
|
|
|
|
|
|
|
|||||||||||||||||||||||||||||||||
| Other changes in the capital surplus |
— | — | — | — | — | — | — | — | — | — | — | — | — | |||||||||||||||||||||||||||||||||||||||||||||||||||
| |
|
|
|
|
|
|
|
|
|
|
|
|
|
|
|
|
|
|
|
|
|
|
|
|
|
|
|
|
|
|
|
|||||||||||||||||||||||||||||||||
| Net profit for the year ended December 31, 2019 |
— | — | — | — | — | — | — | — | — | — | — | |||||||||||||||||||||||||||||||||||||||||||||||||||||
| Other comprehensive income (loss) for the year ended |
||||||||||||||||||||||||||||||||||||||||||||||||||||||||||||||||
| December 31, 2019, net of income tax |
— | — | — | — | — | ( |
) | ( |
) | ( |
) | — | — | ( |
) | — | ( |
) | ( |
) | ( |
) | ||||||||||||||||||||||||||||||||||||||||||
| |
|
|
|
|
|
|
|
|
|
|
|
|
|
|
|
|
|
|
|
|
|
|
|
|
|
|
|
|
|
|
|
|||||||||||||||||||||||||||||||||
| Total comprehensive income (loss) for the year ended December 31, 2019 |
— | — | — | — | — | ( |
) | — | — | ( |
) | — | ||||||||||||||||||||||||||||||||||||||||||||||||||||
| |
|
|
|
|
|
|
|
|
|
|
|
|
|
|
|
|
|
|
|
|
|
|
|
|
|
|
|
|
|
|
|
|||||||||||||||||||||||||||||||||
| Cash dividends received by subsidiaries from the Company |
— | — | — | — | — | — | — | — | — | — | — | — | — | |||||||||||||||||||||||||||||||||||||||||||||||||||
| |
|
|
|
|
|
|
|
|
|
|
|
|
|
|
|
|
|
|
|
|
|
|
|
|
|
|
|
|
|
|
|
|||||||||||||||||||||||||||||||||
| Disposal of interest in investments accounted for using the equity method (Note 14) |
— | — | ( |
) | — | — | — | — | — | — | — | — | ( |
) | — | ( |
) | |||||||||||||||||||||||||||||||||||||||||||||||
| |
|
|
|
|
|
|
|
|
|
|
|
|
|
|
|
|
|
|
|
|
|
|
|
|
|
|
|
|
|
|
|
|||||||||||||||||||||||||||||||||
| Differences between consideration and carrying amount arising from acquisition or disposal of subsidiaries (Note 31) |
— | — | ( |
) | — | — | — | — | — | — | — | — | — | — | ( |
) | ( |
) | ( |
) | ||||||||||||||||||||||||||||||||||||||||||||
| |
|
|
|
|
|
|
|
|
|
|
|
|
|
|
|
|
|
|
|
|
|
|
|
|
|
|
|
|
|
|
|
|||||||||||||||||||||||||||||||||
| Changes in percentage of ownership interest in subsidiaries (Note 31) |
— | — | ( |
) | — | — | — | — | — | — | — | — | — | — | ( |
) | ( |
) | ( |
) | ||||||||||||||||||||||||||||||||||||||||||||
| |
|
|
|
|
|
|
|
|
|
|
|
|
|
|
|
|
|
|
|
|
|
|
|
|
|
|
|
|
|
|
|
|||||||||||||||||||||||||||||||||
| Issue of ordinary shares under employee share options (Note 28) |
— | — | — | — | — | — | — | — | — | — | — | |||||||||||||||||||||||||||||||||||||||||||||||||||||
| |
|
|
|
|
|
|
|
|
|
|
|
|
|
|
|
|
|
|
|
|
|
|
|
|
|
|
|
|
|
|
|
|||||||||||||||||||||||||||||||||
| Cash dividends distributed by subsidiaries |
— | — | — | — | — | — | — | — | — | — | — | — | — | — | ( |
) | ( |
) | ||||||||||||||||||||||||||||||||||||||||||||||
| |
|
|
|
|
|
|
|
|
|
|
|
|
|
|
|
|
|
|
|
|
|
|
|
|
|
|
|
|
|
|
|
|||||||||||||||||||||||||||||||||
| Additional non-controlling interest arising on issue of employee share options by subsidiaries (Note 28) |
— | — | ( |
) | — | — | — | — | — | — | — | — | — | — | ( |
) | ||||||||||||||||||||||||||||||||||||||||||||||||
| |
|
|
|
|
|
|
|
|
|
|
|
|
|
|
|
|
|
|
|
|
|
|
|
|
|
|
|
|
|
|
|
|||||||||||||||||||||||||||||||||
| Disposal of investments in equity instruments at fair value through other comprehensive income |
— | — | — | — | — | — | ( |
) | — | — | ( |
) | — | — | — | — | ||||||||||||||||||||||||||||||||||||||||||||||||
| |
|
|
|
|
|
|
|
|
|
|
|
|
|
|
|
|
|
|
|
|
|
|
|
|
|
|
|
|
|
|
|
|||||||||||||||||||||||||||||||||
| BALANCE AT DECEMBER 31, 2019 |
$ |
$ |
$ |
$ |
$ |
$ |
$ |
( |
) | $ |
( |
) | $ |
— | $ |
— | $ |
( |
) | $ |
( |
) | $ |
$ |
$ |
|||||||||||||||||||||||||||||||||||||||
| BALANCE AT JANUARY 1, 2020 |
$ |
$ |
$ |
$ |
$ |
$ |
$ |
( |
) | $ |
( |
) | $ |
— | $ |
— | $ |
( |
) | $ |
( |
) | $ |
$ |
$ |
|||||||||||||||||||||||||||||||||||||||
| |
|
|
|
|
|
|
|
|
|
|
|
|
|
|
|
|
|
|
|
|
|
|
|
|
|
|
|
|
|
|
|
|||||||||||||||||||||||||||||||||
| Appropriation of 2019 earnings |
||||||||||||||||||||||||||||||||||||||||||||||||||||||||||||||||
| Legal reserve |
— | — | — | — | ( |
) | — | — | — | — | — | — | — | — | — | — | ||||||||||||||||||||||||||||||||||||||||||||||||
| Special reserve |
— | — | — | — | ( |
) | — | — | — | — | — | — | — | — | — | — | ||||||||||||||||||||||||||||||||||||||||||||||||
| Cash dividends distributed by the Company |
— | — | — | — | — | ( |
) | ( |
) | — | — | — | — | — | — | ( |
) | — | ( |
) | ||||||||||||||||||||||||||||||||||||||||||||
| |
|
|
|
|
|
|
|
|
|
|
|
|
|
|
|
|
|
|
|
|
|
|
|
|
|
|
|
|
|
|
|
|||||||||||||||||||||||||||||||||
| — | — | — | ( |
) | ( |
) | — | — | — | — | — | — | ( |
) | — | ( |
) | |||||||||||||||||||||||||||||||||||||||||||||||
| |
|
|
|
|
|
|
|
|
|
|
|
|
|
|
|
|
|
|
|
|
|
|
|
|
|
|
|
|
|
|
|
|||||||||||||||||||||||||||||||||
| Change from investments in associates accounted for using the equity method |
— | — | — | — | — | — | — | — | — | — | — | — | — | |||||||||||||||||||||||||||||||||||||||||||||||||||
| |
|
|
|
|
|
|
|
|
|
|
|
|
|
|
|
|
|
|
|
|
|
|
|
|
|
|
|
|
|
|
|
|||||||||||||||||||||||||||||||||
| Other changes in the capital surplus |
— | — | — | — | — | — | — | — | — | — | — | — | — | |||||||||||||||||||||||||||||||||||||||||||||||||||
| |
|
|
|
|
|
|
|
|
|
|
|
|
|
|
|
|
|
|
|
|
|
|
|
|
|
|
|
|
|
|
|
|||||||||||||||||||||||||||||||||
| Net profit for the year ended December 31, 2020 |
— | — | — | — | — | — | — | — | — | — | — | |||||||||||||||||||||||||||||||||||||||||||||||||||||
| Other comprehensive income (loss) for the year ended |
||||||||||||||||||||||||||||||||||||||||||||||||||||||||||||||||
| December 31, 2020, net of income tax |
— | — | — | — | — | ( |
) | ( |
) | ( |
) | ( |
) | — | — | |||||||||||||||||||||||||||||||||||||||||||||||||
| |
|
|
|
|
|
|
|
|
|
|
|
|
|
|
|
|
|
|
|
|
|
|
|
|
|
|
|
|
|
|
|
|||||||||||||||||||||||||||||||||
| Total comprehensive income (loss) for the year ended December 31, 2020 |
— | — | — | — | — | ( |
) | ( |
) | — | — | |||||||||||||||||||||||||||||||||||||||||||||||||||||
| |
|
|
|
|
|
|
|
|
|
|
|
|
|
|
|
|
|
|
|
|
|
|
|
|
|
|
|
|
|
|
|
|||||||||||||||||||||||||||||||||
| Cash dividends received by subsidiaries from the Company |
— | — | — | — | — | — | — | — | — | — | — | — | — | |||||||||||||||||||||||||||||||||||||||||||||||||||
| |
|
|
|
|
|
|
|
|
|
|
|
|
|
|
|
|
|
|
|
|
|
|
|
|
|
|
|
|
|
|
|
|||||||||||||||||||||||||||||||||
| Disposal of interest in investments accounted for using the equity method (Note 14) |
— | — | — | — | ( |
) | ( |
) | — | — | — | — | ||||||||||||||||||||||||||||||||||||||||||||||||||||
| |
|
|
|
|
|
|
|
|
|
|
|
|
|
|
|
|
|
|
|
|
|
|
|
|
|
|
|
|
|
|
|
|||||||||||||||||||||||||||||||||
(Continued)
F-11
ASE TECHNOLOGY HOLDING CO., LTD. AND SUBSIDIARIES
CONSOLIDATED STATEMENTS OF CHANGES IN EQUITY
(Amounts in Thousands)
Equity Attributable to Owners of the Company |
||||||||||||||||||||||||||||||||||||||||||||||||||||||||||||||||
Other Equity |
||||||||||||||||||||||||||||||||||||||||||||||||||||||||||||||||
Unrealized Gain |
||||||||||||||||||||||||||||||||||||||||||||||||||||||||||||||||
(Loss) on |
||||||||||||||||||||||||||||||||||||||||||||||||||||||||||||||||
Financial |
||||||||||||||||||||||||||||||||||||||||||||||||||||||||||||||||
Exchange |
Assets at |
|||||||||||||||||||||||||||||||||||||||||||||||||||||||||||||||
Differences on |
Fair Value |
|||||||||||||||||||||||||||||||||||||||||||||||||||||||||||||||
Share Capital |
Retained Earnings |
Translating |
Through Other |
Gain (Loss) |
Unearned |
Non- |
||||||||||||||||||||||||||||||||||||||||||||||||||||||||||
Shares |
Capital |
Legal |
Special |
Unappropriated |
Foreign |
Comprehensive |
on Hedging |
Employee |
Treasury |
controlling |
||||||||||||||||||||||||||||||||||||||||||||||||||||||
(In Thousands) |
Amounts |
Surplus |
Reserve |
Reserve |
Earnings |
Total |
Operations |
Income |
Instruments |
Compensation |
Total |
Shares |
Total |
Interests |
Total Equity |
|||||||||||||||||||||||||||||||||||||||||||||||||
| Differences between consideration and carrying amount arising from acquisition or disposal of subsidiaries (Notes 31) |
— | $ | — | $ | ( |
) | $ | — | $ | — | $ | — | $ | — | $ | — | $ | — | $ | — | $ | — | $ | — | $ | — | $ | ( |
) | $ | ( |
) | $ | ( |
) | |||||||||||||||||||||||||||||
| |
|
|
|
|
|
|
|
|
|
|
|
|
|
|
|
|
|
|
|
|
|
|
|
|
|
|
|
|
|
|
|
|||||||||||||||||||||||||||||||||
| Changes in percentage of ownership interest in subsidiaries (Note 31) |
— | — | ( |
) | — | — | ( |
) | ( |
) | — | — | — | — | — | — | ( |
) | ( |
) | ( |
) | ||||||||||||||||||||||||||||||||||||||||||
| |
|
|
|
|
|
|
|
|
|
|
|
|
|
|
|
|
|
|
|
|
|
|
|
|
|
|
|
|
|
|
|
|||||||||||||||||||||||||||||||||
| Issue of ordinary shares under employee share options (Note 28) |
— | — | — | — | — | — | — | — | — | — | — | |||||||||||||||||||||||||||||||||||||||||||||||||||||
| |
|
|
|
|
|
|
|
|
|
|
|
|
|
|
|
|
|
|
|
|
|
|
|
|
|
|
|
|
|
|
|
|||||||||||||||||||||||||||||||||
| Cash dividends distributed by subsidiaries |
— | — | — | — | — | — | — | — | — | — | — | — | — | — | ( |
) | ( |
) | ||||||||||||||||||||||||||||||||||||||||||||||
| |
|
|
|
|
|
|
|
|
|
|
|
|
|
|
|
|
|
|
|
|
|
|
|
|
|
|
|
|
|
|
|
|||||||||||||||||||||||||||||||||
| Additional non-controlling interest arising on issue of employee share options by subsidiaries (Note 28) |
— | — | ( |
) | — | — | ( |
) | ( |
) | — | — | — | — | — | — | ( |
) | ||||||||||||||||||||||||||||||||||||||||||||||
| |
|
|
|
|
|
|
|
|
|
|
|
|
|
|
|
|
|
|
|
|
|
|
|
|
|
|
|
|
|
|
|
|||||||||||||||||||||||||||||||||
| Disposal of investments in equity instruments at fair value through other comprehensive income |
— | — | — | — | — | — | ( |
) | — | — | ( |
) | — | — | — | — | ||||||||||||||||||||||||||||||||||||||||||||||||
| |
|
|
|
|
|
|
|
|
|
|
|
|
|
|
|
|
|
|
|
|
|
|
|
|
|
|
|
|
|
|
|
|||||||||||||||||||||||||||||||||
| BALANCE AT DECEMBER 31, 2020 (RETROSPECTIVELY ADJUSTED) |
$ |
$ |
$ |
$ |
$ |
$ |
$ |
( |
) | $ |
$ |
( |
) | $ |
— | $ |
( |
) | $ |
( |
) | $ |
$ |
$ |
||||||||||||||||||||||||||||||||||||||||
| |
|
|
|
|
|
|
|
|
|
|
|
|
|
|
|
|
|
|
|
|
|
|
|
|
|
|
|
|
|
|
|
|||||||||||||||||||||||||||||||||
| BALANCE AT JANUARY 1, 2021 (RETROSPECTIVELY ADJUSTED) |
$ |
$ |
$ |
$ |
$ |
$ |
$ |
( |
) | $ |
$ |
( |
) | $ |
— | $ |
( |
) | $ |
( |
) | $ |
$ |
$ |
||||||||||||||||||||||||||||||||||||||||
| |
|
|
|
|
|
|
|
|
|
|
|
|
|
|
|
|
|
|
|
|
|
|
|
|
|
|
|
|
|
|
|
|||||||||||||||||||||||||||||||||
| Appropriation of 2020 earnings |
||||||||||||||||||||||||||||||||||||||||||||||||||||||||||||||||
| Legal reserve |
— | — | — | — | ( |
) | — | — | — | — | — | — | — | — | — | — | ||||||||||||||||||||||||||||||||||||||||||||||||
| Special reserve |
— | — | — | — | ( |
) | — | — | — | — | — | — | — | — | — | — | ||||||||||||||||||||||||||||||||||||||||||||||||
| Cash dividends distributed by the Company |
— | — | — | — | — | ( |
) | ( |
) | — | — | — | — | — | — | ( |
) | — | ( |
) | ||||||||||||||||||||||||||||||||||||||||||||
| |
|
|
|
|
|
|
|
|
|
|
|
|
|
|
|
|
|
|
|
|
|
|
|
|
|
|
|
|
|
|
|
|||||||||||||||||||||||||||||||||
| — | — | — | ( |
) | ( |
) | ( |
) | — | — | — | — | — | — | ( |
) | — | ( |
) | |||||||||||||||||||||||||||||||||||||||||||||
| |
|
|
|
|
|
|
|
|
|
|
|
|
|
|
|
|
|
|
|
|
|
|
|
|
|
|
|
|
|
|
|
|||||||||||||||||||||||||||||||||
| Change from investments in associates accounted for using the equity method |
— | — | ( |
) | — | — | — | ( |
) | — | — | ( |
) | — | ( |
) | — | ( |
||||||||||||||||||||||||||||||||||||||||||||||
| |
|
|
|
|
|
|
|
|
|
|
|
|
|
|
|
|
|
|
|
|
|
|
|
|
|
|
|
|
|
|
|
|||||||||||||||||||||||||||||||||
| Other changes in the capital surplus |
— | — | — | — | — | — | — | — | — | — | — | — | — | |||||||||||||||||||||||||||||||||||||||||||||||||||
| |
|
|
|
|
|
|
|
|
|
|
|
|
|
|
|
|
|
|
|
|
|
|
|
|
|
|
|
|
|
|
|
|||||||||||||||||||||||||||||||||
| Net profit for the year ended December 31, 2021 |
— | — | — | — | — | — | — | — | — | — | — | |||||||||||||||||||||||||||||||||||||||||||||||||||||
| Other comprehensive income (loss) for the year ended December 31, 2021, net of income tax |
— | — | — | — | — | ( |
) | — | — | ( |
) | |||||||||||||||||||||||||||||||||||||||||||||||||||||
| |
|
|
|
|
|
|
|
|
|
|
|
|
|
|
|
|
|
|
|
|
|
|
|
|
|
|
|
|
|
|
|
|||||||||||||||||||||||||||||||||
| Total comprehensive income (loss) for the year ended December 31, 2021 |
— | — | — | — | — | ( |
) | — | — | |||||||||||||||||||||||||||||||||||||||||||||||||||||||
| |
|
|
|
|
|
|
|
|
|
|
|
|
|
|
|
|
|
|
|
|
|
|
|
|
|
|
|
|
|
|
|
|||||||||||||||||||||||||||||||||
| Buy-back of ordinary shares |
— | — | — | — | — | — | — | — | — | — | — | — | ( |
) | ( |
) | — | ( |
) | |||||||||||||||||||||||||||||||||||||||||||||
| |
|
|
|
|
|
|
|
|
|
|
|
|
|
|
|
|
|
|
|
|
|
|
|
|
|
|
|
|
|
|
|
|||||||||||||||||||||||||||||||||
| Cash dividends received by subsidiaries from the Company |
— | — | — | — | — | — | — | — | — | — | — | — | — | |||||||||||||||||||||||||||||||||||||||||||||||||||
| |
|
|
|
|
|
|
|
|
|
|
|
|
|
|
|
|
|
|
|
|
|
|
|
|
|
|
|
|
|
|
|
|||||||||||||||||||||||||||||||||
| Changes in percentage of ownership interest in subsidiaries (Note 31) |
— | — | ( |
) | — | — | ( |
) | ( |
) | — | — | — | — | — | — | ( |
) | ( |
) | ( |
) | ||||||||||||||||||||||||||||||||||||||||||
| |
|
|
|
|
|
|
|
|
|
|
|
|
|
|
|
|
|
|
|
|
|
|
|
|
|
|
|
|
|
|
|
|||||||||||||||||||||||||||||||||
| Issue of ordinary shares under share-based payment arrangements (Note 28) |
— | — | — | — | — | — | — | ( |
) | ( |
) | — | — | |||||||||||||||||||||||||||||||||||||||||||||||||||
| |
|
|
|
|
|
|
|
|
|
|
|
|
|
|
|
|
|
|
|
|
|
|
|
|
|
|
|
|
|
|
|
|||||||||||||||||||||||||||||||||
| Cash dividends distributed by subsidiaries |
— | — | — | — | — | — | — | — | — | — | — | — | — | — | ( |
) | ( |
) | ||||||||||||||||||||||||||||||||||||||||||||||
| |
|
|
|
|
|
|
|
|
|
|
|
|
|
|
|
|
|
|
|
|
|
|
|
|
|
|
|
|
|
|
|
|||||||||||||||||||||||||||||||||
| Additional non-controlling interest arising on issue of employee share options by subsidiaries (Note 28) |
— | — | — | — | — | — | — | — | — | — | — | — | ||||||||||||||||||||||||||||||||||||||||||||||||||||
| |
|
|
|
|
|
|
|
|
|
|
|
|
|
|
|
|
|
|
|
|
|
|
|
|
|
|
|
|
|
|
|
|||||||||||||||||||||||||||||||||
| Issue of convertible bonds by subsidiaries (Note 21) |
— | — | — | — | — | — | — | — | — | — | — | — | — | — | ||||||||||||||||||||||||||||||||||||||||||||||||||
| |
|
|
|
|
|
|
|
|
|
|
|
|
|
|
|
|
|
|
|
|
|
|
|
|
|
|
|
|
|
|
|
|||||||||||||||||||||||||||||||||
| Disposal of investments in equity instruments at fair value through other comprehensive income |
— | — | — | — | — | — | ( |
) | — | — | ( |
) | — | — | — | — | ||||||||||||||||||||||||||||||||||||||||||||||||
| |
|
|
|
|
|
|
|
|
|
|
|
|
|
|
|
|
|
|
|
|
|
|
|
|
|
|
|
|
|
|
|
|||||||||||||||||||||||||||||||||
| BALANCE AT DECEMBER 31, 2021 |
$ | $ | $ | $ | $ | $ | $ | ( |
) | $ | $ | $ | ( |
) | $ | ( |
) | $ | ( |
) | $ | $ | $ | |||||||||||||||||||||||||||||||||||||||||
| |
|
|
|
|
|
|
|
|
|
|
|
|
|
|
|
|
|
|
|
|
|
|
|
|
|
|
|
|
|
|
|
|||||||||||||||||||||||||||||||||
| US DOLLARS (Note 4) BALANCE AT DECEMBER 31, 2021 |
$ | $ | $ | $ | $ | $ | $ | ( |
) | $ | $ | $ | ( |
) | $ | ( |
) | $ | ( |
) | $ | $ | $ | |||||||||||||||||||||||||||||||||||||||||
| |
|
|
|
|
|
|
|
|
|
|
|
|
|
|
|
|
|
|
|
|
|
|
|
|
|
|
|
|
|
|
|
|||||||||||||||||||||||||||||||||
| The accompanying notes are an integral part of the consolidated financial statements. | (Concluded) |
F-12
ASE TECHNOLOGY HOLDING CO., LTD. AND SUBSIDIARIES
CONSOLIDATED STATEMENTS OF CASH FLOWS
(Amounts in Thousands)
For the Year Ended December 31 |
||||||||||||||||
2019 |
2020 |
2021 |
||||||||||||||
NT$ |
NT$ |
NT$ |
US$ (Note 4) |
|||||||||||||
| CASH FLOWS FROM OPERATING ACTIVITIES |
||||||||||||||||
| Profit before income tax |
$ | |
$ | |
$ | |
$ | |
||||||||
| Adjustments for: |
||||||||||||||||
| Depreciation expense |
||||||||||||||||
| Amortization expense |
||||||||||||||||
| Net loss (gain) on fair value change of financial assets and liabilities at fair value through profit or loss |
( |
) | ||||||||||||||
| Finance costs |
||||||||||||||||
| Interest income |
( |
) | ( |
) | ( |
) | ( |
) | ||||||||
| Dividend income |
( |
) | ( |
) | ( |
) | ( |
) | ||||||||
| Share-based payments compensation |
||||||||||||||||
| Share of profit of associates and joint ventures |
( |
) | ( |
) | ( |
) | ( |
) | ||||||||
| Loss (gain) on disposal of property, plant and equipment |
( |
) | ( |
) | ( |
) | ||||||||||
| Loss (gain) on disposal of investments accounted for using the equity method |
- | ( |
) | |||||||||||||
| Impairment loss recognized on financial assets |
- | |||||||||||||||
| Reversal of impairment loss recognized on financial assets |
( |
) | ( |
) | - | - | ||||||||||
| Impairment loss recognized on non-financial assets |
||||||||||||||||
| Gain on disposal of subsidiaries |
- | ( |
) | ( |
) | ( |
) | |||||||||
| Gain on remeasurement of investments accounted for using the equity method |
( |
) | - | - | - | |||||||||||
| Gain from bargain purchase - acquisition of subsidiaries |
- | - | ( |
) | ( |
) | ||||||||||
| Net gain on foreign currency exchange |
( |
) | ( |
) | ( |
) | ( |
) | ||||||||
| Others |
( |
) | ( |
) | ( |
) | ||||||||||
| Changes in operating assets and liabilities |
||||||||||||||||
| Financial assets mandatorily at fair value through profit or loss |
||||||||||||||||
| Contract assets |
( |
) | ( |
) | ( |
) | ||||||||||
| Trade receivables |
( |
) | ( |
) | ( |
) | ||||||||||
| Other receivables |
( |
) | ( |
) | ( |
) | ( |
) | ||||||||
| Inventories |
( |
) | ( |
) | ( |
) | ||||||||||
| Other current assets |
( |
) | ( |
) | ( |
) | ||||||||||
| Other operating activities assets |
- | ( |
) | ( |
) | ( |
) | |||||||||
| Financial liabilities held for trading |
( |
) | ( |
) | ( |
) | ( |
) | ||||||||
| Trade payables |
( |
) | ||||||||||||||
| Other payables |
||||||||||||||||
| Other current liabilities |
||||||||||||||||
| Other operating activities liabilities |
( |
) | ||||||||||||||
| |
|
|
|
|
|
|
|
|||||||||
| Cash generated from operations |
||||||||||||||||
| Interest received |
||||||||||||||||
| Dividend received |
||||||||||||||||
| Interest paid |
( |
) | ( |
) | ( |
) | ( |
) | ||||||||
| Income tax paid |
( |
) | ( |
) | ( |
) | ( |
) | ||||||||
| |
|
|
|
|
|
|
|
|||||||||
| Net cash generated from operating activities |
||||||||||||||||
| |
|
|
|
|
|
|
|
|||||||||
(Continued)
F-13
ASE TECHNOLOGY HOLDING CO., LTD. AND SUBSIDIARIES
CONSOLIDATED STATEMENTS OF CASH FLOWS
(Amounts in Thousands)
For the Year Ended December 31 |
||||||||||||||||
2019 |
2020 |
2021 |
||||||||||||||
NT$ |
NT$ |
NT$ |
US$ (Note 4) |
|||||||||||||
| CASH FLOWS FROM INVESTING ACTIVITIES |
||||||||||||||||
| Purchase of financial assets at fair value through other comprehensive income |
$ | ( |
) | $ | ( |
) | $ | ( |
) | $ | ( |
) | ||||
| Proceeds from sale of financial assets at fair value through other comprehensive income |
- | |||||||||||||||
| Return of capital from financial assets at fair value through other comprehensive income |
||||||||||||||||
| Purchase of financial assets at fair value through profit or loss |
( |
) | - | - | - | |||||||||||
| Proceeds from sale of financial assets at amortized cost |
- | - | ||||||||||||||
| Acquisition of associates and joint ventures |
( |
) | ( |
) | ( |
) | ( |
) | ||||||||
| Proceeds from disposal of investments accounted for using the equity method |
- | - | - | |||||||||||||
| Net cash outflow on acquisition of subsidiaries |
( |
) | ( |
) | ( |
) | ( |
) | ||||||||
| Proceeds from disposal of subsidiaries |
- | |||||||||||||||
| Return of capital from investments accounted for using the equity method |
- | - | - | |||||||||||||
| Payments for property, plant and equipment |
( |
) | ( |
) | ( |
) | ( |
) | ||||||||
| Proceeds from disposal of property, plant and equipment |
||||||||||||||||
| Payments for intangible assets |
( |
) | ( |
) | ( |
) | ( |
) | ||||||||
| Proceeds from disposal of intangible assets |
||||||||||||||||
| Payments for right-of-use |
( |
) | ( |
) | ( |
) | ( |
) | ||||||||
| Payments for investment properties |
( |
) | ( |
) | - | - | ||||||||||
| Proceeds from disposal of investment properties |
- | - | - | |||||||||||||
| Increase in other financial assets |
( |
) | ( |
) | ( |
) | ( |
) | ||||||||
| Decrease in other financial assets |
||||||||||||||||
| Increase in other non-current assets |
( |
) | ( |
) | ( |
) | ( |
) | ||||||||
| Decrease in other non-current assets |
||||||||||||||||
| Income tax paid |
- | - | ( |
) | ( |
) | ||||||||||
| Proceeds from disposal of right-of-use |
- | |||||||||||||||
| Other investing activities items |
- | - | ||||||||||||||
| |
|
|
|
|
|
|
|
|||||||||
| Net cash used in investing activities |
( |
) | ( |
) | ( |
) | ( |
) | ||||||||
| |
|
|
|
|
|
|
|
|||||||||
| CASH FLOWS FROM FINANCING ACTIVITIES |
||||||||||||||||
| Proceeds from short-term borrowings |
- | - | ||||||||||||||
| Repayment of short-term borrowings |
( |
) | ( |
) | - | - | ||||||||||
| Proceeds from bonds offering |
||||||||||||||||
| Repayment of bonds payable |
- | ( |
) | ( |
) | ( |
) | |||||||||
| Proceeds from long-term borrowings |
||||||||||||||||
| Repayment of long-term borrowings |
( |
) | ( |
) | ( |
) | ( |
) | ||||||||
| Repayment of the principle portion of lease liabilities |
( |
) | ( |
) | ( |
) | ( |
) | ||||||||
| Dividends paid |
( |
) | ( |
) | ( |
) | ( |
) | ||||||||
| Proceeds from exercise of employee share options |
||||||||||||||||
| Payments for buy-back of ordinary shares |
- | - | ( |
) | ( |
) | ||||||||||
(Continued)
F-14
ASE TECHNOLOGY HOLDING CO., LTD. AND SUBSIDIARIES
CONSOLIDATED STATEMENTS OF CASH FLOWS
(Amounts in Thousands)
For the Year Ended December 31 |
||||||||||||||||
2019 |
2020 |
2021 |
||||||||||||||
NT$ |
NT$ |
NT$ |
US$ (Note 4) |
|||||||||||||
| Decrease in non-controlling interests |
$ | ( |
) | $ | ( |
) | $ | ( |
) | $ | ( |
) | ||||
| Other financing activities items |
( |
) | ( |
) | ( |
) | ||||||||||
| |
|
|
|
|
|
|
|
|||||||||
| Net cash used in financing activities |
( |
) | ( |
) | ( |
) | ( |
) | ||||||||
| |
|
|
|
|
|
|
|
|||||||||
| EFFECTS OF EXCHANGE RATE CHANGES ON THE BALANCE OF CASH AND CASH EQUIVALENTS HELD IN FOREIGN CURRENCY |
( |
) | ( |
) | ( |
) | ( |
) | ||||||||
| |
|
|
|
|
|
|
|
|||||||||
| NET INCREASE (DECREASE) IN CASH AND CASH EQUIVALENTS |
( |
) | ||||||||||||||
| CASH AND CASH EQUIVALENTS AT THE BEGINNING OF THE YEAR |
||||||||||||||||
| |
|
|
|
|
|
|
|
|||||||||
| CASH AND CASH EQUIVALENTS AT THE END OF THE YEAR |
$ | $ | $ | $ | ||||||||||||
| |
|
|
|
|
|
|
|
|||||||||
| The accompanying notes are an integral part of the consolidated financial statements. | (Concluded) |
F-15
ASE TECHNOLOGY HOLDING CO., LTD. AND SUBSIDIARIES
NOTES TO CONSOLIDATED FINANCIAL STATEMENTS
(Amounts in Thousands, Unless Stated Otherwise)
1. |
GENERAL INFORMATION |
ASE Technology Holding Co., Ltd. (the “Company”) is a corporation incorporated in Nanzih Technology Industrial Park under the laws of Republic of China (“R.O.C.”) starting from April 30, 2018 (date of incorporation). The Company and its subsidiaries (collectively referred to as the “Group”) offer a comprehensive range of semiconductors packaging, testing, and electronic manufacturing services (“EMS”).
The Company’s subsidiaries, Advanced Semiconductor Engineering, Inc. (symbol “2311”, “ASE”) and Siliconware Precision Industries Co., Ltd. (symbol “2325”, “SPIL”), entered into and executed a joint share exchange agreement to establish the Company and the Company acquired all issued and outstanding ordinary shares of ASE and SPIL on April 30, 2018. Both of ASE’s and SPIL’s ordinary shares have been delisted while the ordinary shares of the Company were listed starting from the same date under the symbol “3711”. In addition, ASE’s ordinary shares that have been traded on the New York Stock Exchange (the “NYSE”) under the symbol “ASX” in the form of American Depositary Shares (“ADS”) starting from September 2000 were exchanged as the Company’s ADSs under the same symbol “ASX” starting from April 30, 2018.
The ordinary shares of the Company’s subsidiary, Universal Scientific Industrial (Shanghai) Co., Ltd. (“USISH”), have been listed on the Shanghai Stock Exchange under the symbol “601231” since February 2012.
The consolidated financial statements are presented in the Company’s functional currency, New Taiwan dollar (NT$).
2. |
APPROVAL OF FINANCIAL STATEMENTS |
The consolidated financial statements were authorized for issue by the management on March 22, 2022.
3. |
APPLICATION OF NEW AND REVISED INTERNATIONAL FINANCIAL REPORTING STANDARDS AS ISSUED BY THE INTERNATIONAL ACCOUNTING STANDARDS BOARD (“IASB”) (collectively, “IFRSs”) |
a. |
Amendments to IFRSs that are mandatorily effective for the current year |
In the current year, the Group applied the amendments to IFRS 9, IAS 39, IFRS 7, IFRS 4 and IFRS 16 “Interest Rate Benchmark Reform—Phase 2” and amendment to IFRS 16 Rent Concessions beyond June 30, 2021.”
“Covid-19-Related
Except for the following, the initial application of the aforementioned new, revised or amended standards and interpretations did not have material impact on the Group’s accounting policies:
| Amendment to IFRS 16 “Covid-19-Related |
The Group elected to apply the amendment that extends the availability of the practical expedient to lease payments due on or before June 30, 2022. Refer to Note 4 for the relevant accounting policies of the practical expedient.
F-16
The Group applies the amendment from January 1, 2021.
| b. | New, revised or amended standards and interpretations in issue but not yet effective |
The Group has not applied the following new, revised or amended standards and interpretations that have been issued but are not yet effective:
| New, Revised or Amended Standards and Interpretations |
Effective Date Announced by IASB (Note 1) | |
| “Annual Improvements to IFRS Standards 2018–2020” |
January 1, 2022 (Note 2) | |
| Amendments to IFRS 3 “Reference to the Conceptual Framework” |
January 1, 2022 (Note 3) | |
| Amendments to IAS 16 “Property, Plant and Equipment—Proceeds before Intended Use” |
January 1, 2022 (Note 4) | |
| Amendments to IAS 37 “Onerous Contracts–Cost of Fulfilling a Contract” |
January 1, 2022 (Note 5) | |
| Amendments to IFRS 10 and IAS 28 “Sale or Contribution of Assets between an Investor and its Associate or Joint Venture” |
To be determined by IASB | |
| Amendments to IAS 1 “Classification of Liabilities as Current or Non-current” |
January 1, 2023 | |
| Amendments to IAS 1 “Disclosure of Accounting Policies” |
January 1, 2023 (Note 6) | |
| Amendments to IAS 8 “Definition of Accounting Estimates” |
January 1, 2023 (Note 7) | |
| Amendments to IAS 12 “Deferred Tax related to Assets and Liabilities arising from a Single Transaction” |
January 1, 2023 (Note 8) |
Note 1: |
Unless stated otherwise, the above New IFRSs are effective for annual reporting periods beginning on or after their respective effective dates. | |
Note 2: |
The amendments to IFRS 9 will be applied prospectively to modifications and exchanges of financial liabilities that occur on or after the annual reporting periods beginning on or after January 1, 2022. | |
Note 3: |
The amendments are applicable to business combinations for which the acquisition date is on or after the beginning of the annual reporting period beginning on or after January 1, 2022. | |
Note 4: |
The amendments are applicable to property, plant and equipment that are brought to the location and condition necessary for them to be capable of operating in the manner intended by management on or after January 1, 2021. | |
Note 5: |
The amendments are applicable to contracts for which the entity has not yet fulfilled all its obligations on January 1, 2022. | |
Note 6: |
The amendments will be applied prospectively for annual reporting periods beginning on or after January 1, 2023. | |
Note 7: |
The amendments are applicable to changes in accounting estimates and changes in accounting policies that occur on or after the beginning of the annual reporting period beginning on or after January 1, 2023. | |
Note 8: |
Except for deferred taxes that will be recognized on January 1, 2022 for temporary differences associated with leases and decommissioning obligations, the amendments will be applied prospectively to transactions that occur on or after January 1, 2022. | |
F-17
| c. | Significant changes in accounting policy resulted from new, revised and amended standards and interpretations in issue but not yet effective |
Except for the following, as of the date that the accompanying consolidated financial statements were authorized for issue, the Group does not expect that the application of the aforementioned new, revised or amended standards and interpretations will have a material impact on the financial statements.
| 1) | Amendments to IAS 16 “Property, Plant and Equipment: Proceeds before Intended Use” |
The amendments prohibit an entity from deducting from the cost of an item of property, plant and equipment any proceeds from selling items produced while bringing that asset to the location and condition necessary for it to be capable of operating in the manner intended by management. The cost of those items is measured in accordance with IAS 2 “Inventories”. Any proceeds from selling those items and the cost of those items are recognized in profit or loss in accordance with applicable standards.
The amendments are applicable only to items of property, plant and equipment that are brought to the location and condition necessary for them to be capable of operating in the manner intended by management on or after January 1, 2021.
F-18
2) |
Amendments to IAS 37 “Onerous Contracts—Cost of Fulfilling a Contract” |
The amendments specify that when assessing whether a contract is onerous, the “cost of fulfilling a contract” includes both the incremental costs of fulfilling that contract (for example, direct labor and materials) and an allocation of other costs that relate directly to fulfilling contracts (for example, an allocation of depreciation for an item of property, plant and equipment used in fulfilling the contract).
3 ) |
Amendments to IAS 1 “Classification of Liabilities as Current or Non-current” |
The amendments clarify that for a liability to be classified as
non-current,
the Group shall assess whether it has the right at the end of the reporting period to defer settlement of the liability for at least twelve months after the reporting period. If such rights are in existence at the end of the reporting period, the liability is classified as non-current
regardless of whether the Group will exercise that right. The amendments also clarify that, if the right to defer settlement is subject to compliance with specified conditions, the Group must comply with those conditions at the end of the reporting period even if the lender does not test compliance until a later date. The amendments stipulate that, for the purpose of liability classification, the aforementioned settlement refers to a transfer of cash, other economic resources or the Group’s own equity instruments to the counterparty that results in the extinguishment of the liability. However, if the terms of a liability that could, at the option of the counterparty, result in its settlement by a transfer of the Group’s own equity instruments, and if such option is recognized separately as equity in accordance with IAS 32 “Financial Instruments: Presentation”, the aforementioned terms would not affect the classification of the liability.
4 ) |
Amendments to IAS 1 “Disclosure of Accounting Policies” |
The amendments specify that the Group should refer to the definition of material to determine its material accounting policy information to be disclosed. Accounting policy information is material if it can reasonably be expected to influence decisions that the primary users of general purpose financial statements make on the basis of those financial statements. The amendments also clarify that:
| • | accounting policy information that relates to immaterial transactions, other events or conditions is immaterial and need not be disclosed; |
| • | the Group may consider the accounting policy information as material because of the nature of the related transactions, other events or conditions, even if the amounts are immaterial; and |
| • | not all accounting policy information relating to material transactions, other events or conditions is itself material. |
F-19
The amendments also illustrate that accounting policy information is likely to be considered as material to the financial statements if that information relates to material transactions, other events or conditions and:
| (1) | the Group changed its accounting policy during the reporting period and this change resulted in a material change to the information in the financial statements; |
| (2) | the Group chose the accounting policy from options permitted by the standards; |
| (3) | the accounting policy was developed in accordance with IAS 8 “Accounting Policies, Changes in Accounting Estimates and Errors” in the absence of an IFRS that specifically applies; |
| (4) | the accounting policy relates to an area for which the Group is required to make significant judgments or assumptions in applying an accounting policy, and the Group discloses those judgments or assumptions; or |
| (5) | the accounting is complex and users of the financial statements would otherwise not understand those material transactions, other events or conditions. |
5 ) |
Amendments to IAS 8 “Definition of Accounting Estimates” |
The amendments define that accounting estimates are monetary amounts in financial statements that are subject to measurement uncertainty. In applying accounting policies, the Group may be required to measure items at monetary amounts that cannot be observed directly and must instead be estimated. In such a case, the Group uses measurement techniques and inputs to develop accounting estimates to achieve the objective. The effects on an accounting estimate of a change in a measurement technique or a change in an input are changes in accounting estimates unless they result from the correction of prior period errors.
6 ) |
Amendments to IAS 12 “Deferred Tax related to Assets and Liabilities arising from a Single Transaction” |
The amendments clarify that the initial recognition exemption under IAS 12 does not apply to transactions in which equal taxable and deductible temporary differences arise on initial recognition. The Group will recognize a deferred tax asset (to the extent that it is probable that taxable profit will be available against which the deductible temporary difference can be utilized) and a deferred tax liability for all deductible and taxable temporary differences associated with leases and decommissioning obligations on January 1, 2022, and recognize the cumulative effect of initial application in retained earnings at that date. The Group will apply the amendments prospectively to transactions other than leases and decommissioning obligations that occur on or after January 1, 2022.
4. |
SUMMARY OF SIGNIFICANT ACCOUNTING POLICIES |
| a. | Statement of compliance |
The consolidated financial statements have been prepared in accordance with IFRSs as issued by the IASB.
| b. | Basis of preparation |
The consolidated financial statements have been prepared on the historical cost basis except for financial instruments measured at fair value and net defined benefit liabilities which are measured at the present value of the defined benefit obligation less the fair value of plan assets.
F-20
The fair value measurements, which are grouped into Levels 1 to 3 based on the degree to which the fair value measurement inputs are observable and based on the significance of the inputs to the fair value measurement in its entirety, are described as follows:
| 1) | Level 1 inputs are quoted prices (unadjusted) in active markets for identical assets or liabilities; |
| 2) | Level 2 inputs are inputs other than quoted prices included within Level 1 that are observable for an asset or a liability, either directly (i.e. as prices) or indirectly (i.e. derived from prices); and |
| 3) | Level 3 inputs are unobservable inputs for an asset or a liability. |
| c. | Classification of current and non-current assets and liabilities |
Current assets include cash and cash equivalents and those assets held primarily for trading purposes or expected to be realized within twelve months after the balance sheet date, unless the asset is to be used for an exchange or to settle a liability, or otherwise remains restricted, at more than twelve months after the balance sheet date. Current liabilities are obligations incurred for trading purposes or to be settled within twelve months after the balance sheet date (even if an agreement to refinance, or to reschedule payments, on a long-term basis is completed after the balance sheet date and before the consolidated financial statements are authorized for issue) and liabilities that do not have an unconditional right to defer settlement for at least 12 months after the balance sheet date (terms of a liability that could, at the option of the counterparty, result in its settlement by the issue of equity instruments do not affect its classification). Assets and liabilities that are not classified as current are classified as
non-current.
The Group engages in the construction business which has an operating cycle of over one year. The normal operating cycle applies when considering the classification of the Group’s construction-related assets and liabilities.
| d. | Basis of consolidation |
| 1) | Principles for preparing consolidated financial statements |
The consolidated financial statements incorporate the financial statements of the Company and the entities controlled by the Company (i.e. its subsidiaries).
Income and expenses of subsidiaries acquired or disposed of during the period are included in the consolidated statement of profit or loss and other comprehensive income from the effective dates of acquisitions up to the effective dates of disposals, as appropriate.
When necessary, adjustments are made to the financial statements of subsidiaries to bring their accounting policies into line with those used by the Company.
All intra-group transactions, balances, income and expenses are eliminated in full upon consolidation. Total comprehensive income of subsidiaries is attributed to the owners of the Company and to the
non-controlling
interests even if this results in the non-controlling
interests having a deficit balance. Changes in the Group’s ownership interests in subsidiaries that do not result in the Group losing control over the subsidiaries are accounted for as equity transactions. The carrying amounts of the interests of the Group and the
non-controlling
interests are adjusted to reflect the changes in their relative interests in the subsidiaries. Any difference between the amount by which the non-controlling
interests are adjusted and the fair value of the consideration paid or received is recognized directly in equity and attributed to the owners of the Company. When the Group loses control of a subsidiary, a gain or loss is recognized in profit or loss and is calculated as the difference between (i) the aggregate of the fair value of the consideration received and any investment retained in the former subsidiary at its fair value at the date when control is lost and (ii) the assets (including any goodwill) and liabilities and any
non-controlling
interests of the former subsidiary at their carrying amounts at the date when control is lost. The Group accounts for all amounts recognized in other comprehensive income in relation to that subsidiary on the same basis as would be required had the Group directly disposed of the related assets or liabilities. | 2) | Subsidiaries included in consolidated financial statements were as follows: |
| Establishment and Operating |
Percentage of Ownership (%) |
|||||||||||||
December 31 |
||||||||||||||
| Name of Investor |
Name of Investee |
Main Businesses |
Location |
2020 |
2021 |
|||||||||
| The Company |
ASE | |||||||||||||
| USI Inc. (“USIINC”) | ||||||||||||||
| SPIL | ||||||||||||||
| ASE |
A.S.E. Holding Limited | |||||||||||||
| J R Holding Limited (“JR Holding”) | ||||||||||||||
| Innosource Limited | ||||||||||||||
| Omniquest Industrial Limited | ||||||||||||||
| ASE Marketing Service Japan Co., Ltd. | ||||||||||||||
| ASE Test, Inc. | ||||||||||||||
| Luchu Development Corporation | ||||||||||||||
| Advanced Microelectronic Products Inc. (“AMPI”) | ||||||||||||||
| ASE Test, Inc. |
Alto Enterprises Limited | |||||||||||||
| Super Zone Holdings Limited | ||||||||||||||
| Luchu Development Corporation | ||||||||||||||
| TLJ Intertech Inc. | ||||||||||||||
| MingFeng Information Service Corp., Ltd. | ||||||||||||||
| AMPI | ||||||||||||||
| A.S.E. Holding Limited |
ASE Investment (Labuan) Inc. | |||||||||||||
| ASE Test Limited (“ASE Test”) | ||||||||||||||
| ASE Technology Partners, Limited | ||||||||||||||
Integrated Solutions Enterprise Europe (“ITGEU”) |
||||||||||||||
| JR Holding |
ASE Test | |||||||||||||
| Omniquest Industrial Limited | ||||||||||||||
| JR Industrial Inc. | ||||||||||||||
| ASE Japan Co., Ltd. | ||||||||||||||
| ASE (U.S.) Inc. | ||||||||||||||
| Global Advanced Packaging Technology Limited | ||||||||||||||
| Anstock Limited | ||||||||||||||
| Anstock II Limited | ||||||||||||||
| Suzhou ASEN Semiconductors Co., Ltd. (“ASEN”) | |
|||||||||||||
| Innosource Limited |
Omniquest Industrial Limited | |||||||||||||
| ASE (Shanghai) Inc. | ||||||||||||||
| Omniquest Industrial Limited |
ASE Corporation | |||||||||||||
| Alto Enterprises Limited |
ASE (Kunshan) Inc. | (Note 2 | ) | |||||||||||
| ASE Investment (Kun Shan) Limited | ||||||||||||||
| Super Zone Holdings Limited |
Advanced Semiconductor Engineering (China) Ltd. | |||||||||||||
| ASE Investment (Labuan) Inc. |
ASE (Korea) Inc. (“ASE Korea”) | |||||||||||||
| ASE Technology Partners, Limited |
ASE Technology Acquisition Corporation | |||||||||||||
| ASE Korea |
ASE (Weihai) Inc. | |||||||||||||
| ASE Test |
ASE Test Holdings, Ltd. | |||||||||||||
| ASE Holdings (Singapore) Pte Ltd | ||||||||||||||
| ASE Investment (Labuan) Inc. | ||||||||||||||
| ASE Singapore Pte. Ltd. | ||||||||||||||
| ASE Test Holdings, Ltd. |
ISE Labs, Inc. | |||||||||||||
(Continued)
F-22
| Establishment and Operating |
Percentage of Ownership (%) |
|||||||||||||
December 31 |
||||||||||||||
| Name of Investor |
Name of Investee |
Main Businesses |
Location |
2020 |
2021 |
|||||||||
| ISE Labs, Inc. |
ISE Services, Inc. |
|
||||||||||||
| ASE Holdings (Singapore) Pte Ltd |
ASE Electronics (M) Sdn. Bhd. |
|
||||||||||||
| Global Advanced Packaging Technology Limited |
ASE Assembly Test (Shanghai) Limited |
|
||||||||||||
| ASE Advanced Semiconductor (Shanghai) Limited |
|
|||||||||||||
| GAPT Holding Limited |
|
(Note 2 | ) | |||||||||||
| GAPT Holding Limited |
Global Advanced Packaging Test (Hongkong) Limited |
|
(Note 2 | ) | ||||||||||
| Global Advanced Packaging Test (Hongkong) Limited |
Suzhou ASEN Semiconductors Co., Ltd. (“ASEN”) |
) |
(Note 2 | ) | ||||||||||
| |
|
ASE (Weihai) Inc. |
|
) |
|
|
|
|
|
|
|
(Note 2 |
) | |
| ASEN |
ASE Advanced Semiconductor (Shanghai) Limited |
|
(Note 2 | ) | ||||||||||
| ASE Assembly Test (Shanghai) Limited |
ASE Investment (Kun Shan) Limited |
|
||||||||||||
| Wuxi Tongzhi Microelectronics Co., Ltd. |
|
|||||||||||||
| ISE Labs, China, Ltd. |
|
|||||||||||||
| Shanghai Ding Hui Real Estate Development Co., Ltd. (“DH”) |
|
|||||||||||||
| DH |
Shanghai Ding Qi Property Management Co., Ltd. |
|
||||||||||||
| Shanghai Ding Wei Real Estate Development Co., Ltd. (“DW”) |
|
|||||||||||||
| Shanghai Ding Yu Real Estate Development Co., Ltd. |
|
|||||||||||||
| Kun Shan Ding Hong Real Estate Development Co., Ltd |
|
|||||||||||||
| Shanghai Ding Xu Property Management Co., Ltd. |
|
|||||||||||||
| Shanghai Dingyao Estate Development Co., Ltd. |
|
|||||||||||||
| Shanghai Ding Fan Business Management Co., Ltd. |
|
|||||||||||||
| ASE Investment (Kun Shan) Limited |
ASE (Kun s han) Inc. |
|
(Note 2 | ) | ||||||||||
| ASE Corporation |
ASE Mauritius Inc. |
|
||||||||||||
| ASE Labuan Inc. |
|
|||||||||||||
| ASE Mauritius Inc. |
ASE (Kunshan) Inc. |
|
(Note 2 | ) | ||||||||||
| ASE (Shanghai) Inc. |
|
|||||||||||||
| ASE Labuan Inc. |
ASE Electronics Inc. |
|
||||||||||||
| ASE (Shanghai) Inc. |
Advanced Semiconductor Engineering (HK) Limited |
|
||||||||||||
| Shanghai Ding Hui Real Estate Development Co., Ltd. |
|
|||||||||||||
| Universal Scientific Industrial (Shanghai) Co., Ltd. (“USISH”) |
|
|||||||||||||
| USIINC |
Huntington Holdings International Co., Ltd. |
|
||||||||||||
| Huntington Holdings International Co., Ltd. |
Unitech Holdings International Co., Ltd. |
|
||||||||||||
| Real Tech Holdings Limited |
|
|||||||||||||
| Universal ABIT Holding Co., Ltd. |
|
|||||||||||||
| Real Tech Holdings Limited |
USI Enterprise Limited (“USIE”) |
|
||||||||||||
| USIE |
USISH |
|
||||||||||||
| USISH |
Universal Global Technology Co., Limited |
|
||||||||||||
(Continued)
F-23
| Establishment and Operating |
Percentage of Ownership (%) |
|||||||||||||
December 31 |
||||||||||||||
| Name of Investor |
Name of Investee |
Main Businesses |
Location |
2020 |
2021 |
|||||||||
| Universal Global Technology (Kunshan) Co., Ltd. (“UGKS”) |
|
|||||||||||||
| Universal Global Technology (Shanghai) Co., Ltd. |
|
|||||||||||||
| Universal Global Electronics (Shanghai) Co., Ltd. |
|
|||||||||||||
| USI Electronics (Shenzhen) Co., Ltd. |
|
|||||||||||||
| Universal Global Technology (Huizhou) Co., Ltd. |
|
|||||||||||||
| FINANCIERE AFG (“FAFG”) |
|
|||||||||||||
| Universal Global Technology Co., Limited |
Universal Global Industrial Co., Limited |
|
||||||||||||
| Universal Global Scientific Industrial Co., Ltd. (“UGTW”) |
||||||||||||||
| USI America Inc. |
|
|||||||||||||
| Universal Scientific Industrial De Mexico S.A. De C.V. |
|
|||||||||||||
| USI Japan Co., Ltd. |
|
|||||||||||||
| USI Electronics (Shenzhen) Co., Ltd. |
|
|||||||||||||
| Universal Global Electronics Co., Ltd. |
|
|||||||||||||
| Universal Scientific Industrial (France) (“USIFR”) |
|
|||||||||||||
| UNIVERSAL INDUSTRIA L (VIE TNAM ) CO ., |
|
|||||||||||||
| Universal Global Industrial Co., Limited |
Universal Scientific Industrial De Mexico S.A. De C.V. |
|
(Note 1 | ) | (Note 1 | ) | ||||||||
| UGTW |
Universal Scientific Industrial Co., Ltd. (“USI”) |
|
||||||||||||
| Universal Global Electronics Co., Ltd. |
Universal Scientific Industrial Poland Sp. z o.o. (“USIPL”) |
|
||||||||||||
| Universal Global Electronics (Shanghai) Co., Ltd. |
USI Science and Technology (Shenzhen) Co., Ltd. |
|
||||||||||||
| USIFR |
FAFG |
|
||||||||||||
| ASTEELFLASH GROUP |
|
(Note 1 | ) | |||||||||||
| Establishment and Operating |
Percentage of Ownership (%) |
|||||||||||||
December 31 |
||||||||||||||
| Name of Investor |
Name of Investee |
Main Businesses |
Location |
2020 |
2021 |
|||||||||
| FAFG |
ASTEELFLASH GROUP |
|
||||||||||||
| MANUFACTURING POWER TUNISIA |
|
|||||||||||||
| ASTEELFLASH MEXICO S.A. de C.V. |
|
|||||||||||||
| ASTEELFLASH GROUP |
ASTEELFLASH (BEDFORD) LIMITED |
|
||||||||||||
| ASTEELFLASH FRANCE |
|
|||||||||||||
| ASTEELFLASH TUNISIE S.A. |
|
|||||||||||||
| ASTEELFLASH HONG KONG LIMITED |
|
|||||||||||||
| ASTEELFLASH MEXICO S.A. de C.V. |
|
|||||||||||||
| ASTEELFLASH GERMANY GmbH |
|
|||||||||||||
| MANUFACTURING POWER TUNISIA |
|
|||||||||||||
| ASTEELFLASH US HOLDING CORP. |
|
|||||||||||||
| ASTEEL ELECTRONIQUE FOUCHANA |
Engaged in the design and manufacturing of electronic components (disposed to ASTEELFLASH TUNISIE S.A. in June 2021) |
(Note 1 | ) | |||||||||||
| AFERH TUNISIE |
|
|||||||||||||
| ASTEEL ELECTRONICS MANUFACTURING SERVICES |
|
|||||||||||||
| ASTEELFLASH PLZEN S.R.O. |
|
— | ||||||||||||
| ASTEELFLASH (BEDFORD) LIMITED |
ASTEELFLASH TUNISIE S.A. |
|
(Note 1 | ) | (Note 1 | ) | ||||||||
| ASTEELFLASH TECHNOLOGIE |
ASTEELFLASH FRANCE |
|
(Note 1 | ) | (Note 1 | ) | ||||||||
| ASTEELFLASH FRANCE |
SCI CHASSET |
|
||||||||||||
| AFERH |
|
|||||||||||||
| ASTEEL ELECTRONICS MANUFACTURING SERVICES |
|
|||||||||||||
| ASTEEL ELECTRONIQUE FOUCHANA |
Engaged in the design and manufacturing of electronic components (disposed to ASTEELFLASH TUNISIE S.A. in June 2021) |
|||||||||||||
| ASTEELFLASH TECHNOLOGIE |
|
|||||||||||||
| ASTEELFLASH BRETAGNE |
|
|||||||||||||
| ASTEELFLASH TUNISIE S.A. |
|
(Note 1 | ) | (Note 1 | ) | |||||||||
| ASTEELFLASH TUNISIE S.A. |
ASTEEL ELECTRONIQUE TUNISIE |
|
||||||||||||
| ASTEEL ELECTRONIQUE FOUCHANA |
Engaged in the design and manufacturing of electronic components (acquired from ASTEELFLASH GROUP, ASTEELFLASH FRANCE, Asteelflash Suzhou Co., Ltd. and ASTEELFLASH USA CORP.in June 2021 and merged by ASTEELFLASH TUNISIE S.A. in December 2021) |
(Note 1 | ) | — | ||||||||||
| AFERH |
AFERH TUNISIE |
|
||||||||||||
| ASTEELFLASH HONG KONG LIMITED |
Asteelflash S uzhou Co., Ltd . |
|
||||||||||||
| Asteelflash Suzhou Co., Ltd. |
A STE EL ELECT R ONIQUE FO UCHANA |
Engaged in the design and manufacturing of electronic components (disposed to ASTEELFLASH TUNISIE S.A. in June 2021) |
(Note 1 | ) | ||||||||||
| ASTEELFLASH TUNISIE S.A. |
|
(Note 1 | ) | (Note 1 | ) | |||||||||
| ASTEELFLASH GERMANY GmbH |
ASTEELFLASH HERSFELD GmbH |
|
||||||||||||
| ASTEELFLASH EBERBACH GmbH |
|
|||||||||||||
(Continued)
F-25
| Establishment and Operating |
Percentage of Ownership (%) |
|||||||||||||
December 31 |
||||||||||||||
| Name of Investor |
Name of Investee |
Main Businesses |
Location |
2020 |
2021 |
|||||||||
| ASTEELFLASH BONN GmbH |
|
|||||||||||||
| ASTEELFLASH SCHWANDORF GmbH |
|
|||||||||||||
| ASTEELFLASH PLZEN S.R.O. |
|
|
||||||||||||
| ASTEELFLASH DESIGN SOLUTIONS HAMBOURG GmbH |
|
|||||||||||||
| EN ELECTRONICNETWORK SRL |
|
|||||||||||||
| ASTEELFLASH TUNISIE S.A. |
|
|
(Note 1) | (Note 1 | ) | |||||||||
| ASTEELFLASH MEXICO S.A. de C.V. |
ASTEELFLASH TUNISIE S.A. |
|
|
(Note 1) | (Note 1 | ) | ||||||||
| ASTEELFLASH US HOLDING CORP. |
ASTEELFLASH USA CORP. |
Engaged in the design and manufacturing of electronic components |
|
|||||||||||
| ASTEELFLASH USA CORP. |
ASTEEL ELECTRONIQUE FOUCHANA |
|
|
(Note 1) | ||||||||||
| ASTEELFLASH TUNISIE S.A. |
|
|
(Note 1) | (Note 1 | ) | |||||||||
| SPIL |
SPIL (B.V.I.) Holding Limited |
Engaged in investing activities |
|
|||||||||||
| Siliconware Investment Co., Ltd. |
|
|||||||||||||
| SPIL (B.V.I.) Holding Limited |
Siliconware USA, Inc. |
Engaged in marketing activities |
|
|||||||||||
| SPIL (Cayman) Holding Limited |
Engaged in investing activities |
|
||||||||||||
| SPIL (Cayman) Holding Limited |
Siliconware Technology (Suzhou) Limited (“SZ”) |
|||||||||||||
(Concluded)
| Note | 1: The number of shares held was |
Note |
2: In December 2021, the Company’s board of directors resolved to dispose its 100% shareholdings in those subsidiaries, which were settled in December 2021 and resulted in losing its control over those subsidiaries. Refer to Note 30 DISPOSAL OF SUBSIDIARIES for related disclosure. |
| e. | Business combinations |
Acquisitions of businesses are accounted for using the acquisition method. Acquisition-related costs are generally recognized in profit or loss as they are incurred.
Goodwill is measured as the excess of the sum of the consideration transferred, the amount of any
non-controlling
interests in the acquiree, and the fair value of the acquirer’s previously held equity interest in the acquiree (if any) over the net of the acquisition-date amounts of the identifiable assets acquired and the liabilities assumed. If, after re-assessment,
the net of the acquisition-date amounts of the identifiable assets acquired and liabilities assumed exceeds the sum of the consideration transferred, the amount of any non-controlling
interests in the acquiree and the fair value of the acquirer’s previously held interest in the acquiree (if any), the excess is recognized immediately in profit or loss as a bargain purchase gain. Where the consideration the Group transfers in a business combination includes assets or liabilities resulting from a contingent consideration arrangement, the contingent consideration is measured at its acquisition-date fair value and considered as part of the consideration transferred in a business combination. Changes in the fair value of the contingent consideration that qualify as measurement period adjustments are adjusted retrospectively, with the corresponding adjustments being made against goodwill or gains on bargain purchases. Measurement period adjustments are adjustments that arise from additional information obtained during the measurement period about facts and circumstances that existed as of the acquisition date. The measurement period does not exceed 1 year from the acquisition date.
F-26
The subsequent accounting for changes in the fair value of the contingent consideration that do not qualify as measurement period adjustments depends on how the contingent consideration is classified. Contingent consideration not classified as equity is remeasured at fair value at the end of subsequent reporting period with any gain or loss recognized in profit or loss.
When a business combination is achieved in stages, the Group’s previously held equity interest in an acquiree is remeasured to fair value at acquisition date, and the resulting gain or loss, if any, is recognized in profit or loss or other comprehensive income. Amounts arising from interests in the acquiree prior to the acquisition date that have previously been recognized in other comprehensive income are recognized on the same basis as would be required had those interest been directly disposed of by the Group.
If the initial accounting for a business combination is incomplete by the end of the reporting period in which the combination occurs, the Group reports provisional amounts for the items for which the accounting is incomplete. Those provisional amounts are adjusted retrospectively during the measurement period, or additional assets or liabilities are recognized, to reflect new information obtained about facts and circumstances that existed at the acquisition date that, if known, would have affected the amounts recognized at that date.
Business combination involving entities under common control is not accounted for using the acquisition method but is accounted for at the carrying amounts of the entities. The Group elected not to restate comparative information of the prior period in the financial statements as the business combination was an organization restructure under common control.
| f. | Foreign currencies |
In preparing the financial statements of each individual entity, transactions in currencies other than the entity’s functional currency (i.e. foreign currencies) are recognized at the rates of exchange prevailing at the dates of the transactions.
At each balance sheet date, monetary items denominated in foreign currencies are retranslated at the rates prevailing at that date. Exchange differences on monetary items arising from settlement or translation are recognized in profit or loss in the period in which they arise except for exchange differences on transactions entered into in order to hedge certain foreign currency risks.
Non-monetary
items denominated in foreign currencies that are measured at fair value are retranslated at the rates prevailing at the date when the fair value was determined. Exchange differences arising from the retranslation of non-monetary
items are included in profit or loss for the period except for exchange differences arising from the retranslation of non-monetary
items in respect of which gains and losses are recognized directly in other comprehensive income, in which cases, the exchange differences are also recognized directly in other comprehensive income. Non-monetary
items denominated in a foreign currency and measured at historical cost are translated using the exchange rate at the date of the transaction, and are not retranslated. For the purposes of presenting the consolidated financial statements, the assets and liabilities of the Group’s foreign operations (including subsidiaries, associates and joint ventures in other countries that use currencies which are different from the currency of the Company) are translated into the New Taiwan dollars using exchange rates prevailing at each balance sheet date. Income and expense items are translated at the average exchange rates for the period. The resulting currency translation differences are recognized in other comprehensive income and accumulated in equity attributed to the owners of the Company and
non-controlling
interests as appropriate. On the disposal of the Group’s entire interest in a foreign operation, or a disposal involving the loss of control over a subsidiary that includes a foreign operation, or a partial disposal of an interest in a joint arrangement or an associate that includes a foreign operation of which the retained interest becomes a financial asset, all of the exchange differences accumulated in equity in respect of that operation attributable to the owners of the Company are reclassified to profit or loss.
F-27
In relation to a partial disposal of a subsidiary that does not result in the Group losing control over the subsidiary, the proportionate share of accumulated exchange differences is
re-attributed
to the non-controlling
interests of the subsidiary and is not recognized in profit or loss. For all other partial disposals, the proportionate share of the accumulated exchange differences recognized in other comprehensive income is reclassified to profit or loss. Goodwill and fair value adjustments recognized on identifiable assets and liabilities of acquired foreign operation are treated as assets and liabilities of the foreign operation and translated at the rates of exchange prevailing at the end of each reporting period. Exchange differences are recognized in other comprehensive income.
| g. | Inventories and inventories related to real estate business |
Inventories, including raw materials, supplies, work in process, finished goods, and materials and supplies in transit are stated at the lower of cost or net realizable value. Inventory write-downs are made by item, except for those that may be appropriate to group items of similar or related inventories. Net realizable value is the estimated selling prices of inventories less all estimated costs of completion and estimated costs necessary to make the sale. Raw materials and supplies are recorded at moving average cost while work in process and finished goods are recorded at standard cost.
Inventories related to real estate business include land and buildings held for sale, land held for construction and construction in progress. Land held for development is recorded as land held for construction upon obtaining the title of ownership. Prior to the completion, the borrowing costs directly attributable to construction in progress are capitalized as part of the cost of the asset. Construction in progress is transferred to land and buildings held for sale upon completion. Land and buildings held for sale, construction in progress and land held for construction are stated at the lower of cost or net realizable value and related write-downs are made by item. The amounts received in advance for real estate properties are first recorded as advance receipts and then recognized as revenue when the construction is completed and the title and significant risk of the real estate properties are transferred to customers. Cost of sales of land and buildings held for sale are recognized based on the ratio of property sold to the total property developed.
| h. | Investments in associates and joint ventures |
An associate is an entity over which the Group has significant influence and that is neither a subsidiary nor an interest in a joint venture. Joint venture is a joint arrangement whereby the Group and other parties that have joint control of the arrangement have rights to the net assets of the arrangement.
The Group applies the equity method to investments in an associate and joint venture.
Under the equity method, investments in an associate and a joint venture are initially recognized at cost and adjusted thereafter to recognize the Group’s share of the profit or loss and other comprehensive income of the associate and joint venture. The Group also recognizes the changes in the Group’s share of equity of associates and joint venture.
Any excess of the cost of acquisition over the Group’s share of the net fair value of the identifiable assets and liabilities of an associate or a joint venture at the date of acquisition is recognized as goodwill, which is included within the carrying amount of the investment and is not amortized. Any excess of the Group’s share of the net fair value of the identifiable assets and liabilities over the cost of acquisition after reassessment is recognized immediately in profit or loss.
F-28
When the Group subscribes for additional new shares of an associate and joint venture at a percentage different from its existing ownership percentage, the resulting carrying amount of the investment differs from the amount of the Group’s proportionate interest in the associate and joint venture. The Group records such a difference as an adjustment to investments with the corresponding amount charged to gain or loss on disposal of investments accounted for using the equity method. When the Group reduces its ownership interest in an associate or a joint venture but the Group continues to use the equity method, the Group reclassifies to profit or loss the proportion of the gain or loss that had previously been recognised in other comprehensive income relating to that reduction in ownership interest if that gain or loss would be reclassified to profit or loss on the disposal of the related assets or liabilities.
When the Group’s share of losses of an associate and a joint venture equals or exceeds its interest in that associate and joint venture (which includes any carrying amount of the investment accounted for using the equity method and long-term interests that, in substance, form part of the Group’s net investment in the associate and joint venture), the Group discontinues recognizing its share of further losses. Additional losses and liabilities are recognized only to the extent that the Group has incurred legal obligations or constructive obligations, or made payments on behalf of that associate and joint venture.
The entire carrying amount of an investment (including goodwill) is tested for impairment as a single asset by comparing its recoverable amount with its carrying amount. Any impairment loss recognized is not allocated to any asset, including goodwill, that forms part of the carrying amount of the investment. Any reversal of that impairment loss is recognized to the extent that the recoverable amount of the investment subsequently increases.
The Group discontinues the use of the equity method from the date on which its investment ceases to be an associate and a joint venture. Any retained investment is measured at fair value at that date, and the fair value is regarded as the investment’s fair value on initial recognition as a financial asset. The difference between the previous carrying amount of the associate and the joint venture attributable to the retained interest and its fair value is included in the determination of the gain or loss on disposal of the associate and the joint venture. The Group accounts for all amounts previously recognized in other comprehensive income in relation to that associate and joint venture on the same basis as would be required had that associate directly disposed of the related assets or liabilities. If an investment in an associate becomes an investment in a joint venture or an investment in a joint venture becomes an investment in an associate, the Group continues to apply the equity method and does not remeasure the retained interest.
When a group entity transacts with its associate and joint venture, profits and losses resulting from the transactions with the associate and joint venture are recognized in the Group’ consolidated financial statements only to the extent that interests in the associate and the joint venture are not related to the Group.
| i. | Property, plant and equipment |
Except for land which is stated at cost, property, plant and equipment are stated at cost less accumulated depreciation and accumulated impairment.
Properties in the course of construction are carried at cost, less any recognized impairment loss. Cost includes professional fees and borrowing costs eligible for capitalization. Such assets are depreciated and classified to the appropriate categories of property, plant and equipment when completed and ready for their intended use.
Freehold land is not depreciated.
F-2
9
Depreciation of property, plant and equipment is recognized using the straight-line method. Each significant part is depreciated separately. The estimated useful lives, residual values and depreciation method are reviewed at each balance sheet date, with the effect of any changes in estimate accounted for on a prospective basis.
On derecognition of an item of property, plant and equipment, the difference between the sales proceeds and the carrying amount of the asset is recognized in profit or loss.
| j. | Investment properties |
Investment properties are properties held to earn rental and/or for capital appreciation. Investment properties include assets and properties under construction that meet the definition of investment properties.
right-of-use
Freehold investment properties are initially measured at cost, including transaction costs. Subsequent to initial recognition, investment properties are measured at cost less accumulated depreciation and accumulated impairment loss.
Investment properties acquired through leases are initially measured at cost, which comprises the initial measurement of lease liabilities adjusted for lease payments made on or before the commencement date, plus initial direct costs incurred and an estimate of costs needed to restore the underlying assets, less any lease incentives received. These investment properties are subsequently measured at cost less accumulated depreciation and accumulated impairment loss and adjusted for any remeasurement of the lease liabilities.
Depreciation is recognized using the straight-line method.
Investment properties under construction are measured at cost less accumulated impairment loss. Cost includes professional fees and borrowing costs eligible for capitalization. Depreciation of these assets commences when the assets are ready for their intended use.
For a transfer of classification from investment properties to property, plant and equipment and to assets, the deemed cost of the property for subsequent accounting is its carrying amount at the commencement of owner-occupation.
right-of-use
For a transfer of classification from property, plant and equipment and assets to investment properties, the deemed cost of an item of property for subsequent accounting is its carrying amount at the end of owner-occupation.
right-of-use
For a transfer of classification from inventories to investment properties, the deemed cost of an item of property for subsequent accounting is its carrying amount at the inception of an operating lease.
On derecognition of an investment property, the difference between the net disposal proceeds and the carrying amount of the asset is included in profit or loss.
| k. | Goodwill |
Goodwill arising from an acquisition of a business is carried at cost as established at the date of acquisition of the business less accumulated impairment loss.
For the purposes of impairment testing, goodwill is allocated to each of the Group’s cash-generating units or groups of cash-generating units (referred to as “cash-generating unit”) that is expected to benefit from the synergies of the combination.
F-30
A cash-generating unit to which goodwill has been allocated is tested for impairment annually, or more frequently when there is an indication that the unit may be impaired, by comparing its carrying amount, including the attributed goodwill, with its recoverable amount. However, if the goodwill allocated to a cash-generating unit was acquired in a business combination during the current annual period, that unit shall be tested for impairment before the end of the current annual period. If the recoverable amount of the cash-generating unit is less than its carrying amount, the impairment loss is allocated first to reduce the carrying amount of any goodwill allocated to the unit and then pro rata to the other assets of the unit based on the carrying amount of each asset in the unit. Any impairment loss is recognized directly in profit or loss. An impairment loss recognized for goodwill is not reversed in subsequent periods.
| l. | Other intangible assets |
| 1) | Separate acquisition |
Other intangible assets with finite useful lives acquired separately are initially measured at cost and subsequently measured at cost less accumulated amortization and accumulated impairment loss. Other intangible assets are amortized using the straight-line method over their estimated useful lives. The estimated useful lives, residual values, and amortization methods are reviewed at each balance sheet date, with the effect of any changes in estimate being accounted for on a prospective basis.
| 2) | Acquired through business combinations |
Other intangible assets acquired in a business combination and recognized separately from goodwill are initially recognized at their fair value at the acquisition date which is regarded as their cost. Subsequent to initial recognition, they are measured on the same basis as intangible assets that are acquired separately.
| 3) | Derecognition |
On derecognition of an intangible asset, the difference between the net disposal proceeds and the carrying amount of the asset are recognized in profit or loss.
| m. | Impairment of property, plant and equipment, right-of-use |
At each balance sheet date or whenever events or changes in circumstances indicate that the carrying value may not be recoverable, the Group reviews the carrying amounts of its property, plant and equipment, asset, investment properties and intangible assets, excluding goodwill, to determine whether there is any indication that those assets have suffered an impairment loss. If any such indication exists, the recoverable amount of the asset is estimated in order to determine the extent of the impairment loss. When it is not possible to estimate the recoverable amount of an individual asset, the Group estimates the recoverable amount of the cash-generating unit to which the asset belongs. Corporate assets are allocated to the individual cash-generating units on a reasonable and consistent basis of allocation. The recoverable amount is the higher of fair value less costs to sell and value in use. If the recoverable amount of an asset or cash-generating unit is estimated to be less than its carrying amount, the carrying amount of the asset or cash-generating unit is reduced to its recoverable amount, with the resulting impairment loss recognized in profit or loss.
right-of-use
When an impairment loss is subsequently reversed, the carrying amount of the asset or cash-generating unit is increased to the revised estimate of its recoverable amount, but only to the extent of the carrying amount that would have been determined had no impairment loss been recognized for the asset or cash-generating unit in prior years. A reversal of an impairment loss is recognized immediately in profit or loss.
F-31
n. |
Financial instruments |
Financial assets and financial liabilities are recognized when a group entity becomes a party to the contractual provisions of the instruments.
Financial assets and financial liabilities are initially measured at fair value. Transaction costs that are directly attributable to the acquisition or issue of financial assets and financial liabilities (other than financial assets and financial liabilities at FVTPL) are added to or deducted from the fair value of the financial assets or financial liabilities, as appropriate, on initial recognition. Transaction costs directly attributable to the acquisition of financial assets or financial liabilities at fair value through profit or loss are recognized immediately in profit or loss.
| 1) | Financial assets |
All regular way purchases or sales of financial assets are recognized and derecognized on a settlement date basis.
| a) | Measurement categories |
Financial assets held by the Group are classified into the following categories: financial assets at FVTPL, financial assets at amortized cost and investments in debt instruments and equity instruments at FVTOCI.
| i. | Financial asset at FVTPL |
Financial asset is classified as at FVTPL when the financial asset is mandatorily classified or it is designated as at FVTPL. The Group’s financial assets mandatorily classified as at FVTPL include investments in equity instruments which are not designated as at FVTOCI and debt instruments that do not meet the amortized cost criteria or the FVTOCI criteria.
Financial assets at FVTPL are subsequently measured at fair value, and any dividends or interest earned on such financial assets are recognized in other income; any remeasurement gains or losses on such financial assets are recognized in other gains or losses.
Fair value is determined in the manner described in Note 34.
| ii. | Financial assets at amortized cost |
Financial assets that meet the following conditions are subsequently measured at amortized cost:
| i) | The financial asset is held within a business model whose objective is to hold financial assets in order to collect contractual cash flows; and |
| ii) | The contractual terms of the financial asset give rise on specified dates to cash flows that are solely payments of principal and interest on the principal amount outstanding. |
Subsequent to initial recognition, financial assets at amortized cost, including cash and cash equivalents, trade receivables at amortized cost, other receivables and other financial assets, are measured at amortized cost, which equals to gross carrying amount determined using the effective interest method less any impairment loss. Exchange differences are recognized in profit or loss.
F-32
Interest income is calculated by applying the effective interest rate to the gross carrying amount of a financial asset, except for:
| i) | Purchased or originated credit-impaired financial assets, for which interest income is calculated by applying the credit-adjusted effective interest rate to the amortized cost of the financial asset; and |
| ii) | Financial assets that are not credit-impaired on purchase or origination but have subsequently become credit-impaired, for which interest income is calculated by applying the effective interest rate to the amortized cost of such financial assets in subsequent reporting periods. |
A financial asset is credit impaired when one or more of the following events have occurred:
| i) | Significant financial difficulty of the issuer or the borrower; |
| ii) | Breach of contract, such as a default; |
| iii) | It is becoming probable that the borrower will enter bankruptcy or undergo a financial reorganization; or |
| iv) | The disappearance of an active market for that financial asset because of financial difficulties. |
Cash equivalents include time deposits with original maturities within 3 months from the date of acquisition, which are highly liquid, readily convertible to a known amount of cash and are subject to an insignificant risk of changes in value
and repurchase agreements collateralized by bonds.
These cash equivalents are held for the purpose of meeting short-term cash commitments.
| iii. | Investments in debt instruments at FVTOCI |
For the Group’s debt instruments that meet the following conditions are subsequently measured at FVTOCI:
| i) | the debt instrument is held within a business model whose objective is achieved by both the collecting of contractual cash flows and the selling of the financial assets; and |
| ii) | the contractual terms of the debt instrument give rise on specified dates to cash flows that are solely payments of principal and interest on the principal amount outstanding. |
Investments in debt instruments at FVTOCI are subsequently measured at fair value. Changes in the carrying amounts of these debt instruments relating to changes in foreign currency exchange rates, interest income calculated using the effective interest method and impairment losses or reversals are recognized in profit or loss. Other changes in the carrying amount of these debt instruments are recognized in other comprehensive income and will be reclassified to profit or loss when the investment is disposed of.
| iv. | Investments in equity instruments at FVTOCI |
On initial recognition, the Group make an irrevocable election to designate investments in equity instruments as at FVTOCI. Designation at FVTOCI is not permitted if the equity investment is held for trading or if it is contingent consideration recognized by an acquirer in a business combination.
Investments in equity instruments at FVTOCI are subsequently measured at fair value with gains and losses arising from changes in fair value recognized in other comprehensive income and accumulated in other equity. The cumulative gain or loss will not be reclassified to profit or loss on disposal of the equity investments, instead, they will be transferred to retained earnings.
F-33
Dividends on these investments in equity instruments are recognized in profit or loss when the Group’s right to receive the dividends is established, unless the dividends clearly represent a recovery of part of the cost of the investment.
| b) | Impairment of financial assets and contract assets |
At each balance sheet date, the Group recognizes a loss allowance for expected credit losses on financial assets at amortized cost (including trade receivables) and investments in debt instruments that are measured at FVTOCI
and
contract assets. The Group always recognizes lifetime Expected Credit Loss (“ECL”) for trade receivables and contract assets. For all other financial instruments, the Group recognizes lifetime ECL when there has been a significant increase in credit risk since initial recognition. If, on the other hand, the credit risk on the financial instrument has not increased significantly since initial recognition, the Group measures the loss allowance for that financial instrument at an amount equal to
12-month
ECL. Expected credit losses reflect the weighted average of credit losses with the respective risks of a default occurring as the weights. Lifetime ECL represents the expected credit losses that will result from all possible default events over the expected life of a financial instrument. In contrast,
12-month
ECL represents the portion of lifetime ECL that is expected to result from default events on a financial instrument that are possible within 12 months after the reporting date. The Group recognizes an impairment gain or loss in profit or loss for all financial instruments with a corresponding adjustment to their carrying amount through a loss allowance account, except for investments in debt instruments that are measured at FVTOCI, for which the loss allowance is recognized in other comprehensive income and does not reduce the carrying amount of the financial asset.
| c) | Derecognition of financial assets |
The Group derecognizes a financial asset only when the contractual rights to the cash flows from the asset expire or when it transfers the financial asset and substantially all the risks and rewards of ownership of the asset to another entity.
On derecognition of a financial asset at amortized cost in its entirety, the difference between the asset’s carrying amount and the sum of the consideration received and receivable is recognized in profit or loss. On derecognition of an investment in a debt instrument at FVTOCI, the difference between the asset’s carrying amount and the sum of the consideration received and receivable and the cumulative gain or loss which had been recognized in other comprehensive income is recognized in profit or loss. However, on derecognition of an investment in an equity instrument at FVTOCI, the difference between the asset’s carrying amount and the sum of the consideration received and receivable is recognized in profit or loss, and the cumulative gain or loss which had been recognized in other comprehensive income is transferred directly to retained earnings, without recycling through profit or loss.
| 2) | Equity instruments |
Debt and equity instruments issued by a group entity are classified as either financial liabilities or as equity in accordance with the substance of the contractual arrangements and the definitions of a financial liability and an equity instrument.
Equity instruments issued by a group entity are recognized at the proceeds received, net of direct issue costs.
F-34
Repurchase of the Company’s own equity instruments is recognized in and deducted directly from equity. No gain or loss is recognized in profit or loss on the purchase, sale, issue or cancellation of the Company’s own equity instruments.
| 3) | Financial liabilities |
| a) | Subsequent measurement |
All
financial liabilities are measured at amortized cost using the effective interest methodor at fair value through profit or loss:
Financial liabilities are classified as at FVTPL when such financial liabilities are held for trading. Financial liabilities held for trading are stated at fair value, and any gains or losses on such financial liabilities are recognized in other gains or losses.
Fair value is determined in the manner described in Note 34.
| b) | Derecognition of financial liabilities |
The difference between the carrying amount of a financial liability derecognized and the consideration paid, including any
non-cash
assets transferred or liabilities assumed, is recognized in profit or loss. | 4) | Derivative financial instruments |
The Group enters into a variety of derivative financial instruments to manage its exposure to interest rate and foreign exchange rate risks, including forward exchange contracts, swap contracts and target redemption forward contracts.
Derivatives are initially recognized at fair value at the date on which the derivative contracts are entered into and are subsequently remeasured to their fair value at the end of each reporting period. The resulting gain or loss is recognized in profit or loss immediately unless the derivative is designated and effective as a hedging instrument; in which event, the timing of the recognition in profit or loss depends on the nature of the hedging relationship. When the fair value of a derivative financial instrument is positive, the derivative is recognized as a financial asset; when the fair value of a derivative financial instrument is negative, the derivative is recognized as a financial liability.
Derivatives embedded in hybrid contracts that contain financial asset hosts that is within the scope of IFRS 9 are not separated; instead, the classification is determined in accordance with the entire hybrid contract. Derivatives embedded in
non-derivative
host contracts that are not financial assets that is within the scope of IFRS 9 (e.g. financial liabilities) are treated as separate derivatives when they meet the definition of a derivative, their risks and characteristics are not closely related to those of the host contracts and the host contracts are not measured at FVTPL. 5) |
Convertible bonds issued by the subsidiaries |
The component parts of compound instruments (i.e., convertible bonds) issued by the subsidiary are classified separately as financial liabilities and equity in accordance with the substance of the contractual arrangements and the definitions of a financial liability and an equity instrument.
On initial recognition, the fair value of the liability component is estimated using the prevailing market interest rate for similar non-convertible instruments. This amount is recorded as a liability on an amortized cost basis using the effective interest method until extinguished upon conversion or upon the instrument’s maturity date. Any embedded derivative liability is measured at fair value.
The conversion option classified as equity is determined by deducting the amount of the liability component from the fair value of the compound instrument as a whole. This is recognized and included in non-controlling interests, and is not subsequently remeasured. When the conversion option remains unexercised at maturity, the balance recognized in non-controlling interests will be transferred to capital surplus - the change of interest in subsidiaries.
Transaction costs that relate to the issuance of the convertible bonds are allocated to the liability and equity components in proportion to the allocation of the gross proceeds. Transaction costs relating to the equity component are recognized directly in non-controlling interests. Transaction costs relating to the liability component are included in the carrying amount of the liability component.
| o. | Hedge accounting |
The Group designates certain hedging instruments, which include derivatives, embedded derivatives and
non-derivatives
in respect of foreign currency risk, as either fair value hedges or cash flow hedges or hedges of net investment in foreign operations. | 1) | Fair value hedges |
Gains or losses on hedging instruments that are designated and qualify as fair value hedges are recognized in profit or loss immediately, together with any changes in the fair value of the hedged asset or liability that are attributable to the hedged risk. The change in the fair value of the hedging instrument and the change in the hedged item attributable to the hedged risk are recognized in profit or loss in the line item relating to the hedged item.
F-35
The Group discontinues hedge accounting only when the hedging relationship ceases to meet the qualifying criteria; for instance, when the hedging instrument expires or is sold, terminated or exercised.
| 2) | Cash flow hedges |
The effective portion of gains or losses on hedging instruments that are designated and qualify as cash flow hedges is recognized in other comprehensive income. The gains or losses relating to the ineffective portion are recognized immediately in profit or loss.
The associated gains or losses that were recognized in other comprehensive income are reclassified from equity to profit or loss as a reclassification adjustment in the line item relating to the hedged item in the same period when the hedged item affects profit or loss. If a hedge of a forecasted transaction subsequently results in the recognition of a
non-financial
asset or a non-financial
liability, the associated gains and losses that were recognized in other comprehensive income are removed from equity and included in the initial cost of the non-financial
asset or non-financial
liability. The Group discontinues hedge accounting only when the hedging relationship cease to meet the qualifying criteria; for instance, when the hedging instrument expires or is sold, terminated, or exercised. The cumulative gain or loss on the hedging instrument that has been previously recognized in other comprehensive income from the period when the hedge was effective remains separately in equity until the forecast transaction occurs. When a forecast transaction is no longer expected to occur, the gain or loss accumulated in equity is recognized immediately in profit or loss.
| 3) | Hedges of net investments in foreign operations |
Hedges of net investments in foreign operations are accounted for similarly to cash flow hedges. Any gains or losses on the hedging instrument relating to the effective portion of the hedge are recognized in other comprehensive income and accumulated under the heading of foreign currency translation reserve. The gains or losses relating to the ineffective portion are recognized immediately in profit or loss.
The gains and losses on the hedging instrument relating to the effective portion of the hedge, which were accumulated in the foreign currency translation reserve, are reclassified to profit or loss on the disposal or partial disposal of a foreign operation.
| p. | Revenue recognition |
The Group identifies the contracts with customers, allocates transaction prices to performance obligations and, when performance obligations are satisfied, recognizes revenues at fixed amounts as agreed in the contracts with taking estimated volume discounts into consideration.
For contracts where the period between the date on which the Group transfers a promised good or service to a customer and the date on which the customer pays for that good or service is one year or less, the Group does not adjust the promised amount of consideration for the effects of a significant financing component.
The Group’s duration of contracts with customers is expected to be one year or less, and the consideration from contracts with customers is included in transaction price and, therefore, can apply the practical expedient that not to disclose the performance obligations including (i) the aggregate amount of the transaction price allocated to the performance obligations that are not fully satisfied or have partially completed at the end of the reporting period, and (ii) the expected timing for recognition of revenue.
F-36
The Group’s operating revenues include revenues from sale of goods and services as well as sale and leasing of real estate properties.
When customers control goods while they are manufactured in progress, the Group measures the progress on the basis of costs incurred relative to the total expected costs as there is a direct relationship between the costs incurred and the progress of satisfying the performance obligations. Revenue and contract assets are recognized during manufacture and contract assets are reclassified to trade receivables when the manufacture is completed or when the goods are shipped upon customer’s request.
The Group recognizes revenues and trade receivables when the goods are shipped or when the goods are delivered to the customer’s specific location because it is the time when the customer has full discretion over the manner of distribution and price to sell the goods, has the primary responsibility for sales to future customers and bears the risks of obsolescence.
Revenues from sale of real estate properties are recognized when customers purchase real estate properties and complete the transfer procedures. Revenues from leasing real estate properties are recognized during leasing periods on the straight-line basis.
| q. | Leases |
At the inception of a contract, the Group assesses whether the contract is, or contains, a lease.
For a contract that contains a lease component and
non-lease
components, the Group elects to account for the lease and non-lease
components as a single lease component. | 1) | The Group as lessor |
Leases are classified as finance leases whenever the terms of a lease transfer substantially all the risks and rewards of ownership to the lessee. All other leases are classified as operating leases.
When the Group subleases a asset, the sublease is classified by reference to the asset arising from the head lease, not with reference to the underlying asset. However, if the head lease is a short-term lease that the Group, as a lessee, has accounted for applying recognition exemption, the sublease is classified as an operating lease.
right-of-use
right-of-use
Lease payments (less any lease incentives payable) from operating leases are recognized as income on a straight-line basis over the terms of the relevant leases. Initial direct costs incurred in obtaining operating leases are added to the carrying amounts of the underlying assets and recognized as expenses on a straight-line basis over the lease terms.
| 2) | The Group as lessee |
The Group recognizes assets and lease liabilities for all leases at the commencement date of a lease, except for short-term leases and
right-of-use
low-value
asset leases accounted for applying a recognition exemption where lease payments are recognized as expenses on a straight-line basis over the lease terms. Right-of-use
Right-of-use
Right-of-use
right-of-use
F-37
Right-of-use
right-of-use
right-of-use
right-of-use
Lease liabilities are initially measured at the present value of the lease payments, which comprise fixed payments,
in-substance
fixed payments, variable lease payments which depend on an index or a rate, residual value guarantees, the exercise price of a purchase option if the Group is reasonably certain to exercise that option, and payments of penalties for terminating a lease if the lease term reflects such termination, less any lease incentives receivable. The lease payments are discounted using the interest rate implicit in a lease, if that rate can be readily determined. If that rate cannot be readily determined, the Group uses the lessee’s incremental borrowing rate. Subsequently, lease liabilities are measured at amortized cost using the effective interest method, with interest expense recognized over the lease terms. When there is a change in a lease term, a change in the amounts expected to be payable under a residual value guarantee, a change in the assessment of an option to purchase an underlying asset, or a change in future lease payments resulting from a change in an index or a rate used to determine those payments, the Group remeasures the lease liabilities with a corresponding adjustment to the assets. However, if the carrying amount of the assets is reduced to zero, any remaining amount of the remeasurement is recognized in profit or loss. For a lease modification that is not accounted for as a separate lease, the Group accounts for the remeasurement of the lease liability by (a) decreasing the carrying amount of the asset of lease modifications that decreased the scope of the lease, and recognizing in profit or loss any gain or loss on the partial or full termination of the lease; (b) making a corresponding adjustment to the asset of all other lease modifications. Lease liabilities are presented on a separate line in the consolidated balance sheets.
right-of-use
right-of-use
right-of-use
right-of-use
The Group negotiates with the lessor for rent concessions as a direct consequence of the COVID-19 to change the lease payments originally due by June 30, 2022, that results in the revised consideration for the lease substantially less than the consideration for the lease immediately preceding the change. There is no substantive change to other terms and conditions. The Group elects to apply the practical expedient to all of these rent concessions, and therefore, does not assess whether the rent concessions are lease modifications. Instead, the Group recognizes the reduction in lease payment in profit or loss as a deduction of expenses of variable lease payments, in the period in which the events or conditions that trigger the concession occurs, and makes a corresponding adjustment to the lease liability.
Variable lease payments that do not depend on an index or a rate are recognized as expenses in the periods in which they are incurred.
| r. | Borrowing costs |
Borrowing costs directly attributable to the acquisition, construction or production of qualifying assets are added to the cost of those assets, until such time as the assets are substantially ready for their intended use or sale.
Investment income earned on the temporary investment of specific borrowings pending their expenditure on qualifying assets is deducted from the borrowing costs eligible for capitalization.
Other than stated above, all other borrowing costs are recognized in profit or loss in the period in which they are incurred.
| s. | Government grants |
F-38
Government grants related to income are not recognized until there is reasonable assurance that the Group will comply with the conditions attaching to them and that the grants will be received.
Government grants are recognized in other income on a systematic basis over the periods in which the Group recognizes as expenses the related costs for which the grants are intended to compensate. Specifically, government grants whose primary condition is that the Group should purchase, construct or otherwise acquire
non-current
assets are recognized as deferred revenue in the consolidated financial statements and transferred to profit or loss on a systematic and rational basis over the useful lives of the related assets. Government grants that are receivable as compensation for expenses or losses already incurred or for the purpose of giving immediate financial support to the Group with no future related costs are recognized in profit or loss in the period in which they become receivable.
The
benefit of a
government
l
a below-market rate of interest is treated as a government grant measured as the difference between the proceeds received and the fair value of the loan based on prevailing market interest rates. oa
n received at
| t. | Employee benefits |
| 1) | Short-term employee benefits |
Liabilities recognized in respect of short-term employee benefits are measured at the undiscounted amount of the benefits expected to be paid in exchange for the related services.
| 2) | Retirement benefits |
Payments to defined contribution retirement benefit plans are recognized as expenses when employees have rendered services entitling them to the contributions.
Defined benefit costs (including service cost, net interest and remeasurement) under the defined benefit retirement benefit plans are determined using the projected unit credit method. Service cost (including current service cost and past service cost) and net interest on the net defined benefit liability (asset) are recognized as employee benefits expense in the period they occur. Remeasurement, comprising actuarial gains and losses and the return on plan assets (excluding interest), is recognized in other comprehensive income in the period in which they occur. Remeasurement recognized in other comprehensive income is reflected immediately in retained earnings and will not be reclassified to profit or loss.
Net defined benefit liability (asset) represents the actual deficit (surplus) in the Group’s defined benefit plan. Any surplus resulting from this calculation is limited to the present value of any refunds from the plans or reductions in future contributions to the plans.
| u. | Share-based payment arrangements |
The fair value at the grant date of the employee share options and restricted for cash which are reserved for employees is the date on which the number of shares that the employees purchase is confirmed.
stocks
for employees is expensed on a straight-line basis over the vesting period, based on the Group’s best estimate of the number of options or shares that are expected to ultimately vest, with a corresponding increase in capital surplus—employee share options or non-controlling
interests (employee share options issued by subsidiaries) and other equity - unearned employee benefits or non-controlling interests (restricted s
tocks
for employees issued by subsidiaries). It is recognized as an expense in full at the grant date if vesting immediately. The grant date of issued ordinary shares
When restricted
stocks
for employees are issued, other equity - unearned employee benefits is recognized on the grant date, with a corresponding increase in capital surplus - restricted stocks
for employees. At each balance sheet date, the Group reviews its estimate of the number of employee share options and restricted
st
for employees expected to vest. The impact of the revision of the original estimates is recognized in profit or loss such that the cumulative expense reflects the revised estimate, with a corresponding adjustment to the capital surplus—employee share options or o
cks
non-controlling
interests (employee share options issued by subsidiaries) and other equity - unearned employee benefits or non-controlling interests (restricted stocks
for employees issued by subsidiaries). F-39
v. |
Taxation |
Income tax expense represents the sum of the tax currently payable and deferred tax.
| 1) | Current tax |
Income tax payable (recoverable) is based on taxable profit (loss) for the year determined according to the applicable tax laws of each tax jurisdiction. Taxable profit differs from net profit as reported in profit or loss because it excludes items of income or expense that are taxable or deductible in other years and it further excludes items that are never taxable or deductible. The Group’s liability for current tax is calculated using tax rates that have been enacted or substantively enacted by the end of the reporting period.
Adjustments of prior years’ tax liabilities are added to or deducted from the current year’s tax provision.
| 2) | Deferred tax |
Deferred tax is recognized on temporary differences between the carrying amounts of assets and liabilities in the consolidated financial statements and the corresponding tax bases used in the computation of taxable profit. If a temporary difference arises from the initial recognition (other than in a business combination) of assets and liabilities in a transaction that affects neither the taxable profit nor the accounting profit, the resulting deferred tax asset or liability is not recognized. In addition, a deferred tax liability is not recognized on taxable temporary differences arising from the initial recognition of goodwill.
Deferred tax liabilities are generally recognized for all taxable temporary differences. Deferred tax assets are generally recognized for all deductible temporary differences, unused loss carryforwards and unused tax credits for capital expenditure to the extent that it is probable that taxable profits will be available against which those deductible temporary differences can be utilized.
Deferred tax liabilities are recognized for taxable temporary differences associated with investments in subsidiaries and associates, except where the Group is able to control the reversal of the temporary differences and it is probable that the temporary difference will not reverse in the foreseeable future. Deferred tax assets arising from deductible temporary difference associated with such investments and interests are only recognized to the extent that it is probable that there will be sufficient taxable profits against which to utilize the benefits of the temporary differences and they are expected to reverse in the foreseeable future.
The carrying amount of deferred tax assets is reviewed at each balance sheet date and reduced to the extent that it is no longer probable that sufficient taxable profits will be available to allow all or part of the assets to be recovered. A previously unrecognized deferred tax asset is also reviewed at each balance sheet date and recognized to the extent that it has become probable that future taxable profit will allow the deferred tax asset to be recovered.
Deferred tax liabilities and assets are measured at the tax rates that are expected to apply in the period in which the liabilities are settled or assets are realized, based on tax rates (and tax laws) that have been enacted or substantively enacted by the balance sheet date. The measurement of deferred tax liabilities and assets reflects the tax consequences that would follow from the manner in which the Group expects, at the balance sheet date, to recover or settle the carrying amount of its assets and liabilities.
F-40
| 3) | Current and deferred tax for the year |
Current and deferred tax are recognized in profit or loss, except when they relate to items that are recognized in other comprehensive income or directly in equity, in which case, the current and deferred tax are also recognized in other comprehensive income or directly in equity, respectively.
Where current tax or deferred tax arises from the initial accounting for a business combination, the tax effect is included in the accounting for the business combination.
| w. | U.S. Dollar Amounts |
A translation of the consolidated financial statements into U.S. dollars is included solely for the convenience of the readers and has been translated from New Taiwan dollar (NT$) at the exchange rate as set forth in the statistical release by the U.S. Federal Reserve Board of the United States, which was NT$27.74 to US$1.00 as of December 31, 2021. The translation should not be construed as a representation that the NT$ amounts have been, could have been, or could in the future be, converted into U.S. dollars at this or any other rate of exchange.
5. |
CRITICAL ACCOUNTING JUDGMENTS AND KEY SOURCES OF ESTIMATION UNCERTAINTY |
In the application of the Group’s accounting policies, management is required to make judgments, estimates and assumptions on the carrying amounts of assets and liabilities that are not readily apparent from other sources. The estimates and underlying assumptions are based on historical experience and other factors that are considered to be relevant. Actual results may differ from these estimates.
The Group considers the recent development of the
COVID-19
in R.O
and its economic environment implications when making its critical accounting estimates in cash flow projections, growth rate, discount rate, profitability, etc. The estimates and underlying assumptions are reviewed on an ongoing basis. Revisions to accounting estimates are recognized in the .
C
.
year
in which the estimates are revised if the revisions affect only that year
or in the year
of the revisions and future year
if the revisions affect both current and future s
years
. | Impairment of goodwill |
Determining whether goodwill is impaired requires an estimation of the value in use of the cash-generating units to which goodwill has been allocated. The calculation of the value in use requires management to estimate the future cash flows expected to be generated from the cash-generating units and a suitable discount rate in order to calculate the present value. Where the actual future cash flows are less than expected, or change in facts and circumstances results in downward revision of future cash flows or upward revision of discount rate, a material impairment loss may arise.
6. |
CASH AND CASH EQUIVALENTS |
December 31 |
||||||||||||
2020 |
2021 |
|||||||||||
NT$ |
NT$ |
US$ (Note 4) |
||||||||||
| Cash on hand |
$ | $ | $ | |||||||||
| Checking accounts and demand deposits |
||||||||||||
| Cash equivalents (time deposits with original maturity of less than three months and repurchase agreements collateralized by bonds) |
||||||||||||
| |
|
|
|
|
|
|||||||
| $ | $ | $ | ||||||||||
| |
|
|
|
|
|
|||||||
F-41
7. |
FINANCIAL INSTRUMENTS AT FAIR VALUE THROUGH PROFIT OR LOSS |
December 31 |
||||||||||||
2020 (Retrospectively Adjusted) |
2021 |
|||||||||||
NT$ |
NT$ |
US$ (Note 4) |
||||||||||
| Financial assets mandatorily classified as at FVTPL |
||||||||||||
| Derivative instruments (non-designated hedges) |
||||||||||||
| Swap contracts |
$ | $ | $ | |||||||||
| Forward exchange contracts |
||||||||||||
| Redemption option and put option of convertible bonds |
- | |||||||||||
| Target redemption forward contracts |
- | |||||||||||
| Non-derivative financial assets |
||||||||||||
| Quoted ordinary shares |
||||||||||||
| Private-placement funds |
||||||||||||
| Unquoted preferred shares |
||||||||||||
| Contingent considerations (Note 29) |
||||||||||||
| Open-end mutual funds |
||||||||||||
| |
|
|
|
|
|
|||||||
| Current |
||||||||||||
| |
|
|
|
|
|
|||||||
| Non-current |
$ | $ | $ | |||||||||
| |
|
|
|
|
|
|||||||
| Financial liabilities held for trading |
||||||||||||
| Derivative instruments (non-designated hedging) |
||||||||||||
| Swap contracts |
$ | $ | $ | |||||||||
| Forward exchange contracts |
||||||||||||
| Target redemption forward contracts |
- | - | ||||||||||
| |
|
|
|
|
|
|||||||
| Current |
$ | $ | $ | |||||||||
| |
|
|
|
|
|
|||||||
At each balance sheet date, outstanding swap contracts not accounted for hedge accounting were as follows:
Notional Amount |
||||||||
Currency |
Maturity Period |
(In Thousands) |
||||||
| December 31, 2020 |
||||||||
| Sell NT$/Buy US$ |
- |
NT$ |
||||||
| Sell US$/Buy RMB |
- |
US$ |
||||||
| Sell US$/Buy HKD |
2 | US$ |
||||||
| Sell US$/Buy JPY |
1 | US$ |
||||||
| Sell US$/Buy KRW |
1 | US$ |
||||||
| Sell US$/Buy NT$ |
- |
US$ |
||||||
| December 31, 2021 |
||||||||
| Sell RMB/Buy US$ |
1 | RMB |
||||||
| Sell NT$/Buy US$ |
- | NT$ |
||||||
| Sell US$/Buy RMB |
2 | US$ |
||||||
| Sell US$/Buy JPY |
1 | US$ |
||||||
| Sell US$/Buy KRW |
1 | US$ |
||||||
| Sell US$/Buy NT$ |
- | US$ N T $ |
||||||
F-42
At each balance sheet date, outstanding forward exchange contracts not accounted for hedge accounting were as
follows
:
Notional Amount | ||||
Currency |
Maturity Period |
(In Thousands) | ||
| December 31, 2020 |
||||
| Sell RMB/Buy US$ |
RMB | |||
| Sell HKD/Buy US$ |
HKD | |||
| Sell NT$/Buy US$ |
- |
NT$ | ||
| Sell US$/Buy RMB |
- |
US$ | ||
| Sell US$/Buy EUR |
US$ | |||
| Sell US$/Buy JPY |
- |
US$ | ||
| Sell US$/Buy KRW |
1 | US$ | ||
| Sell US$/Buy MYR |
- |
US$ | ||
| Sell US$/Buy NT$ |
- |
US$ | ||
| Sell US$/Buy SGD |
- |
US$ | ||
| December 31, 2021 |
||||
| Sell RMB/Buy JPY |
RMB | |||
| Sell RMB/Buy US$ |
RMB | |||
| Sell NT$/Buy US$ |
- | NT$ | ||
| Sell US$/Buy RMB |
- | US$ | ||
| Sell US$/Buy EUR |
US$ | |||
| Sell US$/Buy JPY |
- | US$ | ||
| Sell US$/Buy MYR |
- | US$ | ||
| Sell US$/Buy NT$ |
US$ | |||
| Sell US$/Buy SGD |
- | US$ | ||
As of each balance sheet date, outstanding target redemption forward contracts not accounted for hedge accounting were as follows:
Notional Amount | ||||
Currency |
Maturity Period |
(In Thousands) | ||
| December 31, 2020 |
||||
| Sell EUR/Buy US$ |
- |
EUR | ||
| December 31, 2021 |
||||
| Sell EUR/Buy US$ |
- |
EUR | ||
The target redeemable forward contracts held by subsidiaries are weekly settled. If the market exchange rate is lower than the execution rate at the time of settlement, the contract will be settled at the nominal amount, whereas if the market exchange rate is higher than the execution rate, the contract will be settled at a leveraged nominal amount (twice the nominal amount). The contracts last until all the nominal amount of US$ position is fully settled. However, when the accumulated excess of the execution rates over the market exchange rates reach the agreed threshold after the weekly settlement, the contracts will be automatically early terminated.
F-43
8. |
FINANCIAL ASSETS AT FAIR VALUE THROUGH OTHER COMPREHENSIVE INCOME (FVTOCI) |
December 31 |
||||||||||||
2020 |
2021 |
|||||||||||
NT$ |
NT$ |
US$ (Note 4) |
||||||||||
| Investments in equity instruments at FVTOCI |
$ | $ | $ | |||||||||
| Investments in debt instruments at FVTOCI |
||||||||||||
| |
|
|
|
|
|
|||||||
| $ | $ | $ | ||||||||||
| |
|
|
|
|
|
|||||||
| a. | Investments in equity instruments at FVTOCI |
December 31 |
||||||||||||
2020 |
2021 |
|||||||||||
NT$ |
NT$ |
US$ (Note 4) |
||||||||||
| Unquoted ordinary shares |
$ | $ | $ | |||||||||
| Quoted ordinary shares |
— | |||||||||||
| Unquoted preferred shares |
||||||||||||
| Limited partnership |
||||||||||||
| |
|
|
|
|
|
|||||||
| $ | $ | $ | ||||||||||
| |
|
|
|
|
|
|||||||
| b. | Investments in debt instruments at FVTOCI |
December 31 |
||||||||||||
2020 |
2021 |
|||||||||||
NT$ |
NT$ |
US$ (Note 4) |
||||||||||
| Unsecured subordinate corporate bonds |
$ | $ | $ | |||||||||
| |
|
|
|
|
|
|||||||
The Group purchased 1,000 units of 1,000 thousand with annual interest rate at 3.5 % and effective interest rate at 3.2 %.
the abovementioned
perpetual unsecured subordinate corporate bonds with par value of NT$9. |
CREDIT RISK MANAGEMENT FOR INVESTMENTS IN DEBT INSTRUMENTS |
The Group’s investment in unsecured subordinate corporate bonds is rated the equivalent of investment grade or higher and has low credit risk for impairment assessment.
There was no significant increase in credit risk of such debt instrument since initial recognition leading to changes in interest rates and terms, and there was also no significant change in bond issuer’s operation affecting the ability performing debt obligation. Therefore, no expected credit losses existed. The Group reviews changes in bond yields and other public information periodically and makes an assessment whether there has been a significant increase in lifetime Expected Credit Loss (“ECL”) since initial recognition.
F-44
10. |
TRADE RECEIVABLES, NET |
December 31 |
||||||||||||
2020 |
2021 |
|||||||||||
NT$ |
NT$ |
US$ (Note 4) |
||||||||||
| At amortized cost |
||||||||||||
| Gross carrying amount |
$ | $ | $ | |||||||||
| Less: Allowance for impairment loss |
||||||||||||
| |
|
|
|
|
|
|||||||
| At FVTOCI |
||||||||||||
| |
|
|
|
|
|
|||||||
| $ | $ | $ | ||||||||||
| |
|
|
|
|
|
|||||||
| a. | Trade receivables |
| 1) | At amortized cost |
The Group’s average credit terms granted to the customers were 30 to 90 days. The Group evaluates the risk and probability of credit loss of trade receivables by reference to the Group’s past experiences, financial condition of each customer, impact of
COVID-19,
as well as competitive advantage and future development of the industry in which the customer operates. The Group then reviews the recoverable amount of each individual trade receivable at each balance sheet date to ensure that adequate allowance is made for possible irrecoverable amounts. In this regard, management believes the Group’s credit risk was significantly reduced. The Group measures the loss allowance for trade receivables at an amount equal to lifetime ECLs. The expected credit losses on trade receivables are estimated using a provision matrix by reference to past default experience of the debtor and an analysis of the debtor’s current financial position, adjusted for general economic conditions of the industry in which the debtors operate and an assessment of both the current as well as the forecast direction of economic conditions at each balance sheet date. As the Group’s historical credit loss experience shows significantly different loss patterns for different customer segments, the provision matrix for expected credit loss allowance based on trade receivables due status is further distinguished according to the Group’s different customer base.
The Group writes off a trade receivable when there is information indicating that the debtor is in severe financial difficulty and there is no realistic prospect of recovery. For trade receivables that have been written off, the Group continues to engage in enforcement activity to attempt to recover the receivables due. Where recoveries are made, these are recognized in profit or loss.
The following table details the loss allowance of trade receivables based on the Group’s provision matrix.
| December 31, 2020 |
Not Past Due |
Overdue 1 to 30 days |
Overdue 31 to 90 Days |
Overdue Over 91 Days |
Individually Impaired |
Total |
|||||||||||||||||||
NT$ |
NT$ |
NT$ |
NT$ |
NT$ |
NT$ |
|||||||||||||||||||
| Expected credit loss rate |
||||||||||||||||||||||||
| Gross carrying amount |
$ |
$ |
$ |
$ |
$ |
$ |
||||||||||||||||||
| Loss allowance (Lifetime ECLs) |
( |
) |
( |
) |
( |
) |
( |
) |
( |
) |
( |
) | ||||||||||||
| |
|
|
|
|
|
|
|
|
|
|
|
|||||||||||||
| |
|
|
|
|
|
|
|
|
|
|
|
|
|
|
|
|
|
|
|
|
|
|
|
|
$ |
$ |
$ |
$ |
$ |
$ |
|||||||||||||||||||
| |
|
|
|
|
|
|
|
|
|
|
|
|||||||||||||
F-45
| December 31, 2021 |
||||||||||||||||||||||||
Not Past Due |
Overdue 1 to 30 days |
Overdue 31 to 90 Days |
Overdue Over 91 Days |
Individually Impaired |
Total |
|||||||||||||||||||
NT$ |
NT$ |
NT$ |
NT$ |
NT$ |
NT$ |
|||||||||||||||||||
| Expected credit loss rate |
||||||||||||||||||||||||
| |
|
|
|
|
|
|
|
|
|
|
|
|
|
|
|
|
|
|
|
|
|
|
|
|
| Gross carrying amount |
$ |
$ |
$ |
$ |
$ |
$ |
||||||||||||||||||
| Loss allowance (Lifetime ECLs) |
( |
) |
( |
) |
( |
) |
( |
) |
( |
) |
( |
) | ||||||||||||
| |
|
|
|
|
|
|
|
|
|
|
|
|||||||||||||
$ |
$ |
$ |
$ |
$ |
$ |
|||||||||||||||||||
| |
|
|
|
|
|
|
|
|
|
|
|
|||||||||||||
Not Past Due |
Overdue 1 to 30 days |
Overdue 31 to 90 Days |
Overdue Over 91 Days |
Individually Impaired |
Total |
|||||||||||||||||||
US$ (Note 4) |
US$ (Note 4) |
US$ (Note 4) |
US$ (Note 4) |
US$ (Note 4) |
US$ (Note 4) |
|||||||||||||||||||
| Expected credit loss rate |
||||||||||||||||||||||||
| Gross carrying amount |
$ |
$ |
$ |
$ |
$ |
$ |
||||||||||||||||||
| Loss allowance (Lifetime ECLs) |
( |
) |
( |
) |
( |
) |
( |
) |
( |
) |
( |
) | ||||||||||||
| |
|
|
|
|
|
|
|
|
|
|
|
|||||||||||||
$ |
$ |
$ |
$ |
$ |
$ |
|||||||||||||||||||
| |
|
|
|
|
|
|
|
|
|
|
|
|||||||||||||
The movements of the loss allowance of trade receivables were as f
o
llows: December 31 |
||||||||||||||||
2019 |
2020 |
2021 |
||||||||||||||
NT$ |
NT$ |
NT$ |
US$ (Note 4) |
|||||||||||||
| Balance at January 1 |
$ | $ | $ | $ | ||||||||||||
| Net remeasurement of loss allowance |
( |
) | ( |
) | ||||||||||||
| Reclassification |
( |
) | ( |
) | ||||||||||||
| Acquisition through business combinations |
||||||||||||||||
| Amounts written off |
( |
) | ( |
) | ( |
) | ||||||||||
| Disposal of subsidiaries |
— | — | ( |
) | ( |
) | ||||||||||
| Effects of foreign currency exchange differences |
( |
) | ( |
) | ( |
) | ( |
) | ||||||||
| |
|
|
|
|
|
|
|
|||||||||
| Balance at December 31 |
$ | $ | $ | $ | ||||||||||||
| |
|
|
|
|
|
|
|
|||||||||
| 2) | At FVTOCI |
For the trade receivables due from certain customers, the Group decides whether or not to factor these trade receivables to banks without recourse based on the Group’s demand of working capital. These trade receivables are classified as at FVTOCI because they are held within a business model whose objective is achieved by both the
collection
of contractual cash flows and the selling of financial assets. The following table details the loss allowance of trade receivables at FVTOCI based on the Group’s provision matrix.
| December 31, 2020 |
||||||||||||||||||||||||
Not Past Due |
Overdue 1 to 30 days |
Overdue 31 to 90 Days |
Overdue Over 91 Days |
Individually Impaired |
Total |
|||||||||||||||||||
NT$ |
NT$ |
NT$ |
NT$ |
NT$ |
NT$ |
|||||||||||||||||||
| Expected credit loss rate |
— | — | ||||||||||||||||||||||
| |
|
|
|
|
|
|
|
|
|
|
|
|
|
|
|
|
|
|
|
|
|
|
|
|
| Gross carrying amount |
$ | $ | $ | $ | — | $ | — | $ | ||||||||||||||||
| Loss allowance (Lifetime ECLs) |
— | — | — | — | — | — | ||||||||||||||||||
| |
|
|
|
|
|
|
|
|
|
|
|
|||||||||||||
| $ | $ | $ | $ | — | $ | — | $ | |||||||||||||||||
| |
|
|
|
|
|
|
|
|
|
|
|
|||||||||||||
F-46
| December 31, 2021 |
||||||||||||||||||||||||
Not Past Due |
Overdue 1 to 30 days |
Overdue 31 to 90 Days |
Overdue Over 91 Days |
Individually Impaired |
Total |
|||||||||||||||||||
NT$ |
NT$ |
NT$ |
NT$ |
NT$ |
NT$ |
|||||||||||||||||||
| Expected credit loss rate |
||||||||||||||||||||||||
| |
|
|
|
|
|
|
|
|
|
|
|
|
|
|
|
|
|
|
|
|
|
|
|
|
| Gross carrying amount |
$ |
$ |
$ |
$ |
$ |
$ |
||||||||||||||||||
| Loss allowance (Lifetime ECLs) |
||||||||||||||||||||||||
| |
|
|
|
|
|
|
|
|
|
|
|
|||||||||||||
$ |
$ |
$ |
$ |
$ |
$ |
|||||||||||||||||||
| |
|
|
|
|
|
|
|
|
|
|
|
|||||||||||||
Not Past Due |
Overdue 1 to 30 days |
Overdue 31 to 90 Days |
Overdue Over 91 Days |
Individually Impaired |
Total |
|||||||||||||||||||
US$ (Note 4) |
US$ (Note 4) |
US$ (Note 4) |
US$ (Note 4) |
US$ (Note 4) |
US$ (Note 4) |
|||||||||||||||||||
| Expected credit loss rate |
||||||||||||||||||||||||
| |
|
|
|
|
|
|
|
|
|
|
|
|
|
|
|
|
|
|
|
|
|
|
|
|
| Gross carrying amount |
$ | $ | $ | $ | $ | $ | ||||||||||||||||||
| Loss allowance (Lifetime ECLs) |
||||||||||||||||||||||||
| |
|
|
|
|
|
|
|
|
|
|
|
|||||||||||||
| $ | $ | $ | $ | $ | $ | |||||||||||||||||||
| |
|
|
|
|
|
|
|
|
|
|
|
|||||||||||||
| 3) | At FVTPL |
Some of the Group’s subsidiaries sell all of their trade receivables to banks without recourse. The sale will result in the derecognition of these trade receivables because the Group’s subsidiaries will transfer substantially all risks and rewards to banks. These trade receivables are measured at FVTPL because the objective of the subsidiary’ business model is neither held to collect contractual cash flows nor held both
to
collect contractual cash flows and to sell financial assets. As of December 31, 2020 and 2021, the trade receivables at FVTPL were all factored to banks without recourse. | b. | Transfers of financial assets |
The
f
ollowing
Group’s outstanding trade receivables transferred but not yet due were as follows: s
werethe
Counterparty |
Receivables Factoring Proceed |
Reclassified to Other Receivables |
Advances Received- Unused |
Advances Received- Used |
Annual Interest Rates on Advances Received (%) |
|||||||||||||||
| December 31, 2020 |
||||||||||||||||||||
| BNP Paribas |
EUR | EUR | EUR | |
EUR | |||||||||||||||
| HSBC |
EUR | EUR | EUR | EUR | ||||||||||||||||
| Citibank Taiwan Ltd. |
US$ | US$ | — | US$ | — | US$ | ||||||||||||||
| Standard Chartered Bank |
US$ | US$ | — | US$ | — | US$ | ||||||||||||||
| First Commercial Bank |
NT$ | NT$ | — | NT$ | — | NT$ | ||||||||||||||
| December 31, 2021 |
||||||||||||||||||||
| BNP Paribas |
EUR | EUR | EUR | EUR | ||||||||||||||||
| First Commercial Bank |
NT$ | NT$ | — | NT$ | — | NT$ | ||||||||||||||
Pursuant to the factoring agreements, losses from commercial disputes (such as sales returns and discounts) are borne by the Group, while losses from credit risk are borne by banks. As of December 31, 2020 and 2021, the Group’s issued promissory notes with aggregate amounts of
US$2,000
thousand to Citibank Taiwan Ltd. to compensate losses from commercial disputes. As of the date that the consolidated financial statements were authorized for issue by the management, the Group did not have a material commercial dispute and also expected to have no material commercial dispute in the foreseeable future.
F-47
11. |
INVENTORIES |
December 31 |
||||||||||||
2020 (Retrospectively Adjusted) |
2021 |
|||||||||||
NT$ |
NT$ |
US$ (Note 4) |
||||||||||
| |
|
|
||||||||||
| Finished goods |
$ | $ | $ | |||||||||
| Work in process |
||||||||||||
| Raw materials |
||||||||||||
| Supplies |
||||||||||||
| Raw materials and supplies in transit |
||||||||||||
| |
|
|
|
|
|
|||||||
| $ | $ | $ | ||||||||||
| |
|
|
|
|
|
|||||||
The cost of inventories recognized as operating costs for the years ended December 31, 2019, 2020 and 2021 were NT$347,877,603 thousand, NT$398,068,260 thousand and NT$458,345,579 thousand (US$16,522,912 thousand), respectively, which included write-downs of inventories at NT$452,134 thousand, NT$1,493,793 thousand and NT$647,946 thousand (US$23,358 thousand), respectively.
12. |
INVENTORIES RELATED TO REAL ESTATE BUSINESS |
December 31 |
||||||||||||
2020 |
2021 |
|||||||||||
NT$ |
NT$ |
US$ (Note 4) |
||||||||||
| |
|
|
||||||||||
| Land and buildings held for sale |
$ | $ | $ | |||||||||
| Construction in progress |
||||||||||||
| Land held for construction |
||||||||||||
| |
|
|
|
|
|
|||||||
| $ | $ | $ | ||||||||||
| |
|
|
|
|
|
|||||||
Construction in progress is mainly located on Hutai Road in Shanghai, China and Lidu Road in Kun Shan, China. The capitalized borrowing costs for the years ended December 31, 2019, 2020 and 2021 are disclosed in Note 25.
Construction in progress located on Hutai Road in Shanghai was completed in 2021 and immediately leased out for shopping centers 9,722,579 thousand (US$350,490 thousand).
business
. As a result, the Group reclassified those buildings and land use right under the line item of “inventories related to real estate—construction in progress” to investment properties wi
of NT$th amount
As of December 31, 2020 and 2021, inventories related to real estate business of NT$13,471,645 thousand and NT$5,412,114 thousand (US$195,102 thousand), respectively, are expected to be recovered longer than twelve months.
Refer to Note 36 for the carrying amount of inventories related to real estate business that had been pledged by the Group to secure bank borrowings.
(Continued)
F-48
13. |
OTHER FINANCIAL ASSETS |
December 31 |
||||||||||||||||||||
2020 |
2021 |
|||||||||||||||||||
NT$ |
NT$ |
US$ (Note 4) |
||||||||||||||||||
| Guarantee deposits |
$ | |
|
|
|
$ | |
|
|
|
$ | |||||||||
| Pledged time deposits (Note 36) |
|
|
|
|
|
|
|
|
||||||||||||
| Time deposits with original maturity over three months |
|
|
|
|
|
|
|
|
||||||||||||
| Others (Note 36) |
|
|
|
|
|
|
|
|
||||||||||||
| |
|
|
|
|
|
|
|
|
|
|
|
|
|
|||||||
| |
|
|
|
|
|
|
|
|||||||||||||
| Current |
|
|
|
|
|
|
|
|
||||||||||||
| |
|
|
|
|
|
|
|
|
|
|
|
|
|
|||||||
| |
|
|
|
|
|
|
|
|||||||||||||
| Non-current |
$ | |
|
|
|
$ | |
|
|
|
$ | |||||||||
| |
|
|
|
|
|
|
|
|
|
|
|
|
|
|||||||
14. |
INVESTMENTS ACCOUNTED FOR USING THE EQUITY METHOD |
December 31 |
||||||||||||||||||||
2020 |
2021 |
|||||||||||||||||||
NT$ |
NT$ |
US$ (Note 4) |
||||||||||||||||||
| Investments in associates |
$ | |
|
|
|
$ | |
|
|
|
$ | |||||||||
| Investments in joint ventures |
|
|
|
|
|
|
|
|
||||||||||||
| |
|
|
|
|
|
|
|
|
|
|
|
|
|
|||||||
| |
|
|
|
|||||||||||||||||
| $ | |
|
|
|
$ | |
|
|
|
$ | ||||||||||
| |
|
|
|
|
|
|
|
|
|
|
|
|
|
|||||||
| a. | Investments in associates |
| 1) | Investments in associates accounted for using the equity method that was not individually material consisted of the following: |
| Name of Associate |
Main Business |
Operating Location |
Carrying Amount as of December 31 |
|||||||||||||
2020 |
2021 |
|||||||||||||||
NT$ |
NT$ |
US$ (Note 4) |
||||||||||||||
| Yann Yuan Investment Co., Ltd. (“Yann Yuan”) |
|
$ | $ | $ | ||||||||||||
| ChipMOS Technologies Inc. (“ChipMOS”) |
|
|||||||||||||||
| M-Universe Investments Pte. Ltd. (“MU”) |
|
|||||||||||||||
| Hung Ching Development Construction Co. (“HC”) |
|
|||||||||||||||
| Hung Ching Kwan Co. (“HCK”) |
|
|||||||||||||||
| Chipletz, Inc. (“CHIPLETZ”) |
|
— | ||||||||||||||
| Deca Technologies Inc. (”DECA”) |
|
|||||||||||||||
| |
|
|
|
|
|
|||||||||||
| Less: Deferred gain on transfer of land |
||||||||||||||||
| |
|
|
|
|
|
|||||||||||
| $ | $ | $ | ||||||||||||||
| |
|
|
|
|
|
|||||||||||
F-49
2) |
At each balance sheet date, the total percentages of ownership held by the Group were as follows: |
December 31 | ||||||||||
2020 |
2021 | |||||||||
| Yann Yuan |
% |
% | ||||||||
| ChipMOS |
|
% | |
% | ||||||
| MU |
|
% | |
% | ||||||
| HC |
|
% | |
% | ||||||
| HCK |
|
% | |
% | ||||||
| CHIPLETZ |
|
— | |
% | ||||||
| DECA |
|
% | |
% | ||||||
3) |
In March 2021, the Group’s subsidiary, ISE Labs, Inc., invested US$ |
4) |
In June 2021, the Group’s subsidiary, SPIL, did not subscribe to Yann Yuan’s cash capital increase proportionately, which led to a decrease in the Group’s percentage of ownership in Yann Yuan to |
5) |
Fair values (Level 1) of investments in associates with available published price quotation are summarized as follows: |
December 31 |
||||||||||||
2020 |
2021 |
|||||||||||
NT$ |
NT$ |
US$ (Note 4) |
||||||||||
| ChipMOS |
$ | $ | $ | |||||||||
| |
|
|
|
|
|
|||||||
| HC |
$ | $ | $ | |||||||||
| |
|
|
|
|
|
|||||||
6 ) |
Aggregate information of associates that are not individually material |
For the Year Ended December 31 |
||||||||||||||||
2019 |
2020 |
2021 |
||||||||||||||
NT$ |
NT$ |
NT$ |
US$ (Note 4) |
|||||||||||||
| The Group’s share of: |
||||||||||||||||
| Net i ncome |
$ | $ | $ | $ | ||||||||||||
| Other comprehensive income |
||||||||||||||||
| |
|
|
|
|
|
|
|
|||||||||
| Total comprehensive income |
$ | $ | $ | $ | ||||||||||||
| |
|
|
|
|
|
|
|
|||||||||
F-50
| b. | Investments in joint ventures |
| 1) | Investment in joint ventures that was not individually material and accounted for using the equity method consisted of the following: |
| Name of Joint Venture |
Main Business |
Operating Location |
Carrying Amount as of December 31 |
|||||||||||||
2020 |
2021 |
|||||||||||||||
NT$ |
NT$ |
US$ (Note 4) |
||||||||||||||
| SUMA-USI Electronics Co., Ltd. (“SUMA-USI”) |
$ | $ | $ | |||||||||||||
| |
|
|
|
|
|
|||||||||||
| 2) | At each balance sheet date, the percentages of ownership held by the Group’s subsidiary were as follows: |
December 31 | ||||
2020 |
2021 | |||
| SUMA-USI |
||||
| 3) | In March 2019, UGKS entered into a joint venture agreement with Cancon Information Industry Co., Ltd. to establish SUMA-USI and obtained SUMA-USI. Based on the joint venture agreement, both investors jointly lead the relevant operation activities of SUMA-USI, which resulted in that the investment in SUMA-USI was accounted for using the equity method. |
| 4) | Aggregate information of joint ventures that were not individually material |
For the Year Ended December 31 |
||||||||||||||||
2019 |
2020 |
2021 |
||||||||||||||
NT$ |
NT$ |
NT$ |
US$ (Note 4) |
|||||||||||||
| The Group’s share of: |
||||||||||||||||
| Net income (loss) |
$ | ( |
) | $ | $ | $ | ||||||||||
| Other comprehensive income (loss) |
( |
) | — | — | ||||||||||||
| |
|
|
|
|
|
|
|
|||||||||
| Total comprehensive income (loss) |
$ | ( |
) | $ | $ | $ | ||||||||||
| |
|
|
|
|
|
|
|
|||||||||
15. |
PROPERTY, PLANT AND EQUIPMENT |
The carrying amounts of each class of property, plant and equipment were as follows:
December 31 |
||||||||||||
2020 (Retrospectively Adjusted) |
2021 |
|||||||||||
NT$ |
NT$ |
US$ (Note 4) |
||||||||||
| Land |
$ | $ | $ | |||||||||
| Buildings and improvements |
||||||||||||
| Machinery and equipment |
||||||||||||
| Other equipment |
||||||||||||
| Construction in progress and machinery under insta llatio n |
||||||||||||
| |
|
|
|
|
|
|||||||
| $ | $ | $ | ||||||||||
| |
|
|
|
|
|
|||||||
F-51
| For the year ended December 31, 2019 |
||||||||||||||||||||||||
Land |
Buildings and Improvements |
Machinery and Equipment |
Other Equipment |
Construction in Progress and Machinery under Installation |
Total |
|||||||||||||||||||
NT$ |
NT$ |
NT$ |
NT$ |
NT$ |
NT$ |
|||||||||||||||||||
| Cost |
||||||||||||||||||||||||
| Balance at January 1, 2019 |
$ | $ | $ | $ | $ | $ | ||||||||||||||||||
| Additions |
— | |||||||||||||||||||||||
| Disposals |
— | ( |
) | ( |
) | ( |
) | — | ( |
) | ||||||||||||||
| Reclassification |
— | ( |
) | |||||||||||||||||||||
| Acquisition through business combinations (Note 29) |
||||||||||||||||||||||||
| Effect of foreign currency exchange differences |
( |
) | ( |
) | ( |
) | ( |
) | ( |
) | ||||||||||||||
| |
|
|
|
|
|
|
|
|
|
|
|
|||||||||||||
| Balance at December 31, 2019 |
$ | $ | $ | $ | $ | $ | ||||||||||||||||||
| |
|
|
|
|
|
|
|
|
|
|
|
|||||||||||||
| Accumulated depreciation and impairment |
||||||||||||||||||||||||
| Balance at January 1, 2019 |
$ | — |
$ | $ | $ | $ | — |
$ | ||||||||||||||||
| Depreciation expenses |
— | — | ||||||||||||||||||||||
| Impairment losses recognized |
— | — | ||||||||||||||||||||||
| Disposals |
— | ( |
) | ( |
) | ( |
) | — | ( |
) | ||||||||||||||
| Reclassification |
— | ( |
) | — | ||||||||||||||||||||
| Acquisition through business combinations (Note 29) |
— | — | ||||||||||||||||||||||
| Effect of foreign currency exchange differences |
— | ( |
) | ( |
) | ( |
) | — | ( |
) | ||||||||||||||
| |
|
|
|
|
|
|
|
|
|
|
|
|||||||||||||
| Balance at December 31, 2019 |
$ | — | $ | $ | $ | $ | — | $ | ||||||||||||||||
| |
|
|
|
|
|
|
|
|
|
|
|
|||||||||||||
| For the year ended December 31, 2020 (retrospectively adjusted) |
||||||||||||||||||||||||
Land |
Buildings and Improvements |
Machinery and Equipment |
Other Equipment |
Construction in Progress and Machinery under Installation |
Total |
|||||||||||||||||||
NT$ |
NT$ |
NT$ |
NT$ |
NT$ |
NT$ |
|||||||||||||||||||
| Cost |
||||||||||||||||||||||||
| Balance at January 1, 2020 |
$ | $ | $ | $ | $ | $ | ||||||||||||||||||
| Additions |
— | |||||||||||||||||||||||
| Disposals |
— | ( |
) | ( |
) | ( |
) | ( |
) | ( |
) | |||||||||||||
| Disposal of subsidiaries (Note 30) |
— | ( |
) | ( |
) | ( |
) | ( |
) | ( |
) | |||||||||||||
| Reclassification |
— | ( |
) | |||||||||||||||||||||
| Acquisitions through business combinations (Note 29) |
||||||||||||||||||||||||
| Effect of foreign currency exchange differences |
( |
) | ( |
) | ( |
) | ( |
) | ( |
) | ( |
) | ||||||||||||
| |
|
|
|
|
|
|
|
|
|
|
|
|||||||||||||
| Balance at December 31, 2020 (retrospectively adjusted) |
$ | $ | $ | $ | $ | $ | ||||||||||||||||||
| |
|
|
|
|
|
|
|
|
|
|
|
|||||||||||||
| Accumulated depreciation and impairment |
||||||||||||||||||||||||
| Balance at January 1, 2020 |
$ | — |
$ | $ | $ | $ | — |
$ | ||||||||||||||||
| Depreciation expense |
— | — | ||||||||||||||||||||||
| Impairment losses recognized |
— | — | — | |||||||||||||||||||||
| Disposals |
— | ( |
) | ( |
) | ( |
) | — | ( |
) | ||||||||||||||
| Disposal of subsidiaries (Note 30) |
— | ( |
) | ( |
) | ( |
) | — | ( |
) | ||||||||||||||
| Reclassification |
— | ( |
) | — | ||||||||||||||||||||
| Acquisitions through business combinations (Note 29) |
— | — | ||||||||||||||||||||||
| Effect of foreign currency exchange differences |
— | ( |
) | ( |
) | ( |
) | — | ( |
) | ||||||||||||||
| |
|
|
|
|
|
|
|
|
|
|
|
|||||||||||||
| Balance at December 31, 2020 |
$ | — | $ | $ | $ | $ | — | $ | ||||||||||||||||
| |
|
|
|
|
|
|
|
|
|
|
|
|||||||||||||
F-52
| For the year ended December 31, 2021 |
||||||||||||||||||||||||
Land |
Buildings and Improvements |
Machinery and Equipment |
Other Equipment |
Construction in Progress and Machinery under I nstallation |
Total |
|||||||||||||||||||
NT$ |
NT$ |
NT$ |
NT$ |
NT$ |
NT$ |
|||||||||||||||||||
| Cost |
||||||||||||||||||||||||
| Balance at January 1, 2021 (retrospectively adjusted) |
$ |
$ |
$ |
$ |
$ |
$ |
||||||||||||||||||
| Additions |
||||||||||||||||||||||||
| Disposals |
( |
) |
( |
) |
( |
) |
( |
) |
( |
) |
( |
) | ||||||||||||
| Disposal of subsidiaries (Note 30) |
— |
( |
) |
( |
) |
( |
) |
( |
) |
( |
) | |||||||||||||
| Reclassification |
( |
) |
( |
) | ||||||||||||||||||||
| Acquisitions through business combinations (Note 29) |
— |
|||||||||||||||||||||||
| Effect of foreign currency exchange differences |
( |
) |
( |
) |
( |
) |
( |
) |
( |
) | ||||||||||||||
| |
|
|
|
|
|
|
|
|
|
|
|
|||||||||||||
| Balance at December 31, 2021 |
$ |
$ |
$ |
$ |
$ |
$ |
||||||||||||||||||
| |
|
|
|
|
|
|
|
|
|
|
|
|||||||||||||
| Accumulated depreciation and impairment |
||||||||||||||||||||||||
| Balance at January 1, 2021 |
$ |
— |
$ |
$ |
$ |
$ |
— |
$ |
||||||||||||||||
| Depreciation expense |
— |
— |
||||||||||||||||||||||
| Impairment losses recognized |
— |
— |
||||||||||||||||||||||
| Disposals |
— |
( |
) |
( |
) |
( |
) |
— |
( |
) | ||||||||||||||
| Disposal of subsidiaries (Note 30) |
— |
( |
) |
( |
) |
( |
) |
— |
( |
) | ||||||||||||||
| Reclassification |
— |
( |
) |
( |
) |
— |
( |
) | ||||||||||||||||
| Acquisitions through business combinations (Note 29) |
— |
— |
||||||||||||||||||||||
| Effect of foreign currency exchange differences |
— |
( |
) |
( |
) |
( |
) |
— |
( |
) | ||||||||||||||
| |
|
|
|
|
|
|
|
|
|
|
|
|||||||||||||
| Balance at December 31, 2021 |
$ |
— |
$ |
$ |
$ |
$ |
— |
$ |
||||||||||||||||
| |
|
|
|
|
|
|
|
|
|
|
|
|||||||||||||
Land |
Buildings and Improvements |
Machinery and Equipment |
Other Equipment |
Construction in Progress and Machinery under I nstallation |
Total |
|||||||||||||||||||
US$ (Note 4) |
US$ (Note 4) |
US$ (Note 4) |
US$ (Note 4) |
US$ (Note 4) |
US$ (Note 4) |
|||||||||||||||||||
| Cost |
||||||||||||||||||||||||
| Balance at January 1, 2021 ( re tr o spectively adjusted) |
$ |
$ |
$ |
$ |
$ |
|||||||||||||||||||
| Additions |
||||||||||||||||||||||||
| Disposals |
( |
) |
( |
) |
( |
) |
( |
) |
( |
) |
( |
) | ||||||||||||
| Disposal of subsidiaries (Note 30) |
— |
( |
) |
( |
) |
( |
) |
( |
) |
( |
) | |||||||||||||
| Reclassification |
( |
) |
( |
) | ||||||||||||||||||||
| Acquisitions through business combinations (Note 29) |
— |
|||||||||||||||||||||||
| Effect of foreign currency exchange differences |
( |
) |
( |
) |
( |
) |
( |
) |
( |
) | ||||||||||||||
| |
|
|
|
|
|
|
|
|
|
|
|
|||||||||||||
| Balance at December 31, 2021 |
$ |
$ |
$ |
$ |
$ |
$ |
||||||||||||||||||
| |
|
|
|
|
|
|
|
|
|
|
|
|||||||||||||
| Accumulated depreciation and impairment |
||||||||||||||||||||||||
| Balance at January 1, 2021 |
$ |
— |
$ |
$ |
$ |
$ |
— |
$ |
||||||||||||||||
| Depreciation expense |
— |
— |
||||||||||||||||||||||
| Impairment losses recognized |
— |
— |
||||||||||||||||||||||
| Disposals |
— |
( |
) |
( |
) |
( |
) |
— |
( |
) | ||||||||||||||
| Disposal of subsidiaries (Note 30) |
— |
( |
) |
( |
) |
( |
) |
— |
( |
) | ||||||||||||||
| Reclassification |
— |
( |
) |
( |
) |
— |
( |
) | ||||||||||||||||
| Acquisitions through business combinations (Note 29) |
— |
— |
||||||||||||||||||||||
| Effect of foreign currency exchange differences |
— |
( |
) |
( |
) |
( |
) |
— |
( |
) | ||||||||||||||
| |
|
|
|
|
|
|
|
|
|
|
|
|||||||||||||
| Balance at December 31, 2021 |
$ |
— |
$ |
$ |
$ |
$ |
— |
$ |
||||||||||||||||
| |
|
|
|
|
|
|
|
|
|
|
|
|||||||||||||
F-53
Based on the future operation plans and the capacity evaluation, the Group assessed that a portion of plant and equipment in the packaging segment and the testing segment were not qualified for the production needs and, therefore, recognized an impairment loss of NT$201,006 thousand, NT$992,273 thousand and NT$126,766 thousand (US$4,571 thousand) under the line item of other operating income and expenses (Note 25) for the years ended December 31, 2019, 2020 and 2021, respectively.
The recoverable amounts of a portion of the impaired plant and equipment were determined by their fair value less cost of disposal, of which the fair value was based on the recent quoted prices of assets with similar age and obsolescence provided by vendors in secondary market or the disposal price, and both of which represented Level 3 inputs because the secondary market was not active and the disposal price was negotiated with counterparties. The recoverable amounts of the remaining impaired plant and equipment were determined by their value in use and the Group expects only short-term or no economic benefits would be generated by these assets and the discount effect was immaterial.
Each class of property, plant and equipment was depreciated on a straight-line basis over the following useful lives:
| Buildings and improvements |
||||
| Main plant buildings |
||||
| Cleanrooms |
||||
| Others |
||||
| Machinery and equipment |
||||
| Other equipment |
The capitalized borrowing costs for the years ended December 31, 2019, 2020 and 2021 are disclosed in Note 25.
16. |
LEASE ARRANGEMENTS |
| a. | Right-of-use |
December 31 |
||||||||||||
2020 (Retrospectively Adjusted) |
2021 |
|||||||||||
NT$ |
NT$ |
US$ (Note 4) |
||||||||||
| Carrying amounts |
||||||||||||
| Land |
$ |
$ |
$ |
|||||||||
| Buildings and improvements |
||||||||||||
| Machinery and equipment |
||||||||||||
| Other equipment |
||||||||||||
| |
|
|
|
|
|
|||||||
$ |
$ |
$ |
||||||||||
| |
|
|
|
|
|
|||||||
For the Year Ended December 31 |
||||||||||||||||
2019 |
2020 |
2021 |
||||||||||||||
NT$ |
NT$ |
NT$ |
US$ (Note 4) |
|||||||||||||
| Additions to right-of-use |
$ |
$ |
$ |
$ |
||||||||||||
| |
|
|
|
|
|
|
|
|||||||||
| Depreciation charge for right-of-use |
$ |
$ |
$ |
$ |
||||||||||||
| Land |
||||||||||||||||
| Buildings and improvements |
||||||||||||||||
| Machinery and equipment |
||||||||||||||||
| Other equipment |
||||||||||||||||
| |
|
|
|
|
|
|
|
|||||||||
$ |
$ |
$ |
$ |
|||||||||||||
| |
|
|
|
|
|
|
|
|||||||||
F-54
The amounts disclosed above with respect to the assets did not include the assets that meet the definition of investment properties.
right-of-use
right-of-use
| b. | Lease liabilities |
December 31 |
||||||||||||
2020 |
2021 |
|||||||||||
NT$ |
NT$ |
US$ (Note 4) |
||||||||||
| Carrying amounts |
||||||||||||
| Current |
$ | $ | $ | |||||||||
| |
|
|
|
|
|
|||||||
| Non-current |
$ | $ | $ | |||||||||
| |
|
|
|
|
|
|||||||
The Group’s lease liabilities were mainly from land and buildings and improvements. The range of discount rates for lease liabilities was as follows:
December 31 | ||||
2020 |
2021 | |||
| Land (%) |
||||
| Buildings and improvements (%) |
||||
| c. | Material lease-in activities and terms |
The Group leases land and buildings for the use of plants and offices with remaining lease terms of 1 -53 years and 1 -29 years, respectively. For the leasehold land located in the R.O.C., the Group has extension options at the expiry of the lease periods. However, the government has the right to adjust the lease payments on the basis of changes in announced land value prices and also has the right to terminate the lease contract under certain circumstances. The Group does not have bargain purchase options to acquire the leasehold land and buildings at the expiry of the lease periods. In addition, the Group is prohibited from subleasing or transferring all or any portion of the underlying assets without the lessor’s consent.
| d. | Subleases |
In addition to the sublease transactions described in Note 17, the Group did not have other sublease transactions.
F-55
| e. | Other lease information |
December 31 |
||||||||||||
2020 |
2021 |
|||||||||||
NT$ |
NT$ |
US$ (Note 4) |
||||||||||
Expenses relating to short-term leases |
$ | $ | $ | |||||||||
Expenses relating to low-value assets leases |
$ | $ | $ | |||||||||
Expenses relating to variable lease payments not included in the measurement of lease liabilities |
$ | $ | $ | |||||||||
Total cash outflow for leases |
$ | $ | $ | |||||||||
The Group elected to apply the recognition exemption for qualifying short-term leases and assets and lease liabilities for these leases.
low-value
asset leases and, ther
, did not recognize ef
oreright-of-use
17. |
INVESTMENT PROPERTIES |
For the year ended December 31, 2019 |
||||||||||||||||
Land |
Buildings and Improvements |
Right-of-use Assets |
Total |
|||||||||||||
NT$ |
NT$ |
NT$ |
NT$ |
|||||||||||||
Cost |
||||||||||||||||
Balance at January 1, 2019 |
$ | $ | $ | $ | ||||||||||||
Additions |
— | — | ||||||||||||||
Disposals |
— | ( |
) | — | ( |
) | ||||||||||
Reclassification |
— | ( |
) | ( |
) | ( |
) | |||||||||
Effects of foreign currency exchange differences |
— | ( |
) | ( |
) | ( |
) | |||||||||
Balance at December 31, 2019 |
$ | $ | $ | $ | ||||||||||||
Accumulated depreciation |
||||||||||||||||
Balance at January 1, 2019 |
$ | — | $ | $ | $ | |||||||||||
Depreciation expenses |
— | |||||||||||||||
Disposals |
— | ( |
) | — | ( |
) | ||||||||||
Reclassification |
— | ( |
) | ( |
) | |||||||||||
Effects of foreign currency exchange differences |
— | ( |
) | |||||||||||||
Balance at December 31, 2019 |
$ | — | $ | $ | $ | |||||||||||
Carrying amount at December 31, 2019 |
$ | $ | $ | $ | ||||||||||||
F-56
For the year ended December 31, 2020 |
||||||||||||||||
Land |
Buildings and Improvements |
Right-of-use Assets |
Total |
|||||||||||||
NT$ |
NT$ |
NT$ |
NT$ |
|||||||||||||
Cost |
||||||||||||||||
Balance at January 1, 2020 |
$ | $ | $ | $ | ||||||||||||
Additions |
— | — | ||||||||||||||
Disposals |
— | ( |
) | — | ( |
) | ||||||||||
Reclassification |
— | ( |
) | |||||||||||||
Effects of foreign currency exchange differences |
— | |||||||||||||||
Balance at December 31, 2020 |
$ | $ | $ | $ | ||||||||||||
Accumulated depreciation |
||||||||||||||||
Balance at January 1, 2020 |
$ | — | $ | $ | $ | |||||||||||
Depreciation expenses |
— | |||||||||||||||
Disposals |
— | ( |
) | — | ( |
) | ||||||||||
Reclassification |
— | ( |
) | |||||||||||||
Effects of foreign currency exchange differences |
— | |||||||||||||||
Balance at December 31, 2020 |
$ | — | $ | $ | $ | |||||||||||
Carrying amount at December 31, 2020 |
$ | $ | $ | $ | ||||||||||||
For the year ended December 31, 2021 |
||||||||||||||||
Land |
Buildings and Improvements |
Right-of-use Assets |
Total |
|||||||||||||
NT$ |
NT$ |
NT$ |
NT$ |
|||||||||||||
Cost |
||||||||||||||||
Balance at January 1, 2021 |
$ | $ | $ | $ | ||||||||||||
Disposals |
— | ( |
) | — | ( |
) | ||||||||||
Disposal of subsidiaries (Note 30) |
— | ( |
) | ( |
) | ( |
) | |||||||||
Reclassification (Note 12) |
( |
) | ||||||||||||||
Effects of foreign currency exchange differences |
( |
) | ||||||||||||||
Balance at December 31, 2021 |
$ | $ | $ | $ | ||||||||||||
Accumulated depreciation |
||||||||||||||||
Balance at January 1, 2021 |
$ | — | $ | $ | $ | |||||||||||
Depreciation expenses |
— | |||||||||||||||
Disposals |
— | ( |
) | — | ( |
) | ||||||||||
Disposal of subsidiaries (Note 30) |
— | ( |
) | ( |
) | ( |
) | |||||||||
Reclassification |
— | |||||||||||||||
Effects of foreign currency exchange differences |
— | ( |
) | ( |
) | |||||||||||
Balance at December 31, 2021 |
$ | — | $ | $ | $ | |||||||||||
Carrying amount at December 31, 2021 |
$ | $ | $ | $ | ||||||||||||
F-57
Land |
Buildings and Improvements |
Right-of-use Assets |
Total |
|||||||||||||
US$ (Note 4) |
US$ (Note 4) |
US$ (Note 4) |
US$ (Note 4) |
|||||||||||||
Cost |
||||||||||||||||
Balance at January 1, 2021 |
$ | $ | $ | $ | ||||||||||||
Disposals |
— | ( |
) | — | ( |
) | ||||||||||
Disposal of subsidiaries (Note 30) |
— | ( |
) | ( |
) | ( |
) | |||||||||
Reclassification (Note 12) |
( |
) | ||||||||||||||
Effects of foreign currency exchange differences |
— | ( |
) | |||||||||||||
Balance at December 31, 2021 |
$ | $ | $ | $ | ||||||||||||
Accumulated depreciation |
||||||||||||||||
Balance at January 1, 2021 |
$ | — | $ | $ | $ | |||||||||||
Depreciation expenses |
— | |||||||||||||||
Disposals |
— | ( |
) | — | ( |
) | ||||||||||
Disposal of subsidiaries (Note 30) |
— | ( |
) | ( |
) | ( |
) | |||||||||
Reclassification |
— | |||||||||||||||
Effects of foreign currency exchange differences |
— | ( |
) | ( |
) | |||||||||||
Balance at December 31, 2021 |
$ | — | $ | $ | $ | |||||||||||
Carrying amount at December 31, 2021 |
$ | $ | $ | $ | ||||||||||||
Right-of-use
The abovementioned investment properties were leased out for 1 to 20 years, with an option to extend for an additional lease term. The lease contracts contain market review clauses in the event that the lessees exercise their options to extend. The lessees do not have bargain
purchase
options to acquire the investment properties at the expiry of the lease term. F-58
In addition to fixed lease payments, some of the lease contracts also indicated that the lessees should make variable payments determined at a specific percentage of the excess of respective lessee’s monthly revenues over a specific amount.
The maturity analysis of lease payments receivable under operating leases of investment properties was as follows:
December 31 |
||||||||||||
2020 |
2021 |
|||||||||||
NT$ |
NT$ |
US$ (Note 4) |
||||||||||
Year 1 |
$ | $ | $ | |||||||||
Year 2 |
||||||||||||
Year 3 |
||||||||||||
Year 4 |
||||||||||||
Year 5 |
||||||||||||
Year 6 onwards |
||||||||||||
| $ | $ | $ | ||||||||||
The investment properties were depreciated on a straight-line basis over the following useful lives:
Main buildings |
||||
Right-of-use |
Because the market conditions 54,139 thousand and NT$3,865 thousand (US$139 thousand), respectively.
we
severely affected by re
COVID-19
in 2020 and 2021, the Group agreed to provide unconditional rent concessions
for some lease contracts. The rent concessions were accounted for as adjustments to related income over the remaining lease term. For the years ended December 31, 2020 and 2021, total amount from the rent concessions were NT$The fair value of the investment properties was measured using the market approach and the income approach based on level 3 inputs by independent professional appraisers. The significant unobservable inputs were discount rates. The fair value of the investment properties was as follows:
December 31 |
||||||||||||
2020 |
2021 |
|||||||||||
NT$ |
NT$ |
US$ (Note 4) |
||||||||||
Fair value |
$ | $ | $ | |||||||||
Refer to Note 36 for the carrying amount of the investment properties that had been pledged by the Group to secure borrowings.
F-59
18. |
GOODWILL |
For the year ended December 31, 2019
Cost |
Accumulated impairment |
Carrying amount |
||||||||||
NT$ |
NT$ |
NT$ |
||||||||||
| Balance at January 1, 2019 |
$ | $ | $ | |||||||||
| Acquisition through business combinations (Note 29) |
— | |||||||||||
| Effect of foreign currency exchange differences |
( |
) | — | ( |
) | |||||||
| |
|
|
|
|
|
|||||||
| Balance at December 31, 2019 |
$ | $ | $ | |||||||||
| |
|
|
|
|
|
|||||||
For the year ended December 31, 2020 (retrospectively adjusted)
Cost |
Accumulated impairment |
Carrying amount |
||||||||||
NT$ |
NT$ |
NT$ |
||||||||||
| Balance at January 1, 2020 |
$ | $ | $ | |||||||||
| Acquisition through business combinations (Note 29) |
— | |||||||||||
| Effect of foreign currency exchange differences |
( |
) | — | ( |
) | |||||||
| |
|
|
|
|
|
|||||||
| Balance at December 31, 2020 |
$ | $ | $ | |||||||||
| |
|
|
|
|
|
|||||||
For the year ended December 31, 2021
Cost |
Accumulated impairment |
Carrying amount |
||||||||||
NT$ |
NT$ |
NT$ |
||||||||||
| Balance at January 1, 2021 (retrospectively adjusted) |
$ | $ | $ | |||||||||
| Disposal of subsidiaries (Note 30) |
( |
) | — | ( |
) | |||||||
| Effect of foreign currency exchange differences |
( |
) | — | ( |
) | |||||||
| |
|
|
|
|
|
|||||||
| Balance at December 31, 2021 |
$ | $ | $ | |||||||||
| |
|
|
|
|
|
|||||||
F-60
Cost |
Accumulated Impairment |
Carrying Amount |
||||||||||
US$ (Note 4) |
US$ (Note 4) |
US$ (Note 4) |
||||||||||
| Balance at January 1, 2021 (re tro spectively adjusted) |
$ | $ | $ | |||||||||
| Disposal of subsidiaries (Note 30) |
( |
) | — | ( |
) | |||||||
| Effect of foreign currency exchange differences |
( |
) | — | ( |
) | |||||||
| |
|
|
|
|
|
|||||||
| Balance at December 31, 2021 |
$ | $ | $ | |||||||||
| |
|
|
|
|
|
|||||||
| a. | Allocating goodwill to cash-generating units |
The Group did not monitor goodwill for internal management purpose but for financial reporting purpose and, therefore, the goodwill was allocated to the following cash-generating units for evaluation of impairment: packaging segment, testing segment, EMS segment and other segment. The carrying amounts of goodwill allocated to cash-generating units were as follows:
F-61
December 31 |
||||||||||||
2020 (Retrospectively Adjusted) |
2021 |
|||||||||||
| Cash-generating units |
NT$ |
NT$ |
US$ (Note 4) |
|||||||||
| Packaging segment |
$ | $ | $ | |||||||||
| Testing segment |
||||||||||||
| EMS segment (Note 29) |
||||||||||||
| Others |
||||||||||||
| |
|
|
|
|
|
|||||||
| $ | $ | $ | ||||||||||
| |
|
|
|
|
|
|||||||
| b. | Impairment assessment |
At the end of each year, the Group performs evaluation of goodwill for impairment by reviewing the recoverable amounts based on value in use which incorporates cash flow projections estimated by management covering a five-year period. The cash flows beyond that five-year period are extrapolated using a steady per annum growth rate. In assessing value in use, the estimated future cash flows are discounted to their present value using annual 9.59 %-14.99 %, 10.39 %-14.71 % and 10.27 %-15.76 % as of December 31, 2019, 2020 and 2021, respectively. For the years ended December 31, 2019, 2020 and 2021, no
pre-tax
discount rates which were Management believes that any reasonably possible change in the key assumptions on which the recoverable amount was based
on
would not cause the
carrying amount of each
cash-generating unit to exceed its recoverable amount. 19. |
OTHER INTANGIBLE ASSETS |
The carrying amounts of each class of other intangible assets were as follows:
December 31 |
||||||||||||
2020 (Retrospectively Adjusted) |
2021 |
|||||||||||
NT$ |
NT$ |
US$ (Note 4) |
||||||||||
| Customer relationships |
$ | $ | $ | |||||||||
| Computer software |
||||||||||||
| Patents and acquired specific technology |
||||||||||||
| Others |
||||||||||||
| |
|
|
|
|
|
|||||||
| $ | $ | $ | ||||||||||
| |
|
|
|
|
|
|||||||
F-62
| For the year ended December 31, 2019 |
||||||||||||||||||||
Customer Relationships |
Computer Software |
Patents and Acquired Specific Technology |
Others |
Total |
||||||||||||||||
NT$ |
NT$ |
NT$ |
NT$ |
NT$ |
||||||||||||||||
| Cost |
||||||||||||||||||||
| Balance at January 1, 2019 |
$ | $ | $ | $ | $ | |||||||||||||||
| Additions |
— | — | ( |
) | ||||||||||||||||
| Disposals or derec o gnization |
( |
) | ( |
) | — | ( |
) | ( |
) | |||||||||||
| Acquisition through business combinations (Note 29) |
— | — | ||||||||||||||||||
| Effect of foreign currency exchange differences |
— | ( |
) | ( |
) | ( |
) | ( |
) | |||||||||||
| |
|
|
|
|
|
|
|
|
|
|||||||||||
| Balance at December 31, 2019 |
$ | $ | $ | $ | $ | |||||||||||||||
| |
|
|
|
|
|
|
|
|
|
|||||||||||
| Accumulated amortization |
||||||||||||||||||||
| Balance at January 1, 2019 |
$ | $ | $ | $ | $ | |||||||||||||||
| Amortization expense |
||||||||||||||||||||
| Disposals or derecognization |
( |
) | ( |
) | — | ( |
) | ( |
) | |||||||||||
| Acquisition through business combinations (Note 29) |
— | — | ||||||||||||||||||
| Effect of foreign currency exchange differences |
— | ( |
) | ( |
) | ( |
) | ( |
) | |||||||||||
| |
|
|
|
|
|
|
|
|
|
|||||||||||
| Balance at December 31, 2019 |
$ | $ | $ | $ | $ | |||||||||||||||
| |
|
|
|
|
|
|
|
|
|
|||||||||||
F-63
| For the year ended December 31, 2020 (retrospectively adjusted) |
||||||||||||||||||||
Customer Relationships |
Computer Software |
Patents and Acquired Specific Technology |
Others |
Total |
||||||||||||||||
NT$ |
NT$ |
NT$ |
NT$ |
NT$ |
||||||||||||||||
| Cost |
||||||||||||||||||||
| Balance at January 1, 2020 |
$ | $ | $ | $ | $ | |||||||||||||||
| Additions |
— | |||||||||||||||||||
| Disposals or derecognization |
— | ( |
) | — | ( |
) | ( |
) | ||||||||||||
| Disposal of subsidiaries (Note 30) |
— | ( |
) | — | — | ( |
) | |||||||||||||
| Acquisition through business combinations (Note 29) |
— | |||||||||||||||||||
| Effect of foreign currency exchange differences |
( |
) | ( |
) | ( |
) | ||||||||||||||
| |
|
|
|
|
|
|
|
|
|
|||||||||||
| Balance at December 31, 2020 |
$ | $ | $ | $ | $ | |||||||||||||||
| |
|
|
|
|
|
|
|
|
|
|||||||||||
| Accumulated amortization |
||||||||||||||||||||
| Balance at January 1, 2020 |
$ | $ | $ | $ | $ | |||||||||||||||
| Amortization expense |
||||||||||||||||||||
| Disposals or derecognization |
— | ( |
) | — | ( |
) | ( |
) | ||||||||||||
| Disposal of subsidiaries (Note 30) |
— | ( |
) | — | — | ( |
) | |||||||||||||
| Acquisition through business combinations (Note 29) |
— | |||||||||||||||||||
| Effect of foreign currency exchange differences |
( |
) | ( |
) | ( |
) | ||||||||||||||
| |
|
|
|
|
|
|
|
|
|
|||||||||||
| Balance at December 31, 2020 |
$ | $ | $ | $ | $ | |||||||||||||||
| |
|
|
|
|
|
|
|
|
|
|||||||||||
F-64
| For the year ended December 31, 2021 |
||||||||||||||||||||
Customer Relationships |
Computer Software |
Patents and Acquired Specific Technology |
Others |
Total |
||||||||||||||||
NT$ |
NT$ |
NT$ |
NT$ |
NT$ |
||||||||||||||||
| Cost |
||||||||||||||||||||
| Balance at January 1, 2021 (retrospectively adjusted) |
$ | $ | $ | $ | $ | |||||||||||||||
| Additions |
— | |||||||||||||||||||
| Disposals or derecognization |
( |
) | ( |
) | — | ( |
) | ( |
) | |||||||||||
| Disposal of subsidiaries (Note 30) |
— | ( |
) | ( |
) | ( |
) | ( |
) | |||||||||||
| Acquisition through business combinations (Note 29) |
— | — | — | |||||||||||||||||
| Effect of foreign currency exchange differences |
( |
) | ( |
) | ( |
) | ( |
) | ( |
) | ||||||||||
| |
|
|
|
|
|
|
|
|
|
|||||||||||
| Balance at December 31, 2021 |
$ | $ | $ | $ | $ | |||||||||||||||
| |
|
|
|
|
|
|
|
|
|
|||||||||||
| Accumulated amortization |
||||||||||||||||||||
| Balance at January 1, 2021 |
$ | $ | $ | $ | $ | |||||||||||||||
| Amortization expense |
||||||||||||||||||||
| Disposals or derecognization |
( |
) | ( |
) | — | ( |
) | ( |
) | |||||||||||
| Disposal of subsidiaries (Note 30) |
— | ( |
) | ( |
) | ( |
) | ( |
) | |||||||||||
| Acquisition through business combinations (Note 29) |
— | — | — | |||||||||||||||||
| Effect of foreign currency exchange differences |
( |
) | ( |
) | ( |
) | ( |
) | ( |
) | ||||||||||
| |
|
|
|
|
|
|
|
|
|
|||||||||||
| Balance at December 31, 2021 |
$ | $ | $ | $ | $ | |||||||||||||||
| |
|
|
|
|
|
|
|
|
|
|||||||||||
F-65
Customer Relationships |
Computer Software |
Patents and Acquired Specific Technology |
Others |
Total |
||||||||||||||||
US$ (Note 4) |
US$ (Note 4) |
US$ (Note 4) |
US$ (Note 4) |
US$ (Note 4) |
||||||||||||||||
| Cost |
||||||||||||||||||||
| Balance at January 1, 2021 (retrospectively adjusted) |
$ |
$ |
$ |
$ |
$ |
|||||||||||||||
| Additions |
— | |||||||||||||||||||
| Disposals or derecognization |
( |
) | ( |
) | — | ( |
) | ( |
) | |||||||||||
| Disposal of subsidiaries (Note 30) |
— | ( |
) | ( |
) | ( |
) | ( |
) | |||||||||||
| Acquisition through business combinations (Note 29) |
— | — | — | |||||||||||||||||
| Effect of foreign currency exchange differences |
( |
) | ( |
) | ( |
) | ( |
) | ( |
) | ||||||||||
| |
|
|
|
|
|
|
|
|
|
|||||||||||
| Balance at December 31, 2021 |
$ | $ | $ | $ | $ | |||||||||||||||
| |
|
|
|
|
|
|
|
|
|
|||||||||||
| Accumulated amortization |
||||||||||||||||||||
| Balance at January 1, 2021 |
$ | $ | $ | $ | $ | |||||||||||||||
| Amortization expense |
||||||||||||||||||||
| Disposals or derecognization |
( |
) | ( |
) | — | ( |
) | ( |
) | |||||||||||
| Disposal of subsidiaries (Note 30) |
— | ( |
) | ( |
) | ( |
) | ( |
) | |||||||||||
| Acquisition through business combinations (Note 29) |
— | — | — | |||||||||||||||||
| Effect of foreign currency exchange differences |
( |
) | ( |
) | ( |
) | ( |
) | ( |
) | ||||||||||
| |
|
|
|
|
|
|
|
|
|
|||||||||||
| Balance at December 31, 2021 |
$ | $ | $ | $ | $ | |||||||||||||||
| |
|
|
|
|
|
|
|
|
|
|||||||||||
Each class of other intangible assets was amortized on the straight-line basis over the following useful lives:
December 31, 2020 |
December 31, 2021 |
|||||||
| Customer relationships |
||||||||
| Computer software |
||||||||
| Patents and acquired specific technology |
||||||||
| Others |
||||||||
20. |
BORROWINGS |
| a. | Short-term borrowings |
Bank loans mainly represented unsecured revolving loans
,
letters of credit a
nd bank overdrafts.
December 31 |
||||||||||||
2020 |
2021 |
|||||||||||
NT$ |
NT$ |
US$ (Note 4) |
||||||||||
| Secured bank loans, annual interest rates both were |
$ | $ | $ | |||||||||
| Unsecured bank loans, annual interest rates were |
||||||||||||
| |
|
|
|
|
|
|||||||
| Less: financial liabilities for hedging - current (Note 34) |
||||||||||||
| |
|
|
|
|
|
|||||||
| $ | $ | $ | ||||||||||
| |
|
|
|
|
|
|||||||
F-67
| b. | Long-term borrowings |
| 1) | Bank loans |
December 31 |
||||||||||||
2020 |
2021 |
|||||||||||
NT$ |
NT$ |
US$ (Note 4) |
||||||||||
| Revolving bank loans |
||||||||||||
| Syndicated bank loans - repayable through January 2022, annual interest rates were |
$ | $ | $ | |||||||||
| Others - repayable through January 2022 to July 2029, annual interest rates were |
||||||||||||
| Mortgage loans |
||||||||||||
| Repayable through March 2022 to December 2033, annual interest rates were |
||||||||||||
| |
|
|
|
|
|
|||||||
| Less: unamortized discounts |
||||||||||||
| |
|
|
|
|
|
|||||||
| Less: current portion |
||||||||||||
| financial liabilities for hedging - current (Note 34) |
||||||||||||
| financial liabilities for hedging - non-current (Note 34) |
||||||||||||
| |
|
|
|
|
|
|||||||
| $ | $ | $ | ||||||||||
| |
|
|
|
|
|
|||||||
Pursuant to some of the above revolving bank loans agreements, the Company’s subsidiaries should meet certain financial covenants which are calculated based on each of their annual audited consolidated financial statements or semi-annual reviewed consolidated financial statements. The Company’s subsidiaries were in compliance with all of the financial covenants.
| 2) | Long-term bills payable |
December 31 |
||||||||||||
2020 |
2021 |
|||||||||||
NT$ |
NT$ |
US$ (Note 4) |
||||||||||
| China Bills Finance Corporation, repayable through |
$ | $ | $ | |||||||||
(Continued)
F-68
December 31 |
||||||||||||
2020 |
2021 |
|||||||||||
NT$ |
NT$ |
US$ (Note 4) |
||||||||||
| Ta Ching Bills Finance Corporation, repayable through |
$ | $ | $ | |||||||||
| Mega Bills Finance Corporation, repayable in |
||||||||||||
| International Bills Finance Corporation, early repaid in |
— | |||||||||||
| |
|
|
|
|
|
|||||||
| Less: unamortized discounts |
||||||||||||
| |
|
|
|
|
|
|||||||
| $ | $ | $ | ||||||||||
| |
|
|
|
|
|
|||||||
(Concluded)
F-69
21. |
BONDS PAYABLE |
December 31 |
||||||||||||
2020 |
2021 |
|||||||||||
NT$ |
NT$ |
US$ (Note 4) |
||||||||||
| Unsecured domestic bonds |
||||||||||||
| Interest due annually with annual interest rate at |
$ | $ | $ | |||||||||
| Repayable at maturity in January 2023 and interest due annually with annual interest rate at |
||||||||||||
| Repayable at maturity in January 2022 and interest due annually with annual interest rate at |
||||||||||||
| Repayable at maturity in January 2024 and interest due annually with annual interest rate at |
||||||||||||
| Repayable at maturity in April 2024 and interest due annually with annual interest rate at |
||||||||||||
| Repayable at maturity in April 2026 and interest due annually with annual interest rate at |
||||||||||||
| Repayable at maturity in April 2025 and interest due annually with annual interest rate at |
||||||||||||
| Repayable at maturity in August 2023 and interest due annually with annual interest rate at |
||||||||||||
| Repayable at maturity in August 2025 and interest due annually with annual interest rate at |
||||||||||||
| Repayable at maturity in August 2027 and interest due annually with annual interest rate at |
||||||||||||
| Unsecured overseas bonds |
||||||||||||
| US$ |
||||||||||||
| US$ |
||||||||||||
| Unsecured overseas convertible bonds |
||||||||||||
| RMB |
— | |||||||||||
| |
|
|
|
|
|
|||||||
| Less: discounts on bonds payable |
||||||||||||
| |
|
|
|
|
|
|||||||
| Less: current portion of bonds payable |
||||||||||||
| |
|
|
|
|
|
|||||||
| $ | $ | $ | ||||||||||
| |
|
|
|
|
|
|||||||
F-70
| a. | In December 2017, AMPI offered the fifth secured domestic convertible bonds in NT$ |
| b. | In March 2021, the subsidiary, USISH, offered an unsecured overseas convertible bonds (the “USISH Bonds”) in RMB of the last installation ). |
When the USISH Bonds were offered, the subsidiaries, USIE and ASE (Shanghai) Inc., totally subscribed for RMB2,670,199 thousand. Such USISH Bonds were deemed as a hybrid financial instrument under IFRS 9 and, therefore, USIE and ASE (Shanghai) Inc. classified them as financial assets mandatorily at FVTPL. Since the aforementioned contractual obligations assumed by USISH and the contractual rights entitled to USIE and ASE (Shanghai) Inc. were extinguished in economic substance, the assets and liabilities related to the USISH Bonds subscribed for by USIE and ASE (Shanghai) Inc. were
all
eliminated upon the consolidation. Each holder of the USISH Bonds has the right to convert the USISH Bonds into ordinary shares of USISH at the conversion price at any time from the first trading day after 9 months of the offering date to the maturity date (the “Conversion Period”). The initial conversion price was RMB20.25 per share at offering date and the conversion price will be subject to the adjustment in the event of the conversion provisions due to anti-dilution clause. As of December 31, 2021, the conversion price was RMB19.75 . As of December 31, 2021, USISH Bonds with the cumulative par value of RMB26 thousand was converted into one thousand ordinary shares of USISH. Before the maturity of the Bonds, if the closing price of USISH’s ordinary shares in Shanghai Stock Exchange is lower than 80 % of the current conversion price for at least 15 trading days out of any 30 consecutive trading days, the board of directors of USISH will have the right to propose a downward revision on conversion price and submit it to USISH’s shareholders’ meeting for approval.
During the Conversion Period, USISH’s board of directors has the right to redeem all or part of the unconverted bonds at the price of par value plus accrued interests in either of the following circumstances: (1) if the closing price of USISH’s ordinary shares in Shanghai Stock Exchange is not less 130 % (including 130 %) of the current conversion price for at least 20 trading days out of any 30 consecutive trading days, or (2) the unconverted USISH Bonds falls below RMB30,000 thousand.
In the last two interest accrual years before the maturity, the holders of USISH Bonds have the right to sell back all or part of USISH Bonds to USISH at the price of par value plus accrued interest in either of the following circumstances: (1) if the closing price of USISH’s ordinary shares in Shanghai Stock Exchange is lower than 70 % of the current conversion price in any 30 consecutive trading days, or (2) if USISH is deemed to change the use of the funds pursuant to the relevant regulations of the China Securities Regulatory Commission or USISH is identified by the China Securities Regulatory Commission as changing the use of funds before the maturity. In addition, after 3 years from the offering date, holders of USISH Bonds have the right to sell back all or part of USISH Bonds to USISH at 102 % of the par value (including the interests accrued for the 3rd year).
At the offering date, USISH Bonds consisted of debt host contract (recognized under the line item of bonds payable), conversion right (recognized under the line item of 4.2989 %, the amount of the 404,026 thousand (US$14,565 thousand), and the aggregate fair value of the redemption option and put option was NT$6,756 thousand (US$244 thousand) on initial recognition.
non-controlling
interests since it is an equity component of the bonds offered by the subsidiary), redemption option and put option (recognized under the line item of financial liabilities at FVTPL). In the consolidated financial statements, the effective interest rate of the debt host contract was con
right was NT$versi
on
22. |
OTHER PAYABLES |
December 31 |
||||||||||||
2020 |
2021 |
|||||||||||
NT$ |
NT$ |
US$ (Note 4) |
||||||||||
| Payables for property, plant and equipment |
$ | $ | $ | |||||||||
| Accrued salary and bonus |
||||||||||||
| Accrued employees’ compensation and remuneration to directors |
||||||||||||
| Accrued employee insurance |
||||||||||||
| Accrued utilities |
||||||||||||
| Others |
||||||||||||
| |
|
|
|
|
|
|||||||
| $ | $ | $ | ||||||||||
| |
|
|
|
|
|
|||||||
F-71
23. |
RETIREMENT BENEFIT PLANS |
| a. | Defined contribution plans |
| 1) | The pension plan under the R.O.C. Labor Pension Act (“LPA”) for the Group’s R.O.C. resident employees is a government-managed defined contribution plan. Based on the LPA, the Company and its subsidiaries in R. makes monthly contributions to employees’ individual pension accounts at O.C . |
| 2) | The subsidiaries of the Group located in countries other than Taiwan also make contributions at various ranges according to relevant local regulations. |
| b. | Defined benefit plans |
| 1) | The Company and its subsidiaries in R.O.C joined the defined benefit pension plan under the R.O.C. Labor Standards Law operated by the government. Pension benefits are calculated on the basis of the length of service and average monthly salaries of the last six months before retirement. The Company and its subsidiaries in . R make contributions based on a certain percentage of their domestic employees’ monthly salaries to a pension fund administered by the pension fund monitoring committee. Before the end of each year, the Company and its subsidiaries in .O.C . R.O.C assess the balance in the pension fund. If the amount of the balance in the pension fund is inadequate to pay retirement benefits for employees who conform to retirement requirements in the next year, the Company and its subsidiaries in . R.O.C are required to fund the difference in one appropriation that should be made by the end of March in the next year. Pension contributions are deposited in the Bank of . Taiwan in the committee’s name and are managed by the Bureau of Labor Funds, Ministry of Labor (“the Bureau”); the Company and its subsidiaries in Taiwan have no right to influence the investment policy and strategy. |
2) |
Pension plans for certain subsidiaries of the Group stipulate that employees with service years exceeding agreed years are entitled to receive a lump-sum payment based on their length of service and the agreed salaries at the time of termination of employment. |
F-72
3) |
ASE, SPIL, ASE Test, Inc. and ASEE have pension plans for executive managers. Pension costs under the plans were NT$ies ) for the years ended December 31, 2019, 2020 and 2021, respectively. Pension payments were NT$ |
4) |
|
December 31 |
||||||||||||
2020 |
2021 |
|||||||||||
NT$ |
NT$ |
US$ (Note 4) |
||||||||||
| Present value of the defined benefit obligation |
$ |
$ |
$ |
|||||||||
| Fair value of the plan assets |
( |
) |
( |
) |
( |
) | ||||||
| |
|
|
|
|
|
|||||||
| Present value of unfunded defined benefit obligation |
||||||||||||
| Recorded under other payables |
( |
) |
( |
) |
( |
) | ||||||
| Recorded under other non-current assets |
— |
— |
||||||||||
| |
|
|
|
|
|
|||||||
| Net defined benefit liabilit ies |
$ |
$ |
$ |
|||||||||
| |
|
|
|
|
|
|||||||
F-73
Movements in net defined benefit liabilit
ies
were as follows: Present Value of the Defined Benefit Obligation |
Fair Value of the Plan Assets |
Net Defined Benefit Liabilit ies (Asset s ) |
||||||||||
NT$ |
NT$ |
NT$ |
||||||||||
| Balance at January 1, 2019 |
$ |
$ |
( |
) | $ |
|||||||
| |
|
|
|
|
|
|||||||
| Service cost |
||||||||||||
| Current service cost |
||||||||||||
| Net interest expense (income) |
( |
) | ||||||||||
| |
|
|
|
|
|
|||||||
| Recognized in profit or loss |
( |
) | ||||||||||
| |
|
|
|
|
|
|||||||
| Remeasurement |
||||||||||||
| Return on plan assets (excluding amounts included in net interest) |
( |
) | ( |
) | ||||||||
| Actuarial (gain) loss |
||||||||||||
| Changes in financial assumptions |
||||||||||||
| Experience adjustments |
||||||||||||
| Changes in demographic assumptions |
( |
) | ( |
) | ||||||||
| |
|
|
|
|
|
|||||||
| Recognized in other comprehensive income |
( |
) | ||||||||||
| |
|
|
|
|
|
|||||||
| Contributions from the employer |
( |
) | ( |
) | ||||||||
| Benefits paid from |
||||||||||||
| the pension fund |
( |
) | ||||||||||
| the Group |
( |
) | ( |
) | ||||||||
| Business combinations |
( |
) | ||||||||||
| Exchange differences on foreign plans |
( |
) | ( |
) | ||||||||
| |
|
|
|
|
|
|||||||
| Balance at December 31, 2019 |
( |
) | ||||||||||
| Service cost |
||||||||||||
| Current service cost |
||||||||||||
| Past service cost and gain on settlements |
( |
) | ( |
) | ||||||||
| Net interest expense (income) |
( |
) | ||||||||||
| |
|
|
|
|
|
|||||||
| Recognized in profit or loss |
( |
) | ||||||||||
| |
|
|
|
|
|
|||||||
| Remeasurement |
||||||||||||
| Return on plan assets (excluding amounts included in net interest) |
( |
) | ( |
) | ||||||||
| Actuarial (gain) loss |
||||||||||||
| Changes in financial assumptions |
||||||||||||
| Experience adjustments |
||||||||||||
| Changes in demographic assumptions |
( |
) | ( |
) | ||||||||
| |
|
|
|
|
|
|||||||
| Recognized in other comprehensive income |
( |
) | ||||||||||
| |
|
|
|
|
|
|||||||
(Continued)
F-74
Present Value of the Defined Benefit Obligation |
Fair Value of the Plan Assets |
Net Defined Benefit Liabilit ies (Asset s ) |
||||||||||
NT$ |
NT$ |
NT$ |
||||||||||
| Contributions from the employer |
$ |
$ |
( |
) | $ |
( |
) | |||||
| Benefits paid from |
||||||||||||
| the pension fund |
( |
) | ||||||||||
| the Group |
( |
) | ( |
) | ||||||||
| Assets extinguished on settlement |
||||||||||||
| Business combinations |
||||||||||||
| Exchange differences on foreign plans |
( |
) | ||||||||||
| |
|
|
|
|
|
|||||||
| Balance at December 31, 2020 |
( |
) | ||||||||||
| Service cost |
||||||||||||
| Current service cost |
||||||||||||
| Past service cost and gain on settlements |
( |
) | ( |
) | ||||||||
| Net interest expense (income) |
( |
) | ||||||||||
| |
|
|
|
|
|
|||||||
| Recognized in profit or loss |
( |
) | ||||||||||
| |
|
|
|
|
|
|||||||
| Remeasurement |
||||||||||||
| Return on plan assets (excluding amounts included in net interest) |
( |
) | ( |
) | ||||||||
| Actuarial (gain) loss |
||||||||||||
| Changes in financial assumptions |
( |
) | ( |
) | ||||||||
| Experience adjustments |
||||||||||||
| Changes in demographic assumptions |
||||||||||||
| |
|
|
|
|
|
|||||||
| Recognized in other comprehensive income |
( |
) | ( |
) | ( |
) | ||||||
| |
|
|
|
|
|
|||||||
| Contributions from the employer |
( |
) | ( |
) | ||||||||
| Benefits paid from |
||||||||||||
| the pension fund |
( |
) | ||||||||||
| the Group |
( |
) | ( |
) | ||||||||
| Business combinations |
||||||||||||
| Exchange differences on foreign plans |
( |
) | ( |
) | ||||||||
| |
|
|
|
|
|
|||||||
| Balance at December 31, 2021 |
$ | $ | ( |
) | $ | |||||||
| |
|
|
|
|
|
|||||||
(Concluded)
F-75
Present Value of the Defined Benefit Obligation |
Fair Value of the Plan Assets |
Net Defined Benefit Liabilit ies (Asset s ) |
||||||||||
US$ (Note 4) |
US$ (Note 4) |
US$ (Note 4) |
||||||||||
| Balance at January 1, 2021 |
$ | $ | ( |
) | $ | |||||||
| |
|
|
|
|
|
|||||||
| Service cost |
||||||||||||
| Current service cost |
||||||||||||
| Past service cost and gain on settlements |
( |
) | — | ( |
) | |||||||
| Net interest expense (income) |
( |
) | ||||||||||
| |
|
|
|
|
|
|||||||
| Recognized in profit or loss |
( |
) | ||||||||||
| |
|
|
|
|
|
|||||||
| Remeasurement |
||||||||||||
| Return on plan assets (excluding amounts included in net interest) |
( |
) | ( |
) | ||||||||
| Actuarial (gain) loss |
||||||||||||
| Changes in financial assumptions |
( |
) | ( |
) | ||||||||
| Experience adjustments |
||||||||||||
| Changes in demographic assumptions |
||||||||||||
| |
|
|
|
|
|
|||||||
| Recognized in other comprehensive income |
( |
) | ( |
) | ( |
) | ||||||
| |
|
|
|
|
|
|||||||
| Contributions from the employer |
( |
) | ( |
) | ||||||||
| Benefits paid from |
||||||||||||
| the pension fund |
( |
) | ||||||||||
| the Group |
( |
) | ( |
) | ||||||||
| Business combinations |
||||||||||||
| Exchange differences on foreign plans |
( |
) | ( |
) | ||||||||
| |
|
|
|
|
|
|||||||
| Balance at December 31, 2021 |
$ | $ | ( |
) | $ | |||||||
| |
|
|
|
|
|
|||||||
| 5) | |
December 31 |
||||||||||||
2020 |
2021 |
|||||||||||
NT$ |
NT$ |
US$ (Note 4) |
||||||||||
| Cash |
$ | $ | $ | |||||||||
| Equity instruments |
||||||||||||
| Debt instruments |
||||||||||||
| Others |
||||||||||||
| |
|
|
|
|
|
|||||||
| Total |
$ | $ | $ | |||||||||
| |
|
|
|
|
|
|||||||
| 6) | Through the defined benefit plans under the Labor Standards Law of the R.O.C., the Group in R. are exposed to the following risks: O.C . |
| a) | Investment risk |
The plan assets are invested in equity and debt securities, bank deposits, etc. The investment is conducted at the discretion of the Bureau or under the mandated management. However, in accordance with relevant regulations, the return generated by plan assets should not be below the interest rate for a
2-year
time deposit with local banks. F-77
| b) | Interest risk |
A decrease in the government bond interest rate will increase the present value of the defined benefit obligation; however, this will be partially offset by an increase in the return on the plan’s debt investments.
| c) | Salary risk |
The present value of the defined benefit obligation is calculated by reference to the future salaries of plan participants. As such, an increase in the salary of the plan participants will increase the present value of the defined benefit obligation.
| 7) | The management of ASE Korea is responsible for the administration of the fund and determination of the investment strategies according to related local regulations. ASE Korea is responsible for the shortfall between the fund and the defined benefit obligation. The plan assets are investment in the certificates of deposits. |
| 8) | The present value of the defined benefit obligation and the related current service cost and past service cost were measured using the Projected Unit Credit Method. |
December 31 |
||||||||
2020 |
2021 |
|||||||
| Discount rates (%) |
||||||||
| Expected rates of salary increase (%) |
||||||||
The sensitivity analysis below has been determined based on reasonably possible changes of the respective assumptions occurring at each balance sheet date, while holding all other assumptions constant.
December 31 |
||||||||||||
2020 |
2021 |
|||||||||||
NT$ |
NT$ |
US$ (Note 4) |
||||||||||
| Discount rate |
||||||||||||
| 0.5% higher |
$ | ( |
) | $ | ( |
) | $ | ( |
) | |||
| |
|
|
|
|
|
|||||||
| 0.5% lower |
$ | $ | $ | |||||||||
| |
|
|
|
|
|
|||||||
| Expected rates of salary increase |
||||||||||||
| 0.5% higher |
$ | $ | $ | |||||||||
| |
|
|
|
|
|
|||||||
| 0.5% lower |
$ | ( |
) | $ | ( |
) | $ | ( |
) | |||
| |
|
|
|
|
|
|||||||
The sensitivity analysis presented above may not be representative of the actual change in the defined benefit obligation as it is unlikely that the change in assumptions would occur in isolation of one another as some of the assumptions may be correlated.
| 9) | |
December 31 |
||||||||||||
2020 |
2021 |
|||||||||||
NT$ |
NT$ |
US$ (Note 4) |
||||||||||
| No later than 1 year |
$ | $ | $ | |||||||||
| Later than 1 year but not later than 5 years |
||||||||||||
| Later than 5 years |
||||||||||||
| |
|
|
|
|
|
|||||||
| $ | $ | $ | ||||||||||
| |
|
|
|
|
|
|||||||
F-78
The Group expected to make contributions of NT$513,781 thousand and NT$595,871 thousand (US$21,481 thousand) to the defined benefit plans in the next year starting from January 1, 2021 and 2022, respectively.
As of December 31, 2020 and 2021, the average duration of the defined benefit obligation excluding those for executive managers of the Group both were 9 16
.
24. |
EQUITY |
| a. | Share capital |
| Ordinary shares |
||||||||
December 31 |
||||||||
2020 |
2021 |
|||||||
| Numbers of shares authorized (in thousands) |
||||||||
| |
|
|
|
|||||
| Numbers of shares reserved (in thousands) |
||||||||
| Employee share options |
||||||||
| |
|
|
|
|||||
| Number of shares issued and fully paid (in thousands) |
||||||||
| |
|
|
|
|||||
December 31 |
||||||||||||
2020 |
2021 |
|||||||||||
NT$ |
NT$ |
US$ (Note 4) |
||||||||||
| Share capital authorized |
$ | $ | $ | |||||||||
| |
|
|
|
|
|
|||||||
| Share capital reserved |
||||||||||||
| Employee share options |
$ | $ | $ | |||||||||
| |
|
|
|
|
|
|||||||
| American Depositary Receipts |
||||||||||||
The Company’s ADS represents 2 ordinary shares of the Company. As of December 31, 2020 and 2021, 107,964 thousand and 157,164 thousand ADSs were outstanding and represented 215,927 thousand and 314,328 thousand ordinary shares of the Company, respectively.
F-79
| b. | Capital surplus |
December 31 |
||||||||||||
2020 |
2021 |
|||||||||||
NT$ |
NT$ |
US$ (Note 4) |
||||||||||
| May be used to offset a deficit, distributed as cash dividends, or transferred to share capital (1) |
||||||||||||
| Issuance of ordinary shares |
$ | $ | $ | |||||||||
| Merger by share exchange |
||||||||||||
| Difference between consideration and the carrying amount of the subsidiaries’ net assets during actual disposal or acquisition |
||||||||||||
| Exercised employee share options |
||||||||||||
| Treasury share transactions |
||||||||||||
| Expired share options (Note 28) |
||||||||||||
| |
|
|
|
|
|
|||||||
| May be used to offset a deficit only |
||||||||||||
| Changes in percentage of ownership interest in subsidiaries (2) |
||||||||||||
| Share of changes in capital surplus of associates |
||||||||||||
| Dividends that the claim period has elapsed and unclaimed by shareholders |
||||||||||||
| |
|
|
|
|
|
|||||||
| |
|
|
|
|
|
|||||||
| May not be used for any purpose |
||||||||||||
| Employee share options |
||||||||||||
| Employee restricted stock awards |
||||||||||||
| Others (3) |
||||||||||||
| |
|
|
|
|
|
|||||||
| |
|
|
|
|
|
|||||||
| $ | $ | $ | ||||||||||
| |
|
|
|
|
|
|||||||
| 1) | Such capital surplus may be used to offset a deficit; in addition, when the Company has no deficit, such capital surplus may be distributed as cash dividends or transferred to share capital (limited to a certain percentage of the Company’s capital surplus and once a year). |
| 2) | Such capital surplus arises from the effects of changes in ownership interests in subsidiaries resulting from equity transactions other than actual disposals or acquisitions, or from changes in capital surplus of subsidiaries accounted for using the equity method. |
| 3) | Such capital surplus represents the excess of the carrying amount of related accounts over the par value due to employee share options exercised and the Company has not completed registration formalities. |
| c. | Retained earnings and dividend policy |
The Articles of Incorporation of the Company (the “Articles”) provides that annual net income shall be distributed in the following order:
| 1) | Replenishment of deficits; |
| 2) | 10.0% as legal reserve; |
| 3) | Special reserve appropriated or reversed in accordance with laws or regulations set forth by the authorities concerned; |
F-80
| 4) | If annual net income remains, a proposal for the distribution of such amount together with a part or all of the accumulated undistributed profits from previous years shall be prepared by the board of directors and submit to the shareholders’ meeting for resolution. However, the distributable dividends may be paid in cash after a resolution has been adopted by a majority vote at a meeting of the board of directors attended by two-thirds of the total number of directors; and in addition thereto a report of such distribution shall be submitted to the shareholders’ meeting. |
For the policies on the distribution of employees’ compensation and remuneration of directors, refer to employees’ compensation and remuneration of directors in Note 25(g).
The Company is currently in the mature growth stage. To meet the capital needs for business development now and in the future and satisfy the shareholders’ demand for cash inflows, the Company shall use residual dividend policy to distribute dividends, of which the cash dividend is not lower than 30 % of the total dividend distribution, with the remainder to be distributed in shares. A distribution plan is also to be made by the board of directors and passed for resolution in the shareholders’ meeting.
Appropriation of earnings to legal reserve shall be made until the legal reserve equals the Company’s share capital. Legal reserve may be used to offset deficits. If the Company has no deficit and the legal reserve has exceeded 25 % of the Company’s share capital, the excess may be transferred to capital or distributed in cash.
Items referred to under Rule No. 1090150022 issued by
the Financial Supervisory Commission R.O.C.
and in the directive titled “Questions and Answers for Special Reserves Appropriated Following Adoption of IFRSs” should be appropriated to or reversed from a special reserve by the Company.
The appropriation of earnings for 2019 and 2020 resolved
in
the Company’s annual shareholders’ meetings in June 2020 and August 2021, respectively,
were as follows: Appropriation of Earnings |
Dividends Per Share |
|||||||||||||||
For Year 2019 |
For Year 2020 |
For Year 2019 |
For Year 2020 |
|||||||||||||
NT$ |
NT$ |
NT$ |
NT$ |
|||||||||||||
(in dollars) |
(in dollars) |
|||||||||||||||
| Legal reserve |
$ | $ | ||||||||||||||
| Special reserve (reverse) |
( |
) | ||||||||||||||
| Cash dividends |
$ | $ | ||||||||||||||
| |
|
|
|
|||||||||||||
| $ | $ | |||||||||||||||
| |
|
|
|
|||||||||||||
F-81
| d. | Others equity items |
| 1) | Exchange differences on translating foreign operations |
For the Year Ended December 31 |
||||||||||||||||
2019 |
2020 |
2021 |
||||||||||||||
NT$ |
NT$ |
NT$ |
US$ (Note 4) |
|||||||||||||
| Balance at January 1 |
$ | ( |
) | $ | ( |
) | $ | ( |
) | $ | ( |
) | ||||
| Recognized for the year |
||||||||||||||||
| Exchange differences a on translating foreign operations ri sing |
( |
) | ( |
) | ( |
) | ( |
) | ||||||||
| Share from associates and joint venture accounted for using the equity method |
( |
) | ||||||||||||||
| Reclassification |
||||||||||||||||
| Disposal of associates and joint venture accounted for using the equity method |
— |
— |
— |
|||||||||||||
| Disposal of foreign operations |
— | ( |
) | ( |
) | |||||||||||
| |
|
|
|
|
|
|
|
|||||||||
| Balance at December 31 |
$ |
( |
) |
$ |
( |
) |
$ |
( |
) |
$ |
( |
) | ||||
| |
|
|
|
|
|
|
|
|||||||||
F-82
| 2) | Unr e alized gain (loss) on financial assets at FVTOCI |
For the Year Ended December 31 |
||||||||||||||||
2019 |
2020 |
2021 |
||||||||||||||
NT$ |
NT$ |
NT$ |
US$ (Note 4) |
|||||||||||||
| Balance at January 1 |
$ | ( |
) | $ | ( |
) | $ | $ | ||||||||
| Unrealized gain (loss) recognized during the year |
||||||||||||||||
| Debt instruments |
( |
) | ( |
) | ||||||||||||
| Equity instruments |
( |
) | ( |
) | ( |
) | ( |
) | ||||||||
| Share from associates and joint venture accounted for using the equity method |
||||||||||||||||
| Realized gain (loss) recognized during the year |
||||||||||||||||
| Disposal of associates and joint venture accounted for using the equity method |
— | — | — | |||||||||||||
| Cumulative unrealized loss of equity instruments transferred to retained earnings due to disposal |
— | |||||||||||||||
| Cumulative unrealized loss transferred to retained earnings due to disposal of equity instruments in relation to associates and joint venture accounted for using the equity method |
( |
) | ( |
) | ( |
) | ( |
) | ||||||||
| |
|
|
|
|
|
|
|
|||||||||
| Balance at December 31 |
$ | ( |
) | $ | $ | $ | ||||||||||
| 3) | Gain (loss) on hedging instruments - hedges of net investments of foreign operations |
For the Year Ended December 31 |
||||||||||||
2020 |
2021 |
|||||||||||
NT$ |
NT$ |
US$ (Note 4) |
||||||||||
| Balance at January 1 |
$ | $ | ( |
) | $ | ( |
) | |||||
| Recognized during the year |
||||||||||||
| Foreign currency risk – loans denominated in foreign currency |
( |
) | ||||||||||
| |
|
|
|
|
|
|||||||
| Balance at December 31 |
$ | ( |
) | $ | $ | |||||||
| |
|
|
|
|
|
|||||||
(Concluded)
F-83
| 4) | Unearned employee compensation |
In August 2021, the shareholders’ meeting resolved to issue restricted stock awards for employees
.
R
efer to Note 28For the Year Ended December 31, 2021 |
||||||||
NT$ |
US$ (Note 4) |
|||||||
| Balance at January 1 |
$ | $ | ||||||
| Issuance of employee restricted stock awards |
( |
) | ( |
) | ||||
| Share-based payment expenses |
||||||||
| |
|
|
|
|||||
| Balance at December 31 |
$ | ( |
) | $ | ( |
) | ||
| |
|
|
|
|||||
| e. | Treasury shares (in thousand shares) |
| Purpose of Repurchase |
Shares repurchased for cancellation |
Shares held by subsidiaries |
Total |
|||||||||
| Balance at December 31, 2020 |
||||||||||||
| |
|
|
|
|
|
|||||||
| |
|
|
|
|
|
|
|
|
|
|
|
|
| Balance at January 1, 2021 |
||||||||||||
| Addition |
||||||||||||
| |
|
|
|
|
|
|||||||
| |
|
|
|
|
|
|
|
|
|
|
|
|
| Balance at December 31, 2021 |
||||||||||||
| |
|
|
|
|
|
|||||||
In
order to maintain the Company’s credit and shareholders’ rights and interests,
the
in
to repurchase up to November 202
1
for cancellation
at prices between NT$.
I
f the Company’s shares price falls below NT$continuous to execute
th
e
repurchase. As of December 31, 2021, the Company 55,000 thousand shares, of which 53,067 thousand shares
early
completed the
repurchaseof
were bought back before December 31, 2021 at an average price of NT$104.2 (US$ 3.8 ) while the remaining
thousand shares were bought back during January 2022 at an average price of NT$106.4 (US$3.8 ). In February 2022, the Company’s board of directors resolved that February 25, 2022 was the record date for capital reduction and completed the cancellation of those repurchased ordinary shares.
The Company’s shares held by its subsidiaries at each balance sheet date were as follows:
Shares Held by Subsidiaries |
Carrying Amount |
Carrying Amount |
Fair Value |
Fair Value |
||||||||||||||||
(in thousand shares) |
NT$ |
US$ (Note 4) |
NT$ |
US$ (Note 4) |
||||||||||||||||
| December 31, 2020 |
||||||||||||||||||||
| ASE Test |
$ | $ | ||||||||||||||||||
| JR Holding |
||||||||||||||||||||
| ASE Test, Inc. |
||||||||||||||||||||
| |
|
|
|
|
|
|||||||||||||||
| $ | $ | |||||||||||||||||||
| |
|
|
|
|
|
|||||||||||||||
| December 31, 2021 |
||||||||||||||||||||
| ASE Test |
$ | $ | $ | $ | ||||||||||||||||
| JR Holding |
||||||||||||||||||||
| ASE Test, Inc. |
||||||||||||||||||||
| |
|
|
|
|
|
|
|
|
|
|||||||||||
| $ | $ | $ | $ | |||||||||||||||||
| |
|
|
|
|
|
|
|
|
|
|||||||||||
Fair value (Level 1) of the Company’s shares held by subsidiaries is based on the closing price from an available published price quotation.
Under the Securities and Exchange Act in the R.O.C., the Company shall neither pledge treasury shares nor exercise shareholders’ rights on these shares, such as the rights to dividends and voting. The subsidiaries holding the aforementioned treasury shares are bestowed shareholders’ rights except the rights to participate in any share issuance for cash and voting.
F-84
| f. | Non-controlling interests |
For the Year Ended December 31 |
||||||||||||||||
2019 |
2020 (retrospectively adjusted) |
2021 |
||||||||||||||
NT$ |
NT$ |
NT$ |
US$ (Note 4) |
|||||||||||||
| Balance at January 1 (retrospectively adjusted) |
$ | $ | $ | $ | ||||||||||||
| Share of profit for the year |
||||||||||||||||
| Other comprehensive income (loss) for the year |
||||||||||||||||
| Exchange difference on translating foreign operations |
( |
) | ( |
) | ( |
) | ||||||||||
| Unrealized gain (loss) on equity instruments at FVTOCI |
( |
) | ||||||||||||||
| Gain (loss) from hedging |
— | ( |
) | |||||||||||||
| Remeasurement on defined benefit plans |
( |
) | ( |
) | ||||||||||||
| Share of other comprehensive income from associates accounted for using the equity method |
— | — | ||||||||||||||
| Non-controlling interests arising from acquisition or disposal of subsidiaries (Note 29) |
— | — | ||||||||||||||
| Acquisition of non-controlling interests in subsidiaries (Note 31) |
( |
) | ( |
) | — | — | ||||||||||
| Issuance of ordinary shares by subsidiaries (Note 29) |
— | — | ||||||||||||||
| Subsidiaries’ buy back of their own outstanding ordinary shares (Note 31) |
( |
) | ( |
) | ( |
) | ( |
) | ||||||||
| Equity component of convertible bonds issued by subsidiaries |
— | — | ||||||||||||||
| Non-controlling interest relating to outstanding vested employee share options granted by subsidiaries |
||||||||||||||||
| Cash dividends d to ist ri buted non-controlling interests |
( |
) | ( |
) | ( |
) | ( |
) | ||||||||
| |
|
|
|
|
|
|
|
|||||||||
| Balance at December 31 |
$ | $ | $ | $ | ||||||||||||
| |
|
|
|
|
|
|
|
|||||||||
F-85
25. |
PROFIT BEFORE INCOME TAX |
| a. | Other operating income and expenses, net |
For the Year Ended December 31 |
||||||||||||||||
2019 |
2020 |
2021 |
||||||||||||||
NT$ |
NT$ |
NT$ |
US$ (Note 4) |
|||||||||||||
| Rental income |
$ | $ | $ | $ | ||||||||||||
| Gain (loss) on disposal of property, plant and equipment |
( |
) | ||||||||||||||
| Royalty income |
— | — | ||||||||||||||
| Impairment loss (Note 15) |
( |
) | ( |
) | ( |
) | ( |
) | ||||||||
| Others |
( |
) | ||||||||||||||
| |
|
|
|
|
|
|
|
|||||||||
| $ | ( |
) | $ | $ | $ | |||||||||||
| |
|
|
|
|
|
|
|
|||||||||
| b. | Other income |
For the Year Ended December 31 |
||||||||||||||||
2019 |
2020 |
2021 |
||||||||||||||
NT$ |
NT$ |
NT$ |
US$ (Note 4) |
|||||||||||||
| Interest income |
||||||||||||||||
| Bank deposits |
$ | $ | $ | $ | ||||||||||||
| Contracts with customers |
— | — | ||||||||||||||
| Government subsidies |
||||||||||||||||
| Dividends income |
||||||||||||||||
| |
|
|
|
|
|
|
|
|||||||||
| $ | $ | $ | $ | |||||||||||||
| |
|
|
|
|
|
|
|
|||||||||
c. |
Other gains and losses |
For the Year Ended December 31 |
||||||||||||||||
2019 |
2020 |
2021 |
||||||||||||||
NT$ |
NT$ |
NT$ |
US$ (Note 4) |
|||||||||||||
| Remeasurement gain on investments accounted for using the equity method due to step acquisition |
$ | $ | — | $ | — | $ | — | |||||||||
| Net gain on financial assets mandatorily at FVTPL |
||||||||||||||||
| Net loss arising on financial instruments held for trading |
( |
) | ( |
) | ( |
) | ( |
) | ||||||||
| Gain on disposal of subsidiaries (Note 30) |
— | |||||||||||||||
| Foreign exchange gain, net |
||||||||||||||||
| Gain recognized in bargain purchase transaction (Note 29) |
— | |||||||||||||||
| Gain (loss) on disposal of investments accounted for using the equity method |
— | ( |
) | ( |
) | |||||||||||
| Impairment loss on financial assets |
( |
) | — | — | — | |||||||||||
| Others |
( |
) | — | — | — | |||||||||||
| |
|
|
|
|
|
|
|
|||||||||
| $ | $ | $ | $ | |||||||||||||
| |
|
|
|
|
|
|
|
|||||||||
(Concluded)
F-86
| d. | Finance costs |
For the Year Ended December 31 |
||||||||||||||||
2019 |
2020 |
2021 |
||||||||||||||
NT$ |
NT$ |
NT$ |
US$ (Note 4) |
|||||||||||||
| Interest on lease liabilities |
$ | $ | $ | $ | ||||||||||||
| Interest on borrowings and bonds payable |
||||||||||||||||
| |
|
|
|
|
|
|
|
|||||||||
| Total interest expense for financial liabilities measured at amortized cost |
||||||||||||||||
| Less: Amounts included in the cost of qualifying assets |
||||||||||||||||
| Inventories related to real estate business |
( |
) | ( |
) | ( |
) | ( |
) | ||||||||
| Property, plant and equipment |
( |
) | ( |
) | ( |
) | ( |
) | ||||||||
| |
|
|
|
|
|
|
|
|||||||||
| Other finance costs |
||||||||||||||||
| |
|
|
|
|
|
|
|
|||||||||
| $ | $ | $ | $ | |||||||||||||
| |
|
|
|
|
|
|
|
|||||||||
Information relating to the capitalized borrowing costs was as follows:
For the Year Ended December 31 |
||||||||||||
2019 |
2020 |
2021 |
||||||||||
| Annual interest capitalization rates |
||||||||||||
| Inventories related to real estate business (%) |
||||||||||||
| Property, plant and equipment (%) |
||||||||||||
| e. | Depreciation and amortization |
For the Year Ended December 31 |
||||||||||||||||
2019 |
2020 |
2021 |
||||||||||||||
NT$ |
NT$ |
NT$ |
US$ (Note 4) |
|||||||||||||
| Property, plant and equipment |
$ | $ | $ | $ | ||||||||||||
| Right-of-use |
||||||||||||||||
| Investment properties |
||||||||||||||||
| Other intangible assets |
||||||||||||||||
| |
|
|
|
|
|
|
|
|||||||||
| Total |
$ | $ | $ | $ | ||||||||||||
| |
|
|
|
|
|
|
|
|||||||||
| Summary of depreciation by function |
||||||||||||||||
| Operating costs |
$ | $ | $ | $ | ||||||||||||
| Operating expenses |
||||||||||||||||
| |
|
|
|
|
|
|
|
|||||||||
| $ | $ | $ | $ | |||||||||||||
| |
|
|
|
|
|
|
|
|||||||||
| Summary of amortization by function |
||||||||||||||||
| Operating costs |
$ | $ | $ | $ | ||||||||||||
| Operating expenses |
||||||||||||||||
| |
|
|
|
|
|
|
|
|||||||||
| $ | $ | $ | $ | |||||||||||||
| |
|
|
|
|
|
|
|
|||||||||
(Concluded)
F-87
Operating expenses directly related to investment properties
For the Year Ended December 31 |
||||||||||||||||
2019 |
2020 |
2021 |
||||||||||||||
NT$ |
NT$ |
NT$ |
US$ (Note 4) |
|||||||||||||
| Direct operating expenses of investment properties that generated rental income |
$ | $ | $ | $ | ||||||||||||
| |
|
|
|
|
|
|
|
|||||||||
| f. | Employee benefits expense |
For the Year Ended December 31 |
||||||||||||||||
2019 |
2020 |
2021 |
||||||||||||||
NT$ |
NT$ |
NT$ |
US$ (Note 4) |
|||||||||||||
| Post-employment benefits |
||||||||||||||||
| Defined contribution plans |
$ | $ | $ | $ | ||||||||||||
| Defined benefit plans |
||||||||||||||||
| |
|
|
|
|
|
|
|
|||||||||
| Equity-settled share-based payments |
||||||||||||||||
| Other employee benefits |
||||||||||||||||
| |
|
|
|
|
|
|
|
|||||||||
| $ | $ | $ | $ | |||||||||||||
| |
|
|
|
|
|
|
|
|||||||||
| Summary of employee benefits expense by function |
||||||||||||||||
| Operating costs |
$ | $ | $ | $ | ||||||||||||
| Operating expenses |
||||||||||||||||
| |
|
|
|
|
|
|
|
|||||||||
| $ | $ | $ | $ | |||||||||||||
| |
|
|
|
|
|
|
|
|||||||||
| g. | Employees’ compensation and the remuneration to directors |
The Articles stipulates to distribute employees’ compensation and remuneration to directors at the rates 0.01 %-1.00 % and no higher than 0.75 %, respectively, of net profit before income tax, employees’ compensation and remuneration to directors.
of
F-88
For the Year Ended December 31 |
||||||||||||||||||||
2020 |
2021 |
|||||||||||||||||||
Accrual Rate (%) |
Accrual Amount |
Accrual Rate (%) |
Accrual Amount |
|||||||||||||||||
NT$ |
NT$ |
US$ (Note 4) |
||||||||||||||||||
| Employees’ compensation |
$ | $ | $ | |||||||||||||||||
| Remuneration to directors |
||||||||||||||||||||
If there is a change in the proposed amounts after the consolidated financial statement authorized for issue, the differences are recorded as a change in accounting estimate and will be adjusted in the following year.
In March 2020 and 2021, the board of directors resolved the appropriations of employees’ compensation and remuneration to directors in cash for 2019 and 2020, respectively. The differences between the resolved amounts and the accrued amounts reflected in the annual consolidated financial statements for the years ended December 31, 2019 and 2020 were deemed changes in estimates. The differences were NT$3 thousand and NT$818 thousand (US$29
For Year 2019 |
For Year 2020 |
|||||||||||||||
Employees’ compensation |
Remuneration to directors |
Employees’ compensation |
Remuneration to directors |
|||||||||||||
NT$ |
NT$ |
NT$ |
NT$ |
|||||||||||||
| Resolved by the board of directors |
$ | $ | $ | $ | ||||||||||||
| |
|
|
|
|
|
|
|
|||||||||
| Recognized in the consolidated financial statements |
$ | $ | $ | $ | ||||||||||||
| |
|
|
|
|
|
|
|
|||||||||
Information on the employees’ compensation and the remuneration to directors resolved by the board of directors is available at the Market Observation Post System website of the Taiwan Stock Exchange (the “TWSE”).
26. |
INCOME TAX |
The Company and its subsidiaries, ASE, SPIL and USIINC, have filed a consolidated tax return for corporate income tax and for unappropriated earnings.
| a. | Income tax recognized in profit or loss |
The major components of income tax were as follows:
For the Year Ended December 31 |
||||||||||||||||
2019 |
2020 |
2021 |
||||||||||||||
NT$ |
NT$ |
NT$ |
US$ (Note 4) |
|||||||||||||
| Current income tax |
||||||||||||||||
| In respect of the current year |
$ | $ | $ | $ | ||||||||||||
| Income tax on unappropriated earnings |
||||||||||||||||
| Changes in estimate for prior years |
( |
) | ( |
) | ( |
) | ( |
) | ||||||||
| |
|
|
|
|
|
|
|
|||||||||
| |
|
|
|
|
|
|
|
|||||||||
| Deferred income tax |
||||||||||||||||
| In respect of the current year |
( |
) | ( |
) | ||||||||||||
| Changes in tax rates |
— | |||||||||||||||
| Changes in estimate for prior years |
( |
) | ( |
) | ||||||||||||
| Effect of foreign currency exchange differences |
( |
) | ( |
) | ( |
) | ( |
) | ||||||||
| |
|
|
|
|
|
|
|
|||||||||
| ( |
) | ( |
) | |||||||||||||
| |
|
|
|
|
|
|
|
|||||||||
| Income tax expense recognized in profit or loss |
$ | $ | $ | $ | ||||||||||||
| |
|
|
|
|
|
|
|
|||||||||
F-89
A reconciliation of income
tax expense calculated at the statutory rates
and income tax expense recognized in profit or loss was as follows:
For the Year Ended December 31 |
||||||||||||||||
2019 |
2020 |
2021 |
||||||||||||||
NT$ |
NT$ |
NT$ |
US$ (Note 4) |
|||||||||||||
| Profit before income tax |
$ | $ | $ | $ | ||||||||||||
| |
|
|
|
|
|
|
|
|||||||||
| Income tax expense calculated at the statutory rates |
$ | $ | $ | $ | ||||||||||||
| Nontaxable expense in determining taxable income |
||||||||||||||||
| Tax-exempt income |
( |
) | ( |
) | ( |
) | ( |
) | ||||||||
| Additional income tax on unappropriated earnings |
||||||||||||||||
| Income tax credits |
( |
) | ( |
) | ( |
) | ( |
) | ||||||||
| The origination and reversal of temporary differences |
( |
) | ( |
) | ||||||||||||
| Income tax adjustments on prior years |
( |
) | ( |
) | ( |
) | ( |
) | ||||||||
| Unrecognized deferred tax liability for temporary differences associated with investments |
( |
) | ( |
) | ( |
) | ( |
) | ||||||||
| Unrecognized loss carryforwards |
— | — | ||||||||||||||
| Realized investment loss on merger of subsidiary |
— | ( |
) | — | — | |||||||||||
| Withholding tax |
||||||||||||||||
| Land value increment tax |
— |
— |
||||||||||||||
| Capital gains tax |
— | — | ||||||||||||||
| |
|
|
|
|
|
|
|
|||||||||
| Income tax expense recognized in profit or loss |
$ | $ | $ | $ | ||||||||||||
| |
|
|
|
|
|
|
|
|||||||||
In July 2019, the President of the R.O.C. announced the amendments to the Statute for Industrial Innovation, which stipulate that the amounts of unappropriated earnings in 2018 and thereafter that are reinvested in the construction or purchase of certain assets or technologies are allowed as deduction when computing the income tax on unappropriated earnings. When calculating the tax on unappropriated earnings, the Group only deducts the amount of the unappropriated earnings that has been reinvested in capital expenditure.
In addition, in accordance with Rule No.10904558730 issued by the Ministry of Finance of Taiwan, the Group has deducted the amount of dividends distributed in 2020 attributable to the increase in the retained earnings as of January 1, 2018 as a result of initial adoption of IFRS 9 and IFRS 15 when calculating the tax on unappropriated earnings for 2018.
F-90
| b. | Income tax recognized directly in equity |
For the Year Ended December 31 |
||||||||||||||||
2019 |
2020 |
2021 |
||||||||||||||
NT$ |
NT$ |
NT$ |
US$ (Note 4) |
|||||||||||||
| Deferred income tax |
||||||||||||||||
| Related to employee share options |
$ |
$ |
( |
) |
$ |
( |
) |
$ |
( |
) | ||||||
| |
|
|
|
|
|
|
|
|||||||||
| c. | Income tax recognized in other comprehensive income |
For the Year Ended December 31 |
||||||||||||||||
2019 |
2020 |
2021 |
||||||||||||||
NT$ |
NT$ |
NT$ |
US$ (Note 4) |
|||||||||||||
| Deferred income tax |
||||||||||||||||
| Related to remeasurement of defined benefit plans |
$ |
$ |
$ |
( |
) |
$ |
( |
) | ||||||||
| Unrealized loss on equity instruments at fair value through other comprehensive income |
( |
) |
( |
) |
( |
) |
( |
) | ||||||||
| |
|
|
|
|
|
|
|
|||||||||
| Income tax recognized in other comprehensive income |
$ |
( |
) |
$ |
( |
) |
$ |
( |
) |
$ |
( |
) | ||||
| |
|
|
|
|
|
|
|
|||||||||
| d. | Current tax assets and liabilities |
December 31 |
||||||||||||
2020 |
2021 |
|||||||||||
NT$ |
NT$ |
US$ (Note 4) |
||||||||||
| Current tax assets |
||||||||||||
| Tax refund receivable |
$ | $ | $ | |||||||||
| Prepaid income tax |
||||||||||||
| |
|
|
|
|
|
|||||||
| $ | $ | $ | ||||||||||
| |
|
|
|
|
|
|||||||
| Current tax liabilities |
||||||||||||
| Income tax payable |
$ | $ | $ | |||||||||
| |
|
|
|
|
|
|||||||
| e. | Deferred tax assets and liabilities |
The Group offset certain deferred tax assets and deferred tax liabilities which met the offset criteria.
F-91
| The movements of deferred tax assets and deferred tax liabilities were as follows: |
| For the year ended December 31, 2019 |
||||||||||||||||||||||||||||
Balance at January 1 |
Recognized in Profit or Loss |
Recognized in Other Comprehensive Income |
Recognized in Equity |
Exchange Differences |
Acquisitions through Business Combinations |
Balance at December 31 |
||||||||||||||||||||||
NT$ |
NT$ |
NT$ |
NT$ |
NT$ |
NT$ |
NT$ |
||||||||||||||||||||||
| Deferred tax assets |
||||||||||||||||||||||||||||
| Temporary differences |
||||||||||||||||||||||||||||
| Property, plant and equipment |
$ | $ | ( |
) | $ | — | $ | — | $ | ( |
) | $ | $ | |||||||||||||||
| Defined benefit obligation |
( |
) | — | ( |
) | — | ||||||||||||||||||||||
| FVTPL financial instruments |
— | — | ( |
) | — | |||||||||||||||||||||||
| Others |
( |
) | — | ( |
) | |||||||||||||||||||||||
| |
|
|
|
|
|
|
|
|
|
|
|
|
|
|||||||||||||||
| ( |
) | ( |
) | |||||||||||||||||||||||||
| Loss carry-forward |
( |
) | — | — | ( |
) | ||||||||||||||||||||||
| Investment credits |
( |
) | — | — | ( |
) | — | |||||||||||||||||||||
| |
|
|
|
|
|
|
|
|
|
|
|
|
|
|||||||||||||||
| $ | $ | ( |
) | $ | $ | $ | ( |
) | $ | $ | ||||||||||||||||||
| |
|
|
|
|
|
|
|
|
|
|
|
|
|
|||||||||||||||
| Deferred tax liabilities |
||||||||||||||||||||||||||||
| Temporary differences |
||||||||||||||||||||||||||||
| Property, plant and equipment |
$ | $ | ( |
) | $ | — | $ | — | $ | ( |
) | $ | $ | |||||||||||||||
| FVTPL financial instruments |
— | — | ( |
) | — | |||||||||||||||||||||||
| Others |
( |
) | ( |
) | ( |
) | ||||||||||||||||||||||
| |
|
|
|
|
|
|
|
|
|
|
|
|
|
|||||||||||||||
| $ | $ | ( |
) | $ | $ | ( |
) | $ | ( |
) | $ | $ | ||||||||||||||||
| |
|
|
|
|
|
|
|
|
|
|
|
|
|
|||||||||||||||
| For the year ended December 31, 2020 (retrospectively adjusted) |
||||||||||||||||||||||||||||||||
Balance at January 1 |
Recognized in Profit or Loss |
Recognized in Other Comprehensive Income |
Recognized in Equity |
Exchange Differences |
Acquisitions through Business Combinations |
Disposal of Subsidiaries |
Balance at December 31 |
|||||||||||||||||||||||||
NT$ |
NT$ |
NT$ |
NT$ |
NT$ |
NT$ |
NT$ |
NT$ |
|||||||||||||||||||||||||
| Deferred tax assets |
||||||||||||||||||||||||||||||||
| Temporary differences |
||||||||||||||||||||||||||||||||
| Property, plant and equipment |
$ |
$ |
$ |
— |
$ |
— |
$ |
$ |
$ |
( |
) |
$ |
||||||||||||||||||||
| Defined benefit obligation |
( |
) |
— |
— |
||||||||||||||||||||||||||||
| FVTPL financial instruments |
( |
) |
— |
— |
( |
) |
( |
) |
||||||||||||||||||||||||
| Others |
— |
( |
) |
( |
) |
( |
) |
|||||||||||||||||||||||||
| |
|
|
|
|
|
|
|
|
|
|
|
|
|
|
|
|||||||||||||||||
( |
) |
( |
) |
( |
) |
|||||||||||||||||||||||||||
| Loss carry-forward |
( |
) |
— |
— |
( |
) |
( |
) |
||||||||||||||||||||||||
| Investment credits |
( |
) |
— |
— |
( |
) |
— |
— |
||||||||||||||||||||||||
| |
|
|
|
|
|
|
|
|
|
|
|
|
|
|
|
|||||||||||||||||
$ |
$ |
$ |
$ |
( |
) |
$ |
( |
) |
$ |
$ |
( |
) |
$ |
|||||||||||||||||||
| |
|
|
|
|
|
|
|
|
|
|
|
|
|
|
|
|||||||||||||||||
| Deferred tax liabilities |
||||||||||||||||||||||||||||||||
| Temporary differences |
||||||||||||||||||||||||||||||||
| Property, plant and equipment |
$ |
$ |
$ |
— |
$ |
— |
$ |
( |
) |
$ |
$ |
— |
$ |
|||||||||||||||||||
| FVTPL financial instruments |
( |
) |
— |
— |
— |
— |
||||||||||||||||||||||||||
| Others |
( |
) |
( |
) |
||||||||||||||||||||||||||||
| |
|
|
|
|
|
|
|
|
|
|
|
|
|
|
|
|||||||||||||||||
$ |
$ |
$ |
$ |
$ |
( |
) |
$ |
$ |
( |
) |
$ |
|||||||||||||||||||||
| |
|
|
|
|
|
|
|
|
|
|
|
|
|
|
|
|||||||||||||||||
| For the year ended December 31, 2021 |
||||||||||||||||||||||||||||
Balance at January 1 (retrospectively adjusted) |
Recognized in Profit or Loss |
Recognized in Other Comprehensive Income |
Recognized in Equity |
Exchange Differences |
Disposal of Subsidiaries |
Balance at December 31 |
||||||||||||||||||||||
NT$ |
NT$ |
NT$ |
NT$ |
NT$ |
NT$ |
NT$ |
||||||||||||||||||||||
| Deferred tax assets |
||||||||||||||||||||||||||||
| Temporary differences |
||||||||||||||||||||||||||||
| Property, plant and equipment |
$ |
$ |
( |
) |
$ |
— |
$ |
— |
$ |
( |
) |
$ |
( |
) |
$ |
|||||||||||||
| Defined benefit obligation |
( |
) |
( |
) |
— |
( |
) |
— |
||||||||||||||||||||
| FVTPL financial instruments |
— |
— |
( |
) |
— |
|||||||||||||||||||||||
| Others |
— |
( |
) |
( |
) |
|||||||||||||||||||||||
| |
|
|
|
|
|
|
|
|
|
|
|
|
|
|||||||||||||||
( |
) |
( |
) |
( |
) |
( |
) |
|||||||||||||||||||||
| Loss carry-forward |
— |
— |
( |
) |
( |
) |
||||||||||||||||||||||
| Investment credits |
( |
) |
— |
— |
( |
) |
— |
|||||||||||||||||||||
| |
|
|
|
|
|
|
|
|
|
|
|
|
|
|||||||||||||||
$ |
$ |
$ |
( |
) |
$ |
( |
) |
$ |
( |
) |
$ |
( |
) |
$ |
||||||||||||||
| |
|
|
|
|
|
|
|
|
|
|
|
|
|
|||||||||||||||
| Deferred tax liabilities |
||||||||||||||||||||||||||||
| Temporary differences |
||||||||||||||||||||||||||||
| Property, plant and equipment |
$ |
$ |
$ |
— |
$ |
— |
$ |
( |
) |
$ |
( |
) |
$ |
|||||||||||||||
| FVTPL financial instruments |
— |
— |
( |
) |
— |
|||||||||||||||||||||||
| Others |
( |
) |
||||||||||||||||||||||||||
| |
|
|
|
|
|
|
|
|
|
|
|
|
|
|||||||||||||||
$ |
$ |
$ |
$ |
$ |
$ |
( |
) |
$ |
||||||||||||||||||||
| |
|
|
|
|
|
|
|
|
|
|
|
|
|
|||||||||||||||
F-92
Balance at January 1 (retrospectively adjusted) |
Recognized in Profit or Loss |
Recognized in Other Comprehensive Income |
Recognized in Equity |
Exchange Differences |
Disposal of Subsidiaries |
Balance at December 31 |
||||||||||||||||||||||
US$ (Note 4) |
US$ (Note 4) |
US$ (Note 4) |
US$ (Note 4) |
US$ (Note 4) |
US$ (Note 4) |
US$ (Note 4) |
||||||||||||||||||||||
| Deferred tax assets |
||||||||||||||||||||||||||||
| Temporary differences |
||||||||||||||||||||||||||||
| Property, plant and equipment |
$ |
$ |
( |
) |
$ |
— |
$ |
— |
$ |
( |
) |
$ |
( |
) |
$ |
|||||||||||||
| Defined benefit obligation |
( |
) |
( |
) |
— |
( |
) |
— |
||||||||||||||||||||
| FVTPL financial instruments |
— |
— |
( |
) |
— |
|||||||||||||||||||||||
| Others |
— |
( |
) |
( |
) |
|||||||||||||||||||||||
| |
|
|
|
|
|
|
|
|
|
|
|
|
|
|||||||||||||||
( |
) |
( |
) |
( |
) |
( |
) |
|||||||||||||||||||||
| Loss carry-forward |
— |
— |
( |
) |
( |
) |
||||||||||||||||||||||
| Investment credits |
( |
) |
— |
— |
( |
) |
— |
|||||||||||||||||||||
| |
|
|
|
|
|
|
|
|
|
|
|
|
|
|||||||||||||||
$ |
$ |
$ |
( |
) |
$ |
( |
) |
$ |
( |
) |
$ |
( |
) |
$ |
||||||||||||||
| |
|
|
|
|
|
|
|
|
|
|
|
|
|
|||||||||||||||
| Deferred tax liabilities |
||||||||||||||||||||||||||||
| Temporary differences |
||||||||||||||||||||||||||||
| Property, plant and equipment |
$ |
$ |
$ |
— |
$ |
— |
$ |
( |
) |
$ |
( |
) |
$ |
|||||||||||||||
| FVTPL financial instruments |
— |
— |
( |
) |
— |
|||||||||||||||||||||||
| Others |
( |
) |
||||||||||||||||||||||||||
| |
|
|
|
|
|
|
|
|
|
|
|
|
|
|||||||||||||||
$ |
$ |
$ |
$ |
$ |
$ |
( |
) |
$ |
||||||||||||||||||||
| |
|
|
|
|
|
|
|
|
|
|
|
|
|
|||||||||||||||
| f. | Items for which no deferred tax assets have been recognized for loss carry-forward, investment credits and deductible temporary differences |
December 31 |
||||||||||||
2020 |
2021 |
|||||||||||
NT$ |
NT$ |
US$ (Note 4) |
||||||||||
| Loss carry-forward |
$ | $ | $ | |||||||||
| Investment credits |
||||||||||||
| Deductible temporary differences |
||||||||||||
| |
|
|
|
|
|
|||||||
| $ | $ | $ | ||||||||||
| |
|
|
|
|
|
|||||||
The unrecognized loss carry-forward will expire through 2030.
| g. | Information about unused loss carry-forward, unused investment credits, tax-exemption and other tax relief |
As of December 31, 2021, the unused loss carry-forward comprised:
Expiry Year |
NT$ |
US$ |
||||||
(Note 4) |
||||||||
| 2022 |
$ | $ | ||||||
| 2023 |
||||||||
| 2024 |
||||||||
| 2025 |
||||||||
| 2026 and thereafter |
||||||||
| |
|
|
|
|||||
| $ | $ | |||||||
| |
|
|
|
|||||
As of December 31, 2021, unused investment credits comprised:
Tax Credit Source |
Remaining Creditable Amount |
Expiry Year | ||||||||
NT$ |
US$ |
|||||||||
(Note 4) |
||||||||||
| Purchase of machinery and equipment |
$ | $ | ||||||||
| Others |
||||||||||
| |
|
|
|
|||||||
| $ | $ | |||||||||
| |
|
|
|
|||||||
F-93
As of December 31, 2021, profits attributable to the following expansion project is exempted from income tax for a
5-year
period: Tax-exemption Period | ||
| Construction and expansion of ASE Test Inc. in 2009 |
- | |
Some China subsidiaries qualified as high technology enterprises were entitled to a reduced income tax rate of 15 % and were eligible to deduct certain times of research and development expenses from their taxable income.
| h. | Unrecognized deferred tax liabilities associated with investments |
As of December 31, 2020 and 2021, the taxable temporary differences associated with the investments in subsidiaries for which no deferred tax liabilities have been recognized were NT$33,474,725 thousand and NT$39,480,927 thousand (US$1,423,249 thousand), respectively.
| i. | Income tax assessments |
The tax authorities have examined income tax returns of the Company and its R.O.C. subsidiaries through 2018 and 2019.
27. |
EARNINGS PER SHARE |
The earnings and weighted average number of ordinary shares outstanding in the computation of earnings per share were as follows:
| Net profit for the year |
||||||||||||||||
For the Year Ended December 31 |
||||||||||||||||
2019 |
2020 |
2021 |
||||||||||||||
NT$ |
NT$ |
NT$ |
US$ (Note 4) |
|||||||||||||
| Profit for the year attributable to owners of the Company |
$ | $ | $ | $ | ||||||||||||
| Effect of potentially dilutive ordinary shares: |
||||||||||||||||
| Potential ordinary s hares of the subsid iary |
( |
) | ( |
) | ( |
) | ( |
) | ||||||||
| |
|
|
|
|
|
|
|
|||||||||
| Earnings used in the computation of diluted earnings per share |
$ | $ | $ | $ | ||||||||||||
| |
|
|
|
|
|
|
|
|||||||||
Weighted average number of ordinary shares outstanding
(in thousand shares): For the Year Ended December 31 |
||||||||||||
2019 |
2020 |
2021 |
||||||||||
| Weighted average number of ordinary shares in the computation of basic earnings per share |
||||||||||||
| Effect of potentially dilutive ordinary shares |
||||||||||||
| Employee share options |
||||||||||||
| Employees’ compensation |
||||||||||||
| Employee restricted stock awards |
— | — | ||||||||||
| |
|
|
|
|
|
|||||||
| Weighted average number of ordinary shares in the computation of diluted earnings per share |
||||||||||||
| |
|
|
|
|
|
|||||||
F-94
For the computation of earnings per ADS, the denominators were the half of the aforementioned weighted average outstanding shares (1 ADS represents 2 ordinary shares) while the numerators held constant.
The Group is able to settle the employees’ compensation by cash or shares. The Group assumed that the entire amount of the compensation would be settled in shares and the resulting potential shares were included in the weighted average number of ordinary shares outstanding used in the computation of diluted earnings per share if the effect is dilutive. Such dilutive effect of the potential shares was included in the computation of diluted earnings per share until the board of directors approve the number of shares to be distributed to employees at their meeting in
the
following year. 28. |
SHARE-BASED PAYMENT ARRANGEMENTS |
| a. | Employee share option plans of the Company |
In order to attract, retain and reward employees, the Company and its subsidiary, ASE, have their employee share option plans for the Group’s full-time employees. As disclosed in Note 1, the Company assumed ASE’s obligations of outstanding employee share option plans starting from April 30, 2018 and each share option represents the right to purchase 0.5 ordinary share of the Company when exercised. Under the terms of the plan, share options are granted at an exercise price equal to or not less than the closing price of the ordinary shares listed on the TWSE at the issue date. The right of those share options granted under the plan is valid for 10 years , 1.5 % of the market price per ordinary share, the exercise price is accordingly adjusted.
non-transferable
and exercisable at certain percentages subsequent to the second anniversary of the grant date. For any subsequent changes in the Company’s capital structure or when cash dividend per ordinary share exceeds F-95
Information about the share option plans that the Company granted
and assumed
were as follows: For the Year Ended December 31 |
||||||||||||||||||||||||
2019 |
2020 |
2021 |
||||||||||||||||||||||
Weighted |
Weighted |
Weighted |
||||||||||||||||||||||
Average |
Average |
Average |
||||||||||||||||||||||
Number of |
Exercise |
Number of |
Exercise |
Number of |
Exercise |
|||||||||||||||||||
Options |
Price |
Options |
Price |
Options |
Price |
|||||||||||||||||||
(In |
Per Share |
(In |
Per Share |
(In |
Per Share |
|||||||||||||||||||
Thousands) |
(NT$) |
Thousands) |
(NT$) |
Thousands) |
(NT$) |
|||||||||||||||||||
| Balance at January 1 |
$ | $ | $ | |||||||||||||||||||||
| Options expired |
— | — | ( |
) | ||||||||||||||||||||
| Options forfeited |
( |
) | ( |
) | ( |
) | ||||||||||||||||||
| Options exercised |
( |
) | ( |
) | ( |
) | ||||||||||||||||||
| |
|
|
|
|
|
|||||||||||||||||||
| Balance at December 31 |
||||||||||||||||||||||||
| |
|
|
|
|
|
|||||||||||||||||||
| Options exercisable, end of year |
||||||||||||||||||||||||
| |
|
|
|
|
|
|||||||||||||||||||
The weighted average share prices at exercise dates of share options for the years ended December 31, 2019, 2020 and 2021 were NT$69.3 , NT$68.5 and NT$108.8 (US$3.9 ), respectively.
Information about the outstanding share options that the Company granted and assumed at each balance sheet date was as follows:
| Range of Exercise Price Per Share (NT$) |
Weighted Average Remaining Contractual Life (Years) |
|||||||
| December 31, 2020 |
||||||||
| ASE 4 th share options |
$ |
|||||||
| ASE 5 th share options |
||||||||
| The Company 1 st share options |
||||||||
| December 31, 2021 |
||||||||
| ASE 5 th share options |
||||||||
| The Company 1 st share options |
||||||||
| b. | Employee restricted stock awards plan of the Company |
To attract and retain talents 15,000
as well as
motivate and engage employees, the Company’s annual shareholders’ meetings resolved in August 202
the 2021 employee restricted stock awards plan and1
to issue granted
thousand ordinary shares on the record date of October 1, 2021. The par value and the exercise price was NT$10 (US$0.36 ) and NT$0 per share, respectively
.
The fair value at the grant day was NT$92.4 (US$3.33 )
per s
hare.
The vested shares are settled and issued on an annual basis during a three-year period starting from October 1, 2021. Up to one-thirds of the total shares granted will be vested only after the Company reaching specific performance targets before the end of each year-period. Except for inheritance, those shares shall not be sold, pledged, transferred, gifted, conditioned, or otherwise dispose of before vest, while the rights of attendance, propose, speak, vote and election at shareholders meeting and other rights, including but not limited to, stock dividend, cash dividend, distribution from legal reserve and capital surplus, share options at cash capital increase are identical with the Company’s ordinary shares issued and outstanding. All the shares under this plan should be deposited in a trust account before vest.
After the grant date, the Company has the right to revoke and cancel those unvested shares. The dividends (including cash dividends, stock dividends, and the cash or the shares distributed from legal reserve or capital surplus) entitled to those unvested shares and interests derived therefrom shall be returned to the Company from the trust account at the same time.
F-96
| c. | Employee share option plans of subsidiaries |
USIE
The terms of the plans issued by USIE were the same with those option plans previously granted by ASE. Information about share options was as follows:
For the Year Ended December 31 |
||||||||||||||||
2019 |
2020 |
|||||||||||||||
Weighted |
Weighted |
|||||||||||||||
Number of |
Average Exercise |
Number of |
Average Exercise |
|||||||||||||
Options |
Price |
Options |
Price |
|||||||||||||
(In |
Per Share |
(In |
Per Share |
|||||||||||||
Thousands) |
(US$) |
Thousands) |
(US$) |
|||||||||||||
| Balance at January 1 |
$ | $ | ||||||||||||||
| Options forfeited |
— | — | ( |
) | ||||||||||||
| Options exercised |
( |
) | ( |
) | ||||||||||||
| |
|
|
|
|||||||||||||
| Balance at December 31 |
— | — | ||||||||||||||
| |
|
|
|
|||||||||||||
| Options exercisable, end of year |
— | — | ||||||||||||||
| |
|
|
|
|||||||||||||
In 2019 and 2020, the Group’s shareholdings in USIE decreased because USIE’s share options were exercised. The transaction was accounted for as an equity transaction since the Group did not cease to have control over USIE and, as a result, capital surplus was decreased by NT$981,078 thousand
in
2019,
and capital surplus
and retained earnings was decreased by NT$thousand, respectively, in
2020. In addition, all of USIE’s share options were fully exercised as of December 31, 2020.
USISH
Under the share option plan issued in 2015 (“2015 share options”), each unit represents the right to purchase one ordinary share of USISH when exercised. The options are valid for 10 years,
non-transferable
and exercisable at certain percentages subsequent to the second anniversary of the grant date incorporated with certain performance conditions. For any subsequent changes in USISH’s capital structure, the exercise price is accordingly adjusted. In November 2019, USISH adopted the first share option plan (“2019 share options”) and granted 17,167 thousand share options to its employees. Each unit represents the right to purchase one ordinary share of USISH when exercised. The options are valid for 3.0 years, 4.0 years and 5.0 years, respectively, and are exercisable at certain percentages within 12 months subsequent to the second, the third and the fourth anniversary of the grant date under the satisfaction of certain performance conditions within each respective vesting period. In the event that USISH increases share capital by capital surplus or by cash, or distributes share dividends or cash dividends, the exercisable share option units and the exercise price are accordingly adjusted.
In September 2020, USISH adopted the second share option plan (“2020 share options”) and granted 1,140 thousand share options to its employees. The conditions of issued 2020 share options are the same as 2019 share options plan, except that the options are valid for 2.2 years, 3.2 years and 4.2 years , respectively, and with each respective vesting period of 1.2 years , 2.2 years and 3.2 years .
F-97
Information about share options was as follows:
For the Year Ended December 31 |
||||||||||||||||||||||||
2019 |
2020 |
2021 |
||||||||||||||||||||||
Number of |
Exercise |
Number of |
Exercise |
Number of |
Exercise |
|||||||||||||||||||
Options |
Price |
Options |
Price |
Options |
Price |
|||||||||||||||||||
(In |
Per Share |
(In |
Per Share |
(In |
Per Share |
|||||||||||||||||||
Thousands) |
(RMB) |
Thousands) |
(RMB) |
Thousands) |
(RMB) |
|||||||||||||||||||
| Balance at January 1 |
$ | $ | $ | |||||||||||||||||||||
| Options granted |
||||||||||||||||||||||||
| Options forfeited |
( |
) | ( |
) | ( |
) | ||||||||||||||||||
| Options exercised |
( |
) | ( |
) | ( |
) | ||||||||||||||||||
| |
|
|
|
|
|
|||||||||||||||||||
| Balance at December 31 |
||||||||||||||||||||||||
| |
|
|
|
|
|
|||||||||||||||||||
| Options exercisable, end of year |
||||||||||||||||||||||||
| |
|
|
|
|
|
|||||||||||||||||||
| Fair value of options granted (RMB) |
$ | $ | $ | |||||||||||||||||||||
| |
|
|
|
|
|
|||||||||||||||||||
Information about USISH’s outstanding share options at each balance sheet date was as follows:
| Range of Exercise Price Per Share (RMB) |
Remaining Contractual Life (Years) |
|||||||
| December 31, 2020 |
||||||||
| 2015 share options |
$ | |||||||
| 2019 share options |
||||||||
| 2020 share options |
||||||||
| December 31, 2021 |
||||||||
| 2015 share options |
||||||||
| 2019 share options |
||||||||
| 2020 share options |
||||||||
d . |
Employee restricted stock plans of subsidiaries |
In November 2019, USISH adopted the first restricted 6,156 thousand ordinary shares to its directors (excluding independent directors), supervisors and employees. In April 2020, the board of directors further resolved to grant 6,403 thousand ordinary shares instead, while other terms remain constant. The plan was of 3 phases starting from 2019 and each phase lasts for 1 year with a valid period of 4.5 years , 3.5 years and 2.5 years , respectively. Upon satisfaction of certain performance conditions in each phase, participants are entitled to subscribe a certain percentage of the total USISH’s ordinary shares issued under the plan with a
stock
plan (“2019 restricted stocks
”) and granted lock-up
period of 1 year. The valid period may be early terminated or extended prior to one month of the expiration date depending on the conditions of ordinary shares granted. In the event that USISH increases share capital by capital surplus or by cash, or distributes share dividends or cash dividends, the exercise price is accordingly adjusted. F-98
In September 2020, USISH adopted the second restricted 425 thousand ordinary shares to its employees. The conditions of issued 2020 restricted 2 years and the ordinary shares that USISH would issue to participants for free are with a 1.3 year.
stock
plan (“2020 restricted stocks
”) and granted stocks
are the same as 2019 restricted sto
plan, except that the restricted cks
stocks
are valid for lock-up
period of In September 2021, USISH adopted the third restricted
stock
plan (“2021 restricted stocks
”) and granted 281 thousand ordinary shares to its expatriate staff. The conditions of issued 2021 restricted st
are the same as 2020 restricted oc
ks
sto
plan. cks
Information about restricted
stocks
was as follows: For the Year Ended December 31 |
||||||||||||||||||||||||
2019 |
2020 |
2021 |
||||||||||||||||||||||
Number of |
Exercise |
Number of |
Exercise |
Number of |
Exercise |
|||||||||||||||||||
Options |
Price |
Options |
Price |
Options |
Price |
|||||||||||||||||||
(In |
Per Share |
(In |
Per Share |
(In |
Per Share |
|||||||||||||||||||
Thousands) |
(RMB) |
Thousands) |
(RMB) |
Thousands) |
(RMB) |
|||||||||||||||||||
| Balance at January 1 |
— | $ | — | $ | $ | |||||||||||||||||||
| Options granted |
||||||||||||||||||||||||
| Options exercised |
— | — | ( |
) | ( |
) | ||||||||||||||||||
| Options forfeited |
— | — | — | — | ( |
) | ||||||||||||||||||
| |
|
|
|
|
|
|||||||||||||||||||
| Balance at December 31 |
||||||||||||||||||||||||
| |
|
|
|
|
|
|||||||||||||||||||
| Options exercisable, end of year |
||||||||||||||||||||||||
| |
|
|
|
|
|
|||||||||||||||||||
| Fair value of options granted (RMB) |
$ | $ | $ | |||||||||||||||||||||
| |
|
|
|
|
|
|||||||||||||||||||
Information about USISH’s outstanding restricted
st
at each balance sheet date was as follows: oc
ks| Range of Exercise Price Per Share (RMB) |
Remaining Contractual Life (Years) |
|||||||
| December 31, 2020 |
||||||||
| 2019 restricted st ocks |
$ | |||||||
| 2020 restricted stocks |
— | |||||||
| December 31, 2021 |
||||||||
| 2019 restricted st ocks |
||||||||
| 2020 restricted stocks |
— | |||||||
| 2021 restricted st oc ks |
— | |||||||
The Group’s shareholdings in USISH decreased because the abovementioned share option plans and restricted 105,785 thousand, NT$1,010,219 thousand and NT$58,448 thousand (US$2,107 thousand) in 2019, 2020 and 2021, respectively.
stock
plan were exercised in 2019, 2020 and 2021. The transaction was accounted for as an equity transaction since the Group did not cease to have control over USISH and, as a result, capital surplus increased by NT$e . |
Fair value information |
For the fair values at the grant date of USISH’s 2019, 2020 and 2021 plans, the share options plans were measured by using the trinomial tree model, while the restricted
stocks
plans were measured by using the Black-Scholes Option Pricing Model incorporating the effect of the lock-up
period. The inputs to the models were as follows: F-99
| Share option plan |
||||
2019 Share Options Plan |
2020 Share Options Plan | |||
| Share price at the grant date |
RMB |
RMB | ||
| Exercise price |
RMB |
RMB | ||
| Expected volatility (%) |
||||
| Expected lives (years) |
||||
| Expected dividend yield |
— | — | ||
| Risk free interest rate (%) |
||||
| Restricted stock plan |
||||||||
2019 Restricted S tocks |
2019 Restricted Stocks Plan Amended in 2020 |
2020 Restricted Stocks Plan |
2021 Restricted Stocks Plan | |||||
| Share price at the grant date |
RMB |
RMB |
RMB |
RMB | ||||
| Exercise price |
RMB |
RMB |
(Note) | (Note) | ||||
| Expected volatility (%) |
||||||||
| Lock-up periods (years) |
||||||||
| Expected dividend yield |
— | — | — | — | ||||
| Risk free interest rate (%) |
||||||||
| Note: | The restricted st plan is to transfer ordinary shares for free upon satisfaction of certain performance conditions prior to the expiration. ock |
Expected volatilities were based on the annualized volatilities of USISH’s historical share prices.
For the years ended December 31, 2019, 2020 and 2021, employee benefits expense recognized on the share-based payment plans were NT$871,699 thousand, NT$955,575 thousand and NT$699,211 thousand (US$25,206 thousand), respectively.
F-100
29. |
BUSINESS COMBINATIONS |
| a. | Subsidiaries acquired |
Principal Activity |
Date of Acquisition |
Proportion of Voting Equity Interests Acquired (%) |
Consideration Transferred |
|||||||||||||
NT$ |
US$ (Note 4) |
|||||||||||||||
| AMPI |
$ |
|||||||||||||||
| |
|
|||||||||||||||
| ASEEE |
$ — |
|||||||||||||||
| |
|
|||||||||||||||
| USIPL |
$ |
|||||||||||||||
| |
|
|||||||||||||||
| FAFG |
$ |
|||||||||||||||
| |
|
|||||||||||||||
| ITGEU |
$ |
$ |
||||||||||||||
| |
|
|
|
|||||||||||||
| SER |
$ |
$ |
||||||||||||||
| |
|
|
|
|||||||||||||
F-101
| b. | Consideration Transferred |
AMPI |
ASEEE |
USIPL |
FAFG (Retrospectively Adjusted) |
ITGEU |
SER |
|||||||||||||||||||||||||||
NT$ |
NT$ |
NT$ |
NT$ |
NT$ |
US$ (Note 4) |
NT$ |
US$ (Note 4) |
|||||||||||||||||||||||||
| Cash |
$ | $ | $ | $ | $ | $ | $ | $ | ||||||||||||||||||||||||
| Equity instrument issued |
— |
— |
— |
— | — | — | — | |||||||||||||||||||||||||
| Contingent consideration arrangement |
— |
— |
— | ( |
) | — | — | — | — | |||||||||||||||||||||||
| |
|
|
|
|
|
|
|
|
|
|
|
|
|
|
|
|||||||||||||||||
| Fair value of identifiable net assets acquired |
$ | $ | $ | $ | $ | $ | $ | $ | ||||||||||||||||||||||||
| |
|
|
|
|
|
|
|
|
|
|
|
|
|
|
|
|||||||||||||||||
In April 2019, the Group’s subsidiary, ASE Test, Inc., subscribed for 100,000 thousand ordinary shares of AMPI from its private placement with NT$250,000 thousand in cash. The percentage of the Group’s ownership in AMPI then increased to 50.97 % and, therefore, the Group obtained control over AMPI. The investment in ordinary shares of AMPI originally accounted for using the equity method was remeasured to the fair value at the acquisition date and the Group recognized remeasurement gain of NT$243,057 thousand under the line item of other gains and losses.
In April 2019, ASE entered into a memorandum of understanding with TDK Corporation (“TDK”) in relation to ASEEE that was incorporated by a joint venture agreement entered into by the Group and TDK. In addition to a reduction of one legal representative director of TDK, which resulted in that the Group obtained control over ASEEE starting from April 2019 and the investments in ASEEE originally accounted for using the equity method was remeasured to its fair value at the acquisition date with a remeasurement gain of NT$76,655 thousand under the line item of other gains and losses (Note 25), the memorandum of understanding set out that, after ASEEE offset its accumulated deficits against its capital in an amount of NT$1,147,595 thousand, ASE subscribed all of 150,000 1,500,000 thousand in May 2019 and then repurchased all of ASEEE’s ordinary shares held by TDK in an amount of US$6,000 thousand in July 2019. As a result, the Group eventually held 100 % of ownership in ASEEE (Note 31). Furthermore, ASE merged ASEEE in February 2020.
F-102
In October 2019, the Group’s subsidiary, Universal Global Electronics Co., Ltd., acquired 60 % shareholdings of USIPL with a total consideration based on independent professional appraisal reports.
In December 2020, the Group’s subsidiary, USIFR, paid NT$10,800,558 thousand (equivalent to US$368,753 thousand) in cash and the Group’s subsidiary, USISH, issued its 25,940 thousand new ordinary shares, respectively, to acquire 100 % shareholdings of FAFG. In addition, according to the share purchase agreement, USIFR is obliged to pay an 42,805 thousand in 2023 if FAFG’s net profit in 2021 and 2022 reaches the predetermined target. In December 2020, USIFR deposited NT$294,244 thousand (equivalent to US$10,122 thousand) in advance to trust account. Based value of contingent consideration, USIFR will be able to receive NT$385,735 thousand back, of which NT$294,244 thousand will be received from trust account while NT$91,491 thousand will be received additionally.
earn-out
amount up to US$on the valuation report of fair
In November 2021, the Group’s subsidiary, ASTEELFLASH FRANCE, acquired 100 % shareholdings of SER
and o
control over SER. In November 2021, the board of directors of ASTEELFLASH FRANCE further resolved to merge SERbtain
ed
.
December 28, 202
was 1
the
record date for the merger and such merger was completed. | c. | Assets acquired and liabilities assumed at the date of acquisition |
AMPI |
ASEEE |
USIPL |
FAFG |
ITGEU |
SER |
|||||||||||||||||||||||||||
NT$ |
NT$ |
NT$ |
NT$ |
NT$ |
US$ (Note 4) |
NT$ |
US$ (Note 4) |
|||||||||||||||||||||||||
| Assets |
||||||||||||||||||||||||||||||||
| Cash and cash equivalents |
$ | $ | $ | $ | $ | $ | $ | $ | ||||||||||||||||||||||||
| Trade and other receivables |
||||||||||||||||||||||||||||||||
| Inventories |
— | — | ||||||||||||||||||||||||||||||
| Property, plant and equipment |
||||||||||||||||||||||||||||||||
| Intangible assets |
||||||||||||||||||||||||||||||||
| Others |
||||||||||||||||||||||||||||||||
| Liabilities |
||||||||||||||||||||||||||||||||
| Trade and other payables |
( |
) | ( |
) | ( |
) | ( |
) | ( |
) | ( |
) | ( |
) | ( |
) | ||||||||||||||||
| Borrowings and bonds payables |
( |
) | ( |
) | ( |
) | ( |
) | — | — | — | — | ||||||||||||||||||||
| Others |
( |
) | ( |
) | ( |
) | ( |
) | ( |
) | ( |
) | ( |
) | ( |
) | ||||||||||||||||
| |
|
|
|
|
|
|
|
|
|
|
|
|
|
|
|
|||||||||||||||||
| Fair value of identifiable net assets acquired |
$ | $ | $ | $ | $ | $ | $ | $ | ||||||||||||||||||||||||
| |
|
|
|
|
|
|
|
|
|
|
|
|
|
|
|
|||||||||||||||||
A call option on the remaining 40 %
non-controlling
interests of USIPL was stipulated in the equity transfer agreement. The Group recognized the call option under the line item of financial assets at FVTPL and exercised it in June 2020 (Note 31). | d. | Non-controlling interest |
Non-controlling interests of AMPI and ASEEE were measured at their proportionate share of their fair value of AMPI’s and ASEEE’s identifiable net assets, respectively.
Non-controlling interests of USIPL were measured at fair value at the acquisition date by using market approach incorporating transaction prices of comparable companies and the discount rate for lack of control. The significant unobservable inputs is the discount rate for lack of control of 31 %.
Non-controlling
interests of FAFG were measured at its proportionate share of the fair value of FAFG’s identifiable net assets. F-103
| e. | Goodwill recognized on acquisitions or gain recognized in bargain purchase transaction |
AMPI |
ASEEE |
USIPL |
FAFG |
ITGEU |
SER |
|||||||||||||||||||||||||||
NT$ |
NT$ |
NT$ |
NT$ |
NT$ |
US$ (Note 4) |
NT$ |
US$ (Note 4) |
|||||||||||||||||||||||||
| Consideration transferred |
$ | $ | $ | $ | $ | $ | $ | $ | ||||||||||||||||||||||||
| Add: Fair value of investments owned |
— | — | — | — | — | |||||||||||||||||||||||||||
| Add: Non-controlling interests |
— | — | — | — | ||||||||||||||||||||||||||||
| Less: Fair value of identifiable net assets acquired |
( |
) | ( |
) | ( |
) | ( |
) | ( |
) | ( |
) | ( |
) | ( |
) | ||||||||||||||||
| |
|
|
|
|
|
|
|
|
|
|
|
|
|
|
|
|||||||||||||||||
| Goodwill recognized on acquisition (gain recognized in bargain purchase transaction) |
$ | $ | $ | $ | $ | ( |
) | $ | ( |
) | $ | — | $ | — | ||||||||||||||||||
| |
|
|
|
|
|
|
|
|
|
|
|
|
|
|
|
|||||||||||||||||
The goodwill from acquisitions mainly represents the control premium. In addition, the consideration paid for acquisitions effectively included amounts attributed to the benefits of expected synergies, such as revenue growth and future market expansions. These benefits are not recognized separately from goodwill because they do not meet the recognition criteria for identifiable intangible assets.
The goodwill recognized on acquisitions is not expected to be deductible for tax purpose.
| f. | Net cash outflow (inflow) on acquisition of subsidiaries |
AMPI |
ASEEE |
USIPL |
FAFG |
ITGEU |
SER |
|||||||||||||||||||||||||||
NT$ |
NT$ |
NT$ |
NT$ |
NT$ |
US$ (Note 4) |
NT$ |
US$ (Note 4) |
|||||||||||||||||||||||||
| Consideration transferred |
$ | $ | — | $ | $ | $ | $ | $ | $ | |||||||||||||||||||||||
| Less: Cash and cash equivalent acquired |
( |
) | ( |
) | ( |
) | ( |
) | ( |
) | ( |
) | ( |
) | ( |
) | ||||||||||||||||
| |
|
|
|
|
|
|
|
|
|
|
|
|
|
|
|
|||||||||||||||||
| Net cash outflow (inflow) on acquisition of subsidiaries |
$ | ( |
) | $ | ( |
) | $ | $ | $ | ( |
) | $ | ( |
) | $ | $ | ||||||||||||||||
| |
|
|
|
|
|
|
|
|
|
|
|
|
|
|
|
|||||||||||||||||
F-104
| g. | Impact of acquisitions on the results of the Group |
The results of operations since the acquisition date were included in the consolidated statements of comprehensive income and were as follows:
AMPI (for the period from April 30, 2019 through December 31, 2019) |
ASEEE (for the period from April 26, 2019 through December 31, 2019) |
USIPL (for the period from October 31, 2019 through December 31, 2019) |
FAFG (for the period from December 1, 2020 through December 31, 2020) |
ITGEU (for the period from October 21, 2021 through December 31, 2021) |
SER (for the period from November 2, 2021 through December 31, 2021) |
|||||||||||||||||||||||||||
NT$ |
NT$ |
NT$ |
NT$ |
NT$ |
US$ (Note 4) |
NT$ |
US$ (Note 4) |
|||||||||||||||||||||||||
| Operating revenue |
$ | $ | ( |
) | $ | $ | $ | $ | $ | |
$ | |||||||||||||||||||||
| |
|
|
|
|
|
|
|
|
|
|
|
|
|
|
|
|||||||||||||||||
| Net profit (loss) |
$ | ( |
) | $ | ( |
) | $ | ( |
) | $ | $ | ( |
) | $ | ( |
) | $ | ( |
) | $ | ( |
) | ||||||||||
| |
|
|
|
|
|
|
|
|
|
|
|
|
|
|
|
|||||||||||||||||
Had the abovementioned
pro-forma
information is for illustrative purposes only and is not necessarily an indication of the operating revenue and results of operations of the Group that actually would have been achieved had the acquisition been completed at the beginning of each annual reporting period, nor is it intended to be a projection of future results. In determining the
pro-forma
operating revenue and profit for the period had each subsidiary been acquired at the beginning of each respective annual reporting period, the Group has calculated the depreciation of property, plant and equipment and the amortization of intangible assets acquired on the basis of the fair values at the initial accounting for the business combination rather than the carrying amounts recognized in the respective pre-acquisition
financial statements. | h. | As of December 31, 2021, the Group has completed the identification of the difference between the cost of the investment and the Group’s share of FAFG’s net fair value of identifiable assets and liabilities, and has retrospectively adjusted the comparative consolidated financial statements as of and for the year ended December 31, 2020. As of December 31, 2020, the retrospective adjustments are summarized as follows: |
December 31, 2020 |
||||||||
After Retrospectively Adjusted |
Before Retrospectively Adjusted |
|||||||
NT$ |
NT$ |
|||||||
| Consolidated balance sheet |
||||||||
| Inventories |
$ | $ | ||||||
| |
|
|
|
|||||
| Financial assets at fair value through profit or loss – non-current |
$ | $ | ||||||
| |
|
|
|
|||||
| Property, plant and equipment |
$ | $ | ||||||
| |
|
|
|
|||||
| Right-of-use |
$ | $ | ||||||
| |
|
|
|
|||||
| Goodwill |
$ | $ | ||||||
| |
|
|
|
|||||
| Other intangible assets |
$ | $ | ||||||
| |
|
|
|
|||||
| Deferred tax liabilities |
$ | $ | ||||||
| |
|
|
|
|||||
| Non-controlling interests |
$ | $ | ||||||
| |
|
|
|
|||||
30. |
DISPOSAL OF SUBSIDIARIES |
The board of directors of the Group’s subsidiary, SPIL (Cayman) Holding Limited, resolved in September 2020 to dispose its 100 % shareholdings in Siliconware Electronics (Fujian) Co., Limited (“SF”) to Shenzhen Hiwin System Limited with a consideration of RMB966,000 thousand. The disposal was completed in October 2020 and the control over SF
was transferred
to the acquirer. F-105
The board of directors of the Company resolved in December 2021 to dispose its 100 % shareholdings in GAPT Holding Limited
(including its subsidiaries) and ASEKS (collectively, “GAPT Holding and ASEKS”). The disposal was completed in December 2021 and the control over GAPT Holding and ASEKS was transferred to the acquirer.
| a. | Analysis of assets and liabilities on the date control was lost |
2020 |
2021 |
|||||||||||
SF |
GAPT Holding and ASEKS |
|||||||||||
NT$ |
NT$ |
US$ (Note 4) |
||||||||||
| Current Assets |
||||||||||||
| Cash and cash equivalent |
$ | $ | $ | |||||||||
| Trade and other receivables |
||||||||||||
| Inventories |
||||||||||||
| Other current assets |
||||||||||||
| Non-Current Assets |
||||||||||||
| Property, plant and equipment |
||||||||||||
| Right-of-use |
||||||||||||
| Investment property |
— | |||||||||||
| Goodwill |
— | |||||||||||
| Deferred tax assets |
||||||||||||
| Other non-current assets |
||||||||||||
| Current Liabilities |
||||||||||||
| Short-term borrowings |
— | ( |
) | ( |
) | |||||||
| Trade and other payables |
( |
) | ( |
) | ( |
) | ||||||
| Current portion of long-term borrowings |
( |
) | — | — | ||||||||
| Other current liabilities |
( |
) | ( |
) | ( |
) | ||||||
| Non-Current Liabilities |
||||||||||||
| Long-term borrowings |
( |
) | — | — | ||||||||
| Deferred tax liabilities |
( |
) | ( |
) | ( |
) | ||||||
| Lease liabilities – non-current |
— | ( |
) | ( |
) | |||||||
| Other non-current liabilities |
— | ( |
) | ( |
) | |||||||
| |
|
|
|
|
|
|||||||
| Net assets disposed of |
$ | $ | $ | |||||||||
| |
|
|
|
|
|
|||||||
F-106
| b. | Gain on disposal of subsidiaries |
2020 |
2021 |
|||||||||||
SF |
GAPT Holding and ASEKS |
|||||||||||
NT$ |
NT$ |
US$ (Note 4) |
||||||||||
| Total consideration (paid in cash) |
$ | $ | $ | |||||||||
| Net assets disposed of |
( |
) | ( |
) | ( |
) | ||||||
| Reclassification of accumulated exchange difference from equity to profit or loss due to the loss of control |
( |
) | ||||||||||
| |
|
|
|
|
|
|||||||
| Gain on dis posals |
$ | $ | $ | |||||||||
| |
|
|
|
|
|
|||||||
| c. | Net cash inflow on disposals of subsidiaries |
2020 |
2021 |
|||||||||||
SF |
GAPT Holding and ASEKS |
|||||||||||
NT$ |
NT$ |
US$ (Note 4) |
||||||||||
| Consideration received in cash and cash equivalents |
$ | $ | $ | |||||||||
| Less: Cash and cash equivalent balances disposed of |
( |
) | ( |
) | ( |
) | ||||||
| Other receivables (Note) (the outstanding receivables of consideration, net of relevant expenditure) |
( |
) | ( |
) | ( |
) | ||||||
| |
|
|
|
|
|
|||||||
| $ | $ | $ | ||||||||||
| |
|
|
|
|
|
|||||||
| Note: | The outstanding receivables for the disposal of SF had been fully received in 2021. |
31. |
EQUITY TRANSACTION WITH NON-CONTROLLING INTERESTS |
| a. | USISH |
USISH repurchased its own 13,037 thousand outstanding ordinary shares during year ended December 31, 2019 and, the Group’s shareholdings of USISH increased from 74.6 % to 77.7 %. The transaction was accounted for as an equity transaction since the Group did not cease to have control over USISH and capital surplus was decreased by NT$334,719 thousand.
as a resu
l
t,In September 2021, USISH repurchased its own 16,042 thousand outstanding ordinary shares at prices between RMB13.86 to RMB14.95 per share the Group’s shareholdings of USISH increased. The transaction was accounted for as an equity transaction since the Group did not cease to have control over USISH and, as a result, capital surplus and retained earnings were decreased by NT$11,277 thousand (US$407 thousand) and NT$436,927 thousand (US$15,751 thousand), respectively.
w
hich made| b. | USIPL |
In May 2020, the board of directors of Universal Global Electronics Co., Ltd. resolved to acquire 40 % shareholdings of USIPL from Chung Hong Electronics (Suzhou) Co., Ltd. at RMB24,500 thousand. The aforementioned transaction resulted the Group’s shareholdings in USIPL to increase from 60 % to 100 %, and such transactions were accounted for as an equity transaction since the Group did not cease to have control over USIPL. The Group recognized a decrease in capital surplus by NT$13,502 thousand in the second quarter of 2020.
F-107
| c. | USIE |
In July 2019, the shareholders’ meeting of USIE resolved to repurchase its own outstanding 7,378 thousand ordinary shares at US$14.30 per share, and, as a result, the Group’s shareholdings in USIE increased from 95.42 % to 98.72 %. The transaction was accounted for as an equity transaction since the transaction did not change the Group’s control over USIE and the Group capital surplus decreased by NT$1,625,448 thousand in 2019. In July 2019, the board of directors of USIE resolved July 23, 2019 was the record date for capital reduction and then the repurchased ordinary shares were subsequently cancelled.
In September 2020, the shareholders’ meeting of USIE resolved to repurchase its own outstanding 10,308 thousand ordinary shares at US$19.47 per share, and as a result, the Group’s shareholdings of USIE increased from 95.00 % to 99.62 %. The transaction was accounted for as an equity transaction since the transaction did not change the Group’s control over USIE and capital surplus and retained earnings were decreased by NT$780,533 thousand and NT$2,760,175 thousand, respectively, in the third quarter of 2020. In September 2020, the board of directors of USIE resolved September 15, 2020 was the record date for capital reduction and then the repurchased ordinary shares were subsequently cancelled.
In December 2021, the shareholders’ meeting of USIE resolved to repurchase its own outstanding 9,137 thousand ordinary shares at US$17.20 per share 95.85 % to 100.00 %. The transaction was accounted for as an equity transaction since the transaction did not change the Group’s control over USIE and capital surplus and retained earnings were decreased by NT$47,171 thousand (US$1,700 thousand) and NT$2,093,787 thousand (US$75,479 thousand), respectively, in the fourth quarter of 2021. In December 2021, the board of directors of USIE resolved
w
the Group’s shareholdings of USIE increased from hi
ch made
that
December 22, 2021 was the record date for capital reduction and the repurchased ordinary shares were subsequently cancelled. F-108
| d. | ASEN and SZ |
In July 2019, ASE’s board of directors resolved to acquire 30 % shareholdings of ASEN from Beijing Unis Capital Management Co., Ltd. at US$97,748 thousand by its subsidiary, JR Holding. In addition, in July 2019, SPIL’s board of directors also resolved to acquire 30 % shareholdings of SZ from Tibet Zixi Electronic Technology Co., Ltd. at US$162,870 thousand by its subsidiary, SPIL (Cayman) Holding Limited. The aforementioned transactions will result the Group’s shareholdings of ASEN and SZ both to increase from 70 % to 100 % and, therefore, both transactions will be accounted for as an equity transaction since the Group will not cease to have control over the subsidiaries. The Group recognized a decrease in capital surplus by NT$2,650,950 thousand in 2019.
| e. | Others |
In July 2018, UGTW’s board of directors approved to acquire the outstanding ordinary shares of USI at NT$18 per ordinary shares. In 2019, UGTW completed the acquisition and recognized an increase in capital surplus by NT$142 thousand.
As disclosed in Note 29, ASE purchased ASEEE’s ordinary shares through its capital increase in May 2019 and then repurchased all of ASEEE’s ordinary shares held by TDK in July 2019. As a result, the Group eventually held 100 % of ownership in ASEEE and capital surplus was decreased by NT$128,805 thousand.
F-109
32. |
CASH FLOW INFORMATION |
| a. | Non-cash investing activities |
In addition to other notes, the Group entered into the following investing activities which include both cash and
non-cash
items for the years ended December 31, 2019, 2020 and 2021: For the Year Ended December 31 |
||||||||||||||||
2019 |
2020 |
2021 |
||||||||||||||
NT$ |
NT$ |
NT$ |
US$ (Note 4) |
|||||||||||||
| Payments for property, plant and equipment |
||||||||||||||||
| Purchase of property, plant and equipment |
$ | $ | $ | $ | ||||||||||||
| Increase in other non-current assets |
||||||||||||||||
| Decrease (increase) in other payables |
( |
) | ( |
) | ( |
) | ||||||||||
| Capitalized borrowing costs |
( |
) | ( |
) | ( |
) | ( |
) | ||||||||
| |
|
|
|
|
|
|
|
|||||||||
| $ | $ | $ | $ | |||||||||||||
| |
|
|
|
|
|
|
|
|||||||||
| Proceeds from disposal of property, plant and equipment |
||||||||||||||||
| Consideration from disposal of property, plant and equipment |
$ | $ | $ | $ | ||||||||||||
| Increase in other non-current assets |
— | — | ( |
) | ( |
) | ||||||||||
| Increase (decrease) in other receivables |
( |
) | ||||||||||||||
| |
|
|
|
|
|
|
|
|||||||||
| $ | $ | $ | $ | |||||||||||||
| |
|
|
|
|
|
|
|
|||||||||
| Payments for other intangible assets |
||||||||||||||||
| Purchase of other intangible assets |
$ | $ | $ | $ | ||||||||||||
| Decrease in other payables |
— | — | — | |||||||||||||
| |
|
|
|
|
|
|
|
|||||||||
| $ | $ | $ | $ | |||||||||||||
| |
|
|
|
|
|
|
|
|||||||||
F-110
| b. | Changes in liabilities arising from financing activities |
| For the year ended December 31, 2019 |
Short-term Borrowings (including financial liabilities for hedging) |
Bonds Payable |
Long-term Borrowings |
Lease Liabilities |
Total |
||||||||||||||||
NT$ |
NT$ |
NT$ |
NT$ |
NT$ |
||||||||||||||||
| Balance at January 1, 2019 |
$ | $ | $ | $ | $ | |||||||||||||||
| Net financing cash flows |
( |
) | ( |
) | ||||||||||||||||
| Interest under operating activities |
— | — | — | |||||||||||||||||
| Non-cash changes |
||||||||||||||||||||
| Lease liabilities |
— | — | — | |||||||||||||||||
| Acquisition through business combinations (Note 29) |
||||||||||||||||||||
| Amortization of issuance cost |
— | — | ||||||||||||||||||
| Lease modifications |
— | — | — | ( |
) | ( |
) | |||||||||||||
| Short-term borrowings transferred to long-term borrowings |
( |
) | — | — | — | |||||||||||||||
| Effects of foreign currency exchange |
( |
) | — | ( |
) | ( |
) | ( |
) | |||||||||||
| |
|
|
|
|
|
|
|
|
|
|||||||||||
| Balance at December 31, 2019 |
$ | $ | $ | $ | $ | |||||||||||||||
| |
|
|
|
|
|
|
|
|
|
|||||||||||
F-111
| For the year ended December 31, 2020 |
Short-term Borrowings (including financial liabilities for hedging) |
Bonds Payable |
Long-term Borrowings |
Lease Liabilities |
Total |
||||||||||||||||
NT$ |
NT$ |
NT$ |
NT$ |
NT$ |
||||||||||||||||
| Balance at January 1, 2020 |
$ |
$ |
$ |
$ |
$ |
|||||||||||||||
| Net financing cash flows |
( |
) |
( |
) |
( |
) |
( |
) | ||||||||||||
| Interest under operating activities |
— |
— |
— |
|||||||||||||||||
| Rent expense under operating activities |
— |
— |
— |
( |
) |
( |
) | |||||||||||||
| Non-cash changes |
||||||||||||||||||||
| Lease liabilities |
— |
— |
— |
|||||||||||||||||
| Amortization of issuance cost |
— |
— |
||||||||||||||||||
| Lease modifications |
— |
— |
— |
( |
) |
( |
) | |||||||||||||
| Short-term borrowings transferred to long-term borrowings |
( |
) |
— |
— |
— |
|||||||||||||||
| Adjustments for government subsidy |
— |
— |
— |
|||||||||||||||||
| Acquisition of subsidiaries (Note 29) |
— |
— |
||||||||||||||||||
| Disposal of subsidiaries (Note 30) |
— |
— |
( |
) |
( |
) |
( |
) | ||||||||||||
| Effects of foreign currency exchange |
( |
) |
— |
( |
) |
( |
) |
( |
) | |||||||||||
| |
|
|
|
|
|
|
|
|
|
|||||||||||
| Balance at December 31, 2020 |
$ |
$ |
$ |
$ |
$ |
|||||||||||||||
| |
|
|
|
|
|
|
|
|
|
|||||||||||
| For the year ended December 31, 2021 |
Short-term Borrowings (including financial liabilities for hedging) |
Bonds Payable |
Long-term Borrowings (including financial liabilities for hedging) |
Lease Liabilities |
Total |
||||||||||||||||
NT$ |
NT$ |
NT$ |
NT$ |
NT$ |
||||||||||||||||
| Balance at January 1, 2021 |
$ |
$ |
$ |
$ |
$ |
|||||||||||||||
| Net financing cash flows |
( |
) |
( |
) |
||||||||||||||||
| Interest under operating activities |
— |
— |
— |
|||||||||||||||||
| Rent expense under operating activities |
— |
— |
— |
( |
) |
( |
) | |||||||||||||
| Convertible bonds classified separately as equity components and embedded derivative liability |
— |
( |
) |
— |
— |
( |
) | |||||||||||||
| Non-cash changes |
||||||||||||||||||||
| Lease liabilities |
— |
— |
— |
|||||||||||||||||
| Amortization of issuance cost |
— |
— |
||||||||||||||||||
| Convertible bonds issued by subsidiaries and converted to ordinary shares |
— |
( |
) |
— |
— |
( |
) | |||||||||||||
| Lease modifications |
— |
— |
— |
( |
) |
( |
) | |||||||||||||
| Acquisition of subsidiaries (Note 29) |
— |
— |
— |
|||||||||||||||||
| Disposal of subsidiaries (Note 30) |
( |
) |
— |
— |
( |
) |
( |
) | ||||||||||||
| Reclassification |
— |
— |
— |
|||||||||||||||||
| Effects of foreign currency exchange |
( |
) |
( |
) |
( |
) |
( |
) | ||||||||||||
| |
|
|
|
|
|
|
|
|
|
|||||||||||
| Balance at December 31, 2021 |
$ |
$ |
$ |
$ |
$ |
|||||||||||||||
| |
|
|
|
|
|
|
|
|
|
|||||||||||
Short-term Borrowings (including financial liabilities for hedging) |
Bonds Payable |
Long-term Borrowings (including financial liabilities for hedging) |
Lease Liabilities |
Total |
||||||||||||||||
US$ (Note 4) |
US$ (Note 4) |
US$ (Note 4) |
US$ (Note 4) |
US$ (Note 4) |
||||||||||||||||
| Balance at January 1, 2021 |
$ |
$ |
$ |
$ |
$ |
|||||||||||||||
| Net financing cash flows |
( |
) |
( |
) |
||||||||||||||||
| Interest under operating activities |
— |
— |
— |
|||||||||||||||||
| Rent expense under operating activities |
— |
— |
— |
( |
) |
( |
) | |||||||||||||
| Convertible bonds classified separately as equity components and embedded derivative liability |
— |
( |
) |
— |
— |
( |
) | |||||||||||||
| Non-cash changes |
||||||||||||||||||||
| Lease liabilities |
— |
— |
— |
|||||||||||||||||
| Amortization of issuance cost |
— |
— |
||||||||||||||||||
| Convertible bonds issued by subsidiaries and converted to ordinary shares |
— |
( |
) |
— |
— |
( |
) | |||||||||||||
| Lease modifications |
— |
— |
— |
( |
) |
( |
) | |||||||||||||
| Acquisition of subsidiaries (Note 29) |
— |
— |
— |
|||||||||||||||||
| Disposal of subsidiaries (Note 30) |
( |
) |
— |
— |
( |
) |
( |
) | ||||||||||||
| Reclassification |
— |
— |
— |
|||||||||||||||||
| Effects of foreign currency exchange |
( |
) |
( |
) |
( |
) |
( |
) | ||||||||||||
| |
|
|
|
|
|
|
|
|
|
|||||||||||
| Balance at December 31, 2021 |
$ |
$ |
$ |
$ |
$ |
|||||||||||||||
| |
|
|
|
|
|
|
|
|
|
|||||||||||
F-112
33. |
CAPITAL MANAGEMENT |
The capital structure of the Group consists of debt and equity. The Group manages its capital to ensure that entities in the Group will be able to continue as going concerns while maximizing the return to shareholders through the optimization of the debt and equity balance. Key management personnel of the Group periodically reviews the cost of capital and the risks associated with each class of capital. In order to balance the overall capital structure, the Group may adjust the amount of dividends paid to shareholders, the number of new shares issued or repurchased, and the amount of new debt issued or existing debt redeemed.
The Group is not subject to any externally imposed capital requirements except those discussed in Note 20.
34. |
FINANCIAL INSTRUMENTS |
| a. | Fair value of financial instruments that are not measured at fair value |
| 1) | Fair value of financial instruments not measured at fair value but for which fair value is disclosed |
Except bonds payable measured at amortized cost, the management considered that the carrying amounts of financial assets and financial liabilities not measured at fair value approximate their fair values. The carrying amounts and fair value of bonds payable as of December 31, 2020 and 2021 were as follows:
Carrying Amount |
Fair Value |
|||||||||||||||
NT$ |
US$ (Note 4) |
NT$ |
US$ (Note 4) |
|||||||||||||
| December 31, 2020 |
$ | $ | ||||||||||||||
| December 31, 2021 |
$ | $ | ||||||||||||||
| 2) | Fair value hierarchy |
The aforementioned fair value hierarchy of bonds payable was Level 3 which was determined based on discounted cash flow analysis with the applicable yield curve for the duration. The significant unobservable inputs is discount rates that reflected the credit risk.
F-113
| b. | Fair value of financial instruments that are measured at fair value on a recurring basis |
| 1) | Fair value hierarchy |
Level 1 |
Level 2 |
Level 3 |
Total |
|||||||||||||
NT$ |
NT$ |
NT$ |
NT$ |
|||||||||||||
| December 31, 2020 (retrospectively adjusted) |
||||||||||||||||
| Financial assets at FVTPL |
||||||||||||||||
| Derivative financial assets |
||||||||||||||||
| Forward exchange contracts |
$ | — | $ | $ | — | $ | ||||||||||
| Swap contracts |
— | — | ||||||||||||||
| Non-derivative financial assets |
||||||||||||||||
| Quoted ordinary shares |
— | — | ||||||||||||||
| Private-placement funds |
— | — | ||||||||||||||
| Contingent considerations |
— | — | ||||||||||||||
| Unquoted preferred shares |
— | — | ||||||||||||||
| Open-end mutual funds |
— | — | ||||||||||||||
| |
|
|
|
|
|
|
|
|||||||||
| $ | $ | $ | $ | |||||||||||||
| |
|
|
|
|
|
|
|
|||||||||
| Financial assets at FVTOCI |
||||||||||||||||
| Investments in equity instruments |
||||||||||||||||
| Unquoted ordinary shares |
$ | — | $ | — | $ | $ | ||||||||||
| Unquoted preferred shares |
— | — | ||||||||||||||
| Limited partnership |
— | — | ||||||||||||||
| Investments in debt instruments |
||||||||||||||||
| Unsecured subordinate corporate bonds |
— | — | ||||||||||||||
| Trade receivables, net |
— | — | ||||||||||||||
| |
|
|
|
|
|
|
|
|||||||||
| $ | — | $ | — | $ | $ | |||||||||||
| |
|
|
|
|
|
|
|
|||||||||
| Financial liabilities at FVTPL |
||||||||||||||||
| Derivative financial liabilities |
||||||||||||||||
| Swap contracts |
$ | — | $ | $ | — | $ | ||||||||||
| Target redemption forward contracts |
— | — | ||||||||||||||
| Forward exchange contracts |
— | — | ||||||||||||||
| |
|
|
|
|
|
|
|
|||||||||
| $ | — | $ | $ | — | $ | |||||||||||
| |
|
|
|
|
|
|
|
|||||||||
F-114
Level 1 |
Level 2 |
Level 3 |
Total |
|||||||||||||||||||||||||||||
NT$ |
US$ (Note 4) |
NT$ |
US$ (Note 4) |
NT$ |
US$ (Note 4) |
NT$ |
US$ (Note 4) |
|||||||||||||||||||||||||
| December 31, 2021 |
||||||||||||||||||||||||||||||||
| Financial assets at FVTPL |
||||||||||||||||||||||||||||||||
| Derivative financial assets |
||||||||||||||||||||||||||||||||
| Swap contracts |
$ | — | $ | — | $ | $ | $ | — | $ | — | $ | $ | ||||||||||||||||||||
| Forward exchange contracts |
— | — | — | — | ||||||||||||||||||||||||||||
| Redemption option and put option of convertible bonds |
— | — | — | — | ||||||||||||||||||||||||||||
| Target redemption forward contracts |
— | — | — | — | ||||||||||||||||||||||||||||
| Non-derivative financial assets |
||||||||||||||||||||||||||||||||
| Quoted ordinary shares |
— | — | — | — | ||||||||||||||||||||||||||||
| Private-placement funds |
— | — | — | — | ||||||||||||||||||||||||||||
| Unquoted preferred shares |
— | — | — | — | ||||||||||||||||||||||||||||
| Conti n gent considerations |
— | — | — | — | ||||||||||||||||||||||||||||
| Open-end mutual funds |
— | — | — | — | ||||||||||||||||||||||||||||
| |
|
|
|
|
|
|
|
|
|
|
|
|
|
|
|
|||||||||||||||||
| $ | $ | $ | $ | $ | $ | $ | $ | |||||||||||||||||||||||||
| |
|
|
|
|
|
|
|
|
|
|
|
|
|
|
|
|||||||||||||||||
| Financial assets at FVTOCI |
||||||||||||||||||||||||||||||||
| Investments in equity instruments |
||||||||||||||||||||||||||||||||
| Unquoted ordinary shares |
$ | — | $ | — | $ | — | $ | — | $ | $ | $ | $ | ||||||||||||||||||||
| Quoted ordinary shares |
— | — | — | — | ||||||||||||||||||||||||||||
| Unquoted preferred shares |
— | — | — | — | ||||||||||||||||||||||||||||
| Limited partnership |
— | — | — | — | ||||||||||||||||||||||||||||
| Investments in debt instruments |
||||||||||||||||||||||||||||||||
| Unsecured subordinate corporate bonds |
— | — | — | — | ||||||||||||||||||||||||||||
| Trade receivables, net |
— | — | — | — | ||||||||||||||||||||||||||||
| |
|
|
|
|
|
|
|
|
|
|
|
|
|
|
|
|||||||||||||||||
| $ | $ | $ | — | $ | — | $ | $ | $ | $ | |||||||||||||||||||||||
| |
|
|
|
|
|
|
|
|
|
|
|
|
|
|
|
|||||||||||||||||
| Financial liabilities at FVTPL |
||||||||||||||||||||||||||||||||
| Derivative financial liabilities |
||||||||||||||||||||||||||||||||
| Swap contracts |
$ | — | $ | — | $ | $ | $ | — | $ | — | $ | $ | ||||||||||||||||||||
| Forward exchange contracts |
— | — | — | — | ||||||||||||||||||||||||||||
| |
|
|
|
|
|
|
|
|
|
|
|
|
|
|
|
|||||||||||||||||
| $ | — | $ | — | $ | $ | $ | — | $ | — | $ | $ | |||||||||||||||||||||
| |
|
|
|
|
|
|
|
|
|
|
|
|
|
|
|
|||||||||||||||||
For the financial assets and liabilities that were measured at fair value on a recurring basis, there were no transfers between Level 1 and Level 2 of the fair value hierarchy during the years ended December 31, 2020 and 2021.
| 2) | Reconciliation of Level 3 fair value measurements of financial assets |
| For the year ended December 31, 2019 |
Financial Assets at FVTPL |
Financial Assets at FVTOCI |
|||||||||||||||
| Financial Assets |
Equity Instruments |
Equity Instruments |
Debt Instruments |
Total |
||||||||||||
NT$ |
NT$ |
NT$ |
NT$ |
|||||||||||||
| Balance at January 1 |
$ |
$ |
$ |
$ |
||||||||||||
| Recognized in profit or loss |
— |
— |
||||||||||||||
| Recognized in other comprehensive income |
||||||||||||||||
| Included in unrealized losses on financial assets at FVTOCI |
— |
( |
) |
( |
) |
( |
) | |||||||||
| Effects of foreign currency exchange |
( |
) |
( |
) |
— |
( |
) | |||||||||
| Net increase in trade receivables |
— |
— |
||||||||||||||
| Trade receivables factoring |
— |
— |
( |
) |
( |
) | ||||||||||
| Purchases |
— |
|||||||||||||||
| Disposals |
— |
( |
) |
— |
( |
) | ||||||||||
| |
|
|
|
|
|
|
|
|||||||||
| Balance at December 31 |
$ |
$ |
$ |
$ |
||||||||||||
| |
|
|
|
|
|
|
|
|||||||||
| For the year ended December 31, 2020 |
Financial Assets at FVTPL |
Financial Assets at FVTOCI |
|||||||||||||||||||
| Financial Assets |
Equity Instruments |
Debt Instruments |
Equity Instruments |
Debt Instruments |
Total |
|||||||||||||||
NT$ |
NT$ |
NT$ |
NT$ |
NT$ |
||||||||||||||||
| Balance at January 1 |
$ | $ | $ | $ | $ | |||||||||||||||
| Recognized in profit or loss |
( |
) | — | — | — | ( |
) | |||||||||||||
| Recognized in other comprehensive income |
||||||||||||||||||||
| Included in unrealized losses on financial assets at FVTOCI |
— | — | ( |
) | ( |
) | ( |
) | ||||||||||||
| Effects of foreign currency exchange |
( |
) | — | ( |
) | — | ( |
) | ||||||||||||
| Net increase in trade receivables |
— | — | ||||||||||||||||||
| Trade receivables factoring |
— | ( |
) | — | ( |
) | ( |
) | ||||||||||||
| Purchases |
— | — | ||||||||||||||||||
| Disposals |
( |
) | — | ( |
) | — | ( |
) | ||||||||||||
| Acquisition through business combinations |
— | — | — | |||||||||||||||||
| Exercise of call option |
( |
) | — | — | — | ( |
) | |||||||||||||
| |
|
|
|
|
|
|
|
|
|
|||||||||||
| Balance at December 31 (retrospectively adjusted) |
$ | $ | $ | $ | $ | |||||||||||||||
| |
|
|
|
|
|
|
|
|
|
|||||||||||
F-115
| For the year ended December 31, 2021 |
Financial Assets at FVTPL |
Financial Assets at FVTOCI |
|||||||||||||||||||
| Financial Assets |
Equity Instruments |
Debt Instruments |
Equity Instruments |
Debt Instruments |
Total |
|||||||||||||||
NT$ |
NT$ |
NT$ |
NT$ |
NT$ |
||||||||||||||||
| Balance at January 1 (retrospectively adjusted) |
$ |
$ |
$ |
$ |
$ |
|||||||||||||||
| Recognized in profit or loss |
— |
— |
— |
|||||||||||||||||
| Recognized in other comprehensive income |
||||||||||||||||||||
| Included in unrealized losses on financial assets at FVTOCI |
— |
— |
||||||||||||||||||
| Effects of foreign currency exchange |
( |
) |
— |
( |
) |
— |
( |
) | ||||||||||||
| Net increase in trade receivables |
— |
— |
||||||||||||||||||
| Trade receivables factoring |
— |
( |
) |
— |
( |
) |
( |
) | ||||||||||||
| Purchases |
— |
— |
||||||||||||||||||
| Disposals |
( |
) |
— |
( |
) |
— |
( |
) | ||||||||||||
| Reclassify |
— |
— |
( |
) |
— |
( |
) | |||||||||||||
| |
|
|
|
|
|
|
|
|
|
|||||||||||
| Balance at December 31 |
$ |
$ |
$ |
$ |
$ |
|||||||||||||||
| |
|
|
|
|
|
|
|
|
|
|||||||||||
Financial Assets at FVTPL |
Financial Assets at FVTOCI |
|||||||||||||||||||
| Financial Assets |
Equity Instruments |
Debt Instruments |
Equity Instruments |
Debt Instruments |
Total |
|||||||||||||||
| US$ (Note 4) |
US$ (Note 4) |
US$ (Note 4) |
US$ (Note 4) |
US$ (Note 4) |
||||||||||||||||
| Balance at January 1 (retrospect ively adjusted) |
$ |
$ |
$ |
$ |
$ |
|||||||||||||||
| Recognized in profit or loss |
— |
— |
— |
|||||||||||||||||
| Recognized in other comprehensive income |
||||||||||||||||||||
| Included in unrealized losses on financial assets at FVTOCI |
— |
— |
||||||||||||||||||
| Effects of foreign currency exchange |
( |
) |
— |
( |
) |
— |
( |
) | ||||||||||||
| Net increase in trade receivables |
— |
— |
||||||||||||||||||
| Trade receivables factoring |
— |
( |
) |
— |
( |
) |
( |
) | ||||||||||||
| Purchases |
— |
— |
||||||||||||||||||
| Disposals |
( |
) |
— |
( |
) |
— |
( |
) | ||||||||||||
| Reclassify |
— |
— |
( |
) |
— |
( |
) | |||||||||||||
| |
|
|
|
|
|
|
|
|
|
|||||||||||
| Balance at December 31 |
$ |
$ |
$ |
$ |
$ |
|||||||||||||||
| |
|
|
|
|
|
|
|
|
|
|||||||||||
| 3) | Valuation techniques and assumptions applied for the purpose of measuring fair value |
| a) | Valuation techniques and inputs applied for the purpose of measuring Level 2 fair value measurement |
| Financial Instruments |
Valuation Techniques and Inputs | |
| Derivatives - swap contracts and forward exchange contracts | Discounted cash flows - Future cash flows are estimated based on observable forward exchange rates at balance sheet dates and contract forward exchange rates, discounted at rates that reflected the credit risk of various counterparties. | |
| Derivatives - redemption option and put option of convertible bonds |
Option pricing models – Use of present value techniques and reflect the time value and intrinsic value of redemption option and put option. | |
| Target redemption forward contracts | Valuation based on the spot exchange rate on the valuation date, the exercise price, the volatility in exchange rate, the contract period and the quoted risk free interest rate during the contract period. | |
| b) | Valuation techniques and inputs applied for the purpose of measuring Level 3 fair value measurement |
F-116
The fair value of unquoted ordinary shares, unquoted preferred shares, limited partnership and private-placement funds were determined by using market approach and asset-based approach. The significant unobservable inputs were the discount rates for lack of marketability of 10 % to 30 %. If the discount rates for lack of marketability to the valuation model increased by 1 % to reflect reasonably possible alternative assumptions while all other variables held constant, the fair value of the abovementioned investments would have decreased approximately by NT$9,700 thousand and NT$19,300 thousand (US$696 thousand) as of December 31, 2020 and 2021, respectively.
The fair values of the unsecured subordinate corporate bonds were determined using income approach based on a discounted cash flow analysis. The significant unobservable input was the discount rate that reflects the credit risk of the counterparty. If the discount rate increased by 0.1 % while all other variables held constant, the fair value of the bonds would have decreased approximately by NT$5,000 thousand and NT$4,000 thousand (US$144 thousand) as of December 31, 2020 and 2021, respectively.
The fair value of accounts receivables measured at FVTOCI are determined based on the present value of future cash flows that reflect the credit risk of counterparties. Since the discount effect was not significant, the Group measured its fair value by using the nominal values.
The fair value of the contingent considerations were determined by using the Monte Carlo Simulation method. If the estimated net profit margin fails to reach the performance specified in the agreement, the Group could receive the contingent considerations according to the agreement, refer to Note 29 for business combinations.
| c. | Categories of financial instruments |
December 31 |
||||||||||||
2020 (Retrospectively Adjusted) |
2021 |
|||||||||||
NT$ |
NT$ |
US$ (Note 4) |
||||||||||
| Financial assets |
||||||||||||
| FVTPL |
||||||||||||
| Mandatorily at FVTPL |
$ | $ | $ | |||||||||
| Measured at amortized cost (Note 1) |
||||||||||||
| FVTOCI |
||||||||||||
| Equity instruments |
||||||||||||
| Debt instruments |
||||||||||||
| Trade receivables, net |
||||||||||||
| Financial liabilities |
||||||||||||
| FVTPL |
||||||||||||
| Held for trading |
||||||||||||
| Financial liabilities for hedging |
||||||||||||
| Measured at amortized cost (Note 2) |
||||||||||||
| Note 1: | The balances included financial assets measured at amortized cost which comprised cash and cash equivalents, trade and other receivables and other financial assets. |
| Note 2: | The balances included financial liabilities measured at amortized cost which comprised short-term borrowings, trade and other payables, bonds payable and long-term borrowings. |
| d. | Financial risk management objectives and policies |
F-117
The derivative instruments used by the Group were to mitigate risks arising from ordinary business operations. All derivative transactions entered into by the Group were designated as either hedging or trading. Derivative transactions entered into for hedging purposes must hedge risk against fluctuations in foreign exchange rates and interest rates arising from operating activities. The currencies and the amount of derivative instruments held by the Group must match its hedged assets and liabilities denominated in foreign currencies.
The Group’s risk management department monitored risks to mitigate risk exposures, reported unsettled position, transaction balances and related gains or losses to the Group’s chief financial officer on monthly basis.
| 1) | Market risk |
The Group’s activities exposed it primarily to the financial risks of changes in foreign currency exchange rates and interest rates. Gains or losses arising from fluctuations in foreign currency exchange rates of a variety of derivative financial instruments were approximately offset by those of hedged items. Interest rate risk was not significant due to the cost of capital was expected to be fixed.
There had been no change to the Group’s exposure to market risks or the manner in which these risks were managed and measured.
| a) | Foreign currency exchange rate risk |
The Group had sales and purchases as well as financing activities denominated in foreign currency which exposed the Group to foreign currency exchange rate risk. The Group entered into a variety of derivative financial instruments to hedge foreign currency exchange rate risk to minimize the fluctuations of assets and liabilities denominated in foreign currencies.
The carrying amounts of the Group’s foreign currency denominated monetary assets and liabilities (including those eliminated upon consolidation) as well as derivative instruments which exposed the Group to foreign currency exchange rate risk at each balance sheet date are presented in Note
39
. The Group was mainly subject to the impact from the exchange rate fluctuation in US$ and JPY against NT$, RMB or EUR. 1% fluctuation is used when reporting foreign currency exchange rate risk internally to key management personnel and represents management’s assessment of the reasonably possible change in foreign currency exchange rates. The sensitivity analysis included financial assets and liabilities and inter-company receivables and payables within the Group. The changes in profit before income tax due to a 1% change in US$ and JPY against NT$, RMB and EUR would be NT$82,000 thousand, NT$35,000 thousand and NT$38,000 thousand (US$1,370 thousand) for the years ended December 31, 2019, 2020 and 2021, respectively. Hedging contracts and hedged items have been taken into account while measuring the changes in profit before income tax. The abovementioned sensitivity analysis mainly focused on the foreign currency monetary items at each balance sheet date. As the
period-end
exposure did not reflect the exposure for the years ended December 31, 2019, 2020 and 2021, the abovementioned sensitivity analysis was unrepresentative of those respective years. | Hedge accounting |
The Group’s hedging strategy was to lift borrowings denominated in foreign currencies to avoid exchange rate exposure from its investments in equity instruments denominated in foreign currencies (recognized under the line item of financial assets at FVTPL) and net investment in foreign subsidiary, USIFR, which has EUR as its functional currency. Those transactions were designated as fair value hedges and a hedge of net investment in foreign operation, respectively. Hedge adjustments were made to totally offset the foreign exchange gains or losses from those equity instruments denominated in foreign currencies and foreign operations when they were evaluated based on the exchange rates on each balance sheet date.
F-118
The hedge ineffectiveness in these hedging relationships arose from the material difference between the notional amounts of borrowings denominated in foreign currencies and the original investments in equity instruments denominated in foreign currencies and net investment in foreign operations. No other sources of ineffectiveness is expected to emerge from these hedging relationships.
| December 31, 2020 |
| Hedging Instrument/Hedged Items |
Line item in |
Carrying Amount |
||||||||
| Balance sheet |
Asset |
Liability |
||||||||
NT$ |
NT$ |
|||||||||
| Fair value hedge |
||||||||||
| Borrowings denominated in foreign currencies/ Financial assets at FVTPL |
Financial liabilities for hedging - current | $ | $ | |||||||
| Hedge of net investment in foreign operation |
Financial liabilities for hedging - current | |||||||||
| Hedge of net investment in foreign operation |
Financial liabilities for hedging - non-current |
|||||||||
Change in Value Used for Calculating Hedge Ineffectiveness |
Accumulated Gains or Losses in Other Equity |
Carrying Amount of Hedged Item in Fair Value Hedge |
Accumulated Amount of Fair Value Hedge Adjustments on Hedged Item |
|||||||||||||||||||||
| Hedging Instrument/Hedged Item |
Hedging Instrument |
Hedged Item |
Continuing Hedges |
Hedge Accounting No Longer Applied |
Asset |
Asset |
||||||||||||||||||
NT$ |
NT$ |
NT$ |
NT$ |
NT$ |
NT$ |
|||||||||||||||||||
| Fair value hedge |
||||||||||||||||||||||||
| Borrowings denominated in foreign currencies/ Financial assets at FVTPL |
$ | |
$ | ( |
) | $ | — | $ | — | $ | |
$ | ( |
) | ||||||||||
| Hedge of net investment in foreign operation |
( |
) | ( |
) | — | — | — | |||||||||||||||||
| December 31, 2021 |
| Hedging Instrument/Hedged Items |
Line item in |
Carrying Amount |
||||||||||||||||
| Balance sheet |
Asset |
Liability |
||||||||||||||||
NT$ |
US$ (Note 4) |
NT$ |
US$ (Note 4) |
|||||||||||||||
| Fair value hedge |
||||||||||||||||||
| Borrowings denominated in foreign currencies/ Financial assets at FVTPL |
Financial liabilities for hedging - current | $ | $ | $ | $ | |||||||||||||
| Hedge of net investment in foreign operation |
Financial liabilities for hedging - current | |||||||||||||||||
| Hedge of net investment in foreign operation |
Financial liabilities for hedging - non-current |
|||||||||||||||||
Change in Value Used for Calculating Hedge Ineffectiveness |
Accumulated Gains or Losses in Other Equity |
Carrying Amount of Hedged Item in Fair Value Hedge |
Accumulated Amount of Fair Value Hedge Adjustments on Hedged Item |
|||||||||||||||||||||
| Hedging Instrument/Hedged Item |
Hedging Instrument |
Hedged Item |
Continuing Hedges |
Hedge Accounting No Longer Applied |
Asset |
Asset |
||||||||||||||||||
NT$ |
NT$ |
NT$ |
NT$ |
NT$ |
NT$ |
|||||||||||||||||||
| Fair value hedge |
||||||||||||||||||||||||
| Borrowings denominated in foreign currencies/ Financial assets at FVTPL |
$ | |
$ | ( |
$ | — | $ | — | $ | $ | ( |
|||||||||||||
| Hedge of net investment in foreign operation |
( |
) | — | — | — | |||||||||||||||||||
F-119
Change in Value Used for Calculating Hedge Ineffectiveness |
Accumulated Gains or Losses in Other Equity |
Carrying Amount of Hedged Item in Fair Value Hedge |
Accumulated Amount of Fair Value Hedge Adjustments on Hedged Item |
|||||||||||||||||||||
| Hedging Instrument/ Hedged Item |
Hedging Instrument |
Hedged Item |
Continuing Hedges |
Hedge Accounting No Longer Applied |
Asset |
Asset |
||||||||||||||||||
US$ (Note 4) |
US$ (Note 4) |
US$ (Note 4) |
US$ (Note 4) |
US$ (Note 4) |
US$ (Note 4) |
|||||||||||||||||||
| Fair value hedge |
||||||||||||||||||||||||
| Borrowings denominated in foreign currencies/ Financial assets at FVTPL |
$ | |
$ | ( |
) | $ | — | $ | — | $ | $ | ( |
) | |||||||||||
| Hedge of net investment in foreign operation |
( |
) | — | — | — | |||||||||||||||||||
| b) | Interest rate risk |
Except a portion of long-term borrowings and bonds payable at fixed interest rates, the Group was exposed to interest rate risk because group entities borrowed funds at floating interest rates. Changes in market interest rates led to variances in effective interest rates of borrowings from which the future cash flow fluctuations arise. The Group utilized financing instruments with low interest rates and favorable terms to maintain low financing cost, adequate banking facilities, as well as to hedge interest rate risk.
The carrying amounts of the Group’s financial assets and financial liabilities with exposure to interest rates at each balance sheet date were as follows:
December 31 |
||||||||||||
2020 |
2021 |
|||||||||||
NT$ |
NT$ |
US$ (Note 4) |
||||||||||
| Fair value interest rate risk |
||||||||||||
| Financial assets |
$ | $ | $ | |||||||||
| Financial liabilities |
||||||||||||
| Cash flow interest rate risk |
||||||||||||
| Financial assets |
||||||||||||
| Financial liabilities |
||||||||||||
For assets and liabilities with floating interest rates, a 100 basis point increase or decrease was used when reporting interest rate risk internally to key management personnel. If interest rates had been 100 basis points (1%) higher or lower and all other variables held constant, the Group’s profit before income tax for the years ended December 31, 2019, 2020 and 2021 would have decreased or increased approximately
by NT$
thousand, NT$
thousand and NT$
thousand (US$
thousand), respectively. Hedging contracts and hedged items have been taken into account while measuring the changes in profit before income tax. The abovementioned sensitivity analysis mainly focused on the interest rate items at the end of each year. As the
year-end
exposure did not reflect the exposure for the years ended December
31,
2019,
2020 and
2021, the abovementioned sensitivity analysis was unrepresentative of those respective periods.
| c) | Other price risk |
The Group was exposed to equity price risk through its investments in financial assets at FVTPL and financial assets at FVTOCI. If equity price was 1 % higher or lower, profit before income tax for the years ended December 31, 2019, 2020 and 2021 would have increased or decreased approximately by NT$51,000 thousand, NT$59,000 thousand and NT$49,000 thousand (US$1,766 thousand), respectively, and other comprehensive income before income tax for the years ended December 31, 2019, 2020 and 2021 would have increased or decreased approximately by NT$8,000 thousand, NT$7,000 thousand and NT$9,000 thousand (US$324 thousand), respectively.
F-120
| 2) | Credit risk |
Credit risk refers to the risk that counterparty will default on its contractual obligations resulting in financial loss to the Group. The Group’s credit risk arises from cash and cash equivalents, trade and other receivables and other financial assets. The Group’s maximum exposure to credit risk was the carrying amounts of financial assets in the consolidated balance sheets.
As of December 31, 2020 and 2021, the Group’s five largest customers accounted for 27 % and 33 % of trade receivables, respectively. The Group transacts with a large number of unrelated customers and, thus, no concentration of credit risk was observed.
| 3) | Liquidity risk |
The Group manages liquidity risk by maintaining adequate working capital and banking facilities to fulfill the demand for cash flow used in the Group’s operation and capital expenditure. The Group also monitors its compliance with all the loan covenants. Liquidity risk is not considered to be significant.
In the table below, financial liabilities with a repayment on demand clause were included in the earliest time band regardless of the probability of counter-parties choosing to exercise their rights. The maturity dates for other
non-derivative
financial liabilities were based on the agreed repayment dates. To the extent that interest flows are floating rate, the undiscounted amounts were derived from the interest rates at each balance sheet date.
| December 31, 2020 |
On Demand or Less than 1 Month |
1 to 3 Months |
3 Months to 1 Year |
1 to 5 Years |
More than 5 Years |
||||||||||||||||
NT$ |
NT$ |
NT$ |
NT$ |
NT$ |
||||||||||||||||
| Non-derivative financial liabilities |
||||||||||||||||||||
| Non-interest bearing |
$ | $ | $ | $ | $ | |||||||||||||||
| Obligation under leases |
||||||||||||||||||||
| Floating interest rate liabilities |
||||||||||||||||||||
| Fixed interest rate liabilities |
||||||||||||||||||||
| |
|
|
|
|
|
|
|
|
|
|||||||||||
| $ | $ | $ | $ | $ | ||||||||||||||||
| |
|
|
|
|
|
|
|
|
|
|||||||||||
Further information for maturity analysis of obligation under leases was as follows:
Less than 1 Year |
1 to 5 Years |
5 to 10 Years |
10 to 15 Years |
15 to 20 Years |
More than 20 Years |
|||||||||||||||||||
NT$ |
NT$ |
NT$ |
NT$ |
NT$ |
NT$ |
|||||||||||||||||||
| Obligation under leases |
$ | $ | $ | $ | $ | $ | ||||||||||||||||||
| |
|
|
|
|
|
|
|
|
|
|
|
|||||||||||||
F-121
| December 31, 2021 |
On Demand or Less than 1 Month |
1 to 3 Months |
3 Months to 1 Year |
1 to 5 Years |
More than 5 Years |
||||||||||||||||
NT$ |
NT$ |
NT$ |
NT$ |
NT$ |
||||||||||||||||
| Non-derivative financial liabilities |
||||||||||||||||||||
| Non-interest bearing |
$ | $ | $ | $ | $ | |||||||||||||||
| Obligation under leases |
||||||||||||||||||||
| Floating interest rate liabilities |
||||||||||||||||||||
| Fixed interest rate liabilities |
||||||||||||||||||||
| |
|
|
|
|
|
|
|
|
|
|||||||||||
| $ | $ | $ | $ | $ | ||||||||||||||||
| |
|
|
|
|
|
|
|
|
|
|||||||||||
On Demand or Less than 1 Month |
1 to 3 Months |
3 Months to 1 Year |
1 to 5 Years |
More than 5 Years |
||||||||||||||||
US$ (Note 4) |
US$ (Note 4) |
US$ (Note 4) |
US$ (Note 4) |
US$ (Note 4) |
||||||||||||||||
| Non-derivative financial liabilities |
||||||||||||||||||||
| Non-interest bearing |
$ | $ | $ | $ | $ | |||||||||||||||
| Obligation under leases |
||||||||||||||||||||
| Floating interest rate liabilities |
||||||||||||||||||||
| Fixed interest rate liabilities |
||||||||||||||||||||
| |
|
|
|
|
|
|
|
|
|
|||||||||||
| $ | $ | $ | $ | $ | ||||||||||||||||
| |
|
|
|
|
|
|
|
|
|
|||||||||||
Further information for maturity analysis of obligation under leases was as follows:
Less than 1 Year |
1 to 5 Years |
5 to 10 Years |
10 to 15 Years |
15 to 20 Years |
More than 20 Years |
|||||||||||||||||||
NT$ |
NT$ |
NT$ |
NT$ |
NT$ |
NT$ |
|||||||||||||||||||
| Obligation under leases |
$ |
$ |
$ |
$ |
$ |
$ |
||||||||||||||||||
| |
|
|
|
|
|
|
|
|
|
|
|
|||||||||||||
Less than 1 Year |
1 to 5 Years |
5 to 10 Years |
10 to 15 Years |
15 to 20 Years |
More than 20 Years |
|||||||||||||||||||
US$ (Note 4) |
US$ (Note 4) |
US$ (Note 4) |
US$ (Note 4) |
US$ (Note 4) |
US$ (Note 4) |
|||||||||||||||||||
| Obligation under leases |
$ |
$ |
$ |
$ |
$ |
$ |
||||||||||||||||||
| |
|
|
|
|
|
|
|
|
|
|
|
|||||||||||||
The amounts included above for floating interest rate instruments for
non-derivative
financial liabilities were subject to change if changes in floating interest rates differ from those estimates of interest rates determined at each balance sheet date. The following table detailed the Group’s liquidity analysis for its derivative financial instruments. The table was based on the undiscounted contractual net cash inflows and outflows on derivative instruments settled on a net basis, and the undiscounted gross cash inflows and outflows on those derivatives that require gross settlement. When the amounts payable or receivable are not fixed, the amounts disclosed have been determined by reference to the projected interest rates as illustrated by the yield curves at each balance sheet date.
F-122
On Demand or Less than 1 Month |
1 to 3 Months |
3 Months to 1 Year |
More than 1 Year |
|||||||||||||
NT$ |
NT$ |
NT$ |
||||||||||||||
| December 31, 2020 |
||||||||||||||||
| Net settled |
||||||||||||||||
| Forward exchange contracts |
$ | $ | $ | — | $ | — | ||||||||||
| |
|
|
|
|
|
|
|
|||||||||
| Gross settled |
||||||||||||||||
| Forward exchange contracts |
||||||||||||||||
| Inflows |
$ | $ | $ | $ | — | |||||||||||
| Outflows |
( |
) | ( |
) | ( |
) | — | |||||||||
| |
|
|
|
|
|
|
|
|||||||||
| — | ||||||||||||||||
| |
|
|
|
|
|
|
|
|||||||||
| Swap contracts |
||||||||||||||||
| Inflows |
— | |||||||||||||||
| Outflows |
( |
) | ( |
) | ( |
) | — | |||||||||
| |
|
|
|
|
|
|
|
|||||||||
| ( |
) | ( |
) | ( |
) | — | ||||||||||
| |
|
|
|
|
|
|
|
|||||||||
| Target redemption forward contracts |
||||||||||||||||
| Inflows |
||||||||||||||||
| Outflows |
( |
) | ( |
) | ( |
) | ( |
) | ||||||||
| |
|
|
|
|
|
|
|
|||||||||
| ( |
) | ( |
) | ( |
) | ( |
) | |||||||||
| |
|
|
|
|
|
|
|
|||||||||
| $ | ( |
) | $ | ( |
) | $ | ( |
) | $ | ( |
) | |||||
| |
|
|
|
|
|
|
|
|||||||||
F-123
On Demand or Less than 1 Month |
1 to 3 Months |
3 Months to 1 Year |
||||||||||
NT$ |
NT$ |
NT$ |
||||||||||
| December 31, 2021 |
||||||||||||
| Net settled |
||||||||||||
| Forward exchange contracts |
$ | ( |
) | $ | ( |
) | $ | |||||
| |
|
|
|
|
|
|||||||
| Gross settled |
||||||||||||
| Forward exchange contracts |
||||||||||||
| Inflows |
$ | $ | $ | |||||||||
| Outflows |
( |
) | ( |
) | ( |
) | ||||||
| |
|
|
|
|
|
|||||||
| |
|
|
|
|
|
|||||||
| Swap contracts |
||||||||||||
| Inflows |
||||||||||||
| Outflows |
( |
) | ( |
) | ( |
) | ||||||
| |
|
|
|
|
|
|||||||
| ( |
) | ( |
) | ( |
) | |||||||
| |
|
|
|
|
|
|||||||
| Target redemption forward contracts |
||||||||||||
| Inflows |
||||||||||||
| Outflows |
( |
) | ( |
) | ( |
) | ||||||
| |
|
|
|
|
|
|||||||
| |
|
|
|
|
|
|||||||
| $ | ( |
) | $ | ( |
) | $ | ( |
) | ||||
| |
|
|
|
|
|
|||||||
On Demand or Less than 1 Month |
1 to 3 Months |
3 Months to 1 Year |
||||||||||
US$ (Note 4) |
US$ (Note 4) |
US$ (Note 4) |
||||||||||
| December 31, 2021 |
||||||||||||
| Net settled |
||||||||||||
| Forward exchange contracts |
$ | ( |
) | $ | ( |
) | $ | |||||
| |
|
|
|
|
|
|||||||
| Gross settled |
||||||||||||
| Forward exchange contracts |
||||||||||||
| Inflows |
$ | $ | $ | |||||||||
| Outflows |
( |
) | ( |
) | ( |
) | ||||||
| |
|
|
|
|
|
|||||||
| |
|
|
|
|
|
|||||||
| Swap contracts |
||||||||||||
| Inflows |
||||||||||||
| Outflows |
( |
) | ( |
) | ( |
) | ||||||
| |
|
|
|
|
|
|||||||
| ( |
) | ( |
) | ( |
) | |||||||
| |
|
|
|
|
|
|||||||
| Target redemption forward contracts |
||||||||||||
| Inflows |
||||||||||||
| Outflows |
( |
) | ( |
) | ( |
) | ||||||
| |
|
|
|
|
|
|||||||
| |
|
|
|
|
|
|||||||
| $ | ( |
) | $ | ( |
) | $ | ( |
) | ||||
| |
|
|
|
|
|
|||||||
35. |
RELATED PARTY TRANSACTIONS |
Balances and transactions within the Group had been eliminated upon consolidation. Details of transactions between the Group and other related parties were disclosed as follows:
| a. | Related parties |
In addition to those disclosed in Note 14, the related parties were as follows:
| Name of Related Party |
Relationship with the Company | |
| ASE Cultural and Educational Foundation |
Substantial related party | |
| ASE Environmental Protection and Sustainability Foundation |
Substantial related party | |
| b. | Contribution of related party |
For the Year Ended December 31 |
||||||||||||||||
| Relationship and Name of Related Party |
2019 |
2020 |
2021 |
|||||||||||||
NT$ |
NT$ |
NT$ |
US$ (Note 4) |
|||||||||||||
| Substantial related party |
||||||||||||||||
| ASE Cultural and Educational Foundation |
$ | $ | — | $ | $ | |||||||||||
| ASE Environmental Protection and Sustainability Foundation |
||||||||||||||||
| |
|
|
|
|
|
|
|
|||||||||
| $ | $ | $ | $ | |||||||||||||
| |
|
|
|
|
|
|
|
|||||||||
| c. | In 2019, the subsidiary, ASE, purchased real estate properties from associates, HC, with the amount of NT$ had been fully paid in September 2019. |
| d. | ASE and HC entered into a joint development agreement in June 2020 under the concept of joint construction. The agreement stipulates that HC will build the plant on the leasehold land and ASE and its affiliates will have the priority to purchase the plant after the completion of the plant construction. The final transaction price will be the purchase price less an amount based on the ratio calculated by independent professional appraisers. |
F-125
| e. | In the third quarter of 2021, ASE purchased real estate properties from HC had been fully paid. |
f. |
The subsidiaries, ASE and ASEE, separately entered into a joint construction and allocation of housing units agreement with HC in August 2021. The agreement stipulates that ASE and ASEE will provide land or leasehold land and fund to HC for plant construction and to allocate those housing units based on the independent professional appraisal reports. After the completion of the plant construction, ASE, ASEE and its affiliates will have the priority to purchase the plant. |
| g. | As disclosed in Note 31, USIE repurchased its own |
F-126
| h. | Compensation to key management personnel |
For the Year Ended December 31 |
||||||||||||||||
2019 |
2020 |
2021 |
||||||||||||||
NT$ |
NT$ |
NT$ |
US$ (Note 4) |
|||||||||||||
| Short-term employee benefits |
$ | $ | $ | $ | ||||||||||||
| Post-employment benefits |
||||||||||||||||
| Share-based payments |
||||||||||||||||
| |
|
|
|
|
|
|
|
|||||||||
| $ | $ | $ | $ | |||||||||||||
| |
|
|
|
|
|
|
|
|||||||||
The compensation to the Group’s key management personnel was determined according to personal performance and market trends.
36. |
ASSETS PLEDGED AS COLLATERAL OR FOR SECURITY |
The following assets were provided as collateral for bank borrowings, tariff guarantees of imported raw materials or collateral:
December 31 |
||||||||||||
2020 |
2021 |
|||||||||||
NT$ |
NT$ |
US$ (Note 4) |
||||||||||
| Inventories related to real estate business |
$ | $ | $ | |||||||||
| Property, plant and equipment |
||||||||||||
| Investment properties |
||||||||||||
| Other financial assets (including current and non-current) |
||||||||||||
| |
|
|
|
|
|
|||||||
| $ | $ | $ | ||||||||||
| |
|
|
|
|
|
|||||||
In addition to the abovementioned assets, 89.6 % of shareholdings in FAFG was provided as collateral for syndicated bank loans as of December 31, 2020.
37. |
SIGNIFICANT CONTINGENT LIABILITIES AND UNRECOGNIZED COMMITMENTS |
In addition to those disclosed in other notes, significant commitments and contingencies of the Group as of each balance sheet date were as follows:
| a. | As of December 31, 2020 and 2021, unused letters of credit of the Group were approximately NT$ |
| b. | As of December 31, 2020 and 2021, letters of bank guarantee provided to customs for the impo of goodsrt and export with b facilities granted to the Group were approximately NT$ank |
| c. | As of December 31, 2020 and 2021, the Group’s commitments to purchase property, plant and equipment were approximately NT$ |
| d. | The Group entered into long-term purchase agreements of materials and supplies with multiple suppliers. The relative minimum purchase quantity is specified in the agreements. |
| e. | The Group entered into long-term agreements with multiple customers. The relative minimum order quantity to customers and minimum purchase quantity of materials from suppliers are specified in the agreements. |
F-127
| f. | In December 2021, in consideration of corporate social responsibility, the board of directors resolved the disbursements of NT$thousand) to ASE Cultural and Educational Foundation for promoting the cultural and educational activities to discharge the Group’s social responsibilities. |
| g. | In December 2013, in consideration of corporate social responsibility for environmental protection, the board of directors of ASE, approved the contributions of at least NT$ |
38. |
OTHERS |
| a. | There were five employees and a waste disposal supplier of a subsidiary in China accused by China People’s Procuratorate (the “Procuratorate”) for committing the crime of environmental pollution in 2018. During the trial, the Procuratorate claimed that the subsidiary should also be charged with corporate crime which caused the subsidiary received a change and addition indictment in October 20 19 . In June 2020, in the first trial, the court of first instance ruled that the subsidiary shall be imposed a fine of RMBco-defendants have filed an appeal against the judgment and, pursuant to local applicable law, the whole case will be deemed appealed. This case was denied by the court of second instance, which affirmed the judgment of the first instance, on April 7, 2021. The case was concluded. |
| b. | On December 20, 2013, the Kaohsiung Environmental Protection Bureau (the “KEPB”) imposed an administrative fine of NT$ 19 , KEPB has refunded NT$re-imposed an administrative fine of NT$ |
39 . |
SIGNIFICANT ASSETS AND LIABILITIES DENOMINATED IN FOREIGN CURRENCIES |
The following information was aggregated by the foreign currencies other than functional currencies of the group entities and the exchange rates between foreign currencies and respective functional currencies were disclosed. The significant financial assets and liabilities denominated in foreign currencies were as follows:
F-128
Foreign Currencies (In Thousand) |
Exchange Rate |
Carrying Amount (In Thousand) |
||||||||||
| December 31, 2020 |
||||||||||||
| Monetary financial assets |
||||||||||||
| US$ |
$ | $ | ||||||||||
| US$ |
||||||||||||
| US$ |
||||||||||||
| JPY |
||||||||||||
| JPY |
||||||||||||
| HKD |
||||||||||||
| Monetary financial liabilities |
||||||||||||
| US$ |
||||||||||||
| US$ |
||||||||||||
| US$ |
||||||||||||
| JPY |
||||||||||||
| JPY |
||||||||||||
| HKD |
||||||||||||
| December 31, 2021 |
||||||||||||
| Monetary financial assets |
||||||||||||
| US$ |
||||||||||||
| US$ |
||||||||||||
| US$ |
||||||||||||
| JPY |
||||||||||||
| JPY |
||||||||||||
| Monetary financial liabilities |
||||||||||||
| US$ |
||||||||||||
| US$ |
||||||||||||
| US$ |
||||||||||||
| JPY |
||||||||||||
| JPY |
||||||||||||
The significant realized and unrealized foreign exchange gain (loss) were as follows:
| For the Year Ended December 31 |
||||||||||||||||||||||
| 2019 |
2020 |
2021 |
||||||||||||||||||||
| Functional Currencies |
Exchange Rate |
Net Foreign Exchange Gain (Loss) |
Exchange Rate |
Net Foreign Exchange Gain (Loss) |
Exchange Rate |
Net Foreign Exchange Gain (Loss) |
||||||||||||||||
NT$ |
NT$ |
NT$ |
US$ (Note 4) |
|||||||||||||||||||
| US$ |
$ | ( |
) | $ | ( |
) | $ | $ | ||||||||||||||
| NT$ |
||||||||||||||||||||||
| RMB |
( |
) | ( |
) | ( |
) | ||||||||||||||||
| |
|
|
|
|
|
|
|
|||||||||||||||
| $ | $ | $ | $ | |||||||||||||||||||
| |
|
|
|
|
|
|
|
|||||||||||||||
4 0 . |
OPERATING SEGMENTS INFORMATION |
The Group has the following reportable segments: Packaging, Testing and EMS. The Group packages bare semiconductors into finished semiconductors with enhanced electrical and thermal characteristics; provides testing services, including
front-end
engineering testing, wafer probing and final testing services; engages in the designing, assembling, manufacturing and sale of electronic components and telecommunications equipment motherboards. Information about other business activities and operating segments that are not reportable are combined and disclosed in “Others.” The Group engages in other activities such as substrate production as well as sale and leasing of real estate properties. F-129
The accounting policies for segments are the same as those described in Note 4. The measurement basis for resources allocation and performance evaluation is based on profit before income tax.
| a. | Segment revenues and operation results |
Adjustments |
||||||||||||||||||||||||
Packaging |
Testing |
EMS |
Others |
and Eliminations |
Total |
|||||||||||||||||||
NT$ |
NT$ |
NT$ |
NT$ |
NT$ |
NT$ |
|||||||||||||||||||
| For the year ended December 31, 2019 |
||||||||||||||||||||||||
| Revenue from external customers |
$ |
$ |
$ |
$ |
$ |
— |
$ |
|||||||||||||||||
| Inter-group revenues (Note 1) |
( |
) |
— |
|||||||||||||||||||||
| Segment revenues |
— |
|||||||||||||||||||||||
| Interest income |
( |
) |
||||||||||||||||||||||
| Interest expense |
( |
) |
( |
) |
( |
) |
( |
) |
( |
) | ||||||||||||||
| Depreciation and amortization |
( |
) |
( |
) |
( |
) |
( |
) |
— |
( |
) | |||||||||||||
| Share of the profit or loss of associates and joint ventures |
— |
— |
||||||||||||||||||||||
| Impairment loss |
( |
) |
( |
) |
— |
— |
— |
( |
) | |||||||||||||||
| Segment profit before income tax |
( |
) |
— |
|||||||||||||||||||||
| Expenditures for segment assets |
— |
|||||||||||||||||||||||
| December 31, 2019 |
||||||||||||||||||||||||
| Investments accounted for using the equity method |
— |
— |
||||||||||||||||||||||
| Contract assets |
— |
— |
— |
|||||||||||||||||||||
| For the year ended December 31, 2020 |
||||||||||||||||||||||||
| Revenue from external customers |
— |
|||||||||||||||||||||||
| Inter-group revenues (Note 1) |
( |
) |
— |
|||||||||||||||||||||
| Segment revenues |
— |
|||||||||||||||||||||||
| Interest income |
— |
|||||||||||||||||||||||
| Interest expense |
( |
) |
( |
) |
( |
) |
( |
) |
— |
( |
) | |||||||||||||
| Depreciation and amortization |
( |
) |
( |
) |
( |
) |
( |
) |
— |
( |
) | |||||||||||||
| Share of the profit or loss of associates and joint ventures |
— |
— |
||||||||||||||||||||||
| Impairment loss |
( |
) |
( |
) |
— |
— |
— |
( |
) | |||||||||||||||
| Segment profit before income tax |
( |
) |
— |
|||||||||||||||||||||
| Expenditures for segment assets |
— |
|||||||||||||||||||||||
| December 31, 2020 |
||||||||||||||||||||||||
| Investments accounted for using the equity method |
— |
— |
||||||||||||||||||||||
| Contract assets |
— |
— |
— |
|||||||||||||||||||||
| For the year ended December 31, 2021 |
||||||||||||||||||||||||
| Revenue from external customers |
— |
|||||||||||||||||||||||
| Inter-group revenues (Note 1) |
( |
) |
||||||||||||||||||||||
| Segment revenues |
— |
|||||||||||||||||||||||
| Interest income |
— |
|||||||||||||||||||||||
| Interest expense |
( |
) |
( |
) |
( |
) |
( |
) |
— |
( |
) | |||||||||||||
| Depreciation and amortization |
( |
) |
( |
) |
( |
) |
( |
) |
— |
( |
) | |||||||||||||
| Share of the profit or loss of associates and joint ventures |
— |
— |
||||||||||||||||||||||
| Impairment loss |
( |
) |
( |
) |
— |
— |
— |
( |
) | |||||||||||||||
| Segment profit before income tax |
— |
|||||||||||||||||||||||
| Expenditures for segment assets |
— |
|||||||||||||||||||||||
| December 31, 2021 |
||||||||||||||||||||||||
| Investments accounted for using the equity method |
— |
— |
||||||||||||||||||||||
| Contract assets |
— |
— |
— |
|||||||||||||||||||||
Adjustments |
||||||||||||||||||||||||
Packaging |
Testing |
EMS |
Others |
and Eliminations |
Total |
|||||||||||||||||||
US$ (Note 4) |
US$ (Note 4) |
US$ (Note 4) |
US$ (Note 4) |
US$ (Note 4) |
US$ (Note 4) |
|||||||||||||||||||
| For the year ended December 31, 2021 |
||||||||||||||||||||||||
| Revenue from external customers |
$ |
$ |
$ |
$ |
$ |
— |
$ |
|||||||||||||||||
| Inter-group revenues (Note 1) |
( |
) |
— |
|||||||||||||||||||||
| Segment revenues |
— |
|||||||||||||||||||||||
| Interest income |
— |
|||||||||||||||||||||||
| Interest expense |
( |
) |
( |
) |
( |
) |
( |
) |
— |
( |
) | |||||||||||||
| Depreciation and amortization |
( |
) |
( |
) |
( |
) |
( |
) |
— |
( |
) | |||||||||||||
| Share of the profit or loss of associates and joint ventures |
— |
— |
||||||||||||||||||||||
| Impairment loss |
( |
) | ( |
) |
— |
— |
— |
( |
) | |||||||||||||||
| Segment profit before income tax |
— |
|||||||||||||||||||||||
| Expenditures for segment assets |
— |
|||||||||||||||||||||||
| December 31, 2021 |
||||||||||||||||||||||||
| Investments accounted for using the equity method |
— |
— |
||||||||||||||||||||||
| Contract assets |
— |
— |
— |
|||||||||||||||||||||
Note 1: Inter-group revenues were eliminated upon consolidation.
F-130
| Note 2: | The disaggregated product and service type from the Group’s contract with customer is the same as those disclosed in above reportable segment. |
| b. | Revenue from major products and services |
For the Year Ended December 31 |
||||||||||||||||
2019 |
2020 |
2021 |
||||||||||||||
NT$ |
NT$ |
NT$ |
US$ (Note 4) |
|||||||||||||
| Packaging service |
$ | $ | $ | $ | ||||||||||||
| Testing service |
||||||||||||||||
| EMS |
||||||||||||||||
| Others |
||||||||||||||||
| |
|
|
|
|
|
|
|
|||||||||
| $ | $ | $ | $ | |||||||||||||
| |
|
|
|
|
|
|
|
|||||||||
| c. | Geographical information |
The Group’s revenue from external customers by location of headquarter and information about its
non-current
assets by location of assets are detailed below. | 1) | Net revenues from external customers |
For the Year Ended December 31 |
||||||||||||||||
2019 |
2020 |
2021 |
||||||||||||||
NT$ |
NT$ |
NT$ |
US$ (Note 4) |
|||||||||||||
| United States |
$ | $ | $ | $ | ||||||||||||
| Taiwan |
||||||||||||||||
| Asia |
||||||||||||||||
| Europe |
||||||||||||||||
| Others |
||||||||||||||||
| |
|
|
|
|
|
|
|
|||||||||
| $ | $ | $ | $ | |||||||||||||
| |
|
|
|
|
|
|
|
|||||||||
| 2) | Non-current assets |
December 31 |
||||||||||||
2020 (Retrospectively Adjusted) |
2021 |
|||||||||||
NT$ |
NT$ |
US$ (Note 4) |
||||||||||
| Taiwan |
$ | $ | $ | |||||||||
| China |
||||||||||||
| Others |
||||||||||||
| |
|
|
|
|
|
|||||||
| $ | $ | $ | ||||||||||
| |
|
|
|
|
|
|||||||
Non-current
assets exclude financial instruments, post-employment benefit assets, and deferred tax assets. | d. | Major customers |
Except customer A from which the operating revenues generated from packaging and EMS segments were
NT$103,987,781
NT$145,952,908 thousand and NT$158,624,032 thousand (US$5,718,242 thousand) for the years ended December 31, 2019, 2020 and 2021, respectively, and customer B from which the operating revenues generated from packaging and testing segments was NT$44,653,072 thousand for the year ended December 31, 2019, the Group did not have any other individual customer from which the operating revenues exceeded 10% of operating revenues for the years ended December 31, 2019, 2020 and 2021.
F-13
1
TABLE OF CONTENTS
Part IItem 1. Identity Of Directors, Senior Management and AdvisersItem 2. Offer Statistics and Expected TimetableItem 3. Key InformationItem 4. Information on The CompanyItem 4A. Unresolved Staff CommentsItem 5. Operating and Financial Review and ProspectsItem 6. Directors, Senior Management and EmployeesItem 7. Major Shareholders and Related Party TransactionsItem 8. Financial InformationItem 9. The Offer and ListingItem 10. Additional InformationItem 11. Quantitative and Qualitative Disclosures About Market RiskItem 12. Description Of Securities Other Than Equity SecuritiesPart IIItem 13. Defaults, Dividend Arrearages and DelinquenciesItem 14. Material Modifications To The Rights Of Security Holders and Use Of ProceedsItem 15. Controls and ProceduresItem 16. ReservedItem 16A. Audit Committee Financial ExpertItem 16B. Code Of EthicsItem 16C. Principal Accountant Fees and ServicesItem 16D. Exemptions From The Listing Standards For Audit CommitteesItem 16E. Purchases Of Equity Securities By The Issuer and Affiliated PurchasersItem 16F. Change in Registrant S Certifying AccountantItem 16G. Corporate GovernanceItem 16H. Mine Safety DisclosureItem 16I. Disclosure Regarding Foreign Jurisdictions That Prevent InspectionsPart IIIItem 17. Financial StatementsItem 18. Financial StatementsItem 19. ExhibitsNote 6: The Amendments Will Be Applied Prospectively For Annual Reporting Periods Beginning on Or After January 1, 2023Note 1: The Number Of Shares Held Was 1 Share Or 3 Shares and The Percentage Of Ownership Was Less Than 0. 1%Note 1: Inter-group Revenues Were Eliminated Upon Consolidation